Volatiles in Magmas 0939950367
168 54 353MB
English Pages 536 Year 1994
Page 1
Titles
REVIEWS in MINERALOGY Volume 30
VOLATILES IN
Editors:
Michael R. Carroll
University of Bristol
John R. Holloway
Arizona State University
Mineralogical Society of America
Page 1
Titles
Volume 30: VOLATILES IN MAGMAS
Page 1
Titles
iv
Page 2
Titles
v
Page 3
Titles
vi
Page 1
Titles
Volatiles in Magmas
Reviews in Mineralogy, Volume 30
iii
Page 1
Titles
VOLATILES IN MAGMAS
vii
Page 2
Titles
~~~:~~i.:~.~::::: :::::::::::::::::::::: ::::::::::::::::::::::::::::::::::::::: 11
viii
Page 3
Titles
ix
Page 4
Titles
x
Page 5
Titles
COZ 216
xi
Page 6
Titles
xii
Page 7
Titles
xiii
Page 8
Titles
DIFFUSION IN VOLATILE-BEARING MAGMAS
xiv
Page 9
Titles
xv
Page 10
Titles
xvi
Page 11
Page 12
Page 1
Titles
Chapter 1
VOLCANIC-GAS STUDIES:
METHODS, RESULTS, AND APPLICATIONS
Robert B. Symondst, William I. Rose2, Gregg J. S. Bluth2
Page 2
Titles
2
:1-··-··-~~~·~2:~~,~·:S~=~j
.3
Page 3
Titles
3
(6)
Page 4
Titles
4
Page 5
Titles
5
Page 6
Titles
6
:
Tables
Table 1
Page 7
Titles
7
Tables
Table 1
Page 8
Titles
8
............ CO
Common causes of disequilibrium
Tables
Table 1
Page 9
Titles
9
Page 10
Titles
Restoration procedure
Tables
Table 1
Page 11
Titles
11
.'
..
Page 12
Titles
12
_ (I/>co,nco, )(I/>H,sn H,S )K15 (20)
n cos - -~--=-:-~-=----''-:---
I/>cos (I/>Hpn Hp)
Page 13
Page 14
Titles
14
Symonds, Rose, Bluth & Gerlach: Volcanic-Gas Studies
EL
I ! ! I I I !
I ! ! ! ! I !
I I I I I I I
8383388
0000000
-("f")-_oooor
0000000
~~('f")o\""':~('t')
0000000
0000000
o\~o\oO""':o\o\
~
o Ng"'''O
'" ~ ..,
~ "d' v ~860.~ ec
~. . == =
. ~ Kg
Page 9
Titles
•
o~ • (k .:
-" ,f.:~ ~ ",. I
K20 (wt. %)
Tables
Table 1
Page 10
Page 11
Tables
Table 1
Page 12
Page 13
Titles
MORB
o
I
;€
Tables
Table 1
Page 14
Page 15
Page 16
Titles
MORB
Tables
Table 1
Page 17
Page 18
Page 19
Page 20
Page 21
Titles
a
Johnson, Anderson. Rutherford: Pre-eruptive Volatiles in Magmas
IOr------------------------------- ~
miD
301
1300
I
1200
PI
cpr
2~ Op
2%
PIn!
1000 1100
Tee)
Hb
8
4
2~ t>
. "Cpx
solidus' . '3%
800 900 I I
P 6
(MT. HooD! ANDESITE'
Melt
1.0
0.75
0.25 0.5
X Fluid
800 .
o
Page 22
Page 23
Page 24
Page 25
Titles
Johnson, Anderson, Rutherford: Pre-eruptive Volatiles in Magmas 305
/
950
790 830 870 910
TEMPERATURE (oC)
Mount St. Helens Dacite
Tables
Table 1
Page 26
Titles
100,-;:::===========::::;-----,
o
Page 27
Titles
1\7ifC
fl
Page 28
Page 29
Titles
PH20= PFLUm
3
Johnson. Anderson, Rutherford: Pre-eruptive Volatiles in Magmas 309
4
t:: .0. I i I I
950
790 830 870 910
TEMPERATURE ( °c )
I
O~----~----~----~----~----~
750
0.25 0.5 0.75
XH20 in Fluid
800
750L-----~----~----~----~
o
900
T
(C) 850
Page 30
Tables
Table 1
Page 31
Page 32
Page 33
Page 34
Page 35
Page 36
Page 37
Page 38
Page 39
Titles
4.0
-3.0 -2.0 -1.0 0.0 1.0 2.0 3.0
o~--~~~--~~~
~.O
~ 8
S
r55 6
~ 4
Page 40
Page 41
Page 42
Page 43
Titles
Johnson, Anderson, Rutherford: Pre-eruptive Volatiles in Magmas 323
REFERENCES
Page 44
Titles
324 Johnson, Anderson, Rutherford: Pre-eruptive Volatiles in Magmas
Page 45
Titles
Johnson. Anderson, Rutherford: Pre-eruptive Volatiles in Magmas 325
Page 46
Titles
326 Johnson, Anderson, Rutherford: Pre-eruptive Volatiles in Magmas
Page 47
Titles
Johnson, Anderson, Rutherford: Pre-eruptive Volatiles in Magmas 327
Page 48
Titles
328 Johnson, Anderson, Rutherford: Pre-eruptive Volatiles in Magmas
Page 49
Titles
Johnson, Anderson, Rutherford: Pre-eruptive Volatiles in Magmas 329
Page 50
Titles
330 Johnson, Anderson, Rutherford: Pre-eruptive Volatiles in Magmas
Page 1
Titles
Chapter 9
THE EFFECT OF H20, C02 AND F ON THE
Rebecca A. Lange
Page 2
Titles
The effect of temperature, pressure, and composition
(2)
Page 3
Titles
333
f.I = VT + VTTa2
JP T
Tables
Table 1
Page 4
Titles
(5)
(av) _""X (aVi)
ap T _ £.., t.r ap T
The importance of water
Page 5
Titles
335
(7)
Page 6
Titles
. f~ ° P-l
Page 7
Titles
337
9.0 +-~-'----.--~~-~-r-----,J
~
==
---
. -
Page 8
Titles
I f~2o C .. -Vm *(P-J)
Page 9
Titles
339
, .' I .. •
e=
___ ~;
fr ,
Tables
Table 1
Page 10
Tables
Table 1
Page 11
Titles
341
Page 12
Titles
I f~02 C '" ym *(P-J)
Page 13
Titles
343
Page 14
Page 15
Titles
345
u
...
Page 16
Titles
SILICA TE MELT VISCOSITIES
Page 17
Titles
347
Newtonian and non-Newtonian rheology
y
Page 18
Page 19
Titles
349
In T/(T) = I Di(T)Xj
B
T
Tables
Table 1
Page 20
Titles
Configurational entropy theory of viscosity
- T sconl (T)
T ConI (T)
Sconl(T) = Scon!(Tg) + f P dT (28)
[cCrystal(T)]
Scon!(T ) = rT fusion P dT + IlS . +
g k T foD~
T [CliqUid(T)] 0 [cg1asS(T)]
f g P dT + f P dT.
Page 21
Titles
351
Tables
Table 1
Page 22
Titles
•
•
•
•
•
...................
Tables
Table 1
Table 2
Page 23
Page 24
Titles
(32)
kT'r
d3
354
Page 25
Titles
355
Page 26
Page 27
Titles
357
The effect of H20 on silicate melt viscosities
Tables
Table 1
Page 28
Titles
358
~-------------------------.8
.".
•
Tables
Table 1
Table 2
Page 29
Titles
359
Page 30
Titles
360
Lange: H20, C02, F; Effects on Melt Density and Viscosity
2.0+----r---.,---.,---.,...----.
.~
Tables
Table 1
Page 31
Titles
361
~
Tables
Table 1
Page 32
Tables
Table 1
Page 33
Titles
363
Tables
Table 1
Page 34
Titles
€
Page 35
Titles
Lange: H20, C02. F; Effects on Melt Density and Viscosity
365
Page 36
Titles
366
Lange: H20. C02. F; Effects on Melt Density and Viscosity
Page 37
Titles
Lange: H20, C02, F; Effects on Melt Density and Viscosity
367
Page 38
Titles
368
Lange: H20, C02, F; Effects on Melt Density and Viscosity
Page 39
Titles
Lange: H20, C02, F; Effects on Melt Density and Viscosity
369
Page 40
Page 1
Titles
Chapter 10
DIFFUSION IN VOLA TILE-BEARING MAGMAS
E. Bruce Watson
Page 2
Titles
372
Page 3
Titles
373
distance -7
Page 4
Titles
374
Watson: Diffusion in Volatile-bearing Magmas
(4)
Jj=-Dj dCj
(dCj) =i_[Dj dCj]
at x dX dX t
(6)
Page 5
Titles
375
(aCj) = n, a2Cj
at x ax2
Page 6
Titles
376
Page 7
Page 8
Titles
378
Page 9
Titles
Watson: Diffusion in Volatile-bearing Magmas
379
The thin-source geometry
thin-source experiment
Page 10
Titles
380
diffusion couple
cl 1-
Page 11
Titles
381
Page 12
Titles
382
i
""'__--q
distance~
Page 13
Titles
383
Q
m2/s 10-4
Water and related species
Page 14
Titles
384
Watson: Diffusion in Volatile-bearing Magmas
10.-------,--------.-------,
Jambo\?~_ --------7---
-----.1~?' Shaw'74
.> > .,;. ",.
11 ~ ,," ~ •.• - .,"' _
I~~ :.;;.. . .!:~.~-:' ... ~ ... ~-----
effect of water
150 2 4 6
wt. % dissolved water
10
15
9 11 13
1(f(K)X104
TI'24
Recommend Papers


![The Chemistry and Biology of Volatiles [1 ed.]
0470777788, 9780470777787](https://ebin.pub/img/200x200/the-chemistry-and-biology-of-volatiles-1nbsped-0470777788-9780470777787.jpg)
![Insect Pheromone Biochemistry and Molecular Biology: The Biosynthesis and Detection of Pheromones and Plant Volatiles [1 ed.]
0121071510, 9780121071516](https://ebin.pub/img/200x200/insect-pheromone-biochemistry-and-molecular-biology-the-biosynthesis-and-detection-of-pheromones-and-plant-volatiles-1nbsped-0121071510-9780121071516.jpg)
![Analysis of Volatiles: Methods. Applications. Proceedings. International Workshop Würzburg, Federal Republic of Germany, September 28-30, 1983 [Reprint 2011 ed.]
9783110855944, 9783110098051](https://ebin.pub/img/200x200/analysis-of-volatiles-methods-applications-proceedings-international-workshop-wrzburg-federal-republic-of-germany-september-28-30-1983-reprint-2011nbsped-9783110855944-9783110098051.jpg)


- Author / Uploaded
- Michael R Carroll
- John R Holloway
- Eds.
File loading please wait...
Citation preview
REVIEWS in MINERALOGY
Volume 30
VOLATILES IN MAGMAS Editors:
Michael R. Carroll University
of Bristol
John R. Holloway Arizona State University Front cover: View of Mt. Vesuvius, overlooking the Bay of Naples, shortly before the large eruption of 1906. Photo kindly provided by Prof. R. Funiciello, Dipartimento di Geologia, Terza Universita di Roma. Back Cover: Left: Highly vesicular pumice from Glass Mountain, Medicine Lake, California. Scale bar 200 µm. Center: Basaltic tephra, Kilauea, Hawaii. -650 µm square. Right: Basaltic reticulite, Kilauea, Hawaii. -950 µm square.
Series Editor: Paul H. Ribbe Department of Geological Sciences Virginia Polytechnic Institute & State University Blacksburg, Virginia 24061-0420
Mineralogical
Society
of America
Washington, D.C.
COPYRIGHT 1994 MINERALOGICAL
SOCIETY
Printed by BookCrafters,
REVIEWS
OF AMERICA
Inc., Fredericksburg,
Virginia
IN MINERALOGY
( Formerly: SHORT COURSE NOTES) ISSN 0275-0279
Volume 30: VOLATILES
IN MAGMAS
ISBN 0-939950-36-7
DEDICATION
TO C. WAYNE BURNHAM
Wayne Burnham became interested in volatiles in melts through his work on hydrothermal ore deposits (his Ph.D. dissertation), and his work with Dick Jahns on pegmatites. From the time he arrived at Penn State in 1955 he began experiments aimed at understanding H20 in melts. The early experiments were on the effects of H20 on phase equilibria in granitic systems, and studies of the more fundamental properties of H20 solubility and melt viscosity quickly followed. In attempting to devise a method to explain H20 solubility in melts Wayne realized that he needed to have a complete thermodynamic model for a hydrous melt. He knew that this meant measuring the P-V-T properties of a hydrous melt system, but he needed a highly precise volumometer which would work over the P-T range of silicic crustal melts. He decided that such a volumometer needed a working fluid with precisely known P-V-T properties and chose H20 for the fluid. The first step then was to measure those properties over the range 1 bar to 8 kbars and 25° to 900°e. It took six years to complete that project before he and Nick Davis could measure the volumetric properties of hydrous albitic melts over the same P-T range. Wayne then generalized the thermodynamic model for H20 solubility in hydrous albitic melts to bulk compositions spanning the range of common igneous rocks. Following that he developed a thermodynamic model for crystal-liquid equilibria which he continues to expand to include additional components. Using the thermodynamic model for H20 in rhyolite, Wayne related the volatile content of magmas to the energetics of eruptive processes and breccia formation. Over the course of much of his career Wayne has published chapters in three successive volumes of The Geochemistry of Hydrothermal Ore Deposits (the latest one is currently in press), edited by his friend and colleague Hugh Bames. Those chapters each deal with the interaction of the important volatiles in magmas. Wayne's research forms the basis of much of work described in this Volume, and we happily dedicate it to him and hope that he continues to provide us with his insights and enthusiasm. John Holloway & Mike Carroll Chronological
listing of C. Wayne Burnham's
papers
Burnham CW (1954) Contact metamorphism at Crestmore, California. Calif. Div. Mines Geol Bull. 170:61-70 Burnham CW (1954) The Crestmore Hills. California Div Mines Geol Bull.170, Guide No. 5:54-57 Burnham CW (1959) Contact metamorphism of magnesian limestones at Crestmore, California. Geol Soc Am Bull 70:879-920 Burnham CW (1959) Metallogenic provinces of the southwestern United States and northern Mexico. New Mexico Bur Mines Bull 65:1-76 Burnham CW (1962) Facies and types of hydrothermal alteration. Econ Geol 57:768-784 Burnham CW, Jahns RH (1962) A method for determining the solubility of water in silicate melts. Am J Sci 260:721-745. Putman GW, Burnham CW (1963) Minor elements in igneous rocks, northwestern and central Arizona. Geochim Cosmochim Acta 27:53-106 Hamilton DL, Burnham CW, Osborn EF (1964) The solubility of water and effects of oxygen fugacity and water content on crystallization in mafic magmas. J Petrol 5:21-39 Anderson GM, Burnham CW (1965) The solubility of quartz in supercritical water. Am J Sci 263:494-511 Anderson GM, Burnham CW (1967) Reactions of quartz and corundum with aqueous chloride and hydroxide solutions at high temperatures and pressures. Am J Sci 265: 12-27 Burnham CW (1967) Hydrothermal fluids at the magmatic stage. In: Geochemistry of Hydrothermal Ore Deposits, 38-76, Holt, Reinhart and Winston, New York
iv
Holloway JR, Burnham CW, Millhollen GL (1968) Generation of H20-C02 mixtures for use in hydro-thermal experimentation. J Geophs Res 73:6598-6600 Burnham CW, Holloway JR, Davis NF (1969) The specific volume of water in the range 10008900 bars, 20 to 900° C. Am J Sci 267:70-95 Burnham CW, Holloway JR, Davis NF (1969) Thermodynamic properties of water to looo°C and 10000 bars. Geol Soc Am Spec Paper 132: 96 p Hsu LC, Burnham CW (1969) Phase relationships in the system Fe3AI2Si3012-Mg3AI2Si3012 at 2.0 kilobars. Geol Soc Am Bull 80:2293-2408 Jahns RH, Burnham CW (1969) Experimental studies of pegmatite genesis: I. A model for the derivation and crystallization of granitic pegmatites. Econ Geol 64:843-864 Burnham CW, Davis NF (1971) The role of H20 in silicate melts: I. P-V-T relations in the system NaAlSi30g-H20 to 10 kilobars and 1000° C. Am J Sci 270:54-79 Millhollen GL, Wyllie PJ, Burnham CW (1971) Melting relations of NaAISi30g to 30 kb in the presence of H20:C02 = 50:50 vapor. Am J Sci 271:473-480 Burnham CW (1972) The energy of explosive volcanic eruptions. Earth and Mineral Sci Bull 14:69-70 Holloway JR, Burnham CW (1972) Melting relations of basalt with equilibrium water pressure less than total pressure. J Petrol 13: 1-29 Kilinc lA, Burnham CW (1972) Partitioning of chloride between a silicate melt and coexisting aqueous phase from 2 to 8 kilobars. Economic Geol 67:231-235 Eggler DH, Burnham CW (1973) Crystallization and fractionation trends in the system andesite-H20-C02-02 at pressures to 10 kb. Geol Soc Am Bull 84:2517-2532 Burnham CW (1974) NaAlSi30g-H20 solutions: a thermodynamic model for hydrous magmas. Bull Soc Fr Mineral Cristallogr 97:223-230 Burnham CW, Davis NF (1974) The role of H20 in silicate melts: II. Thermodynamic and phase relations in the system NaAISi30g-H20 to 10 kilobars, 7()()OC-1100°C. Am.J Sci 274: 902-940 Burnham CW (1975) Thermodynamics of melting in experimental silicate-volatile systems. Fortschr Mineral 52:101-118 Burnham CW (1975) Water and magmas: A mixing model. Geochim Cosmochim Acta 39: 1077-1084 Burnham CW, Darken LS, Lasaga AC (1978) Water and magmas: Application of the GibbsDuhem Equation: A response. Geochim Cosmochim Acta 42:277-280 Flynn RT, Burnham CW (1978) An experimental determination of rare earth partition coefficients between a chloride containing vapor phase and silicate melts -. Geochim. Cosmochim. Acta. 42: 685-701. Burnham CW (1979) The importance of volatile constituents. In: The Evolution of the igneous rocks, 1077-1084, Princeton University Press, Princeton, NJ Burnham CW (1979) Magmas and hydrothermal fluids. In: Geochemistry of hydrothermal ore deposits, 71-136, John Wiley & Sons, New York Burnham CW, Lasaga AC (1979) Water and magmas: Another Reply. Geochim Cosmochim Acta 43: 643-647 Burnham CW, Ohmoto H (1980) Late-stage processes of felsic magmatism. Mining Geology (Japan) Special Issue, p 1-11 Burnham CW (1981) The nature of multicomponent aluminosilicate melts. In: Chemistry and Geochemistry of Solutions at High Temperatures and Pressures, p 197-229. Pergammon Press, New York. Burnham CW (1981) Convergence and mineralization - Is there a relation? Geol Soc Am Memoir 154: 761-768. Burnham CW (1981) Physiochemical constraints on porphyry mineralization. Arizona Geology Digest XIV:71-77 Burnham CW, Ohmoto H (1981) Late magmatic and hydrothermal processes in ore formation. In: Mineral Resources: Genetic Understanding for Practical Applications (Studies in Geophysics), 62-72, National Academy Press, Washington, DC Boettcher AL, Burnham CW, Windom KE, Bohlen SR (1982) Liquids, glasses, and the melting of silicates to high pressure. J Geol 90:127-138
v
Anderson GM, Burnham CW (1983) Feldspar solubility and the transport of aluminum under metamorphic conditions. Am J Sci 283A: 283-297 Burnham CW (1983) Deep submarine pyroclastic eruptions, Econ Geol Monogr 5:142-148 Eggler DH, Burnham CW (1984) Solution of H20 in diopside melts: a thermodynamic model. Contrib Mineral Petrol 85:58-66 Bodnar RJ, Burnham CW, Sterner SM (1985) Synthetic fluid inclusions in natural quartz. III. Determination of phase equilibrium properties in the system H20-NaCI to l000°C and 1500 bars. Geochim Cosmochim Acta 49:1861-1873 Burnham CW (1985) Energy release in subvolcanic environments: implications for breccia formation. Econ Geol 80:1515-1522 Burnham CW, Nekvasil H (1986) Equilibrium properties of granitic magmas. Am Mineral 71 :239-263 Nekvasil H, Burnham CW (1987) The calculated individual effects of pressure and water content on phase equilibria in the granite system. In Mysen BO (00) Magmatic Processes: Physicochemical Principles. Geochemistry Soc Spec Publ 17:95-109 Burnham CW (1992) Calculated melt and restite compositions of some Australian granites. Trans Royal Soc Edinburgh: Earth Sciences 83:387-397. Burnham CW (1994) Magmas and hydrothermal fluids. In: Geochemistry of Hydrothermal Ore Deposits, 3rd Edition, John Wiley & Sons (in press), New York.
vi
Reviews in Mineralogy, Volume 30
Volatiles in Magmas
FOREWORD Volatiles in Magmas is Volume 30 in the Reviews in Mineralogy series begun in 1974 by the Mineralogical Society of America (MSA). See the opposite page for a listing of available titles. Most of these books, including this one, have been produced in conjunction with short courses on their respective topics. The Voltiles in Magmas course was organized by Mike Carroll (Bristol University) and John Holloway (Arizona State University) and transpired at the Napa Valley Sheraton Hotel in California, December 2-4, 1994, just prior to the Fall Meetings of the American Geophysical Union in San Francisco. Very special thanks are due Mike Carroll, who was responsible for most of the technical editing, and John Holloway, his co-editor. Most of the editing, revising, and proofing was, for the first time in our corporate experience, carried out through the Internet bye-mail with a high degree of success, with only minor frustrations. The crash of the Series Editor's hard disk at the last moment threatened disaster, but that is history of interest only to him and his skilled and concientious helpers, Brett Macey and Margie Sentelle. Paul H. Ribbe Series Editor Virginia Tech, Blacksburg EDITORS'
INTRODUCTION
Volatile components, by which we mean those magma constituents which typically prefer to occur in the gaseous or super-critical fluid state, may influence virtually every aspect of igneous petrology. The study of volatile-bearing systems, both in nature and in the laboratory, has far exceeded the relative abundances of these components in igneous rocks, yet in many ways the words of Bowen (1928) are still broadly applicable: "...to many petrologists a volatile component is exactly like a Maxwell demon; it does just what one may wish it to do." (Bowen, 1928, p. 282) What we hope to show in this volume are some areas of progress in understanding the behavior of magmatic volatiles and their influence on a wide variety of geological phenomena; in doing this it also becomes apparent that there remain many questions outstanding. The range of topics we have tried to cover is broad, going from atomisticscale aspects of volatile solubility mechanisms and attendant effects on melt physical properties, to the chemistry of volcanic gases and the concentrations of volatiles in magmas, to the global geochemical cycles of volatiles. The reader should quickly see that much progress has been made since Bowen voiced his concerns about Maxwell demons, but like much scientific progress, answers to old questions have prompted even greater numbers of new questions. This book has benefited from the efforts of many people: the authors themselves, most of whom managed to keep to deadlines; the many reviewers who provided valuable, detailed comments, often on short notice; the many graduate students at Bristol who served as guinea-pigs to help gauge the suitability of chapters for non-specialists; and the Series Editor, Paul Ribbe, and his staff, who actually made everything happen in the end. We thank all for their efforts. We also acknowledge secretarial support from Bristol University and Arizona State University, and MRC thanks Prof. A. Mottana and the Terza Universita di Roma for a Visiting Professorship during the final, hectic month of preparation of this volume. Michael R. Carroll University of Bristol, UK John R Holloway Arizona State University, Tempe
iii
VOLATILES IN MAGMAS TABLE OF CONTENTS,
VOLUME
30
Copyright; List of additional volumes of Reviews in Mineralogy..................... Foreword. . .. .. . . .. . .. Editors' Introduction Dedication to C. Wayne Burnham Chronological listing ofC. Wayne Burnham's papers Chapter 1 VOLCANIC·GAS
Page .~ III
iii iv iv
R. B. Symonds, W. I. Rose, G. J. S. Bluth & T. M. Gerlach STUDIES:
METHODS,
ApPLICA
RESULTS,
AND
TIONS
Introduction... Sampling and In-situ Measurements at High-Temperature Sites............ Inherent risks and limitations.......................................................... Health and safety hazards..... Sampling bias..... Contamination. ... .. . .. ..... ... .. .. ... ...... .. ..... .. . ... ... . ... . ... ... .. ... .. .. .. Reactions during cooling... .. ... ..... .. ..... ... .. .... .... .. . . .. . ... .. ... . .. ... Methods.................................................................................... Solution-filled collection bottles.............................................. Pre-1975 collection techniques............................................... In-situ gas chromatography................................................... Oxygen fugacity probes....................................................... Evaluation of Volcanic-Gas Analyses......................................................... General guidelines....................................................................... Evaluatio.n proced~res:.................................................................. Air contamination . .. . .. .. .. . Equilibrium-disequilibrium analysis.......................................... Common causes of disequilibrium................................................... Oxidation of H2, H2S, or CO. Gains or losses of H20...................................................... Extraneous CH4 and NH3.................................................... Gains of H2 Retrieval of equilibrium compositions............................................... Removal of disequilibrium effects Estimating concentrations of minor and trace species Equilibrium Compositions of High-Temperature Volcanic Gases Molecular compositions................................................................. Elemental compositions : Oxygen fugacities. .. . .. .. .. .. .. . .. .. . .. .. .. .. .. . . . ... Pressure effects Shallow Magma Degassing Processes Degassing at hot-spot and divergent-plate volcanoes Kilauea volcano Divergent-plate volcanoes Generalizations. . .... .. .. .. .... ... .. ....... .. .. .. .. .. .. .. ... . ... . ... ... . ... .. .. ... Degassing at convergent-plate volcanoes
vii
1 I 1 1 1 2 2 2 2 4 4 4 5 5 5 5 6 6 9 9 9 10 11 11 12 13 13 19 22 23 24 24 24 26 26 26
Showa-Shinzan dome, Japan 26 Mount St. Helens, U.S.A 28 White Island, New Zealand.......................................... 30 Gas/lava interactions during degassing. . .. .. .. .. .. . ... . ... .. .. . ... . 32 Trace-element vapor transport and deposition during degassing............... 34 Remote Sensing of Gas Emissions........................................................... 34 Correlation Spectrometer Determination of S02 .... .... .. .. .... .. 37 Instrumentation and methods... .. .. .. .. . . .. . . ... . ... . .. 37 S02 emissions and volcanic activity................................................. 39 Total Ozone Mapping Spectrometer Determinations of S02 Emissions 43 Introduction 43 Method 43 Basic parameters........................ .. .. . . ... . . 43 TOMS instruments 43
~~~:~~i.:~.~::::: :::::::::::::::::::::: ::::::::::::::::::::::::: 11
Sources of error............ .. .. .. . .. . .. .. Data Applications . ... .. .. ... .. . ....... ... .. ... .. . ... . .. . .... .. General correlations of S02 outgassing with eruption characteristics. ........ ..... .. .... . .... ... ... .. .. ... . .... ... .. ... . .. . ... ... ... Annual S02 emissions Tamden use with COSPEC Excess S02 from convergent-plate volcanoes Detection of H2S emissions........................................ .. . Emission Rates of Other Volcanic Gases Methods for measurement.. Methods of estimation....... .. . . . . .. Measuring both S02 and C02 emission rates-an example of the advantages Gas Studies to Assess Volcanic Hazards Direct gas sampling..................................................................... Measuring gas emission rates............. .. Continuous monitoring of fumaroles and ambient air.. Sampling of volcanic crater lakes....................... .. .. .. .. .. .. An integrated approach to surveillance.. .. . .. .. . Conclusions...................................................... .. . .. Acknowledgments........ .. . .. . ... References. .. .. ... ... . .. . .. .. ... .... ....... ... .... .. .... . ... ... . .. ... ..... ... .... ... . .. . .. ... .. ... .. Chapter 2 ANALYTICAL
45 46 46
46 48 48 49 51 51 51 53 53 54 54 56 56 56 56 58 60 60
P. D. Ihinger, R. L. Hervig & P. F. McMillan METHODS
FOR VOLATILES
IN GLASSES
Introduction Overview and historical development of analytical techniques Bulk extraction techniques Energetic particle techniques...... .. . Vibrational spectroscopic techniques Raman scattering spectroscopy... .. .. .. .. Nuclear magnetic resonance Analytical Methods Involving Bulk Extraction General description of the technique Application to volatile contents in glasses Hydrogen Other volatiles........................................... . .
viii
67 67 68 .. 70 71 .. .. 72 72 73 73 76 76 78
Analytical Methods Involving Secondary Ion Mass Spectrometry (SIMS) 78 Introduction 78 General description of SIMS techniques 79 Primary beam characteristics....... .... ..... .. .. .... ... . .. . ... .. .. .. ... . ... ... 79 Secondary ion characteristics .... ..... .. .. ... .... . .. . ... .. .. .. ... . ... ... 79 Applications to volatile contents in silicate glasses: Hydrogen 81 H analysis using positive secondary ions................................. 81 H analysis using negative secondary ions 84 Hydrogen detection levels 84 Matrix effects.. ..... .. .. .. .. .. .. .. . .. . .... ....... ... .. ..... .. ... . ... ... . ... . ... .. 85 Precision. .. .... ... ... .... . .. . .... .. .. .. .. .. ..... .. .. .. ... .. ... ... . .. . . .. . ... . ... .. 86 D/H measurements by SIMS................................................. 86 Applications to volatile contents in silicate glasses: Carbon.................... 86 Carbon detection levels....... . . 86 Precision. .. .. ..... .... ... .... ... .... ... . ....... .... ... .... ... . .. .. .. .. .. ... . ... ... 87 Applications to volatile contents in silicate glasses: Halogens.... .... ... 87 Fluorine.... .. .. . . ... .. .. 87 Chlorine 88 Sensitivity and precision 89 Applications to volatile contents in silicate glasses: Sulfur..................... 89 Applications to volatile contents in silicate glasses: Other elements 91 Summary of SIMS 91 Analytical Methods Involving Vibrational Spectroscopy 91 Introduction 91 Vibrational properties of important volatile species 92 OH and H20 92 CO, C02 and C03296 Quantitative vibrational spectroscopy...... . . .. . .. . . .. . ... . ... .. .. 99 Infrared absorption: theory.................................................... 99 Practical application of the technique 101 Quantitative Raman spectroscopy 101 References 112 Chapter
3
C. W. Burnham
DEVELOPMENT
OF THE BURNHAM MODEL FOR PREDICTION H20 SOLUBILITY IN MAGMAS
Historical Perspective The Thermodynamic Properties References Chapter
123 .124 129
of H20 in Granitic Melts
4
OF
P. F. McMillan WATER SOLUBILITY AND SPECIATION MODELS
Introduction Early work: low pressure solubility The effect of pressure: "square root relationships" Burnham's model for water dissolution Molecular water as a dissolving species Critical behavior of aluminosilicate-water systems at high pressure and temperature Microscopic Models for Water Dissolution SiOZ-H20
ix
131 131 132 133 134 137 139 139
Binary silicate systems Hydrous aluminosilicate glasses In-situ Studies at High Temperature and Pressure, and Effects of Relaxation and Proton Exchange Conclusion References Chapter 5
148 152 152
J. G. Blank & R. A. Brooker
EXPERIMENTAL MELTS:
141 143
STUDIES OF CARBON DIOXIDE IN SILICATE
SOLUBILITY,
SPECIATION,
AND STABLE CARBON
ISOTOPE BEHAVIOR Introduction Experimental and Analytical Methods Experiments Analysis Solubility Measurements Early work Selected data Pressure dependence Temperature dependence Compositional dependence The effect of water Speciation Vibrational spectroscopy Theory The COz molecule The carbonate molecule Sample spectra The NaAI02-SiOZjoin Natural melt compositions NMR spectra Dissolution Mechanisms Environments of molecular COZ Carbonate in NaAlOz-Si02 compositions Carbonate in other compositions Thermodynamic models Stable Isotope Fractionation Introduction Experimental fractionation studies COz-basalt COZ-rhyolite Intermediate compositions Summary Acknowledgments Appendix References
x
157 158 158 159 160 160 160 .160 160 162 163 164 165 165 166 166 167 167 169 170 171 172 172 173 175 176 176 .177 177 178 178 179 179 179 182
Chapter
J. R. Holloway & J. G. Blank
6
ApPLICATION
OF EXPERIMENTAL RESULTS TO IN NATURAL MELTS
C-O-H SPECIES
Introduction Oxidation State and Fluid Phase Speciation in the C-O-H System at Igneous Temperatures and High Pressures The thermodynamic data Fluid speciation calculations Implications for experiments Oxidizing conditions: The H20-C02join Reducing conditions: Limits on CO, H2, and C~ Graphite-HyO experiments Practical Calculation of H20 Solubility in Rock Melts The Burnham model The Stolper model. Water-basalt Water-rhyolite Calculating H20 solubility C02 Solubility in Rock Melts C02 in basaltic melts Rhyolitic melts Effects of composition on C02 solubility in rock melts Calculation of C02 solubility in rock melts Mixed- Volatile Solubilities in Silicate Melts Water-carbon dioxide mixtures Degassing at low pressures CO-C02 fluids: Carbon species solubility under reducing conditions Stable Isotope Partitioning between Volatile Species in Fluid and Melt. Terminology Degassing models Experimentally-determined isotopic fractionations and application to natural systems
COZ
H20 Degassing of natural systems Acknowledgments References Appendix Spera-Stolper H20 version 1.0 C02-H20 Degas version 1.0 Chapter
187 187 188 191 191 191 192 191 193 194 197 202 202 203 203 203 205 207 207 208 208 209 210 211 212 213 215 216 216 217 217 218 221 221 225
M. R. Carroll & J. D. Webster
7
SOLUBILITIES
OF SULFUR,
CHLORINE,
NOBLE GASES, NITROGEN,
AND FLUORINE IN MAGMAS
Introduction Sulfur Solubility in Melts General solubility behavior Experimental methods of sulfur solubility determination Experimental studies at atmospheric pressure High pressure sulfur solubility experiments Sulfur behavior in natural systems Noble Gas Solubilities in Silicate Melts
xi
231 232 232 234 235 240 243 244
Experimental measurements General solubility behavior Melt composition and noble gas solubility Alternative treatment of melt composition effects on solubility Pressure and temperature dependence of noble gas solubility Melt-vapor partitioning of noble gases in natural systems Abundance fractionations and magma degassing Nitrogen Solubility in Magmas Experimental Determination of Halogen Solubilities Analytical techniques for F and Cl.. Chlorine solubilities: general approach Chlorine solubilities Water- and silica-poor silicate melts Water-poor felsic melts Cl partitioning between hydrous felsic melts and fluids Summary of CI solubilities Solubility mechanisms and speciation of Cl in silicate magmas F solubilities: general approach Water- and silica-poor silicate melts Water-poor felsic melts Hydrous felsic melts Summary of F solubilities Solubility mechanisms and speciation of F in silicate magmas Halogens in CI- and F-enriched Magmas Chlorine in magmas Fluorine in magmas Volcanic degassing of F and CI Thermodynamic constraints on Cl and F solubilities Conclusions Acknowledgments References Chapter 8 PRE-ERUPTIVE
244 244 244 246 248 249 251 252 252 252 254 254 255 255 257 258 258 259 261 262 262 263 264 266 267 268 268 269 270 271 271
M. C. Johnson, A. T. Anderson, Jr. & M. J. Rutherford VOLATILE CONTENTS OF MAGMAS
Introduction Constraints on Pre-Eruptive Volatiles from Natural Glasses Constraints on Pre-Eruptive Volatiles from Phase Equilibria Volatiles in Basaltic and Andesitic Magmas Volatiles in magmas from Kilauea Volcano, Hawaii H20 in Kilauean magmas C02 in Kilauean magmas Sulfur in Kilauean magmas Pre-eruptive volatiles in'basaltic magmas from other tectonic settings Mid-ocean ridge basalts Arc basalts Back-arc basin basalts Phase equilibria constraints on volatiles in basalts Mineral indicators Phase equilibria constraints on volatiles in andesites Volatiles in Dacitic and Rhyolitic Magmas Rhyolitic glass inclusions Phase equilibria constraints Mount St. Helens mafic dacites
xii
281 282 284 287 287 287 290 292 292 292 296 297 297 298 300 .302 303 304 .304
Mount Pinatubo dacite Bishop Tuff rhyolite
307 310 311 .311 312 315 .317 .319 321 .321 323
Discussion Kilauean basaltic magma system Volatile constraints on high-alumina basalt magma genesis Volatile saturation in magmas Obsidians: the Mono Craters obsidian clasts and domes Volatiles and the oxidation state of magmas Eruption dynamics The significance of volatiles in silicic magmas: some speculations References '"
R. A. Lange
Chapter 9 THE EFFECT
OF
H20, C02 AND F ON THE DENSITY AND
VISCOSITY OF SILICATE MELTS Introduction Silicate Melt Densities The effect of temperature, pressure, and composition Composition and temperature at 1 bar Pressure The importance of water Direct P-V-T measurements Derivation of VH,O,total from solubility curves What about t~ speciation of water? Derivation of V H...z9molecular from solubility curves What value of v~,O,total should be applied to natural liquids? Application of magma dynamics The importance of C02 Derivation of VCO"total from solubility curves What about the speciation of C02? The partial molar volume of molecular C02 in molten albite The partial molar volume of dissolved carbonate in molten basalt. The importance of feo to derived values of VCO"total The effect of C02 on ctensity of magmatic liquids The effect of F on the density of silicate melts Silicate Melt Viscosities Newtonian and non-Newtonian rheology The effect of composition and temperature at 1 bar. Configurational entropy theory of viscosity Natural liquids Microscopic mechanisms of viscous flow: NMR constraints The effect of pressure on silicate melt viscosity The effect of H20 on silicate melt viscosities The effect of C02 on silicate melt viscosities The effect of F on silicate melt viscosities Toward a comprehensive model equation for silicate melt viscosity Acknowledgments References
xiii
.331 .332 .332 332 .333 .334 335 .335 337 337 340 341 .341 342 .342 .343 343 343 344 345 346 347 348 350 350 353 355 357 359 362 .364 364 365
Chapter 10
E. B. Watson DIFFUSION
IN VOLATILE-BEARING
MAGMAS
Introduction .371 Overview of Basic Diffusion Theory 371 Nature and theoretical conceptualizations of diffusion .37l Definitions 371 Atomistics 372 Phenomenology: diffusion equations .374 Complications 375 "Kinds" of diffusion 375 Temperature and pressure dependence of diffusion .377 Effect of temperature 377 Pressure dependence of D 378 Experimental and Analytical Approaches 378 General considerations 378 The thin-source geometry 379 Experimental technique 380 Extraction of diffusivity 380 The diffusion couple and related approaches .380 Experimental configuration 380 Extraction of diffusivity .381 Diffusion in more than one dimension 382 Diffusion of Dissolved Volatiles in Magmatic Liquids .382 Introduction .382 Water and related species 383 Silicic melt compositions 383 Basaltic melt 389 Carbon dioxide 389 Sulfur-related species 392 Effect of water 394 Role of oxygen fugacity 394 Halogens 395 Fluorine 395 Chlorine 396 Noble gases 398 Effects of Dissolved Volatiles (H20) on Cation Diffusion 399 Introduction .399 Tracer diffusion .400 Chemical diffusion .403 High field-strength elements .403 Silica .404 Effects of H20: Recap and final observations .404 Effects of other volatiles: Preliminary information on fluorine and chlorine. 405 Significance and Applications .406 Crystal/liquid processes .406 Growth and dissolution rates .406 Boundary-layer processes .407 Bubble growth .407 Larger-scale magmatic processes .408 Acknowledgments .409 References .409
xiv
R. S. J. Sparks, J. Barclay, C. Jaupart, H. M. Mader & J. C. Phillips
Chapter lla PHYSICAL
ASPECTS OF MAGMATIC
EXPERIMENTAL
AND THEORETICAL
DEGASSING
I.
CONSTRAINTS
ON VESICULATION Introduction Observational Constraints Volatile solubility Basaltic (low viscosity) systems Silicic (high viscosity) systems Viscosity and diffusivity Eruption styles Eruption products Bubble Formation Nucleation theory Experiments on nucleation Bubble growth Diffusive growth Decompression of bubbles in high viscosity magma Decompression of high viscosity foams Growth of stretching bubbles Experimental Degassing Conduit Flow Models A Conceptual Model for Explosive Volcanism Acknowledgments Appendix References Chapter
K. V. Cashman & M. T. Mangan
llb PHYSICAL
CONSTRAINTS
.413 .413 .414 .415 .415 .416 .416 .418 .420 .420 .422 .424 .424 .427 .431 .431 .432 .436 .439 441 441 443
ASPECTS OF MAGMATIC
ON VESICULATION
DEGASSING
II.
PROCESSES FROM TEXTURAL
STUDIES OF ERUPTIVE PRODUCTS Introduction Bubble Suspensions and Foams Nomenclature and structure Processes that influence structure Capillary drainage Film rupture Coalescence Ostwald ripening Textural Characterization of Pyroclasts Vesicularity Vesicle size, shape and spatial distribution Vesicle shape Spatial distribution Vesicle size and number density Vesicle size distributions Vesiculation in Basaltic Systems Fire fountains Tephras
xv
447 448 448 .450 .450 .450 .451 .451 .452 .452 452 452 .453 453 .454 .455 .455 456
Effusive eruptions Reticulite Active lava tubes and surface flows Solidified lava flows Inflated sheet flows Submarine lava flows Vesiculation in Silicic Magmas Explosive eruptions Vesicularity Vesicle volume distributions Vesicle shapes Effusive silicic eruptions Macroscopic textural data Open-system volatile loss Conclusions Acknowledgments References Chapter
.457 458 .459 .461 .461 .463 .464 .464 .465 .466 .468 .471 472 .473 .473 .474 .474
12
EARTH DEGASSING
A. Jambon AND LARGE-SCALE
GEOCHEMICAL
CYCLING
OF VOLATILE ELEMENTS Introduction Noble Gases and the Degassing History of the Earth Helium: a non conservative element. Helium in meteorites The atmospheric budget and helium residence time in the atmosphere Cosmogenic helium Helium in the ocean: the MORB source and helium flux from the mantle The helium:heat-flow relationship Helium from arc magmas Helium flux from the continental crust Helium model age of the mantle and outgassing The 3He/4He vs 87Sr/86Sr relationship Argon and catastrophic versus continuous degassing Argon isotopes in terrestrial reservoirs 40 Ar and long term terrestrial outgassing Further inferences from Neon and Xenon Constraints from terrestrial xenology Neon C02 - A Major Volatile with Major Problems The bulk Earth abundance C/36Ar and bulk Earth carbon Terrestrial inventory The C/3He ratio and the flux of C02 H20 - A Marginally Volatile Species Water in the exosphere Water in H20:MORB and the H20:ridge flux Water and subduction Sulfur - An Example of Massive Recycling Long term sulfur cycle Sulfur in oceanic basalts
xvi
.479 .481 .481 .481 .482 .482 .482 .483 484 .484 .485 .485 .487 .487 .488 .489 .489 .490 .490 491 .491 492 .495 .497 .497 .497 .498 .499 499
.5oo
Mantle sulfur Halogens Fluorine Chlorine and bromine Iodine Conclusions Acknowledgments References
.502 502 502 505 .507 508 509 509
XVll
Chapter
1
VOLCANIC-GAS STUDIES: METHODS, RESULTS, AND APPLICATIONS Robert
B. Symondst, William I. Rose2, Gregg J. S. Bluth2 and Terrrence M. Gerlach!
1United
States Geological Survey, Cascades Volcano Observatory 5400 MacArthur Blvd. Vancouver, Washington 98661 USA
2Department of Geological Engineering, Geology, and Geophysics Michigan Technological University Houghton, Michigan 49931 USA INTRODUCTION This chapter reviews several facets of the study of volcanic gases. The focus of the review is generally, but not exclusively on "high-temperature volcanic gases"-i.e., gases emitted at temperatures over 500°C from various sources at active volcanoes (erupting magma, lava flows, lava lakes, lava domes, eruption vents, fumaroles, fractures, etc.)since these gases contain a substantial proportion of volatiles released directly from shallow magmas. Shallow magmas beneath active volcanoes release volatiles during both passive degassing and volcanic eruption. Passively degassing volcanoes often permit direct sampling of volcanic gases from ground-level sources and from volcanic plumes. Investigations of volcanic gases during eruptive degassing generally require remote sensing methods, including satellite-based methods. Because of the close tie to magma degassing, investigations of high-temperature volcanic gases provide important data for constraining the compositions, amounts, and origins of volatiles in magma. Volcanic gas data provide insights into magma degassing processes and critical information for evaluating volcanic hazards. In recent years, volcanic gas emissions have also received attention because of their effects on the atmosphere and climate, and as benchmarks for comparison with anthropogenic gas emissions. SAMPLING AND IN·SITU MEASUREMENTS AT HIGH-TEMPERATURE SITES Inherent risks and limitations Health and safety hazards. Getting to high-temperature sites on volcanoes inevitably involves higher than normal risks regardless of the mode of transport (hiking, climbing, helicopter flight). At the site, there are serious risks from direct exposure to eruptions, explosions, lava spraying, and hot gases (Williams, 1993). Furthermore, it is virtually impossible to work at these sites without some exposure to corrosive and toxic gases, aerosols, and toxic trace metals. Sampling bias. Unfortunately, sampling is only feasible at the Earth's surface, so all volcanic-gas samples represent low-pressure (-I bar) discharges. A potentially more significant problem is that the samples may represent fractionated gases from very degassed magma.
2
Symonds, Rose, Bluth & Gerlach: Volcanic-Gas Studies o
H20
.(
1 f ..U
-2 -3
bD
-4
.3
••• ' .-._
•. _-_._._.
--.
-_.
CO2• -' - - .•••
- •••.
_.
"-fI;' _....
:1-··-··-~~~·~2:~~,~
·7
,~
(50
250
,
350
450
550
650
,
,
750
850
950
T (e) Figure 1. Calculated distribution of species for closed-system cooling of the August 11, 1960 gas sample from Showa-Shinzan's A-I fumarole at 1 atm pressure. Gas analysis is from Mizutani and Sugiura (1982). For clarity, we exclude HCl (-3.4 log moles) and HF (-3.7 log moles) from the plot; all other species included in the calculations are shown.
Contamination. The ideal volcanic-gas sample would contain only magmatic volatiles. However, high-temperature volcanic gases are commonly mixtures of magmatic volatiles, air, meteoric steam, and gases from hydrothermal systems. It is often difficult to avoid some air contamination, because air can mix with magmatic gases at depth, in the vent, or during sampling. The common presence of meteoric water and hydrothermal fluids in volcanoes often leads to contamination of gas samples by meteoric steam and hydrothermal gases. Reactions during cooling. For purposes of constraining magmatic-volatile compositions, volcanic-gas samples should be collected at magmatic temperatures. Unfortunately, most samples come from vents that are tens to hundreds of degrees Celsius cooler than the parental magma. During cooling, the concentrations of gas species can change (Fig. 1), although the changes are usually arrested by quenching of gas reactions at temperatures hotter than the vent temperature (Le Guem et aI., 1982; Gerlach and Casadevall, 1986a). Methods Solution-filled collection bottles. The most common present-day method for sampling volcanic gases is to collect them in solution-filled bottles and analyze the mixtures in the laboratory (Giggenbach and Matsuo, 1991). This method was developed by Giggenbach (1975) and Giggenbach and Goguel (1989). A typical sampling setup is shown in Figure 2. A titanium or silica tube is inserted into the vent and attached to a dewared tube that minimizes condensation. The sampling train connects to an evacuated, pre-weighed sampling bottle partly filled with 4N NaOH solution. During sampling, the gas bubbles through the NaOH solution. H20 condenses and the acid gases (C02, S02, H2S, HCI, HF) are absorbed by the NaOH solution by the following reactions:
CDl + 2 OH-(aq) = C032-(aq) + H20 4 S02 + 7 OH-(aq) = 3 S042-(aq) + HS-(aq) + 3 H20 H2S + OH-(aq) = HS-(aq) + H20 HCl + 2 OH-(aq) = 2CI-(aq) + H20 HF + 2 OH-(aq) = 2F-(aq) + H20
(1) (2) (3) (4) (5)
The noncondensable gases (H2, CO, C04, COS, N2, Ar, Dl) collect in the headspace. In the laboratory, the bottles are reweighed to determine the weight gain during collection.
Symonds, Rose, Bluth & Gerlach: Volcanic-Gas Studies __
3
dewared silica tube
evacuated collection bollie partly filled with 4N NaOH solution
Figure 2. Typical sampling setup based on the method of Giggenbach (1975) for collecting volcanic-gas samples in evacuated bottles partially filled with NaOH solution.
The headspace gases are analyzed (normally by gas chromatography) to determine the molar amounts of each gaseous species collected. The solutions are analyzed by various techniques (e.g., wet-chemical methods, ion chromatography, selective ion electrode) for C032-, S042-, HS-, total sulfur, Cl, and F- to reconstruct the molar amounts of absorbed acid gases. H20 is determined by difference (weight gain minus weight determined for non-Hjf) gas species). HS- may oxidize to S042- after collection if the sample is contaminated with air. To preserve the original quantity of HS-, some gas geochemists spike their NaOH solutions with Cd2+ or collect a second bottle filled with NH40H-AgN03 solution (Greenland, 1987b; Giggenbach and Matsuo, 1991). During collection, the HS- reacts with the Cd2+ or Ag+ to form CdS or AgS precipitate, which enables determination of the amount of H2S by weighing the amount of sulfide precipitate or by determining the amount of Cd2+ or Ag+ consumed by the precipitation reaction. Another significant post-collection reaction is conversion of CO to formate (HC02-): CO + OH-(aq)
= HCDl-(aq)
(6)
(Giggenbach and Matsuo, 1991). This reaction is controlled kinetically; CO loss depends on time and the normality of the NaOH solution, and is less of a problem when using higher normality (-4N) NaOH solutions and when collecting gases rich in acidic species (Giggenbach and Matsuo, 1991). Preliminary results suggest that CO loss follows the radioactive isotope decay equation; hence, the initial CO concentration in the gas may be determined by obtaining several CO analyses over time and extrapolating back to the time of collection (Giggenbach and Matsuo, 1991). Samples obtained in solution-ftlled bottles can be affected by several alterations during collection. Condensation or re-evaporation of liquid in the sampling train due to temperature fluctuations below and above the H20 boiling point may severely disturb H20, HCl, and S02 concentrations (Gerlach, 1980b; Giggenbach and Matsuo, 1991). Condensation can be minimized by using a dewared sampling train as shown in Figure 2. Spilling of solution from the sampling bottle during collection decreases the determined amount of H20 but has little effect on the determined quantities of other gas species (Gerlach, 1993b). Chemical reactions between the volcanic gases and titanium sampling tubes produce excess H2. Silica and mullite tubes do not react with high-temperature volcanic gases, but may be too fragile to use in vigorous vents (Greenland, 1987b; Giggenbach and Matsuo, 1991). Titanium tubing withstands rough field use and is
4
Symonds, Rose. Bluth & Gerlach: Volcanic-Gas Studies
probably unreactive in S:400'C vents (Giggenbach and Matsuo, 1991). However, when used in >4OO'C vents. titanium may react with the gases to produce H2, especially if the gases contain >0.1 % HCl (Greenland, 1987b; Giggenbach and Matsuo, 1991). The predicted reaction I between the titanium tube and the gas is as follows: Ti(s) + 2 H20 ~ TiDl(s) + 2 H2
(7)
Finally, minor amounts of sulfur may be lost by deposition of native sulfur prior to gas entry into the collection bottle (Matsuo, 1961; Gerlach, 1993b) by the reactions: 2 H2S + SD2 ~ 3 S(s) + 2 H20 S2 ~ 2 S(s)
(8) (9)
Native sulfur typically saturates at temperatures between 100' and 200'C (Bernard, 1985; Quisefit et aI., 1989). Because temperatures of the gases often drop to -lOOT prior to entry into the collection bottle, loss of native sulfur is potentially a problem. Pre-I975 collection techniques. Prior to 1975, most volcanic-gas samples were collected in flow-through or evacuated bottles without a solution to absorb the condensable gases, although notable exceptions are the 1954-1985 Showa-Shinzan samples (Nemoto et al., 1957; Mizutani 1962a,b; Mizutani and Sugiura, 1982). H20 was not determined in many of the pre-1975 dry-bottle samples, although some analysts obtained estimates of the H20 contents by determining the amount of condensate in the bottle (Giggenbach and Le Guern, 1976), by adding CaC2(s) and determining H20 from the acetylene (C2H2) generated (Tazieff et aI., 1972), by adding silica gel to the bottles to absorb H20 (Huntingdon, 1973), or by condensing the H20 prior to entry of gas into the bottle (Sigvaldason and Elisson, 1968). Dry-bottle samples are also affected by loss of sulfur from Reactions (8) and (9) and by the disproportionation of SDl in condensed H20: 4 SDl + 4 H20 ~ H2S + 6 H+(aq) + 3 S042-(aq)
(10)
Some pre-1975 collection techniques exposed the sampled gases to reactive metals (steel, Cu, AI) that caused copious H2 generation from reaction with H20 and HCl (Gerlach, 1979; Gerlach, 198Oc; Giggenbach and Matsuo, 1991). In-situ gas chromatography. Some investigators have obtained analyses of volcanic gases by injecting them directly into a field gas chromatograph (hereafter, FGC; Le Guem et al., 1982). This method can determine H20, H2, CDl, CO, S02, H2S, and atmospheric gases, but HCl and HF must be determined by the bottle-sampling approach (Le Guern et al., 1982). This method potentially yields real-time data on gas composition before leaving the field. Successful application of FGC is limited to sites where it is possible to work for an extended period of time (hours to days). The bottle-sampling approach is more desirable than FGC for hazardous sites where an extended stay is impractical or unsafe and where the results are not needed immediately. Other disadvantages of FGC are relatively large errors in H20 and the inability to measure HCl and HF. Oxygen fugacity probes. Some workers have used solid electrolyte probes to measure the oxygen fugacity (f02) of the gas in the field (Gantes et al., 1983). The most common probe consists of an electrolyte core, generally made of Zr and Y oxides, coated by a porous noble metal such as Pt (Gantes et aI., 1983). The exchange of oxygen ions between the electrolyte core and the noble metal coating fuels the oxidation process of reduced volcanic-gas species and produces a current that is a function of fDl. 1Reaction predicted by reacting a small amount of Ti(s) with a range of volcanic-gas compositions at 400' to 1200'C using thermochemical equilibrium program, GASWORKS (Symonds and Reed, 1993). The results show that Ti(s) reacts to form rutile (Ti02) in preference to 28 other Ti-bearing gases and solids.
Symonds, Rose, Bluth & Gerlach: Volcanic-Gas Studies EVALUATION General
5
OF VOLCANIC· GAS ANALYSES
guidelines
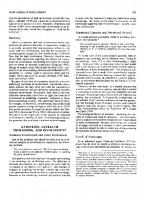
We suggest several guidelines to aid in selecting and evaluating gas samples that are likely to contain a high proportion of magmatic volatiles. A high collection temperature (>5oo"C) is one of the best indicators that a volcanic-gas sample is mainly from a magmatic source. Samples obtained in solution-filled bottles or from in-situ FGC are in general preferable to samples collected in flow-though or evacuated bottles without caustic solution. After collection, gas samples can be evaluated in several ways. When available, stable isotope data (0180 and oD data on H20, o13C data on CD2 and C04, and 034S data on total sulfur) are extremely valuable to help determine whether these constituents come from magma, meteoric fluids, sedimentary rocks or fluids within them, seawater, or from some other source (Allard, 1983; Taylor, 1986).For thermochemical evaluation of a gas sample, it is desirable to have analytical data for as many species as possible, although it is common for analyses to lack data for critical species (e.g., S02, H2, H2S, CO) either because no determinations were made or because of detection limitations. Finally, gas samples are preferred that contain CO2, renormalize the adjusted analysis, and recalculate Cfs. Repeat procedure until all Cfs converge. See Gerlach and Casadevall (1986a).
Nonequilibrium oxidation of H2 to H2O
3,8,10
Convert a trial amount of H20 to H2 in the original analysis by reversing the reaction.Hj + 11202 => H20, renormalize adjusted analysis, and recalculate Cfs. Repeat procedure until all Cfs converge. See Le Guem et al. (1982).
Nonequilibrium oxidation of H2S to S02
6,8,11
Convert trial amounts of H2S to S02 by reversing the reaction: H2S + 31202 => S02 + H20, renormaJize adjusted analysis, and recalculate Cfs. Repeat procedure until all Cfs converge. See Gerlach (198(}a).
Gains of unequilibrated H2
6, 12
If relatively minor, identify and reverse reaction that produces excess H2, renormalize adjusted analysis, and recalculate CTs. If major, estimate equilibrium gas composition from the mass balances of C, H, and S in the analysis, and from independent estimates of f02' See Gerlach (1979. 198Oc).
CH4 in
H2O
(1) Very low CTs for CH4 relative to all other species. (2) 013C data may indicate a sedimentary source for CH4' (3) Low CTs for H2, H20, S02, and H2S relative to Cfs for C02 and CO. (4) Simultaneous samples from the same vent will have widely variable HlC and HIS ratios but relatively constant CIS ratios. (5) OD and 0180 data for contemporaneous fumarolic condensates may indicate mixing between magmatic and meteoric fluids if the excess H20 is from a meteoric source. (6) High Cfs for H2, H20, S02, and H2S relative to Cfs for C02 and CO. (7) NaOH solution may have spilled from sampling bottle during collection. (8) Samples may show evidence of air contamination (e.g., >1 % N2' N2/Ar ~ atmospheric value of 83.6). (9) Simultaneous samples from the same vent may show variable CO/(CO + C02) ratios. (10) Simultaneous samples from the same vent may show variable H2/(H2 + H20) ratios. (11) Simultaneous samples from the same vent may show variable H2S/(H2S + S02) ratios. (12) Samples probably reacted with Cu, AI, steel, or Ti collection materials.
Gains of H2. Samples collected prior to 1975 may show disequilibrium from excess H2 generated by reactions of H20 and HCI with Cu, AI, or steel sampling materials, as discussed above (Gerlach, 1979, 198Oc). Today, samples containing excess H2 are rare because most are collected with relatively unreactive silica or titanium sampling tubes. However, recent work by Giggenbach and Matsuo (1991) suggests that titanium can react with >4OO°Cvolcanic gases to generate H2 by Reaction (7), especially if the gases contain significant HCI. The symptoms of H2 gains are anomalously low fDl values (Gerlach, 1979) and high CTs for H20, H2, S02, and H2S but low CTs for C02 and CO (Table 2).
Symonds, Rose, Bluth & Gerlach: Volcanic-Gas Studies
11
4-,----,----,----,----,----,----,---,,---.
-
3-;
~ J:
...'
2-
-
1-
-
O-+----~--~----~--~----~--~--~~~ o
2
CIS
Retrieval
of equilibrium
3
4
Figure 6. A plot of HIC versus CIS ratios for the 1971 Erta'Ale gas analyses from Giggenbach and Le Guern (1976). All samples were collected from a 1075°C vent over a two-hour period. H20 errors cause H/C to vary over a wide range but do not affect CIS which is relatively constant (see text).
compositions
We assume that high-temperature volcanic-gas samples with quenched equilibrium compositions represent better the volatiles degassed from shallow magma than do samples with disequilibrium compositions. It is therefore desirable to retrieve the initial equilibrium compositions of disequilibrium samples. Retrieval of equilibrium compositions is possible for some disequilibrium samples, but with varying degrees of reliability. If the samples have disequilibrium compositions caused predominantly by a single type of alteration or analytical error, as opposed to multiple or superimposed sources of disequilibrium, their equilibrium compositions often can be restored if the analyses are sufficiently complete (Gerlach and Casadevall, 1986a). Restoration makes no a priori assumptions of an initial equilibrium state but in fact tests the equilibrium hypothesis for high-temperature volcanic gases and yields the last equilibrium composition and temperature. "Restored equilibrium compositions" are considered about as reliable as quenched equilibrium compositions. "Apparent equilibrium compositions" are based on incomplete analyses and the assumption that the gases initially approached a state of chemical equilibrium (Gerlach and Casadevall, 1986a). Analytical data must be complete enough, however, to constrain both the last equilibrium temperature and the concentrations of the undetermined species. Apparent equilibrium compositions are less reliable than restored equilibrium compositions. "Estimated equilibrium compositions" are based on incomplete analyses and the assumption that the gases initially approached a state of chemical equilibrium (Gerlach and Casadevall, 1986a). However, for estimated compositions it is necessary to assume that the gases were in equilibrium at the collection temperature since the analytical data are insufficient for simultaneous determination of both the last equilibrium temperature and concentrations of the undetermined species. Estimated equilibrium compositions are the least reliable of the retrieved equilibrium compositions for high-temperature volcanic gases ..
Removal of disequilibrium effects. There is a large body of literature (Gerlach 1979, 1980a-d, 1981, 1993a,b; Le Guern et aI., 1982; Gerlach and Casadevall, 1986a; Symonds et aI., 1990; Kodosky et al., 1991) that describes computer-based methods (e.g.,
12
Symonds, Rose, Bluth & Gerlach: Volcanic-Gas Studies
using program SOL VGAS) for removing disequilibrium modifications from volcanic-gas analyses. These restoration procedures involve identifying the sources of disequilibrium, reversing their effects on the analytical data, recalculating the moles of component species, and recomputing the CTs to determine if the adjusted composition is closer to an equilibrium composition (Fig. 4). This process is repeated iteratively until all the CTs converge, or it is determined that a restored equilibrium composition cannot be obtained. Table 2 summarizes the restoration procedures for the most common disequilibrium modifications of volcanic-gas analyses. For restorable samples that suffer from disequilibrium oxidation of H2, H2S, or CO, their restored equilibrium compositions are obtained by reversing Reactions (13), (14), or (15), respectively. For instance, if a sample suffers from disequilibrium oxidation of H2, its restored equilibrium composition is obtained by converting the gained amount of H20 to H2 by reversing Reaction (13). This is done quickly on a computer by converting a trial amount of H20 to H2 in the original analysis, discarding the appropriate amount of oxygen, and recomputing the CTs. The procedure is repeated until the CTs converge to within ±l0°e. Disequilibrium loss or gain of H20 is treated in a similar fashion by adding or subtracting trial amounts of H20 to/from the original analysis, depending on whether H20 has been lost or gained, and computing CTs for the adjusted analysis. This process is repeated until the equilibrium amount of H20 is found and the CTs converge. Some gas analyses have multiple sources of disequilibrium. For instance, the 1974 Erta'Ale samples show evidence of gains or losses of H20, loss of sulfur due to reaction with the steel lead-in tubes, and atmospheric oxidation of reduced sulfur species (Gerlach, 1980b). Application of the numerical operations in Table 2 will eliminate only one source of disequilibrium so other methods must be used to remove multiple disequilibrium problems. One common approach is to estimate the last equilibrium composition using the analytical data for unmodified species and assume that the gas was last in equilibrium at the vent temperature (Gerlach, 1980a-c). For instance, Gerlach (1980b) obtains estimated equilibrium compositions for the 1974 Erta'Ale samples, all collected sequentially from the same vent, by the following steps: (1) compute the f02 of each sample at the vent temperature from equilibria (15) and analytical data for CO and CD2, which show consistent CO/C02 values; (2) calculate the equilibrium amounts of H20 for each sample from analytical data for H2 and the computed f02 values; (3) add S to samples with relatively low SIC ratios; and (4) calculate the equilibrium distribution of S species from the computed fDl values and the mass balances for C, H. and S in each analysis. Estimating concentrations of minor and trace species. Many volcanic gas analyses lack data minor and trace species such as COS, S2, and magmatic 02 and CH4). Some of these species may be important in some high-temperature volcanic gases (COS, S2, CH4; Gerlach and Nordlie, 1975), and some define petrologically useful intensive parameters (f02, fS2). The equilibrium amounts of COS, S2, CH4, and 02 can be estimated from the following equilibria: C02 + H2S = COS + H20 2 H2S = 2 H2 + S2 C02+4H2=C04+2H20 2 H20 = 2 H2 + 02
(16) (17) (18) (19)
combined with known equilibrium concentrations of H20, H2, C02, and H2S, and the following equations: _ (I/>co,nco, )(I/>H,sn H,S )K15 (20) n cos - -~--=-:-~-=----''-:--I/>cos(I/>Hpn Hp)
Symonds, Rose, Bluth & Gerlach: Volcanic-Gas Studies nS. =
n
N(~H.SnH.,s)2 K16 ~s.(~H.nH.
(21)
'f P
t
_ p2 (~co.nco. )(~H.n H. K17 CH. ~CH. (~HpnH.of N2
(22)
N (~H.cfl H.O)2 K18 nO,
~o, (~H.nH.
13
(23)
'f P
where ni is the molar abundance of species i, t/>i is the fugacity coefficient of species i, P is the pressure in atmospheres, N is the total moles of gas, and K16, K17, K18, and K19 are the equilibrium constants for Reactions (16) through (19), respectively, at pressure P and at the equilibrium temperature of the sample. Since pressure is atmospheric in collection environments (Stevenson, 1993) and the gases can be assumed to be ideal, the P and t/>i. terms equal unity. For example, to calculate the equilibrium amount of S2, n s., is first estimated from (21) with the initial value of N taken as the total moles of gas species (without S2). The estimate for n s., is added to the molar amounts of species to calculate an improved value for N, which in tum gives a better estimate of ns.,. This process is repeated until n s., and N converge. The interactive procedure can be neglected if ni for the undetermined species is many orders of magnitude smaller than N. EQUILIBRIUM COMPOSITIONS HIGH-TEMPERATURE VOLCANIC
OF GASES
In Tables 3-5, we compile the quenched, restored, apparent, and estimated equilibrium compositions of 136 high-temperature volcanic-gas samples from convergent-plate, divergent-plate, and hot-spot volcanoes (Tables 3-5). The tables include most published and some unpublished equilibrium compositions of >5OO°Cvolcanic gases. Table 6 lists additional sources of recent high-quality volcanic-gas data for samples collected at >500°C vents and that undoubtedly contain quenched and retrievable equilibrium compositions. Preliminary interpretation of these additional analyses suggests that they generally support our conclusions on volcanic gases as discussed below. Discussions of studies on -O "1 log unit below to < 1 log unit above QFM; Carmichael, 1991); the j02's for Ardoukoba, Erta'Ale, and Surtsey, all divergent-plate basalts, are up to 1 log unit higher than the range for oceanic basalts (3 to H2S + 2 H20,
(26)
2 H2 + CO + SDl
(27)
2 H2 + S02
=>
=>
2 H20 + COS,
2 H20 + 112 S2.
(28) o
CO2
H2O
H2O S02
-~
CO2
·2
_I'---..
H2
~02
H2S
v:: ·4
.___
·2
CO
~
r .:
CO
S2
S2 COS
I
cos
Ir-(9125180)
o
I
I
I
I
20
40
60
80
l3l25118)
~ -6 100
Pressure (bars)
0
I
I
,
20
40
60
I 80
100
Pressure (bars)
Figure 14. Calculated distribution of the mOSI abundant species of H, 0, C, and S as a function of pressure for (A) Mount St. Helens sample 800925-710 at lOOO°C and (B) Kilauea sample J8 at 1170°C. Starting compositions at 1 bar pressure are tabulated in Tables 3-5.
SHALLOW Degassing at hot-spot
MAGMA DEGASSING PROCESSES
and divergent-plate
volcanoes
Kilauea volcano. Studies of high-temperature volcanic gases have contributed to understanding magma degassing processes at Kilauea volcano (Gerlach, 1980a, 1986, 1993a; Gerlach and Graeber, 1985; Greenland et aI., 1985; Gerlach and Taylor, 1990). Sustained summit lava lake eruptions persisted at Kilauea during most of the previous century and on into the early 1920's and for brief periods in 1952 and 1967-1968. In essence, the roof of the summit magma chamber rose to the surface and a continuous resupply of magma sustained a lava lake at these times. Sustained summit lava lake eruptions emit relatively C02-rich, Type I volcanic gases (J series samples, Table 5, Fig. 15) directly to the atmosphere in a one-stage degassing process (Fig. 16a). The Type I gas samples (Table 5) plotted in Figure 15 include C02-rich samples like J-8, which was collected from a crack in a spatter cone adjacent to upwelling resupply magma, and several samples poorer in C02 that were emitted by partially degassed resupply magma at the margins of a summit lava lake. Sustained summit lava lake eruptions have been comparatively uncommon in this century, when most eruptions have occurred along rift zones. The magma of rift zone eruptions is temporarily stored in the summit chamber prior to being discharged into the rift
Symonds, Rose, Bluth & Gerlach: Volcanic-Gas Studies
25
C Figure 15. Ternary plot of C, H, and S for Type I volcanic gases (circles) from the 1918-19 summit lava lake (J-series samples in Table 5), Type II volcanic gases (squares) collected in 1983 from the east rift zone of Kilauea (Pele samples in Table 5), and the COr rich summit Chamber Gas composition (triangle). The degassing vector originating at J-8 (Table 5) illustrates that the COT depleted, Type II gases lie on a continuation of the trend formed by Type I gases from partially degassed summit lava lake resupply magma. (By permission of the editor of Geochimica et Cosmochimica Acta; Gerlach (I993a), Fig. 3, p. 799. H(
6. Chamber Gas
.r-s / .... ....
,i=b 0
Summit Lava Lake Gases (Type I)
C}.cb
0.-
I
IIIlIlJ Episode-l
Gases
(Type
II)
\
S
a ONE-STAGE
DEGASSING
TWO-STAGE
DEGASSING
IOkmr
Figure 16. Schematic cross-sections, without vertical exaggeration, of the magma supply, storage, and transport system of Kilauea, volcano. Each cross-section begins west of the summit caldera and runs southeast along the upper east rift zone, and east and northeast, along the middle and lower east rift zone. The cross-sections continue along the submarine east rift zone out -70 km to the Hawaiian Deep. For purposes of clarity the thickness of the feeder conduit for parental magma is greatly exaggerated and the summit chamber is somewhat enlarged. A plexus of dikes, sheets, and conduits is believed to constitute the summit chamber and east rift zone storage reservoirs shown schematically here as regions with high meltto-rock ratios. (a) A one-stage degassing process during a continuously supplied summit lava lake eruption emitting Type I volcanic gases (J-series samples, Table 5, Fig. 15) derived from lava lake resupply magma. (b) A two-stage degassing process involving CO2-rich chamber gas (Fig. 15) venting from new magma equilibrating in the summit reservoir and a rift zone eruption emitting type II volcanic gases (Pele samples, Table 5, Fig. 15) derived from summit reservoir-equilibrated magma. The chamber gas supplies volatiles to the summit hydrothermal system and to the summit fumaroles and plume. Eruptions of reservoirequilibrated magma occur in the summit region and along the rift zone at subaerial and submarine sites. From Gerlach (1986). 10 km
zone complex (Fig. 16b). Equilibration and evolution of new magma injected into and temporarily stored in the summit chamber result in degassing of excess gas, which leads to the emission of a Chamber Gas containing >90% C02 (Fig. 15). Summit chamber degassing acts on all magma discharged into the reservoir system of the rift zone complex, and it is the first stage of a two-stage degassing process for magma that is subsequently erupted from the rift zone (Fig. 16b); the second stage occurs during the rift zone eruption
26
Symonds, Rose, Bluth & Gerlach: Volcanic-Gas Studies
itself (Fig. 16b). Summit chamber degassing removes so much C02 that, compared to Type I gases, rift zone eruptions produce distinctly C02-depleted, Type II volcanic gases, such as the Pele samples (Table 5, Fig. 15). The compositions of Chamber, Type I, and Type II gases plotted in Figure 15 show that Type I and Type II gases differ from each other mainly by their CDl content, and that the latter gases lie on a continuation of the trend formed by Type I gases from the partially degassed resupply magma of a summit lava lake (Fig. 15). Divergent-plate volcanoes. Similar degassing processes may be common at divergent-plate volcanoes (Gerlach, 1989a, 1989b). For instance, in the axial volcanic fields of the Afar depression, there are similar differences in the compositions of gas samples from the sustained summit lava lake of Erta' Ale volcano and samples from a fissure eruption at Ardoukoba on the Asal Rift in 1978 (Table 4, Fig. 8). In this case also, the summit lava lake and rift zone volcanic gases differ from each other mainly by their C02 content, which is higher in the summit lava lake gases (Type I) compared to the rift zone eruption gases (Type II) (Table 4, Fig. 8), suggesting again that the magma of the rift eruption at Ardoukoba underwent a two-stage degassing process with the first stage consisting of C02-rich chamber degassing during prior storage in a crustal magma reservoir. Finally, there is evidence to suggest that mid-oceanic ridge basalts undergo an analogous two-stage degassing process in which the first stage of degassing is the release of C02-rich gas from the ridge magma reservoirs that overlie the principal mantle sources of partial melt (Gerlach, 1989b). Generalizations. Chamber degassing fractionates the volatiles in the magma supplied from the mantle to hot-spot and divergent-plate crustal magma chambers. In general, it probably operates largely on the basis of volatile solubility in basaltic melts, removing most of the C02 and heavier rare gases (Ar, Kr, Xe, Rn), much of the He and Ne, some sulfur, and minor amounts of water and halogens (see also Chapters 6, 7 and 8). Chamber degassing also may be an effective mechanism for fractionating stable isotopes of volatile elements - e.g., carbon isotopes (Gerlach and Taylor, 1990). Therefore, Type I volcanic gases better represent the volatiles of new magma from the mantle, whereas Type II gases reflect fractionation by chamber degassing during crustal storage. Chamber degassing of C02-rich gas is responsible for the tendency of volcanic gases from hot-spot and divergent-plate basalts to separate into a high CIS group and a low CIS group (Fig. 8). The high CIS group consists of Type I gases and show somewhat variable CIS (-1-4), possibly reflecting different mantle sources. The low CIS group includes the Type II gases, which have comparatively restricted CIS values near 0.3, perhaps reflecting equilibration to similar low pressure conditions in crustal magma chambers. Degassing at convergent-plate
volcanoes
There are several examples of time-series studies of the degassing of magmahydrothermal systems at convergent-plate volcanoes. In addition to those considered below for Showa-Shinzan, Mount St. Helens, and White Island volcanoes, there are studies of time-series gas sampling available for Momotombo volcano, Nicaragua (Menyailov et aI., 1986) and Vulcano, Italy (Tedesco et al., 1991; Magro and Pennisi, 1991). Showa-Shinzan dome, Japan. The 31 years of gas data from Showa-Shinzan is currently the longest set of time-series data on high-temperature fumarolic emissions (Mizutani, 1962b, 1978; Mizutani and Sugiura, 1982; Symonds and Mizutani, in prep.). Showa-Shinzan is a dacitic lava dome that formed during the 1943-45 eruption of Usu volcano, Japan. High-temperature fumaroles on the dome were sampled from 1954 to
Symonds, Rose, Bluth & Gerlach: Volcanic-Gas Studies
27
1985, during which the dome degassed, cooled, and was invaded by meteoric vapor. Samples collected from the A-I fumarole, the hottest vent, in 1954-78 (Table 3) and in 1985 (Symonds and Mizutani, in prep.) best represent the temporal evolution of the discharged volatiles during the 31-year period. A
200
•
199
~
H
"
.
6r:-------------,
"
100..
meteroic vapor dominated ux~f ec ne por
100.
198
99.8
197::~~~~~~~~~~~~~---1950 1960 1.2
metercic vapor dominated
o
99.4,:~~~_~~~~ 1970
1980
C
1950
....... ~~~.-
1960
1970
__ 1980
0.05r;)------------~
o
0.04 0.8
0.03
S
C
0.02
0.4 0.01
0.0
• 0.00'h-~_~_~~_
1950 1.00
.'
1960
1970
1980
1950 0.04
E
1960
......_~_ 1970
..............< 1980
rooo---------------, F
0.03
Cl
F
0.05
0.02
0.01
0.00 1950
0.00 h-~_~+__~~_ 1960
1970
1980
1950
1960
....._~~_~~ 1970
1980
Figure 17. Plot showing moles of elemental hydrogen (A), oxygen (B), carbon (C), sulfur (D), chlorine (E), and fluorine (F) per 100 moles of gas for samples collected from the A-I fumarole on Showa-Shinzan between 1954 and 1985 (Table 3). Arrows in (A-B) show schematically the inferred influx of meteoric H20 into the A-I gases from 1954 to 1964, whereas the solid lines in (A-B) mark the period from 1973 to 1985 when the A-I gases were dominated by meteoric vapor.
Figure 17 shows the temporal evolution of elemental H, 0, C, S, CI, and F in the A-I fumarole gases from 1954 to 1985. During this period, the equilibrium temperatures of the A-I gases dropped from 1015 to 518°C. From 1954 to 1964 the A-I gases became increasingly enriched in H but depleted in 0, C, and S (Fig. 17A-D). After 1972, most samples contained >99.8% H20 and contained nearly constant levels of H, 0, C,
28
Symonds. Rose, Bluth & Gerlach: Volcanic-Gas Studies
and S (Fig. 17A-D). As suggested by Mizutani and Sugiura (1982), these trends reflect the escalating amounts of meteoric H20 in these samples. which is especially pronounced from 1954 to 1964. After 1964, the A-I fumarole gases were dominated by meteoric vapor. In contrast, concentrations of atomic Cl and F generally decreased from 1954 to 1960, increased sharply between 1961 and 1964, and decreased after 1964 (Fig. 17E-F). The general decrease in Cl and F from 1954 to 1985 represents the overall meteoric-waterdilution trend. However, the sharp increase in Cl and F between 1961 and 1964 may represent a late-stage halogen release from the magma. In essence, Cl and F partition from the magma much later than C and S, and these late-stage halogens overprint the overall meteoric-water-dilution trend during the 1961-64 period. Figure 18B shows that the CVS ratio increased five-fold from 1954 to 1964. Over the same interval, the CIS ratio decreased by a factor of five (Fig. 18A). In contrast, the 1954-64 CUP ratios were relatively constant (Fig. 18C). 40
IA 30
Figure 18. Plots showing: (A) atomic CIS, (B) atomic CllS, and (C) atomic Cl!F for 16 restored gas samples collected from the A-I fumarole at Showa-Shinzan between 1954 and 1985 (Table 3). Arrows in (A-B) indicate inferred degassing trends from 1954 10 1964, whereas the solid lines in (A-B) mark the period from 1973 10 1985 when the A-I gases were dominated by meteoric vapor.
CIS 20
meteoric vapor dominated
10
0 10
I
4r--------------------------------, c
B
8
3 CI/F
6
2
CIIS 4
"
.'
2
meteoric vapor dominated
o
0 1950
1960
1970
1980
1950
1960
1970
1980
The 1015 to 518°C temperature drop of the equilibrium A-I gases from 1954 to 1985 caused ratios of H201H2. C02/CO. and H2S/S02 to increase (Fig. 19), chiefly because the equilibrium amounts of H2S increased while those of H2, S02, and CO decreased (Fig. 1). These temperature-induced changes reflect right shifts in Reaction (26) and this reaction: 0
S02 + 3 CO + H20 = H2S + C02
(29)
Mount St. Helens, U.S.A. The 1980-86 eruptions of Mount St. Helens provided an opportunity to study the evolution of gases discharging from a magma-hydrothermal system (Gerlach and Casadevall, 1986a,b). The volcano erupted explosively on 18 May 1980, followed by five smaller explosive eruptions in the summer of 1980 and the extrusion of a lava dome after the October 1980 explosive eruption. The dome grew by episodic exogenous and endogenous growth until 1986. Gases were collected from fumaroles on the crater floor and on the dome from September 1980 to September 1981 (Table 3; additional data in Gerlach and Casadevall, 1986a). Over this period, the H content of the
Symonds, Rose, Bluth & Gerlach: Volcanic-Gas Studies
29
4.5 3.5 2.5 "0 'p C!S
1.5
.3
0.5
eE.
-0.5 -1.5 -2.5 500
600
700
800
900
1000
Tee)
Figure 19. Plot showing ratios of H20/H2 (triangles), C02/CO (circles), and H2SIS02 (squares) as a function of temperature for the A-I fumarole Sbowa-Sbinzan gas samples (Table 3). Solid lines represent linear regression fits of the data. All correlation coefficients are significant at the 99% confidence level.
.... 0,------
10.0 '.0
107.0
105.0
0
en w ..J a :a::
..J
1.0
0
U
···.0
5.0 '.0
Z
!c'
~ w
-,
a
s
IOS.O
0
104.0
..J II: 0Z
!c'
'.
". X )(
3.0
-...x
W ..J
w
)(
xlE
2.0
'.
.
o
··· -,0
101.0 ...... X
:it.
102.0
x
0
1.0
101.0
tI
.OO.D+-~~~_T--~~--~~~~--
0.0
~
0.",------------_---.
200.0
..B
198.0 1•.
0
en w
'0
7.0
..J II: 0-
o
.......
'.0
-.
....
. iii 0
0 )r'"
'9i.O
!!
;;;
)(
W ...J
.···x
a
!!:
192.0
:::r"
0
0.5 -l
en
'0
190.0
...J
0
1••
0
0Z
..
!c'
'
.t:l
0.'
II:
0 1•.
.....
0.3
w
..J W
0
············· ..0 0.2
lIi.O
o
.'
D.1
112.0
.~.0~~~_T~ J J 19BO
A
----------~~T-~~4 SON
0
J r 19BI
"
A
"
J
J
A
5
0
D.O+--.--.--.--.---.--TJ J A SON 0 J r " A 1980
19BI
-_rl "
J
J
A
5 0
Figure 20. Elemental C, 0, H, and S in moles per 100 moles of gas for 16 samples collected from Mount St. Helens, September 1980 to September 1981. The squares represent highest-quality restored and apparent compositions (Table 3) and Xs mark estimated compositions determined by Gerlach and Casadevall (1986a). The dashed line is the compositional trend for the 3 best samples reported in Table 3. [By permission of the editor of Journal of Volcanology and Geothermal Research; Gerlach and Casadevall (1986b), p. 150.]
30
Symonds, Rose, Bluth & Gerlach: Volcanic-Gas Studies 0.0
H2O
1
-1.0
~
z
o ..... -2.0 ~ u
"-
"2
-J.O
~ x:
8
-i.O
.J
-s.O -6.04-~-r~~~~~~~~-r-r~~~~~ J J A SON 0 J r M A M J J A 5 0 19BO
19B1
Figure 21. Equilibrium model of l-atm fumarole gas compositions for Mount St. Helens between June 1980 and October 1981. [Used by permission of the editor of Journal of Volcanology and Geothermal Research, from Gerlach and Casadevall (1986b), Fig. 2, p. 152.)
gases increased linearly while the concentrations of C, 0, and S decreased, also in a linear fashion (Fig. 20). These trends reflect the steady dilution of the magmatic gases by hydrothermal vapor over this time period. Estimates of the proportion of hydrothermal vapor in the Mount St. Helens gases range from 20 to 40% in June 1980 to 50 to 100% by October 1981. Like Showa-Shinzan, there are also temperature-related changes in the ratios of gas species. Linear changes in vent temperature and atomic compositions of fumarolic gases between September 1980 and September 1981 were used to constrain a l-atm equilibrium model of the gases between June 1980 and October 1981 (Fig. 21). White Island, New Zealand. White Island, an active andesitic-dacitiv volcano at the northeastern end of the Taupo volcanic zone, has emitted fumarolic gases for at least the past 150 years (Cole and Nairn, 1975). Regular fumarole gas sampling (about 2 samples per year from 6 to 10 fumaroles) commenced in 1971 and continues to the present day (Giggenbach and Sheppard, 1989). Over this time period, eruptions occurred in July 1971, between December 1976 and January 1982, and between December 1983 and February 1984. Between 1971 and 1984, samples from the Donald Mound fumarole, consistently the hottest vent, display cyclical variations in concentrations of HCl, H2, S02, and H2S that increase and decrease with fumarole temperature, although the decreases in H2S during periods of lower temperatures are much larger than the corresponding decreases in S02 (Fig. 22). The concentration of C02 also varies with temperature, but somewhat less than the other gases (Fig. 22). Giggenbach and Sheppard (1989) suggest that fluctuating inputs of magmatic gas into the sub volcanic system trigger movements in the inferred subsurface brines (Fig. 23) that may account for the variations in gas compositions from the Donald Mound fumaroles. During periods of high magmatic-gas output between late 1982 until early 1983, magmatic gases vented freely from the magma to the Donald Mound fumaroles (Fig. 23). However, during periods of low magmatic gas flux, brines, inferred from the intermittent occurrence of highly mineralized acidic springs, invade the vapor-only zone (Fig. 23) and absorb HCl, SDl, and other condensable gases. H2S also decreases during the low-temperature periods, probably a consequence of subsurface precipitation and loss of native S. Subsequent reheating evaporates the brines and deposits sulfur, releasing some of the previously absorbed volatiles and sometimes producing higher-than-magmatic concentrations of HCI and total S. C02 probably fluctuates less than the HCl and S02 because it is less soluble in the brine (see below).
Symonds, Rose, Bluth & Gerlach: Volcanic-Gas Studies
100
~=
10
-
-
r;
A
31
H2O
~
! 6
~ ~ 8
0.1
0.01
0.001 I
I
1971
1976
1981
10
B J
*.. 6
.~
.J
V
~
~~-
i ~'~ \~.
L'
0.1
~ 8
V~V.1
0.01
0.001 1971
1981
1978
1986
800
~C
600
~
/\ \
Q:
f ~~j
t!!
200
~
\
/\ \
/
I
..
I
-,.{" \
~
0 1971
1976
1981
1986
Figure 22. Temporal evolution of discharges from the hottest Donald Mound fumarole on White Island volcano from 1971 to 1984. Diagram shows the temporal evolution of (A) H20, CO2, HCl, and H2; (B) S02 and H2S;and (C) temperature. Arrows mark short eruptive episodes in July 1971 and between December 1983 and February 1984; bar marks December 1976 to January 1982 eruptive period. All data from Giggenbach and Sheppard (1989). Total S and its oxidation state, n, recalculated as S02 and H2S, assuming they are the dominant species, using the equations described by Giggenbach and Goguel (1989; p. 49); when n exceeded 4.0, we assigned an arbitrary value of 0.002 mole % for the concentration of H2S. H2 data unavailable for samples collected on July 29 and August 26, 1971, and on December 2, 1980.
32
Symonds, Rose, Bluth & Gerlach: Volcanic-Gas Studies OONALOMQUt-V
SPRINGS
SEA
Figure 23. Schematic cross-section across the White Island crater showing inferred locations, relative to Donald Mound, of degassing magma, vapor-only zone, vapor-plus-brine zone, and brine-only zone for the high-temperature periods in 1972 and 1975. Diagram from Giggenbach and Sheppard (1989).
Gasllava interactions during degassing It is commonly assumed that, after discharging from magma, volcanic gases maintain homogeneous equilibrium with falling temperature until they quench. A test of this assumption with ten high-temperature gas samples (Pele samples, Table 5) reveals a more complex process for gases emitted from an erupting fissure in 1983 on the east rift zone of Kilauea (Gerlach, 1993a). The Pele analyses have log fDl values that fall on a tight linear trend (r2 = 0.982) as a function of reciprocal (last equilibrium) temperature (Fig. 24a). Regression of the data yields the following equation: log f02 = -26,410 (1ff) + 10.06
(29)
where f02 is in bars and T is in Kelvin; the equation is valid from 935 to 1032°C. Values of log fH2, log fCO, log fS2, log fH2S, log fC12, and log fF2 also follow linear trends as a function of reciprocal (last equilibrium) temperature (Fig. 24b-g). It can be shown that these linear trends do not represent the intrinsic closed-system trends expected if the gases maintained homogeneous equilibrium during cooling. Numerical simulation of closedsystem (homogeneous equilibrium) cooling of each sample from high temperature to the last equilibrium temperature produces trends that depart from the observed linear trends for all species, except for F2 (Fig. 24a-g). Open-system cooling involving oxygen transfer between the major gas species (H20, C02, S02) and lava, however, is consistent with the observed linear log f02-versus-reciprocal-temperature trend. Numerical simulations show, moreover, that the gas/lava oxygen transfer required to constrain log f02 by equation (29) during open-system cooling also produces the observed linear trends of all minor and trace species (Fig. 24a-g). Mass balance calculations suggest that redox reactions between the gas and ferrous/ferric iron in the lava are plausible mechanisms for the oxygen transfer. Oxygen transfer during cooling is variable-probably reflecting fluctuating rates of gas flow. Higher flow rates reduce the time available for gasllava oxygen exchange and result in gases with higher last equilibrium temperatures; lower flow rates favor oxygen transfer down to lower temperatures. Gas/lava exchanges of other components (C,H,S) apparently are relatively insignificant during cooling; thus, multicomponent gas/lava heterogeneous equilibrium is not realized. Samples of higher-temperature-up to 1185°C-C02-rich volcanic gases from sustained summit lava lake eruptions (J-series samples, Table 5) also show buffering by gas/lava oxygen transfer. The two data sets give a tightly constrained log f02-relative to the nickel-nickel oxide (NNO) buffer-of NNO - 0.5(±O.05) for subaerially erupted Kilauea basalt from liquidus to solidus temperatures (Fig. 13). Thus,
33
Symonds. Rose. Bluth & Gerlach: Volcanic-Gas Studies l09fo2
1000·C
950·C
-10
109fH
a
2
1000· C
950· C
-I . 7 r------=c.=.:,.=--=:..._----':.;:;_;--'-~
b
-II
-11.5
0.76
logfCO
0.78
0.8
1000·C
0.76
950·C
-2.9
log '52
c
"
4 3 2
o -1
o
1
2
3
4
5
6
Sulfur Dioxide (log kilotons) Figure 29. S02 outgassing by explosive eruptions compared to VEl (from Bluth et al., 1993). Data are separated by tectonic regimes to show relative contributions of volcanic activity as a function of explosivity. The TOMS SOr VEl regression line (r2 = 0.999) is determined from average S02 for all VEl 4-6 eruptions between 1979 and 1992; VEl 2 and 3 averages are calculated using respective TOMS detection rates. Estimates of S02 emissions (*) from some historical, highly explosive eruptions are added for comparison.
48
Symonds, Rose, Bluth & Gerlach: Volcanic-Gas Studies
Annual S02 emissions. In order to understand the impact of volcanism on the Earth's atmosphere, the eruption frequency and outgassing rates for the entire range of volcanic activity must be known. Non-explosive volcanoes (e.g., Etna, Kilauea) degas at relatively consistent rates, estimated at 9 Mt S~ annually (Stoiber et aI., 1987). In contrast, forceful degassing characteristic of explosive eruptions (e.g., Mount Pinatubo) is notoriously sporadic and more difficult to quantify. Thus the total yearly volcanic flux of sulfur dioxide is not well constrained; previous ground-based estimates range from l.5 to 50 Mt (see references within Bluth et al., 1993). The current man-made contribution is approximately 190 Mt/yr (Moller, 1984). Using the TOMS data, Bluth et al. (1993) made the simplest estimate of annual S~ output by explosive volcanism from the total explosive S~, 52 Mt, over 14 years of observation - an average of 4 Mt/yr. But Figure 28 demonstrates the rather sporadic distribution of the "average" output The dataset is sensitive to the S02 emissions of a few relatively large eruptions. For example, one could argue that the 14-year TOMS database is simply dominated by two eruptions, El Chich6n and Mount Pinatubo; removing these would halve the calculated annual S02 flux for this period. Seeking another way to address the temporal distribution of global volcanism, Bluth et al. (1993) linked the TOMS S02 data to a longer-term dataset of eruption explosivity (VEl) and frequency. Although virtually useless in connecting individual eruptions to S02 emissions (in Fig. 29, note the 2-3 order of magnitude ranges of S~ observed over VEl 3 or 4 eruptions), a general relationship between average sulfur dioxide emission and VEl has been observed previously by Stoiber et al. (1987). Likewise in Figure 29, a TOMS S02IVEI relationship can be determined from average S02 amounts for each VEl level (VEl 2 and 3 averages reflect the TOMS' detection rates of these eruptions). The relationship of eruption frequency to VEl over the past 200 years (Simkin, 1993) can then be used to determine the annual eruptive activity for each VEl category. Multiplying the two (average S02 and number of eruptions from VEl 0 - 7) produces a total S02 flux from explosive volcanism of approximately 4 Mt, in agreement with the simple average of the total TOMS S02 database. This suggests that the dominance of the total explosive S02 output by a few large eruptions is not unique to the past 14 years. Most volcanic emissions are apparently generated from non-explosive degassing, and combining the non-explosive (9 Mt) and explosive (4 Mt) outputs yields an annual flux of 13 Mt S02 from volcanoes. Therefore, it appears that the average annual volcanic emission of S02 to the Earth's atmosphere comprises less than 10% of the present-day anthropogenic flux. Even a Mount Pinatubo-sized eruption is small compared to the current annual anthropogenic S02 contribution to the atmosphere. Although much smaller in S02 mass output, volcanic activity produces a disproportionately large climatic impact compared to anthropogenic sources because explosive volcanism has the ability to inject sulfur directly into the stratosphere. In the TOMS database 65% of the total 52 Mt S02 was emitted by eruptions of VEl 4 and above (Bluth et al., 1993), which implies that stratospheric injection of sulfur dioxide by volcanoes averages roughly 2.5 Mt/yr. Tandem use with COSPEC. In short-lived, powerful eruptions, such as those of Mount Pinatubo in June 1991, the explosive emissions of S02 are usually much greater than the non-explosive contribution. These emissions are best quantified by TOMS. In contrast, eruptions such as exhibited by Mauna Loa and Etna outgas essentially all their sulfur non-explosively, and are better evaluated by COSPEC. To accurately assess the total sulfur budget for moderate strength volcanism such as that exhibited by Galunggung in 1982, a com bination of remote sensing techniques is most appropriate.
49
Symonds, Rose, Bluth & Gerlach: Volcanic-Gas Studies
-...
20
'D
15
~
•
0 en
=
E
en
:::E ~
•
••
1.5
>-
GI
'D
N
0 en 0
•
10
-
g
•
CD
W
2.0
1.0
W 11.
en 0 0 0.5
5
-D-
0.0
0 18
22
26
30
3
7
11
15
19
August - September, 1982 Figure 30. Comparison of TOMS and COSPEC S02 data for a coincident period of record of Galunggung eruptions in Indonesia, August 19 - September 19, 1982 (from Bluth et al., 1994a). Large VuJcanian eruptions reported by the Cikasasah Volcano Observatory are marked by filled triangles along the horizontal axis. Note that the TOMS and COSPEC data are plotted on different scales.
Galunggung awoke from 63 years of quiescence in April 1982. During its most violent period from April to October, the Cikasasah Observatory reported 88 eruptions (Katili and Sudradjat, 1984). Eruptions became less violent towards the end of September, but the volcano continued to erupt sporadically through January 1983. TOMS detected and measured 24 separate sulfur dioxide clouds from April 5 to September 19 (Bluth et al., 1994a). The rapid dispersion of the S02 clouds, altitude estimates of co-emitted ash clouds, and comparisons of cloud motion to tropospheric wind, suggest that most of the S02 remained below the tropopause. A total of just over 2000 kt S02 was produced primarily by the 24 explosive eruptions observed by TOMS, and to a smaller extent by the 64 explosive eruptions which were below the TOMS detection limit. For the first time both TOMS and COSPEC were in operation during a coincident, 32day period of explosive volcanism (Fig. 30). Bluth et al. (1994a) estimated that explosive outgassing of S02 (derived from TOMS) produced approximately six times the nonexplosive emissions (estimated from COSPEC data; Badruddin, 1986). If this ratio remained relatively constant over the course of activity from April to September, approximately 350 kt would have outgassed non-explosively. CO SPEC data indicate an additional 50 kt S02 were emitted by the less-violent activity from the end of September 1982 to the end of January 1983. Combining all the estimates of S02 emissions, Galunggung outgassed approximately 2500 kt of sulfur dioxide from both explosive and non-explosive activity between April 1982 to January 1983. Excess S02 from convergent-plate
volcanoes
Volatile exsolution models for Kilauea basalt containing 0.3 wt % H20, 0.07 wt % S, and 0.02-0.05 wt % C02 suggest that vigorous exsolution of dissolved sulfur (as S02) occurs only after the magma has ascended to shallow depths (estimated to be about 150 m) where pressures are Ii) 1.9 x 10⁵/yrt 4.0 x 10⁴ 3.7 X 10⁶ 1.1 x I O·~ 3.5 X 10⁷ 2.2 X lOR 1.2 x 10⁹ 2.6 x 10⁴ 5.0 X 10⁹ 7.4 x lOB 5.4 X lOB
t From Allard et .1. (1994); tslighlly modified
10
S mass tonnes (=
u» Ii)
1.1 x leJ5/yrt 7.5 x 10³ 2.7 x IO-~ s.s x UP :Ux lOs J.(\ x 106 7.0 x 10⁶t 1.3 x 10² O_(\ X 107 0.3 X 10⁶ 1.2 x 1()5
Equiv % S wt% 58t 15 6.9 3.1 0.93 0.72 0.58 0.5 0.12 0.04 0.02
reflect data of Bluth et al. (1993).
near the surface (Andres et al., 1989). These results are also likely to be true for eruptions of other tholeiitic basalts with similar low volatile contents, but they are at odds with S02 emissions depicted by TOMS and COSPEC data for eruptions of magma at convergentplate volcanoes. For these systems, S02 emissions appear to be in excess of expected yields based on concentrations of dissolved sulfur, as represented by melt inclusions, and the quantity of erupted and near surface magma (Rose et al., 1982; Andres et al., 1991; Westrich and Gerlach, 1992; Allard et al., 1994; Gerlach et al., 1994, 1995; Gerlach and McGee, 1994). In many cases, the proportion of excess sulfur indicated by the S02 release is very large. Table 9 shows examples of the required sulfur contents of surficial coerupted magma that, if completely degassed, could account for the observed masses of released sulfur. The values are much higher than the sulfur content of the magma indicated by melt inclusions, except for Mauna Loa, which involves tholeiitic basalt likely to have a volatile content similar to that of Kilauea basalt. Most of the examples are for convergent plate volcanoes. The general lack of agreement in these cases shows that remote sensing of S02 is a poor way to estimate lava eruption rates and volumes for these systems, and that melt-inclusion methods are likely to underestimate sulfur yields during convergent plate volcanism (Devine et al., 1984; Palais and Sigurdsson, 1989) by large factors. Comprehensive TOMS, COSPEC, and melt-inclusion data permit a comparison of S02 emissions based on remote sensing and melt inclusions for explosive volcanism at three convergent plate volcanoes. TOMS and COSPEC data from the climactic explosion of Mount St. Helens on May 18, 1980 to the last stages of quiescent dome degassing in September 1988 indicate a total S02 emission for the eruption of roughly 2 Mt (megaton) compared to a melt inclusion-based estimate for the eruption of 0.08 Mt (Gerlach and McGee, 1994). The total TOMS and COSPEC-based S02 emission estimate for the 19891990 eruption of Redoubt Volcano, Alaska, is approximately 1 Mt compared to a maximum emission estimate of 0.04 Mt from melt-inclusion data (Gerlach et al., 1994). The TOMS estimate for S02 emission during the 1991 eruption of Mount Pinatubo, Philippines, is about 20 Mt (Bluth et aI., 1992), whereas the melt inclusions indicate no significant degassing of dissolved sulfur during magma ascent and eruption (Gerlach et al., 1995; see also Chapter 8). The sources of the excess sulfur are widely discussed and debated, but the remote sensing data for S02 and C02 and melt inclusion data for H20 and C02 suggest that the Mount St. Helens dacite, the Redoubt andesites, and the Mount Pinatubo dacite were vapor-saturated at depth prior to eruption, and that sulfur in accumulated vapor provided the immediate source of excess sulfur for the S02 emissions (Westrich and
Symonds, Rose, Bluth & Gerlach: Volcanic-Gas Studies
51
Gerlach, 1992; Gerlach et aI., 1994; Gerlach and McGee, 1994; Wallace and Gerlach, 1994; Gerlach et aI., 1995). Detection of H2S emissions. During the summer of 1992, Mount Spurr, Alaska ended a 39-year period of quiescence and emitted large S02 plumes during three separate eruptions June 27, August 18, and September 17 (Bluth et aI., 1994b). After the August and September eruptions, an unusual pattern was observed: TOMS-measured S02 actually increased from the first to second day, before returning to a typical pattern of gradual cloud dispersion (Fig. 31). Both eruption plumes were observed after complete separation from the volcano, thus there was no possibility that the increase could have occurred from additional outgassing after the first TOMS overpass. An important implication for this retrieval pattern may be that significant H2S emission occurred during the Spurr eruption. Bluth et al. (l994b) first examined several other explanations. Measurement uncertainty was ruled out as the cause, based on the consistent S02 dispersion characteristics of the clouds after the initial days' low quantities. Neither interference from co-erupted ash, nor aerosol formation were consistent with the TOMS data UV light scattering by the ash clouds, which Schneider et al. (1994) showed were coincident with the gas clouds, may have partially masked detection of sulfur dioxide, but TOMS reflectivity data showed no evidence of UV attenuation from ash particles. In addition, the slow fallout rate of micron-sized particles in the plume (Rose, 1993; Wen and Rose, 1994) indicated that any effect on TOMS measurements should have lasted for weeks, rather than only a single day. Radiative transfer modeling of ash and aerosol effects on TOMS retrievals suggest that the presence of either should cause measured S02 to increase, rather than be underestimated. Also, the aerosol effect should have increased with time, as more S~ converted to aerosol. The eruption of H2S, and oxidation to S02 subsequent to the first day, could explain the tonnage increases in the TOMS data. The amount of hydrogen sulfide required to produce the sulfur dioxide pattern observed in the TOMS data is roughly 75 kt H~S for the August eruptions (a 3: 1 S02:H2S ratio), and 25 kt H2S for the September eruption (a 6: I ratio). Doukas and Gerlach (1994) report on evidence and a possible mechanism for hydrogen sulfide emissions from boiling of hydrothermal fluid within the volcano (see below). As discussed above under pressure effects, it is also possible that H2S was a stable sulfur gas species in the magma at depth (Reaction 26, Fig. 14) and that rapid eruption and transport through the troposphere allowed a significant amount of it to reach the stratosphere and subsequently oxidize to S02. For example, Gerlach and Casadevall (l986b) suggested that sudden release of H2S stabilized in magma at depth (Fig. 14) may have caused the high H2S/S02 observed in Mount St. Helens plumes during explosive eruptions, including the May 18, 1980 climactic eruption plume (Casadevall et aI., 1981; Hobbs et aI., 1981), and that S~-related environmental effects of explosive volcanism may often require post-eruption oxidation of discharged H2S. The pattern of increasing S~ in this stratospheric cloud was also observed in the TOMS data immediately after the climactic May 18 eruption of Mount St. Helens in 1980. While the TOMS data cannot be used as definitive proof of H2S gas emissions from either the Spurr or St. Helens eruptions, these results may open a new approach for investigating the degassing of magma-hydrothermal systems. EMISSION RATES OF OTHER VOLCANIC GASES Methods for measurement Volcanologists have long recognized the value of remote sensing data on more species, but results of this sort are very sparse (Mori et aI., 1993). An infrared gas spectrometer
52
Symonds, Rose, Bluth & Gerlach: Volcanic-Gas Studies 350
600
A. June 27 Eruption
300 ~
..
~ 0
!II "0 :J
250
0
500 ~ 400 ~
200 150
.2
..
..
~.
§
.....
~
300
.
100
200 ~ :J 0
.......
50 .,:
• 100
0 350
..
B. August 18 Eruption
~ 0
200
..
!II "0 :J 0
U
.e
500
.
150
.:
100
SO
.•......
'. •
400 ....
8 g 300
'.
'.
'.
.....,..,
0 350
200
:J
.2
,
j600 500
.. E
~ 0
:::~
.2
S C "0
• 100 0
C. September 17 Eruption
250
0
::..
0
,
,
300 [
!II "0 :J
..
E
a'/~'''' .:
50 r
..
U
0 600
300 ~ 250
..e
:!:..
400 ~
100
_ .. ~ _.
'.
8
..
300
:: III
! 200 ~ :::J
0
50 t
S0.
:
100
0 0
50
100
150
U
0 200
TIme sInce eruption (hours) Figure 31. Comparison of cloud sulfur dioxide mass (open circles) and area (filled circles) as a function of time after eruptions of Mount Spurr, Alaska in 1992 (from Bluth et al., 1994b). (a) June 27 eruption. (b) August 18 eruption. (c) September 17 eruption.
(Miran) has been used to provide data on C02 fluxes of volcanic plumes at Mount St. Helens (Harris et al., 1981). This device is not a remote sensor, but requires direct sampling of the plume. This limitation means that the C02 concentrations of the plume must be mapped by aircraft traverses through the plume. As a result, the Miran has only been used in a few cases (Harris et al., 1981; Casadevall et al., 1987; Casadevall et al., 1994; Doukas and Gerlach, 1995). At Mount St. Helens Miran data on C02 were coupled with CO SPEC determined S02 fluxes to allow comparison and ratioing of two species. Because most of the C02 may be lost from magmas before extensive degassing of S02as discussed above for Kilauea volcano-there is a possibility that such data will be a more useful forecasting tool than S02 alone (Harris and Rose, 1994; Casadevall et al., 1994).
Symonds, Rose, Bluth & Gerlach: Volcanic-Gas
53
Studies
Methods of estimation Combining flux measurements with compositional data on plumes and fumaroles gives estimated fluxes of additional species. For instance, by combining COSPEC S~ fluxes with direct gas samples that constrain the ratios of other species to S02, fluxes for all species in the samples can be estimated (e.g. Rose et al., 1986; McGee, 1992). When analytical data are not available for minor and trace species, thermochemical modeling can provide estimates of the appropriate ratios (Symonds et aI., 1992). Combining the COSPEC with gas-filter sampling (Finnegan et al., 1989) also allows estimation of elemental fluxes (Phelan et al., 1982; Rose et al., 1988).
':f
i
i
i
i
, i
r=
i
Begin CO2
a
800
a a
10000
700
5"
t:: X :::l ...J
U. N
0
5"
a
600
8000
;::: X :::l
500
...J
6000
400
u, N
0
en
o
300
4000
Low Ught
200
f-
100
f-
0' 11-Jun
a
\
a
a
1991
28-Dec
I
.~= .,
a
19-5ep
06-Apr 1992 DATE
15.Jul
23-0ct
a
-I a
31-Jan
I
2000
a 0 11-May
1993
Figure 32. S02 and C02 emission-rate measurements for Crater Peak, Spurr Volcano, between 1991 and 1993. Solid squares and open squares give S02 (left vertical axis) and C02 (right vertical axis) fluxes, respectively. Arrows mark explosive eruptions. Solid bar indicates low light period when COSPEC measurements were not possible. From Doukas and Gerlach (1994).
Measuring
both S02 and C02 emission rates-an example of the advantages
During the 1991-1993 activity of Crater Peak on Spurr Volcano, Doukas and Gerlach (1994) measured both S02 and C02 emission rates using COSPEC and Miran, respectively. Over this timeframe, there were three subplinian eruptions on June 27, August 18, and September 16-17, 1992. S02 measurements began on July 22,1991 at the onset of precursory seismicity, whereas C02 fluxes were not initiated until September 25, 1992; flux measurements continued until April 24, 1993 (Fig. 32). Despite the elevated seismic activity and explosive eruptions, both indicating shallow intrusion of magma, S02 fluxes were generally -
~
u !l c
"
0
u
600 ~ Sulfur Dioxide Emission Rate 450 300 150 LONE Reducing Gas (air)
60 40 20 0
ia....WU
16000 ~ FAMS Radial Tilt 12000 8000 4000 5.0 ~ TNK~-RUBY c':~n;';'~ti~~ Rate -5.0 -15.0 -25.0 4000 3000 2000 1000 0
t
~~~sl~~A~
Oct
5
10
15
20
25
Nov
6
1986
Figure 33. Plot of S02 emission rates, reducing-gas sensor data, tilt, electronic distance measurements (EDM), and seismic data at Mount St. Helens during October and November, 1986. Air reducing-gas data are from station LONE on the east side of the dome. The single datum on October 22 is shown enlarged and the dotted line represents the missing early portion of the reducing-gas peak. Tilt data are from FAMS (north side of dome); EDM data are from the line between lNKR (north crater floor) and RUBY (north side of dome); Seismicity is represented by hourly-averaged RSAM data from YELS (north crater floor). Vertical line represents the beginning of lava extrusion on 21 October 1986. Note that the increases in S02 fluxes and reducing-gas signals coincide with changes in tilt, EDM, and seismic data. From McGee and Sutton (1994).
eruptions. TOMS is useful (for S02) during the large explosive eruptions, but can't be used to measure lower-level emissions. The example shown in Figure 34 documents S~ emissions throughout 1980 at Mount St. Helens. Most of the data come from COSPEC observations, but the high spikes are TOMS data, taken during the major eruption of May 18. The ratio of explosive to non explosive degassing at Mount St. Helens in 1980 is roughly 5: 1; -1 Mt during the May 18 event and 220 Kt during non-eruptive days of 1980. CONCLUSIONS Volcanic gases contain H20, C02, S02, H2, H2S, HCl, HF, CO, S2, COS, rare gases, and a number of trace-metal species. The main volcanic gases are H20, C02, and S02, although H2S may be the dominant sulfur gas in equilibrium with some convergentplate magmas at depth, and HCl may exceed total S in some convergent-plate volcanic gases. Gases discharging from convergent-plate volcanoes contain much more H20 than gases from divergent-plate or hot-spot volcanoes, which have higher proportions of C02 and S02. Convergent-plate-volcano gases are also relatively enriched in HCl. These patterns reflect the tectonic origins of the respective magmas. Magmas from divergent-plate and hot-spot volcanoes derive volatiles primarily from the mantle, so they contain moderate amounts of C and S but are relatively depleted in H20 and Cl compared to magmas from convergent-plate volcanoes, which contain volatiles from the subducted slab as well as the mantle, making them richer in H20 and Cl.
59
Rose, Bluth & Gerlach: Volcanic-Gas Studies
Symonds, 10' ,,-..,
10"
S02 Emissions Mount St. Helens
~
C\j
e
10'
CI:l il)
~ ~
10'
~ u
10'
0
'E
10'
:;E ..__,
10'
il)
10° 75
125
175
225
275
325
375
Julian Days 1980 Figure 34. Combination of COSPEC (open circles) and TOMS (filled circles) data for Mount St Helens in 1980. COSPEC data are from Casadevall et al. (1982); TOMS data are approximate. Highest spike of S02 emissions is on Julian day 138 (18 May), about 1 Mt, measured by TOMS.
The relative abundances of H2, H2S, and CO in volcanic gases depend on temperature, pressure, and bulk composition. For a given bulk atomic composition, the H2fH20, S02lH2S, and CO/C02 ratios increase with rising temperature and falling pressure. The abundances of H2, H2S, and CO also increase with the amounts of atomic H, H + S, and C, respectively, and with decreasing f02. The f02's of at least some high-temperature volcanic gases are apparently buffered by their respective lavas over a range ofliquidus to solidus conditions. Thus, volcanic-gas data can provide independent constraints on f02 of magmas in addition to those provided by analyses of minerals and glasses in rocks. Volcanic-gas studies contribute to the overall understanding of the storage and release of volatiles from magmas. One outstanding dilemma is that many andesitic-dacitic convergent-plate volcanoes emit more S02 during eruptions than can be explained by the amount of dissolved S released from erupted or near-surface magma. This also applies to CO2 in the few cases where the appropriate C02 data exist. One emerging explanation is that many of these magmas may contain a separate gas phase at depth prior to eruption (see also Chapter 8). These andesitic-dacitic magmas also contain variable amounts of dissolved volatiles (mainly H20) that may exsolve from melt during ascent and eruption or at shallow depths by second boiling of magma (e.g., during crystallization of a dome). Most basaltic magmas also appear to contain dissolved volatiles and a separate gas phase. For instance, Kilauea magmas apparently saturate with C02-rich fluid at -40 km depth, whereas most of the remaining volatiles exsolve at ~150 m. This general feature of twostage degassing may be common at hot-spot and divergent-plate volcanoes. Once a separate C02-rich fluid exists, it may scavenge other volatiles with especially low solubility (e.g., rare gases) from the melt. Volcanic gases are one of several indicators used to understand and forecast volcanic activity. In particular, S02 fluxes correlate moderately well with volcanic activity, and have helped forecast some eruptions. However, S02-flux data have been much more successful at predicting the episodic eruptions or declining volcanic activity that follow an
60
Symonds, Rose, Bluth & Gerlach: Volcanic-Gas Studies
initial cataclysmic eruption than in predicting the first explosive eruption itself. This suggests that prior to the vent-clearing eruption, a hydrothermal or impermeable-rock barrier may prevent some or all of the S02 from reaching the surface. Recent work indicates that magmatic C02 and He are less affected by hydrothermal barriers and may therefore provide an improved basis for forecasting initial eruptions. The principal atmospheric and global impacts of volcanic eruptions occur through stratospheric injection of S~, which converts to sulfuric acid aerosols that block incoming solar radiation and contribute to ozone destruction. On average, volcanoes emit 13 Mt of S02 per year, of which 4 Mt comes from explosive eruptions and 9 Mt is emitted by passive degassing. This represents only 5-10% of the annual anthropogenic S~ flux, but its climatic and atmospheric impacts are greater because much of the volcanic S02 is injected explosively into the stratosphere where it is not readily rained out, unlike the S~ discharged into the troposphere. Over the past 14 years, the eruptions of El Chich6n and Mount Pinatubo dominate the explosive S~ flux, suggesting that most of the stratospheric injections come from infrequent large eruptions. Future studies should expand the data on high-temperature equilibrium com-positions of volcanic gases. These studies should include thermochemical evaluation of analytical data and retrieval of last equilibrium compositions and temperatures where possible by methods reviewed above. High sampling priorities include gases from hot-spot and divergent-plate volcanoes, especially those with alkaline and evolved magmas. More tirneseries samples from multiple vents on the same volcano are also needed. In addition, more work is needed to develop sensors that detect specific gas species and resist corrosion by acidic volcanic gases so that the true potential of time-series monitoring of fumaroles can be realized. A high priority for plume studies is to measure C~ emission rates, as well as the emission rates of other gas species, in addition to S~. Past studies show that, in addition to S02 fluxes, ratios of gas species change with volcanic activity. Multiple-species flux data would provide data on both emission rates and the ratios of gas species. Satellitebased systems that can detect multiple species well into the troposphere are also desirable and may offer the most cost-effective approach for measuring volcanic-gas emissions when combined with in-situ or continuous sensor data in the future. Such systems may provide the only practical means for observing volcanic emissions on a global scale. Finally, we need additional TOMS measurements of S02 emissions from large explosive eruptions to improve understanding of the atmospheric and climatic impacts of these volcanic events. ACKNOWLEDGMENTS Timely and detailed reviews by Patrie Allard, Alain Bernard, Jake Lowenstern, and Ken McGee greatly improved an earlier draft of this paper. Mark Reed suggested the method of graphically displaying correspondence temperatures. Funding for this project was provided in part by the U.S. Geological Survey Volcano Hazards and Geothermal Studies Program and the U.S. Geological Survey Global Change and Climate History Program. REFERENCES Agustsdouir AM, Brantley SL (1994) Volatile fluxes integrated over four decades at Gnmsvotn volcano, Iceland. J Geophys Res 99:9505-9522. Allard P (1983) The origin of hydrogen, carbon, sulphur, nitrogen and rare gases in volcanic exhalations: evidence from isotope geochemistry. In: Tazieff H, Sabroux JC (eds) Forecasting Volcanic Events. Elsevier, Amsterdam, 337-386. Allard P, Tazieff H, Dajlevic D (1979) Observations of sea floor spreading in Afar during the November 1978 fissure eruption. Nature 279:30-33.
Symonds, Rose, Bluth & Gerlach: Volcanic-Gas Studies
61
Allard P, Carbonnelle J, Dajlevic D, Le Bronec J, Morel P, Robe MC, Maurenas 1M, Faivre-Pierre R, Martin D, Sabroux JC, Zettwoog P (1991a) Eruptive and diffuse emissions of C02 from Mount Etna Nature 351:387-391. Allard P, Malorani A, Tedesco D, Cortecci G, Turi B (1991b) Isotopic study of the origin of sulfur and carbon in Solfatara fumaorles, Campi Flegrei caldera. J Volcanol Geotberm Res 48:139-159. Allard P, Carbonnelle J, Metrich N, Loyer H, Zettwooog P (1994) Sulphur output and magma degassing budget of Stromboli volcano. Nature 368:326-330. Alt JC (1994) A sulfur isotopic profile through the Troodos ophiolite, Cyprus: primary composition and the effects of seawater hydrothermal alteration. Geochim Cosmochim Acta 58: 1825-1840. Andres RJ, Rose WI (1994) Remote sensing spectroscopy of volcanic plumes and clouds. In: McGuire WJ, Kilburn CRJ, Murray JB (eds) Monitoring Active Volcanoes: Strategies, Procedures, and Techniques. University College of London Press, London, England (in press). Andres RJ, Kyle PR, Stokes JB, Rose WI (1989) Sulfur dioxide emissions from episode 48A, East Rift Zone eruption of Kilauea volcano, Hawaii. Bull VolcanoI52:113-117. Andres RJ, Rose WI, Kyle PR, deSilva S, Francis P, Gardeweg M, Moreno Roa H (1991) Excessive sulfur dioxide emissions from Chilean volcanoes. J Volcanol Geotherm Res 46:323-329. Andres RJ, Rose WI, Stoiber RE, Williams SN, Matias 0, Morales R (1993) A history of sulfur dioxide emission rate measurements from Guatemalan volcanoes. Bull VolcanoI55:379-388. Andres RJ, Kyle PR, Chuan RL (1994) Sulfur dioxide, particle and elemental emissions from Mount Etna, Italy during July 1987. Geologishe Rundschau (in press). Baubron JC, Allard P, Toutain JP (1990) Diffuse volcanic emissions of carbon dioxide from Vulcano Island, Italy. Nature 344:51-53. Badruddin M (1986) Pancaran gas S02 pada Letusan G. Galunggung, 1982. In: Katili JA, Sudradjat A, Kumumadinata K (eds) Letusan Galunggung 1982-1983. Direktorat Vulkanologi, Direktorat Jenderal Geologi Dan Sumberdaya Mineral, Departemen Pertambangan Dan Energi, Bandung, 285-301 (in Indonesian). Bernard A (1985) Les mecanismes de condensation des gaz volcaniques. PhD dissertation, University of Brussels, Belgium (in French). Bernard A, Symonds RB, Rose WI Jr (1990) Volatile transport and deposition of Mo, W and Re in high temperature magmatic fluids. Appl Geochem 5:317-326. Berresheim H, Jaescbke W (1983) The contribution of volcanoes to the global atmospheric sulfur budget. J Geophys Res 88:3732-3740. Bluth GJS, Doiron SD, Schnetzler CC, Krueger AJ, Walter LS (1992) Global tracking of the S02 clouds from the June, 1991 Mount Pinatubo eruptions. Geophys Res Lett 19:151-154. Bluth GJS, Schnetzler CC, Krueger AJ, Walter LS (1993) The contribution of explosive volcanism to global atmospheric sulphur dioxide concentrations. Nature 366:327-329. Bluth GJS, Casadevall TJ, Schnetzler CC, Doiron SD, Walter LS, Krueger AJ, Badruddin M (1994a) Evaluation of sulfur dioxide emissions from explosive volcanism: the 1982-1983 eruptions of Galunggung, Java, Indonesia. J Volcanol Geotherm Res (in press). Bluth GJS, Scott CJ, Sprod IE, Schnetzler CC, Krueger AJ, Walter LS (1994b) Explosive S02 emissions from the 1992 eruptions of Mount Spurr, Alaska. In: Keith T (ed) Spurr 1992. U S Geol Surv Bull (in press). Brantley SL, Agustsdottir AM, Rowe GL (1993) Crater lakes reveal volcanic heat and volatile fluxes. GSA Today 3:173-178. Buat-Menard P, Arnold M (1978) The heavy metal chemistry of atmospheric particulate matter emitted by Mount Etna volcano. Geophys Res Lett 5:245-248. Caltabiano T, Gennaro D, Romano R (1994) S02 flux measurements at Mount Etna (Sicily). J Geophys Res (in press). Carmichael ISE (I991) The redox states of basic and silicic magmas: a reflection of their source region? Contrib Mineral Petrol 106:129-141. Casadevall TJ, Johnston DA, Harris DM, Rose WI, Malinconico LL, Stoiber RE, Bornhorst TJ, Williams SN (1981) S02 emission rates at Mount. St. Helens from March 29 through December, 1980. In: Lipman PW, Mullineaux DR (eds) The 1980 eruptions of Mount St. Helens, Washington. U S Geol Surv Prof Paper 1250: 193-200. Casadevall T, Rose W, Gerlach T, Greenland LP, Ewert J, Wunderman R, Symonds R (1983) Gas emissions and the eruptions of Mount St. Helens through 1982. Science 221:1383-1385. Casadevall TJ, Rose WI Jr, Fuller WH, Hunt WH, Hart MA, Moyers JL, Woods IX, Chuan RL, Friend JP (1984) Sulfur dioxide and particles in quiescent volcanic plumes from Poas, Arenal, and Colima volcanos, Costa Rica and Mexico. J Geophys Res 89:9633-9641. Casadevall TJ, Stokes JB, Greenland LP, Malinconico LL, Casadevall JR, Furukawa BT (1987) S02 and C02 emission rates at Kilauea volcano, 1979-1984. In: Decker RW, Wright 1L, Stauffer PH (eds) Volcanism in Hawii. U S Geol Surv Prof Paper 1350:771-780.
62
Symonds, Rose, Bluth & Gerlach: Volcanic-Gas Studies
Casadevall TJ, Doukas MP, Neal CA, McGimsey RG, Gardner CA (1994) Emission rates of sulfur dioxide and carbon dioxide from Redoubt volcano, Alaska during the 1989-1990 eruptions. J Volcanol Geotherm Res (in press). Cbaigneau M, Tazieff H, Febre R (1960) Composition des gaz volcaniques du lac de lave permanent due Nyiragongo (Congo beIge). C R Acad Sci Paris, Ser D, 250:2482-2485. Chartier TA, Rose WI, Stokes JB (1988) Detailed record of S02 emissions from Pu'u '0'0 between episodes 33 and 34 of the 1983-86 ERZ eruption, Kilauea, Hawaii. Bull Volcanol 50:215-228. Christenson BW, Wood CP (1993) Evolution of vent-hosted hydrothermal system beneath Ruapehu Crater Lake, New Zealand. Bull VolcanoI55:547·565. Cole JW, Nairn IA (1975) Catologue of the active volcanoes of the world including solfatara fields-Part 22. New Zealand. Int'l Assoc Volcanol Chern Earth's Interior. Connor CB, Stoiber RE, Malinconico, LL Jr (1988) Variation in sulfur dioxide emissions related to earth tides, Halemaumau crater, Kilauea volcano, Hawaii. J Geophys Res 93:14867-14871. Daag A, Tubianosa B, Newhall C, Tungol N, Javier D, Dolan M, de los Reyes PJ, Arboleda R, Martinez M, Regalado MTM (1994) Monitoring sulfur dioxide emissions at Mount Pinatubo. In: Punongbayan RS, Newhall CG (eds) The 1991-1992 eruptions of Mount Pinatubo, Philippines. US Geol Surv Prof Paper (in press). Delmelle P, Bernard A (1994) Geochemistry, mineralogy, and chemical modelling of the acid crater lake of Kawah Ijen volcano, Indonesia. Geochim Cosmochim Acta 58:2445-2460. Delorme H (1983) Composition chimique et isotopique de la phase gazeuse de volcans calcoalcalins: Amerique Centrale et Soufriere de la Guadeloupe. Application 11la surveillance volcanique. PhD disseration, University of Paris VII. Devine JD, Sigurdsson H, Davis AN, Self S (1984) Estimates of sulfur and chlorine yields to the atmosphere from volcanic eruptions and potential climatic effects. J Geophys Res 89:6309-6325. Doukas MP, Gerlach TM (1994) Results of volcanic gas monitoring during the 1992 eruption at Mt. Spurr. In: Keith T (ed) Spurr 1992. US 0001 Surv Bull (in press). Ellis AI (1957) Chemical equilibrium in magmatic gases. Am J Sci 255:416-431. Finnegan DL, Kotra JP, Hermann DM, Zoller WH (1989) Use of 7LiOH-impregnated filters for the collection of acidic gases and analysis by instrumental neutron activation analysis. Bull Volcanol 59:83-87. Friend JP, Bandy AR, Moyers JL, Zoller WH, Stoiber RE, Torres AL, Rose WI, McCormick MP, Woods DC (1982) Research on atmospheric volcanic emissions: an overview. Geophys Res Lett 9:11011104. Gantes M, Sabroux JC, Vitter G (1983) Chemical sensors for monitoring volcanic activity. In: Tazieff H, Sabroux JC (eds) Forecasting Volcanic Events. Elsevier, Amsterdam, 409-424. Gerlach TM (1979) Evaluation and restoration of the 1970 volcanic gas analyses from Mount Etna, Sicily. J Volcanol Geotherm Res 6:165-178. Gerlach TM (1980a) Evaluation of volcanic gas analyses from Kilauea Volcano. J Volcanol Geotherm Res 7:295-317. Gerlach TM (1980b) Investigations of volcanic gas analyses and magma outgassing from Erta'Ale lava lake, Afar, Ethiopia. J Volcanol Geotherm Res 7:415-441. Gerlach TM (l980c) Evaluation of volcanic gas analyses from Surtsey Volcano, Iceland, 1964-1967. J Volcanol Geotherm Res 8:191-198. Gerlach TM (198Od) Chemical characteristics of the volcanic gases from Nyiragongo lava lake and the generation ofCH4-rich fluid inclusions in alkaline rocks. J Volcanol Geotherm Res 8:177-189. Gerlach TM (1981) Restoration of new volcanic gas analyses from basalts of the Afar region: further evidence of C02-degassing trends. J Volcanol Geotherm Res 10:83-91. Gerlach TM (1986) Exsolution of H20, C02, and S during eruptive episodes at Kilauea volcano, Hawaii. J Geophys Res 91:12177-12185. Gerlach TM (1989a) Degassing of carbon dioxide from basaltic magma at spreading centers: I. Afar transitional basalts. J Volcanol Geotherm Res 39:211-219. Gerlach TM (1989b) Degassing of carbon dioxide from basaltic magma at spreading centers: II. Mid-oceanic ridge basalts. J Volcanol Geotherm Res 39:221-232. Gerlach TM (1993a) Oxygen buffering of Kilauea volcanic gases and the oxygen fugacity of Kilauea basalt. Geochim Cosmochim Acta 57:795-814. Gerlach TM (1993b) Thermodynamic evaluation and restoration of volcanic gas analyses: An example based on modem collection and analytical methods. Geochem J 27:305-322. Gerlach TM, Casadevall TJ (1986a) Evaluation of gas data from high-temperature fumaroles at Mount St. Helens, 1980-1982. J Volcanol Geotherm Res 28:107-140. Gerlach TM, Casadevall TJ (1986b) Fumarole emissions at Mount St. Helens Volcano, June 1980 to October, 1981: degassing of a magma-hydrothermal system. J Volcanol Geotherm Res 28:141-160. Gerlach TM, Graeber FJ (1985) Volatile budget of Kilauea volcano. Nature 313:273-277.
Symonds, Rose, Bluth & Gerlach: Volcanic-Gas Studies
63
Gerlach 1M, McGee KA (1994) Total sulfur dioxide emissions and pre-eruption vapor saturated magma at Mount St. Helens, 1980-1988. Geophys Res Lett (in review). Gerlach 1M, Nordlie BE (1975) The C-O-H-S gaseous systems, Part II: temperature, atomic composition, and molecular equilibria in volcanic gases. Am J Sci 275:377-394. Gerlach 1M, Taylor BE (1990) Carbon isotope constraints on degassing of carbon dioxide from Kilauea volcano. Geochim Cosmochim Acta 54:2051-2058. Gerlach 1M, Westrich HR, Casadevall TJ, Finnegan DL (1994) Vapor saturation and accumulation in magmas of the 1989-1990 eruption of Redoubt volcano, Alaska. J Volcanol Geotherm Res 62 (in press). Gerlach 1M, Westrich HR, Symonds RB (1995) Pre-eruption vapor saturation in magma of the climactic Mount Pinatubo eruption: Source of the giant statospheric sulfur dioxide cloud. In: Punongbayan RS, Newhall CG (eds) The 1991-1992 eruptions of Mount Pinatubo, Phillipines. U S Geol Surv Prof Paper (in press). Getahun A, Reed MH, Symonds R (1994) Mount St. Augustine volcano fumarole wall rock alteration: mineralogy, zoning, and numerical models of its formation process. J Volcanol Geotherm Res (in review). Giggenbach WF (1974) The chemistry of Crater Lake, Mt. Ruapehu (New Zealand) during and after the 1971 active period. New Zealand J Sci 17:33-45. Giggenbach WF (1975) A simple method for the collection and analysis of volcanic gas samples. Bull Volcanol 39: 15- 27. Giggenbach WF (1980) Geothermal gas equilibria. Geochim Cosmochim Acta 44:2021-2032. Giggenbach WF (1987) Redox processes goveming the chemistry of fumarolic gas discharges from White Island, New Zealand. Appl Geochem 2:143-161. Giggenbach WF (1992) Isotopic shifts in waters from geothermal and volcanic systems along convergent plate boundaries and their origins. Earth Planet Sci Lett 113:495-510. Giggenbach WF, Glover RB (1975) The use of chemical indicators in the surveillance of volcanic activity affecting the crater lake on Mt. Ruapehu, New Zealand. Bull VolcanoI39:70-81. Giggenbach WF, Goguel RL (1989) Collection and analysis of geothermal and volcanic water and gas discharges. DSIR Chemistry Rept CD 2401. Giggenbach WF, Le Guem F (1976) The chemistry of magmatic gases from Erta'Ale, Ethiopia. Geochim Cosmochim Acta 40:25-30. Giggenbach WF, Matsuo S (1991) Evaluation of results from second and third IAVCEI field workshops on volcanic gases, Mt Usu, Japan, and While Island, New Zealand. Appl Geochem 6:125-141. Giggenbach WF, Sheppard DS (1989) Variations in the temperature and chemistry of White Island fumarole discharges 1972-85. New Zealand Geol Surv Bull 103: 119-126. Gill JB (1981) Orogenic andesites and plate tectonics. Springer-Verlag, Berlin. Graedel 1E (1978) Chemical compounds in the atmosphere. Academic Press, New York. Greenland LP (1987a) Hawiian eruptive gases. In: Decker RW, Wright TL, Stauffer PH (eds) Volcanism in Hawii. U S Geol Surv Prof Paper 1350:781-790. Greenland LP (1987b) Composition of gases from the 1984 eruption of Mauna Loa volcano. In: Decker RW, Wright TL, Stauffer PH (eds) Volcanism in Hawii. U S Geol Surv Prof Paper 1350:781-790. Greenland LP, Rose WI, Stokes JB (1985) An estimate of gas emissions and magmatic gas content from Kilauea volcano. Geochim Cosmochim Acta 49: 125-129. Harris DM, Rose WI (1994) Dynamics of carbon dioxide emissions, magma crystallization and magma ascent: hypothesis, theory and application to Mount St. Helens. Bull Volcanol (in review). Harris DM, Sato M, Casadevall TJ, Rose WI Jr, Bornhorst TJ (1981) Emission rates of C02 from plume measurements. In: Lipman PW, Mullineaux DR (eds) The 1980 eruptions of Mount St. Helens, Washington. U S Geol Surv Prof Paper 1250:201-207. Heald EF, Naughton 11, Barnes IL Jr (1963) Use of equilibrium calculations in the interpretation of volcanic gas samples. J Geophys Res 68:545-557. Hobbs PV, Radke LF, Eltgroth MW, Hegg DA (1981) Airbome studies of the emissions from the volcanic eruptions of Mount St. Helens. Science 211:816-818. Holloway JR (1977) Fugacity and activity of molecular species in supercritical fluids. In: Fraser DO (ed) Thermodynamics in Geology. Reidel Publishing Co, Dordrecht, Holland, 161-181. Huntingdon AT (1973) The collection and analysis of volcanic gases from Mount Etna. Philos Trans R Soc London, Ser A, 274:119-128. Ito E, Harris DM, Anderson AT Jr (1983) Alteration of oceanic crust and geologic cycling of chlorine and water. Geochim Cosmochim Acta 47:1613-1624. Jaggar TA (1940) Magmatic gases. Am J Sci 238:313-353. Katili JA, Sudradjat A (1984) Galunggung: The 1982-1983 eruption. Report of the Volcanological Survey of Indonesia, Republic of Indonesia. Kodosky LG, Motyka RJ, Symonds RB (1991) Fumarolic emissions from Mount St. Augustine, Alaska,
64
Symonds, Rose, Bluth & Gerlach: Volcanic-Gas Studies
1979-1984: degassing trends, volatile sources, and their possible role in eruptive style. Bull Volcanol 53:381-394. Krauskopf KB (1957) The heavy metal content of magmatic vapor at 6OOT. Econ GeoI52:786-807. Krauskopf KB (1964) The possible role of volatile metal compounds in ore genesis. Econ GeoI59:22-45. Krueger AI (1983) Sighting of EI Chich6n sulfur dioxide clouds with the Nimbus 7 Total Ozone Mapping Spectrometer. Science 220:1377-1379. Krueger AI (1985) Detection of volcanic eruptions from space by their sulfur dioxide clouds. American Institute of Aeronautics and Astronautics, AAlA 23rd Aerospace Sciences Meeting, AlAA-85-0100, January 14-17, Reno, Nevada, 1-5. Krueger AI, Walter LS, Schnetzler CC, Doiron SD (1990) TOMS measurement of the sulfur dioxide emitted during the 1985 Nevado del Ruiz eruptions. J Volcan Geotherm Res 41:7-15. Kyle PR, McIntosh WC (1989) Automation of a correlation spectrometer for measuring volcanic S02 emissions. New Mexico Bur Mines Mineral Res Bull 131:158. Kyle PR, Meeker K, Finnegan D (1990) Emission rates of sulfur dioxide, trace gases and metals from Mount Erebus, Antarctica. Geophys Res Lett 17:2125-2128. Kyle PR, Sybeldon LM, McIntosh WC, Meeker K, Symonds R (1994) Sulfur dioxide emission rates from Mount Erebus, Antarctica. In: Kyle P (ed) Volcanological Studies of Mount Erebus, Antarctica. Antarctic Res Series, Washington, DC (in press). Lazrus AL, Cadle RD, Gandrud BW, Greenberg JP, Huebert BJ, Rose WI (1979) Trace chemistry of the stratosphere and of volcanic eruption plumes. J Geophys Res 84:7869-7875. Le Guern F, Gerlach TM, Nohl A (1982) Field gas chromatograph analyses of gases from a glowing dome at Merapi volcano, Java, Indonesia, 1977, 1978, 1979. J Volcanol Geotherm Res 14:223-245. Magro G, Pennisi M (1991) Noble gases and nitrogen: mixing and temporal evolution in the fumarolic fluids of Vulcano, Italy. J Volcanol Geotherm Res 47:237-247. Malinconico LL (1979) Fluctuations in S02 emissions during recent eruptions of Etna. Nature 278:43-45. Matsuo S (1961) On the chemical nature of fumaorlic gases of volcano, Showashinzan, Hokkaido, Japan. J Earth Sci Nagoya Univ 9:80-100. Matsuo S, Suzuoki T, Kusakabe M, Wada H, Suzuki M (1974) Isotopic and chemical compositions of volcanic gases from Satsuma-Iwojima, Japan. Geochem J 8: 165-173. Matsuo S, Ossaka J, Hirabayashi J, Ozawa T, Kimishima K (1982) Chemical nature of volcanic gases of Usu volcano in Japan. Bull VolcanoI45:261-264. McGee K (1992) The structure, dynamics and chemical composition of non-eruptive plumes from Mount St. Helens. J Volcanol Geotherm Res 51:269-282. McGee K, Sutton AI (1994) Eruptive activity at Mount St. Helens, Washington, USA, 1984-1988: a gas geochemistry perspective. Bull Volcanol (in press). McGee TJ, Burris J Jr (1987) S02 absorption cross sections in the near U.V. J Quant Radiative Transfer 37:165-182. Menyailov IA (1975) Prediction of eruptions using changes in compositions using changes in compositions of volcanic gases. Bull VolcanoI39:112·125. Menyailov lA, Nikitina LP (1980) Chemistry and metal contents of magmatic gases: the new Tolbachik volcanoes case (Kamchatka). Bull VolcanoI43:197-205. Menyailov lA, Nikitina LP, Shapar VN, Pilipenko VP (1986) Temperature increase and chemical change of fumarolic gases at Momotombo volcano, Nicaraqua, in 1982-1985: are these indicators of a possible eruption? J Geophys Res 91:12199-12214. Millan MM, Hoff RM (1978) Remote sensing of air pollutant by correlation spectroscopy-instrumental response characteristics. Atmos Environ 12:853-864. Mizutani Y (1962a) Chemical analysis of volcanic gases. J Earth Sci Nagoya Univ 10:125-134. Mizutani Y (1962b) Origin of lower temperature fumarolic gases at Showashinzan. J Earth Sci Nagoya Univ 10:135-148. Mizutani Y (1978) Isotopic compositions of volcanic steam from Showashinzan volcano, Hokkaido, Japan. Geochem J 12:57-63. Mizutani Y, Sugiura T (1982) Variations in chemical and isotopic compositions of fumarolic gases from Showashinzan volcano, Hokkaido, Japan. Geochem J 16:63-71. Moller D (1984) Estimation of the global man-made sulphur emission. Atmos Environ 18:19-27. Mori T, Notsu K, Tohjima Y, Wakita H (1993) Remote detection of HCI and S02 in volcanic gas from Unzen volcano, Japan. Geophys Res Lett 20:1355-1358. Nemoto T, Hayakawa M, Takahashi K, Oana S (1957) Report on the geological, geophysical, and geochemical studies ofUsu volcano (Showashinzan). Geol Surv Japan Rep 170:1-149. Newhall CG, Self S (1982) The volcanic explosivity index (VEl): An estimate of explosive magnitude for historical volcanism. J Geophys Res 87:1231-1238. Nordlie BE (1971) The composition of the magmatic gas of Kilauea and its behavior in the near surface environment. Am J Sci 271:417-463.
Symonds, Rose, Bluth & Gerlach: Volcanic-Gas Studies
65
Palais JM, Sigurdsson H (1989) Petrologic evidence of volatile emissions from major historic and prehistoric volcanic eruptions. In: Berger A, Dickinson RE, Kidson JW (eds) Understanding Climate Change. Am Geophys Union Monograph 52:31-53. Peacock SM (1990) Fluid processes in subduction zones. Science 248:329-337. Phelan JM, Finnegan DL, Ballantine OS, Zoller WH, Hart MA, Moyers JL (1982) Airborne aerosol measurements in the quiescent plume of Mount St. Helens: September, 1980. Geophys Res Lett 9:1093-1093. Quisefit JP, Toutain JP, Bergametti G, Javoy M, Cheynet B, Person A (1989) Evolution versus cooling of gaseous volcanic emissions from Momotombo Volcano, Nicaragua: Thermochemical model and observations. Geochim Cosmochim Acta 53:2591-2608. Rose WI (1993) Comment on "another look at the calculation of fallout tephra volumes" by Judy Fierstein and Manuel Nathenson. Bull Volcanol 55:372-374. Rose WI, Chuan RL, Cadle RD, Woods DC (1980) Small particles in volcanic eruption clouds. Am J Sci 280:671-696. -Rose WI Jr, Stoiber RE, Malinconico LL (1982) Eruptive gas compositions and fluxes of explosive volcanoes: Budget of Sand Cl emitted from Fuego volcano, Guatemala. In: Thorpe RS (ed) Orogenic Andesites and Related Rocks. Wiley and Sons, New York, NY, 669-676. Rose WI, Symonds RB, Chartier T, Stokes JB, Brantley S (1985) Simultaneous experiments with two correlation spectrometers at Kilauea and Mount St. Helens. EOS Trans Am Geophys Union 66: 1142. Rose WI, Chuan RL, Giggenbach WF, Kyle PR, Symonds RB (1986) Rates of sulfur dioxide and particle emissions from White Island volcano, New Zealand, and an estimate of the total flux of major gaseous species. Bull VolcanoI48:181-188. Rose WI, Heiken G, Wohletz K, Eppler 0, Barr S, Miller T, Chuan RL, Symonds, RB (1988) Direct rate measurements of eruption plumes at Augustine volcano: a problem of scaling and uncontrolled variables. J Geophys Res 93:4485-4899. Rowe GL (1991) The acid crater lake system of Poas volcano, Costa Rica: geochemistry, hydrology, and physical characteristics. PhD Dissertation, Pennsylvania State University, University Park, PA Rowe GL, Varekamp JC (1993) A call for contributions to the IWGCL crater and caldera lake database. International Working Group on Crater Lakes (IWGCL) Newsletter 6:54-61. Rowe GL Jr, Brantley SL, Fernandez M, Fernandez JF, Borgia A, Barquero J (1992a) Fluid-volcano interaction in an active stratovolcano: the crater lake system of Poas volcano, Costa Rica. J Volcanol Geotherm Res 49:23-51. Rowe GL Jr, Ohsawa S, Takano B, Brantley SL, Fernandez JF, Barquero J (1992b) Using crater lake chemistry to predict volcanic activity at Poas volcano, Costa Rica. Bull Volcanol 54:494-503. Schidlowski M (1986) The atmosphere. In: Hutzinger 0 (ed) The Natural Environment and the Biogeochemical Cycles. Springer Verlag, New York. Schneider OJ, Rose WI, Kelley L (1994) Tracking of the 1992 Crater Peak/Spurr volcano eruption clouds using AVHRR. In: Keith T (ed) Spurr 1992. US Geol Surv Bull (in press). Schoeberl MR, Doiron SO, Lait LR, Newman PA, Krueger AJ (1993) A simulation of the Cerro Hudson S02 cloud. J Geophys Res 98:2949-2955. Shepherd ES (1921) Kilauea gases, 1919. Hawaiian Volcano Obs Bull 9:83-88. Shinohara H, Giggenbach WF, Kazahaya K, Hedenquist JW (1993) Geochemistry of volcanic gases and hot springs of Satsuma-Iwojima, Japan: following Matsuo. Geochem J 27:271-285. Sigvaldason GE, Elisson G (1968) Collection and analysis of volcanic gases at Surtsey, Iceland. Geochim Cosmochim Acta 32:797-805. Simkin T (1993) Terrestrial volcanism in space and time. Ann Rev Earth Planet Sci 21:427-452. Smithsonian Institution/SEAN, 1989, Global Volcanism 1975-1985. Prentice-Hall, Englewood Cliffs, New Jersey, and American Geophysical Union, Washington, DC. Sorey ML, Kennedy BM, Evans WC, Farrar CD, Suemnicht GA (1993) Helium isotope and gas discharge variations associated with crustal unrest in Long Valley Caldera, California, 1989-1992. J Geophys Res 98:15871-15889. Spycher NF, Reed MH (1988) Fugacity coefficients of H2, C02, CH4, H20 and of H20-C02-CH4 mixtures: A virial equation treatment for moderate pressures and temperatures applicable to calculations of hydrothermal boiling. Geochim Cosmochim Acta 52:739-749. Stevenson OS (1993) Physical models of fumarolic flow. J Volcanol Geotherm Res 57:139-156. Stoiber RE, Jepsen A (1973) Sulfur dioxide contributions to the atmosphere by volcanoes. Science 182:577-578. Stoiber RE, Rose WI Jr (1974) Fumarolic incrustations at active Central American volcanoes. Geochim Cosmochim Acta 38:495-516. Stoiber RE, Malinconico LL Jr, Williams SN (1983) Use of the Correlation Spectrometer at Volcanoes. In: Tazieff H, Sabroux JC (eds) Forecasting Volcanic Events. Elsevier Science Publishers, Amsterdam, 425-444.
66
Symonds, Rose, Bluth & Gerlach: Volcanic-Gas Studies
Stoiber RE, Williams SN, Huebert BJ (1986) Sulfur and halogen gases at Masaya Caldera complex, Nicaragua: total flux and variations with time. J Geophys Res 91:12215-12231. Stoiber RE, Williams SN, Huebert BJ (1987) Annual contribution of sulfur dioxide to the atmosphere by volcanoes. J Volcanol Geotherm Res 33:1-8. Stolper E, Newman S (1994) The role of water in the petrogenesis of Mariana trough magmas. Earth Planet Sci Lett 121:293-325. Sutton AJ (1990) Chemical sensors for volcanic gases with a compilation of commercial availability. U S Geol Surv Open-File Rept 90-44. Sutton AJ, McGee KA, Casadevall TJ, Stokes JB (1992) Fundamental volcanic-gas-study techniques: an integrated approach to monitoring. In: Ewert JW, Swanson DA (eds) Monitoring volcanoes: techniques and strategies used by the staff of the Cascades Volcano Observatory, 1980-90. US Geol Surv Bull 1966:181-188. Symonds R (1993) Scanning electron microscope observations of sublimates from Merapi volcano, Indonesia. Geochem J 26:337-350. Symonds RB, Reed MH (1993) Calculation of multicomponent chemical equilibria in gas-solid-liquid systems: Calculation methods, thermochemical data and applications to studies of high-temperature volcanic gases with examples from Mount St. Helens. Am J Sci 293:758-864. Symonds RB, Rose WI, Reed MH, Lichte FE, Finnegan DL (1987) Volatilization, transport and sublimation of metallic and non-metallic elements in high temperature gases at Merapi Volcano, Indonesia. Geochim Cosmochim Acta 51:2083-2101. Symonds RB, Rose WI, Gerlach TM, Briggs PH, Harmon RS (1990) Evaluation of gases, condensates, and S02 emissions from Augustine Volcano, Alaska: the degassing of a CI-rich volcanic system. Bull VolcanoI52:355-374. Symonds RB, Reed MH, Rose WI (1992) Origin, speciation, and fluxes of trace-element gases at Augustine volcano, Alaska: insights into magma degassing and fumarolic processes. Geochim Cosmochim Acta 56:633-657. Takano B (1987) Correlation of volcanic activity with sulfur oxyanion speciation in a crater lake. Science 235:1633-1635. Takano B, Watanuki K (1990) Monitoring of volcanic eruptions at Yugama crater lake by aqueous sulfur oxyanions. J Volcanol Geotherm Res 40:71-87. Taran Y A, Rozhkov AM, Serafimova EK, Esikov AD (1991) Chemical and isotopic compositions of magmatic gases from the 1988 eruption of Klyuchevskoy volcano, Kamchatka. J Volcanol Geotherm Res 46:255-263. Taylor BE (1986) Magmatic volatiles: isotopic variations of C, H, and S. In: Valley JW, Taylor HP, ONeil JR (eds) Stable isotopes in high temperature geological processes. Rev Mineral 16: 185-225. Tazieff H, Le Guern F, Carbonnelle I, Zettwoog P (1972) Etude chimique des fluctuations des gaz eruptifs de volcan Erta'Ale (Afar, Ethiopia). C R Acad Sci Paris, Ser D, 274:1003-1006. Tedesco D, Sabroux JC (1987) The determination of deep temperatures by means of the CO-C02-H2-H20 geothermometer: an example using fumaroles in the Campi Flegrei, Italy. Bull VolcanoI49:381-387. Tedesco D, Toutain IP, Allard P, Losno R (1991) Chemical variations in fumarolic gases at Vulcano Island (Southern Italy): seasonal and volcanic effects. J Volcanol Geotherm Res 45:325-334. Wallace PI, Gerlach TM (1994) Magmatic vapor source for S02 released during volcanic eruptions: evidence from Mount Pinatubo. Science 265:497-499. Wen S, Rose WI (1994) Retrieval of sizes and total masses of particles in volcanic clouds using AVHRR bands 4 and 5. J Geophys Res 99:5421-5431. Westrich HR, Gerlach TM (1992) Magmatic gas source for the stratospheric S02 cloud from the June 15, 1991, eruption of Mount Pinatubo. Geology 20:867-870. Williams SN (1993) Galeras volcano, Colombia: perspectives from a researcher and survivor. Geotimes 38-6:12-14. Williams SN, Stoiber RE, Garcia NP, Londono AC, Gemmell IB, Lowe DR, Connor CB (1986) Eruption of the Nevado del Ruiz volcano, Colombia, on 13 November 1985: gas flux and fluid geochemistry. Science 233:964-967. Williams SN, Sturchio NC, Calvache ML V, Mendez RF, Londono AC, Garcia NP (1990) Sulfur dioxide from Nevado del Ruiz volcano, Colombia: total flux and isotopic constraints on its origin. J Volcanol Geotherm Res 42:53-68. Woods A (1993) Moist convection and the injection of volcanic ash into the atmosphere. I Geophys Res 98:17627-17636.
Chapter 2 ANAL YTICAL
METHODS Phillip
FOR VOLA TILES
IN GLASSES
D. Ihinger
Department of Geology and Geophysics Yale University New Haven, Connecticut 06511 USA
Richard
L. Hervig
Center for Solid State Science Arizona State University Tempe, Arizona 85287 USA
Paul F. McMillan Department of Chemistry and Biochemistry Arizona State University Tempe, Arizona 85287 USA
INTRODUCTION Our understanding of the behavior of volatiles in silicate melts has been closely linked to the development of the experimental and analytical methods that have been applied to investigate them. The techniques vary widely in character, ranging from bulk extraction methods, to site- and species-specific spectroscopic studies. Some familiarity with these techniques and their range of application is essential to the investigator who wishes to pursue or evaluate studies of volatile behavior in magmatic systems. The goal of this chapter is to review the analytical techniques that are most routinely applied to volatilebearing systems of geological interest. These techniques include bulk vacuum extraction, Secondary Ion Mass Spectroscopy (SIMS), and vibrational spectroscopy (principally Fourier transform infrared (FfIR) absorption for dissolved volatile analysis, and Raman spectroscopy for fluid inclusions). We present here a concise description of each technique, along with a discussion of their advantages and disadvantages, especially when applied to studies of volatiles dissolved in silicate melts. Overview and historical development of analytical techniques A variety of analytical methods has been applied to the study of the volatile contents of geological materials. The principal methods can be broadly divided into four classes: (I) bulk extraction techniques, (2) energetic particle bombardment techniques, (3) vibrational spectroscopic techniques, and (4) phase equilibrium studies. Methods (1), (2), and (4) have proven highly successful for determining the total volatile contents of silicate melts and glasses. However, these methods reveal little about the abundances of individual volatile-bearing species, and as such contribute little to understanding the structural role of volatiles in molten silicates. Analytical methods that fall within classes (1) and (2), however, are readily applicable to determining volatile concentrations in natural samples and have been especially successful in illuminating the degassing behavior of volatiles in igneous environments (see Chapters 7, 8).
68
Ihinger, Hervig & McMillan: Analytical Methods for Volatiles in Glasses
The spectroscopic techniques (class (3» are ideally suited for determining the concentrations of particular volatile species, but in the absence of good theoretical models for absolute peak intensities, these methods must rely on prior calibration of standard samples via bulk techniques. Analytical methods within classes (I) and (4) are sufficiently accurate to generate standards for methods within classes (2) and (3). Methods that comprise class (4) include a variety of experiments involving melt-vapor systems, such as determining freezing point depression by observing the onset of melting, or determining solubility through the appearance of dimples in capsules (e.g., Burnham and Jahns, 1962). These indirect methods for volatile determination involve series of time-intensive experiments, and so are not ideally suited to routine determination of volatile contents of natural or synthetic samples; therefore, they will not be discussed in this chapter. We present here a brief overview as well as a summary of the historical development of methods (1)-(3) as applied to the study of volatiles in silicate melts. Bulk extraction techniques. Bulk extraction techniques involve subjecting the sample of interest to high temperatures in order to physically remove all volatile elements, and subsequently analyzing the exsolved gas and/or the refractory residue. The Penfield method (Penfield, 1894) provided quick and easy measurements of the volatile content of geological samples. The method involves. measuring the loss on ignition of hydrous samples heated within glass tubes. Tilden (1896) performed the first systematic study of the release of volatiles from natural rocks. Following the earlier definitive conclusions about the structural state of volatiles in minerals (Davy, 1824; Brewster, 1826; Sorby and Butler, 1869), Tilden suggested that volatiles evolved on heating magmatic rocks were "wholly inclosed in cavities." Chamberlin (1908) analyzed 112 natural rocks (including fresh volcanic rocks) and concluded, contrary to Tilden, that volatiles released upon heating rock powders in vacuo represented magmatic components not associated with gas cavities. Instead, he proposed that the gas evolved at high temperatures was either chemically bonded to the glasses and solids or physically "occluded" within the rock in the molecular state. Goranson (1931,1936) was the first to quantitatively apply bulk extraction techniques to the study of volatiles in glasses quenched from melts of geological composition. He experimentally determined the solubility of water in both natural (rhyolite) and synthetic (albite, orthoclase, orthoclase-silica) melts using the weight-loss on ignition technique, after equilibrating vapor saturated melts at pressures up to 4 kbars and temperatures up to 1200°C. After removing excess vapor by piercing and heating charges to II0T, he combusted the entire hydrous assemblage at high temperature and atmospheric pressure. The dissolved water content was assumed to be equal to the difference in weight before and after the combustion process, with a minor correction made for some diffusive loss of indigenous water during the 110°C heating step. Shepherd (1938) applied Goranson's quantitative methods to accurately determine the volatile content of natural obsidians collected from around the world. The "weight-loss" technique has been subsequently modified in many ways. Kennedy (1950), on measuring the solubility of water in pure silica, measured only the amount of water released during the 110°C heating step. By knowing the amount of water loaded into the charge before the experiment, the concentration of silica in the vapor phase before quenching, the amount of water the colloidal silica scavenged from the vapor upon precipitation, and the total anhydrous weight of the silica starting material, he calculated the total water content of the glass by evaporative weight difference. Hamilton et al. (1964) applied the same technique to melts of basaltic and andesitic composition. These workers
Ihinger, Hervig & McMillan: Analytical Methods for Volatiles in Glasses
69
ignored the solute correction, but applied a new correction to account for the loss of H2 through the platinum capsule walls generated by the oxidation of ferrous to ferric iron in the melt during the experiment. A simplified version of this weight-loss technique (ignoring both corrections) was adopted by Oxtoby and Hamilton (l978a,b,c,d; also Hamilton and Oxtoby, 1986) for solubility determinations on natural and synthetic aluminosilicate glasses. Yoder, Stewart, and Smith (1956) applied another variation of the "weight-loss" technique, in which water contents of feldspathic melts were determined by completely crystallizing hydrated glasses and measuring the difference in the weight between their anhydrous crystalline products and their hydrous glassy experimental run products. Khitarov et a!. (1959) applied a further modification to the weight-loss technique; rather than assuming that all weight lost on ignition was due to water released from the glass, these workers measured the quantity of water actually released on ignition by collecting the released water in absorbent anhydrone, for which the water content was measured by weight difference. Their results on rhyolitic compositions at 900T differed from Goranson's (1931) by up to 2.0 weight percent absolute, for samples prepared under identical conditions. The standard method by which released water is collected and chemically analyzed was first developed by Fischer (1935), and is commonly termed Karl Fischer titration. In this method, evolved water reacts quantitatively with coulometrically generated iodine. The relative standard deviation for this technique is less than 5% for low water content samples (-0.1 wt % total water; Westrich, 1987), and less than 2% for higher water content glasses (-1.5 wt % total water; Turek et a!., 1976). The relatively rapid (samples are completely analyzed within thirty minutes), simple, and inexpensive nature of this technique has led to its routine use for determining the water content of silicate glasses (e.g., Holz et a!., 1994; Behrens, 1994). Several analytical techniques have been used in conjunction with bulk extraction techniques to characterize vapors that evolve on fusion of silicate glasses in vacuum. For example, volume manometry (e.g., Craig, 1953) and pressure manometry (Harris, 1981; Brett et al., 1987) have been routinely applied to determine the absolute abundance of volatiles within glassy samples. Gas chromatographs (e.g., Moore et a!., 1970; Brey and Green, 1976; Pichavant, 1981), quadrupole mass spectrometers (e.g., Killingley and Muenow, 1975; Delaney et aI., 1978; Byers et a!., 1986), and Knudsen Cell mass spectrometers have been attached to vacuum extraction lines to distinguish the relative concentrations of gaseous species exsolved from silicate samples (see below, Analytical Methods Involving Bulk Extraction, for more details of these techniques). Light element analyzers that employ these techniques are now commercially available for determining the volatile contents of geological materials. For example, the Carlo Erba Strumentazione (trademark of Montedison, Milan, Italy) is a C, H, S, and N analyzer that uses chromatographic columns to separate out volatile species. In this device, the sample is heated to -1000°C in a tin crucible and is placed in contact with a C[203 catalyst. The exothermic reaction of the catalyst with the tin results in a combustion reaction at about 1700°C, ensuring complete evolution and oxidation of volatiles within the sample, and these oxidized species are carried to the chromatographic columns using helium as a carrier gas. Accuracies for N2 gas range from ±1O% for samples of 0.01 % total N to ±O.2% for samples with 10 % total N content. These analyses take about 5 minutes per sample and require sample sizes ranging from 0.5 to 100 mg, depending on the concentrations of the volatiles of interest.
70
Ihinger, Hervig & McMillan: Analytical Methods for Volatiles in Glasses
The LECO Corporation (St. Joseph, MI) also manufactures light element analyzers capable of determining the volatile contents of geological materials. Separate carbon and sulfur (model # CS-444), nitrogen and oxygen (model # TC-436), and hydrogen (model # RH-404) analyzers are available at prices ranging from $50,000 to $65,000. These instruments have quoted accuracies of 0.1 ppm C and S (or 0.5% of total C and S), 0.5 ppm 0, 1.0 ppm N (or 1% of total 02 and N2), and 0.05 ppm H (or 1% of total H). Both resistance and induction furnaces are employed in these analytical devices. Their detection methods include IR absorption for C, S, and 02 and thermal conductivity for N2 and H2. The precision of an older LECO analyzer (model # SC-132) was reported by Krom and Berner (1983) to be 0.7 % absolute on replicate extractions of calcite crystals, and the analyses were accurate to within 4% of the total carbon in the sample. They noted that sample sizes as low as 34 mg were sufficient to yield reasonable results in sediment samples containing 2.55 wt % total carbon. State-of-the-art vacuum extraction techniques have been developed largely because of the intense interest in the isotopic composition of volatiles in geological materials. Determining the isotopic composition of dissolved volatiles requires the preparation of pure gas samples for which the vacuum extraction line is ideally suited. The isotopic composition of water in erupted magmas was first investigated by Friedman and Smith (1958). They examined water released from both the water-rich perlitic over-growths and the water-poor rhyolitic cores of obsidians, to demonstrate the isotopic distinction between inherent magmatic water and water subsequently added during hydration at low temperatures. High vacuum extraction lines have subsequently been used in conjunction with mass spectrometers to determine the volatile content and isotopic composition of unaltered plutonic rocks (e.g., Godfrey, 1962; O'Neil et al., 1977; O'Neil and Chappel, 1977; Masi et a!., 1981; Craig and Lupton, 1976; Nabelek et aI., 1983; Brigham and O'Neil, 1985), fresh continental volcanic rocks (e.g., Taylor et a!., 1983; Newman et al., 1988; Anderson and Fink, 1989), and fresh oceanic rocks (e.g., Moore, 1970; Sakai et al., 1971; Pineau and Javoy, 1983; Des Marais and Moore, 1984; Kyser and O'Neil, 1984; Mattey, et aI., 1984; Poreda, 1985; Pored a et al., 1986; Blank, et aI., 1986; Dobson and O'Neil, 1987; Garcia et aI., 1989). Vacuum extraction techniques have proven useful for many applications, and will be described in greater detail below.
Energetic particle techniques. A range of techniques involving energetic particles has been successfully applied to the study of volatile contents in silicate glasses. These techniques include electron microprobe, ion microprobe, and nuclear reaction techniques. They are advantageous in that they require only a small amount of sample, and are extremely precise. Their chief disadvantage is that they require accurate calibration standards, and that they are generally incapable of distinguishing individual volatile-bearing species concentrations. The ion microprobe (or secondary ion mass spectrometer, SIMS) is most commonly applied to analytical problems in the semiconductor industry. However, the high sensitivity afforded by mass spectrometric analysis and the good lateral resolution (usually ranging from a few to -30 micron diameter incident ion beam) make it a useful tool for geochemists. The interested reader is referred to Williams (1985; 1992; references therein) for a review of the physical principles of SIMS. With respect to volatile-containing quenched melts, SIMS has been successfully applied to the analysis of H (Delaney and Karsten, 1981; Steele, 1986; Hervig et a!., 1989), C (Pan et a!., 1991; Thibault and Holloway, 1994), F (Hervig et a!., 1989; Dunbar and Hervig, 1992a,b), and Cl (Hervig et aI., 1989).
Ihinger, Hervig & McMillan: Analytical Methods for Volatiles in Glasses
71
The development of layered synthetic microstructure (LSM) crystals, used as dispersing elements in X-ray spectrometers, has allowed the quantitative application of the electron microprobe to the study of light volatile elements within silicate glasses (e.g., Wood et aI., 1985; Nicolosi et aI., 1986; Huang et al., 1989). These crystals can be manufactured with specific d values optimized for the light elements of interest. For example, WSi crystals (2d - 60 angstroms) are ideally suited for the study of F, 0, N, and C (Potts and Tindle, 1989; Nash, 1992; McGuire et aI., 1992), and MoB4C (2d - 150 angstroms) crystals are used for the study of B and Be (McGee, et al. 1991). These crystals have replaced lead stearate (organic multilayered) crystals that have traditionally been applied to the study of light elements in silicate glasses. Some of the analytical details of electron microprobe applications to light elements can be found in the following references: C - Mysen et a!. (1976), Mathez and Delaney (1981); S - Carroll and Rutherford (1985); Cl- Harris and Anderson (1984); Ar - White et al. (1989), Carroll and Stolper (1991). High energy beam nuclear reaction techniques have also been applied with some success to the study of volatiles in silicate melts (e.g., see Courel et aI., 1991). These include the measurement of hydrogen (Lee et al., 1974; Mosbah et aI., 1991), fluorine (Mosbah, 1991), nitrogen (Mosbah et al., 1993), chlorine (Metrich et aI., 1993) and bulk carbon (Mathez et al., 1984; Fine et al., 1985). Vibrational spectroscopic techniques. Researchers in the glass sciences have long applied spectroscopic methods to the quantitative determination of volatiles in silicate glasses (e.g., Harrison, 1947; Scholze, 1960, 1966: Dodd and Fraser, 1966; Ernsberger, 1977; Pearson et al., 1979; Bartholomew et a!., 1980; Wu, 1980; Takata et a!., 1981; Shelby, 1987). Keller and Pickett (1954) were the first to apply vibrational spectroscopic techniques to materials of direct geological interest. They observed significant absorptions at 3500 crrr ! and 1630 cm! in the infrared spectrum of natural volcanic glasses and assigned these to the presence of hydroxyl and molecular water species. Evidence for the presence of molecular water species in a silicate melt was provided by Orlova (19.64), who analyzed infrared spectra of albitic melts quenched to hydrous glasses. Ostrovskiy et al. (1964) used this technique to investigate the influence of cation size on the solubility of water in alkali melts. They distinguished the two hydrous species (bound hydroxyl and molecular H20), and observed Henrian behavior for the molecular species based on their experimental results at 2 and 4 kbars. The near-Ik absorption technique has been refined and developed by Stolper and coworkers in a series of studies of water speciation and solubility within melts and glasses of geological interest, and has now become a routine method for rapid and reliable analysis of hydroxyl species, molecular H20, and total dissolved water (Stolper, 1982a; Newman et al., 1988; Silver and Stolper, 1989; Stolper, 1989; Silver et a!., 1990; Ihinger, 1991; Pan et al., 1991; Pawley et aI., 1992; Blank et al., 1993; Dixon et al., 1994). The technique has also proven to be especially effective for the determination of the water contents within melt inclusions as small as 25 µm in diameter (e.g., Anderson et al., 1989; Skirius et al., 1990; Bacon et aI., 1992; Lowenstern, 1993; Stolper and Newman, 1994), and is easily applied to diffusion studies (Stanton et al., 1985; Stanton, 1989; Zhang et al., 1991; Zhang and Stolper, 1991). Such spectroscopic studies have contributed greatly to our understanding of the solubility mechanisms of water in silicate melts (see Chapter 4). Infrared spectroscopic studies have been applied with equal success to the investigation of dissolved C02 in natural and synthetic silicate glasses. Early studies in the glass sciences used infrared spectroscopy to investigate the incorporation of C02 in silicate
72
Ihinger, Hervig & McMillan: Analytical Methods for Volatiles in Glasses
glasses (Scholze, 1966). Powder transmission methods, in which the ground sample is mixed with KBr (or some other mounting medium), then pressed into a disc for infrared transmission spectroscopy, has been used qualitatively to explore the solubility mechanism of C02 in mafic and synthetic aluminosilicate melts (Mysen, 1976; Mysen et aI., 1976; Brey, 1976; Tailor, 1990). These workers found evidence for both molecular CD2 and carbonate C03 - species. Fine and Stolper (1985; 1986) have calibrated characteristic absorption bands assigned to molecular C02 (at 2350 cmJ) and carbonate species (two bands between 1400 and 1600 cm-l) for aluminosilicate glass compositions, and have quantitatively investigated the solubility and speciation of these carbon-bearing species in quenched silicate melts via infrared absorption on doubly polished plates of known thickness. This technique has subsequently been applied to the determination of carbon contents in natural samples from a variety of localities (e.g., Dixon et al., 1988; Newman et al., 1988; Stolper and Newman, 1994), and to a range of experimental run products (Fogel and Rutherford, 1990; Pan et aI., 1991; Pawley et al., 1992; Blank et aI., 1993). Later in this chapter, we describe in detail the theory and application of vibrational spectroscopy to the study of volatiles in silicate glasses. Raman scattering spectroscopy has been used extensively in the structural study of volatile-containing melts and glasses (e.g., Sharma, 1979; Sharma et aI., 1979; Mysen et al., 1980; Mysen and Virgo, 1980a,b; 1986a,b; Rai et al.. 1983; McMillan et al., 1983; 1993: see chapter 5), but has not yet been reliably calibrated for the quantitative analyses of these species. The Raman technique could be applied to the analysis of dissolved volatile species, based on its demonstrated success in the analysis of molecular species in fluid inclusions (Dhamelincourt et al., 1979; Roedder, 1984; Pasteris et al., 1988; Dubessy et aI., 1989). It would be quite easy to extend these calibrations to species dissolved in volatile-containing glasses, to provide an alternate analytical technique for situations where infrared absorption becomes difficult. One obvious example is in the analysis of compositions with very high dissolved C02 contents, which require extremely thin doubly polished samples to be prepared for IR analysis, because of the intensity of the infrared absorption (R. Brooker. unpublished data). Raman spectroscopy would permit easy analysis of such samples, from the strong characteristic peak for symmetric stretching of the C032- group (Sharma, 1979; Sharma et al., 1979; Mysen et aI., 1980; Mysen and Virgo, 1980a,b; 1986a,b: see below). In addition, Raman spectroscopy gives site-specific information on dissolved volatiles which is not easily available from IR studies: for example, the Raman band observed near 900 cm! in hydrous aluminosilicate glasses may well be a vibration of OH species associated with AI sites (see Sykes and Kubicki, 1993; McMillan et a!., 1993: also Chapter 4 for discussion of this assignment). Calibration of the intensity of this band would permit quantification of the concentration of these species as a function of total water content. Nuclear magnetic resonance (NMR) techniques have also been applied to the quantitative study of H- and C-bearing volatiles in silicate glasses (e.g., Muller-Warmuth et a!., 1965; Scholze, 1966; Belton, 1979; Bartholomew and Schreurs. 1980; Bray and Holupka, 1984; Eckert et aI., 1987; 1988; Farnan et aI., 1987; Kohn et a!., 1989b, 1991). The technique and its application to geological samples has been reviewed by Kirkpatrick (1988) and Stebbins (1988). In the NMR experiment. the sample is placed in an external magnetic field, which causes nuclear spins to become preferentially aligned. The isotopes lH, 2H and I3C (also 19F, lOB, llB. 170), either at natural abundance, or artificially enriched, are convenient NMR nuclei. If the sample is irradiated with a radio frequency pulse. the sample absorbs energy as the spins are tipped. The precise frequency of the radio frequency energy absorbed is dependent upon the nucleus of interest and the magnitude of the applied magnetic field. For example, at a field of 8.45 T, l3C resonates
Ihinger, Hervig & McMillan: Analytical Methods for Volatiles in Glasses
73
near 90.5 MHz, and 1H at 360 MHz, so that different nuclei are well separated in the experiment. The precise resonance frequency for each nucleus studied is highly dependent on the local environment for that atom or ion, so NMR spectroscopy is a sensitive structural probe for dissolved volatile species and framework ions (e.g., Farnan et al., 1987; Eckert et al., 1988; Kirkpatrick, 1988; Stebbins, 1988; Kohn et al., 1989a,b; 1991; 1992: see Chapter 5). NMR spectroscopy for samples in the condensed phase is complicated because the various orientation-specific interactions are not averaged, with the result that NMR lines are usually broad. This is usually overcome by the technique of "magic angle sample spinning" (MAS), in which the sample is rapidly spun about an axis at a "magic angle" (usually 54.71·) to the applied magnetic field (Kirkpatrick, 1988). The amount of radio frequency energy absorbed is directly proportional to the number of nuclei excited in the experiment, so that integration of the observed signal directly gives the concentration of the species contributing to that resonance, with no further calibration. For this reason, NMR spectroscopy should provide a powerful, site-specific quantitative tool for the analysis of dissolved volatiles in silicate glasses. However, various factors related to the nature of the NMR experiment, including both instrumental parameters and the specific properties of the nucleus under investigation, do not yet permit such a simple, direct, precise quantification of the NMR signal for most samples of geological interest (although these questions are being actively addressed: see e.g., Eckert et aI., 1988; Kohn et aI., 1991). NMR techniques are particularly advantageous in that they require minimal sample preparation and are in principle non-destructive, although the sample must generally be ground for MAS studies. The application of this family of techniques to quantitative, site-specific studies of volatiles in silicate melts holds much promise for the future. ANAL YTICAL
METHODS
INVOLVING
BULK EXTRACTION
General description of the technique The most direct method for determining the concentration of volatile components in silicate glasses involves fusion of the sample at high temperature, under vacuum, in a glass or metal-walled extraction line. The gas evolved on fusion is cryogenically purified so that the volatile species of interest can be isolated and measured. Several comprehensive and authoritative works describing the physical basis of technique and measurement in vacuum have been published (e.g., Martin and Hill, 1948; Dushman, 1962; Turnbull et a!., 1962; Diels and Jaeckel, 1966; Yarwood, 1967; Redhead et al., 1968; Berman, 1985). The vacuum line consists of a devolatilizing chamber, separate oxidizing and reducing furnaces, a cryogenic trap, and any analytical device (including volume manometer, pressure manometer, gas chromatograph, isotope ratio mass spectrometer, quadrupole mass spectrometer, and/or any of a variety of chemical reactors) used to measure the amount of different chemical species in the gaseous sample (Fig. 1). The precision of this technique is variable, and depends mainly on the total amount of extracted gas and the care taken in reducing the background associated with each measurement. The devolatilizing chamber consists of a metal crucible sealed within a quartz glass reaction vessel, placed within a high-temperature fusion furnace. Because H2 gas can diffuse out of the line through heated walls, radio-frequency induction furnaces are often used to generate the temperatures necessary for fusion. The crucible (usually made of platinum or molybdenum) is placed in the axis of a water-cooled copper coil (the inductor), and is heated as an alternating electric current within the copper coil induces an oscillating electric field within the metal crucible (which acts as the susceptor). The high temperatures attained within such induction furnaces can be measured quite accurately above -700·C
74
Ihinger, Hervig & McMillan: Analytical Methods for Volatiles in Glasses 18
Figure 1. Schematic diagram of the vacuum extraction line; 1) evacuated quartz reaction vessel, 2) glass to metal seal, 3) gate valve, 4) evacuated loading chamber, 5) rotative magnetic insertion rod, 6) air-actuated vacuum valve, 7) oxidation furnace, 8) reduction furnace, 9) VCR coupling, 10) vacuum gauge, 11) cryogenic trap, 12) glass stopcock, 13) vacuum arc remelted stainless steel manifold, 14) Toepler pump, 15) calibrated volume, 16) to mercury manometer, 17) exit port to analytical apparatus, 18) to turbo molecular vacuum pump.
with the use of a suitably calibrated optical pyrometer. However the lack of sufficient thermal radiation at temperatures lower than this, and the uncertainties due to the interaction of metallic thermocouple wires with the oscillating electromagnetic field, make accurate low temperature calibration of induction furnaces difficult. For this reason, conventional metalwound resistance furnaces have been used for high precision, low temperature heating steps of volatile-bearing material. Other sample heating techniques that avoid heating of the chamber walls involve CD2 laser and infra-red imaging techniques. The laser technique has proven particularly successful in the extraction of rare gases from geologic materials, and can be used for sample areas down to several tens of µm in dimension. Large thermal gradients developed during irradiation of large samples require caution in applying this teachnique (e.g., see Sharp, 1990). Infra-red image furnaces utilize gold-lined, parabolic-shaped mirrors to reflect radiation emitted from heated tungsten elements and generate an axial-symmetric hotzone. The quartz glass walls of the extraction line are relatively transparent to the IR radiation, so that H2 diffusion through the wall is minimized. These furnaces have extremely fast response times, and can be reproducibly controlled throughout complicated heating schedules (P. Ihinger and M. Davis, unpublished results). Another advantage is that they are cheaper and more compact than induction furnaces, so that their use in the Earth sciences will continue to grow. Before samples are loaded into the extraction line, empty crucibles are preheated for several hours. at higher temperatures than those to be encountered during the extraction procedure. This ensures the removal of any volatiles within the crucible, and also serves to remove any adsorbed volatiles from the surface of the quartz reaction vessel. If high
75
Ihinger, Hervig & McMillan: Analytical Methods for Volatiles in Glasses
precision is not required, time can be saved by loading the weighed sample directly into the pre-heated reaction vessel in air. The blank contribution of average-sized vessels exposed to air is typically less than 3 µmoles water and -0.25 µmoles C02 and is reproducible to within 3% of these values (Ihinger, 1991). When small amounts of water (3 wt %). Also note general colinearity of pantellerite and metaluminous rhyolites.
84
Ihinger, Hervig & McMillan: Analytical Methods for Volatiles in Glasses
Negative secondary ions
-
H- (Lake Co. Plag) H- (5.1% H20 Rhy)
+ 51- (5.1 % H20 Rhy)
I/)
-
o
•
Cii
c: ::::s
o
--
..
CJ
+
>-
+
e
•
u;
Q)
c:
.. 100~~~~--~~~~~~~====::::::: -25 o 25 50 75
100
125
Initial kinetic energy (eV) Figure 6. Energy spectra for H- and 28Si- sputtered from ME35D, an experimentally hydrated (5.1 % by Karl Fisher titration) rhyolite glass and H- from Lake Co. plagioclase (An60). Primary beam was emitted from a duoplasmatron ion source at -12.5 kV accelerating potential. Note high secondary intensities at low initial kinetic energies, and the gradual decrease of secondary silicon and hydrogen with increasing initial kinetic energies. The negative ion energy spectra of silicon and hydrogen are similar, in contrast to positive ion energy spectra (Fig. 4).
H~O 1 0ion ions very
H analysis using negative secondary ions. The energy spectra for Hsputtered from the same phases as in Figure 4 are shown in Figure 6. The negative ion spectra are distinct from those for positive ions in that they resemble very closely the spectrum for Si. When negative ions are analyzed, secondary electrons are still generated, but they are immediately repelled by the negative potential on the sample, and are not as likely to cause desorption of surface hydrogen. Note the secondary peak for H- ions sputtered from the Lake Co. plagioclase sample at -30 eV excess kinetic energy (also to a lesser degree on the rhyolite glass). During analysis, the samples charged up by -30V. The charging in the crater was compensated by adding -30V to the sample potential, but at the edge of the crater, near the remaining conducting coat, there is no charging, and we observe the sputtering of H- ions with an apparent energy difference of 30 eV compared to the center of the crater. Si: ions do not show the same secondary peak, as no Si is adsorbed to the conducting coat. A hydrogen calibration can be obtained using negative secondary ions, but as suggested by the energy spectra in Figure 6, background signals can be a serious problem. An example is shown on Figure 7, for some of the hydrous basaltic and rhyolite glasses depicted in Figure 7. Negative secondary ions with 50±20 eV were used to construct this plot. As for positive ions, the slope of the rhyolite calibration is greater than for basalt (by nearly identical factors of 1.5; Figs. 5,7). The effect of varying secondary ion energy and sample composition on hydrogen calibrations using negative secondary ions has not been examined.
Hydrogen detection levels. Anecdotal evidence suggests that it is the mounting medium that controls the background for H analyses. For example, the lowest water backgrounds we have observed ($0.1 wt % H20) were on samples embedded and polished
85
Ihinger, Hervig & McMillan: Analytical Methods for Volatiles in Glasses
Basalt and Rhyolite (Negative Ions)
0.5 y
= 0.11 + 0.07x
R"2 = 0.95
0.4 N
0
en
en to
0.3
,
CI)
~,
-
0.2 y
::I:
Figure 7. Calibration for H in basalt and rhyolite glasses using negative secondary ions with 5000 eV excess kinetic energy. H count rate normalized to that for 28Si-. Standards characterized as in Fig. 3.
= 0.09 + 0.045x
R"2 = 0.67
0.1
0.00
2
3
4
5
6
in orthodontic resin (for infrared analysis). For SIMS analysis, these wafers were stuck to a glass slide with a drop of "super glue" (cyanoacrylate). More commonly, our epoxy-rich standard grain mounts give -0.3 wt % H20 backgrounds, while polished thin sections of rocks give backgrounds closer to 0.2 wt % H20. Leaving the sample in the vacuum chamber for several days will significantly lower the H background, if such time is available (e.g., 1994 basalt and phonolite calibrations shown on Fig. 5a; Deloule et a!., 1991a). Another technique to reduce the H background from the vacuum is to greatly increase the intensity of the primary ion beam, which, in effect, removes H-bearing gas contaminants from the sample surface (by sputtering) as fast as or faster than they can be deposited. The limit of this technique occurs when further increases in primary ion current do not increase the current density in the crater. Yurimoto et al. (1989) used high primary beam currents to obtain detection levels near 5 ppm (atomic) for H in quartz at the expense of using a 100 µm diameter primary ion beam. Very low background levels can also be achieved when experiments are conducted with D20 instead of H20. The background signal for D is nearly absent, allowing very low levels of D in synthetic, nominally anhydrous phases to be determined (Rovetta et a!., 1989, Pawley et a!., 1993). When negative secondary ions are studied, we observe higher backgrounds for H20 than for positive ions, but no rigorous comparison has been made by us. Matrix effects. Besides the glasses described above, we have studied the minerals kaersutite, tremolite, biotite, staurolite, and cordierite over the past five years using the conditions for positive ion analysis described above. All of these phases fall very close to the calibration defined by the basaltic glasses in Figure 5a with the exception of the tremolite (closer to the rhyolite calibration) and the biotite (very much below the basaltic calibration). Until more examples of these two phases are tested we would suggest that for compositions from 28 up to 59 wt % Si02 (the silica content of the phonolite in Fig. 5a) a calibration based on basalt glass will provide reasonably accurate analyses. The rhyolite (and pantellerite) glasses at 70 to 76 wt % Si02 show higher sensitivities (higher H+/Si+ per wt % H20) than basalts, but we do not know where in composition-space the calibration changes, or if the change is sudden or gradual. For analysis of high-silica glasses, it would be best to obtain standards as close as possible to unknowns.
86
Ihinger, Hervig & McMillan: Analytical Methods for Volatiles in Glasses
Precision. The data in Figure 5 indicate that H+ calibrations are reproducible in that repeated analysis sessions generally give the same slope. Specifically, we can calculate the error in the slope for a particular calibration. For example, the 1994 basalt calibration gives a slope of 0.206±0.013 (one standard error), a precision of about 6%. For the 1993 rhyolite calibration, we calculate a slope of 0.249±0.022, approximately a 10% uncertainty. The percentage uncertainty in the rhyolite slope is cut in half if the glass containing 5 wt % H20 is removed from the fit. Thus, precision of H20 analyses on rhyolite glass by SIMS is significantly improved when water contents are less than -3 wt %. This may be related to dominance of (mobile?) molecular H20 in water-rich glasses. DIH measurements by SIMS. D/H ratios measured by Deloule et al. (1991a) used positive, low-energy secondary ions to maximize sensitivity. This technique is useful (Deloule et al., 1991b; Watson et al., 1994), but is difficult to apply to compositions other than represented by standards because of the large matrix effects (instrumental fractionation varied by several tens of per mil over a range of amphibole solid solutions). It is known that ions generated by electron stimulated desorption are subject to very large isotope fractionation effects (Madey et al., 1970; Houston and Madey, 1982), suggesting that there is a significant change in the secondary electron yields for the samples studied by Deloule et al. (1991a). Analyses using negative secondary ions (minimal contribution by secondary electron-generated ions) may reduce this effect, but at the expense of isotope ratio precision. Applications
to volatile contents in silicate glasses: Carbon
Carbon is difficult to analyze using positive secondary ions because ion yields are low, and 24Mg2+ at the same nominal mass/charge value as 12C+ must be resolved. Much greater sensitivity can be achieved with negative secondary ions (and multiply charged elemental negative ions are not stable). Pan et al. (1991) synthesized C02-bearing basaltic and basanitic glasses and characterized them by total carbon analysis. These samples provided a SIMS calibration with identical C ion yields for basaltic and basanitic glasses. Later analyses on bulk-analyzed leucitites (Thibault and Holloway, 1994) and one minette (synthesized by Y. Thibault, now at the C. Scarfe Laboratory at the University of Alberta) showed colinearity with basaltic and basanitic samples. The leucitite + minette + basanite + basalt calibration is shown on Figure 8a. A suite of acmitic (NaFeSi206) glasses was also studied by SIMS (synthesized by Y. Thibault; Fig. 8a). The sensitivity is -112 that for leucitites. Several other samples are shown on Figure 8b, with the leucitite calibration given for scale. C02-bearing albitic and albiteoy-anorthitej glasses were synthesized using l3C-bearing starting materials and were characterized by NMR (provided by R. Brooker, University of Bristol). The two rhyolitic glasses (provided by R.A. Fogel) were characterized by Fourier transform infrared spectroscopy on normal isotopic abundance samples (Fogel and Rutherford, 1990). The data for the rhyolitic and Ab9SAnS glasses are approximately colinear, and this trend has slightly lower slope than the acmitic glasses in Figure 8a. The albitic glasses suggest a slope which is about 20% that of the leucitite composition. There is a general trend of decreasing sensitivity to C with increasing amounts of C dissolved as molecular C02 species, but the acmite glasses provide an exception. The matrix effects for C analyses by SIMS are poorly understood at present.
Carbon detection levels. The background for carbon (detected as negative secondary ions) is determined by a combination of the sample mounting medium, and back streaming of pump oil. Increasing the primary ion current (and as a result, the primary ion beam spot size) decreases the contribution of C from the vacuum, until a point is reached where larger currents do not translate into higher current densities. Rastering a -5 nA primary beam over an area -30 µm on a side for -5 minutes before returning to a stationary
87
Ihinger, Hervig & McMillan: Analytical Methods for Volatiles in Glasses
a
o
en..
•
Leucitite Minette Acmite
II
a
0.02
,
en
CO
«,
o
Figure 8. (a) Calibration for carbon in experimentally carbonated leucitite, minette, and acmite glasses (characterized by total carbon analysis). The 12C-t28Si- ratio is multiplied by the wt. fraction Si02 in the glass. The slope of this line is indistinguishable from the calibration for basalt and basanite (Pan et al., 1991). Acmite glasses show lower sensitivity for C analysis by a factor of -2.
0.01
-
N .,...
0.00 0
1
2
0.003
4
I I
b
I I I I I
(b) Calibration for carbon in rhyolite glass (calibrated by FfIR; Fogel and Rutherford, 1990), albite glass, and Ab95An5 glass, both calibrated by nuclear magnetic resonance (NMR) spectrosco&y on samples synthesized with pure 3C. Vertical axis represents secondary ion intensity ratios for either l3C- or 12C-, depending on the sample. The leucitite calibration from (a) is shown for comparison. Samples from Drs. Y. Thibault (Chris Scarfe Lab, University of Alberta), R. Brooker (University of Bristol), and R.A. Fogel (American Museum of Natural History).
3
CO2 (wt.%)
I
N
0
en..
I
Leucitite
0.002
I I
-
I I I I I
C/)
I I
co
r-
-
" I
,
N
Albite 95% Anorthite 5%
I
0.001
I I I
o
I I
•
I I
,'/__..,...0.000 0.0
Rhyolite glass (FTIR)
0.2
0.4
0.6
0.8
1.0
1.2
Total CO2 (Wt.%)
beam for analysis gave the minimum background levels at ASU, corresponding to 0.1 to 0.3 wt % CD2 (Pan et al., 1991; Hervig, 1992). However, background levels as low as 0.02 wt % C02 have been reported on synthetic albite glass on another Cameca SIMS instrument (Ian Hutcheon, pers. comm., 1991).
Caltech,
now at Lawrence
Livermore
National
Laboratories,
Precision. The precision of SIMS measurements on silicic glasses has not been tested at ASU, but repeated measurements of our bulk-analyzed basanites and leucitites has given the same slope (within 10%) on our calibration plots since 1990. Applications
to volatile contents in silicate glasses: Halogens
Fluorine. Fluorine can be analyzed using either positive or negative secondary ions. Positive F ions are surprisingly intense at low secondary ion energies, the result of the efficiency with which secondary electrons can desorb F ions from the sample surface (see Williams, 1992). When high energy ions are studied, the sensitivity for F drops severely, in concert with its high ionization potential (1 countls 19F+ - 200 ppm F for 1 nA 0- and secondary ions with 75±20 eV). Ottolini et a!. (1994) suggested that matrix effects for
88
Ihinger, Hervig & McMillan: Analytical Methods for Volatiles in Glasses Analyses of rhyolite standards for F 0.008
a
Positive
secondary
ions
0.006
-
+
aP;
0.004
N
_
+LL
CI> T"
0.002
V
y = 1.2e-4 • 4.8e-7"x
0.000-
R"2 = 0.996
' 10000
o
20000
F (ppm) 20r-~--~~--'---~-r-
b
-
15
Negative
secondary
ions
~
,
s .
T"_
10
LL
CI> T"_
5 ~ /
oo •
y 2000
= - .10 + 2.0e-3·x 4000
6000
F (ppm)
R"2
= 0.987 8000
10000
Figure 9. Analyses of rhyolite standards for fluorine. (a) calibration with positive secondary ions with 7S±20 eV excess kinetic energy normalized to the 30Si+ count rate. Data include analyses from 1991 and 1994. The analytical sessions are not distinguishable. (b) calibration with negative secondary ions with 50±20 eV excess kinetic energy normalized to the 180- count rate. Note that the vertical axes are not normalized for silica or oxygen abundance as the rbyolitic glasses represent a limited range of compositions. Standards characterized by ion specific electrode (most by H.R. Westrich, Sandia National Labs).
high energy (l00±25 eV) F+ ions were small based on their analyses of amphiboles, micas, kornerupines, and topaz. One problem with measuring F" is that 180H+ is not completely eliminated by energy filtering and can be a significant interference for low-F, high H glasses. A calibration curve for F+ in rhyolite glasses is shown on Figure 9a. For this calibration, we have combined analyses taken in 1991 and 1994. Negative secondary ions of F are much more intense than positive ions; 1 countls F=-c Ippm for 1 nA 0- and secondary ions with 50±20 eV. A calibration on many of the same rhyolite glasses shown in Figure 9a is displayed in Figure 9b. We have analyzed one F-rich amphibole and three different apatites. The results for the crystals were colinear and the slope of the resulting calibration curve was greater by a factor of 1.3 than that for the rhyolite glasses. The extent of matrix effects for this element remains to be investigated.
Chlorine. Ottolini et al. (1994) found that the signal for high energy (l00±25 eV) Cl+ was about half that for F", limiting the use of positive ion analysis to levels of tens of ppm CI. No calibration curve was presented in this work. Much higher sensitivities are
Ihinger, Hervig & McMillan: Analytical Methods for Volatiles in Glasses
Figure 10. Calibration for chlorine in rhyolitic 1:lasses. Negative secondary ions of 3 CI- and 37CI- with 50±20eV excess kinetic energy normalized to the 180 - count rate plotted against CI determined by electron probe. The ratio of the slopes is within 2% of the standard terrestrial CI isotope ratio. Note the negative intercept. Regardless of which isotope is used for the SIMS calibration, there is a constant difference of -120 ppm CI between SIMS (low) and electron probe (higher abundances) indicating a minor background signal in the electron probe.
89
...:-- 0.3 c 0.2
0.1
1000
2000
3000
CI (ppm)
observed for negative secondary ions; our calibration on the same rhyolite glasses as in Figure 9b is shown in Figure 10. We measured both isotopes of Cl, and the slopes for the two calibrations are different by a factor of 0.315±O.003, very similar to the terrestrial 37ClI 35Cl ratio of 0.319. For the other calibrations we have described, the intercepts have either been close to zero (e.g., F) or positive (e.g., H, C). The latter calibrations indicate an instrumental background for the species studied. For Cl, the intercept is negative, indicating that the nominal analyses of the standards are too high. Both isotopes imply that the standards are uniformly high by -120 ppm CI. Because the standards are characterized by the electron probe, this should not be surprising, as the level of detection for Cl is on this order. Sensitivity and precision. Sensitivity for halogens can be very good when using negative secondary ions; measurements of less than 1 ppm of either F or Cl should be feasible. However, at these low levels, contamination problems may be important. We have found that F and Cl signals can be significant on nominally anhydrous, halogen-free minerals in thin section, presumably because the epoxy in which they are embedded is halogen-bearing and is smeared across the sample surface during polishing. Rastering the primary ion beam over a small area (e.g., 50 x 50 microns) for a few minutes seems to virtually eliminate this contamination. Reproducibility has been good for fluorine; note the combination of data sets from 1991 and 1994 in Figure 9a. We also note that we have been getting the same 19F-/180- ratio (within 10%) on Durango apatite since 1990. Applications
to volatile contents in silicate glasses: Sulfur
Whereas SIMS has been commonly used for S isotope ratio measurements on sulfides (e.g., Eldridge et al., 1989), the measurement of S in volcanic glasses by SIMS has been limited. This is because the electron probe is adequate for many naturally occurring compositions (e.g., Devine et aI., 1984). For high-silica compositions, however, the solubility of sulfur diminishes to the point that electron probe analyses are at or below easily achieved detection levels. SIMS analyses for S in rhyolites are difficult because there are serious interferences on S from oxygen dimers (1602- and 160180- on 32S- and 34S-, respectively) and because of the slightly greater problem of sample charging when negative secondary ions are analyzed. An attempt to measure sulfur in a suite of high-silica glasses is shown on Figure lla. Only ions with 50±20 eV excess kinetic energy were
90
Ihinger, Hervig & McMillan: Analytical Methods for Volatiles in Glasses Sulfur calibration 0.0004
a f ('II
0
0.0003
-
0.0002
en..
~ ('II
r..., rJ) '
~8
ON
:::l
0.«1
o
>
-:=-e g
g
~8 ..... ,..,
:::I.8::r::
,
~§
tl' 00
'0
,
,..,
"6
~
,
&!;!:!
N
:::I.8::r::
00 .....0-
r/J~
0
8~
8 0-
C
.,..
';;i Q)
>
;;;
..&
B
r/J
§ ~~
~o-0._
=~
~
0-
::::
.,
';;i
(v)
(16)
Nlo(v) el>is the total scattered power (in 1 s-l), integrated over all scattering directions and polarization states of the radiation, and there are N molecules per unit volume in the region sampled. For a given polarization state of the incident and scattered radiation, the total scattered intensity entering the spectrometer at a given frequency for all molecules in the volume sampled is I
= del>= NI (dO") 'dO °dO
(17)
where the solid angle 0 is determined by the collection and spectrometer optics. The quantity do/dO is known as the differential scattering cross section. Ignoring polarization effects, the quantum mechanical expression for the Raman scattered intensity for a collection of diatomic molecules with vibrational frequency Vi at temperature T is I =NI dO"=NI s ° dr\ U
(vo-v/ 2
(da)2 hv,
0
m * Vi (1 _ e- kT)
2 4
EoC
(18)
-1A
aisr
for Stokes scattering. It is seen that, unlike infrared absorption coefficients, the intensity of Raman scattering depends implicitly upon the temperature and the wavelength (frequency) of excitation, even within the harmonic approximation. For vibrations of polyatomic molecules, or if the polarization properties of the incident and scattered radiation are considered, the term in (daJd&-)2 in this expression is replaced by appropriate elements of the polarizabiJity tensor (Long, 1977; McMillan, 1985). Absolute values of the differential Raman scattering cross section for the vibrational modes of a few gas phase molecules have been measured (Schreiter and Klockner, 1979; Bernstein, 1982; Kiefer, 1982). However, for most cases, differential Raman cross sections are commonly measured and reported relative to a standard for which the absolute cross section is well known, such as N2 gas (Schrotter and Klockner, 1979). The resulting relative normalized differential Raman cross sections for a range of molecules have been compiled by Schrotter and Klockner (1979) and Bernstein (1982), and these values are commonly used in fluid inclusion analysis (Dhamelincourt et al., 1979; Bergman and Dubessy, 1984; Pasteris et aI., 1988; Dubessy et aI., 1989). The relative
112
Ihinger, Hervig & McMillan: Analytical Methods for Volatiles in Glasses
concentrations of species a and b within an inclusion are obtained by ratioing their Raman intensities:
(d%nt Idn
No _I; Ib (d(11 ) ,
Ii" b
s
(19)
0
in which NafNb represents the relative numbers of species a and b, usually expressed as a percentage or mole fraction in the scattering volume, V. This approach eliminates the need for independent determination of V, which would be required for an absolute determination of species concentration. In a Raman scattering experiment, the scattering volume is a function of both the incident laser focusing optics and the collection optics, which define an approximate cylinder several µm3 in volume, within which the exciting radiation is concentrated (Pasteris, 1988). In recent fluid inclusion studies, more reliable values for the relative normalized differential Raman cross sections of different gas phase species have been adopted (Schrotter and Kleckner, 1979; Dubessy, 1989). In addition, it has been recognized that these should be corrected by a frequency- and temperature-dependent factor, arising from the frequency and temperature dependence of the Raman cross section (Dubessy et aI., 1989). This results in a correction to the relative differential cross sections for species a and b, (d(1/dn)a/(d(1/dn)b, which depends on their characteristic Raman frequencies relative to a particular excitation frequency, at a given temperature. Further, the vibrational modes of species in fluid inclusions, particularly C02, are affected by the density and by interaction with solvent molecules, resulting in changes in the Raman cross sections relative to dilute gas phase molecules (Pasteris et al., 1988; Dubessy et al., 1989; Chou et al., 1990). A successful fluid inclusion analysis depends on the assumption that the instrumental response is linear over the entire wavelength range studied, which is demonstrably not true for commercial Raman instruments. Especially the grating reflectivity and detector efficiency are strongly dependent on wavelength, and also on the polarization state of the light passing through the spectrometer. One method to correct for this is to determine an intensity calibration factor as a function of wavelength, by passing light from a standard calibration lamp through the instrument. The use of instrument-specific "Raman quantification factors" has also been suggested to replace the Raman scattering cross sections for fluid inclusion studies (Wopenka and Pasteris, 1987; Pasteris et al., 1988). From this discussion, it would be relatively easy to establish a working set of Raman scattering cross sections for various volatile species of interest dissolved in silicate glasses. Small known quantities of a standard such as N2 or CH4 could be dissolved in the glass (either as truly dissolved molecular species, or as homogeneously distributed submicroscopic bubbles) to provide an initial internal calibration, then one of the Raman bands of the silicate framework could serve as the standard in later work. Application of this technique could permit quantification of species concentrations not easily measured by infrared spectroscopy, such as carbonate contents in very high carbon content samples, or the species associated with the 900 cm-l band in hydrous aluminosilicate compositions (McMillan et aI., 1993).
REFERENCES Aines RD, Rossman GR (1984) Water in minerals: A peak in the infrared? J Geophys Res 89:4059-4072 Anderson AT, Newman S, Williams SN, Druitt TH, Skirius C, Stolper E (1989) H20, C02, CI and gas in Plinian and ash flow Bishop rhyolite. Geology 17:221-225
Ihinger, Hervig & McMillan: Analytical Methods for Volatiles in Glasses
113
Anderson SW, Fink JH (1989) Hydrogen-isotope evidence for extrusion mechanisms of the Mount St Helens lava dome. Nature 341:521-523 Bacon CR, Newman S, Stolper E (1992) Water, C02, Cl, and F in melt inclusions in phenocrysts from three Holocene explosive eruptions, Crater Lake, Oregon. Am Mineral 77:1021-1030 Barres 0, Bumeau A, Dubessy J, Pagel M (1987) Application of micro-FT-IR spectroscopy to individual hydrocarbon fluid inclusions. Appi Spectroscopy 41:1000-1008 Bartholomew RF, Butler BL, Hoover HL, Wu CK (1980) Infrared specta of a water-containing glass. J Am Ceram Soc 63:481-485 Bartholomew RF, Schreurs JWH (1980) Wide-line NMR study of protons in hydrosilicate glasses of different water content. J Non-crystalline Solids 38-39:679-684 Behrens H (1994) Measurement of solubilities of water in melts of albitic (NaAlSi308) and orthoclasic (KAlSi308) compositions. Eur J Mineral, submitted Bell DR, Rossman GR (1992) Water in Earth's mantle: the role of nominally anhydrous minerals. Science 255:1391-1396 Bell PM, Mao HK, Weeks RA (1976) Optical spectra and electron paramagnetic resonance of lunar and synthetic glasses: a study of the effects of controlled atmosphere, composition and temperature. Proc 7th Lunar Sci Conf:2543-2559 Belton PS (1979) An 1H pulsed N .M.R. study of some amorphous silicate hydrates. J Chern Technol BiotechnoI29:l9-25 Bergman SC, Dubessy J (1984) C02-CO fluid inclusions in a composite peridotite xenolith for upper mantle oxygen fugacity. Contrib Mineral Petrol 85: 1-13 Berman A (1985) Total Pressure Measurements in Vacuum Technology. Academic Press, Inc, Orlando, Florida Bernstein HJ (1982) Raman intensities of gases In: Vibrational Intensities in Infrared and Raman Spectroscopy, WB Person, G Zerbi (eds), Elsevier, Amsterdam. p 258-265 Bigeleisen J, Periman ML, Prosser He (1952) Conversion of hydrogenic materials to hydrogen for isotopic analysis. Anal Chern 24:1356-1357 Blank JG, Delaney JR, Des Marais DJ (1986) Carbon in basaltic glass from the Juan de Fuca Ridge. EOS Trans Am Geophys Union 67:1253 Blank JG, Stolper EM, Carroll MR (1993) Solubilities of carbon dioxide and water in rhyolitic melt at 8500C and 750 bars. Earth Planet Sci Lett 119:27-36 Boulos EN ,Kreidl NJ (1972) Water in glass: a review. J Canadian Ceram Soc 41:83-90 Bray PJ, Holupka R (1984) Proton resonance in natural glasses. J Non-Cryst Solids 67:119-126 Brett R, Evans HT, Gibson EK, Hedenquist JW, Wandless M, Sommer MA (1987) Mineralogical studies of sulfide samples and volatile concentrations of basalt glasses from the southern Juan de Fuca Ridge. J Geophys Res 92:11,373-11,379 Brewster D (1826) On the existence of two new fluids in the cavities of minerals, which are immiscible, and possess remarkable physical properties. Trans R·Soc Edinburgh 10: 1-41 Brey G (1976) C02 solubility and solubility mechanisms in silicate melts at high pressures. Contrib Mineral Petrol 57:215-221 Brey G, Green DH (1976) Solubility of C02 in olivine melilitite at high pressures and the role of C02 in the earth's upper mantle. Contrib Mineral Petrol 55:217-230 Brigham RH, 0' Neil JR (1985) Genesis and evolution of water in two-mica pluton: a hydrogen isotope study. Chern GeoI49:l59-l77 Bums RG, Strens RGJ (1966) Infrared study of the hydroxyl bands in clinoamphiboles. Science 153:890892 Burnham CW, Jahns RH (1962) A method for determining the solubility of water in silicate melts. Am J Sci 260:721-745 Byers CD, Garcia MO, Muenow DW (1986) Volatiles in basaltic glasses from the East Pacific Rise at 21°N: implications for MORB sources and submarine lava flow morphology. Earth Planet Sci Lett 79:9-20 Carroll MR, Rutherford MJ (1985) Sulfide and sulfate saturation in hydrous silicate melts. J Geophys Res 90:C6Ol-C6l2 Carroll MR, Stolper EM (1991) Argon solubility and diffusion in silica glass: implications for the solution behavior of molecular gases. Geochim Cosmochim Acta 55 :211- 225 Chamberlin RT (1908) The gases in rocks. Publication No. 106 Carnegie Inst of Wash Washington, DC, 80pp Chase B (1987) Fourier transform Raman spectroscopy. Anal Chern 59:881-889 Chaussidon M, Jambon A (1994) Boron content and isotopic composition of oceanic basalts: Geochemical and cosmoshemical implications. Earth Planet Sci Lett 121:277-283 Chaussidon M, Libourel G (1993) Boron partitioning in the upper mantle: An experimental and ion probe study. Geochim Cosmochim Acta 57:5053-5062
114
Ihinger, Hervig & McMillan: Analytical Methods for Volatiles in Glasses
Chou I-M, Pasteris JD, Seitz JC (1990) High-density volatiles in the system C-O-H-N for the calibration of a laser Raman microprobe. Geochim Cosmochim Acta 54:535-543 Clark GJ, White CW, Allred DD, Appleton BR, Tsong 1ST (1978) Hydrogen concentration profiles in quartz determined by a nuclear reaction technique. Phys Chern Minerals 3:199-211 Coleman ML, Shepherd TJ, Durham JJ, Rouse JE , Moore GR (1982) Reduction of water with zinc for hydrogen isotope analysis. Anal Chern 54:993-995 Coplen TB, Wildman JD, Chen J (1991) Improvements in the gaseous hydrogen-water equilibration technique for hydrogen isotope ratio analysis. Anal Chern 63:910-912 Courel P, Trocellier P, Mosbah M (1991) Nuclear reaction microanalysis and analysis of light elements in minerals and glasses. Nucl Instr Methods Phys Res 54B:429-432 Craig H (1953) The geochemistry of the stable carbon isotopes. Geochim Cosmochim Acta 3:53-92 Craig H, Lupton JE (1976) Primordial neon, helium, and hydrogen in oceanic basalts. Earth Planet Sci Lett 31:369-385 Danyushevsky LV, Falloon TJ, Sobolev AV, Crawford AJ, Carroll M, Price RC (1993) The H20 content of basalt glasses from Southwest Pacific back-arc basins. Earth Planet Sci Lett 117:347-362 Davis AR, Oliver BG (1972) A vibrational spectroscopic study of the species present in the C02-H20 system. J Solution Chern 1:329-339 Davy H (1822) On the state of water and aeriform matter in cavities found in certain crystals. Phil Trans Part II:367-376 Delaney JR, Karsten JL (1981) Ion microprobe studies of water in silicate melts: Concentration-dependent water diffusion in obsidian. Earth Planet Sci Lett 52:191-202 Delaney JR, Muenow DW, Graham DO (1978) Abundance and distribution of water, carbon and sulfur in the glassy rims of submarine pillow basalts, Geochim Cosmochim Acta 42:581-594 Delhaye M, Dhamelincourt P (1975) Raman microprobe and microscope with laser excitation. J Raman Spectroscopy 3:33-43 Deloule E, France-Lanord C, Albarede F (199la) DIH analysis of minerals by ion probe. In: Taylor HP Jr, ONeil JR, Kaplan IR (eds) Stable Isotope Geochemistry: A Tribute to Samuel Epstein, Geochemical Society, Special Publication No.3, 53-62 Deloule E, Albarede F, Sheppard SMF (199lb) Hydrogen isotope heterogeneities in the mantIe from ion probe analysis of amphiboles from ultramafic rocks. Earth Planet Sci Lett 105:543-553 Des Marais DJ (1978) Variable temperature cryogenic trap for the separation of gas mixtures. Anal Chem 50:1405-1406 Des Marais DJ ,Moore JG (1984) Carbon and its isotopes in mid-oceanic basaltic glasses. Earth Planet Sci Lett 69:43-57 Devine JD, Sigurdsson H, Davis AN (1984) Estimates of sulfur and chlorine yield to the atmosphere from volcanic eruptions and potential climatic effects. J Geophys Res 89:6309-6325 Dhamelincourt P, Beny 1M, Dubessy J, Poty B (1979) Analyse d'inclusions fluides lila microsonde MOLE 11effet Raman. Bull Minerai 102:600-610 Diels K, Jaeckel R (1966) Leybold Vacuum Handbook. Pergamon Press, Oxford DingweU DB, Harris DM, Scarfe CM (1984) The solubility of H20 in melts in the system Si02-Ai203Na20-K20 at 1 to 2 Kbars. J GeoI92:387-395 Dixon JE, Stolper EM, Delaney JR (1988) Infrared spectroscopic measurements of CO2 and H20 glasses in the Juan de Fuca Ridge basaltic glasses. Earth Planet Sci Lett 90:87-104 Dixon JE, Clague DA, Stolper EM (1991) Degassing history of water, sulfur, and carbon in submarine lavas from Kilauea volcano, Hawaii. J GeoI99:371-394 Dixon JE, Stolper EM, Holloway JR (1994) An experimental study of water aand carbon dioxide solubilities in mid-ocean ridge basaltic liquids. J Petrol, in press Dobson PF, Epstein S, Stolper EM (1989) Hydrogen isotope fractionation between coexisting vapor and silicate glasses and melts at low pressure. Geochim Cosmochim Acta 53:2723-2730 Dobson PF , ONeil JR (1987) Stable isotope compositions and water contents of boninite series volcanic rocks from Chichi-jima, Bonin islands, Japan. Earth Planet Sci Lett 82:75-86 Dodd DM , Fraser DB (1966) Optical determinations of OH in fused silica. J Appi Phys 37:3911 Dubessy J, Poty B, Ramboz C (1989) Advances in C-O-H-N-S fluid geochemistry based on micro-Raman spectrometric analysis of fluid inclusions. Eur J Mineral 1:517-534 Dubois A-D (1985) An accurate zinc charcoal reduction system for DIH measurements of water and cellulose. Bull Soc Belg GeoI94:1l3-1l5 Dunbar NW, Hervig RL (1992a) Petrogenesis and volatile stratigraphy of the Bishop Tuff: evidence from melt inclusion analysis. J Geophys Res 97:15129-15150 Dunbar NW, Hervig RL (1992b) Volatile and trace element composition of melt inclusions from the Lower Bandelier Tuff: Implications for magma chamber processes and eruptive style. J Geophys Res 97:15151-15170 Dushman S (1962) Scientific Foundations of Vacuum Technique. John Wiley and Sons, Inc, New York
Ihinger, Hervig & McMillan: Analytical Methods for Volatiles in Glasses
115
Eckert H, Yesinowski JP, Stolper EM, Stanton TR, Holloway J (1987) The state of water in rhyolitic glasses: a deuterium NMR study. J Non-crystalline Solids 93:93-114 Eckert H, Yesinowski JP Silver LA, Stolper EM (1988) Water in silicate glasses: quantitation and structural studies by f H solid echo and MAS-NMR methods. J Phys Chern 92:2055-2064 Eggier DH, Mysen B, Hoering TC, Holloway JR (1979) The solubility of carbon monoxide in silicate melts at high pressures and its effect on silicate phase relations. Earth Planet Sci Leu 43:321-330 Eldridge CS, Compston W, Williams IS , Walshe JL (1989) Sulfur isotope analyses on the SHRIMP ion microprobe. In: Shanks WS, Criss RE (eds) New frontiers in stable isotopic research: Laser probes, ion probes, and small sample analysis. US Geol Surv Bull 1890:163-174 Epstein S, Taylor HP (1970) The concentration and isotopic composition of hydrogen, carbon and silicon in Apollo 11 lunar rocks and minerals. Geochim Cosmochim Acta, Supp 1, 2:1085-1096 Ernsberger FM (1977) Molecular water in glass. J Am Ceram Soc 60:91-92 Farnan I, Kohn SC, Dupree R (1987) A study of the structural role of water in hydrous silica glass using cross-polarization magic angle spinning NMR. Geochim Cosmochim Acta 51:2869-2873 Fine GJ, Stolper EM (1985) The speciation of carbon dioxide in sodium aluminosilicate glasses. Contrib Mineral Petrol 91:105-121 Fine OJ, Stolper E (1986) Carbon dioxide in basaltic glasses: concentrations and speciation. Earth and Planet Sci Lett 76:263-278 Fine G, Stolper E, Mendenhall MH, Livi RP, Tombrello TA (1985) Measurement of the carbon content of silicate glasses using the I2C(d,Pol13C nuclear reaction In: Microbeam Analysis-1985 San Francisco Press 241-245 Fischer K (1935) A new method for the analytical determination of the water content of liquids and solids. Angew Chern 48:394-396 Fogel RA, Rutherford MJ (1990) The solubility of carbon dioxide in rhyolitic melts: A quantitative FTIR study. Am Mineral 75:1311-1326 Fraser DG, Rammensee W (1987) Determination of the mixing properties of granitic and other aluminosilicate melts by Knudsen Cell Mass Spectrometry. In: Mysen BO (ed) Magmatic Processes: Physicochemical Principles The Geochemical Society Special Publication No. 1401-410 Friedman I (1953) Deuterium content of natural water and other substances. Geochim Cosmochim Acta 4:89-97 Friedman I , Smith RL (1958) The deuterium content of water in some volcanic glasses. Geochim Cosmochim Acta 15:218-228 Garcia MO, Muenow DW, Aggrey KE, O'Neil JR (1989) Major element, volatile, and stable isotope geochemistry of Hawaiian submarine tholeiitic glasses. J Geophys Res 94:10525-10538 Garrabos Y, Tufeu R, Le Neindre B, Zalczer G, Beysens D (1980) Rayleigh and Raman scattering near the critical point of carbon dioxide. J Chern Phys 72:4637-4651 Godfrey JD (1962) The deuteruim content of hydrous minerals from the East-Central Sierra Nevada and Yosemite National Park. Geochim Cosmochim Acta 26:1215-1245 Goldman DS, Berg 11 (1980) Spectral study of ferrous iron in Ca-Al-borosilicate glass at room and melt temperatures. J Non-Crystalline Solids 38&39:183-188 Goranson R (1931) The solubility of water in granite magmas. Am J Sci 22:481-502 Goranson RW (1936) Silicate-water systems: the solubility of water in albite-melt Trans Am Geophys Union 17:257-259 Griffiths PR, de Haseth JA (1986) Fourier Transform Infrared Spectroscopy. John Wiley and Sons, New York. Grimley RT (1967) Mass spectrometry In: Margrave, JL (ed) The Characterization of High Temperature Vapors Wiley 195-243 Hadni A (1967) Essentials of Modem Physics Applied to the Study of the Infrared. Pergamon Press, Oxford Hamilton DL, Burnham CW, Osborn EF (1964) The solubility of water and effects of oxygen fugacity and water content on crystallization in mafic magmas. J Petrol 5:21-39 Hamilton DL, Oxtoby S (1986) Solubility of water in albite-melt determined by the weight-loss method. J Geol 94:626-630 Hanson RC, Bachman K (1980) Raman studies of pressure tuning of the Fermi resonance in solid C02. Chem Phys Lett 73:338-342 Hanson RC, Jones LH (1981) Infrared and Raman studies of pressure effects on the vibrational modes of solid C02. J Chem Phys 75:1102-1112 Harris DM (1981) The microdetermination of H20, C02, and S02 in glass using a l280·C microscope vacuum heating stage, cryopumping, and vapor pressure measurements from 77 to 273 K. Geochim Cosmochim Acta 45:2023-2036 Harris DM, Anderson AT (1984) Volatiles H20, C02, and CI in a subduction related basalt. Contrib Mineral Petrol 87: 120-128
116
Ihinger, Hervig & McMillan: Analytical Methods for Volatiles in Glasses
Harrison AJ (1947) Water content and infrared transmission of simple glasses. Am Ceram Soc J 30:362366 Hervig RL (1992) Ion probe microanalyses for volatile elements in melt inclusions. EOS Trans Am Geophys Union 73:367 Hervig RL, Dunbar N, Westrich HR, Kyle P (1989) Pre-eruptive water content of rhyolitic magmas as determined by ion microprobe analyses of melt inclusions in phenocrysts. J Volcan Geotherm Res 36:293-302 Hervig RL, Williams P (1988) SIMS microanalyses of minerals and glasses for H and D. In: Benninghoven A, Huber AM, Werner HW (eds) Secondary Ion Mass Spectrometry, SIMS VI. J. Wiley & Sons, New York, 961-964 Hervig RL, Williams P, Thomas RM, Schauer SN, Steele 1M (1992) Microanalyses of oxygen isotopes in insulators by secondary ion mass spectrometry. Int J Mass Spec Ion Proc 120:45-63 Herzberg G (1945) Molecular Spectra and Molecular Structure II Infrared and Raman Spectra of Polyatomic Molecules. Van Nostrand Reinhold, New York Herzberg G (1950) Molecular Spectra and Molecular Structure I Spectra of Diatomic Molecules. Van Nostrand-Reinhold, New York Hinthorne JR, Anderson CA (1975) Microanalysis of fluorine and hydrogen in silicates with the ion microprobe mass analyzer. Am Mineral 60: 143-147 Hinton RW (1990) Ion microprobe trace-element analysis of silicates: Measurement of multi-element glasses. Chern GeoI83:11-25 Holtz F, Behrens H, Dingwell DB, Johannes W (1994) Water solubility in haplogranitic melts: Compositional, pressure, and temperature dependence. Am Mineral, in press Houston JE, Madey TE (1982) Core-level processes in the electron-stimulated desorption of CO from the W(11O) surface. Phys Rev B26:554-566 Howard-Lock HE, Stoicheff BP (1971) Raman intensity measurements of the Fermi diad VI, 2v2, in lZC02 and 13C02. J Mol Spectroscopy 37:321-326 Huang TC, Fung A, White RL (1989) Recent measurements of long-wavelength X-rays using synthetic multilayers. X-ray Spectrometry 18:53-56 Huber KP, Herzberg G (1979) Molecular Spectra and Molecular Structure IV Constants of Diatomic Molecules. Van Nostrand Reinhold, New York Ibinger PD (1991) An experimental study of the interaction of water with granitic melt. PhD thesis, California Institute of Technology Jones AP, Smith JV (1984) Ion probe analysis of H, Li, B, F, and Ba in micas with additional data for metamorphic amphibole, scapolite, and pyroxene. N Jb Mineral Mb 1984:228-240 Kadik AA, Lebedev TB (1968) Temperature dependence of the solubility of water in albite melt at high pressures. Geochem Int 5:1172-1181 Karsten JL, Holloway JR, Delaney JR (1982) Ion microprobe studies of water in silicate melts: temperature-dependent water diffusion in obsidian. Earth Planet Sci Lett 59:420-428 Keller WD, Pickett EE (1954) Hydroxyl and water in perlite from Superior, Arizona Am J Sci 252:87-98 Kendall C, Coplen TB (1985) Muitisample conversion of water to hydrogen by zinc for stable isotope determination. Anal Chern 57:1437-1440 Kennedy GC (1950) A portion of the system silica-water. Econ GeoI45:629-653 Khitarov NI, Lebedev EB, Rengarten EV (1959) The solubility of water in basaltic and granitic melts. Geokhimiya 5:479-492 Kiefer W (1982) Experimental techniques in Raman spectroscopy In: Person WB, Zerbi G (eds) Vibrational Intensities in Infrared and Raman Spectroscopy Amsterdam, Elsevier 239-257 Killingley JS, Muenow DW (1975) Volatiles from Hawaiian submarine basalts determined by dynamic high temperature mass spectrometry. Geochim Cosmochim Acta 39:1467-1473 Kirkpatrick, R1 (1988) MAS NMR spectroscopy of minerals and glasses. In: Spectroscopic Methods in Mineralogy and Geology, FC Hawthorne (ed), Rev Mineral 18:341-403 Knudsen M (1909) Die Molekularstromung der Gase dUTChOffnungen unde die Effusion. Ann Phys 28:9991016 Kohn SC, Dupree R, Golam Mortuza M (1992) The interaction between water and aluminosilicate magmas. Chern Geol 96:399-409 Kohn SC, Dupree R, Smith ME (1989a) A multinuclear magnetic resonance study of the structure of hydrous albite glasses. Geochim Cosmochim Acta 53:2925-2935 Kohn SC, Dupree R, Smith ME (1989b) lH NMR studies of hydrous silicate glasses. Nature 337:539-541 Kohn SC, Brooker RA, Dupree R (1991) 13C MAS NMR: a method for studying C02 speciation in glasses. Geochim Cosmocbim Acta 55:3879-3884 Konijnendijk WL, Buster JHJM (1977) Raman-scattering measurements of silicate glasses containing sulphate. J Non-Crystalline Solids 23:401-418
Ihinger, Hervig & McMillan: Analytical Methods for Volatiles in Glasses
117
Krom MD, Berner RA (1983) A rapid method for the determination of organic and carbonate carbon in geological samples. J Sed Petrol 53:660-663 Kyser TK, O'Neil JR (1984) Hydrogen isotope systematics of submarine basalts. Geochim Cosmochim Acta 48:2123-2133 Lee RR, Leich DA. Tombrello TA, Ericson JE, Friedman I (1974) Obsidian hydration profile measurements using a nuclear reaction technique. Nature 250:44-47 Leshin LA, Stolper EM, Eckert H (1990) Water in alkali silicate glasses: A MAS NMR and FTIR study. VM Goldschmidt Conf Progr Abstr 2:61 London D, Hervig RL, Morgan VI GB (1988) Melt-vapor solubilities and elemental partitioning in peraluminous granite-pegmatite systems: experimental results with Macusani glass at 200 MPa. Contrib Mineral Petrol 99:360-373 Long DA (1977) Raman Spectroscopy. McGraw-Hill, New York Lowenstem JB (1993) Evidence for a copper-bearing fluid in magma erupted at the Valley ofTen Thousand Smokes, Alaska. Contrib Mineral Petrol 114:409-421 Luth RW (1988a) Effects of F on phase equilibria and liquid structure in the system NaAISi04CaMgSi206-Si02. Am Mineral 73:306-312 Luth RW (1988b) Raman spectroscopic study of the solubility mechanisms of F in glasses in the system CaO-CaF2-SiOz. Am Mineral 73:297-305 Madey TE, Yates JTJ, King DA, Uhlaner CJ (1970) Isotope effect in electron stimulated desorption: oxygen chemisorbed on tungsten. J Chern Phys 52:5213-5220 Martin LH. Hill RD (1948) A Manual of Vacuum Practice. Cambridge University Press, London Masi U, O'Neil JR, Kistler RW (1981) Stable isotope systematics in Mesozoic granites of central and northern California and southwestern Oregon. Contrib Mineral Petrol 76: 116-126 Mathez EA, Blacic JD, Beery J, Maggiore C, Hollander M (1984) Carbon abundances in mantle minerals determined by nuclear reaction analysis. Geophys Res Len 11:947-950 Mathez EA, Delaney JR (1981) The nature and distribution of carbon in submarine basalts and peridotite nodules. Earth Planet Sci Lett 56:217-232 Mattey DP. Carr RH, Wright IP, Pillinger CT (1984) Carbon isotopes in submarine basalts. Earth Planet Sci Lett 70:196-206 McGee]J, Slack JF, Herrington CR (1991) Boron analysis by electron microprobe using MoB4C layered synthetic crystals. Am Mineral 76:681-684 McGuire AV, Francis CA, Dyar MD (1992) Mineral standards for electron microprobe analysis of oxygen. Am Mineral 77:1087-1091 McMillan PF (1985) Vibrational spectroscopy in the mineral sciences. In: Microscopic to Macroscopic: Atomic Environments to Mineral Thermodynamics. SW Kieffer and A Navrotsky (eds) Rev Mineral 14:9-63 McMillan P, Remmele RL (1986) Hydroxyl sites in Si02 glass: a note on infrared and Raman spectra. Am Mineral 71:772-778 McMillan PF, Hofmeister AM (1988) Infrared and Raman spectroscopy. In: Spectroscopic Methods in Mineralogy and Geology. FC Hawthorne (ed), Rev Mineral 8:99-159 McMillan PF, Jakobsson S, Holloway JR, Silver LA (1983) A note on the Raman spectra of water-bearing albite glasses. Geochim Cosmochim Acta 47:1937-1943 McMillan P, Akaogi M, Sato R, Poe B. Foley J (1991) Hydroxyl groups in B-Mg2Si04. Am Mineral 76:354-360 McMillan PF, Stanton TR, Poe BT, Remmele RR (1993) A Raman spectroscopic study of HID isotopically substituted hydrous aluminosilicate glasses. Pbys Chern Minerals 19:454-459 McMillan PF, Dubessy J, Hemley RJ (1994) Applications to earth science and environment. In: Raman Microscopy. J. Corset (ed), Academic Press, to be published McMillan PW, Chlebik A (1980) The effect of hydroxyl ion content on the mechanical and other properties of soda-lime-silica glass. J Non-cryst Solids 38:509-514 Meade C, Reffner JA, Ito E (1994) Synchrotron infrared absorbance of hydrogen in MgSi03 perovskite. Science 264:1558-1560 Metrich N, Clocchiatti R, Mosbah M (1993) The 1989-1990 activity of Etna magma mingling and ascent of H20-Cl-S-rich basaltic magma evidence from melt inclusions. J Voican Geotherm Res 59: 131 Moore CB, Gibson EK, Larimer JW, Lewis CF, Nichiporuk W (1970) Total carbon and nitrogen abundances in Apollo 11 lunar samples and selected chondrites and basalts. Geochim Cosmochim Acta Suppl 1:431 Moore JG (1970) Water content of basalt erupted on the ocean floor. Contrib Mineral Petrol 28:272-279 Mosbah M, Bastoul A, Cuney M (1993) Nuclear microprobe analysis of I4N and its application to the study of ammonium-bearing minerals. Nucl Inst Methods Phys Res 77:450 Mosbah M, Clocchiatti R, Tirira J (1991) Study of hydrogen in melt inclusions trapped in quartz with a nuclear microprobe. Nucllnst Methods Phys Res 54:298
118
Ihinger, Hervig & McMillan: Analytical Methods for Volatiles in Glasses
Mosbah MN (1991) PIGME fluorine determination using a nuclear microprobe with application to glass inclusions. Nucl Inst Methods Phys Res 58:227 Moulson AI, Roberts JP (1960) Water in silica glass. Trans Brit Ceram Soc 59:388-399 Mysen BO (1976) The role of volatiles in silicate melts: solubility of carbon dioxide and water in feldspar, pyroxene, and feldspathoid melts to 30 kb and l6250C Am J Sci 276:969-996 Mysen BO, Virgo D (1980) Solubility mechanisms of carbon dioxide in silicate melts: a Raman spectroscopic study. Am Mineral 65:885-899 Mysen BO, Virgo D (1980) Solubility mechanisms of water in basalt melt at high pressures and temperatures: NaCa AlSi207-H20 as a model. Am Mineral 65: 1176-1184 Mysen BO, Virgo D (1985) Interaction between fluorine and silica in quenched melts on the joins Si02AlF3 and Si02-NaF determined by Raman spectroscopy. Phys Chern Minerals 12:77-85 Mysen BO, Virgo D (1986a) Volatiles in silicate melts at high pressure and temperature: 1 Interaction between OH groups and Si4+, AJ3+, Ca2+, Na+, and H+. Chern Geol 57:303-331 Mysen BO, Virgo D (1986b) Volatiles in silicate melts at high pressure and temperature. 2 Water in melts along the join NaAl02-Si02 and a comparison of solubility mechanisms of water and fluorine. Chern GooI57:333-358 Mysen BO, Eggler DH, Seitz MG, Holloway JR (1976) Carbon dioxide in silicate melts and crystals. Part I solubility measurements. Am J Sci 276:455-479 Mysen BO, Virgo B, Harrison WJ, Scarfe CM (1980) Solubility mechanisms of H20 in silicate melts at high pressures and temperatures: A Raman spectroscopic study. Am Mineral 65:900-914 Nabelek PI, O'Neil JR, Papike JJ (1983) Vapor phase exolution as a controlling factor in hydrogen isotope variation in granitic rocks: the Notch Peak granitic stock, Utah. Earth Planet Sci Lett 66:137-150 Nash WP (1992) Analysis of oxygen with the electron microprobe: Applications to hydrated glass and minerals. Am Mineral 77:453-456 Newman S, Stolper EM, Epstein S (1986) Measurement of water in rhyolitic glasses: calibration of an infrared spectroscopic technique. Am Mineral 71:1527-1541 Newman S, Epstein S, Stolper EM (1988) Water, carbon dioxide, and hydrogen isotopes in glasses from the ca 1340 AD eruption of the Mono Craters, California: Constraints on degassing phenomena and initial volatile content. J Volcan Geotherm Res 35:75-96 Nicolosi JA, Broven JP, Merlo D, Jenkins R (1986) Layered synthetic microstructures for long wavelength X-ray spectrometry. Optical Eng 25:964-969 O'Neil JR, Chappell BW (1977) Oxygen and hydrogen isotope relations in the Berridale batholith. J Geol Soc Lond 133:559-571 O'Neil JR, Shaw SE, Flood RH (1977) Oxygen and hydrogen isotope compositions as indicators of granite genesis in the New England Batholith, Australia. Contrib Mineral Petrol 62:313-328 Oriova GP (1964) Solubility of water in albite melts-under pressure. Int Geol Rev 6:254-258 Ostrovskiy lA, Oriova GP, Rudnitskaya YS (1964) Stoichiometry in the solution of water in alkalialuminosilicate melts. DokJady Akad Nauk SSR 157: 149-151 Ottolini L, Botazzi P, Vannucci R (1993) Quantification of lithium, beryllium, and boron in silicates by secondary ion mass spectrometry using conventional energy filtering. Analyt Chem 65:1960-1964 Ottolini L, Botazzi P, Zanetti A (1994) Quantitative analysis of hydrogen, fluorine, and chlorine in silicates using energy filtering. In: SIMS IX, Proc Ninth Int Conf Secondary Ion Mass Spectrometry, in press Ox toby S, Hamilton DL (1978a) The discrete association of water with Na20 and Si0 in NaAl silicate 2 melts. Contrib Mineral Petrol 66:185-188 Oxtoby S, Hamilton DL (1978b) Solubility of water in melts of Na20-AI203-Si02 and K20-AI203 -Si02 systems. In: WS Mackenzie (ed) Progress in Experimental Petrology, vol 4, Natural Environment Research Council, Manchester, England. p 33-36 Oxtoby S, Hamilton DL (1978c) Water in plagioclase melts. In: WS Mackenzie (ed) Progress in Experimental Petrology, vol 4, Natural Environment Research Council, Manchester, England. p 3637 Oxtoby S, Hamilton DL (1978d) Calculation of the solubility of water in granitic melts. In: WS Mackenzie (ed) Progress in Experimental Petrology, vol 4, Natural Environment Research Council, Manchester, England. p 37-40 Paillat 0, Elphick SC, Brown WL (1992) The solubility of water in NaAlSi308 melts: a re-examination of Ab-H20 phase relationships and critical behavior at high pressures. Contrib Mineral Petrol 112:490500 Palais JM, Sigurdsson H (1989) Petrological evidence of volatile emissions from major historic and prehistoric volcanic eruptions. In: Geophysical Monographs No. 15: Contribution of Geophysics to Climate Change Studies. Am Geophys Union, Washington DC, p 31-53 Pan V, Holloway JR, Hervig RL (1991) The pressure and temperature dependence of carbon dioxide solubility in tholeiitic basalt melts. Geochim Cosmochim Acta 55:1587-1595
Ihinger, Hervig & McMillan: Analytical Methods for Volatiles in Glasses
119
Pandya N, Muenow DW, Sharma SK (1992) The effect of bulk composition on the speciation of water in submarine volcanic glasses. Geochim Cosmochim Acta 56:1875-1883 Pasteris JD, Wopenka B, Seitz JC (1988) Practical aspects of quantitative laser Raman microprobe spectroscopy for the study of fluid inclusions. Geochim Cosmochim Acta 52:979-988 Paterson MS (1982) The determination of hydroxyl by infrared absorption in quartz, silicate glasses and similar materials. Bull Mineral 105:20-29 Pawley AR, Holloway JR, McMillan PF (1992) The effect of oxygen fugacity on the solubility of carbonoxygen fluids in basaltic melt Earth Planet Sci Lett 110:213-225 Pawley AR, McMillan PF, Holloway JR (1993) Hydrogen in stishovite, with implications for mantle water content Science 261:1024-1026 Pearson AD, Pasteur GA, Northover WR (1979) Determination of the absorptivity of OH in a sodium borosilicate glass. J Mat Sci 14:869-872 Penfield SL (1894) On some methods for the determination of water. Am J Sci 48:30-37 Pichavant M (1981) An experimental study of the effect of boron on a water-saturated haplogranite at I kbar pressure: geological applications. Contrib Mineral Petrol 76:430-439 Pichavant M, Holtz F, McMillan P (1992) Phase relations and compositional dependence of H20 solubility in quartz-feldspar melts. Chern GeoI96:303-3l9 Pineau F, Javoy M (1983) Carbon isotopes and concentrations in mid-oceanic ridge basalts. Earth Planet Sci Lett 62:239-257 Poreda R (1985) Helium-3 and deuterium in back-arc basalts: Lau-Basin and the Mariana Trough. Earth Planet Sci Lett 73:244-254 Poreda R, Schilling J-G, Craig H (1986) Helium and hydrogen isotopes in ocean-ridge basalts north and south of Iceland. Earth Planet Sci Lett 78: 1-17 Potts PJ, Tindle AG (1989) Analytical characteristics of a multilayer dispersion element (M = 6OA) in the determination of fluorine in minerals by electron microprobe. Mineral Mag 53:357-362 Rai CS, Sharma SK, Muenow DW, Matson DW, Byers CD (1983) Temperature dependence of C02 solubility in high pressure quenched glasses of diopside composition. Geochim Cosmochim Acta 47:953-958 Redhead PA, Hobson JP, Komelsen EV (1968) The Physical Basis of Ultrahigh Vacuum. Chapman and Hall Ltd, London Richet P, Roux J, Pineau F (1986) Hydrogen isotope fractionation in the system H20-liquid NaAlSi308: New data and comments on DIH fractionation in hydrothermal experiments. Earth Planet Sci Lett 78:115-120 Roedder E (1984) Fluid Inclusions. Rev Mineral 12, 644 p Rosasco CJ, Roedder E (1979) Application of a new Raman microprobe spectrometer to non-destructive analysis of sulphate and other ions in individual phases in fluid inclusions in minerals. Geochim Cosmochim Acta 43:1907-1915 Rosasco GJ, Roedder E , Simmons JH (1975) Laser-excited Raman spectroscopy for non-destructive partial analysis of individual phases in fluid inclusions in minerals. Science 190:557-560 Rosasco GJ, Simmons JH (1974) Investigation of gas content of inclusions in glass by Raman scattering spectroscopy. Am Ceram Soc Bull 53:626-630 Roselieb K, Rammensee W, Biittner H, Rosenhauer M (1992) Solubility and diffusion of noble gases in vitreous albite. Chern GeoI96:24I-266 Rossman GR (1988a) Vibrational spectroscopy of hydrous components. In: Spectroscopic Methods in Mineralogy and Geology, FC Hawthorne (ed), Rev Mineral 18:193-206 Rossman GR (1988b) Optical spectroscopy. In: Spectroscopic Methods in Mineralogy and Geology, FC Hawthorne (ed), Rev Mineral 18:207-243 Rovetta MR, Blacic JD, Hervig RL, Holloway JR (1989) An experimental study of hydroxyl in quartz using infrared spectroscopy and ion microprobe techniques. J Geophys Res 94:5840-5850 Russell LE (1957) Solubility of water in molten glass. J Soc Glass Technology 4l:304-317T Ryskin YI (1974) Vibrations of protons in minerals: hydroxyl, water and ammonium. In: The Infrared Spectra of Minerals, VC Farmer (ed) London, Mineral Soc 137-181 Sakai H3 Smith JW, K~an IR, Petrowski C (1971) Microdeterminations of C, N, S, H, He, metallic Fe, 1)1 C, 1)15N, and I) 4S in geologic samples. Geochem J 10:85-96 Schiegl WE, Vogel JC (1970) Deuterium content of organic matter. Earth Planet Sci Lett 7:307-313 Scholze H (1960) Zur frage der unterscheidung zwischen H20-moieculen und OH-Gruppen in Glasern und Mineralen Naturwiss 47:226-227 Scholze H (1966) Gases and water in glass: Parts I, II, III. The Glass Industry 47:546-551; 622-628; 670674 Schrotter HW, Kleckner HW (1979) Raman scattering cross sections in gases and liquids In: Raman Spectroscopy of Gases and Liquids, A Weber (ed), Springer-Verlag, Berlin. p 123-166
120
Ihinger, Hervig & McMillan: Analytical Methodsfor Volatiles in Glasses
Sharma SK (1979) Structure and solubility of carbon dioxide in silicate glasses of diopside and sodium melilite composition at high pressures from Raman spectroscopic data. Carnegie Inst Wash Yearb 78:532-537 Sharma SK. Hoering TC, Yoder HS (1979) Quenched melts of akermanite compositions with and without C02 - characterization by Raman spectroscopy and gas chromatography. Carnegie Inst Wash Yearb 78:537-542 Sharp Z (1990) A laser-based microanalytical method for the in situ determination of oxygen isotope ratios of silicates and oxides. Geochim Cosmochim Acta 54: 1353-1357 Shelby JE (1987) Quantitative determination of the deuteroxyl content of vitreous silica. Commun Am Ceram Soc 70:C-9 - ColO Shepherd ES (1938) The gases in rocks and some related problems. Am J Sci 35-A:3ll-351 Shimizu N (1986) Silicon-induced enhancement in secondary ion emission from silicates. Int'l J Mass Spec Ion Proc 69:325-338 Silver LA, Stolper EM (1989) Water in albitic glasses. J Petrol 30:667-709 Silver LA, lhinger PD, Stolper EM (1990) The influence of bulk composition on the speciation of water in silicate glasses. Contrib Mineral Petrol 104:142-162 Sisson lW, Layne GD (1993) H20 in basalt and basaltic andesite gtass inclusions from four subductionrelated volcanoes. Earth Planet Sci Len 117:619-635 Skirius CM, Peterson JW, Anderson AT (1990) Homogenizing rhyolitic inclusions from the Bishop Tuff. Am Mineral 75:1381-1398 Sorby HC, Butler PJ (1869) On the structure of rubies, sapphires, diamonds, and some other minerals. Proc R Soc 17:291-303 Stanton TR (1989) High pressure isotopic studies of the water diffusion mechanism in silicate melts and glasses. PhD Dissertation. Arizona State University. Stanton TR, Holloway JR, Hervig RL, Stolper EM (1985) Isotope effect on water diffusivity in silicic melts: an ion microprobe and infrared analysis. Eos Trans Am Geophys Union 66: 1131 Stebbins J (1988) NMR spectroscopy and dynamic processes in mineralogy and geochemistry. In: Spectroscopic Methods in Mineralogy and Geology, FC Hawthorne (ed), Rev Mineral 18:405-429 Steele D (1971) Theory of Vibrational Spectroscopy. W B Saunders, Philadelphia Steele 1M (1986) Ion probe determination of hydrogen in geologic samples. N Jb Mineral Mh 1986:193202 Stewart DB (1958) The system CaAl2Si208-Si02-H20. Geol Soc Am Bull 69: 1648 Stolen RH, Walrafen GE (1976) Water and its relation to broken bond defects in fused silica. J Chern Phys 64:2623-2631 Stolper EM (1982a) Water in silicate glasses: an infrared spectroscopic study. Contrib Mineral Petrol 81:117 Stolper E (1982b) The speciation of water in silicate melts. Geochim Cosmochim Acta 46:2609-2620 Stolper EM (1989) Temperature dependence of the speciation of water in rhyolitic melts and glasses. Am Mineral 74:1247-1257 Stolper EM, Holloway JR (1988) Experimental determination of the solubility of carbon dioxide in molten basalt at low pressure. Earth Planet Sci Leu 87:397 -408 Stolper E, Fine G. Johnson T. Newman S (1987) Solubility of carbon dioxide in albitic melt. Am Mineral 72:1071-1085 Stolper EM, Newman S (1994) The role of water in the petrogenesis of Mariana trough magmas. Earth Planet Sci Lett, in press Stone J, Walrafen GE (1982) Overtone vibrations of OH groups in fused silica optical fibers. J Chern Phys 76:1712-1722 Strens RG (1966) Infrared study of cation ordering and clustering in some (Fe.Mg) amphibole solid solutions. Chern Commun 15:519-520 Sykes D, Kubicki JD (1993) A model for H20 solubility mechanisms in albite melts from infrared spectroscopy and molecular orbital calculations. Geochim. Cosmochim. Acta 57: 1039-1052 Takata M, Acocella J, Tomozawa M, Watson EB (1981) Effect of water content on the electrical conductivity of Na20·3Si02 glass. J Am Ceram Soc 64:719-724 Tanweer A, Hut G, Burgman JO (1988) Optimal conditions for the reduction of water to hydrogen by zinc for mass spectrometric analysis of the deuterium content. Chern Geol 73: 199-203 Taylor BE. Eichelberger JC, Westrich HR (1983) Hydrogen isotopic evidence of rhyolitic magma degassing during shallow intrusion and eruption. Nature 306:541-545 Taylor BE, Westrich HR (1985) Hydrogen isotope exchange and water solubility in experiments using natural rhyolite obsidian. EOS Trans Am Geophys Union 66:387 Taylor W (1990) The dissolution mechanism of C02 in aluminosilicate melts - infrared spectroscopic constraints on the cationic environment of dissolved [C0312-. Eur J Mineral 2:547-563
Ihinger, Hervig & McMillan: Analytical Methods for Volatiles in Glasses
121
Thibault Y, Holloway lR (1994) Solubility of C02 in a Ca-rich Ieucitite: effects of pressure, temperature, and oxygen fugacity. Contrib Mineral Petrol 116:216-224 Tilden WA (1896) An attempt to determine the condition in which helium and the associated gases exist in minerals. Proc R Soc 59:218-224 Turek A, Riddle C, Cozens Bl, Tetley NW (1976) Determination of chemical water in rock analysis by Karl Fischer titration. Chem GeoI17:26l-267 Turnbull AH, Barton RS, Riviere lC (1962) An Introduction to Vacuum Technique. George Newnes Ltd, London Ueda A , Sakai H (1984) Sulfur isotope study of Quaternary volcanic rocks from the lapanese Islands Arc. Geochim Cosmochim Acta 48:1837-1848 Uys 1M, King TB (1963) The effect of basicity on the solubility of water in silicate melts. Trans Met Soc AIME 227:492-500 Vennemann 1W, O'Neil lR (1993) A simple and inexpensive method of hydrogen isotope and water analyses of minerals and rocks based on zinc reagent. Chern GeoIl03:227 -234 Verweij H, van den Boom H, Breemer RE (1977) Raman scattering of carbonate ions dissolved in potassium silicate glasses. 1 Am Ceram Soc 60:529-534 Walrafen GE (1964) Raman spectral studies of water structure. 1 Chern Phys 40:3249-3256 Watson LL, Hutcheon ID, Epstein S, Stolper EM (1994) Water on Mars: Clues from deuteriumlhydrogen and water contents of hydrous phases in SNC meteorites. Science 265:86-90. Webster JD (1990) Partitioning ofF between H20 and CO2 fluids and topaz rhyolite melt. Contrib Mineral Petrol 104:424-438 Webster 10, Holloway JR, Hervig RL (1989) Partitioning of lithophile trace elements between H20 and H20 + C02 fluids and topaz rhyolite melt. Econ Geol84:ll6-134 Webster JD, Taylor RP, Bean C (1993) Pre-eruptive melt composition and constraints on degassing of a water-rich pantellerite magma, Fantale volcano, Ethiopia. Contrib Mineral Petrol 114:53-62 Werner HW, Morgan AE (1976) Charging of insulators by ion bombardment and its minimization for secondary ion mass spectrometry (SIMS) measurements. 1 Appi Phys 47:1232-1242 Westrich HR (1987) Determination of water in volcanic glasses by Karl-Fischer titration. Chern Geol 63:335-340 White WB (1974) The carbonate minerals. In: The Infrared Spectra of Minerals, VC Farmer (ed), Mineral Soc, London, p 227-284 White BS, Brearley M, Montana A (1989) Solubility of argon at high pressures. Am Mineral 74:513-529 Williams P (1981) Ion-stimulated desorption of positive halogen ions. Phys Rev B 23:6187-6190 Williams P (1985) Secondary ion mass spectrometry. Ann Rev Mater Sci 15:517-548 Williams P (1992) Quantitative analysis using sputtering techniques: secondary ion and sputtered neutral mass spectrometry. In: Briggs 0, Seah MP (eds) Practical Surface Analysis (second edition). John Wiley & Sons, New York, p 177-228 Williams P, Reed DA, Morgan AE (1983) Ion microscopy using electron-desorbed ions. Appl Surface Sci 16:345-350 Wood n, Grukpido NJ, Har KL, Flessa SA, Dadin AM, Deem IE, Ferris DH (1985) Measured X-ray performance of synthetic multi layers compared to calculated effects of layer imperfection. Soc PhotoOptical Instrumentation Engineers (SPIE) Proc 563:238-244 Wopenka B, Pasteris 1 (1986) Limitations to quantitative analysis of fluid inclusions in geological samples by laser Raman spectroscopy. Appl Spectroscopy 40:144-151 Wopenka B, Pasteris JD, Freeman 11 (1990) Analysis of individual fluid inclusions by Fourier transform infrared and Raman microspectroscopy. Geochim Cosmochim Acta 54:519-533 Wright RB, Wang CH (1973) Density effect on the Fermi resonance in gaseous C02 by Raman scattering. J Chern Phys 58:2893-2895 Wright RB, Wang CH (1974) Effect of density on the Raman scattering of molecular fluids. II. Study of intermolecular interaction in C02. 1 Chern Phys 61:2707-2710 Wu CK (1980) Nature of incorporated water in hydrated silicate glasses. J Am Ceram Soc 63:453-457 Yarwood J (1967) High Vacuum Technique. William Clowes and Sons, Ltd, London Yoder HS, Stewart DB, Smith JR (1956) Ternary feldspars. Carnegie Inst Wash Year Book 57:189-191 Yurimoto H, Kurosawa M, Sueno S (1989) Hydrogen analysis in quartz crystals and quartz glasses by secondary ion mass spectrometry. Geochim Cosmochim Acta 53:751-755 Zhang Y, Stolper EM, Wasserburg GJ (1991) Diffusion of water in rhyolitic glasses. Geochim Cosmochim Acta 55:441-456 Zhang Y, Stolper EM (1991) Water diffusion in a basaltic melt. Nature 351:306-309 Zinner E (1989) Isotopic measurements with the ion microprobe In: Shanks WS, Criss RE (eds) New frontiers in stable isotopic research: Laser probes, ion probes, and small sample analysis. US Geol Surv Bull 1890:145-162
CHAPTER
DEVELOPMENT FOR PREDICTION
3
OF THE BURNHAM MODEL
OF H20 SOLUBILITY IN MAGMAS
C. Wayne Burnham Geology Department Arizona State University Tempe, Arizona 85287 USA
HISTORICAL PERSPECTIVE N. L. Bowen, in his classic treatise on The Evolution of the Igneous Rocks (1928), was of the opinion that small amounts of a volatile, such as H20, would have correspondingly small effects on the liquidus phase relations appropriate to the "dry" melts in silicate systems, as indicated by his admonition (his Chapter XVI): "To many petrologists a volatile is exactly like a Maxwell demon; it does exactly what one may wish it to do." Only three years later Goranson (1931) embarked upon a series of experimental studies which culminated seven years later (Goranson, 1938) and showed, for the first time, that a relatively small weight percent of H20 in albite and sanidine melts does, indeed, behave almost like a "Maxwell demon" in its effect upon liquidus phase relations in these systems. To his credit, Bowen realized the significance of Goranson's findings and later did much to establish the importance of "small amounts" of H20 in the origin of granites (Bowen and Tuttle, 1950; Tuttle and Bowen, 1958). The work embodied in this latter publication constituted the coup de grace to the transformist school of the origin of granites, and virtually all definitive work since 1958, whether field or laboratory oriented, has supported their main conclusions regarding the magmatic origin of granites. Perhaps the main reason that Bowen did not more fully appreciate the critical role of H20 in the origin of granites at an earlier time was the lack, at that time, of an understanding of how silicate melts and H20 interact. His early position, prevalent at the time, appears to have been based on the assumption that H20, like other simple oxides such as Na20, affects liquidus equilibria merely by simple dilution. Goranson's (1938) experimental results clearly showed, however, that the addition of a relatively small weight percent H20 has a disproportionately large effect on the liquidus temperature of albite. At 2.0 kbar H20 pressure and 1100 K, for example, albite melt is saturated with only 6.1±O.3 wt % H20 (Burnham and Jahns, 1962, Fig. 8), but the liquidus temperature is approximately 3OO·C lower than in the anhydrous melt at the same pressure (Burnham and Davis, 1974, Fig. 18). Were this large effect to be attributed to dilution, alone, the cryoscopic relations (Burnham, 1992, Fig. I) require that the 6.1 wt % H20 lower the activity of the ab component of the melt to 0.25, but, owing to differences in gram formula weight between H20 (18.02 g) and NaAlSi30S (262.2 g), the most this amount of H20 could lower aabm by dilution is to 0.50. Thus, only approximately half the lowering of the liquidus temperature at 2.0 kbar can be attributed to dilution; the other half may be attributed to the mechanism by which H20 dissolves in silicate melts, as discussed below.
124
Burnham: H20 Solubility Models
In an effort to resolve this discrepancy, as well as many other puzzling aspects of the role of H20 in granitic magmas, experimental research was undertaken to determine the thermodynamic properties of H20 in NaAISi30S melts. Melts of albite composition were chosen with the presumption that the behavior of H20 in them is representative of that in melts of granitic composition, as attested by close similarities in H20 solubilities and in its effects on melting relations. Before the results of these experiments on hydrous melts, in the form of P-V-T measurements at pressures to 10 kbars encountered in the earth's crust (Burnham and Davis, 1971), could be used to derive therefrom other thermodynamic parameters, however, it was necessary to know the standard-state thermodynamic properties of pure H20 throughout the high temperature-pressure region of interest. An extensive experimental effort was mounted in the mid 1960s, therefore, to determine, for the first time, the thermodynamic properties of H20 to 1273 K and 10 kbars (Burnham et al., 1969). These data, combined with those on the partial molal volumes (Burnham and Davis, 1971) and solubilities of H20 in NaAISi30S melts (Burnham and Jahns, 1962; OrIova, 1962) provide the data required to completely determine the partial molal thermodynamic properties of H20 in these melts (Burnham and Davis, 1974). The volumetric measurements also provided the data base necessary for the first quantitative evaluation of the mechanical (P~ V) energy released in the exsolution of H20 from a magma, as in explosive volcanic eruptions and igneous breccia formation (Burnham, 1972, 1983, and 1985). THE THERMODYNAMIC
PROPERTIES
OF H20 IN GRANITIC MELTS
Notation
= activity of component i in melt m relative to melt of pure i. = fugacity of H20(W) in melt m f WO = fugacity of pure H20 at P and T. Gwo = molal Gibbs free energy of pure H20 at P and T. kwmi = Henry's-law analogue constant for H20 in melt m of i composition. µj = chemical potential of component i in the system. ajm
f wm
X~
= mole fraction of i in melt m.
The fundamental criterion for chemical equilibrium is that the partial molal Gibbs free energy of each substance (i), or its chemical potential (µi), be the same in every phase at equilibrium. Hence any change in an independent variable that leads to a change in µj in one phase must produce precisely the same change in µj in all phases, if equilibrium is to be maintained. In terms of the three independent variables of interest here - P, T, and Xj the total differential, dµj, in any given phase may be expressed as (1)
or, from the first and second laws of thermodynamics and the Lewisian definition of activity (aj), dµj == RTdlnc., the partial derivatives in Equation (1) may be replaced by their equivalents to yield
(2)
Burnham: H20 Solubility Models
125
where Vi and Sj are the partial molal volume and entropy of component i, respectively, and the last partial derivative gives the rate of change of µj with respect to composition. The integral of Equation (2) for i = w with respect to pressure, at constant temperature and Xwffi, yields an expression for the chemical potential of H20 in the melt (µwffih Xw relative to some unspecified reference pressures where ~ffi is known. These reference pressures were chosen at several points along isotherms on the H20 saturation surface, where the melt is in equilibrium with almost pure H20 and Gwo. the molal Gibbs free energy of H20 (Burnham et al., 1969), is known (cf. Burnham and Davis, 1974, Fig. I). One of these isotherms (1173 K) is shown in Figure I below. As a consequence of this choice, the isothermal dependence of µwffi on X wffi , the mole fraction of H20 in the melt, could be readily evaluated. Having thus obtained isothermal values for µwill as a function of P and X wffi , it became a simple matter to compare isobaric and isoplethal values at different temperatures and thereby obtain values for µwm as a function of all three independent variables, P, T, and Xwm. Although the chemical potential relationships are of fundamental importance, they are of limited utility for present purposes, because, as Xwm approaches zero, µwm approaches minus infinity. To circumvent this inconvenience, Burnham and Davis (1974) first converted chemical potentials into fugacities (f Will) through the identity
(3) and found that not only did f wm approach zero as Xwm approaches zero, as required, but that it varied essentially linearly with the square of the mol fraction (Xwm)2 up to Xwffi= 0.5. This same relationship holds, of course, if fugacities are converted into activities (awm) through the relationship
(4) where Gwoand f WO are the Gibbs free energy and fugacity of pure H20, respectively, at P and T (Burnham, 1975a, Figs. 1-5).
900 8 P 6 (kbar) 4 Figure I. The calculated saturation mol fraction of H20 (solubility) in feldspar (Ab.An.Or) and nepbeline (Ne), as well as quartz and diopside (Qz.Di), melts at900T (1173 K).
2
0 0.0
0.2
0.4
0.6
0.8
Mole fraction H20 in melt
1.0
126
Burnham: H20 Solubility Models 1.0 I
J
j)
j))
j.
j
»)
I
0.8
0.6
a
m
" Figure 2. The activity of H20 (aw m) in silicate melts as a function of the square of its mol fraction (Xw)2 and pressure (kbar) at soooe, as presented in
0.4
0.2
Burnham (1974).
0.1
0.2
0.5
0.6
This linear relationship between f Will or awffi and (XwID)2 for values of Xwm ~ 0.5, as shown in Figure 2, was not unexpected, as Hamilton et aI. (1964) found that the solubility of H20 in andesitic and basaltic melts tended to vary linearly with the square root of total pressure (Ptll2). It was thus interpreted by Burnham and Davis (1974) and Burnham (1975a,b) to indicate that up to one mol of H20 per mol of NaAlSi30S melt dissolves mainly by a dissociation-type reaction to produce two mols of products, presumably OH-. Accordingly, the activity of H20 was interpreted to obey, within the limits of experimental error on solubilities, a Henry's-Law analogue relationship for a dissociated solute (awm)p,T,xwm
SO.5
=
kwrna (XwID)2
where kw rna is a Henry's-Law
(5)
analogue constant for melts of feldspar composition.
At values of Xwffi >0.5, as shown in Figure 2, the linear relationship between awbm and (Xwm)2 no longer holds, but the constant slopes of the µwm vs. Xwm isobars at XwID > 0.5, which are independent of P (Burnham and Davis, 1974, Figs. 2-6), lead to the relationship (Burnham, 1975a): (awm)P,T,XwID > 0.5 = 0.25 kw IDaexp [(6.52 - 2667ff)(XWID Equations
- 0.5)]
(6)
(5) and (6), together with values for In kwrna from
In kwrna
= 5.00
+ ( In P)(4.481x1O-S
+ ( In P)2(1.831x1O-8
T2 - 1.5 lx lQ-4 T - 1.137)
T2 -4.882xI0'5
T + 4.656x1O-2)
+ 7.80x1O·3( In p)3 - 5.012xlO-4( In p)4 + T(4.754xlO-3 - 1.621xlO-6 T) where P and T are in units of bars and K, respectively,
(7) are all that is required
to evaluate of interest to granite petrology. Conversely, because the aqueous phase is more than 99 mol % H20 at melt saturation below 10 kbars, awID may be set to unity and Equations (5) and (6) solved
awm as a function of P,T, and XwID in feldspar melts under the conditions
127
Burnham: H20 Solubility Models
for Xwm, the saturation mol fraction of H20 in the melt (Fig. I). Graphs of In kwma as a function of In P and T are presented in Figure 3 for the 973 and 1373 K isotherms, from which it is apparent that the temperature dependence of In kwma becomes very small at pressures of 10 kbar and higher (10-5 K-l or less). 10
8 .:t!.~
.5 Figure 3. The natural logarithm of the Henrys-Law analogue constant (kwrna) for H20 in albite melts versus the natural logarithm of pressure (in bars). Curves shown are the 973 K and 1373K isotherms.
6
4
2
0 0
2
4 6 In P (bars)
8
10
Equation (7) was obtained by least-squares fit to data taken from Figure 9.2 of Burnham (1981) which, in turn, were obtained from the data embodied in Figures 8-12 of Burnham and Davis (1974). Uncertainties in the values of In kwma obtained from Equation (7), which are directly applicable only to melts of feldspar composition, range from ±O.2 at 0.5 kbar to ±O.08 at 10 kbar, based on the estimates of Burnham (1981, p. 228) for the uncertainties in the experimental H20 solubility data used (±O.03 in Xwm). In melts of other compositions Equation (7) must be modified as indicated below. In S40s (qz) melts, for example, Burnham (1981) showed that the expression for In kwma could be made applicable simply by the addition of a constant 0.47, which gives rise to the lower solubilities shown in Figure 1. Thus Equation (7) can be made applicable to qz melts simply by replacing In kwma with In kwmqz and adding 0.47 to the first term, making it 5.47. The same procedure may be adopted for melts of pyroxene composition - to a close approximation - despite the fact that the experimental data on diopside melts analyzed by Eggler and Burnham (1984) suggest a mechanism of solution which may be somewhat different from that in aluminosilicate melts. This caveat notwithstanding, application of the Gibbs-Duhem relation to the saturation values of Xwm (cf. Fig. 1) calculated on the assumption that In kwmdi= In kwmqz= In kwma + 0.47, coupled with the cryoscopic equations for diopside (Ca1.33Mg1.33Si2.670S), yield good agreement with the experimental data of Eggler and Rosenhauer (1978) on the H20saturated solidus of diopside at pressures of five kilo bars and higher. These results, coupled with those from the system Si40S-H20, suggest that the factor 0.47 arises from the interaction of H20 with the Al-containing complexes in melts of feldspar composition. Evidence in support of this correlation is forthcoming from melts which contain more than one gram atom of Al per eight gram atoms of oxygen (Dingwell et al., 1984).
128
Burnham: H20 Solubility Models
In melts of nepheline composition (Na2AI2Si20S), for example, the two Al per eight oxygens should lead to a In kwmne that is 0.47 lower than In kwma. In fact, the much higher solubilities of H20 in nepheline melts determined by Boettcher and Wyllie (1969) and by Burnham (ca. 1960, unpublished experimental results), as indicated in the calculated curves of Figure I, are fully accounted for, within experimental error, by this factor. Moreover, the dramatic lowering of the H20-saturated solidus temperature of nepheline from approximately 1800 K at atmospheric pressure to 963 K at 10 kbar, as also demonstrated by Boettcher and Wyllie (1969), can be accounted for only if the highpressure melts contain the much larger amounts of H20 indicated in Figure 1. Similarly, the H20-saturated solidus of leucite (K1.333Al1.333Si2.6670S)is lowered substantially relative to that of sanidine (KA1Si30S) at a given pressure (Goranson, 1938; Spengler, 1965), in part because In kwm1c is 0.157 lower (0.333·0.47 = 0.157) than In kwma and Xwm is therefore correspondingly greater at a given awbm, such as at saturation. The very steep negative initial slope of the leucite liquidus curve in hydrous melts of sanidine composition, however, is due also in part to a rapidly decreasing extent of speciation (incongruency) to produce lc with increasing H20 pressure. From the immediately foregoing discussions, it is apparent that to use Equations (5) and (6) for the purpose of calculating the mol fraction of H20 (Xwm) in a melt for a given awhm, it is necessary first to recast the chemical composition of the melt into mineral-like components-analogous to the CIPW norm-using the eight-oxygen mole convention (cf. Burnham, 1981a, Table 9.2; Burnham and Nekvasil, 1986, Table 3). In this context, the method proposed by Burnham (l975a,b; 1979a) for computing the "albiteequivalent" mass of melt results in variable formula weights of individual melt components and corresponding discontinuities at Xw m = 0.5, hence it cannot be used in calculations in volving application of the Gibbs-Duhem equation and, therefore, should be abandoned. Next, the appropriate kwmi is used to compute Xwmi in each melt component, as in Figure I, then these Xwmi's are weighted by the corresponding Xl.am'sand summed. The appropriate In kwmi to use in these computations is given, to a close approximation for all silicate components, by the relation In kwmi = In kwma + 0.47(1 - NAFi) (8) where In kwma, which is applicable to all three feldspar-like components, is given by Equation (7), and NAfli is the number of hydroxy-aluminate complexes per 8-oxygen mole of component i. In albite and anorthite melts, for example, N = I [NaAlO(OH)+oSi306(OH)- and CaAl203(OH)+ oSi204(OHn whereas in nepheline melts N = 2{2[NaAlO(OH)+oSi02(OH)-]}. Although the solubilities of H20 in S40s melts calculated from Equations (5) to (7) are within the uncertainty of those determined experimentally for pressures up to approximately seven kilobars, the calculated solubility curve shown in Figure I does not exhibit the marked inflection toward much higher H20 contents of the melt phase that are found experimentally as the "second critical endpoint" (complete miscibility) is approached at -10 kbar (Kennedy et al., 1962). This discrepant behavior was interpreted by Burnham (1981) to indicate that most of the excess H20 (15 to 17 wt %) is not actually dissolved in the melt. This interpretation, which implies that much of the H20 forms an emulsion with an Si40SoH20 solution, is supported by the fact that the S-L- V curve for quartz, as shown by Kennedy et al. (1962), does not exhibit a down-temperature inflection at pressures above 7 kilobars, as it must if this much additional H20 was in true melt solution and, therefore, markedly lowered aqzhm. Other silicate systems in which H20 solubilities appear to be positively temperature dependent at elevated pressures and temperatures above approximately l000"C are similarly interpreted.
Burnham: H20 Solubility Models
129
REFERENCES Boettcher AL, Wyllie PJ (1969) Phase relationships in the system NaAlSi04-Si02-H20 to 35 kilobars pressure. Am J Sci 267:875-909 Bowen NL (1928) The Evolution of the Igneous Rocks. Princeton University Press, Princeton, NJ, 332 p Bowen NL, Tuttle OF (1950) The system NaAlSi30s-H20. J Geol 58:489·511 Burnham ew (1972) The energy of explosive volcanic eruptions. Earth Mineral Sci (The Pennsylvania State University) 41 :69-70 Burnham ew (1974) NaAlSi30g-H20 solutions: a thermodynamic model for hydrous magmas. Bull Soc fr Mineral Cristallogr 97:223-230 Burnham ew (1975a) Thermodynamics of melting in experimental silicate-volatile systems. Fortscbr Mineral 52:101-118 Burnham CW (1975b) Water and magmas: A mixing model. Geochim Cosmochim Acta 39:1077·1084 Burnham ew (1979a) The importance of volatile constitutents. In: The Evolution of the Igneous Rocks, Princeton University Press, Princeton, NJ, p 1077-1084 Burnham ew (1979b) Magmas and hydrothermal fluids. In: Geochemistry of Hydrothermal Ore Deposits. John Wiley and Sons, New York, p 71·136 Burnham ew (1981) The nature of multicomponent aluminosilicate melts In: Chemistry and Geochemisry of Solutions at High Temperatures and Pressures. Pbys Chem Earth 13&14:191-227 Burnham CW (1983) Deep submarine pyroclastic eruptions, Econ Geol Monogr 5:142·148 Burnham ew (1985) Energy release in subvolcanic environments: implications for breccia formation. Econ GeoI80:1515-1522 Burnham ew (1992) Calculated melt and restite compositions of some Australian granites. Trans Royal Soc Edinburgh: Earth Sciences 83:387-397 Burnham ew (1994) Magmas and hydrothermal fluids. Geochemistry of Hydrothermal Ore Deposits, John Wiley and Sons, New York, in press Burnham ew, Davis NF (1971) The role of H20 in silicate melts: I. P-V-T relations in the system NaAlSi30g-H20 to 10 kilobars and l000T. Am J Sci 270:54-79 Burnham CW, Davis NF (1974) The role of H20 in silicate melts: II. Thermodynamic and phase relations in the system NaAlSi30g-H20 to 10 kilobars, 700T -ll00T. Am J Sci 274:902·940 Burnham ew, Holloway JR, Davis NF (1969) Thermodynamic properties of water to l0000e and 10000 bars. Geol Soc Am Spec Paper 132:1·96 Burnham ew, Jahns RH (1962) A method for determining the solubility of water in silicate melts. Am J Sci 260:721-745 Burnham ew, Nekvasil H (1986) Equilibrium properties of granitic magmas. Am Min 71:239-263 Dingwell DB, Harris DM, Scarfe eM (1984) The solubility of H20 in melts in the system Si02-Ai203Na20-K20 at 1 to 2 kbars. J GeoI92:387-395 Dingwell DB, Webb SL (1990) Relaxation in silicate melts. Eur J Min 2:427449 Eggler DH (1974) Effect of e02 on the melting of peridotite. Carnegie Inst Wash Yrbk 73:215-224 Eggler DH, Burnham ew (1984) Solution of H20 in diopside melts: a thermodynamic model. Contrib Mineral Petrol 85:58-66 Eggler DH, Rosenbauer M (1978) Carbon dioxide in silicate melts: II. Solubilities of C02 and H20 in eaMgSi206 (diopside) liquids and vapors at pressures to 40 kb. Am J Sci 287:64-94 Goranson RW (1931) The solubility of water in granite magmas. Am J Sci 22:481-582 Goranson RW (1938) Silicate-water systems: Phase equilibria in the NaAlSi30g-H20 and KaA1Si30g-H20 systems at high temperatures and pressures. Am J Sci 35A:71-91 Hamilton DL, Burnham ew, Osborn EF (1964) The solubility of water and effects of oxygen fugacity and water content on crystallization in mafic magmas. J Petrol 5:21·39 Kennedy GC, Wasserburg GJ, Heard He, Newton RC (1962) The upper three-phase region in the system Si02-H20. Am J Sci 260:501-521 Orlova GP (1962) The solubility of water in albite melts. Int'I Geol Rev 6:254-258. Spengler Cl (1965) The upper three-phase region in a portion of the system KAlSi206-Si02-H20 at water pressures from two to seven kilobars. PhD dissertation, The Pennsylvania State University, University Park, PA Stolper E (1982) The speciation of water in silicate melts. Geochim Cosmochim Acta 46:2609-2620 Tuttle OF, Bowen NL (1958) Origin of granite in the light of experimental studies in the system NaAlSi30g-KaA1Si30g-Si02-H20. Geol Soc Am Memoir 74:153 p
Chapter 4 WATER SOLUBILITY AND SPECIATION MODELS Paul F. McMillan Department of Chemistry and Biochemistry Arizona State University Tempe, Arizona 85287 USA INTRODUCTION Water is the most important magmatic volatile, both in terms of its abundance, and in its influence on melt properties and crystallization pathways. Since the general realization of its importance, in the early part of this century (Bowen, 1928; Ingerson, 1960), there have been on-going efforts to understand and quantify the extent of water incorporation in aluminosilicate liquids at high pressures and temperatures, and its effect on magma rheology and crystal-liquid phase relations. There have also been many attempts to model the nature of the water-melt interaction, and the number and types of hydrous species present in the molten aluminosilicate. These models are essential for construction of realistic thermodynamic models of water-containing magmas, and for understanding the microscopic details of water dissolution and diffusion processes. Despite extensive studies, there remain major questions to be resolved regarding the mode and even the extent of water dissolution as a function of pressure, temperature and bulk melt composition. In addition, the advent of in-situ studies at high pressures and temperatures, coupled with a better understanding of relaxation behavior in molten silicates in general, are beginning to permit a more sophisticated approach to understanding the dynamic nature of hydration processes in the high temperature liquids. The aim of the present chapter is to give a general overview of the present state of affairs in understanding water solubility, including a brief summary of current controversies in the field. It is hoped that this may help stimulate further work, especially with the design of critical experiments to help resolve these points of contention, as "water" moves further from its status of "Maxwell demon" in hydrous magmas (Bowen, 1928; Burnham, 1979), and the details of its fascinating chemistry in high temperature silicates begin to be revealed. Early work: low pressure solubility The extent and mechanism of incorporation of hydrous species in molten and glassy silicates has long been of interest in both geochemistry and the glass sciences. In several series of experiments carried out at or near room pressure, workers in the glass sciences investigated the isobaric solubility of water as a function of the partial pressure of water in the vapor phase (Tomlinson, 1956; Russell, 1957; Kurkjian and Russell 1958; Moulson and Roberts 1961; Scholze 1966; Bedford 1975; Coutures and Peraudeau 1981). These results showed that the amount of water incorporated in the glass or melt varied with the square root of the partial pressure of water vapor: (1)
This observation was used to support a water dissolution model involving dissociation of H20 into two hydroxylated species in the glass or melt:
132
McMillan: Water Solubility and Speciation Models
+ 02-
Hp (v)
(m)
2 OW
(m),
(2)
consistent with spectroscopic studies of the hydrous glasses (Adams and Douglas, 1959; Scholze et aI., 1962; Muller-Warmuth, 1965a,b; Scholze, 1966). The effect of pressure: "square root relationships" From the pioneering experimental work of Goranson (1931), it was known that the maximum water solubility in silicate magmas increases rapidly with increasing total pressure. In geochemical studies covering several decades, water solubilities have been measured in many natural and synthetic melt compositions over a wide range of pressures and temperatures (Jahns and Burnham, 1958; Tuttle and Bowen, 1958; Khitarov et aI., 1959, 1968; Khitarov, 1960; Ingerson, 1960; Burnham and Jahns, 1962; Orlova, 1962; Kennedy et aI., 1962; Friedman et aI., 1963; Hamilton et al., 1964; Ostrovskiy et al., 1964; Kadik and Lebedev, 1968; Burnham and Davis, 1971, 1974; Kadik et aI., 1972; Eggler, 1972; Hodges, 1973, 1974; Oxtoby and Hamilton, 1978a,b,c,d, 1979; Voigt et al., 1981; Day and Fenn, 1982; Dingwell et al., 1984; Hamilton and Oxtoby, 1986; McMillan et aI., 1986; Pichavant, 1987; McMillan and Holloway, 1987; Silver et aI., 1990; Pichavant et aI., 1992; Paillat et aI., 1992; Holtz et al., 1992; Blank et al., 1993; Dixon et al., 1994; Cocheo, 1994). Guided by the work on hydrous glasses at low pressure, the solubility data from such experiments at high pressure have often been plotted against the square root of the water pressure, or water fugacity, in the fluid (Hodges, 1973, 1974; Hamilton et aI., 1964; Mysen, 1977; Oxtoby and Hamilton, 1978a; Eggler and Rosenhauer, 1978). In plots of this type, linear relations between the solubility (SH,o~ual to the mole fraction or activity of hydrous species dissolved in the melt) and V ~!I'o or ) / H,O have been taken to support the heterogeneous equilibrium (2), involving dissociation of the H20 species, as the water dissolution mechanism at high pressure (Burnham and Davis, 1974; Bedford, 1975; Rosenhauer and Eggler, 1975; Mysen, 1977; Eggler and Burnham, 1984) (Fig. I). However, a linear relation between SH,O and ) / H,O should not in fact be obtained in such high pressure solubility experiments, even if the dissolution did occur via Reaction (2) (Goranson, 1937; Wasserburg, 1957; Stolper, 1982a; McMillan and Holloway, 1987). Unlike the atmospheric pressure data, the high pressure solubility measurements are not isobaric, but instead represent polybaric points on the water saturation surface. Any equilibrium expression for the water dissolution reaction along the saturation boundary must then contain a pressure dependent exponential term, involving the change in partial molar volumes of the reacting species ( Av-reacrion L},
=
V-
hydrous melt -
V-
dry melt -
-V)· H20
I"V-'O"dP .
e
RT
(Wasserburg, 1957; Stolper, 1982a; McMillan and Holloway, 1987). Although most synthetic and natural aluminosilicate melts studied to date do not show any simple linear relation between SH 0 and ~/H 0 above approximately 500 bars pressure (Oxtoby and Hamilton, 1978a; McMillan ana Holloway, 1987), as expected, linear "square root" relationships have in fact been found for particular (unrelated) aluminosilicate melt compositions, at least up to several (6-8) kbar pressure (Hamilton et al., 1964; McMillan et al., 1986; McMillan and Holloway, 1987) (Fig. 1). From the previous discussion, observation of such a linear relation in these poly baric saturation experiments does not give any direct information on the speciation associated with the water dissolution reaction, but indicates that some cancellation of terms in the
133
McMillan: Water Solubility and Speciation Models
o •
CAS CRB
-..... III
..c
100
c:
o ~: .. 50
_1
o
5
10
mole%
15
20
H20
kbar
Figure 1. Plots of square root of water fugacity in fluid versus molar water solubility for selected melt compositions (water mole fractions calculated on a one-oxygen molar basis for the dry melt: see McMillan and Holloway, 1987). Note that Columbia River basalt (CRB: Hamilton et al., 1964) and a calcium aluminosilicate melt composition (CAS: McMillan et aI., 1986) show linear root fugacitywater solubility relations, whereas compositions such as albite (Ab), orthoclase (Or) and nepheline (Ne) (Oxtoby and Hamilton, 1978a) do not.
thermodynamic expression for the dissolution reaction has occurred. In fact, if the mechansim for the dissolution reaction were known, along with an equation of state for the dry melt, the the variation of SH,O with ~fH 0 would provide valuable information on the reaction volume, and the molar volume of the hydrous melt, at high pressure and temperature. In their plots of water solubility versus ~PH,O or ~fH 0' Hodges (1974) and Oxtoby and Hamilton (1978a) considered that their data represented linear regions separated by breaks in slope, indicative of changes in the water solubility mechanism at particular pressures or water contents. However, these solubility data could be equally well represented by continuous solubility curves. Such continuous changes in slope of water solubility relations would be expected due to variations in the partial molar volumes of the aqueous fluid or the hydrous melt species with pressure, and need not reflect any changes in the water dissolution mechanism. Burnham's
model for water dissolution
Burnham and Davis (1971, 1974) used the results of P-V-T measurements on two compositions in the albite-water system to construct isobaric sections relating a~u~ and the mole fraction of water dissolved in the melt, x~e~. This work is summari~ed in Chapter 3 of this volume. The results suggested a linear relationship between water activity and the square of the mole fraction of dissolved water (x~e~) for < 0.5, with positive deviations from this relation occurring at higher water contents. These observations were used to construct a model for water dissolution in albitic melts. For x~e~ < 0.5, it was proposed that the molecular H20 component dissociated by exchanging one hydrogen with the Na+ charge-balancing the aluminosilicate network:
X~:~
(3)
Although this reaction as written does not necessarily imply any breakage of TOT (T = Si, Al) linkages in the melt (Kohn et al., 1989b, 1992), the cartoon used to depict the
134
McMillan: Water Solubility and Speciation Models
LEGEND
O
OZ-(Silicate)
Q OZ-(HZO)
o
Na+
Figure 2. Cartoon depicting water dissolution mechanism in albite (NaAlSi30S) melt, proposed by Burnham (1975). The figure shows an H20 molecule (happy face) reacting with the NaAlSi30S unit, breaking a TOT linkage, and exchanging Na+ with H+. The first step corresponds to the reaction NaAlSi30S + H20 ~ AISi307(OH) + NaOH. The TOT (T = AI, Si) linkage is broken, and the chargebalancing Na+ is exchanged by H+. The second step occurs at higher water content and corresponds to the reaction AISi307(OH) + nH20 ~ AISi3D7_n(OH)2n+l in which the remaining TOT linkages are hydrolyzed. Redrawn from Burnham (1975).
reaction by Burnham (1975a, 1979) does involve rupture of intertetrahedrallinkages (Fig. 2). At higher H20 contents, with > 0.5, there is no Na+ available for such exchange reactions, and the TOT linkages are hydrolyzed:
X~:~
ALSiP, (OH)
+ nHp
AIS~07_n(OH)2n+l
(4)
(Burnham, 1974, 1975a,b, 1979, 1981; Eggler and Burnham, 1984). In these models for water dissolution, no molecular water was presumed to be present as a species dissolved in the melt. Molecular water as a dissolving species Early infrared spectroscopic studies had in fact indicated the presence of molecular (i.e., undissociated) H20 as a dissolving species in hydrous silicate glasses (Keller and Pickett, 1954; Orlova, 1962; Ostrovskiy et al., 1964; Scholze, 1966). In addition, the presence of substantial amounts of molecular water in high pressure aluminosilicate melts was suggested from solubility measurements and theoretical considerations (Wasserburg, 1957; Shaw, 1964; Hodges, 1973, 1974; Mysen, 1977; Eggler and Rosenhauer, 1978). This is now supported by many modern infrared and NMR studies on high water content glasses (Ernsberger, 1977; Bartholomew et al., 1980; Bartholomew and Schreurs, 1980; Wu, 1980; Takata et al., 1981; Stolper, 1982a,b, 1989; McMillan and Remmele, 1986; Newman et al., 1986; Farnan et aI., 1987; Eckert et al., 1987, 1988; Silver and Stolper, 1989; Kohn et al., 1989a,b, 1992; Silver et aI., 1990; Kummerlen et al., 1992). Mysen et al. (1980) had suggested from Raman spectroscopic results that no molecular H20 was
McMillan: Water Solubility and Speciation Models
135
present in hydrous albite glasses, based on the absence of the HOH bending band near 1600 cm-1. However, McMillan et al. (1983) showed that this band is in fact present in hydrous albite glass samples, although its Raman intensity is low. This assignment was accepted in subsequent Raman spectroscopic studies of hydrous glasses (Mysen and Virgo, 1985, 1986a,b). Stolper (1982a,b) carried out systematic quantitative infra-red absorption studies of water incorporation in a range of natural and synthetic aluminosilicate glasses, and demonstrated the presence of molecular water species at high water contents (Fig. 3). At water contents below approximately 1 wt %, a dissolution mechanism involving only hydroxyl (-OH) groups is a good approximation, consistent with previous studies of glasses prepared at or near room pressure (Scholze, 1966; Coutures and Peraudeau, 1981). However, for higher water contents corresponding to solubilities at higher pressure, both hydroxyl and molecular H20 groups were found to be present in the hydrous glasses, and the ratio of molecular water to hydroxyl groups increased rapidly with increasing water content (Fig. 3). By carrying out infrared experiments at liquid nitrogen temperature, where any bulk liqud water would be frozen to crystalline ice, Stolper (1982b) showed that the molecular H20 was not simply present as submicroscopic bubbles of trapped fluid, but should be considered as a true dissolved species in the melt. This near-infrared absorption technique has now been fully calibrated for routine quantitative analyses of hydrous species in aluminosilicate glass (Newman et al., 1986), has been extended to a wide range of natural and synthetic compositions (Silver and Stolper, 1989; Silver et al., 1990; Blank et al., 1993; Dixon et al., 1994), and has been applied to study speciation in water diffusion studies (Stanton et al., 1985; Stanton, 1989; Zhang and Stolper, 1991; Zhang et al., 1991). Based on their findings, Stolper (1982a,b) and Silver and Stolper (1985) proposed a thermodynamic model for water dissolution in aluminosilicate melts, involving both hydroxyl (OH) and molecular H20 in the dissolution mechanism. Reaction (2) above becomes a homogeneous equlibrium:
Hp
(m)
+ 02-
(m)
2 OW
(m)
(5)
with an equilibrium constant Kj , and is preceded by a heterogeneous dissolution of molecular water in the melt:
Hp
(ft)
~
Hp
(m),
(6)
with equilibrium constant K2. The regular solution model derived from these observations and its application to hydrous aluminosilicate melts is discussed in detail by Silver and Stolper (1985) and Silver et al. (1990), and in Chapter 6 of this volume. This mechanism for water incorporation, involving both hydroxyl groups and undissociated molecular water, is more consistent with the spectroscopic data for hydrous glasses than is the speciation model proposed by Burnham (Burnham and Davis, 1971, 1974; Burnham, 1974, 1975a,b). However, Stolper (1982a) has compared the activitycomposition relations for hydrous albitic melts calculated by both methods, and found a close correspondence between the two. If this observation can be extended to other cases of geologic interest, it would be extremely useful. .The actiyity-comFosition relation derived by Burnham is algebraically very simple (a~:~=(X~:~)for X~'~< 0.5), and has now been incorporated into an extensive thermodynamic data base and model for phase behavior in multicomponent systems (Burnham, 1981; Burnham and Nevkasil, 1986). If
136
McMillan: Water Solubility and Speciation Models
it does provide a useful working approximation to the true activity-composition relations of hydrous melts, there is no reason to abandon the simple Burnham form for the more accurate Stolper-Silver relations, unless the simpler form breaks down. The range of validity of the simple Burnham activity-composition relation should continue to be tested, for practical applications in igneous petrology.
(8)
tot~1 w~trr
12~
mclecular
HlP (H-O-HI
(H-O-H) ~nd X-OH
~
~
.,
hydroxyl groups
(X-OHI
~
08
u
c:
'"
, r'Y' ~
H10
700°C at pressures up to 4 kbar and>900°C at 10 kbar (Joyce and Holloway, 1993). In the calculations presented here it is assumed that the fluid species mix ideally. Fluid speciation calculations Calculation of fluid speciation in the two component C-O system at magmatic temperatures is relatively straightforward. A maximum of two phases exist, graphite and fluid. According to the phase rule, the variance is either zero or one at fixed P and T, depending on whether the system is graphite saturated. Graphite-saturated fluids are invariant at fixed P and T, and consequently both the CO/C02 ratio and f02 are known. Graphite under-saturated fluids. are univariant at constant P and T, and knowledge of either the CO/COz ratio or the f02 completely defmes the system. Calculation of the abundance of fluid species in the 3-component C-O-H system is somewhat more involved. This system can also have a maximum of two phases, graphite and fluid. At fixed P and T, graphite-saturated fluids are univariant, and graphite undersaturated fluids are divariant. Specifying the f02 in graphite-saturated fluids fixes the fluid composition and vice versa. Equilibrium calculations have been conducted using either an equilibrium constant approach (French, 1966; Frost, 1979; Holloway, 1987) or a global free-energy minimization (Dayhoff et al., 1967; Gordon and McBride, 1971; Holloway and Reese, 1974). The former approach involves fixing carbon activity, either at unity by imposing graphite saturation, or at values less than one for graphite-undersaturated fluids; in either scenario, the oxygen fugacity is fixed. Figure 1 illustrates typical results. The fluid compositions (in terms of atomic C, 0, and H) saturated in graphite form the "graphite saturation surface", indicated by the heavy curve (Fig. 1). Calculations using the free energy minimization technique are well-suited for determining fluid species concentration as a function of P and T for a fixed atomic composition of the system. Fixing the atomic composition of a system at constant P and T completely specifies the concentration of equilibrium species and f02. Free energy minimization programs are also well adapted for calculating minor and trace species concentrations. Examples of the results of such calculation are given in Table 2. Note the low concentrations of species other than C02 ' CO, CH4, H2, H20 at magmatic conditions. Implications
for experiments
Oxidizing conditions: The H20-C02 join. Nearly-binary H20-C02 fluids are stable over a wide range of f02 (Fig. 2). The conditions range from unrealistically high values of f02 (more than several log units above the Ni-NiO (NNO) buffer) to values more typical of magmatic systems (-0-1 log unit below NNO). However, many high pressure phase equilibria and volatile solubility experiments are subject to loss or gain of H2 due to its rapid hydrogen diffusion through capsule walls and its ubiquitous presence in pressure vessels. The consequences of such diffusive flux can be seen for a fictive composition "B", chosen to lie at the intersection of the C-H20 join with a segment connecting H2 to the midpoint of the C02-H20 join (Fig. 1). Loss of H2 from a fluid initially at point B will result in decreased H20 activity and oxidation, as well as decreased Fe3+/Fe2+ in ironbearing melts. Gain of H2 will result in reduction, decreased C02 activity, and increased CO and/or Cf4 activities in the fluid phase. This is illustrated in Figure 2, which shows
192
Holloway & Blank: Experimental Results Applied to C-O-H in Natural Melts
Table 2. Relative abundances of major and minor gas species calculated for "Composition B" at 10 kbars and 1400°C as denoted in Figure 2.
C B A 0.6 r--,--,.---,--,.---.-..--r--,
. ~. \
i\
0.4 Species
Mole Fraction
H20 H2 CH4 CO C02 C2H4 CH20 CH3 HCO C2H2
I
0.56780 0.17994 0.11296 0.08197
0.OS498 0.00141 0.00089 0.00004 0.00001 0.00001
I Calculated as described by Holloway
and Reese (1974).
...
Mole Fraction 0.3
f
0.2f-
NNO I
QFM
0.1 0.01 -2
t_.,:;;It_"":: __
-I
012
'
_-I
3
I
'S:.l 4
5
Figure 2. Binary plot of fluid compositions along the line segment A-C in Figure I illustrating the change in fluid composition as a function of f02 (relative to NNO), which increases moving from point A (near the H apex) to point C (the 1:1 H20:C02 composition). The vertical line shows the fluid composition at point B on the CH20 join in Figure l. Note that fluids more oxidizing than NNO-O.5 (equivalent to QFM) are essentially pure H20 + C02. NNO f02 values are from O'Neill (1987).
how speciation of fluid with initial composition at B will change with H2 loss or addition, along the dashed (hydrogen reaction) line A-B-C in Figure 1. Although H2 loss through a capsules wall is very common in a range of experiments, H2 gain occurs frequently in COz-rich experiments and causes formation of H20. H2 gain can also facilitate loss of iron into the capsule wall in iron-bearing melts as a result of a lowered f02 (although the loss of iron causes a small increase in Fe203 which will partially offset the H2 gain; Holloway et al., 1992). Successful execution of experiments to measure solubilities of "pure" COz or H20 fluids, or of C02 and H20 fluid mixtures must be done at oxygen fugacities greater than -NNO-O.S to avoid the presence of significant amounts of reduced species. As seen in Figure 2, the relative concentrations of H20 in the fluid is less sensitive to change in f02 than is C02.
Reducing conditions: Limits on CO, H2, and CH4. Experimental measurement of CO and CH4 solubility is impeded by their partial decomposition at magmatic conditions. CO reaches maximum concentrations in the C-O system at high T and low P when the fluid is saturated with graphite. As shown in Figure 3, the CO/C02 ratio in the fluid declines rapidly with increasing P. High methane concentrations are found only in strongly-reducing fluids in which H20 is often present in significant amounts, hindering separation of methane solubility from that of the highly soluble H20. However, the limited available data for the solubility of Cf4 in basaltic melt in equilibrium with methane-rich fluids suggest very low methane solubilities (Holloway and Jakobsson, 1986). In contrast, Taylor and Green (1988) conducted peridotite melting experiments in the presence of reduced C-O-H fluids and suggested that methane was significantly soluble on the basis of solidus temperatures.
Holloway & Blank: Experimental Results Applied
to
C-O-H in Natural Melts
193
1.0,---...,-----,---r---,----, Graphite-Saturated Fluid Compositions in the c-o System
J(!uid co
Figure 3. Graphite-saturated fluid compositions in the c-o system as a function of P and T. The mole fraction of CO in the fluid X~is shown (similarly, the mole fraction of C02 in the fluid = X~~ I - X~d). Numbers next to solid circles are log f02 values relative to NNO (O'Neill, 1987).
=
0.2,
...
-
-1.7
2
6 P (kbar)
4
900°C 8
10
There are no thermodynamic limitations to the generation of fluids with very high hydrogen concentrations, but such fluids would be extremely reducing (Fig. 2). Very strongly reducing conditions reduce the silicon in Si02 to metal. For this reason the solubility of H2 in silicate melts is unknown. However, it seems probable that H2 solubility is at least as great as that of argon, which has solubility similar to that of COz in silica-rich melts (White et al., 1989; Carroll and Stolper, 1993; see Chapter 7). Graphite-Hat) experiments. Use of graphite capsule-liners in high-pressure melting experiments is common but care must be taken in such experiments to control the volatile species activities. Some attempts have been made to add H20 to such experiments either as water or a hydrous mineral in the starting material. It is important to note that in this case the volatiles will include all components of the C-O-H system and that if hydrogen or oxygen fugacities are not controlled carefully there can be a significant decrease in the amount of water present in the experimental capsule both through diffusive loss of hydrogen and/or reaction of H20 with graphite to produce COz; such effects are discussed in detail by Holloway et al. (1992). PRACTICAL
CALCULATION OF H20 SOLUBILITY IN ROCK MELTS
Experimentally-determined equilibrium volatile solubility curves provide information useful for interpretation of measured volatile contents of erupted silicate glasses. Water solubilities in rock composition melts can be done via two distinct methods which we will refer to as the Burnham or the Stolper models. The approach outlined in the Stolper model requires fitting of thermodynamic parameters to available solubility data for individual rock compositions. The result is an accurate fit to the data, but the Stolper model does not allow direct calculation of H20 solubilities of compositions other than those whose volatile solubility data sets have been considered. In contrast, the Burnham model is not fit to a specific data set for a natural melt compositions but can be used to calculate H20 solubility in virtually any silicate melt composition. A fundamental difference between the two models is that the Burnham model is based principally on direct P-V-T measurements on hydrous albitic melts, thus allowing direct estimation of the partial molar volume of H20 in melts. Burnham and Davis (1974) found a convincing change in the partial molar volume of H20 in albitic melt with pressure and temperature, whereas the Stolper model, in contrast, assumes a constant molar volume which is independent of P and T. These
194
Holloway & Blank: Experimental Results Applied to C-O-H in Natural Melts
differences are not important in calculating solubilities, but are of considerable importance in calculating melt densities as discussed in Chapter 9 of this volume. The Stolper model as usually applied is not as versatile as the Burnham model, but is likely to be more accurate for the compositions to which it has been applied, particularly as it is based on a wider range of experimental water solubility data and on direct physical measurements of the hydrous species in glasses quenched from high temperature melts. In principle, the Stolper model can be expanded to encompass compositional variations (Silver and Stolper, 1989) but this remains to be done. The Burnham model Calculation of H20 solubility using the Burnham model involves recasting the melt composition of interest in terms of 8-oxygen normative components, as discussed in Chapter 3 and as illustrated in the Appendix to this chapter. Given a melt composition and a choice of P and T, the Burnham model requires calculation of a value of In kwma, which is a Henry's-Law analog constant for melts of feldspar composition; this calculated In kwma value is then adjusted to account for the effects of non-feldspar components on water solubility. The general sequence of steps can be summarized as follows (see also Appendix and Chapter 3): 1. Use the following equation (Eqn. 7, Chapter 3) to calculate In kwma for a chosen P (kbar) and XT (hundreds of Kelvins). In kwma = S.OO + (In P)(4.481xlO-8 XT2 - I.S l x 10-4 XT - 1.137) + (In P)2(1.831xlO-8 xT2 -4.882xlO-5 XT + 4.6S6xlO-2) + 7.80xlO-3(ln p)3 - 5.012xlO-4(ln p)4 + XT(4.7S4xlO-3 - 1.621xl0-6 XT)
(4)
2. Use the following expression (a generalized form of Eqn. 8 from Chapter 3) to calculate In kwrock meltfor the melt composition of interest: In kwrock melt = In kwma + 0.47·(1 - {(Xab+Xor+Xan) - 2· Xne }
(5)
where the mole fractions (Xi) are of eight-oxygen normative components in the melt composition in question. 3. Find Xwm from the equations below which are obtained from (Eqns. Sand 6 in Chapter 3): 1/2
a
X wll'l
X
-
(6a)
W
[ k:ockmell
=05+1n[
~.
]
aw
]~[6.S2-2667J
Q~*~·~/I
(6b)
T
where aw = the activity of H20 in the system and T is in Kelvins. If Xwm>O.S as calculated by Equation (6a), then re-calculate a value using Equation (6b). 4. Convert the mole fraction of H20 to wt % H20 with the following algorithm: wt% melt = [ H20
18.02· Xmm w 18.02·Xm m +CI-Xm m )·FW. w
w
1
(7)
eight
where FWeight is the 8-oxygen formula weight (glmol) of the volatile-free melt, Xm is the mole fraction of H20 in the melt (also calculated on a 8-oxygen basis, and 18.0.5. If X::;'>0.5 then use Equation (6b) to calculate X::;'. In this example, X::;'= (1.017.2914) 0.5 = 0.3703. 5. Use Equation (7) to calculate the solubility in wt % H20 (from Table 3, FW8 = 261): 18.02 (0.3703) wt % H20 = 100 x . ~ ~~ ,~~-~~, '" ~ ~-~~,~-.
= 3.90
196
Holloway & Blank: Experimental Results Applied to C-O-H in Natural Melts
Figure 4. Comparison of the Burnham model predictions with experimentally-determined H20 solubilities in albitic melts. Symbols represent the following data: filled squares (Burnham and Jahns, 1962); filled circles (Hamilton. 1987) except the two points at 1400°C from (Paillat et al.• 1992). Data points falling far from the normal trend are labeled to indicate pressure in kbar. Solid lines were calculated with the Burnham model as described in the text. Dashed lines are least-squares fits to the data of Hamilton et al. (1964) at 2 and 4 kbar.
The accuracy of the Burnham model can be evaluated by using it to calculate H20 solubility in melt compositions for which experimental measurements of H20 solubility exist (Fig. 4). As described in Chapter 3 of this volume. the model is based on, and strongly influenced by, the P-V-T measurements of hydrous albitic melts (Burnham and Davis, 1971; 1974). Of the data shown. only those of Burnham and Jahns (1962) were available at the time the albite model was formulated. Precise and accurate measurements of H20 solubility are difficult, especially at high H20 concentrations. and different studies may yield differences of 10 to 20% or more for nominally the same experimental conditions (e.g., McMillan and Holloway, 1987; see also Chapter 4). Comparison of measured water solubilities in albitic melt from a variety of sources and the predictions of the Burnham model shows that in general the model is in reasonable agreement with experimental findings. Application of Burnham's model to natural melts requires use of Equation (4) to account for the effect of bulk composition on solubility. Figure S shows water solubility data for several natural and haplo- rock compositions, and the calculated solubilities based on the Burnham model. In some cases the model underestimates the experimental data, especially at higher pressures, whereas for silicic and basaltic magmas it overestimates the data. The model most nearly approximates the silicic compositions (compare model with granite minimum composition EA1.2K in Figure SA, high-silica rhyolite composition in Fig. SB), while it is not nearly as accurate for andesitic compositions (Fig. SC). The fit to experimental data for basaltic compositions is not as good as for rhyolitic melt at low pressure. The recent measurements on basaltic and rhyolitic compositions (Figs. SB and SD) are based on infrared measurements which have high precision at these relatively low H20 concentrations. There is clearly need for improvement in the modeling of compositional effects, and for additional highly accurate experimental solubilities on rock compositions. A summary of calculated H20 solubilities for a wide range of rock compositions is shown in Figure 6 where the solubility is presented as the difference relative to albitic melt. An issue of importance to volcanic degassing calculations is the effect of temperature on H20 solubility at low pressures. The Burnham model predicts a moderate decrease in solubility with increasing temperature, and this is in agreement with the results of experimental studies on albitic (Fig. 4) and haplogranitic (Fig. 7) melts. However, there
Holloway & Blank: Experimental Results Applied to C-O-H in Natural Melts
197
have been no systematic studies of H20 solubility as a function of temperature at pressures below 2 kbar, a pressure range important to volcanic degassing.
:
I
5
I
• •
Phonolite 850-900°C
~
..,...•V_".
5 tWt% 4 H2O 3
I
~.
t
~
4
~
3
I
850°C
..··iI
•
,
EAI.2K
2~
(Granite Min.) 800°C
/
-
High-Silica Rhyolite
2 t- " r--
o
l
0
121 lOt-
I
I
I
500
1000
1500
I
I
I
I
or
2000 I
I
0
I
I
500
1000
I
I
IB 1500
4.0
•
- ~
•
,..,. ... ,L."""'.-:
8
I
lI00°C
IAI
3.0
Wt% H20 6 4 2
o
Columbia River Basalt
r/
r
0
r-v-r-
I
I
I
2
I
I
3 4 P (bars)
I
,Iel
5
6
7
0.0' 0
500
1000 P (bars)
ID 150C
Figure 5. Comparison of measured H20 solubilities as a function of pressure with those predicted using the Burnham model. (A) phonolite (Carrolland Blank, 1994)and a granite minimummelt (Dingwell et al., 1984). (B) Rhyolite data (Silver et al., 1989) at 850°C (only rapid-quench data are shown). (C) Columbia River tholeiitic basalt and Mount Hood andesite(Hamiltonet al., 1964). (D) Mid-oceanridge basalt (Dixon et al., 1994) and basanite (composition in Table 3; Cocheo and Holloway, 1993). The Stolper model A thermodynamic model for H20 solubility in silicate melts was developed by Stolper and coworkers to account for the presence of both hydroxyl (OH) and molecular H20 groups in aluminosilicate glasses. The model has been applied to results of quantitative infrared spectroscopy measurements (Chapters 2 and 4), and it provides activitycomposition relations and solubility parameters specific to a given melt composition. In applying the model it was assumed initially that the concentrations of OH and H20 species measured in quenched glasses are representative of those dissolved in the silicate melts at high temperature. It is now realized that H20 speciation may be affected to varying degrees (depending on the total water content in the melt) during quenching; Zhang et al. (1991) derived an algorithm to correct for these changes in speciation, although the issue of speciation itself is one of some debate (see Chapter 4).
Although earlier qualitative observations of molecular H20 and hydroxyl species in silicate glasses had been made (see summary in Chapter 3), Stolper (1982a,b) provided the
198
& Blank: Experimental Results Applied to C-O-H in Natural Melts
Holloway
0.0 .------r----,---,----, .~~ . - . _ ~ Phon (900°C)
.~. ~\
.-.-.-
..
Dac
~'~ ~.t.,
-0.5
Rhy (850°C)
~ ,~'~ -,,"I And(l?50°C)
----~i-.'.
L1Wt% H20
(Rock-Albite)
Basan;'~ (l200°C) /' .... :,........... AlkBas __ (l200°C) /" ,'"
-1.0
MORB
-1.5
2 kbars
•
(900°C) .- . -
(l200°C) L-_---' __
o
500
-L __
1000 P (bars)
4
-~.-
2 ,
Haplogranite Minimum Melt Composition
•
.......
.............. --"-_""--'
1500
OL-~~_L-~~_L_~~
2000
750
850
950
1050
1150
T (0C)
Figure 6 (left). Calculated H20 solubilities using the Burnham model for a range of melt compositions compared to H20 solubility in albitic melt. Figure 7 (right). An example of the H20 solubility:effect of temperature on H20 solubility in silicate melts, ilustrating, for the haplogranite-water system at 2 kbar, the gradual decrease from 6 to -S.4 wt % water as the temperature increases by 400°C from 7S0° to IIS0°C. H20 solubility data for a haplogranite minimum melt composition from Holtz et al. (1992). The water solubility curve calculated using Burnham's model is included for comparison. first quantitative determinations of species concentrations as a function of the total dissolved H20 concentration. He proposed a thermodynamic model based on ideal mixing of 0, OH and molecular H20 which provided an adequate fit to the data available at that time. Silver and Stolper (198S) expanded on the original ideal mixing model by incorporating temperature effects on solubility and speciation, and they showed that the model provided a reasonable fit to H20-saturated melting experiments for albite, diopside and silica compositions at low to moderate pressures; at P > -8 kbar the model significantly underestimated solubilities. The ideal mixing model was superseded by the introduction of three more complex models (Silver and Stolper, 1989), primarily because the ideal mixing model could not fit newly obtained speciation data for high total H20 contents. Silver and Stolper showed that any of the three models could provide a good fit to all available speciation data for albitic glasses, but they preferred the regular solution model due to its relative simplicity, although they noted that the model with several distinguishable types of 0 and OH sites could potentially be developed into a general model to describe the effects of melt composition on water solubility. The regular solution model is explained in detail in Silver and Stolper (1989) and Stolper (1989), and it has been used to model water solubility and speciation in rhyolitic (Silver et aI., 1990; Blank et al., 1993b) and basaltic compositions (Dixon et aI., in press). The model describes the homogeneous equilibrium between dissolved molecular water, hydroxyl groups, and melt oxygen species H20 (melt) and can be reduced
=
0 (melt) + 2 OH(melt)
to the following
expression,
with the empirical parameters H2().speciation data:
C' derived from fitting of spectroscopically-measured
A', B', and
Holloway & Blank: Experimental Results Applied ••
8~
--
0
s
C-O-H in Natural Melts
199
MORB Glass Model (MORB) I
0
o [J Albitic Glass
::r:
-0
to
6
0
£ ~
4
::I 0
.!l
~ ~ ~
-rlJI6l-
2
2
-In( (
_Q - -
Figure 8. Comparison of measured and calculated H20 speciation in albitic and basaltic glasses from quenched melts. Curves are best fits to the measured infrared spectroscopic data for OH and molecular H20 using Equations (8) and (10) with data and model parameters from Table 4. Modified after Dixon et al. (in press).
[J
4 6 8 Wt% Total H2O
10
(X;Hr m xmH,o,mo/)( 1X
OH - XZ,o.mo/)
1=
A' + B
xm
(8)
m
OH + C XH,O.mo/
The fit of this model to water speciation in albitic and basaltic glasses quenched from high temperature melts is shown in Figure 8. Equation (8) allows evaluation of the homogeneous equilibrium between different hydrous species in water-bearing quenched melts. but in order to calculate water solubilities as a function of P and T it is necessary to consider the heterogeneous equilibrium between melt and coexisting aqueous fluid phase. This can be expressed by the reaction H20 (fluid) = H20 (melt)
(9)
In the Stolper model, molecular H20 is the species used to evaluate thermodynamic activity-composition relations. The dependence of the activity of molecular H20 in fluidsaturated melt on total pressure and H20 fugacity and temperature is given by the following expression for the equilibrium in Equation (9) (Silver and Stolper. 1985; 1989): m om XH20(P,T)=Xlio(Po,To)
2
°/H20(P,TJ /
H20(Po.TO)
exp
l-vru;'h(P-Po)
T 1lH7f2o(T,Po)
+ J
RTo
T
P
o
2
RT
1
dT (10)
where XZ O(P.T) is the activity of water in the melt at pressure (bars) and temperature T (OK); X;;~(Po.To) is the activity of water in the melt in equilibrium with pure aqueous fluid at the reference pressure (Po) and temperature (To); /H O(P.T) is the fugacity of H20 in the coexisting fluid and /~ O(Po.To) is the fugacity of pure fho in the fluid at the Po and To ; R is the gas constant (chosen to agree with the units used for P and V, e.g., 83.14 bar cm3 mol-l K-l); v~·;ois the molar volume of water in the melt in its standard state. and is assumed to be a constant and equal to the partial molar volume of water in the melt; and 1lH~ O(T.Po) is the heat of solution of a mole of H20 in the melt and has only been dete~ined in the case of albite melt (Silver and Stolper, 1985). In most cases. Equation (10) is applied to isothermal data, and the enthalpy term omitted. The partial molar volume of H20 in the melt is usually assumed independent of P and H20 concentration. the exception is again albite (Silver and Stolper, 1989).
200
Holloway & Blank: Experimental
Results Applied to C-O-H in Natural Melts
Application of Equation (10) to experimental data assumes that molecular water in the melt obeys Henry's law; i.e., (11)
Validity of the Henrian approximation can be tested by plotting water fugacity against the mole fraction of molecular water in glasses quenched from melts equilibrated with fluid at constant total pressure. The variation in water fugacity at constant total pressure is achieved by varying the composition of the fluid (Blank et al., 1993b; Dixon et al., in press). An example is shown in Figure 9A. In this case, the volume-dependent term drops out of Equation (10) and activity is directly proportional to fugacity, so if the concentration of molecular water is proportional to water fugacity, it must also be proportional to activity. 0.04
2.26
-- -.-
~
I
pure H20 vapor mixedC~-H20vapor
/,6
0
003~
.d
.
0
ON 0.02
F -
_.-0....
pure H2
°
mixed CO2-H20
•
(1200°C) mixed CO2-H20 vapor
g .'
!_.~"o
tJ.tJ.
, 200
0.4
f
0
e£ >< ~
3.41 ~
::r:
0.2 0.0
B 0.2
0 a
0.4
0.6
0.8
liz ° = fHz0
I f~o"
Xitzo
0
2)·-6
io
"S
2.26 -;:;,
g
0.021- •
V
0.6
'"'0
.,::1""!
0.00 0
0
Q..'
0$"
0.04
0
.e£ >< ....
4.59
.0 ••••
8.·.0 0
ooot
0.8
tJ. 0
vapor
(850°C)
eeQ >
145!aM' Oil
r: 1;:f1Je.
C\I
C\I
(")
§
v (D
It)
5.13
§~~.~
T"'"
(D
'f:
5", -5'0 ","".>II =::cK So! ~~~l:
~~
T"'"
iuaorad
0 ~
C>
(5
145!aM '.oa:l
.'"
~o
(D
0
It)
0:1:_
~.8 ~
"0
~
:::;
~ e=
o
iuaorad
C>
""
~~ o
m cr: 0
~o
o
:::;
Q)
_
l0:l:
QJ
,-O{,l}....,J
~_
.~~ ~= e'~?:>
Ng"'''O O._ ~._
V5-!3 .!l ~.... ~"':tc~ .., _._
~860.~ec
~
"d'
v
(!l
~
~
'"
8.B
(D
(D
~~
~
I{)
v
~
0
CD
(\J.....,.....
(D
d
IUaOJa
~
C\I
0
T"'"
T"'"
T"'"
5
14 laM
.c ~
CD
0 I 'It
(D
~
'"
0 l.
c ..,.0
'B ==!Hit;: =
':;1.0;9
'0>
:=c..,
!!s"'''O ",,~ ~ ~. ~e 8. c Kg Qj
N-;J11.)1l)
1'!~l,.>II._ ~,o N
:t
Johnson, Anderson, Rutherford: Pre-eruptive Volatiles in Magmas
289
submarine Kilauean basalt (Clague et aI., in press); some of these fragments have -15 wt % MgO, and are considered close in composition to Kilauean parental magma. Such glasses contain -0.4 wt % H20 (Fig. 3) which, if crystallized in a closed system free of gas, would yield basaltic liquids with 7 wt % MgO and -0.55 wt % H20, similar to the results of Moore (1965) and Dixon et al. (1991).
1.2
-;f!, 0
~
+
1.0
+
+
+
0.8 0.6
+
0
o~ ~ •++
(k .:
-" ,f.:~~",.
IN 0.4
x.. •
It·x o~ + "00
0.2 0.0 0.0
\
++,f!-~
0.2
0.4
+ ,.,+ +
•
0.6
I
I
~
0
+
Moore
A&B
Clague Dixon
0.8
1.0
Figure 3. H20 and K20 contents of Kilauean basaltic glasses and glassy basalts. The data plotted include glass on rims of submarine basalts (circles; Dixon et aI., 1991), grains of glass from turbidite (crosses; Clague et al., in press), glassy submarine basalts (squares; Moore, 1965), and glass inclusions in olivine phenocrysts from the 1959 Kilauea Iki eruption (+; Anderson and Brown, 1993).
K20 (wt. %) Glass inclusions in olivine phenocrysts from the 1959 Kilauean eruption of picritic basalt have been analyzed using four different methods. (1) Anderson and Brown (1993) using FTIR spectroscopy reported a range from 0.24 to 1.1 wt % H20. (2) Anderson's (1974 a, b) summation deficit for an inclusion from this eruption is consistent with less than -0.5 wt % H20, a result at the detection limit for this technique. (3) Harris and Anderson (1983) using a tedious but simple manometric approach reported 0.2 wt % H20. This result is at the low end of the spectroscopic data (Anderson and Brown, 1993) and may reflect analytical bias combined with H20 loss during pre-analysis drying in vacuum as observed by Moore and Schilling (1973). (4) Muenow et al. (1979) reported a maximum of 0.004 wt % H20 by pyrolizing polycrystalline olivine samples and assuming that certain gas surges resulted from bursting of glass inclusions. The H20 concentrations reported by Anderson and Brown (1993) correlate with eruption date. Early erupted inclusions comprise a high-Hjf) group (mostly 0.70±0.1O wt % H20). Most inclusions that erupted later have less than 0.40 wt % H20. In all, 21 inclusions have less than 0.5 wt % H20, and three inclusions have more than 0.9 wt % H20. Thus, lower than average H20 concentrations are more common than high H20 concentrations. H20 does not correlate with K20 (Fig. 3). Based on the total dissolved volatiles, some inclusions have formation pressures up to -2000 bars indicating that basaltic magma with -0.7 wt % H20 exists at considerable depths beneath Kilauea. Gerlach and Graeber (1985) and Greenland et al. (1985) independently estimated the pre-eruptive H20 contents of Kilauean basaltic magma by combining gas monitoring data with published glass inclusion and submarine glass analyses. Gerlach and Graeber's (1985) estimate (0.30 wt % H20) relies mostly on eruptive gas sample compositions collected by Shepherd and Jaggar from the active Halemaumau lava lake in 1917 and 1918 and a sulfur normalization procedure. This procedure entails calculating sulfur loss from included and residual (degassed) glass and combining this information with the gas
290
Johnson, Anderson, Rutherford: Pre-eruptive Volatiles in Magmas
H20/S02 ratio to yield the amount of H20 lost by exsolution. Adding the residual H20 dissolved in erupted scoriaceous glass to the amount lost yields the pre-eruptive H20. The estimate of Greenland et al. (1985) is based on eruptive and non-eruptive volcanic gas emission rates during the 1980's and involves a C02 normalization procedure. C~ emission derived from the volume flux of lava is used to estimate the C02 lost per unit mass of magma. This information together with the H20/C02 ratio of coeval eruptive gas samples yields a concentration of 0.32 wt % H20 in the pre-eruptive magma. Eruption dynamics provide an independent approach to estimating pre-eruptive magmatic volatile contents. Wilson and Head (1981) applied their eruption dynamics model to the 1959 Kilauea eruption and noted that the observed lava fountain heights and mass eruption rates calculated from lava lake filling were consistent with 0.19 to 0.27 wt % H20 exsolved. These numbers assume a crystal-free system and should be adjusted to 0.24 to 0.34 wt % in view of up to 20 wt % olivine phenocrysts. They should be further increased by -0.06 (Harris, 1981) to 0.09 (Friedman, 1967; Stolper, 1982) wt % to account for H20 remaining in the glass to yield an estimate of 0.31 to 0.43 wt % preeruptive H20. In addition, the 1959 glasses are unusually MgO-rich (-10 wt % for early erupted scoria; Helz, 1987). For comparison, a further increase to 0.34 to 0.47 wt % H20 is appropriate because -10 wt % olivine crystallization is required to yield melt with 6.2 wt % MgO similar to Kilauean basaltic glasses (Moore, 1965; Dixon et aI., 1991) and summit lavas extruded in 1917-1918. Although the gas erupted in 1959 was not analyzed, significant S02 and CO2 were probably present in the eruptive gas (Gerlach, 1986) implying that the adjusted Wilson and Head (1981) estimate is a maximum. Wilson and Head (1981) assumed that melt degassing is arrested at the pressure where foam disrupts into spray (assumed to occur at -70 vol % gas). Their model requires a disruption pressure of -9 bars to form a 300 m lava fountain. The scoria glass has, however, degassed to pressures less than -1.2 bars (Dixon, 1992). About 0.2 wt % H20 would exsolve between 9 and 1.2 bars according to the H20 solubility data of Dixon (1992). Whether the Wilson and Head (1981) estimate should be increased by this H20 content depends upon whether the additional 0.2 wt % H20 contributes to the kinetic energy of the erupting lava and thus lava fountain height. After magma disrupts, gas may escape to the surface independently of molten spray. Such non-eruptive gas escape is suggested by active gas emission from non-incandescent gas vents proximal to eruptive vents where lava is extruding (Greenland, 1987). If the post-disruption exsolved H20 is assumed not to contribute to lava fountain height, then the implied pre-eruptive H20 concentration must be increased by 0.2 wt % to 0.54 to 0.67 wt %. The similarity between this result and the H20 concentrations measured in Kilauean glass inclusions and submarine basaltic glasses may be real, but it must be recalled that the effect on eruption dynamics of any CO2 and S02 present in coeruptive gas has been ignored.
CO2 in Kilauean magmas. Pre-eruptive CO2 concentrations in Kilauean basaltic magma are constrained by five different methods which yield different concentration estimates. For example, some non-Kilauean Hawaiian olivines contain inclusions of dense C02-rich gas requiring -4 kbar entrapment pressures at 1200°C (Roedder, 1965). A basaltic melt in equilibrium with 4 kbar of CO2 pressure (C02 fugacity = 10,600 bar) would dissolve -0.53 wt % CO2 according to a linear extrapolation of the Pawley et al. (1992) solubility relation. Dissolved CO2 (as C032-; Fine and Stolper, 1986) concentrations are substantial in both submarine basaltic glass and glass inclusions in olivine phenocrysts from Kilauea (Fig. 4). The highest measured C02 concentration from a glass inclusion in a Kilauean olivine phenocryst is 758 ppm (Anderson and Brown, 1993). Much CO2, however, may be stored in the accompanying gas bubble.
Johnson, Anderson, Rutherford: Pre-eruptive Volatiles in Magmas
291
400 350
E
0. 0.
300 250
•
200
o
150 100
• ••
+
• .+
Ja
.,.
+ *+
+
•
N
0
+
+
+
•
+
+ + + + +
x
+
+
X
.+1-
50
•
• + ++
+
X
x x
+
0 5.0
7.0
9.0
11.0
MgO
13.0
Figure 4. C02 and MgO contents of Kilauean basaltic glasses. Data plotted include glass on rims of submarine basalts ( • ; Dixon et al., 1991), grains of glass from turbidite (crosses; Clague et al., in press), and glass inclusions in olivine phenocrysts from the 1959 Kilauea Iki eruption (+ ; Anderson and Brown, 1993; only includes M< raw C02 in the glass; does not include C02 that may reside in a gas bubble; one inclusion with 758 15.0 ppm C02 plots off the diagram). Note the several glass grains from turbidite that have -15 wt % MgO.
Estimating the total CO2 in the inclusion (melt plus gas) gives -0.2 wt % C02 for this relatively differentiated basaltic glass. Ground deformation at Kilauea depends partly on the volume of compressible gas in Kilauea's stored magma (Johnson, 1992). Johnson's (1992) assessment of the compressibility of the summit reservoir suggests -0.3 wt % gas is present. Volcanic gas monitoring data yield estimates of 0.32 (Greenland et al., 1985) and 0.65 (Gerlach and Graeber, 1985) wt % CO2 in parental Kilauean basaltic magma. Greenland et al. (1985) assumed that the C02 escaping non-eruptively from the summit was derived from magma erupting almost simultaneously from the east rift zone. Gerlach and Graeber's (1985) estimate is partly based on analyses of C02-rich gas collected in 1917-1918 from the active summit lava lake. They argued that the gas resulted from a single stage of degassing, and that the magma retained its original volatile complement until the moment of gas release from the lava lake. This closed-system view of parental magma ascent is difficult to reconcile with views that Kilauean parental magma is picritic (Wright, 1984; Clague et al., 1991) because the 1917-1918 lavas are basalts with -7.8 wt % MgO (Wright, 1971). Bottinga and Javoy (1991) pointed out that the COrrich gas composition would result in ascent rates too great to allow magma and gas to remain in equilibrium. The gas composition then reflects quenching from a greater pressure where bubbles are small and C02-rich. Another possibility is that rising gas-rich magma loses H20 by convectively mixing with previously degassed melt that convects downwards. Estimates of pre-eruptive magmatic C02 derived by volcanological approaches are greater than solubility will allow within Kilauea's summit magma storage reservoir and imply the presence of excess gas in parental magma as it enters the magma storage reservoir. Kilauean gas and glass carbon isotopic com~ositions suggest appreciable degassing of C02 (Gerlach and Taylor, 1990). The 13C/l C ratio of Kilauean gases and glasses decreases with degassing, and Gerlach and Taylor (1990) interpret this trend to result from batch degassing in two stages; non-eruptive release of C02-rich gas from Kilauea's summit area followed by release of the remaining magmatic CO2 during rift zone eruptions. In summary, the CO2 content of parental Kilauean magma is uncertain and may have varied secularly. Volcanic gas data and ground deformation studies suggest that magma
292
Johnson, Anderson, Rutherford: Pre-eruptive Volatiles in Magmas
stored in Kilauea's summit reservoir contains excess CO2-rich gas. Glass inclusion data reflect only dissolved CO2 and suggest a lower limit of -0.2 wt % CO2. These data are consistent with the assessment of Greenland et al. (1985) of 0.3 wt % CO2, Factor of 2 uncertainties exist, however, and Gerlach and Graeber's (1985) estimate of -0.6 wt % cannot be discounted. Sulfur in Kilauean magmas. Pre-eruptive sulfur concentrations in Kilauean basaltic magma have been assessed based on analyses of submarine basaltic glass (Moore and Fabbi, 1971; Dixon et al., 1991) and glass inclusions in phenocrysts (Anderson and Wright, 1972; Anderson, 1974a; Harris and Anderson, 1983; Anderson and Brown, 1993). Most analyses have 0.08 to 0.15 wt % S, although concentrations as low as 0.02 and as high as 0.19 wt % S have been reported (usual microprobe precision is about ±o.O 1 wt % S absolute). A strong positive correlation exists between S and H20 in the submarine Kilauean glasses (Dixon et aI., 1991), but not in glass inclusions (Anderson and Brown, 1993). The trend in the submarine glasses is interpreted to indicate that this basalt, or a component of it, has been affected by degassing which lowed both water and sulfur abundances. Greenland et al. (1985) estimated eruptive degassing of 0.06 wt % S which together with 0.02 wt % S in residual erupted basaltic glass (Moore and Fabbi, 1971) yields a pre-eruptive magmatic S content of 0.08 wt %. This volcanological estimate is at the low end of the results from inclusion analyses, and this discrepancy is not well explained. The abundance of sulfur in Kilauean basalts is less than that required for sulfide saturation, and immiscible sulfides are not present in the glasses, but rare sulfide-rich olivine phenocrysts suggest that the picritic parent magma may be sulfide saturated (Helz, 1987). Any breakdown of this immiscible sulfide, however, would tend to make the volcanological sulfur estimates higher than dissolved gas analyses. Several possible explanations exist for the range of sulfur abundances observed in the glass inclusions. Sulfur solubility is enhanced by magma oxidation (Carroll and Rutherford, 1985; 1987; Wallace and Carmichael, 1992). Perhaps different inclusions had different oxidation histories, although no evidence exists that these basalts underwent such oxidation state changes. Another possibility is that some glass inclusions may contain relict high temperature super-saturated sulfur concentrations. Finally, it is possible that some pulses of these magmas have suffered degassing of a CO2 and S-rich volatile phase at depth, and the olivines have grown in variably degassed melt. Pre-eruptive
volatiles in basaltic magmas from other tectonic settings
Mid-ocean ridge basalts. Following his early studies of Kilauean submarine basaltic glasses, Moore and coworkers pioneered the study of dissolved volatiles in other submarine basalts (Moore, 1970; Moore and Schilling, 1973; Moore, 1979). Since then, basaltic glasses from many different sea-floor settings have been analyzed by various techniques. Although all techniques yield similar dissolved H20 contents, CO2 measurements appear technique-dependent. Reported analyses of dissolved water in submarine basaltic glasses from seamounts and fast and slow spreading mid-ocean ridges are presented in Figure 5 where total magmatic H20 (OH- and H20 molecular in spectroscopic data, H20+ in Penfield analyses) is plotted against sample recovery depth. The experimentally determined solubility of H20 in basaltic melt as a function of pressure is also shown (Hamilton et al., 1964). Total H20 correlates poorly with depth and is generally less than the amount of H20 required for saturation indicating that most melts were not saturated with an H20rich fluid when quenched to glass. Virtually all deep sea basaltic glasses contain vesicles,
Johnson, Anderson, Rutherford: Pre-eruptive Volatiles in Magmas
293
3.0 MORB BABB
0
25 ~
+
x
........
~ 0
I
Hawaii
+ +
2.0
1 o 15 IN 1.0
t
·
+-+:....
. ~ '*'
+ +
0
_
+ --- ,.,
x
0.5
x ~ _+X x x .. , x ~~
0.0 I 0
, G1-~~'i 1000 2000
+
~JJ;e x
+ +
+
'*'
+
x +x
x
j
)(
rl
~
,
x
I
4000
3000
x x x
5000
6000
depth (meters) Figure 5. Published H20 contents of glassy submarine basalts versus depth of recovered dredge fa midocean ridges, back-arc basins, and Hawaiian tholeiites. Dashed line represents experimentally determined solubility of water as a function of pressure (Hamilton et al., 1964). Most MORB glasses are H20undersaturated. (Data for MORB from: Moore, 1970; Delaney et al., 1978; Harris, 1981; Byers et al., 1983; 1984; 1986; Dixon et al., 1988; Michael, 1988; Jambon and Zimmerman, 1990; data for BABB from: Garcia et al., 1979; Muenow et al., 1980; Volpe et al., 1987; Aggrey et al., 1988b; Jambon and Zimmerman, 1990; Danyushevsky et al., 1993; data for Hawaii from: Muenow et al., 1979; Harris, 1981; Byers et al., 1985; Jambon and Zimmerman, 1990; Dixon et al., 1991.)
however, indicating gas saturation. These observations may be reconciled by concluding that the ambient gas was H20-poor. Water and K20 abundances in mid-ocean ridge basalt (MORB) glasses are positively correlated (Fig. 6), with H20/K20 ratios ranging from 1:4 to 1:1. Both H20 and K20 behave incompatibly during partial melting of MORB-type mantle (Michael, 1988; Hess, 1992), and H20/K20 ratio variations mainly reflect compositional variations in the source. The limited range of H20/K20 ratios implies that these elements are linked during source enrichment processes. Since the trend of the data intersects the 0.8 1 :4
0.7
1 :1
;¤
o
o
0.5
o
0 0/0 0 0/0 00
0.4
o
o
0.3
I
0.2
N
o
o
0.6
MORB
0.1
o.oW
I
,
I
,
I
,
I
,
I
,
I
,
I
0.0 0.1 0.2 0.3 0.4 0.5 0.6 0.7
K20 (wt. %)
,
Figure 6. Compilation of literature data showing measured H20 content of submarine MORB glasses as a function of K20. Only glasses with less than 0.8 wt % K20 are shown. K20fH20 ratios of 1:1 and 1:4 are indicated; most MORB have intermediate K20fH20 ratios. (Data compiled from: Moore, 1970; Harris, 1981; et al., 1983; 1984; 1986; j Byers Delaney et al., 1978; Aggrey et al., 0.8 1988a; Dixon et al., 1988; Michael, 1988; Jambon and Zimmerman, 1990.)
294
Johnson, Anderson, Rutherford: Pre-eruptive Volatiles in Magmas
20 15
MORB ~ •
Hawaii others
laboratory
10
5
25 20 15
MORB ~
Hawaii
•
others
•
Pineau
laboratory
10
o
Figure 7. (a) Histogram of water contents for mid-ocean ridge basaltic glasses. Striped bars are data from the Hawaii-laboratory (Delaney et al., 1978; Byers et al., 1983; 1984; 1986; Aggrey et al., 1988a), gray bars are other available data (Moore, 1970; Harris, 1981; Brett et al., 1987; Dixon et al., 1988; Michael, 1988; Jambon and Zimmerman, 1990). (b) Histogram of C02 contents for mid-ocean ridge basaItic glasses. Striped bars are data from the Hawaii-laboratory (Delaney et aI., 1978; Byers et aI., 1983; 1984; 1986), black bars are from Pineau et aI., 1983, gray bars are other available data (Moore, 1970; Harris, 1981; Fine and Stolper, 1986; Brett et al., 1987; Dixon et al., 1988). Although similar water contents are reported by all groups, the C02 contents reported by the Hawaii-laboratory are uniformly higher than most other analyses.
positive H20 axis rather than the origin, H20 is inferred to behave slightly more compatibly than K20 during mantle melting (Michael, 1988). Measurements of C02 in submarine MORB glasses are controversial. Most studies report CO2 contents of less than 400 ppm (Harris, 1981; Fine and Stolper, 1986; Brett et al., 1987; Dixon et al., 1988). Data collected using vacuum fusion and quadrupole mass spectrometry (Delaney et al., 1978; Byers et al., 1983; 1984; 1986) yield results a factor of 2-10 greater (Fig. 7). One study employing vacuum fusion and manometry reports a mean dissolved C02 content of 615±30 ppm (Pineau and Javoy, 1983). Measured C02 contents are plotted as a function of sample recovery depth in Figure 8. The experimentally determined variation in CO2 solubility as a function of pressure is also shown (Dixon et aI., in press, a). This work includes new measurements made using an improved background subtraction scheme on CO2-saturated glasses produced in an earlier experimental study (Stolper and Holloway, 1988). These new results suggest that at a given pressure, C02 saturation occurs with -20% less dissolved C02 than previously reported by Pawley et al. (1992). Little correlation exists between CO2 content and recovery depth for most MORB glasses (Fig. 8, but see Harris, 1981). Relative to the experimental solubility data of Dixon et al. (in press, a), most analyzed MORB glasses plot above the equilibrium saturation line indicating that these glasses are C02 supersaturated. If the Pawley et al. (1992) solubility curve is considered, then some glasses plot below equilibrium
Johnson,
Anderson,
Rutherford:
Pre-eruptive Volatiles in Magmas
295
Figure 8. Compilation of literature data showing measured C02 contents in submarine basaltic glasses versus depth of recovered dredge for mid-ocean ridges, back-arc basins, and Hawaiian tholeiites. Dashed line represents experimentally determined solubility of C02 as a function of pressure (Dixon et aI., in press, a). Most MORB glasses are super-saturated in C02. (Data for MORB from: Moore, 1970; Delaney et al., 1978; Harris, 1981; Byers et al., 1983; 1984; 1986; Dixon et al., 1988; data for BABB from: Garcia et aI., 1979; Muenow et aI., 1980; Volpe et aI., 1987; Aggrey et aI., 1988b; data for Hawaii from: Muenow et al., 1979; Harris, 1981; Byers et aI., 1985; Dixon et aI., 1991.) saturation. Samples interpreted to be CO2 super-saturated must have equilibrated at higher pressures. Apparently, ascent rates were rapid enough to prevent bubbles from nucleating and growing, C02 remained dissolved in the melt, and melt/fluid equilibrium was not maintained. A dissolved C02 content cannot be translated directly into an equilibration depth unless the coexisting gas composition is known. In general, MORB gas compositions are C02-rich (Moore et al., 1977). If the coexisting gas is pure CO2, then the experimental data allow equilibration pressures to be calculated directly. At oxygen fugacities greater than 1 log unit below NNO, however, substantial CO will be present in the gas phase reducing PC02 to significantly less than Ptotal. In this case, the measured CO2 contents can not be directly equated with equilibration pressures unless CO2 fugacity is known (Pawley et aI., 1992). In contrast to H20, CO2 is not correlated with melt K20 (Fig. 9). Yet, CO2 must behave as an incompatible element during MORB formation as no CO2-rich minerals are thought to be present in the mantle in significant quantities at the pressures where MORB melting begins. The C02 found in MORB is probably derived from carbon present in the MORB mantle as graphite, diamond, or amorphous carbon depending on pressure and oxygen fugacity. The lack of correlation between K20 and C02 suggests that melt CO2 contents are affected by a heterogeneous equilibrium between melt and a CO2-rich .vapor, This relationship may not be simple. Reduced C decorating fractures in phenocrysts and vesicle walls occurs in MORB samples (Mathez and Delaney, 1981). This reduced carbon is not detectable by all analytical methods, and its origin is problematical. The basalt C02 contents reported by Byers et al. (1983; 1984; 1986) and Delaney et al. (1978) are uniformly higher (up to an order of magnitude) than those observed by
296
Johnson, Anderson, Rutherford: Pre-eruptive Volatiles in Magmas 2000
no
BcP
1600
E
0. 0. .__. N
0
MORB
DO
........ 1200
0 0
0
o 0
800
o
0 0
0 0
0
400 DO
0
o
0.0 0.1 0.2 0.3 0.4 0.5 0.6 0.7 0.8
K20 (wt. %)
Figure 9. Compilation of literature data showing lack of correlation between measured C02 content of submarine MORB glasses and melt K20 content. Only glasses with less than 0.8 wt % K20 are shown. (Data compiled from: Moore. 1970; Delaney et al., 1978; Harris. 1981; Byers et al., 1983; 1984; 1986; Dixon et al., 1988.)
most other workers who have analyzed similar rocks (Fig. 7). One explanation is that different techniques analyze different phases. FTIR spectroscopy measures only IRactive dissolved volatiles. Data reported by the above authors were collected by heating carefully selected glass fragments to high-temperature and releasing volatiles from both the glass and any trapped bubbles. The bubbles in submarine basalt glasses are C02-rich and H20-poor (Moore et aI., 1977), and they represent a possible C02 source not analyzed by FTIR spectroscopy. If these bubbles were included in mass spectrometric analyses but not in FTIR analyses, then the mass spectrometric results would be expected to have higher C02 contents and equivalent H20 contents as observed (Fig. 7). The ideal gas law suggests that at equilibrium at 1200°C and 200 bars, a magma containing 1.5 vol % of C02 bubbles would have -300 ppm C02 in the bubbles. Indeed, Pineau et al. (1983) report dissolved C02 contents from 370-900 ppm (Fig. 7), and note that these CO2 contents may be contaminated by C02 from fluid inclusions which did not burst during earlier laser heating. Another difference between the Byers and coworkers data sets and most other data sets is that reduced species of C (CO and Cf4) are commonly reported, yet these species are not reported in other studies (e.g., Dixon et aI., 1988; Brett et al., 1987; Moore, 1970). Perhaps, the CO and Cf4 are derived from rare amorphous carbon from vesicles and cracks (Mathez and Delaney, 1981). Amorphous carbon may be oxidized during sample heating forming CO as well as C02. This C was probably present in samples analyzed by other groups using pyrolitic methods, although no reduced C-species are reported, and measured CO2 contents are generally lower than those of Byers and coworkers. These differences may simply be a reflection of the fact that carbon analyses at these low concentrations are extremely difficult, and contamination is a potentially serious problem. According to DesMarais and Moore (1984) various forms of carbon are adsorbed onto basalt at room temperature and contribute to carbon species emitted during pyrolysis. Arc basalts. Most submarine basalts from mid-ocean ridges and Hawaii are volatilepoor. Early studies of pillow basalts from the Marianas arc and trough (Garcia et al., 1979) suggested that arc basalts also had low volatile contents (
.
"Cpx '3% XFI 'd-I' ,UI -;900
solidus' 01 800
.
•
=-:-:----..
~
1000
1100
Tee)
1200
I
I
1300
(MT. HooD! ANDESITE'
Melt
p
=p = 5 Kb FLUID Total -
fo2=QFM
800
o
0.25
0.5
X Fluid H20
. 0.75
1.0
Figure 11. Phase equilibria of Mount Hood Andesite after Eggler and Burnham (1973). (a) P- T phase relations at H20undersaturated conditions. High temperature liquidi are drawn for O. 2 and 5 wt % H20 in the melt. (b) T-XH:zO plot of the same data for a constant pressure of 5 kbar. All experiments are nominally at the QFM oxygen buffer.
302
Johnson, Anderson, Rutherford: Pre-eruptive Volatiles in Magmas
>1200°C to approximately lO00°C and plagioclase crystallization is suppressed relative to the pyroxenes and Fe-Ti oxides. Amphibole crystallization occurs at 950-1000°C depending on melt composition, providing H20 in the melt is greater than -4 wt % (see also Merzbacher and Eggler, 1984; Rutherford and Hill, 1993). Mineral and glass compositions were not obtained from these early experiments. Some phase compositions are available from basaltic composition experiments (Spulber and Rutherford, 1983; Sisson and Grove, 1993a and b) because these experiments produced andesitic and more evolved melts. Numerous andesite phase equilibria questions remain unanswered, however. What reactions control olivine resorption in an andesitic magma, and how do these reactions change with P, T and PH20? Is amphibole involved in these reactions? What is the source of variable H20, K20, and Na20 in andesitic magmas, and how do these variations affect phase equilibria (Sisson and Layne, 1993)? What is the oxidation state of andesitic magmas? Does oxidation state correlate with H20 abundance (Carmichael, 1991; Rutherford et al., 1993)? VOLATILES IN DACITIC AND RHYOLITIC MAGMAS Silicic magmas may have substantial C-O-H-S volatile concentrations. Qualitative evidence includes the presence of H20- and S-bearing phenocrysts, dissolved volatiles in glass inclusions in phenocrysts, violently explosive eruptions, and the vesicular texture of tephra and lavas. Giant crystals in granitic pegmatites, and the common association of granites with various volatile-bearing ore deposits provide evidence from plutonic settings. It is much more difficult, however, to determine the quantitative abundances of these volatiles in magmas at depth. Clemens (1984) reviewed various lines of evidence and resulting estimates of H20 in silicic and intermediate plutonic and volcanic magmas. He concluded that such magmas have H20 contents ranging from 1000°C. In contrast, nuclear magnetic resonance (NMR) spectroscopic studies on molten silicates (e.g., Stebbins et al., 1985; Liu et ai., 1988; Stebbins et ai., 1992 ) can probe much lower frequency motions and hence, longer time scales that are applicable to viscous flow. NMR spectra obtained on melts under in-situ, high temperature conditions (Farnan and Stebbins, 1990; Stebbins and Farnan, 1992) demonstrate that the lifetime of a silicate tetrahedron is relatively short on the NMR time scale (seconds to microseconds) because only one line is observed in the spectra of samples where, by stoichiometry, more than one silicon environment must exist. This is true for samples of greatly differing silica contents and shows that even when a silicate system contains a large proportion of weak bonds, the Si-O bonds in the system are breaking and re-forming rapidly. For example, in a hightemperature NMR study of 29Si line shapes observed for alkali silicate liquids, Liu et ai. (1988) showed that the exchange of oxygens between bridging and non-bridging sites takes place at the microsecond to nanosecond time scale at liquidus temperatures. They concluded that this process must be a fundamental step in viscous flow and configurational entropy generation. Line shape analysis by Farnan and Stebbins (1990) indicates that the rate of the Si-O bond-breaking process in K2SLt09 melt at -1000°C is approximately 2 µs. The observed Qn species exchange process obtained from the spectra allows a temperature-dependent exchange time, r, to be derived. Because this exchange involves the breaking and reforming of Si-O bonds, it is probably related to the basic mechanism of viscous flow and relaxation. Farnan and Stebbins (1990) demonstrated this by calculating the viscosity of the K2SLtD9 liquid using a simple Eyring model of viscosity:
354
Lange: H20, C02, F; Effects on Melt Density and Viscosity kT'r 11=3
(32)
d
assuming jump frequencies ('t) equal to the exchange frequencies obtained from the NMR results at each T, and a jump distance (d) taken as the Si-Si distance of 0.3 nm, which is typical of many crystalline silicates. The calculated viscosity of molten K2S409 from Farnan and Stebbins (1990) using Equation (17) compares extremely well with that measured for this composition by Shartriss et al. (1952) at high temperatures, but deviates from the low temperature measurements of Webb and Dingwell (1990). Farnan and Stebbins (1990) pointed out, however, that this could be accounted for by recognizing two processes which affect motional narrowing of the 29Si NMR spectrum. The first process is termed a "nonexchange event", where an intermediate state is formed but relaxes back to its original configuration. The second process is termed a "complete exchange event", where the intermediate state relaxes to a new configuration. At high temperatures, the probability of the complete exchange process is close to 1 after the intermediate state is formed, whereas at low temperatures, the probability decreases. Because the "non-exchange" process contributes to NMR line-shape narrowing, the NMR derived values of t underestimate the viscosity. However, Farnan and Stebbins (1990) were able to use a two-dimensional NMR experiment at a temperature just above T g where the two Q species exchange processes are decoupled, and the "complete" exchange process can be observed independently of the "non-exchange" process. In that experiment, an exchange time scale on the order of 0.5 seconds was observed and leads to viscosities calculated from Equation (32) that match the values measured at low temperature. What is the relationship between the parameters in Equation (32) and those in the configurational entropy model of Equation (27)? From the original work of Adam and Gibbs (1965), the relaxation time scale of a silicate melt is expected to be inversely proportional to the configurational states available to the ~stem. Therefore, the parameter 't in Equation (32) should be inversely proportional to SeD rt (T). The next question is what is the nature of the intermediate state inferred from the NMR results of Farnan and Stebbins (1990), and can it be related to the parameter Be in Equation (27), which is considered to represent an energy barrier to a change in configurational states. The NMR results of Liu et al. (1988), and Stebbins et al. (1992) directly address this issue and provide constraints on the nature of the intermediate step during viscous flow. This is based on the more general NMR approach to studying the dynamics in both liquids and solids and involves measurements of the spin-lattice relaxation times, Tj. It is beyond the scope of this paper to explain this parameter, and the reader is referred to Stebbins et al. (1992) for a discussion. The principal point is that the time scale of Tl is often just that needed to explore diffusion, and it is observed that a fundamental change in the relaxation mechanism for 29Si takes place at or near the glass transition. Liu et al. (1988) and Stebbins et al. (1992) suggested that 29Si spin-lattice relaxation may be caused by the formation of short-lived distorted sites that are intermediates in the QD species exchange reactions. They proposed a mechanism for Qn species exchange that is inspired by the molecular dynamic simulations of Soules (1979), Angell et al. (1983), Brawer (1985) and Kubicki and Lasaga (1988). A possible scenario is that when a non-bridging oxygen moves close to another Si04 tetrahedron, a distorted five-coordinated Si site is created. Some of the time, the newly arrived nonbridging oxygen "jumps" away and the initial configuration is maintained. At other times, one of the original bridging oxygens "jumps" away from the distorted five-coordinated site, and a new configuration is achieved. When this happens, both local viscous flow and Qn speciation has occurred.
Lange: H20. C02. F; Effects on Melt Density and Viscosity
355
Although it not possible for NMR experiments to test this model, NMR spectra obtained by Stebbins (1991) and Xue et al. (1991) have detected measurable abundances of the proposed intermediate state, namely five-coordinated Si, in glasses quenched from melts equilibrated both a I bar and elevated pressures. Abundances up to 0.10% have been observed in K2Si409 glasses quenched from liquids equilibrated at one bar. Not surprisingly, abundances of both Siv and SiVI increase in K2SLJD9glasses quenched from li~ids equilibrated at increasing pressures; at 6 GPa, quenched abundances of Siv and Si Iapproach 3.9 and 1.5% respectively. Clearly, a link between pressure-induced coordination change of Si and the role of Si V as an intermediate step in viscous flow is compelling. Such a relationship may explain the complex pressure dependence to melt viscosity. The effect of pressure
on silicate melt viscosity
A thorough review of the pressure dependence of silicate melt viscosities can be found in Scarfe (1986) and Scarfe et ai. (1987). Currently, most of the published data on the viscosity of molten silicates at elevated pressures have been obtained by the falling-sphere method (Shaw, 1963; Kushiro, 1978) in a piston-cylinder apparatus. The technique employs Stoke's relation: 2g(pliq
ry=
_ pSPhere
)r2
O~
9v where pliq and pSPhere are the density of the liquid and falling sphere respectively, g is the gravitational constant, r is the radius of the sphere, and v is the velocity at which the sphere falls through the silicate melt. This relation must be combined with the Faxen correction to correct for drag along the walls of the crucible (Shaw, 1963). Most of the error in derived values of ry is derived from the uncertainty in the velocity at which the sphere falls; this is obtained from several experiments quenched at different time intervals to document the distance traversed by the sphere per unit time. Reported uncertainties in viscosity range from 15 to 25%. Since viscosity varies by several orders of magnitude as a function of composition, temperature, and pressure, this is not a large relative error. The results of high-pressure falling sphere viscometery applied to a wide variety of synthetic and natural liquid compositions have been summarized by Scarfe et ai. (1987). Although some silicate melts (e.g, CaMgSi206) show a viscosity increase with increasing pressure, consistent with other inorganic liquids, most silicate and aluminosilicate liquids (NaAlSi30g, NaAlSjz06, K20-MgO-5SiD2, an andesite, and two tholeiitic basalts) show a decrease in viscosity with applied pressure. In virtually all cases, the variation in viscosity over a 20 kbar interval is:$; 1 log unit. An exception to this is the viscosity decrease of more than 2 log units between 0 and -25 kbar for molten K2Si409 (Dickinson et al., 1990), which has the highest concentration of five-coordinated Si in quenched liquids from o to 6 GPa (Stebbins and McMillan, 1989; Xue et ai., 1991). One of the limitations of the falling-sphere technique is that it cannot be applied to extremely fluid liquids. Uncertainties become unacceptably large when viscosities are S 10 poise because the velocity of the falling sphere is too rapid for accurate measurement. As a consequence, alternative methods are required in order to obtain viscosity data for silicate melts at pressure > 5 GPa, which are also at high temperatures. To overcome this problem, Kanzaki et al. (1987) developed an in-situ technique for measuring the velocity of Pt spheres in silicate melts at pressures s 10 GPa using synchrotron radiation to produce X-ray shadowgraphs. The most serious limitation of this method, however, are the severe temperature gradients that exist (Kanzaki, 1987).
356
Lange: H20, C02, F; Effects on Melt Density and Viscosity
Another approach for estimating the viscosities of fluid liquids at elevated temperatures and pressures is based on the Erying relationship applied to 0 diffusivity data (e.g., Rubie et al., 1993). From Equation (16), diffusivity can be related to viscosity as follows: D=kT/1]A
(34)
where D is 0 diffusivity, k is the Boltzmann constant, T is absolute temperature, 1] is viscosity and A is the diffusive jump distance. This relationship can only be applied to those melts where a similar mechanism for oxygen diffusion and viscous flow is operative. The successful application of Equation (34) to molten NaAlSi206 (Shimizu and Kushiro, 1984) and Na2Si409 (Rubie et ai., 1993) implies that Si-O and Al-O bond breaking is a fundamental feature of both viscous flow and oxygen diffusion in these two polymerized melts. The results of Rubie et al. (1993) indicate that the viscosity of molten Na2S409 at 1825°C decreases with increasing pressure, but only by -0.8 log units over a 100 kbar interval. Perhaps more importantly, Rubie et al. found that the activation energy for 0 selfdiffusion at 4 GPa is considerably lower than the value obtained from 1 bar viscosity measurements (55±17 versus 174 to -180 kJ/mol). The implication is that the energy barrier to a change in configurational sates (the parameter Be in Equation 27) has been reduced and the intermediate step for viscous flow is more readily accessible in molten Na2S4D9 at pressures approaching 4 GPa. It is tempting to speculate that the general trend of decreasing viscosity with increasing pressure in polymerized melts is related to an increase in the abundance of five-coordinated silicon (or aluminum), which may be the intermediate step in viscous flow. The observation that the degree of melt polymerization appears to control whether viscosity will increase or decrease with pressure may be related to the compositional control on the formation of five- and six-coordinated silicon inferred from the NMR results of Xue et al. (1991). In that study, it was concluded that the degree of polymerization of a silicate melt plays a major role in controlling the formation of high-coordinated [51Siand [61Sispecies with increasing pressure. Xue et ai. (1991) proposed a model in which five- and sixcoordinated Si is formed by conversion of non-bridging 0 atoms to bridging 0 atoms. The mechanism is expressed in the following simple reactions: Q3
+ Q4 = Q4. +
2Q3 + Q4
[51Si
= 2Q4. + [61Si
(35) (36)
where Q3 refers to a silicon atom with three bridging oxygens and one non-bridging oxygen, Q4 refers to a silicon atom with four bridging oxygens, and Q4* is a Si04 species with three [41Siand one [61Sior [51Sineighbors. This model implies that the formation of high-coordinated Si is favored in those melts where both Q3 and Q4 species are maximized. In other words, if the abundance of Q4 species is diminished, by an increase in alkali or water concentration, then the reactions in Equations (19) and (20) will not be driven toward the creation of high-coordinated Si. Stebbins et al. (1992) observed a strong correlation between Q4 abundance and the activity of silica in the melt; it follows therefore that the most silica undersaturated magmas will form less five-coordinated silicon with increasing pressure, and therefore will not have melt viscosities that decrease as a function of pressure. This has been observed, in fact, for an andesite melt with 2.9 wt % (9.5 mole%) H20 (Kushiro, 1978). Not only does the presence of water reduce the viscosity of the andesite melt by a factor of 20, but it also changes the pressure dependence of viscosity. There are, in addition, a variety of silicate liquids that demonstrate a complex pressure
Lange: H20, C02, F; Effects on Melt Density and Viscosity
357
dependence to their viscosities; for example, Scarfe et al. (1987) observed that the viscosity of molten Na2SjzOs initially increases by -0.6 log units between 1 and 15 kbar, and then proceeds to decrease by -1.0 log units between 15 and 25 kbar. In contrast, Brearley et al. (1986) found that the viscosity of molten Ab2SDi7Sinitially decreases by less than 0.5 log units between 0-5 kbar, and then increases by -0.5 log units between 5 and 25 kbar. The bottom line for petrologists, however, is that most natural silicate liquids (rhyolites through basalts) have anhydrous melt viscosities that decrease with pressure, often by less than 1 log unit over a 20 kbar interval. A much more significant reduction in melt viscosity is observed with the addition of water.
The effect of H20 on silicate melt viscosities Published measurements of the viscosity of hydrous silicate melts are currently restricted to four siliceous compositions: rhyolite (Sabatier, 1956; Saucier, 1952; Shaw, 1963; Friedman et al., 1963; Persikov et al., 1990), andesite (Kushiro, 1978b; Persikov et al., 1990), albite (Dingwell and Mysen, 1985; Dingwell, 1987; Persikov et al., 1990), and sanidine (White and Montana, 1990). All experiments are based on the falling sphere technique described above and demonstrate that the addition of -2 wt % H20 can dramatically reduce melt viscosity by up to -3 log units. For comparison, a temperature increase of -200 degrees is required to achieve the same viscosity reduction in albite and rhyolite melts (Urbain et al., 1982; Neuville et ai., 1993). There have been no reported viscosity measurements on hydrous basaltic or otherwise depolymerized (e.g., diopside) melt compositions despite the evidence cited earlier that both silicic and mafic magmas can contain significant amounts of dissolved water. The primary reason for this paucity of data is the difficulty of performing falling sphere viscometry to extremely fluid liquids. The effect of increasing water content on the viscosity of rhyolite, albite, and sanidine liquids is shown in Figure 9. Although the data cover a wide range of pressures (2 to 15 kbar) and temperatures (850 to 1500°C), a general trend is observed where there is an initial, rapid decrease in viscosity with the first 3 wt % of total dissolved water concentration, which begins to level off at -5 wt % total water. As originally discussed by Stolper (l982a), this trend is consistent with the water speciation results of Stolper (1982b), Silver and Stolper (1989), and Silver et al. (1991) on rhyolite, albite, and sandine liquids; their data demonstrate that the hydroxyl concentration increases rapidly as water is first added to the melt. As total water concentrations increase beyond -5 wt %, most of the additional water is incorporated as molecular H20. The strong correlation between the reduction in melt viscosity and the increase in hydroxyl concentration with total water content
~ .;
-= .~
•
Rhyolite (2 kb) 0 Albite (7.S kb) Sanidine 115 kb)
111 -.
...
9
.....__
7
J"'-
" ~ .;;: ee
-=
850cC
--...._
LL
1200°C
~
ISOO°C 1 0
2
4
6
wt % H2O
8
10
Figure 9. A plot of log viscosity for molten albite (Dingwell, 1987), sanidine (White and Montana, 1990) and rhyolite (Shaw, 1963) as a function of total dissolved water. The effect of -2 wt % total H20 is more pronounced at 850°C (-3 log unit reduction) than at 1500°C (-1.7 log unit reduction).
358
Lange: H20. C02. F; Effects on Melt Density and Viscosity
was noted by Stolper (1982b) and is illustrated in Figure 10. The striking correlation reflects the role of OH groups in depolymerizing the highly siliceous melts, NaAlSi308, KAlSi30s and rhyolite, that under anhydrous conditions are nearly fully polymerized with virtually all of their oxygens as bridging oxygens. The speciation of dissolved water according the reaction in Equation (12) requires that for every two hydroxyl groups formed, one bridging oxygen is consumed, which both depolymerizes the melt and increases the number of available configurational states. This, in turn, according to Equation (27), leads to a decrease in melt viscosity, as observed. It appears that dissolved molecular water has little effect on melt viscosity.
~-------------------------.8 Albite
;;-
o viscosity ·OH(wt%)
~ .~ e
~ .;;:
4
7.S kb
..
:t o
o
Figure 10. A plot of log viscosity for albite liquid (Dingwell, 1987; right axis) and concentration of hydroxyl groups dissolved in albite liquid (Silver and Stolper, 1989; left axis) as a function of total dissolved water content. The correlation between vis-cosity and hydroxyl concentration indicates that dissolved molecular water has little effect on silicate melt viscosity.
•
.".
0 2
4
6
total water concentration
8
10
(WI %)
The reduction in silicate melt viscosity caused by dissolved hydroxyl groups is strongly dependent on temperature. This is illustrated by the data presented in Figure 9 and Table 4, where the effect of -2 wt % total water on melt viscosity is more pronounced at lower than higher temperatures. For example, at 850°C (and 2 kbar), the effect of 2 wt % H20 is to reduce the melt viscosity of rhyolite by -3.1 log units. In contrast, at 1200°C (and 7.5 kbar), the viscosity of molten albite is reduced by -2.3 log units, whereas at 1500°C (and 20 kbar), the viscosity of molten sanidine is reduced by only -1.7 log units. This does not seem to be related to pressure, since the viscosity of molten albite with 2 wt % H20 is virtually identical (102.3 vs 102.4poise) at different pressures (7.5 vs 15 kbar) but at the same temperature (l200°C). In contrast, at constant pressure (15 kbar), but at different temperatures (1200 vs 1400°C), the effect of ·-2 wt % H20 in albite melt leads to Table 4. Variable effect of water on silicate melt viscosity Composition
T (OC)
Rhyolite Albite Albite Albite Sanidine
850 1200 1200 1400 1500
P
log 11 log 11 L\ log 11 dry 2 wt % H20 (kbars) (poise) (poise) (poise) 2.0 7.5 15.0 15.0 20.0
1l.9 7.0 6.6 4.5 3.9
8.8 4.7 4.2 2.9 2.2
3.1 2.3 2.4 1.6 1.7
Reference
Shaw (1963) Dingwell (1987) Dingwell (1987) Dingwell (1987) White and Montana (1990)
Lange: H20. C02. F; Effects on Melt Density and Viscosity
359
different values of viscosity (102.4 versus 101.6 poise). Nor can this variable effect of water on melt viscosity as a function of temperature be related to an increase in hydroxyl groups at low temperatures. To the contrary, Stolper (1989) and Zhang (1993) have shown that at P < 20 kbar, the effect of increasing temperature on the reaction in Equation (12) is to increase the production of OH groups. The most likely reason for the increased effect of water on melt viscosities at lower temperatures is that the configurational entropy term in Equation (27) is "weighted" more heavily at lower versus higher temperatures as seen in Figure 8. The effect of water on melt viscosity is further enhanced when F (and possibly other volatile components) are also dissolved in the melt. This is caused by the entropy of mixing contribution (Eqn. 31) to sconf(n, rendering an additive compositional model for viscosity (e.g., Bottinga and Weill, 1972; Shaw, 1972) incorrect. Evidence for this is seen in the results of Dingwell (1987) on the combined effect of fluorine and H20 on albite melt viscosity. At l400°C, deviations from an additive model are slight, and a maximum discrepancy of -0.2 log units is observed at equal molar proportions of F and H20 (5.8 wt % F and 2.79 wt % H20). At 12oo°C, the maximum discrepancy increases to -0.4 log units, whereas at l000°C, an additive model overestimates the viscosity by -0.6 log units. Once again the configurational entropy of mixing term becomes increasingly important at lower temperatures. The combined effect of both CQz and H20 on silicate melt viscosities has not been studied as yet, although some data may exist inadvertently due to the extreme difficulty in keeping any sample completely anhydrous in a piston-cylinder apparatus (Fine and Stolper, 1985; Stolper et al., 1987). This effect will be discussed below. The effect of C02 on silicate melt viscosities Currently, data on the effect of CD2 on silicate melt viscosities are fairly limited; only three melt compositions have been explored (KAlSi308, NaAlSi30g, and NaCaAlSi2D?) in two published studies (Brearley and Montana, 1989; White and Montana, 1990). White and Montana (1990) measured the viscosity of sanidine liquid with 0.25, 0.50, l.oo, and 1.50 wt % C02 between 15 and 25 kbar and 1500 to 16OO°C. The results (Fig. 11) are somewhat surprising in that increasing concentrations of dissolved CD2 have virtually no effect on the melt viscosity (within error) at 20 kbar. In sharp contrast, however, the effect of just 0.5 wt % C02 appears to significantly reduce the melt viscosity at 25 kbar. This contrasting effect of dissolved CD2 on sanidine melt viscosity between 20 and 25 kbar may be due to the somewhat anomalous viscosity value for sanidine melt obtained under dry conditions at 15OO°Cand 25 kbar (White and Montana, 1990). In Figure 12, a comparison of measured sanidine and albite melt viscosities as a function of pressure (Brearley and Montana, 1989; White and Montana, 1990) indicates that the value for sanidine at 15OO°C and 25 kbar is surprisingly high. This value is especially .unusual because it indicates that the viscosity of sanidine melt actually increases between 20 and 25 kbar; such an increase in viscosity with pressure is usually observed for only depolymerized melts (e.g., diopside) and not for such highly polymerized liquids as sanidine. Moreover, this behavior is not seen at 16OO°C,where the sanidine melt viscosity decreases between 20 and 25 kbar (White and Montana, 1990), similar to the trend observed for albite melt (Brearley and Montana, 1989). White and Montana (1990) pointed out that 15OO°Ccorresponds to the high-temperature bracket of the sanidine liquidus at 25 kbar (Boettcher et ai., 1984); therefore, the high viscosity value may reflect incipient crystallization. Another possible explanation for the contrasting effect of CD2 on sanidine melt
Lange: H20, C02, F; Effects on Melt Density and Viscosity
360
5.0,
(a)
Sanidine lS00°C. 20 kbars
4.5
3.0 2.5
2.0+----r---.,---.,---.,...----.
Figure 11. A comparison of the effect of H20 versus C02 on the viscosity of sanidine melt from White and Montana (1990). At 20 kbars and 15OO°C,the effect of 0.5 to 2.0 wt % total dis-solved C02 has virtually no effect on the viscosity of sanidine melt within error (±15 % in viscosity and ±0.08 in log viscosity). In contrast, at 25 kbars and 15OO°C,the effect of 0.5 and 1.0 wt % C02 is to reduce the viscosity of sanidine melt by more than 0.5 log units. These results should be interpreted with caution, however, since Fine and Stolper (1985) and Stolper et a1. (1987) have shown that it is virtually impossible to keep water out of nominally anhydrous C02-bearing samples in a piston-cylinder apparatus. Less than 0.3 wt % H20 is all that is required to reduce the viscosity of nominally anhydrous C02-bearing sanidine melts at 25 kbars.
.. '" ·0
-=
.....
.~
5.0
o
U
• Sanidine, lS00°C ... Sanidine, 1600°C
4.6
0.5
0.0
1.0
1.5
1.0
1.5
wt % dissolved volatile
5.0,
Sanidine
(b)
lS00°C, 25 kbars ",.5
4.0
.~
3.5
.;: 2.5
0.5
1.0
1.5
2.0
1.5
wt % dissolved volatile
Albite,1400°C
4.4
u 4.0
.;: '"
3.8
.::""
3.6 3.4 3.2 14
16
18
20
Pressure
22
(kbar)
26
Figure 12. A plot of log viscosity of albite melt at 1400° (Brearley and Montana, 1989) and sanidine melt at 1500 and 1600°C (White and Montana, 1990) as a function of pressure.
viscosity at 20 versus 25 kbar (at 1500°C) is variable water contamination. White and Montana (1990) acknowledged that it is virtually impossible to completely eliminate the presence of H20 in their piston-cylinder experiments, which are characterized by run durations of 3 to 45 minutes. Fine and Stolper (1985) found that in their C02-speciation studies of nominally anhydrous sodium aluminosilicate liquids, piston-cylinder run durations of only 30 minutes led to total water concentrations in the samples that ranged
Lange: H20. C02. F; Effects on Melt Density and Viscosity
361
from 0.10 to 0.65 wt %. At these low concentrations, virtually all of the water is dissolved as hydroxyl groups and would exert a strong influence on measured melt viscosities. From Figure II b, in which the effect of dissolved H20 and C02 on sanidine melt viscosity are compared, it can be seen that less than 0.3 wt % H20 is all that is required to reduce the viscosity of the C02-bearing sanidine melt to the values obtained at 25 kbar. As a consequence, it is not possible to attribute the reduction in sanidine melt viscosity at 25 kbar to the presence of dissolved C02 alone until the water concentration of each experimental charge has been determined by spectroscopic methods. Moreover, if there is a small concentration of water in the C02-bearing sanidine melts, then the presence of both dissolved water and C02 will contribute an entropy of mixing term to the configurational entropy of the melt, which should further reduce melt viscosity. (a)
Albite,
4.50
~
1400°C
Dry O.SOwt % C02
4.25
Q
Co
-
4.00
~
3.75
~ -;; "> OJ)
.s
3.50
3.25
+-~--r~---'r-~..,.....~---r~-..---..., 14
16
18
20
Pressure
22
24
26
(kbar)
(b)
Sanidine,
4.50
OJ
'" ~ ~ '"0
~ .:;
4.25
4.00
3.75
OJ)
~
lS00°C
Dry 0.50
3.50
wt
% C02
3.25 14
16
18
20
Pressure
22
(kbar)
26
Figure 13. A comparison of the effect of 0.5 wt % CO2 on the viscosity of albite and sanidine melts (Brearley and Montana. 1989; White and Montana. 1990).
A comparison of the effect of dissolved CD2 on the viscosity of albite versus sandine liquid is shown in Figure 13 as a function of pressure. The measurements of Brearley and Montana (1989; Fig. 13a) indicate that the effect of 0.5 wt % CQz is to reduce the viscosity of albite liquid by -0.15 log units at 1400°C. In contrast, the measurements of White and Montana (1990; Fig. 13b) indicate that 0.5 wt % C02 reduces the viscosity of sanidine liquid by -0.30 log units at 15()()°C. Although the effect of C02 is more pronounced in sanidine versus albite melt, it is significantly less than the effect of dissolved water on the viscosity of sanidine melt as seen in Figure 11, particularly at 20 kbar. From the C02 speciation measurements of Fine and Stolper (1985) and Stolper et ai. (1987) on albite liquid, it is well established that C02 dissolves both as molecular CD2 and
362
Lange: H20, C02, F; Effects on Melt Density and Viscosity
as a carbonate species. At a concentration of -0.50 wt % total C02, 20 kbar pressure and 1450°C, the concentration of molecular CQz is -0.39 wt % and that of C032- is -0.14 wt % in albite melt (Stolper et al., 1987). Given a total dissolved CD2 concentration of 0.5 wt %, if molecular C02 exerts little influence on the structure and hence viscosity of albite liquid, then it is not surprising that the effect of -0.14 wt % dissolved carbonate is to reduce the viscosity by only -0.15 log units. The fact that 0.5 wt % C02 appears to have a more pronounced effect on the viscosity of sanidine melt may indicate a higher proportion of total C02 dissolved as carbonate in sanidine versus albite melt under otherwise similar conditions. The effect of 2 wt % C02 on the viscosity of a depolymerized melt composition, NaCaAlSi207, was also explored by Brearley and Montana (1989). From the results of Fine and Stolper (1985), Stolper and Holloway (1988), and Pan et ai. (1991), it is anticipated that virtually all of the CD2 is dissolved as carbonate. From the viscosity data plotted in Figure 14 it is clear that 2 wt % CD2 has no measurable effect on the viscosity of sodium melilite liquid. Nor is there any resolvable pressure effect between 10 and 20 kbar, either dry or with 2 wt % CD2.
NaCaAISi207 1.45
~
1.35
-=
1.25
'"' .;:: '"
"
1.15
.s
1.05
·0
!:' .;;;
..
•
14S0·C
0
Dry :2 wt % CO2
+
f
0
I
f
•
t
0.95 8
10
11
1~
Pressure
16
18
10
22
(kbar)
Figure 14. The effect of 2 wt % C02 on the viscosityof sodiummelilite (NaCaAlSi207) liquidas a functionof pressure. Errorson log viscosity are ±O.l for this extremely fluid composition(Brearelyand Montana,1989).
The general conclusion that can be drawn from these initial studies is that regardless of its speciation, dissolved CQz appears to have a minimal effect on silicate melt viscosity. In those experiments where the measured viscosities of CD2-bearing melts are significantly reduced, it is unclear how much can be attributed to small concentrations (~0.3 wt %) of dissolved water. The importance of analyzing each experimental charge for both H20 and CD2 cannot be overemphasized, in order to fully resolve the influence of dissolved C02 on silicate melt viscosity. The effect of F on silicate melt viscosities The effectiveness of F as an agent to reduce the viscosity of silicate melts has been utilized for centuries in the glass and ceramics industry. Experimental work conducted by these two industries over the past fifty years has been primarily applied to AI-poor slag melts at one bar (e.g., Owens-Illinois Glass Company, General Research Laboratory, 1944; Hirayama and Camp, 1969). An exception is the work of Bills (1963) on CaOAI203-Si02-CaF2 liquids, also at one bar. As discussed below, the effect of F on the viscosity of AI-free vs. AI-bearing silicate melts is significantly different, and only the latter
Lange: H20, C02, F; Effects on Melt Density and Viscosity
363
liquids are relevant to the study of magmas. In the recent geologic literature, viscosity measurements on F-bearing silicate melts have been performed both at one bar by concentric cylinder viscometry (five sodium aluminosilicates and diopside; Dingwell et al., 1985; Dingwell, 1989) and at elevated pressure (2.5 to 22.5 kbar) on molten albite by falling sphere viscometry (Dingwell and Mysen, 1985; Dingwell, 1987). Of all the volatile components considered in this chapter, fluorine is by far the most soluble in silicate melts at one bar, thus allowing viscosity measurements to be performed on F-rich liquids at atmospheric pressure. A comparison of the effect of fluorine on the viscosity of molten albite (0 versus 5.8 wt % F) and molten diopside (0 versus 4.7 wt % F) is shown in Figure 15 as a function of inverse temperature at one bar. Most obvious is the pronounced effect that F has on reducing the viscosity of fully polymerized, AI-bearing melts such as albite relative to depolymerized, AI-free melts such as diopside. Although some ultrapotassic, mantlederived melts (i.e., lamproites) can contain up to 2 wt % F (Aoki et ai., 1981), the measurements of Dingwell (1989) indicate that this amount of F in a lamproite melt will reduce viscosity by less than 0.2 log units. In sharp contrast, at low temperatures « I 100°C) the effect of almost 6 wt % F is to reduce the viscosity of albite melt by more than 3 log units. It is quite clear that fluorine will have a marked effect on the magma chamber dynamics and eruptive style of high-silica rhyolites. This is confirmed by field studies of F-rich topaz rhyolites that erupted to form unusually long lava flows with little pyroclastic activity (Christiansen et al., 1983).
8
-
~ ~ -;
!:'
........
6
.riJ
5
·w
4
..
3
-;:
• • •
albite (dry)
.s
;:
000 0
i
•
0
0
00 0 albite (S.8~ Fl
cPO
diopside (dry)
• .,..I!b
diopside (~.7~ Fl
0
4.5
5.5
6.S
lOOOO·(1/T)
7.5
Figure 15. A comparison of the effect of fluorine on albite vs. diopside liquid vis-cosity. Data are from the 1 bar concentric cylinder viscosity measurements of Urbain et al. (1982) for dry albite, Scarfe et al. (1983) for dry diopside, Dingwell et al. (1985) for albite with 5.8 % F, and Dingwell (1989) for diopside with 4.7 % F.
As observed for H20, the reduction in aluminosilicate melt viscosity caused by dissolution of fluorine is strongly dependent on temperature. In the case for albite, the effect of 5.8 wt % F is to reduce melt viscosity by more than 3 log units at 1100°C and less than 1 log unit at 1600°C. The cause for this strong temperature dependence is related to the marked difference in the respective slopes of log viscosity versus Iff curves for the Fbearing and F-free albite melts. The slope of each curve is proportional to the parameter Be in Equation (27), which is the energy barrier to a change in configurational states and is considerably lower in the F-bearing albite melt. The implication is that the intermediate step for viscous flow is more readily accessible in the F-bearing than the F-free albite melt. As discussed above, recent NMR studies have led to suggestions that five- and six-fold coordinated Si and Al may serve as intermediates in QII species exchange and viscous flow (Stebbins et al., 1992). This interpretation is consistent with NMR evidence for five- and six-fold coordinated aluminum fluoride complexes (Kohn et ai., 1991; Schaller et al., 1992) in sodium aluminosilicate glasses. Moreover, the removal of AI from the tetrahedral
364
Lange: H20, C02, F; Effects on Melt Density and Viscosity
network by complexing with F will cause depolymerization of the melt and a consequential reduction in viscosity. Although both water and fluorine significantly reduce aluminosilicate melt viscosities, the solution mechanism of F appears to be entirely different from that of H20 (Kohn et al., 1989). A comparison of the effect of 5.8 wt % F versus 2.8 wt % H20 on albite melt viscosity as a function of pressure is shown in Figure 16 (Dingwell and Mysen; 1985). Although dissolved water appears to be far more effective than dissolved fluorine on a weight per cent basis, concentrations of 5.8 wt % F and 2.8 wt % H20 (in albite) are similar in terms of the molar quantity X1(X+O) where X= F,OH. The effect of the two volatiles on melt viscosity is therefore nearly equivalent on a molar basis; dissolved hydroxyl is somewhat more effective in reducing melt viscosity (-0.3 log units difference between the two components at 15 kbar and 1400°C). The most effective reduction in melt viscosity is acheived, however, when both hydroxyl and fluorine ions are present. The configurational mixing contribution to the viscosity is substantial at l000°C (0.6 log units) as seen in the data of Dingwell (1987) and discussed above in the section on the effect of H20 on melt viscosity. 6
Albite
1400eC "'dry 5.8 wt'i F • 1.S wt"" H2O
c::
¤...
.. ">
4
e
3
2+-~-r--~----~--~--~--~ o 5 10 IS lO !S Pressure
(kbar )
30
Figure 16. A comparison of the effect of fluorine (5.8 wt %) vs. water (2.8%) on the viscosity of molten albite as a function of pressure.
Toward a comprehensive model equation for silicate melt viscosity Many more measurements of silicate melt viscosity containing a wide variety of volatile components, including Cl and S03, are required before a general model equation applicable to a wide variety of magmatic liquids becomes available. The experiments that are sparse are those at low temperatures, where the effect of variable composition on melt viscosity is particularly strong. Of all the volatile components, H20 and F are by far the most important to silicate melt viscosity models. What has not yet been taken into account, however, in current viscosity models (e.g., Shaw, 1972) is the strong temperature dependence to the effect of water on melt viscosity. Because this can be understood using the theory of configurational entropy, successful development of a general model should be based on this concept. ACKNOWLEDGMENTS Support from the National Science Foundation (EAR-9219070) is acknowledged. This manuscript was significantly improved by comments from N. Bagdassarov, M. Carroll, E. Essene, W.O. Ernst, P. Richet, Y. Zhang, and one anonymous reviewer.
Lange: H20, C02. F; Effects on Melt Density and Viscosity
365
REFERENCES Adam G, Gibbs JH (1%5) On the temperature dependence of cooperative relaxation properties in glassforming liquids. J Chem Pbys 43: 139-146 Agee CB, Walker D (1993) Olivine flotation in mantle melt. Earth Planet Sci Leu 114:315-324 Anderson AT, Newman S, Williams SN, Druitt TH, Skirius C, Stolper E (1989) H20, CQz, CI, and gas in Plinian and ash-flow Bishop rhyolite. Geology 17:221-225 Angell CA, Cheeseman PA, Tamaddon S (1983) Water-like transport property anomalies in liquid silicates investigated at high T and P by computer simulation techniques. Bull Mireral 106:87-97 Aoki K, Ishikawa K, Kanisawa S (1981) Fluorine geochemistry of basaltic rocks from continental and oceanic regions and petrogenetic application. Contrib Mineral Petrol 76:53-59 Bagdassarov NS, Dingwell DB (1992) A rheological investigation of vesicular rhyolite. J Volcanol Geothenn Res 50:307-322 Bagdassarov NS, Dingwell DB (1993) Frequency dependent rheology of vesicular rhyolite. J Geophys Res 98:6477-6487 Bailey JC (1977) Fluorine in granitic rocks and melts: a review. Chem Geol 19:2-42 Bartholomew RF, Butler BL, Hoover HL, Wu CK (1980) Infrared spectra of water-containing glass. J Am Ceram Soc 63:481-485. Bills PM (1963) Viscosities in silicate slag systems. Joumal of the Iron and Steel Institute 201:133-140 Blank JG, Stolper EM, Carroll MR (1993) Solubilities of carbon dioxide and water in rhyolite melt at 850°C and 750 bars. Earth Planet Sci Leu 119:27-36 Bockris JOM, Tomlinson JW, White JL (1956) The structure of the liquid silicates: partial molar volumes and expansivities. Faraday Soc Trans 52:299-310 Bottinga Y, Weill D (1970) Densities of liquid silicate systems calculated from partial molar volumes of oxide components. Am J Sci 269:169-182 BoUinga Y, Weill DF (1972) The viscosity of magmatic silicate liquids: A model for calculation. Am J Sci 272:438-475 Brawer S (1985) Relaxation in Viscous Liquids and Glasses. American Chemical Society, Columbus, Ohio Brearley M, Montana A (1989) The effect of C02 on the viscosity of silicate liquids at high pressure. Geochim Cosmochim Acta 53:2609-2616 Brearley M, Dickinson JE, Scarfe CM (1986) Pressure dependence of melt viscosities on the join diopsidealbite. Geochim Cosmochim ACIa 50:2563-2570 Brey G, Green DH (1975) The role of C(h in the genesis of olivine melilitite. Contrib Mineral Petrol 49:93-103 Brodholt JP, Wood BJ (1993) Simulations of the structure and thennodynamic properties of water at high pressures and temperatures J Geophys Res 98:519-536 Burnham CW, Davis NF (1971) The role of H20 in silicate melts. 1. P-V-T relations in the system NaAlSi30g-H20 to 10 kilobars and 1000 °C. Am J Sci 270:54-79 Burnham CW, Holloway JR, Davis NF (1969) The specific volume of water in the range 1000 to 8900 bars, 20 to 900 Am J Sci 267-A:70-95 Christensen IN, DePaulo DJ (1993) Time scales of large volume silicic magma systems: Sr isotopic systematics of phenocrysts and glass from the Bishop Tuff, Long Valley, California Contrib Mineral Petrol, 113:100-114 Christiansen EH, Sheridan MF, Burt DM (1983) The geology and geochemistry of Cenozoic topaz rhyolites from the western United Slates. Geol Soc Am Special Paper 205, 82 P Clague DA, Frey FA (1982) Petrology and trace elemeny geochemistry of the Honolulu volcanics, Oahu: implications for the ocean mantle below Hawaii. J PetroI23:447-504 Congdon RD, Nash WP (1988) High-fluorine rhyolite: an eruptive pegmatite magma at the Honeycomb Hills, Utah. Geology 16:1018-1021 Danyushevsky LV, Falloon TJ, Sobolev AV, Crawford, AJ, Carroll M, Price RC (1993) The H20 content of basalt glasses from Southwest Pacific back-arc basins. Earth Planet Science Leu 117:347-362 Dickinson JE, Scarfe CM, McMillan P (1990) Physical properties and structure of K2Si409 melt quenched from pressures up to 2.4 GPa. J Geophys Res 95:15675-15682 Dingwell DB (1987) Melt viscosities in the system NaAlSi30g-H20-F20.t. In: Mysen BO (ed) Magmatic Processes: Physiochemical Principles. The Geochemical Society, Spec Pub 1:423-431 Dingwell DB (1989) Effect of fluorine on the viscosity of diopside liquid. Am Min 74:333-338 Dingwell DB (1992) Density of some titanium-bearing silicate liquids and the compositional dependence of the partial molar volume of Ti02. Geochim Cosmochim ACIa 56:3403-3408 Dingwell DB, Bagdassarov NS, Bussod GY, Webb SL (1993) Magma rheology. In: Luth RW (ed) Experiments at High Pressure and their Applications to the Earth, Short Course Handbook. Mineralogical Association of Canada 21: 131-196. Dingwell DB, Brearley M (1988) Melt densities in the CaO-FeO-Fe203-Si02 system and the
0c.
366
Lange: H20. C02. F; Effects on Melt Density and Viscosity
compositional dependence of the partial molar volume of ferric iron in silicate melts. Geochim Cosmochim Acta 52:2815-2825 Dingwell DB, Knoche R, Webb SL (1993) The effect of F on the density of haplogranite melt. Am Min 78:325-330 Dingwell DB, Mysen BO (1985) Effects of water and fluorine on the viscosity of albite melt at high pressure: a preliminary investigation. Earth Planet Sci Leu 74:266-274 Dingwell DB, Scarfe CM, Cronin DJ (1985) The effect of fluorine on viscosities in the system Na20Al2OJ-Si02: implications for phonolites, trachytes and rhyolites. Am Min 70:80-87 Dingwell DB, Webb SL (1990) The onset of non-newtonian rheology of silicate melts: A fiber elongation study. Pbys Chem. Minerals 17:125-132 Dixon JE, Stolper EM, Holloway JR (1994) An experimental study of water and carbon dioxide solubilities in mid-oceanic ridge basaltic liquids. J Petrol (in press) Eckert H, Yesinowski JP, Stolper EM, Stanton TR, Holloway, JR. (1987) The state of water in rhyolitic glasses: a deuterium NMR study. J Non-Cryst Solids 93:93-114. Ecken H, Yesinowski JP Silver LA, Stolper EM (1988) Water in silicate glasses: quantitation and f structural studies by H solid echo and MAS-NMR methods. J Chern Phys 92:2055-2064 Eggler DH (1978) The effect of CO2 upon paniaI melting of peridotite in the system Na20-CaO-AI203MgO-Si02-C02 to 35 kb, with an analysis of melting in a peridotite-H20-C02 system. Am J Sci 278:305-343 Farnan I, Stebbins IF (1990) A high-temperature 29Si NMR investigation of solid and molten silicates. J Am Chern Soc 112:32-39 Fine G, Stolper E (1985) Dissolved carbon dioxide in basaltic glasses: Concentrations and speciation. Earth Planet Sci Lett 76:263-278 Fine G, Stolper E (1986) The speciation of carbon dioxide in sodium aluminosilicate glasses. Contrib Mineral Petro191:105-121 Friedman I, Long W, Smith RL (1963) Viscosity and water content of rhyolite glass. J Geophys Res 68:6523-6535 Geschwind CH, Rutherford MJ (1992) Cummingtonite and the evolution of the Mount St. Helens (Washington) magma system: an experimental study. Geology 20:1011-1014. Grjotheim K, Matiasovsky K, Danek V, Stubergh JR (1990) Electrochemical deposition of metals; alloys and oxygen from natural minerals - I. Physicochemical properties of molten cryolite-potassium feldspar mixtures. Canad Meta1l Quart 29:39-42 Halliday AN, Mahood GA, Holden P, Metz JM, Dempster TJ, Davidson JP (1989) Evidence for long residence times of rhyolitic magma in the Long Valley magmatic system: the isotopic record in precaldera lavas of Glass Mountain. Earth Planet Sci Lett 94:274-290 Harris DM, Anderson AT (1984) Volatiles H20, C02, and Cl in a subduction related basalt. Contrib Mineral Petrol 87:120-128 Heinrich EW (1966) The Geology of Carbonates. Rand McNally, New York. Hervig RV, Dunbar N, Westrich HR, Kyle PR (1989) Pre-eruptive water content of rhyolitic magmas as determined by ion microprobe analyses of melt inclusion in phenocrysts. J Volcanol. Geotherm. Res 36:293-302 Hildreth WE (1977) The magma chamber of the Bishop Tuff: gradients in temperature, pressure, and composition. Ph.D. thesis, University of Califomia, Berkeley. Hirayama C, Camp E (1969) The effect of fluorine and chlorine substitution on the viscosity and fining of soda-lime and potassium-barium silicate glass. Glass Tech 10:123-127 Hodges FW (1974) The solubility of H20 in silicate melts. Carnegie Inst. Wash. Year Book 73:251-255 Holloway JR (1977) Fugacity and activity of molecular species in supercritical fluids. In: Fraser DG (ed) Thermodynamics in Geology. DReidel, Dordrectht, Holland, p 161-181. Hummel W, Arndt J (1985) Variation of viscosity with temperature and composition in the plagioclase system. Contrib Mineral Petrol 90:83-92 Ihinger PD (1991) An experimental study of the interaction of water with granitic melt. Ph.D. thesis, California Institute of Technology Kanzaki M (1987) Physical properties of silicate melts at high pressures Ph.D. thesis, Geophysical Institute, University of Tokyo, Tokyo, Japan Kanzaki M, Kurita K, Fujii T, Kato T, Shimomura 0, Akimoto S (1987) A new technique to measure the viscosity and density of silicate melts at high pressure. In: Manghnani MH and Syono Y (eds) Highpressure research in mineral physics. Geophysical Monograph 39:195-200. Am Geophys Union, Washington, D.C. Kogarko LN, Krigman LD (1981) Fluorine in Silicate Melts and Magmas. 159 p Nauka, Moscow. Kohn SC, Dupree R, Smith ME (1989) A multinuclear magnetic resonance study of the structure of hydrous albite glasses. Geochim Cosmochim Acta 53:2925-2935 Kobn SC, Dupree R, Monuza MG, Henderson CMB (1991) NMR evidence for five- and six-coordinated
Lange: H20, C02, F; Effects on Melt Density and Viscosity
367
aluminum fluoride complexes in F-bearing aluminosilicate glasses. Am Min 76:309-312 Kovalenko VI, Hervig RL, Sheridan MF (1988) Ion microprobe analyses of trace elements in anorthoclase, hedenbergite, aenigmatite, quartz, apatite and glass in pantellerite. Am Min 73: 1038-1045 Kovalenko VI, Hervig RL, Schauer S (1989) Volatile contents of pantellerites. New Mex Bur Mines Mineral Resource Bull 131:156 Kraynik AM (1988) Foam flows. Ann Rev Fluid Mech 20:325-357 Kress VC, Williams Q, Carmichael ISE (1988) Ultrasonic investigation of melts in the system Na20Al203-Si02. Geochim Cosmochim Acta 52:283-293 Kress VC, Carmichael ISE (1991) The compressibility of silicate liquids containing Fe203 and the effect of composition, temperature, oxygen fugacity and pressure on their redox states. Contrib Mineral Petrol 108:82-92 Kubicki JD, Lasaga AC (1988) Molecular dynamic simulations of Si02 melt and glass: ionic and covalent models. Am Min 73:941-955 Kushiro I (1978) Density and viscosity of hydrous calc-alkaline andesite magma at high pressure. Res Carnegie Inst Wash Yearbk 77:675-677 Lange RA (1993) Densities of Ti02-bearing silicate melts: evidence for composition-induced coordination change of Ti4+. Geol Soc Am Abastr Programs 25:A212 Lange RA and Carmichael ISE. (1987) Densities of Na20-K20-CaO-MgO-FeO-Fez03-Al203Ti02-Si02 liquids: new measurements and derived partial molar properties. Geochim Cosmochim Acta 53:21952204 Lange RA, Carmichael ISE (1989) Ferric-ferrous equilibria in Na20-FeO-Fe203-Si02 melts: effects of analytical techniques on derived partial molar volumes. Geochim Cosmochim Acta 53:2195-2204 Lange RA, Carmichael ISE (1990) Thermodynamic properties of silicate liquids with emphasis on density, thermal expansion and compressibility. In: Nicholls J and Russell JK (eds) Modern Methods of Igneous Petrology. Rev Mineral 24:25-64 Leonteva A (1940) Measurements of the viscosity of obsidian and of hydrated glasses (in Russian), Izv Akad Nauk SSSR, Ser Geol 2:44-54 Liu S-B, Stebbins JF, Schneider E, Pines A (1988) Diffusive motion in alkali silicate melts: an NMR study at high temperature. Geochim Cosmochim Acta 52:527-538 Lowenstern JB, Mahood GA (1991) New data on magmatic H20 contents ofpantellerites with implications for petrogenesis and eruptive dynamics at Pantelleria. Bull Volcanol 54:78-83 Manghnani MH, Sato H, Rai CS (1986) Ultrasonic velocity and attenuation measurements on basalt melts to 1500°C: role of composition and structure in the viscoelastic properties. J Geophys Res 91:93339342 Martin D, Griffiths RW, Campbell IH (1987) Compositional and thermal convection in magma chambers. Contrib Mineral Petrol 96:465-475 McKeown DA, Galeener FL., Brown GE 91984) Raman studies of AI coordination in silica-rich sodium aluminosilicate glasses and some related minerals. J Non-Cryst Solids 68:361-378 McMillan PW, Jakobsson S, Holloway JR, Silver LA (1983) A note on the Raman spectra of waterbearing albite glass. Geochim Cosmochim Acta 47:1937-1943 McMillan PW, Wolf GH, Poe BT (1992) Vibrational spectroscopy of silicate liquids and glasses. Chern GeoI96:351-366 Miller GH, Stolper EM, Ahrens TJ (1991) The equation of state of a molten komatiite. 1. Shock wave compression to 36 GPa J Geophys Res 96:11,831-11,848 Mysen BO (1990) Effects of pressure, temperature, and bulk composition on the structure and species distribution in depolymerized alkali aluminosilicate melts and quenched melts. J Geophys Res 95: 15733-15744 Mysen BO, Arculus RJ, Eggler DH (1975) Solubility of carbon dioxide in natural nephelinite, tholeiite and andesite melts to 30 kbar pressure. Contrib Mineral Petrol 53:239 Mysen BO, Eggler DH, Setiz MG, Holloway JR (1976) Carbon dioxide in silicate melts and crystals. Part I. Solubility measurements. Am J Sci 276:455-479 Neuville D, Richet P (1991) Viscosity and mixing in molten (Ca, Mg) pyroxenes and garnets. Geochim Cosmochim Acta 55:1011-1019 Neuville D, Courtial P, Dingwell DB, Richer P (1993) Thermodynamic and rheological properties of rhyolite and andesite melts. Contrib Mineral Petrol 113:572-581 Newman S, Stolper EM, Epstein S (1986) Measurement of water in rhyolitic glasses: Calibration of an infrared spectroscopic technique. Am Min 86:1527-1541 Newman S, Epstein S, Stolper EM (1988) Water, carbon dioxide, and hydrogen isotopes in glasses from the ca. 1340 A.D. eruption of the Mono Craters, California: constraints on degassing phenomena and initial volatile content J Volcanol Geotherm Res 35:75-96 Nicholls J, Carmichael ISE (1969) Peralkaline acid liquids: a petrological study. Contrib Mineral Petrol 20:268-294
368
Lange: H20, C02, F; Effects on Melt Density and Viscosity
Nogami M, Tomozawa M (1984) Effect of stress on water diffusion in silica glass. J Am Ceram Soc 67:151-154 Orlova GP (1962) The solubility of water in albite melts. lot Geol Rev 6:254-258 Ostrovskiy lA, Orlova GP, Rudnitskaya YS (1964) Stoichiometry in the solution of water in alkalialuminosilciate melts. DokJady Akad Nauk SSR 157: 149-151 Owens-Illinois Glass Company, General Research Laboratory (1944) Effect of fluorine and phosphorous pentoxide on properties of soda-dolomite lime-silica glass. J Am Ceram Soc 27:369-372 Paillat 0, Elphick EC, Brown WL (1992) The solubility of water in NaAlSi308 melts: a re-examination of Ab-H20 phase relationships and critical behavior at high pressures Contrib Mineral Petrol 112:490-
500 Pan V, Holloway JR, Hervig RL (1991) The pressure and temperature dependence of carbon dioxide solubility in tholeiitic basaltic melts. Geochim Cosmochim Acta 55:1587-1596 Persikov ES, Zharikov VA, Bukhtiyarov PG, Pol'skoy SF (1990) The effect of volatiles on the properties of magmatic melts. Eur J Mineral 2:621-642 Richet P (1984) Viscosity and configurational entropy of silicate melts. Geochim Cosmochim Acta 48:471-483 Richet P, Robie RA, Hemingway BS (1986) Low-temperature heat capacity of diopside glass (CaMgSi206): a calorimetric test of the configurational entropy theory applied to the viscosity of liquid silicates. Geochim Cosmochim Acta 50:1521-1533 Rigden SM, Ahrens TJ, Stolper EM (1989) High pressure equation of state of molten anorthite and diopside. J Geophys Res 94:9508-9522 Rivers ML, Carmichael ISE (1987) Ultrasonic studies of silicate melts. J Geophys Res 92:9247-9270 Rubie DC, Ross CR, Carroll MR, Elphick SC (1993) Oxygen self-diffusion in Na2Si409 liquid up to 10 GPa and estimation of high-pressure melt viscosities. Am Min 78:574-582 Sabatier G (1956) Influence de la teneur en eau sur la viscosite d'une reunite, verre ayant la composition chimique d'un granite. C R Aca Sci 242:1340-1342 Saucier PH (1952) Quelques experience sur la viscosite 11 haute temperature de verres ayant la composition d'un granite. Influence de la vapeur d'eau sous pression. Bull Soc fr Min Cristallogr 75: 1-45 Saxena SK, Fei Y (1987) High pressure and high temperature fluid fugacities. Geochim Cosmochim Acta 51 :783-791. Scamehorn CA, Angell CA (1991) Viscosity-temperature relations in fully polymerized aluminosilicate melts from ion dynamics simulations. Geochim Cosmochim Acta 55:721-730. Scarfe CM (1986) Viscosity and density of silicate melts. In: Scarfe CM (ed) Silicate Melts: Their Properties and Structure Applied to Problems in Geochemistry, Petrology, Economic Geology, and Planetology, Short Course Handbook. Mineral Assoc'n Canada, 36-56 Scarfe CM, Mysen BO, Virgo D (1987) Pressure dependence of the viscosity of silicate melts. In: Mysen BO (ed) Magmatic Processes: Physiochemical Principles. Geochemical Society Spec Pub 1:59-67 Schaller T, Dingwell DB, Keppler H Kneller W, Merwin L, Sebald A (1992) Fluorine in silicate glasses: A multinuclear NMR study. Geochim Cosmochim Acta 56:701-707 Schilling I-G, Bergeron MB, Evans R (1980) Halogens in the mantle beneath the North Atlantic. Phil Trans Roy Soc Lond ser A 297:147-178 Seifert FA, Mysen BO, Virgo D (1981) Structural similarity of glasses and melts relevant to petrological processes. Geochim Cosmochim Acta 45:1879-1884 Shaw HR (1963) Obsidian-Hjf) viscosities at 1000 and 2000 bars in the temperature range 7OO-9OO°C. J Geophys Res 68:6337-6343 Shaw HR (1972) Viscosities of magmatic silicate liquids: an empirical method of prediction. Am J Sci 272:870-893 Shimizu N and Kushiro I (1984) Diffusivity of oxygen in jadeite and diopside melts at high pressures Geochim Cosmochim Acta 48:1295-1303 Silver LA, lhinger PD and Stolper E (1990) The influence of bulk composition on the speciation of water in silicate glasses. Contrib Mineral Petrol 104:142-162 Silver L and Stolper E (1989) Water in albitic glasses. Journal of Petrology, 30:667-7CFJ Sisson 1W, Grove TI.. (1993) Experimental investigations of the role of H20 in calc-alkaline differentiation and subduction zone magmatism. Contrib Mineral Petrol 113:143-166 Sisson 1W, Layne GD (1993) H20 in basalt and basaltic andesite glass inclusions from four subductionrelated volcanoes. Earth Planet Science Lett 117:619-635 Skirius CM, Peterson JW, Anderson AT (1990) Homogenizing rhyolitic glass inclusions from the Bishop Tuff. Am Min 75:1381-1398 Sparks RJS, Huppert HE, Turner JS (1984) The fluid dynamics of evolving magma chambers. Royal Soc Lond Phil Trans Ser A 310:511-534 Spera F" Bergman SC (1980) Carbon dioxide in igneous petrogenesis: I. Aspects of the dissolution of C02 in silicate liquids. Contrib Mineral Petrol 74:55-66
Lange: H20, C02, F; Effects on Melt Density and Viscosity
369
Stebbins JF (1991) NMR evidence for five-coordinated silicon in a silicate glass at atmospheric pressure. Nature 351:638-639 Stebbins JF, Farnan I (1992) Effects of high temperature on silicate liquid structure: a multinuclear NMR study, Science 255:586-589 Stebbins JF, McMillan P (1989) Five- and six-coordinated Si in K2Si409 liquid at 1.9 GPa and 1200°C. Am Min 74:965-968 Stebbins JF, Sykes 0 (1990) The structure of NaAlSi308 liquid at high pressure: new constraints from NMR spectroscopy. Am Min 75:943-946 Stebbins JF, Carmichael ISE, Moret LK (1984) Heat capacities and entropies of silicate liquids and glasses. Contrib Mineral PetroI86:131-148 Stebbins JF, Farnan I, Xue X (1992) The structure and dynamics of alkali silicate liquids: A view from NMR spectroscopy. Chem Geol 96:371-385 Stebbins JF, Murdoch JB, Schneider Ei Carmichael ISE, Pines A (1985) A high temperature nuclear magnetic resonance study of 27AI, 3Na, and 29Si in molten silicates. Nature 314:250-252 Stein OJ, Spera FJ (1992) Rheology and microstructure of magmatic emulsions: theory and experiments. J Volcanol Geotherm Res 49:157-174 Stein OJ, Spera FJ (1993) Experimental rheometry of melts and supercooled liquids in the system NaAISi04-Si02: implications for structure and dynamics. Am Min 78:710-723 Stolper EM (1982a) Water in silicate glasses: an infrared spectroscopy study. Contrib Mineral Petrol 94:178-182 Stolper EM (1982b) The speciation of water in silicate melts. Geochim Cosmochim Acta 46:2609-2620 Stolper E (1989) Temperature dependence of the speciation of water in rhyolitic melts and glasses. Am Min 74:1247-1257 Stolper E, Fine G, Johnson T, Newman S (1987) The solubility of carbon dioxide in albitic melt Am Min 72:1071-1085 Stolper E, Holloway JR (1988) Experimental determination of the solubility of carbon dioxide in molten basalt at low pressure. Earth Planet Sci Lett 87:397-408 Stolper E, Newman S (1994) The role of water in the petrogenesis of Mariana trough magmas. Earth Planet Sci Lett 121:293-325 Taniguchi H (1992) Entropy-dependence of viscosity and the glass-transition temperature of melts in the system diopside-anorthite. Contrib Mineral Petrol 109:295-303 Thibault Y, Holloway JR (1994) Solubility of CO2 in Ca-rich leucitite: effects of pressure, temperature and oxygen fugacity. Contrib Mineral Petrol 116:216-224 Tuttle OF, Gittens J (eds) (1966) Carbonatites. Interscience 591 p Urbain G, Bottinga Y and Richet P (1982) Viscosity of liquid silica, silicates and aluminosilicates. Geochim Cosmochim Acta 46:1061-1072 Webb SL, Dingwell DB (1990) The onset of non-Newtonian rheology of silicate melts. Phys Chem Min 17:125-132 Webb SL, Knoche R, Dingwell DB (1992) Determination of silicate liquid thermal expansivity using dilatometry and calorimetry. Eur J Mineral 4:95-104 Webster JD, Duffield WA (1991) Pre-eruptive concentrations of volatiles and lithophile elements in Taylor Creek Rhyolite: analysis of glass inclusions in quartz phenocrysts. Am Min 76:1628-1645 Wendlandt RF, Mysen BO (1978) Melting phase relations of natural peridotite and C02 as a function of degree of partial melting at 15 and 30 kbar. Carnegie Inst Wash Year Book 77:756-761 White BS, Montana A (1990) The effect of H20 and CO2 on the viscosity of sanidine liquid at high pressures J Geophys Res 95:15,683-15,693 White WB, Minser DO (1984) Raman spectra and structure of natural glasses. J Non-Cryst Solids 67:45-49 Wilding MC, Macdonald R, Davies JE, Fallick AE (1993) Volatile characteristics of peralkaline rhyolites from Kenya: an ion microprobe, infrared spectroscopic and hydrogen isotope study. Contrib Mineral Petrol 114:264-275 Wyllie P (1967) Ultramafic and Related Rocks. Wiley, New York Xue X, Stebbins JF, Kanzaki M, McMillan P, Poe B (1991) Pressure-induced silicon coordination and tetrahedral structural changes in a1kaIi oxide-silica melts up to 12 GPa: NMR, Raman, and infrared study. Am Min 76:8-26 Zhang Y (1993) Pressure dependence of the speciation of water in rhyolitic glasses. Trans. Am Geophys Union 74:631 Zhang Y, Stolper EM, Ihinger PO (1989) Reaction kinetics of H20 + 0 = 2 OH and its equilibrium, revisited. V.M. Goldschmidt Conference Abstr, p 94 Zhang Y, Stolper EM, Wasserburg GJ (1991) Diffusion of water in rhyolitic glasses. Geochim Cosmochim Acta 55:441-456
Chapter
10
DIFFUSION IN VOLATILE-BEARING MAGMAS E. Bruce Watson Department of Earth and Environmental Sciences Rensselaer Polytechnic Institute Troy, New York 12180 USA INTRODUCTION The role of volatiles in determining the phase equilibria, physical properties and eruption dynamics of magmas has been an area of intensive investigation for several decades. Indeed, this "Reviews" volume is a testimonial not only to the perceived importance of magmatic volatiles, but also to the magnitude of the intellectual effort put toward their understanding. In the context of the long history of research into the nature and effects of magmatic volatiles, investigations focusing specifically upon diffusion came on the scene relatively recently, beginning with a ground-breaking effort by H.R. Shaw (1974) published just twenty years ago. This late attention to diffusion can probably be attributed in part to the former tendency among experimentalists to concentrate upon strictly equilibrium phenomena, and perhaps also to the limited availability of analytical instruments suitable for high-resolution, in-situ characterization of dissolved volatile concentrations. Despite a general paucity of volatile-related diffusion data prior to the late 1970s, theorists and experimentalists alike had developed a strong suspicion that dissolved volatiles (water in particular) have a strong enhancing effect on diffusion-theorists because they appreciated the inverse correlation between viscosity and diffusion embodied in the Stokes-Einstein equation, and experimentalists because they routinely observed that crystals grew bigger and faster in hydrous melts than in dry melts of the same composition at the same temperature. The purpose of this chapter is to summarize the results of experimental studies that have contributed to our present understanding of diffusion in magmas containing dissolved volatiles. Two kinds of investigation are recognized here and treated in separate sections: those focusing on diffusion of volatiles themselves, and those addressing the effects of dissolved volatiles upon diffusion of other magmatic components. In order to keep the scope of the chapter manageable, only passing references are made to diffusion of volatiles in solid glasses, though a sizable literature on this topic does exist (especially for water in Si02). To assist readers who may be unfamiliar with basic diffusion theory or with experimental techniques used in characterizing diffusion in melts containing dissolved volatiles, a brief, practical overview of these subjects is provided in the sections immediately following. OVERVIEW Nature
and theoretical
OF BASIC DIFFUSION
conceptualizations
THEORY
of diffusion
Definitions. In this chapter and in most correct usages of the word, "diffusion" refers to the translational motion of atoms or molecules dissolved in a phase; in general, the reference frame for gauging motion is the lattice or structure of the phase of interest.
372
Watson: Diffusion in Volatile-bearing Magmas
Relatively inexplicit volatile-related magmatic processes such as "vapor-phase transport" and "volatile streaming" fall outside the realm of what can be called strictly diffusion, and so are not discussed in this chapter. Diffusion theory is typically put forth in separate but complementary approaches: atomistics (deductions based upon consideration of the random motion of individual atoms) and phenomenology (presentation of the empirical equations governing diffusion in a continuum). Available space in this chapter (and expertise of the writer!) precludes comprehensive treatment of these approaches, but a brief and selective overview will expedite the clear presentation of data and concepts later in the chapter. For a more indepth review of diffusion theory, the reader is referred to Manning (1968), Shewmon (1989) and Cussler (1984). This last volume is an especially readable presentation of theory and applications of diffusion to mass transport in liquid and/or gas systems; it is laden with interesting examples and solved problems on topics ranging from ion-exchange columns to artificial kidneys (no geology, unfortunately). Atomistics. Classic atomistic treatments of diffusion are based upon a crystalline lattice characterized by a limited number of site types (usually just one). This framework is not very realistic for magmatic liquids, in which long-range structure is lacking and site characteristics are determined at least in part by the identity of the occupying atom. Nevertheless, certain aspects of atomistic diffusion theory are readily transferable to molten silicates. It is still appropriate, for example, to consider a dissolved ion oscillating in a (momentarily) fixed position, at frequency u, as having the potential in any given oscillation cycle to leave its original position and "relocate" a small distance away. This displacement would constitute a diffusive "jump", and would amount to a net motion of the ion in the melt. Even in liquids, the fraction of oscillations that result in jumps is small, being given by exp(-E/kT), where E is the energy barrier that must be surmounted to achieve a jump (contributions to E include the breaking of bonds at the original site, as well as the transient, close approach to neighboring ions that accompanies a jump). In general, then, the jump frequency of a dissolved ion (in sec+) from a given position or site is given by f= u exp (-E/kT) (1) where u is the oscillation frequency (typically _1014 Hz), k is Boltzmann's constant and T is temperature in kelvins. Equation (1) applies to the totally random translational motion of an atom, ion or molecule in its host phase. If one could tag a specific atom and follow its progress, that atom would make periodic jumps in random directions, possibly even revisiting sites it occupied previously. This process is sometimes referred to as "random walk" diffusion, and it occurs in all substances regardless of the degree of initial heterogeneity (i.e., no concentration gradient is required). The values of E and u, of course, are affected not only by the identity of the diffusing species of interest, but also by its immediate atomic environment and the general structural (lattice) characteristics of the host phase. Recognizing the existence of random-walk diffusion is critical to appreciating the.meanings and distinctions among the terms chemical diffusion, self diffusion, isotopic diffusion and tracer diffusion (see section on "Kinds" of diffusion). In crystalline solids, the random atomic-jump process described above may involve one of several possible mechanisms, the most important of which are probably the vacancy (where the species of interest jumps into a near-neighbor vacant site), the interstial (where the diffusant is small enough to occupy a position between or among normal lattice sites)
373
Watson: Diffusion in Volatile-bearing Magmas
and the ring mechanism (in which simultaneous rotation of a cluster of atoms results in net motion of all of them). In cases where the vacancy mechanism operates, it is clear that the otherwise random-directional aspect of any single diffusive jump can be heavily biased by the presence of a neighboring vacancy. It is also clear that the frequency of jumps (hence the rate of diffusion) may be strongly dependent upon the concentration of vacancies. In magmas and other complex liquids, the conceptualization of diffusion as mechanismspecific may be a little tricky to defend; in fact, it seems likely that for network-modifying species in magmatic liquids (which most dissolved volatiles are), a variety of atomic migration mechanisms can operate, because there is some local flexibility in the way in which atoms fill space. In silicate melts, the main determinant of available diffusion mechanisms may well be the requirement that local charge balance be recovered once a jump has occurred. Atomistic models of diffusion take on directionality when a concentration gradient is introduced. Consider a series of closely-spaced planes (in a crystal, these would be lattice planes) perpendicular to a one-dimensional gradient (along x) in the concentration of B atoms (solid circles in Fig. 1). The flux of atoms from plane 1 to plane 2 can be described in terms of the jump frequency, 1, introduced previously. Recalling that the units of flux are atoms·area-l.time-l (the area being perpendicular to the flux direction), and avoiding reference to any diffusion mechanism, the net flux, J, from (1) to (2) is simply the number of atoms jumping from 1~ 2 minus the number jumping back (2~1): JI
->
2
=
nl(f IN)
- n2(f I N)
(2)
where nl,2 represent the densities of diffusant atoms on the specified plane and N is the number of possible jump directions (i.e., only one jump in N would move an atom from 1~2 or vice versa; in a metal, N would be six-the coordination number). Converting atom densities to concentrations (c = nio; where a. is the distance between planes), we have I I I I I I I I I I / / /
/ / /
/
distance
-7
--X----7 Figure 1. Atomistic representation of diffusion in the presence of a concentration gradient. Planes 1, 2, and 3 are separated by one atomic jump distance, a (in a crystal, this would be the lattice spacing), and are oriented perpendicular to a I-dimensional gradient in the concentration of B atoms (I), which decreases in the x direction (i.e., from left to right). Because the medium of interest is a melt, the atoms in each plane exhibit no long-range order. See text for discussion.
374
Watson: Diffusion in Volatile-bearing Magmas (3)
J 1->2=W 0, so essentially the same solution to the nonsteady-state diffusion equation applies to cases in which diffusion occurs from a surface held at constant concentration into a medium that is infinite in just one direction (i.e., semi-infinite). The relation describing concentration as a function of distance for this "constant surface" boundary condition is (cx•t- co)/(ci - co)
=
erf{x/(4Dt)1I2}
(18)
where ci is the initial concentration of diffusant in the sample of interest and Co is the surface concentration. This solution has been implemented for diffusion in volatile-bearing melts in several ways, including: (1) exposing an initially volatile-free specimen to an effectively infinite reservoir of fluid, thus generating uptake profiles in which the surface concentration of the dissolved volatile is equal to its solubility (and therefore constant over time); (2) annealing samples initially containing dissolved volatiles at conditions conducive to diffusive loss; and (3) partially dissolving minerals into volatile-bearing melts to evaluate the effect of dissolved volatiles on diffusion of the components of the dissolving mineral. In the last case above, the diffusant concentration is held constant at the surface of the dissolving mineral (x = 0) as dictated by the solubility of that mineral in the melt (see Fig. 4). The process of mineral dissolution actually results in a moving mineral/melt interface, thus invalidating Equation (18) as a rigorous description of Cx t vs. x in the melt. For highly insoluble minerals (e.g., apatite and zircon in silicic melts), the interface displacements involved in dissolution may have an insignificant effect on the diffusion gradient in the contacting melt, so the solution above is still serviceable for extracting diffusivities. (Strictly speaking, the volatile-uptake and -loss approaches also involve a moving interface if a change in volume accompanies dissolution or volatilization, but such effects are likely to be negligibly small). In the context of moving boundaries, it should be noted that analytical solutions to the nonsteady-state diffusion equation do exist for some moving-boundary situations (see Crank, 1975), and almost any degree of complication can be modeled numerically using [mite-difference techniques. In most situations, of course, it is the objective of the experimenter to design his or her experiments around the simplest possible data acquisition and reduction, keeping the number of variables to a minimum.
382
: :
i
-·
Watson: Diffusion in Volatile-bearing Magmas dissolving minerff
G
analytical
'.
traverse
quenched melt
C
""'__--q
Figure 4. Scbematic representation of chemical diffusion in a melt resulting from partial
mineral I melt
distance~
dissolution of a simple mineral. See text and Equation (18).
Diffusion in more than one dimension For certain problems in volatile diffusion, it is convenient to use what are best described as bulk-gain or bulk-loss experiments-i.e., ones in which a volatile component diffuses into or out of a sample over its entire surface area. Prior to the advent of in situ analytical techniques, this approach was necessary (as in Shaw's pioneering work on H20 diffusion in granitic melt) because, even though concentration profiles could not be determined, bulk loss or gain of a component could be gauged gravimetrically. Appropriate solutions to Equation (9) exist for dealing with situations in which diffusion occurs, for example, radial to the axis of a cylinder or the center of a sphere, and the only quantity that can be measured is the total amount of material diffused in or out (see Crank, 1975, pp. 90ff). In general, the diffusivity is assumed to be independent of concentration in applying such solutions, but characterization of the shape of sorption (or desorption) vs. (time)1I2curves can permit an assessment of the existence of any concentration dependence (e.g., Shaw, 1974; Jambon et al., 1992). Depending upon the uncertainty in measuring gain or loss of volatiles, and also upon the degree to which the sample approaches an ideal shape (sphere, cylinder, etc.), D values resulting from bulk sorption or desorption can have relatively high uncertainties. Even if an in situ analytical technique is available for a component of interest, it may still be convenient to use a spherical sample geometry-e.g., a melt droplet in contact with an atmosphere that serves as a source or sink for the volatile of interest. Such a case involves radial diffusion, and the resulting concentration profiles differ from those caused by diffusion in one dimension only. The experimenter is faced with the choice of fitting measured profiles to a slightly more complex equation for spherical diffusion (Crank, 1975, p. 91), or ignoring the radial aspect and invoking Equation (18). The latter approach is perfectly acceptable when the total length of the diffusion profile is a small fraction of the sample radius. DIFFUSION
OF DISSOLVED VOLATILES IN MAGMA TIC LIQUIDS
Introduction The strategy in this section is to review, in chronological order of publication (as far as is practical), experimental studies of dissolved volatile diffusion in magmas. The various magmatic volatiles are discussed independently, more or less in order of abundance, beginning with water and progressing to CO2, sulfur species, halogens, and eventually to noble gases. An attempt is made to present enough details of the experimental techniques
383
Watson: Diffusion in Volatile-bearing Magmas
used in each study for the reader to appreciate the general quality and range of applicability of the data. For clarity in presentation and ease of interstudy comparison, available data for a given volatile are presented on a single Arrhenius diagram, omitting actual data points in most cases. A comparative summary diagram of available data on diffusion of all dissolved volatiles appears at the end of the section (Fig. 13, below). For ease in comparison among various diffusants, Arrhenius equations taken from the numerous sources of data are standardized to SI units, and lines appearing on the summary figures are keyed to equations in the text. Many readers are probably more familiar with the now unfashionable units of calories and centimeters, so the following conversion table may be helpful. units used in this chapter
parameter
units
D
m2/s
Do
m2/s
Q
J/mole Jzdeg-mole
R
conversion
factors
to convert from
to
multiply by
cm2/s
m2/s
10-4
calories
joules
4.184
(8.3143)
Water and related species
Silicic melt compositions. As noted previously, the first study of H20 diffusion in a magmatic liquid was that of Shaw (1974), who investigated the rate of H20 uptake by cylinders of granitic obsidian. Although much more is known today about the details and mechanisms of dissolved H20 transport in melts, Shaw brought to light the general systematics of the diffusion process, and his data and interpretations, as well as the applications he discussed, still stand as fundamental contributions. Shaw's bulk-uptake approach was simple and appropriate to the general unavailability (at the time) of in situ analytical techniques for hydrogen and/or oxygen. Cylinders of granitic obsidian (Valles Caldera, NM, USA; 77% Si02) were milled to -2.5 mm in diameter and sealed in gold capsules with an amount of water just sufficient for saturation of the obsidian at run conditions. Using cold-seal pressure vessels, the capsules were subjected to water pressures of 10 to 200 MPa at temperatures of 750° to 850°C for durations of I to 150 hours. At any given pressure and temperature, water diffused into the obsidian cylinders to an extent determined by the run duration. Upon quenching, the total water uptake was gauged both by the weight gained during the high P- T hydration and the weight lost upon subsequent complete dehydration at lOOO°C in air. Shaw recognized the possibility that water diffusivity would depend upon water content, but his bulk-uptake technique limited his ability to quantitatively determine Dwate/ as a function of XH20. By inspection of the form of weight-gain vs. hydration-time curves for specific conditions, and by analogy with concentration-dependent diffusion in other materials, he was able to deduce the general sense of Dwater variation with concentration, which is reproduced in Figure 5 in comparison with results from later studies. The diffusivity ranges from -10-13 m2/s at vanishingly small H20 content to -10-11 m2/s at 6 wt % dissolved H20. Shaw's best estimate of the activation energy, Q, for diffusion was -60±20 kJ/mole (see lines 19 and 20 in Fig. 6), which, he noted, compared favorably with previously-determined values for hydrogen and water diffusion in silica # The subscript
"water" is used to denote an apparent diffusivity that incorporates the migration interaction of all water-related species. The importance of this distinction will become clear later.
and
384
Watson: Diffusion in Volatile-bearing Magmas
10.-------,--------.-------, Jambo\?~_
11 ~
,," I~~
.!:~.~-:' ...~...~----~•.•-
:.;;...
__ • ,/.>·''--Karsten
II
12~
--------7--Shaw'74 ",. _ .,"'
-----.1~?' .> > .,;.
Figure 5. Dependence of apparent total water diffusivity (Dwaler) upon H20 concentration, according to several research groups. All information applies to 800°C except for the data of Jambon (1979), which pertain to 850°C. Note that Jambon's value plotted at 3% water actually represents melts containing 1 to 5% water-an average water content is shown here for clarity. Note also that his value at -0.1 % water is shown as corrected by the later work of Jambon et al. (1992). The dashed or dotted lines show envelopes of uncertainty proposed by the authors of each study, except for those of Karsten et at. (1982), which were estimated by Lapham et al. (1984).
elal. '82
,,~/;...~.c' /
,.
/./---'"
Lapham el al. '84
I I
Jarnbon '79
effect of water content on Dwale,
150
2
4
6
wt. % dissolved water
= Figure 6. Summary of data on diffusion of water-related species in melts and glasses. The numbers associated with specific Arrhenius lines refer to numbered equations in the text; other data are identified in the legend. The indicated percentages denote water content in wt %. Most information pertains to granitic compositions except for the lines labeled 24 and 25, which refer to hydrogen diffusion in dry albite glass and total water diffusion in basalt melt, respectively. Line 23 represents diffusion specifically of molecular H20; all other lines depict total water diffusivities (except #24). See text for details and discussion.
glass. Arrhenius mately by:
equations
10 9
O.4i~·'
TI'24
-
1.8'10.8 exp(-65,OOOIRT)
Dwater
-
1.6·IO-lOexp(-74,OOOIRT)
2 log f02 units above FMQ) [Carroll and Rutherford, 1988; see also Chapter 7]. Thts, the transition from sulfide- to sulfate-dominated melts occurs over a relatively small range in fa that encompasses typical values for calcalkaline magmas. As we shall see, the studies des~ribed below do not answer definitively the question of speciation-dependence of Dsulfur, but they do provide a preliminary data set indicative of a relatively small f O2 effect. Watson et al. (1993) performed three types of experiments on a variety of melt compositions, including natural obsidian (76 wt % Si02) and dacite (68 % Si02) as well as synthetic (Fe-free) dacite, synthetic low-K andesite (61 % Si02) and a lunar ultramafic composition (44 % Si02). The "lunar" melt was doped with 3000 ppm S and loaded on Pt wire loops for low-pressure, sulfur-loss experiments at 1300°C and log f02 = IW-O.7. Sulfur loss from the roughly spherical melt droplets (-1 mm dia.) was characterized by electron microprobe traverses on the quenched glasses, and Dsulfur was estimated by matching the measured concentration proftles with those predicted for diffusion in a sphere governed by various assumed values of D. Diffusion in the other melts was investigated by techniques more similar to those described earlier in this chapter for other volatiles. Specifically, two types of samples were run in a piston-cylinder apparatus at 1 GPa: (1) diffusion couples consisting of presynthesized, S-doped and S-free halves; and (2) thinsource, radiotracer experiments in which 35S was deposited (as aqueous Na2S04) at the end of prefabricated glass cylinders. Diffusion gradients in the quenched couples were characterized by electron microprobe traverses along axial sections, and chemical diffusivities were extracted by fitting the profiles to Equation (17). Tracer diffusivities were obtained from the thin-source experiments by making B-track maps of the sectioned specimens, scanning these with a photodensitometer, and fitting the absorption vs. distance curves to Equation (16) (see Watson, 1991). The total range in temperature of the experiments was 1100° to 1500°C, although no single melt has been investigated over so
Watson: Diffusion in Volatile-bearing Magmas ISOO
l300
1100
900
800
393
°c
10
I sulfur summary I wet andesite (32)
'~lunar
melt (dry)
•\
andesite (31) \
\
13'
14
!
~ DRY
Baker & Rutherford (weI)
dacite (30)
•
obsidIan
6
'94
~
7
8
9 4
I(f(K)xl0
10
Figure 8. Summary of data on diffusion of sulfur in magmatic melts. The numbers identify Arrhenius equations in the text. Data on the left (hightemperature) side of the diagram are from Watson et al. (1993) and generally represent experiments performed under reducing conditions at 1 GPa ("wet" andesite contains -5.5 wt % H20). The lunar melt was run under reducing conditions at near-atmospheric conditions. The values of Baker and Rutherford (1994) represent oxidizing conditions at 200 MPa water pressure (The values are switched in their published abstract; they appear correctly in this figure). See text for details.
large a range. The effect of up to 8.5 wt % dissolved H20 on sulfur diffusion in the obsidian, dacite and andesite melts was assessed using the radiotracer technique. Two low-pressure experiments on the lunar melt composition at 1300°C, of 40 and 180 minutes duration, returned the same diffusivity of 6.6.10-12 m2/s. At the time of this writing, data at other temperatures are not available, so the temperature dependence of Dsulfur in ultramafic melts is unconstrained (but note that the activation energy for diffusion appears to decrease with decreasing Si02 content for the other melts; Fig. 8). It can probably be assumed that dissolved S is present as sulfide in the lunar melt (Carroll and Rutherford, 1988), so the diffusivity reported above might be considered an endmember value for very reduced magmas. Sporadic coverage ofT-f~ space has been achieved for the more silicic terrestrial melt compositions. Most of the diffusion-couple and radiotracer experiments run to date were made in Mo capsules, which impose very reducing conditions (near IW) on the contained melts. The body of data for sulfur diffusion in these reduced melts points to several general conclusions: (I) there is a systematic melt composition effect manifested as lower Dsulfur values and higher activation energies for diffusion as the Si02 content of the melt increases (the one value for the ultramafic lunar melt is consistent with this trend); (2) the effect of dissolved water is to significantly enhance sulfur diffusion, especially in highly silicic melts; and (3) Dsulfur in all but the lunar melt is significantly lower than the Dco values summarized in the previous section, and markedly lower than DH20, especially iIi silicic melts at typical liquidus temperatures. These general characteristics can be seen in the summary diagram presented as Figure 8, which include actual data points because the values are not yet published elsewhere. For dry Fe-free dacite and low-K andesite, Arrhenius equations based on 3 data points each (spanning 1300° to 1500°C) are as follows: (30) Dsulfur - 1.4.10-4 exp(-263,OOO/RT) dry, reduced dacite: dry, reduced andesite:
Dsulfur -
1.0.10-6 exp(-191,OOOIRT)
(31)
394
Watson: Diffusion in Volatile-bearing
7.5,
• tracer expts (thin source) • diffusion couple
en
•
I
.S
8~ .9,
••
•
,-..
13
I effect of water on sulfur diffusion
I
andesitemelt @1300"c reducingconditions 8.5t
,
I
0
Magmas
1
2
3
4 wt. % dissolved water
5
6
Figure 9. Effect of dissolved H20 on sulfur diffusion in molten andesite at 13()()OC (previously unpublished data of Watson. D.A. Wark and J. W. Delano). The apparent high quality of the loglinear fit (except for the "dry" values) is considered fortuitous in view of the estimated -factor-of-Z uncertainty in each thin-source data point; however, the overall of influence of dissolved H20 is thought to be accurately represented.
It is emphasized that these equations are preliminary, with uncertainties of at least 10% in Q and much greater in Do. There are too few data at present to compute Arrhenius parameters for diffusion in dry obsidian melt, but it is clear that the trend represented by Equations (30) and (3 I)-toward lower D and higher Q with increasing Si02 content--continues up to the high-Sifr, obsidian (see Fig. 8).
Effect of Water. The influence of water on Dsulfur has been characterized most thoroughly for the low-K andesite: As water content increases from 0 to 5.5 wt %, the enhancement in diffusivity exceeds an order of magnitude at temperatures below -I 100°C (see Fig. 8). On the basis of two data points (at 1300° and 15OO°C), diffusion of sulfur in molten andesite containing -5.5 wt % H20 is described approximately by: Dsulfur - 3.2,10-8 exp(-115,OOO/RT)
(32)
At 1300, where the data are most complete, Dsulfur appears to increase roughly linearly with added H20 (see Fig. 9). The effect of dissolved H20 appears to be even more pronounced in the obsidian melt, where an increase in Dsulfur by more than an order of magnitude occurs just in the interval 3.1 to 8.5 wt % H20 at I 100°C (a reliable value for dry obsidian at this temperature is not yet available). The general systematics of the effect of H20 on Dsulfur are similar to its effect on Deo2 (and cation diffusion in general; see last section of this chapter)-specifically, added H20 results in higher D at any given temperature and lower Q overall.
Role of oxygen fugacity. Although the picture concerning the influence of S oxidation state on Dsulfur is not fully developed, it can be tentatively concluded that the effect is significant but not large. Two sets of information point to this conclusion. First, Baker and Rutherford (1994) extracted Dsulfur values for rhyolite melt at 800° and 900°C (200 MPa water pressure) from anhydrite dissolution experiments made under highly oxidizing conditions (MnO-Mn304); their values appear to be a factor of 5 to 10 higher than the down-temperature extrapolation of the Watson et al. data for reduced rhyolite melt of similar H20 content (see Fig. 8; note that the two diffusivities published by Baker and
Watson: Diffusion in Yolatile-bearing Magmas
395
Rutherford are switched in their abstract). However, it is important to bear in mind that at least some of the difference is attributable to the 0.8-GPa difference in pressure between the two sets of data. The other indication of a relatively small f 0;. effect on Dsulfurcomes from additional data acquired by Watson et al. since the publication of their abstract. Several radiotracer experiments were made in which 5% hematite powder was added to the starting glasses as an internal f 02 control, and the runs were made in Pt rather than Mo capsules. After both the presynthesis step and the actual diffusion anneal, the glasses contained small, dispersed euhedra of Fe-oxide-in some cases both hematite and magnetite. The diffusivities resulting from these experiments appear to be only slightly higher than Dsulfur values for reduced melts at similar conditions (see Fig. 8). More experiments on S diffusion systematically incorporating f o, as a variable should eventually clarify the role of changes in S speciation; for now, however, it appears that the effect of oxidation is to enhance Dsulfursomewhat but not dramatically. A relatively small effect may imply that the diffusing species and/or diffusion mechanism is relatively independent of f 02' Halogens Relatively little information exists on diffusion of dissolved halogens in magmas, and much of the available data base pertains to dry, simple-system analogs over restricted ranges in temperature. To the author's knowledge, only fluorine and chlorine have been studied to date. Fluorine. The first study of F diffusion in melts was that of Johnston et al. (1974), who used a radiotracer technique to measure DF in a basic slag composition in the system CaO-Al20rSi02 (-40 wt % each of CaO and Si02) at -1300° to 1600°C. Neglecting for the moment the questionable suitability of this depolymerized melt as a magma analog, the results of this study were intriguing in the respect that F was found to diffuse significantly faster-and with a lower activation energy-than any other melt component, including oxygen: DF(tracer) ranged from -1.10-9 to -4-10-9 m2/s over the temperature range investigated, which translates into an activation energy of -80 kJ/mole (Fig. 10). Using diffusion couples run in a piston-cylinder at 1200° to 1400°C and 1.0 to 1.5 GPa, Dingwell and Scarfe (1984) examined chemical diffusion of fluorine in a more geologically-relevant melt of jadeite (NaAISi206) composition. One of the juxtaposed melts was of stoichiometric jadeite composition, the other jadeite in which some of the oxygen was replaced by fluorine (6 wt %). Diffusion couples were prepared by tightly packing glass powders of the two compositions into platinum tubes and sealing the tubes with welds. The couples were run with the denser, fluorine-free melt on the bottom, usually for 60 minutes. The extent of fluorine-oxygen interdiffusion was characterized by electron microprobe traverses on the quenched and sectioned samples. The authors were able to draw several important conclusions from their data: (1) the chemical diffusivity of fluorine (DF_O)in a relatively polymerized melt (-60 wt % Si02) is significantly lowerand the activation energy for diffusion significantly higher-than the tracer values reported earlier for basic slags; (2) over the range of FlO ratios studied, there is no dependence of DF-Oupon concentration of F (i.e., the interdiffusion gradients conformed well to Eqn. 17); and (3) any effect of pressure on F-O interdiffusion is small (calculated activation volumes at 1200, 1300 and 1400°C are not statistically different from zero). Averaged over 1.0 to 1.5 GPa, fluorine-oxygen interdiffusion in jadeitic melt (see Fig. 10). DF_O= 5.6-10-6 exp(-159,OOO/RT)
(33)
Figure 10. Summary of halogen (F and Cl) diffusivities in molten silicates. The "wet" Cl data of Watson (1991) are radiotracer values for molten obsidian (I) or dacite (n) containing -8 wt % dissolved H20. Other diffusivities and diffusion media represented are: Cl tracer diffusion in soda-lime aluminosilicate melt with 56% Si02 (Watson and Bender 1980); F tracer diffusion in basic slag with 40% SiOz (Johnston et al. 1974); F-O interdiffusion in albite melt (Dingwell and Scarfe 1985); F-O interdiffusion in jadeite melt (Dingwell and Scarfe 1984); and Cl chemical diffusion in wet haplogranitic melt and in dry obsidian (Bai and Koster van Groos 1994). The numbered lines refer to Arrhenius equations in the text.
Dingwell and Scarfe followed up their initial paper on F diffusion in jadeite melts at high pressures with a study of other melts in the Na20-Al20rSi02 system at near-atmospheric pressure (Dingwell and Scarfe, 1985). These studies involved suspension of F-enriched glass spheres of albite, jadeite, and peraluminous haplogranite composition (75 wt % Si02) from Pt loops in an oxygen-flow furnace. At 1200° to 1400°C, these spheres exchanged fluorine for ambient oxygen at a rate determined by the F-O interdiffusion coefficient. As in the previous high-pressure study of F diffusion in jadeite melt, F-O interdiffusion was again found to be independent of F concentration, with DF.O increasing in the order albite < peraluminous melt < jadeite. For the range in temperature covered, all diffusivities fall between 10-11 and 10-13 m2/s, and activation energies between -120 and 180 kJ/mole. For albite melt, F-O interdiffusion conforms to DF.O
=
2.3'10-9 exp(-124,000IRT)
(34)
Chlorine. The data base on chlorine diffusion is comparable with that on fluorine, being represented by just one abstract and two published papers. Watson and Bender (1980) measured tracer diffusivities for a variety of elements-including Cl-in a sodalime aluminosilicate melt (56 wt % Si02) at 1100° to 1300°C and 0.6 to 1.8 GPa. As in radiotracer studies described earlier (e.g., of CO2), the thin-source technique was used. Glass rods were prepared at atmospheric pressure by drawing the melt into a Pt capillary, which was subsequently cut into 6 to 8 mm lengths; one end of each length was polished and 36CI was introduced as aqueous NaCl. After drying off the solution, the sample was inserted in a graphite or boron nitride sleeve, which was plugged at the ends and run in a piston-cylinder apparatus. Diffusivities were calculated from photodensitometer scans of
Watson: Diffusion in Volatile-bearing
Magmas
397
track maps made from axial sections of the samples. At the lowest pressure studied (0.6 GPa), the following Arrhenius relation was determined for Cl tracer diffusion in the Na20CaO-Al20rSi02 melt: Do(tracer)
=
3.4.104 exp( -207,OOOIRT)
(35)
As in the case of F-O interdiffusion studied by Dingwell and Scarfe (1984), DC1is unaffected by changes in pressure: Watson and Bender reported an activation volume of -I cmvrnole, which is not statistically different from zero. The subject of chlorine diffusion was revisited by Watson (1991), who sought to characterize the effects of dissolved H20 on DCl in rhyolitic and dacitic melts using techniques identical to those described for CO2 in the same paper (see above). The part of the study devoted to Cl diffusion was not entirely successful in that reliable data could not be obtained for melts containing less than 8 wt % dissolved H20-in drier melts, the radiotracer tended to penetrate down the melt/capsule interface. One value was reported for the dacite (I 100°C) and four for the obsidian (800° to I 100°C), all pertaining to melts with 8 wt % dissolved H20. Scatter in the data precludes an estimate of the Arrhenius parameters, but it is clear that DC!is lower than DC02 in melts of similar composition and water content (see Fig. 10). Beta-track maps of the failed experiments (in which 36CI penetrated along the capsule wall) indicated, furthermore, that DCldecreases sharply in melts containing less than 8% water. Bai and Koster van Groos (1994) made a comprehensive study of CI chemical diffusion in a haplogranitic melt (74.6 wt % Si02) and a natural obsidian (77.9 wt % Si02) that addressed the effects not only of temperature (650° to 1400°C) but also of pressure (to 0.46 GPa) and water content (0-7 wt %). The study incorporated three different experimental approaches: Nominally dry, high-temperature (850° to 1400°C) experiments were performed at atmospheric pressure by immersing spheres of the rhyolitic obsidian in molten NaCl sealed in Pt capsules. Higher pressure, hydrous runs in which NaCI-rich brines served as the CI source were made in cold-seal pressure vessels at 850°C and 20 to 200 MPa, again using the natural glass as starting material. A final series of experiments was made at 0.1 to 0.46 GPa and 650° to 900°C on the haplogranitic melt in internallyheated or cold-seal pressure vessels. Chlorine uptake profiles, typically hundreds of microns long, were characterized by electron microprobe, and DC1values were calculated using the standard approach of inverting the C: x data through the error function. For their low-pressure series of experiments at 850° to 1400°C, Bai and Koster van Groos (1994) report the following well-constrained Arrhenius relation for chemical diffusion of Cl in dry obsidian: DC1(chemical) = 3.16.10-9 exp( -86,190/RT)
(36)
The temperature effect on DC1in hydrous haplogranitic melts (coexisting with NaClrich brine at 0.2 GPa) is given by Do( chemical) = 6.46.10-7 exp( -11 0,900/RT)
(37)
Comparison of Equations (36) and (37) indicates a substantial effect of dissolved water upon Cl diffusion (see also Fig. 15a, below). Note that Equation (37) is consistent with the isolated tracer diffusivity values reported by Watson (1991), but the newer data are of higher quality and provide a much better indication of the temperature dependence of DC1in hydrous silicic melts (see Fig. 10). Bai and Koster van Groos were able to estimate activation volumes for Cl diffusion in both dry and hydrous granitic melts as 27±1O and 22±7 cmvmole, respectively. These
398
Watson: Diffusion in Volatile-bearing Magmas
differ significantly from the near-zero Va value reported by Watson and Bender (1980), but the melt compositions and pressure regimes of the two studies are also markedly different. Noble
gases
Most studies of noble gas diffusion in amorphous silicates have been conducted on solid glasses [see Doremus (1994) for an up-to-date review; also Carroll and Stolper, 1991; 1993; and Carroll et al., 1993], so there exists only a tenuous basis upon which to draw conclusions about magmas. The one study devoted (in part) to diffusion in molten silicate is that of Lux (1987), who presented preliminary data for diffusion of He, Ne, Ar, Kr, and Xe in tholeiitic basalt (49.7 wt % Si02) at 1350°C and near-atmospheric pressure. The technique used by Lux involved initial purging of natural tholeiite melt of its noble gases, loading the resulting glass fragments into a Pt tube (-3 cm long, 0.5 ern dia.), and re-heating the tube to 1350°C in a noble-gas atmosphere for 8 hours. The bulk uptake of each gas was determined by isotope-dilution mass spectrometry, and diffusivities were calculated by applying a solution for diffusion in a semi-infinite medium in which the surface concentration is constant over time (given by the gas solubility at the pressure of the experiment). Lux considered the resulting diffusivities to be preliminary because the experiments were not repeated, but the data are very systematic in showing a monotonic (though modest) decrease in diffusivity with increasing atomic radius, from DHe-5±1'1O-9 m 2/S, to DXe - 2.5± 1.10-10 m 2/S. This relationship is good evidence that the results were not affected by convection in the melt-the main pitfall to which experiments of this type are prone. Lux noted that the calculated diffusivities are higher than would be expected from uptemperature extrapolation of values measured on basaltic glasses, and also that the 20-fold change in D from the smallest (He) to the largest (Xe) rare gas is much smaller than the 8order-of-magnitude difference reported by Hiyagon (1984) for diffusion in basaltic glass at 900°C. The apparent major differences between noble gas diffusion in basaltic glasses and melts led Lux to conclude that D values cannot be extrapolated through the glass transition temperature. This conclusion is quite different from that reached by Zhang et al. (1991) and Jambon et al. (1992) for diffusion of molecular H20-and by Blank (1994) for diffusion of CO2-in obsidian, which obey single Arrhenius relations over a large range in temperature spanning the glass transition. Note also that the Arrhenius relation for He diffusion determined by Jambon and Shelby (1980) for basaltic glass at 200° to 300°C does extrapolate to a value generally consistent with Lux' data for diffusion of other noble gases in basalt melt at 1350°C (see Fig. 12, below). These divergent views concerning glass/melt similarity with respect to diffusion of neutral species are especially interesting in view of the fact that molecular H20, rare gases and CO2 all fall on a smooth curve relating activation energy for diffusion in obsidian (glass) to molecular or atomic radius (Zhang et al., 1991; Blank, 1994; see Fig. 11). In obsidian, neutral H20 and CO2 molecules (and, by inference, rare gas atoms) seem to show consistent diffusion behavior through the glass transition; it is not yet clear, however, whether the same can be said of basalt. From studies of rare gas solubilities in natural melts, Lux concluded that solubility is negatively correlated with melt density, so perhaps the difference in diffusion properties of the two materials is due simply to structural differences between obsidian and basaltic glasses and melts. A reasonable data base exists for rare gas diffusion in various solid glasses, including obsidian and basalt. However, because of the uncertain relevance of the information to magmas-and because other summaries exist-a comprehensive review is not attempted
Watson: Diffusion in Volatile-bearing Magmas
399
160
.,
120
C~
¢
Ne CI
40~
Figure 11. Diagram showing the correlation between atomic or molecular radius of neutral diffusants and the activation energy (Q) for diffusion in rhyolitic glass. 1500 700
He
o
0~-=~~~~~-7'-~
o
0.4
0.8
1.2
1.6
2.0
o
r (A)
o
100
300
t
He
8
I Lux '87
I noble
I basalt melt
10
Xe
-.. /He
"
~
o 0.00 500
1000
HEIGHT
1500
(m)
2000
Figure 16. Numerical calculation of the variation of gas fraction with height for the same conditions as given in Figure IS. Note that almost all the gas exsolution occurs over a very narrow region with the vesicularity changing from 0.2 to 0.7 over SOm.
Once the eruption has been initiated the system consists of three regions. In the lower region pressure is sufficiently high in the conduit that the magma can either remain undersaturated in H20 or supersaturated. The pressure declines gradually with height and viscosity remains constant, because no gas has yet exsolved. The experimental data of Hurwitz and Navon (1994) indicates that substantial supersaturation pressures can be sustained in the ascending magma without major nucleation taking place. The middle region consists of a zone of rapid (explosive) degassing, in which the magma viscosity increases by three or four orders of magnitude as vesiculation occurs. At the base of this region the large supersaturations required for explosive nucleation rates are established. Numerical calculations (e.g., Figs. 15 and 16) suggest that this region shows large pressure gradients, is typically only tens of metres thick, and involves bubble growth over
440
Sparks et al.: Magma Degassing: Constraints on Vesiculation
times of order 10 s. It is likely that this region is characterised by large supersaturations although this is not considered in the numerical model. The middle region is where explosive bubble growth, foam acceleration and disintegration takes place. The working hypothesis is that this region is very thin and is characterised by a large pressure drop. The upper region of conduit flow occurs above the fragmentation level where high velocity twophase flow is achieved. In this region, shock tube studies indicate that large heterogeneties can exist (Anilkumar et al., 1993; Mader et al., 1994). Much remains to be understood about exactly what happens in the middle region of explosive expansion and fragmentation. The shock tube experiments (Mader et al., 1994) simulate the explosive expansion of a foam in analogue systems and demonstrates that the foam disintegrates as a consequence of acceleration. The concept of a static high pressure foam that disintegrates and then accelerates is not supported by the calculations or experiments. Bubbles should grow faster in these explosive flows as they are stretched by acceleration along the conduit. Bubble elongation has been shown here to enhance degassing rates due to the increase in surface area production compared with spherical bubble growth. There may therefore be positive feedback mechanisms operating to enhance degassing rates in this region. The processes documented in the laboratory simulations might be described as a variety of wave model in which an exsolution wave propagates down into the magma column. The mechanism of fragmentation remains poorly understood. In the shock tube experiments the accelerating foams disintegrate into a spray entirely in the liquid state. In detail these flows are heterogeneous and complex deformation of the liquid elements of the foam are sufficient to tear the foam into fragments. The shock tube experiments demonstrate that brittle failure is not essential for fragmentation. However caution is necessary in that the huge differences in viscosity may make the liquid-state disintegration processes inappropriate in magmas. At magmatic temperatures strain rates have to be sufficiently high that the timescale of deformation is shorter than the viscous relaxation timescale (Dingwell and Webb, 1989). In the numerical calculations presented in Figures 15 and 16 the strain rates approach those necessary to cross the glass transition at the top of the degassing region and thus brittle fracturing could be a consequence of the extreme flow conditions found in the thin region of explosive degassing. Another conundrum is what significance should be placed on the observed vesicularities of pumice. Calculations on viscosity and diffusive bubble growth (Sparks, 1978; Proussevitch et al., 1993; Thomas et al., 1994; Barclay et aI., 1995) indicate that even for the large pressure drops and characteristic time-scale of order lOs the viscosity does not inhibit explosive bubble growth and foam acceleration until viscosities of around 109 Pas are achieved, when further expansion will be strongly inhibited. The vesicularities of pumice in the range 0.7 to 0.8 seem therefore to be a viscosity quench. One view would be that the expanding foam reaches this viscosity threshold before fragmentation and the foam expansion diminishes. A fragmentation wave then propagates into the foam. Another view is that expansion is uninhibited and the foam accelerates and disintegrates before the viscosity threshold is reached and the pumice fragments continue expansion and degassing in the upper region of two-phase flow. This later view is supported by the reasoning given in Thomas et al. (1994) where they observe that vesicularities of pumice deposits from the Taupo eruption are almost identical for different phases with discharge rates that differed by more than an order of magnitude. They take this to mean that, before fragmentation, decompression rates are not large enough for bubble expansion to be retarded by viscous effects. The numerical calculations in Figures 15 and 16 show that high strain rates are characteristic of the region of 0.7 to 0.8 vesicularity and approach the conditions for brittle
Sparks et al.: Magma Degassing: Constraints on Vesiculation
441
fragmentation. Interesting issues then emerge about whether the preserved vesicularities represent the condition of the magma where the flow acceleration results in strain rates that cross the glass transition or represent a viscosity quench, either prior to or just after fragmentation. Three important pressures can be usefully distinguished in an eruption. The saturation pressure for H20 is at the deepest level and can migrate up and down in the conduit system. It can occur close to the surface in a gas-poor, undersaturated magma chamber, whereas it occurs in the chamber for a saturated magma. The depth of saturation can migrate upwards in a zoned chamber characterized by diminishing volatile content with depth, and it can migrate downwards due to the overall decrease in chamber pressure with time or due to the level of fragmentation moving downwards, which reduces the hydrostatic load on the chamber. The pressure of explosive nucleation occurs where the supersaturation is sufficient for large nucleation rates and, from the experimental data of Hurwitz and Navon (1994), will occur at supersaturations of 10 to over 70 MPa depending on the availability of sites for heterogeneous nucleation. Even gas-rich magmas may nucleate bubbles at quite shallow levels if large supersaturations are indeed developed. Fragmentation appears to occur where hydrodynamic conditions result in large accelerations and disintegration of the magmatic foam. Empirical evidence indicates that this occurs where vesicularities are in the range 0.7 to 0.8 at pressures of a few MPa. Can this working hypothesis provide an explanation of what is observed? An important implication of this model is that pressures drop from about a few tens of MPa to a few MPa in a few short distance, probably of order of tens of metres. This pressure drop results in the explosive bubble formation and foam acceleration required for production of pumice and ash by either ductile or brittle fragmentation. The disintegrating foam can expand to vesicularities that are limited by the large viscosity increases during the later stages of degassing. The very large nucleation densities observed in pumice (1012 to 1014 m-3) are consistent with the large and rapid decompressions. Tube pumice also provides evidence for the extreme accelerating flow conditions that lead to fragmentation. ACKNOWLEDGMENTS Research on vesiculation at Bristol is supported by grants from the Natural Environmental Research Council (GR3/8630) and the European Community (PL910499). We are grateful to Oded Navon for supplying the photographs for Figure 4. Brad Sturtevant provided many valuable comments on the manuscript and is also thanked for his contributions to developing some of the concepts in this paper. Detailed reviews by Mike Carroll, John Holloway and Megan Morrissey improved the paper. APPENDIX The diffusive expansion of an elongate ellipsoidal bubble is analysed using the approximation of a thin boundary layer 4 b=-r
Figure 18. Vesicle volume distributions measured in 'gray' 1980 Mount St. Helens pumice (as shown in Fig. 16b). 'Decoalesced' distributions were made by drawing lines of minimum thickness between vesicles where partial walls remained. The decoalesced distributions are the closest available representation of the bubble population at the time of magma fragmentation. Replotted from Klug and Cashman (1994).
468
Cashman & Mangan: Constraints on Vesiculation Processes
Vesicle number densities for the gray pumice are extremely high (>109), resulting in nucleation rates of 3 to 10 x 105 cm-3s-1. Again, these rates are predicated on times calculated assuming that the system maintained equilibrium during ascent. Recent experimental work by Hurvitz and Navon (1994) provides a limited basis for comparison. Nucleation rates estimated by Klug and Cashman span the range observed by Hurvitz and Navon for bubble nucleation in water-saturated rhyolite at large pressure drops (>80 MPa). However, vesicle number densities in the pumice exceed those in the experimental charges by an order of magnitude (even for experimental overpressures of >100 MPa). High measured vesicle number densities in the Mount St. Helens pumice may indicate that vesiculation occurred at very high supersaturations (that is, large L1P). Alternatively, it is possible that the high vesicle number densities are related to the prevalent microlite population, although the evidence is ambiguous. Experimental studies on obsidian have shown that the presence of microlites may significantly increase bubble nucleation rates (Bagdassarov and Dingwell, 1992; Hurvitz and Navon, 1994). Although vesicle number densities in microlite-free pumice from Mount St. Helens are slightly lower than those in microlite-bearing samples, this difference can be explained by the high degree of bubble coalescence in microlite-free samples (Klug and Cashman, 1994).
Vesicle shapes in pumice commonly record stages of bubble coalescence (Heiken, 1987; Orsi et al., 1992; Klug and Cashman, 1994). Evidence for inter-bubble expansion preserved in silicic pumice (Fig. 19a,b) indicates clast expansion times less than times required for complete rupture of melt films and retraction to spherical shapes. Instead, bubble walls thin unevenly, and breakage occurs where walls reach thicknesses of