Sulfur in Magmas and Melts: Its Importance for Natural and Technical Processes 9781501508370, 9780939950874
Volume 73 of Reviews in Mineralogy and Geochemistry represents a compilation of the material presented by the invited sp
248 92 68MB
English Pages 592 Year 2018
TABLE OF CONTENTS
1. Studies of Sulfur in Melts - Motivations and Overview
2. Analytical Methods for Sulfur Determination in Glasses, Rocks, Minerals and Fluid Inclusions
3. Spectroscopic Studies on Sulfur Speciation in Synthetic and Natural Glasses
4. Diffusion and Redox Reactions of Sulfur in Silicate Melts
5. The Role of Sulfur Compounds in Coloring and Melting Kinetics of Industrial Glass
6. Experimental Studies on Sulfur Solubility in Silicate Melts at Near-Atmospheric Pressure
7. Modeling the Solubility of Sulfur in Magmas: A 50-Year Old Geochemical Challenge
8. The Sulfur Budget in Magmas: Evidence from Melt Inclusions, Submarine Glasses, and Volcanic Gas Emissions
9. Distribution of Sulfur Between Melt and Fluid in S-O-H-C-Cl-Bearing Magmatic Systems at Shallow Crustal Pressures and Temperatures
10. Sulfur-bearing Magmatic Accessory Minerals
11. Sulfur in Extraterrestrial Bodies and the Deep Earth
12. Fining of Glass Melts
13. Sulfur Degassing From Volcanoes: Source Conditions, Surveillance, Plume Chemistry and Earth System Impacts
14. Sulfur Isotopes in Magmatic-Hydrothermal Systems, Melts, and Magmas
15. Interactions Between Metal and Slag Melts: Steel Desulfurization
16. The Role of Magmatic Sulfur in the Formation of Ore Deposits
Recommend Papers


![The Probability Integral: Its Origin, Its Importance, and Its Calculation [1st ed. 2023]
3031384156, 9783031384158](https://ebin.pub/img/200x200/the-probability-integral-its-origin-its-importance-and-its-calculation-1st-ed-2023-3031384156-9783031384158.jpg)


![Science Between Myth and History: The Quest for Common Ground and Its Importance for Scientific Practice [1. ed.]
9780198864967](https://ebin.pub/img/200x200/science-between-myth-and-history-the-quest-for-common-ground-and-its-importance-for-scientific-practice-1nbsped-9780198864967.jpg)


- Author / Uploaded
- Harald Behrens (editor)
- James D. Webster (editor)
File loading please wait...
Citation preview
REVIEWS IN MINERALOGY AND GEOCHEMISTRY Volume 73
2011
Sulfur in Magmas and Melts: Its Importance for Natural and Technical Processes EDITORS Harald Behrens James D. Webster
University of Hannover Hannover, Germany American Museum of Natural History New York, U.S.A.
ON THE COVER: Top Left: Image from Kawah Ijen volcano, Java, Indonesia in 1998. It shows sulfur being collected from a large fumarole within the crater for commerical use (supplied by J.D.Webster, New York USA). Top Right: View into a side fired glass melting furnace under operation (copyright by HVG-DGG, Offenbach am Main, Germany). Bottom Left: Microscope photo of an H 2 0-S bearing andesitic glass obtained by a decompression experiment at 1030 °C with pressure release from 4 kbar to 0.7 kbar (supplied by A. Fiege, Hannover, Germany). Bottom Right: S K-edge XANES spectrum of a fluid-saturated Etna basalt synthesized at 200 MPa, 1050 °C, log(/o2/bar) = -8.3 (supplied by M. Wilke, Potsdam, Germany).
Series Editor: Jodi J. Rosso MINERALOGICAL SOCIETY OF AMERICA GEOCHEMICAL SOCIETY
Reviews in Mineralogy and Geochemistry, Volume 73 Sulfur in Magmas and Melts: Its Importance for Natural and Technical Processes ISSN ISBN
1529-6466
978-0-939950-87-4
COPYRIGHT 2 0 1 1 THE M I N E R A L O G I C A L
S O C I E T Y OF A M E R I C A
3 6 3 5 CONCORDE PARKWAY, SUITE 5 0 0 CHANTILLY, VIRGINIA, 2 0 1 5 1 - 1 1 2 5 , U . S . A . WWW.MINSOCAM.ORG The appearance of the code at the bottom of the first page of each chapter in this volume indicates the copyright owner's consent that copies of the article can be made for personal use or internal use or for the personal use or internal use of specific clients, provided the original publication is cited. The consent is given on the condition, however, that the copier pay the stated per-copy fee through the Copyright Clearance Center, Inc. for copying beyond that permitted by Sections 107 or 108 of the U.S. Copyright Law. This consent does not extend to other types of copying for general distribution, for advertising or promotional purposes, for creating new collective works, or for resale. For permission to reprint entire articles in these cases and the like, consult the Administrator of the Mineralogical Society of America as to the royalty due to the Society.
Sulfur in Magmas and Melts: Its Importance for Natural and Technical Processes 73
Reviews in Mineralogy and. Geochemistry
73
FROM THE SERIES EDITOR The chapters in this volume represent a compilation of the material presented by the invited speakers at a short course on August 21-23, 2011 called "Sulfur in Magmas and Melts and its Importance for Natural and Technical Processes." This Mineralogical Society of America and the Geochemical Society sponsored short course was held at the Hotel der Achtermann, in Goslar, Germany following the 2011 Goldschmidt Conference in Prague, Czech Republic. Following a nice overview in chapter 1 by the organizers Harald Behrens and James Webster, this volume is divided into 4 parts. (1) Analytical and Spectroscopic Methods — chapters 2 and 3 (2) Physical and Chemical Properties of S-Bearing Silicate Melts — chapters 4-7 (3) Constraints from Natural and Experimental Systems — chapters 8-11 (4) Natural and Technical Applications — chapters 12-16 Any supplemental materials associated with this volume, such as the supplemental tables compiled by Marini et al. (chapter 14), can be found at the M S A website, www. minsocam.org/MSA/RIM. Errata will also be posted there. The reader will also be able to find links to paper and electronic copies of this and other RiMG volumes. Todi 3". Posso, Series Editor West Richland, Washington June 2011
1529-6466/11/0073-0000S05.00
DOI: 10.2138/rmg.2011.73.0
Sulfur in Magmas and Melts: Its Importance for Natural and Technical Processes 73
Reviews in Mineralogy and. Geochemistry
73
TABLE OF CONTENTS I
Studies of Sulfur in Melts - Motivations and Overview Harald Behrens, James D. Webster
INTRODUCTION Background The behavior and importance of sulfur in melts REVIEW ( IIAI' I I RS IN THIS VOLUME REMAINING ISSUES AND CONSIDERATIONS FOR FUTURE RESEARCH ACKNOWLEDGMENTS REFERENCES
1 1 2 2 6 7 8
Analytical Methods for Sulfur Determination in Glasses, Rocks, Minerals and Fluid Inclusions Edward M. Ripley, Chusi Li, Craig H. Moore Erika R. Elswick, J. Barry Maynard, Rick L. Paul Paul Sylvester, Jun Hun Seo, Nobomichi Shimizu INTRODUCTION ANALYTICAL TECHNIQUES Total sulfur concentration in minerals, rocks and glasses using elemental analyzer - infrared absorption technology Total sulfur concentration in minerals, rocks and glasses using elemental analyzer - mass spectrometer technology Total sulfur concentration of minerals, rocks and glasses using X-ray fluorescence "Kiba" method for the determination of sulfur concentration in whole rocks and glasses Nuclear methods (activation analysis) for the determination of sulfur concentration in minerals, rocks and glasses Sulfur analysis of minerals and glasses using the electron microprobe Analyses of the sulfur concentration of minerals and glasses by secondary ion mass spectrometry (SIMS) Analyses of the sulfur concentration of minerals and glasses by laser ablation inductively coupled plasma mass spectrometry (LA-ICP-MS) iv
9 10 10 11 13 15 16 19 20 22
Sulfur
in Magmas
and Melts
- Table of
Contents
Determination of the sulfur concentration in fluid inclusions by LA-ICP-MS SUMMARY ACKNOWLEDGMENTS REFERENCES
«3
31 32 35 35
Spectroscopic Studies on Sulfur Speciation in Synthetic and Natural Glasses Max Wilke, Kevin Klimm, Simon C. Kohn
INTRODUCTION X-RAY EMISSION AND ABSORPTION SPECTROSCOPY S K a X-ray emission Determination of the S oxidation state using EPMA X-ray excited high-resolution X-ray emission spectroscopy X-ray absorption spectroscopy Determination of S oxidation state from XANES Beam damage during Analysis by EPMA and XANES Sulfur redox equilibrium determined in glasses by A,(S K a ) and XANES NUCLEAR MAGNETIC RESONANCE 33 S NMR of solid model compounds 33 SNMR of glasses RAMAN AND IR SPECTROSCOPY Raman spectroscopy of sulfur model compounds Experimental details for Raman spectroscopy on glasses Raman spectroscopy on sulfur in glasses Beam damage by Raman Spectroscopy Determination of the oxidation state using Raman spectroscopy SUMMARY AND OUTLOOK ACKNOWLEDGEMENTS REFERENCES
T1
41 42 42 45 46 46 54 55 57 60 61 64 66 66 67 69 71 71 72 73 73
Diffusion and Redox Reactions of Sulfur in Silicate Melts Harald Behrens, Jan Stelling
INTRODUCTION SULFUR DIFFUSION STUDIES Silica glass Simple silicate glasses Borosilicate glasses Aluminosilicate melts relevant to magmatic systems COMPARISON TO DIFFUSION OF OTHER VOLATILES EFFECT OF REDOX STATE ON SULFUR DIFFUSION v
79 80 82 82 89 90 92 95
Sulfur
in Magmas
and Melts
- Table of
Contents
SULFIDE/SULFATE INTERDIFFUSION AND REDOX REACTIONS OF SULFUR Redox reactions in dry melts Redox reactions in hydrous melts SULFUR DIFFUSION VERSUS VISCOSITY SUMMARY AND OUTLOOK ACKNOWLEDGMENTS RERERENCES
3
96 96 98 99 102 103 103
The Role of Sulfur Compounds in Coloring and Melting Kinetics of Industrial Glass Roberto Falcone, Stefano Ceola, Antonio Daneo, Stefano Maurina
INTRODUCTION SULFUR COMPOUNDS IN INDUSTRIAL GLASS PRODUCTION Sodium sulfate Slag Glass cullet Filter dust Pyrite Others INDUSTRIAL GLASS PRODUCTION B atch preparation Melting Batch reactions Fining Forming and post-forming OPTICAL PROPERTIES AND COLORS OF INDUSTRIAL SLS CONTAINER GLASS COLOR GENERATION IN SLS GLASSES SULFUR SOLUBILITY REDOX AND GLASS COLOR The batch redox number Experimental melting CHEMICAL CHARACTERIZATION OF GLASS COLORS BUBBLES IN SLS GLASSES Incomplete fining Redox Reboil Deposits SUMMARY AND OUTLOOK ACKNOWLEDGMENTS REFERENCES
vi
113 114 114 114 114 114 115 115 115 116 117 117 121 123 124 126 128 129 131 132 134 135 135 135 136 138 138 139
Sulfur in Magmas and Melts
O
- Table of
Contents
Experimental Studies on Sulfur Solubility in Silicate Melts at Near-Atmospheric Pressure Linda Backnaes, Joachim Deubener
INTRODUCTION ANALYSIS METHODS FOR SULFUR CONTENT INDUSTRIAL Ml I I S Effect of oxygen fugacity Effect of melt temperature Effect of melt composition SOLUBILITY OF SULFUR-BEARING WASTE IN MELTS SOLUBILITY OF SULFUR IN NATURAL MELTS AND SYNTHETIC ANALOGS SUMMARY AND OUTLOOK AKNOWLEDGMENT REFERENCES
7
143 144 144 144 149 150 155 157 160 161 161
Modeling the Solubility of Sulfur in Magmas: A 50-Year Old Geochemical Challenge Don R. Baker, Roberto Moretti
INTRODUCTION THERMODYNAMICS AND MODELING SULFUR SOLUBILITY IN MAGMATIC SYSTEMS A few necessary definitions and concepts Modeling philosophies Thermodynamic basis for dissolution of sulfur in silicate melts A BRIEF HISTORY OF EXPERIMENTS AND EMPIRICAL MODELS FOR SULFUR SOLUBILITY IN SILICATE MELTS Sulfur behavior in systems with only sulfur-rich gas and silicate melts at 1 atm SULFIDE AND SULFATE SATURATION IN SILICATE MELTS Sulfide saturation at 1 bar Sulfide and sulfate saturation at high-pressure with or without the presence of a hydrous fluid THERMODYNAMIC MODELS FOR THE BEHAVIOR OF SULFUR IN MAGMATIC SYSTEMS Sulfur speciation in silicate melts The thermodynamic model of Moretti and Ottonello GEOLOGICAL APPLICATIONS CONCLUSIONS ACKNOWLEDGMENTS REFERENCES
vii
167 168 168 169 171 175 175 178 178 182 191 192 194 203 208 209 209
Sulfur
O
in Magmas
and Melts
- Table of
Contents
T h e S u l f u r B u d g e t in M a g m a s : Evidence from Melt Inclusions, Submarine Glasses, and Volcanic Gas Emissions Paul J. Wallace, Marie Edmonds
INTRODUCTION SULFUR CONCENTRATIONS IN MAGMAS MAGMATIC DEGASSING OF SULFUR Degassing and vapor-melt partitioning Degassing inferred from melt inclusions from mafic volcanoes Magmatic vapor phase and volcanic gases "Excess sulfur" or more accurately, "excess volatiles" problem Magmatic sulfur and ore deposits Recycling of sulfur in subduction zones ACKNOWLEDGMENTS REFERENCES
7
215 216 221 221 223 226 229 236 237 239 239
D i s t r i b u t i o n of S u l f u r B e t w e e n M e l t a n d F l u i d in S-O-H-C-Cl-Bearing Magmatic Systems at S h a l l o w C r u s t a l P r e s s u r e s a n d T e m p e r a t u r e s James D. Webster, Roman E. Botcharnikov
INTRODUCTION BACKGROUND Experimental background METHODS Experimentation: advantages and challenges Analytical: issues and challenges EXPERIMENTAL RESULTS ON SULFUR PARTITIONING BETWEEN FLUID AND SILICATE MELT Felsic melts — S-H 2 0±C0 2 Rhyodacitic melts — S-H 2 0-C1 Phonolitic melts — S-H 2 0-C1 Andesitic melts — S-H 2 0±C0 2 ±B Basaltic melts — S-H 2 0±C0 2 -C1 Summary on S partitioning between fluids and rhyolitic to basaltic melts at crustal conditions APPLICATION OF THE EXPERIMENTAL DATA TO PROCESSES OF FLUID EXSOLUTION AND THE EVOLUTION OF MAGMA AND MAGMATIC FLUIDS Magmatic gas composition as an indicator of magma and volcanic degassing activity
viii
247 249 250 251 251 256 258 258 261 261 265 265 269
271 272
Sulfur
in Magmas
and Melts
- Table of
Contents
Volatile mixing relationships and the influence of S on C0 2 , H 2 0, and CI solubility in melt and new insights on vapor (fluid) saturation in felsic magmas SUGGESTIONS FOR FUTURE RESEARCH ACKNOWLEDGMENTS REFERENCES
IU
274 276 276 276
Sulfur-bearing Magmatic Accessory Minerals Fleurice Parat, François Holtz, Martin J. Streck
INTRODUCTION: THE OCCURRENCE OF MAGMATIC SULFUR-BEARING MINERALS Magmatic sulfides Magmatic sulfates and sulfate-bearing minerals MINERAL STABILITY, PARAGENESES AND MINERAL/MELT PARTITIONING OF SULFUR Transition from sulfide to sulfate stability fields in silicate melts Stability range of sulfide phases in magmatic systems Sulfates and sulfate-bearing minerals THE IMPORTANCE OF S-BEARING ACCESSORY MINERALS FOR DECIPHERING MAGMA RESERVOIR PROCESSES IN SITU SULFUR ISOTOPE IN S-BEARING MINERALS CONCLUDING REMARKS ACKNOWLEDGMENTS REFERENCES
I I
285 286 291 295 295 296 302 306 308 309 309 309
Sulfur in Extraterrestrial Bodies and the Deep Earth Denton S. Ebel
COSMOCHEMISTRY OF SULFUR Silicate melts and sulfur in primitive source materials Sulfur content of the terrestrial planets EXPERIMENTAL CONSTRAINTS Element partitioning Liquid silicate - liquid metal-sulfide Solid metal - liquid metal-sulfide Sulfide saturation and immiscibility Rheology: wetting and deformation PLANETARY INTERIORS Iron meteorites Sulfur in core fractionation Earth core formation Sulfur and lithophile element partitioning ix
315 315 318 318 318 320 321 323 324 324 324 325 326 328
Sulfur
in Magmas
and Melts
- Table of
Contents
MAGMAS OF OTHER SOLAR SYSTEM BODIES CONCLUSIONS ACKNOWLEDGMENTS REFERENCES
1 2
328 330 330 330
Fining of Glass Melts Hayo Müller-Simon
INTRODUCTION AGENTS USED l OR CHEMICAL FINING LABORATORY EXPERIMENTS ON SULFUR CHEMISTRY Equilibrium experiments Melting experiments MONITORING OF THE REACTION PARAMETERS Oxidation state of iron Oxygen sensors Redox number concepts Interdependence of redox related measurements MODELS OF INDUSTRIAL SULFUR FINING Solubility concept Equilibrium concepts Dynamic equilibrium concepts INVESTIGATIONS UNDER INDUSTRIAL CONDITIONS SUMMARY ACKNOWLEDGMENT REFERENCES
I «3
337 339 341 341 344 348 348 349 350 351 352 352 352 353 355 358 359 359
Sulfur Degassing From Volcanoes: Source Conditions, Surveillance, Plume Chemistry and Earth System Impacts Clive Oppenheimer, Bruno Scaillet Robert S. Martin
INTRODUCTION Geodynamics and the geochemical behavior of sulfur Subduction zones Ocean ridge environments Hot spots Flood basalts and silicic parts of large igneous provinces MEASURING VOLCANIC SULFUR EMISSIONS Direct sampling In situ sensing Ultraviolet spectroscopy Broad-band infrared spectroscopy Laser spectroscopy x
363 363 364 369 371 372 373 377 377 378 383 385
Sulfur
in Magmas
and Melts
- Table of
Contents
Satellite remote sensing INTERPRETATION OF SULFUR-EMISSION DATA Proportions of sulfur species Sulfur fluxes Sulfur isotopes VOLCANIC SULFUR EMISSION TO THE ATMOSPHERE Ice cores ATMOSPHERIC AND CLIMATIC IMPACTS OF SULFUR DEGASSING Chemical schemes relevant to volcanic sulfur emissions Impacts of tropospheric sulfur emissions from volcanoes The atmospheric and climatic impact of the 1991 eruption of Mt. Pinatubo Requirements for a climate-forcing eruption SUMMARY AND CONCLUSIONS ACKNOWLEDGMENTS REFERENCES
385 386 386 387 388 389 392 394 394 398 399 404 405 406 406
Sulfur Isotopes in Magmatic-Hydrothermal Systems, Melts, and Magmas Luigi Marini, Roberto Moretti, Marina Accornero INTRODUCTION BASIC PRINCIPLES Terminology of sulfur isotope systematics 833S and 836S values Equilibrium fractionation factors Isotope geothermometry SULFUR ISOTOPIC COMPOSITION OF NATURAL SAMPLES Mantle-derived materials and igneous rocks Sulfide and sulfate minerals from magmatic, magmatic-hydrothermal and related ore deposits Sulfur isotopes in magmatic and magmatic-hydrothermal systems SULFUR STABLE ISOTOPES AND THE POTENTIAL FOR PROBING DEGASSING AND CRYSTALLIZATION PROCESSES AND SULFUR SOURCES IN MAGMAS Magmatic degassing and sulfur isotope fractionation Separation of S-bearing liquids and/or solid phases Parametric assessment Comparison of analytical S and 8 34 S zs data from selected volcanic systems and theoretical models of degassing and separation of sulfides and anhydrite Conclusions and future research ACKNOWLEDGMENTS REFERENCES
xi
423 424 424 425 426 430 430 430 431 434
452 453 454 454 465 481 482 482
Sulfur
I3
in Magmas
and Melts
- Table of
Contents
Interactions Between Metal and Slag Melts: Steel Desulfurization Jean Lehmann, Michele Nadif
INTRODUCTION PARTITIONING OF SULFUR BETWEEN SLAG AND METAL MELTS Sulfide capacity Modeling Desulfurization during secondary metallurgy operations METHODS OF DESULFURIZATION Evolution of S-content during liquid steel refining Desulfurization of steel by steel-slag stirring Slag formers additions Slag composition Stirring conditions Desulfurization of steel by lime powder injection SUMMARY AND FUTURE WORK LIST OF SYMBOLS REFERENCES
1 6
493 494 494 495 496 499 499 501 503 503 503 506 507 509 510
The Role of Magmatic Sulfur in the Formation of Ore Deposits Adam C. Simon, Edward M. Ripley
INTRODUCTION 513 GEOCHEMISTRY OF SULFUR IN MAGMATIC-HYDROTHERMAL SYSTEMS 514 Sulfur basics 514 Behavior of sulfur in silicate melts 516 THE PARTITIONING OF METALS AND SULFUR AMONG MAGMATIC PHASES ... 519 The partitioning of sulfur between silicate melt and H-O-S-Cl fluid(s) 519 Controls on the partitioning of ore metals among silicate melt and crystalline sulfides 519 The partitioning of ore metals among silicate melt, sulfide liquid and sulfide crystals 523 The partitioning of ore metals among silicate melt and S-bearing aqueous fluid(s) 527 The transport of ore metals in magmatic-hydrothermal fluid(s) 530 The partitioning of ore metals between vapor and brine at temperatures below the water-saturated granite solidus 539 PORPHYRY-TYPE ORE DEPOSITS 540 Porphyry basics 540 Tectonic setting and associated magma composition of porphyry deposits 540 Source of sulfur in porphyry environments 541 Source of ore fluids in porphyry environments 542 xii
Sulfur
in Magmas
and Melts
- Table of
Contents
Constraints on the composition of porphyry-ore forming fluids Harmonizing fluid transport data from nature and experiments Oxidation state of causative magmas: the role of sulfide vs. sulfate Causative magma sources: normal or enriched? Deposition of metal-sulfides in the porphyry environment Ni-Cu-(PGE) DEPOSITS Characteristics and classification of magmatic Cu-Ni-(PGE) deposits Resource and grade characteristics A general model for magmatic Ni-Cu ore genesis Source magmas for Ni-Cu deposits Transport of sulfide melt PGE DEPOSITS IN LAYERED INTRUSIONS Characteristics and classification of PGE deposits Models for the genesis of PGE deposits in layered mafic intrusions Source magmas for PGE deposits FUTURE RESEARCH: WHAT DO WE NEED? ACKNOWLEDGMENTS REFERENCES
xiii
543 546 546 549 551 552 552 553 554 556 556 557 557 559 563 563 5 64 564
1
Reviews in Mineralogy & Geochemistry Vol. 73 pp. 1-8,2011 Copyright © Mineralogical Society of America
Studies of Sulfur in Melts - Motivations and Overview Harald Behrens Institut für Mineralogie andZFM Center for Solid State Chemistry and New Materials Leibniz Universität Hannover Callinstr. 3 D-30167 Hannover, Germany [email protected]
James D. Webster Dept. of Earth and Planetary Sciences, Division of Physical American Museum of Natural History Central Park West at 79th St. New York, New York 10024-5102, U.S.A.
Sciences
jdw @ amnh. o rg
INTRODUCTION Background For the past 37 years the Mineralogical Society of America, and in conjunction with the Geochemical Society (since 2000), have sponsored and published 72 review volumes that communicate the results of significant advances in research in the Earth sciences. Several of these have either directly or indirectly addressed the fundamental importance, role, and behavior of volatile components on processes influencing magma rheology, crystallization, evolution, eruption, and related metasomatism and mineralization. Volume 30—which was published in 1994—focused on this topic broadly, and this volume has provided a lasting summary on the geochemical and physical behaviors of a wide variety of magmatic volatiles (Carroll and Holloway 1994). Since that year, continued research has brought important and new knowledge about the role of the volatile component sulfur in natural magmas, and significant progress was made simultaneously in understanding the role of sulfur in industrial or technical processes such as glass or steel production. Here, in volume 73, we have assembled in 15 chapters the current state of research concerning sulfur in melts based on the extensive experience of various authors practically working on these topics. The behavior of sulfur in melts and its implications for natural and industrial processes are still insufficiently understood, and hence, are difficult to apply as a tool for interpreting problems of geological or industrial interest. In recent decades, various new investigations in the geosciences as well as in the engineering and material sciences have employed modern spectroscopic, analytical, theoretical, and experimental techniques to improve our understanding of the complex and volatile behavior of sulfur in a wide variety of molten systems. However, these different research initiatives (e.g., empirical vs. applied research and natural vs. technical applications) were rarely well integrated, and the scientific goals were usually approached with specific and relatively focused points of view. Consequently, bridging this longstanding gap between the earth sciences and material sciences is one of the major objectives of this published volume and its associated short course (presented August of 2011 in Goslar, Germany). Furthermore, it is currently an appropriate time to provide a comprehensive overview on the 1529-6466/11/0073-0001S05.00
DOI: 10.2138/rmg.2011.73.1
2
Behrens and Webster
state of the art concerning sulfur in silicate melts given the important advances made since 1994, and also to address important questions which remain to be resolved. The behavior and importance of sulfur in melts Sulfur is one of the most abundant volatiles in terrestrial magmas. During volcanic eruptions, large amounts of sulfur are released to the atmosphere, mostly as S0 2 and H 2 S, which have important climatic impacts. Sulfur also has significant effects on the partitioning of a wide variety of elements between silicate melts, liquid metals, gases, and solids, and consequently magmatic sulfur species exert major controls on the genesis of a large variety of ore deposits. Physicochemical processes involving sulfur also affected the evolution of the early solar system. Furthermore, sulfur plays important roles in technical processes involved in glass and steel production. In glass manufacturing, sulfate is often added for fining of glass melts, i.e., to remove bubbles which would otherwise cause significant quality degradation, and sulfur also influences the color of industrial glass. In steel production, molten metals are forced to interact with silicate slag melts for desulfurization which is required to produce high-performance steel. Although the specific problems related to sulfur in silicate melts vary between natural and industrial applications, the underlying physicochemical processes are nevertheless the same. The solubility of sulfur-bearing minerals and the partitioning of sulfur between coexisting phases (e.g., a melt and gas phase) determine how much sulfur can be dissolved in or extracted from melts. Moreover, the diffusivity of sulfur in melts exerts a major control on the formation of bubbles and on the kinetics of mineral dissolution and growth. It is also important to bear in mind that the behavior of sulfur in silicate melts is much more complex than that of other volatiles, such as water and carbon dioxide, because sulfur dissolves in silicate melts in at least two different oxidation states. At low oxygen fugacities below that of the nickel-nickel oxide oxygen buffer, sulfide (S2~) is the predominant sulfur species whereas at higher oxygen fugacities sulfate (S0 4 2 - ) is dominant. Other species such as sulfite (S4+) may exist as well at specific conditions. As a consequence of the multi-species behavior of sulfur, it is often difficult to model and sometimes difficult to predict the behavior of sulfur in natural and industrial processes. Complex reactions which are coupled to other oxidation-reduction equilibria (e.g., those involving heterovalent cations such as iron) can occur due to changes in the oxidation state of sulfur. For instance, during the degassing of silicate melt at very high temperature and atmospheric pressure, sulfate becomes instable and dissociates forming sulfur dioxide and oxygen, and the latter species are able to oxidize ferrous to ferric iron. REVIEW CHAPTERS IN THIS VOLUME In chapter 2, an overview on methods for quantifying the sulfur contents of glasses, minerals, and other solid phases is given by Ripley et al. (2011, this volume). The most common technique to gain information about the spatial distribution of sulfur in condensed matter is still electron microprobe analysis (EMPA), but other methods, i.e., laser-ablation combined with mass spectrometry (LA-ICPMS) or optical emission spectrometry and secondary ion mass spectrometry (SIMS) are also frequently used tools. X-ray fluorescence (XRF) is a widely employed method for analysis of rocks, owing to its ability to simultaneously analyze a wide range of elements in different matrices with a modest level of sample preparation. This chapter also describes nuclear reaction analysis, which involves bombardment of material with a high-energy beam and subsequent detection of gamma radiation, as another technique used to measure samples with very low sulfur concentrations. Issues bearing on proper standards, analytical detection limits, and analytical uncertainties are also discussed. In chapter 3, Wilke et al. (2011, this volume) report on the significant progress that has been made in the last few years in the characterization of sulfur speciation in glasses by spectroscopic
Sulfur in Melts - Motivations and Overview
3
techniques. X-ray absorption spectroscopy (XAS) is the most commonly used tool. This method can clearly distinguish oxidation states of sulfur in the glasses and yields information about the coordination of sulfur, but quantitative interpretation of XAS spectra in terms of relative proportions of sulfur species in glasses is still in its early stages and requires additional calibration work. Magic-angle spinning nuclear magnetic resonance spectroscopy (MAS NMR) also has the potential to yield insights into the coordination and the oxidation states of sulfur in glasses, but its application is limited by the low natural abundance of the sulfur isotope 33S used in NMR measurements. Recently, Raman spectroscopy has been intensively applied to study sulfur speciation, i.e., to analyze specific bands of sulfide, sulfate, and hydrogen sulfide in glasses. However, as described by Wilke et al., this technique is applicable only for specific melt compositions and at sulfur contents exceeding several hundreds of ppm by weight. A variety of processes in magmas and melts are controlled by sulfur diffusion and oxidation-reduction reactions of sulfur in the melt, and an overview on this topic is given in chapter 4 by Behrens and Stelling (2011, this volume). Close inspection of data in the published literature implies that differences in sulfur speciation, i.e., whether sulfide or sulfate is the dominant sulfur species in melts, have little influence on the mobility of sulfur in the melts. The evaluation of results of experimental studies in this chapter does, however, provide evidence that sulfur diffusion is strongly coupled to the dynamics of the silicate network and, hence, to the viscosity of the melt. It is shown that the Eyring relationship, which relates diffusivity to viscosity, is a good tool for predicting sulfur diffusivity in the melts. The kinetic issues of melting of raw materials in industrial glass manufacturing are described in chapter 5 by Falcone et al. (2011, this volume). During the production of sodalime-silicate glass, sulfur-containing raw materials (sulfates and sulfides) are added to improve the quality of the final product; sulfate is used for fining of glass melts, i.e., to remove bubbles from the glass batch. In addition, the oxidation-reduction conditions during glass melting and minor contents of iron exert major controls on the color of the glass products. In particular, the amber color of glasses is attributed to chemical associations, such as Fe3+-S2~, which are stable only in a narrow range of oxygen fugacity, the latter of which can be established by adding specific amounts of carbon sources to the raw materials prior to melting. It has long been of interest to predict the solubility of sulfur in silicate melts under the conditions relevant to glass and steel production as well as for natural processes. In chapter 6, Backnaes and Deubener (2011, this volume) give an overview of experimental results improving industrial glass or steel production. Particular attention is given to experiments on the equilibration of gas mixtures with silicate melts and on the effects of adding reducing agents such as carbon to the melt at ambient pressure. It is noted that the measured quantities of sulfur in the melt typically do not represent equilibrium conditions but instead are affected by kinetic factors such as diffusion and convection in the melt. Nevertheless, such experiments provide useful information on how different chemical components affect the ability of the melt to bind sulfur species. A variation in oxygen fugacity in the gas mixtures in contact with the melts at constant sulfur fugacity demonstrates that sulfur solubility is particularly high when sulfate is the stable sulfur species. High sulfur concentrations in the melts are also achieved when equilibrating silicate melts with gas mixtures under reducing conditions, and a distinctly V-shaped solubility curve for sulfur in the melt as a function of the logarithm of oxygen fugacity in the gas phase is often observed at ambient pressure. Useful approaches to estimate the solubility of sulfur in silicate melts relevant to natural systems are given in chapter 7 by Baker and Moretti (2011, this volume). Empirical models which reproduce experimental data accurately have been tested, but these models may have large uncertainties when extrapolated to conditions which are far from those covered by the experimental data. Thermodynamic models have been constructed and are more applicable and useful for extrapolation out of the range of the supporting experimental data. In particular,
4
Behrens and Webster
a new model is proposed by Baker and Moretti (2011, this volume) for prediction of sulfur capacity at anhydride saturation (SCAS) in silicate melts. As detailed in chapter 8 by Wallace and Edmonds (2011, this volume), silicate melt inclusions trapped in minerals provide the opportunity to investigate processes of magma evolution and subsequent eruptive processes. Silica-rich melts are characterized by relatively low sulfur solubilities, so it is clear that the recharge of mafic magma with more chemically evolved magmas (some of which may be saturated in vapor) contributes to the volatile budget of at least some intermediate and silicic volcanoes. Characteristic ranges in S content of pillowbasalt rim glasses and melt inclusions collected from mid-ocean ridge basalts (MORB) and basaltic arc magmas are summarized. This chapter addresses mafic magmas that are able to mingle and mix efficiently with resident magmas. It also describes how and why the mixed magmas associated with mafic recharge are usually highly oxidized and silicic in composition which promotes sulfur partitioning into the vapor phase. The sulfur data from melt inclusions are used to interpret volatile recycling in subduction zones, compositions of pre-eruptive volcanic gases, and the "excess sulfur" problem associated with some eruptive systems. The partitioning of sulfur between fluids and melts, as reviewed in chapter 9 by Webster and Botcharnikov (2011, this volume), controls the volatile budget of magmas and sulfur release on volcanic degassing. In general, sulfur is preferentially incorporated in a magmatic fluid phase, i.e., fluid/melt partition coefficients are larger than 1 and even may reach values of 1000 or more. Temperature, pressure, and oxygen and sulfur fugacities as well as fluid and melt composition affect the fluid/melt partitioning of sulfur. Typically, silica-rich melts (e.g., rhyolitic melts) display larger S partition coefficients than silica-poor (e.g., basaltic) melts. With knowledge of the partitioning behavior of sulfur, the measurements of magmatic gas compositions may be used as an indicator of magma degassing activity and style. Fluids generated in magmatic systems are usually composed of various components in the system S-O-H-C-Cl, but other halogens and N may also be involved, and as described in this chapter, experimental research on sulfur partitioning at elevated pressures between silicate melts and complex multi-component fluids is insufficient, at present, to model degassing in all magmas. An overview on the importance and role of sulfur-bearing minerals in magmas is given in chapter 10 by Parat et al. (2011, this volume). As described therein, S-bearing minerals represent only a negligible component of the mineral assemblage in magmatic rocks, and hence, are accessory minerals. In most cases, these S-bearing accessory phases are iron sulfides, typically pyrrhotite, but chalcopyrite, pentlandite, sphalerite or molybdenite also occur. Among sulfate minerals that are stable in magmatic systems, anhydrite is the most common phase. Other magmatic S0 4 -bearing minerals include S-rich apatite, haiiyne/sodalite, and silvialite. Despite the small abundance of these S-bearing minerals, they are extremely useful for estimating the activity of various sulfur-bearing species in the magmas, to constrain oxygen fugacity and the S concentration in magmas prior to eruption and degassing (e.g., pre-eruptive sulfur concentration in melts). In chapter 11, Ebel (2011, this volume) addresses the current understanding of sulfur in extraterrestrial bodies and in the deep Earth. Our knowledge on the abundances of S, C, N, O, and other volatile components in the solar system is based mainly on meteorite data combined with spectroscopic measurements of the solar photosphere. However, sampling of comets in the NASA Stardust mission and experimental studies, i.e., on element partitioning between metals, metal liquids, silicate and silicate melts, at high pressures also provide useful information. The solar abundance of S expressed by the ratio of (S/(Fe+Ni+Co)) is approximately 0.5. It is preserved at least in the carbonaceous chondrites (CI) and perhaps also in comets, while the rocky planets and most meteorite parent bodies (asteroids) have either lost or never accreted a significant sulfur component. This chapter describes how silicate melts are involved in nearly every phase of planetary evolution, from accretionary impacts through core/mantle
Sulfur in Melts - Motivations and Overview
5
differentiation to volcanism and subduction. While the effect of dissolved sulfur on element partitioning between melt and solid metals has been investigated, it remains an open question about how sulfur affects the partitioning of other elements during core/mantle differentiation. The fining of molten glass, as described in chapter 12 by Miiller-Simon (2011, this volume), is an important step in industrial glass manufacturing that is used to improve the quality of glass products. The primary melt may contain numerous bubbles which originate from air trapped in the cavities of the solid starting mixture before melting, and from C 0 2 that is generated through combustion of organic impurities and the decomposition of carbonates during melting. In the fining process, these bubbles expand by sequestration of other gas-soluble components in the melt facilitating the ascent of the bubbles to the melt-gas interface, so the number of bubbles decreases strongly in the product with heating time. Sulfate salts are often added to the raw material batch for fining of soda-lime silicate melts, which is the most commonly used base composition for container glass, fiat glass, fiber glass and glass tableware products. Upon heating to temperatures above 1400 °C, sulfate ions dissociate to sulfur dioxide and oxygen which diffuse into the pre-existing bubbles. As detailed in this chapter, understanding the elementary processes of fining is crucial in optimizing the entire glass-production process. In Chapter 13, Oppenheimer et al. (2011, this volume) discuss sulfur degassing from volcanoes with respect to source conditions in magma, the surveillance of volcanic activities, the chemical composition of released gases, and global impacts of magmatic sulfur release. This review also addresses the speciation of sulfur in volcanic vapors, the causes of variability in sulfur abundance and speciation in different geodynamic contexts, techniques and resulting data in the measurement of sulfur emissions from volcanoes, the links between subsurface processes and surface observations, and the consequences of volcanic sulfur degassing for climate and the environment. The 1991 activity of Mt. Pinatubo is described as a well-documented example of the global impacts of a single major eruption (approximately 10 km 3 of erupted material) that has been studied with significant instrumental detail. Although twenty years have already passed since that eruption, it is remarkable to note that new findings concerning its climatic, environmental, and ecological consequences are still emerging. Despite the tremendous insights afforded by this event, it represents only a very small sample of the broad range of volcanic eruption styles, geographic locations, and atmospheric states that combine to produce significant perturbations to atmospheric composition, radiation, and dynamics. Chapter 14, by Marini et al. (2011, this volume), reviews how the stable isotopes of sulfur serve as an important geochemical tool for the study of processes occurring in magmarelated, hydrothermal systems, melts, and magmas. Sulfur has four stable isotopes with natural abundances of 95.02% ( 32 S), 0.75% ( 33 S), 4.21% ( 34 S), and 0.02% ( 36 S). Importantly, small variations in the ratios of these isotopes can be induced by kinetic and thermodynamic effects, and these variations or fractionations are exacerbated given the multiple oxidation states of sulfur. The fractionation of sulfur isotopes between co-existing phases is particularly large when the oxidation state of sulfur differs in both phases and when the phases have different aggregate physical states (i.e., gas phases vs. condensed phases). This chapter summarizes how sulfur isotopes have been measured in volcanic gases as well as in samples from magmatic rocks and or magmatic ore deposits. These data are compared with theoretical models of degassing and the crystallization and physical separation of sulfides and anhydrite from melt to gain insights into the processes occurring in magma chambers and during the ascent of the magma to the surface. In particular, this chapter addresses sulfur isotope characteristics for magmas and eruptive products of Mt. Vesuvius, Mt. Mazama, and Mt. Etna. Desulfurization of molten metals by interaction with slags is widely applied in the production of high-quality steel as described in chapter 15 by Lehmann and Nadif (2011, this volume). Sulfur is mainly present in solid steel as manganese sulfide (MnS) inclusions which strongly affect the processing and properties of steel. Since such inclusions behave
6
Behrens and Webster
more plastically than steel during deformation, they act as crack-initiation sites and zones of weakness. Therefore, sulfur is detrimental to the malleability, ductility, toughness, formability, weldability, and corrosion resistance of steels, and hence, very low levels of sulfur ( t2 o
a,
O
u
rt
>,
a fl W
s
g fl
tj 01 ^ 1« 0)B 0) > » s s
fl •2 I •rt a ei
= —
-d £ S > aj ij 5 § e Sfl K p
2
a
a a.
Cm 50, while 3 5 S produced from CI is about 35x the activity produced from an equal amount of sulfur. Accurate measurement of sulfur therefore requires measurement of and correction for the interfering element. For measurement of sulfur via 3 5 S, a CVS ratio of 0.003 results in a 10% correction (Paul 2008). Li and Filby (1983) measured sulfur mass fractions from 0.7% to 4% in fuel oils with Cl/S ratios < 0.003 with l a uncertainties of < 3%, but for biological materials with < 0.3% sulfur and Cl/S > 0.3, uncertainties up to 50% were reported. Paul (2008) measured 5 |ig/g sulfur in a 1 g sample of ultra-high-purity iron by the 3 5 S method, with an irradiation time of 8 h. (Paul 2008) and an expanded uncertainty of about 10%, with a 30% correction for the chlorine (also measured by NAA). A detection limit of 0.1 jig was calculated for sulfur in a sample with 0.1 jig CI. A general discussion of uncertainties arising in RNAA procedures is given elsewhere (Paul et al. 2003; Paul 2008). Prompt gamma-ray activation analysis (PGAA), also known as prompt neutron gammaray activation analysis (PNGAA), utilizes radiation emitted during neutron bombardment rather than radiation from delayed decay of radioactive product nuclei. This technique has
Analytical
Methods
19
the advantage of being able to measure elements that do not form radioactive products upon neutron capture. Gamma rays emitted during de-excitation of compound product nuclei formed upon neutron capture (known as prompt or capture gamma rays) are measured using a high-purity intrinsic germanium detector. PGAA is typically performed using neutron beams extracted from reactors, although isotopic sources (e.g., 152Cf) are sometimes used. The use of cold neutrons with guided beams results in lower background and enhanced sensitivities (Paul 1997). PGAA is regularly performed at the NIST Center for Neutron Research, which is maintained as a user facility. Uncertainties in PGAA may arise from correction for background gamma rays from neutron capture in the shielding, detector, and the surrounding environment and from the effects of neutron scattering by hydrogen (Mackey et al. 2005). For this reason, samples are most often packaged and mounted for analysis using nonhydrogenous materials. Because neutron scattering can have a dramatic effect on element sensitivities, best results are obtained by matching the hydrogen content of samples and standards. Sulfur has been measured in coals, coal fly ash, cements, and biological materials using reactor-based thermal neutron PGAA at mass fractions down to 0.2% (Jurney et al. 1977; Failey et al. 1979; Germani et al. 1980), with l a uncertainties of 5% to 10% and reported detection limits of about 100 jig (Jurney et al. 1977). PGAA using a 152Cf neutron source has been used for on-line determination of sulfur in coals at mass fractions from 0.5% to 6% (Vourvopoulos and Womble 1989). The availability of portable neutron sources and reactor user facilities (Paul 1997) makes PGAA a viable technique for measurement of sulfur at mass fractions above 0.1%. Sulfur has been measured by 14 MeV neutron activation analysis using a D-T (deuteriumtritium) neutron generator as the radiation source (Shani and Cohen 1976; Klie and Sharma 1982) and quantified by measurement of 34P produced by the 34S(n, p)34P reaction. A lower limit of detection of 0.25% (mass fraction) has been reported for sulfur in coal (Klie and Sharma 1982). Charged-particle activation analysis has been used to measure sulfur, with a cyclotron as the radiation source, via the reaction 34S(p, n)34mCl in metals with and without radiochemical separation of chlorine (Dabney et al. 1973; Vanecasteele et al. 1980; Strijckmans et al. 1985), and in petroleum products using the 32S(p, n)32Cl reaction (Thomas and Schweiker 1972). Detection limits at lower ppb levels have been reported. Proton-induced prompt-gamma activation analysis has been used to measure sulfur in coals at % mass fractions (Olivier et al. 1986). Heavy ion activation analysis using the 32 S( ls O, t)47V reaction has been used to measure sulfur in metals, ceramics, and biological samples at mass fractions down to ppb (Rousseau et al. 1984). Sulfur analysis of minerals and glasses using the electron microprobe Electron microprobe analysis is a nondestructive in situ technique used to determine the concentrations of elements in solid materials. When a sample is bombarded by an electron beam, each element emits a set of characteristic X-rays with specific energies and wavelengths. The concentration of an element in the sample is determined by comparing the X-rays of an unknown material with the intensity of a characteristic X-ray emitted from a standard in which the concentration of the element is known. Both the sample and standard must have a flat, polished surface to ensure precise comparison of X-ray intensity between them. All major elements in the sample must be analyzed so that the matrix effect can be corrected accurately using the correction procedure (ZAF or PAP) imbedded in the data acquisition software. Most instruments are equipped with wavelength-dispersive spectrometry (WDS) and energydispersive spectrometry (EDS). However, EDS is not suitable for quantitative analysis of many rock-forming minerals, volcanic and synthetic glasses, and melt inclusions because the energy peaks of the X-rays emitted from some of the constituent elements overlap (i.e., Na-Mg, Mg-Al, Al-Si, K-Ca). Most instruments can accommodate two types of samples: 25 mm (1") circular and 26 x 46 mm rectangular polished sections or polished thin sections.
20
Ripley et al.
The smallest spatial resolution (beam diameter) of the electron beam in most instruments is 1 |im. Under the conditions of 15 kV and 20-nA beam current; the total excitement volume in the target is about 2x larger than the beam size. So, typically a polished area of >3 |im in diameter in the sample is required for routine analysis. During electron-beam bombardment, heat is generated on the surface of the target. For example, under the conditions of 15 kV, 20 nA and 1 |im beam size, the temperature in the target may reach 50°C. If the beam current increases to 100 nA, the temperature in the target may exceed 100°C at which de-volatilization may occur. A larger beam of 5-10 |im in diameter may reduce the bombardment heat by >50%. So, typically a 5-10 |im beam is used for the analysis of volcanic and synthetic glasses, and melt inclusions. Counting time has a minor effect on the detection limit for sulfur. For example, doubling the counting time only reduces the detection limit by
V
-0.1 32
S/ 2 9 Si
0.0
(8) Comparison of Feb.2010 and Feb,2008 analysis Feb.2008 30 pm; 42.4 wt% NaCI eqv. s conc. 9000 ng/g LOD of S; 336 (jg'g
-VvwW Feb.2010
30 pm 42.0 wt% NaCI eqv.
S conc. 6000 |jg/g LOD of S; 102 pg/g
0.001
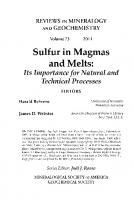
60 70 Time (seconds) Figure 11. Plots of gas blank-corrected transient signals (cps) of quartz-hosted single brine inclusions (30 |jm size) in a molybdenite-quartz vein from the Bingham Canyon deposit, USA by LA-ICP-MS. (A) Good signals of 32S, 29Si, 23Na, and ^S/^Si ratios in fluid inclusion after cleaning of ablation chamber, measured in Feb. 2010. (B) High and unstable S/Si background ratios during quartz ablation (Feb. 2008) become lower and stable (Feb. 2010) after removal of S contamination by cleaning of the ablation chamber, leading to a much better detection limit (LOD).
expected sulfur concentration. A review of the literature shows that the method of choice for bulk sulfur analyses of rocks (including ores) involves an elemental analyzer coupled with an infrared detection cell (e.g., LECO, ELTRA systems). The "Kiba" method of sulfur extraction followed by gravimetric analysis allows the detection of sulfur in the range of 50-100 ppm, but care must be exercised in the collection of produced sulfide and final weighing. The method is particularly suitable for the collection of finely disseminated sulfides in rocks for isotopic analysis. For routine determination of sulfur in minerals and glasses the electron microprobe remains the most utilized technique, unless sulfur is present at concentrations less than 50 to 100 ppm. For the detection of low-levels of sulfur in minerals and glasses Secondary Ion Mass Spectrometry may become the norm. Only a few labs in the world at present are capable of exploring sulfur determination by SIMS; the future for routine sulfur analysis may be a function
34
Ripley et al. Table 4. Comparison of methods for the determination of S concentration in minerals, rocks, glasses, and fluid inclusions
Normal Detection Limit
Remarks
powdered minerals, rocks, glasses
100 ppm; minimum 0.6 ppm in a homogeneous 1-gram sample
standard choice for analyses of rocks and glasses
powdered minerals, rocks, glasses
50 to 100 ppm
dissolved S in glasses may be difficult to extract
Kiba extraction
powdered minerals, rocks, glasses
50 to 100 ppm
accurate determinations require careful gravimetric procedures
X-ray fluorescence
powders (in form of fused glass disks or pressed disks); polished minerals
1000 ppm
high detection limit and poor precision has limited usefulness
Nuclear methods
powders or solid surfaces that can be irradiated
5 ppm in a 1 gram sample
uncertainty may be high
Electron microprobe
polished surfaces of minerals and glasses
100 ppm
match of sulfide and sulfate standards to unknowns may be critical
SIMS
polished surfaces of minerals and glasses
6 ppb, but variable due to instrument background
background may be as high as 300 ppb; accuracy of low-level standards may be a concern
LA-ICP-MS
polished surfaces of minerals or glasses; fluid inclusions
5 to 30 ppm
spectral interference, blank contamination and lack of appropriate standards for analysis of S in silicates have been limiting factors
Technique
Sample Types
EA with infrared detection cell EA coupled to a mass spectrometer
of instrument availability. Nuclear methods of sulfur analyses offer the potential for low-level sulfur determination, but standards and samples with known isotopic compositions must be run together to reduce large variations in accuracy. Laboratory availability will limit the routine use of nuclear methods of analyses for most geologic materials. Sulfur analyses using LA-ICP-MS technology is in its infancy, but the potential to determine low-levels of sulfur concurrently with other trace-elements ensures that research will continue to be directed at making sulfur analyses via LA-ICP-MS routine. Analyses of sulfur in fluid inclusions via LA-ICP-MS will advance research on ore genesis and volatile interaction with rocks. Microanalytical tools involving the ion probe and LA-ICP-MS offer an additional benefit of potential determination of sulfur isotope ratios (see the contributions in this volume by Marini et al. 2011 and Simon and Ripley 2011). Samples analyzed via mass spectrometry following high-temperature combustion offer a similar benefit, but the extraction of sulfur species dissolved in glass by this method has proven difficult with most EA systems.
Analytical
Methods
35
ACKNOWLEDGMENTS We would like to thank Nicole Metrich and Charles Mandeville for reviews that improved the presentation of this chapter. The editorial assistance of Jim Webster and Harald Behrens is appreciated. Paul Sylvester expresses appreciation to Mike Tubrett and Kate Souders for the LA-ICP-MS measurements of sulfur in the NIST glasses. REFERENCES Audi G, Wapstra AH, Thibault C (2003) The 2003 atomic mass evaluation. (II). Tables, graphs and references. Nucl Phys A 729:337-676 Axelsson MD, Rodushkin I (2001) Determination of major and trace elements in sphalerite using laser ablation double focusing sector field ICP-MS. J Geochem Explor 72:81-89 Bach W, Erzinger J (1995) Volatile components in basalts and basaltic glasses from the EPR at 9°30 N. Proc Ocean Drill Program Part B Sci Results 142:23-29 Ballhaus C, Sylvester P (2000) Noble metal enrichment processes in the Merensky reef, Bushveld complex. J Petrol 41:545-561 Bandura DR, Baranov VI, Tanner SD (2002) Detection of ultratrace phosphorus and sulfur by quadrupole ICPMS with dynamic reaction cell. Anal Chem 74: 1497-1502. Banks DA, Yardley BWD (1992) Crush-leach analysis of fluid inclusions in small natural and synthetic samples. Geochim Cosmochim Acta 56: 245-248. Bendall C, Lahaye Y, Fiebig J, Weyer S, Brey GP (2006) In situ sulfur isotope analysis by laser ablation MCICPMS. Appl Geochem 21:782-787 Bouten P, Hoste J (1962) The determination of sulfur and phosphorus in steel by neutron activation analysis. Anal Chim Acta 27:315-319 Bower NW, Gladney ES, Ferenbaugh RW (1986) Critical comparison of X-ray fluorescence and combustion infrared methods for the determination of sulphur in biological matrices. Analyst 111: 105-106 Bray CJ, Spooner ETC (1992) Fluid inclusion volatile analysis by gas-chromatography with photoionization micro-thermal conductivity detectors - applications to magmatic MoS 2 and other H 2 0-C0 2 and H 2 0-CH 4 fluids. Geochim Cosmochim Acta 56: 261-272 Cabri LJ, Sylvester PJ, Tubrett MN, Peregoedova A, Laflamme LHG (2003) Comparison of LAM-ICP-MS and Micro-PIXE results for palladium and rhodium in selected samples of Noril'sk and Talnakh sulfides. Can Mineral 41:321-329 Carroll MR, Rutherford M.J (1988) Sulfide speciation in hydrous experimental glasses of varying oxidation state: results from measured wavelength shifts of sulfur X-rays. Am Mineral 73: 845-849 Cauzid J, Philippot P, Martinez-Criado G, Menez B, Laboure S (2007) Contrasting Cu-complexing behaviour in vapour and liquid fluid inclusions from the Yankee Lode tin deposit, Mole Granite, Australia. Chem Geol 246: 39-54 Chinchon JS, Lopez-Soler A, Traveria A, Vaquer R (1988) X-ray fluorescence analysis of samples with elemental sulphur: Effect of sulphur sublimation. X-Ray Spectrom 17: 217-218 Craddock PR, Rouxel O, Ball L, Bach W (2008) Sulfur isotope measurement of sulfate and sulfide by highresolution MC-ICP-MS. Chem Geol 253:102-113 Dabney SA, Swindle DL, Beck JN, Francis G, Schweikert EA (1973) On the determination of sulfur by charged particle activation analysis. J Radioanal Nucl Chem 16:375-383 Dams R, Robbins JA, Rahn KA, Winchester JW (1970) Nondestructive neutron activation analysis of air pollution particulates. Anal Chem 42:861-867 de Hoog JM, Mason PD, van Bergen MJ (2001) Sulfur and chalcophile elements in subduction zones: constraints from a laser ablation ICP-MS study of melt inclusions from Galunggung Volcano, Indonesia. Geochim Cosmochim Acta 65:3147-3164 de Hoog JCM, Hattori HK, Hoblitt RP (2004) Oxidized sulfur-rich mafic magma at Moutn Pinatubo, Philippines. Contrib Mineral Petrol 146:750-761 De Laeter JR, Bohlke JK, De Bievre P, Hidaka H, Peiser HS, Rosman KJR, Taylor PDP (2003) Atomic weights of the elements: Review 2000 (IUPAC Technical Report). Pure and Appl Chem 75:683-800 Diana M, Gabrielli N, Ridolfi S (2007) Sulfur determination on stone monuments with a field-transportable EDXRF system. X-Ray Spectrom 36:424-428, doi: 10.1002/xrs.l005 Elswick ER, Hower JC, Carmo AM, Sun T, Mardon SM (2007) Sulfur isotope geochemistry of coal and derived combustion products: an example from an Eastern Kentucky mine and power plant. Appl Geochem 22:2065-2077
36
Ripley et al.
Evans KA, O'Neill HStC, Mavrogenes J A (2008) Sulphur solubility and sulphide immiscibility in silicate melts as a function of the concentration of manganese, nickel, tungsten and copper at 1 atm and 1400 °C. Chem Geol 255:236-249 Failey MP, Anderson DL, Zoller WH, Gordon G E (1979) Neutron-capture prompt y-ray activation analysis for multielement determination in complex samples. Anal Chem 51:2209-2221 Fitzpatrick AJ, Kyser K, Chipley D, Beauchemin D (2008) Fabrication of solid calibration standards by a sol-gel process and use in laser ablation ICPMS. J Anal At Spectrom 23:244-248 Fleming RF, Lindstrom R M (1982) Limitations on the accuracy of sulfur determination in NAA. Trans Am N u c l S o c 41:223 Foriel J, Philippot P, Rey P, Somogyi A, Banks D, Menez B (2004) Biological control of CI/Br and low sulfate concentration in a3.5-Gyr-old seawater from North Pole, Western Australia. Earth Planet Sei Lett 228:451463 Gazulla MP, Gomez MP, Orduna M, Rodrigo M (2008) New methodology for sulfur analysis in geological samples by W D - X R F spectrometry. X-ray Spectrom 38:3-8, doi 10.1002/xrs.l092 Germani M S , Gokmen I, Sigleo AC, Kowalczyk GS, Olmez I, Small AM, D.Anderson DL, Failey MP, Gulvali MC, Choquette CE, Lepel EA, Gordon GE, Zollar WH (1980) Concentrations of elements in the National Bureau of Standards' bituminous and subbituminous coal Standard Reference Materials. Anal Chem 52:240-245 Giblin AE, Likens GE, White D, Howarth R W (1990) Sulfur storage and alkalinity generation in New England lake sediments. Limnol Oceanogr 35:852-869 Gibson E K Jr, Andrawes F F (1978) Sulfur abundances in the 74001/74002 drive tube core from Shorty Crater, Apollo 17. Lunar and Planetary Science Conference, 9th, Houston, T X , March 13-17, 1978, Proceedings. Volume 2. (A79-39176 16-91) New York, Pergamon Press, Inc., p 2011-2017 Giles HL, Hurley PW, Webster H W M (1995) Simple approach to the analysis of oxides, silicates and carbonates using X-ray fluorescence spectrometry. X-ray Spectrom 24:205-218 Gray A L (1985) Solid sample introduction by laser ablation for inductively coupled plasma source mass spectrometry. Analyst 110:551-556 Greenberg RR, Lindstrom RM, Simons DS (2000) Instrumental neutron activation analysis for certification of ion-implanted arsenic in silicon. J Radioanal Nucl Chem 245:57-63 Guillong M, Heinrich CA (2007) Sensitivity enhancement in laser ablation ICP-MS using small amounts of hydrogen in the carrier gas. J Anal At Spectrom 2 2 : 1 4 8 8 - 1 4 9 4 Guillong M, Latkoczy C, Seo JH, Gunther D, Heinrich CA (2008a) Determination of sulfur in fluid inclusions by laser ablation ICP-MS. J Anal At Spectrom 2 3 : 1 5 8 1 - 1 5 8 9 Guillong M, Meier DL, Allan M M , Heinrich CA, Yardley B W D (2008b) S I L L S : A MATLAB-based program for the reduction of laser ablation ICP-MS data of homogeneous materials and inclusions. In: Laser Ablation I C P - M S in the Earth Sciences: Current Practices and Outstanding Issues. Sylvester P (ed) Mineralogical Association of Canada Short Course Series, 40:328-333 Gunther D, Audetat A, Frischknecht R, Heinrich CA (1998) Quantitative analysis of major, minor and trace elements in fluid inclusions using laser ablation inductively coupled plasma mass spectrometry. J Anal At Spectrom 13:263-270 Hauri E, Wang J, Dixon JE, King PL, Mandeville C, Newman S (2002) SIMS analysis of volatiles in silicate glasses. 1. Calibration, matrix effects and comparisons with FTIR. Chem Geol 183:99-114 Heinrich CA, Pettke T, Halter W E , Aigner-Torres M, Audetat A, Gunther D, Hattendorf B, Bleiner D, Guillong M, Horn I (2003) Quantitative multi-element analysis of minerals, fluid and melt inclusions by laserablation inductively-coupled-plasma mass-spectrometry. Geochim Cosmochim Acta 67:3473-3497 Hettipathirana TD, Grey NA, Naidu R (2004) Analysis of silicates using wavelength-dispersive X-ray fluorescence spectrometry for major elements: Effects of loss elimination and catch-weights. X - R a y Spectrom 33:117-123, doi: 10.1002/xrs.709. Ihinger PD, Hervig RL,McMillan PF (1994) Analytical methods for volatiles in glasses. Rev Mineral 30:67-121 Jochum KP, Stoll B, Herwig K, Willbold M, Hofmann AW (2006) MPI-DING reference glasses for in situ microanalysis: New reference values for element concentrations and isotope ratios. Geochem Geophys Geosyst 7:Q02008, doi:10.1029/2005GC001060 Jurney ET, Curtis D B , Gladney E S (1977) Determination of sulfur in environmental materials by thermal neutron capture prompt gamma-ray spectrometry. Anal Chem 49:1741-1743 Kerr 2001 The calculation and use of sulfide metal contents in the study of magmatic ore deposits: a methodological analysis. Explor Min Geol 10:289-301 Kiba T, Takagi T, Yoshimura Y, Kishi I (1955) Tin (Il)-strong phosphoric acid. A new reagent for the determination of sulfate by reduction to hydrogen sulfide. Bull Chem Soc Japan 28: 641-644 Klie JH, Sharma HD (1982) Sulfur determination in coal by 14 M e V neutron activation analysis. J Radioanal Nucl Chem 71:299-309 Knoll G F (1989) Radiation Detection and Measurement. John Wiley and Sons, New York
Analytical
Methods
37
Kosler J (2008) Laser ablation sampling strategies for concentration and isotope ratio analyses by ICP-MS. In: Laser Ablation ICP-MS in the Earth Sciences: Current Practices and Outstanding Issues. Sylvester P (ed) Mineralogical Association of Canada Short Course Series, 40:79-92 Krouse HR, Ueda A (1987) Contents and sulphur isotope composition of trace sulfate and sulphide in various rock types. Appl Geochem 2:127-131 Leoni L, Menichini M, Saitta M (1982) Determination of S, CI and F in silicate rocks by X-ray fluorescence analyses. X-ray Spectrom 11:135-137 Li M, Filby RH (1983) Determination of sulfur in fly ash and fuel oil Standard Reference Materials by radiochemical neutron activation analysis and liquid scintillation counting. Anal Chem 55:2336-2340 Liu Y, Samaha N, Baker DR (2007) Sulfur concentration at sulfide saturation (SCSS) in magmatic silicate melts. Geochim Cosmochim Acta 71:1783-1799 Longerich HP, Jackson SE, Gunther D (1996) Laser ablation inductively coupled plasma mass spectrometric transient signal data acquisition and analyte concentration calculation. J Anal At Spectrom 11:899-904 Lytle D, Gerke TL, Maynard JB (2005) Geochemistry of sulfur in iron corrosion scales found in drinking water distribution systems: Role of sulfate reducing bacteria. J Am Water Works Assoc 97:109-120 Mackey EA, Paul RL, Lindstrom RM, Anderson DL, Greenberg RR (2005) Evaluation of uncertainties in prompt gamma-ray activation analysis. J Radioanal Nucl Chem 265:273-281 Mandeville CW, Sasaki A, SaitoG, Faure K, King R, Hauri E (1998) open-system degassing of sulfur from Krakatau 1883 magma. Earth Planet Sci Lett 160:709-722 Mandeville CW, Webster J, Tappan C, Taylor B, Timbal A, Sasaki A, Hauri E, Bacon C (2009) Stable isotopic and petrologic evidence for open-system degassing during the climatic and pre-climactic eruptionsof Mt. Mazama, Crater Lake, Oregon. Geochim Cosmochim Acta 73:2978-3012 Marini L, Moretti R, Accornero M (2011) Sulfur isotopes in magmatic-hydrothermal systems, melts, and magmas. Rev Mineral Geochem 73:423-492 Mason PRD, Kaspers K, van Bergen MJ (1999) Determination of sulfur isotope ratios and concentrations in water samples using ICP-MS incorporating hexapole ion optics. J Anal At Spectrom 14:1067-1074 Mason PRD, Kosler J, de Hoog, JCM, Sylvester PJ, Meffan-Main S (2006) In situ determination of sulfur isotopes in sulfur-rich materials by laser ablation-multiple collector-inductively coupled plasma mass spectrometry (LA-MC-ICP-MS). J Anal At Spectrom 21:177-186 Mason PRD, Mank AJG (2001) Depth-resolved analysis in multi-layered glass and metal materials using laser ablation inductively coupled plasma mass spectrometry (LA-ICP-MS). J Anal At Spectrom 16:1381-1388 Mathez EA (1980) Sulfide relations in Hole 418A flows and sulfur contents of glasses. In: Initial Reports of the Deep Sea Drilling Project, v. 51, 52, 53, Part 2. Donnelly T, Francheteau J, Bryan W, Robinson P, Flower M, Salisbury M, et al. (eds) Washington (U.S. Government Printing Office), p 1069-1085. http://www. deepseadrilling.org/5 l_52_53/volume/dsdp5 l_52_53pt2_31 .pdf McCandless EL (1964) Determination of sulfur in polysaccharides by neutron activation analysis. Anal Biochem 7:357-365 Metrich N, Bertagnini A, Landi P, Rosi Mauro (2001) Crystallization driven by decompression and water loss at Stromboli Volcano (Aeolian Island, Italy. J Petrol 42:1471-1490 Norman M, Robinson P, Clark D (2003) Major- and trace-element analysis of sulfide ores by laser-ablation ICPMS, solution ICP-MS, and XRF: new data on international reference materials. Can Mineral 41:293-305 O'Neill HC, Mavrogenes JA (2002) The sulfide capacity and the sulfur content at sulfide saturation of silicate melts at 1400 °C and 1 bar. J Petrol 43:1049-1087 Ohmoto H, Lasaga AC (1982) Kinetics of reactions between aqueous sulfates and sulfides in hydrothermal systems. Geochim Cosmochim Acta 46:1727-1745 Olivier C, Peisach M, Morland HJ, De Wet BS (1986) Sulphur determination by proton-induced prompt gamma emission: The effect of the matrix and its importance in coal analysis. J Radioanal Nucl Chem 106:107-122 Paul RL (1997) Hydrogen measurement by prompt gamma-ray activation analysis. Analyst 122:35R-41R Paul RL (2008) Determination of sulfur in steels by radiochemical neutron activation analysis with liquid scintillation counting. J Radioanal Nucl Chem 276:243-249 Paul RL, Simons DS, Guthrie WF, Lu J (2003) Radiochemical neutron activation analysis for certification of ion-implanted phosphorus in silicon. Anal Chem 75:4028- 4033 Pearce WC, Hill JWF, Kerry I (1990) Use of X-ray fluorescence spectrometry for the direct multi-element analysis of coal powders. Analyst 115:1397-1403 Pelikanova M (1985) Determination of sulphur in silicate and carbonate rocks by wavelength dispersive XRF. Fresnius J Anal Chem 320:338-340 Pettke T, Halter WE, Webster JD, Aigner-Torres M, Heinrich CA (2004) Accurate quantification of melt inclusion chemistry by LA-ICPMS: a comparison with EMP and SIMS and advantages and possible limitations of these methods. Lithos 78:333-361 Richards JP, Larson PB (eds) (1998) Techniques in Hydrothermal Ore Deposits Geology. Reviews in Economic Geology, Volume 10. Society of Economic Geologists 264pp
38
Ripley et at
Rocholl A, Simon K, Jochum KP, Bruhn F, Gehann R, Kramar U, Luecke W, Molzahn M, Pernicka E, Seufert HM, Spettel B, Stummeier J (1997) Chemical characterisation of N I S T silicate glass certified reference material S R M 6 1 0 by ICP-MS.TIMS, L I M S , S S M S , INAA, AAS and PIXE. Geostand Geoanal Res 24:101-114 Rose-Koga EF, Albarede F (2010) A data brief on magnesium isotope compositions of marine calcareous sediments and ferromanganese nodules. Geochem Geophys Geosys 11, Q03006, doi: 1029/2009GC002899 Rousseau M, Friedli C, Lerch P (1984) Trace determination of sulfur by heavy ion activation analysis. Anal Chem 5 6 : 2 8 5 4 - 2 8 5 6 Rowan JT, Houk RS (1989) Attenuation of polyatomic ion interferences in inductively coupled plasma mass spectrometry by gas-phase collisions. Appl Spectrosc 4 3 : 9 7 6 - 9 8 0 Roy P, Balaram V, Singh RS, Krishna AK, Charan CD, Charan SN, Murthy NN (2009) A simplified and rapid method for the determination of sulphur in kimberlites and other geological samples by W D - X R F spectrometry. At Spectrosc 30:178-183 Ryan CG, Heinrich CA, Mernagh TP (1993) P I X E microanalysis of fluid inclusions and its application to study ore metal segregation between magmatic brine and vapor. Nucl Instrum Methods Phys Res Sect B 77:463471 Sakai H, Ueda A, Field C W (1978) 5 M S and concentration of sulphide and sulphate sulphurs in some ocean floor basalts and serpentinites. In: Short Papers of the Fourth International Conference, Geochronology, Cosmochronology, Isotope Geology. Zartman R E (ed), US Geol Surv Open-file Rept 78-701:372-374 Sasaki A, Arikawa Y, Folinsbee R E (1979) Kiba reagent method of sulphur extraction applied to isotope work. Bull Geol Survey Japan 30:241-245 Sasaki A, Ishihara S (1979) Sulfur isotopic composition of the magnetite-series and ilmenite-series granitoids in Japan. Contrib Mineral Petrol 68:107-115 Seo JH, Guillong M, Heinrich CA (2009) The role of sulfur in the formation of magmatic-hydrothermal coppergold deposits. Earth and Planet Sci Lett 282:323-328 Seo JH, Guilong M, Aerts M, Zajacz Z, Heinrich CA (2011) Microanalysis of S, CI and Br in fluid inclusions by LA-ICP-MS. Chem Geol 284:35-44, doi:10.1016/j.chemgeo.2011.02.003 Shah KR, Filby RH, Haller WA (1970) Determination of trace elements in petroleum by neutron activation analysis. J Radioanal Chem 6:185-192 Shani G, Cohen D (1976) The lower detectable limit of sulfur by fast neutron activation analysis. Int J Appl Radiatlsot 27:349-350 Simon AC, Ripley R M (2011) The role of magmatic sulfur in the formation of ore deposits. Rev Mineral Geochem 73:513-578 Sohn RA, Menke W (2002) Application of maximum likelihood and bootstrap methods to nonlinear curve-fit problems in geochemistry. Geochem Geophys Geosys 3, doi:10.1029/2001GC000253 Souliotis AG (1964) Combined radiochemical-neutron activation analysis method for the determination of sulfur and phosphorus in high-purity paper and beer. Anal Chem 3 6 : 8 1 1 - 8 1 4 Stefansson A, Seward T M (2004) Gold(I) complexing in aqueous sulphide solutions to 5 0 0 degrees C at 5 0 0 bar. Geochim Cosmochim Acta 68:4121-4143 Strijckmans K, De Brucker N, Vanecasteele C (1985) Determination of sulphur in fly ash by instrumental proton activation analysis. J. Radioanal Nucl Chem Lett 96:389-398 Studley S A, Ripley EM, Els wick E R , Dorais MJ, Fong J, Finkelstein D, Pratt L M (2002) Analysis of sulfides in whole rock matrices by elemental analyzer-continuous flow isotope ratio mass spectrometry. Chem Geol 192:141-148 Sylvester PJ (ed) (2008a) Laser ablation ICP-MS in the Earth Sciences: current practices and outstanding issues. Mineralogical Association of Canada Short Course Series, Volume 4 0 Sylvester PJ (2008b) Matrix effects in laser ablation ICP-MS. In: Laser ablation ICP-MS in the Earth sciences: current practices and outstanding issues. Sylvester P (ed), Mineralogical Association of Canada Short Course Series, 40:67-78 Sylvester PJ, Cabri LJ, Tubrett MN, McMahon G, Laflamme JHG, Peregoedova A (2005) Synthesis and evaluation of a fused pyrrhotite standard reference material for platinum group element and gold analysis by laser ablation-ICPMS. Abstract, 10th Intern Platinum Symp, p 16-20 Thomas JP, Schweiker E A (1972) A rapid method for assaying sulfur using proton activation analysis. Nucl Instrum Meth 99:461-467 ThordarsonT, Self S, OskarssonN, HulseboschT (1996) Sulfur, chlorine and fluorine degassing and atmospheric loading by the 1783-1784 AD Laki (Skaftai Fires) eruption in Iceland. Bull Volcanol 58:205-225 Ueda A, Sakai H (1983) Simultaneous determinations of the concentration and isotope ratio of sulfate- and sulfide-sulfur and carbonate-carbon in geological samples. Geochem J 17:185-196 Vanecasteele C, Dewaele J, Esprit M, Goethals P (1980) The determination of sulphur in copper, nickel, and aluminum alloys by proton activation analysis. Anal Chim Acta 119:121-127
Analytical
Methods
39
Vourvopoulos G, Womble PC (1989) On-line sulfur determination in coal with prompt gamma neutron activation. Nucl Instrum Meth Phys Res B 36:200-205 Walker FW, Parrington JR. Feiner F (1989) Nuclides and Isotopes - Chart of the Nuclides, 14th edition. General Electric Wallace P, Carmichael ISE (1992) Sulfur in basaltic magmas. Geochim Cosmochim Acta 56:1863-1874 Wayman CH (1964) Determination of total sulfur in water by neutron activation analysis. Anal Chem 36:665-
666 Wilke M, Klimm K, Kohn SC (2011) Spectroscopic studies on sulfur speciation in synthetic and natural glasses. Rev Mineral Geochem 73:41-78 Williams JP, Farncomb FJ, Magliocca TS (1957) Determination of sulfur in glass. J Am Ceram Soc 40:352-354 Wilson SA, Ridley WI, Koenig AE (2002) Development of sulfide calibration standards for the laser ablation inductively-coupled plasma mass spectrometry technique. J Anal At Spectrom 17:406-409 Wohlgemuth-Ueberwasser CC, Ballhaus C, Berndt J, Stotter nee Paliulionyte V, Meisel T (2007) Synthesis of PGE sulfide standards for laser ablation inductively coupled plasma mass spectrometry (LA-ICP-MS). Contrib Mineral Petrol 154:607-617 Yule HP (1965) Experimental reactor thermal-neutron activation analysis sensitivities. Anal Chem 37:29-132 Zajacz Z, Halter W (2009) Copper transport by high temperature, sulfur-rich magmatic vapor: Evidence from silicate melt and vapor inclusions in a basaltic andesite from the Villarrica volcano (Chile). Earth Planet Sci Lett 282:115-121
3
Reviews in Mineralogy & Geochemistry Vol. 73 pp. 41-78, 2011 Copyright © Mineralogical Society of America
Spectroscopic Studies on Sulfur Speciation in Synthetic and Natural Glasses Max Wilke HelmholtTzentrum Potsdam Deutsches GeoForschungsZentrum GFZ Telegrafenberg, 14473 Potsdam, Germany [email protected]
Kevin Klimm Institut für Geowissenschaften Johann Wolfgang Goethe-JJniversität Altenhöferallee 1, 60438 Frankfurt am Main, Germany
Simon C. Kohn Department of Earth Sciences University of Bristol Queens Rd., Bristol, BS8 1RJ, United Kingdom
INTRODUCTION Spectroscopic methods are powerful means to obtain information on the electronic or local structure of materials. By these methods, constraints can be provided on the chemical state, crystal chemistry or, in non-crystalline materials, the coordination environment or complexation of a given element. In this chapter, we focus on spectroscopic techniques that provide direct insight into the sulfur (S) species present in glasses and melts and which are applicable at the sulfur concentrations usually found in glasses (mostly below 1-2 wt%). Methods that are potentially suitable for this task are i) the wavelength analysis of X-ray emission spectra (mostly using the electron microprobe), ii) X-ray absorption spectroscopy, iii) 33S NMR and iv) Raman spectroscopy. For compounds such as sulfides or sulfates, containing S as a major component, further methods such as optical absorption spectroscopy in the UV-visible frequency range (UVVIS) or electron spin/paramagnetic resonance (ESR or EPR) spectroscopy (e.g., Ross 1974; Wincott and Vaughan 2006) are useful. However, these two techniques provide only an indirect view on sulfur because they actually probe the cations, which are often transition metals. In compounds where S is a major component, these data also provide information on the sulfur species, because the cations are linked to S as an anion. In glasses, where S is only a minor component and cations are mostly coordinated by oxygen, it is difficult to link the observations made on the cation to the S species. Nevertheless, there are some studies on glasses where the additional information by UV-VIS or ESR spectroscopy was used to constrain possible species of sulfur in the glass (e.g., Beerkens 2003; Bingham et al. 2010). Here, only very brief introductions to the spectroscopic techniques will be provided. For a more detailed introduction to the spectroscopic techniques introduced here the reader is referred to other literature on this topic (e.g., Hawthorne 1988; Beran and Libowitzky 2004). Information on other analytical techniques related to sulfur is found in the chapter by Ripley et al. (2011, this volume). We will first discuss X-ray based techniques such as X-ray 1529-6466/11/0073-0003S05.00
DOI: 10.2138/rmg.2011.73.3
Wilke, Klimm,
42
Kohn
emission and X-ray absorption spectroscopy that have been most widely used to characterize the sulfur oxidation state in glass. From X-ray absorption spectroscopy additional information on the type and arrangement of neighboring atoms may be derived. Next, the current state of 33 S N M R spectroscopy on sulfur in glasses will be presented. Finally, the strength and limitations of Raman spectroscopy for evaluating sulfur species in glasses will be discussed. For all methods we will discuss the potential for constraining the speciation of sulfur in glasses and, as far as possible, how they can be used to quantify relative proportions of the sulfur species. Information on coordination and nearest neighbors of sulfur is only qualitative, so far. Quantitative determinations of the sulfur oxidation state in quenched melts are used to constrain the thermodynamics of sulfur redox reactions in silicate melts.
X-RAY EMISSION AND ABSORPTION SPECTROSCOPY S K a X-ray emission Measuring the wavelength of S K a radiation [A,(S K a )] provides information on the valence state and the local electronic environment of sulfur in the matter of interest. Generally, S K a X-ray radiation is emitted if the K-shell Is electrons have been excited to higher energy levels either by X-rays with an energy of at least 2.47 keV or by electrons with an excitation voltage of at least 7-8 kV. K a radiation is emitted upon an electronic transition from the L to the K-shell, or in other notation from the S 2p electron orbital to the Is orbital level. For the sake of integrity it has to be noted that the S K a radiation can be distinguished in two discrete energies S K a l and S K a 2 due to the splitting of the 2p electron orbital into two energy levels, 2 p m and 2p 3/2 . In the following, we will simply use the term S K a , that refers to the doublet of S K a l and S K a 2 wavelengths as the two emission lines are hard to distinguish from each other due to the experimental energy resolution commonly used. Variations in the wavelength of the emitted S K a is related to shifts in the energy levels of the electron shells due to changes in the valence electron population, which influences the screening of the nuclear charge and thus the nuclear potential experienced by the 2p electrons (Alonso Mori et al. 2009). The wavelength of the emitted K a radiation varies in a similar fashion as the ionic radii of S2~ (184 pm) and S 6+ (29 pm) (Shannon 1976). The energy of the K a radiation for S2~ is approximately 0.2 eV lower and for S 6+ 1.2 eV higher compared to the K a radiation of elemental sulfur (Faessler and Goehring 1952; Matthews et al. 1999). This corresponds to a wavelength shift AX(S K a ) of -0.003 A between sulfide and sulfate (Carroll and Rutherford 1988). The energy difference between S 4+ and S° is about half that of S 6+ (Alonso Mori et al. 2009). Mixtures of sulfur in various valence states display intermediate wavelengths for X(S K J between that of pure S 6+ and pure S2~. Therefore, in contrast to XANES or Raman spectroscopy, measuring the S K a wavelength does not provide direct constraints on the sulfur species, at least with the wavelength resolution and counting statistics usually available—for example, a mixture of S 6+ and S2~ in a sulfur-bearing compound can display identical wavelengths to pure S 4 + (see also below). Measurements of X(S K a ) are performed by scanning the wavelength of emitted X-rays during exposure of solid material to a high-energy electron beam. Typically such measurements are performed using electron probe microanalysers (EPMA). With this technique, the X-rays are excited by electrons and the wavelength is determined by scanning the angle of a spectrometer crystal with known crystal lattice (usually a crystal made of Pentaerythritol, PET) such that Bragg's Law (nX = 2d sin 0) is fulfilled for X(S K a ). Usually a full scan in the range of 0.612 to 0.616 sin 0 is performed resulting in a spectrum of counts versus sin 0 (Fig. 1). The peak maximum of the spectrum corresponds to the X(S K a ) of interest. It has to be noted that so far all studies measuring the X(S K a ) for determining the S6+/S2~ ratios performed scans over the full range of sin 0. However, it is also possible to determine the S6+/S2~ by comparing two intensities at fixed sin 0 relatively in a similar fashion as it has been
Spectroscopic
Studies
of Sulfur
• FeS
o BaSOj
0.612
0.613
0.614
0.615
0.616
Speciation
in
Glasses
43
Figure 1. Scans of the ?t(S Kj,) peak position for FeS (black circles) and B a S 0 4 (open circles) crystalline compounds (Klimm unpublished data). Operating conditions of the EPMA were 20 kV and 30 nA with a spot diameter of 15 |jm. Each spectrometer was moved 0.00004 sinO units for 100 steps over the range of 0.612 to 0.616 sinO during a single spot analysis. Counting time for each step varied was 1600 ms which results in total counting time of each spot of 160 s. Peak positions (indicated by grey lines) were obtained by fitting the wave scan spectra with a Gaussian function (solid and dotted lines). The calculated A?t(S Kj,) wavelength shift between the FeS and B a S 0 4 reference compound is in this case 3.07xl0 3 A.
sine demonstrated for Fe L a and Fe Lp intensities in order to determine the Fe 3+ /Fe 2+ ratio in garnets (Hoefer and Brey 2007). A,(S K a ) shift of sulfur model compounds. The relationship of S K a wavelength shift and the sulfur valence state was established 40 to 50 years ago by analyzing numerous solid sulfur reference compounds with known sulfur valence state by X-ray excited emission spectroscopy (e.g., Faessler and Goehring 1952; Chappell and White 1968; Connolly and Haughton 1972). Nowadays, A,(S K a ) measurements are usually performed by EPMA and are calibrated with sulfate and sulfide compounds to determine the maximum wavelength shift [AA,(S K a )]. The wavelength shift measured on unknown samples is compared to this calibration for determining an apparent sulfur valence state (e.g., Carroll and Rutherford 1988; Wallace and Carmichael 1994; Jugo et al. 2005). Sulfide (S2~), the most reduced variety of sulfur, yields highest values of A,(S K a ) whereas the oxidized variety sulfate (S 6+ ) yields lowest values. In addition to the valence state of sulfur (S 6+ or S2~), the charge balancing ion of the sulfide or sulfate compound also affects the exact wavelength of A,(S K a ). For instance, the A,(S K a ) for sulfides is higher by ~0.0001 A for FeS 2 than for MnS 2 (Faessler and Goehring 1952). For sulfates it is higher by AX(S K a ) ~ 0.0002 A for C a S 0 4 (anhydrite) than for B a S 0 4 (barite), which is in the same order of magnitude as the precision of the EPMA analysis reported by Wallace and Carmichael (1994). The highest AX(S K a ) between sulfate and sulfide are obtained for sulfides and barite and are in the range of AX(S K a ) = 0.292 to 0.313 A (Table 1) depending on the diffracting crystal, spectrometer geometry, etc. Because of the high sulfur concentration in the sulfide and sulfate reference compounds, high quality scans of wavelength spectra can be obtained at "normal" electron beam conditions such as 15 kV, 20-40 nA with acquisition times of less than a minute (Carroll and Rutherford 1988). Typical scans of the wavelength for FeS and barite are shown in Figure 1. Because of the relatively small difference between K a l and K a 2 wavelength and the experimental resolution the A,(S K a ) scans follow a Gaussian function, which is used for fitting in order to determine the peak position and thus A,(S K a ). It should be noted that FeS can be present as pyrrhotite or troilite, which is not always specified by the authors. Rowe et al. (2007) used both and do not report any difference in terms of A,(S K a ). Therefore, the more general term FeS is used here. Experimental details for EPMA of S in glasses. The sample preparation for determining the A,(S K a ) of S in glasses using an electron microprobe follows the common procedure of sample preparation for any conventional analysis using EPMA (see also Ripley et al. 2011, this volume). Glass chips are embedded in epoxy resin and polished using a combination of
Wilke,
44
Klimm,
Kohn
Table 1. S K a wavelength shift between sulfide and sulfate model compounds. Reference Sulfide
Compound \ ( S K a ) (AxlO3) Pyrite
Source
Barite
Anhydrite
Scapoli te
CaS
-
2.00
2.00 1.84
FeS2
-
2.1
-
FeS
-
3.06±0.08
2.86±0.18
-
Carroll & Rutherford 1988 Wallace & Carmichael 1994 Mètrich & Clocchiatti 1996
-
Chappell & White 1968
-
Connolly & Haughton 1972
FeS
3.13+0.11
3.00±0.09
-
0.39±0.12
FeS
3.11+0.10
-
-
-
ZnS
3.07±0.18
-
-
-
ZnS
3.04±0.20
-
-
-
Jugo et al. 2005
FeS
2.92±0.11
-
Klimm et al. submitted
-
-
Gurenko & Schmincke 1998; Gurenko & Schmincke 2000
Note: A/.i S K a ) wavelength shift calculated relative to given reference sulfide in units of Angstrom times 10 3 .
abrasive paper and diamond-bearing polishing paste or solutions, respectively. Although it has been argued that some surface oxidation may occur during sample preparation generating S 6+ in nominally sulfate free samples (Fleet et al. 2005b), thus affecting the measured sulfur valence state, there is no definitive evidence that such a process commonly occurs in all samples. XANES and Raman spectroscopy of only sulfide-bearing alkali silicate glasses that are usually very sensitive to corrosion and oxidation showed no evidence for any oxidation during sample preparation (Klimm and Botcharnikov 2010; Klimm et al. submitted). The polished sample should be perfectly plane and the surface roughness should be less than 1 |im in order to guarantee optimal conditions for analysis. In order to perform A,(S K a ) determination on natural melt inclusions care has to be taken to consider the size of the inclusions. Because of the excitation depth of a few |im, depending on the analytical conditions such as acceleration voltage, beam current and beam focus, a sufficiently large volume of glass is required. It also has to be noted that melt inclusions or synthetic glasses may contain additional crystalline sulfate/ sulfide phases or droplets of quenched immiscible sulfide liquid indicating sulfur saturation, which can distort the S6+/S2~ determination of sulfur dissolved in the glass. A general difficulty of analyzing sulfur in silicate glasses using EPMA is the relatively low abundance of sulfur, which is related to the relatively low solubility of sulfur in silicate melts. Sulfur solubility may vary considerably as a function of various parameters such as glass composition, oxygen fugacity, temperature and pressure and sulfur concentrations in coexisting phases. Typical sulfur levels in natural glass compositions are low and usually below ~3000 ppm total S (e.g., Wallace and Carmichael 1992; Clemente et al. 2004; Backnaes and Deubener 2011,this volume; Ebel 2011, this volume; Baker and Moretti 2011, this volume). This in return requires relatively high beam currents and counting times to lower the detection limit and increase counting statistics during EPMA analysis. Typical conditions for the determination of X(S Ka) by EPMA in natural glasses are acceleration voltages of 15-30 kV and beam currents of 20-40 nA. Counting times of >1 min are used in order to achieve sufficient counting statistics in spectra acquired at low S concentrations. Usually, reliable X(S K a ) wavelength measurements can be performed for concentrations as low as 100 ppm S with >10 min total counting time (e.g., Wallace and Carmichael 1992; Nilsson and Peach 1993). The uncertainty in peak position at S concentrations o" 'C «D •a S
2476
5
2474
12H;0
CaSOj>2HjO
Figure 1 0 . 3 3 S M A S N M R spectra for sulfate model compounds (Wagler et al. 2004). Most of the spectra show a quadrupolar doublet line shape because of residual 2 n d order quadrupole interaction. [Used by permission of Elsevier Limited, from Wagler et al. (2004) J Magn Reson 170, Fig. 2, p. 340] 3.5 3.0 Figure 11. Plot of quadrupole constant (C 9 ) for sulphate model compounds vs A(SO) m , the difference between the longest and shortest S-O bond length in the sulfate group (Wagler et al. 2004). The circles are Cq determined f r o m experimental N M R spectra, the squares are Cq f r o m ab initio calculation. [Used by permission of Elsevier Limited, from Wagler et al. (2004) J Magn Reson 170, Fig. 3, p. 342]
2.5 2.0 -
1.5 1.0 -
0.5 0.0 -
0.00
0.02
0.04 A(S-0)ra
0.06
0.08
64
Wilke,
Klimm,
Kohn
at natural abundance with signal enhancement were reported by Jakobsen et al (2009, 2010) and Sutrisno et al (2009) who used both high fields and quadrupolar Carr-Purcell-MeiboomGill (QCPMG) to obtain high quality spectra from ever more complex materials with a wide range of Cq. Most recently Moudrakovski et al (2010) used fields up to 21.1 T and the QCPMG technique to acquire 33 S N M R spectra (with and without MAS) of K 2 S 0 4 , K H S 0 4 , K 2 S 2 0 7 , and K 2 S 2 O s at natural abundance. They fitted their spectra to obtain improved values of isotropic chemical shift, chemical shift anisotropy, quadrupole coupling constant and asymmetry parameter. They also performed density-functional-theory (DFT) calculations to complement their experimental data. Quadrupolar constants, up to 16 MHz were observed. " S N M R of glasses There are very few published 33 S NMR spectra of glasses. However, the data published so far suggest that the best results can be obtained using 33 S enrichment, the highest available magnetic fields and magic angle spinning. Typically at least a few tens of mg of sample is required, so the spatial resolution of XANES, EPMA or Raman is not attainable. Couch et al. (2004) presented spectra for 6 (mostly hydrous) silicate glasses as well as some model compounds obtained at a frequency of 46.05 MHz using a field of 14.1 T. The spectra were relatively good with acquisition times of 15-60 hours and 99% enriched 33 S in the starting materials for the glasses, even though the sulfur concentration was only 0.5 to 2 wt% S. Peaks at 324-336 ppm, attributed to sulfate were observed in all glasses. No quadrupolar lineshape was observed, but that is typical of spectra of quadrupolar nuclei in glasses, where a range of environments usually leads to an asymmetric broadened line (Kohn et al. 1998). In addition one sample showed an additional peak at 360 ppm that was assigned to thiosulfate. However it was suggested that the thiosulfate was present in the sample as particles of nanocrystalline thiosulfate at the surface of the glass rather than as a species dissolved in the glass. O'Dell et al. (2008) applied some of the latest techniques for enhancing 33 S N M R signals to a hydrous glass containing 1.15 wt% of 99%-enriched S. They showed that the MAS signal could be improved by a factor of up to 1.85 (see Fig. 12) with no line-shape distortion. The data suggest that natural abundance studies of 33 S in glasses are not yet feasible, but with continuing technological improvements they may be possible in the future. Recently Klimm et al. (submitted) reported 33 S MAS N M R spectra for a much wider range of glass compositions, and used improved experimental conditions compared with Couch et al. (2004), most notably a magnetic field strength of 18.8 T. The hydrous glasses include samples synthesized at both oxidizing and reducing conditions, where S is expected to be present as sulfate and sulfide, respectively. XANES measurements were made on the same samples to provide a wellcharacterized value for the S 6+ /ES ratio for each sample. Representative spectra from the Klimm et al. (submitted) study are shown in Figure 13. Two samples show peaks at about - 2 0 0
ppm
Figure 12. Three separate, normalized, 33 S MAS N M R spectra of the same sulphate-bearing silicate glass, showing the signal enhancement that is possible using rotor assisted population transfer (RAPT) and hyperbolic secant adiabatic pulse sequences (redrawn after O'Dell et al. 2008)
Spectroscopic
Studies
of Sulfur
Speciation
in Glasses
65
Figure 13. 3 3 S MAS N M R spectra of a range of S-containing silicate glasses equilibrated at different oxygen fugacities (after Klimm et al. submitted).
ppm that are attributed to sulfide. The peaks are of different widths and slightly different positions in the two samples suggesting some compositional control (RS50 has a trondhjemitic composition whereas RS11 is albite). No crystalline sulfides have peaks at -200 ppm, and it is tentatively suggested that this resonance can be attributed to dissolved molecular H 2 S in the glasses. Potentially, it could be also related to the same sulfide species that gives rise to the Raman band that was assigned to HS~ (Klimm and Botcharnikov 2010, Klimm et al. submitted, see also below). All the other samples have compositions of either sodium calcium silicate (RS55, RSI9), rubidium silicate (RS54), sodium silicate (RS16) or potassium silicate (RS53, RS41, RS18) and show sulfate resonances at about 330 ppm. There are a few small additional features in some spectra, but none are completely reproducible, and the evidence for other structural species in the glass is not convincing. It is interesting to note that some of the sulfate resonances are broader than others, and a range of average Cq from 1.1-1.4 MHz is derived from fitting. It was also observed that some samples where both sulfide and sulfate are known to be present (from XANES) only showed sulfate resonances, implying that dissolved sulfide is not observable in some compositions. This could be because of a large dispersion of the chemical shift (remember the wide range in shifts observed previously for model compounds) or a large Cq. The latter is not consistent with the model compounds, but perhaps sulfide dissolved in silicate melts has a much more asymmetric environment than simple crystalline sulfides. The large dispersion of chemical shift would be consistent with the results by XANES as well as by simulations (Machacek et al. 2010). These indicate that S2~ is probably predominantly associated to network-modifying cations, which very likely would result in a relatively large dispersion of sulfur sites in the glass structure. In conclusion, NMR has not yet fulfilled its promise as a method to obtained detailed structural information on S dissolution mechanisms in glasses. The low frequency and natural abundance of 33S make the collection of spectra with adequate signal-to-noise ratio challenging. The key to collecting useful spectra is use of the highest possible magnetic fields. A decade or so ago 14.1 T was the highest commercially available magnetic field for an NMR spectrometer,
66
Wilke, Klimm,
Kohn
but now 18.8 T, 21.1 T and even 23.5 T instruments are becoming available. The higher fields dramatically increase signal-to-noise ratio and decrease linewidths. Although difficult, NMR should continue to be developed as a complement to XANES and Raman spectroscopy. RAMAN AND IR SPECTROSCOPY Vibrational spectroscopy such as Raman or Infrared spectroscopy provides direct information on structural properties of materials by measuring vibrational transitions of bonded atoms in crystalline and non-crystalline structures or molecular units. Raman spectroscopy arises from the Raman effect or Raman scattering that is the inelastic scattering of photons, which results in a frequency shift of the scattered light in comparison to the excitation frequency. A requirement for the observation of the Raman effect is the presence of Raman active vibrational modes within the matter of interest. Several normal vibrational modes can be distinguished: Vi, v2, v 3 and v4, which corresponds to symmetric stretching, symmetric bending, asymmetric stretching and bending of a bond, respectively (often described as Aj for Vi, E for v 2 and F for v 3 and v4. The theoretical and experimental aspects of Raman spectroscopy and its application have been extensively reviewed in the past (e.g., Karr 1975; McMillan 1985; Smith and Dent 2005) including its application on silicate glasses (McMillan and Wolf 1995) and on sulfide and sulfate compounds (Myneni 2000; Wincott and Vaughan 2006). As far as experimental details are concerned, we will only discuss a few important issues for application to sulfur in silicate glass. Raman spectroscopy has already been applied successfully to investigate sulfur-bearing fluid inclusions in natural minerals (e.g., Rosasco et al. 1975; Rosasco and Roedder 1979; Beny et al. 1982; Burke 2001). Bands related to sulfur species have been assigned by a comparison of band positions to bands occurring in Raman spectra of sulfur reference compounds. However, the number of studies applying Raman spectroscopy to study sulfur in glasses is still rather limited as will be shown below. Infrared spectroscopy is also frequently applied to crystalline sulfides and sulfates to study the vibrational modes of these compounds (e.g., Wincott and Vaughan 2006; Ross 1974). For glasses, only a few studies can be found that report infrared spectra focused on sulfur. These are mostly restricted to chalcogenide-based glasses with very high sulfur contents or other compositions of technical interest (e.g., Mei et al. 2003; Kim et al. 2005; Santagneli et al. 2008). To our knowledge, no studies report infrared spectra focused on sulfur in silicate glasses. This is probably because sulfur concentrations are low and it is rather difficult to separate weak but broad bands from the background. In addition, bonds that are visible with Raman spectroscopy are usually weaker in IR spectra and vice versa because of the selection rules for vibrational transitions. This has been shown experimentally for instance for H 2 0 (e.g., Karr 1975; Smith and Dent 2005). Raman spectroscopy of sulfur model compounds Raman spectroscopy has been applied routinely as a fingerprinting method in order to quickly and easily identify minerals of geological interest (e.g., Mernagh and Trudu 1993; Sarma et al. 1998; Hope et al. 2001; White 2009). Raman spectra of minerals have been collected over the years and have become available online as databases or libraries, such as the RRUFF database at www.RRUFF.info (Downs 2006), and can be used as reference spectra. Most common natural sulfur-bearing minerals incorporate sulfur as sulfate (S6+) or sulfide (S2~). Because the structural environments of S 6+ and S2~ in solid sulfur compounds are fundamentally different, with S 6+ being connected to oxygen as a S0 4 2 - group and S2~ mostly being connected to metallic cations (e.g., FeS, FeS 2 , NiS), the wavenumbers at which Raman bands due to S are observed are fundamentally different and thus allow S2~ and S 6+ to be distinguished in Raman spectra. For S 6+ the most intense features observed in Raman spectra are related to the Vi S-O
Spectroscopic Studies of Sulfur Speciation in Glasses
67
[vi(S0 4 )] stretching mode of sulfate and occur at wavenumbers of 1000±25 cm 1 depending on the exact composition and structure of the sulfate compound (e.g., Rosasco and Roedder 1979; Beny et al. 1982; Burke 2001; McKeown et al. 2001; Tsujimura et al. 2004; Lenoir et al. 2009; White 2009). For instance, the Raman spectra of anhydrite (CaS0 4 ) display the highest peak at 1016 cm -1 corresponding to Vi(S0 4 ) bands whereas at 497 cm - 1 a much smaller band is characteristic for the symmetric bending mode of the S0 4 2 - compound [v 2 (S0 4 )] (Fig. 14, Sarma et al. 1998). For gypsum, which is the hydrated form of CaS0 4 (-2H 2 0), V!(S04) and v 2 (S0 4 ) are observed at slightly lower wavenumbers of 1008 and 495 cm -1 , respectively. Other sulfates such as potassium-bearing sulfates such as mercallite (KHS0 4 ) have Vi(S0 4 ) shifted to 977 cm -1 . For sulfides, the most intense bands occur at much lower wavenumbers in the range of 250 to 450 cm"1 (Hope et al. 2001; Mernagh and Trudu 1993; White 2009). For instance, pyrite and marcasite (both as FeS2) display the most intense bands at 375 and 325 cm -1 , respectively, and these are also related to Vi stretching modes (Fig. 14). Sulfides with cations of a less metallic character show the most intense features at lower wavenumbers (e.g., MgS with vi at -300 cm"1, Siebert et al. 2004). Experimental details for Raman spectroscopy on glasses Modern experimental setups for Raman spectroscopy are often based on a confocal microscope, which allows a spatially resolved analysis in the micrometer range. A major advantage of this setup is that no special sample preparation is usually required and materials can be exposed directly to the laser beam. With a confocal micro Raman setup, the laser beam can be focused easily on the surface of the sample. Therefore, glass chips can be mounted directly under the laser beam. However, care has to be taken that the surface is carefully cleaned because a thin film of organic solvents or microcrystalline dust particles may completely overly the signal of the glass. If band intensities are to be used for quantification more efforts should be dedicated to produce a polished sample surface in order to minimize any effects of the surface to the measured signal. Since a confocal setup restricts the acquisition of signal to a well-defined volume, micro-Raman spectroscopic studies on fluid inclusion trapped within natural minerals are possible (e.g., Rosasco et al. 1975; Rosasco and Roedder 1979; Beny et al. 1982; Burke 2001). This allows the determination of sulfur speciation below the sample surface and may be of interest when determining the sulfur speciation of melt inclusions, which are not exposed to the surface. One problem for the identification of Raman bands related to sulfur in glasses is the relatively low signal of the bands due to the low sulfur concentration in the glass. In addition, the bands are relatively broad due to disorder within the glass structure in contrast to very sharp bands observed in solid crystalline sulfur compounds. This is especially problematic in the case of natural glasses where sulfur abundance barely exceeds 1000 ppm and sulfur might be present in various valence states (S2~ and S6+). In this case, the counting statistics of the spectra should be optimal in order to have a good signal to noise ratio. This can be achieved by increasing the laser intensity and acquisition time or by performing multiple scans that sum up to one spectrum. Increasing the laser intensity and acquisition time may lead to the saturation of the detector and is thus intrinsically limited, but it varies for each specific Raman spectrometer setup (Klimm and Botcharnikov 2010). Very high laser intensities may also damage the glass. Typical acquisition times for Raman spectra of sulfur bearing glasses are in the range of 20-1000 s for the 514.5 nm wavelength Ar+ laser and the 532 nm wavelength ND:YAG laser (e.g., Hapanowicz and Condrate 1996; Tsujimura et al. 2004; Lenoir et al. 2009; Klimm and Botcharnikov 2010). With these conditions sulfur species have been identified down to concentrations of ~0.01 wt% S for the glass compositions studied (Klimm and Botcharnikov 2010). It also has to be noted that background fluorescence is a common phenomenon in Raman spectroscopy, which can be induced by various parameters of the sample (e.g., transition metals, organics of epoxy glue). For instance, Klimm and Botcharnikov (2010) reported fluorescence in the Raman spectrum of potassium silicate glasses. The spectrum showed a sudden overall
68
Wilke, Klimm,
Kohn
Wavenumber [cm 1 ] Figure 14. Raman spectra of selected sulfate and sulfide reference compounds from the public RRUFF database at www.rruff.info (Downs 2006): Anhydrite, C a S 0 4 (RRUFFID: R061102); Gypsum C a S 0 4 - 2 H 2 0 (RRUFFID: X050096); Arcanite K 2 S 0 4 (RRUFFID: R070040); Mercallite, K H S 0 4 (RRUFFID: R070072); Pyrite, FeS, (RRUFFID: ID060882); Marcasite, FeS, (RRUFFID: R070692). Numbers in italics indicate wavenumbers of the v r m o d e .
Spectroscopic Studies of Sulfur Speciation in Glasses
69
increase in intensities over a broad range of wavenumbers. However, in this case the information of the spectrum was still visible. Fluorescence is especially problematic for determining peak areas to quantifying the abundance of a certain species in the glass because of the difficulty in performing a reliable background subtraction. The only way to circumvent fluorescence is probably to use a laser with a different energy that does not excite fluorescence. Raman spectroscopy on sulfur in glasses Determining sulfur species in glasses by Raman spectroscopy is associated with difficulties due to the, sometimes, uncertain interpretation of the spectra. A Raman spectrum reflects all Raman active modes of the measured sample. Therefore, Raman spectra of sulfur-bearing glasses are a summary of vibrational modes related to the glass structure—for example, Si-O bonds, those related to sulfur bonds (e.g., S-O), and if present those related to O-H or C-O bonds. Due to the relatively low solubility of sulfur in glasses, especially in those of geological interest (see the contributions in this volume by Backnaes and Deubener 2011 Baker and Moretti 2011, and Ebel 2011) the resulting bands related to sulfur (especially for sulfide) are relatively weak and often make a correct identification very difficult. In addition, it is difficult to synthesize appropriate glasses containing sulfur in various valence states because the synthesis has to be performed under controlled redox conditions. Most information has been gathered on the presence of sulfate because syntheses of oxidized glasses are generally easier to perform, so that little information has been obtained on reduced sulfur species using Raman spectroscopy. Usually Raman spectra of sulfur containing glasses are compared to Raman spectra of solid reference compounds or liquids. The similarity of the position of bands to sulfur-bearing reference compounds is commonly used as a confirmation of the presence of a specific sulfur species in the measured glass ("fingerprint method"). However, because sulfur is dissolved in the glass and because of differences in coordination between glasses and crystals, bands are usually shifted by a few wavenumbers compared to reference compounds. Only a limited number of studies are available that specifically investigated sulfur incorporated in silicate glasses because of the low band intensity and the difficulty in assigning and interpreting Raman bands for S in glasses, Raman spectroscopic investigations on sulfur in glasses have therefore been performed mainly on glasses of technical interest. The compositions studied include alkali silicate glasses (Konijnendijk and Buster 1977; Hapanowicz and Condrate 1996; Ooura and Hanada 1998; Tsujimuraet al. 2004; Klimm and Botcharnikov 2010; Fig. 15), borosilicate glasses (McKeown et al. 2001; Manara et al. 2007; Lenoir et al. 2009) and borate glasses (Ahmed et al. 1997). Recently, the results of Raman spectroscopic investigations of sulfur in hydrous natural glass compositions such as basalt, andesite and rhyodacite have been published (Klimm and Botcharnikov 2010). As shown in Figure 15, most oxidized glasses show a significant band in the range of ~970 to 1010 cm - 1 which corresponds to the v ^ S O ^ band. The range of wavenumbers observed for the V!(S04) band in glasses is related to differences in the corresponding glass structure, i.e., it is a function of the content and type of network-modifying cations. The band is shifted to high wavenumbers for cations with high ionic field strength (e.g., Li). The largest variations of the Vi(S0 4 ) band are observed for borate glasses with various cations (McKeown et al. 2001). For other simple glass compositions, such as potassium silicate, sodium silicate, soda lime silicate or borosilicate glasses the Vi(S0 4 ) band occurs at 990 cm - 1 (Hapanowicz and Condrate 1996; McKeown et al. 2001; Tsujimura et al. 2004; Manara et al. 2007; Lenoir et al. 2009; Klimm and Botcharnikov 2010). Although bands related to S 6+ have not been assigned in Raman spectra of borate glasses by Ahmed et al. (1997), some spectra also display a band at 990 cm -1 , indicating that S 6+ is present in those glasses. In more complex natural glasses such as basalt, andesite and rhyodacite the v^SC^) band is observed at 1000 cm - 1 (Klimm and Botcharnikov 2010). It should be noted that the v^SC^) band in glasses is often superimposed by the intense bands of the Si-O vibrations in this spectral range, which may complicate correct identification and separation of
70
Wilke, Klimm, Kohn
Figure 15. Raman spectra of hydrous S-bearing glass, a) Soda-lime silicate glass (0.36 wt% S 2 - and 0.54 wt% S 6+ , respectively), synthesized at 200 MPa, 1000 °C: In reduced samples bands can be assigned to S as sulfide. In oxidized glass only bands related to sulfate are observed, b) Basaltic glass, synthesized at 200 MPa. 1050 °C (0.13 wt% S 2 - and 0.60 wt% S 6+ , respectively; data from Klimm and Botcharnikov 2010).
500
1000
1500
2000
2500
3000
Wavenumber [cm 1 ]
the sulfur band. In critical cases, where the Vi(S0 4 ) band is completely superimposed by bands related to the silicate network as demonstrated for relatively polymerized geological relevant glass compositions with low S solubility, the detection of this band is limited to sulfur contents above 150 ppm S 6+ (Klimm and Botcharnikov 2010; Klimm et al. submitted). Assignment of bands in Raman spectra related to reduced sulfur incorporated in glasses has been not so straightforward. Ahmed et al. (1997) suggested that S3~, S2~, S 2 2 - , S 3 2 - , S 5 2 and S 6 2 - can be identified in Raman spectra of borate glasses. However, the bands related to these polysulfides are rather weak and the presented spectra are quite noisy, so that the band assignment might be an over-interpretation. McKeown et al. (2001) and Tsujimura et al. (2004) reported bands in the range of 350 to 380 cm - 1 , at ~ 300 cm - 1 and at ~460 cm - 1 in spectra taken on sodium silicate and borosilicate glasses. The band at 460 cm - 1 is close to the frequency of the v 2 (S0 4 ) band. Bands between 300 and 380 cm - 1 could indicate S-S bonds or intermediate S species. Therefore, the authors speculated on the presence of polysulfide (e.g., S 6 2 - ), dithionate (S5+) or thiosulfite (S 4+ ), because A,(S K a ) analysis and S K-edge XANES of these glasses suggest the presence of reduced sulfur species. These observations are, at least partially, in contrast to those made by Klimm and Botcharnikov (2010), who investigated S in either fully oxidized or reduced hydrous glasses. In simple glass compositions, such as potassium silicate and soda lime glass with a few wt. % of water (below water saturation) a band at 2574 cm - 1 appears at reducing conditions, which was assigned to the presence of HS~ in these glasses (Rosasco and Roedder 1979, see Fig. 15). This band was also observed by Stelling et al. (2011) for hydrous sulfide-bearing Na-Si and Na-Ca-Si glasses. The slightly asymmetric feature of the band at 2574 cm - 1 can be explained by the presence of additional H 2 S in the glass as it has also been demonstrated for natural fluid inclusions (Rosasco and Roedder 1979). No bands
Spectroscopic
Studies
of Sulfur
Speciation
in Glasses
71
were detected in the 300-400 cm - 1 region that could have been assigned to any sulfide species. Klimm and Botcharnikov (2010) did not observe the HS~ band in reduced glasses of hydrous basaltic, andesitic and rhyodacitic compositions. In contrast to hydrous S-free basaltic, andesitic and rhyodacitic glasses, the reduced S-bearing ones show a band at 400 cm -1 , which can be related to iron-sulfide bonding within the silicate glass structure when compared to sulfide reference compounds. Based on this observation, Klimm and Botcharnikov (2010) suggested that the dissolution mechanism of sulfide in silicate glasses is different in iron bearing and iron-free systems, which is in agreement with observations by XANES (Fleet et al. 2005b, see also above) and is consistent with the correlation of sulfur solubility with the iron content of the melt (e.g., Wallace and Carmichael 1992, Carroll and Webster 1994; also see in this volume Backnaes and Deubener 2011 and Baker and Moretti 2011). Beam damage by Raman Spectroscopy Unlike other spectroscopic studies using intense X-ray or electron beams (S K-edge XANES and X(S K a ) wavelength shift), no beam damage has so far been reported in studies investigating sulfur speciation by Raman spectroscopy. However, it is known that during laser irradiation the temperature of glasses increases. By using a high-intensity laser, such a temperature increase may lead to degassing of the volatiles (e.g., H 2 0, C0 2 , 0 2 ) that are dissolved in the glass. The exsolved gases form bubbles within the glass, which can be observed microscopically. This process is often described as "boiling" and is mostly observed in dark iron-bearing glass compositions. Hapanowicz et al. (1995) described such a degassing process for lead silicate glasses after the irradiation of the glass with a high intensity 4-kW C 0 2 laser and subsequent analysis with Raman spectroscopy. The bubbles formed contained oxygen, which had exsolved from the glass although no change in the silicate glass structure was observed. Advances in detector sensitivity allow the use of lasers with shorter wavelength and less power as well as reduced acquisition times, minimizing the effect of heating during laser beam exposure. For instance, Klimm and Botcharnikov (2010) did not observe any beam damage such as "boiling" during laser beam exposure or changes in the spectra during acquisition using the 532 nm line of a Nd: YAG laser on hydrous silicate glasses. Increasing the acquisition time or laser intensity during spectrum acquisition resulted in saturation of the detector rather than damaging the silicate glasses. However, it has to be noted that laser beam damage may occur during Raman spectroscopic investigations and glass samples should be carefully investigated after laser beam exposure. Apart from "boiling" the S species present in the glass may change during irradiation, which should be tested by performing time-dependent measurements. Determination of the oxidation state using Raman spectroscopy So far, it has been demonstrated that Raman spectroscopy on silicate glasses allows sulfate (S6+) and sulfide (S2~) species in silicate glasses to be identified. However, in order to determine the S6+/ES ratio of sulfur dissolved in glasses, in a comparable way to (S K a ) wavelength shift measurement and S K-edge XANES spectroscopy, a quantification of each species present in a Raman spectrum is required. Quantification has only been successfully performed for the sulfate content in oxidized borosilicate glasses (Fig. 16, Lenoir et al. 2009). The intensity of the sulfate band is directly related to the concentration of sulfate in the glass. Because the sulfate band is often superimposed by bands related to the silicate glass structure, a deconvolution of the wavelength region where the sulfate and silicate bands occur is necessary in order to determine the intensity of the band related to sulfate. In addition to the sulfate concentration, the intensity of this band also depends on the bulk glass compositions. Therefore, a calibration of the band intensity as a function of sulfur content for each glass composition is required in order to quantify the S 6+ abundance in glasses. Furthermore, sulfur bands should be scaled to bands of the glass network in order to eliminate effects of the Raman measurement conditions. The same calibration and scaling has to be applied to other sulfur species such as S2~. However,
72
Wilke, Klimm,
Kohn
1000
1100
"tf> c cu
900
1200
Wavenumber [cm 1 ] Figure 16. Deconvolution of baseline-corrected Raman spectrum of N a borosilicate glass in the region 850-1250 c i r r 1 in order to extract the intensity of the V! band of sulfate (Redrawn after Lenoir et al. 2009). Spectrum was fitted using four Gaussians to describe bands related to the silicate stretching vibrations and one Gaussian for the sulfate band (shaded).
considering the small band intensity for S2~ compared to S 6+ , especially in natural glasses (Klimm and Botcharnikov 2010) an accurate quantification of S6+/ES is difficult if possible at all. Thus, the determination of this parameter by Raman spectroscopy remains the object of future Raman spectroscopic investigations and might only be possible in specific systems. Nonetheless, the qualitative detection of different sulfur species allows a rough estimation of the/i^ during formation by Raman spectroscopy; if both, S 6+ and S2~ coexist in a glass a rough estimate of the corresponding/^ is possible. Assuming that the S6+/ES ratio is simply a function of/o, and other parameters such as composition, pressure and temperature have minor effects on the S6+/ES equilibrium, such conditions are in the range of QFM = 0 to QFM+2 according to the latest calibration of S6+/ES VS./Q, (Jugo et al. 2010). If only S2~ is determined by Raman spectroscopy then/o, < QFM and, accordingly, if only S 6+ is determined t h e n / ^ > QFM+2. Thus, when applied to natural glass samples (e.g., melt inclusions) a preliminary estimation of the redox conditions is possible, which can be further constrained by more robust methods. SUMMARY AND OUTLOOK The various spectroscopic techniques proposed here provide valuable experimental insight into the incorporation of sulfur in silicate glasses and melts and substantially contribute to a better understanding of sulfur speciation in these compounds. Each method shown here has its advantages and disadvantages and the choice of which one to use depends on the problem and the specific questions to be answered. The method easiest to apply is certainly Raman spectroscopy due to its widespread availability, which should give at least qualitative data. S K a wavelength analysis can be used as an add-on of EPMA. However, the S oxidation state determined might be strongly affected by beam damage. X-ray induced high-resolution X-ray emission analysis might be a possible way to go in the future. Satisfactory 33S NMR data are difficult to obtain particularly due to low abundance of the relevant isotope and the potential of this method strongly depends on the availability of strong magnetic fields. If data can be obtained they provide very detailed insight to the species present in the glass at least for oxidized samples, but more methodological developments are required. XANES is the most elaborate approach since access to beamtime at synchrotron radiation facilities is limited. However, this
Spectroscopic
Studies
of Sulfur
Speciation
in Glasses
73
method probably provides the deepest and most robust insight to the sulfur species. On one hand, the S oxidation state can be determined quantitatively with only small artifacts from the analysis. On the other, these spectra can be used to constrain models for the S incorporation in melts and glass by the use of ab initio methods to simulate XANES spectra, which has only been applied to S in limited cases (e.g., Kravtsova et al. 2004) and not yet to S in glasses. All techniques provide evidence that S2~ and S 6+ are the dominant species for S in silicate glasses. Most of the earlier evidence for the presence of S 4+ in glass can now be explained in terms of experimental artifacts. Spectroscopic evidence points out that S 6+ is present in glasses within the sulfate anion. The sulfate anion forms an isolated unit that is not connected to the network of Si0 4 tetrahedra via bridging oxygens. The sulfide anion appears to predominantly replace non-bridging oxygens, based on spectroscopic evidence and the very first molecular simulation study (Machacek et al. 2010). The latter also indicates that free S2~ is not relevant in silicate melts. Spectroscopic as well sulfur solubility data suggest association of Fe and S2~ in silicate melts. Apart from this observation, there is no systematic understanding of interactions or association of S2~ with other components of the melt. Further insight could come from quantitative understanding of experimental spectra with ab initio simulation of spectra, particularly if they are combined with the outcome of computational molecular dynamics studies. The structure of glasses represents that of the melt frozen-in at the temperature of the glass transition, so that the S species found in the glass might be different from those present at high temperature in the melt. Experiments looking at sulfur speciation in situ at high temperature and/ or high pressure remain a field for future research. Such studies might resolve the question of the stability of S 4+ in melts. Although measurements at ambient pressure are feasible using both X-ray and Raman techniques, the low energy of S K a and S K-edge means that measurements at high pressure are rather unlikely using X-ray spectroscopy, but might be possible by Raman spectroscopy.
ACKNOWLEDGEMENTS We thank R. Alonso Mori for providing data of XANES spectra. We appreciate reviews by M. Fleet, D. Neuville as well as comments from H. Behrens that were very helpful for improving the manuscript.
REFERENCES Ahmed AA, Sharaf, NA, Condrate RA (1997) Raman microprobe investigation of sulfur-doped alkali borate glasses. J Non-Cryst Solids 210:59-69 Alonso Mori R, Paris E, Giuli G, Eeckhout SG, Kavcic M, Zitnik M, Bucar K, Pettersson LGM, Glatzel P (2009) Electronic structure of sulfur studied by X-ray absorption and emission spectroscopy. Anal Chem 81:6516-6525 Ashbrook SE, Duer MJ (2006) Structural Information from quadrupolar nuclei in Solid State NMR. Concepts in Magnetic Resonance Part A, Vol. 28A(3) 183-248 Backnaes L, Deubener J (2011) Experimental studies on sulfur solubility in silicate melts at near-atmospheric pressure. Rev Mineral Geochem 73:143-165 Backnaes L, Stelling J, Behrens H, Goettlicher J, Mangold S, Verheijen O, Beerkens RGC, Deubener J (2008) Dissolution mechanisms of tetravalent sulfur in silicate melts: evidences from sulfur K edge XANES studies on glass. J Am Ceram Soc 91:721-727 Baker DR, Moretti R (2011) Modeling the solubility of sulfur in magmas: a 50-year old geochemical challenge. Rev Mineral Geochem 73:167-213 Barbarella G (1993) Sulfur-33 NMR. Progress in NMR spectroscopy 25:317-343 Beerkens RGC (2003) Amber chromophore formation in sulfur- and iron-containing soda-lime-silica glasses. Glass Sci Technol 76:166-175
74
Wilke, Klimm, Kohn
Beny C, Guilhaumou N, Touray JC (1982) Native-sulfur-bearing fluid inclusions in the C0 2 -H 2 0-H 2 0-S-system - micro-thermometry and Raman micro-probe (Mole) analysis - thermochemical interpretations. Chem Geol 37:113-127 Beran A, Libowitzky E (eds) (2004) Spectroscopic methods in mineralogy. EMU Notes in Mineralogy, 6, Eötvös University Press Budapest Bingham PA, Connelly AJ, Hand RJ, Hyatt NC, Northrup PA, Alonso Mori R, Glatzel P, Kavcic M, Zitnik M, Bucar K, Edge R (2010) A multi-spectroscopic investigation of sulphur speciation in silicate glasses and slags. Eur J Glass Sei Technol A 51:63-80 Bonnin-Mosbah M, Metrich N, Susini J, Salome M, Massare D, Menez B (2002) Micro X-ray absorption near edge structure at the sulfur and iron K-edges in natural silicate glasses. Spectrochim Acta B 57:711-725 Brendebach B, Denecke MA, Roth G, Weisenburger S (2009) Sulfur incorporation in high level nuclear waste glass: a S K-edge XAFS investigation. J Phys Conf Ser 190:012186 Bunker G (2010) Introduction to XAFS: A Practical Guide to X-ray Absorption Fine Structure Spectroscopy. Cambridge University Press Burke EAJ (2001) Raman microspectrometry of fluid inclusions. Lithos 55:139-158 Carroll MR, Rutherford MJ (1988) Sulfur speciation in hydrous experimental glasses of varying oxidation states: results from measured wavelength shifts of sulfur X-rays. Am Mineral 73:845-849 Carroll MR, Webster JD (1994) Solubilities of sulfur, noble gases, nitrogen, chlorine, and fluorine in magmas. Rev Mineral 30: 231-279 Chappell BW, White AJR (1968) X-ray spectrographic determination of sulfur coordination in scapolite. Am Mineral 53:1735-1738 Chesnut DB, Quin LD (2004) 33S NMR shieldings and chemical bonding in compounds of sulfur. Heteroat Chem 15:216-224 demente B, Scaillet B, Pichavant M (2004) The solubility of sulfur in hydrous rhyolitic melts. J Petrol 45:21712196 Connolly JW, Haughton DR (1972) Valence of sulfur in glass of basaltic composition formed under conditions of low oxidation potential. Am Mineral 57:1515-1517 Cottrell E, Kelley KA, Lanzirotti A, Fischer RA (2009) High-precision determination of iron oxidation state in silicate glasses using XANES. Chem Geol 268:167-179 Couch S, Howes AP, Kohn SC, Smith ME (2004) 33S solid state NMR of sulfur speciation in silicate glasses. Solid State NMR 26:203-208 Daunch WA, Rinaldi PL (1996) Natural-abundance solid-state 33S NMR with high-speed magic angle spinning. J Magn Reson Ser A 123:219-221 de Hoog JCM, Hattori KH, Hoblitt RP (2004) Oxidized sulfur-rich mafic magma at Mount Pinatubo, Philippines. Contrib Mineral Petrol 146:750-761 de Lacaillerie JBD, Barberon F, Bresson B, Fonollosa P, Zann H, Fedorov VE, Naumov, Gan NGZ (2006) Applicability of natural abundance 33S solid-state NMR to cement chemistry. Cement Concrete Res 36:1781-1783 Downs RT (2006) The RRUFF project: an integrated study of the chemistry, crystallography, Raman and infrared spectroscopy of minerals. Program and Abstracts of the 19th General Meeting of the International Mineralogical Association in Kobe, Japan, 003-13 Ebel DS (2011) Sulfur in extraterrestrial bodies and the deep earth. Rev Mineral Geochem 73:315-336 Eckert H, Yesinowski JP (1986) 33S NMR at natural abundance in solids. J Am Chem Soc 108:2140-2146 Evans KA, O'Neill HStC, Mavrogenes JA, Keller NS, Jang LY, Lee JF (2009) XANES evidence for sulfur speciation in Mn-, Ni- and W-bearing silicate melts. Geochim Cosmochim Acta 73: 6847-6867 Faessler A, Goehring M (1952) Röntgenspektrum und Bindungszustand - Die K-Alpha-Fluoreszenzstrahlung des Schwefels. Naturwissenschaften 39:169-177 Falcone R, Ceola S, Daneo A, Maurina S (2011) The role of sulfur compounds in coloring and melting kinetics of industrial glass. Rev Mineral Geochem 73:113-141 Farges F, Munoz M, Siewert R, Malavergne V, Brown GE Jr, Behrens H, Nowak M, Petit PE (2001) Transition elements in water-bearing silicate glasses/melts. Part II. Ni in water-bearing glasses. Geochim Cosmochim Acta 65:1679-1693 Farrell SP, Fleet ME (1999) Evolution of local electronic structure in cubic Mg^Fe^S by S K-edge XANES spectroscopy. Solid State Commun 113:69-72 Farrell SP, Fleet ME (2001) Sulfur K-edge XANES study of local electronic structure in ternary monosulfide solid solution [(Fe,Co,Ni]0.923S]. Phys Chem Miner 28:17-27 Farrell SP, Fleet ME, Stekhin IE, Kravtsova A, Soldatov AV, Liu XY (2002) Evolution of local electronic structure in alabandite and niningerirte solid solutions [(Mn,Fe)S, (Mg,Mn)S, (Mg,Fe)S] using sulfur Kand L-edge XANES spectroscopy. Am Mineral 87:1321-1332 Fechtelkord M (2004) Solid state NMR spectroscopy as supporting method in Rietveld refinements of rockforming minerals: New developments and examples. EMU Notes Mineral 6:421-463
Spectroscopic Studies of Sulfur Speciation in Glasses
75
Figueiredo MO, da Silva T P (2009) Effect of oxygen sharing on the white line of S K-edge X A N E S spectra of sulfate minerals. Eur J Mineral 21:79-83 Fleet M E (2005) X A N E S spectroscopy of sulfur in Earth materials. Can Mineral 43:1811-1838 Fleet M E , Liu X , Harmer SL, King, PL (2005b) Sulfur K-edge X A N E S spectroscopy: Chemical state and content of sulfur in silicate glasses. Can Mineral 43:1605-1618 Fleet ME, Liu X Y , Harmer SL, Nesbitt HW (2005a) Chemical state of sulfur in natural and synthetic lazurite by S K-edge X A N E S and X-ray photoelectron spectroscopy. Can Mineral 43:1589-1603 George GN, Gorbaty M L (1989) Sulfur K-edge X-ray absorption spectroscopy of petroleum asphaltenes and model compounds. J Am Chem Soc 111:3182-3186 Gurenko AA, Schmincke HU (1998) Petrology, geochemistry, S, CI and F abundances, and S oxidation state of sideromelane glass shards from Pleistocene ash layers north and south of Gran Canaria (ODP Leg 157). Contrib Mineral Petrol 131:95-110 Gurenko AA, Schmincke HU (2000) S concentrations and its speciation in Miocene basaltic magmas north and south of Gran Canaria (Canary Islands): Constraints from glass inclusions in olivine and clinopyroxene. Geochim Cosmochim Acta 64:2321-2337 Hansen M R , Brorson M, Bilds0e H, Skibsted J, Jakobsen HJ (2008) Sensitivity enhancement in naturalabundance solid-state 3 3 S M A S N M R spectroscopy employing adiabatic inversion pulses to the satellite transitions. J Magn Reson 190:316-326 Hapanowicz RP, Condrate R A (1996) Raman spectral investigation of sulfate inclusions in sodium calcium silicate glasses. J Solid State Chem 123:183-185 Hapanowicz RP, Condrate RA, Buerhop C (1995) Raman microprobe study of bubbles formed because of laser damage in glasses. Applied Spectroscopy 49:1369-1370 Hawthorne F C (ed) (1988) Spectroscopic Methods in Mineralogy and Geology. Reviews in Mineralology, Volume 18. Mineralogical Society of America Hitchcock AP, Bodeur S, Tronc M (1987) Sulfur and chlorine K-shell X-ray absorption spectra of SC1 2 , S 2 C1 2 , SOCl 2 , and S0 2 C1 2 . Chem Phys 115:93-101 Hoefer FIE, Brey GP (2007) The iron oxidation state of garnet by electron microprobe: Its determination with the flank method combined with major-element analysis. Am Mineral 92:873-885 Hope GA, Woods, R, Munce C G (2001) Raman microprobe mineral identification. Miner Eng 14:1565-1577 Jackowski K (2001) Gas-phase " O and 3 3 S N M R spectroscopy. J Mol Struct 5 6 3 - 5 6 4 : 1 5 9 - 1 6 2 Jakobsen HJ, Bilds0e H, Skibsted J, Brorson M, Gor'kov P, Gan Z (2010) A strategy for acquisition and analysis of complex natural abundance 3 3 S solid-state N M R spectra of a disordered tetrathio transition-metal anion. J Magn Reson 202:173-179 Jakobsen HJ, Bilds0e H, Skibsted J, Brorson M, Srinivasan B R , Natherd C, Bensch W (2009) New opportunities in acquisition and analysis of natural abundance complex solid-state 3 3 S M A S N M R spectra: (CH 3 NH 3 ) 2 WS 4 , Phys Chem Chem Phys 11:6981-6986 Jakobsen HJ, Hove AR, Bilds0e H, Skibsted J (2006) Satellite transitions in natural abundance solid-state S-33 M A S N M R of alums - Sign change with zero-crossing of C-Q in a variable temperature study. J Magn Reson 180:170-177 Jakobsen HJ, Hove AR, Bilds0e H, Skibsted J, Brorson M (2007) Advancements in natural abundance solidstate 3 3 S M A S N M R : characterization of transition-metal M L S bonds in ammonium tetrathiometallates. Chem Commun 1629-1631 Jokic A, Cutler JN, Ponomarenko E, van der Kamp G, Anderson DW (2003) Organic carbon and sulfur compounds in wetland soils: insights on structure and transformation processes using K-edge X A N E S and N M R spectroscopy. Geochim Cosmochim Acta 67:2585-2597 Jugo PJ (2009) Sulfur content at sulfide saturation in oxidized magmas. Geology 37:415-418 Jugo PJ, Luth RW, Richards J P (2005) Experimental data on the speciation of sulfur as a function of oxygen fugacity in basaltic melts. Geochim Cosmochim Acta 69:497-503 Jugo PJ, Wilke M, Botcharnikov R E (2010) Sulfur K-edge X A N E S analysis of natural and synthetic basaltic glasses: Implications for S speciation and S content as function of oxygen fugacity. Geochim Cosmochim Acta 74:5926-5938 Karr C (1975) Infrared and Raman Spectroscopy of Lunar and Terrestrial Minerals. Academic Press. Kasrai M, Bancroft GM, Brunner RW, Jonasson RG, Brown J R , Tan KH, Feng X (1994) Sulfur speciation in bitumens and asphaltenes by X-ray absorption fine structure spectroscopy. Geochim Cosmochim Acta 58:2865-2872 Kim Y, Saienga J, Martin S W (2005) Glass formation in and structural investigation of Li 2 S + GeS 2 + G e 0 2 composition using Raman and IR spectroscopy. J Non-Cryst Solids 3 5 1 : 3 7 1 6 - 3 7 2 4 Kirkpatrick R J (1988) M A S N M R spectroscopy of minerals and glasses. Rev Mineral 18:341-403 Klimm K, Botcharnikov R E (2010) The determination of sulfate and sulfide species in hydrous silicate glasses using Raman spectroscopy. Am Mineral 9 5 : 1 5 7 4 - 1 5 7 9
76
Wilke, Klimm, Kohn
Klimm K, Kohn SC, O'Dell LA, Botcharnikov RE, Smith M E (submitted) The dissolution mechanism of sulfur in silicate melts; I. Assessment of analytical techniques in determining sulfur speciation. Geochim Cosmochim Acta Kohn S C (2004) N M R studies of silicate glasses. E M U Notes Mineral 6:399-419 Kohn SC, Smith ME, Dirken PJ, van Eck ERH, Kentgens APM, Dupree R (1998) Sodium environments in dry and hydrous albite glasses. Improved 2 3 Na solid state N M R data and their implications for water dissolution mechanisms. Geochim Cosmochim Acta 62:79-87 Konijnendijk WL, Buster J (1977) Raman-scattering measurements of silicate-glasses containing sulfate. J NonCryst Solids 23:401-418 Kravtsova AN, Stekhin IE, Soldatov AV, Liu X , Fleet M E (2004) Electronic structure of M S (M=Ca,Mg,Fe,Mn): X-ray absorption analysis. Phys Rev B 69:134109/1-134109/12 Kress VC, Carmichael I S E (1991) The compressibility of silicate liquids containing F e 2 0 3 and the effect of composition, temperature, oxygen fugacity and pressure on their redox states. Contrib Mineral Petrol 108:82-92 Lenoir M, Grandjean A, Poissonnet S, Neuville D R (2009) Quantitation of sulfate solubility in borosilicate glasses using Raman spectroscopy. J Non-Cryst Solids 355:1468-1473 Li D, Bancroft GM, KasraiM, Fleet M E , F e n g X H , Tan K (1995) S K- and L-edge X-ray absorption spectroscopy of metal sulfides and sulfates: applications in mineralogy and geochemistry. Can Mineral 33:949-960 Li D, Bancroft GM, Kasrai M, Fleet ME, Yang B X , Feng XH, Tan K, Peng M S (1994) S K-edge and L-edge X-ray-absorption spectroscopy of sphalerite, chalcopyrite and stannite. Phys Chem Miner 20:489-499 Machacek J, Gedeon O, Liska M, Marhoul F (2010) Molecular simulations of silicate melts doped with sulfur and nitrogen. J Non-Cryst Solids 3 5 6 : 2 4 5 8 - 2 4 6 4 MacKenzie KJD, Smith M E (2002) Multinuclear Solid State Nuclear Magnetic Resonance of Inorganic Materials. Pergamon Press Manara D, Grandjean A, Pinet O, Dussossoy JL, Neuville D R (2007) Sulfur behavior in silicate glasses and melts: Implications for sulfate incorporation in nuclear waste glasses as a function of alkali cation and V 2 0 5 content. J Non-Cryst Solids 353:12-23 Matthews SJ, Moncrieff DHS, Carroll M R (1999) Empirical calibration of the sulfur valence oxygen barometer from natural and experimental glasses: method and applications. Mineral Mag 63:421-431 McKeown DA, Muller IS, Gan H, Pegg IL, Kendziora CA (2001) Raman studies of sulfur in borosilicate waste glasses: sulfate environments. J Non-Cryst Solids 288:191-199 McKeown DA, Muller IS, Gan H, Pegg IL, Stolte W C (2004) Determination of sulfur environments in borosilicate waste glasses using X-ray absorption near-edge spectroscopy. J Non-Cryst Solids 333:74-84 McMillan PF, Wolf GH (1995) Vibrational spectroscopy of silicate liquids. Rev Mineral 32:247-315 McMillan P F (1985) Vibrational spectroscopy in the mineral sciences. Rev Mineral 14:9-63 Mei Q, Saienga J, Schrooten J, Meyer B, Martin S W (2003) Preparation and characterization of glasses in the Ag 2 S + B 2 S 3 + GeS 2 system. J Non-Cryst Solids 3 2 4 : 2 6 4 - 2 7 6 Mernagh TP, Trudu AG (1993) A laser Raman microprobe study of some geologically important sulfide minerals. C h e m G e o l 103: 113-127 Metrich N, Berry AJ, O'Neill HStC., Susini J (2009) The oxidation state of sulfur in synthetic and natural glasses determined by X-ray absorption spectroscopy. Geochim Cosmochim Acta 73:2382-2399 Metrich N, Bonnin-Mosbah M, Susini J, Menez B, Galoisy L (2002) Presence of sulfite ( S ^ ) in magmas: implications for volcanic sulfur emissions. Geophys Res Lett 29:1538 Metrich N, Clocchiatti R (1996) Sulfur abundance and its speciation in oxidized alkaline melts. Geochim Cosmochim Acta 6 0 : 4 1 5 1 - 4 1 6 0 Mosselmans JFW, Pattrick RAD, Vanderlaan G, Charnock J M , Vaughan DJ, Henderson CMB., Garner CD (1995) X-ray absorption near-edge spectra of transition metal disulfides F e S 2 (pyrite and marcasite), CoS 2 , NiS 2 and CuS 2 , and their isomorphs FeAsS and CoAsS. Phys Chem Miner 22:311-317 Moudrakovski I, Lang S, Patchkovskii S, Ripmeester J (2010) High field 3 3 S solid state N M R and first-principles calculations in potassium sulfates. J Phys Chem A 114:309-316 Musio R (2009) Applications of 3 3 S N M R spectroscopy. Annu Rep N M R Spectrosc 68:1-88 Myneni, S C B (2000) X-ray and vibrational spectroscopy of sulfate in earth materials. Rev Mineral Geochem 40:113-172 Nagashima S, Katsura T (1973) The solubility of sulfur in N a 2 0 - S i 0 2 melts under various oxygen partial pressures at 1100 °C, 1250 °C and 1300 °C. Bull Chem Soc Jpn 46:3099-3103 Nilsson K, Peach C L (1993) Sulfur speciation, oxidation state, and sulfur concentrations in backarc magmas. Geochim Cosmochim Acta 57:3807-3813 O'Dell LA, Klimm K, Freitas JCC, Kohn SC, Smith M E (2008) 3 3 S M A S N M R of a disordered sulfur-doped silicate: Signal enhancement via RAPT, Q C P M G and adiabatic pulses. Appl Magn Reson 35:247-259 Ooura M, Hanada T (1998) Compositional dependence of solubility of sulfate in silicate glasses. Glass Technology 39:68-73
Spectroscopic Studies of Sulfur Speciation in Glasses
77
Paris E, Giuli G, Carroll MR, Davoli I (2001) The valence and speciation of sulfur in glasses by X-ray absorption spectroscopy. Can Mineral 39:331-339 Prietzel J, Thieme J, Neuhäusler U, Susini J, Kögel-Knabner I (2003) Speciation of sulfur in soils and soil particles by X-ray spectromicroscopy. Eur J Soil Science 54:423-443 Ripley EM, Li C, Moore CH, Elswick ER, Maynard JB, Paul RL, Sylvester P, Seo JH, Shimizu N (2011) Analytical methods for sulfur determination in glasses, rocks, minerals and fluid inclusions. Rev Mineral Geochem 73:9-39 Rosasco GJ, Roedder E (1979) Application of a new Raman microprobe spectrometer to nondestructive analysis of sulfate and other ions in individual phases in fluid inclusions in minerals. Geochim Cosmochim Acta 43:1907-1915 Rosasco GJ, Roedder E, Simmons JH (1975) Laser-excited Raman-spectroscopy for nondestructive partial analysis of individual phases in fluid inclusions in minerals. Science 190:557-560 Ross SD (1974) Sulfates and other oxy-anions of Group VI. In: The Infrared Spectra of Minerals. Farmer VC (ed) Mineralogical Society Monograph 4, London, p 423-444 Rowe MC, Kent AJR, Nielsen RL (2007) Determination of sulfur speciation and oxidation state of olivine hosted melt inclusions. Chem Geol 236:303-322 Rowe MC, Kent AJR, Nielsen RL (2009) Subduction influence on oxygen fugacity and trace and volatile elements in basalts across the cascade volcanic arc. J Petrol 50:61-91 Santagneli SH, Schneider J, Skripachev I, Ribeiro SJL, Messaddeq Y (2008) Preparation and characterization of new glassy system As 2 P 2 S8-Ga 2 S 3 . J Phys Chem B 112:4943-4947 Sarma LP, Prasad PSR, Ravikumar N (1998) Raman spectroscopic study of phase transitions in natural gypsum. J Raman Spectr 29:851-856 Shannon RD (1976) Revised effective ionic radii and systematic studies of interatomic distances in halides and chalcogenides. Acta Crystallogr A32:751-767 Siebert J, Malavergne V, Guyot F, Combes R, Martinez I (2004) The behaviour of sulfur in metal-silicate core segregation experiments under reducing conditions. Phys Earth Planet Inter 143:433-443 Smith E, Dent G (2005) Modern Raman Spectroscopy: A Practical Approach. Wiley Stebbins J F (1988) NMR spectroscopy and dynamic processes in mineralogy and geochemistry. Rev Mineral 18:405-429 Stelling J (2009) Diffusion, Speziation und Löslichkeit von Schwefel in Silikatschmelzen. PhD Thesis Leibniz Universität Hannover, Germany Stelling J, Behrens H, Wilke M, Göttlicher J, Chalmin E (2011) Interaction between sulfide and H 2 0 in silicate melts. Geochim Cosmochim Acta 75:3542-3557 Sutrisno A, Terskikhb VV, Huang Y (2009) A natural abundance 33 S solid-state NMR study of layered transition metal disulfides at ultrahigh magnetic field. Chem Commun 186-188 Sutton SR, Karner J, Papike J, Delaney JS, Shearer C, Newville M, Eng P, Rivers M, Dyar MD (2005) Vanadium K edge XANES of synthetic and natural basaltic glasses and application to microscale oxygen barometry. Geochim Cosmochim Acta 69:2333-2348 Tsujimura T, Xue XY, Kanzaki M, Walter MJ (2004) Sulfur speciation and network structural changes in sodium silicate glasses: Constraints from NMR and Raman spectroscopy. Geochim Cosmochim Acta 68:50815101 Vairavamurthy A, Maletic D, Wang S, Manowitz B, Eglington T, Lyons T (1997) Characterization of sulfurcontaining functional groups in sedimentary humic substances by X-ray Absorption near-edge structure spectroscopy. Energy Fuels 11:546-553 Wagler TA, Daunch WA, Panzner M, Youngs WJ, Rinaldi PL (2004) Solid-state 33 S MAS NMR of inorganic sulfates, J Magn Reson 170:336-344 Wagler TA, Daunch WA, Rinaldi PL, Palmer AR (2003) Solid state 33 S NMR of inorganic sulfides. J Magn Reson 161:191-197 Wallace PJ, Carmichael ISE (1992) Sulfur in basaltic magmas. Geochim Cosmochim Acta 56:1863-1874 Wallace PJ, Carmichael ISE. (1994) S speciation in submarine basaltic glasses as determined by measurements of S K a X-ray wavelength shifts. Am Mineral 79:161-167 White SN (2009) Laser Raman spectroscopy as a technique for identification of seafloor hydrothermal and cold seep minerals. Chem Geol 259:240-252 Wilke M, Jugo PJ, Klimm K, Susini J, Botcharnikov RE, Kohn SC, Janousch M (2008) The origin of S 4 + detected in silicate glasses by XANES. Am Mineral 93:235-240 Wilke M, Partzsch GM, Bernhardt R, Lattard D (2004) Determination of the iron oxidation state in basaltic glasses using XANES at the K-edge. Chem Geol 213:71-87 Wilke M, Schmidt C, Farges F, Malavergne V, Gautron L, Simionovici A, Hahn M, Petit PE (2006) Structural environment of Fe in water-bearing silicate glass and melt - evidence from X-ray absorption spectroscopy. Chem Geol 229:144-161 Wincott PL, Vaughan DJ (2006) Spectroscopic studies of sulfides. Rev Mineral Geochem 61:181-229
78
Wilke, Klimm, Kohn
Winther KT, Watson EB, Korenowski GM (1998) Magmatic sulfur compounds and sulfur diffusion in albite melt at 1 GPaand 1300-1500 degrees C. Am Mineral 83:1141-1151 Womes M, Karnatak RC, Esteva JM, Lefebvre I, Allan G, Olibier-Fourcade J, Jumas JC (1997) Electronic structures of FeS and FeS2: X-ray absorption spectroscopy and band structure calculations. J Phys Chem Solids 58:345-352 Zwanziger JW (1998) Structure and chemical modification in oxide glasses. Int Rev Phys Chem 17:65-90
4
Reviews in Mineralogy & Geochemistry Vol. 73 pp. 79-111,2011 Copyright © Mineralogical Society of America
Diffusion and Redox Reactions of Sulfur in Silicate Melts Harald Behrens and Jan Stelling Institut für Mineralogie andZFM Center for Solid State Chemistry and New Materials Leibniz Universität Hannover, Callinstr. 3 D-30167 Hannover, Germany [email protected]
INTRODUCTION Although large-scale transport in magmas is usually controlled by convection, diffusion of sulfur in silicate melts, nevertheless, plays a crucial role in the kinetics of various magmatic processes. The most important process is probably the degassing of magmas and melts initiated by an oversaturation of the melt with respect to dissolved volatiles. Such oversaturation can be caused in nature, i.e., by decompression when a magma ascends to the Earth surface. But the degassing of melts is also of major interest for technical applications, e.g., during fining of melts in industrial glass production. The kinetics of volcanic eruptions and the fining of glass melts are basically controlled by the dynamics of bubble nucleation and growth, and these properties are strongly affected by the diffusion of volatiles from the melt into bubbles (Nemec 1980a,b; Sparks et al. 1994; Müller-Simon 2011, this volume). Hence, understanding the diffusion of volatiles in melts provides a necessary tool for modeling bubble nucleation and growth. However, the diffusivities of volatiles such as H 2 0, C0 2 , S0 2 and H2S in the melt do not only affect the degassing rate, they may also cause a fractionation of volatiles between gas phase and melt as well, due to different diffusivities. For instance, in hydrous magmas the diffusion of H 2 0 is usually much faster than C 0 2 and sulfur diffusion (Baker et al. 2005; Zhang and Ni 2010), so rapid, disequilibrium removal of bubbles from the melt may cause an artificial enrichment of some components in the bubbles. Other processes which may be governed by sulfur diffusion in the melts are the dissolution and precipitation of minerals. In glass manufacturing, crucial problems are the kinetics of dissolution of the raw materials in the melt batch and of the homogenization of the melt (see Falcone et al. 2011, this volume). In nature, the formation of sulfur-bearing accessory minerals requires extraction of sulfur from a large melt volume, due to the low sulfur solubility in the melts (see Parat et al. 2011, this volume). Hence, rates of diffusion of sulfur towards or away from the minerals are important for the kinetics of crystal growth and crystal dissolution. But diffusion may affect isotope partitioning between melts and minerals as well if the mass of the isotopes and, hence, their diffusivities in the melt differ strongly. The mechanisms of sulfur diffusion in silicate melts are much more complex than those of other reactive volatiles such as H 2 0 and C0 2 . Water and carbon dioxide both dissolve as unreacted species (molecules) and reacted species (hydroxyl groups and carbonate groups). For these two components the molecular species diffuses much faster than the reacted species, which often can be considered in a first approximation as immobile (Zhang and Ni 2010). Hence, diffusional transport is controlled by the fraction of molecular species relative to the reacted species and their mobilities in the melt. The dominant sulfur species in silicate melts, assuming that speciation in glasses represents the melt at least near the glass transition, are 1529-6466/11/0073-0004S05.00
DOI: 10.2138/rmg.2011.73.4
80
Behrens &
Stelling
sulfide under reducing conditions and sulfate under oxidizing conditions (see Wilke et al. 2011, this volume). In both cases there is not a simple transfer to a molecular form. No molecular form exists for sulfide except possibly in hydrous melts where H 2 S could be formed, and sulfate can decompose to molecular S0 2 only by a change in oxidation state (e.g., SO42~(OT) S0 2 (g) + 0.50 2 (g) + 02~(m), where m refers to melt and g to gas). Hence, the most likely process of diffusion of sulfur in the melt occurs via ionic sulfur species, and fluxes of other melt constituents, e.g. alkali ions, are required for local charge neutralization. As a consequence, the diffusion of sulfur in the melt will be associated with a large structural perturbation, i.e. local re-arrangement of the structure is needed because the diffusing unit is too large to fit into existing holes of the silicate network. Hence, one might expect a large influence of the kinetics of structural relaxation (i.e., viscosity) on sulfur diffusion. Sulfur diffusion studies on silicate glasses and melts are rare for natural melts as well as for melts of interest for technical application. Previous reviews on melts relevant to nature can be found in Watson (1994), Baker et al. (2005) and Zhang et al. (2007). In part, the lack of diffusion data is due to technical difficulties in doing well-controlled diffusion experiments. These problems are related to the volatile character of sulfur, to the speciation of sulfur which changes with redox conditions, and also to the overprinting of diffusive transport by convection in diffusion sample experiments. In this chapter, we will first give an overview of sulfur diffusion studies on silicate melts. Several of these studies show large variations of the diffusion coefficients at constant pressuretemperature (P-T) conditions, and an important question is whether other transport mechanisms such as convection may have affected the experiments. Next, we will compare the diffusion of sulfur with that of other volatiles such as H 2 0, C 0 2 and noble gases. For understanding the rate-controlling processes of sulfur diffusion in silicate melts, the effect of oxygen fugacity will be discussed, and findings on diffusion of individual sulfur species will be presented. Then we will have a look at diffusion-controlled redox processes in which sulfur is involved. This is interesting in view of the interaction of magmas with fluids which may induce changes in sulfur speciation (Webster and Botcharnikov 2011, this volume). Finally, considering that sulfur diffusion is usually very slow in silicate melts, one needs to address how strongly the mobility of sulfur in silicate melts is coupled to the dynamics of the silicate network, i.e., to melt viscosity.
SULFUR DIFFUSION STUDIES Experimental techniques to determine diffusion coefficients of ions, atoms, and molecules in silicate melts are described in Ryerson (1987), Watson and Dohmen (2010) and Behrens (2010). Information about analytical techniques to measure diffusion profiles can be found in Cherniak et al. (2010). In most of the sulfur diffusion studies, chemical diffusion coefficients were measured, meaning that a gradient in sulfur concentration was present in the experimental diffusion samples. In a few studies (Watson 1994; Szurman et al. 2007; Backnaes 2011), the radioactive isotope 35S was used to monitor sulfur diffusion and the samples were virtually free of chemical potential gradients. Conditions and results of the sulfur diffusion studies are listed in Appendix Table 1. Compositions of the studied melts can be found in the Appendix Table 2. The temperature dependence of diffusivity is usually expressed by an Arrhenius relationship (1) where i refers to the diffusing species. Di o is the pre-exponential factor, Ea is the activation energy for diffusion, R is the universal gas constant and T is the absolute temperature. Figure 1 presents a compilation of sulfur diffusion data for melts with compositions relevant for industrial processes or for magmatic systems.
Diffusion
& Redox Reactions of Sulfur in Silicate
Melts
81
T(°C) 1500
1300 1200
1100
1000
900
Q Q
800
Sz07, AF45+15
-
Sz07, AF45+10
-
Sz07, AF45+5 Sz07_red, AF45 Sz07_ox, AF45 -16
(a)
E05, S i 0 2
I.... I.... I
-18
0.55
0.60
0.65
0.70
0.75
0.80
0.85
0.90
0.95
1000/T (T in K ) T(°C) 1500
- l ' I
1
1300 1200
I
1
I
'
1100 T~
1000 T~
900
800
- W94, and 5.5 wt% H 2 0 F05, dry E bas
F05, E bas - 4 wt% H 2 0
-10
F05, S bas - 3 wt% H 2 0 W94, lunar F05, dry S bas
-12
Q Q
W94, dry and
W94, dry dac ~ - .
-14
W98, dry alb
+
+ B&R96, dry rhy 1 atm
-16
(b) -18 0.55
. B&R96, rhy 5.8 wt% H 2 0
B&R9S, dry rhy
_L 0.60
_L 0.65
LJ_ 0.70
_L 0.75
_L 0.80
_L 0.85
_L 0.90
0.95
1000/T (T in K)
Figure 1. Compilation of sulfur diffusion data for (a) simple melts and melts of interest for glass sciences: B10 - NCS, NS3 (Backnaes 2010; Backnaes et al. 2011); B62 - NCS (Brückner 1962); E05 - Si0 2 glass (Espiau de Lamaestre et al. 2005); K&N95 - NCS (Klouzek and Nemec 1995), N&M81 - float glass (Nemec and Mühlbauer 1981); Sch87 - alkali borosilicate SRL-131 (Schreiber et al. 1987); Sch89 - E-glass (Schreiber et al. 1989); S09 - NCS, NS3 (Stelling 2009); Sz07_ox - barium aluminoborosilicate AF45, oxidizing cond. (Szurman et al. 2007); Sz07_red - AF45, reducing conditions (Szurman et al. 2007) and (b) melts of interest for geosciences: B&R96 - rhyolite (Baker and Rutherford 1996); F05 - E bas = Etna basalt, S bas = Stromboli basalt (Freda et al. 2005); W94 - andesite & dacite (Watson 1994), W98 - albite (Winther et al. 1998). Lines are Arrhenius relationships listed in Appendix Table 1 ; compositions are given in Appendix Table 2.
82
Behrens &
Stelling
In past, the terminology of diffusion coefficients has been ambiguous. In some older papers (Nemec and Mühlbauer 1981; Schreiber et al. 1987, 1989; Klouzek and Nemec 1995), the diffusing species was often not clearly identified and labels such as S0 2 or S0 3 were used for diffusion coefficients; these labels refer to the gas phase used in the experiments rather than to the mobile species in the silicate melt. In this review the term sulfur diffusion (S-diffusion) refers to experiments in which the diffusing sulfur species could not be clearly identified or in which different sulfur species coexisted. Diffusion coefficients for species such as sulfide or sulfate are given only when the data are based on measurements of profiles of discrete species, i.e., identified by using micro XANES (X-ray absorption near-edge structure) spectroscopy. The terms tracer diffusion and 35 S-diffusion refer to experiments in which the radioactive isotope 35S was used. In the following, the studies are discussed in order of an increasing complexity of melt composition. Some recent work of one of the authors on sodium silicate and soda lime silicate melts is presented in more detail than other work, because this work has been so far published only as a dissertation (Stelling 2009). Silica glass Espiau de Lamaestre et al. (2005) studied S-diffusion profiles in silica glass by secondary ion mass spectrometry (SIMS) after implanting sulfur close to the glass surface using a highly energetic particle beam and subsequent diffusion annealing at temperatures of 1073-1173 K in a silica tube furnace under dry N2. The obtained diffusivities between 2.5xl0~ 18 m2/s and 1.6xl0~17 m2/s are the slowest ones measured for sulfur diffusion in glasses to date (Fig. 1). These data may be compared to noble gas diffusion and are intermediate between diffusivities for krypton and xenon in silica glasses (Behrens 2010). The authors (Espiau de Lamaestre et al. 2005) assume that species equilibrium is achieved during experiment by the reaction S2~ + 20 2 S0 4 2 - ; however, sulfur speciation was not measured. For the implantation process one might expect different sulfur species than those found in glasses produced by quenching of silicate melts. Large local stress is induced in the glass around the implanted atoms and local relaxation of the silica network is very slow at the temperatures of the diffusion experiments which are far below the glass-transition temperatures of silica glasses (Agrarwal et al. 1995). Hence, the diffusion data may not be transferable to a relaxed, stress-free silica glass. Simple silicate glasses Studies on S-diffusion in simple Al- and B-free silicate compositions are restricted to soda lime silicate and sodium trisilicate melts. The first systematic study on transport of sulfur in silicate melts was performed by Brückner (1961a,b, 1962) on soda lime silicate glass melts with a composition often used as a simplified window glass composition (16 N a 2 0 - 10 CaO - 74 Si0 2 in mol%, denoted hereafter as NCS). He studied interface reactions and material exchange between silicate melts and sulfur-bearing gases or molten salts. Brückner (1961b) tried to model the results of experiments in platinum crucibles involving uptake of sulfur by the NCS melt overlain by Na 2 S0 4 melt. He assumed a simple diffusion-controlled process and found that the derived sulfur diffusivity of ~3xl0 - 7 m 2 /s was relatively fast compared to sodium diffusion. Furthermore, the derived diffusivity varied very little with temperature in the range of 1373-1873 K. The author argued that convection had a major influence on the transport of sulfur in the melt, induced probably by reactions at the salt/silicate interface and by density fluctuations in the melt near the interface. Subsequently, Brückner (1962) performed two experiments in which a sulfate-bearing melt was placed above a sulfate-free melt in a platinum capsule, one was heated for 30 minutes and the other for 65 minutes at 1573 K. Sulfur profiles were measured using bulk analyses of glass sections parallel to the diffusion interface. The data suffer from the imprecision of the analytical technique available at that time, and also
Diffusion
& Redox Reactions of Sulfur in Silicate
Melts
83
f r o m the degassing of sulfur to the outer atmosphere, which strongly affected the profiles in the upper part of the melt batch. Brückner (1962) argued that the measured values of D = 8xlO~ 10 m 2 /s after 30 min and D = 2xlO~ 10 m 2 /s after 65 min represent upper limits for the diffusion coefficient. Even higher apparent diffusivities were found in experiments when a S 0 2 - 0 2 gas mixture in ratio 2:1 was blown over the glass melt. The author noted that the uptake of sulfur was accompanied by a loss of sodium. Sodium diffuses through the melt to the gas/melt interface and forms a layer of sodium sulfate liquid by reaction with sulfur dioxide and oxygen ( N a 2 0 + Vi 02 + S 0 2 = N a 2 S 0 4 ) , but sodium is evaporated as well to the atmosphere under the chosen experimental conditions. The studies of Brückner (1961a,b, 1962) point out the need to avoid the contribution of convection to the overall transport of sulfur in melts and give the first example of the coupling of sulfur fluxes to fluxes of other melt components. Nemec and Mühlbauer (1981) reported a diffusion equation, which they assigned to S 0 3 diffusion (the term S-diffusion is more appropriate), in a float glass melt compositionally similar to the N C S melt. According to Nemec (pers. communication) the data are based on photographic measurement of the growth rate of ascending bubbles in the sulfate-bearing melt in the T-range of 1698-1773 K. Using gas chromatographic analysis of volatiles released from re-heated quenched glasses, it could be demonstrated that the content of the fining gases S 0 2 and 0 2 was about 98% in the bubbles. Diffusion coefficients of S 0 3 were derived by modeling the growth kinetics assuming a simple diffusion-controlled mechanism. An inverse approach was used by Klouzek and Nemec (1995) who measured the rate of dissolution of S 0 2 gas in a NCS glass melt. The gas was loaded via a tube in a silica container which was inserted upside down in the melt. Then the position of the gas/melt interface was recorded with a video camera, and diffusion data were obtained by fitting the change in the height of the gas column to the solution of Fick's 2 nd law for spherical coordinates to account for the curved gas/melt interface. In the case of S 0 2 and S 0 2 - 0 2 gases, the experimental data show noticeable discrepancies to the trend expected by the theoretical equation implying that the dissolution process is not exclusively controlled by diffusion of sulfur species in the melt. The authors suggest that chemical reaction and convection have an effect as well on the absorption kinetics. Fitting only the initial period of the experiments, estimates of sulfur diffusivities in soda lime silicate melts were obtained which range from 9.0x 10~12 m 2 /s at 1523 K to 5 . 1 x l 0 - 1 1 m 2 /s at 1723 K. Using the same experimental approach, in a subsequent study Nemec and Klouzek (1998) found evidence for the formation of a sulfate layer at the interface between soda lime silicate glass melts and S 0 2 ± 0 2 in particular at lower temperatures (1473 K). This reaction includes extraction of N a 2 0 and/or CaO f r o m the melt and, hence, induces a flux of these components to the melt surface, as observed already by Brückner (1962). A model to describe the interaction between sulfate-bearing melts and S0 2 -bearing bubbles was proposed by Nemec and Ullrich (1998). In the PhD thesis of Stelling (2009) diffusion-couple experiments were used to study chemical diffusion of sulfur in NCS melts and sodium trisilicate (NS3) melts. In the experiments, sulfur-free and sulfur-bearing glass cylinders (diameter 4 mm, length 3-4 mm) with polished base planes in mutual contact were loaded in platinum capsules (Fig. 2). Sulfur contents between 0.10 and 0.25 wt% were adjusted in the sulfur-bearing halves of the couple; these sulfur contents are much lower than the expected sulfur solubility for the conditions of the diffusion experiments. Sulfur-bearing N S 3 glasses were produced by melting mixtures of glass powder and appropriate amounts of N a 2 S 0 4 , FeS or Na 2 S in platinum capsules in an internally heated gas pressure vessel (IHPV) at 1273 K, 100 M P a for ca. 15 h. The syntheses conditions were chosen to be similar to those used in the diffusion experiments, in order to prevent complications during the diffusion runs induced by disequilibrium of hydrogen between the pressure medium and the experimental charge (the capsule walls are permeable to hydrogen at temperature). However, X ANES spectra (recorded on glass powders or glass sections at the SUL-X or X AS beam line at
84
Behrens &
Stelling
Figure 2. Scheme of a diffusion couple sample, before (left) and after (right) the experiment.
ANKA, the synchrotron facility at the Karlsruhe Institute of Technology (KIT), Germany, or the ID21 beam line at the European Synchrotron Radiation Facility (ESRF), Grenoble, France) demonstrate that only sulfide remains stable in the nominally anhydrous melt while sulfate is partially reduced under these conditions in the IHPV (Stelling 2009). Therefore, a different synthesis strategy was chosen for NCS glasses in order to obtain samples containing exclusively sulfate or sulfide. To produce sulfate-bearing glasses, about 1 wt% sulfur as Na 2 S0 4 was mixed with glass powder and melted in a platinum crucible at temperatures between 1640 K and 1920 K in air for 1.5 to 3 h. The remaining sulfur content in the glasses after this fining experiment was typically 0.10-0.15 wt%. Sulfide-bearing glasses were prepared by melting up to 7 wt% of sulfur as Na 2 S and FeS with glass powder in a graphite crucible for 60 to 90 min at 1700 to 1800 K. To protect the graphite crucible against oxidation in air, it was inserted in an alumina crucible and covered with a platinum lid. Sulfur distribution in both sulfate- and sulfide-bearing NCS glasses was homogeneous and glasses were free of salt-relicts over several millimeters as evidenced by analyses of glass fragments using a carbon/sulfur analyzer ELTRA CS800 or by investigation of thin sections of the glasses using a CAMECA SX-100 electron microprobe. Results of S K-edge XANES spectroscopy demonstrate that either sulfate or sulfide was the only sulfur species in the respective glasses. The NS3 glasses have typically higher water contents (0.1-0.6 wt%) than NCS glasses (C02
(13)
The equivalent carbon is then used in the batch redox number calculation with the redox value -6.7. The same procedure is applied to determine the redox value of glass cullet. Table 5 shows typical ranges of batch redox numbers for different industrial SLS glass container colors. Table 6 illustrates an example of batch redox number calculation for an amber glass batch composition. It is important to stress that optimum redox numbers may vary with the type of furnace, the fuel used and the general melting conditions. In fact, the batch redox number cannot account for either all of the possible melting condition variations or for the glass production rate (pull rate) in industrial plants that can lead to different redox states in the end product. Nevertheless, once established, it can be used as a reference value for that particular melting unit. In order to monitor the real redox state of the glass melt during the melting process, inline oxygen sensors have been developed. These devices enable the detection of uncontrolled redox variations at an early stage and a faster correction of the batch redox number, particularly when high percentages of recycled cullet are used in the glass batch (Laimbock 2008; MiillerSimon 2011, this volume).
Table 5. Typical batch redox number ranges for different types of container glass (from Daneo et al. 2006)
Glass color
Batch redox number range
Colorless
+15/+7
Half white
+5 / - 3
Emerald green
-3/-10
Yellow green UVAG
-16 / -20
Amber
-20 / -30
Table 6. Example of a batch redox number calculation for a cullet free amber glass batch.
Raw material
Weight (kg)
COD (mg oxygen/g raw material)
Equivalent C per kg of raw material (kg)
Silica sand
2000
0.15
0.11
Soda-ash
600
Limestone
330
0.25
0.03
Dolostone
300
0.25
0.03
Equivalent C total
0.17
Redox value
Redox number
-6.7
-1.1
-1.2
-7.2
Pyrite
6
Graphite (85% C)
0.7
-5.7
-4.0
Slag
80
-0.14
-11.2
Batch redox number
Sulfur
Compounds
in Industrial
Glass
131
Experimental melting In order to investigate sulfur behavior in SLS melting experiments at different redox conditions have been performed (Barbon et al. 1991). In order to define real sulfur solubility in a glass melt, an equilibrium state between the melt and the gas phase is required. In melting experiments, an equilibrium state is rarely reached and therefore, sulfur behavior in the glass melt would be more correctly described by the amount of sulfur retained by the glass, usually expressed as weight % of SC)3 ,r. The amount of retained sulfur depends largely on the experimental parameters. Nevertheless, at constant experimental conditions, it can be used as an approximate indicator of sulfur solubility in glass. Figure 6 shows the variation of retained sulfur concentration (expressed as wt% S0 3 tot) and the % of Fe2+ of Fe tot versus the batch redox number, for a SLS glass composition. The curve was obtained experimentally by adding carbon to the same SLS batch glass melted at 1350 °C. The corresponding glass contained 0.33 wt% of total iron (expressed as Fe 2 0 3 ), without any other coloring element (Barbon et al. 1991; Maurina et al. 2008). In the Figure, the color of the glass produced by iron at different redox values is also reported. Under oxidizing conditions, (redox number +15 to +10 and Fe2+/Fetot < 30%), sulfur is soluble largely as sulfate (S6+) (Wilke et al. 2011, this volume). Iron is present mostly as Fe 3+ which gives the glass a pale yellowish color. At more reduced conditions, i.e., higher contents of ferrous iron, the retained sulfur decreases progressively. Initially Fe 2+ increases moderately; after entering the region of negative redox numbers the abundance of ferrous iron increases dramatically. Glass color changes from yellow to green (30-50% Fe2+) to blue (approx. 60% Fe2+) due to the progressive increase of Fe2+. In correspondence of a batch redox number - 1 5 (Fe2+ = 65-70%) sulfur begins to dissolve as sulfide (S2~). The corresponding glass color suddenly turns from blue to amber-yellow, due to the formation of the amber chromophore Fe3+/S2", turning dark brown at extremely reduced conditions. At a batch redox number around -20, Fe2+correspond to about 80% of total iron, whereas retained sulfur reaches its minimum concentration (minimum of solubility). For redox numbers lower than - 2 0 (industrial amber color region) we observe a significant increase of retained sulfur in the glass in the form of sulfides and a moderate increase of Fe 2+ (80-85 %).
20
10
0
-10
-20
-30
-40
-SO
Batch redo* number
Figure 6. Total retained sulfur solubility versus Fe 2+ /Fe tot ratio (in %) for a soda-lime-silica glass batch after experiments at 1350 °C in which various amounts of carbon were added to soda-lime silicate melts (data from Barbon et al. 1991).
132
Falcone, Ceola, Daneo,
Maurina
The effect of temperature on the glass redox and sulfur solubility (Backnaes and Deubener 2011, this volume) also has to be considered. Dubois et al. (1990) report that if the melting temperature for oxidized glasses increases, glasses with a higher ferrous content and lower retained sulfur are obtained. They concluded that a temperature increase lowers the sulfate solubility and enhances the thermal decomposition of ferric iron. Barbon et al. (1991) investigated the effect of temperature on the redox state of the resulting glasses for batch redox numbers ranging from +30 to -70. By melting the same batch at different temperatures (1350 °C and 1500 °C), an increase of the retained sulfur (in the form of sulfide) was observed in the glass obtained with batch redox numbers lower than -20. By contrast, in the oxidized range a higher melting temperature resulted in lower retained sulfur content due to reduced sulfate solubility. Moreover, the minimum of sulfur solubility was attained at lower redox number. A shift of the Fe 2+ to Fe3+ curve to higher redox numbers was also observed, in agreement with Dubois et al. (1990).
CHEMICAL CHARACTERIZATION OF GLASS COLORS The concentrations and redox state of coloring polyvalent elements in the end product are routinely analyzed in industrial and research glass laboratories in order to monitor the quality and stability (constancy) of glass color. The concentration of elements influencing glass color can be determined by traditional wet chemistry methods and instrumental analytical techniques (Guadagnino and Corumluoglu 1997; Corumluoglu and Guadagnino 1999; Ripley et al. 2011, this volume). Nevertheless most of these techniques are expensive and time consuming. In the field of industrial glass rapid and frequent analyses are required to strictly monitor the production process. Glass compositions are therefore usually determined by quantitative Wavelength Dispersive X-ray Fluorescence Spectrometry (WDXRF) which provides reliable, accurate, fast and low-cost analysis. Severe limitations occur on sulfur analysis in glass samples by WDXRF due to sample preparation as glass beads (loss of sulfur during fusion with lithium tetra- or meta-borate) or pressed pellets (poor correlation of X-ray intensities to standard sulfur concentrations), as described by Ripley et al. (2011, this volume). Consequently, WDXRF analysis of glass samples at SSV are routinely performed on the flat glass surface polished with cerium oxide fine powder (without any other type of preparation such as grinding, fluxing, etc.) using a sequential X-ray spectrometer calibrated according to international glass standards (NBS, SGT, etc.). This procedure enables the quantitative determination of all glass components including total iron, total sulfur and chromium (conventionally expressed as S0 3 t o t , Fe 2 0 3 t o t and Cr 2 0 3 , respectively) even at very low concentrations on the order of tens of ppm. Ferrous oxide (FeO) and sulfide (S2~) concentrations in SLS glass samples can be rapidly determined by means of visible-near infrared range (Vis-NIR) spectrophotometry FeO can be determined by measuring the absorption band centered at 1050 nm. Sulfides can be determined by measuring the intensity of the amber chromophore optical absorption (Bamford and Hudson 1965; Cable and Hulme 1985; Boheme et al. 1991). A good correlation between FeO concentrations determined by wet chemistry and the absorption at 1050 nm was obtained by using a base line joining two points of the spectral curve at 770 and 1500 nm, where the absorption coefficient of Fe 2+ is practically constant and the interference of amber and chromium chromophores is negligible (Daneo et al. 1992). For sulfides determination the amber absorption is measured at 550 nm, where the interference due to the absorption band of Cr3+ is low and can be corrected according to the equation: [Fe 3 + ][S 2 1 = a xA550 -b x[Cr 2 0 3 ] - c
(14)
where the coefficients a, b and c are > 0 and have been determined by the statistical treatment of
Sulfur Compounds in Industrial Glass
133
a large number of reference samples analyzed by wet chemistry or other analytical techniques to determine the concentrations of iron and chromium. These coefficients are not absolute but differ depending on the instrument type and on the analytical methods for the chemical analysis. The spectrophotometric determination of sulfides is an indirect measurement since only the sulfides bond in the amber complex are determined. Nevertheless, Daneo et al. (1992) demonstrated that the corrected 550 nm absorption is proportional to the total sulfides content in the range of industrial hollow glass compositions, by comparing wet chemistry and spectrophotometric data. Table 7 lists typical wt% concentration ranges of F e 2 0 3 t o t , S0 3 j t o t and C r 2 0 3 together with the Fe 2+ /Fe tot and S 2 ~/S tot ratios (expressed in %) of different containers glass (extra-colorless, colorless, half white, emerald green, yellow-green UVAG and amber glass) produced by Italian manufacturers (Daneo et al. 2009). In white glass, Fe 2 0 3 tot, present as an undesired impurity from raw materials, ranges between 0.015 wt% (extra white glass) and 0.03-0.07 wt%. Fe 2 + is lower than 30% of total iron; total retained sulfur (expressed as S0 3 j t o t ) is higher than 0.20 wt%; C r 2 0 3 must be lower than 0.0003 wt% (3 ppm). In half-white glass, the F e 2 0 3 t o t and S0 3 , t o t concentrations range between 0.1 wt% and 0.2 wt% and Fe 2 + ranges between 30% and 40% of total iron. In emerald green glass, the color is mainly provided by about 0.2 wt% of Cr 2 0 3 , that is added to the batch as chromite ((Fe,Mg)Cr 2 0 4 ). In this type of glass, F e 2 0 3 tot concentration ranges between 0.4 and 0.6 wt% (iron is introduced in the batch mainly as hematite) and the ferrous iron usually ranges between 4 5 % and 55% of total iron. The yellow-green (UVAG) and amber glasses are characterized by high iron contents ( F e 2 0 3 t o t > 0.5 wt% and > 0.3 wt% respectively); S0 3 j t o t is typically about 0.02 wt% for yellow-green glass (minimum sulfur retention) and lower than 0.06 wt% for amber glass. These types of glass have high Fe 2 + content (>70% - 80% of Fe tot ) but still contain sufficient amounts of Fe 3 + that ensure the formation of the amber chromophore. Yellow-green color of UVAG glass is produced by the simultaneous presence of amber chromophore and trivalent chromium (Cr 2 0 3 about 0.1 wt%). The latter provides the green hue. Table 7. Ranges o f coloring ions concentrations (in wt% of oxide) and redox pairs ratios (in % ) in S L S container glasses produced in Italy (data from S S V ) .
Glass type
Fe 2 0 3 , tot
so3,tot
Cr203
Fe 2+ /F etot
Colorless
0.015-0.07
0.20-0.30
—
1 -30
S^Stot —
Half white
0.1-0.2
0.08-0.20
traces
30 40
Emerald green
0.4-0.6
0.04-0.05
0.15 0.25
43 56
— —
Yellow green UVAG
0.4-1.0
0.01-0.03
0.06 0.13
70 80
75 90
Amber
0.3-0.5
0.04-0.06
0.03 0.06
74 82
85 95
Figure 7 shows typical ranges of total retained sulfur concentration (expressed as S 0 3 tot ) of different types of container glass versus their Fe 2+ /Fe tot . The general trend of the data mirrors the retained sulfur curve in Figure 6. The total amount of retained sulfur decreases progressively from oxidized colorless glasses to reduced yellow-green and then increases going toward highly reduced amber glass. Sulfur speciation in industrial SLS glass melt has recently been investigated by XANES spectroscopy. Bingham et al. (2010) reported the presence of intermediate S 4 + and S 5 + , in addition to main sulfur species S 6 + and S 2 ~, primarily in yellow-green (UVAG) glasses produced under moderately reduced conditions that coincide with minimum sulfur solubility. However, the existence of intermediate redox states of sulfur between sulfide and sulfate is still
134
Falcone, Ceola, Daneo,
Maurina
0.4
o
EMERALD ^ GREEN 0.0 0
10
20
30
40
50
F i g u r e 7. T y p i c a l r a n g e s of total r e t a i n e d s u l f u r and Fe2+/Fetot ratio for d i f f e r e n t c o n t a i n e r glass t y p e s p r o d u c e d in Italy (data f r o m SSV).
AMBER
LI VAG SO
70
O 80
90
100
2
Fe * / feta,(%) controversial. Other studies show evidence that such XANES features can be formed as beam damage (Wilke et al. 2008; 2011, this volume).
BUBBLES IN SLS GLASSES Bubbles in soda-lime container glass are caused by different phenomena linked to the different stages of the production process. In particular, bubbles are the main defects of SLS glass products that may derive from uncontrolled variations of retained sulfur. These defects can be caused by a local event that changes the uniformity of temperature or composition in the glass. Gaseous inclusions represent a serious aesthetic problem, especially for high quality glass production. The presence of visible bubbles in high quality cosmetic and perfumery containers causes the rejection of the product by the customer. Bubbles on the bore (mouth) of a container might cause mechanical problems in the cork process and large bubbles on the container bodies might lead to holes or even glass fragmentation inside the container and contamination of the contained product. Therefore, knowledge of the composition of gas bubbles is fundamental for determining the origin of the defect and undertaking necessary corrective operations in the glass production line (Backhausen et al. 2004). Gas compositions in bubbles can be analyzed using a mass spectrometer with a quadrupole analyzer (Greim et al. 1981). A small fragment of glass with a bubble is placed in the breaking chamber. Inside this chamber, the air is pumped out by means of turbo-molecular pumps, until reaching an internal pressure of 10~12 to 10~13 bar. At this vacuum level, the bubble is broken by a plunger and the gases inside reach the ionization chamber through the transfer line. The ionization chamber creates the ions which, after being accelerated by an appropriate device, simultaneously reach the quadrupole analyzer (dynamic analysis). High vacuum levels are necessary because of the small size of the bubbles usually analyzed. Since gas pressure in the bubbles at room temperature range from 0.2 to 0.3 bar, it is necessary to have as much gas as possible reaching the analyzer. All the surfaces in contact with the gas are gold plated in order to limit the absorption of the gas species on the internal walls and obtain low detection limit. As an example the detection limit of GIA522 Mass spectrometer produced by IPI is approximately 5xl0~ 12 bar-1 (which corresponds to a bubble with a diameter of 0.1 mm with an internal pressure of 10~2 bar). In order to promote bubble breakage by means of a plunger, two opposite converging cuts near the bubble are made on
Sulfur Compounds in Industrial Glass
135
the sample. This preparation also reduces the fresh fractured surface that could absorb part of the gas after breaking. Gaseous inclusions containing sulfur are mainly caused by three different issues: incomplete fining, redox instability and reboil. Incomplete fining The fining process depends on the maximum temperature reached by the melt in the hotspot, and the time that the melt stays at this temperature. The fining process is insufficient or incomplete when, due to an uneven balance of the time-temperature choice, the molten glass still contains medium-sized bubbles (up to 1 mm) after leaving the fining stage. The time the melt stays in the furnace is influenced by the pull rate (amount of glass extracted from the furnace); time is shorter as the pull rate is increased. This is a common issue at plants whose economic budget is strictly related to final product quantity generated per day, and where the presence of some defects is not that critical (containers for low quality products). The incomplete decomposition of the fining agents lead to the incomplete reaction and release of S 0 2 and 0 2 gases and eventually leads to the presence of S 0 2 bubbles in which the main gas, in oxidized glasses, may be condensated and other gases dissolved in the melt, such as C 0 2 , may diffuse into the cavity (Golob and Lowell Swarts 1984). The temperature in the working end is strongly influenced by the quantity and type of raw materials in the furnaces. For instance, the higher the fraction of glass cullet, the lower the heat that is required to melt the batch material, or at given heat, the temperature in the glass throat needs to be higher (Conradt et al. 1997). If the amount of cullet is not kept strictly under control, temperature fluctuations may arise during initial melting stages. These fluctuations can cause a displacement of the hot-spot of the furnace, and eventually lead to incomplete fining. As a consequence sulfates may evolve completely into S 0 2 and 0 2 before the complete elimination of C 0 2 from the melt has occurred. Thus C 0 2 bubbles in the molten glass persist after it has passed the throat and cannot be eliminated. Redox During the fusion process, the redox state must be kept under control; otherwise, uncontrolled variations may lead to the formation of S 0 2 -bearing bubbles. This phenomenon can derive result from drastic redox gradient, where oxidized glass undergoes a sudden reduction, or when reduced glass suffers fast oxidation. In both cases, sulfur oversaturation can occur in the glass melt, followed by the formation of S0 2 -bearing bubbles. Redox variations arise where two glass melts with different redox states come into contact. The two most common causes are the use of different-colored cullets or residual glass from a former production run, after color change. Moreover, in a particular production (tableware, perfumery, etc.), glass is colored by adding a frit (i.e., a colored low temperature melting glass) to the colorless glass in the feeder. The mixing of these two different glasses may lead to the formation of sulfur-containing bubbles. Sometimes, a burner with too much or too little oxidant flame might change the redox state of the glass melt surface giving rise to sulfur bubbles. Reboil The term "reboil" refers to the sudden formation of bubbles after the fining phase as a consequence of a local temperature increase, due to an ill-regulated burner over the glass melt, or to malfunctioning of the thermo-regulation system. This temperature increase causes a local reduction of sulfur solubility and, in the case of oversaturation, the formation of S0 2 -bearing bubbles as main gas component. If this phenomenon happens in the proximity of the working end, the glass melt will not have enough time to re-dissolve the S 0 2 gas. In this case, the bubbles are limited to specific production intervals and a single production line. Table 8 reports typical compositional ranges of bubbles in SLS container glasses due to incomplete fining, redox and reboil.
136
Falcone,
Ceola, Daneo,
Maurina
Table 8. Typical composition ranges (in vol%) of bubbles in SLS container glasses due to incomplete fining, redox and reboil (from Maurina et al. 2008). Gas
Fining
Redox
Reboil
so2
traces - 78.2%
87.1-95.3%
96.9-97.9%
N2
0.4-7.1%
2.8-7.9%
1.1-1.5%
co2
21.2-91.7%
1.7-4.4%
1.0-1.5%
H2S
0 - traces
traces - 0.2%
COS
0-1.1%
—
AR
—
0 - traces
— — —
Pressure
10-100 mbar
80-120 mbar
80-120 mbar
Deposits
S° - sulfate
S° - sulfate
S° - sulfate
Deposits The gases contained in sulfur-bearing bubbles, may react with the surrounding glass forming sulfur and sulfate deposits before reaching the working end. S 0 2 in the bubble decomposes into S 0 3 and S: 3 S 0 2 —» 2 S 0 3 + S
(15)
S 0 3 reacts with N a 2 0 in the glass melt, forming N a 2 S 0 4 deposits on the internal bubble surface: S 0 3 + N a 2 0 H> N a 2 S 0 4
(16)
The gas pressure inside the bubble is reduced because of this mechanism (Golob and Lowell Swarts 1984) and sometimes gas bubbles contain only residual gases and deposits. The lowering of the pressure inside the bubble drives the diffusion of the gases from melt to the bubble, in order to re-establish the equilibrium between gas and melt. Elemental sulfur and sulfates solid deposits can be analyzed by Optical Microscope (OM) and Scanning Electron Microscope and Energy Dispersive X-ray microanalysis (SEM-EDX). Observed under the optical microscope, sulfate deposits often display an irregular shape, which, in some cases, has a peculiar dendritic structure (snowflake structure). Figure 8 shows sulfate deposits and small spheres of elemental sulfur condensation deposited on the internal surface of a bubble in a SLS container glass. The identification of sulfur condensates can be confirmed by heating the bubble and observing the effect of increasing temperature on the deposits. Sulfur condensates melt at about 120 °C and changes color at about 145 °C. These changes are reversible upon cooling (Fowkes and Parton 1969). Deposit morphologies can be observed at high magnification using SEM-EDX analysis, which also provides information about their chemical composition. However, there are some technical difficulties. Sample preparation is quite difficult, because the bubble must be opened without spoiling or losing the deposit inside the internal bubble surface. Moreover, the concavity of the internal surface is not suitable for SEM-EDX analysis, which is best performed on flat surfaces. Figure 9 shows the SEM secondary electron images of the internal surface of a bubble with sodium sulfate deposits are shown at different magnifications. Due to the small quantity of deposits present and the concavity of the sample, only qualitative elemental microanalysis could be performed on this sample. Nevertheless, the analyses gave clear evidence for the chemical nature of the deposit (Maurina et al. 2008).
Sulfur Compounds
in Industrial
Glass
137
Figure 8. Detail of bubble with sulfur and sulfates deposits (optical stereo microscope).
2SkU
X500
Sa5m
13 3 5
SEI
Figure 9. SEM secondary electron images of the internal surface of a bubble with sulfates deposit at low (above) and high (below) magnification.
138
Falcone, Ceola, Daneo,
Maurina
SUMMARY AND OUTLOOK In the production of industrial SLS glass, sulfur compounds play an important role in determining the quality of the final product. These compounds actively participate in the fining process. Moreover they take a decisive role in the coloring mechanism of reduced glasses (yellow-green and amber) by producing the amber color. The absorption bands at 290 and 425 nm of this chromophore provide the highest level of protection to photosensitive foodstuffs and beverages. Glass container color quality is monitored by measuring optical properties and CIE L*a*b* 1976 coordinates. Moreover it is essential to monitor redox equilibria in order to ensure the right, stable and reproducible color quality. The batch redox number concept alone is not sufficient for ensuring the optimal quality of the end product. Therefore the analytical determination of the redox pairs ratios Fe2+/Fe3+, S2"/S6+ and Cr 2 0 3 concentration are of critical importance in order to ensure stable and homogeneous final coloration, in particular for reduced glasses such as yellow-green UVAG and amber. For these types of glass, small optical property variations can be evident to the observer and, if they fall outside acceptance limits, the products may be contested or rejected by the customer. Furthermore, uncontrolled variations of retained sulfur in glass melts may cause sulfur bubbles which spoil the final product quality and can cause product rejection by customers. Therefore, the analytical characterization of the gases inside the bubbles is fundamental for determining their origin and undertaking necessary corrective operations Today, due to commercial reasons, glassmakers are increasingly requested to perform frequent glass color changes in the furnace. In industrial glass tank furnaces color changes are carried out by the so called changeover on the run, i.e., the progressive change of the batch composition while production operations continue (draining and refilling is theoretically possible only for small tanks for special glasses). During the transitions periods (which vary from several hours to several days, depending upon starting and target colors) usually no saleable glass is produced. Therefore, for economic reasons, the change must be performed as quickly as possible. In recent years, the amount of glass cullet in the batch has increased up to 80-90 wt% for particular glass types such as emerald green and UVAG yellow-green. This environmentally positive trend has several drawbacks mainly due variability of cullet compositions, and also in terms of redox affecting contaminants. Based on these assumptions future tasks in glass technology should include the development of procedures and analytical methods for the fast glass quality specifications, with particular concern on consistency, uniformity and reproducibility of glass color, in order to assist glassmakers particularly during the critical phase of color change. Moreover, the development of rapid methods for the characterization of glass cullet and the effect of high percentages of glass cullet in the batch on sulfur solubility, redox and glass color and bubbles formation should be studied, as well as considering the inevitable variations of industrial cullet compositions.
ACKNOWLEDGMENTS The authors wish to thank prof. Harald Behrens from the University of Hannover for his careful revision work and assistance during the manuscript preparation and all the reviewers for their constructive comments and suggestions. Special thanks to Linda Falcone, Robert Linnen, Sharon Webb and Jim Webster for their English revision work and to Marta Vallotto for the drawing of Figure 1.
Sulfur Compounds in Industrial Glass
139
REFERENCES Albayrak G, Sengel H (2008) Review of sulphate chemistry and its impact on glass production. Glass Technol Eur J Glass Sci Technol A 49:289-296 ArkosiovàM, Klouzek J, Nemec (2008) The role of sulfur in glass melting processes. Ceram Silik 52:155-159 Backhausen J, Muysenberg E, Ullrich J (2004) The importance of understanding the basic quality issues for improving the technology in glass melting. Int Glass J 129:31-36 Backnaes L, Deubener J (2011) Experimental studies on sulfur solubility in silicate melts at near-atmospheric pressure. Rev Mineral Geochem 73:143-165 Bamford CR (1977) Color Generation and Control in Glass. Elsevier, Amsterdam Bamford CR, Hudson EJ (1965) A spectrophotometric method for the determination of the ferrous/ferric ratio in soda-lime-silica glass. Proc of the 7 th ICG Congress 1:1-11 Barbon F, Geotti-Bianchini F, Hreglich S, Scandellari L, Verità M (1991) Effect of the batch redox number and melting temperature on the redox equilibria in soda-lime industrial glass. Proc of the l s t E S G Conference Fundamentals of the glass manufacturing process, p 252-256 Barton J (2001) The evolution of the composition of industrial glasses: a historical perspective. Riv Staz Sper Vetro 2:3-10 Barton J, Guillemet C (2005) Le Verre - Science et Technologie. EDP Sciences, France Beerkens R (2005) Sulphate decomposition and sulphur chemistry in glass melting processes. Glass Technol Eur J Glass Sci Technol A 46:39-46 Beerkens R (2007) Sulphur chemistry and sulphate fining and foaming of glass melts. Glass Technol Eur J Glass Sci Technol A 48:41-52 Behrens H, Stelling J (2011) Diffusion and redox reactions of sulfur in silicate melts. Rev Mineral Geochem 73:79-111 Bingham PA, Connelly AJ, Hand RJ, Hyatt NC, Northrup PA, Alonso Mori R, Glatzel P, Kavcic M, Zitnik M, Bucar K, Edge R (2010) A multi-spectroscopic investigation of sulfur speciation in silicate glasses and slags. Glass Technol Eur J Glass Sci Technol A 51:63-80 Boheme W, Mueller HW, Liekmeier W (1991) A spectrometer concept for dedicated applications in UV-VIS spectroscopy. Int Lab Jan-Feb: 18-24 Cable M, Hulme R (1985) Measurement of the ferrous:ferric ratio in flint glasses and its uses. Glass Technol 26:170-175 Chopinet M-H, Verità M, Falcone R, Lehuédé P, Vallotto M, Nardone M, Sodo A (2008) Soda-lime-silica glass containers: chemical durability and weathering products. Adv Mater Res 39-40:305-310 Clark-Monks C, Parker JM (1980) Stones and Cords in Glass. Society of Glass Tecnology, Sheffield Commission Internationale de l'Eclairage (2004) Colorimetry, 3rd Edition. Technical Report CIE 015:2004 Conradt R, Kham NS, Eiumnoh C, Pimkhaokham P (1997) Melting behavior of batches containing ground cullets. In: Proceedings of Fundamentals of Glass Science and Technology. Glafo, Vaxjo, Sweden, p 290-296 Corumluoglu O, Guadagnino E (1999) Determination of ferrous iron and total iron in glass by a colorimetrie method. Glass Technol 40:24-28 Cotton FA, Wilkinson G, Gaus P (1995) Basic Inorganic Chemistry, 3rd ed. Wiley, New York. Chapter 23. Daneo A, Falcone R, Hreglich S (2006) Vetri per contenitori: ruolo dello stato redox nella formazione e stabilità del colore. Riv Staz Sper Vetro 5:5-16 Daneo A, Falcone R, Hreglich S (2009) Effect of the redox state on container glass color stability. Glass Technol Eur J Glass Sci Technol A 50:147-150 Daneo A, Polato P, Scandellari M L, Verità M (1992) Spectrophotometric determination of ferrous iron and sulphides in industrial hollow soda-lime glass. Boi Soc Esp Ceram Vidrio 31:509-514 Dolan MD, Misture ST (2004) Analysis of glass batch reactions using in situ x-ray diffraction. Part 2. Sodalime-silica glass batches. Glass Technol 45:167-174 Douglas R W, Zaman M S (1969) The chromophore in iron-sulphur amber glass. Phys Chem Glasses 10:125132 Dubois B, Rey S, Petit-Marie D, Barton J L (1990) Effect of melting temperature on redox state of glass refined with sulfate. Glastech Ber 63K:253-260 Falcone R, Licenziati F, Orsega EF, Verità M (2011) The dependence of the weathering of soda-lime-silica glass on environmental parameters: a preliminary investigation. Glass Technol Eur J Glass Sci Technol A 52:23-29 Fowkes AJ, Parton C (1969) Sulphur and iodine condensates in bubble in glass. Glass Technol 5:147-150 Geotti-Bianchini F, Verità M, De Riu L, Stella A (1994) Evaluation of tin oxide coatings on glass containers using HECM and EPMA. Glass Technol 35:216-223 Golob H R, Lowell Swarts E (1984) Diproportion of S 0 2 in bubbles within soda-containing glasses. J Am Ceram Soc 67:564-567
140
Falcone, Ceola, Daneo,
Maurina
Greim J, Knodler H, Schaeffer H A (1981) Mass spectrometric analysis of the S0 2 gas reaction with soda-limesilica glass surfaces. Verres Réfract 35:315-318 Guadagnino E, Corumluoglu O (1997) Indirect determination of sulphide sulphur in glass by flame atomic absorption spectrometry. Glass Technol 38:179-182 Guloyan YA (2007) Complete analysis of ionic staining of glasses by transition-metal compounds. Glass Ceram 64:153-158 Harding FL, Ryder RJ (1970) Amber colour in commercial silicate glasses. J Can Ceram Soc 39:59-63 Hlavac J (1983) The Technology of Glass and Ceramics. An Introduction. Elsevier, Amsterdam Hreglic S, Scandellari M, Verità M (1979) Impiego delle scorie d'altoforno come materia prima nella produzione del vetro. Riv Staz Sper Vetro 9:205-214 Hrma P (1985) Reaction between sodium carbonate and silica sand at 874 °C < T < 1022 °C. J Am Ceram Soc 68:337-341 Hrma P (1990) Batch melting reactions. In: Chemistry of Glasses - 2ni Edition. Paul A (ed) Chapman and Hall, London New York, p 157-178 Jacobsson B, Hògberg B (1947) The sensitivity of beer to light. Protection afforded by glass bottles. Wallerstein Lab Comm 29:5-16 Kim S, Sanders TH (1991) Phase diagram for ceramists. J Am Ceram Soc 74:1833-1840 Klouzek J, Arkosiovà M, Lubomir N, Cincibusovà P (2007) The role of sulphur compounds in glass melting. Glass Technol Eur J Glass Sci Technol A 48:176-182 KramerF W (2005) Solubility of gases in glass melts. Ber Bunsenges Phys Chem 100:1512-1514 Kraub M, Lenhart A, Ratka H, Kircher U (1995) Characterization of filter dust in the glass container industry and definition of its influence on green glass melts. Glastech Ber Glass Sci Technol 68:278-284 Laimbòck P (2008) In-line oxygen sensors for the glass melt and the float bath. Adv Mater Res 39-40:443-446 Lehmann J, Nadif M (2011) Interactions between metal and slag melts: steel desulfurization. Rev Mineral Geochem 73:493-511 Levich,VG (1962) Physiochemical Hydrodynamics. Prentice-Hall, Englewood Cliffs, NJ USA Levin EM, Robbins CR, McMurdie HF (1964) Phase Diagrams for Ceramists. The American Ceramic Society, Columbus Locardi B (1992) Qualità del vetro e conservazione degli oli vegetali. Riv Staz Sper Vetro 2:67-72 Manring WH, Hopkins RW (1958) Use of sulphates in glass. The Glass Industry 39:139-142 Mastrobattista G (1990) Effect of light on extra virgin olive oils in different types of glass bottles. Ital J Food Sci 3:191-195 Maurina S, Falcone R, Vallotto M (2008) Origine e caratterizzazione delle inclusion gassose contenenti zolfo nei vetri sodico-calcici per contenitori. Riv Staz Sper Vetro 4:17-15 Muller-Simon H (2011) Fining of glass melts. Rev Mineral Geochem 73:337-361 Muller-Simon H, Gitzhofer K (2008) Sulphur mass flow balances in industrial glass melting furnaces. Glass Technol Eur J Glass Sci Technol A 49:289-296 Novotny F, Losot R (2008) Chemical reactions in a soda-lime silicate batch. Advanced Materials Research 39-40:459-464 Paul A (1990) Chemistry of Glasses - 2ni Edition. Chapman and Hall, London New York Peters A (1993) Determination of reducing components in glassmaking raw materials. Glastech Ber 66:19-24 Polato P, Daneo A (1991) Specificazione del colore: dall'atlante di Munsell al diagramma colorimetri co CIE. Riv Staz Sper Vetro 6:303-314 Polato P, Daneo A, Segato P (1988) Caratterizzazione ottica del vetro cavo. Riv Staz Sper Vetro 1:5-18 Polato P, Segato P, Daneo A (1989) Determination of color difference or "colorlessness" for glasses using the spectrophotometric method. Riv Staz Sper Vetro 1:81-90 Ripley EM, Li C, Moore CH, Elswick ER, Maynard JB, Paul RL, Sylvester P, Seo JH, Shimizu N (2011) Analytical methods for sulfur determination in glasses, rocks, minerals and fluid inclusions. Rev Mineral Geochem 73:9-39 Scalet B (1996) Problems related to the use of cullet and the reuse of dusts from fumes treatment plants. Intern Glass J 87:65-69 Scholze H (1991) Glass, Nature, Structure and Properties. Springer Verlag, New York Shaeffer HA (1984) Diffusion-controlled processes in glass forming melts. J Non-Cryst Solids 67:19-33 Shelby JE (1997) Introduction to Glass Science and Technology. Royal Society of Chemistry Simpson W (1976) Calumite slag as a glassmaking raw material for the increase of furnace productivity. Glass Technol 17:35-40 Simpson W (1979) Calumite slag - its benefits to the glassmakers. Riv Staz Sper Vetro 9:364-368 Simpson W, Myers DD (1978) The redox number concept and its use by the glass technologist. Glass Technol 19:82-85 Sinton C W (2006) Raw Material for Glass and Ceramics. John Wiley and Sons, New Jersey Trier W (1987) Glass Furnaces: Design Construction and Operation. Society of Glass Technology, Sheffield
Sulfur Compounds in Industrial Glass
141
Verità M, Falcone R, Sommariva G, Chopinet M-H, Lehuédé P (2009) Weathering of the inners surface of soda-lime-silica glass containers exposed to the atmosphere. Glass Technol Eur J Glass Sci Technol A 50:65-70 Volf MB (1961) Technical Glasses. Sir Issac Pitman and Sons, Eds, London Volf MB (1990) Technical Approach to Glass. Elsevier, Amsterdam and New York Wilke M, Jugo PJ, Klimm K, Susini J, Botcharnikov RE, Kohn SC, Janousch M (2008) The origin of S 4 + detected in silicate glasses by XANES. Am Mineral 93:235-240 Wilke M, Klimm K, Kohn SC (2011) Spectroscopic studies on sulfur speciation in synthetic and natural glasses. Rev Mineral Geochem 73:41-78 Wiszecki G, Stiles WS (1982) Color Science - Concepts and Methods, Quantitative Data and Formulae - 2ni Edition. John Wiley and sons, New York
6
Reviews in Mineralogy & Geochemistry Vol. 73 pp. 143-165,2011 Copyright © Mineralogical Society of America
Experimental Studies on Sulfur Solubility in Silicate Melts at Near-Atmospheric Pressure Linda Backnaes* and Joachim Deubener Institute of Non-Metallic Materials Clausthal University of Technology, Zehntnerstr. 2a D-38678 Clausthal-Zellerfeld, Germany linda-johanna. backnaes @ schott. com ^current affiliation: SCHOTT Electronic Packaging, Christoph-Dorner-Str.
29, D-84028 Landshut,
Germany
INTRODUCTION Various experimental studies in silicate melts have been performed to understand the dependence of sulfur solubility on melt composition and experimental conditions. These experiments were motivated by glass technologists due to the role swulfur compounds play in fining (Miiller-Simon 2011, this volume) and coloring (Falcone et al. 2011, this volume) melts. In particular, the risk of foaming in the glass tank and rejects in the glass production due to discoloration and bubbles demand a systematic approach for sulfur solubility in silicate melts. Also sulfur solubility experiments have been conducted by metallurgists, whose interest is centered on the interaction of metal and slag melts to desulfurize steel products (Lehmann and Nadif 2011, this volume). Besides technical applications, sulfur solubility experiments at atmospheric pressure are of importance to geoscientists in modelling near-surface conditions such as sulfur degassing from volcanoes (Oppenheimer et al. 2011, this volume) and the role of sulfur in the formation of ore deposits (Simon and Ripley 2011, this volume). In order to study the effect of polymerization of the silicate network on sulfur solubility, melt compositions were varied in the experiments across broad limits. It has been shown that the solubility generally increases with increasing network modifier to network former ratio (Baker and Moretti 2011, this volume). This supports the idea that the presence of free volume and cationic charge compensators in the network structure promote incorporation and mobility of anionic sulfur species (Behrens and Stelling 2011, this volume). Sulfur speciation is also responsible for the strong dependence of sulfur solubility on oxygen fugacity as reported by Baker and Moretti (2011, this volume) and Miiller-Simon (2011, this volume) for natural and technical melts, respectively. Sulfur was found to be stable in these melts as sulfide S2~ under reducing conditions and as sulfate (S0 4 ) 2 - under oxidizing conditions with a sharp transition at oxygen fugacities close to that of the Ni-NiO buffer (Wilke et al. 2011, this volume). In most of the experimental studies on sulfur solubility, sulfur was introduced by either mixing solid sulfur sources such as sodium sulfate to the glass batch before melting or by passing sulfur-bearing gases through/over the hot silicate melt. For any sulfur source the sulfur retention of the melt will depend on dwell time of the sulfurization experiment while the sulfur solubility in the melt at saturation with the present sulfur source, is independent of dwelling. This means that in order to be able to talk about sulfur solubility, the experiments need to be performed with consideration of the equilibrium between at least two phases, for example melt + fluid, melt + salt or melt + gas (Baker and Moretti 2011, this volume). As a consequence of the slow mobility of the sulfur species in silicate melts (Behrens and Stelling 2011, this volume) 1529-6466/11/0073-0006S05.00
DOI: 10.2138/rmg.2011.73.6
144
Backnaes &
Deubener
these specific equilibria may be reached in large sample volumes and at low temperatures only after days or even longer dwell times. The lack of detailed description of experimental conditions in several reports makes it difficult to identify whether the sulfur content of the glasses reflects equilibrium conditions or a kinetically controlled state specific to the applied procedures. With regard to gas reactions, a strong control on the fugacity of sulfur and oxygen needs to be undertaken. This has often not been done because the scope of the experiments was mainly to improve manufacturing procedures. For example, in an experiment designed to investigate the fining of melts, an equilibrium state is usually not reached, and therefore the sulfur contents of the glass product does not represent the true solubility of sulfur in the melt. In the course of this paper the term solubility is used only for experiments in which equilibrium or at least near-equilibrium conditions were achieved while the term retention is used for all other experiments.
ANALYSIS METHODS FOR SULFUR CONTENT There are several ways of measuring the sulfur content in a glass. Since the sulfur contents are usually quite low however, the analysis method needs to have a high sensitivity for element detection. The analysis methods for sulfur determination in glasses are thoroughly discussed in Ripley et al. (2011, this volume), and hence only the methods employed in the studies presented in this chapter are briefly mentioned below. Two main analysis methods were employed: Electron microprobe analysis (EMPA) (Haughton et al. 1974; Buchanan and Nolan 1979; Kaushik et al. 2006; Bingham et al. 2007, 2008; Mishra et al. 2008; Lenoir et al. 2009) and X-ray fluorescence (XRF) analysis (Papadopoulos 1973; Barbon et al. 1991; Ooura and Hanada 1998; McKeown et al. 2001; Manara et al. 2007). In some of the older papers, a method based on acid extraction was employed (Pearce and Beisler 1965; Nagashima and Katsura 1973; Katsura and Nagashima 1974), in which the glass was dissolved in acid (hydrochloric acid, strong phosphoric acid, or mixtures of stannous chloride dehydrate with phosphoric acid). When using the phosphor-based acids (Nagashima and Katsura 1973; Katsura and Nagashima 1974), the sulfur was dissolved as hydrogen sulfide, whereupon it was fixed as zinc sulfide and photometrically determined. When using hydrochloric acid (Pearce and Beisler 1965), the dissolved material was filtered, and the filtrate containing the sulfur fraction was analyzed gravimetrically (as BaS0 4 ). Combustion analysis was used for sulfur detection by Fincham and Richardson (1954). In this method, the glass is rapidly combusted and the amount of sulfur dioxide gas (S0 2 ) is quantified through infra-red spectroscopy. A similar method, namely evolved gas analysis (EGA) combined with the use of a mass spectrometer, was used by Klouzek et al. (2006, 2007) for the determination of sulfur gases released from a melt in the furnace. Therefore mixtures of glass, coke and sodium sulfate were filled in a silica glass tube and placed in a laboratory furnace that was heated at a rate of 5 K min -1 . Gases evolved from the sample were flushed out to sampling loops by a stream of air. The loops were repeatedly connected to the stream of carrier gas of a chromatograph. Furthermore, combustion analysis was used by Beerkens and Kahl (2002), which dissolved the evolved S0 2 gas in NaOH peroxide and determined the sulfur content of the resulting solution by titration.
INDUSTRIAL MELTS Effect of oxygen fugacity Since sulfur is a polyvalent element, one of the most influential parameters with regard to sulfur solubility and speciation in silicate melts is the oxygen fugacity ( f 0 l ) in the melt. The
Sulfur Solubility
in Silicate Melts at Near-Atmospheric
Pressure
145
effect of /o 2 on sulfur solubility has been investigated by several research groups (Fincham and Richardson 1954; Holmquist 1966; Nagashima and Katsura 1973; Papadopoulos 1973; Schreiber et al. 1987; Beerkens et al. 2002, 2003a, 2003b; Müller-Simon et al. 2008). In the pioneering work of Fincham and Richardson (1954) sulfur solubility in the binary systems Ca0-Si0 2 , Mg0-Si0 2 , Fe0-Si0 2 and Ca0-Al 2 0 3 as well as the ternary system Ca0-Si0 2 -Al 2 0 3 was investigated. The melts were equilibrated with a furnace atmosphere containing a H 2 -C0 2 -S0 2 gas mixture of constant sulfur dioxide fugacity (/so2) but different f0r The reaction time in the temperature range from 1350 to 1650 °C was varied to reach constant sulfur content in the melt. Thus, their experiments determined the sulfur solubility at saturation with the sulfur-bearing gases. The sulfur content of the melts was analyzed by combustion after quench. At low oxygen fugacities (f0l < 10~7 bar), Fincham and Richardson (1954) found that the solubility of sulfur is enhanced with decreasing f0l, but declined with decreasing f0l under oxidizing conditions (f0l > 10~2 bar). The following equilibrium reactions have been proposed to explain the partitioning between the sulfur in gas (g) and melt (m) and the solubility of sulfur as reduced sulfide (S2~) under low and as oxidized sulfate (S0 4 2- ) under high oxygen fugacities: S0 2 (g) + 0 2 - ( m ) ^ 0 2 ( g ) + S 2 -(m) S0 2 (g) +^02(g)
(1)
+ O 2 -(m) ^ S0 4 2 -(m)
(2)
with the corresponding equilibrium constants: Y
3l2 _ Jf Oi a"s2sulfide —
\D)
/S02
V
a 2_ _ sulfate r r 1/2 a Jso2 Jo2 0i-
(A \ '
where asi-, aSOii- and aQi- are the activities of sulfide, sulfate and free oxygen in the melt, respectively. Rearranging Equations (3) and (4) in logarithmic scales and assuming ideal behavior of the mixed compounds the solubility of sulfur as sulfide ( S a n d as sulfate (Ssuifate) is: ^Sulfide =
teg^SO,
^Ksulfide
V )
Sulfate =~l°g-Po2 40gPs02 ^Og( ^sulfate *o2-
^
(6)
where PQl, PSOl are the partial pressures of oxygen and sulfur dioxide and c02- is the concentration of free oxygen in the melt (O 2- ) Nagashima and Katsura (1973) investigated the sulfur solubility in binary Na 2 0-Si0 2 melts of molar ratios of 1:3, 1:2 and 1:1 at 1100 °C, 1250 °C and 1300 °C by keeping the S0 2 partial pressure constant but varying the oxygen partial pressure. They passed a pre-mixed gas flow of S0 2 with addition of C0 2 and H2 over the melt to control the oxygen and sulfur dioxide fugacity. The sulfur content of the glasses was measured through an acid extraction method. Gas-saturated melts were obtained at 1300 °C and 1250 °C as shown from the lack of variation in sulfur content with run duration. For the mixture of 1:1 Na 2 0 to Si0 2 at 1100 °C however, a significant deviation from equilibrium with the gas phase was reported, since the sulfur concentration levels were reported to be close to 8% (it was however not stated if the value referred to mol% or wt%). Furthermore, the experimental dwell times at the given temperatures was not stated. The equilibrium compositions of the gas phase were calculated numerically by minimizing free energy of the gas mixture using the method of White
146
Backnaes &
Deubener
et al. (1958) and comparing the calculated P Q l with the actual oxygen partial pressure measured by a Zr0 2 sensor. At constant temperature, the sulfur solubility for all three glass compositions showed a minimum for intermediate oxygen partial pressures in the range PQl = 10~7-10~9 bar, with the minimum solubility being shifted to lower oxygen partial pressures as the sodium oxide content increases (Fig. 1). The maximum sulfur solubility was found at either high or low oxygen partial pressures, i.e., during either oxidizing or reducing conditions, when sulfur is present in the form of sulfate and sulfide respectively. In Figure 1 the logarithm of the oxygen fugacity was specified relative to the nickel-nickel oxide (NNO) buffer since in the relevant temperature range NNO equals QFM + 1. In this diagram it is assumed that PQl equals/^. Experimental conditions for the data presented in Figure 1 are listed in Table 1 of the Appendix. A different approach to investigate the dependence of sulfur solubility on oxygen fugacity was used by Beerkens and Kahl (2002) for soda-lime-silicate melts (74 Si0 2 -16 Na 2 0-10 CaO). The glasses were produced by adding sodium sulfate (1 wt%) and iron (up to 1.5 wt%), and carbon powder as reducing agent (in various amounts) to the batch. Batches of 700 g (with a 7 cm initial batch height) were pre-melted in silica and alumina crucibles at 1200 °C for 16 h and then heated up to 1400 °C in air and subsequently cooled down to room temperature. The oxygen
log (PQ2 (bar)) @ 140CTC -12
-6
-10
-4
-8
-2
-6
0 ANNO
-4
2
-2
4
0
6
Figure 1. Total sulfur in the melt as a function of oxygen fugacity (relative to the log/o 2 of the nickel-nickel oxide equilibrium ANNO) in different silicate melts. Straight lines indicate sulfate and sulfide solubility trends according to (J(logS)/J(log/o 2 )) = 1/2 and (J(logS")/J(log/o2)) = - 3 / 2 , respectively. Data: 39.4 Si0 2 43.3 CaO-17.3 Al 2 0,-melts: Black full symbols, square = 1425 °C, circle = 1500 °C, triangle = 1550 °C, Fincham and Richardson (1954); Si0 2 -Na 2 0-melts at 1200 °C: Half-filled symbols, circle = trisilicate, square = disilicate, Holmquist (1966); Si0 2 -Na 2 0-melts at 1250 °C: Open symbols, circle = trisilicate, square = disilicate, star = metasilicate, Nagashima and Katsura (1973); 74 Si0 2 - 16 N a 2 0 - 10 CaO melts at 1400 °C: Gray halftone symbols, square = 0.12 wt% FeO , pyramid = 0.3 wt % FeO, diamond = 1.5 wt% FeO, circle = lower N a 2 0 content, Beerkens and Kahl (2002). It needs to be emphasised that the data set from Beerkens and Kahl (2002) does not represent equilibrium between the sulphur and melt phases. Lines connecting data are intended as a visual guide.
Sulfur
Solubility
in Silicate Melts at Near-Atmospheric
Pressure
147
fugacity in the melt was measured during heating from 1200 °C to 1400 °C and during cooling with a Zr0 2 oxygen sensor (immersed 3-5 cm below the glass surface), and was within the Po 2 _ r a n g e of 10~0,2-10~7,5 bar. The sulfur content of the glass was analyzed by a hot extraction method. A minimum of sulfur retention was detected in the Po 2 _ r a n g e °f 10~5-10~6 bar (Fig 1). A major focus of the study of Beerkens and Kahl (2002) was on the variation of the intensity of amber coloration with redox state of the melt using the intensity of the absorption band at a wavelength of 410 nm as the controlling parameter. The increase of P 0 l is associated with a change from amber-colored to colorless glasses. In contrary to the studies of Nagashima and Katsura (1973) and Fincham and Richardson (1954), equilibrium was not reached in the experiments of Beerkens and Kahl (2002) and, hence, the concentrations of sulfur in the postexperimental glasses represent only sulfur retention. However, the trends of S-content of melts as a function of P 0 l are quite similar in these studies and agree with the so called "Budd-curve" introduced in glass technology through the pioneering work on sulfur retention of Budd (1965). Beerkens and Kahl (2002) interpreted their results with reference to the stability of the different sulfur species, i.e., sulfate being stable at high oxygen fugacity, and sulfide at reducing oxygen fugacities. As the sulfur retention was at its minimum in the sulfite stability field at intermediate oxygen fugacity they concluded that sulfite is not a stable species in the melt. Spectroscopic data summarized by Wilke et al. (2011, this volume) support this assumption and showed that sulfide and sulfate occurred in its own specific oxygen partial pressure range while both species can coexist in the melt only in a narrow range of oxygen fugacity centered about one order of magnitude above the equilibrium/^ of the quartz-fayalite-magnetite (QFM+1). Furthermore, Backnaes et al. (2008) detected solely sulfate and sulfide species in technical soda-lime-silica glasses using XANES spectroscopy. However, this is not an unambiguous proof that sulfite does not exist in the high temperature melts. As noted by Miiller-Simon (2011, this volume) sulfite may convert to other sulfur species during cooling. According to Equations (5) and (6) slopes ¿/(log S)/i/(log f0l) of -1.5 and +0.5 are expected when sulfide and sulfate, respectively, are the sole sulfur species. From inspecting the data collected in Figure 1 it can be seen that only the data from Fincham and Richardson (1954) and Nagashima and Katsura (1973) reveal similar slopes, but there too, the slight deviations from models of sulfur solubility (Baker and Moretti 2011, this volume) are evident. The data from the other reports show noticeable discrepancy from the expected trend that indicates either variable sulfur dioxide fugacity or contributions of other sulfur dissolution reactions within these series of experiments. Whether sulfur dissolves exclusively as sulfate at high oxygen fugacities and sulfide at low oxygen fugacities can be tested by inspecting the ranges with respect to the oxygen fugacity of constant values of K'sulfide and K'sulfat— i.e., plotting log K' vs. log P0l with logK' = log(K x c0i-) in Figure 2. Fincham and Richardson (1954) defined an upper limit for exclusive sulfide and a lower limit for exclusive sulfate solubility at oxygen fugacities of 10~6 bar and 10 -4 bar respectively for a calcium alumosilicate melt at 1500 °C. Nagashima and Katsura (1973) concluded that for sodium silicate compositions at 1250 °C sulfur solubility is governed by the sulfate equilibrium (Eqn. 4) at oxygen fugacities above 10~7 bar and by the sulfide equilibrium (Eqn. 3) at oxygen fugacities below 10~9 bar. The close correlation of sulfur solubility and sulfur speciation is in agreement with spectroscopy data (XANES) of Jugo et al. (2010), where a sharp step in the S6+/ES ratio was detected at oxygen fugacities close to NNO buffer (~ 10~42 bar at 1500 °C and ~ 10~7 bar at 1250 °C). Therefore in Figure 2 the logarithm of the oxygen fugacity was specified relative to the nickel-nickel oxide (NNO) buffer and it was assumed for simplicity that Po2 equals/o 2 . The oxidation of sulfur under high oxygen fugacities (Eqn. 2) has also been studied by Holmquist (1966) by equilibrating binary sodium silicate melts with mixtures of nitrogen,
148
Backnaes &
-8
-6
-4
-2
Deubener
0
2
4
6
ANNO Figure 2. Equilibrium constants for sulfide reaction Equation (5) (dashed lines) and sulfate reaction Equation (6) (solid lines) as a function of oxygen fugacity (relative to the log/o 2 of the nickel-nickel oxide equilibrium ANNO). Data: 39.4 S i O r 4 3 . 3 CaO-17.3 Al 2 0,-melts at 1500 °C: Symbols: Black full circles, Fincham and Richardson (1954): Si0 2 -Na 2 0-melts at 1250 °C: Open symbols, circle = trisilicate, square = disilicate, star = metasilicate, Nagashima and Katsura (1973): Lines are intended as a visual guide.
hydrogen and sulfur dioxide gases. At relative high oxygen partial pressures (lO^-lO - 4 bar), with sulfur dioxide gas as the sulfur source and sulfate being the exclusive sulfur species in the melt, the dissolution mechanism was described. Using different Na 2 0/Si0 2 ratios in the range from 1.5 to 4, Holmquist (1966) demonstrated that the slope of logS vs. log (PSo2 x ^o21/2) was close to unity at sulfur fugacities near to saturation, which confirmed the assumption that sulfur dissolves exclusively as single S0 4 2 - groups in the glass network under highly oxidized conditions (Fig. 3). The dependence of sulfur retention on oxygen fugacity is addressed in glass technology commonly by using redox numbers based on the refining reaction of carbon and sodium sulfate with the silicate melt and the chemical oxygen demand to oxidize carbon entirely to carbon dioxide. Empirical factors were introduced to evaluate the various raw materials according to their ability to influence the redox state of the batch as a whole. Two different redox number concepts are frequently used: Glass redox number (GRN) by Simpson and Myers (1978) and chemical oxygen demand (COD) by Manring and Diken (1980). Details on the calculation of different redox numbers can be found in Miiller-Simon (2011, this volume) and consequences for coloring glasses are shown in Falcone et al. (2011, this volume). Since industrial redox numbers are calculated on the basis of relative proportions of constituent raw material, they are not equivalent to the oxygen fugacity in the melt. However, empirical relations between redox numbers and P 0 l have been introduced (Miiller-Simon 1999) using in-situ measurements of oxygen partial pressures during tank operation. Simpson and Myers (1978) added calumite slags (sulfide-bearing earth alkaline alumosilicate glass) as a reducing agent to highly oxidized multi-component soda-lime silicate batches
Sulfur
Solubility
in Silicate Melts at Near-Atmospheric
Pressure
149
1
-6
-5 f
°g(pS02 *
-4 p
-3
-2
o 2 5 N N O ) , w h e n sulfur is dissolved in the melt structure as sulfate, and under reducing condition ( f 0 l < N N O ) when sulfide is the dominant sulfur species in the melt. This behavior f o r m s a typical V-shaped equilibrium solubility curve between a sulfur-bearing gas or gas mixture and a melt. However, for most data reported in the literature, deviations f r o m the expected trend for sulfide and sulfate solubility, i.e., slopes ¿(log S)/ 1 bar is based on the computation of the equilibrium constant shift with P for any specific oxide-sulfide and oxide-sulfate exchange. In the case of exchanges of the type of Equation (58a), we have for example: In
=
+
1
- - J - J (AVm + A Vfl)dP Kl
(70)
where subscripts m and/? refer melt and fluid (or gas) components, respectively. Details on the data used and the strategies applied to reduce the number of unconstrained parameters can be found in Moretti and Ottonello (2005) and in Moretti and Baker (2008). The success of this thermodynamic model is displayed through the comparison of the modeled and measured sulfide capacity, C s , and sulfate capacity, CSo4, as defined by Equations (17) and (18) (Fig. 10), and its capability to assess sulfur solubility in both relatively simple systems, such as metallurgical slags, and complex systems, such as natural silicate melts (Fig. 11). For these reasons, the model can be used to define the compositional dependencies of the sulfide and sulfate capacities of different hydrous magmatic compositions (Fig. 12). From the Cs and Cso4 information provided by such diagrams, it is possible to relate sulfur mass partitioning with gas fugacities and provide a full characterization of the system by adopting the following relationship: ^silicate melt ^silicate melt ^silicatemelt s > ,—1/2 ,• I /2 s' total sulfide + ^sulfate ~ S . / 0 /s2 + S 0 . / 0 / S L
2
L
4
2
2
r3/2 ,• I /2
I'
i1 \ \ i
)
where in this case the sulfur concentrations and the Cs and Csc,4 are expressed in weight percent. This equation can be used to estimate the total sulfur concentration in melts, or as oxybarometer, or as a sulfur barometer, depending on the needs and information available. Moretti and Baker (2008) built upon the model of Moretti and Ottonello (2003a,b, 2005) to calculate the saturation of silicate melts with sulfide (either molten or crystalline). They calibrated their model for sulfide saturation using all available data in the literature and demonstrated possible complexities of sulfur's behavior in magmatic systems (discussed below). In addition, they stressed that some of the complexities to be expected in magmatic systems may not be discerned when using simple, empirical models for the saturation of silicate melts with sulfides. They also updated the equation of Bockrath et al. (2004) that calculates the sulfur fugacity at sulfide-saturated conditions. Unfortunately, no similar thermodynamic model for the saturation of magmatic-composition melts with sulfate is currently available. Software for the application of the models of Moretti and Ottonello (2005) and Moretti and Baker (2008) are available from R. Moretti.
Modeling the Solubility of Sulfur in Magmas
201
Figure 10. Comparison of the calculated C s , in weight percent, defined by Equation (17), for sulfide (Fig. 10a), and the calculated C S 0 4 , in weight percent, defined by Equation (18), for sulfate (Fig. 10b), with the measured values using the conjugated Toop-Samis-Grjotheim model of Moretti and Ottonello (2003a,b; 2005). Note that the agreement between measurements and model calculations is almost always within 10%. (Drawn after Moretti and Ottonello 2005.)
Although the polymeric model used by Moretti and Ottonello (2003a,b, 2005) is but one of many ways to model silicate melt thermodynamics, it provides a useful formalism to constrain reactions and interaction parameters. Margules-like approaches rarely provide the correct interaction terms for the same component in both compositionally simple (slags) and complex (natural melts) systems. But, applying the polymerization model allowed Moretti and Ottonello (2003a,b, 2005) to find the best solutions for the dissolution of sulfur (as well as other elements) in limiting binaries (e.g., Si0 2 -Ca0) and extrapolate them to more complex systems.
202
Baker & Moretti S i 0 2 - M n 0 C a O , T = 1500°C
5000
C a O
D B 3 synthetic basalt
4000 •g
3000 •
Q. Q.
n
2000 1000 -
0 -8
-6
-4
I o g f 0 2 - logfS 2 5000 H 4000 -
SiOj-MgO-CaO, T = 1500' : C CaO
ç
MORB
3000 -
Q. Q.
m
2000 -
-6
-4
l o g f 0 2 - logfS 2
Cape Vogel andeslte
2000 Ç
1500 -
Q. Q.
m
1000 500
Si0 2 C a O T i 0 2 , T - 1500°C
0
CaO
-8
-6
l o g f 0 2 - logfS 2 2000 • h y d r o u s daclte 1500 •
â
1000 •
to 500 •
-14
-13
-12
Iogf02 - logfS2
Figure 11. Solubility of sulfur in silicate melts as sulfide: predictions from the model presented by Moretti and Ottonello (2003a,b, 2005) vs. experiments for both simple slags of metallurgical interest (panels a to c) and natural melts or their analogs (panels d to g). Experimental data (gray circles) are from Abraham et al. ( 1960) in panel a, Kalyanram et al. ( 1960) in panel b. Brown et al. ( 1982) in panel c, O'Neill and Mavrogenes (2002) for panels d t o / ( g r a y triangles) and from Clemente et al. (2004) in panel g (gray squares and circles). Black diamonds in panels d to g are computations from the Moretti and Ottonello (2005) model; symbols have been connected by a heavy line as a guide for the eye in each panel. Asterisks in panels d t o / a r e computations based on the model of O'Neill and Mavrogenes (2002); the thin line connecting them has been drawn as a guide for the eye in each panel. Panels e to g are modified from Moretti and Ottonello (2005).
Modeling the Solubility of Sulfur in Magmas
203
Figure 12. (a) The sulfide capacity, C s (in wt%) as defined by Equation (17), vs. water concentration in the melt for a water-saturated Kilauea basaltic melt composition at 1050 to 1200 °C (upper 4 curves) and a water-saturated rhyolitic melt at 700 to 900 °C (lower 5 curves) and pressures from 1 atm (0.0 wt% H 2 0 ) to 500 MPa as calculated by the model of Moretti and Ottonello (2005). (b) Sulfate capacity, C S o 4 (in wt%) as defined by Equation (18) vs. water concentration in the melt for a water-saturated Kilauea basaltic melt at 1050 to 1200 °C (lower 4 curves) and a water-saturated rhyolitic melt at 700 to 900 °C (upper 5 curves) and pressures from 1 atm (0.0 wt% H 2 0 ) to 500 MPa, as calculated by the model of Moretti and Ottonello (2005). The subvertical dashed lines in both figures indicate the pressures, in MPa. Water contents calculated with the model of Papale et al. (2006). Please see text for further discussion. (Drawn after Moretti and Ottonello 2005.)
GEOLOGICAL APPLICATIONS The relative solubility (or partitioning) of sulfur between a fluid or gas phase and a silicate melt, as well as the saturation of the system with either a sulfide (liquid or crystalline) or a sulfate, depend upon pressure, temperature, fo2,fs2 and composition. Despite the lack of critical data needed for modeling the behavior of sulfur (e.g., hydrous, basic and intermediate melt
204
Baker & Moretti
compositions under conditions of known oxygen and sulfur fugacities), after half a century of research we are to the point where quantitative, or at least semi-quantitative, models can be constructed that constrain the evolution of sulfur in magmatic systems. When complete compositional and fugacity information is available for a magmatic system the behavior of sulfur can be more-or-less easily modeled. However, it is rare that there is enough data for a backward model of sulfur in the magmatic system. Instead, forward models are typically created and matched with the rocks in hand. A recent example of forward modeling is presented in Moretti and Baker (2008) who investigated the effects of intensive variables on sulfide saturation in a generic rhyolitic melt with 0.5% H 2 0 at 800 °C, a rhyolitic melt at water-saturated conditions and 800 °C and a basaltic melt with 0.5 wt% H 2 0 at 1200 °C, all at crustal conditions. The oxygen fugacity width of the transition region between S2~ and S 6+ is similar for all combinations of melts and water concentrations modeled by Moretti and Baker (2008). However, the oxygen fugacity at which the calculated sulfate species becomes the dominant species in the melt changes by 2 orders of magnitude as composition, pressure, temperature and water concentration change (Fig. 13). This point occurs at oxygen fugacities between approximately ANNO-O.5 at 100 MPa and ANNO+O.25 at 500 MPa for both the basalt at 1200 °C and water-poor rhyolite at 800 °C. Whereas for the water-saturated rhyolite at 800 °C the change occurs at ANNO+O.5 at 100 MPa and ANNO+2 at 500 MPa. These differences are due to compositional effects on the activities of the sulfide and sulfate species dissolved in the melt. The compositional, pressure, and temperature effects demonstrated in Figure 13 are a caution on the extent to which we can rely on any general correlation between the ratio of sulfate to sulfide in the melt as a measure of oxygen fugacity during magmatic evolution (e.g., Fig. 8). The SCSS for silicate melts changes significantly near the NNO buffer (Fig. 14). Below this oxygen fugacity the saturating concentration of sulfur in the melt is constant and increases with increasing water concentration at constant temperature, as well as with decreasing silica concentration and increasing temperature, as discussed previously in the review of experimental
1.0 Basalt, 0.5%H 2 0, 100 MPa, 12(
0.9 0.8
"2
g, -2.5 O) O
Q
-3.5 -
B a s a l t i c m e l t in e q u i l i b r i u m w i t h f l u i d 10 M P a , 1 4 0 0 K after Moretti etal. (2003)
0
A NNO Figure 15. Example of multicomponent gas-melt saturation (Moretti et al. 2003) of a tholeitiic melt at 10 MPa, 1400 K, under progressively oxidizing conditions and for total (exsolved + dissolved) volatile contents of 3 wt% H2OtMal, 1 wt% CO 2 t0tal and 0.5 wt% S t0Bl . (a) The concentration of sulfide, sulfate and total dissolved sulfur in the melt are plotted as a function of/o 2 , expressed as ANNO. Note the lack of any observable sulfur concentration minimum, unlike what is seen in Figure 2, because the fSOl in this case varies with/o 2 . (b) The concentration of sulfur dissolved in the melt normalized to the/ sc > 2 as a function of foY When the data are plotted in this manner the sulfur concentration in the melt calculated by the model of Moretti et al. (2003) respects the theoretical slopes of the hypothesized reactions for sulfur dissolution in silicate melts (Fig. 2). (Drawn after Moretti et al. 2003.)
208
Baker &
Moretti
Although we must acknowledge the current limitations of all the models investigated, they are still useful tools for petrogenetic and volcanic investigations, as many of the papers referenced in this contribution demonstrate. In the latter role, the model of Moretti and Ottonello (2003a,b; 2005) was one of the tools used by Aiuppa et al. (2007) to forecast volcanic eruptions at Mt. Etna, Italy. The interpretation of sulfur isotope data in magmatic systems (Marini et al. 2011, this volume) is another good example of the importance that composition-dependent models have in studying the saturation and speciation properties of sulfur in melts. The models for the SCSS and SCAS provide constraints on the maximum amount of sulfur that can be dissolved in magmatic melts. Any additional sulfur (the "excess sulfur"), often necessary to balance the observed sulfur degassing of volcanoes with the measured sulfur concentrations in quenched glasses, must therefore have been stored in another phase (usually considered to be the gas or fluid phase) of the volcanic system. The "excess sulfur", above that which can be stored in the melt, can be used to estimate the mass of the gas phase present at depth. Thus, constraints on the possible masses of gases trapped in volcanic systems and the potential mass of sulfur degassed from volcanoes into the atmosphere can be assessed using models for the SCSS and the SCAS. Understanding the conditions at which a magma becomes saturated with a sulfide phase is directly applicable to models for the formation of ore deposits and therefore to our search for these resources (Barnes 1979; Naldrett 1989; Simon and Ripley 2011, this volume). Knowledge of the SCSS for magmas of differing composition can be applied to the search for high-temperature, sulfide-bearing mineral deposits, particularly for magmatic sulfide deposits such as those associated with mafic magmatic systems (e.g., Thakurta et al. 2008). In particular, models for the SCSS may play a key role in the search for Ni-Cu ore deposits, which produce not only these two metals but also more-valuable platinum group metals (e.g., Koek et al. 2010). Combining models for the SCSS with those for the exsolution of volatiles (e.g., Papale et al. 2006) can predict whether ore metals would be found associated with sulfides trapped within the magmatic system or if they would have been transported away in the fluid phase (Barnes 1979). Such knowledge can provide a valuable guide in the search for ore deposits.
CONCLUSIONS We characterize our current understanding of the behavior of sulfur in silicate melts of magmatic compositions as "good." We have a basic understanding of the mechanisms of sulfur dissolution in compositionally complex silicate melts and a choice of both empirical and thermodynamic models for the calculation of the SCSS and the SCAS. However, none of the models are perfect, and, in general, their accuracies are approximately ± 10% (relative). Nevertheless, this level of accuracy is sufficient for many petrological investigations and can provide constraints on the evolution of sulfur in magmatic systems. There is no doubt the models and their ability to predict the saturation of silicate melts with sulfur-rich phases will improve in the future. However these improvements require additional experimental data, particularly in the critical/o 2 range near the NNO buffer where the speciation of dissolved sulfur changes from S2~ to S 6+ with increasing f0r In particular, systematic experiments need to be performed over a wide range of melt and fluid compositions (including variations in water and halogen concentrations), temperatures and pressures, with controlled fugacities of oxygen, sulfur and water. Such experiments are technologically challenging and few laboratories have the resources to perform such experiments, but they are critical in the advancement of our understanding of sulfur in magmatic systems. Other technologically challenging experiments involve direct determination of basic thermodynamic properties (calorimetric and volumetric properties) of sulfur species in melts. However, the low concentrations of the saturation limits imposed by sulfide (either crystalline or liquid) and sulfate (anhydrite) precipitation represent a major obstacle in this endeavor.
Modeling the Solubility of Sulfur in Magmas
209
Sulfur is a key element whose behavior in magmatic systems must be understood because of its importance in ore deposit formation, volcanic eruption prediction, and global climate change. The models discussed in this contribution, as well as future models, will contribute to this understanding and allow us to better constrain sulfur's role as we search for the increasing resources our society needs, seek better techniques to predict hazardous volcanic eruptions, and improve our understanding of the impact of volcanic degassing on global climate change.
ACKNOWLEDGMENTS Many thanks go to H. Behrens and J.D. Webster for their excellent reviews of an earlier version of this manuscript that improved it significantly. RM acknowledges financial support from MIUR (Italian Government) in the frame of the PRIN 2007 project (INGV-Naples research Unit). Support for D.R.B. research has come from his NSERC Discovery grant; this paper was written while D.R.B. on sabbatical at Sincrotrone Trieste who graciously provided both hospitality and a stimulating environment for work.
REFERENCES Abraham KP, Davies MW, Richardson FD (1960) Sulphide capacities of silicate melts. J Iron Steel Inst 196:309-312 Abraham KP, Richardson FD (1960) Sulphide capacities of silicate melts, Part II. J Iron Steel Inst 196:313-317 Ahmed AA, Sharaf NA, Condrate RA Sr (1997) Raman microprobe investigation of sulphur-doped alkali borate glasses. J Non-Cryst Solids 210:59-69 Aiuppa A, Moretti R, Federico C, Guidice G, Gurrieri S, Liuzzo M, Papale P, Shinohara H, Valenza M (2007) Forecasting Etna eruptions by real-time observation of volcanic gas composition. Geology 35:1115-1118 Andres RJ, Kasgnoc AD (1998) A time-averaged inventory of subaerial volcanic sulfur emissions. J Geophys Res 103:25251-25261 Ariskin AA, Bychkov KA, Danyushevsky LV, Barmina GS (2008) A model of S solubility in basaltic melts at 1 atm. Geochim Cosmochim Acta 72: Supplement 1, A31 Ariskin AA, Polyakov VB (2008) Chemical interactions and configurational disorder in silicate melts. Geochem Inter 46:429-447 Backnaes L, Deubener J (2011) Experimental studies on sulfur solubility in silicate melts at near-atmospheric pressure. Rev Mineral Geochem 73:143-165 Barnes HL (ed) (1979) Geochemistry of Hydrothermal Ore Deposits. 2nd ed. Wiley, New York Bockrath C, Ballhaus C, Holzhied A (2004) Stabilities of laurite RuS 2 and monosulfide liquid solution at magmatic temperature. Chem Geol 208:265-271 Botcharnikov RE, Behrens H, Holtz F, Koepke J, Sato H (2004) Sulfur and chlorine solubility in Mt. Unzen rhyodacitic melt at 850 °C and 200 MPa. Chem Geol 213:207-225 Bradbury JW (1983) Pyrrhotite Solubility in Hydrous Albite Melts. Ph. D. dissertation, Penn. State Univ. Brown SD, Roxburgh RJ, Ghita I, Bell HB (1982) Sulphide capacity of titania-containing slags. Ironmaking and Steelmaking 9:163-167 Buchanan DL, Nolan J (1979) Solubility of sulfur and sulfide immiscibility in synthetic tholeiitic melts and the relevance to Bushveld-complex rocks. Can Mineral 17:483-494 Buchanan DL, Nolan J, Wilkinson N, de Villiers JR (1983) An experimental investigation of sulphur solubility as a function of temperature in synthetic silicate melts. Geol Soc South Africa Special Pub 7:383-391 Burnham C W (1979). The importance of volatiles constituents. In: The Evolution of the Igneous Rocks: Fiftieth Anniversary Perspectives. Yoder HS (ed) Princeton University Press, Princeton, p 439-482 Carmichael ISE (1991) The redox states of basic and silicic magmas: a reflection of their source regions? Contrib Mineral Petrol 106: 29-141 Carroll MR, Rutherford MJ (1985) Sulfide and sulfate saturation in hydrous silicate melts. J Geophys Res 90:601-612 Carroll MR, Rutherford MJ (1987) The stability of igneous anhydrite: Experimental results and implications for sulfur behavior in the 1982 El Chichon trachyandesite and other evolved magmas. J Petrol 28:781-801 Carroll MR, Rutherford MJ (1988) Sulfur speciation in hydrous experimental glasses of varying oxidation state: results from measured wavelength shifts of sulfur X-rays. Am Mineral 73:845-849 Clemente B, Scaillet B, Pichavant M (2004) The solubility of sulfur in hydrous rhyolitic melts. J Petrol 45:21712196
210
Baker & Moretti
Close WP, Tillman JF (1969) Chemical analysis of some elements in oxidation-reduction equilibria in silicate glasses. Glass Technol 10:134-136 Costa F, Scaillet B, Pichavant M (2004) Penological and experimental constraints on the pre-eruption conditions of Holocene dacite from Valcan San Pedro (36°S, Chilean Andes) and the importance of sulphur in silicic subduction-related magmas. J Petrol 45:855-881 Courtillot VE, Rennes PR (2003) On the ages of flood basalt events. C R Geosci 335:113-140 Crutzen PJ (2006) Albedo enhancement by stratospheric sulfur injections: A contribution to resolve a policy dilemma? Climate Change 77:211-220, doi:10.1007/sl0584-006-9101-y Danckwerth PA, Hess PC, Rutherford MJ (1979) The solubility of sulfur in high-Ti0 2 mare basalts. Proc. 10th Lunar Planet. Sci. Conf:517-530 Darken LS, Larsen BM (1942) Distribution of manganese and of sulphur between slag and metal in the openhearth furnace. Trans Am Inst Mining Metall Eng 150:87-109 Duffy JA (1996) Optical basicity: A practical acid-base theory for oxides and oxyanions. J Chem Education 73:1138-1142 Erwin DH (2006) Extinction: How Life on Earth Nearly Ended 250 Million Years Ago. Princeton University Press, Princeton Falcone R, Ceola S, Daneo A, Maurina S (2011) The role of sulfur compounds in coloring and melting kinetics of industrial glass. Rev Mineral Geochem 73:113-141 Fedele L, Orsi G, Giaccio B, Isaia R, Scaillet B (2003) The Campanian Ignimbrite eruption, Heinrich Event 4, and Palaeolithic change in Europe: A high-resolution investigation. In: Volcanism and the Earth's Atmosphere. Robock A, Oppenheimer C (eds) AGU Monograph 139, p 301-325 Fincham CJ, Richardson FD (1954) The behavior of sulfur in silicate and aluminate melts. Proc R Soc Lond 223A:40-61 Flood H, Forland HT (1947) The acidic and basic properties of oxides. Acta Chem Scand 1:592-604 Flood H, Grjotheim T (1952) Thermodynamic calculation of slag equilibria. J Iron Steel Inst 171:64-80 Fraser DG (1975) An investigation of some long-chain oxi-acid systems. Ph.D. thesis. University of Oxford. Fraser DG (1977) Thermodynamic properties of silicate melts. In: Thermodynamics in Geology. Fraser DG (ed) Reidel, Berlin, p 300-325 Froese E, Gunter AE (1976) A note on the pyrrhotite-sulfur vapor equilibrium. Econ Geol 71:1589-1594 Frost BR (1991) Introduction to oxygen fugacity and its petrologic importance. Rev Mineral 25:1-9 Ghiorso MS, Carmichael ISE, Rivers ML, Sack RO (1983) The Gibbs free energy of mixing of natural silicate liquids; an expanded regular solution approximation for the calculation of magmatic intensive variables. Contrib Mineral Petrol 84:107-145 Graf HF, Langmann B, Feichter J (1998) The contribution of Earth degassing to atmosphere sulfur budget. Chem Geol 147:131-145 Halmer HH, Schmincke H-U, Graf H-F (2002) The annual volcanic gas input into the atmosphere, in particular into the stratosphere: a global data set for the past 100 years. J Volcan Geotherm Res 115:511-528 Haughton DR, Roeder PL, Skinner BJ (1974) Solubility of sulfur in mafic magmas. Econ Geol 69:451-467 Helz GR, Wyllie PJ (1979) Liquidus relationships in the system CaC0 3 -Ca(0H) 2 -CaS and the solubility of sulfur in carbonatite magmas. Geochim Cosmochim Acta 43:259-265 Helz RT (1977) Determination of the P-T dependence of the first appearance of FeS-rich liquid in natural basalts to 20 kb. EOS Trans, Am Geophys Union 58:523 Holzheid A, Grove TL (2002) Sulfur saturation limits in silicate melts and their implications for core formation scenarios for terrestrial planets. Am Mineral 87:227-237 Huang W-L, Williams RJ (1980) Melting relations of portions of the system Fe-S-Si-O to 32 kb with implications to the nature of the mantle-core boundary. Lunar Planet Sci XI: 486-488 Jacobsson S, Oskarsson N (1991) The system C-O in equilibrium with graphite at high pressure and temperature, An experimental study. Geochim Cosmochim Acta 58:9-17 Jugo P J, Luth RW, Richards JP (2005b) Experimental data on the speciation of sulfur as a function of oxygen fugacity in basaltic melts. Geochim Cosmochim Acta 69:497-503 Jugo PJ (2009) Sulfur content at sulfide saturation in oxidized magmas. Geology 37:415-418, doi: 10.1130/ G25527A. Jugo PJ, Luth RW, Richards JP (2005a) An experimental study of the sulfur content in basaltic melts saturated with immiscible sulfide or sulfate liquids at 1300 °C and 1.0 GPa. J Petrol 46:783-798 Kalyanram MR, Macfarlane TG, Bell HB (1960) The activity of calcium oxide in slags in the systems CaOMg0-Al 2 0 3 -Si0 2 at 1500 °C. J Iron Steel Inst 195:58-64 Katsura T, Nagashima S (1974) Solubility of sulfur in some magmas at 1 atmosphere. Geochim Cosmochim Acta 38:517-531 Koek M, Kreuzer OP, Maier WD, Porwal AK, Thompson M, Guj P (2010) A review of the PGM industry, deposit models and exploration practices: Implications for Australia's PGM potential. Resources Policy 35:20-35
Modeling the Solubility of Sulfur in Magmas
211
Konijnendijk WL, Buster JHJM (1977) Raman-scattering measurements of silicate glasses containing sulphate. J Non-Cryst Solids 23:401-418 Kress VC (1997) Magma mixing as a source for Pinatubo sulfur. Nature 389:591-593 Kress VC, Carmichael ISE (1991) The compressibility of silicate liquids containing F e 2 0 3 and the effect of composition, temperature, oxygen fugacity and pressure on their redox states. Contrib Mineral Petrol 108:82-92 Lafage B, Taxil P (1993) Titration of molten soda lime silicate-glasses by square-wave voltammetry. J Electrochem Soc 140:3089-3093 Lehmann J, Nadif M (2011) Interactions between metal and slag melts: steel desulfurization. Rev Mineral Geochem 73:493-511 Li C, Ripley EM (2005) Empirical equations to predict the sulfur content of mafic magmas at sulfide saturation and applications to magmatic sulfide deposits. Mineral Deposit 40:218-230 Li C, Ripley EM (2009) Sulfur contents at sulfide-liquid or anhydrite saturation in silicate melts: Empirical equations and example applications. Econ Geol 104:405-412 Liu Y (2005) Sulfur Concentration at Sulfide Saturation in Anhydrous Silicate Melts at Crustal Conditions. M.Sc. thesis, McGill Univ. Liu Y, Samaha N-T, Baker DR (2007) Sulfur concentration at sulfide saturation (SCSS) in magmatic silicate melts. Geochim Cosmochim Acta 71:1783-1799 Luhr JF (1990) Experimental phase relations of water- and sulfur-saturated arc magmas and the 1982 eruptions of El Chichón volcano. J Petrol 31:1071 -1114 MacLean W H (1969) Liquidus phase relations in the FeS-Fe0-Fe 2 0 3 -Si02 system and their application in geology. Econ Geol 64:865-884 Marini L, Moretti R, Accornero M (2011) Sulfur isotopes in magmatic-hydrothermal systems, melts, and magmas. Rev Mineral Geochem 73:423-492 Markus RS, Baker DR (1989) Sulfur solubility in anhydrous andesitic melts. EOS Trans, Am Geophys Union 70:1402 Matthews SJ, Moncrieff DHS, Carroll M R (1999) Empirical calibration of the sulphur valence oxygen barometer from natural and experimental glasses: Methods and applications. Mineral Mag 63:421-431 Mavrogenes JA, O'Neill HS (1999) The relative effects of pressure, temperature and oxygen fugacity on the solubility of sulfide in mafic magmas. Geochim Cosmochim Acta 63:1173-1180 Métrich N, Clocchiatti R (1996). Sulfur abundance and its speciation in oxidized alkaline melt. Geochim Cosmochim Acta 60:4151-4160 Moretti R (2005) Polymerisation, basicity, oxidation state and their role in ionic modelling of silicate melts, Ann Geophys 48:583-608 Moretti R, Baker DR (2008) Modeling of the interplay o f / 0 2 a n d / S 2 along the FeS-Silicate Melt equilibrium. Chem Geol 256:286-298. doi: 10.1016/j.chemgeo.2008.06.055 Moretti R, Ottonello G (2003a) Polymerization and disproportionation of iron and sulfur in silicate melts: Insights from an optical basicity-based approach. J Non-Cryst Sol 323:111-119 Moretti R, Ottonello G (2003b). A polymeric approach to the sulfide capacity of silicate slags and melts. Metall Mater Trans B 34B:399-410 Moretti R, Ottonello G (2005) Solubility and speciation of sulfur in silicate melts, the conjugated Toop-SamisGrjotheim (CTSFG) model. Geochim Cosmochim Acta 69:801-823 Moretti R, Papale P, Ottonello G (2003) A model for the saturation of C-H-O-S fluids in silicate melts. In: Volcanic Degassing. Oppenheimer C, Pyle DM, Barclay J (eds) Geol Soc London Special Pub 213, London, p 81-101 Moune S, Holtz F, Botcharnikov RE (2009) Sulphur solubility in andesitic to basaltic melts: implications for Hekla volcano. Contrib Mineral Petrol 157:691-707 Miiller-Simon H (2011) Fining of glass melts. Rev Mineral Geochem 73:337-361 Mysen BO, Popp RK (1980) Solubility of sulfur in CaMgSi0 6 and NaAlSi 3 0 8 melts at high pressure and temperature with controlled/0 2 and/S 2 . Am J Sci 280:78-92 Mysen BO, Richet P (2005) Developments in Geochemistry 10: Silicate Glasses and Melts (Properties and Structure). Elsevier, New York Naldrett AJ (1969) A portion of the system Fe-S-O between 900° and 1,080 °C and its application to sulfide ore magmas. J Petrol 10:171-201 Naldrett AJ (1989) Magmatic sulfide deposits. Clarendon Press, Oxford University Press, Oxford Nilsson K, Peach CL (1993) Sulfur speciation, oxidation state and sulfur concentration in backarc magmas. Geochim Cosmochim Acta 57:3807-3813 O'Neill HS, Mavrogenes JA (2002) The sulfide capacity and the sulfur content at sulfide saturation of silicate melts at 1400 °C and 1 bar. J Petrol 43:1049-1087 Ottonello G (2001) Thermodynamic constraints arising from the polymeric approach to silicate slags: the system C a 0 - F e 0 - S i 0 2 as an example. J Non-Cryst Solids 282:72-85
212
Baker & Moretti
Ottonello G (2005) Chemical interactions and configurational disorder in silicate melts. Ann Geophys 48:561581 Ottonello G, Moretti R (2004) Lux-Flood basicity of binary silicate melts. J Phys Chem Solids 65:1609-1614 Ottonello G, Moretti R, Marini L, Vetuschi Zuccolini M (2001). On the oxidation state of iron in silicate melts and glasses: A thermochemical model. Chem Geol 174:157-179 Papale P, Moretti R, Barbato R (2006) The compositional dependence of the saturation surface of H 2 0 + C0 2 fluids in silicate melts. Chem Geol 229:78-95 Parat F, Holtz F, StreckMJ (2011) Sulfur-bearing magmatic accessory minerals. Rev Mineral Geochem 73:285314 Pawlowsky-Glahn V, Egozcue JJ (2006) Compositional data and their analysis: an introduction. In: Compositional Data Analysis in the Geosciences: From Theory to Practice. Buccianti A, Mateu-Figueras G, Pawlowsky-Glahn V (eds) Geol Soc London Spec Pub, 264, London, p 203-206 Pelton AD, Eriksson G, Romero-Serrano A (1993) Calculation of sulfide capacities of multicomponent slags. Metall Trans B 24B:817-825 Poulson SR, Ohmoto H (1990) An evaluation of the solubility of sulfide sulfur in silicate melts from experimental data and natural samples. Chem Geol 85:57-75 Pyare R, Nath P (1986) A simple and rapid spectrophotometric method for determination of sulfite and sulfate in binary sodium-silicate glasses. Glass Tech 1:21-23 Reddy RG, Blander M (1987) Modeling of sulfide capacities of silicate melts. Metall Trans B 18B:591-596 Richardson FD, Fincham CJB (1956) Sulphur in silicate and alumínate slags. J Iron Steel Inst 178:4-15 Rosenqvist T (1951) A thermodynamic study of the reaction CaS + H 2 0 = CaO + H2S and the desulphurization of liquid metals with lime. Trans Am Inst Mining Metall Eng 191:535-540 Ryerson FJ, Watson EB (1987) Rutile saturation in magmas, implications for Ti-Nb-Ta depletion in island-arc basalts. Earth Planet Sci Lett 86:225-239 Scaillet B, MacDonald R (2006) Experimental and thermodynamic constraints on the sulphur yield of peralkaline and peraluminous silicic flood eruptions. J Petrol 47:1413-1437. Scaillet B, Pichavant M (2003) Experimental constraints on volatile abundances in arc magmas and their implications for degassing processes. In: Volcanic Degassing. Oppenheimer C, Pyle DM, Barclay J (eds) Geol Soc London Special Pub 213, London, p 23-52 Scaillet B, Pichavant M (2005) A model of sulphur solubility for hydrous mafic melts: application to the determination of magmatic fluid compositions of Italian volcanoes. Ann Geophys 48:671-698 Self S (2006) The effects and consequences of very large explosive volcanic eruptions. Phil Trans Roy Soc A 364:2073-2097 doi:10.1098/rsta.2006.1814 Shima J, Naldrett AJ (1975) Solubility of sulfur in an ultramafic melt and the relevance of the system Fe-S-O. Econ Geol 70:960-967 Simon AC, Ripley RM (2011) The role of magmatic sulfur in the formation of ore deposits. Rev Mineral Geochem 73:513-578 Smith SJ, Andres R, Conception E, Lurz J (2004) Sulfur Dioxide Emissions 1850-2000: Methods and Results. Pacific Northwest National Laboratory Research Report 14537 Stevenson DS, Johnson CE, Collins WJ, Derwent RG (2003) The tropospheric sulphur cycle and the role of volcanic S0 2 . In: Volcanic Degassing. Oppenheimer C, Pyle DM, Barclay J (eds) Geol Soc London Special Pub 213, London, p 295-305 Stoiber R, Williams SN, Huebert B (1987) Annual contribution of sulfur dioxide to the atmosphere by volcanoes. J Vole Geotherm Res 33:1-8 Symonds RB, Rose WI, Bluth GS, Gerlach TM (1994) Volcanic gas studies, methods, results and applications. Rev Mineralogy 30:1-66 Temkin M (1945) Mixtures of fused salts as ionic solutions. Acta Phys Chim USSR 20:411-420 Thakurta J, Ripley EM, Li C (2008) Geochemical constraints on the origin of sulfide mineralization in the Duke Island Complex, Southeastern Alaska. Geochem Geophys Geosys 9:Q07003 Tilquin JY, Duveiller P, Gilbert J, Claes P (1997) Electrochemical behaviour of sulfate in sodium silicates at 1000 degrees C. Electrochim Acta 42:2339-2346 Toop GW, Samis CS (1962) Activities of ions in silicate melts. Trans Metall Soc AIME 224:878-887 Wallace P, Carmichael ISE (1992) Sulfur in basaltic magmas. Geochim Cosmochim Acta 56:1863-1874 Wallace PJ (2005) Volátiles in subduction zone magmas, concentrations and fluxes based on melt inclusion and volcanic gas data. J Volcanol Geotherm Res 140:217-240 Wallace PJ, Carmichael ISE (1994) S speciation in submarine basaltic glasses as determined by measurements SKa X-ray wavelength shifts. Am Mineral 79:161-167 Ward PL (2009) Sulfur dioxide initiates global change in four ways. Thin Solid Films 517:3188-3203 Webster J D, Sintoni M F, De Vivo B (2009). The partitioning behavior of CI, S, and H 2 0 in aqueous vapor±saline-liquid saturated phonolitic and trachytic melts at 200 MPa. Chem Geol 263:19-36. Webster JD, Botcharnikov RE (2011) Distribution of sulfur between melt and fluid in S-O-H-C-Cl-bearing magmatic systems at shallow crustal pressures and temperatures. Rev Mineral Geochem 73:247-283
Modeling the Solubility of Sulfur in Magmas
213
Wendlandt RF (1982) Sulfide saturation of basalt and andesite melts at high pressures and temperatures. Am Mineral 67:877-885 Wilke M, Jugo PJ, Klimm K, Susini J, Botcharnikov R, Kohn SC, Janousch M (2008) The origin of S 4 + detected in silicate glasses by XANES. Am Mineral 93:235-240 Wilke M, Klimm K, Kohn SC (2011) Spectroscopic studies on sulfur speciation in synthetic and natural glasses. Rev Mineral Geochem 73:41-78 Winther KT, Watson EB, Korenowski GM (1998) Magmatic sulfur compounds and sulfur diffusion in albite melt at 1 G P a a n d 1300-1500 °C. Am Mineral 83:1141-1151 Young RW, Duffy JA, Hassall GJ, Zu Z (1992) Use of optical basicity concept for determining phosphorus and sulphur slag-metal partitions. Ironmaking Steelmaking 19:201-219
8
Reviews in Mineralogy & Geochemistry Vol. 73 pp. 215-246, 2011 Copyright © Mineralogical Society of America
The Sulfur Budget in Magmas: Evidence from Melt Inclusions, Submarine Glasses, and Volcanic Gas Emissions Paul J. Wallace Department of Geological Sciences, University of Oregon Eugene, Oregon 97403-1272, U.S.A. pwallace @ uoregon. edu
Marie Edmonds Department of Earth Sciences University of Cambridge Cambridge, CB2 3EQ, United Kingdom medm06 @ esc.cam.ac.uk
INTRODUCTION The major magmatic volatile components—H 2 0, C0 2 , S, CI, andF—play an important role in the formation, evolution, and eruption of magma. Knowledge of magmatic concentrations and fluxes of these volatiles is thus important for understanding explosive eruptive behavior of volcanoes, recycling of volatiles in subduction zones, formation of magmatic-hydrothermal ore deposits, fluxes of volcanic gases to Earth's atmosphere, and potential climatic impacts of large volcanic eruptions. Over the past 30 years, new analytical techniques for measuring volatiles in melt inclusions and glasses from volcanic rocks and new developments in remote sensing technology used for quantifying volcanic emissions have led to major advances in our understanding of volatiles in magmatic systems and their fluxes from Earth's mantle to the crust and hydrosphere. Sulfur plays a particularly important role in many of the processes noted above because it affects partitioning of metals into sulfide phases or vapor in magmas during crustal storage, and when released to the atmosphere, it forms sulfuric acid aerosol droplets that catalyze ozone destruction, influences other aspects of atmospheric chemistry, and blocks incoming solar radiation. In addition, S may play a role in causing oxidation of the mantle wedge above subduction zones (Kelley and Cottrell 2009). In silicate melts, the solubility behavior, activitycomposition relations, and vapor-melt partitioning of S are complex due to multiple valence states and species (S2~, S 6+ in melt; H 2 S, S2, S0 2 , S0 3 in vapor) and the occurrence of nonvolatile S-rich phases (immiscible Fe-S-O liquid, pyrrhotite, monosulfide and intermediate solid solutions, anhydrite). Sulfur dioxide (S0 2 ) is the easiest of the main magmatic volatiles to measure in volcanic plumes using ground- and satellite-based remote sensing techniques because of its relatively high concentration in volcanic plumes relative to background values. More recently, techniques for measuring H 2 S in volcanic plumes have been developed (e.g., McGee et al. 2001). There is now a wealth of data on S0 2 fluxes from active volcanoes based on remote sensing techniques (see Oppenheimer et al. 2011, this volume). These data have led to a long-standing puzzle, 1529-6466/11/0073-0008S05.00
DOI: 10.2138/rmg.2011.73.8
216
Wallace & Edmonds
known as the excess sulfur problem, concerning S in magmatic systems: concentrations of dissolved S in magmas before eruption, as estimated from melt inclusion data, are typically far too low to account for the total mass of S 0 2 released during the eruption as measured by remote sensing techniques (Stoiber and Jepson 1973; Rose et al. 1982; Andres et al. 1991; Wallace 2001; Shinohara 2008). The likely cause of this excess S problem is the presence of an exsolved C-O-H-S vapor phase in the magma before the time of eruption (Anderson 1975; Luhr et al. 1984; Andres et al. 1991; Lowenstern 1993; Gerlach et al. 1994, 1996; Gerlach and McGee 1994; Wallace and Gerlach 1994; Giggenbach 1997; Wallace 2001; Scaillet and Pichavant 2003; Scaillet et al. 2003; Shinohara 2008). As a result, eruptions of silicic magma can release large amounts of S 0 2 derived from pre-eruptive exsolved vapor, despite the fact that such magmas generally have low concentrations of dissolved S (see also Baker and Moretti 2011, this volume). In this chapter, we review the concentration, solubility controls, and degassing behavior of S in magmas from different tectonic environments, with an emphasis on subduction-zone magmatism. We focus on the following major questions: 1.
What are the concentrations of S in magmas across the spectrum from basalt to rhyolite, and what do the variations tell us about S losses to sulfide or sulfate immiscible melts or minerals or to a vapor phase during magma differentiation?
2.
Given the common occurrence of excess S emissions from erupting volcanoes, how do the large mass fractions of vapor form in magma and, specifically, what is the role of mafic magma recharge in the underlying magmatic system?
3.
How can we best use volcanic gas composition to better understand the partitioning behavior of sulfur between melt and vapor?
4.
How do S and magma redox state affect the partitioning of metals during partial melting in the mantle, sulfide fractionation during magma transit through the crust, and exsolution of a vapor phase, and how do these relate to the formation of magmatichydrothermal ore deposits?
5.
What do the higher S contents in arc basaltic magmas compared to magmas in other tectonic environments tell us about S recycling in subduction zones?
SULFUR CONCENTRATIONS IN MAGMAS Information on the S and other volatile contents of magmas comes primarily from two types of samples: submarine glassy pillow rims and melt inclusions trapped in phenocrysts. Matrix glasses from subaerially erupted samples can also be analyzed, but these are always strongly degassed and provide no real information on magmatic concentrations except, perhaps, for highly soluble volatiles like F. For example, subaerial matrix glasses contain 800 ppm S (see below). Exceptions to this might occur when sulfur diffusion into bubbles is inhibited due to kinetic factors such as during explosive eruptions with very high magma ascent rates, for example (data on the diffusivity of S in silicate melts can be found in Baker et al. 2005, Freda et al. 2005, and Behrens and Stelling 2011, this volume). Submarine pillow basalts, by contrast, are commonly quenched at a high enough hydrostatic pressure to inhibit degassing of S from the glassy, rapidly quenched pillow rims (Moore and Fabbi 1971; Dixon et al. 1991). However, during shallow-water eruptions and even during deep-water eruption of H 2 0-rich magma, S can be partially to strongly degassed (e.g., Davis et al. 1991). For H 2 0-poor MORB and Hawaiian tholeiite, degassing of S only occurs at water depths < ~1000 m.
The Sulfur Budget in Magmas
217
Melt inclusions represent small volumes of silicate melt trapped at pressure inside of growing phenocrysts. In principle, providing they remain sealed during eruption, the host crystal acts like a tiny pressure vessel to keep the inclusion at relatively high pressure so that exsolution of volátiles does not occur. However, melt inclusion data can be complicated in some cases by either post-entrapment effects or the fact that inclusions may be trapped at middle- to upper-crustal pressures after some degassing of melt has already occurred (Lowenstern 1995; Métrich and Wallace 2008). The main post-entrapment effect of concern for S is that diffusive exchange between melt and olivine often causes a decrease in the FeO T content of the melt inclusion (Danyushevsky et al. 2000), and this can potentially cause exsolution of a sulfide globule in the inclusion because of decreased solubility of S in the silicate melt (Danyushevsky et al. 2002). Post-entrapment changes in oxygen fugacity may also occur (Gaetani et al. 2010), and this could potentially change S speciation in a melt inclusion or cause a sulfide globule to either exsolve or dissolve. Recognizing the effects of partial degassing before inclusion trapping will be discussed below. Complementing the analytical data on pillow rim glasses and melt inclusions are numerous experimental studies on the solubility and speciation of S under a wide range of conditions, and these experiments are valuable for understanding variations of S in natural samples. Analytical techniques for measuring S concentration and speciation in melt inclusions and glassy pillow rinds are described in Métrich and Wallace (2008), Ripley et al. (2011, this volume) and Wilke et al. (2011, this volume). MORB pillow rim glasses and melt inclusions contain ~800-1300 ppm S at 8-10 wt% FeO T , and the S contents increase with increasing FeO T up to ~2000-2400 ppm S at 15-16 wt% FeO T (Fig. 1). This correlation is caused by the effect of melt Fe in increasing the solubility of S in silicate melts (Mathez 1976; Wallace and Carmichael 1992; O'Neill and Mavrogenes 2002; Liu et al. 2007; Baker and Moretti 2011, this volume; Ebel 2011, this volume). At the relatively low oxygen fugacities of MORB magmas (
Q. Q. W
/
•
fQt
1 y »
•
1
1
Sulfide saturation
!
1 1 1 2 3 H 2 0 (wt%) in melt
1— 1 2 3 H 2 0 (wt%) in melt
Figure 6. Variation of H 2 0 and S concentrations in melt inclusions from (A) Irazii (Benjamin et al. 2007) and Arenal (Wade et al. 2006) and (B) Etna (Spilliaert et al. 2006a). Sulfur-degassing paths were calculated based on the approach in Sisson and Layne (1993), which uses the relationship between K 2 0 and H 2 0 to calculate the proportion of H 2 0 in the separating assemblage of crystals and bubbles and assumes no fractionation of K 2 0 . The S-degassing paths were calculated using £ ) s ™ P 0 I melt = 1 1 0 for Irazii and 70 for Arenal. Etna data include olivine-hosted melt inclusions from samples of the 2002 flank eruption (filled circles) and three lava fountains in 2000 (open squares). The pressure at which S degassing begins is constrained from the C 0 2 and H 2 0 contents of the melt inclusions. For closed-system degassing, the S decrease is consistent with £)s™p01 melt values ranging from 0 at higher pressures to 60 at lower pressures (Spilliaert et al. 2006a). Figure is modified from Metrich and Wallace (2008).
The Sulfur
Budget in
225
Magmas
Botcharnikov 2011, this volume). At all of these volcanoes, S is dissolved in melt primarily as S 6+ based on measurements of SKa wavelengths of the glasses. The pressures for S degassing are far higher than the low pressure of S exsolution (< 10 MPa) reported for submarine basalts (e.g., Dixon et al. 1991), which contain S mainly as S2~ because of their lower The evolution of S and H 2 0 during decompression depends on magma ascent rate and degassing conditions (open vs. closed system). Changes in redox state towards more reduced conditions can drive the melt to sulfide saturation during late stage crystallization at shallow depth, and this affects the S degassing path. Faster magma ascent inhibits these processes until low pressure, causing S degassing to be controlled by vapor-melt partitioning. In cogenetic basaltic and trachybasaltic magmas at Etna, the S content of sulfide-saturated melt inclusions trapped in Fo < 75 olivine representative of the shallow, partly degassed magma are only half that of sulfide-free inclusions in Fo ~ 80 olivine that crystallized during fast ascent of basaltic magma under dominantly closed-system conditions (Spilliaert et al. 2006a). In contrast to the differences in S content, the H 2 0 contents of the different inclusions are comparable (~1.5 wt%). Relations between S, K 2 0, and H 2 0 can be used to infer and quantify S loss by degassing because S should behave like an incompatible element in the absence of any degassing or formation of a S-rich phase (Fig. 7). Variations in S/K 2 0 in cogenetic suites of melt inclusions show evidence for S loss by degassing simultaneous with fractional crystallization of melt. The two processes are linked by cause and effect because loss of H 2 0 by degassing causes S in the melt to partition into the vapor phase and simultaneously drives melt crystallization by increasing the liquidus temperature (Sisson and Layne 1993; Roggensack 2001; Wade et al. 2006; Johnson et al. 2008, 2010). This does not mean that the actual magma temperature increases, though in some cases it may (Blundy et al. 2006), but is caused by the fact that the wet liquidus temperature of a silicate melt is lower than the dry liquidus temperature. Assuming that degassing can be described by a Rayleigh fractionation process, Sisson and Layne (1993) used melt inclusion data to calculate a Dsvap°r-melt value of 34 for calc-alkaline basalt of Fuego volcano in Guatemala. Other calculated values of DsvaPor"melt for calc-alkaline basalt to basaltic andesite using this same method are 70 for Arenal volcano in Costa Rica (Wade et al. 2006),
O Jorullo Ml
Crystallization
0
0.3 -
A Paricutin Ml
Degassing
Degassing + crystallization
#
Hoya Alvarez Ml
O Jorullo matrix A Paricutin matrix
0.2 -
O Hoya Alvarez matrix
-Q O CM
0.1 -
co
- O -
O O K ^ — 0.5
1.5
2.5
K 2 0 (wt%) in melt Figure 7. S / K 2 0 vs. K 2 0 in melt inclusions (MI) and matrix glasses (matrix) f r o m Jorullo and Paricutin volcanoes (calc-alkaline basalt to basaltic andesite) and Hoya Alvarez maar (alkali basalt) in central Mexico. Vectors indicate general paths for melts undergoing crystallization, degassing, and degassing + crystallization. Decreases in S / K 2 0 with increasing K 2 0 indicate S degassing during differentiation of the magmas at Jorullo and Paricutin. Hoya Alvarez melts appear not to have degassed S during differentiation, though decreases in S / K 2 0 in matrix glasses indicate eruptive degassing of S. Figure is f r o m modified f r o m Johnson et al. (2010).
226
Wallace & Edmonds
75 for Irazu, also in Costa Rica (T. Plank, written commun., based on data in Benjamin et al. 2007), and 2-21 for Jorullo volcano (Johnson et al. 2010). Values for more K-rich arc magmas are 40 for Stromboli volcano (K-rich basalt to shoshonite; Metrich et al. 2001) and 5-20 for cinder cones in the western Trans-Mexican Volcanic Belt (shoshonite; Vigouroux et al. 2008). The Irazu value is higher than the values calculated at high pressure using Scaillet and Pichavant (2005), but we consider the agreement to be reasonably good given that the latter model does not have any experimental hydrous mafic melts in its calibration dataset. Some values of Dsvap°r"mdt from cinder cones in Mexico are lower than the calculated values (Johnson et al. 2010). This could perhaps be caused by slow diffusion of S (Freda et al. 2005) during rapid ascent and degassing, but we note that the predicted effects of slow S diffusion have not been observed for other melt inclusion data sets (see discussion in Metrich and Wallace 2008). Comparisons of open-system and closed-system degassing have been made using methods whereby a value of Dsvap°r"mdt can be calculated for each inclusion based on its difference from the initial concentrations of S and H 2 0 (Spilliaert et al. 2006a; Johnson et al. 2010). Closedsystem models typically yield higher Dsvap°r"mdt values than open-system models because Rayleigh fractionation is a more efficient mechanism of degassing; thus for a given initial and final dissolved S content, an open-system model requires a lower Dsvap°r"mdt to explain the data. Melt inclusion data from Etna yield closed-system degassing Dsvap°r-melt values from 0-60 compared to open-sytem values of 0.4-25, and the values increase with decreasing pressure (Spilliaert et al. 2006a). The melt inclusion data show significant increases in Dsvap°r"mdt at pressures 2000 ppm in basaltic-andesite melt inclusions to below detection for rhyolitic matrix glasses. Measurements of volcanic gas fluxes constrain the vapor C 0 2 / S 0 2 ratio, which is highly sensitive to vapor-melt separation depth.
The Sulfur
Budget in
Magmas
MAGMA MINGLING
M A G M A MIXING
E x c e s s sulfur
E x c e s s sulfur
Sulfur partitions into fluid in silicic magma
Quenching, crystallisation, v e s i c a t i o n , enclave formation
233
Sulfur partitions into a fluid in hybrid mixed magma
Gas-rich mafic magma mixes wilh resident silicic magma
Figure 11. Mechanisms for volatile transfer during recharge of silicic magma chambers by oxidized mafic magmas. Magma mingling involves quenching, crystallization and vesiculation at the interface between the two magmas, with volatile exsolution due to second boiling. Vapor is fluxed through silicic magma, with sulfur derived from the mafic magma partitioning strongly into the vapor phases; there is little transfer of mass from the mafic magma. Erupted lavas may contain enclaves of mafic magma and evidence of disequilibrium caused by heating. Volatiles escaping during eruptive pauses require significant magma permeability or some other mechanism for adverting vapor to the surface (e.g., convection at depth). Magma mixing involves significant fractions of the mafic magma mixing with the silicic magma in the chamber, resulting in hybrid magmas that contain mafic-derived phenocrysts. Upon mixing, sulfur partitions into a vapor phase and then is released to the atmosphere after magma ascent, closed-system degassing and eruption. Modified from Edmonds et al. (2010).
Thermodynamic models suggest that this gas is released from magma at pressures of 150-350 MPa. Mafic magma ascends from depth, degasses due to first and second boiling (the latter during crystallization), and around 30% of it gets mixed with the resident dacite and erupted, degassing completely and advecting exsolved vapor to the surface. The rest quenches and solidifies in the sub-volcanic plumbing system, which is likely to be an array of dikes, sills and small pods of magma rather than a single large integrated reservoir. At Soufriere Hills Volcano, there is abundant evidence for mafic recharge triggering and sustaining the 1995-present eruption and supplying sulfur to the system (Edmonds et al. 2001). The crystal-rich erupting andesite contains decimeter-scale enclaves of basaltic-andesite bulk composition. Petrological evidence of heating, from amphibole and orthopyroxene rims and other evidence of disequilibrium, such as rounded quartz and sieve-textured plagioclase, all point to heating of the andesite before eruption (Murphy et al. 2000). The timing of the heating, inferred to be due to intrusion of mafic magma, is constrained by Fe-Ti oxide diffusion profiles (based on the assumption that the profiles are due to temperature changes at a fixed /¡30, which is probably not realistic during magma recharge), which suggests that heating takes place days to weeks before eruption of the andesite (Devine et al. 2003). Studies of volcanic gas flux and composition constrain the contribution of mafic magma-derived volatiles to the
234
Wallace & Edmonds
system (Edmonds et al. 2010). Soufrière Hills Volcano gases display a similar range in C 0 2 / S 0 2 and S0 2 /H 2 S to other arc volcanoes (Fig. 8). The strong inverse relationship between C 0 2 / S 0 2 and S0 2 /H 2 S in Figure 8 does not allow for an important role for gas buffering at a constant S0 2 /H 2 S across the range of volcanic systems considered here (Giggenbach 1987). Instead, the spread of data suggest that melt-vapor separation at a range of pressures is the dominant mechanism controlling the ratios. In the case of Soufriere Hills, the gas data cannot be reconciled with models of simple closed- or open-system degassing of the erupting rhyolite, and an extra source of vapor is required. The data are best explained by a model of mixing between a vapor phase in equilibrium with the rhyolite melt at low pressures and a deep, mafic magma-derived vapor with high H 2 S / S 0 2 and C 0 2 / S 0 2 , which dominates during eruptive pauses, when persistent degassing takes place (Edmonds et al. 2010). The mafic magma quenches, crystallizes and vesiculates at the interface between the two magmas, liberating a vapor phase which is able to migrate to the surface through the rhyolite, through permeable networks of bubbles at depth and fractures closer to the surface (Fig. 11). One recent study suggests that oxidized mafic magmas transported large amounts of sulfur, mobilized from sulfides in the mantle source, to the shallow silicic magma reservoir prior to the climactic eruption of Pinatubo on 15 June 1991 (de Hoog et al. 2004). Pinatubo andesite dome lavas, erupted prior to the explosive dacitic eruption of 15 June, are the product of mixing between batches of basaltic andesite injected into the magma chamber and resident dacite. Melt inclusions in olivine contain variable amounts of sulfur, up to 1700 ppm, with 85% as sulfate, yielding an oxidation state of NNO+1.5 for the mafic magma prior to mixing, which is similar to the oxidation state calculated for the dacite melt of NNO + 1.5-1.7 (Scaillet and Evans 1999). Upon mixing with resident dacite, sulfur from the mafic magma was both fixed as anhydrite and sulfides in the dacite, and also partitioned into a H 2 0 - C 0 2 vapor. This vapor may have migrated to the upper parts of the magma chamber and was readily available for discharge into the atmosphere during an explosive eruption (de Hoog et al. 2004). Controversy remains, however, over the role of mafic magma in contributing to the volatile budget of arc volcanoes. Microgranular enclaves contained within the andesite erupted prior to and after the explosive Pinatubo eruption of 15 June 1991 have bulk sulfur contents of 50-1000 ppm (locked in sulfides and late-formed apatite), indicating a variable efficiency in sulfur degassing during magma mingling (Di Muro et al. 2008). Based on the composition and morphology of sulfides in the enclaves, it has been proposed that intruding mafic melt was reduced, with sulfur partitioned between a Cu-poor sulfide (incorporated from country rocks during magma ascent towards the dacite reservoir) and the melt. Upon mixing with hydrous, cooler dacite, the Cu-poor sulfides partially transformed into Cu-rich sulfides and then Ba-Sr sulfates as the mafic melt was progressively oxidized. Melt inclusions record a range of sulfur concentrations, with highest S contents in the least and most evolved glasses, and the least S contents in the glasses with intermediate Mg number, proposed to represent glasses at the sulfate-sulfide redox boundary (Di Muro et al. 2008). The release of S from the melt at the redox boundary (as originally proposed by Kress 1997a, as the source of the massive sulfur release) was almost immediately counteracted by the absorption of S back into the melt, this time dissolved as sulfate, which was later partly incorporated into large amounts of late-stage apatite. Final magma ascent caused melt sulfur depletion through degassing. This study concludes that the mafic recharges are volumetrically insignificant, petrologically do not represent the parent to the dacite, and did not contribute to the huge S emissions associated with the 15 June eruption. The contribution of sulfur (and other volatiles) from crustal sediments is also likely to be important for some volcanic emitters. In particular, degassing of S- and C-rich evaporites, coal and limestones by metamorphic devolatilization and/or assimilation and melting could boost the volatile emissions of a particular volcano or volcanic region considerably. Digestion of sediments can be deduced using geochemical data for S and C isotopes in volcanic gases
The Sulfur Budget in Magmas
235
and for volatiles in melt inclusions and has been shown to be important at Vesuvius (IaconoMarziano et al. 2009). Magma convection and/or open system degassing in low viscosity volcanic systems. Persistent degassing with little eruption of magma at basaltic, basaltic-andesite or silica-undersaturated magma volcanoes is commonplace across the whole range of tectonic settings. The style of volcanic activity typically involves a narrow conduit and bubble bursting and/or strombolian eruptions (e.g., Villarica, Masaya, Stromboli), or a flared conduit and lava lake, with visible evidence of magma turnover (e.g., Erebus, Nyiragongo, Erta Ale, Kilauea summit 2008-present). These volcanoes are characterized, during persistent degassing, by a continuous gas plume rich in sulfur dioxide. The excess sulfur problem is, owing to the minimal magma erupted, extreme at these volcanoes. Measurements of the gas composition and flux have been carried out at many of these volcanoes and there is an abundance of recent work that now converges upon a consensus regarding the mechanisms of volatile supply to the gas plume (Sawyer et al. 2008; Aiuppa et al. 2009; Oppenheimer et al. 2009). The gas compositions are generally close to equilibrium with melt at low pressures and the gas contains large fractions of H 2 0 and S0 2 . A remarkably steady gas composition and flux points to a magma convection regime, with shortterm fluctuations in gas composition, particularly the proportions of C 0 2 and halogens relative to S0 2 , pointing to a) periodic inputs of hotter, more gas-rich magma which disrupts convection (e.g., Oppenheimer et al. 2006, 2009) and/or b) open-system degassing at the topmost part of the conduit whereby either melt-vapor separation and bubble rise occurs (e.g., Edmonds and Gerlach 2007; Sawyer et al. 2008) or permeable bubble networks develop (Burton et al. 2007a). The relative importance of these three processes varies from volcano to volcano. Degassing at Stromboli takes place predominantly by open-system degassing, with gas slugs (with a high C/S ratio) rising from 1-3 km (Burton et al. 2007b). Convective magma degassing and overturn takes place in the conduit to supply a background flux of sulfur-rich gases. Prior to the effusive eruption and paroxysmal explosion in 2007, an increase in the C/S ratio of the gases was interpreted as the result of an enhanced number and rate of rise of deep-sourced (1-3 km) bubbles, perhaps caused by an injection of volatile-rich magma (Aiuppa et al. 2009). Lava lakes are an excellent natural laboratory for the study of magma turnover and the relative importance of open- versus closed-degassing processes. A remarkably steady S 0 2 flux and gas composition at Nyiragongo Volcano's lava lake, measured using Fourier Transform infrared spectroscopy (FTIR), suggests a closed-system magma convection and degassing regime, whereby magma ascends and degasses, with melt and vapor in equilibrium until tens of meters depth. Rapid temporal fluctuations in the proportions of halogen species relative to sulfur in the plume indicate some melt-gas separation in the topmost part of the system, when bubbles achieve a large enough size through expansion and coalescence to rise relative to melt (Sawyer et al. 2008). Observations at both Erta Ale and Erebus Volcanoes suggest that S 0 2 flux scales linearly with lake area (Kyle et al. 1994; Oppenheimer et al. 2004). This suggests that the control or driving force for convection might be the sinking of cool, degassed, more crystalline magma, the volume of which controls the rate of turnover. At Villarica, Chile, reconstructions of the volatile budget suggest that magma convection operates to supply sulfur and other gases to the volcanic plume (Witter et al. 2004). Differential bubble rise was rejected as being the dominant mechanism supplying the gas plume. Typical bubble sizes and number densities (inferred from erupted products) and a 15-meter diameter conduit (from visual observations at the surface) could supply fluxes that would fall short of what is observed by 3-4 orders of magnitude (Witter et al. 2004). Degassed, dense magma is inferred to sink back down the conduit and not remain stored in the edifice, as there is no net deformation observed over time. Melt inclusion evidence for gas fluxing in mafic volcanic systems. There is an interesting parallel between the volcanic gas evidence for vapor transfer from mafic to silicic systems and the evidence from melt inclusions for large excesses of gas fluxing through mid- to upper-
236
Wallace & Edmonds
crustal magma reservoirs and conduit systems of mafic volcanic systems. Mafic magmas are typically vapor-saturated at middle- to upper-crustal pressures because of the relatively low solubility of C 0 2 in silicate melts (Metrich and Wallace 2008). Vapor saturation pressures for melt inclusions can be calculated using H 2 0 and C 0 2 data, but these pressures usually represent minimum values because it can be difficult to correct for the amount of C 0 2 lost post-entrapment to a shrinkage bubble. Calculated pressures for melt inclusions from an individual volcano typically show evidence of having been trapped over a wide range of pressures (commonly from NNO+1.2 exhibited significantly greater values of D^" mt (e.g., hundreds to thousands) than pyrrhotite-bearing runs at log/o 2 < NNO+1 (e.g., Di'mt < 10). Increasing values of D//mt from ca. 100 to 500 were also observed with si-mt of a natural, strongly alkaline rhyolite at 150 MPa and 800 °C as log /o 2 increased to values > NNO+1, but in contrast two less-alkaline si-mt at the same P and T exhibited no significant change in D^"mt with log/o 2 varying from NNO-1.6 to NNO+2.9 (Scaillet and Macdonald 2006). These observations differ dramatically with those of Keppler (2010) for haplogranite melt at 200 MPa and 850 °C. His runs showed D^" mt decreasing with increasing f 0 r Values of D^" mt varied from 468 (at log /o 2 equivalent to that of the Co-CoO buffer) to 47 (at log/o 2 of NNO+O.5 to NNO+1), and an additional increase of log/o 2 from ca. NNO+1 to that of the Fe 2 03-Fe 3 04 buffer showed no change in S partitioning (i.e., D^" mt was 49). In way of explaining these differences, Keppler (2010) noted that: (1) thermodynamically estimated data on S partitioning between fluid and si-mt do not vary significantly with/o 2 (from ca. NNO-O.5 to NNO+1.7) for natural felsic to andesitic magmas (Scaillet and Pichavant 2003), and (2) that the low (fluid/melt) ratios of some of the experiments of Scaillet et al. (1998) may have caused significant error in the calculated D^ l m t . For comparatively reducing conditions (ca. log /o 2 < NNO+O.5), S is preferentially incorporated in favor of aqueous fluids that are in equilibrium with haplogranitic si-mt, but the S content of natural fluids will likely be limited by S sequestration due to pyrrhotite crystallization in felsic magmas at such/o 2 (Keppler 2010). At higher f0l, however, the results on S partitioning are quite variable. With log/o 2 > NNO+O.5, most thermodynamically estimated values of D / ' m t for felsic magmas range from 100 to ca. 1000 (Scaillet and Pichavant 2003), experimental values of D/'mt for three alkaline si-mt at 150 MPa range from ca. 70-500 (Scaillet and Macdonald 2006), experimental values of Dsfl'mt for molten Mt. Pinatubo dacite at 224 MPa are near 1000, and experimental values of Dsfl'mt for calcium- and anhydrite-free haplogranite melt are near 50 (Keppler 2010). It should be noted, here, that the chemical associations of reduced and oxidized S species with H + and the primary cations dissolved in aqueous fluids like these are poorly known at present. The issue of speciation may be pertinent to the differences in D//mt observed for these haplogranitic versus those of the more chemically complex granitic melts. If the presence of Fe, Mg, and Ca in si-mt enhances the concentration of S in the fluid, then D / ' m t should be greater with natural versus synthetic, haplogranitic melts at equivalent conditions of T, P, and/o 2 . It follows that future research should work to determine the speciation of S in geologically relevant, magmatic fluids. In contrast to the influences of si-mt composition and/o 2 , changes in T and P have less of an effect on S partitioning with felsic melts. Keppler's (2010) haplogranitic runs at 750-850 °C and Scaillet and Macdonald's (2006) runs at 800-900 °C show only minor changes in D^" mt with T. Keppler's (2010) haplogranitic runs at 850 °C do show D^'mt varying from 58±3 to 94±9 to 47±4 to 68±5 as P increases from 50 to 100 to 200 to 300 MPa at constant f0r It should also be noted that/ S2 influences S partitioning, because the concentration of S in si-mt increases strongly with/ S2 (Clemente et al. 2004). We note that the study of Scaillet et al. (1998) reports values of log fSl for two runs (i.e., ranging from - 3 . 1 to -1.2), but the influence of fS2 on Dsfl'mt was not determined because the/o 2 also varied between these runs. In general,
260
Webster &
Botcharnikov
/s, was not constrained for most of the investigations addressed above, and future experimental investigations should explore the influence of this parameter. Felsic melts — S-H20-C02. The influence of C0 2 on D¡f11"" can be evaluated through comparison of the results for C-free runs of Keppler (1999, 2010) with observations on C-bearing runs of Webster et al. (2009; 2010) and Webster et al. (in press) (Fig. 2). All of these experiments involved fluid-saturated, subaluminous to peraluminous haplogranitic melts, and the former C-free runs were conducted at 200 MPa and 850 °C with log/^, controlled by three external buffer conditions (e.g., Co-CoO and NNO+O.5 to NNO+1). The latter were run at 200 MPa, 895 to 912 °C, and l o g / 0 , of NNO-O.4 to NNO+1.5, and most runs included C0 2 but several C-free runs were conducted as well. In the studies of Webster et al. (2009) and Webster et al. (in press), the concentration of S in the run-product fluids was determined by mass balance, the C0 2 concentration of most fluids was constrained by capsule freeze-and-puncture methods, and H 2 0 in fluids was constrained by capsule heating and resulting weight-loss. For all runs, no sulfides were present, all S added to the starting charge apparently dissolved during the runs, and the mass of fluid in each run was sufficiently large such that the results of the mass-balance computations were robust and comparable. The S concentrations of the C0 2 -bearing and C0 2 -free melts are consistent for both sets of 200-MPa data (Fig. 2). The S concentrations of the C0 2 -free melts of Keppler (1999; 2010) range from 1000 as P decreases from ~100 to 25 MPa, indicating that S is preferentially partitioned into the fluid (Fig. 7f). The fluids released from the Masaya basaltic melt, which have lower S contents compared with those of Stromboli, are characterized by higher enrichment in S relative to the fluids of the Stromboli basalt experiments at similar conditions. This observation indicates that D^" mt is affected even by small variations in the composition of basaltic systems. The constant major-element composition of the si-mt and the absence of S-bearing phase(s) at high T and oxidizing conditions of the experiments indicate that the observed behavior of S should be attributed to changes in yssl'mt and/or y/1. The decrease in S concentration with decreasing concentration of H 2 0 in the melt under constant f0l and P has been reported in experimental studies of basaltic systems (Liu et al. 2007 and Moune et al. 2009, Fig. 6), although it was not confirmed by any systematic work. These observations indicate that H 2 0 and S interact in magmatic phases and presumably change D A n increase in Dsfl'mt can be also related to changes in the properties of the fluid phase, because the proportions of H 2 0 and C 0 2 as major components of the fluid progressively increase with decreasing P as shown in the work of Lesne et al. (2011) for closed-system conditions. The very good agreement between the experimental results and the compositions of melt inclusions from natural rocks as reported by Lesne et al. (2011) indicates that the determined Dsfl'mt values are not an experimental artifact.
Sulfur
Distribution
between Melts and Fluids in Magmatic
Systems
267
2000 i 1800 o> 1600 ì
1400 -
"3
1200 -
o
1000 "
~
•
Stromboli A
•
Stromboli B
o
Masaya A
•
Masaya B
800 -
5
eoo ;
°
400 200
0
(a)
-
0
100
200
300
400
500
100
Pressure, MPa
200 300 Pressure, MPa
400
TTTT1 i Ii (c) 200
300
400
100
Pressure, MPa
200
300
400
Pressure, MPa
10000
1000 ^
2 100 1
in a 10 ;
200 300 Pressure, MPa
400
500
100
200 300 Pressure, MPa
400
F i g u r e 7. Plots showing the closed-system evolution of volatile composition in synthetic basaltic melts relevant for magmas of Stromboli and M a s a y a volcanoes at 1150 °C and at redox conditions in the range f r o m F M Q + 1 . 7 to F M Q + 3 . 1 as a function of pressure and initial concentrations of volatiles (modified after Lesne et al. 2011): (a) C 0 2 , (b) H 2 0 , (c) CI, and (d) S. The variation of (S/Cl) ratio in the melts is shown in panel (e), whereas the Z)/"™' (wt% S in fluid/wt% S in melt) illustrated in panel (f). Precision shown is l a .
However, the quantification and correct interpretation of the observed effect require additional future experimental study. It must be noted that the presence of small amounts of S in these basaltic systems and the partitioning of S in favor of the fluid at low P did not cause large changes in the behavior of other volatiles. The evolution of H 2 0 and C 0 2 content with P is dictated largely by typical
268
Webster & Botcharnikov
partition mechanisms observed for S-free, H 2 0-C0 2 -basaltic melt systems (Dixon et al. 1995; Botcharnikov et al. 2005; Shishkina et al. 2010; Vetere et al. 2011). Since the bulk amount of CI was quite low, the concentration of CI in the melt remained almost constant over the entire P range leading to significant increases in the S/Cl ratio in the released fluids at low P. The low or negligible CI content of the fluid in the investigated systems provides no apparent effect on the mixing properties of the fluid, and hence, on the partitioning of S and other volatiles (as observed for silicic systems with high-Cl concentrations, as described previously). Another recent study focused on a more classical experimental approach where a Mt. Etna trachybasaltic melt was equilibrated with excess fluid containing H 2 0, S, and CI (Beermann et al. 2009; Beermann 2010). The experiments were conducted in an internally heated pressure vessel at 1050 °C and P of 100 and 200 MPa. The redox conditions inside the capsules varied from log/o 2 of FMQ+0.7 to FMQ+3.2. The initial bulk concentrations of S and CI in the system varied from 0.2 to 2 wt% and from 0.06 to 3.5 wt%, respectively (S was added as elemental sulfur and CI as HC1 solution with 5 to 30 wt% CI). The data (Beermann 2010) show that at oxidizing conditions of FMQ+3.2, both P and CI concentration of the system significantly decrease (P by approximately 20-25 rel%, whereas CI by up to ~ 40 rel%) the S content of the si-mt resulting in increasing D T h e Dsfl'mt are always > 1 and can reach values of 35-40 and 70 at 200 and 100 MPa, respectively, depending on the amount of CI in the system. The highest Dsfl'mt values (up to 240) are observed for reduced systems at ~FMQ+0.7. The data indicate that increasing the concentration of CI in the melt from 0.05 to ~3 wt% can increase Dsfl'mt from ~160 to 240 under reducing conditions. However, it must be kept in mind that mass-balance calculations of Dsfl'mt for systems containing sulfide phases can involve large uncertainties due to difficulties with determination of the extent of Fe loss and with quantification of the sulfide phase abundance. Nevertheless, the observed changes in Dsfl'mt and the effect of CI on S partitioning can be attributed to the possible change in activity coefficients of different S species in coexisting si-mt and fluids. The occurrence of different S species depends on magmatic conditions, in particular, on/o 2 and on the phase compositions. For instance, the extraction of cations by CI- and S-bearing aqueous fluids may have an effect on the composition of S- and Cl-bearing components of the fluid and hence on their activity coefficients. As shown by Beermann (2010), the change in S speciation from sulfide to sulfate leads to a significant extraction of Ca (as well as Na and K) by S from basaltic melt into the fluid phase with increasing f0r Moreover, the efficiency of cation extraction increases with increasing CI content of the fluid leading to possible variations in fluid and si-mt properties and changes in y s and ya. On the other hand, at relatively reduced conditions the extraction of cations from the si-mt is significantly less, even in FeS-saturated systems, indicating that the mutual effects of volatiles are strongly dependent on the cation load of the fluid and complexing of volatile species with cations in coexisting phases. Beermann (2010) has also observed, as previously recorded for other systems, that the addition of S to the system increases Dd11"" by approximately 25 rel% at oxidizing conditions but the effect of S on CI partitioning is very small to negligible at relatively reduced conditions (Beermann 2010). Such differences may result from the more effective extraction of cations by oxidized S-bearing fluids. The reported correlation between the concentrations of dissolved S and cations in Clbearing and CaS0 4 -saturated si-mt is indicative of significant enrichment of S and cations in the fluid phase and is consistent with the experimental data on the solubility of CaS0 4 in alkalichloride aqueous fluids (Newton and Manning 2005) and in Cl-bearing fluids coexisting with trachytic and phonolitic si-mt (Webster et al. 2009). The effect of CI is theorized to reflect the change in S speciation and formation of alkali-sulfate components at the expense of the Casulfate component in the fluid according to the equilibrium equation:
Sulfur Distribution between Melts and Fluids in Magmatic Systems
269
2CaS0 4 + NaCl + KC1 (+H 2 0) = 2CaCl + aq + N a S O ^ + K S O ^ (+H 2 0)
(9)
as proposed by Webster et al. 2009 (see also Newton and Manning 2005). Furthermore, the increase in S partitioning into the alkali- and Cl-rich fluids implies that alkali-sulfate fluid components have lower activity coefficients relative to that of the Ca-sulfate component. It must be emphasized that recent experimental data for basaltic systems clearly illustrate that the partitioning of individual volatile components between basaltic melts and exsolving fluids is considerably influenced by the interrelated effects of volatiles and by properties of multi-component (volatile- and cation-bearing) aqueous fluids under given T, P, and redox conditions. Depending on the relative volatile abundances and magmatic conditions in basaltic systems, an increase in the CI content of the system can enhance S partitioning into the fluid by approximately 30 to 40 rel%, whereas S is able to enhance CI exsolution from the si-mt by ca. 25 to 30 rel%. Conversely, the experimental data also show that if the degassing processes occur in the magmas with S and CI concentrations far from saturation with S- or Cl-bearing phase(s), the exsolution of significant S and CI can be delayed to P of 150 to 100 MPa. Moreover, with further decompression, the S/Cl ratio in the fluid can increase dramatically due to much more effective partitioning of S in favor of the fluid. Summary on S partitioning between fluids and rhyolitic to basaltic melts at crustal conditions The hydrothermal S partitioning experiments reviewed herein were conducted with rhyolitic to basaltic melts, at 50 to 800 MPa, and magmatic T, and they show D^llmt ranging from ca. 1 to 2800 (Table 1). Sulfur partitioning depends on and shows variable responses to changes in /o 2 (and the valence state of S),/s 2 , melt composition, fluid composition, T, and P. It has been demonstrated for a variety of si-mt that the partitioning of S between si-mt and fluid varies with si-mt composition, and hence, Dsfl'mt should vary with magma evolution (Scaillet and Pichavant 2003; Botcharnikov et al. 2004; Webster et al. 2009; Beermann 2010). For P > 100 MPa, D / ' m t shows a general decrease with change in magma composition from basaltic to rhyolitic as illustrated in Figure 8, indicating that fluids associated with silicic magmas should be more enriched in S relative to melts as compared with basaltic systems. Furthermore, it also evident that, for a given composition, systems under relatively reduced conditions (log/o 2 100 MPa, although Keppler (2010) reports some 50-MPa data); whereas, the runs of Lesne et al. (2011) demonstrate a remarkable increase in D^"mt as P decreases from ~ 100 to 25 MPa for basaltic si-mt (Fig. 7). Moreover, the data of Moune et al. (2009; Moune pers. communication) show that the H 2 0 content of the si-mt may have a significant influence on D^"mt (Fig. 6). These observations on P and/n 2 o are highly pertinent to future research given that few experiments have been conducted at relatively low P and in the systems with varying H 2 0 at magmatic redox conditions. Likewise, the influence of T requires further study. Most experiments involve O-H-S fluids, and the effects of C and CI on Dsfl'mt are known only for a relatively restricted range of conditions. For C-O-H-S-bearing systems, Dsfl'mt exhibits a range that is similar to that for O-H-S-bearing systems. The runs of Lesne et al. (2011) and Beermann (2010) with basalt si-mt show that Dsfl'mt ranges from N N O (Botcharnikov et al. 2004; Beermann et al. 2009; Webster et al. 2009; Beermann 2010) is geologically significant because the presence of even minute quantities of magmatic CI may force the exsolution of hypersaline liquid or vapor plus hypersaline liquid from fluid-undersaturated si-mt, and in particular, for relatively anhydrous felsic si-mt (Webster 1992). This behavior is also significant because it applies broadly to melts ranging from 48 to 70 wt% Si0 2 . Thus, the presence of S in comparatively oxidized si-mt modifies CI solubility in the si-mt which, in turn, controls fluid phase equilibria, fluid composition, and process of fluid exsolution (Webster et al. 2009), i.e. phenomena that are responsible for the dynamics of magma degassing.
276
Webster & Botcharnikov SUGGESTIONS FOR FUTURE RESEARCH
The volume fraction of pre-eruptive vapor (or other fluids) in magma is one parameter that serves to regulate volcanic eruptive styles, magnitudes, and durations (Wallace and Anderson 2000; Oppenheimer 2003). In addition, magmatic fluids range from low-density vapor to dense saline liquids and the type of fluid that first exsolves and the efficacy of that fluid in implementing eruptive processes vary strongly with fluid composition. The capacity of a multi-component fluid to expand and provide PAV work in the system varies with the partial molar volumes of the individual components and the molar volume and composition of the fluid mixture. For example, the addition of C 0 2 to an aqueous vapor at 200 MPa and T < 700 °C can increase the partial molar volume of H 2 0 and the molar volume of the mixture (Sterner and Bodnar 1991; Churakov and Gottschalk 2003). Conversely, the addition of NaCl to an aqueous vapor dramatically reduces the molar volume of the mixture at similar conditions (Bodnar 1985; Burnham 1997). The influence of S-dominated vapor species is less well known. Thermodynamic modeling indicates that the addition of H 2 S and S 0 2 to aqueous vapor may also increase the molar volume of the mixture (Shi and Saxena 1992), but supporting experimental data are sorely needed. This is particularly true for complex mixtures of C-O-H-S-Cl fluids. Finally, it should be emphasized that the results of experimental studies reviewed in this chapter clearly demonstrate that accurate and quantitative interpretation of natural processes responsible for the partitioning of S between magmatic phases and S budget in multi-component natural systems requires additional extensive experimental work bearing on natural multicomponent systems. The main focus should be the measurement of fluid compositions and the associated partitioning of volatiles in S-C-H-Cl-O systems with systematic variation in P, T, fo2, melt and fluid composition. In addition, new analytical techniques allowing more precise determination of fluid composition are required. Particular attention should also be directed to the behavior of volatile constituents in open versus closed systems at relevant magmatic conditions, because such data are important for the monitoring of changes in volcanic activity based on the composition of volcanic gases and melt inclusions. Another important aspect that should be addressed by future experiments is the kinetics of multi-component volatile exsolution from silicate liquids into the coexisting mixed fluids, which will provide important constraints on the dynamics of magma degassing. And finally, future experimental studies should take into account the saturation of magmas with volatile-rich phases, such as saline liquids, sulfides, sulfates and volatile-bearing silicate minerals, and the role of such phases in the behavior and budget of S in multi-component fluids.
ACKNOWLEDGMENTS We express our appreciation to Jake Lowenstern, Hans Keppler, and Harald Behrens for clear, detailed, and beneficial reviews, and N. Nicholson for assistance in editing. We would like to acknowledge O. Beermann, P. Lesne, and S. Moune for providing us with recent experimental data for basaltic systems in the form of manuscripts and theses that significantly improved the quality and depth of this review paper. Some research addressed herein was supported by National Science Foundation award EAR-0836741 to J.D.W. and by Deutsche Forschungsgemeinschaft (DFG) grants No378/4 and Bo2941/l to R.E.B.
REFERENCES Aiuppa A, Baker DR, Webster JD (2009a) Halogens in volcanic systems. Chem Geol 263:1-18 Aiuppa A, Federico C, Paonita A, Pecoraino G, ValenzaM (2002) S, CI and F degassing as an indicator of volcanic dynamics: The 2001 eruption of Mount Etna. Geophys Res Lett 29(11), doi:10.1029/2002GL015032
Sulfur Distribution
between Melts and Fluids in Magmatic
Systems
Til
Aiuppa A, Federico C, Giudice G, Gurrieri S, Paonita A, Valenza M (2004) Plume chemistry provides insights into mechanisms of sulfur and halogen degassing in basaltic volcanoes. Earth Planet Sei Lett 222(2):469483 Aiuppa A, Federico C, Giudice G, Giuffrida G, Guida R, Gurrieri S, Liuzzo M. Moretti R, Papale P (2009b) The 2007 eruption of Stromboli volcano: Insights from real-time measurement of the volcanic gas plume C0 2 /S0 2 ratio. J Volcanol Geotherm Res 182(3-4):221-230 Arthur MA (2000) Volcanic contributions to the carbon and sulfur geochemical cycles and global change. In: Encyclopedia of Volcanoes. Sigurdsson H (ed) Academic Press, San Diego p 1045-1056 Backnaes L, Deubener J (2011) Experimental studies on sulfur solubility in silicate melts at near-atmospheric pressure. Rev Mineral Geochem 73:143-165 Backnaes L, Stelling J, Behrens H, Goettlicher J, Mangold S, Verheijen O, Beerkens GCR, Deubener J (2008) Dissolution mechanisms of tetravalent sulphur in silicate melts: Evidences from sulphur K edge XANES studies on glasses. J Am Ceram Soc 91(3):721-727 Baker DR, Barnes S-J, Simon G, Bernier F (2001) Fluid transport of sulfur and metals between sulfide melt and basaltic melt. Can Mineral 39:537-546 Baker DR, Freda C, Brooker RA, Scarlato P (2005) Volatile diffusion in silicate melts and its effects on melt inclusions. Ann Geophys 48(4-5):699-717 Baker DR, Moretti R (2011) Modeling the solubility of sulfur in magmas: a 50-year old geochemical challenge. Rev Mineral Geochem 73:167-213 Baker LL Rutherford MJ (1996) Sulfur diffusion in rhyolite melts. Contrib Mineral Petrol 123:335-344 Beermann O (2010) The solubility of sulfur and chlorine in H 2 0-bearing dacites of Krakatau and basalts of Mt. Etna. PhD Thesis, 109 p, Hannover Beermann O, Botcharnikov RE, Nowak M, Holtz F (2009) Redox control on S and CI partitioning between basaltic melts and coexisting fluids: Experimental constraints at 1050 °C and 200 MPa. Eos Trans. AGU, 90(52), Fall Meet. Suppl. Abstract V43B-2230 Beermann O, Botcharnikov RE, Nowak M, Holtz F (2011) Temperature dependence of sulphide and sulphate solubility in olivine-saturated basaltic magmas. Geochim Cosmochim Acta, in press Behrens H, Stelling J (2011) Diffusion and redox reactions of sulfur in silicate melts. Rev Mineral Geochem 73:79-111 Berndt J, Liebske C, Holtz F, Freise M, Nowak M, Ziegenbein D, Hurkuck W, Koepke J (2002) A combined rapid-quench and H 2 -membrane setup for internally heated pressure vessels: Description and application for water solubility in basaltic melts. Am Mineral 87:1717-1726 Bischoff JL, Pitzer KS (1989) Liquid-vapor relations for the system NaCl-H 2 0: summary of the P-T-X surface from 300° to 500 °C. Am J Sei 289:217-248 Bockrath C, Ballhaus C, and Holzheid A (2004) Stabilities of laurite RuS 2 and monosulfide liquid solution at magmatic temperature. Chem Geol 208:265-271 Bodnar RJ (1985) Pressure-volume-temperature-composition (PVTX) properties of the system H 2 0-NaCl at elevated temperatures and pressures. PhD Dissertation, The Pennsylvania State University, State College, Pennsylvania Bodnar RJ, Burnham CW, Sterner SM (1985) Synthetic fluid inclusions in natural quartz. III. Determination of phase equilibrium properties in the system H 2 0-NaCl to 1000 °C and 1500 bars. Geochim Cosmochim Acta 49:1861-1873 Botcharnikov RE, Behrens H, Holtz F, Koepke J, Sato H (2004) Sulfur and chlorine solubility in Mt. Unzen rhyodacite melt at 850 °C and 200 MPa. Chem Geol 213:207-225 Botcharnikov RE, Behrens H, Holtz F (2006) Solubility and speciation of C-O-H fluids in andesitic melt at T = 1100-1300 °C and P = 200 and 500 MPa. Chem Geol 229(1-3):125-143 Botcharnikov R, Freise M, Holtz F, Behrens H (2005) Solubility of C-O-H mixtures in natural melts: new experimental data and application range of recent models. Ann Geophys 48(4-5):633-646 Botcharnikov RE, Linnen RL, Wilke M, Holtz F, Jugo PJ, Berndt J. (2011) High gold concentration in sulphidebearing magma at oxidizing conditions. Nature Geosci, doi: 10.1038/NGE01042 Bowers TS, Helgeson HC (1983) Calculation of the thermodynamic and geochemical consequences of nonideal mixing in the system H 2 0-C0 2 -NaCl on phase relations in geologic systems: Equation of state for H 2 0-C0 2 -NaCl fluids at high pressures and temperatures. Geochim Cosmochim Acta 47:1247-1275 Buchanan DL, Nolan J, Wilkinson N, De Villiers JPR (1983) An experimental investigation of sulfur solubility as a function of temperature in silicate melts. Spec Pub Geol Soc S Africa 7:383-391 Burgisser A, Scaillet B (2007) Redox evolution of a degassing magma rising to the surface. Nature 445:194197 Burgisser A, Scaillet B, Harshvardhan (2008) Chemical patterns of erupting silicic magmas and their influence on the amount of degassing during ascent. J Geophys Res 113(B12204):14p Burnham CW (1997) Magmas and hydrothermal fluids. In: Geochemistry of Hydrothermal Ore Deposits, 3rd edition. HL Barnes (ed) John Wiley & Sons, New York, p 63-123
278
Webster & Botcharnikov
Burton M, Allard P, Mure F, La Spina A (2007) Magmatic gas composition reveals the source depth of slugdriven strombolian explosive activity. Science 317(5835):227-230 Carroll MR, Rutherford MJ (1988) Sulfur speciation in hydrous experimental glasses of varying oxidation state; results from measured wavelength shifts of sulfur X-rays. Am Mineral 73(7-8):845-849 Carroll MR, Webster JD (1994) Solubilities of sulfur, noble gases, nitrogen, chlorine, and fluorine in magmas. Rev Mineral 30:231-279 Cervantes P, Wallace PJ (2003) Role of H 2 0 in subduction-zone magmatism: New insights from melt inclusions in high-Mg basalts from central Mexico. Geology 31:235-23 8 Chambefort I, Dilles J, Kent AJR (2008) Anhydrite-bearing andesite and dacite as a source for sulfur in magmatic-hydrothermal mineral deposits. Geology 36:719-722 Chase M (1998) NIST-JANAF thermochemical tables. Journal of Physical and Chemical Reference Data Monographs 9, 4th Edition. American Inst, of Physics Christopher T, Edmonds M, Humphreys MCS, Herd RA (2010) Volcanic gas emissions from Soufrière Hills Volcano, Montserrat 1995-2009, with implications for mafic magma supply and degassing. Geophys Res Lett 37:L00E04 Churakov SV, Gottschalk (2003) Perturbation theory based equation of state for polar molecular fluids: II. Fluid mixtures. Geochim Cosmochim Acta 67:2415-2425 Churikova T, Woerner G, Mironov N, Kronz A (2007) Volatile (S, CI and F) and fluid mobile trace element compositions in melt inclusions: implications for variable fluid sources across the Kamchatka arc. Contrib Mineral Petrol 154(2):217-239 Clemente B, Scaillet B, Pichavant M (2004) The solubility of sulphur in hydrous rhyolitic melts. J Petrol 45:2171-2196 Core DP (2004) Oxygen and Sulfur Fugacities of Granitiods: Implications for Ore-Forming Processes. PhD dissertation, The University of Michigan, Ann Arbor, Michigan De Hoog JCM, Hattori KH, Hoblitt RP (2004) Oxidized sulfur-rich mafic magma at Mount Pinatubo, Philippines. Contrib Mineral Petrol 146:750-761 De Hoog JCM, Mason PRD, van Bergen MJ (2001) Sulfur and chalcophile elements in subduction zones: constraints from a laser ablation ICP-MS study of melt inclusions from Galunggung Volcano, Indonesia. Geochim Cosmochim Acta 65:3147-3164 Delmelle P, and Stix J (2000) Volcanic gases. In: Encyclopedia of Volcanoes. Sigurdsson H (ed) Academic Press, San Diego, p 803-815 Di Muro A, Pallister J, Villemant B, Newhall C, Semet M, Martinez M, Mariet C (2008) Pre-1991 sulfur transfer between mafic injections and dacite magma in the Mt. Pinatubo reservoir. J Volcanol Geotherm Res 175:517-540 Dixon JE (1997) Degassing of alkalic basalts. Am Mineral 82:368-378 Dixon JE, Stolper EM, Holloway JR (1995) An experimental study of water and carbon dioxide solubilities in mid ocean ridge basaltic liquids. Part I: Calibration and solubility models. J Petrol 36:1607-1631 Driesner T (2007) The system H 2 0-NaCl. Part II. Correlations for molar volume, enthalpy, and isobaric heat capacity from 0 to 1000 °C, 1 to 5000 bar, and 0 to 1 X N a a . Geochim Cosmochim Acta 71:4902-4919 Ducea M, Mclnnes B, Wyllie P (1994) Sulfur variations in glasses from volcanic rocks: Effect of melt composition on sulfur solubility. Int Geol Rev 36(8):703-714 Edmonds M, Gerlach TM (2007) Vapor segregation and loss in basaltic melts. Geology 35(8):751-754 Edmonds M, Herd RA (2007) A volcanic degassing event at the explosive-effusive transition. Geophys Res Lett 34:L21310 Edmonds M, Oppenheimer C, Pyle DM, Herd RA, Thompson G (2003) S0 2 emissions from Soufrière Hills Volcano and their relationship to conduit permeability, hydrothermal interaction and degassing regime. J Volcanol Geotherm Res 124(l-2):23-43 Einaudi MT, Hedenquist JW, Inan EE (2003) Sulfidation state of fluids in active and extinct hydrothermal systems: transitions from porphyry to epithermal environments. In: Volcanic, Geothermal, and OreForming Fluids: Rulers and Witnesses of Processes within the Earth. Volume 10. Simmons SF, Graham I (eds) Econ Geol Spec Pub, p 285-313 Evans KA, O'Neill HSC, Mavrogenes JA, Keller NS, Jang LY, Lee JF (2009) XANES evidence for sulphur speciation in Mn-, Ni- and W-bearing silicate melts. Geochim Cosmochim Acta 73(22):6847-6867 Falcone R, Ceola S, Daneo A, Maurina S (2011) The role of sulfur compounds in coloring and melting kinetics of industrial glass. Rev Mineral Geochem 73:113-141 Fincham CJB Richardson FD (1954) The behavior of sulfur in silicate and aluminate melts. Phil Trans Roy Soc London A223:40-62 Fleet ME, Liu X, Harmer SL, King PL (2005) Sulfur K-edge XANES spectroscopy: Chemical state and content of sulfur in silicate glasses. Can Mineral 43(5):1605-1618 Fleet ME, Stone WE, Crocket JH (1991) Partitioning of palladium, iridium, and platinum between sulfide liquid and basalt melt - effects of melt composition, concentration, and oxygen fugacity. Geochim Cosmochim Acta 55(9):2545-2554
Sulfur Distribution between Melts and Fluids in Magmatic Systems
279
Froese E, Gunter A E (1976) A note on the pyrrhotite-sulphur vapor equilibrium. Econ Geol 7 1 : 1 5 8 9 - 1 5 9 4 Gaetani GA, Grove T L (1997) Partitioning of moderately siderophile elements among olivine, silicate melt, and sulfide melt: Constraints on core formation in the Earth and Mars. Geochim Cosmochim Acta 61(9):1829-1846 Gerlach T M (1986) Exsolution of H 2 0 , C 0 2 , and S during eruptive episodes at Kilauea Volcano, Hawaii. J Geophys Res 9 1 : 1 2 1 7 7 - 1 2 1 8 5 Gerlach T M , Westrich HR, Symonds R B (1995) Preeruption vapor in magma of the climactic Mount Pinatubo eruption: source of the giant stratospheric sulfur dioxide cloud. In: Fire and Mud: Eruptions and Lahars of Mount Pinatubo, Philippines. Newhall CG, Punongbayan RS (eds) University of Washington Press p 415-433 Gerlach T M , Westrich HR, Casadevall TJ, Finnegan D L (1994) Vapor saturation and accumulation in magmas of the 1989-1990 eruption of Redoubt Volcano, Alaska. J Volcanol Geotherm Res 62:317-337 Giggenbach W F (1996) Chemical composition of volcanic gases. In: Monitoring and Mitigation of Volcano Hazards. Scarpa R, Tilling RI (eds) Springer, Berlin, p 2 2 1 - 2 5 6 GiggenbachWF (1997) The origin and evolution of fluids in magmatic-hydrothermal systems. In: Geochemistry of Hydrothermal Ore Deposits, 3 r d Edition. Barnes HL (ed) John Wiley & Sons, New York, p 7 3 7 - 7 9 6 Gorbachev NS (1990) Fluid-magma interaction in sulfide-silicate systems. Int Geol Rev 3 2 : 7 4 9 - 8 3 6 Guillong M, Latkoczy C, Seo JH, Günther D, Heinrich CA (2008) Determination of sulfur in fluid inclusions by laser ablation ICP-MS. J Anal At Spectrom 2 3 : 1 5 8 1 - 1 5 8 9 Haughton DR, Roeder PL, Skinner B J (1974) Solubility of sulfur in mafic magmas. Econ Geol 69:451-467 Hedenquist JW, Lowenstern J B (1994) The role of magmas in the formation of hydrothermal ore deposits. Nature 3 7 0 : 5 1 9 - 5 2 7 Holloway J R (1976) Fluids in the evolution of granitic magmas: consequences of finite C 0 2 solubility. Geol SocAmBull 87:1513-1518 Holloway J R (1987) Igneous fluids. Rev Mineral 17:211-233 Holloway J R , Blank J G (1994) Application of experimental results to C-O-H species in natural melts. Rev Mineral 3 0 : 1 8 7 - 2 3 0 Holzheid A, Grove T L (2002) Sulfur saturation limits in silicate melts and their implications for core formation scenarios for terrestrial planets. Am Mineral 87(2-3):227-237 Jahn S, Schmidt C (2010) Speciation in aqueous M g S 0 4 fluids at high pressures and high temperatures from ab initio molecular dynamics and Raman spectroscopy. J Phys Chem B 2 0 1 0 : 1 5 5 6 5 - 1 5 5 7 2 Jantzen CM, Smith M E , Peeler D K (2004) Dependency of sulfate solubility on melt composition and melt polymerization (U). Symposium on Waste Management Technologies in Ceramic and Nuclear Industries. ACS. Report W S R C - M S - 2 0 0 4 - 0 0 2 9 0 , 14 p. Jugo PJ, Luth RW, Richards J P (2005a) An experimental study of the sulfur content in basaltic melts saturated with immiscible sulfide or sulfate liquids at 1300 °C and 1.0 GPa. J Petrol 4 6 : 7 8 3 - 7 9 8 Jugo PJ, Luth RW, Richards J P (2005b) Experimental data on the speciation of sulfur as a function of oxygen fugacity in basaltic melts. Geochim Cosmochim Acta 69(2):497-503 Jugo P, Wilke M, Botcharnikov R E (2010) Sulfur K-edge X A N E S analysis of natural and synthetic basaltic glasses: Implications for S speciation and S content as function of oxygen fugacity. Geochim Cosmochim Acta 7 4 : 5 9 2 6 - 5 9 3 8 Kamenetsky V S , Wolfe RC, Eggins SM, Mernagh TP, Bastrakov E (1999) Volatile exsolution at the Dinkidi Cu-Au porphyry deposit, Philippines: a melt-inclusion record of the initial ore-forming process. Geol 27:691-694 Katsura T, Nagashima S (1974) Solubility of sulfur in some magmas at 1 atmosphere. Geochim Cosmochim Acta 38(4):517-531 Keppler H (1999) Experimental evidence for the source of excess sulfur in explosive volcanic eruptions. Science 2 8 4 : 1 6 5 2 - 1 6 5 4 Keppler H (2010) The distribution of sulfur between haplogranite melts and aqueous fluids. Geochim Cosmochim Acta 7 4 : 6 4 5 - 6 6 0 Klimm K, Botcharnikov R E (2010) The determination of sulfate and sulfide species in hydrous silicate glasses using Raman spectroscopy. Am Mineral 9 5 : 1 5 7 4 - 1 5 7 9 Lenoir M, Grandjean A, Poissonnet S, Neuville D R (2009) Quantitation of sulfate solubility in borosilicate glasses using Raman spectroscopy. J Non-Cryst Solids 3 5 5 ( 2 8 - 3 0 ) : 1 4 6 8 - 1 4 7 3 Lesne P, Kohn SC, Blundy J, Witham F, Botcharnikov RE, Behrens H (2011) Experimental simulation of basalt degassing at Stromboli and Masaya volcanoes. J Petrol, in press Li C, Ripley E M (2009) Sulfur contents at sulfide-liquid or anhydrite saturation in silicate melts: empirical equations and example applications. Econ Geol 104:405-412 Liebscher A, Heinrich C A (2007) Fluid-fluid interactions in the Earth's crust - an introduction. Rev Mineral Geochem 65:1-13
280
Webster &
Botcharnikov
Liu Y, Samaha N-T, Baker DR (2007) Sulfur concentration at sulfide saturation (SCSS) in magmatic silicate melts. Geochim Cosmochim Acta 71(7): 1783-1799 Luhr JF, Carmichael ISE, Varekamp JC (1984) The 1982 eruptions of El Chichón volcano, Chiapas, Mexico: mineralogy and petrology of the anhydrite-bearing pumice. J Volcanol Geotherm Res 23:69-108 Mandeville CW (2010) Sulfur: a ubiquitous and useful tracer in Earth and planetary sciences. Elements 6:7580 Mandeville CW, Sasaki A, Saito G, Faure K, King R, Hauri E (1998) Open-system degassing of sulfur from Krakatau 1883 magma. Earth Planet Sci Lett 160:709-722 Martini M, Buccianti A (1997) The investigation of magmatic, hydrothermal and atmospheric contributions to the chemical composition of volcanic gases, as a guide to volcano surveillance (abs.) Jan. 1997 IAVCEI, Puerta Vallaría, Mexico Mathez EA (1976) Sulfur solubility and magmatic sulfides in submarine basalt glass. J Geophys Res 81(23):4269-4276 Matthews SJ, Moncrieff DHS, Carroll M R (1999) Empirical calibration of the sulphur valence oxygen barometer from natural and experimental glasses; method and applications. Mineral Mag 63(3):421-431 McGonigle AJS, Oppenheimer C. (2003) Optical sensing of volcanic gas and aerosol emissions. Geol Soc London Spec Pub 213(1):149-168 McKeown DA, Muller IS, Gan H, Pegg IL, Kendziora CA (2001) Raman studies of sulfur in borosilicate waste glasses: sulfate environments. J Non-Cryst Solids 288(1-3): 191-199 Métrich N, Berry AJ, O'Neill HSC, Susini J (2009) The oxidation state of sulfur in synthetic and natural glasses determined by X-ray absorption spectroscopy. Geochim Cosmochim Acta 73(8):2382-2399 Métrich N, Bertagnini A, Landi P, Rosi M (2001) Crystallization driven by decompression and water loss at Stromboli Volcano (Aeolian Islands, Italy). J Petrol 42(8):1471-1490 Métrich N, Clocchiatti R (1996) Sulfur abundance and its speciation in oxidized alkaline melts. Geochim Cosmochim Acta 60:4151-4160 Métrich N, Mandeville CW (2010) Sulfur in magmas. Elements 6(2):81-86 Métrich N, Wallace P (2008) Volatile abundances in basaltic magmas and their degassing paths tracked by melt inclusions. Rev Mineral Geochem 69:363-402 Moretti R (2005) Polymerisation, basicity, oxidation state and their role in ionic modelling of silicate melts. Ann Geophys 48:583-608 Moretti R, Baker DR (2008) Modeling the interplay of fQ and / s along the FeS-silicate melt equilibrium. Chem Geol 256:286-298 Moretti R, Ottonello G (2005) Solubility and speciation of sulfur in silicate melts: The Conjugated ToopSamis-Flood-Grjotheim (CTSFG) model. Geochim Cosmochim Acta 69(4):801-823 Moretti R, Papale P, Ottonello G (2003) A model for the saturation of C-O-H-S fluids in silicate melts. Geol Soc London Spec Pub 213(1):81-101 Moune S, Holtz F, Botcharnikov R (2009) Sulphur solubility in andesitic to basaltic melts: implications for Hekla volcano. Contrib Mineral Petrol 157(6):691-707 Moune S, Sigmarsson O, Thordarson T, Gauthier P-J (2007) Recent volatile evolution in the magmatic system of Hekla volcano, Iceland. Earth Planet Sci Lett 255(3-4):373-389 Müller-Simon H (2011) Fining of glass melts. Rev Mineral Geochem 73:337-361 Mysen BO, Popp RK (1980) Solubility of sulfur in CaMgSi 2 0 6 and NaAlSi 3 0 8 melts at high-pressure and temperature with controlled fQ and/ S 2 . Am J Sci 280(l):78-92 Nagashima S, Katsura T (1973) Solubility of sulfur in N a 2 0 - S i 0 2 melts under various oxygen partial pressures at 1100 °C, 1250 °C, and 1300 °C. Bull Chem Soc Japan 46(10):3099-3103 Newman S, Lowenstern JB (2002) VOLATILECALC: a silicate m e l t - H 2 0 - C 0 2 solution model written in Visual Basic for excel. Comp Geosci 28:597-604 Newton RC, Manning CE (2005) Solubility of anhydrite, CaS0 4 , in N a C l - H 2 0 solutions at high pressures and temperatures. J Petrol 46:701-716 Nowak M, Behrens H (1995) The speciation of water in haplogranitic glasses and melts determined by in situ near-infrared spectroscopy. Geochim Cosmochim Acta 59:3445-3450 O'Neill H St C (1987) The quartz-fayalite-iron and quartz-fayalite-magnetite equilibria and the free energies of formation of fayalite (Fe 2 Si0 4 ) and magnetite (Fe 3 0 4 ). Am Mineral 72:67-75 Oppenheimer C (2003) Volcanic degassing. In: The Crust. Treatise in Geochemistry. Volume 3. Rudnick RL (ed) Elsevier, p 123-166 Oppenheimer C, Scaillet B, Martin RS (2011) Sulfur degassing from volcanoes: source conditions, surveillance, plume chemistry and earth system impacts. Rev Mineral Geochem 73:363-421 Pallister JS, Hoblitt RP, Reyes AG (1992) A basalt trigger for the 1991 eruptions of Pinatubo volcano? Nature 356:426-428 Parat F, Holtz F (2004) Sulphur partitioning between apatite and melt and effect of sulphur on apatite solubility at oxidizing conditions. Contrib Mineral Petrol 147:201-212
Sulfur Distribution between Melts and Fluids in Magmatic Systems
281
Parat F, Holtz F, Feig S (2008) Pre-eruptive conditions of the Huerto Andesite (Fish Canyon System, San Juan volcanic field, Colorado): influence of volátiles (C-O-H-S) on phase equilibria and mineral composition. J Petrol 49:911-935 Parat F, Holtz F, Streck MJ (2011) Sulfur-bearing magmatic accessory minerals. Rev Mineral Geochem 73:285-314 Pokrovski GS, Dubrovinsky LS (2011) The S3~ ion is stable in geological fluids at elevated temperatures and pressures. Science 331(6020):1052-1054 Portnyagin M, Hoernle K, Plechov P, Mironov N, Khubunaya S (2007) Constraints on mantle melting and composition and nature of slab components in volcanic arcs from volátiles (H 2 0, S, CI, F) and trace elements in melt inclusions from the Kamchatka Arc. Earth Planet Sci Lett 255(l-2):53-69 RaiaF, Webster JD, DeVivo B (2000) Pre-eruptive volatile contents of Vesuvius magmas: contraints on eruptive history and behavior. I-the medieval and modern interplinian activities. Eur J Mineral 12:179-193 Rethmeier J, Rabenstein A, Langer M, Fischer U (1997) Detection of traces of oxidized and reduced sulfur compounds in small samples by combination of different high-performance liquid chromatography methods. J Chromat A 760:295-302 Ripley EM, Li C, Moore CH, Elswick ER, Maynard JB, Paul RL, Sylvester P, Seo JH, Shimizu N (2011) Analytical methods for sulfur determination in glasses, rocks, minerals and fluid inclusions. Rev Mineral Geochem 73:9-39 Roedder E (1984) Fluid Inclusions. Reviews in Mineralogy Volume 12. Mineral Soc Am Rye RO, Luhr JF, Wasserman MD (1984) Sulfur and oxygen isotope systematics of the 1982 eruptions of El Chichón Volcano, Chiapas, Mexico. J Volcanol Geotherm Res 23:109-123 Salvi S, Williams-Jones AE (2003) Bulk analysis of volátiles in fluid inclusions. In: Fluid Inclusions: Analysis and Interpretation. Samson I, Anderson A, Marshall D (eds.) Min Assoc Canada Short Course 32:247-278 Scaillet B, Clemente B, Evans BW, Pichavant M (1998) Redox control of sulfur degassing in silicic magmas. J Geophys Res 103(B10):23,937-23,949 Scaillet B, Evans BW (1999) The June 15, 1991 eruption of Mount Pinabuto. I. Phase equilibria and preemption P - T - / O 2 - / H 2 O conditions of the dacite magma. J Petrol 40:381-411 Scaillet B, Macdonald R (2006) Experimental and thermodynamic constraints on the sulphur yield of peralkaline and metaluminous silicic flood eruptions. J Petrol 47:1413-1437 Scaillet B, Pichavant M (2003) Experimental constraints on volatile abundances in arc magmas and their implications for degassing processes. In: Volcanic Degassing. Vol. 213. Oppenheimer C, Pyle DM, Barclay J (eds). Geol Soc Spec Pub p 23-52 Scaillet B, Pichavant M (2005) A model of sulphur solubility for hydrous mafic melts: application to the determination of magmatic fluid compositions of Italian volcanoes. Ann Geophys 48(4-5):671-698 Scaillet B, Pichavant M, Roux J, Humbert G, Lefevre A (1992) Improvements of the Shaw membrane technique for measurement and control of f m at high temperatures and pressures. Am Mineral 77:647-655 Schmidt C (2009) Raman spectroscopic study of a H 2 0 + Na 2 S0 4 solution at 21-600 °C and 0.1 MPa to 1.1 GPa: relative differential V!S042~ Raman scattering cross sections and evidence of the liquid-liquid transition. Geochim Cosmochim Acta 73:425-437 Seo JH, Guillong M, Heinrich CA (2009) The role of sulfur in the formation of magmatic-hydrothermal copper-gold deposits. Earth Planet Sci Lett 282:323-328 Seward TM (1981) Metal complex formation in aqueous solutions at elevated temperatures and pressures. In: Physics and Chemistry of the Earth. Vol. 13+14. Richard DT, Wickman EE (eds). Pergamon Press, p 113-132 Shi P, Saxena SK (1992) Thermodynamic modeling of the C-H-O-S fluid system. Am Mineral 77:1038-1049 Shishkina T, Botcharnikov RE, Holtz F, Almeev RR, Portnyagin M (2010) Solubility of H 2 0- and C0 2 -bearing fluids in tholeiitic basalts at pressures up to 500 MPa. Chem Geol 277: 115-125 Siggurdson H, Carey S, Palais JM, Devine J (1990) Pre-eruptive compositional gradients and mixing of andesite and dacite magma eruption from Nevado del Ruiz volcano, Colombia in 1985. J Volcanol Geotherm Res 41:127-151 Simon AC, Ripley RM (2011) The role of magmatic sulfur in the formation of ore deposits. Rev Mineral Geochem 73:513-578 Sisson TW, Layne GD (1993) H 2 0 in basalt and basaltic andesite glass inclusions from 4 subduction-related volcanoes. Earth Planet Sci Lett 117:619-635 Sourirajan S, Kennedy GC (1962) The system H 2 0-NaCl at elevated temperatures and pressures. Am J Sci 260:115-141 Spilliaert N, Allard P, Métrich N, Sobolev AV (2006a) Melt inclusion record of the conditions of ascent, degassing, and extrusion of volatile-rich alkali basalt during the powerful 2002 flank eruption of Mount Etna (Italy). J Geophys Res-Solid Earth 111(B4):B04203 doi: 10.1029/2005JB003934 Spilliaert N, Métrich N, Allard P (2006b) S-Cl-F degassing pattern of water-rich alkali basalt: Modelling and relationship with eruption styles on Mount Etna volcano. Earth Planet Sci Lett 248(3-4):772-786
282
Webster & Botcharnikov
Sterner SM, Bodnar RJ (1991) Synthetic fluid inclusions. X: Experimental determination of P-V-T-X properties in the C0 2 -H 2 0 system to 6 kb and 700 °C. Am J Sci 291:1-54 Stevens RK, Mulik JD, O'Keeffe AE, Krost KJ (1971) Gas chromatography of reactive sulfur gases in air at the parts-per-billion level. Anal Chem 43(7):827-831 Symonds RB, Rose WI, Bluth GJS, GerlachTM (1994) Volcanic-gas studies: Methods, results and applications. Rev Mineral 30:1-66 Tamic N, Behrens H, Holtz F (2001) The solubility of H 2 0 and C 0 2 in rhyolitic melts in equilibrium with a mixed C0 2 -H 2 0 fluid phase. Chem Geol 174:333-347 Taylor JR, Wall VJ, Pownceby MI (1992) The calibration and application of accurate redox sensors. Am Mineral 77:284-295 Teague AJ, Kohn SC, Klimm K, Botcharnikov RE (2008) Sulphur solubility in Mount Hood andesites and C0 2 fluids: Implications for volcanic degassing EOS Trans. AGU, 89(53), Fall Meet. Suppl. Abstract V21B-2086 Toulmin PI, Barton PBJ (1964) A thermodynamic study of pyrite and pyrrhotite. Geochim Cosmochim Acta 28:641-671 Tsujimura T, Xue X, Kanzaki M, Walter MJ (2004) Sulfur speciation and network structural changes in sodium silicate glasses: Constraints from NMR and Raman spectroscopy. Geochim Cosmochim Acta 68(24):5081-5101 Vaughan DJ, Craig JR (1997) Sulfide ore mineral stabilities, morphologies, and intergrowth textures. In: Geochemistry of Hydrothermal Ore Deposits, 3rd Edition. Barnes HL (ed) John Wiley & Sons, New York, p 367-434 Vetere F, Botcharnikov RE, Holtz F, Behrens H, De Rosa R (2011) Solubility of H 2 0 and C 0 2 in shoshonitic melts at 1250 °C and pressures from 50 to 400 MPa: Implications for Campi Flegrei magmatic systems. J Volcanol Geotherm Res 202:251-261 Vigouroux N, Wallace P, Kent AJR (2008) Volatiles in high-K magmas from the western Trans-Mexican Volcanic Belt: Evidence for fluid-flux melting and extreme enrichment of the mantle wedge by subduction processes. J Petrol doi:10.1093/petrology/egn039 Vogt JHL (1917) Die sulphid-silikat-schmetlzlosungen. Norsk Geol Tides IV:43-51 Wade JA, Plank T, Melson WG, Soto GJ, Hauri AH (2006) Volatile content of magmas from Arenal volcano, Costa Rica. J Volcanol Geotherm Res 157:94-120 Wallace PJ (2001) Volcanic S 0 2 emissions and the abundance and distribution of exsolved gas in magma bodies. J Volcan Geotherm Res 108:85-106 Wallace PJ (2005) Volatiles in subduction zone magmas: concentrations and fluxes based on melt inclusion and volcanic gas data. J Volcanol Geotherm Res 140:217-240 Wallace PJ, Anderson AT, Jr (2000) Volatiles in magma. In: Encyclopedia of Volcanoes. Siggurdson H (ed) Academic Press, San Diego p. 149-170 Wallace PJ, Carmichael ISE (1994) S speciation in submarine basaltic glasses as determined by measurements of S K a X-ray wavelength shifts. Am Mineral 79(1-2):161-167 Wallace PJ, Edmonds M (2011) The sulfur budget in magmas: evidence from melt inclusions, submarine glasses, and volcanic gas emissions. Rev Mineral Geochem 73:215-246 Webster JD (1992) Fluid-melt interactions involving Cl-rich granites: experimental study from 2 to 8 kbar. Geochim Cosmochim Acta 56:679-687 Webster JD (2009) Advances in constraining solubilities of H-O-C-S-Cl-bearing fluids in silicate melts (abs). EOS V51-G02 Webster JD, Goldoff B, Shimizu N ( 2 0 1 1 ) COHS fluids and granitic magma: how S partitions and modifies C0 2 concentrations of fluid-saturated felsic melt at 200 MPa. Contrib Mineral Petrol, doi:10.1007/ S00410-011-0628-1
Webster JD, Mandeville CW (2007) Fluid immiscibility in volcanic environments. Rev Mineral Geochem 65:313-362 Webster JD, Mandeville CW, Goldoff B, Coombs ML, Tappen C (2010) Augustine volcano, Alaska: The influence of volatile components in magmas erupted AD 2006 to 2100 years before present. In: The 2006 Eruption of Augustine Volcano. Power J, Coombs ML, Freymueller J (eds) US Geol Surv Prof Paper 1769:383-423 Webster JD, Sintoni MF, De Vivo B (2006) The role of sulfur in promoting magmatic degassing and volcanic eruption at Mt. Somma-Vesuvius. In: Volcanism in the Campania Plain. Volume 9. De Vivo B (ed), Elsevier Amsterdam, p 219-233 Webster JD, Sintoni MF, De Vivo B (2009) The partitioning behavior of CI and S in aqueous fluid- and salineliquid saturated phonolitic and trachytic melts at 200 MPa. Chem Geol 263:19-36 Wilke M, Jugo PJ, Klimm K, Susini J, Botcharnikov R, Kohn SC, Janousch M (2008) The origin of S 4+ detected in silicate glasses by XANES. Am Mineral 93(l):235-240
Sulfur Distribution between Melts and Fluids in Magmatic Systems
283
Wilke M, Klimm K, Kohn SC (2011) Spectroscopic studies on sulfur speciation in synthetic and natural glasses. Rev Mineral Geochem 73:41-78 Williams-Jones G, Rymer H (2000) Hazards of volcanic gases. In: Encyclopedia of Volcanoes. Sigurdsson H (ed) Academic Press San Diego, p 997-1004 Winther KT, Watson EB, Korenowski G M (1998) Magmatic sulfur compounds and sulfur diffusion in albite melt at 1 G P a a n d 1300-1500 degrees C. Am Mineral 83(11-12 Part 1):1141-1151
10
Reviews in Mineralogy & Geochemistry Vol. 73 pp. 285-314, 2011 Copyright © Mineralogical Society of America
Sulfur-bearing Magmatic Accessory Minerals Fleurice Parat Géosciences Montpellier - Université Montpellier 2 Place E. Bataillon 34095 Montpellier cedex 5. France and Mineralogie-Geochemie, Institutfiir Geowissenschaften Albertstr. 23b 79104 Freiburg, Germany Fleurice.Parat@
gm.univ-montp2.fr
François Holtz Institut für Mineralogie, Callinstr. 3 Leibniz Universität Hannover 30167, Germany
Martin J. Streck Department of Geology Portland State University Portland, Oregon 97207-0751, U.S.A. INTRODUCTION: THE OCCURRENCE OF MAGMATIC SULFUR-BEARING MINERALS Almost all magmas contain sulfide- or sulfate-bearing phases. In most natural samples the sulfur-bearing phase is a sulfide, which typically is pyrrhotite ( F e ^ S ) or pyrite (FeS2) although chalcopyrite (CuFeS2), pentlandite ((Fe,Ni)9S8), sphalerite (ZnS) or molybdenite (MOS2) may be present as well. Sulfate minerals are rare at magmatic conditions, and anhydrite (CaS0 4 ) is the most common. Other magmatic S0 4 -bearing minerals include the sodalite group minerals (haiiyne simplified formula: (Na,Ca)4_8(Al6Si6(0,S)24)(S04,Cl)1_2), scapolite minerals (silvialite: (Ca,Na) 4 Al 6 Si 6 0 2 4(S04,C0 3 )), and S-bearing apatite (Ca 5 (P0 4 ) 3 (F, CI, OH)). Barite (BaS0 4 ) has been mentioned in rare cases (Marchev 1991). Sulfur-bearing minerals usually constitute a negligible fraction of the mineral assemblage in magmatic rocks and thus can be classified as accessory minerals. The crystallization of sulfide, sulfate, and S-bearing minerals strongly depends on melt composition, temperature and pressure, and the S speciation in melt which, in turn, is strongly dependent on the prevailing oxygen fugacity (Baker and Moretti 2011, this volume; Wilke et al. 2011, this volume). Irrespectively of the low abundance of S-bearing minerals, the evolution of sulfur in magmas may be evaluated from the occurrence of sulfides and sulfates. These minerals are critical for estimating the activity of various sulfur-bearing species in magmas and can be used to constrain the oxygen fugacity and the S concentration in the melt (e.g., pre-eruptive sulfur concentration in melts). The presence of either sulfide or sulfate in silicate melt indicates that the predominant dissolved sulfur species in the melt are S2~ or S 6+ , respectively. Typically one of these species is dominant, but there are conditions where S2~ or S 6+ are present in subequal proportions (Wilke et al. 2011, this volume). 1529-6466/11/0073-0010S05.00
DOI: 10.2138/rmg.2011.73.10
286
Parat, Holtz, Streck
In this chapter, the main S-bearing minerals occurring in magmatic rocks and their geological setting are described, and their utility in understanding sulfur geochemistry in magmas is explored. Because subsolidus reactions may affect S-bearing minerals in plutonic rocks, we focus on reviewing minerals observed in volcanic rocks. Magmatic sulfides Magmatic sulfides are common in arc-related mafic and silicic igneous rocks, oceanic island basalts and mid-oceanic ridge basalts, whereas they are rare in alkaline magmas from intracontinental settings (e.g., Scaillet and Macdonald 2006). They are accessory minerals occurring as isolated crystals in glass or included in other mineral phases (such as magnetite, pyroxene, sphene, plagioclase). They rarely form euhedral crystals but instead commonly occur as sulfide globules or blebs (Fig. 1). Pyrrhotite is a stable sulfide in many arc related magmas (Figs, la and 2), whereas Cu-Ni-Fe-sulfides are abundant in oceanic island basalts and mid-oceanic island basalts (Figs. Id and 3). Chalcopyrite, pentlandite and sphalerite are often reported in magmatic rocks, however, these sulfide phases formed after sulfide entrapment during cooling under subsolidus conditions. At magmatic conditions the stable sulfide phases are monosulfide solid solution ( F e ^ S - N i ^ S , mss; Naldrett et al. 1967), intermediate solid solution (iss, high-temperature solid solution with compositions close to that of CuFeS 2 ; see reviews by Raghavan 2004 and Fleet 2006), Cu-rich pyrrhotite, and a sulfide liquid. Upon cooling, monosulfide solid solution converts to pyrrhotite through exsolution of pentlandite,
Figure 1. Microphotographs of magmatic sulfides, (a) Pyrrhotite (po) inclusions in magnetite taken with reflected light microscopy, Huerto Andesite; (b) Cu-Fe-sulfides in magnetite (mag) in Mount Pinatubo dacite with reflected light microscopy; ilm: ilmenite (Fournelle et al. 1996); (c) Triangular, semi-transparent crystal of molybdenite (mo) and coexisting melt inclusions from the Amalia Tuff, Latir volcanic field. New Mexico taken with transmitted light microscopy (Audetat et al. 2011). (d) Sulfides in olivine phenocryst hosted bleb of monosulfide solid solution (mss) with magnetite (mag) and subsolidus lamellar exsolution of isocubanite (icb) in pumice from the 1959 eruption of Kilauea (Stone and Fleet 1991). {Figure lc was reproduced with permission of Oxford University Press from Audetat et al. (2011) Journal of Petrology, Vol. 54, p. 891-904}
Sulfur-bearing Magmatic Accessory Minerals
287
whereas the intermediate solid solution unmixes to form chalcopyrite and cubanite (CuFe 2 S 3 ) (e.g., Mungall 2007; Nadeau et al. 2010). Sulfides are rare in peralkaline igneous rocks consisting of pyrrhotite, pyrite, and molybdenite (Scaillet and Macdonald 2006; Audétat et al. 2011) (Fig. 1). For example, pyrrhotite is present in peralkaline rhyolite of Tejeda volcano, Gran Canaria and in syenite from La Gomera Island, Canary Islands (Crisp and Spera 1987; Rodríguez-Losada and MartínezFrías 1998). Pyrrhotite and molybdenite are present in peralkaline rhyolite from Pantelleria, Italy (Lowenstern et al. 1993). Molybdenite may be more common in magmatic systems than recognized up to now. For example, Audétat et al. (2011) looked carefully for the presence of molybdenite in 27 continental felsic systems and identified this mineral as inclusions in quartz in 13 cases. Pyrrhotite ( F e ^ S ) is the most abundant sulfide reported in continental arc-related magmatic rocks (e.g., Whitney and Stormer 1983; Luhr et al. 1984) and in island arc basalts and andesites (e.g., Heming and Carmichael 1973; Ueda and Itaya 1981). Magmatic pyrrhotite can crystallize at high temperature from reduced S-saturated melt (log/o 2 (bar) < NNO+1, where NNO refers to the logarithm of the oxygen fugacity defined by the Ni-NiO buffer; Carroll and Rutherford 1987). At high oxygen fugacity, pyrrhotite may partially breakdown to a Fe-O-S liquid (Clemente et al. 2004). During cooling and devitrification, pyrrhotite can oxidize to form pyrite (FeS2) and magnetite (6FeS + 2 0 2 = 3FeS 2 + Fe 3 0 4 ) (Whitney 1984). Pyrite has been recorded in some volcanic examples (Table 1) but it is not clear if this mineral is magmatic or was produced by a subsolidus reaction. Both Cu-Fe sulfide and Ni-Fe sulfide have been identified as magmatic phases. For example, they are reported in island arc volcanic rocks from the 1991 Mount Pinatubo eruption (e.g., Pallister et al. 1992; Hattori 1996; McKibben et al. 1996), the Merapi volcano (Nadeau et al. 2010), and in continental arc andesites from Mount Shasta (Stone et al. 1989); pyrrhotite is rare in such occurrences. The composition of Cu- and Ni- sulfides ranges from pyrrhotite to bornite (Cu 5 FeS 4 ) and from pyrrhotite to pentlandite ((Fe,Ni) 9 S 8 ), respectively (Fig. 2). The mineral compositions plot in the fields of bornite solid solution, intermediate solid solution (iss), and pyrrhotite. Compositions intermediate between these three phases are not observed, in agreement with the existence of immiscibility gap (see phase relationships below). Curich minerals are ubiquitous inclusions in pyrrhotite, magnetite or in the matrix of some other arc-related magmas (Luhr et al. 1984; Lowenstern 1993; Chesner 1998; Costa et al. 2004) (Fig. lb). Both iss and pyrrhotite have been reported as inclusions in silicate phenocrysts crystallized directly from silicate melt at high temperature (e.g., Lowenstern 1993), whereas small chalcopyrite or cubanite (CuFe 2 S 3 ) crystals inside pyrrhotite were attributed to exsolution from the host pyrrhotite (e.g., Luhr et al. 1984). Phase equilibria suggest that the coexistence of Ni-bearing pyrrhotite and Cu-Fe-sulfide (e.g., iss) may be related to the miscibility gap between two high temperature CuFeS 2 (iss) and F e ^ S - N i ^ S (mss) phases (Craig and Kullerud 1969; Raghavan 2006). However, textural observations and general occurrences of sulfides in mafic and silicic rocks suggest that the two types of sulfides do not crystallize contemporaneously but rather one after the other starting with early crystallization of Ni-pyrrhotite followed by crystallization of Cu-Fe-sulfides (along with anhydrite) as illustrated in the following examples. In volcanic rocks of Mount Pinatubo volcanics, in which both sulfate (anhydrite) and sulfides are present, sulfide phases are: (1) globular nickel-bearing (NNO+l
n.d.
Idaho
U.S.A.
71-75 M a
granodiorite
n.d.
800
Cajon Pass
U.S.A.
Cretaceous
tonalite-granodiorite
NNO+2
700-800
760
Intrusive
SODALITE-BEARING
ROCKS
Laacher See Tephra
Germany
13 ka
phonolite
NNO+2.3
Massif Central
France
65 Ma-3450 B P
tephrite
NNO+1-2
900
trachyphonolite
NNO+1-2
700
n.d.
n.d.
Aiguillier Massif
France
2 Ma
trachyandesite
Tenerife
Canary Islands
0.6 M a
phonolite
Santo Antao
Cape Verde
0.7- O.lMa
Tahiti
France
0.5-1.2 M a
Wolf Rock, Cornwall
England
NNO+0.5
800
nephelinite phonolite
n.d.
n.d.
trachyte-phono lite
n.d.
n.d.
phonolite
n.d.
n.d.
Oldoinyo Lengai
Tanzania
ijolite-urtite
n.d.
n.d.
North Qiangtang
Tibet
trachyandesite
n.d.
n.d.
North Qiangtang
Tibet
tephrite-phonotephrite
n.d.
n.d.
Vulture
Italy
basanite, phonolite
n.d.
n.d.
tephrite, phonotephrite
n.d.
n.d.
phonolite
NNO+2.2-2.9
n.d.
hauynophyre
NNO+2.2-2.9
n.d.
syenitic nodule
n.d.
n.d.
phonolitic leucitite
n.d.
n.d.
Vulsini District
Italy
0.8-0.58 M a
0.6-0.15 M a
Vico
Italy
0.42-0.1 M a
phonotephrite
n.d.
n.d.
Alban Hills, Tavolato
Italy Province
0.6-0.02 M A
phonotephrite
n.d.
n.d.
Vesuvius
Italy
phonolite
n.d.
n.d.
Ventotene-Santo Stefano
Italy
latite-trachyte
n.d.
n.d.
ab: albite, aeg: aegirine, afs: alkalifeldspar, aln: allanite, am: amphibole, anh: anhydrite, an: anorthite, ap: apatite, bn: bornite, bt: biotite, ccp: chalcopyrite, cpx: clinopyroxene, est: cassiterite, cup: cuprite, g: glass, grt: garnet, hbl: hornblende, hyn: hatiyne, ilm: ilmenite, iss: intermediate solid solution, krs: kaersutite, let: leucite, mag: magnetite, mel: melilite, mnz: monazite, mo: molybdenite, ne: nepheline, nsn: nosean, ol: olivine, opx: orthopyroxene, ox: FeTi-oxides, phi: phlogopite, pi: plagioclase, pn: pentlandite, po: pyrrhotite, py: pyrite, qtz: quartz, sa: sanidine, s-mei: sulfate meionite, sod: sodalite, spn: spinel, ttn: titanite, zrn: zircon, n.d.: not determined. N N O refers the logarithm of the oxygen fugacity defined by the Ni- NiO buffer.
Sulfur-bearing Magmatic Accessory Minerals
Paragenesis
po
iss
anh hyn nsn
289
References
pi, hbl, bt, qtz, anh, ap, ccp, ox
Pallister et al. 1992, 1996
pi, cpx, opx, bt, anh, ap, py, mag, ilm
Fournelle 1990
pi, cpx, hbl, bt, anh, ap, ttn, po, mag
L u h r e t a l . 1984
pi, cpx, opx, hbl, bt, qtz, ap, anh, po, zrn, ox, ilm
Matthews et al. 1999
pi, cpx, opx, hbl, bt, qtz, ttn, ap, anh, po, ox
Drexler & Muñoz 1985; Deen et al. 1994
pi, cpx, opx, hbl, bt, qtz, ap, anh, po, ttn, mag, ilm
Chambeford et al. 2008
pi, hbl, opx, cpx, ttn, est, cup, bn, ilm, mag, ap, anh
Dirksen et al. 2006
pi, cpx, opx, hbl, bt, mag, ap, zrn, anh, py
Arculus et al. 1983
pi, cpx, opx, hbl, anh, mag, ilm
Swanson & Kearney 2008
pi, hbl, bt, ap, mag, anh
Luhr 2008
pi, cpx, opx, hbl, anh, ap, po, py, mag
Parat et al. 2002
pi, hbl, bt, qtz, anh, ap, po, ccp, ttn, ilm, mag
Audétat and Pettke 2006
pl, bt, qtz, anh, po, mag, ilm
Stern et al. 2007
pl, ol, cpx, anh, po, pn, ccp
Li et al. 2009
pl, hbl, bt, qtz, anh, ap, ttn, mag
Audétat et al. 2004
pl, qzt, bt, afs, anh, ap, mnz, aln, zrn, py, ox
Tepper & Kuehner 1999
pl, hbl, ttn, qtz, anh, ap, mag, ilm
Barth & Doráis 2000
sa, pl, am, phi, cpx, ttn, hyn, ap
Worner & Schmincke 1984
pl, afs, cpx, am, hyn, ap, mag
Downes 1987
pl, afs, cpx, am, bt, hyn, nsn, sod, zrn, spn, mag
Downes 1987
pl, cpx, am, hyn, nsn, ol, afs, ap, ttn, ox
Morel & Gourgaud 1992
afs, bt, cpx, hyn, nsn, ap, ttn, mag, ilm
Bryan 2006
sa, cpx, krs, hyn, ttn, ox
Holm et al. 2006
pl, ne, sa, let, cpx, hyn, nsn, ap, mag, ttn
Tracy 2003
sa, ne, nsn, cpx, ox
Tilley 1959; Harrison et al. 1977
ne, cpx, grt, mag, ap, hyn, po
Dawson et al. 1994; Zaitsev et al. 2009
cpx, let, nsn, hyn, ne, sa, ap, ox
Guo et al. 2006
ol, cpx, let, ne, nsn, hyn, ttn, sa, ap, ox
Guo et al. 2006
let, ol, cpx, hyn, spl, afs, bt, ap, ox
D e Fino et al. 1986 Bindi et al. 1999
pl, cpx, ol, let, am, afs, ne, bt, hyn, ap, mag
D e Fino et al. 1986 Bindi et al. 1999
sa, ne, grt, ttn, cpx, let, hyn, ap, mag
D e Fino et al. 1986 Bindi et al. 1999
hyn, cpx, ne, let, mag, sod, ap, mel
D e Fino et al. 1986; Bindi et al. 1999
afs, pl, cpx, am, hyn, mag, ttn
Renzulli et al. 1998
cpx, bt, let, pl, sa, hyn
Holm 1982
sa, cpx, hyn, ox, ap, ttn
Perini et al. 2004 Peccerillo 2005 Peccerillo 2005 Peccerillo 2005
290
Parat, Holtz,
Streck
Figure 2. Sulfide composition in arc-related rocks (individual analyses), (a) Cu-Fe-S and (b) Ni-Fe-S ternary plot of normalized atomic proportions in the sulfides. Sulfide compositions are either from reconstructed sulfide compositions (Nadeau et al. 2010) or from sulfides without exsolution texture, bn: bornite, ccp: chalcopyrite, cu: cubanite, pn: pentlandite, po: pyrrhotite, py: pyrite, vio: violarite.
anhydrite) from S0 2 -rich supercritical fluids released by underlying mafic magmas. Because the dacitic magma is more oxidized than the mafic magma, S0 2 would be converted to H 2 S. The H2S produced by the dacitic magma would form sulfides in the dacitic melt together with elements transported by the fluids, such as Zn, Cd, Cu, and Se. An alternative scenario for the formation of Cu-rich sulfide and anhydrite in the Mount Pinatubo dacite may be due to the following (simplified) reaction: 2S0 2 + CaO + FeO = CaS0 4 + FeS + 0 2
(1)
In any case, the presence of Cu-rich pyrrhotite in silicic magmas such as Mount Pinatubo may be used as a proxy for the presence of Cu-bearing supercritical fluids. Evidence for a Cu-bearing fluid in magmas has been found by Lowenstern (1993) in form of Cu-rich vapor bubbles in melt inclusions (Valley of Ten Thousand Smokes). It should be noted that supercritical fluids may also contain chlorine. The presence of CI leads to higher partition coefficients for S between solid phases and silicate melt (Botchamikov et al. 2004) and lowers sulfide solubility in melt.
Sulfur-bearing Magmatic Accessory Minerals
291
Chlorine may thus play a role for sulfide saturation, as also evidenced for apatite and other sulfate-bearing minerals, which may contain appreciable CI concentrations (see below). At Mount Shasta, complicated sulfide assemblages are present as inclusions in olivine and pyroxene megacrysts of andesitic tephras. They include mss, iss, pyrrhotite, pentlandite, chalcopyrite, violarite (FeNi2S4), idaite (Cu3FeS4), and pyrite (Stone et al. 1989). Ni-sulfides are common in olivine megacrysts, whereas chalcopyrite is present as inclusion in pyroxene megacrysts. The similarity of bulk sulfide (Fig. 2) and olivine compositions to experimental high-temperature partitioning data suggest an origin through sulfide liquid immiscibility, although high-temperature subsolidus processes such as degassing or S infiltration along fissures may also have been important (Stone et al. 1989). Intermediate Ni-Cu-Fe sulfides are reported for mid-oceanic ridge basalts (e.g., Mathez 1976; Francis 1990) and oceanic island basalts (e.g., Stone and Fleet 1991). These sulfides occur as globules in glass or as inclusions in olivine or plagioclase phenocrysts. They are Ni- and Cu-rich, containing up to 58 wt% Cu (close to bornite composition) and 32 wt% Ni (pentlandite) (Fig. 3). The presence of Ni-Cu sulfides can be explained by direct crystallization from a silicate melt. However, the models commonly invoked to explain the crystallization of Ni-Cu-Fe sulfides include: i) formation of an immiscible sulfide liquid during the early magmatic stage of the host rocks, either by segregation (Naldrett 1981) or assimilation (Lesher and Groves 1986), ii) sulfide metasomatism during the late-magmatic stage, or iii) subsolidus processes (Stone et al. 1989). Molybdenite. Recently, Audétat et al. (2011) showed that molybdenite (MoS2) may be a common mineral in intraplate silicic magma systems. It occurs as small, brownish, semitransparent triangular or hexagonal platelets in quartz phenocrysts (Fig. lc) (Lowenstern et al. 1993; Audétat et al. 2011). The presence of molybdenite in pantellerite is explained by Lowenstern et al. (1993) as result from a drop in temperature during magmatic differentiation of a Mo-rich peralkaline melt (12-25 ppm Mo (10000 ppm = 1 wt%)) at reducing conditions. Furthermore, the crystallization of molybdenite is thought to be favored by the absence of other Mo-bearing phases such as oxides (e.g., ilmenite) or titanite. To our knowledge, no exact composition of molybdenite occurring in volcanic rocks has been published (due to the small size of the minerals). However, the coexistence of molybdenite with pyrrhotite may be useful to determine/o 2 and/ S2 prevailing in magmas (Audétat et al. 2011; see below). Magmatic sulfates and sulfate-bearing minerals Although magmatic sulfates and sulfate-bearing minerals are rare, reports of sulfatebearing minerals in igneous rocks (e.g., nosean, haiiyne, silvialite) date back to early in the 20th century (Lindgren and Ransome 1906; Brauns 1914). The minerals crystallize from oxidized sulfate-bearing melts. Anhydrite was found in arc-related magmas, whereas sodalite-group minerals (haiiyne and nosean) are present in alkaline magmas of intraplate settings. The absence of pyrrhotite in alkaline rocks and the presence of sulfate-bearing minerals may reflect the higher/o 2 or lower Fe2+/Fe3+ when compared with metaluminous rocks (Scaillet and Macdonald 2006). Table 1 lists well-known natural examples from which sulfates and S0 4 -rich sodalitegroup minerals have been described, although Table 1 is meant to be neither a comprehensive list including all examples worldwide nor representative of the relative global distribution of sulfate-bearing volcanic rocks. Anhydrite (CaS0 4 ) is rare in volcanic rocks and was recognized for the first time as a primary igneous phase in the 1982 El Chichón eruption products (Luhr et al. 1984). In El Chichón lavas, anhydrite forms euhedral phenocrysts surrounded by rhyolitic glass with no evidence of disequilibrium (Fig. 4a) but it is absent in more porous pumices. Its absence in some
292
Parat, Holtz,
• M O R B ; Francis 1 9 9 0 O MORB; Mathez 1976
Streck
S (at%)
O MORB; C z a m a n s k e and Moore 1977 O O I B ; S t o n e and Fleet 1 9 9 1 • I s l a n d a r c ; Hattorl 1 9 9 6 • i s l a n d a r c ; N a d e a u et al. 2 0 1 0 A Continental arc; Lowenstern 1993 A C o n t i n e n t a l arc, S t o n e et al. 1 9 S 9
7
60
/
70 Cu (at%)
" nNi (at%)
Ni (at%)
Cu (at%)
\
Figure 3. Cu-Ni-Fe sulfide compositions, (a) Cu-Ni-S ternary plot of normalized atomic proportions in the sulfides projected from Fe. (b) Cu-Ni-Fe ternary plot of normalized atomic proportions in the sulfides projected from S. Sulfide compositions are from sulfides without exsolution texture, bulk analyses, or reconstructed sulfide compositions (Nadeau et al. 2010). bn: bornite, ccp: chalcopyrite, cu: cubanite, pn: pentlandite, po: pyrrhotite, py: pyrite, vio: violarite. MORB: mid-oceanic ridge basalt, OIB: oceanic island basalt.
Sulfur-bearing Magmatic Accessory Minerals
293
of the 1982 El Chichón eruptive products was interpreted to be due to dissolution by meteoritic water immediately subsequent to the eruption (Luhr et al. 1984). This highlights the high susceptibility of anhydrite to be erased from the geological record even if the rock otherwise may look quite pristine. Subsequent investigations identified primary ^^"^E^K^SVftT^I^H^YTf^WHl anhydrite as inclusions in other minerals | d. \ in a few recent, as well as in some older, intermediate to silicic arc-related eruptive products (Table 1). Anhydrite considered to be a primary igneous mineral has also been described from plutonic rocks ranging in composition f r o m picritic gabbros to granitic rocks (Table 1). Anhydrite-bearing magmas are found in arc environments and usually contain mineral assemblages that record hydrous, oxidized (>NNO) conditions and temperature between 650 and 900 °C (Table 1). In the volcanic and plutonic examples listed in Table 1, pyrrhotite (or pyrite) or iss always is present with anhydrite, with two exceptions: the Sutter Buttes andesite (Luhr 2008) and the Cajon Pass tonalite (Barth and Dorais 2000). Anhydrite often coexists with sulfur-rich apatite (from 50 ppm to >0.4 wt% S) in silicate melts, depending on temperature and/^,, conditions (Baker and Rutherford 1996). Particular attention has been paid to the presence of anhydrite in volcanic systems in the last two decades because some recent explosive eruptions have produced one to two orders of magnitude more sulfur dioxide than could have been dissolved in the melt phase of the erupted magma. This is known as the "excess sulfur" problem and the breakdown of anhydrite has been evaluated as a possible source for this "excess" sulfur (Baker and Rutherford 1996; Rutherford and Devine 1996; Swanson and Kearney 2008).
Figure 4. Microphotographs of magmatic sulfates, (a) Backscattered electron images of isolated anhydrite (anh) crystals and S-rich apatite (ap) surrounded by vesiculated glass in 1982 El Chichón pumices (Luhr 2008); (b) Crystals of haiiyne (hyn), lazurite (laz) and nosean (nsn) taken with transmitted light microscopy from haiiynophyre lava from Mt. Vulture, Italy (Di Muro et al. 2004); (c) Thin section of scapolite in basanite fromChuquet-Genestoux, Chaîne des Puys (photo courtesy of P. Boivin) (Boivin and Camus 1981). an: anorthite, ap: apatite, br: outer opaque rim. {Figure 4a was reproduced with permission from Elsevier from Luhr (2008) Journal of Volcanology and Geothermal Research, Vol. 175, p. 394-407; Figure 4b was reproduced with permission from the Mineralogical Society of Great Britain and Ireland from Di Muro et al. (2004) Mineralogical Magazine, Vol. 68, p. 591-614, Fig. 2c}
294
Parat, Holtz,
Streck
Magmatic minerals of the sodalite-group are haiiyne (Na,Ca) 4 _ s (Al 6 Si 6 (0,S)24)(S0 4 ,Cl) 1 _2 and nosean Na s (Al 6 Si 6 0 2 4 )(S0 4 ) (Fig. 4b). Haiiyne and nosean are Si-poor, Al-rich tectosilicates that are distinguished chemically from pure sodalite (Na s (Al 6 Si 6 0 2 4 )Cl 2 ) by the replacement of CI by S 0 4 (Tracy 2003; Deer et al. 2004) (Fig. 5a). In addition, Ca is incorporated in various concentrations by nosean and especially haiiyne (Fig. 5b). Haiiyne and nosean are found as magmatic minerals in some alkaline (quartz-undersaturated) magmatic rocks and carbonatites (e.g., Oldoinyo Lengai, Dawson et al. 1994; Zaitsev et al. 2009). Furthermore, both haiiyne and nosean have also been reported from intraplate trachyandesite, tephrite, phonotephrite and phonolite at several locations around the world (see typical examples in Table 1 and their composition in Fig. 5). Haiiyne is a common mineral in rocks associated with alkaline volcanism from Central Italy (Table 1) (Cavarretta and Lombardi 1990). The Nosean phonolite of Wolf Rock, Cornwall, is well known for its abundant zoned phenocrysts of nosean (Harrison et al. 1977). The incorporation of both CI and S in the minerals of the sodalite group is potentially useful to constrain the evolution of volatile concentrations in quartz-undersaturated magmatic systems. For example, Holm et al. (2006) noted that the C1/S0 4 ratio in haiiyne increases with the Na/(Na+K+Ca) ratio, which is interpreted as reflecting the increase of the C1/S0 4 ratio in magmas with increasing degrees of differentiation from nephelinite to phonolite. However, use of C1/S0 4 in sodalite group minerals to constrain volatile concentrations in magmas remains
• • O O X A A A A +
Worner and Schmincke 1984, Eifel Tracy 2003, Tahiti Bryan 2006, Canary Island Holm et al. 2006, C a p e Verde Renzulli et al. 1998, Italy Stoppa et al. 2002, Italy De Flno e t a l . 1986, Italy Cavarretta and Lombardi 1990, Italy Di Muro et al. 2004, Italy Zaitsev et al. 2009, Oldoinyo Lengai
• •
•
• *
.A A ¿0
°AS>
^
A
+
0
0.5
a
•
A
A
o
1.0 1.5 CI wt%
A
•2 0.4 0.3
Bodies & Deep
S/(Fe+Ni+Co) O TO"5 * K/ii • S/Si
0,6
Ë o
in Extraterrestrial
• 10* K/S *
0.1
\
\ solar1 solar2 Orgueil' CI3
CM3 CV3
CO3
CK4
ca rbonaceo us c h o n d rites
CRa
CH4
H3
LL
EH3 EL3 PUM5
ordinary chondrites
Figure 2. Atomic ratios of canonical "solar" composition, meteorites, and the primitive upper mantle (PUM) of Earth. Undifferentiated compositions include carbonaceous (Orgueil, CI - CH), ordinary (H - LL), R chondrites, and enstatite chondrites (EH - EL). For EH chondrites, S/O = 0.103, for PUM, K/S = 0.787. Sources (superscripts): 'Anders and Grevesse (1989). 2 Lodders (2003), 3 Wasson and Kallemeyn (1988), 4 Lodders and Fegley (1998), 5 McDonough and Sun (1995).
(asteroids) have either lost, or never accreted, a significant sulfur component. Most, but not all, lunar rocks are strongly depleted in sulfur, relative to Earth's mantle. Initial results from the Stardust mission indicate a lower limit (2a) elemental ratio of S/Fe > 0.31 in the rocky portion of Comet Wild 2, the only comet ever sampled directly (Westphal et al. 2009). The most metal-rich ordinary chondrites (H) and volatile-depleted carbonaceous chondrites (CV, CO, CK, CR), have similar, low atomic S/(Fe+Co+Ni) ratios (Fig. 2). Figure 1 schematically summarizes the hierarchical accretion of planetary bodies from |in>sized clasts and sub-)im sized matrix to progressively larger bodies. Silicate melts appear to have been formed in the earliest phases of solar system evolution, and chondrules show evidence of repeated melting events. While the heating mechanisms for CAIs and chondrules are not known, the heating of bodies >20 km in diameter is understood to result from the decay of radioactive elements that were more abundant in the early solar system than they are today. Fully melted CAIs, rare components in CV chondrites, yield the oldest U/Pb ages of any rocks formed in the solar system. Silicate melts and sulfur are involved in every phase of planetary evolution, from accretionary impacts through core/mantle differentiation to volcanism and subduction (Fig. 1). In cosmochemistry, "volatile" elements include sulfur and others that remain in the vapor phase when a vapor of solar composition cools to below ~477 °C at a total pressure (Ptota!) of 10 -4 bar. The solar abundance of S is preserved in at least the CI chondrites, and perhaps also in comets, suggesting that these bodies sampled solids equilibrated with a vapor of solar composition down to at least 431 °C , the temperature at which FeS becomes stable against evaporation at Ptota! = 1 0 ^ bar (Lodders 2003). Imagine that the midplane of the protoplanetary disk (the rotating disk of gas and mineral dust from which the planets formed) around the sun concentrated dust rich in high-temperature silicate condensates. At the enhanced dust/gas ratios expected in the midplane of the protoplanetary disk, solid or liquid sulfides would form at higher temperatures (Ebel and Grossman 2000; Ebel 2006). These are chemical systems where the vapor pressure, primarily due to H 2 , is constant, but solid dust particles are more abundant, increasing the overall abundance of elements that are concentrated in dust (Si, Mg, Al, Ca, Fe, O). In the most S-rich meteorites, however, S is in sulfates and sulfides formed at low temperatures during parent body aqueous and thermal alteration. Davis (2006) summarizes the debate over volatile depletion in meteorites (including S).
Ebel
318 Sulfur content of the terrestrial planets
During and after planetary accretion, silicate, sulfide, and metallic melts form discrete but dynamically and chemically interacting reservoirs. Chemical composition, particularly sulfur content, strongly controls the distribution of elements among these reservoirs. Planetary core formation involves gravitational removal of metal and/or sulfides from silicates at pressures from ~4 GPa (the Moon's core/mantle boundary), to 140 GPa (Earth's core/mantle boundary). Fractional crystallization of cores of small bodies (e.g., parent bodies of iron meteorites) involves metal-sulfide liquid equilibria at low pressures. Planetary evolution is therefore strongly influenced by sulfur content. Albarede (2009) points to volatile depletion, particularly of S (Dreibus and Palme 1996; O'Neill and Palme 1998), in arguing for the late delivery of water, which is also volatile, to all the terrestrial planets. Volatility is conveniently indexed by the temperature at which 50% of an element has condensed to solids from a cooling vapor of solar bulk composition. While the K/U ratio is a frequent proxy for volatile/refractory mixing in discussions of the compositions of planets (Fig. 2), S has a 50% condensation temperature (Tx%) of 391 °C, 342 °C below that of K (potassium) in a vapor of solar composition at Ptotai = 10~4 bar (Lodders 2003). Because of its high solar system abundance, S should therefore unambiguously record volatile depletion or partial condensation in planetary bodies. Other volatile, moderately siderophile and chalcophile elements (Ga, Cu, P, Sn) are also likely to record pre-accretionary partial condensation (Humayun and Cassen 2000; Righter and Drake 2000), and not later, post-accretionary processes. Earth's mantle composition can be inferred from upper mantle rocks sampled as xenoliths in magmas from deep sources (Becker et al. 2006; Carlson and Boyet 2008). McDonough (2003; cf. Boehler 1996) reviews our understanding of the composition of the Earth's core, which cannot be measured directly, although the size and density of Earth's core are well known. Curves comparing element volatility to upper mantle abundances for lithophile elements can be interpolated to S, C, and P to infer bulk Earth compositions (Fig. 3). The upper mantle deficits in S, C, and P must then be compensated by an excess in the core, to bring P, S, and C abundances up to the volatility trend line. Thus the core is inferred to contain ~90% of the Earth's C and P, and -98% of its S (McDonough 2003). But this C-P-S combination (6080% being S) can account for only ~2.5 mass% of the core, requiring another light element, probably Si, maybe O (Hillgren et al. 2000; Wade and Wood 2005; Wood et al. 2008). Several mechanisms have been proposed for volatile loss (including S) from the terrestrial planets and asteroids, and from the parent bodies of the iron-rich meteorites. Either bodies did not accrete volatiles at all (partial condensation), or volatiles were lost through magmatic processes, or heating by impacts. Data for K isotopes (Humayun and Clayton 1995) indicate that if planetary scale evaporative loss did occur, for example at the top of a magma ocean, it did not fractionate light from heavy K isotopes. Nor are any significant enrichments in heavy S isotopes observed among components of chondritic meteorites (Alexander et al. 2000; Alexander and Grossman 2005; Marini et al. 2011, this volume). These results indicate that S was only partially condensed, in isotopic equilibrium with condensates, into terrestrial planetary bodies, including most asteroids.
EXPERIMENTAL CONSTRAINTS Element partitioning Silicate melts are central to discussion of core-mantle differentiation and the histories of meteorite parent bodies. Once a molten core forms inside a planet, core solidification involves differentiation of solid crystalline metal from liquid metal-sulfide (Ohtani et al. 1997). Constraints on parent body processes can be provided by the equilibrium partitioning of highly siderophile elements (HSE): Ru, Rh, Pd, Re, Os, Ir, Pt, Au; moderately siderophile elements
Sulfur 1500
in Extraterrestrial 1300
1100
900
Bodies & Deep 700
Earth
319
500 °C
F i g u r e 3. V o l a t i l e - d e p l e t i o n trend a n d e x p e c t a t i o n f o r S a n d P c o n t e n t of b u l k E a r t h . T h e a b u n d a n c e in the silicate p o r t i o n of the E a r t h ( M c D o n o u g h 2 0 0 3 ) relative t o C I c h o n d r i t e s ( L o d d e r s a n d F e g l e y 1998), is p l o t t e d a g a i n s t the t e m p e r a t u r e ( r 5 0 % , ° C ) at w h i c h 5 0 % of the s o l a r c o m p l e m e n t of e a c h e l e m e n t w o u l d c o n d e n s e f r o m a v a p o r of b u l k s o l a r c o m p o s i t i o n at Ptotai = lO^ 4 b a r ( L o d d e r s 2 0 0 3 ) . F o r c a r b o n , = - 2 2 3 °C. T h e d a s h e d line a p p r o x i m a t e s the e x p e c t e d b u l k E a r t h volatility t r e n d , a n d d a s h e d v e r t i c a l lines b e t w e e n that t r e n d a n d m e a s u r e d m a n t l e c o m p o s i t i o n s (stars) illustrate h o w c o r e P a n d S c o m p o s i t i o n s m a y b e i n f e r r e d . See a l s o O ' N e i l l a n d P a l m e ( 2 0 0 8 , their F i g . 3; m a n y o t h e r v e r s i o n s of this figure exist in the literature).
(MSE): Fe, Co, Ni, Cu, Mo, Ag, W; and chalcophile elements (Cu, Zn, Ga, Ge, As; Ag, Cd, In, Sn, Sb) between coexisting phases (e.g., silicate melt and metal-sulfide liquid) at high temperatures. The HSE strongly partition into planetary cores (Becker et al. 2006). HSE isotopes (e.g., of Os) may be tracers of mantle plume sources on Earth (Brandon and Walker 2005; Van Orman et al. 2008). MSE and chalcophile elements in planetary mantles provide other useful tracers of core formation, because these elements partition less completely into cores (Mann et al. 2009). In 1977, Kelly and Larimer lamented the omission of many siderophile elements from cosmochemical research, "owing to the almost complete lack of data on distribution coefficients in metal-sulfide-silicate systems, a void that hopefully can soon be filled." Today, much of that void has been filled (Righter 2005). In part this is due to improved methods for traceelement analysis such as laser ablation inductively coupled plasma mass spectrometry (LAICPMS, e.g., Campbell and Humayun 1999), and nanoscale secondary ion mass spectrometry (SIMS, e.g., Stadermann et al. 1999). Improved techniques allow experiments that reach high temperature and pressure conditions, using multianvil apparatus (reaching the base of Earth's upper mantle, ~25 GPa, ~2000 °C) and the diamond anvil cell (reaching Earth's core/mantle boundary, ~135 GPa, >3200 °C; e.g., Campbell et al. 2007). Questions and challenges do remain, as reviewed by Righter and Drake (2003). These include limited partitioning data for moderately siderophile elements (e.g., Sb, As, Ag, Ge); gaps in the experimental database for metal-silicate melt partitioning; limitation of most experiments to basaltic melts, rather than the peridotitic melts of the early mantle; and insufficient high-temperature, high-pressure mineral/melt partitioning data to allow broad application of crystal chemical concepts such as elastic strain theory (Stewart et al. 2009). Distribution coefficients between solid metal and liquid metal-sulfide (DM/s"~'"), sulfurfree metallic liquid and silicate melt (£)'»-'»/s'-'»); metal-sulfide melt and silicate melt (£)s"-'»/s'-'»);
320
Ebel
or metal-sulfide melt and crystalline silicate depend upon oxygen fugacity (fo2), temperature (7), pressure (P), and the compositions of coexisting phases (Baker and Moretti 2011, this volume; Parat et al. 2011, this volume). Distribution coefficients are a convenient way to parameterize equilibria that are more correctly described by chemical thermodynamics and the free energies of exchange reactions as functions of the activities of all participants in those reactions. Thus exchange reactions with strong volume changes will be more pressure dependent, and those with large entropy changes more temperature dependent. Righter and Drake (2003) present a thermodynamic approach for understanding the subtle interplay of f0l, T, P, and composition, particularly sulfur. Walker and Li (2008) demonstrate the superiority of a thermodynamic understanding in disentangling the effects of pressure and composition on the marginally siderophile element Mo, which becomes chalcophile (DM/su~m(Mo) decreases) at 1100 °C from 0 to 6 GPa in the Fe-S system. The reader is referred to the contribution by Baker and Moretti (2011, this volume) for the thermodynamics of S partitioning between silicate melts and other phases. For most purposes, D values (ratios of concentrations in wt%) based on specific experiments or parameterizations (e.g., using the ratio of non-bridging oxygens to tetrahedral cations, NBO/T, to describe melt polymerization, rather than a full equation of state for the silicate melt) are used in the literature. The convention is, for example = (wt% X in metal/sulfide melt) / (wt% X in silicate melt). Liquid silicate - liquid metal-sulfide In planetary interiors undergoing differentiation, silicate liquids float and the denser immiscible metal-sulfide liquids sink. Experimental constraints allow modeling of this process based on observed abundances of elements in rocks from differentiated bodies, including the Earth. Pressure is very important in large bodies (e.g., Earth), and much less so in small ones (e.g., Mercury, asteroids). Sulfur strongly partitions into liquid metal-sulfide, with B su ' mJs, ' m (S) increasing with increasing FeO activity in silicate melt, increasing pressure, and decreasing temperature (Rose-Weston et al. 2009, their Eqn. 12). Elements such as Ni, W, Os, and Re that partition strongly into solid metal rather than metal-sulfide liquid (high DM/su~m) will also have jsu-m/si-m v a i u e s that decrease with increasing sulfur abundance in metal-sulfide liquid (Righter 2005). Thus sulfur abundance (and also C content) strongly influences element partitioning during differentiation (Li and Agee 2001; Li and Fei 2003). A vast literature exists on the partitioning of trace elements between metal-sulfide melt and silicate melt at various pressures, temperatures, and imposed f0r Mann et al. (2009) recently investigated lithophile and weakly-siderophile element partitioning in C-, and S-bearing systems from 2 to 24 GPa, 1750-2600 °C, and log fQl = IW-1.3 to IW-4.2, where IW refers to the iron-wiistite oxygen fugacity buffer curve. Applied to the Earth's mantle abundances of those elements, their results indicate that the Earth's core differentiated from the mantle at high pressures. Corgne et al. (2007) recently investigated K partitioning between peridotitic melt and Fe-Ni-S-C-O liquids at 1650-2200 °C and 1.0-7.7 GPa, showing that Dsu'mJsi'm (K) remains very low even at high pressure and S content. Recent work has extended the experimental database to more volatile chalcophile elements, such as Sb (Corrigan et al. 2009; Righter et al. 2009b), and Te and Se (Rose-Weston et al. 2009). The laser-heated diamond anvil cell (DAC) allows experiments at deep-mantle pressures, albeit with more difficulty in the control of temperature gradients. Jephcoat et al. (2008) review results for Ni, Co, I, and noble gases in S-free systems, where Dm~mJs,~m for Ni and Co converge to similar values of 20 < om'm/sl'm(iMi, Co) < 30 above 30 GPa (to 52 GPa) at 2227-3263°C and log fQl = IW-2.0. Increasing numbers of S-bearing experiments are being done that are relevant to S-mediated partitioning at very high pressures. Bass and Parise (2008) review new techniques being applied to understanding mineral-melt interactions at ultra-high pressures.
Sulfur
in Extraterrestrial
Bodies & Deep
Earth
321
Many difficulties occur in partitioning studies of platinum group elements (PGEs) in silicate melts at high P and T. These include the low solubilities of PGEs in silicate liquids, and control of/o, (Righter and Drake 2003). An additional issue is the interpretation of nanonuggets in run products as either quench products of initial heating to high temperature (Cottrell and Walker 2006), or part of the equilibrium metal assemblage at run conditions (Ertel et al. 2006, 2008). Cottrell and Walker (2006) provide strong evidence for the former in the case of Ds"""'/s'""'(Pt). Recently, Righter et al. (2008) have overcome many of these problems in studying Ds"""'/s'""'(Pd) in both graphite and MgO capsules followed by LA-ICPMS analysis. They found large decreases in ^»-'"¿»-'»(pd) approaching 12 GPa and 1900 °C. They investigated both Fe-S and Fe-S-C liquids, with silicate liquid compositions closer to expected peridotitic Earth mantle compositions, in contrast to earlier work (Holzheid et al. 2000). The role of S in these experiments was critical, as S and C in the metallic liquid are known to decrease ^"-'»/«-'»(pd) in experimental systems (Chabot et al. 2006). Generally, Ds"-",/s'-"' of high-valence elements (W, Ga, P, Mo) increase with silicate melt polymerization, while low-valence elements (Co, Ni) are negligibly affected. Figure 4 illustrates the large effect on D'"'"^''"' for Ga, W and P in S-free experiments from polymerized rhyolitic melts to depolymerized peridotitic melts, in terms of the ratio of non-bridging oxygen atoms to tetrahedrally coordinated cations, NBO/T (Mysen 1991). Both C and S in metallic liquid can have large effects on Ds"-",/s'-"' (Jana and Walker 1997), as can the major element composition Ni/(Fe+Ni) in the metallic liquid. Solid metal - liquid metal-sulfide Partitioning of metal-sulfide melts from silicate melts is followed by separation of solid metal from liquid metal-sulfide in planetary differentiation. Products of these metal-sulfide systems are represented by iron meteorites. Models for the fractional crystallization of iron meteorites, and inferences about their parent differentiated planetary bodies, depend on experimental data. In partially molten Fe-S-metal systems, S is strongly concentrated in the
Figure 4. Effect of silicate melt composition on S-free metal-liquid silicate-melt partition coefficients (D""" A ""). after Righter and Drake (2003, their Fig. 6). Experimental data for Co, W, Ga from Jaeger and Drake (2000), P from Pak and Fruehan ( 1986).
322
Ebel
liquid. As the concentration of S in the liquid increases at low pressure, most siderophile elements partition more strongly into the solid metal (Fig. 5). Scott (1972) estimated distribution coefficients from measurements of concentrations in coexisting sulfide nodules (that were once sulfide liquid) and surrounding metal in iron meteorites. Jones and Malvin (1990) compiled experimental data, and devised a parameterization of DM/s"~'" for many trace elements at 1 bar, based on the availability of metal domains in Fe-Ni-S-P-C liquids. That is, siderophile element preferences for liquid depend on the abundance of atomic-scale locations that are free of non-metals. This powerful method, revised by Chabot and Jones (2003), allows prediction of partitioning behavior in a wide range of circumstances. Table 1 gives fit parameters Da and P for partition coefficients of elements /', DM/s"~"'(i), expressed as ratios of wt%: (Fe domains/
wt% S in liquid m e t a l Figure 5. Parameterizations and data for solid metal-liquid metal partition coefficients (D M/s ""') of Chabot and Jones (2003). Experimental data for Au, Ge and Ir are as compiled by Chabot and Jones (2003) and plotted in Chabot and Haack (2006, their Fig. 8), shown for comparison to fitted curves (Table 1) for those elements, and fits for other elements (Re, W, Co, Ni, P). Fit for Ga is very close to Ge, and Os is very close to Re. Of the elements shown, only Cu is chalcophile.
Sulfur in Extraterrestrial Bodies & Deep Earth
323
Table 1. Fit parameters for D M/su - m (wt% in solid metal / wt% in liquid metal sulfide) for siderophile elements at 1 bar pressure (Chabot and Jones 2003). Element
D0
P
As
0.22
2.2
Au
0.25
2
Co
1
1.2
Ga
0.78
2.6
Ge
0.66
3
Ir
1.5
4.9
Ni
0.86
0.6
Os
2
5.1
P
0.06
2.8
Pd
0.43
1.1
Pt
0.81
4.4
Re
2
5
W
1.2
3.6
where the fraction of Fe domains in the Fe-Ni-S system that are non-metal free is calculated as: (Fe domains) =
fl — IX ) s (l-*s)
-
(2)
where X s is the mole fraction of S in liquid. In the Fe-Ni-S-P-C system the fraction of Fe domains is given as: (Fe domains) =
2
—
(1 -Xs -2XP -2XC)
(3)
where Xv and Xc are the mole fractions of P and C in liquid, respectively. This is a logical framework, grounded in the success of associated solution theory in describing the thermodynamic behavior of sulfide melts (Chang and Hsieh 1987; Kress 2000, 2003). Associated solution theory is a general scheme for treating liquids as aggregates of associated and free atoms (e.g., Fe + Fe-S + S) in developing models for liquid thermodynamic properties. Partitioning in metal - metal-sulfide systems appears to be weakly pressure-dependent to moderate pressures (to 8 GPa, Jones and Walker 1991). Recent high-pressure experiments include work by Hayashi et al. (2009), Lazar et al. (2004), Stewart et al. (2009), Van Orman et al. (2008), Walker (2000), and Walker and Li (2008). Sulfide saturation and immiscibility This topic is discussed in detail in this volume by Baker and Moretti (2011). A great deal of experimental work exists to constrain the S content at sulfide saturation ( S C S S ) of silicate liquids at pressures below 9 GPa. Liu et al. (2007) compared their model for S C S S with those of Holzheid and Grove (2002), Li and Ripley (2005), and Scaillet and Pichavant (2005). They report that sulfur solubility in silicate melts (in equilibrium with sulfide) increases with temperature and f0l, but decreases with pressure and the degree of melt polymerization. Holzheid and Grove (2002) calculated that up to 12 wt% S is stable in a metallic liquid in equilibrium with a magma ocean containing 200 ppm S, similar to the Earth's mantle. That value allows S to be the dominant light element in the core, but only if the Earth's S content does not follow the volatility trend seen in lithophile elements (Fig. 3).
324
Ebel
Corgne et al. (2007) have found that immiscible S-rich and C-rich liquid alloys coexist up to ~5.5 GPa, in experiments on a "chondrite-like" composition at conditions up to 2200 °C and 7.7 GPa. These exciting results suggest that in small planetary bodies, particularly with enhanced C and S contents, significant stratification of a molten core would have been likely to occur. Rheology: wetting and deformation The rheology of silicate partial melts and the wetting behavior of coexisting sulfide melts are increasingly recognized as important influences on core/mantle differentiation and the eventual distribution of trace elements in planetary bodies. Experimental studies of wetting behaviors of Fe-Ni-S-O liquids show that migration of such liquids through an olivine-rich matrix would be highly inefficient below 11 GPa in reduced systems (Minarik et al. 1996; cf. Mungall and Su 2005). Gaetani and Grove (1999) found that sulfide liquids wet olivine, forming interconnected networks at high/o 2 (FMQ) in 1 bar, 1350 °C experiments. In the late stages of core formation, and in some planetary environments, wetting therefore facilitates the transport of siderophile elements. Sulfide liquids may, therefore, variably fractionate more chalcophile Os and Pb from lithophile Re, U, and Th, depending upon how efficiently they wet surfaces of silicates. Deformation may have important effects while a planetary body is hot and actively differentiating into a core and mantle. Kohlstedt and Holtzman (2009) recently reviewed experiments designed to improve our understanding of deformation in the process of melt extraction, including systems containing metal-sulfide liquid (Bruhn et al. 2000; Holtzman et al. 2003). High-temperature shear deformation experiments on planetary precursor materials provide constraints on how cores might form in planetesimals subject to impacts. Rushmer et al. (2005) contrasted buoyancy mechanisms for core segregation with shear-induced segregation in response to impacts. The efficiency and rate of transport of metal-sulfide liquid depend upon both the degree of melting and the shear stress in Rushmer et al.'s (2005) model. The apparent solubility of S in Fe-rich metallic liquids segregating to the core of a chondritic planet is sensitive to the rate of liquid transport. Thus shear stress on a planetesimal can affect the partitioning of S and highly siderophile elements into the core, and can also drive return flow of siderophile elements back into the mantle. Sulfur may play an important role in mass transfer between metallic planetary cores and partially molten silicate mantles. Rushmer et al. (2000) reviewed the physical processes of core formation. If sulfide "wets" silicate grains in a partially molten mixture, the sulfide can form a continuous path between reservoirs of metallic material. Wetting behavior depends primarily on surface tension of liquids, and small amounts of electrical current can affect the surface properties of metal-sulfide liquids. Recently Kavner and Walker (2006; cf. Kavner et al. 2007) explored the "electro-wetting" of silicates by sulfide liquid under an imposed potential of 1 volt, to simulate possible effects of current flow across Earth's core/mantle boundary. Experiments showed dramatic electrochemical effects, including enhanced wetting by sulfide, indicating that small electrical currents can enhance the percolation of sulfide liquids into silicate partial melts (core or mantle). PLANETARY INTERIORS Iron meteorites Upon melting of a bulk planetesimal of chondritic composition, dense, metal-sulfide melts (siderophile) differentiate from less dense silicate melts (lithophile) to form cores and mantles of planetary bodies. These cores further fractionate as solid metal crystallizes from metal-sulfide liquid, progressively enriching that liquid in less siderophile elements. Thus the compositions of iron meteorites record the histories of the cores of the earliest planetary
Sulfur in Extraterrestrial
325
Bodies & Deep Earth
bodies in the solar system, prior to their disruption by collisions (Uhlig 1954; Allan and Jacobs 1956). Improvements in isotope and trace-element measurements have made possible increasingly accurate chronologies of planetary accretion and differentiation (reviewed by Halliday and Kleine 2006; cf. Burkhardt et al. 2008; Cook et al. 2004), and inferences about the compositions of the silicate mantles that are missing from the iron meteorites. Rocks potentially from differentiated parent bodies represent less than 13.7% of meteorite falls, and only 5.2% of all falls are iron or stony iron, based on statistics of U.S. Antarctic finds (Zolensky 1998). Those percentages include a small number of stony irons produced in extraterrestrial impacts, and iron meteorites that were not formed by magmatic processes. Most iron meteorites contain between 5 and 10 wt% Ni, 0.5-1.0 wt% Co, 0.2-0.6 wt% S, 0.10.3 wt% P and 0.01-0.2 wt% C (originally as Fe-carbides, Lipschutz and Anders 1961). Iron meteorites survive impact and weathering longer and in larger pieces than stony meteorites, so are over-represented in non-Antarctic meteorite collections. Buchwald (1975) described nearly all known iron meteorites in detail, and recent reviews of non-chondritic meteorites (achondrites) include Mittlefehldt et al. (1998), Haack and McCoy (2003), Chabot and Haack (2006), McCoy et al. (2006). The sub-solidus exsolution of Fe-rich and Fe-poor crystalline metal phases (Widmanstatten patterns) and concentration profiles of trace elements in those phases in iron meteorites allow inferences of the cooling rates and parent body sizes of those meteorites (Goldstein et al. 2009). Sulfide liquid nodules in iron meteorites separated from the surrounding iron-nickel alloy during cooling. Because Pb is chalcophile and U is highly lithophile, magmatic sulfide (troilite, FeS) inclusions in iron meteorites record the least radiogenic Pb of any known solar system materials. The elements in these inclusions fractionated into iron liquid from silicate magmas, and then fractionated from the crystallizing iron cores of their parent planetary bodies. The primordial Pb composition of the solar system has been referenced against troilite from the Canyon Diablo iron meteorites for nearly forty years (Canyon Diablo troilite, CDT, Tatsumoto et al. 1973). Recently Blichert-Toft et al. (2010) revised these values based on a study of sulfide inclusions in a range of iron meteorites, and the discovery of more primitive Pb isotopic signatures in the Nantan iron meteorite. From correlations between Ni concentrations and trace elements, it is inferred that most iron meteorite compositions result from secondary fractional crystallization (also known as differentiation, or segregation) of solid metal alloy from metallic liquid. Dendritic crystallization is one likely mechanism (Haack and Scott 1993). Different geochemical groups of iron meteorites are distinguished by different trends of fractional crystallization, implying the existence of different parent body cores with different initial compositions of siderophile elements. Variations in Ga and Ge were first used to distinguish four "Ga-Ge" groups (Lovering et al. 1957). This taxonomy has been developed by Wasson and coworkers (e.g., Wasson 1967, Wasson 1974, Scott and Wasson 1975, Scott 1977a, Wasson 1985; Wasson and Kallemeyn 2002), to 13 groups based on ~600 iron meteorites (Wasson et al. 1989).
Sulfur in core fractionation Sulfur is the most chemically important non-metal in planetary cores differentiated from silicate melts. Solid metal/liquid metal partition coefficients ('p M / s u ' m ) deduced from trace-element variations within iron meteorite groups are consistent with D ~ measured experimentally. Non-equilibrium solidification assuming local equilibrium at a solid-liquid front, no backward diffusion of the solute, and complete liquid mixing can be modeled using the Schiel-Gulliver equation (Gulliver 1913; Schiel 1942). So the composition of the solid (C s o M ) at time t is given by M/su m
'solid
r\M/su-m ~
U
liquid initial
/1 U
3-S)
(/'/"' ~
l i
(4)
326
Ebel
where fs is the fraction of liquid solidified at time t, and CinitiJ,qu,d is the initial liquid composition. Trace element partition coefficients ('p M/su ' m ) between solid and liquid metal depend on concentrations of S, P, C (non-metals) in the liquid (Fig. 5, Table 1; Narayan and Goldstein 1982; Willis and Goldstein 1982; Malvin et al. 1986; Jones and Malvin 1990). The solar S/P ratio is 53 (Lodders 2003), so the effect of S is expected to dominate fractional crystallization (Chabot et al. 2006). The effect of phosphorus on partitioning is less wellconstrained at high pressure for many trace elements, and has been shown to be negligible at 1 bar if S is present (Corrigan et al. 2009). From parameterizations of the experimental data, the initial S contents of the parent body cores of the magmatic iron groups have been estimated by modeling of crystallization trends considering multiple elements partitioning simultaneously. In this way, Jones and Drake (1983) calculated S/Ni mass ratios ranging from ~0 in the parent body cores of IVB iron meteorites, to 0.67 in cores of IIIAB irons, to 3.4 in the cores of IIAB iron meteorites. In undifferentiated meteorites, the same ratio ranges from 5.51 in CI to 1.64 in CV carbonaceous chondrites, to 1.25 in H ordinary chondrites (Wasson and Kallemeyn 1988). Chabot (2004) has used partitioning data to closely match trends for three iron meteorite groups, yielding 12.0 ± 1.5 wt% S in IIIAB, 17.0 ± 1.5 wt% S in IIAB, and 1 ± 1 wt% S in IVB iron meteorite parent body cores. She accounted for S exclusion from solids, and resulting nonconstant partition coefficients, in modeling core crystallization. These S contents are consistent with other studies of fractional crystallization of the IIIAB parent body core (Haack and Scott 1993; Ulff-M0ller 1998; Chabot and Drake 1999), but higher than those based on measurements of troilite nodule abundance in meteorites representing different crystallization stages. In the studies based on nodule measurements (e.g., Wasson and Choi 2003), measurements of S in a series of meteorites representing different stages of crystallization are extrapolated back to the S content at zero crystallization using models to estimate the fraction of trapped melt and degree of crystallization. The ratio of sulfur to the bulk metal+sulfide content, S/(S+Fe+Co+Ni) where values are in wt%, ranges from 23.4 in CI to 8.1 in CV to 6.4 in H chondrites (Fig 2, above; Wasson and Kallemeyn 1988). Thus there is wide latitude for assumptions about the initial S depletions in the parent magmas of the iron meteorites, but the IIIAB and IIAB groups appear to have retained a significant proportion of the solar S component in their cores. Yet, S-rich iron meteorites are rare and pallasites are also deficient in FeS. Ulff-M0ller et al. (1998b) concluded that a FeS liquid escaped or became concentrated in pallasite domains that are underrepresented in the meteorite record. So far, no meteorites anomalously enriched in S have been discovered, but not all extraterrestrial material is represented in the meteorite record. Several mechanisms have been proposed for S removal from differentiated asteroids early in solar system history, including outgassing of S during differentiation, removal as immiscible liquids, segregation of S into metastable liquid layers by partial melting (Kracher and Wasson 1982), and removal by explosive volcanism (Keil and Wilson 1993). The latter two ideas involve formation of FeS-rich partial melts at the Fe,Ni - FeS cotectic. Haack and Scott (1993) used detailed trace-element observations, guided by experiments, to infer the accumulation of S-rich liquid at the top of asteroid cores and in structural traps during dendritic crystallization of the IIIAB parent body core, represented by ~200 meteorites including Cape York. Segregated S-rich layers would survive disruption and the space environment for much shorter timescales than the mantles of the iron meteorite parent bodies, which are also largely missing from the meteorite record (Burbine et al. 1996; Chabot and Haack 2006). Earth core formation Compositional constraints on the Earth's core result from (1) analysis of upper mantle rocks, (2) experiments on partitioning between Fe-Ni-S-P-O liquids and solid or liquid silicates,
Sulfur
in Extraterrestrial
Bodies & Deep
Earth
327
and (3) comparisons with the meteorite record. Particularly with regard to (2), much progress has been made recently, as reviewed briefly above and by Wood (2008). Different mechanisms for Earth's accretion history and core formation cannot be ruled out by the evidence so far. Thus, controversy remains between single stage models of steady "homogeneous accretion" modified by pre-accretionary volatile depletion, with subsequent fractionation in a magma ocean (Wanke 1981; Wanke et al. 1984; Righter 2003), and multi-stage models of "heterogeneous accretion" involving singular or stochastic material addition, or upward recycling of the core (Kimura et al. 1974; Morgan et al. 1981; O'Neill 1991; O'Neill and Palme 1998; Wade and Wood 2005; Wood et al. 2009; Rose-Weston et al. 2009). Heterogeneous accretion includes the widely accepted addition of siderophile elements to the mantle by a "late veneer" (Chou 1978), suggested by the near-chondritic ratios of HSE in the mantle, and the overabundances of many HSE compared to their expected partitioning behavior. The hypothesis is that after Earth's core had been substantially differentiated (i.e., "late") from a reduced precursor, a "veneer" of oxidized chondritic material accreted and remained in the mantle (Drake and Righter 2002). Yet another possibility is that high-velocity impacts during the late stage of planetary accretion caused large fractions of material to be lost from the Earth and other terrestrial planets (Agnor and Asphaug 2004; O'Neill and Palme 2008). A central issue in understanding the formation of the Earth's core is that the abundances of Ni, Co, W, and HSEs (Os, Re, Ir, Ru, Pt, Rh, Pd, Au) in the primitive upper mantle, while very low, are higher than expected for a magma ocean in chemical equilibrium with the core, from experimental partition coefficient data. This controversy has been reviewed recently (e.g., Lorand et al. 2008). It is clear that sulfur is a crucial actor, based on all the experimental results mentioned above (Righter et al. 2008). Mass transfer across the core-mantle boundary could partly explain the composition of the mantle. This includes the possible return of core material to the mantle either in plumes from the early core-mantle boundary (McDonough 2003), or in asteroid and comet impacts during the late heavy bombardment of the inner solar system (Rushmer et al. 2005). Late or prolonged extraction of Pb to the core in sulfide liquid may have disturbed the U-Pb systematics of the mantle, relative to the W-Hf system (Hart and Gaetani 2006). Core-mantle communication may even influence the evolution of the Earth's interior to the present (Walker 2000; Kavner and Walker 2006). Righter and Drake (2003) build on the conclusion of Righter et al. (1997) that mantle Ni, Co, Mo, W and P abundances are consistent with equilibration of S-bearing liquid metal with hydrous liquid silicate near 27 GPa and 1925 °C and log/o 2 = IW-0.15, near the present-day upper/lower mantle boundary. This is known as the "deep magma ocean" hypothesis (Rubie et al. 2003). Righter et al. (2008) and Cottrell and Walker (2006) have shown by experiment that suprachondritic Pd/Ir and Pt/Ir, respectively, of the upper mantle (Becker et al. 2006) can be explained by metal sulfide melt - silicate melt equilibrium at the high pressure and temperatures of an early magma ocean. However, mantle Pd/Ir is not as high as experiments would predict for the even higher pressure and temperature conditions of a magma ocean suggested by Chabot et al. (2005) who find that core segregation conditions of 30-60 GPa, >1825 °C, and l o g / 0 2 = IW-2.2 are consistent with D"™'"^Ni) and Dsu-m/si-m(Co) parameterizations at 60% of its mass, unlike Venus and Earth, which have cores ~32% of their total mass. If Mercury is highly reduced, then Ca-, or REE-bearing S-rich liquids may have been extracted to its core, and the signature of such a history would be measurable by remote sensing of Mercury's surface from space. However, the volatile-depletion trend of the terrestrial planets suggests that S was very strongly depleted from its solar system abundance in the solids that combined to form Mercury (Fig. 3). Our most recent knowledge of Venus derives from the Magellan mission, as reviewed in Bougher et al. (1998). Pyrite is likely present on the 390-470 °C hot Venusian surface (Hong and Fegley 1998). Kargel et al. (1993) synthesized Venera and VEGA mission results, and recalculated major-element oxide compositions (from X-ray fluorescence data) and K, U, Th abundances (from gamma ray spectroscopy). Unfortunately, sulfur was not measured. All seven landers reported mafic volcanic compositions, with particularly K-rich signatures suggesting an anhydrous, carbonated mantle. Kargel et al. (1993) conclude that the mantles of Earth and Venus are geochemically very similar in other (non-volatile) respects.
Sulfur
in Extraterrestrial
Bodies & Deep
Earth
329
The chemical evolution of the Moon is thought to have been dominated by melting of the entire silicate mantle, creating a global magma ocean (Wieczorek et al. 2006). The liquid core that formed by differentiation in this period acted as a convecting dynamo (Garrick-Bethell et al. 2000). Although lunar magnetic activity has ceased, recent findings show the lunar core remains partially molten (Williams et al. 2001, 2004; Weber et al. 2011), and there are suggestions that the lunar mantle may still be degassing (Crotts and Hummels 2009). Weitz et al. (1999) found 600 ppm S in a melt inclusion from the source magma of lunar fire fountains, collected during the Apollo 17 mission. Condensates in vugs and vesicles yield lower limits on the sulfur content of erupted lavas (Fegley 1991). Sulfide replacement of silicates has been inferred from analysis of lunar breccias (Lindstrom and Salpas 1983; Shearer et al. 2010). The ratio of S to other chalcophile elements is higher in lunar basalts than terrestrial basalts (Heiken et al. 1991, p. 422), indicating that less sulfide was removed from the lunar mantle prior to mare basalt formation. The Moon's S content and its expression in surface rocks deserve more exploratory attention. Martian meteorites, the Mars Exploration Rover missions, and recent remote sensing studies have brought Mars into sharp focus. Results from Mars Global Surveyor allowed determination of a range of radii for the Martian core (1520-1840 km, mean Mars radius 3390 km), and also ruled out a completely solid core (Yoder et al. 2003). Stewart et al. (2007) conclude from a study of the Fe-Ni-S system at 23-40 GPa, and earlier work, that the Martian core is completely molten near the (Fe,Ni)-S eutectic, assuming a core composition range of 10.6-16.2 wt% S. This range is consistent with many previous studies (e.g., Wanke and Dreibus 1988), but not all (e.g., Gaetani and Grove 1997). By experimental work at Mars interior P-Tconditions, and by comparison with the Martian basaltic meteorite Shergotty (low A1 2 0 3 , high-FeO liquid), Righter et al. (2009a) have shown that Martian magmas can dissolve up to ~4000 ppm S at sulfide saturation, easily accounting for the sulfate-rich soils and layered deposits recently discovered by the Mars Exploration Rovers (McSween et al. 2004). Such surface rocks record oxidizing, acidic conditions involving extensive flux of water in the Martian past. Ghosal et al. (1998) used basaltic meteorites to infer a reduced, Fe-depleted Martian mantle. In the absence of subduction, the speciation of volcanic gases on Mars is critically dependent on the redox state of the Martian mantle (J. Jones, pers. comm.). Much is yet to be learned about the composition and evolution of Mars. The largest bodies in the asteroid belt are almost certainly differentiated (Greenwood et al. 2005). There is increasing evidence for thermal stratification of the main belt, such that S and other volatile elements are increasingly abundant outward (Ghosh et al. 2006). Asteroid 4 Vesta is known to be differentiated, and is the likely source of the howardite-eucrite-diogenite meteorite suite (Keil 2002), including products of serial silicate volcanism (Yamaguchi et al. 1997). From meteoritic and oxygen isotopic evidence, Boesenberg and Delaney (1997) and Lodders (2000, her Table 1) both estimated that Vesta contains ~6 mass% FeS in bulk, and an atomic S/Si ratio of 0.12 (see Fig. 2). The Dawn mission will return a wide range of data from orbit around both Vesta and Ceres (Russell et al. 2007). Volcanism on Io was reviewed by Geissler (2003). Galileo mission observations provided a revolutionary new understanding of Jupiter's moon (cf. Kargel et al. 1999). Io is the most volcanically active body in the solar system, with at least 152 active volcanic centers (Lopes et al. 2004). This activity is due to tidal forcing by Jupiter, which "kneads" its moon causing internal strain and heating. Volcanic exhalations on Io are very rich in sulfur, although their compositions are difficult to measure. Recent spectroscopic observations by the passing New Horizons mission revealed lower limits of magma temperatures of 880-1060 °C, consistent with basaltic lava enriched in volatile elements (e.g., F) or water (Spencer et al. 2007). Resurfacing of Io seems primarily to occur by plume eruptions, rather than large lava flows (Geissler et al. 2004). However, Radebaugh et al. (2004) concluded that the long-lived, variable over
330
Ebel
minutes, 1225-1325 °C, central region of Pele Patera is an overturning lava lake with a large, stable magma source. Pele's is one of several very S 2 -rich plumes observed with the Hubble telescope, each of which erupts huge quantities of S onto the surface (Jessup et al. 2007).
CONCLUSIONS To a first order, O, Si, Mg and Fe dominate planetary chemistry. But S is ~0.5x the Si abundance (~0.15x Si+Mg+Fe)). Thus S is a primary actor in both condensation chemistry (in the vapor phase, SiO (g) and SiS(g) compete for Si), and in the partitioning behavior of many elements that enter the cores of planetary bodies at low pressures (sampled in asteroids and iron meteorites) and high pressures (the inaccessible cores of the moon and planets). Future advances in understanding the role of S in extraterrestrial and deep planetary silicate melts will depend upon better experimental data, as well as improved abilities to model many trace elements simultaneously in investigating the interactions of silicate melts, metal-sulfide melts, and minerals. Both orbiter and lander missions to other planets will gradually increase the pool of measurements necessary for a better understanding of the roles of silicate melts and sulfur in the solar system. The processes reviewed in this chapter formed the 30880 kg Ahnighito fragment of the Cape York iron meteorite, on display in the American Museum of Natural History, which contains ~250 g Pt and ~25 g Au. Eventually, a deeper understanding of extraterrestrial silicate magmas and the role of sulfur in differentiation will enable humans to mine the asteroid belt.
ACKNOWLEDGMENTS The author is grateful for thoughtful and thorough reviews by H. Behrens, N. Chabot, and H. Palme, and constructive suggestions by J. W. Webster. All greatly improved this paper. The author acknowledges support from the National Aeronautics and Space Administration Cosmochemistry program (grant NNX10AI42G), and the American Museum of Natural History. This research has made use of NASA's Astrophysics Data System Bibliographic Services.
REFERENCES Agnor C, Asphaug E (2004) Accretion efficiency during planetary collisions. Astrophys J Lett 613:L157-L160 Albarede F (2009) Volatile accretion history of the terrestrial planets and dynamic implications. Nature 461:1227-1233 Alexander CMO'D, Grossman JN (2005) Alkali elemental and potassium isotopic compositions of Semarkona chondrules. Meteorit Planet Sci 40:541-556 Alexander CMO'D, Grossman JN, Wang J, Zanda B, Bourot-Denise M, Hewins RH (2000) The lack of potassium-isotopic fractionation in Bishunpur chondrules. Meteorit Planet Sci 35:859-868 Allan DW, Jacobs JA (1956) The melting of asteroids and the origin of meteorites. Geochim Cosmochim Acta 9:256-272 Anders E, Grevesse N (1989) Abundances of the elements: Meteoritic and solar. Geochim Cosmochim Acta 53:197-214 Baker DR, Moretti R (2011) Modeling the solubility of sulfur in magmas: a 50-year old geochemical challenge. Rev Mineral Geochem 73:167-213 Basaltic Volcanism Study Project (1981) Basaltic Volcanism on the Terrestrial Planets. Pergamon Press, Inc., New York. 1286 pp. (http://adsbit.harvard.edu/books/bvtp/) Bass JD, Parise JB (2008) Deep Earth and recent developments in mineral physics. Elements 4:157-163 Becker H, Horan MF, Walker RJ, Gao S, Lorand J-P, Rudnick RL (2006) Highly siderophile element composition of the Earth's primitive upper mantle: Constraints from new data on peridotite massifs and xenoliths. Geochim Cosmochim Acta 70:4528-4550
Sulfur in Extraterrestrial
Bodies & Deep Earth
331
Blichert-Toft J, Zanda B, Ebel DS, Albarede F (2010) The solar system primordial lead. Earth Planet Sci Lett 300:152-163 Boehler R (1996) Melting temperature of the Earth's mantle and core: Earth's thermal structure. Annu Rev Earth Planet Sci 24:15-40 Boesenberg JS, Delaney JS (1997) A model composition of the basaltic achondrite planetoid. Geochim Cosmochim Acta 61:3205-3225 Bottke WF Jr, Cellino A, Paolicchi P, Binzel RP (eds) (2002) Asteroids III. University Arizona, Tucson, 785 pp Bougher SW, Hunten DM, Phillips RJ (1998) Venus II: Geology, Geophysics, Atmosphere, and Solar Wind Environment, U Arizona Press, 1362 pp Bouhifd MA, Jephcoat AP (2003) The effect of pressure on partitioning of Ni and Co between silicate and ironrich metal liquids: a diamond-anvil cell study. Earth Planet Sci Lett 209:245-255 Bourdon B, Touboul M, Caro G, Kleine T (2008) Early differentiation of the Earth and the Moon. Phil Trans RSoc A 366:4105-4128 Brandon AD, Walker RJ (2005) The debate over core-mantle interaction. Earth Planet Sci Lett 232:211-225 Bruhn D, Groebner N, Kohlstedt DL (2000) An interconnected network of core-forming melts produced by shear deformation. Nature 403:883-886 Buchwald, VF (1975) Handbook of Iron Meteorites, Their History, Distribution, Composition and Structure. U California Press, Berkeley, CA Burbine TH, Meibom AA, Binzel RP (1996) Mantle material in the main belt: Battered to bits? Meteorit Planet Sci 31:607-620 Burkhardt C, Kleine T, Bourdon B, Palme H, Zipfel J, Friedrich J, Ebel D (2008) Hf-W systematics of Ca-Alrich inclusions from carbonaceous chondrites: dating the age of the solar system and core formation in asteroids. Geochim Cosmochim Acta 72:6177-6197 Campbell AJ, Humayun M (1999) Trace element microanalysis in iron meteorites by laser ablation ICPMS. Anal Chem 71:939-946 Campbell AJ, Seagle CT, Heinz DL, Shen G, Prakapenka V (2007) Partial melting in the iron-sulfur system at high pressure: A synchrotron X-ray diffraction study. Phys Earth Planet Inter 162:119-128 Carlson RW, Boyet M (2008) Composition of the Earth's interior: the importance of early events. Philos Trans RSoc A 366:4077-4103 Chabot NL (2004) Sulfur contents of the parental metallic cores of magmatic iron meteorites. Geochim Cosmochim Acta 68:3607-3618 Chabot NL, Agee CB (2003) Core formation in the Earth and Moon: new experimental constraints from V, Cr, and Mn. Geochim Cosmochim Acta 67:2077-2091 Chabot NL, Campbell AJ, Jones JH, Humayun M, Lauer HV Jr. (2006) The influence of carbon on trace element partitioning behavior. Geochim Cosmochim Acta 70:1322-1335 Chabot NL, Drake MJ (1999) Crystallization of magmatic iron meteorites: the role of mixing in the molten core. Meteorit Planet Sci 34:235-246 Chabot NL, Haack H (2006) Evolution of asteroidal cores. In: Meteorites and the Early Solar System II. Lauretta D, McSween HY Jr (eds) U Arizona, Tucson p 747-771 Chabot NL, Jones JH (2003) The parameterization of solid metal-liquid metal partitioning of siderophile elements. Meteorit Planet Sci 38:1425-1436 Chabot, NL, Draper, DS, Agee, CB (2005) Conditions of core formation in the Earth: constraints from nickel and cobalt partitioning. Geochim Cosmochim Acta 69:2141-2151 Chang YA, Hsieh K-C (1987) Thermochemical description of the ternary iron-nickel-sulphur system. 25th Annual Conference of Metallurgists (1986 CIM) Canadian Metallurgical Quarterly 26:311-327 Chou CL (1978) Fractionation of siderophile elements in the Earth's upper mantle. Proceedings of the 9th Lunar and Planetary Science Conference, pp 219-230 Cook DL, Walker RJ, Horan MF, Wasson JT, Morgan JW (2004) Pt-Re-Os systematics of group IIAB and IIIAB iron meteorites. Geochim Cosmochim Acta 68:1413-1431 Corgne A, Wood BJ, Fei Y (2007) C- and S-rich molten alloy immiscibility and core formation of planetesimals. Geochim Cosmochim Acta 72:2409-2416 Corrigan CM, Chabot NL, McCoy TJ, McDonough WF, Watson HC, Saslow SA, Ash RD (2009) The ironnickel-phosphorous system: Effects on the distribution of trace elements during the evolution of iron meteorites. Geochim Cosmochim Acta 73:2674-2691 Cottrell E, Fei Y, Ricolleau A, Prakapenka V (2008) Nickel partitioning between liquid metal and liquid silicate in the LHDAC: Techniques for achieving reliable partition coefficients. Lunar Planet Sci XXXIX #2267 Cottrell E, Walker D (2006) Constraints on core formation from Pt partitioning in mafic silicate liquids at high temperatures. Geochim Cosmochim Acta 70:1565-1580 Crotts APS, Hummels C (2008) Lunar outgassing, transient phenomena, and the return to the Moon II: Predictions and tests for outgassing/regolith interactions. Astrophys J 707:1506-1523 Davis AM (2006) Volatile evolution and loss. In: Meteorites and the Early Solar System II. Lauretta D, McSween HY Jr (eds) U Arizona, Tucson, p 295-307
332
Ebel
Drake MJ, Righter K (2002) Determining the composition of the Earth. Nature 416:39-44 Dreibus G, Palme H (1996) Cosmochemical constraints on the sulfur content in the Earth's core. Geochim Cosmochim Acta 60:1125-1130 Ebel DS (2006) Condensaton of rocky material in astrophysical environments. In: Meteorites and the Early Solar System II. Lauretta D, McSween HY Jr (eds) U Arizona, Tucson, p 253-277 Ebel DS, Grossman L (2000) Condensation in dust-enriched systems. Geochim Cosmochim Acta 64:339-366 Ertel W, Dingwell DB, Sylvester PJ (2008) Siderophile elements in silicate melts - A review of the mechanically assisted equilibration technique and the nanonugget issue. Chem Geol 248:119-139 Ertel W, Walter MJ, Drake MJ, Sylvester PJ (2006) Experimental study of platinum solubility in silicate melt to 14 GPa and 2273 K: Implications for accretion and core formation in Earth. Geochim Cosmochim Acta 70:2591-2602 Fegley B Jr (1991) Thermodynamic models of the chemistry of lunar volcanic gases. Geophys Res Lett 18:3073-3076 Gaetani GA, Grove TL (1997) Partitioning of moderately siderophile elements among olivine, silicate melt, and sulfide melt: Constraints on core formation in the Earth and Mars. Geochim Cosmochim Acta 61:1829-1846 Gaetani GA, Grove TL (1999) Wetting of mantle olivine by sulfide melt: Implications for Re/Os ratios in mantle peridotite and late - stage core formation. Earth Planet Sei Lett 169:147 - 163 Garrick-Bethell I, Weiss BP, Shuster DL, Buz J (2009) Early lunar magnetism. Science 323:356-359 Geissler PE (2003) Volcanic activity on Io during the Galileo era. Annu Rev Earth Planet Sei 31:175-211 Geissler PE, McEwen A, Phillips C, Keszthelyi L, Spencer J (2004) Surface changes on Io during the Galileo mission. Icarus 169:29-64 Gessmann CK, Wood BJ (2002) Potassium in the Earth's core? Earth Planet Sei Lett 200(l-2):63-78 Ghosal S, Sack RO, Ghiorso MS, Lipschutz ME (1998) Evidence for a reduced, Fe-depleted martian mantle source region of shergottites. Contrib Mineral Petrol 130:346-357 Ghosh A, Weidenschilling SJ, McSween HY Jr, Rubin A (2006) Asteroidal heating and thermal stratification of the asteroid belt. In: Meteorites and the Early Solar System II. Lauretta D, McSween HY Jr (eds) U Arizona, Tucson, p 555-566 Goldstein JI, Scott ERD, Chabot NL (2009) Iron meteorites: Crystallization, thermal history, parent bodies, and origin. Chemie Erde 69:293-325 Gounelle M, Shu FH, Shang H, Glassgold AE, Rehm KE, Lee T (2006) The irradiation origin of beryllium radioisotopes and other short-lived radionuclides. Astrophys J 640:1163-1170 Grady MM, Wright I (2006) Types of extraterrestrial material available for study. In: Meteorites and the Early Solar System II. Lauretta D, McSween HY Jr (eds) U Arizona, Tucson, p 3-18 Greenwood RC, Franchi IA, Jambon A, Barrat JA, Burbine TH (2005) Widespread magma oceans on asteroidal bodies in the early Solar System. Nature 435:916-918 Gulliver GH (1913) The quantitative effect of rapid cooling upon the constitution of binary alloys. J Inst Metals 9:120-157 (accessed via http://books.google.com) Haack H, McCoy TJ (2003) Iron and Stony-iron Meteorites. In: Meteorites, Comets and Planets. Treatise on Geochemistry. Volume 1. Davis AM (ed), Elsevier, p 325-345 Haack H, Scott ERD (1993) Chemical fractionations in Group IIIAB iron meteorites: Origin by dendritic crystallization of an asteroidal core. Geochim Cosmochim Acta 57:3457-3472 Halliday AN, Kleine T (2006) Meteorites and the timing, mechanisms, and conditions of terrestrial planet accretion and early differentiation. In: Meteorites and the Early Solar System II. Lauretta D, McSween HY Jr (eds) U Arizona, Tucson, p 775-802 Hart SR, Gaetani GA (2006) Mantle Pb paradoxes: the sulfide solution. Contrib Mineral Petrol 152:295-308 Hayashi H, Ohtani E, Terasaki H, Ito Y (2009) The partitioning of Pt-Re-Os between solid and liquid metal in the Fe-Ni-S system at high pressure: Implications for inner core fractionation. Geochim Cosmochim Acta 73:4836-4842 Heiken GH, Vaniman DT, French BM (eds) (1991) Lunar Sourcebook. Cambridge U Press, London Herndon JM (1996) Substructure of the inner core of the Earth. Proc Nat Acad Sei USA 93:646-648 Hillgren VJ, Gessmann CK, Li J (2000) An experimental perspective on the light element in Earth's core. In: Origin of the Earth and Moon. Canup RM, Righter K (eds) U Arizona, Tucson, p 245-264 Holtzman BK, Groebner NJ, Zimmerman ME, Ginsberg SB, Kohlstedt DL (2003) Stress-driven melt segregation in partially molten rocks. Geochem Geophys Geosyst 4:8607 Holzheid A, Grove TL (2002) Sulfur saturation limits in silicate melts and their implications for core formation scenarios for terrestrial planets. Am Mineral 87:227-237 Holzheid A, Sylvester P, O'Neill HSt.C, Rubie DC, Palme H (2000) Evidence for a late chondritic veneer in the Earth's mantle from high-pressure partitioning of palladium and platinum. Nature 406:396-399 Hong Y, Fegley B Jr (1998) The sulfur vapor pressure over pyrite on the surface of Venus. Planet Space Sei 46:683-690
Sulfur in Extraterrestrial Bodies & Deep Earth
333
Humayun M, Cassen P (2000) Processes determining the volatile abundances of the meteorites and terrestrial planets. In: Origin of the Earth and Moon. Canup RM, Righter K (eds) U Arizona Press, Tucson, p 3-23 Humayun M, Clayton RN (1995) Potassium isotope cosmochemistry: Genetic implications of volatile element depletion. Geochim Cosmochim Acta 5 9 : 2 1 3 1 - 2 1 4 8 Jaeger W L , Drake M J (2000) Solubilities of W, Ga and Co in silicate melts as a function of melt composition. Geochim Cosmochim Acta 6 4 : 3 8 8 7 - 3 8 9 5 Jana D, Walker D (1997) The influence of sulfur on partitioning of siderophile elements. Geochim Cosmochim Acta 6 1 : 5 2 5 5 - 5 2 7 7 Jephcoat AP, Bouhifd MA, Porcelli D (2008) Partitioning experiments in the laser-heated diamond anvil cell: Volatile content in the Earth's core. Phil Trans R Soc A 3 6 6 : 4 2 9 5 - 4 3 1 4 Jessup KL, Spencer J R , Yelle R (2007), Sulfur volcanism on Io. Icarus 192:24-40 Jones JH, Drake M J (1983) Experimental investigations of trace element fractionation in iron meteorites, II: The influence of sulfur. Geochim Cosmochim Acta 4 7 : 1 1 9 9 - 1 2 0 9 Jones JH, Malvin D J (1990) A nonmetal interaction model for the segregation of trace metals during solidification of Fe-Ni-S, Fe-Ni-P, and Fe-Ni-S-P alloys. Metall Trans 2 1 B : 6 9 7 - 7 0 6 Jones JH, Walker D (1991) Partitioning of siderophile elements in the Fe-Ni-S system: 1 bar to 80 kbar. Earth and Planetary Science Letters 105:127-133 Kargel J S , Delmelle P, Nash D B (1999) Volcanogenic Sulfur on Earth and Io: Composition and Spectroscopy. Icarus 142:249-280 Kargel J S , Komatsu G, Baker V R , Strom R G (1993) The volcanology of Venera and V E G A landing sites and the geochemistry of Venus. Icarus 103:253-275 Kavner A, Walker D (2006) Core/mantle-like interactions in an electric field. Earth Planet Sci Lett 2 4 8 : 3 0 1 - 3 1 4 Kavner A, Walker D, Sutton S, Newville M (2007) Externally-driven charge transfer in silicates at high pressure and temperature: A X A N E S study. Earth Planet Sci Lett 256:314-327 Keil K (2002) Geological history of asteroid 4 Vesta: The "smallest terrestrial planet". In: Asteroids III. Bottke W F Jr, Cellino A, Paolicchi P, Binzel R P (eds) U Arizona, Tucson, p 5 7 3 - 5 8 4 Keil K, Wilson L (1993) Explosive volcanism and the compositions of cores of differentiated asteroids. Earth Planet Sci Lett 117:111-124 Kelly RW, Larimer J W (1977) Chemical fraction in meteorites-VIII iron meteorites and the cosmochemical history of the metal phase. Geochim Cosmochim Acta 41:93-111 Kimura K, Lewis R S , Anders E (1974) Distribution of gold and rhenium between nickel-iron and silicate melts: implications for the abundance of siderophile elements on the Earth and Moon. Geochim Cosmochim Acta 38:683-701 Kohlstedt DL, Holtzman B K (2009) Shearing melt out of the Earth: An experimentalist's perspective on the influence of deformation on melt extraction. Annu Rev Earth Planet Sci 37:561-593 Kracher A, Wasson J T (1982) The role of S in the evolution of the parental cores of iron meteorites. Geochim Cosmochim Acta 4 6 : 2 4 1 9 - 2 4 2 6 Kress V (2000) Thermochemistry of sulfide liquids II Associated solution model for sulfide liquids in the system O-S-Fe. Contrib Mineral Petrol 139:316-325 Kress V (2003) On the mathematics of associated solutions. Am J Sci 2 0 3 : 7 0 8 - 7 2 2 Lazar C, Walker D, Walker R J (2004) Experimental partitioning of Tc, Mo, Ru, and Re between solid and liquid during crystallization in Fe-Ni-S. Geochim Cosmochim Acta 68:643-651 L e e T , Papanastassiou DA, Wasserburg G J (1976) Demonstration o f M g - 2 6 excess in Allende and evidence for Al-26. Geophys Res Lett 3 : 1 0 9 - 1 1 2 Li C, Ripley E M (2005) Empirical equations to predict the sulfur content of mafic magma at sulfide saturation and applications to magmatic sulfide deposits. Miner Deposita 4 0 : 2 1 8 - 2 3 0 Li J, Agee C B (2001) The effect of pressure, temperature, oxygen fugacity and composition on partitioning of nickel and cobalt between liquid Fe-Ni-S alloy and liquid silicate: implications for the Earth's core formation. Geochim Cosmochim Acta 6 5 : 1 8 2 1 - 1 8 3 2 Li J, Fei Y (2003) Experimental Constraints on Core Composition. In: The Mantle and Core. Treatise on Geochemistry Volume 2. Carlson RW (ed), Elsevier, p 5 2 0 - 5 4 6 Lindstrom M M , Salpas PA (1983) Geochemical studies of feldspathic fragmental breccias and the nature of North Ray Crater ejecta. Proc Lunar Planet Sci Conf 13th, Pt 2, A 6 7 1 - A 6 8 3 (J Geophys Res 88 Suppl) Lipschutz M E , Anders E (1961) The record in the meteorites - IV: Origin of diamonds in iron meteorites. Geochim Cosmochim Acta 2 4 : 8 3 - 8 8 Liu Y, Samaha N-T, Baker D R (2007) Sulfur concentration at sulfide saturation ( S C S S ) in magmatic silicate melts. Geochim Cosmochim Acta 7 1 : 1 7 8 3 - 1 7 9 9 Lodders K (2000) An oxygen isotope mixing model for the accretion and composition of rocky planets. Space Sci Rev 9 2 : 3 4 1 - 3 5 4 Lodders K (2003) Solar system abundances and condensation temperatures of the elements. Astrophys J 591:1220-1247
334
Ebel
Lodders K, Fegley B Jr (1998) The Planetary Scientist's Companion. Oxford U Press, New York Lopes RMC, Kamp LW, Smythe WD, Mouginis-Mark P, Kargel J, Radebaugh J, Turtle EP, Perry J, Williams DA, Carlson RW, Douté S, the Galileo NIMS and SSI Teams (2004) Lava lakes on Io: Observations of Io's volcanic activity from Galileo NIMS during the 2001 fly-bys. Icarus 169:140-174 Lorand J-P, Luguet A, Alard O (2008) Platinum-group elements: A new set of key tracers for the Earth's interior. Elements 4:247-252 Lovering JF, Nichiporuk W, Chodos A, Brown H (1957) The distribution of gallium, germanium, cobalt, chromium, and copper in iron and stony-iron meteorites in relation to nickel content and structure. Geochim Cosmochim Acta 11:263-278 Mal vin DJ, Jones JH, Drake MJ (1986) Experimental investigations of trace element fractionation in iron meteorites III: elemental partitioning in the system Fe-Ni-S-P. Geochim Cosmochim Acta 50:1221-31 Mann U, Frost DJ, Rubie DC (2009) Evidence for high-pressure core-mantle differentiation from the metalsilicate partitioning of lithophile and weakly-siderophile elements. Geochim Cosmochim Acta 73:73607386 Marini L, Moretti R, Accornero M (2011) Sulfur isotopes in magmatic-hydrothermal systems, melts, and magmas. Rev Mineral Geochem 73:423-492 McCoy TJ, Mittlefehldt DW, Wilson L (2006) Asteroid Differentiation. In: Meteorites and the Early Solar System II. Lauretta D, McSween H Y Jr (eds) U Arizona, Tucson, p 733-745 McDonough W F (2003) Compositional model for the Earth's core. In: The Mantle and Core. Treatise on Geochemistry, Volume 2. Carlson RW (ed) Elsevier, p 547-568 McDonough WF, Sun S-S (1995) The composition of the Earth. Chem Geol 120: 223-253 McSween HY, Arvidson RE, Bell JF III, Blaney D, Cabrol NA, Christensen PR, Clark BC, Crisp JA, Crumpler LS, DesMarais DJ, Farmer JD, Gellert R, Ghosh A, Gorevan S., Graff T, Grant J, Haskin L A , Herkenhoff KE, Johnson JR, Jolliff BL, Klingelhoefer G, Knudson AT, McLennan S, Milam K A , Moersch JE, Morris RV, Rieder R, Ruff SW, deSouza PA Jr, Squyres SW, Wanke H, Wang A, Wyatt MB, Yen A, Zipfel J (2004) Basaltic rocks analyzed by the Spirit Rover in Gusev Crater. Science 305:842-845 Minarik WG, Ryerson FJ, Watson EB (1996) Textural entrapment of core-forming melts. Science 272:530-533 Mittlefehldt DW, McCoy TJ, Goodrich CA, Kracher A (1998) Non-chondritic meteorites from asteroidal bodies. Rev Mineral36:4-l-4-195 Morgan JW, Wandless GA, Petrie RK, Irving AJ (1981) Composition of the Earth's upper mantle: 1 Siderophile trace-elements in ultramafic nodules. Tectonophysics 75:47-67 Mungall JE, Su SG (2005) Interfacial tension between magmatic sulfide and silicate liquids: Constraints on kinetics of sulfide liquation and sulfide migration through silicate rocks. Earth Planet Sci Lett 234:135149 Mysen BO (1991) Relations between structure, redox equilibria of iron, and properties of magmatic liquids. In: Physical Chemistry ofMagmas. PerchukLL, Kushiro I (eds) Springer, New York, p 41-98 Narayan C, Goldstein JI (1982) A dendritic solidification model to explain Ge-Ni variations in iron meteorite chemical groups. Geochim Cosmochim Acta 46:259-268 Nicholls RH Jr (2006) Chronological Constraints on Planetesimal Accretion. In: Meteorites and the Early Solar System II. Lauretta D, McSween H Y Jr (eds) U Arizona, Tucson, p 463-472 O'Neill HSC (1991) The origin of the moon and the early history of the earth—a chemical model. Part 2: The earth. Geochim Cosmochim Acta 55:1159-1172 O'Neill HSC, Palme H (1998) Composition of the silicate earth: implications for accretion and core formation. In: The Earth's Mantle, Composition, Structure and Evolution. Jackson I (ed) Cambridge U Press, p 3-126 O'Neill HSC, Palme H (2008) Collisional erosion and the non-chondritic composition of the terrestrial planets. Phil Trans R Soc A 366:4205-4238 Ohtani E, Yurimoto H, Seto S (1997) Element partitioning between metallic liquid, silicate liquid, and lowermantle minerals: implications for core formation of the Earth. Phys Earth Planetary Inter 100:97-114 Pak JJ, Fruehan RJ (1986) Soda slag system for hot metal dephosphorization. Metall Trans 17B:797-804 Palme H, Jones A (2003) Solar system abundances of the elements. In: Meteorites, Comets, and Planets. Treatise on Geochemistry, Volume 1. Davis A M (ed) Elsevier, p 41-61 Palme H, O'Neill HSC (2003) Cosmochemical estimates of mantle composition. In: The Mantle and Core. Treatise on Geochemistry, Volume 2. Carlson RW (ed) Elsevier, p 1-38 Parat F, Holtz F, Streck MJ (2011) Sulfur-bearing magmatic accessory minerals. Rev Mineral Geochem 73:285-314 Prockter L M , Ernst CM, Denevi BW, Chapman CR, Head JW III, Fassett CI, Merline WJ, Solomon SC, Watters TR, Strom RG, Cremonese G, Marchi S, Massironi M (2010) Evidence for young volcanism on Mercury from the third MESSENGER flyby. Science 329: 668-671 Radebaugh J, McEwen AS, Milazzo MP, Keszthely LP, Davies AG, Turtle EP, Dawson DD (2004) Observations and temperatures of Io's Pele Patera from Cassini and Galileo spacecraft images. Icarus 169:65-79 Righter K (2003) Metal-silicate partitioning of siderophile elements and core formation in the early Earth. Annu Rev Earth Planet Sci 31:135-174
Sulfur in Extraterrestrial Bodies & Deep Earth
335
Righter K (2005) Highly siderophile elements: constraints on Earth accretion and early differentiation. In: Earth's Deep Mantle: Structure, Composition, and Evolution, van der Hilst RD, Bass J, Matas J, Trampert J (eds), AGU Geophysical Monograph Series 160:203-220 Righter K, Drake M, Yaxley G (1997) Prediction of siderophile element metal-silicate partition coefficients to 2 0 GPa and 2 8 0 0 C: the effects of pressure, temperature, oxygen fugacity and silicate and metallic melt compositions. Phys Earth Planet Inter 100:115-134 Righter K, Drake M J (2000) Metal/silicate equilibrium in the early Earth—new constraints from the volatile moderately siderophile elements Ga, Cu, P, and Sn. Geochim Cosmochim Acta 6 4 : 3 5 8 1 - 3 5 9 7 Righter K, Drake M J (2003) Partition coefficients at high pressure and temperature. In: The Mantle and Core. Treatise on Geochemistry, Volume 2. Carlson R W (ed) Elsevier, p 4 2 5 - 4 4 9 Righter K, Humayun M, Campbell AJ, Danielson L, Hill D, Drake M J (2009b) Experimental studies of metalsilicate partitioning of Sb: Implications for the terrestrial and lunar mantles. Geochim Cosmochim Acta 73:1487-1504 Righter K, Humayun M, Danielson L (2008) Partitioning of palladium at high pressures and temperatures during core formation. Nature online; doi: 101038/ngeol80 Righter K, Pando K, Danielson L R (2009a) Experimental evidence for sulfur-rich martian magmas: Implications for volcanism and surficial sulfur sources. Earth Planet Sci Lett 2 8 8 : 2 3 5 - 2 4 3 Rose-Weston LA, Brenan JM, Fei Y, Secco RA, Frost D (2009) Effect of Pressure, Temperature and Oxygen Fugacity on the Metal-Silicate Partitioning of Te, Se, and S: Implications for Earth Differentiation. Geochim Cosmochim Acta 7 3 : 4 5 9 8 - 4 6 1 6 Rubie DC, Melosh HJ, Reid JE, Liebske C, Righter K (2003) Mechanisms of metal-silicate equilibration in the terrestrial magma ocean. Earth Planet Sci Lett 205: 239-255 RushmerT, M i n a r i k W G , Taylor G J (2000) Physical processes of core formation. In: Origin of the Earth and Moon. Canup RM, Righter K (eds), U Arizona, Tucson, p 2 2 7 - 2 4 4 Rushmer T, Petford N, Humayun M, Campbell A J (2005) Fe-liquid segregation in deforming planetesimals: Coupling core-forming compositions with transport phenomena. Earth Planet Sci Lett 2 3 9 : 1 8 5 - 2 0 2 Russell CT, Capaccioni F, Coradini A, De Sanctis MC, Feldman WC, Jaumann R, Keller HU, McCord T B , McFadden LA, Mottola S, Pieters CM, Prettyman TH, Raymond CA, Sykes MV, Smith DE, Zuber M T (2007) Dawn Mission to Vesta and Ceres: Symbiosis between Terrestrial Observations and Robotic Exploration. Earth Moon Planets 101:65-91 Scaillet B , Pichavant M (2005) A model of sulphur solubility for hydrous mafic melts: application to the determination of magmatic fluid compositions of Italian volcanoes. Ann Geophys 4 8 : 6 7 1 - 6 9 8 Scheil E (1942) Bemerkungen zur Schichtkristallbildung. Zeit Metallkunde 3 4 : 7 0 - 7 2 Scott E R D (1977) Composition, mineralogy and origin of group IC iron meteorites. Earth Planet Sci Lett 37:273-284 Scott E R D (1972) Chemical fractionation in iron meteorites and its interpretation. Geochim Cosmochim Acta 36:1205-1236 Scott E R D , Wasson J T (1975) Classification and properties of iron meteorites Rev Geophys Space Phys 13:527-546 Shearer CK, Burger PV, Guan Y, Papike JJ, Sutton S (2010) Vapor element transport in the lunar crust: Implications for lunar crustal processes, water on the Moon and lunar ore deposits. Annual L E A G Meeting, abstract # 3 0 3 1 , Lunar and Planetary Institute Shearer CK, Papike J J , Rietmeijer F J M (1998) The planetary sample suite and environments of origin. Rev Mineral 3 6 : 1 - 1 - 1 - 2 8 Spencer J R, Stern SA, Cheng AF, Weaver HA, Reuter DC, Retherford K, Lunsford A, Moore J M , Abramov O, Lopes RMC, Perry JE, Kamp L, Showalter M, Jessup KL, Marchis F, Schenk PM, Dumas C (2007) Io volcanism seen by New Horizons: A major eruption of the Tvashtar Volcano". Science 318:240-243 Stadermann FJ, Walker RM, Zinner E (1999) Sub-^im isotopie measurements with the C A M E C A NanoSIMS. Lunar Planet Sci X X X , Abstract # 1 4 0 7 , LPI Houston Stewart AJ, Schmidt MW, van Westrenen W, Liebske C (2007) Mars: A new core-crystallization regime. Science 3 1 6 : 1 3 2 3 - 1 3 2 5 Stewart AJ, van Westrenen W, Schmidt MW, Giinter D (2009) Minor element partitioning between fee Fe metal and Fe-S liquid at high pressure: The role of crystal lattice strain. Earth Planet Sci Lett 2 8 4 : 3 0 2 - 3 0 9 Tatsumoto M, Knight RJ, Allègre CJ (1973) Time differences in the formation of meteorites as determined from the ratio of lead-207 to lead-206. Science 180:1279-1283 Uhlig HH (1954) Contribution of metallurgy to the origin of meteorites: Part I—Structure of metallic meteorites, their composition and the effect of pressure. Geochim Cosmochim Acta 6:282-301 Ulff-M0ller F ( 1998) Effects of liquid immiscibility on trace element fractionation in magmatic iron meteorites : A case study of group IIIAB. Meteorit Planet Sci 3 3 : 2 0 7 - 2 2 0 Ulff-M0ller F, Choi B-G., Rubin AE, Tran J, Wasson J T (1998) Paucity of sulfide in a large slab of Esquel: New perspectives on pallasite formation. Meteorit Planet Sci 33:221-227
336
Ebel
Van Orman JA, Keshav S, Fei Y (2008) High-pressure solid/liquid partitioning of Os, Re and Pt in the Fe-S system. Earth Planet Sci Lett 274:250-257 Vervack RJ Jr, McClintock WE, Killen RM, Sprague AL, Anderson BJ, Burger MH, Bradley ET, Mouawad N, Solomon SC, Izenberg NR (2010) Mercury's complex exosphere: Results from MESSENGER'S third flyby. Science 329:672-675 Wade J, Wood BJ (2005) Core formation and the oxidation state of the Earth. Earth Planet Sci Lett 236:78-95 Walker D (2000) Core participation in mantle geochemistry: Geochemical Society Ingerson Lecture, GSA Denver, October 1999. Geochim Cosmochim Acta 64:2911-2987 Walker D, Li J (2008) Partitioning of molybdenum to 60 kbar along a warped Fe-FeS liquidus. Chemical Geology 248:166-173 Wanke H (1981) Constitution of terrestrial planets. Philos Trans R Soc A 303:287-302 Wanke H, Dreibus G (1988) Chemical composition and accretionary history of the terrestrial planets. Philos Trans R Soc A 325:545-557 Wanke H, Dreibus G, Jagoutz E (1984) Mantle chemistry and accretion history of the Earth. In: Archaean Geochemistry. Kroner A, Hanson GN, Goodwin AM (eds), Springer-Verlag, Berlin, p 1-24 Wasson JT (1967) The chemical classification of iron meteorites: I A study of iron meteorites with low concentrations of gallium and germanium. Geochim Cosmochim Acta 31:161-180 Wasson JT (1974) Meteorites: Classification and Properties. Springer-Verlag Wasson JT (1985) Meteorites, Their Record of Early Solar System History. W H Freeman, New York Wasson JT, Choi B-G (2003) Main-group pallasites: Chemical composition, relationship to IIIAB irons, and origin. Geochim Cosmochim Acta 67:3079-3096 Wasson JT, Kallemeyn GW (1988) Composition of chondrites. Phil Trans R Soc London A 325:535-544 Wasson JT, Kallemeyn GW (2002) The IAB iron-meteorite complex: A group, five subgroups, numerous grouplets, closely related, mainly formed by crystal segregation in rapidly cooling melts. Geochim Cosmochim Acta 66:2445-2473 Wasson JT, Ouyang X, Wang J, Jerde E (1989) Chemical classification of iron meteorites: XI Multi-element studies of 38 new irons and the high abundance of ungrouped irons from Antarctica. Geochim Cosmochim Acta 53:735-744 Weber RC, Lin P-Y, Garner EJ, Williams Q, Lognonne P (2011) Seismic detection of the lunar core. Science 331:309-312 Weisberg MK, McCoy TJ, Krot AN (2006) Systematics and evaluation of meteorite classification. In: Meteorites and the Early Solar System II. Lauretta D, McSween HY Jr (eds) U Arizona, Tucson, pl9-52 Weitz CM, Rutherford MJ, Head JW III, McKay DS (1999) Ascent and eruption of a lunar high-titanium magma as inferred from the petrology of the 75001/2 drill core. Meteorit Planet Sci 34:527-540 Westphal AJ, Fakra SC, Gainsforth Z, Marcus MA, Ogliore RC, Butterworth AL (2009) Mixing fraction of inner solar system material in comet 81P/Wild2. Astrophys J 694:18-28 Wheeler KT, Walker D, Fei Y, Minarik WG, McDonough WF (2006) Experimental partitioning of uranium between liquid iron sulfide and liquid silicate: Implications for radioactivity in the Earth's core. Geochim Cosmochim Acta 70:1537-1547 Wieczorek MA, Jolliff BL, Khan A, Pritchard ME, Weiss BP, Williams JG, Hood LL, Righter K, Neal C R, Shearer CK, McCallum IS, Tompkins S, Hawke BR, Peterson CD, Gillis JJ, Bussey B (2006) The Constitution and Structure of the Lunar Interior. Rev Mineral Geochem 60:221-364 Williams JG, Boggs DH, Ratcliff JT (2004) Lunar core and tides. Lunar Planet Sci XXXV #1398 Williams JG, Boggs DH, Yoder CF, Ratcliff JT, Dickey JO (2001) Lunar rotational dissipation in solid body and molten core. J Geophys Res - Planets 106:27933-27968 Willis J, Goldstein JI (1982) The effects of C, P, and S on trace element partitioning during solidification in Fe-Ni alloys. J Geophys Res 87:A435-A445 Wood BJ (2008) Accretion and core formation: constraints from metal-silicate partitioning. Philos Trans R Soc A 28:4339-4355 Wood BJ, Wade J, Kilburn MR (2008) Core formation and the oxidation state of the Earth: Additional constraints from Nb, V and Cr partitioning. Geochim Cosmochim Acta 72:1415-1426 Yamaguchi A, Taylor GJ, Keil K (1997) Metamorphic history of the eucritic crust of 4 Vesta. J Geophys Res 102:1381-13386 Yoder CF, Konopliv AS, Yuan DN, Standish EM, Folkner WM (2003) Fluid core size of Mars from detection of the solar tide. Science 300:299-303 Zolensky ME (1998) The flux of meteorites to Antarctica. In: Meteorites: Flux with Time and Impact Effects. Grady MM, Hutchison R, McCall GJH, Rothery DA (eds) Geological Society, London, Special Publications 140:93-104
12
Reviews in Mineralogy & Geochemistry Vol. 73 pp. 337-361,2011 Copyright © Mineralogical Society of America
Fining of Glass Melts Hayo Muller-Simon Hiittentechnische
Vereinigung der Deutschen Glasindustrie Siemensstrafie 45 63071 Offenbach am Main, Germany
(HVG)
mueller-simon@hvg-dgg. de
INTRODUCTION The degassing of silicate melts plays an important role in both the Earth and glass sciences. Volcanic eruptions are driven by the expansion of exsolved volatiles. These volatiles are initially dissolved in magmas at high pressures and later released as one or more fluid phases during ascent of the magma to the Earth's surface due to decompression (Webster and Botcharnikov 2011, this volume; Oppenheimer et al. 2011, this volume). During fining of glass melts the oversaturation of the silicate liquid with respect to dissolved volatiles is induced by heating. Although the process of volatile oversaturation occurring in geologic and industrial melts differs, the fundamental mechanisms controlling melt degassing are similar in both cases, particularly with respect to the nucleation and growth of gas bubbles in the melt and their upward migration driven by buoyancy. Another similarity of natural and technical melt degassing is the role of sulfur. Tremendous amounts of sulfur in form of S 0 2 and H 2 S are produced by volcanic eruptions at the surface or by the cryptic degassing of magmas ascending through the earth's crust (see Oppenheimer et al. 2011, this volume). During the fining of industrial glass melts, one takes advantage of the solubility behavior of sulfur in silicate melts. Sulfate added to the melt batch as a raw material, decomposes to release gaseous compounds during fining that enhance the expansion of existing bubbles which can, as a result, ascend more readily to the melt surface. Hence, the release of gaseous sulfur dioxide is a major issue in both volcanic eruptions and industrial glass production. In this chapter we will have a detailed look at the process of fining in industrial mass glass production. Glass products are found in wide fields of daily life, such as automotive glazing, architecture, food and pharmaceutical packaging, and optical devices or opto-electronic components in computers and consumer electronics. The widespread usage of glass arises from the great variety of properties that can be specifically altered by changing the glass composition. Most industrial glasses belong to the group of soda-lime-silicate glasses, comprising container glass, flat glass, fiber glass and tableware. These so-called mass glasses account for far above 90% of the glass tonnage produced. All these mass glasses are fined by means of sulfur containing raw materials. After sulfur oxide emissions derived from fuel oil firing, the usage of fining agents produces the largest portion of sulfur oxide emissions in the glass industry. Being a substantial contributor to rain acidification, sulfur oxide emissions are thus limited by legal regulation. In order to satisfy these limits in the most economically effective way, it is important to understand in detail the main fining reactions utilized in industrial glass production. Environmental issues strongly influence the actual mass glass production through the need to use filter dust, which is formed when sulfur oxide is absorbed from the exhaust gas in the waste gas treatment plant (Kircher 1993; KrauB 1995), and waste glass which can be used by more than 90% as raw material, so-called recycled cullet, (Schaeffer 1996). Both substances provide a very varying composition making their use extremely difficult and both have a strong influence on the sulfur household in an industrial glass melting tank. 1529-6466/11/0073-0012S05.00
DOI: 10.2138/rmg.2011.73.12
338
Müller-Simon
The glass production process consists of the preparation of the batch f r o m the raw materials, the melting of the batch, fining, homogenization, conditioning, and finally the forming as shown in Figure 1. T h e thoroughly mixed batch is fed into the glass melting tank, where the raw materials are heated rapidly to temperatures of m o r e than 1200 °C. Upon heating the components (e.g., soda ash, lime stone and sand) react to f o r m a glass melt (for details see Falcone et al. 2011, this volume). The primary melt contains many bubbles of air originally trapped between the grains of the raw materials, as well as C 0 2 formed through combustion of organic impurities and decomposition of carbonates. The presence of these bubbles in the glass yields a final product of unacceptable quality. In order to remove these bubbles, the melt is "fined" by further heating to temperatures between 1400 °C and 1600 °C (depending on the glass composition). This increase in temperature causes the bubbles to expand and ascend through the lower viscosity melt, where they are eventually released into the furnace atmosphere. The rising velocity v of a bubble can b e estimated by the Stokes approximation (Mulfinger 1980) . 2gr2(p,-p2)
(1)
91!, where g is the acceleration of gravity, r is the bubble radius, p j is the density of melt, p 2 is the density of the bubble content and r\ 1 is the melt viscosity. Figure 2 shows the dependence of the rising velocity as a function of the bubble diameter and the temperature for a melt of sodalime-silica composition. To a first approximation the gases in the bubbles will obey the ideal gas law; as such by applying the ideal gas law, the bubble diameter is calculated to enlarge by only 2 0 % w h e n the temperature is increased f r o m 1200 °C to 1500 °C. This increase will not have a significant effect on the rising velocity of the bubble. Thus, in order to shorten the fining process, agents which release additional gas as a function of increasing temperature are added to the batch. This fining gas then diffuses into and enlarges the existing bubbles, thereby increasing their buoyancy. This type of chemical fining is the most widespread fining m e t h o d utilized today. However, if chemical fining is not possible or efficient, there are alternate physical methods that can improve the fining of the glass melt. Physical fining may b e accomplished with the application of ultrasonic waves, the application of subatmospheric pressure, and bubbling (i.e., introducing the fining gas through holes in the bottom of the glass melting tank) (Krämer 1999).
batch
silo
1. b a t c h
reaction
1
fining
3
homogenizing conditioning
melting
furnace
feeder
1
wa
5
forming
6.
annealing
channel
•J////J////////777?I E
3
annealing
iäJ ^////////M throat
5 forming machine
Figure 1. Sketch of the glass production process.
lehr
Fining
of Glass
339
Melts
1,E-01
l.i-02 1/1£
l.E-03
C > 4—1
'u o
g l.E-OS QE> C
ut 'C
l,E-06
ljE-07
l.E-oa 20
18
16
14
12
10
8
6
4
2
0
bubble diameter in mm Figure 2. Rising velocity of bubbles as a function of bubble diameter and temperature in a soda-lime-silica melt.
After fining and homogenization, the melt is cooled to its forming temperature and fed into the forming machines (cf. Falcone et al. 2011, this volume). During cooling, fining bubbles that may still be present in the melt are resorbed. This process is sometimes called refining. Between refining and forming, melts for high quality optical glasses are additionally homogenized with a stirring system. This is done in order to minimize variations in chemical composition and related properties such as the refractive index. With the glass melt now achieved, the properties of the product are defined. After forming, most glass products undergo annealing in the lehr for residual stress to be removed (cf. Falcone et al. 2011, this volume).
AGENTS USED FOR CHEMICAL FINING Chemical fining exploits the fact that some compounds react to produce gas with increasing temperature (Cable 1960, 1961 a,b; Krämer 1999). The fining process starts when the partial pressure of the fining gas in gaseous inclusions, e.g., 02 in Equation (3), is reached as temperature is increased (Beerkens 1995). The driving force for the diffusion of the fining gas into the bubbles is the difference between the fining gas concentration in the bubble/melt interface and the equilibrium concentration in the melt (at the given temperature). The bubble volume change with respect to temperature change is given by the differential equation (Cable 1961a; Krämer 1979): dV, dt
f _4nrD,(cla-clb) 1 p
v
r
1 VÄ^fy
(2)
with the partial volume V; of component /', time t, bubble radius r, diffusion coefficient D t of component /', concentration of component i in the melt cia and concentration of component i at the melt/bubble interface cib. After batch melting, gaseous inclusions consist predominantly
340
Müller-Simon
of C 0 2 , CO, N 2 and H 2 0 . Thus, only small partial pressures of the fining gas are required in order to achieve a sufficient concentration gradient to start the growth of bubbles. The choice of the fining agent depends on the viscosity-temperature characteristics of the glass melt. The earliest release of the fining gas at increasing temperature should occur when the melt viscosity is low enough to allow bubbles to escape the melt. In other words, this should occur at the temperature where they have sufficient buoyancy and the lamellae between them and the furnace atmosphere collapse in a sufficiently short time. The most common fining agents are sodium chloride, antimony oxide and sodium sulfate. The most straightforward mechanism is oxygen fining, for example by the decomposition of antimony oxide Sb205(m)^Sb203(m) + 02(g)
(3)
If the glass melt is considered as an electrochemical solution, the fining action can be described by Sb 5 + (m) + O 2 -(m) Sb 3 + (m) + ^ 0 2 ( g )
(4)
The O 2 - activity in the melt is mainly controlled by the addition of alkaline or alkaline earth oxides (i.e., by the bulk glass composition); therefore, the O 2 - activity of the melt is buffered with respect to Equation (4). The ionic description has some advantages when the interaction between pairs of polyvalent elements in the melt is considered (for instance see Eqn. 27). Figure 3 shows the general development of the oxygen partial pressure with increasing temperature, i.e., the temperature at which the fining pressure is reached depends on the Sb 2 05/Sb 2 03 ratio. During fining, not only C 0 2 , CO, N 2 and H 2 0 trapped during the initial melting, but also the oxygen liberated from the fining reaction itself are expelled from the melt. As the fining reaction continues the Sb 2 05/ S b 2 0 3 ratio shifts to lower values; thus, the fining temperature needs to be increased in order for the process to continue. Antimony fining starts at about 1300 °C. Alternative substances used for oxygen fining are arsenic and cerium oxide. Sodium chloride sublimates at approximately 1440 °C at ambient pressure and is used for production of higher melting glasses such as borosilicate glass.
o.
03 en
temperature Figure 3. Principal temperature dependences of oxygen fining by means of antimony.
For the fining of industrial container glass, fiat glass and fiber glass, sulfur-containing raw materials are used almost exclusively today. In addition to the fining effect, sodium sulfate and sodium sulfide form a low liquid eutectic that improves the dissolution of sand grains in the raw material; in other words they act as melting accelerator. Furthermore, sulfide ions are an important component in the amber color of glasses (cf. Falcone et al. 2011, this volume). The fining effect of sulfate was discovered accidentally in the second half of the 19th century when the production method of soda ash for the glass industry changed from the Leblanc process to the Solvay process (Thieme 1993). The new soda as produced by the Solvay
Fining of Glass
Melts
341
process extended the fining time in many glass works, and enhanced the sensitivity of the melt to fluctuations of the firing conditions. Glass technologists soon noted that the contamination of soda ash produced by the Leblanc process with sulfate was unexpectedly advantageous. The sulfur fining process itself goes back to L. Bock, who performed extensive experiments in the Bohemian glass industry, eventually being granted a patent for the use of alkali sulfates in glass fining in 1902 (Weyl 1943). The fundamentals of sulfur chemistry in glass melts have been discovered as early as the 1950's in the landmark study of Fincham and Richardson (1954). These findings have been reconfirmed for silicate glasses several times (e.g., Nagashima and Katsura 1973; Schreiber et al. 1987). Reviews of sulfur chemistry research in silicate glass melts have been given in several papers (Goldman 1985; Miiller-Simon 1999; Beerkens 2007). A consistent description of sulfur fining in industrial glass production is not a simple task because sulfur acts in different capacities during different stages of the melting process. In the continuous melting tanks, which are common in the glass industry today, separation of the discrete sub-steps of the melting process is almost impossible. Thus, in order to understand industrial sulfur fining, knowledge about sulfur chemistry in glass melts must be drawn from laboratory experiments and subsequently applied to industrial conditions. The application of this knowledge has proven to be an intricate task. This is especially true because industrial glass melting furnaces are used for the production of high-quality glass products at specific conditions, which forbids parameter changes for the pursuit of basic scientific interest. The primary issue lies in the fact that the final state of the glass melt after fining cannot be easily assigned to either a steady or equilibrium state. For economic reasons the glass melting process is allowed a limited period only, and the fining is stopped before all bubbles can leave the melt. The flames and heating electrodes utilized in the melting process induce a temperature distribution in the glass bath. Together with the glass melt fluxes caused by temperature differences, the temperature distribution determines the total bubble volume at the end of fining. This distribution of solubility states is mixed during homogenization at the end of the melting process. Partial pressures inside the remaining gas volume and equilibria in the melt will adjust accordingly. In order to address to the dynamics of the sulfur dissolution in industrial glass melting, glass technologists often speak of sulfur retention instead of sulfur concentration. Thus, in the first section of this article the reactions of sulfur in glass melts will be identified based upon what is known from laboratory experiments. In the second section the information which can be deduced from the behavior of glass melting tanks about sulfur chemistry is collected. Comparison of the information from each of the two sections provides important insight into the fining action of sulfur in industrial glass melting tanks. LABORATORY EXPERIMENTS ON SULFUR CHEMISTRY Laboratory experiments on sulfur chemistry can be divided into two types of experiments: equilibrium experiments where glass melts are equilibrated with an atmosphere or liquid of known composition, and melting experiments where a raw material batch is melted under defined heating characteristics. Equilibrium experiments An atmosphere which contains sulfur and oxygen in the temperature range between 1000 and 1600 °C, is dominantly composed of the sulfur in the form of S0 2 with minor amounts of S 0 3 or S 2 if an oxygen excess and oxygen deficit occurs, respectively. Obviously, in the gas phase the dominant redox reactions are: so3(g)^so2(g)+io2(g)
(5)
342
Müller-Simon
and ±S 2 (g) + 0 2 ( g ) ^ ± S 0 2 ( g )
(6)
If a glass melt is brought into equilibrium with such an atmosphere, only the oxidized and the reduced form of sulfur are present in the melt (see Wilke et al. (2011, this volume) for spectroscopic studies on sulfur speciation in glasses and melts) despite the fact that S0 2 is present in a much larger concentration in the atmosphere than S0 3 and S2. At constant temperature, glass composition, and oxygen partial pressure, the amount of dissolved sulfur in the melt increases with increasing sulfur concentration in the gas phase. Thus, sulfur concentration in the melt can be assumed to follow the solution behavior described by Henry's law (Fincham and Richardson 1954; Nagashima and Katsura 1973; Schreiber et al. 1987). The concentration of dissolved sulfur increases also with increasing melt oxygen ion activity (Fincham and Richardson 1954; Nagashima and Katsura 1973), suggesting that the dissolution occurs via formation of sulfate anions and sulfide anions (Fincham and Richardson 1954; Nagashima and Katsura 1973): S0 3 (g) + 0 2 ~ (m) —> S0 2 ~(m)
(7)
S0 2 —> not soluble in glass melts
(8)
2
2
S2(g) + 20 ~(m) —> 2S ~(m) + 02(g)
(9)
The influence of the free oxygen ion activity in glass melts is referred as basicity. Since the chemical solubility of gases such as C0 2 , S0 3 or H 2 0 strongly depends on the basicity of the melt (Paul 1982), glass technologists have developed several means to quantify this property. The most common methods are based on the estimation of the strength of the cation-oxygen bond (Sun 1947, 1948; Krämer 1991) or the measurement of the position of the sp-transition of the 6s electrons of Pb2+. The property measured in the latter technique is known as optical basicity (Duffy and Ingram 1976). For glasses that do not contain lead, the optical basicity can be calculated by multiplying the optical basicities of the single oxides with their respective mole fractions in the glass (Duffy 1989). Although free oxygen ions exist in glass melts only in very small concentrations, they may nevertheless control the dissolution of sulfur in the melt because of the equilibrium between bridging oxygens O0, non-bridging oxygens O" and free oxygen ions O 2 O0(m)
+ O2-(m)^±2O-(m)
(10)
(Toop and Samis 1962). Combination of the redox reactions in Equations (5) and (6) with the dissolution reactions in Equations (7) and (9) yields SO¡-(m) ^
S02(g)
+ ±02(g)
+ 02-(m)
(11)
and S 2 -(m) + ^ 0 2 ( g ) ^ S 0 2 ( g ) + 0 2 -(m)
(12)
These findings are displayed in Figure 4. With increasing temperature the concentration of S0 3 decreases and the concentration of S 2 increases. Commonly polyvalent elements become more reduced with increasing temperature (Paul 1982). Applying the law of mass action to the reactions in Equations (11) and (12) yields the respective reaction constants:
Fining of Glass
343
Melts
S2(gas)
ro
-C Q.
S0 2 (gas>
H ro en
S042_(melt) £ Q.
S 2 (melt> "S0 3 (gas)
Figure 4. Equilibrium concentrations of S0 3 , S 0 2 and S 2 in the gas phase calculated by the computer code FactS age and S0 4 2 ~ and S2~ in glass melts according to Nagashima and Katsura (1973).
a)
1 •c ro Q.
log (oxygen partial pressure)
and r
KSnJ = exp
AH^-TAS^ RT
^
[S2 Pso, • «O
(14)
where AH0 is the standard enthalpy and AS0 is the standard entropy for the respective reaction, T is the temperature, R is the gas constant, [S2~] and [S0 4 2 - ] are the concentrations of the respective species, p is the respective partial pressures, and aQi- is the 0 2 ~ activity. The temperature dependence in Equations (13) and (14) describes an Arrhenius behavior, which is found for all polyvalent elements in glass melts (Riissel 1990). Rearranging Equation (13) and (14) yields 2-
1
log [S0 4 ] = log pSOi + - log p0i + log KSa • aQ2-
(15)
and log [S " ] = log pSOi - - log p0i + log KSnj • aQ
(16)
In both silicate slags (Fincham and Richardson 1954) and glass melts (Nagashima and Katsura 1973) the experimental results agree well with these equilibria, showing the typical V-shape of sulfur solubility as a function of the logarithm of oxygen partial pressure (Fig. 4). According to Equation (15) and (16), the sulfur concentration should increase with increasing oxygen partial pressure with a slope of 0.5 on a logarithmic scale under oxidizing conditions and decrease with a slope of 1.5 under reducing conditions. This matches well in the oxidizing region but poorly under reducing conditions. Equations (15) and (16) imply that both S2~ and S0 4 2 - have the same Henry's law solubility, which cannot be assumed a priori. Moreover, the fact that no S0 3 2 - is found in the glass (Backnaes et al. 2008) does not prove that it does not exist in the melt. Combining Equations (11) and (12) and assuming the existence of S0 3 2 - in the melt yields 3 SOl~(m) + S2~(m)
4 SO2f(m)
(17)
Using the known reaction constants of Equations (11) and (12) (Miiller-Simon 1998a; Beerkens 2003) demonstrates that the equilibrium in Equation (17) is shifted leftward during cooling; thus, S0 3 2 - may only be found by species sensitive method at high temperatures. Therefore it is possible that small concentrations of tetravalent sulfur may disturb the slope
344
Müller-Simon
of solubility curves predicted by Equations (15) and (16). However, the S0 2 release when the glass fusion is finished proves that the S0 2 solubility is much smaller than that of S0 3 and S 2 (Pajean et al. 1975; Klouzek et al. 2007; Collignon et al. 2010). Figure 5 shows the temperature dependence of dissolved sulfur under both oxidizing and reducing conditions (Nagashima and Katsura 1973). Obviously, reaction (11) is shifted to the right side with increasing temperature while reaction (12) is shifted to the left side with increasing temperature. Thus, under oxidizing conditions Equation (15) may serve as a description of sulfur refining. The description of sulfur refining under reducing conditions requires additional assumptions. A quantitative thermochemical description of sulfur chemistry in glass melts based on the above reactions is given in (Beerkens 2003).
Figure 5. Temperature dependence of sulfur dissolution according to Nagashima and Katsura (1973).
Instead of equilibrating the glass melt with a gaseous atmosphere, the melt can alternatively be equilibrated with a molten salt. If a soda-lime-silicate glass melt is exposed to a sodium sulfate melt, sulfur (from the sodium sulfate liquid) diffuses into the silicate melt until a maximum sulfur concentration of 0.25 wt% S0 3 is attained (Bruckner 1962). These phase relations indicate that there is a miscibility gap in the soda-lime-silicate glass melt/ sodium sulfate system. Thus, exposing the glass melt to a pure S0 3 atmosphere results in the formation of a film of sodium sulfate, so-called sulfate gall, on the melt's surface. In form of so-called salt bubbles this gall causes a severe quality reduction. Sulfur solubility also is influenced by the water concentration of the glass melt (Hanke and Scholze 1970). Fining bubbles contain S 0 2 and H 2 0, which dissolve during cooling according to their respective partial pressures and solubilities. If both components are present in the melt this results in a typical inverse solution behavior, as a function of the oxygen partial pressure, for industrial glasses (Geotti-Bianchini and De Riu 1998). It should be noted that under common fining conditions, only sulfur has different redox states, which govern the temperature dependent fining process, although water dissolved in the melt will considerably reduce the need for fining agents (Beerkens 2005, 2007). Melting experiments Equilibrium experiments are often said to be somewhat academic, whereas melting experiments are preferred because they are more like the industrial melting process. However, the complexity of the melting reactions makes the interpretation of these melting experiments inherently difficult. Much of this difficulty lies in the fact that, under industrial conditions
Fining of Glass Melts
345
equilibrium behavior may only be valid for an infinitesimally small melt volume element. In such melting experiments, a batch of raw material is placed in a crucible, heated to the melting temperature and held for some time at maximum temperature before being cooled down. In order to investigate sulfur chemistry, the properties of the final glass such as redox state, sulfur concentration, or the bubble density are measured (Williams 1980). Figure 6 shows the results of some such experiments (Beerkens 2005). The relation between sulfur concentration and redox state differs definitely for equilibrium experiments (Fig. 5) and melting experiments (Fig. 6), especially in the region of the minimum of the sulfur solubility. More information can be obtained when the composition of the gases, which are released during heating, is measured by techniques such as evolved gas analysis (EGA) (Pajean et al. 1975; Klouzek et al. 2007; Collignon et al. 2010). Figure 7 shows typical EGA curves of the S 0 2 release from sulfur containing batches. A considerable reaction velocity is reached when the first liquid phases appear. This occurs at approximately 760 °C where some salts with low melting points, such as Na 2 C0 3 , 0,20
0,18 0,16 0,14 0,12
0,10
O O
O
O
0,08 0,06 0,04 0,02
0,00
log oxygen partial pressure (in bar) at 1673 K F i g u r e 6. Sulfur concentration from melting experiments according to Beerkens ( 2 0 0 5 ) .
800
900
1000
1100
1200
1300
1400
1500
1600
temperature - - Pajean 1975, reduced Pajean 1975, oxidized
— • Klouzek 2007, Si02+CaC03+C+Na2S04 Klouzek 2007, Si02+C+Na2S04
F i g u r e 7. Results o f S 0 2 release from different raw material combinations measured using evolved gas analysis, according to Pajean et al. ( 1 9 7 5 ) and Klouzek et al. ( 2 0 0 7 ) .
346
Müller-Simon
CaC0 3 and NaN0 3 , have eutectics. This point can be considered the starting point for the batch reactions. At 800 °C the first metasilicates are formed: Na 2 C0 3 (/) + «SiO 2 0)
N a 2 0 • wSi0 2 (m) + C0 2 (g)
(18)
where the C 0 2 reacts with the coke in the batch according to the Boudouard reaction C02(g) + C(s)^±2C0(g)
(19)
According to the Boudouard equilibrium above 800 °C the ratio of C 0 / C 0 2 is >0.9. The presence of CO is essential for the reduction of the sodium sulfate (Flick and Nolle 1995). The most important sulfur-containing raw materials for industrial glass production are sodium sulfate, blast furnace slags, and filter dust which contains up to 50 wt% S0 3 . Each of these materials has a completely different melting behavior. Sodium sulfate is strongly involved in the batch reactions, while blast furnace slags hardly react in the batch but dissolve into the primary melt in the later stages of the glass melting process. The melting point of sodium sulfate is approximately 880 °C (Brückner 1962; Samadhi et al. 2001). The decomposition of sodium sulfate starts at 1600 °C (Samadhi et al. 2001) and takes place according to Na 2 S0 4 (/) ^
Na 2 0(/) + S0 2 (g) + ^-O 2 (g)
(20)
where Na 2 0 is in equilibrium with gaseous Na and NaO, and S0 2 is in equilibrium with S0 3 . As discussed above, the S0 2 /S0 3 equilibrium is shifted nearly completely into the direction of S0 2 at high temperature under typical oxygen partial pressures The reaction behavior of sodium sulfate changes, however, if it is combined with coke. At lower temperatures, considering Equation (19), sodium sulfate is reduced via a rapid solid-gas reaction. Na 2 S0 4 (i) + 4 C O ( g ) Na 2 S(i) + 4 C O 2 ( g )
(21)
As soon as the melting point of sodium sulfate is reached, the liquid-solid reaction starting at 740 °C also becomes important. Na 2 S0 4 (/) + 2C(s) Na 2 S(/) + 2 C O 2 ( g )
(22)
At this temperature, the system Na 2 S0 4 -Na 2 S has a eutectic and thus a liquid is formed at much lower temperatures than with pure sodium sulfate (this temperature is even lower than most carbonate eutectics). This liquid covers the sand grains and reacts according to Equation (18). Part of the sodium sulfate does not act according to reactions (21) and (22) but rather to the following reactions Na 2 S0 4 (/) + CO(g) Na 2 0(i) + S0 2 (g) + C O 2 ( g )
(23)
2 Na 2 S0 4 (/) + C(s) 2 Na 2 0(i) + 2 S0 2 (g) + C0 2 (g)
(24)
and
Under batch melting conditions the Na 2 S0 4 -Na 2 S liquid decomposes with increasing temperature according to 3 Na 2 S0 4 (/) + Na 2 S(/) 4 Na 2 0(/) + 4 S0 2 (g)
(25)
At the end of the batch reactions a xNa 2 0-yCa0-zSi0 2 melt exists (x,y,z represent the variable fractions of the different components) in which the sulfur is mainly dissolved as both S 0 4 2 - and S2~(Beerkens 2003). Further increase of the temperature produces both S0 2 and 0 2 according
Fining of Glass
347
Melts
to Equation (15). With advanced fining (i.e., when most of the C 0 2 , CO, H 2 0 and N 2 has been expelled f r o m the melt), the r e l a t i o n p S 0 2 + p02 = 1 bar may be assumed for the fining gas. These reactions can partially be identified in the E G A measurement results (Fig. 7). The first peak on the left side coincides with the occurrence of the first liquid phases, indicating that the sulfur release may be caused by reactions (23) and (24). The second peak from the left is most probably caused by reaction (25), and the peaks on right side can be attributed to reaction (20) (Collignon et al. 2011). The precise position of the fining peak can vary depending on the given composition (Klouzek et al. 2007). It is obvious that the sulfur incorporation into the melt is not only determined by the identity of the sulfur compounds, but also by carbon and its oxides (Bassine et al. 1987; Nolle and Al Hamdan 1990). Figure 8 shows the redox state of the glass given by the iron redox ratio as a function of the carbon addition (Bassine et al. 1987). The oxidation state of such a system is similar to a titration curve. The curve displays three characteristic properties: (1) in the case of sulfate excess the p02 is close to 0.33 bar, i.e., the decomposition described by Equation (20); (2) in the case of coke excess the p02 adjusts itself between the equilibrium with C 0 2 from the carbonate decomposition and the Boudouard equilibrium (Nolle and Al Hamdan 1990); and (3) the transition point between the two is given by the portion of coke which is consumed for the reduction of sodium sulfate according to Equation (24). This behavior shows the role of sulfates in glass batches as oxidizing agents, which is also often utilized for oxidation of the reducing contaminations of recycled cullet like paper and food relics. Interpretation of these types of batch melting experiments is difficult because melt temperature is not directly quantified with thermocouples (Conradt et al. 1994). Rather the temperature must be estimated f r o m the rate of thermal input, furnace temperature, and the time scale. With this method the uncertainty in determining the reaction temperatures arises f r o m unknown rates of thermal transfer f r o m the furnace to the melting materials. The low melting liquids form a so-called batch foam. Before this batch foam is formed, evolving gases can easily leave the batch. During this phase of melting, the state of the batch is governed by the mass flow of the escaping gases. The batch foam hinders the released gases f r o m leaving the batch (i.e., inside the batch foam an equilibrium of the melt with the released gas composition is established). In the interpretation of such experiments it is commonly
carbon addition in umol/g BaSO, in the batch in wt.-%:
-•- 0
—•- 0.65
-*-1.3
Figure 8. Variation of iron redox state as a function of carbon addition for soda lime silicate melts containing various amounts of barium sulfate, according to Bassine et al. (1987).
348
Müller-Simon
assumed that the mass flow of gas in the beginning is small enough that the equilibria in the batch foam are not influenced. However, it must be assumed that the heating rate and related velocity of batch foam formation also impact the results of melting experiments. Because of the excess of C 0 2 and coke, the C0/C0 2 ratio within the foam is defined by the Boudouard equilibrium. The redox state of the melt therefore strongly depends on the amount of CO which escapes before a sufficiently closed foam is formed. As to this point there may be considerable differences between laboratory melts and industrial glass melting furnaces (Conradt et al. 1994).
MONITORING OF THE REACTION PARAMETERS Equations (15) and (16) demonstrate that the sulfur solubility depends on the oxygen partial pressure, the activity of free oxygen ions as determined by the melt compositions, and the partial pressure of the gaseous sulfur compounds. For a complete description of the state of sulfur dissolution under laboratory conditions, as well as in industry, these parameters must be quantified together with the sulfur concentration in the glass. Under both sufficiently oxidizing and reducing conditions the concentrations of S 0 4 2 and of S2~ in the melt are represented to a good approximation by the melt's total sulfur concentration. Since sulfur species analysis is usually much more expensive, especially in industry, the total sulfur content is used for control purposes instead of the species concentration. For the determination of residual sulfur concentrations in glasses several physical methods such as X-ray fluorescence analysis (XFA) or wet-chemical methods such as inductively coupled plasma optical emission spectrometry (ICP/OES) in a digestion solution are available (Meckel 2000). Recently, a new device for sulfur monitoring based on an amperometric sensor has become available. This device allows the continuous measurement of the sulfur concentration under industrial glass production conditions in-situ (Müller-Simon and Bauer 2007). The influence of melt composition on the sulfur solubility is described by the characteristic basicity numbers (Duffy and Ingram 1976; Krämer 1991). Another method to evaluate the influence of composition is the determination of the sodium activity (Beerkens 2003). However, in mass glass production a0i- may be assumed constant in Equation (15) and (16). The /?S02 cannot be measured directly. As discussed above, under oxidizing conditions in gas bubbles, p02 + pS02 = 1 bar is valid, i.e.,/?S0 2 = 1 bar-/?02. The decomposition of S 0 3 yields pS02 = 0.66 bar. Under slightly reducing conditions, pS02 ~ 1 bar is valid, which applies for nearly all industrially melted glasses (Chopinet et al. 1982). The most important parameter is the oxidation state of the glass, which cannot be fixed by estimations or approximations. In order to give a suitable description of the oxidation state, different approaches have been presented which shall be discussed in the following.
Oxidation state of iron Iron is present in nearly all glasses as coloring agent or as contamination (cf. Falcone et al. 2011, this volume). If iron is the only polyvalent element in the glass melt, the Fe2+/Fe3+ ratio depends only on oxygen partial pressure p02 for which the simple relation in Equation (26) applies:
P0l =
A [Fe 3 + ]
[Fe 2
•exp
(-AHi+ASi
RT
(26)
With this equation, the Fe2+/Fe3+-ratio can be used to calculate the oxygen partial pressure at melting conditions. It is important to note that this relation is only valid if no physically dissolved oxygen or second polyvalent element is present in the melt as these elements react
Fining of Glass
349
Melts
with the iron during the cooling process. However, the presence of more than one polyvalent element in concentrations of several 1000 ppm by weight is the normal case in industrial glass melting; these polyvalent elements can be coloring agents such as chromium in green glass or decoloring agents such as cerium, selenium or manganese in flint glass. If the temperature changes, between pairs of polyvalent elements electron exchange reactions take place according to (Lahiri et al. 1974; Miiller-Simon 2007) 3 Fe 2+ (m) + Cr6+ (m) 3 Fe3+ (m) + Cr3+ (m)
(27)
These reactions can take place down to temperatures in the range of the glass transition by direct electron transfer and will freeze in, if the distance between the reaction partners becomes too large. In the case of chromium, Fe2+ is oxidized during cooling until all the Cr6+ is consumed (Dusdorf and Miiller-Simon 1997). Sulfur is, of course, also a polyvalent element present at significant concentrations. The effect of sulfur on the Fe 2+ /Fe 3+ -ratios calculated with Equation (26) is manifested in a manner that depends on the oxidation state of the melt. In a closed system upon cooling, oxidized melts will have Fe 2+ /Fe 3+ -ratios larger than those predicted by Equation (26), whereas reduced melts will have Fe 2+ /Fe 3+ -ratios less than those predicted by Equation (26) (Miiller-Simon 1994). As such, accurate calculation of the oxygen partial pressure from Equation (26) is only possible if the iron concentration is much larger than the concentration of other polyvalent elements. This condition is satisfied in typical green and amber glasses; however, in clear flint glass with 500 ppm Fe 2 0 3 or lower, the Fe 2+ /Fe 3+ -ratio can be shifted by a factor of 2 or greater due to the reaction with sulfur (Miiller-Simon 1994). Oxygen sensors As the sulfur solubility depends on the redox state of the glass melt, it is reasonable to measure the oxygen partial pressure in-situ during production. Such measurements are possible by means of electrochemical oxygen sensors (Frey et al. 1980; Miiller-Simon and Mergler 1988; Baucke et al. 1996; Laimböck and Beerkens 2001). In addition to oxygen partial pressure, it is also possible to measure the sulfur concentration continuously in the glass melt. Figure 9 shows the variation of the oxygen partial pressure and the sulfur concentration over a period of a few
0,03
-2,5
-3,5
0,01
0
10
20
30
40
t i m e in d -O-SVW
-O-XFA
—•—p02
Figure 9. Evolution of oxygen partial pressure and sulfur concentration during industrial green glass production (Miiller-Simon 1998b). Sulfur concentrations were measured by SWV (square wave voltammetry) and XFA (X-ray fluorescence analysis).
350
Müller-Simon
days in a green glass melt as measured with electrochemical sensors. For comparison the figure also shows the results of X-ray fluorescence analysis (XFA) of sulfur in the final glass products. As expected, the concentration of dissolved sulfur increases with increasing oxygen partial pressure. Measurements of both oxygen partial pressure and sulfur concentration are nowadays very reliable. The great advantage of these measurements is that continuous availability of data is possible without sample preparation. This method is also available as an offline measurement for raw material, especially for cullet examination (Beerkens et al. 1997). In this case melting experiments are conducted in a crucible during which oxygen partial pressure measurements are carried out by means of an electrochemical oxygen sensor. The measurement of the oxygen partial pressure provides a strongly temperature dependent sensor signal which adjusts to the redox equilibria of all present polyvalent elements. The temperature dependence of this signal is governed by the combination of all of the polyvalent elements in the melt. The concentration of physically dissolved oxygen is very small in glass melts (Lenhart and Schaeffer 1985; Kohl and Schaeffer 1987) so, only the oxygen which is chemically bonded to polyvalent ions is of interest in dealing with redox reactions. In the case of an industrial soda-lime-silica glass melt, the total chemically bonded oxygen can be written as: V02\hem = ^¡-[Fe3+] + -i[Cr 3 + ] + i [ C r 6 + ] + V 4 4 4 4
+
] +V 4
+
]
(28)
where the species concentrations are multiplied by the electron transition to the most reduced state in the glass melt with respect to the ionization of 0 2 . This quantity remains constant in the case of temperature variations which are fast compared to the time required for macroscopic oxygen diffusion. The total chemically bonded oxygen can be determined by species analysis in the final glass product. In contrast to oxygen diffusion, electron exchange reactions between pairs of polyvalent elements are possible down to temperatures in the range of the glass transition temperature. Since the equilibrium constants of the redox reactions of iron, chromium and sulfur are well known (Miiller-Simon 2007) the redox ratio of every involved polyvalent element may be calculated at any temperature based on Equation (28). Especially the temperature variations of the Fe 2+ /Fe 3+ -ratio, which are inevitable under industrial conditions, may be corrected. Redox number concepts The measuring methods considered above describe the state at the end of the process. This is often considered disadvantageous because the associated control loop, i.e., the time between a variation of the batch composition and the detection of the effect in the glass properties, is very long. Assuming that the redox state is mainly given by the batch composition, a characteristic number could already provide this information at the beginning of the process. For this purpose several redox number concepts have previously been developed. All these concepts are based on the carbon number concept of Manring and Hopkins, which was developed in the 1950s (Manring and Hopkins 1958). This concept is based on the simple assumption that sodium sulfate and carbon react according to the equilibria in Equation (24). It is assumed that the redox state of the batch is neutral if reaction (24) runs stoichiometrically. Under this condition, one mole of carbon will be neutralized by exactly two moles of sodium sulfate. Taking into account the molecular weights of carbon (12 g/mol) and sodium sulfate (142 g/mol), one weight unit of carbon is neutralized by 23.6 weight units of sodium sulfate. For practical purposes Manring and Hopkins (1958) introduced relative factors by which each component of the batch can be weighted with respect to its redox potential. Reducing raw materials like coke and blast furnace slags are assigned negative factors, whereas oxidizing agents such as sodium sulfate are assigned positive factors. In order to calculate the redox state
Fining of Glass
351
Melts
of the batch, the portion of every batch component is multiplied with its respective redox factor and these figures are summed up over all batch components. The sum is related to a batch with 2000 kg of sand. A more detailed description of the calculation procedure and a list of coefficients is given in Falcone et al. (2011, this volume). The first tests of this approach showed that some theoretical factors did not agree well with the observed influence of the respective components. Especially those for coke, which is in practice, far less reducing than expected from the theoretical factor of the carbon number. This fact first appeared when the redox state of a melt was intended to be constant during a change from sulfate/coke to blast furnace slag addition (Simpson and Myers 1978). Simpson and Myers subsequently modified the factors of Manring and Hopkins (1958) by lowering the factor of coke from - 1 6 to -6.7, while the factors for the oxidizing components remained constant. The redox number is still in use in many glass factories for the estimation of the redox state of the batch. One difficulty of this concept is the introduction of recycled cullet. Although the mean organic contamination can be estimated (Nix and Williams 1990), the control of short time variations requires additional effort. An alternative concept has been developed in which the reducing effect of the raw material is experimentally determined (Manring and Davis 1978; Manring and Diken 1980). The effective portion of carbon required by Equation (24) is determined by measurement of the chemical oxygen demand (COD). The equivalent amount of carbon is introduced in the calculation of the redox number with the theoretical efficiency of carbon according to Equation (24). This COD redox number concept is more laborious, but has the advantage that the redox state of the batch is experimentally verified. More accurate correlations can be determined using the COD redox number, if the reducing or oxidizing effect of raw materials with varying redox state such as filter dust or recycled cullet has to be considered. Interdependence of redox related measurements The redox state of the glass melt is determined by the batch bulk composition, thus, there should be a strong relation between the oxygen partial pressure and the redox number of the batch. This can be found, as shown in Figure 10, for several industrially produced glasses. In most cases the COD of the cullet is estimated and the oxidizing power of filter dust is derived from its S0 3 concentration.
-90
-50
-10
30
C O D redox number
Figure 10. Correlation between batch redox number and oxygen partial pressure in the melt for different glass melts (Müller-Simon 1999) [Used by permission of the Deutsche Glastechnische Gesellschaft, from Müller-Simon (1999) HVG-Fortbildungskurs 1999, Fig. 14].
352
Müller-Simon MODELS OF INDUSTRIAL SULFUR FINING
Depending on the particular requirements, different approaches have been worked out to describe the action of sulfur in the course of the melting process. In principle they reflect the view of the laboratory experiments, i.e., these concepts are based on the equilibria of polyvalent elements with oxygen in the glass melt or on the batch reaction. The quality of sulfur fining varies in a distinct manner over the entire redox range (Williams 1980). Under oxidizing conditions good fining quality may be achieved if the fining temperature is high enough. Slightly reducing conditions improve the fining action and a good quality product is already achieved at lower temperatures. At redox conditions corresponding to the sulfur solubility m i n i m u m , fining action b e c o m e s largely ineffective. This behavior predominantly affects the production of green glasses (Beutinger 1995). A m b e r glasses, which are produced under very reducing conditions, possess good fining quality; this behavior seems to be influenced by the iron concentration (Harding and Ryder 1970). However, if the oxygen partial pressure b e c o m e s too low, the amber color vanishes and no fining action is observed (MiillerSimon 1997).
Solubility concept The simplest concept of sulfur fining relies on the variation of the sulfur solubility as a function of oxygen partial pressure (see Figs. 4, 5 and 6). This concept assumes that the fining process is driven by the decrease in the solubility of sulfur compounds. In other words, the fining intensity increases in direction of the solubility minimum. The increased release of fining gas associated with this approach explains the improved fining behavior observed in slightly reducing flint glass melts. At constant additions of fining agents in the batch and more reducing conditions, less sulfur remains dissolved in the glass melt. According to this concept, the sulfur evolved as a result of the difference between the sulfur concentrations in the initial and the final melt acts as fining gas. However, according to reactions (18) to (25), this portion of S 0 2 is produced at a very early stage of the melting process therefore making no contribution to the fining process. This concept does not account for the basic observation that fining is temperature dependent. Furthermore, in contrast to the expected behavior glass melts produced near the sulfur solubility m i n i m u m tend to have poorer fining quality (Beutinger 1995). These considerations indicate that the solubility concept overestimates the amount of S 0 2 that contributes to fining.
Equilibrium concepts The basic problem with the concept discussed above, is that the role of temperature is not sufficiently considered. The role of temperature in fining was introduced in a concept proposed by Chopinet et al. (1983) and Chopinet and Barton (1986). This concept is based on the consideration that at the end of an effective fining process, the composition of bubbles should consist only of S 0 2 and 0 2 , and that if such a melt is heated, the first bubbles occur at the temperature where pS02 + p02 = 1 bar. This temperature is called sulfur saturation temperature. Under this presumption Chopinet and Barton (1986) combined the decomposition reaction of sulfate (Eqn. 11) with the redox equilibrium of ferrous and ferric iron in silicate melts. (29) Combining Equation (11) with Equation (29) yields SO 2 ~{m) + 2 F e 2 + ( m ) S 0 2 ( g ) + 2 F e 3 + ( m ) + 2 0 2 ~ ( m ) Using the equilibrium constants for reaction (11)
(30)
Fining of Glass
Melts
[so;-]
353 (31)
Pso, ' Po, and reaction (29) [Fe 3 [Fe2
(32) Po,
the equilibrium constant of reaction (30) can be expressed as K' =
P so,
[Fe 3
[soj-
[Fe2
(33)
Chopinet and Barton (1986) obtained the thermochemical data of this reaction in fiber glass melts, studied the residual sulfur contents in samples from two fiber glass melting tanks, and plotted the sulfur contents against the melt's redox state given by the square of the iron redox ratio. The plot of measured data and calculated data at two temperatures are shown in Figure 11. Although they found that the redox state varied over a wide range, the sulfur concentrations plotted according to Equation (33) lie close to the curves of constant temperature in Figure 11; in other words the temperature of sulfur release was primarily a property of the glass melting tank. This makes it easy to estimate the total process related sulfur emissions from the batch reactions and fining. Dynamic equilibrium concepts The concepts which have been described above can only be applied to oxidizing melting conditions. For reducing conditions where reaction (12) takes place, no such exist. The oxygen
(Fe 2+ /Fe 3 Figure 11. Sulfur concentration as a function of redox state of iron in the glass. Solid lines are fits according to Equation (33). Data are from Chopinet et al. (1986).
354
Müller-Simon
balance calculation allows for the calculation of S 0 2 in oxidized as well as in reduced glass melts as a function of temperature by means of Equation (28) (Miiller-Simon 1994, 1997, 1998a). Figure 12 shows the temperature dependence of the calculated S 4 + concentration (cf. Eqn 28) in two green container glasses which have been melted under different melting conditions. Because of the negligible small S 0 3 2 - solubility it may be assumed that this S 4+ immediately forms gaseous S 0 2 according to S 4 + (m) + 2 0 2 - { m ) S 0 2 ( g )
(34)
S 0 2 containing bubbles can only be dissolved if the S 4+ -concentration in a glass melt falls below the solubility limit at a given temperature. Forming of glasses is carried out at decreasing temperature between 1200 °C and 1000 °C. In this temperature range the dissolution of small bubbles requires typically a few minutes, which is longer than most forming processes. Especially in container glass production, bubbles will not dissolve after feeding the glass into the forming molds, i.e., in order to produce a bubble free glass the S 4 + concentration must fall below a certain limit when the forming starts. According to Figure 12 this limit lies at about 0.02 wt% S, which is above typical sulfur solubilities in soda-lime-silicate melts (cf. Backnaes and Deubener 2011, this volume). However, this is not a chemical value but a quality criterion. A satisfactory green glass quality may still contain a small residual seediness. The most important advantage of this fining model is the possibility of describing fining under reducing conditions. One could assume that with increasing temperature S 2 may be released, but there is no reason why the chemical solubility of S2~ should decrease. On the other hand it is known that the fining action of sulfur under reducing conditions depends on a sufficient concentration of iron (Harding and Ryder 1970). It is also known that sulfur and iron interact in glass melts (Miiller-Simon 1994). Thus, a fining reaction 6 Fe 3+ im) + S2~ i m ) 6
Fe 2 + im) + S 4+ im)
(35)
in combination with Equation (34) is most probable in iron-bearing glass melts under reducing conditions. The validity of reaction (35) is proved by the vanish of the amber color with
gob temperature 0,02
0,00
0
400
800 temperature in °C
—•—with bubbles
1200
1600
—o- without bubbles
F i g u r e 12. Calculated concentrations o f tetravalent sulfur as a function o f temperature for two green glasses with different quality [Used by permission o f Society o f Glass Technology, from Miiller-Simon ( 1 9 9 8 a ) Glastech. Ber. Glass S c i . Technol. 71, Fig. 8],
Fining
of Glass
Melts
355
increasing temperature (Miiller et al. 1999). This reaction does not only describe the fining action, but it also explains why fining of over-reduced glass melts does not work (MiillerSimon 1997).
INVESTIGATIONS UNDER INDUSTRIAL CONDITIONS Over several years the Research Association of the German Glass Industry (HVG) has performed many investigations in industrial mass glass production, including the measurement of sulfur concentrations in gaseous emissions and glass melts. Data on sulfur mass flows are available for batch, fuel, waste gas, and glass. Additionally, redox data for the batch, the furnace atmosphere and the glass are even available for some cases. According to the considerations enumerated above, sulfur mass flows may be expected from batch reactions as well as from fining. In fossil fuel fired furnaces, the heat is produced by flames and mainly supplied to the glass melt via radiation. The most common type among these is the regenerative furnace in which the combustion air is pre-heated in regenerators. These consist of a ceramic checker work where in turn hot exhaust gas and cold air are passing through. For this purpose the furnace is heated from two sides alternately. While the exhaust gas is passing through the regenerator, the checker work is heated up. After the reversal of the firing side, this heat is transferred to the cold combustion air. Regenerative furnaces are used in the flat and the special glass fields as well as in the container glass production. They feature a relatively low specific heat demand but necessitate relatively high investment for the regenerators. If the ports where the fuel and the pre-heated air enter the furnace and the exhaust gas leaves the furnace are vis-a-vis one speaks of cross-fired regenerative furnaces, if they are side by side of end-fired furnaces. Another type are recuperative glass melting furnaces where the combustion air and the exhaust gas stream through separated cavities in steel or ceramic recuperators, thus, effecting counterflow heat exchange (Trier 1984). Figure 13 shows the relevant sulfur mass flows in an industrial glass melting furnace. If the balance boundaries are taken without the heat regenerators, sulfur is introduced into the process by the raw materials SbaKh, the fuel Sf,,ei, and a portion which is deposited in the regenerator checker work from the waste gas and which is released into the combustion air.
combustion s
fuel
furnace atmosphere
waste gas
" " ^waste
^air i
; s
batch
batch
S release
; s
melt
glass melt
Sglass
glass
Figure 13. Sketch of the sulfur mass flows in industrial glass melting tanks [Used by permission of German Society of Glass Technology, from Müller-Simon and Gitzhofer (2008) Glass Technol. Eur. J. Glass Sei. Technol. A 49. Fig. 1].
356
Müller-Simon
Sulfur leaves the process with the waste gas, swaste, and the produced glass, sgiass. From Figure 13 balances for sulfur mass flows can be derived in industrial glass melting furnaces. * fuel
air
(
3 6
)
and + smste
(37)
The balance then yields 15
fuel
T
air
~
(38)
J
glass
The compounds which are used as fining agents are sodium sulfate, blast furnace slags and filter dust. The amount of sulfur in the cullet depends on the type of cullet: amber, green, flint or mixed. The amount which is introduced with the fuel depends on the fuel quality. According to current EU regulations, heavy fuel oil can contain up to 1 % S while light fuel contains up to 0.1% S. In the following section we will try to identify the reactions of sulfur release which have been compiled above with the measurable mass flows in glass melting furnaces. The total sulfur which is released from the melting process is ^release
^waste
^fuel
^air
^batch
Sgiass
(-^9)
According to reactions (23) to (25) a sulfur mass flow from the batch into the furnace atmosphere, sbatch emissions, exists and according to the temperature dependence of reactions (11) (and 20, resp.) and (12) (and 35, resp.) a sulfur mass flow, Sfi , from the melt into the furnace atmosphere. ning
In cross-fired furnaces it is possible to measure sulfur mass flows through every port, sport, along the furnace axis, which makes estimation of how much sulfur is lost from the batch and how much from the fining area possible (Miiller-Simon and Gitzhofer 2008). release
=Z V . port
(40)
Sulfur enters the furnace chamber with the fuel and the combustion air and leaves it with the waste gas. The sulfur mass flow released with the waste gas is always larger than that which is introduced with the fuel and the combustion air. The difference between discharged sulfur and that introduced into the furnace is equal to the mass flow from the batch and the glass melt into the atmosphere. The results in Figure 14 from investigations in container glass furnaces are a demonstration of this balance. It may be assumed that the batch reaction takes place in the region of ports 1 and 2 and the fining reaction in the region of ports 3 and 4. For all melt compositions about 2/3 of the sulfur emissions come from the batch area and only 1/3 from the refining area. According to Figure 14, the sulfur release is mostly affected by the color of the produced glass, i.e., the redox state (flint glass is produced at p02 = 10 _1 -10~ 2 bar, green at 10~ 3 -10^ bar and amber at 10~5-10~10 bar). Green and amber glass batches release considerably more sulfur compared to flint glass, although the sulfur addition in flint glass batches is larger compared to colored glasses. This is true for the batch reactions as well as for the fining. However, most of the sulfur is released by means of reactions (23) to (25), and smaller amounts by the fining reactions. This behavior is also in agreement with Figure 7. The batch reactions are also influenced by the furnace atmosphere. The two green glasses are melted under completely different combustion conditions. Oxygen excess in the atmosphere causes lower sulfur release in the region of the first port, where as an oxygen deficit causes increased sulfur release. The reason is that in Equation (21) not only the CO which is formed according to the Boudouard equilibrium, but also CO which has infiltrated from the furnace
Fining of Glass
35 7
Melts
atmosphere becomes active in the reactions. Figure 15 shows the sulfur release into the flue gas, swasK, as a function of the redox state of the combustion. All the sulfur which is introduced with the batch and that is not dissolved in the glass melt must be released during glass melting: (41)
^ glass
Figure 16 shows the total sulfur release of the batch and the glass melt as a function of the sulfur addition, with the batch less the sulfur mass flow with the produced glass. Both quantities are related to the tonnage of produced glass. The sulfur content of the fuel has an insignificant influence on the balance in Equation (41) (Miiller-Simon and Gitzhofer 2008). In the case of flint and amber glass, the sulfur emissions clearly increase with increasing sulfur additions. The straight line in Figure 16 shows the best fit line which has a slope of one. This slope means that all the excess sulfur which is not dissolved in the melt is indeed emitted.
flint
-green
-amber
Figure 14. Sulfur release out of the batch and the glass melt into the furnace atmosphere along the axis of cross-fired furnaces for flint, green and amber container glass production [Used by permission of Society of Glass Technology, from Miiller-Simon and Gitzhofer (2008) Glass Technol. Eur. J. Glass Sci. Technol. A 49, Fig. 3].
12
12,5
o x y g e n in flue g a s In v o l . %
Figure 15. Influence of the oxygen content in the furnace atmosphere on sulfur release [Used by permission of Society of Glass Technology, from Miiller-Simon and Gitzhofer (2008) Glass Technol. Eur. J. Glass Sei. Technol. A 49, Fig. 6].
358
Müller-Simon
0,6
0,8 Sbatch-Sgiass
1
1,2
in kg/t glass
Figure 16. Released sulfur srdease as a function of sulfur mass flow with the batch less the sulfur mass flow in the produced glass sbalcll-sgia„ related to the load. Different filling of symbols refer to different redox state of the furnace atmosphere [Used by permission of Society of Glass Technology, from Müller-Simon and Gitzhofer (2008) Glass Technol. Eur. J. Glass Sei. Technol. A 49, Fig. 8],
The deviations from this behavior are probably caused by perturbations from the steady state. Figure 16 also contains an example of flint glass production under various furnace atmosphere oxidation states. This example demonstrates the effect of non-steady state behavior. Although the sulfur release may be caused by locally different mechanisms, in a steady state all the excess sulfur will be released. This means that the excess sulfur not released from the batch by the batch reaction or interaction with the furnace atmosphere is finally released during fining. This is a very important statement with respect to the environmental impact of a given batch composition and glass melting furnace. However, this does not implicitly result in an improvement of the fining action. In the case of a minor gas release with increasing temperature seeds or bubbles may result.
SUMMARY Fining is the most important step in industrial glass production. In this step the glass melt is cleared of bubbles and homogenized. Thus, fining is crucial for the quality of the final glass product. Agents added with the raw material batch release gas with increasing temperature enlarging gaseous inclusions to large bubbles. These bubbles develop enough buoyancy to reach the surface of the glass melt and escape in sufficiently short time. Special glasses are fined by means of oxygen fining mostly with antimony oxide or sodium chloride fining. Mass glasses like container, flat and fiber glass, which account for the largest portion of produced tonnage, are fined with sulfur compounds. It can be shown that most of the sulfur is released in the course of the batch reactions due to the reaction with reducing components. An additional impact is caused by the interaction of the batch with the furnace atmosphere at this stage. Only one third of the released sulfur is caused by fining. Sulfur fining under oxidizing condition is due to the thermal decomposition of the sulfate anion. This decomposition can be improved at slightly reducing conditions or by addition of polyvalent elements for instance iron in green glass. Under very reducing conditions sulfur fining is achieved through oxidation of the sulfide anion through reaction with iron.
Fining of Glass
Melts
359
Sulfur oxide emissions from industrial glass melting tanks are limited due to legal restriction. The knowledge of the basic reactions which are responsible for these emissions is required to optimize the batch composition and the melting process. However, the chemical interactions in the real glass melting process are complex. Thus, future application of this knowledge will increasingly rest upon model based control (Chmelar et al. 2000; Beerkens 2002).
ACKNOWLEDGMENT The author wishes to thank Don Baker and Mathi Rongen for reviewing this chapter. Further thanks go to Harald Behrens and Jim Webster for their constructive comments. All of them greatly assisted in getting this chapter across to geologists. Finally the author thanks Klaudia Jaenicke and Aaron Bell for proof-reading.
REFERENCES Backnaes L, Deubener J (2011) Experimental studies on sulfur solubility in silicate melts at near-atmospheric pressure. Rev Mineral Geochem 73:143-165 Backnaes L, Stelling J, Behrens H et al. (2008) Dissolution mechanism of tetravalent sulphur in silicate melts: evidence from sulphur K edge XANES studies on glass. J Am Ceram Soc 91:721-727 Bassine JF, Mestdagh MM, Rouxhet PG (1987) Redox buffering by sulphate and carbonate during the melting of reduced soda-lime-silica glasses. Glass Technol 28:50-56 Baucke FGK, Werner RD, Müller-Simon H, Mergler K (1996) Application of oxygen sensors in industrial glass melting tanks. Glastech Ber Glass Sei Technol 69: 57-63 Beerkens RGC (1995) The role of gases in glass melting processes. Glastech Ber Glass Sei Technol 68:369-380 Beerkens RGC (2002) Modelling of the melting process in industrial glass furnaces. In: Mathematical simulation in glass technology. Schott series on glass and ceramics, science, technology and applications. Krause D, Loch H (eds) Springer Verlag, p 17-72 Beerkens RGC (2003) Sulfate decomposition and sodium oxide activity in soda-lime-silica glass melts. J Am Ceram Soc 86:1893-1899 Beerkens RGC (2005) Sulphate decomposition and sulphur chemistry in glass melting processes. Glass Technol: Eur J Glass Sei Technol 46:39-46 Beerkens RGC (2007) Sulphur chemistry and sulphate fining and foaming of glass melts. Glass Technol: Eur J Glass Sei Technol A 48:41-52 Beerkens RGC, Faber A, Plessers J, Thontat T (1997) Methods for the characterization of redox state of cullet and batches in glass manufacturing. Glass 74:371-375 Beutinger M (1995) Einsatz von Recyclingglas in der Hohlglasschmelze. Glastech Ber Glass Sei Technol 68:N51-N58 Brückner R (1962) Zur Kinetik des Stoffaustausches an den Grenzflächen zwischen Silikatglas- und Salzschmelzen und des Stofftransportes in Silikatglasschmelzen unter besonderer Berücksichtigung des Verhaltens von N a 2 S 0 4 und seiner Zersetzungsprodukte. Teil III. Glastechn Ber 35:93-105 Cable M (1960) A study of refining. Part 1. Measurements of the refining of soda-lime-silica glass with and without refining agents. Glass Technol 1:144-154 Cable M (1961a) A study of refining. Part 2. Mechanism of refining. Glass Technol 2:60-70 Cable M (1961b) A study of refining. Part 3. The function of arsenious oxide during melting and refining. Glass Technol 2:151-158 Chmelar J, Bodi R, Muijsenberg E (2000) Supervisory advanced control of glass melters and forehearth by GS expert system. Glastech Ber Glass Sei Technol 73:276-284 Chopinet MH, Barton JL (1986) The Effect of melting temperature on the residual sulfate content of glass. Proc XIV. Int Congr on Glass {INCOMPLETE REFERENCE: need page numbers, publisher, editor, etc.} Chopinet MH, Massol JJ, Barton JL (1982) La relation entre la teneur en sulfate et l'état d'oxydation de verres fondus en presence de réducteurs. Rev Staz Sper Vetro 5:200-201 Chopinet MH, Massol JJ, Barton JL (1983) Factors determining the residual sulfate content of glass. Glastechn Ber 56K:596-601 (NOT USED?) Collignon J, Rongen M, Beerkens RGC (2010) Gas release during melting and fining of sulphur containing glasses. Glass Technol: Eur J Glass Sei Technol A 51:123-129 Conradt R, Suwannathada P, Pimkhaokham P (1994) Local temperature distribution and primary melt formation in a melting batch heap. Glastech Ber Glass Sei Technol 67:103-113 Duffy JA (1989) A common optical basicity scale for oxide and fluoride glasses. J Non-Cryst Solids 109:35-39
360
Müller-Simon
Duffy JA, Ingram MD (1976) An interpretation of glass chemistry in terms of the optical basicity concept. J Non-Cryst Solids 21:373-410 Dusdorf W, Müller-Simon H (1997) Investigations into the existence of hexavalent chromium in industrial glasses. Glastech Ber Glass Sei Technol 70:325-332 Falcone R, Ceola S, Daneo A, Maurina S (2011) The role of sulfur compounds in coloring and melting kinetics of industrial glass. Rev Mineral Geochem 73:113-141 Fincham CJB, Richardson FD (1954) The behaviour of sulphur in silicate and alumínate melts. Proc R Soc A223:l 152, 40-63 Flick C, Nolle G (1995) Redox conditions during the melting of batch. Glastech Ber Glass Sei Technol 68:8183 Frey T, Schaeffer HA, Baucke F G K (1980) Entwicklung einer Sonde zur Messung des Sauerstoffpartialdrucks in Glasschmelzen. Glastechn Ber 53:116-123 Geotti-Bianchini F, De Riu L (1998) Water content of sulfate-fined industrial soda-lime glass and its influence on workability. Glastech Ber Glass Sei Technol 71: 230-242 Goldman DS (1985) Redox and sulfur solubility in glass melts. In: Gas bubbles in glass. Prepared by Technical Committee 14 of the International Commission on Glass. Institut National du Verre, Charleroi, 74-91 Hanke KP, Scholze H (1970) Einfluss des Wasserdampfes auf die Blasenbildung sulfathaltiger Glasschmelzen. Glastechn Ber 43:475-482 Harding FL, Ryder RJ (1970) Amber colour in commercial silicate glasses. J Can Ceram Soc 39:59-63 Kircher U (1993) Investigations concerning the recycling of filter dust from electrostatic precipitators in the glass industry. Glastech Ber 66:279-283 Klouzek J, Arkosiová M, Némec L, Cincibusová P (2007) The role of sulphur compounds in glass melting. Glass Technol:Eur J Glass Sei Technol A 48:176-182 Kohl R, Schaeffer HA (1987) Oxidation states of glass melts. Diffusion and Defect Data 53-54:325-334 Krämer F (1979) Mathematisches Modell der Veränderung von Gasblasen in Glasschmelzen. Glastechn Ber 52:43-50 Krämer F (1991) Contribution to basicity of technical glass melts in relation to redox equilibria and gas solubilities. Glastech Ber 64:71-80 Krämer F (1999) Theorie und Praxis des Läuterns technischer Gläser. In: Grundlagen des industriellen Glasschmelzprozesses. Verlag der Deutschen Glastechnischen Gesellschaft, Frankfurt/M., p 25-42 Krauß M, Lenhart A, Ratka H, Kircher U (1995) Characterization of filter dust in the glass container industry and definition of its influence on green glass melts. Glastech Ber Glass Sei Technol 65:278-284 Lahiri D, Mukherjee B, Majumdar RN, Bihar D (1974) Mechanismus der Wechselwirkung zweier RedoxOxide in Glas. Glastechn Ber 47:4-9 Laimböck P, Beerkens RGC (2001) On-line redox sensors in industrial glass melting tanks, Proc 62nd Conf on Glass Problems, p. 27-44 Lenhart A, Schaeffer HA (1985) Elektrochemische Messung der Sauerstoffaktivität in Glasschmelzen. Glastech Ber 58:139-147 Manring WH, Davis RE (1978) Controlling redox conditions in glass melting. Glass Ind 5:13-30 Manring WH, Diken GM (1980) A Practical approach to evaluating redox phenomena involved in the meltingfining of soda-lime glasses. J Non-Cryst Solid 38-39:813-818 Manring WH, Hopkins RW (1958) Use of sulfates in glass. Glass Ind 39:139-170 Müller M, Rüssel C, Claußen O (1999) UV-VIS spectroscopic investigations of amber glass at high temperatures. Glastech Ber Glass Sei Technol 72:362-366 Müller-Simon H (1994) On the interaction between oxygen, iron and sulfur in industrial glass melts. Glastech Ber Glass Sei Technol 67:297-303 Müller-Simon H (1997) Temperature dependence of the redox state of iron and sulfur in amber glass melt. Glastech Ber Glass Sei Technol 70:389-391 Müller-Simon H (1998a) Oxygen balance in sulfur-containing glass melts. Glastech Ber Glass Sei Technol 71:157-165 Müller-Simon H (1998b) Meßanordung zur Kontrolle der Farbe und des Läuterzustands industrieller Glasschmelzen. Final report of the IGF/AiF research project no 10397 Müller-Simon H (1999) Sulfatläuterung in Kalk-Natron-Silicatgläsern. In: Grundlagen des industriellen Glasschmelzprozesses. Verlag der Deutschen Glastechnischen Gesellschaft, Frankfurt/M, p 45-72 Müller-Simon H (2007) Elektronenaustausch zwischen Paaren polyvalenter Elemente in technischen Gläsern und seine Auswirkungen auf die industrielle Glasherstellung. Verlag der Deutschen Glastechnischen Gesellschaft, Offenbach/Main Müller-Simon H, Bauer J (2007) Elektrochemische Sensoren für Messungen in industriellen Glasschmelzen. Stand derTechnik. dgg-journal 6:11-15 Müller-Simon H, Gitzhofer K (2008) Sulphur mass flow balances in industrial glass melting furnaces. Glass Technol Eur J Glass Sei Technol A 49:83-90
Fining of Glass
Melts
361
Müller-Simon H, Mergler KW (1988) Electrochemical measurements of oxygen activity of glass melts in glass melting furnaces. Glastech Ber 61:293-299 Mulfinger HO (1980) Gase (Blasen) in der Glasschmelze. In: Glastechnische Fabrikationsfehler. JebsenMarwedel H, Brückner R (ed) Springer, Berlin, p 193-268 Nagashima S, Katsura T (1973) The solubility of sulfur in Na 2 0-Si0 2 melts under various oxygen partial pressures at 1100 °C, 1250 °C and 1300 °C. Bull Chem Soc Japan 46:3099-3103 Nix M, Williams HP (1990) Calculation of the redox number of batches containing recycled cullet. 2nd Int Conf Fusion and Processing of glass. Glastech Ber 63K:271-279 Nolle G, Al Hamdan M (1990) Kohlenstoff in Glasrohstoffgemengen. Silikattechnik 41:192-193 Oppenheimer C, Scaillet B, Martin RS (2011) Sulfur degassing from volcanoes: source conditions, surveillance, plume chemistry and earth system impacts. Rev Mineral Geochem 73:363-421 Pajean G, Delhopital G, Doumeng M (1975) Application de la Chromatographie en phase gazeuse a l'étude de la decomposition des mélange vitrifiables. Verres Refract 29:231-235 Paul A (1982) Chemistry of Glasses. Chapman and Hall, London and New York Rüssel C (1990) The electrochemical behavior of some polyvalent elements in a soda-lime-silica glass melt. J Non-Cryst Solids 119:303-309 Samadhi TW, Elliott JC, Jones LE, Clare AG (2001) Sodium sulfate decomposition in dry atmospheres. Glastech Ber Glass Sci Technol 74:47-56 Schaeffer H A (1996) Recycling of cullet and filter dust in the German glass industry. Glastech Ber Glass Sci Technol 69:101-106 Schreiber HD, Kozak SJ et al. (1987) Sulfur chemistry in a borosilicate melt. Glastech Ber Glass Sci Technol 60:389-398 Simpson W, Myers DD (1978) The redox number concept and its use by the glass technologist. Glass Technol 19:4, 82-85 Sun K-H (1947) Fundamental condition of glass formation. J Am Ceram Soc 30:277-281 Sun K-H (1948) A scale of acidity and basicity in glass. Glass Ind 29:73-74, 98 Thieme C (1993) Sodium carbonate. In: Ullmann's Encyclopedia of Industrial Chemistry. Elvers B et al. (eds) VCH Verlagsgesellschaft Weinheim Toop G W, Samis CS (1962) Some new ionic concepts of silicate slags. Trans Met Soc AIME 224:878-887 Trier W (1984) Glass Furnaces: Design, Construction and Operation. Society of Glass Technology, Sheffield. Webster JD, Botcharnikov RE (2011) Distribution of sulfur between melt and fluid in S-O-H-C-Cl-bearing magmatic systems at shallow crustal pressures and temperatures. Rev Mineral Geochem 73:247-283 Weyl W (1943) The role of sodium sulfate in glass manufacture. Glass Ind 24:17-20, 39 Wilke M, Klimm K, Kohn SC (2011) Spectroscopic studies on sulfur speciation in synthetic and natural glasses. Rev Mineral Geochem 73:41-78 Williams HP ( 1980) Einfluss des Oxidationszustandes des Gemenges auf die Glasläuterung mit schwefelhaltigen Läutermitteln. Glastechn Ber 53:189-194
13
Reviews in Mineralogy & Geochemistry Vol. 73 pp. 363-421,2011 Copyright © Mineralogical Society of America
Sulfur Degassing From Volcanoes: Source Conditions, Surveillance, Plume Chemistry and Earth System Impacts Clive Oppenheimer1'2'3, Bruno Scaillet2 and Robert S. Martin4 1
2
Le Studium, Institute for Advanced Orléans and Tours, France
Studies
Centre National de la Recherche Scientifique-Institut National des Sciences de 1'JJnivers, Université d'Orléans
Université François Rabelais de Tours, Institut des Sciences de la Terre la rue de la Férollerie, Orléans 45071, France
d'Orléans
3
Department of Geography, University of Cambridge Downing Place, Cambridge CB2 3EN, United Kingdom 4 School of Biological and Chemical Sciences Queen Mary, University of London, United Kingdom
[email protected]
INTRODUCTION Despite its relatively minor abundance in magmas (compared with H 2 0 and C0 2 ), sulfur degassing from volcanoes is of tremendous significance. It can exert substantial influence on magmatic evolution (potentially capable of triggering eruptions); represents one of the most convenient opportunities for volcano monitoring and hazard assessment; and can result in major impacts on the atmosphere, climate and terrestrial ecosystems at a range of spatial and temporal scales. The complex behavior of sulfur in magmas owes much to its multiple valence states (-II, 0, IV, VI), speciation (e.g., S 2 , H 2 S, S0 2 , OCS and S0 3 in the gas phase; S2~, S0 4 2 - and S 0 3 2 - in the melt; and non-volatile solid phases such as pyrrhotite and anhydrite), and variation in stable isotopie composition (32S, 33S, 34S and 36S; e.g., Métrich and Mandeville 2010). Sulfur chemistry in the atmosphere is similarly rich involving gaseous and condensed phases and invoking complex homogeneous and heterogeneous chemical reactions. Sulfur degassing from volcanoes and geothermal areas is also important since a variety of microorganisms thrive based on the redox chemistry of sulfur: by reducing sulfur, thiosulfate, sulfite and sulfate to H 2 S, or oxidizing sulfur and H 2 S to sulfate (e.g., Takano et al. 1997; Amend and Shock 2001; Shock et al. 2010). Understanding volcanic sulfur degassing thus provides vital insights into magmatic, volcanic and hydrothermal processes; the impacts of volcanism on the Earth system; and biogeochemical cycles. Here, we review the causes of variability in sulfur abundance and speciation in different geodynamic contexts; the measurement of sulfur emissions from volcanoes; links between subsurface processes and surface observations; sulfur chemistry in volcanic plumes; and the consequences of sulfur degassing for climate and the environment. Geodynamics and the geochemical behavior of sulfur The sulfur released by magmas in volcanic emissions may derive from three different sources: dissolved in the silicate liquid, present in a coexisting gas phase at depth, or from the breakdown of sulfur-bearing minerals. Both the amount of sulfur locked in solid compounds 1529-6466/11/0073-0013S10.00
DOI: 10.2138/rmg.2011.73.13
364
Opipenheimer,
Scaillet,
Martin
(essentially sulfates and sulfides) and that dissolved in silicate melt under pre-eruptive conditions can be accurately measured. The greatest unknown in assessing the budget of sulfur that can potentially be sourced from degassing magmas comes from the presence of an "excess" gas phase at depth, i.e., in the reservoir where the magma resides for a certain time prior to eruption (Shinohara 2008). This possibility introduces the difficulties of establishing the sulfur content of the gas phase in addition to the abundance of gas relative to minerals and silicate melt phases. Neither variable can be assessed by direct observation or geophysical investigations. We rely, therefore, on indirect means to estimate the abundance of gas and its sulfur content at depth. In the following subsections, we first consider the case for subduction zone magmas, concerning which considerable progress has been achieved in recent years, and then review the evidence for hot spot and ocean ridge environments. Subduction zones Although prior research had already suggested the presence of a gas phase at depth in arc magmas (Rose et al. 1982), the first eruption for which the case for an "excess" gas phase was strongly articulated was that of El Chichón in 1982, thanks to the efforts of the late Jim Luhr. He carried out detailed petrological work on this sulfide- and sulfate-bearing andesitic magma (Luhr et al. 1984; Luhr 1990). Scaling estimates of pre-eruptive dissolved sulfur (measured in crystal-hosted melt inclusions) by the eruption magnitude suggested a sulfur release as much as two orders of magnitude lower than the S0 2 measured by satellite remote sensing techniques (see later section). This great discrepancy between observations and petrologic estimates led Luhr et al. (1984) to suggest that the "excess" sulfur (i.e., that missing from the petrological calculation) was most probably stored in a coexisting gas phase in the reservoir. This approach revealed a similar picture for the next major sulfur-rich volcanic cloud, that released by the 1991 Plinian eruption of Mt. Pinatubo in the Philippines. Here again, comparison between remote sensing measurements and petrological calculations led Westrich and Gerlach (1992) to conclude the existence of an "excess" gas phase in which most of the sulfur was stored prior to eruption. An alternative scenario for sulfur release during the Pinatubo eruption involving anhydrite breakdown during decompression was proposed (Rutherford and Devine 1996), but such a mechanism is not supported on kinetic grounds (Gerlach et al. 1996). The evidence for excess sulfur stored in a gas phase has been reported since for a number of other active volcanoes, including Mt. St. Helens (USA, Gerlach and McGee 1994), Redoubt (USA, Gerlach et al. 1994), Nevado del Ruiz (Colombia, Williams et al. 1986; Sigurdsson et al. 1990), several Chilean volcanoes (Andres et al. 1991; Matthews et al. 1999) and Anatahan (Mariana Islands) during its 2003 eruption (de Moor et al. 2005). Thanks largely to satellite remote sensing estimates, there is, therefore, compelling evidence supporting the concept that arc magmas, in particular those of evolved composition, can hold a significant part of their sulfur budget in a gas phase at depth. The observed sulfur budgets point to a gas phase amounting to a few wt% of the magma, with a sulfur content (of the gas) of up to a few wt%. Another method used to retrieve gas abundance in magma reservoirs is based on the geochemical behavior of trace elements that are prevalent either in the silicate melt or in the gas phases (Wallace and Edmonds, 2011 this volume). If the partition coefficients of those elements are known, then it is possible to calculate the amount of a gas phase in the reservoir given a series of melt inclusions related to each other by a gas-melt fractionation process. Based on this assumption, it is possible to evaluate the amount of gas present in the various parcels of magma sampled by the melt inclusions. Such an approach has been applied successfully to the Bishop Tuff eruption (Wallace et al. 1995, 1999) and also to the 1991 Pinatubo eruption (Wallace and Gerlach 1994). Of particular importance is the latter case because the calculated abundance of gas in the reservoir (up to 5 wt%) corresponds to a sulfur yield similar to that measured independently by satellite remote sensing (around 9 Tg S).
Sulfur
Degassing
From
Volcanoes
365
Consideration of percolation theory led Wallace (2001) to conclude that this value might represent a fluid mechanical threshold. In other words, a magma reservoir cannot sustain more than 5 wt% of gas, beyond which all excess gas arising from further crystallization or supplied from deeper levels to the upper regions of the reservoir, is lost via percolation of gas through a permeable bubble network to the top of the reservoir and into the hydrothermal system. The sulfur content of gas in a magma reservoir can be also estimated from thermodynamic calculations. Using standard concepts of homogeneous equilibria in the C-O-H-S system, as pioneered by Holloway (1977, 1987), it is possible to calculate the abundance and nature of volatile species present in the gas phase. Given the potentially wide range of application of such an approach, its basic principles are summarized here. The gas phase is modeled in the C-O-H-S system, which typically accounts for over 95 mol% of the bulk composition of volcanic gases. Halogens are next in abundance (Aiuppa et al. 2009) but though they potentially affect sulfur solubility in relatively oxidized silicate melts (Botcharnikov et al. 2004; Webster et al. 2009), their role in affecting sulfur behavior in magmatic gases is neglected here for simplicity. Species typically considered are H 2 0, H 2 , C0 2 , CO, CH 4 , S 2 , S0 2 , H 2 S and 0 2 . The five coupled equilibria that govern the abundances of these species in the gas are: H2O = H2
(1)
CO + i o 2 = CO,
(2)
CH 4 + 20 2 = 2 H 2 0
€02
(3)
i s 2 + 0 2 = S0 2
(4)
^ S 2 + H 2 = H2S
(5)
with the corresponding equilibrium constants: (/o1/2x/H ) K, = ^
(6)
r
(7)
f iH,0
(/o 2
x
fco)
(./co2 x fn2o )
(•/ch4 x/O2 ) k 4 = , /so: (/o 2 x /s 2
(8)
(9)
fa2s 1/2 \
(/h2 x/sS2
(10)
where/; is the fugacity of species i. In such a system at any fixed pressure (P) and temperature (I), the knowledge of three additional intensive parameters constrains species' proportions (Holloway 1987). The equilibrium constants K ; can be computed from standard thermodynamic
366
Opipenheimer,
Scaillet,
Martin
databases (Symonds and Reed 1993). The additional relationships needed are: f,=X,
iPf
1 ^ = 1
(11) (12)
where Xt is the mole fraction of species I, and y; the fugacity coefficient (a correction for nonideality; y; = 1 for an ideal gas) at pressure P and temperature T. Several equations of state (EOS) enable calculation of the fugacity coefficient of the main species of interest (see, for instance, Ferry and Baumgartner 1987) but, in the context of the present review, we focus on low-pressure conditions ( / C O 2 or/ s ), which are the input parameters needed to solve the above set of equations (e.g., Anderson et al. 1989; Scaillet and Pichavant 2003, 2005). In general, thermobarometry based on mineral-mineral or mineral-melt equilibria (see Putirka 2008) provides further constraints on both temperature and/o 2 . The main unknown variable with respect to most active volcanoes is the reservoir depth, which can be evaluated either from phase equilibria (e.g., Rutherford et al. 1985; Johnson and Rutherford 1989; Martel et al. 1998; Cottrell et al. 1999; Scaillet and Evans 1999; Costa et al. 2004; Di Carlo et al. 2006), or from gas saturation systematics as first shown by Anderson et al. (1989) for the Bishop tuff for the C-O-H system. In the latter method, one seeks the pressure value which, for a given set of T,f H2Q , and/ cc , 2 conditions, fulfills the constraint of T.Xt = 1. Application of this thermodynamic approach to the C-O-H-S sytem was first attempted by Scaillet and Pichavant (2003) for several recent arc eruptions, for which the key intensive variables mentioned above were reasonably well known. The results are shown in Figure 1, where it can be appreciated that the sulfur content in the gas amounts, at most, to 5-6 wt% (or less than 6 mol% of H 2 S and S0 2 ) for the investigated samples. Another important aspect is the considerable variability between magmas of the studied eruptions, with sulfur content as low as 0.1 wt% (less than 0.1 mol%) in some cases. This is despite the fact that all considered eruptions represent a single tectonic environment, namely subduction-zone volcanism. The reasons for such variability are certainly complex and include source heterogeneity (in terms of sulfur content); the vagaries associated with the various fractionation mechanisms that can affect a magma between its source and the shallow reservoir; and the different types of interactions between host rocks and magma or during magma mixing, both of which are commonplace in arc environments. Whatever the causes, such diversity clearly indicates that evaluating the actual sulfur content of the gas phase present in a reservoir feeding any active volcano needs to be carried out on a case-by-case basis. It was also shown by Scaillet and Pichavant (2003) that in order to make the volcanic gas data match with computed gas composition at depth, the reservoir must already be saturated with at least 1 wt% gas phase, a conclusion consistent with evidence from remote sensing observations discussed above. The calculation of the deep-gas composition also reveals that it is, in general, somewhat richer in sulfur species' than corresponding volcanic exhalations, with the sum of sulfur-bearing species approaching a few mol% (for
Sulfur
Degassing
From
Volcanoes
367
Figure 1. Plots of sulfur concentration of the pre-eruptive gas phase for several historical eruptions in arc settings. The sulfur content has been calculated using a thermodynamic approach (see text and Scaillet and Pichavant 2003).
evolved magma compositions such as dacites), whilst in gases from volcanic arcs, sulfurbearing species abundances are less than 1 mol% (see Symonds et al. 1994). This difference is obviously related to the fact that, upon ascent and with reduced pressure, the water originally dissolved in the silicate liquid in the reservoir (generally in the range 4-7 wt%) is almost totally lost to the gas phase, which thus becomes very water rich. Another difference worthy of note is the fact that high-pressure gases are generally dominated by H 2 S, while the reverse is observed in volcanic gases, as a result of the pressure effect on equilibria governing the relative abundance of H 2 S and S0 2 (see below). This same method has been applied to volcanoes in non-arc settings by Scaillet et al. (2003), with the goal of estimating atmospheric sulfur yields of several major volcanic eruptions capable of impacting climate at a regional-to-global scale. Figure 2 compares the amounts of sulfur released by several eruptions, as derived by the improved petrologic approach, with those obtained by remote sensing techniques. In the derivation of petrologically-based values it is assumed that the magma coexisted with 5 wt% gas. Clearly, the generally good agreement observed between the two data sets supports the idea that most magmas contain a significant proportion of gas prior to eruption. Except for some outliers, the extended database provided by Scaillet et al. (2003) confirms that the sulfur content of the gas phase in silicic-tointermediate arc magmas is always below 10 wt%, with an average of around 3 wt%. When plotted against silica content of the magma, only a weak negative correlation appears: mafic magmas showing a tendency to be slightly richer in sulfur than silicic ones (Fig. 3). The lack of a more pronounced negative correlation contradicts the common view that silicic magmas tend to be poorer in sulfur than mafic ones, because of their intrinsic lower sulfur solubility: the latter fact is more than compensated for by the propensity of the gas phase to hold any sulfur present in the system (e.g., Scaillet et al. 1998; Keppler 1999, 2010), especially under oxidized conditions (Scaillet et al. 1998). However, it must be pointed out that mafic arc magmas seldom erupt and among those rare cases, only a handful have had their pre-eruptive conditions well constrained. The currently
368
Opipenheimer,
Scaillet,
Martin
arc magmas
1010 1011 1012 10 13 10 14 10 15 10 16
Petrologic estimate of Sulfur (g) Figure 2. Plot showing comparison of sulfur yields for several historical volcanic eruptions estimated f r o m remote sensing data (Table 3) and penological and thermodynamic constraints, assuming that the gas phase in the pre-eruptive reservoir amounts to 5 wt% (from Scaillet et al. 2003). The results for sulfur yields obtained only f r o m melt degassing are also shown.
CD
E
0.40
Figure 3. Plot of relationship between the bulk content of S in various magmas erupted at arc and non-arc volcanoes versus the m a g m a S i 0 2 content (from Scaillet et al. 2003)
TO 0.30 O) c Cß
50
60
70
SiC>2 bulk rock (wt%) available information on the sulfur content of gas in mafic arc magmas relies on a very limited data base. One of the best understood arc basalts is that erupted by Stromboli volcano, whose plumbing system is constrained by both phase equilibria (Di Carlo et al. 2006; Pichavant et al. 2009), detailed melt inclusion work (Métrich et al. 2001; Bertagnini et al. 2003, 2008), and volcanic gas emission data (Allard et al. 1994; Burton et al. 2007a; Aiuppa et al. 2010; Allard 2010). Here, the observations point to a deep reservoir located at pressures of 200-300 MPa, and connected to a very shallow reservoir residing at pressures equivalent to around 10-30 MPa. This, in turn, feeds the persistent, mildly explosive activity that typifies Stromboli. The calculation of the gas phase composition in the deep reservoir at 200-300 MPa (Scaillet and Pichavant 2005) indicates a sulfur content in the range of 0.3-6 wt%, which is similar to that
Sulfur Degassing From Volcanoes
369
inferred for more silicic compositions. It is worth stressing that these calculations depend strongly on fs , which remains difficult to constrain for H 2 0-rich arc basalt, owing to the lack of appropriate thermodynamic models for sulfur solubility in hydrous mafic liquids. This is clearly an area where more experimental work is needed. It is thus difficult to know whether the Stromboli case is widely representative of other mafic arc magmas in respect of their sulfur content and yield. Other basaltic volcanoes should have the nature of their plumbing systems better elaborated in order to answer this important question. Ocean ridge environments Although most magmas by volume are produced and erupted at ocean ridges, very little is known about pre-eruptive gas composition for this tectonic setting. This is due in large part to the difficulties of observing and sampling submarine volcanism. One of the closest analogs is seen in the rifting, diking and volcanism of the Afar region (Ferguson et al. 2010), though it is also a challenging place to conduct fieldwork. Hence, despite collection of some relevant volcanic gas composition data (e.g., Giggenbach and Le Guern 1976; Gerlach 1980), we lack modern petrological data (volatiles in melt inclusions) for corresponding magmas, suitable for constraining system behavior at depth as achieved for subduction zones (e.g., Scaillet and Pichavant 2003). Icelandic volcanism has been better studied, with some detailed information on dissolved volatiles present in magma reservoirs (Metrich et al. 1991; Moune et al. 2009) but here, too, there are very few data on related magmatic gas compositions. Therefore, for this volumetrically important category of magmas we must calculate gas composition at depth using available constraints on dissolved volatiles, which have been well established for a number of dredged oceanic basalts (see Wallace and Edmonds 2011, this volume). One salient feature of mid-ocean ridge magmatism is its very dry character, dissolved H 2 0 lying in the range of 0.1-0.5 wt%, or even less than 0.1 wt% (Saal et al. 2002). Dissolved sulfur contents are also well characterized, falling in the range of 800-1200 ppm for primitive end members (Wallace and Carmichael 1992; Saal et al. 2002). Carbon dioxide concentrations are more controversial: some argue that mid-ocean ridge basalts (MORB) are gas-undersaturated under pre-eruptive conditions (Saal et al. 2002), while others (e.g., Sarda and Graham 1990) argue for C 0 2 contents of magmas well above solubility values at pressures of magma storage in the upper oceanic crust (100-200 MPa). Since the case for undersaturation has been disputed on thermodynamic grounds (Scaillet and Pichavant 2004), we show in Figure 4 the calculated C-O-H-S gas phase composition as a function of/o 2 at 1280 °C and 40 MPa for fixed melt H 2 0 content of 0.08 wt% and sulfur melt content around 800 ppm, which are averages for primitive MORB melts (Saal et al. 2002) (note that the bulk C 0 2 content of the magma need not be known to carry out the calculations since fixing/h2o and/s2 (at a given P and T) automatically fixes/Co2, and hence XCo2, in the gas). These data can be taken to illustrate the possible sulfur contents of the gas phase coexisting with MORB in reservoirs associated with axial ridges. These calculations illustrate a well-known feature, that the species abundances in the gas phase vary a lot with/o2, with C 0 2 being the most abundant species in MORBs (Mathez 1984). Sulfur-bearing species are generally present below 1 mol% at/o 2 below NNO-1, with corresponding sulfur concentration in the gas being below 1 wt% for this f Q l range, or even below 0.1 wt% at around NNO-3. In contrast, at/o 2 greater than NNO-1, S 0 2 abundances increase quite significantly to the point that it becomes the second most abundant gas species (after C0 2 ), with sulfur concentration exceeding 20 wt% at around NNO+1. This illustrates the important point that, besides / s (or melt sulfur content), the master variable required is precise knowledge of redox state. This remains an inssue: despite decades of effort by various groups (e.g., Christie et al. 1986; Carmichael 1991; Ballhaus 1993; Bezos and Humler 2002; Li and Lee 2005; Mallmann and O'Neill 2009) there is still no consensus on whether MORBs are either strongly (i.e.,/o 2 < NNO-2), or moderately (FMQ-NNO) reduced, or could even share the same redox state as mafic arc magmas (Mallmann and O'Neill 2009). If one accepts
370
Oppenheimer, Scaillet, Martin
—•—XS2 —•—XH2S —A—XS02 —©—XCO —XC02 —I—XH20 XH2
ANNO
O.OlJ -3
, -
2
-
,
1
0
,
1
ANNO Figure 4. Plots of (a) the variation of fluid species abundances v e r s u s ( i n log units relative to the nickelnickel oxide buffer), calculated for volatile conditions of H 2 0 = 0.06 wt% and 850 p p m dissolved sulfur, which correspond to primitive Mid Ocean Ridge Basalts (Saal et al. 2002). The calculations were made for a pressure of 40 M P a and a temperature of 1280 °C. (b) Evolution of the sulfur content of the gas phase with/o„, corresponding to the gas composition shown in (a).
that most MORBs have pre-emptive/q, at or below NNO-2, then the sulfur fraction stored in the gas is small, below 1000 ppm, with a negligible contribution to the bulk amount of sulfur degassed. In contrast, if the MORB/o„ is around NNO, sulfur contained in the gas approaches or may even exceed 10 wt%, in which case the gas phase contribution to eruptive loss of sulfur becomes important, or even dominant, relative to that dissolved in the melt phase, although we have few constraints on the amounts of gas present in the reservoir. Gas compositions collected from subaerial volcanoes associated with divergent plates (Ardoukoba, Erta 'Ale, Surtsey; see Giggenbach and Le Guern 1976; Allard et al. 1977;
Sulfur
Degassing
From
Volcanoes
371
Gerlach 1980; Sawyer et al. 2008a) have sulfur contents in the range of 10-30 wt%. If those volcanic centers are representative of their deep-oceanic counterparts, it may indicate that MORBs are more oxidized than generally believed. To conclude, the redox state of magmas at divergent plates still needs to be better evaluated—a conclusion that also applies to many, if not all, other magmas! This issue remains a priority for improving our understanding of sulfurrelated magmatic processes. Hot spots The few hot spots where volcanism is presently active include Hawaii and Réunion. We also include Etna in this discussion although its tectonic setting is especially complex and contested (e.g., Schiano et al. 2001) with chemical characteristics of the magmas pointing to either hot spot or arc settings. Thus, any conclusions drawn from the Etna case should be viewed cautiously. Volcanic gas emissions from both Hawaii and Etna have been studied in considerable detail over the last half century, both using conventional approaches, as summarized below and by Symonds et al. (1994), and with more recently developed groundbased remote sensing tools (see below). Volcanic gases emitted at la Réunion are less well characterized as there is little degassing between eruptions (e.g., Toutain et al. 2002). In all three cases, a wealth of microanalytical work aimed at determining pre-eruptive dissolved volatile contents has been undertaken (e.g., Dixon et al. 1997; Bureau et al. 1998, 1999; Wallace and Anderson 1998; Dixon and Clague 2001; Wallace 2002; Spilliaert et al. 2006). Despite some significant variations between the three volcanoes, it appears that hot spots fall roughly in between oceanic and arc magmas, in terms of their pre-eruptive H 2 0 contents (0.4-3 wt%) and redox state (NNO-NNO+1), although considerable uncertainties remain concerning redox state evaluation or significance (Gerlach 2004a; Roeder et al. 2004). The pre-eruptive melt sulfur contents are somewhat higher than for MORBs at comparable levels of FeO content, ranging between 1000 to 2000 ppm (Bureau et al. 1999; Dixon and Clague 2001), and reaching 3000 ppm in the H 2 0-rich variety of basaltic magma erupted at Etna (Spilliaert et al. 2006). The gas phase composition in the magma reservoir of hot-spot volcanoes can be computed, as illustrated for MORBs, assuming a pressure depth for the shallow reservoir in the range 100-200 MPa and various contents for key volátiles, based on petrological data summarized above. Figure 5 shows the variations of sulfur content of the gas phase as a function of/o 2 , for various H 2 0 contents and/s 2 . For the latter, petrological investigations indicate that/s 2 of hot-spot related basalts is within the range of 0.1-100 kPa (Wallace and Carmichael 1992). As already pointed out for MORBs, these calculations show clearly that, in general, the sulfur content of gas remains below 0.1 wt% at/o 2 below NNO (hence, to a first approximation, the gas contribution to the bulk sulfur budget can be ignored). Above this/o 2 threshold, the sulfur content can increase dramatically, even becoming the dominant constituent of the gas phase. Note that, under fairly reduced conditions (NNO-2), the gas can become quite sulfur-rich if the magma has a dissolved H 2 0 content of 3 wt% or more. However, such elevated H 2 0 levels have not been documented for reduced terrestrial basalts (but see Gaillard and Scaillet 2009 for the case of Mars). Volcanic gases measured at other hot spots are essentially similar to those of Kilauea (Gerlach 1980,1993), which have sulfur contents in the range of 20-30 wt%, regardless of their more or less primitive character (i.e., degassed right after their arrival in the shallow reservoir or subsequently following equilibration with local conditions). Mt. Etna gases analyzed during the volcano's 1970 eruption are the most sulfur-rich volcanic gases so far collected, with a total sulfur content exceeding 50 wt% and a S0 2 /H 2 S molar ratio of around 100 (Huntingdon 1973; Gerlach 1979). The more recent activity has shown a significant decline in sulfur content of emitted gases (Allard et al. 2005), although Etna remains today one of the main sustained volcanic sources of sulfur to the atmosphere (Allard et al. 1991; Allard 1997). These two
372
Oppenheimer,
Scaillet,
Martin
ANNO Figure 5. Plot of variation in S content of gas v e r s u s ( i n log units relative to the nickel-nickel oxide buffer), calculated for 100 MPa total pressure for a range of volatile contents and corresponding fugacities ( H 2 0 and S) corresponding to the conditions inferred for present day hot spot related basalts (see text).
examples seem thus to suggest that hot-spot activity may coincide with elevated rates of sulfur emission. The high sulfur content of gases released also seems to indicate that magma redox state in the hot-spot context is somewhat oxidized relative to that of MORB. This evidence once again highlights the important role of redox conditions in gas phase composition. In terms of the sulfur yield of past eruptions to the atmosphere, little can be said without good constraints on redox. The problem can be even more complex when decompression-related effects on magma/Q, are taken into account. Recent modeling efforts, though rudimentary, indicate that volatile loss during decompression may strongly alter magma redox state (Moretti et al. 2003; Burgisser and Scaillet 2007; Burgisser et al. 2008; Gaillard and Scaillet 2009), adding further "noise" to the direct interpretation of volcanic gas data in terms of magma storage or generation conditions. Modeling the interplay between decompression and redox state of magmas and related gases is clearly another fruitful avenue for future research. Flood basalts and silicic parts of large igneous provinces Interest in the potential global impacts of effusive volcanism has been fueled by the coincidence of several of the mass extinctions that punctuate the fossil record with the flood basalt episodes of large igneous provinces (LIPs; Rampino and Stothers 1988; Wignall 2001; Oppenheimer 2011). Estimated sulfur yields of such provinces are exceptional (e.g., Thordarson et al. 1996), and Ar-Ar chronometry has shown that the immense volumes of lava associated with flood basalts (> 106 km3) are erupted in comparatively short time periods For instance, the 30-Ma-old Ethiopian Plateau basalts erupted in under 1 Ma (Hofmann et al. 1997) while the main eruptive phase of the Deccan traps (65.5 Ma old) was over within 0.5 Ma (Courtillot and Renne 2003). Such rapid eruption rates imply correspondingly high fluxes of sulfur and other volatiles to the atmosphere. Self et al. (2008) analyzed melt inclusions in samples of the Deccan basalt and estimated that for each cubic kilometer of lava erupted, at least 3 Tg of S0 2 were released into the atmosphere (plus a comparable amount of HC1). An individual pulse of 1000 km 3 of magma
Sulfur
Degassing
From
Volcanoes
373
would therefore release 4-5 Gt of S0 2 (at least 200x as much as Pinatubo's eruption in 1991). We have very little idea how long each flow took to erupt but estimates vary from years to a few decades. A 10-year duration would correspond to a mean annual eruption rate of 100 km 3 of lava and 10-20x more sulfur than emitted by Pinatubo in 1991, whose sulfate aerosol veil resulted in a 0.3-0.4 °C global average cooling for 2-3 years (see below; Hansen et al. 1996). Such massive eruption intensities along with the expanse of active lava covering the surface are thought to have generated especially energetic fire fountains and vigorous atmospheric updrafts, enabling a substantial fraction of the released sulfur gases to reach the stratosphere. Here, they would have oxidized to form a sulfate aerosol veil capable of climate forcing. The estimates based on basaltic melt inclusions (Sharma et al. 2004; Self et al. 2008) set a lower limit on sulfur outgassing since, for equilibrium partitioning between melt and gas, any pre-eruptive magmatic gas must hold a finite amount of sulfur. In view of the preceding discussion of the importance of knowing f Q l in order to evaluate the distribution of sulfur between silicate melt and gas phases (oxidized magmas tend to store a significant quantity of their sulfur inventory in the gas phase), an important factor in assessing the environmental impacts of flood basalt events is their redox state. Flood basalts with/o 2 in the range of N N O to NNO+1 could yield sulfur outputs far higher than those estimated from melt inclusions alone. If, in contrast, the basalts have a lower redox state, then the sulfur content of the gas phase would be of negligible significance in calculating total sulfur emissions. Detailed investigations of volatile distribution have been carried out for the volcanoes of Hawaii, the modern archetype of the plume, or hot spot, regime viewed as parental to flood basalts. These have documented great regional variability in magma volatile contents and redox states (Dixon et al. 1988, 1991, 1997; Dixon and Clague 2001). If the Hawaiian plume can be considered as representative of hot spot magmatism through geological time, then the associated sulfur degassing is likely to have been very variable in time and space. A further point to be stressed is that, along with the enormous quantities of basalt, flood provinces can include a silicic component (e.g., the Ethiopia-Yemen (30-Ma-old) and Etendeka-Parana (133-Ma-old) provinces). The behavior of sulfur in such environments suggests that the silicic end-members could contribute significantly to LIP sulfur budgets (Scaillet and Macdonald 2006). A critical factor is the Al/(Na+K) molar ratio of rhyolites. Peralkaline rhyolites have much higher sulfur solubilities than metaluminous magmas and, as a result, could convey comparable amounts of sulfur as the mafic counterpart of LIPs. In contrast, metaluminous rhyolites with much lower sulfur solubilities and different mode of production (i.e., by remelting previously dehydrated crust leading to particularly H 2 0- and S-poor magmas, see Scaillet and Macdonald 2006), could be expected to have diminished impacts on the atmosphere and climate for eruptions of the same magnitude. This may be one reason for the limited correlation apparent between the intensity of environmental changes and the magnitude of coincident flood magmatism (Wignall 2001).
MEASURING VOLCANIC SULFUR EMISSIONS Gas emissions from volcanoes are sourced within magmatic plumbing systems and their associated hydrothermal systems. Their vigor and chemical and isotopic composition can reveal much about subterranean processes, especially concerning the chemistry, differentiation, storage and transport of magmas and the relationships between degassing and eruptive style. The importance of gas emissions was recognized by early pioneers of volcanology, including Frank Perret and Thomas Jaggar, who bubbled fumarole gases into bottles of alkaline solution to trap the acidic species for subsequent analysis (Fig. 6a; Perret 1909, 1950; Jaggar 1940). This sampling method remains relevant today, with incondensable species held in the bottle's head space also studied (Table 1).
374
Oppenheimer,
Scaillet,
Martin
(a)
Figure 6. Sampling volcanic emissions the traditional way: Frank Perret on Vesuvius and Patrick Allard on Erta 'Ale.
Of course, since Perret's time, analytical capabilities have developed tremendously, and this manner of gas collection continues to yield the most comprehensive analyses of the chemical and isotopic composition of volcanic gas emissions. However, such sampling is challenging for sustained geochemical surveillance, especially when fumaroles are inaccessible or levels of volcanic activity preclude safe approach. This section focuses on the principal sampling and sensing methods applied to measurements of sulfur emissions from volcanoes. It introduces direct sampling and sensing apparatus, ground-based or airborne ultraviolet spectroscopy
Sulfur Degassing From Volcanoes
375
B 3 M rl « O
o
S «„
rl
® Z 5
= =" 00
§ m mH E o § w z HgX 2 HgX 2 + S 0 2 H> Hg + X 2 + S0 2
(30) (31)
High-temperature models of vent chemistry (Bagnato et al. 2007) predict that Hg(II) comprises 1% of total Hg, while kinetic modeling (von Glasow 2010) shows that the amount of Hg(II) would increase due to oxidation by halogen radicals (Br, CI). However, at high concentrations of S0 2 , any HgX 2 (i.e., Hg(II)) formed would be rapidly converted back to Hg. While the prospect of local Hg deposition depends on a series of uncertain rate constants, it is clearly that case that S chemistry could play a critical role in determining Hg speciation after emission. Impacts of tropospheric sulfur emissions from volcanoes From local to regional scales, volcanic emissions can result in significant environmental and environmental health consequences, including destruction of agricultural crops, contamination of pasture, and human respiratory morbidity and cardiovascular mortality. Large lava eruptions, such as that of Laki (Iceland) in 1783-1784, which released an estimated 120 Tg of S0 2 , have resulted in major pollution episodes responsible for regional-scale extreme weather, agricultural losses, and elevated human morbidity and mortality (Thordarson et al. 1996; Witham and Oppenheimer 2005; Oppenheimer 2011). Thanks largely to the work following the 1991 eruption of Mt. Pinatubo, there is now a good understanding of the stratospheric impacts of volcanic eruption clouds, at least for emissions on this scale. In contrast, the impacts of tropospheric volcanic plumes are rather poorly known (Table 2). This partly stems from a wide spectrum of emissions and emission styles (e.g., continuous degassing, minor eruptions), rapid transport of some components to the Earth's surface, and the greater concentration and variability of H 2 0 in the troposphere. Reactive S, CI and F compounds may be present in both the gas and particle phase in volcanic plumes, and are typically co-emitted with many other volatile species, including water vapor, and with silicate ash particles. Once in the troposphere, physical and chemical processes convert gaseous S0 2 to sulfate, while gaseous HF and HC1 establish equilibria with aqueous phase H+, F~ and Cl~. Increasing interest in the impacts of tropospheric volcanic emissions on terrestrial and aquatic ecology and on human and animal health is driving more research into the tropospheric chemistry and transport of volcanic plumes. This will be of particular importance in understanding the long-range pollution impacts of volcanic clouds (that might be expected from future eruptions of the scale as that of Laki in 1783-1784). Impacts on agriculture, ecosystems and air quality. Volcanic volatiles emitted into the atmosphere are ultimately wet or dry deposited at the Earth's surface. The chemical and physical form in which they are deposited, and the spatial and temporal distribution of deposition, are strongly controlled by atmospheric chemistry and transport of the volcanic plume. Various components of volcanic emissions (including acid species and heavy metals; e.g., Martin et al. 2010a) can be taken up by plants, and can have both harmful and beneficial effects. The detrimental effects are generally either mediated through acidification of soils (by dry or wet deposition) or by direct fumigation of foliage (e.g., respiration of acid gases through stomata). Individual passively degassing volcanoes can also represent major pollution sources. For example, Mt. Etna continuously emits of order 70 kg s _1 S0 2 , and substantially elevates tropospheric sulfate in southern Italy (Graf et al. 1998). Very fine (sub-micron) and highly acidic (pH about 1) aerosol is also emitted from open-vent volcanoes such as Mt. Etna and
Sulfur
Degassing
From
Volcanoes
399
Masaya (Allen et al. 2002, 2006; Mather et al. 2003b). Adverse environmental and health impacts are observed downwind of many degassing volcanoes, including Masaya (Nicaragua), Kilauea (Hawaivi), Poâs (Costa Rica), Miyakejima (Japan) and Popocatépetl (Mexico) (e.g., Baxter et al. 1982; Mannino et al. 1996; Delmelle et al. 2003; Fujita et al. 2003). Downwind of Masaya volcano, S0 2 levels exceed background levels at the surface across an area of 1250 km 2 , and an estimated 50,000 people are exposed to concentrations of S0 2 exceeding WHO air quality standards (125 ppbv over 24 h; 50 ppb over 1 year; Baxter et al. 1982; Baxter 2000; Delmelle et al. 2001, 2002). Symptoms of respiratory illness are commonly reported anecdotally, though formal epidemiological studies have yet to be undertaken. Measurements in Mexico City have indicated the direct influence of Popocatépetl volcano's emissions on urban air quality (e.g., Raga et al. 1999; de Foy et al. 2009). This hints at the potential impacts of future eruptions on the scale of the Laki 1783-1784 episode, with long-range transport of S0 2 and sulfate aerosol reaching European cities, where air quality standards are already surpassed at certain times of the year. Air quality in Hawai'i is affected by "vog" (volcanic fog) associated with S0 2 and sulfate aerosol from Kilauea's plume (Sutton and Elias 1993; Longo and Yang 2008; Longo et al. 2008,2010; Longo 2009). However, a study of healthy residents on the Big Island of Hawai'i found no appreciable effects of the "vog" on the autonomic nervous system (Chow et al. 2010). A study on Réunion revealed elevated exposure to S0 2 in coastal regions during eruptive episodes but limited clinical evidence for respiratory consequences of the volcanic emissions (Viane et al. 2009; Bhugwant et al. 2009). Chemical burning of leaves and flowers of vegetation downwind of the crater is a common observation during degassing crises of Masaya volcano, with substantial economic impact from the loss of coffee crops (Delmelle et al. 2001, 2003). A further common response to increased gas concentrations is defoliation, as was recently observed close to the April 2007 eruption on Réunion (Martin et al. 2010a). More minor responses to exposure to S0 2 including changes in leaf permeability (Percy and Baker 1988) and stomatal conductance (Smith 1990), which affect the uptake of aerosol and gas into the leaf. S0 2 can cause direct damage to plants once it is taken up by the foliage (Smith 1990). The response, however, can be very variable, depending on dosage, atmospheric conditions, leaf type and pre-existing plant health (e.g., Linzon et al. 1979; Winner and Mooney 1980; Smith 1990). In general, chronic exposures to S0 2 concentrations of a few 10s or 100s ppb are sufficient to affect plant ecosystems, decrease agricultural productivity and cause visible foliar chlorosis and necrosis (Winner and Mooney 1980). The impacts of sulfate deposition on soils have been investigated widely in the context of anthropogenic pollution, indicating that the S 0 4 2 - retention capacity of soils varies widely and can be expected to dictate the ecosystem disturbance of volcanogenic sulfur deposition. Anion sorption in soils is directly related to the soil mineralogy and hence, to the soil parent material. Delmelle et al. (2001) estimated that the amount of S0 2 and HC1 dry-deposited within 44 km of Masaya volcano generates an equivalent H + flux ranging from 500 °C) gas mixtures discharged from fumaroles typically found in the craters of active volcanoes are mainly constituted of H 2 0, C0 2 , S0 2 , and H2S, in decreasing order of importance (e.g., Symonds et al. 1994; Oppenheimer et al. 2011, this volume). In addition to these constituents, fumarolic gases emitted from volcanoes situated along convergent plate boundaries are also generally richer in HC1 with respect to volcanic gases from divergent plate boundaries and hot spots (Symonds et al. 1994; Giggenbach 1997). Gas speciation in fumarolic gases can be predicted with equilibrium equations like: H2S(g) +3/2 0 2 ( g ) = S0 2(g) + H 2 0 (g)
(21)
Sulfur Isotopes in Magmatic-Hydrothermal
Systems,
Melts,
& Magmas
435
whose thermodynamic equilibrium constant can be rearranged as follows: l o g ^ L = log£
log / Hji5
^log/=
l o g ^
(22)
where / and Xt indicate fugacity and mole fraction of the z'-th gas, respectively. The fugacity ratio / s o , //h,s is nearly equal to the mole fraction ratio X s o , /Xh,s as long as the fugacitycoefficient-ratio is close to 1. This approximation is certainly valid at high temperatures and low total pressures, where real gases approach ideal-gas behavior. However, since the critical point of H 2 S (TC = 100 °C, PC = 89.37 bar) is not very different from that of S0 2 (TC = 157.6 °C, PC = 78.84 bar), it is reasonable to extend this approximation to relatively low temperatures and comparatively high total pressures. The temperature dependence of log K of Equation (21) is (thermodynamic data from Stull et al. 1969; temperature in K): °7377 logKt2U=^—
3.986-
(23)
The equilibrium/qj values calculated for high-temperature volcanic gases from different platetectonic settings range between two log units above the NNO buffer and one log unit below the QFM buffer (Symonds et al. 1994). Computed values agree with in situ fiy, measurements carried out at some volcanoes, including Mount St. Helens (Gerlach and Casadevall 1986) as well as Merapi and Momotombo (Bernard 1985) and equilibrium/©, values are similar to those expected for their respective lavas (see Symonds et al. 1994). The Xso,/(XH,s + X s o ,) ratio computed at redox conditions fixed by the NNO and QFM buffers is plotted as a function of temperature and water fugacity (which closely approximates total pressure as H 2 0 is by far the major component of volcanic gases and as long as the fugacity coefficient of water does not depart significantly from unity) in Figure 5. It shows that H 2 S is stabilized by decreasing temperatures and increasing pressures and S0 2 is favored by increasing temperatures and decreasing pressures. In addition to redox conditions, temperature, and pressure, the Xso,/(XH,s + X s o ,) ratio is sensitive to magma degassing, owing to the different solubility of H 2 S and S0 2 in silicate melts.
0.9 0.3 .—. to 0.7 X + , 0-6
S 0.5
X
>yj o-4 X
03 0.2
0.1 500
eoo
700
SOO
300
1000
Temperature ( X )
1100
500
GOO
700
800
&QC
1000
Temperature (°C)
110Q
120CB
Figure 5. Plot of the X s o y(X H , s + XSCh) ratio as a function of temperature and water fugacity (which closely approximates total pressure) at oxygen fugacity fixed by (a) the NNO buffer and (b) the FMQ buffer.
Marini, Moretti,
436
Accornero
Other secondary, non-magmatic processes potentially affecting the concentrations of S species in volcanic gases have been discussed by Giggenbach (1996). They comprise: (i)
deposition and revolatilization of elemental sulfur due to thermal effects;
(ii) disproportionation of S 0 2 according to the equations: 4 S0 2 ( g ) + 4 H20(g>1) - > 3 HS0 4 - ( a q ) + 3 H + (aq) + H 2 S (g) 3 S0 2 ( g ) + 2 H20(g>1) - > 2 HS0 4 " ( a q ) + 2 H
+
(aq)
+ Sa>s)
(24) (25)
followed by dissolution of the produced sulfuric acid into associated brines; (iii) addition of H 2 S, produced through interaction of high-temperature volcanic gases with earlier deposited elemental S, as indicated by the reaction: 4 Sa>s) + 4 H 2 0 ( g ) - > HS0 4 - ( a q ) + H + (aq) + 3H 2 S (g)
(26)
again with absorption of sulfuric acid in brines; (iv) addition of both H 2 S and S 0 2 , generated through interaction of volcanic gases with elemental S, according to the reaction: 3 Sa>s) + 2 H 2 0 ( g )
S0 2 ( g ) + 2H 2 S (g)
(27)
(v) oxidation of H 2 S to S 0 2 driven by atmospheric 0 2 or other oxidants; (vi) reduction of S 0 2 to H 2 S controlled by excess, higher temperature H 2 or other reducing agents; (vii) mixing of relatively oxidized, high-C/S magmatic gases with more reduced, lowC/S gases coming from lateral hydrothermal environments. The latter process was recognized, for instance, to occur at White Island (Giggenbach 1987) and Vulcano Island (Chiodini et al. 1993). All of these secondary, non-magmatic processes may influence not only the contents of S species in volcanic gases but also the 8 34 S values of S 0 2 and H 2 S. Assuming, for the purpose of the following discussion, that the effects of secondary, non-magmatic processes are negligible and that the two main S species present in volcanic gases are in chemical and isotopic equilibrium, the 8 34 S values of S 0 2 and H 2 S are related to the 8 34 S value of total gaseous sulfur by the following mass balance:
s34sIS = 8 34 s S02
x r S O w + 8 34 s H2S x (1 - y S02w )
(28)
where y S02(g) = X S02fe) / (^so 2fe) + XH2sfe))- Provided that S 0 2 and H 2 S are in isotopic equilibrium, the values of 8 3 4 S s 0 2 and 8 34 S H2 s are linked by the equation: 10001na SCVH2S = S 34 S s02 - 834SH2S
(29)
where 10001naSo2-H2s represents the equilibrium fractionation factor between gaseous S 0 2 and gaseous H 2 S, whose temperature dependence, from 350 to 1050 °C, is reported in Table A-l (following Ohmoto and Rye 1979). Consequently, if the chemical composition of the gaseous mixture and at least one isotopic value, either 8 3 4 S s s or 8 34 S S o 2 or 8 34 S H2 s, are known, Equations (28) and (29) constrain the other two isotopic values, allowing quantification of the distribution of S isotopes in the considered volcanic gas. Vent temperature was used in these calculations. Values of 8 3 4 S s s , 834SSQ2, 8 34 S H2S , and outlet temperature for high-temperature volcanic gases are reported in supplemental Table E-3, also including some entries for lower-temperature fumaroles (200-500 °C). These data refer to different plate-tectonics settings. It must be noted that 8 34 S S o 2 values that are very similar to the value listed in supplemental Table E-3 for Kilauea, +0.7%o, were measured in 1979 by Sakai et al. (1982) for two solfataric
Sulfur Isotopes in Magmatic-Hydrothermal
Systems,
Melts,
& Magmas
437
fumaroles of the August 1971 and July 1974 eruptive fissures, +0.9 ± 0.2%o (n = 15) and +0.8 ± 0.2%o (n = 7), respectively, in spite of the much lower temperature of these two vents, 128 ± 2 °C and 145 ± 5 °C, respectively. This similarity is probably due to the virtual absence of H 2 S in these volcanic gases. The 5 3 4 S s o , and 534SH,s values of the volcanic gases listed in supplemental Table E-3 are compared in Figure 6, with the expected cooling paths for three hypothetical volcanic gases with initial 5 34 S ss value of 0%e, which is the accepted value for the pristine mantle sulfur, and different S0 2 /H 2 S ratios. These cooling paths were computed using Equations (28) and (29) and assuming that S0 2 and H 2 S concentrations remain constant during cooling (to simplify calculations). Strictly speaking, constant species ratio is valid only for volcanic gases with H2 contents significantly lower than those of gaseous S species, such that no multi-component reactions take place. In spite of the untested hypothesis of chemical and isotopic equilibrium, most samples plot between the two extreme cooling paths for S0 2 /H 2 S ratios of 0.11 and 9. Only the gases from Satsuma-Iwojima, with temperatures of 702-885 °C; the fluid from Galeras, with temperature of 358 °C; and the sample from Kuju at 500 °C, deviate significantly from the hypothetical, isochemical cooling paths for volcanic gases with initial 5 34 S ss value of 0%o. Among the various processes which may be invoked to explain these deviating values, the most probable are: (i)
reduction of sulfate minerals, to explain high 5 3 4 S s o , and 5 34 S H , s values; adopting anhydrite as the sulfate mineral of interest and assuming that H 2 S and S0 2 are
-10
-
S
O
S 3 4 S s 0 2 {%»VS.
5
V-CDT)
10
15
Figure 6. Plot of 5 3 4 S s o , vs. 5 34 S H ,s values for fumarolic discharges from several volcanoes in different plate-tectonics frameworks (see references in supplemental Table E-3). Black symbols = divergent plate margins; grey symbols = hot spots; open symbols = convergent plate margins. Also shown are the H 2 S-S0 2 equilibrium fractionation lines at selected temperatures, and the expected cooling paths (dashed lines) for three volcanic gases with initial 5 3 4 S s s value of Woo and different S0 2 /H 2 S ratios.
438
Marini,
Moretti,
Accornero
produced in equal molar amounts, the process is described by the following reaction: 2 CaS0 4(s) + 5 H2(g) H> S0 2(g) + H2S(g) + 2 H20(g>1) + 2 Ca[OH]2(s)
(30)
where Ca[OH]2(s) represents a Ca-bearing mineral, most likely a Ca-Al-silicate such as wairakite, clinozoisite, prehnite, etc. This reaction may occur if large amounts of H 2 are present in the gas mixture or if another reducing agent is available in the considered system. Reduction of dissolved sulfate present in external waters is possible and formally equivalent to reduction of sulfate minerals, however the concentration of S042~(aq) in high-temperature aqueous solutions is generally low, owing to the strong decrease of the solubility of sulfate minerals with increasing temperature. Another potential process is: (ii) decomposition ofpyrite, to explain low 834SSo2 and 834SH2s values, as indicated by the reaction: 3 FeS2(s) + 5 H 2 O fcl) -> S0 2(g) + 5 H2S(g) + 3 FeO(s)
(31)
where FeO refers to either iron(II) oxide or an unspecified Fe(II)-bearing solid phase, e.g., an Fe-Al-silicate; as the reaction involving CaS0 4 (Eqn. 30) is a disproportionation process, it does not require the involvement of either oxidizing or reducing agents. To complement the plot of 8 34 S s02 vs. 834SH2S values, it is convenient to recall the statistical parameters of the 8 34 S ss value, including both measured data and data computed by using Equation (28), but excluding the evidently anomalous samples from Satsuma-Iwojima, Galeras, and Kuju (see above). The remaining 25 samples are situated in the interval from -3.1 to +5.6%o, with a median of +2.30%o, an average of +2.05%o, and a standard deviation of 2.45%o. These values are somewhat higher than that of pristine mantle sulfur, 0%o, evidently due to the occurrence of interfering processes. A well-documented case history is represented by the crater fumaroles of Vulcano Island, Aeolian Archipelago (Italy). In particular, sulfur isotopes were measured by Cortecci et al. (1996) in 166 fumarolic gas samples collected in the period October 1979 thru April 1995. Among these data, we selected 42 analyses which reported the 8 34 S ss value, chemical composition, and temperature (see supplemental Table E-4). As before, 834SSo2 and 834SH2s values were computed by means of Equations (28) and (29) and compared through the same kind of plot of Figure 6 (Fig. 7) with the expected cooling paths for three hypothetical volcanic gases with initial 8 34 S ss value of 0%o, the value of pristine mantle sulfur, and different S0 2 /H 2 S ratios. Before inspecting Figure 7, it is worth noting that the chronogram of the 8 34 S ss value for fumarole F5 (not reported), for which data are available since September 1973, shows constant values close to +3.0 ± 0.3%o until late 1984, followed by a drop to +0.2%o in May 1985 and, then, by a less pronounced decline to 8-values as low as -2.0%o in early 1995, with fluctuations between -2.7 and +1.4%o. The relatively high 834S values of total fumarolic S detected in the initial period are possibly due to remobilization of previously deposited elemental sulfur, as observed by Giggenbach (1987) at White Island. Apart from these effects, the 8 3 4 S s s values of crater fumarolic discharges, are chiefly controlled by mixing between a magmatic component richer in 34S and a hydrothermal component richer in 32S, as proposed by Cortecci et al. (1996), in line with the dry model of Cioni and D'Amore (1984), later refined by Chiodini et al. (1991, 1993, 1995). This mixing process also governs the 8D and 8 l s O values of H 2 0 and the concentrations of non-reactive and major components (e.g., H 2 0, C0 2 , N2, He). Also shown in Figure 7 are the 834S§o2 and 834Sh2s values expected for reduction of anhydrite driven by H 2 to generate S0 2 and H2S in equal molar amounts (Eqn. 30), hydrolysis of sulfur (Eqn. 27), and decomposition of pyrite (Eqn. 31). Excluding one sample of fumarole F5 and one sample from vent FA, which plot in the field of S hydrolysis, all the other gases
Sulfur Isotopes in Magmatic-Hydrothermal
Systems, Melts, & Magmas
439
Fumarole F5 Fumarole F5AT Fumaroles FA and FF Fumarole F11 Fumarole F0
A
o • o V
hQ a >
Anhydrite
reductioty
u> >
CO -50 SulfurXydrolysis /
Pyrite
decomposition i i i r i i i Ti i i i i il i i i i i i | i i t i -5
0
5
10
8 34 S SO; (%»vs. V-CDT)
15
Figure 7. Plot of 5 3 4 S s o , vs. 5 3 4 S H , s values for the crater fumaroles of Vulcano Island, Italy (data from Cortecci et al. 1996). Also shown are the equilibrium fractionation lines at selected temperatures (solid lines), the expected cooling paths (dashed lines) for three volcanic gases with initial 5 3 4 S s s value of Woo and different S0 2 /H 2 S ratios, as well as the 5 3 4 S s o , and 5 34 S H ,s values expected for anhydrite reduction, sulfur hydrolysis and pyrite decomposition.
discharged by the crater fumaroles of Vulcano Island are situated within the cooling lines for mantle S, indicating both the presence of a magmatic component and the magmatic derivation of the S species present in the hydrothermal component, whereas the contributions of S from decomposition of pyrite, reduction of anhydrite, and remobilization of elemental S appear to be minor or totally negligible. The magmatic affinity of hydrothermal S-bearing gases is not surprising, as they are mainly produced through input of magmatic gases into an hydrothermal aquifer, a process determining preferential scrubbing of S0 2 (Symonds et al. 2001; Marini and Gambardella 2005). However, hydrothermal H 2 S and S0 2 may be generated through steam-driven hydrolysis reactions taking place in the dry, hot zones surrounding the central magmatic-gas column (Chiodini et al. 1993). Sulfur isotope compositions of fumarolic gases discharged at White Island, New Zealand, were first investigated by Rafter et al. (1958). They found that the isotopic composition of 5 3 4 S s s was close to +3%e and the elemental sulfur deposited around the fumarolic vents was enriched in 32S. Subsequently, from 1971 to 1976, an extensive sulfur isotope study was made by Giggenbach and Robinson, who collected samples of S0 2 , H 2 S, elemental S, and S0 4 2 ~ (aq) (Robinson 1987). During this interval of time White Island experienced two heating cycles, with maximum outlet temperatures of 800 °C (1971-1972 and 1975), separated by a cooler period, with maximum vent temperatures lower than 300 °C. The 5 3 4 S s s varied from +2 to +9%e, with low values during the two hot periods and high values during the cooler interval. According
440
Marini, Moretti,
Accornero
to Robinson (1987), these high 8 3 4 S s s values are due to the separation of isotopically light elemental sulfur upstream of the sampling point during the cooler periods. In particular, S0 2 H 2 S fractionation indicates apparent equilibrium temperatures from 270 °C to 960 °C, around an average value of 590 °C, although kinetic isotope effects during separation of elemental S shift the 8 34 S values of remaining S-bearing gases towards greater values. In the peripheral fumaroles, in contrast, the 8 34 S values of gases decrease due to the formation of sulfate. An interesting set of volcanic gas samples discharged from low-temperature fumaroles situated in 12 active volcanoes of the Cascade Range and Aleutian Arc (including Mount Shasta, Mount Hood, Mount St. Helens, Mount Rainier, Mount Baker, Augustine Volcano, Mount Griggs, Trident, Mount Mageik, Aniakchak Crater, Akutan, and Makushin) was obtained between 1992 and 1998 by Symonds et al. (2003). Maximum outlet temperatures are 173 °C at Mount Mageik and 108-134 °C at Mount Baker, whereas all other fumaroles have temperatures close to or slightly lower than 100 °C. The 8 34 S of total S for the fumarolic gas samples collected in 1996 was +4.7 to +5.3%o at Mount Hood, +3.8%o at Mount Shasta, +1.0 to +l.l%o at Makushin, -O.lto -4.7% c at Akutan, and - 7 . 3 to -9.8%o at Mount Baker. As recognized by Symonds et al. (2003), these 8 34 S values are within the reported interval of volcanic gases and consistent with chemical and isotopic modifications caused by scrubbing (Symonds et al. 2001; Marini and Gambardella 2005). In fact, the overall interval in 834S values, from +5.3%o to -9.8%o, may be related to differences in the S0 2 /H 2 S ratio in the volcanic gases and variable effects of scrubbing processes, especially hydrolysis of S 0 2 to form S042~(aq) or HS04~(aq) ions (Eqns. 24 and 25). The H 2 S/ S 0 2 pair very often acts as homogeneous redox buffer for re-equilibration reactions occurring during the ascent (cooling) of volcanic gases from the magma to the vent (e.g., Giggenbach 1987; Chiodini et al. 1993; Symonds et al. 1994). The H 2 S/S0 2 magmatic redox buffer then becomes inactive upon removal of S 0 2 by external groundwaters, if present. Mather et al. (2006) investigated the isotopic compositions of O and S of the aerosol and magma at Masaya volcano, Nicaragua. They found that the 8 34 S value of aerosol sulfate has an average of +7.7 ± 0.8%o, which compares with that of the magma, +6.6 ± 0.2%c. Isotopic data suggest that sulfate is produced by either high-temperature equilibration of the magmatic gases with small quantities of atmospheric oxygen or by direct emission of sulfate from the magma. Hydrothermal aqueous solutions. Hydrothermal aqueous solutions are generally characterized by the coexistence of: (i) dissolved sulfide, with prevalence of either H2S(aq) or HS~(aq) or S2~(aq), depending on pH; and (ii) dissolved sulfate, with dominance of either HS04~(aq) or S0 4 2_ (aq) , again as a function of pH. In addition, both sulfate and sulfide form several aqueous complexes (e.g., CaS0 4 ° (!iq ), NaS04~(!iq), FeHS+(!iq); Seward and Barnes 1997 and references therein), whose stability constants are partially known as a function of the temperature, pressure conditions prevailing in hydrothermal systems. Based on this picture, it is obvious that the rate of exchange of S isotopes between sulfate and sulfide in hydrothermal liquids is essential for the interpretation of the isotope ratios of sulfur in hydrothermal environments. This topic was the subject of several studies (e.g., Igumnov 1976; Robinson 1978; Sakai and Dickson 1978; Kamada et al. 1980; Ohmoto and Lasaga 1982; Sakai 1983), suggesting that the rate of sulfate/sulfide isotope exchange is a function of temperature, pH, and total dissolved sulfur. Temperature seems to be the main controlling parameter, considering that Sakai (1983) evaluated the following half-times for the exchange reaction between S0 4 2 ~ (aq) and H 2 S (aq) : (a) 200 years in well OR-3 of the Hachimantai geothermal reservoir, Japan, at a Si0 2 -temperature (i.e., the equilibrium temperature calculated based on the solubility of a silica mineral like quartz or chalcedony) of 188 °C; (b) 50 years in well KG-8 of the Krafia geothermal reservoir, Iceland, at a Si0 2 -temperature of 210 °C; (c) 22 years in well Wairakei-28, New Zealand, at a Si0 2 -temperature of 250 °C; (d) 0.4 years in well KJ-15, again at Krafia, at a Si0 2 -temperature of 300 °C.
Sulfur Isotopes in Magmatic-Hydrothermal
Systems,
Melts,
& Magmas
441
In addition, Sakai (1983) showed that sulfate and sulfide are not in isotopic equilibrium at these sites, through comparison of fractionation factors and experimental data. This disequilibrium may be attributed to (Sakai 1983): (i) although sulfate and sulfide might have attained isotope equilibrium in the roots of these geothermal systems, at temperatures close to 350 °C, at least at Hachimantai and Wairakei, sulfur isotopes of sulfate and sulfide did not re-equilibrate in the shallower reservoirs tapped by the wells, due to comparatively short residence times, (ii) the presence of one reservoir only, in which geothermal liquids remained for insufficient times to reach isotopic equilibrium, and (iii) the occurrence of sulfide oxidation, and consequent lowering of the 534S of sulfate, due to exploitation or other reasons. Data for these and other systems including geothermal wells are reported in supplemental Table E-5 and displayed in Figure 8. Although most 534SSo42- values are in the interval from +13 to +23%e (Fig. 8), there are also a few isotopically lighter sulfate samples, including the extremely low values of the Icelandic geothermal wells, which span the range from -2.0 to +3.8%o. In contrast, the 534SH,s values are situated in a much narrower interval, usually from - 4 to +2%c, apart from the two exceptions of Zunil and Wairakei. 534SH,s values are generally close to 0%o and are consistent with a magmatic origin. Based on the data in supplemental Table E-5, the 534S values of dissolved sulfate expected for isotope equilibrium in the hydrothermal reservoir fluid, 534Ssc,42-, can be computed by means of the following relationship: S ' X o r =1000 In
X t S
(32)
34
where 5 SH,s is the measured isotope value of ITS and 10001naSo,-H,s represents the equilibrium fractionation factor between dissolved sulfate and ITS. The temperature dependence of the fractionation factor, in the temperature range of 200-400 °C, is conveniently described by the polynomial equation suggested by Ohmoto and Lasaga (1982; see Table A-l).
•
•
Krafla Namafjalt Wa iraké! Zunil Los Humaros Hatctiobaru HacJimantai Takigamt
O o V o O
Mt. Apo Palinpinon Mahanagdong Bacon-Ma nrto Los Adufres
•
+ •
A A
•
5
10
15
ñ34SSQ4z- {%» vs. V-CDT) Figure 8. Plot of 5 34 S S o 4 2- vs. 5 34 S H ,s values for deep geothermal wells from different fields (data from Sakai et al. 1980; Sakai 1983; Giggenbach et al. 1992; Bayon and Ferrer 2005; Matsuda et al. 2005; González-Partida et al. 2005). Also shown are the equilibrium fractionation lines at selected temperatures.
442
Marini, Moretti,
Accornero
Apart f r o m a few wells (H-28 at Hatchobaru, T M 2 and T O l at Mt. Apo, NJ-6D at Palinpinon, M 1 4 at Mahanagdong, and PAL-10D at Bacon-Manito), whose 8 3 4 S s 0 4 2- e q values differ from the measured counterparts by less than one per-mil unit, most measured 8 34 S sc , 4 2- values are significantly lower than expected for isotope equilibrium under reservoir conditions, suggesting possible isotope equilibration at higher temperatures, as indicated by Figure 8. Alternatively, the reader may see that apparent equilibration temperatures displayed by Figure 8 are higher than temperatures listed in supplemental Table E-5 in most cases. This is consistent with the conclusions of previous research (e.g., Sakai et al. 1980; Sakai 1983; Giggenbach et al. 1992; Bayon and Ferrer 2005; Matsuda et al. 2005), although other explanations are possible (see above). Interestingly, dissolved sulfate and sulfide species are generally close to isotope equilibrium in acidic liquids, suggesting that low-pH values and high temperatures might increase the exchange rates of sulfur isotopes, favoring the attainment of isotopic equilibrium. Assuming that the dissolved sulfate of deep geothermal fluids derives f r o m disproportionation of magmatic S 0 2 (Eqn. 24), it is reasonable to hypothesize that: (i) isotopic re-equilibration occurs as long as the aqueous solution is acidic, whereas (ii) it dramatically decreases u p o n neutralization through water-rock interaction. During this process, a geothermal liquid may remain acidic for one or more unspecified reasons (e.g., low neutralizing capacity of the rocks); if so, sulfur isotopes may re-equilibrate at the comparatively low temperatures of the geothermal reservoir. As described above, the very small fractionation between dissolved sulfate and sulfide in the Icelandic fields of N a m a f j a l l and Krafla was attributed (Sakai et al. 1980; Sakai 1983) to the very short residence time of fluids in these geothermal reservoirs (i.e., less than 1 year to a few years), which prevented the attainment of isotopic equilibrium. These extremely short residence times may be due to the high-convective flow rate in these systems, which lie along one of the most active sites of shallow m a g m a movement in Iceland. Light sulfates with 8 34 S S o 4 2- values relatively close to 0%o, typically found in near-surface geothermal environments, might derive their isotopic signature by H 2 S oxidation driven by atmospheric oxygen. Descent of these shallow aqueous solutions, whose dissolved sulfate is depleted in 34 S, and mixing with deep geothermal liquids, whose dissolved sulfate is enriched in 34 S, may generate sulfate with intermediate 8 3 4 S values, that would imply unrealistically high temperatures of apparent isotopic equilibrium. This process takes place, for instance, at Mt. Apo, Philippines (Bayon and Ferrer 2005). A similar mechanism was invoked by Martinez Serrano et al. (1996) to explain both the large variability of the 8 34 S sc , 4 2- values in the Los Humeros geothermal reservoir, f r o m +1.7 to +13.5%o, and the similarity of 8 3 4 S values of dissolved sulfate in wells H9, H12, H13, H24, and H28 and 8 3 4 S values of H 2 S and pyrite. Sulfate-rich waters are considered to be produced by dissolution of a H 2 S-rich vapor phase at shallow levels into meteoric water or geothermal water, followed by rapid oxidation of H 2 S to sulfate, which results in enrichment in 32 S. Hydrothermal gases. Hydrothermal gases are characterized by the virtual absence of S 0 2 and the presence of H 2 S as unique S-bearing gaseous species (Giggenbach 1980). Therefore, the isotopic composition of H 2 S can be very important for establishing the origin of S. For instance, average values and standard deviations of sulfur isotope analyses of H 2 S in different geothermal areas of N e w Zealand are shown in supplemental Table E - 6 (from Robinson 1987). The global average and standard deviation of the entire dataset are +4.7 and ±1.0%o, respectively. As a starting point for the interpretation of these data, Giggenbach (1977) noted that hydrothermal discharges in the Taupo Volcanic Zone have C/S ratio of 35, a value much higher than that of local magmatic discharges, which exhibit a C/S ratio close to 2. This suggests that only a small portion of the sulfur entering the hydrothermal systems f r o m below actually reached the surface, probably because of absorption of sulfur gases in the aqueous phase and consequent precipitation of large amounts of pyrite and other sulfide minerals at depth (e.g.,
Sulfur Isotopes in Magmatic-Hydrothermal
Systems,
Melts,
& Magmas
443
Tui Mine, Te Aroha, where 834Spyrite lies between +3 and +5%c; Robinson 1987). These values are comparable with those of the H 2 S released from the geothermal areas, owing to the small fractionation factors between sulfide minerals and H 2 S gas. Similarly, the 834S value of H 2 S is representative of the isotopic composition of the sulfur source, as long as sulfur is lost from the fluid through separation of sulfide minerals and/or as gaseous H 2 S (e.g., boiling), although the total quantity of sulfur present in the surface discharges was evaluated to be less than 5% of that initially present in the parent fluid (Robinson 1987). In geothermal systems, part of the sulfur is present as dissolved sulfate, but the quantity of sulfate produced through oxidation of H 2 S is generally small and has limited influence on the 8 S H S value. For instance, the geothermal reservoir liquids of Broadlands and Kawerau are characterized by high H2S(aq/S042~(aq) ratios of 21 and 41 respectively, and high 834SH2s values of +5.5 and +6.4%o, respectively. In contrast, at Wairakei and Ngawha, where the H 2 S (aq / S042~(aq) ratios are low, 0.6 and 4 respectively, the 834SH2s values are also low, +4.3 and +3.3%o, respectively. This is probably due to exchange of S isotopes between H2S(aq) and S042~(aq), with 34 S preferentially incorporated in the latter. Summing up, it appears that sulfur in New Zealand geothermal systems derives from magmatic H 2 S, with a 834S value of +3 to +5%o, and that most of it is separated as sulfide minerals at depth. The remaining H 2 S is either partly oxidized to sulfate or escapes to the surface. 3 4
2
Another interesting hydrothermal-magmatic system is that of Nisyros Island, Greece, whose fumarolic discharges have been the subject of several studies (Ambrosio et al. 2010 and references therein). These investigations produced a significant series of data, including the 834S value of H2S in fumarolic gases (Marini and Fiebig 2005). The average 834SH2S of all available data is +3.7%c, with a standard deviation of 0.6%o (N = 73). Some possibly significant changes of the 834S value of H 2 S with time are evident, but their oscillating nature casts doubt on their meaning. In contrast, vent-to-vent changes are small, suggesting that the effects of shallow and relatively shallow processes (e.g., steam separation and condensation) on the 834S value of H 2 S are nil to negligible. Interestingly, the 834S value of H2S at Nisyros is comparable with the isotopic composition of H 2 S from the geothermal systems of New Zealand. Utilizing the 834S values of H2S at Nisyros Island, Marini et al. (2002) carried out reaction path modeling to simulate the irreversible water-rock mass exchanges involving the parent geothermal liquid, as well as the progressive changes in the concentrations and 834S values of S-bearing solutes and minerals. The ultimate aim was to constrain the isotopic composition of sulfur in the magmatic gases entering the shallow hydrothermal system from below. Based on the conceptual geochemical model of the hydrothermal system of Nisyros Island (Ambrosio et al. 2010 and references therein), fumarolic discharges are produced through single-step steam separation from a parent geothermal liquid, deriving from mixing of local seawater (~30%) with arc-type magmatic water (~70%), as indicated by H and O isotopes of water (Brombach et al. 2003). Therefore, geochemical modeling of Marini et al. (2002) involved three steps: (1) reaction of seawater with andesitic rocks; (2) neutralization of magmatic water through interaction with andesitic volcanics; and (3) mixing of modified seawater and neutralized magmatic water in the proportions dictated by stable water isotopes. Simulations were carried out under closedsystem conditions, through step-by-step dissolution of andesite in 1 kg of water assuming bulk dissolution of andesite. Temperature was fixed at 350 °C, in line with measurements in deep geothermal wells and geothermometric indications, and P c o 2 was assumed to remain constant at 126 bar, the full-equilibrium value dictated by coexistence of Ca-Al-silicates and calcite (Giggenbach 1984). Both the andesite-seawater interaction and mixing of modified seawater and neutralized magmatic water were modeled under a constant /o 2 fixed by the F e 0 - F e 0 1 5 hydrothermal buffer (Giggenbach 1987). In contrast, the neutralization of magmatic water was simulated under a constant/o 2 corresponding to the H 2 S-S0 2 magmatic gas buffer (Giggenbach 1987). This reaction path modeling exercise resulted to be very useful to reproduce, to a first
444
Marini, Moretti,
Accornero
approximation, the processes occurring in the root of the hydrothermal system of Nisyros Island and substantiate the interpretation of the sulfur isotopic composition of H 2 S. It must be noted that this quantitative approach represents a sort of evolution of the qualitative model proposed by Giggenbach (1977) and Robinson (1987) for the geothermal systems of New Zealand. In contrast to the isotopic composition of H 2 S from previous sites, hydrogen sulfide from the ridge-centered Icelandic magmatic-hydrothermal systems has much lower 8 34 S values. In particular: (i) the geothermal wells of Krafla have a mean of +0.5 + 0.3%o, N = 5 (Armannsson et al. 1982); this geothermal system is directly fed by magmatic gases, as highlighted by the frequent occurrence of fissure eruptions in this area; (ii) the geothermal wells and fumaroles of Nesjavellir as well as the fumaroles of Hengill and Hveragerdi have an average of - 0 . 2 + 0.8%o, N = 16 (Marty et al. 1991). As pointed out by Armannsson et al. (1982) and Marty et al. (1991), these sulfur isotope ratios span a restricted range close to 0%o, typical of mantle sulfur (e.g., Grinenko et al. 1975; Sakai et al. 1984). Only the data from the Hveragerdi fumaroles (+1.7 and +1.0%o) are slightly higher, possibly due to a slight contribution of marine water (Marty et al. 1991). Also, the fumarolic H 2 S of the Solfatara, Campi Flegrei, Italy, is very similar to the meteoritic standard and to the values typical of mantle-derived sulfur, with a mean of - 0 . 3 + 0.3%o, N = 17 (Allard et al. 1991). Consequently, the fumarolic H 2 S discharged at Solfatara is considered to be derived from an igneous source, including either deep magma degassing or leaching of sulfur-bearing minerals contained in the pyroclastic rocks filling the Campi Flegrei caldera (Allard et al. 1991). Data reported by Allard et al. (1991) were obtained on gas samples collected between 1983 and 1988, i.e., during and soon after the 1982-1984 seismo-volcanic crisis (Barberi et al. 1984). In contrast, 19 samples of gases, collected from the Solfatara fumaroles in the period 19982001, have an average 834SH2S value of +1.7 + 0.3%o (Gambardella, pers. comm.), suggesting the possible occurrence of progressive degassing from a unique magma batch, without the supply of new magma. Alternatively, the higher 834SH2s values in the period 1998-2001 could be attributed to the separation of isotopically light elemental sulfur upstream of the sampling point. This is similar to that observed at White Island (Robinson 1987), although the outlet temperature of the Bocca Grande fumarole remained fixed at 155 + 5 °C from 1983 to 1987 (Allard et al. 1991) and at 160 + 4 °C from 1999 to 2006 (Caliro et al. 2007). Changes in the 834SH2S values of fumarolic gases with time, even higher than those of the Solfatara, were recorded at the Baia di Levante beach, Vulcano Island, Italy from 1975 to 1995 (Fig. 9; Cortecci et al. 1996). At this site, geothermal steam at temperatures of 84-105 °C is discharged along the beach through water-soaked sand and shallow seawater. All H 2 S samples collected before 1984 have 8 34 S values from - 5 . 4 to -1.5%o, whereas most samples obtained after 1984 have 8 34 S values from +1 to +5%c. In 1984, a concurrent but reversed change was recorded in the 8 34 S values of total sulfur in the high-temperature volcanic fumaroles of the La Fossa crater (see above). According to Cortecci et al. (1996), H 2 S is supplied to the geothermal system of the Baia di Levante beach by both: (i) crater-type fluids, modified by interaction with shallow groundwater, and (ii) reduction of marine sulfate. The contribution of the second source seems to have increased after 1984. Hydrothermal sulfide and sulfate minerals of deep geothermal boreholes. The sulfur isotopic composition of hydrothermal sulfides (pyrite and pyrrhotite) and sulfates (anhydrite and alunite) from deep wells of geothermal systems of New Zealand were analyzed by Steiner and Rafter (1966). They found that: (i) the average 8 34 S values of pyrite are + 6%c at Wairakei, +4.7%o at Waiotapu, and +4.5%o at Kawerau, with an overall mean value of +5.4%o; and (ii) the average 8 34 S values of pyrrhotite are +4.0%o at Wairakei and +4.1%o at Waiotapu. In general, these sulfide minerals are not in mutual isotopic equilibrium at the present-day in-hole temperatures. The sulfur isotope ratios of these sulfide minerals, as well as those of supergene alunite samples (with a mean value of +5.6%o) are close to that of H 2 S (see previous section).
Sulfur Isotopes in Magmatic-Hydrothermal
Systems,
_l 1 1 1 1 1 1 1 1 1 L J
8i >
>
25
Melts,
& Magmas
445
1 1 1 1 1 1 1 1 1..
•
0•
c/3 T m to
—i—\—p—!—|—i—i—[—p—i—]—i—j—|—i—i—|—i—i—|—r Jan-74
Jan-77
Jan-80
Jan-83
Jan-86
Time
Jan-89
Jan-92
Jan-95
Figure 9. Chronogram of 5 3 4 S H , s values for the fumaroles of the Baia di Levante Beach, Vulcano Island (data from Cortecci et al. 1996).
A detailed study of the sulfur isotopic composition of mineral sulfides from drill cores in the Broadlands geothermal field was performed by Browne et al. (1975). In borehole Brl6, average 534S values are: +5.5%e for pyrite, +4.6%e for sphalerite, and +2.7%e for galena, whereas the corresponding means for well Br7 are +3.9%e, +3.7%e, and +1.4%e, respectively. Although textural evidence suggests occurrence of chemical equilibrium among these sulfide minerals and the geothermal fluids at temperatures of 160-285 °C, isotope equilibrium temperatures calculated for the sulfide mineral pairs are generally higher than measured inhole temperatures, probably due to incomplete achievement of isotope equilibrium. Only two sphalerite-galena pairs from high-permeability zones appear to be in overall equilibrium with isotope temperatures (~280 °C) close to measured temperatures (267 and 274 °C). It appears that the exchange of sulfur isotopes with the aqueous solution is faster for galena than for pyrite, pyrrhotite, and sphalerite (Robinson 1987). The incorporation of seawater-derived sulfate in geothermal systems has been invoked in numerous studies. Sakai et al. (1980) measured the sulfur isotope ratios in 33 pyrite samples and 2 gypsum samples, which were taken at different depths from different Icelandic geothermal fields (see supplemental Table E-7). They found a remarkable difference between: (i) the geothermal systems fed by meteoric water (e.g., Namafjall, Rrafla, Reykholt, Reykir and Teira), in which the 534S values of hydrothermal pyrite are close to the magmatic value, suggesting that basaltic rocks (or perhaps magmatic gases, in our opinion) represent the main source of sulfur, and (ii) the geothermal fields fed by both meteoric water and marine water (e.g., Reykjanes and Svartsengi), where the 534S values of hydrothermal pyrite is enriched in 34 S by up to 8%e, with respect to the magmatic value, suggesting that both basaltic rocks (or perhaps magmatic gases, in our opinion) and seawater act as sulfur sources. However, things are not so simple, in that (i) at Reykjanes, the contribution of S from seawater sulfate becomes less important with decreasing depth; (ii) in contrast, at Reykir and other low-temperature systems, mixing of light sulfur produced by near-surface processes and basaltic (or magmatic) sulfur from depth seems to occur. Tiou et al. (1985) investigated the sulfur isotope composition of hydrothermal pyrites from the Onikobe geothermal system (Japan). They found that 534S values range from +2.05
446
Marini, Moretti,
Accornero
to +3.59%o at shallow depths (179-333 m), whereas a somewhat higher value (+5.43%o) was measured at a depth of 704 m (supplemental Table E-7). These 8 34 S values are very similar to those of pyrites hosted in shallow (< 800 m) altered basaltic rocks in the Reykjanes geothermal field, Iceland, where they are attributed to partial contribution of seawater (see above). Since infiltration of present-day seawater is considered unlikely at Onikobe, Liou et al. (1985) suggested the contribution of fossil marine sulfur from Miocene sediments. As part of an isotopic-mineralogical study of hydrothermal alteration at Arima Spa, Japan, Masuda et al. (1986) observed that sulfur isotopic compositions of pyrite (supplemental Table E-7) and sphalerite are within a restricted interval, from +2.2 to +3.9%o, with the 8 34 S values of pyrite somewhat higher than those of sphalerite. Possible seawater infiltration and introduction of marine sulfate into the Arima hydrothermal system, when Arima Spa was close to sea level, was invoked by Masuda and coworkers to interpret these data. Boiling can have significant effects on the isotopic composition of precipitated pyrite in geothermal systems. The isotopic compositions of sulfur in over 105 samples of pyrite from five deep wells of the Los Humeros geothermal field, Mexico, was determined by Martinez Serrano et al. (1996) along with the 8 34 S values of dissolved sulfide and sulfate. Pyrite samples were separated from cuttings collected at variable depths. The 8 34 S values of pyrite and H 2 S are very similar and vary between a minimum of - 4 . 5 and a maximum of +4.5%o, around an average of +0.02%o, suggesting the provenance of sulfur involves a magmatic (mantle) source. However, the 8 34 S values of pyrite from four wells, with an average of -0.4%o, are slightly more negative than those from the fifth borehole, with a mean of +2%c. The largest changes in the isotopic characteristics of pyrite were observed at depths where boiling and mixing phenomena occur. Both processes might impose sulfur isotope fractionation, finally affecting the 8 34 S values of deposited pyrite (Martinez Serrano et al. 1996). González-Partida et al. (2005) report the isotopic compositions of hydrothermal pyrite in the Los Azufres geothermal field, Mexico. Two different data groups can be identified: (i) one comprises the pyrite samples coming from deep zones, where boiling does not occur, with 8 34 S values of - 1 . 6 to -3.0%o; and (ii) the other includes pyrites sampled from steam-dominated, shallow levels, with 8 34 S values of - 4 to -4.8%o. The average 8 34 S value of pyrite, -2.5%o, is similar to that of H 2 S, -2.0%c. The authors suggest that: (i) the initial isotopic value for sulfur in the geothermal reservoir, -2.3%o, implies a magmatic (mantle) source; and (ii) the values strongly depleted in 34S observed in pyrites from shallow levels are produced by fractionation during boiling of hydrothermal fluids. In their comprehensive study of the four Philippines geothermal fields of Palinpinon, Mahanagdong, Mt. Apo, and Bacon-Manito, Bayon and Ferrer (2005) present sulfur isotope ratios for dissolved sulfate and H 2 S (see above), and for anhydrite and pyrite collected at variable depths in the geothermal boreholes (supplemental Table E-7). At Palinpinon, Mahanagdong, and Bacon-Manito, sulfur isotope ratios of anhydrite are similar to those of dissolved sulfate, and the 8 34 S values of pyrite are comparable with those of H 2 S. These similarities suggest that dissolved sulfate and H 2 S acted as sulfur sources for secondary anhydrite and pyrite, respectively. In addition, the isotopic composition of both sulfides and sulfates are consistent with the supply of sulfur from magma degassing. In contrast, at Mt. Apo, sulfur isotope ratios of pyrite vary from 0 to +3%c and are significantly higher than the average 8 34 S value of H 2 S of -3%c. According to Bayon and Ferrer (2005), secondary pyrite reflects the 8 34 S ratio of the original, unboiled hydrothermal fluid, whereas continuous boiling has caused the progressive depletion in 34S in H 2 S remaining in the separated liquid. If so, the 8 34 S values of pyrite could suggest that both magmatic gases and seawater act as sulfur sources, similar to what was observed at Reykjanes and Svartsengi (see above). Although data are available only for the four Philippines geothermal fields and two samples from Reykjanes (representative of gypsum and an unspecified sulfate mineral), it is interesting
Sulfur Isotopes in Magmatic-Hydrothermal
Systems,
Melts,
& Magmas
447
to plot these data (Fig. 10). This figure shows that: (i) the hydrothermal pyrites and anhydrites from the geothermal fields of Palinpinon, Mahanagdong, and Bacon-Manito are consistent with the deposition from parent fluids characterized by a 5 34 S ss close to 0%o and low S042~/H2S ratio at temperatures of 200-400 °C. (ii) In contrast, to explain the isotopic data of the pyrites and anhydrites from the other Philippinian geothermal field of Mt. Apo, it is necessary to invoke parent liquids with 5 34 S ss close to 5%c and variable S0 4 2 ~/H 2 S ratios (from 0 to 1) at apparent equilibrium temperatures >300 °C. (iii) The data available for Reykjanes are consistent with parent fluids having 5 34 S ss close to 5%c and low S042~/H2S ratios, at temperatures of 350-400 °C, in line with the interpretation of Sakai et al. (1980). Acid sulfate-chloride groudwaters and the active crater lakes. The acid sulfate-chloride waters, also called volcanic waters (Giggenbach 1988) originate through absorption of hightemperature volcanic gases containing HC1 and S0 2 in groundwater. The bisulfate contained in these waters (which generally prevails over sulfate ion at the very low pH values of these aqueous solutions) is generated by disproportionation of magmatic S0 2 (Eqns. 24 and 25), as recognized by Iwasaki and Ozawa (1960), Ellis and Mahon (1977), and Kusakabe et al. (2000). Bisulfate is generally enriched in 34S, due to the exchange of sulfur isotopes during the disproportionation of S0 2 . Sulfur, which is typically present in active crater lakes, is produced through both disproportionation of S0 2 (Eqn. 25) and oxidation of H 2 S driven by atmospheric 0 2 (e.g., Kusakabe et al. 2000). Acid sulfate-chloride thermal waters are generally characterized by HS04~(aq) concentrations greater than H2S(aq) concentrations. Nevertheless, their HS0 4 ~ (aq /H 2 S (aq) ratio may deviate significantly from the value of 3, which is expected based on the stoichiometry of S0 2 disproportionation (Eqn. 24), due to occurrence of interfering processes (e.g., precipitation of S-bearing minerals, loss of H 2 S through degassing, etc.). The chemical and isotopic
•5
0
5
10
15
20
25
30
ft34S
Anhydrite (%° v s - V - C D T )
Figure 10. Plot of S ^ S ^ y d ^ vs. S ^ S p , ^ values for deep geothermal wells from different fields (data from Sakai et al. 1980 and Bayon and Ferrer 2005). Also shown are the equilibrium fractionation lines at selected temperatures and the lines for 5 3 4 S s s = 0 and 5 3 4 S s s =+5%o and variable S0 4 2 ~/H 2 S ratios of the parent fluids.
448
Marini, Moretti,
Accornero
characteristics of these waters were the subject o f several investigations (e.g., Williams et al. 1990; Shinohara et al. 1993; Sturchio et al. 1993). In particular, the acid sulfate-chloride thermal waters present in the volcanic areas o f northeastern Japan were studied chemically and isotopically by Kiyosu and Kurahashi (1983, 1984). The latter investigation reports the sulfur isotope ratios o f coexisting HS0 4 ~ ( a q ) and H 2 S (aq) , whereas in most other studies only the 5 3 4 S values of sulfate were determined. The 5 3 4 S values o f bisulfate and hydrogen sulfide of these Japanese thermal waters range from +3.8 to +31.1%e and from - 1 6 . 8 to -1.2%e, respectively, with 5 3 4 S values of total dissolved sulfur from +2.5 to +31.1%e (supplemental Table E - 8 , listing only the samples for which the isotopic composition of both HS0 4 ~ ( a q ) and H 2 S ( a q ) are available). These samples were interpreted to have formed by reaction of volcanic gases having S/Cl ratios of 4 to 7 and 5 3 4 S s s values o f total sulfur close to 0%o with groundwater at 2 0 0 °C, with or without precipitation of sulfide minerals. Further indications are provided by the correlation plot of 5 34 S HS Q 4 - VS. 5 3 4 S h , s values (Fig. 11), in which the lines for 5 3 4 S S S = 0%O and variable S0 2 /H 2 S ratio of the parent magmatic gases were drawn based on the isotope mass balances describing the quantitative disproportionation of S 0 2 (Eqns. 24 and 25). The chemical and isotopic characteristics of active crater lakes have received considerable attention, chiefly for reconstructing their conceptual model and the cycle of chemical elements, including sulfur, with the ultimate aim o f mitigating the natural hazards associated with these reservoirs o f water and sometimes of liquid sulfur as well. In particular, different sulfurbearing materials o f several active crater lakes have been analyzed for the 34 S/ 32 S isotope ratios (supplemental Table E-9). In addition to S 0 2 and H 2 S discharged by the fumarolic vents, which are typically present in volcanic crater areas, they include both: (i) dissolved bisulfate and (ii) elemental sulfur, which is present as sulfur spherules floating on the water surface and fragments o f quenched molten sulfur. These forms of sulfur are considered to be derived from
F i g u r e 11. Plot o f 5 3 4 S h s c > 4 - vs. 8 M S H , S values for acid sulfate-chloride groundwaters o f Japan (data from Kiyosu and Kurahashi 1983, 1984). Also shown are the equilibrium fractionation lines at selected temperatures and the 5 3 4 S h s c > 4 - and 5 3 4 S H , S values expected for disproportionation o f S 0 2 , according to Equations ( 2 4 ) (solid lines) and ( 2 5 ) (dashed lines), in magmatic fluids o f variable S 0 2 / H 2 S ratio and initial 5 3 4 S s s = Woo.
Sulfur Isotopes in Magmatic-Hydrothermal
Systems, Melts, & Magmas
449
a pool of molten sulfur situated at the bottom of active crater lakes (e.g., Giggenbach 1974; Oppenheimer 1992; Takano et al. 1994). T h e 5 34 S H so 4 - value ranges f r o m +0.5%o at El Chichón to +28.3%e at lake K a w a h Putih, Patuha volcano, whereas the 5 3 4 S s ° value spans the interval f r o m -11.4%e at Poás to +4.6%c at El Chichón. The A34SHSo4--s° varies f r o m -4.1%E at El Chichón to +28.5% C at Keli Mutu, crater lake 2. Average 5 3 4 S H so 4 -and 5 3 4 S s ° values are compared in the correlation plot of Figure 12. High 5 3 4 S H S q 4 - values accompanied by large A 34 S HS q 4 -.s° (e.g., Maly Semiachik; Poás; Copahue; B a n m n o e Lake; El Chichón in 1983; Yugama; Ruapehu; Keli M u t u ; Kawah Putih; Kawah Ijen) suggest that bisulfate ion and reduced sulfur species were formed through disproportionation of S 0 2 in the magmatic-hydrothermal systems presumably situated below the crater lakes (e.g., Rye et al. 1992). In contrast, low 5 3 4 S h s c , 4 - values accompanied by small A 34 S HS q 4 -.s° (e.g., O-Yunuma, Taisho-Jigoku; Khloridnoe Lake; El Chichón in 1995-1997) are ascribed to bacterially mediated aerobic oxidation of elemental sulfur and sulfides (Nakai and Jensen 1964), which usually have low 5 3 4 S values (e.g., Kusakabe et al. 2000). Sulfur oxidizing bacteria (e.g., Thiobacillus thiooxidans) are active in w a r m (10-60 °C) and acidic conditions (pH close to 3), but they cannot grow in strongly acidic environments, i.e., p H < l (Takano et al. 1997). In addition to disproportionation of S 0 2 in the magmatic-hydrothermal system and bacterial, inorganic oxidation of H 2 S driven by atmospheric 0 2 , other reactions may produce both bisulfate ion and elemental sulfur. For instance, hydrolysis of polythionate ions was suggested by Takano and Watanuki (1990): 3 S 3 0 6 2 " ( a q ) + 2 H 2 0 ( g J ) + H + ( a q ) = 4 S° n , s) + 5 HS0 4 ~ ( a q )
(33)
Unfortunately, it is difficult to recognize the pathway controlling the origin of elemental sulfur based on its isotopic signature. However, bacterial oxidation of H 2 S is unlikely at p H lower than 1.
S 3 4 S H s c v 4- vs. 534SSlllfllI values for active crater lakes (see references in the text and in supplemental Table E-9). Also shown are the HS0 4 ~-S° equilibrium fractionation lines at selected temperatures and the lines for 5 3 4 S s s = 0 and variable S0 2 /H 2 S ratio of the parent magmatic fluids experiencing S0 2 -disproportionation according to either Equations (25) and (35) (solid line) or Equations (24) and (34) (dashed line), followed by 0 2 -driven oxidation of H 2 S to elemental sulfur. MS =Maly Semiachik; PO = Poás; CO = Copahue; BL = Banmnoe Lake; CH = El Chichón; YU =Yugama; RU= Ruapehu; KM = Keli Mutu; KP = Kawah Putih; KI = Kawah Ijen; OY = O-Yunuma; TJ = Taisho-Jigoku; KL = Khloridnoe Lake; TA = Taal; NI = Niseko.
450
Marini, Moretti,
Accornero
The isotopic values of H S 0 4 (aq) and S° may be linked to the S0 2 /H 2 S ratio of magmatic gases through the following isotope balances: 834S s s = 834S x—7 „ + 834S„0 x| 1 72 I HSO, : 4-AKS0 S x Ii l - — 4. °"SOj,., I 2W
(34) '
5 34 S ss = S34SHSO_ x l y ^ + 834Ss„ X
(35)
- |ySOw j
where Y ^ = X s o ^ / ( X ^ + X ^ ) . Equations (34) and (35) assume total conversion of S 0 2 through Equations (24) and (25), respectively, as well as total oxidation of H 2 S through the following reaction: H 2 S (g) + V4 0 2 ( g ) - > Sa>s) + H 2 O 0 )
(36)
34
Equations (34) and (35) were used to draw lines for 8 S s s = 0 and variable S0 2 /H 2 S ratio of the parent magmatic gases in Figure 12. For the crater lakes with high 8 34 S H so 4 - values, comparison of the average isotope values with these theoretical lines indicates that the parent fluids circulating in the sublimnic magmatic-hydrothermal systems are characterized by: (i) very low S0 2 /H 2 S ratios at El Chichón in 1983, Kawah Putih, Banmnoe Lake, Yugama, and Kawah Ijen; (ii) S0 2 /H 2 S ratios near 1 at Ruapehu and Keli Mutu; and (iii) S0 2 /H 2 S ratios somewhat higher than 1 at Maly Semiachik, Copahue, and Poás. Also shown in Figure 12 are the equilibrium fractionation lines between bisulfate ion and elemental sulfur, at selected temperatures. Again, for the crater lakes with high 8 34 S HS q 4 - values, comparison of the average analytical isotope values with these equilibrium fractionation lines suggests the attainment of isotope equilibrium between bisulfate ion and elemental sulfur at temperatures of 220-400 °C. Such temperatures are characteristic for magmatic-hydrothermal systems and are often encountered within the sublimnic zone of active crater lakes. Elemental sulfur. Yellow crystals and crusts of solid elemental sulfur are present around the fumarole outlets in all the active volcanoes of our planet. Deposition of solid elemental sulfur is attributed to different redox reactions, possibly bacterially-mediated, as the reverse of Equation (27), the 0 2 -driven oxidation of H 2 S (Eqn. 36), and the hydrolysis of polythionate ions (Eqn. 33; Takano and Watanuki 1990). In active volcanoes, elemental liquid sulfur occurs, in different locations, such as: (i) at the bottom of several active crater lakes, and (ii) in fumarolic conduits and other parts of the volcanic edifice where temperatures exceed the melting points. Elemental sulfur may involve coexisting molecular forms in the system S x , with 1 < x < 106 (Schmidt and Siebert 1973). Only a few reports concerning large bodies of liquid sulfur are present in the volcanological literature, the most important of which was the effusion of a 1.4-km-long sulfur flow at SiretokoIosan volcano, Japan, in 1936 (Watanabe 1940). Other, less-voluminous sulfur flows occurred at Volcán Azufre, Galapagos Islands (Colony and Nordlie 1973); Mauna Loa, Hawaii (Skinner 1970; Greeley et al. 1984); Lastarria, Chile (Naranjo 1985); and Momotombo, Nicaragua (Smithsonian Institution 1990). At all sites, this phenomenon was ascribed to melting and remobilization of fumarolic sulfur deposits. Since 1989, sulfur flows, sulfur pools, and 1-3 m high sulfur volcanoes ejecting sulfur tephra and accretionary lapilli were observed inside the crater of Poás volcano, Costa Rica, due to desiccation of the crater lake (Oppenheimer and Stevenson 1989; Oppenheimer 1992). Values of 8 34 S ranging between - 1 2 . 3 and -9.4%o were obtained on five samples of elemental sulfur from Poás volcano by Oppenheimer (1992). This range of 8 34 S values is similar to that reported by Rowe (1994) for eight samples (-11.4 to -9.4%o; supplemental Table E-9).
Sulfur Isotopes in Magmatic-Hydrothermal
Systems,
Melts,
& Magmas
451
A large set of 834S values was produced by Ueda et al. (1979), for elemental sulfur samples collected from 44 different volcanic sites in Japan, also including the data previously obtained by Sakai (1957). The whole dataset comprises 91 entries, spanning the range from - 9 to +7%o, with an average of -2.2%o and a standard deviation of 3.6%c. A total of 36 samples of elemental sulfur from the solfataras of Nea Kameni Islet, Santorini Island (Greece), extending over two craters formed in 1940, were reported by Hubberten et al. (1975). The sulfur isotopes are distributed in the interval from 0 to +10%o, with a mean of +5.1%o and a standard deviation of 2.6%c. The 834S values of 11 samples of elemental sulfur collected from the crater fumaroles of Vulcano Island, Italy, between 1973 and 1981 range from -5.4 to -l.l%o, with an average of -3.7%c and a standard deviation of 1.5%o (Cortecci et al. 1996). The probability plots (Sinclair 1974, 1986) for the 834S value of elemental sulfur samples from the Japanese volcanic areas (data from Ueda et al. 1979), all the active crater lakes (data in supplemental Table E-9), and the solfataras of Nea Kameni Islet, Santorini Island, Greece (Hubberten et al. 1975) (Fig. 13) show that: (i) the Japanese samples can be fit by a single straight line and are therefore representative of a single population; (ii) the Nea Kameni dataset presents a flex at 32% probability and, therefore, it comprises two populations; and (iii) the crater lake set exhibits two inflection points, at 25% and 79% probability and, consequently, it includes three populations. The medium and high populations of the crater lake dataset partly overlap the Japanese volcanoes population, whereas all the Nea Kameni samples and the low population of the crater lake set appear to depart significantly from the the Japanese volcanoes population. These distinct populations reflect the different sources of sulfur as well as the fractionation effects of the processes involved in sulfur deposition (e.g., the reverse of Eqn. 27, and Eqns. 36 and 33).
111111111 I I I lull I III I lull
""I ' I ' ' lim! 11111111111 m
10 •
7.5 — 5_
O OI
2.5
>
0
>
: OO
-2.5
m (O an
-7.5 -10
A AAA
•
J a p a n e s e volcanoes (N=91)
A
All active crater lakes (N=51)
O
Nea Kameni, Santorini (N=36)
-12.5 — inij | | i i | Miij 11111111111111111II | III 1111111111111111 |l 1111 I I | l jllll' 0.5
2
10
30
50
70
90
98
99.5
Probability (%) Figure 13. Probability plots for the S 34 S value of elemental sulfur samples from the Japanese volcanic areas (data from Ueda et al. 1979), the active crater lakes (see supplemental Table E-9), and the solfataras of Nea Kameni Islet, Santorini Island, Greece (data from Hubberten et al. 1975). Inflection points indicated by arrows.
452
Marini, Moretti, Accornero SULFUR STABLE ISOTOPES AND THE POTENTIAL FOR PROBING DEGASSING AND CRYSTALLIZATION PROCESSES AND SULFUR SOURCES IN MAGMAS
As for many other stable isotope ratios, sulfur isotopes measured in bulk igneous rocks may be used to recognize the origin and evolution of magmas, and mixing of different sources and/ or assimilation of country rocks, provided that degassing and crystallization effects do not mask other processes. Despite the relatively narrow range of mantle sulfur isotope values (0 ± 2%c; see above), igneous rocks and their constituent minerals show a much wider variability. This testifies to the occurrence of other processes in addition to simple mantle melting, such as rock contamination and assimilation (Shima et al. 1963; Cheney and Lange 1967; Gorbachev and Grinenko 1973; Ripley 1981; Ohmoto 1986; Coleman 1979), as well as interaction with seawater (Grinenko et al. 1975; Sakai et al. 1978). However, sulfur isotope values of S 0 2 and H2S discharged by fumarolic effluents and hydrothermal minerals in active geothermal systems and ore deposits demonstrate that the magmatic-derived sulfur entering the ore-forming hydrothermal environments experiences very large fractionations (see above). Indeed, very simple physical phenomena accompanying magmatic production, differentiation, ascent and emplacement, such as (1) degassing of S 0 2 and/or H2S and (2) crystallization, particularly of S-bearing phases, may have a dramatic effect on the variations of 834S values observed in rocks, sulfide and sulfate phases (either solid or liquid), and gases. These effects must be addressed, chemically and isotopically, to understand the evolution of the magmatic system. In fact, mixing is one of the possibly occurring phenomena, but secondary with respect to sulfur isotope fractionation induced by the phase separation processes recalled above, which take place under the high-temperature conditions of magmatic systems. The main consequence of the occurrence of these separation processes is that the 8 34 S ss value of a given rock is not representative of the original (source) value, because the investigated rock is severely affected by the separation style as well as by pressure, temperature, bulk system composition and oxygen fugacity. Therefore, measured data must be tested first for the effects of fractionation due to degassing and/or crystallization. Once degassing and/or crystallization effects have been recognized, mixing between different sources can be inferred based on both the concurrent evaluation of several isotopic ratios and chemical data analysis (e.g., trace elements). Many interpretations based on mixing of different sources should be revised, if not dismissed, then simplifying the conceptual model of the magmatic systems under investigation. A good example of the correct approach to the problem is given by Faure et al. (1984), Ueda and Sakai (1984), Zheng (1990), and Marini et al. (1994) amongst others. The case of sulfur is particularly complicated because of its high reactivity, mainly due to to the numerous formal oxidation states ( - 2 to +6) it can have in a magmatic system which largely determines its speciation in both melts and gas phases (see Webster and Botcharnikov 2011, this volume). Coleman (1979) already observed that the isotopic composition in studied granitic complexes may be related to the magma-forming oxidation state. Moreover, the high reactivity of sulfur also determines the separation of different solid phases, not only sulfides and sulfates, usually solid solutions dominated by FeS and CaS0 4 , respectively, (see Baker and Moretti 2011, this volume), but also Fe-O-S liquids coexisting with silicate melts. All these phase separation possibilities give rise to a large spectrum of effects on the sulfur content and isotope signature of the parental melt. The separation style (closed- vs. open-system) further complicates the picture. To reconstruct how sulfur and sulfur isotopes partition among coexisting phases, different models can be applied (Baker and Moretti 2011, this volume). The choice of the speciation and saturation model to use is left to the readers, who must be aware that this choice may strongly affect (i) the S02/H2S ratio in the gas phase, (ii) the saturation state of silicate melt with respect to solid/liquid phases, and (iii) the 834S values of the gas and melt phases.
Sulfur Isotopes in Magmatic-Hydrothermal
Systems, Melts, & Magmas
453
In order to simplify mass and isotope balances, the modeling possibilities shown below will assume, to a first approximation, that S-bearing sulfide phases can be modeled as pure FeS (pyrrhotite), either liquid or solid, in igneous systems. Similarly, anhydrite will be considered the only relevant solid sulfate separating from silicic oxidized melts. Magmatic degassing and sulfur isotope fractionation The theoretical variations in the bulk 834S value of the melt, 8 34 S ss , caused by closed- and open-system degassing are described by (e.g., Marini et al. 1994): S34SES-/ £= 834Se§/=
34
S es -
a
K) 1000 ha
gas_melt
(37)
34
-Ses_,- WOO (fVs-sei.- 1
(3g)
respectively, where F = CES m d v / C E S m d t i is the fraction of S remaining in the melt. Equations (37) and (38) depict two extreme scenarios, which bracket all the conditions of gas separation from the melt. Rayleigh distillation is a process in which instantaneous equilibrium is achieved between gas and melt prior to gas removal. Note that Equation (38) strictly holds for a constant fractionation factor through the whole degassing process. Based on the calculus theorem, an average value can be considered in case a gas _ mdt varies along the considered fractionation path (e.g., Criss 1999). Intermediate possibilities exist between closed-system degassing and Rayleigh distillation. Discrete, open-system, degassing may be well described by a multi-step process involving a sequence of closed-system degassing episodes, each ending with complete or partial gas extraction. The gas-melt equilibrium S isotope fractionation factor is constrained by the following equations (Sakai et al. 1982): 1000 lnagas_meit = 8 SZS gas —8 SSS ms,h = = [yS02 = K»2
34
s&§
34
(i
lOOCdn s o ^ s
s^§]
34
[yso?
lOOQin ^
sfo|
(i ¥ s o r )
lOOCdn
34
s^s]
(39)
^
where 7S042- and YSOl are defined as: 7S042- = XS042-/(XS042- + Xsi-)- YSOl = X S0 /(X S02 + XH?S). According to Taylor (1986), the temperature (K) dependence of the equilibrium fractionation factors for the couples S0 2 -H 2 S and H2S-S2~ is conveniently approximated by the following relations: 4.367 ( i f J
1000Ina H
s sj_
= lxl |
T
0,05
0.19
0.41
(40,
(41)
Equations (40) and (41) are somewhat different from those proposed by Ohmoto and Rye (1979), which are reported in Table A-1. Equation (40) is valid in the range 400-1300 °C, whereas Equation (41) strictly holds in the interval 600-1000 °C (Taylor 1986). The temperature dependence of the sulfate-sulfide equilibrium fractionation factor is described by Equation (19), which was experimentally derived by Miyoshi et al. (1984) and is strictly valid from 600 to 1000 °C. However, Equations (41) and (19) will be used up to 1200 °C for the purpose of this review. It will be apparent, from the following discussion, that degassing can change the sulfur isotopic composition of the residual melt and the separated gas in different directions and in various extents, depending on the speciation of S in both phases. This is due to the different values of the fractionation factor 1000 lna gas . mdt computed through Equation (39). It is
Marini, Moretti,
454
Accornero
then important to understand how iso42- and 7So2 are related to pressure, temperature, and compositional variables. Separation of S-bearing liquids and/or solid phases Sulfide separation. The theoretical effects of sulfide separation on the 8 34 S ss values of magmas under closed- and open-system conditions and constant temperature can be computed by means of Equations (37) and (38), in which a stands for the fractionation factor of S isotopes between the coexisting sulfide phase and silicate melt. Taking pyrrhotite as the most obvious analogue of the sulfide phase, the mineral-melt fractionation may be expressed as (Gambardella 2000): 1 0 0 0 1 n a M = 8 34 S FeS -S 34 S zs , melt = =
S
3
X
= ysoi
s
- [ y
s o r
1000in
X
8 3 4 S s o r +(1 -
s2_sot
y
1000in
s o r
)
834Ss2_ ]
X
Fe8_H+s
lOOOtn
(42) ^
The temperature dependence of the equilibrium fractionation factor between FeS and H 2 S, in the 200-600 °C temperature range, is (Ohmoto and Rye 1979, Tin K, see Table A-l): 10001na
f t S
.
H j
s
= 0.10x^j
(43)
A coefficient of 0.25 for the right-side term was proposed by Li and Liu (2006), over the temperature range 0 to 1000 °C (see Table A-l). The temperature dependence of the equilibrium fractionation factors for the couples S042~-S2~ and H2S-S2~ is discussed above. To a first approximation, the same Equations (42) and (43) will be adopted also for describing the fractionation of S isotopes occurring upon separation of an immiscible S-bearing liquid, for simplicity taken as a pure, oxygen-free, FeS liquid. Similar to degassing, the 8 34 S ss variations greatly depend on the way the attainment of sulfur saturation is computed with respect to the other variables such as melt composition, pressure, temperature and/o 2 (Baker and Moretti 2011, this volume). Anhydrite separation. Similarly, the isotopic fractionation induced by anhydrite separation from the melt can be computed by: 1000 In a rC a S„„0
4
„ = 834S„C a S 0 - 8 3 4 SIS, „ melt„ =
-melt
4
34
34 = 8 SCaS0 r so4 - \ Y S04~ 2 x 8 SS04~ 2 +(1 - 7S04~ 2 ) x 8 S$2 ]J
= YS O% 1000in f
34
2
f
S2~-SOf
1000In C„,.„„+,, a S 0 -H S 4
2
lOOOtn
(44) H 2 S-S 2 "
The temperature dependence of the equilibrium fractionation factor between CaS0 4 and H 2 S is conveniently described by Equation (20). This equation, which was experimentally obtained by Miyoshi et al. (1984), is strictly valid in the temperature interval 600-1000 °C, but it will be extended up to 1200 °C for the aims of this review. The temperature dependence of the equilibrium fractionation factors S042~-S2~ and H2S-S2~ has already been described. Parametric assessment It is clear from the above reactions and equations, that temperature, oxygen fugacity, and phase separation style (closed- vs. open-system behavior) are, together with the initial composition, the main variables governing the 8 34 S ss values of residual melts and separated gas, liquid, and solid phases. It is evident that all these parameters operate simultaneously during magmatological and volcanological processes.
Sulfur Isotopes in Magmatic-Hydrothermal
Systems,
Melts,
& Magmas
455
Let us now consider different degassing and mineral separation scenarios, in which these parameters either vary independently or are interrelated by well-defined speciation-redoxsolubility functions available from the literature. In particular, we will focus on the effect of chemistry and particularly H 2 0, in order to show how the total (dissolved+exsolved) volatile content plays a role in shifting 8 34 S ss values. The 8 34 S ss values of the residual melt and separated phases may shift due to the loss of: (i)
S2~ by H 2 S degassing: H 2 0 (g) + S 2 " o H2S(g) + O 2 "
(45)
2
(ii) S ~ by sulfide separation, either liquid FeS or pyrrhotite (po): S2- + F e 2 + o F e S ( U q o r p o ) (iii) S 0 4
2-
induced by S0 2 degassing: S0 4 2 " o S0 2(g) + O 2 " + 1/2 0 2(g)
(iv) S 0 4
2-
(47)
due to anhydrite separation: S0 4 2 " +Ca 2+ CaS0 4(alJl)
2
(46)
(48)
2-
(v) S ~ and S0 4 through disproportionation of sulfate and sulfide ions and degassing of S0 2 , as expressed by the reaction: 3 S0 4 2 " + S 2 " 4 S0 2(g) + 4 O 2 "
(49)
and (vi) S2~ and S 0 4 2 - on joint degassing of S0 2 and H 2 S in a 1:1 proportion: S0 4 2 " + S 2 " + H 2 0 (g) H2S(g) + S0 2(g) + 20 2 ~ + % 0 2(g)
(50)
which is obtained by combining Equations (45) and (47). Figure 14 reports the expected covariation of sulfide and sulfate concentrations in the melt phase dictated by these reactions. It is worth noting that Equation (50), producing the 1:1 slope shown on the diagram of Figure 14, could explain the typical S0 2 /H 2 S ratio in the gas phase of "andesitic" volcanoes, already reported by Giggenbach (1987, 1996). Conversely, Equation (49) produces a 3:1 slope. In the complex frame of volcanic processes, many intermediate mechanisms involving multi-step sequences of several processes may occur. Figure 14 can then be used to evaluate the main process of sulfur loss that takes place in a given magma. For example, one can plot the sulfur speciation data collected from melt inclusions and measured viaXANES (e.g., Metrich et al. 2002) or via electron microprobe through the ASK a technique (Carroll and Rutherford 1988). Visual analysis of samples for the presence of FeS or CaS0 4 will help discriminate between the occurrence of sulfide separation or H2S degassing as well as between S0 2 degassing and CaS0 4 separation. Let us then see how the above processes determine variations of 834S in both melt and gas phases by considering different ways to assess iso42- in the melts, also depending on the adopted way to describe the oxidation state of the system. Figures 15 to 23 represent theoretical frames for the interpretation of analytical isotopic data. In all figures, the initial 834S value of the parental magma was assumed to be 0%o, the value inferred for the primordial mantle (see above). Figure 15 reports the effect of H 2 S outgassing according to Equation (45). Two different temperatures were considered: 1200 °C and 900 °C, grossly typical of basaltic and rhyolitic magmatism, respectively. Two general conditions are considered: (i) all the dissolved sulfur is present as sulfide ion, S2~ (7So42- = 0; Fig. 15 a, c), and (ii) sulfur is partitioned at 50% between sulfide ion, S2~, and sulfate ion, S0 4 2 - (7So42- = 0.5; Fig. 15 b, d). The oxidation state is not
456
Marini,
Moretti,
Accornero
n S 0 4 2 - (mmol/kg of melt) Figure 14. Diagram sketching the main processes yielding sulfur loss in the melt upon degassing and separation of sulfides and anhydrite. Sulfur is present as sulfide anion (S2~) and as sulfate anion (S0 4 2 ~) which contains hexavalent sulfur cation (S 6+ ) covalently bonded to oxygen atoms. The case of a melt with initial composition of bulk sulfur equal to 2000 ppm, and S2~/S6+ = 1 is shown. See text for details.
fixed and the interconversion between S2~ and S0 4 2 - is not allowed; so H2S is produced up to S2~ exhaustion in the silicate melt. Although geologically unlikely, this latter assumption is included to provide a clear starting basis for developing the modeling. In both cases ^02 ^ equal to zero. In the first case, the gas (gray lines) is enriched in the heavier isotope, whereas in the second case the opposite situation is observed, with the gas being depleted in the heavier isotope. Furthermore, if only S2~ is present (TSo42- = 0), the 534S value of both gas and silicate melt decreases progressively with sulfur loss, whereas it tends to increase with sulfur loss for initial 7So42- of 0.5, with the exception of the gas phase under closed-system conditions. Figure 16 shows the fractionation effects due to S0 2 outgassing for the same temperatures considered above but for sulfur present either as sulfate only (iso42- = 1; Fig. 16 a,c), or as both sulfate and sulfide in equal proportions (initial iso42- = 0.5; Fig. 16 b,d). 7 s o , is equal to one in all cases, and again, no constraint is imposed on the redox conditions. Isotope fractionation between the melt and gas phase takes place as a consequence of the reaction of sulfate to S0 2 according to Equation (47). For iso42- = 1, S0 2 outgassing produces an increase in the 534S value of both gas and silicate melt under both closed- and open-system degassing conditions. Fractionation effects are, of course, larger at 900 °C than at 1200 °C. On the other hand, for initial 7So42- of 0.5, S0 2 release produces a decrease in the 534S value of the silicate melt, whereas the 34S isotope content of the gas phase (i) increases constantly for closed-system degassing conditions and (ii) increases up to a maximum around F = 0.6 for open-system gas separation. Figure 17 considers the simultaneous loss of S2~ and S0 4 2 - via Equation (49), yielding S0 2 outgassing (Fig. 17 a,c), or via Equation (50), producing S0 2 and H 2 S in equal proportions (Fig. 17 b,d). In both cases, initial 7So42- is s e t to 0.5. In the case of S0 2 outgassing upon S2~-S042~ disproportionation (Eqn. 49; Fig. 17 a,c), 7 S o, is obviously equal to 1. The limiting lowest value of F (0.35) is imposed by mass balances
Sulfur Isotopes in Magmatic-Hydrothermal
Systems,
Melts,
H , S outgassing at 1200UC 5 P as S J • 2000 ppm as SO/' = 0
• *'
& Magmas
457
H , S outgassing at 900°C S r as = 2000 ppm S„ as SO/ - 0
~
* **
-
/ /V ' '
( if / I /
-!
(a) 0
0.1
0.2
0.3
04
0.5
O.S
07
08
0.9
0
W 0.1
02
F ( S ^ / S : . in melt)
0.3
04
S
H^S outgassing at 1200"C Sm as S 2, = 1000 ppm Sm as SO*2' = 1000 ppm
s^
0.5
0.6
07
O.B
0.9
1
F (S^ m IS\ in melt) 2 \
JV
H^S outgassing at 900ÙÇ
V
Sm as & - 1000 ppm
s,n as SO/-- 1 0 0 0 ppm
J
J (b) 06
0.7
0.8
F(S T r B /S T > melt)
-j
(d) OS
0.7
0.8
i
0.9
F (ST„./S\, in melt)
Figure 15. Effects of H,S outgassing at (a) 1200 °C and F S04 2- = 0, (b) 1200 °C and FSo42-= 0.5, (c) 900 °C and F S o 4 2 - = 0' a n d (d) 900 °C and F S o 4 2 - = 0-5- F is the fraction of sulfur remaining in the melt. Black lines indicate the silicate melt phase; gray lines represent the gas phase. Dashed and solid lines represent openand closed-system conditions, respectively. 8 M S values were computed through Equations (37), (38), and (39). H,S outgassing takes place via reaction (45) only (i.e. loss of S 2 ) , without any involvement of S 0 4 2 .
determined by the stoichiometry of Equation (49). This case is quite similar to that of Figures 16b,d, with a maximum 534S value of the gas around F = 0.65 under open-system separation. If H 2 S and S0 2 are simultaneously released in 1:1 proportion, S0 4 2 - and S2~ are consumed in the same 1:1 proportion, as dictated by Equation (50). In this case, we can observe how sulfur isotope fractionation takes place in a degassing scenario which explains many gas compositions observed at andesitic volcanoes (Giggenbach 1987, 1996). Starting from an equivalent distribution of S2~ and S0 4 2 - (Fig. 17 b,d), both 7So42- a n d 7So2 keep the value of 0.5 throughout the whole degassing process, and 534S values of both gas and silicate melt tend to increase. The silicate melt is always enriched in the heavier sulfur isotope with respect to the separated gas. When condensed phases are separated, such as stoichiometric pyrrhotite (or the
458
Marini,
Moretti,
Accornero
F (S V S ' J n melt)
F ( S \ J 5 \ in melt)
F (S T ras /S T in in melt)
F ( S ^ / S T,„ in melt)
Figure 16. Effects of S O , outgassing at (a) 1200 °C and F S o 4 2-= 1, (b) 1200 °C and F S o 4 2-= 0.5, (c) 900 °C and F S o 4 2 - = !• a n d (d) 900 °C and F S o 4 2 - = 0-5- Black lines indicate the silicate melt phase; gray lines represent the gas phase. Dashed and solid lines represent open- and closed-system conditions, respectively. 5 3 4 S values were computed through Equations (37), (38), and (39). S 0 2 outgassing takes place via Equation (47) only (i.e. loss of S0 4 2 ~), without any involvement of S2~.
corresponding liquid) and anhydrite, the isotopic composition of the silicate melt phase becomes progressively more negative with decreasing values of F. The magnitude of isotope fractionation is larger for FeS separation than for CaS0 4 separation. Closed-system separation of either sulfide or sulfate is likely not to be detected in most cases and only apparent under extreme open-system behavior. These results, shown in Figure 18, refer to Equations (46) and (48), respectively, and apply to silicate melts in which all sulfur is present as either S2~, when FeS separation occurs, or as S0 4 2 - when CaS0 4 is considered. The fractionation of sulfur isotopes is evidently controlled by the values of 7So42- a n d YsQ„ depending on the chemical mechanism occurring (e.g., Eqns. 45 to 50). Simple patterns can then be assessed by imposing 7So42- a n d assuming that Y$Q2 takes the same values, which holds if S 0 4 2 - contributes to S 0 2 and S2~ contributes to H 2 S. The results reported in Figure 19 show
Sulfur Isotopes in Magmatic-Hydrothermal
Systems, Melts, & Magmas
r
as
OS
F ( S y S ^ i n melt}
F ( S V S V ¡ n melt)
SO, * HjS {1:1} outgassing at 1200°C " Sm as S J - 1000 ppm Sin as SO/- • 1000 ppm
I
459
SOj - HjS (1:1) outgassing at 900"C
~ I _I
Sm as S 2 = 1000 ppm Sm as S0 4 2 = 1000 ppm
P • 9>
' \
—
V
\
V
é
H
w 60 —
-
(b) 0
0 1
0.2
0.3
F
0.4
0.5
(S\JS\Jn
0.6
0.7
OS
0.9
^ "
"
-
=
(d) 0 1
02
03
0.4
O.S
0.8
0.7
O.B
F ( S T „ . / S T J n melt)
melt)
Figure 17. Effects of S 0 2 outgassing coupled with S 2 - S 0 4 2 disproportionation (equation 49) at (a) 1200 °C and (c) 900 °C and effects SO,-H 2 S outgassing (1:1 proportion) following Equation (50) at (b) 1200 °C and (d) 900 °C. Initial F S o 4 2 - is s e t t o 0-5 in all cases. Black lines denote the melt phase; gray lines represent the gas phase. Dashed and solid lines represent open- and closed-system conditions, respectively. 5 34 S values were computed through Equations (37), (38), and (39).
the strong control exerted by 7So42- 011 the 5 34 S values of both the silicate melt and gas phases and clearly demonstrate the important role of assessing dependencies of sulfur speciation (hence 7So42-) 011 /o,> especially when sulfur speciation is not directly measured. We can then evaluate the effects of isotope fractionation dictated by degassing of S 0 2 and H 2 S under conditions governed by Equation (21), keeping in mind that P H ,o affects 7 s o , via this reaction. Figures 20 (at 1200 °C) and 21 (at 900 °C) are based on this equilibrium, coupled with the dependence of the S 2 ~/S0 4 2 ~ ratio on/ Q , proposed by Wallace and Carmichael (1994): log
= 1.92 log fa
25410
10
(51)
460
Marini, J
1
1
1
1
S as
1
Moretti,
Accornero
L
J
i
1
1
!
|
1
1
L
= 2000 ppm
Si„ as SO„! = 0
~t 0
0.1
i
i
i
i
i
i
i
i
0.2
0.3
0 4
0.5
0.6
0 7
08
0.9
0
i
i
i
i
i
i
i
i
0.1
0 2
0 3
0 4
0.5
0.6
0 7
0.8
F ( S r J S \ in melt) _1
I
I
I
I
I
I
F (SJJS\ I
I
C a S O i precipitation at 1200"C
I
I
i
I
0
1
in melt) I
I
I
I
l_
CaSOi precip nation at9Q0°C S^asSi =0 as SO/ • 2000 ppm
-
Sv, as S" • 0 5. as • 2000 ppm (b)
r~ 0.9
(d)
—i—i—i—i—i—i—i—r-
0.1
0.2
0.3
04
0 5
0.6
07
F ( S y S \ i n melt)
0 8
0.9
-!—i 0.1
0.2
1
1
0 3
0.4
1—j—i 05
0.6
07
1 0.8
r~ 0.9
1
F ( S V S V i n melt)
Figure 18. Effects of FeS separation from silicate melt (Equation 46) at (a) 1200 °C and (c) 900 °C for F S o 4 2-= 0 and effects of C a S 0 4 separation (reaction 48) at (b) 1200 °C and (d) 900 °C for F S o 4 2-= 1. Black lines denote the melt phase; gray lines represent the gas phase. Dashed and solid lines represent open and closed system conditions, respectively. Calculations were computed on behalf of Equations (42) and (44), respectively, who were incorporated into Equations (37) and (38) after modifying these to describe meltFeS and melt-CaS0 4 systems.
Different redox conditions are considered with respect to the NNO buffer (Huebner and Sato 1970) and for different partial pressures of water. Figures 20 and 21 have very similar features, although at the two investigated temperatures some differences in fractionation trends emerge at around NNO, a redox buffer that preferentially prevails in magmas encountered in subduction settings (Symonds et al. 1994). The different modeled conditions show that under reduced conditions the 5 34 S value becomes more negative with increasing sulfur release from melt (Fig. 20 a, b, c, f, g, h). Due to the non-linearities arising from the ensemble of adopted equations, at 1200 °C, the largest negative enrichment occurs at NNO-1, rather than at NNO-2 (Fig. 20 a, b, f, g). At NNO, trends are still negative, but become positive at NNO+1 (Fig. 20 d,i). When this occurs, the P H ,o (from
Sulfur Isotopes in Magmatic-Hydrothermal
Systems, Melts, & Magmas
Fixed
S'ISOf and
461
SOJH,S
S> = 20 00 ppm
0
0.2
0.4
F
(S\JS\
03
04
0.6
0.8
in melt)
in
0! TO "o P Q O > tij W oû
2
-
0 -
0
0.1
0.2 G
0.5
0.6
0.7
0.8
0.9
1
T
S /S (gas fraction of total sulfur) Figure 19. H 2 S and S 0 2 outgassing from silicate melts at 1200 °C under fixed F S o 4 2 - a n d iso 2 - Dashed and solid lines represent open- and closed-system conditions, respectively.
1 to 1000 bar) does not exert any appreciable role on modeled isotope fractionation (Fig. 20 d, e, i, j). On the contrary, the effect of changing P H ,o is visible for redox conditions < NNO, especially around NNO-1 (Fig. 20 b, g). The similar behaviors observed at 900 °C (Fig. 21) do not change appreciably the conceptual frame, despite the tendency to have a positive isotope fractionation at more reduced conditions. In fact, the inversion from negative to positive 5 34 S patterns is observed at NNO (Fig. 2 1 c , h), and appears to be clearly a function of PH,o> in the light °f its effect on 7 S O v As in the previous case at 1200 °C, the highest negative isotope fractionation is observed at NNO-1.
Marini, Moretti,
462
Accornero
F ( S V S T . in melt) 0
0.1
0.2
0.3
0.4
0.5
0.6
0.7
S G /S' (gas fraction of total sulfur) 0.8
0.9
1
0.1
0.2
03
I I • I ' '
I
04
OS
0.6
0.7
0.8
09
I 1 I I
1
PH2Q ' 1M b™ t30j - J A3
IA '/'
P
o 9 :> y>
-v/ f*H20 • 1
PHÌO" 10 tia'
Is/oz' °*7
-2 - \ ,—
tn s
mo-2
Ter;. 1. = 0.0034
(f)
I I I I 1 1 I I I 1 I I I I ! I I
1•
t/1 m 0)
P Q 9 >
-
0* ,00 ° bar
PH20 " pH20
" t0 baf Ys02 " 0.68
-1 •
^302 " 0 0®
YS02 * 0 ®
--3-
-6
-7 -8 —
NNO-1 Y S O | ! • 0.034
(g)
I [ I I I [ 1 I I I 1 I I I I [ 1 I I
f
j
P
PH20
" br ¥SO2-0.96
Q O >
-
UNO
(h) i I i I i I i I i I r i n
1 I I I I E I I I E I I I [ I I I I 1 0
0.1
0.2
0.3
0.4 T
0,5 T
O.fi
0.7
F ( S „ / S J n melt)
0.8
O.S
1
01
0.2
03
0.4
05
0.8
07
I ? I | r OS
09
1
S^/S 1 (gas fraction of total sulfur)
F i g u r e 2 0 ( o n f a c i n g p a g e a n d a b o v e ) . Effects of H 2 S - S 0 2 outgassing from silicate melts at 1200 °C following Wallace and Carmichael (1994) for different oxygen fugacities relative to the N N O solid buffer. Dashed and solid lines represent open- and closed-system conditions, respectively. Black and gray lines denote the fractionation taking place in the melt and gas phase, respectively. Total sulfur (S T = 2000 ppm).
Sulfur Isotopes in Magmatic-Hydrothermal
Systems, Melts, & Magmas
463
NN01 Yso/=G.79
0
I I I I I I I I I I I I I II 0.1 0.2 0.5 0.4 0.5 0.6 0-T 0.8 0.9 1
i i i i i i í i i i r i i i i i 0.1 0.2 0 3 0.4 0.5 0.6 0.T OB 0.9 1 F ( S V S T w i n melt)
S which was clearly enlightened by Moretti and Ottonello (2005) and clearly emerges from the many available studies on the speciation and solubility of sulfur in melts (see Baker and Moretti 2011 in this volume). Alternative formulations can be based on equations: logi.V.
/.¥.
,
38.48C H 2 0
16.348
21og/ 0 2
(52)
logi.V..
/.V.. i
62.«)C H 2 0
15.459
21og/ 0 2
(53)
for the two extreme compositions of tholeiitic basalt at 1200 °C and rhyolite at 900 °C, respectively. In this approach, 7 S o 4 2 - is n o t a simple function of temperature and/p,, but of water content as well. Because we are addressing degassing systems, water contents are those at saturation for the pressures (P H ,o) h e r e considered, i.e., 1 to 1000 bar. Corresponding water contents at saturation (basalt: 0.007 to 3.78 wt%; rhyolite: 0.01 to 3.81 wt%) were computed via the Papale et al. (2006) model. With respect to the previous approach, we see that 5 3 4 S trends similar to those displayed in Figures 20 and 21 are already obtained at more reduced conditions (about 1 log unit; Fig. 22 and 23). As in the previous case, iso 4 2 - and YSOl increase with/p, obliterating the effect of P H ,o (Fig. 22 c, d, e, h, i, j and Fig. 23 d, e, i, j). In case of rhyolitic melts at 900 °C, the inversion of
464
Marini, Moretti,
Accornero
F (S r w t /S T t t in melt) 0
0.1
0.2
0.3
0.4
0.5
0.6
0.7
S G /S T (gas fraction of total sulfur) 0.8
0 9
01
0
• 1 _f I I I 1 I I I 1 I I I J I I L J I L_
0.2
0.3
0.4
0.5
0.6
0.7
0.8
0.9
I I I I I I I I I I I I I I
1
f*H20 * *0 bar ¥SoZ< 0.004 P D O >
PH2o - 1 I»' Yg02 • Q.03B
«3 NNO-2 YSO," * 0.0035
(f) —r
I I I I I I I I I I I I j I I I -
J.
p^o - l c - bar J 1-
PH20 " 10 1S02-1«
P Zi >
CO
Z
NNO-1 YSO,1 3 »135
(g> 1 I I I I I I I 1 I I I I I I
I I I 4
3—
2— P
a o>
0— -1 —
Pjeo" 10 bar PHjD • 100 ba P^go- 1H»t-r TS02-185 Vfioj - OJH PH20 " 1 tar VS02 MS
2 -3
~
A -5 H NO
Yso.i- * 0.28
-7 —_ (h) I I I I 1 I r | i | r 1 i | i 1 i | i 0
0.1
0 2
0.3
04
0.5
0.6
0.7
F ( S V S T . in melt)
0.8
0.0
-8
i I t | i ] i | [ | i | i i i | i | i 0 !
0.2
0 3
0.4
0.5
0.6
0.7
OS
0 9
S aIS' (gas fraction of total sulfur)
Figure 21 (on facing page and above). Effects of H 2 S - S 0 2 outgassing f r o m silicate melts at 900 °C following Wallace and Carmichael (1994) for different oxygen fugacities relative to the N N O solid buffer. Dashed and solid lines represent open- and closed-system conditions, respectively. Black and gray lines denote the fractionation taking place in the melt and gas phase, respectively. Total sulfur (S T = 2000 ppm).
Sulfur Isotopes in Magmatic-Hydrothermal
Systems,
F ( S T „ / S T l n in melt) 0
0.1
02
0.3
0.4
0.5
OS
0.7
l i l i l í
Melts,
& Magmas
465
S G /S T (gas fraction of total sulfur) 0.8
0.9
'
0.1 J
0.2 I
I
0.3 I
I
0.4 i
I
0.5 J
I
06 I
I
0.7 I
t
0.8 J
J
0.9 I
I
1 L
[ I I I I I I I I I i I tI I I I I I I 0
0.1
0.2
0.3
0.4
0.5
0.6 1.6
0.7 0.
F(SVS T Jn melt)
0.8
0.9
'
F i g u r e 2 1 . caption
0.1
0.2
0.3
0.4
0.5
0.6
0.7
0.8
0.9
S G / S T ( g a s f r a c t i o n of t o t a l s u l f u r )
on facing
page
534S degassing trends from decreasing to increasing ones is observed at NNO-1, and depends on the non-linear interplay of redox conditions with water contents and pressures. Comparison of analytical S and 8 3 4 S s s data from selected volcanic systems and theoretical models of degassing and separation of sulfides and anhydrite Available data. The first S isotopic studies of the volcanic environment (e.g., Sakai 1957; Ault and Kulp 1959; Thode et al. 1961) were focused on separated sulfide and sulfate minerals, native sulfur, gas species, etc. whereas volcanic rocks and melt inclusions were not considered yet. Based on this limited information, it is not possible to reconstruct the effects of degassing and phase separation during magmatic differentiation and magma ascent towards the surface. Among the first pioneering studies on the sulfur isotope composition of volcanic products is that by Smitheringale and Jensen (1963) who measured the 5 34 S ss values of several Triassic igneous rocks from the eastern United States, including the basaltic lavas of the Newark group. A few years later, Schneider (1970) measured the 534S values of sulfide-S, sulfate-S, and total (bulk)-S of Tertiary basaltic rocks from Northern Hessia and Southern Lower Saxony, Germany. However none of these studies measured the concentrations of either bulk S or sulfide-S and sulfate-S. Both Smitheringale and Jensen (1963) and Schneider (1970) discussed the fractionation effects due to S loss, but their interpretation remained at a qualitative level
Marini Moretti, Accornero
466
F (STrlKVSTm in melt) 0
S G /S T (gas fraction of total sulfur) 0
0.1 0.2 0.3 0.4 0.5 0.6 0.7 0.8 0.9 1 J I l ! I I I ] I I l l I I L ] I I L
CD W.
O
3
P Q O >
-f / PH2O"10bar ~~» * Ygo4* 0002 YS02 " 0 -17 3 ! -
(fl
. .j.
01
f
0.2
0.3 0.4 0.5 0.6 0.7 0.8 0.9 1 I I I I I I I I I I I I I I
j '
f S
"
PH2Ch -
TJ04-MB / . Taoi-ot? I PhjO - 1 bir ' VSO4-0.M2 Vsoi-0"
I
2
-3-
t"
/
«3 =!
(a)
? I I I 1 I I I T I II ! I M PH20 • 10M bar P^o"^»»' Yso - 0.W7;rSO2 -0.M YSO* * 0-10; Ysoj" 0.39
I I I
A
hn-nKi» _
Tx Àf fj
It l>
cn P Zi 9
^PHjO-HHwr
PH20 " 1 t"»' Yso4-l».t6;Vs02-l).98
tr
'
.. ' / /'V
PH2Q'
vW!-M»
" 10
Prao-IMOM'
tua-"*
YJOJ-OIS: ISOLDES
u v^.o.hìsoz-am 4
I
% co
(b)
(8) i I i I i I i I
i ! I I t | I
i
I i I i I i I i I i
P
a o>
PHÌO - 100 !»r Yjo^l- 0.M;YSOzÌO.92
Phkj i 100 tur
PH20 • YSOJ-O.«; rsoj-o.er
(e) i I i I 1 I i I i I r 1 i | i 1 i | i 0
0.1
0,2
0.3
0.4
F (svs
0.5 T
.
i n
0.6
0.7
9.8
0.0
!
ì I I I I I I I ] 1 I I I I I I I i S'-VS1 (gas fraction of total sulfur)
me|t)
Figure 22 (on facing page a n d above). E f f e c t s o f H 2 S - S 0 2 outgassing constrained b y the function f o r tholeiitic basalts at 1200 ° C (Eqn. 52); water contents were computed at saturation with the Papale et al. (2006) model. Dashed and solid lines represent open- and closed-system conditions, respectively. Black and gray lines denote the fractionation taking place in the melt and gas phase, respectively. Total sulfur ( S T = 2000 ppm).
r
Sulfur Isotopes in Magmatic-Hydrothermal F (SVST¡n 0
0-0.2
0.3
0.4
0.5
¡n
me
0.6
Systems,
& Magmas
467
SG/ST (gas fraction of total sulfur}
») 0.7
Melts,
0.6
-I -i - I- i- i- i I i -1 -> - I - i- I-
0.9
1
0
I i J -i
0.1
02
0.3
04
0.5
0.6
0.7
0.6
0.9
I I I I I I I ; I I I I I I I ; I I I
1
7
È~ p
D
>
5 -
S -
4
-E
4
~
3
3
2-
2 -_ •
-
1
>~ ' -r> i 1
• -e
6
»'t ' 1 ta TtO! f (LM; rä0: ; C e:
0
; yt0tcUi;V|0]iU
-1 : {'i - i i i i i i i i i i i i i i i i i i i
m
-
5
5-
4
4H
3 -
3
2H
2H
t^
1 ^ pHIO J-1 b4r
0 -t
o
Í-
-t
-2
E (e)
v
50i
.
1
Ü)
-2 0
F l s y s V " ™lt) Figure 22. caption on facing
0.1
.
..J. ,.-r ...J ,.„! ....J,.,. ! „ . !„. I - • I" . . r . . j . . . | . . . | . . .
0.2
0,3
0.4
0.6
0.6
0,7
03
0.9
S C / 5 T ( g a s f r a c t i o n of t o t a l s u l f u r )
page
owing to the lack of concentration data. In the same years, 5 34 S ss values were measured in fourteen lavas from Santorini Island (Greece), without determining S contents, by Hubberten et al. (1975), who totally neglected fractionation effects induced by phase separation. Grinenko et al. (1975) were probably the first who analyzed the 534S values of sulfide-S and sulfate-S, as well as their concentrations, in igneous and metamorphic rocks from the Mid Atlantic Ridge, the Indian Ocean Ridge and the East Pacific Rise, but interpretation of these data was also qualitative. Since the 1980s, researchers began to determine systematically the wholerock S concentrations and 34S/32S isotope ratios from different volcanic systems including: (i)
the subaerial basalts of Kilauea, Hawaii, whose 5 3 4 S s s values vary from -2.2 to +0.4%o; these are very similar to those of the local S-undegassed submarine basalts, which have 5 3 4 S s s values from -0.6 to +0.8%c (Sakai et al. 1982);
(ii) the Quaternary volcanoes of the Japanese Island Arc, which exhibit 5 34 S ss values from -0.4 to +18%c (Ueda and Sakai 1984); (iii) the Jurassic tholeiites of the Kirkpatrick Basalt Group from both Solo Nunatak and Mt. Falla, Northern Victoria Land, in Antarctica, whose 5 3 4 S s s values vary from -4.01 to +3.41%o (Mensing et al. 1984) and from -1.45 to +11.73%c (Faure et al. 1984), respectively;
468
Marini,
Moretti,
Accornero
F ( S ' J S ' J n melt) 0.1
0.2
0-3
0.4
0.5
0.6
D.7
Sr7ST {gas fraction of total suifur) 08
0.9
0.1
0.2
!.. L i
I. I .1 .1 J J .1., !.. !.. L L I J .1 J J J .1., !..
0.3
0-4
0.5
0.6
0.7
.1 .1 J J J._ !.. !.. i l i
0.B
0-9
^
.1 .1 .1.1 .1.,
F*HX> - 10 i . oìiim
vSQMMM
PHJO 2 « TSÌ?J • O.Wl i 5Q21 Q.W4
P Q
-
&-
t , V //PlUO-l'-r */ T 50
V f^HjO * ^ \ VsO^-O.MiVsoj^O.M \ if PHzO-1®lMf j: kV O / -w J ¥504-ÌL^Ysoa-0-80 s yj \t£ PHjO-IOtìbar VS ^ // CM - &»8:YS02 * 0.28
r " i
1--i-|-
PhjO " tjr I - f fs t«-.,-f > '?
PH20" 1HWb«r PH20 ' IO» b»r YS04 - 0-2: *S02 " 0-M (C) I > I < I ' I > I < I < I ' I ' I 0
0.1
0.2
0.3
0.4
0.5
0.6
0.7
F (ST,„s/STm in melt)
0.&
0.9
r 1
a
r
" "i
0-0.2 6
S /S
T
r 0.3
0.4
"i 0.5
' 0.6
" i T " i 0.7
0.8
0.9
1
(gas fraction of total sulfur)
Figure 23 (on facing page and above). Effects of H 2 S-S0 2 outgassing constrained by the function for rhyolite melt at 900 °C (Eqn. 53); water contents were computed at saturation with the Papale et al. (2006) model. Dashed and solid lines represent open- and closed-system conditions, respectively. Black and gray lines denote the fractionation taking place in the melt and gas phase, respectively. Total sulfur (S T = 2000 ppm).
Sulfur Isotopes in Magmatic-Hydrothermal F (STras „/SVn ^ In melt) (J 0-1 0.3 0 3 0.4 0 5 0-6 0.7 OS 0-9 1 L 1 ,.l .J ...I .J .. I,., I.. I.. ,1 I ,.l, .J ..I I .
Q o
*
Systems, Melts, & Magmas
469
SG/Sr (gas fraction of total sulfur) 0 0 1 0.2 0 3 0.4 0 5 0.6 0.7 0.8 OS I . I.. I. ,1, ..I ..I .I J... I... >.. !.. L ,1. .I ..I .I J... I...
I
p ü r' \ njo " l0ü0 \ \ T.ot - «ji:rS0! • "i
«
v
\
Á
/J
PH2Q-»IJb.r
rKa-30 km for the last eruption which occurred in 1944 (Dolfi and Trigila 1978). Plinian eruptions involved larger volumes (from 0.1 to >1 km 3 ) of evolved magmas, which differentiated in relatively shallow magma chambers at depths of 3 to 5 km (Santacroce 1983; Barberi et al. 1981) before their discharge, Marini et al. (1998) measured whole-rock S contents and S isotope ratios of recent lavas and pumices of Vesuvius. To provide a theoretical framework for the interpretation of these analytical data, they solved the system of Equations (37) to (39) for temperatures of 800 and 1100 °C and different redox conditions, expressed as ANNO. iso 4 2 - was constrained adopting the approach of Wallace and Carmichael (1994), Equation (51), whereas YSo2 was fixed by means of Equations (21) to (23), setting/ H2 o at 1 bar. Effects of water fugacity on K^o, were proven to be insignificant up t o ^ o close to 1 kbar at 1100 °C and some tens of bars at 800 °C. The initial 8 34 S value of the melt was assumed to be equal to the typical mantle value (0%o) and an initial S concentration of 3000 ppm was adopted, based on the most primitive sample and an empirical relation proposed by Ducea et al. (1994). The results (Fig. 25) led the authors to conclude that sulfur contents and 8 34 S values of Somma-Vesuvius volcanics are largely governed by syneruptive, open-system degassing at different temperatures. The key parameter governing the 34 32 S/ S ratio in Somma-Vesuvius volcanic rocks seems then to be the average magma oxidation state, which generally varies from +0.85 to +1.20 ANNO units for lavas and from +1.20 to +1.40 ANNO units for pumices, which then are more oxidized than lavas. Moreover, Plinian pumices degassed less extensively than lavas, at temperatures of 800-850 °C, consistent with storage and cooling of these magmas in shallow chambers and the cessation of degassing upon syneruptive quenching, which may also explain why the Plinian pumices are richer in S than the lavas. On the other hand, most lavas experienced more extensive open-system degassing than Plinian pumices, at temperatures of 1050-1300 °C, most likely at near surface or very shallow conditions. This is partly justified by the rapid ascent of basic magma towards the surface, without any significant cooling, the delayed vesiculation, and the easy outgassing of lavas due to their enhanced fluidity. Lavas are indeed relatively S-poor compared to the more differentiated magmas which are related to explosive activity yielding pumices. Consequently, the joint interpretation of S contents and 8 34 S values of magmas constitute a potentially valuable tool to estimate not only their average redox conditions, but also to understand more about the dynamics of volcanic eruptions. Mt. Mazama. Mt. Mazama (Cascade arc) is a 10-km diameter caldera related to the 7700 years B.P climactic eruption of Crater Lake (Mandeville et al. 2009 and references therein). Compositions of eruption deposits vary from rhyodacite through andesite to mafic cumulate compositions (Williams 1942; Bacon and Druitt 1988; Druitt and Bacon 1989). Mandeville et al. (2009) provided an interesting and complete study of Mt. Mazama volcanics from climactic rhyodacitic to andesitic tephra and from deposits of the pre-climactic and postcaldera eruptions. The authors determined water and sulfur contents in matrix glasses, whole rocks and melt inclusions, sulfur speciation in melt inclusions and 8 34 S of glasses and whole rocks. 8 34 S values of the latter range from +2.4 to +14.8%o. Moreover, the occurrence of coexisting sulfide precipitates suggests that their separation plays a pivotal role in controlling the 8 34 S values of the melt. Mandeville et al. (2009) also analyzed (via SIMS) these sulfides and found that their 8 34 S varies from +0.4 to +5.8%o. The presence of sulfide phases causes increases of sulfur content in the surrounding environment, equilibrated with the sulfide, accompanied by possible local changes in the 8 34 S value (due to the "nugget" effect). For example, the crystallization and separation of only 0.314 wt% of
474
Marini,
Moretti,
Accornero
Figure 25. Plot of 5 34 S values vs. the fraction of S remaining in the magma upon degassing (F). The theoretical effects of open-system (A) and closed-system (B) isothermal degassing are shown for a water fugacity of 1 bar, at temperatures of 1100 °C (solid lines) and 800 °C (dashed lines), and specified ANNO values. Circles and squares refer to lavas and pumices from Mt. Vesuvius, respectively (data from Marini et al. 1998).
a stoichiometric pyrrhotite, with a S content of 11,400 mmol/kg (365,000 ppm), reduces the S content of the residual silicate melt from 46.8 mmol/kg (1500 ppm) to 11.1 mmol/kg (355 ppm), which corresponds with the maximum value observed in Mazama inclusions. Therefore, both sulfide separation and sulfur degassing must be used to explain isotopic values observed in Mazama rhyodacitic and andesitic samples. As observed by Mandeville et al. (2009), pyrrhotite grains in contact with silicate glass are rare in Mazama samples, whereas they are present as inclusions in all the phenocryst phases, and are especially common in Fe-Ti oxides. This suggests that pyrrhotite separation occurred essentially before syn-eruptive degassing, as noted by Mandeville et al. (2009). Based on these observations, the evolution of the 534S value of the silicate melt will be modeled starting from an assumed, but reasonable, initial content of 1500 ppm, in response to early separation of pure pyrrhotite, followed by syn-eruptive degassing. Mt. Mazama data offer the opportunity to couple degassing information from melt inclusions with those from sulfur isotopes. In particular, it is possible to assess the conditions for the joint degassing of S and H 2 0 by means of the multicomponent saturation model of Moretti et al. (2003) and Moretti and Papale (2004) (see also Baker and Moretti 2011, this volume). Figure 26 was drawn (i) by taking a redox state fixed at NNO+1 based on mineral equilibria (Druitt and Bacon 1989), and (ii) by setting initial total/(exsolved+dissolved) sulfur contents at 400 ppm and 170 ppm, the shift between these two values being produced by FeS separation. The validity of the model approach to reproduce reasonable degassing paths in H 2 0-S compositional space (Fig. 26) under the experimentally observed constraints given by composition, redox state and total contents of sulfur and water is confirmed when comparing computed with measured 7So42-- Computed values of 7So42- v a r y from 0.62 at high pressure and high water contents, up to 1 at 1 bar. This covers exactly the same range as has been measured for 7So42- by Mandeville et al. (2009). The following model-generated relationship can be established for a Mazama rhyodacite (Mandeville et al. 2009), to assess oxidation state at 900 °C:
Sulfur Isotopes in Magmatic-Hydrothermal
Systems,
Melts,
Mi. Mazama rocks, matrix grasses and Mis
& Magmas
475
S* = 400 ppm|~
Q.
' Sufide Iprecipitabcfi
Cl
w TJ œ _> 01 M
S" = 170 ppm
T= SOC'C NNO+1
dissolved H,0 (wt%) Figure 26. H 2 0 - S covariation computed for Mt. M a z a m a melt inclusions and matrix glasses. Solid lines denote closed-system degassing; dashed lines open-system. Computations were carried at N N O + 1 . Two initial conditions were considered: 1) H 2 O t = 7 wt% and S T = 400 ppm; 2) H 2 O t = 7 wt% and S T = 170 ppm. The loss of initial sulfur is ascribed to FeS separation (data f r o m Mandeville et al. 2009)
l^i.Y..
/.V.. ,
55.GQCH20
15.372
21og/ 02
(54)
The procedure followed here is therefore much more suitable than that based on a much more empirical description of iso42- dependence on redox state only. Figure 27 shows how the 534S value of the melt varies in response to open-system sulfide separation and degassing. As initial 534S, we set the typical mantle value (0%o) for an initial sulfur content of 1500 ppm. FeS separation was modeled by assuming a value of 0.11 for the initial 7so42-- As precipitation occurs, by subtraction of S2~ only from the melt, Jso42- increases up to 1. This explains the concave-upward curvature of the FeS separation curve in the semilogarithmic diagram of Figure 27. The 7so42- range measured by Mandeville et al. (2009) is well covered along the FeS separation curve. It is worth noting that sulfide separation yields 534SmeM = +0.75%o for a melt sulfur content of 300 ppm. This value is in line with that used by Mandeville et al. (2009) as the initial pole for their degassing calculations and corresponds to the 534S value (determined via SIMS) of the most primitive pyrrhotite grains in rhyodacite from the climactic eruption. Moreover, 534S values of separated FeS range between -0.03 and +7.20%e, which are in good agreement with measured values. Degassing trends start from the main curve of FeS separation, and give rise to straight lines (on the semilogarithmic diagram) whose slope is determined by inherited 7So42- values, and which satisfy relation (54) for a given water content and agree with the water-sulfur covariations of Figure 26. The evolution of the 534S value and S content in Mt. Mazama volcanic products (data from Mandeville et al. 2009) proposed here is based on a geochemical model incorporating sulfur speciation and saturation in the silicate melt (Moretti et al. 2003). A refined appraisal of quantities such as the initial amount of S prior to sulfide separation, which can probably be larger than 1500 ppm only, may improve modeling further. For example, very low amounts of
476
Marini,
Moretti,
Accornero
S dissolved in melt (ppm) Figure 27.5 3 4 S evolution of Mt. Mazama volcanic products (data from Mandeville et al. 2009). Black lines denote S0 2 -H 2 S outgassing at NNO+1 but computed for different F S o 4 2 - values, calculated from Equation (54) under different plausible pre-eruptive H 2 0 contents (2.95 and 7 wt%). Dashed black lines refer to open-system degassing; solid ones to closed-system degassing. The gray dashed line represents opensystem precipitation of FeS (pol from a parent melt with initial sulfur content of 1500 ppm.
sulfur (20,000 to ~20, depending on the imposed /o 2 and/s 2 conditions and are constrained according to the imposed fs2 as follows: l 0 g D 2 - m " s - m ' = - 6 . 9 5 ( + 0 . 2 0 ) + 2.39(+0.04){0.51og/ S2 - 0 . 2 5 1 o g / O 2 }
(10)
at 1.5 log units above the FMQ-po buffer, and logDS-""' 5 '-"" = - 7 . 7 9 ( + 0 . 4 4 ) + 2.90(+0.11){0.51og/ S2 - 0 . 2 5 1 o g / O 2 }
(11)
at 1 log unit below the FMQ-po f0l - fSl buffer. Brenan (2008) reported D - > (±1S) that range from 1.6 ± 0.3 to 2.6 ± 0.2 for Re, from 1.9 ± 0.3 to 3.3 ± 0.1 for Os, from 0.99 ± 0.7 to 2.2 ± 0.4 for Ir, and from 0.053 ± 0.005 to 0.13 ± 0.001 for Pd. The study reported D/"" mi/ si-mt v a i u e s that range from 22 ± 3 to 22,311 ± 885 for Re, and >413 to >95,667 for Os. Brenan (2008) concluded that D^u~mthi~mt and Dossu'm'/si'm', and by analogy other PGE, are sensitive to redox conditions, consistent with previous studies. xmss/si m
The partitioning of Cu, Au and Ag between si-mt and magnetite-usp solid solution, and simt and po was the focus of a study by Simon et al. (2008a). They reported data from experiments performed in both hydrous and anhydrous assemblages at temperatures between 800 and 1050 °C, pressures from saturated vapor pressure to 140 MPa, log/O 2 varied from NNO-O.25 to N N O and log/ S 2 varied from - 1 . 5 to - 3 . 0 . Values for (± IS) at 800 °C in a water-saturated
assemblage are Dc™&d-mt = 2x10^ ± 2xl0"9, DAnm^si-m> = 0.82 ± 0.69, DCuus?/si-mt = 26 ± 17,
DAnnsp/si~mt = 50 ± 31, DCnmss/si~mt = 174 ± 25. They reported that at 1050 °C, in an anhydrous assemblage, DCnv°/si-m> > 200, DAgP°/si"mi (± IS) = 58 ± 8, and DAnP°/si"mi (± IS) = 120 ± 50. The values for oAuusp/sl'mt and DCuusp/s'"mi indicate that dilution of mag by the addition of Ti increases the Au- and Cu-sequestering capacity of mag. They reported O x mss/sl ' mt values that indicated that a temperature change from 1050 to 800 °C results in no observable change in the partitioning of Cu. Bell et al. (2009) reported experimental data that elucidate the partitioning of Au, Pt and Pd between mss and granitic si-mt, and iss and granitic si-mt. They performed experiments in a si-mt - su-xtal - su-mt - oxide - supercritical aqueous fluid phase - Pt - Pd - Au assemblage at 800 °C, 150 M P a , / o 2 ~NNO, and log/s 2 varied from 0 to - 5 . They reported B^BSS/Si'mt (± IS) for Au, Pd and Pt that range from 1244 ± 862 to 3 ± 1.8xl0 5 , 0.5 ± 0.4 to 2300 ± 4655, and 400 ± 525 to 27,600 ± 33,115, respectively. These data indicate that mss should strongly fractionate Pd from Pt, and both of these metals from Au and that the mass transfer of Pt and Pd from the si-mt to mss is dependent upon the/s 2 of the system; i.e. higher fs2 yields higher metal
Magmatic Sulfur and Ore Deposit Formation
527
solubilities in mss. These data indicate that there is no systematic variation of the Pt, Pd or Au solubility in iss with variation in either fSl or the Fe/Cu ratio of the recovered iss; however, the data demonstrate that crystallization of iss can fractionate Au and Pd from Pt with Pt being retained more strongly in the granite si-mt. The partitioning of ore metals among silicate melt and S-bearing aqueous fluid(s) It is well recognized that magmatic-hydrothermal H-O-S-Cl fluids are instrumental in the formation of several types of magmatic-hydrothermal porphyry-type ore deposits. There is growing evidence, e.g., from chemical analyses of natural fluid inclusions and Cl/F ratios of apatite, that aqueous fluids were present during the formation of layered-mafic-instrusion-hosted PGE deposits, and aqueous fluids are postulated to play a role in the subsolidus redistribution of metals in some magmatic sulfide deposits (Boudreau et al. 1986; Boudreau and McCallum 1989; Willmore et al. 2000, 2002; Boudreau and Hoatson 2004; Hanley et al. 2008; Boudreau 2009). The most direct evidence of magmatic H-O-S-Cl-volatile phase transport of metals is found in volcanic fumaroles and their sublimates. Volcanic vapors are comprised of H 2 0, C0 2 , S0 2 , and the proportion of these gases varies among volcanic settings. In arc environments that host porphyry-type ore deposits, volcanic gases are reported to contain on the order of 90 mol% H 2 0, with lesser amounts of C 0 2 (up to 10 mol%), S0 2 (up to 6 mol%), and HC1 (up to 6 mol%) (Williams-Jones and Heinrich 2005; Webster and Mandeville 2007; Metrich and Wallace 2008; Oppenheimer et al. 2011, this volume). Other important volatile components, present typically at concentrations below 1 mol%, include H 2 , HF, H2S, Ar, Rn, N, Hg Br and CH 4 (Symonds et al. 1987; Giggenbach et al. 1993; Giggenbach 1997; Williams-Jones and Rymer 2000; Taran and Giggenbach 2003; Elkins et al. 2006; Oppenheimer et al. 2006; Webster and Mandeville 2007). The ability of magmatic-hydrothermal fluid(s) to dissolve and transport significant quantities of S is well documented (Gerlach 1980; Wallace and Gerlach 1994; Giggenbach 1977, 1997; Wallace and Anderson 1999; Stix and Gaonac'h 2000; Hattori and Keith 2001; Wallace 2001, 2005). Metal abundances in volcanic vapors vary significantly (Table 3), but concentrations can be high enough that fumarole encrustations include sphalerite (ZnS), chalcocite (Cu2S), covellite (CuS), galena (PbS), chalcopyrite (CuFeS2), molybdenite (MoS2), cassiterite (Sn0 2 ), wolframite ((FeMn)W0 4 ), scheelite (CaW0 4 ), greenockite (CdS), realgar (As4S4), bismuthinite (Bi2S3) and native Au (Naboko 1964; Stoiber and Rose 1974; Symonds et al. 1987; Quisefit et al. 1989; Taran et al. 2000; Williams-Jones and Heinrich 2005). Korzhinsky et al. (1994) reported the precipitation of rheniite (ReS2) in sublimates from volcanic fumaroles at temperatures of 910 °C, at the Kudriavy volcano in the Kurile arc. Williams-Jones and Heinrich (2005) reported that the variability in the metal composition of volcanic vapors is a function of the composition of the parental si-mt. Volcanic vapors evolved from basaltic si-mt can contain up to several |ig/g Cu as opposed to vapors evolved from dacite and rhyolite si-mt that contain ng/g abundances of Cu. Andesite si-mt can evolve magmatic vapors that contain |ig/g abundances of Cu, Zn and Pb, but notably these andesite-evolved vapors contain higher concentrations of Mo (3 |ig/g from Merapi, Indonesia: Symonds et al. 1987) and Hg (340 |ig/g from Kudryavy, Russia: Taran et al. 1995). High concentrations of Sn (7 |ig/g at Usu, Japan: Giggenbach and Matsuo 1991) and Mo (1 |ig/g at Satsuma Iwojima, Japan: Hedenquist et al. 1994) have also been measured in volcanic vapors. The ability of volcanic vapor to transport S is perhaps best exemplified at Kawah Ijen, Indonesia, where S is mined from an active vent by channeling volcanic vapor through a series of pipes resulting in condensation of molten S that solidifies as it exits the cold end of the pipe (McSween 2010). Practically, the thermal gradient along the length of silica gas-sampling tubes used to sample volcanic vapors allows for the precise determination of the temperature of mineral precipitation, facilitating quantitative constraints on the relationship between temperature and mineral precipitation (Williams-Jones and Heinrich 2005). These data indicate that magnetite,
528
Simon and Ripley es es
& a
p. =,
i 3
§ &
X
fi
o o
Q £
o
o
Q Z;
a, es
Q £
$
o
$
Q Z;
>>
I -Ö £
o
es
a
t
o U
—
Q Z;
es A
Q Z
£
Q Z
o
Q £
£
o A o
B o
£
o
O
1
Q £
o
o
rn
Q Z
o
00
a
Q Z
Q £
vi
S3 Sf y z
0 e es u
Q Z
Q £
o
es
z, z,
t
«