The Ganges Water Diversion: Environmental Effects and Implications (Water Science and Technology Library) 1402024800, 9781402024801
162 40 7MB
English Pages [374]
Recommend Papers


- Author / Uploaded
- Ema Manirula Kādera. Mirjā
File loading please wait...
Citation preview
THE GANGES WATER DIVERSION: ENVIRONMENTAL EFFECTS AND IMPLICATIONS
Water Science and Technology Library VOLUME 49
Editor-in-Chief V. P. Singh, Louisiana State University, Baton Rouge, U.S.A. Editorial Advisory Board M. Anderson, Bristol, U.K. L. Bengtsson, Lund, Sweden J. F. Cruise, Huntsville, U.S.A. U. C. Kothyari, Roorkee, India S.E. Serrano, Philadelphia, U.S.A. D. Stephenson, Johannesburg, South Africa W.G. Strupczewski, Warsaw, Poland
The titles published in this series are listed at the end of this volume.
THE GANGES WATER DIVERSION: ENVIRONMENTAL EFFECTS AND IMPLICATIONS edited by
M. MONIRUL QADER MIRZA Adaptation and Impacts Research Group (AIRG), Environment Canada, c/o Institute for Environmental Studies (IES), University of Toronto, Toronto, Canada
KLUWER ACADEMIC PUBLISHERS NEW YORK, BOSTON, DORDRECHT, LONDON, MOSCOW
eBook ISBN: Print ISBN:
1-4020-2480-0 1-4020-2479-7
©2005 Springer Science + Business Media, Inc. Print ©2004 Kluwer Academic Publishers Dordrecht All rights reserved No part of this eBook may be reproduced or transmitted in any form or by any means, electronic, mechanical, recording, or otherwise, without written consent from the Publisher Created in the United States of America
Visit Springer's eBookstore at: and the Springer Global Website Online at:
http://ebooks.springerlink.com http://www.springeronline.com
Dedication To my parents, wife (Hasna) and son (Hamim)
Preface This book deals with environmental effects on both sides of the border between Bangladesh and India caused by the Ganges water diversion. This issue came to my attention in early 1976 when news media in Bangladesh and overseas, began publications of articles on the unilateral withdrawal of a huge quantity of water from the Ganges River through the commissioning of the Farakka Barrage in India. I first pursued the subject professionally in 1984 while working as a contributor for Bangladesh Today, Holiday and New Nation. During the next two decades, I followed the protracted hydro-political negotiations between the riparian countries in the Ganges basin, and I traveled extensively to observe the environmental and ecological changes in Bangladesh as well as India that occurred due to the water diversion. The Ganges, one of the longest rivers of the world originates at the Gangotri glacier in the Himalayas and flows across the plains of North India. Eventually the river splits into two main branches and empties into the Bay of Bengal. The conflict of diversion and sharing of the Ganges water arose in the middle of the last century when the government of India decided to implement a barrage at Farakka to resolve a navigation problem at the Kolkata Port. The navigation problem was unique in nature and there was no consensus on its causes, which were related to high salinity, heavy slitation, poor navigability on account of a large number of sandbars, sharp bends and sunken ships, and the increasing frequency and intensity of tidal bores. While observing the hydro-political negotiations as well as the effects of water diversion, I realized that a multi-disciplinary book addressing the environmental effects and implications of water diversion was necessary. The contributors to this book are experts in their fields and each has a wide range of experience on the subject. A balanced approach is adopted in reporting the environmental changes of water diversion. Deviating from the usual focus of reporting only adverse effects, in this book, positive effects of the Ganges water diversion is also included. Bangladesh in the downstream reach of the river is suffering from low dry season discharge, morphological changes, increased water and soil salinity, decreased agricultural productivity, damages to ecosystems, etc. The Hooghly Estuary in India is benefited from the diversion in terms of increased growth of flora and fauna and the decrease in salinity levels. The adjacent areas upstream of the Farakka Barrage suffer from the increased flood and riverbank erosion hazards. In addition to a thorough analysis of the environmental effects and implications, this book presents three new important issues - risk analysis, vulnerability, and adaptation related to water diversion. With the application of statistical theory, it is demonstrated that continued diversion of water upstream of the Farakka Barrage put the allocation arrangement of the 1996 Ganges Water-Sharing Treaty between India and Bangladesh at vii
viii
Preface
risk. A risk analysis of the agreed discharge values was not carried out before signing the Treaty. Such analysis is necessary as the occurrence of discharge values is very important for water development planning in both countries. Vulnerability and adaptation science has undergone comprehensive evolution in recent years especially with regard to climate change and variability and in this book these concepts are applied in terms of water diversion. Statistical distribution demonstrates how vulnerability has increased with the increased chances of the occurrence of low flows. System resiliency has decreased and in many cases damages are irreparable. Some autonomous adaptations have taken place. Costly planned adaptation measures are also implemented and some are at planning stages. This book is a timely contribution to water-related conflicts that are now, generally becoming more prominent in the world, particularly in South Asia. In India, a national river inter-linking plan is being envisaged, which is comprised of large-scale inter-basin water transfer options. Concerns are being raised that the plan, if implemented, would cause significant adverse environmental effects in many regions of India and Bangladesh. I am confident that the analytical presentations and discussions outlined in this book will be a wake-up call to politicians, policy makers, and water engineers in terms of the environmental implications of massive water diversions, especially on sensitive downstream ecosystems. I hope that the analytical contents of the book will generate dialogue around the issues of water diversion and will assist in better environmental management. In addition, this book will be of interest to water and environmental researchers, lawyers, academia, donors and investors, non-government organizations, and water activists of South Asia and beyond.
Adaptation and Impacts Research Group (AIRG) Institute for Environmental Studies (IES) University of Toronto 33 Willcocks Street, Toronto, ON M5S 3E8 Canada Email: [email protected]
M. MONIRUL QADER MIRZA Editor
Acknowledgements Special thanks go to Dr. Q.K. Ahmad, Chairman, Bangladesh Unnayan Parishad (BUP) for associating me with the Ganges-Brahmaputra-Meghna Basins Study funded by The Ford Foundation, which enabled me to have a deeper insight into the Ganges water-sharing problem. I gratefully acknowledge the education I received from four Bangladeshi engineers on this issue. They are: late B.M. Abbas A.T., M.F.A. Siddiqui, M. Shahjahan and Amjad Hossain Khan. In addition, I express my gratitude to the Hydrological Sciences Journal, International Commission on Irrigation and Drainage (ICID), International Journal of Water, Springer-Verlag New York Inc., Dr. Ben Crow, Department of Sociology, University of California, Santa Cruz, USA and Dr Mokhles Rahman, Institute for Waste Management and Contaminated Site Remediation, Dresden University of Technology, Germany for allowing me to reproduce some of the figures and texts and Professor Ainun Nishat, IUCN, Dhaka, Bangladesh for granting me time to discuss the Ganges water diversion problem and its environmental effects. Thanks to Petra van Steenbergen and Martine van Bezooijen of Kluwer Academic Publishers for their initiative and guidance. Many reviewers spent enormous amounts of time in critically reviewing the chapters. Farzana Abdulhusein drew many maps and figures and patiently prepared the camera-ready copy. Jane Davie, Department of Geography, University of Toronto also provided cartographic assistance. Professor Marie Sanderson at the Adaptation and Impacts Research Group (AIRG), Environment Canada gave constructive editorial comments on many chapters. I gratefully acknowledge all of these contributions. The costs of design and typesetting the book has been covered by the AIRG. My sincere appreciation and thanks to Don MacIver, Director of the AIRG for his support. I am very grateful to the contributors of this book who invested much time in preparing the chapters. Without their efforts this book would not have materialized. I express my gratitude to my family from whom I took much time during the preparation of this book. Finally the views expressed in this book belong to the authors and do not reflect the views of their respective organizations.
ix
Glossary aman
a type of rice which is grown in the kharif season. There are two types of aman (transplanted and broadcasted) and they are grown in the high lands and low lands, respectively.
aus
a rice crop which is planted during kharif-I season in the low lands.
boro
a rice crop usually planted in November-December and harvested in April-May. High yielding boro requires irrigation.
char
a sand bar which is formed within a river or estuary.
cusec
cubic feet per second
ghat
a river terminal where people are transported from one bank to the other bank by boats/ mechanized ferries.
kharif
a cropping season (April-November).
rabi
a cropping season (November-May). Usually vegetables, pulses and boro rice are grown during rabi season.
Rs.
Rupees, the currency of India, Nepal and Pakistan, with a different value in each country.
thana
smallest administrative unit in Bangladesh.
taka
name of Bangladesh currency.
xi
Table of Contents Preface Acknowledgments Glossary
vii ix xi
1 THE GANGES WATER DIVERSION: ENVIRONMENTAL EFFECTS AND IMPLICATIONS - AN INTRODUCTION M. Monirul Qader Mirza 1.1 1.2 1.3 1.4
Ganges Basin: Hydro-Meteorological Setting, Limitations and Water Diversion Water Diversion and Dispute Resolution: The Phases of Negotiations Water Diversion and Environmental Concerns Road Map to the Book
1 3 3 7
2 HYDROLOGICAL CHANGES IN BANGLADESH M. Monirul Qader Mirza 2.1 2.2 2.3 2.4 2.5
Introduction The Ganges Basin: Hydro-Meteorological Setting The Data Hydrologic Changes in the Ganges System Conclusions
13 14 19 20 31
3 ROLE OF FARAKKA BARRAGE ON THE DISASTROUS 1998 FLOOD IN MALDA (WEST BENGAL) S.K. Mazumder 3.1 3.2 3.3 3.4
Introduction Brief Description of the Flood Causes of Flood and Role of Farakka Barrage Conclusions xiii
39 42 43 48
xiv
Table of Contents
4 IMPACT OF UPSTREAM HUMAN INTERVENTIONS ON THE MORPHOLOGY OF THE GANGES-GORAI SYSTEM Maminul Haque Sarker 4.1 4.2 4.3 4.4 4.5 4.6 4.7 4.8
Introduction Approach Geo-Morphological Settings Hydro-Morphological Characteristics Natural and Human Interventions and Their Impacts on the Ganges Changes in the Ganges River and its Impact on the Gorai River Future of the Gorai River Discussion and Concluding Remarks
49 50 52 56 59 69 74 77
5 EFFECTS ON WATER SALINITY IN BANGLADESH M. Monirul Qader Mirza and Maminul Haque Sarker 5.1 5.2 5.3 5.4 5.5 5.6 5.7 5.8
Introduction Dynamics of River Salinity in the Southwest Region The Data Analytical Methods Reduced Dry Season Flow and Effects on Salinity Projection of Salinity under the Ganges Water-Sharing Treaty Implications of Increased Salinity in Bangladesh Conclusions
81 83 87 87 87 94 96 101
6 FARAKKA BARRAGE AND ITS IMPACT ON THE HYDROLOGY AND FISHERY OF HOOGHLY ESTUARY M. Sinha 6.1 6.2 6.3
Introduction The Impact Concluding Remarks
103 104 122
Table of Contents
xv
7 IMPLICATIONS ON ECOSYSTEMS IN BANGLADESH Ansarul Karim 7.1 7.2 7.3 7.4 7.5 7.6 7.7 7.8 7.9 7.10
Introduction Bounding the Ganges Dependent Ecosystems Impact on Physical Environment Impact of Reduced Freshwater Flow on Vegetation Impact on Faunal Richness Water Quality and Aquatic Biota Salinity and Fish Fauna of Conservation Significance Ecosystem Integrity Impacts on Ecosystem Services
125 125 126 131 143 150 151 152 153 159
8 WATERING THE BANGLADESHI SUNDARBANS Alan Potkin 8.1 8.2 8.3 8.4 8.5 8.6
Introduction The Forested Mouths of the Ganges The Ganges-Brahmaputra Link Canal Water Development in Nepal Social Impacts of Reservoirs Towards Watering the Sundarbans
163 163 168 169 172 174
9 ADVERSE EFFECTS ON AGRICULTURE IN THE GANGES BASIN IN BANGLADESH M. Monirul Qader Mirza and Md. Altaf Hossain 9.1 9.2 9.3 9.4 9.5 9.6
Introduction Agro-Climate of the Ganges Basin in Bangladesh Degraded Agro-Ecological Constraints and Agriculture in the Ganges Basin Water Diversion and Effects on Agriculture Affected Area and Production Loss Concluding Remarks
177 180 184 189 191 194
xvi
Table of Contents
10 ENVIRONMENTAL IMPACTS OF THE GANGES WATER DIVERSION AND ITS INTERNATIONAL LEGAL ASPECTS Md. Nazrul Islam 10.1 10.2 10.3 10.4 10.5 10.6 10.7 10.8
Introduction Environmental Impact of Indian Water Diversion Projects Legal Responses in the 1996 Treaty The 1997 Watercourse Convention A Comparison between the 1996 Treaty and the 1997 Convention Customary Rules in the 1997 Convention Global Environmental Conventions and Soft Law Instruments Conclusions
197 199 202 207 213 215 218 220
11 WATCHING THE FARAKKABARRAGE: ROLE OF MEDIA Moinuddin Naser, Harun-Ur-Rashid and Farzana Abdulhusein 11.1 11.2 11.3 11.4 11.5 11.6 11.7
Introduction Reflection of Farakka in the Media The Role of Media The Function of Media Adaptation Authoritative Differences Over Resources Conclusions: Media Should Show the Way Ahead
223 225 230 237 238 238 240
12 VULNERABILITY TO THE GANGES WATER DIVERSION: ADAPTATION AND COPING MECHANISMS M. Monirul Qader Mirza 12.1 12.2 12.3 12.4 12.5 12.6
Introduction Vulnerability, Adaptation and Adaptive Capacity: A Brief Review of Concept and Issues Water Diversion, Incremental Hazards and Thresholds Adaptation and Coping Mechanisms: A Synthesis Cost of Adaptation Concluding Remarks
247 248 257 264 280 281
Table of Contents
xvii
13 THE GANGES WATER SHARING TREATY: RISK ANALYSIS OF THE NEGOTIATED DISCHARGE M. Monirul Qader Mirza 13.1 13.2 13.3 13.4 13.5
Introduction The Data The Analytical Methods How to Reduce the Risk? Concluding Remarks
287 289 289 296 300
14 REGIONAL COOPERATION ON WATER AND ENVIRONMENT IN THE GANGES BASIN: BANGLADESH PERSPECTIVES Q.K. Ahmad and Ahsan Uddin Ahmed 14.1 14.2 14.3 14.4 14.5 14.6
Introduction The Ganges Basin Cooperation Potential in the Ganges Basin: A Framework Experiences of Past Cooperation and Past Efforts Towards Forging Cooperation An Emerging Issue: The Case of Inter-Linking of Rivers in India Concluding Remarks
305 306 309 312 319 322
ANNEX I
327
INDEX
357
1 THE GANGES WATER DIVERSION: ENVIRONMENTAL EFFECTS AND IMPLICATIONS - AN INTRODUCTION M. Monirul Qader Mirza Adaptation and Impacts Research Group (AIRG), Institute for Environmental Studies (IES), University of Toronto, 33 Willcocks Street, Toronto ON M5S 3E8 Canada
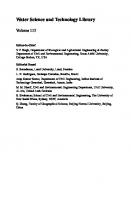
Water is the most powerful agent in shaping the earth’s surface through the processes of rivers, glaciers, ground water, weathering, mass movement, and oceans. Water is also an important element that played a pivotal role in the development of the world’s civilizations. Since the dawn of civilization, humans have harnessed water in many different ways for their physical existence and the sustenance of the environment. They have devised ways of capturing, storing, purifying, and diverting freshwater resources to reduce their vulnerability to highly variable river flows and precipitation. Early agricultural civilizations developed in regions where precipitation and river flows were abundant and could be easily and reliably harnessed. Humans extended their river water-based transportation systems to sea travel and trade. With the growing need of goods, commodities and a safer environment, humans altered the natural hydrological cycle through massive engineering projects for water diversion, flood control, urban and rural water supply, hydropower, navigation and irrigation. The development of water resources served human societies in many positive ways as well as generated adverse effects. This book presents an analytical account of the effects caused by water diversions by major engineering works such as barrages1 and other structures built on the Ganges River (Figure 1.1) in South Asia.
1.1
The Ganges Basin: Hydro-Meteorological Setting, Limitations and Water Diversion
The Ganges is an international river and its basin (Figure 1.1) is distributed over four countries - China, Nepal, India and Bangladesh. The basin area of the Ganges is about 1.095 million km2, of which India has the largest share of 79% (see Table 2.1 in Chapter 2 for the details of the distribution). Bangladesh and China each share about 4% of the basin, the remaining 13% is in Nepal. The river originates at an elevation of 7,000 m in Gangotri on the Southern slope of the Himalayas. From its origin, the Ganges traverses South and 1
A barrage is a gated structure built across a river to regulate water discharge. In South Asia, barrages are primarily used to divert water into channels/canals for irrigation and sometimes to facilitate navigation. The Farakka Barrage on the Ganges River was primarily built to solve navigation problem of the Kolkata Port.
1 M. Monirul Qader Mirza (ed.), The Ganges Water Dispersion: Environmental Effects and Implications, 1–12. © 2004 Kluwer Academic Publishers. Printed in the Netherlands.
2
M. Monirul Qader Mirza
South-Eastward in India for about 2,240 km. About 18 km below Farakka, India, it forms the common boundary between Bangladesh and India. The total length of the Ganges River before emptying into the Bay of Bengal is about 2,560 km. About 451 million people (estimate based on population census of 2001) in the basin area are directly/indirectly dependent on the water and other services of the Ganges River.
Figure 1.1. The Ganges, Brahmaputra and Meghna basins (Mirza, 2003).
The hydrologic cycle and water resources of the Ganges basin are governed by the Southwest monsoon. A monsoon is defined as a seasonal shift in wind direction, being derived from the Arabic word mausim (season). In a true monsoon climate, seasonal wind shifts typically cause a drastic change in the general precipitation and temperature patterns. The onset of the Southwest monsoon in the Ganges basin is expected in June or July, depending on its location. The onset of monsoon in the Southern tip of the Ganges basin is usually in early June, and 15th July in the Northern boundary of the basin. Semi-arid to humid climates occur in various parts of the basin. Mean annual precipitation varies from 450 mm-2000 mm from West to East. About 84% of the rainfall in the basin occurs in the monsoon during June to September. The failure of the monsoon in terms of late arrival and less rainfall usually lead to inadequate water supply in the Ganges basin. Flow in the Ganges River is highly seasonal. Taking average of seasonal flow at Hardinge Bridge, Bangladesh for the pre-diversion period (1965-1974), the dry season to monsoon discharge ratio stands at 1:6 (Mirza and Dixit, 1997). Therefore, the fundamental problem of land and water resources development in the Ganges basin arises from the highly seasonal nature of the flow in the river. In addition to natural seasonality, expansion of irrigation in the upstream basin areas particularly in the Indian states of Uttar Pradesh
Effects of the Ganges Water Diversion
3
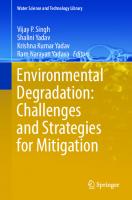
and Bihar has further constrained water availability in the dry season at Farakka. On the Ganges and its tributaries, at least 34 barrages/structures are functional in India and Nepal (Table 1.1). The actual amount of water is being diverted through these diversion structures are not known. However, as many as 400 lift irrigation points along the Ganges in the Indian states of Uttar Pradesh and Bihar siphon off water between 600 m3/sec1,100 m3/sec before the river reaches Farakka (Mirza, 2002). Therefore, available discharge in the lower reaches of the Ganges River has been declining substantially as evident from the measurements taken at Farakka (Figure 1.2). Diversion of water at Farakka through a massive barrage has caused a drastic reduction of the Ganges discharge in areas downstream of the barrage in India and in Bangladesh in the dry season (see Chapter 2 for details).
1.2
Water Diversion and Dispute Resolution: The Phases of Negotiations
A water sharing dispute arose in 1951 when India declared its intention to construct a barrage across the river Ganges at Farakka, West Bengal. The primary objective of the barrage was to divert 1,134 m3/sec (58% of the average March to May discharge of the Ganges in the dry season) to the Bhagirathi-Hooghly system in order to restore the navigability of Kolkata Port (Figure 1.1). The port had gradually lost draft due to heavy natural siltation over a long period of time (Abbas A.T., 1984). Negotiations on the sharing arrangements and their implementation, monitoring and augmentation of flow of the Ganges at Farakka have been continuing for more than 50 years. This period can be divided into eight phases as shown in Table 1.2. Over the protracted period of negotiations and diplomacy, the deadlock was broken for several times enabling Bangladesh and India to enter into one 5-year agreement, two short-term memoranda of understanding before signing a 30-year Treaty in December, 1996 (see Annex I at the end of this book).
1.3
Water Diversion and Environmental Concerns
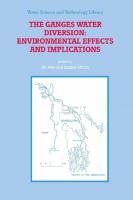
The diversion of the Ganges water at Farakka and upstream is not the only case where environmental effects in the upstream and downstream areas were reported. Freshwater is being diverted in many areas across the world and caused effects similar to the Ganges problem. The downstream effects of the Ganges water diversion include reduced surface water and ground water, increased surface and ground water salinity, agricultural loss, adverse effects on the ecosystems, changes in river morphology, reduced fishery and health effects. Figure 1.3 shows the linkages between water diversion from the Ganges and impacts in Bangladesh. The important environmental effects in the upstream areas are: increased navigability for the Kolkata Port; increased fishery in the Hooghly Estuary; and reduced migratory fisheries, and increased flooding in the upstream of the barrage. Three similar examples of water diversion and consequent environmental effects from other regions are cited below in support of the Ganges’ case.
4
M. Monirul Qader Mirza
Table 1.1. Barrages and other water diversion structures on the Ganges River system in India and Nepal
Barrage/Structure
River/Tributary
Sone Mohammedgonj Tajewala Dadupur
Dhukwan Naroa Lower Sarda Ramganga Kho Ramnagar Ahsan Girija Gomti Rishikesh Hindan Parichha Saryu Bhimgoda New Okhla Tons Madhya Ganga Suheli Mahananda Bagmati Kamala Kankai Babai Baraganga Kosi Sarda
Sone North Koel Yamuna Tributary of Yamuna Tons Chambal Yamuna and Hindan Betwa Ganges Sarda Ramganga Kho Kosi Ahsan Ghagra Gomti Ganges Hindan Betwa Saryu Ganges Yamuna Tons Ganges Suheli Mahananda Bagmati Kamala Kankai Babai Baraganga Kosi Sarda
Gandak
Gandak
Tons Kota Okhla Weir
Location
Maximum Canal Capacity (m3/sec)
India Bihar Bihar Haryana Haryana
232 85 453 382
Madhya Pradesh Rajasthan Delhi
110 * 82
Uttar Pradesh Uttar Pradesh Uttar Pradesh Uttar Pradesh Uttar Pradesh Uttar Pradesh Uttar Pradesh Uttar Pradesh Uttar Pradesh Uttar Pradesh Uttar Pradesh Uttar Pradesh Uttar Pradesh Uttar Pradesh Uttar Pradesh Uttar Pradesh Uttar Pradesh Uttar Pradesh West Bengal Nepal Nepal Nepal Nepal Nepal Indo-Nepal border Indo-Nepal border Indo-Nepal border
* 241 480 152 145 74 159 675 * 481 113 143 360 410 242 21 245 9 345 * * * * * 425 325 443
* Information is not available. Source: Central Board of Irrigation and Power (CBIP) (1981), Barrages in India, CBIP, New Delhi, India.
Effects of the Ganges Water Diversion
5
2500
Discharge (m3/sec)
2000
1949-1988
1992-1997
1500 1000 500 0 March March March April April April 1-10 11-20 21-31 1-10 11-20 21-30
May 1-10
May May 11-20 21-31
Figure 1.2. Ganges River discharge for March-May during 1949-1988 and 1992-1997 (Mirza, 2002).
The case of the Aral Sea is one of the greatest environmental catastrophes ever recorded. Humans have made use of the waters of the Aral basin for thousands of years, borrowing from its two major rivers. The Amu Darya and the Syr Darya rivers have their origin in the Pamir and Tienshan Mountains and empty into the Aral Sea where annual evaporation is about 1,000 mm. Uzbekistan, Kazakhstan, and other Central Asian states use water from the two rivers to grow cotton and other export crops in the face of widespread environmental consequences, including fisheries loss, water and soil contamination, and dangerous levels of polluted airborne sediments. While the sea had been annually receiving about 50 km3 of water in 1965, by the early 1980s this had fallen to zero. As the Aral shrank, its salinity increased, and by 1977 the formerly large fish catch had declined by over 75%. The declining sea level lowered the water table in the region, destroying many oases near its shores (Calder and Lee, 1995; World Bank, 1998). When the Snowy Mountains Scheme in Australia was completed in 1974, the diversion of water to meet agricultural and commercial interests in New South Wales and along the Murray River left very little water for the smaller streams, such as the Snowy River in Victoria. As was the practice at the time, there was little consideration of environmental needs and, as a result, the habitat and ecology of streams changed significantly. Weeds became established under reduced flow conditions and displaced natural vegetation, habitats for native fauna changed and the physical structure of rivers was altered. Other streams affected by the scheme carry increased flow, with less seasonal variation, also causing a change in the riverine environment (Barwon Water, 2001).
6
M. Monirul Qader Mirza
Table 1.2. Different phases of information sharing, discussions, negotiations, and outcomes
Phase
Issues and outcomes
Phase I (1951-1970)
Formal protest lodged by Pakistan and set the ground for information sharing, discussions on respective claims and their justifications. Construction of the barrage began in 1961.
Phase II (1972-1976)
Bangladesh and India signed a 25-year Friendship Treaty in 1972 interalia aiming at cooperation in water resources development. Construction of the barrage completed in 1974. The barrage formally commissioned in 1975 under a temporary 41-day agreement. Unilateral diversion of water began in 1976 by India. The issue was raised in the Commonwealth and United Nations (UN) by Bangladesh focusing on environmental and human cost of water diversion.
Phase III (1977-1982)
Bangladesh and India signed the first water-sharing agreement (1977-1982). Inclusion of Nepal as a third party was negotiated for augmentation. Proposal and counter proposal was tabled for augmentation and negotiation ended in a fiasco. The agreement was not renewed despite embedded provisions.
Phase IV (1982-1988)
Memoranda of Understanding (MOU) signed in 1982 and 1985 with slight modifications of the 1977 agreement. Negotiations on sharing and augmentation were re-opened. The idea of a package deal incorporating all regional rivers was floated but did not make any progress.
Phase V (1988-1992)
Unilateral withdrawal resumed. Negotiations continued but without any result.
Phase VI (1993-1995)
No dialogue between Bangladesh and India. Unilateral withdrawal of water continued. The issue was again raised in the General Assembly of the UN.
Phase VII (1996-2001)
A 30-year Treaty was signed in December 1996 with sharing arrangements significantly different from those of the 1977 agreement. Sharing arrangements failed in the first year of implementation. Indian cooperation for a barrage on the Ganges River in Bangladesh was sought.
Phase VIII (2002-
Bangladesh is proposing to review the Treaty to modify it in accordance with the provisions included aiming at inclusion of a “Guarantee clause” similar to that of the 1977 agreement and a provision for arbitration.
Effects of the Ganges Water Diversion
7
Figure 1.3. Summary of the effects of the reduced flow of the Ganges River.
The idea of draining the marshlands of Southern Iraq is not a recent concept. The delta/marsh area was probably the first region of the world where humans gained control over major rivers. Irrigation and flood protection were vital to the farmers who fed the inhabitants of the world’s first known cities built in Mesopotamia more than 5,000 years ago. The first major marsh-draining scheme was proposed in 1951 by British engineers working for the Iraqi Government. By 1993, the Iraqi Government was able to prevent water from reaching two-thirds of the marshlands. The flow of the Euphrates River has been almost entirely diverted to the Third River Canal, bypassing most of the marshes. The flow of the Tigris River has been channeled into tributary rivers, prohibiting the tributary water from seeping into the marshes. As a result, the environmental effects are thought to be irreversible with the disastrous ecological, social and human consequences for the region (Pearce, 1993; Gleick et al., 1994; Fran, 1994).
1.4
Road Map to the Book
The principal objective of this book is to document environmental effects of the Ganges water diversion on both India and Bangladesh caused by major engineering structures and other means. The book is divided into 14 chapters on the themes: introduction, hydrology, flooding, morphology, salinity intrusion, ecosystems, fishery, agriculture, international environmental law, mass media, risk assessment of water availability and sharing,
8
M. Monirul Qader Mirza
vulnerability and adaptation, augmentation and regional cooperation. Chapter 1 introduces the background of the problem and its related issues. Chapter 2 presents an analysis of effects of the diversion on the surface water of the Ganges River system in Bangladesh. Upstream basin is the only source of water for the Ganges River system in Bangladesh on which about one-third area of the country is dependent. Especially the ecologically sensitive Southwest region of Bangladesh is highly dependent on the Ganges flow which it receives through the Gorai-the major distributary. Due to upstream withdrawal in the post-Farakka period discharge is the Ganges system in Bangladesh has reduced significantly. The analysis demonstrates that in the dry season discharge is reduced as much as 50%. Variability of the discharge has increased. Peak discharge in the monsoon has also increased. An increase in water levels is also evident. In most of the cases, statistical tests applied on the discharge and water levels have significant changes. The analysis further illustrates a major change in the discharge slope of the Gorai River in the post-Farakka period. Chapter 3 presents a case study of the 1998 floods in the Malda District of West Bengal, India. It discusses recent morphological changes in the Ganges - upstream of the Farakka Barrage and an increased flooding in the Malda District. Various causes of the 1998 flood, particularly the role of Farakka Barrage are critically examined. Corrective measures are also suggested for flood control including training of ‘Ganges’ River upstream and downstream of Farakka Barrage. Chapter 4 discusses the morphological changes that occurred in the Ganges system in the post-Farakka period. Due to the lack of relevant data, it presents a qualitative assessment of sediment storage upstream of the barrage. The impact of sediment storage has been assessed from the changes of the downstream planform over the last few decades. The Gorai being a distributary, is largely influenced by the discharge, sediment transport, and the planform of the Ganges around the off-take. Previous studies and analysis of the hydro-morphology suggest that due to the combined effects of the morphological development of the Ganges around the off-take, changes of the hydraulic regime of the Ganges due to Farakka threaten the existence of the Gorai River in the future. Chapter 5 focuses on the empirical analysis of the reduction in water supply in the Southwest region of Bangladesh and increased salinity. The Southwest region of Bangladesh is largely dependent on water supplied by the Gorai River drawn from the Ganges. The empirical analysis demonstrates the relationship between discharge in the Gorai River and salinity. The analysis also determines the requirement of flow for the Ganges and Gorai Rivers to keep salinity at threshold limits. The results show that in the post-Farakka period water availability in the Ganges (subject to the Ganges and Gorai Rivers are hydrologically connected) is inadequate to maintain salinity levels recommended for agriculture, industry and domestic uses. Salinity levels have also been projected under the Ganges Water-Sharing Treaty. Chapter 6 outlines the impacts of the Farakka Barrage on the hydrology and fishery of the Hooghly Estuary. Construction of the Farakka Barrage on the Ganges River has brought
Effects of the Ganges Water Diversion
9
about a significant increase in freshwater discharge in its distributary, the Hooghly Estuary. This has naturally resulted in the major changes in the ecology of the estuary, causing modifications in the structure of its fishery resources, fishing pattern, and fish production. This chapter presents observations on salinity, plankton, bottom biota, fishery resource, and fish production in different zones of the Hooghly Estuary in the pre- and post-Farakka periods. The analysis has revealed the increased freshwater discharge has resulted in a significant decrease in salinity levels throughout the estuary. The freshwater zone has now extended to the mouth of the estuary. The true estuarine zone has moved seaward and the marine zone has been restricted to the area near the mouth of the estuary. This has resulted in major changes in plankton dynamics, sharp decline in the fisheries of marine and neritic species in the upper estuary, caused a significant increase in catch of Tenualosa ilisha and overall increase in the average annual fish landings from the estuary. Chapter 7 focuses on the ecological impacts of water diversion in the Ganges basin in Bangladesh. The Ganges basin is composed of a series of inter-dependent ecological systems. Its dynamic equilibrium has been changed due to human interventions. The decreased flow in the river as well as the increased industrial and agricultural pollutants, have degraded the instream ecosystem. The diversion of water has also caused significant changes in the floral composition in the Sundarbans mangrove forest, which is highly dependent on freshwater supplies from the Gorai River, a distributary of the Ganges. During the dry season, the Gorai is often disconnected from the Ganges River resulting in no freshwater supplies to the Sundarbans. Increased salinity has constrained the growth, survival and regeneration of mangrove plants. Salinity is a critical factor for the growth and regeneration of Heritiera fomes, and the plant species have already shown a declining trend. It is found that productivity of the mangrove ecosystem depends on a dynamic balance among freshwater flow, sedimentation, erosion and species composition. Restoration of the flow of the Gorai River will maintain the ecological gradient of the Sundarbans and ensure habitat diversity. Chapter 8 discuses the alternatives in watering the Bangladesh Sundarbans. The Sundarbans is the largest mangrove forest in the world and recently declared as a world heritage site by the United Nations Scientific, Educational and Cultural Organization (UNESCO). The forest receives freshwater from the Gorai system, which is vital for the survival of the ecosystem. The chapter contains arguments that the delivery of sufficient freshwater to restore and preserve the Sundarbans could probably be accomplished as a secondary benefit of large engineering works such as interbasin transfer from the Brahmaputra system or upbasin storage in Nepal to augment the dry season discharge of the Ganges River. However, formidable technical and social problems will arise in the design and implementation of any such schemes. Chapter 9 discusses the effects of water diversion on agriculture in the Ganges basin in Bangladesh. Agriculture in the basin contributes one-fourth of the gross domestic product of the country and supports seasonal employment for a large number of people. Climate of the Ganges basin is relatively drier than other major river basins in the region. Surface water is crucial to sustain agricultural production as it is characterized by dry climate, and a large part of the basin is susceptible to saline water intrusion. Due to the
10
M. Monirul Qader Mirza
diversion, the saline waterfront has penetrated inland causing a substantial degradation of agricultural land. Adverse effects on fisheries are also considerable. Chapter 10 examines the international legal aspects of the environmental impacts in the Ganges basin in Bangladesh caused by upstream water diversion by India. It compares pre- and post-diversion environmental situations in the basin area in Bangladesh and documents the principal environmental concerns. It also discusses how similar environmental concerns: international watercourses, bio-diversity, climate change, wetlands and desertification, etc. are addressed in the global conventions. The near absence of the environmental issues in the bi-lateral water agreements between Bangladesh and India particularly in the 1996 Ganges Water Treaty is also demonstrated, and measures to modify the 1996 Treaty in the light of international environmental conventions and laws are also suggested. Chapter 11 highlights how the environmental effects caused by the Ganges water has been documented in the print, electronic, and visual media in the co-basin countries. Until now, the media has been lagging behind in providing all the information, thus, failing to reveal the full picture and extent of the problem arising from the water diversion. The media seems to deviate from the root of the problem (i.e. its adverse environmental effects), and broadly concentrates on its political aspects. The environmental problems have not yet been fully investigated and reported in the media because of the lack of knowledge or information received or available to them. Many efforts have been made to resolve the Ganges water crisis, but so far no permanent solution has been reached. However, media professionals can contribute and facilitate in reaching a feasible solution to the Ganges problem, by creating awareness among the common mass, politicians and policy makers through creative writings. Chapter 12 analyses the vulnerability, adaptation and coping mechanisms people/ institutions adopted in the post-Farakka period mainly in Bangladesh. Due to a long period of continued diversion of water from the Ganges River in the post-Farakka period, vulnerability of the hydro-ecological systems in Bangladesh has increased. The system resiliency has significantly decreased. A field survey was carried out to assess the magnitude of vulnerability and adaptation in the Southwest region of Bangladesh. The results indicate that many farmers switched to the limited ground water exploitation to overcome the shortage of surface water. Seasonal agricultural labors switched to other kinds of non-formal economic activities. Costly surface transportation is being used as an alternative to river transportation during very low flow in the channels of the Ganges River system. The analysis shows that adaptation and coping mechanisms are no match to overcome the cost of damages caused by the diversion. Chapter 13 analyses the risks involved in the water sharing arrangement in terms of occurrences of the agreed discharge in the 1996 Ganges Water-Sharing Treaty signed between India and Bangladesh. Both countries share dry season (January to May) discharge of the Ganges River at Farakka, West Bengal, India. The sharing is divided into fifteen 10-day cycles. The Treaty is based on the discharge of the Ganges available at Farakka for the period 1949-1988, taking the average discharge values of the periods
Effects of the Ganges Water Diversion
11
1949-1973 (pre-Farakka) and 1975-1988 (post-Farakka). Since 1975, however, dry season discharge of the Ganges at Farakka has declined due to upstream uses for agriculture and economic sectors. In this situation, the likelihood of occurrence of the 1949-1988 discharge values has reduced. Statistical analysis has been carried out to examine the probability of occurrences and risks of the Treaty discharge values under 1975-1988 condition and some discharge reduction scenarios. The results indicate that reductions in the discharge due to withdrawal at the upstream of Farakka put Bangladesh and India at a risk of non-availability of the shared discharge agreed upon in the Treaty. Failure of the sharing arrangement in two out of five years (1997-2001) since the enforcement of the Treaty supports results of the analysis. Due to the sharing formula of the Treaty, Bangladesh may be at a greater risk than India in future in case of more withdrawal of water in the upstream of Farakka. Chapter 14 argues that the benefits accruable from the cooperation in the Ganges basin among the co-riparians are positive-sum and win-win for all the participants. The available studies on the Ganges-Brahmaputra-Meghna (GBM) regional cooperation conducted by BUP-CPR-IIDS process (explained in detail in the chapter), which came to be known as Track-II, as well as by others and past efforts by the governmental process, i.e. Track-I, have been reviewed to set the background and highlight the possibilities. Both prospects of and the constraints on cooperation in the basin have been identified and discussed. The adverse implications for Bangladesh of the Indian scheme of inter-linking rivers have been discussed. It has been argued that the regionally non-cooperative manner in which the scheme is being developed by India can constitute to a new, major setback for regional cooperation in the Ganges basin, indeed in the GBM region as a whole. That can be avoided only if India takes necessary steps to initiate regional consultations and forge regional agreements by making necessary adjustments to the extent that the scheme adversely affects other co-riparians. Finally, the point that has been made is in the interest of the regional countries whose leaderships should take a more positive attitude and forge cooperation taking advantage of the existing and emerging opportunities, rather than continue to ignore the opportunities or create additional constraints and let the cost of non-cooperation pile up.
References Abbas A.T., B.M.: 1984, The Ganges Water Dispute, University Press Ltd., Dhaka. Barwon Water: 2001, Water for the Environment-A Balancing Act, Fact Sheet No. 13. Calder, J. and Lee, J.: 1995, ARALSEA: Aral Sea and Defense Issues, ICE Case Studies (www.american.edu/TED/ice/aralsea.htm). Fran, H.: 1994, Iraq Since the Gulf War: Prospects for Democracy, Zed Books Ltd., London. Gleick, P.H., Yolles, P. and Hatami, H.: 1994, Water, water and peace in the Middle East: conflict over water rights, Environment 36(3), 6-22. Mirza, M.M.Q. and Dixit, A.: 1997, Climate change and water management in the GBM basins, Water Nepal 5(1), 71-100. Mirza, M.M.Q.:2003, Three recent extreme floods in Bangladesh: A Hydro-meteorological analysis, In: M.M.Q.Mirza, A.Dixit and A.Nishat (eds.), Flood Problem and Management in South Asia, Kluwer Academic Publishers, Dordrecht, the Netherlands.
12
M. Monirul Qader Mirza
Mirza, M.M.Q.: 2002, The Ganges Water Sharing Treaty: risk analysis of the negotiated discharge, International Journal of Water 2(1), 57-74. Pearce, F.: 1993, Draining life from Iraq’s marshes, New Scientist 138(1869) (April 17, 1993), 11-12. World Bank: 1998, Water and Environmental Management Project of the Aral Sea Basin Program, World Bank, Washington, D.C., USA.
2 HYDROLOGICAL CHANGES IN BANGLADESH M. Monirul Qader Mirza Adaptation and Impacts Research Group (AIRG), Institute for Environmental Studies (IES), University of Toronto, 33 Willcocks Street, Toronto, ON M5S 3E8 Canada
2.1
Introduction
The Ganges is an international river shared by China, Nepal, India and Bangladesh. With regard to the distribution of the 109.5 million hectares (ha) basin area, India shares 79%, Nepal 14%, Bangladesh 4% (this is equivalent to 32% of Bangladesh) and China 3%, respectively (Table 2.1). The river has great importance for the socio-economy of the co-basin countries. It is estimated that about 451 million people (based on 2001 census reports of China, Nepal, India and Bangladesh) are directly or indirectly dependent on the Ganges River. In the Ganges basin in Bangladesh, regular water supply from upstream is particularly needed during the dry season (November to May) for agriculture, domestic, river regulation and industrial purposes, maintaining river depths, sustaining fisheries and forestry, and keeping in check inland penetration of sea water from the Bay of Bengal. Until commissioning of the Farakka Barrage (Figure 2.1) in 1975, the river was unregulated and the supply of water in the dry seasons was adequate. The purpose of the construction of the barrage was to divert 1,134 m3/sec (40,000 ft3/sec) of water from the Ganges River to the Hooghly-Bhagirathi River (Figure 2.1) to make the Kolkata Port navigable (Abbas A.T., 1984). It is claimed that since the commissioning of the Farakka Barrage, the hydrology of the Ganges system in Bangladesh has changed significantly. The monsoon discharge in the Ganges River increases while in the dry season it decreases (Asafuddowla, 1993). The Gorai River (the principal distributary of the Ganges), which used to supply water to the Southwest part of Bangladesh, virtually dries up in the dry season. The inadequate supply of water in the Ganges system during the dry season has caused significant socio-economic impacts through disrupting agriculture, fisheries, forestry, navigation and enhancing salinity intrusion further inland from the coast (MOEF, 1995) and also relevant chapters in this book. Much of the techno-political debate over the impact of the Farakka Barrage on Bangladesh is based on general observations and anecdotal evidences rather than sound analyses of relevant data. In order to fill the knowledge gap, this chapter examines: 1) the hydrological changes that have occurred in the Ganges system (including 13 M. Monirul Qader Mirza (ed.), The Ganges Water Dispersion: Environmental Effects and Implications, 13–37. © 2004 Kluwer Academic Publishers. Printed in the Netherlands.
14
M. Monirul Qader Mirza
Ganges River and the Gorai off-take) in Bangladesh in the post-Farakka period using relevant discharge and water level data; 2) the statistical significance of these changes; and 3) siltation in the Gorai River possibly induced by the diversion of water from the Ganges River at Farakka using stage-discharge relationship and regression analysis. More details on siltation are discussed in Chapter 4. Table 2.1. Country-wide distribution of the Ganges basin
Country/State
Total geographical area of country/state (106 ha)
India Bihar Haryana Himachal Madhaya Pradesh Rajasthan Uttar Pradesh West Bengal Delhi Sub-Total Bangladesh Nepal China Grand Total
Basin area (106 ha)
17.39 4.42 5.57 44.34
14.39 3.45 0.44 19.90
34.22 29.44 8.88 0.15 170.62 14.48 14.75 122.20
11.21 29.44 7.16 0.15 86.14 4.60 14.75 4.00 109.50
Distribution (as % of the total in col. 3)
79.00
4.00 14.00 3.00 100.00
Source: Verghese and Iyer (1993).
2.2
The Ganges Basin: Hydro-Meteorological Setting
The Ganges is one of the largest river systems in the world. It rises South of the main Himalayan divide near Gangotri (elevation 4,500 m) in the Uttar Pradesh, India. The river Ganges has different names from its source of origin to the outfalls. From the origin to Devaprayag and at one of the outfalls, the river is known as Bhagirathi. Alkananda joins it at Devaprayag and the combined stream flows as the Ganga. On its way towards the sea, numerous tributaries join the Ganges River from India and Nepal (Figure 2.2). Ramganga joins the Ganges just before Allahabad, while the Yamuna joins on its right bank at Allahabad. The Chambal, the Betwa and Ken are the principal streams flowing into the Yamuna. Various important tributaries join the Ganges between Allahabad and Farakka. Tons, Sone and Pun Pun join from the right side while the left side tributaries are Gomti, Ghagra, Gandak, Buri Gandak and Kosi. The last four right side tributaries originate in Nepal and significantly contribute to the water (71% and 41% of the dry season and annual flow, respectively) and sediment discharge of the Ganges.
Hydrological Changes in Bangladesh
15
Figure 2.1. The Ganges Basin and the Farakka Barrage.
The river divides itself into two channels about 4 km below Farakka. The main left arm enters Bangladesh about 18 km below Farakka (Figure 2.1) and joins the Brahmaputra at Goalundo, while the right arm continues to flow South in West Bengal as BhagirathiHooghly on which the Kolkata Port is situated. The Mahananda from the Darjeeling District branches into two arms; the right arm joins the Ganga upstream of Farakka and the left arm flows into the Ganges soon after it enters Bangladesh. The river divides into two channels below Farakka. In Bangladesh, the Gorai River is the main distributary, which leaves the Ganges River about 65 km above the confluence of the Ganges and Brahmaputra Rivers. Throughout the course of the river, the flows of the Ganges jump suddenly from one gradient to another because of the physical nature of its basin. From its source of origin to Hardwar, it maintains a considerably higher gradient of more than 0.011. From this point, the Ganges follows a moderate gradient, say 0.001 to less than 0.00006 in Bihar. Different gradients of the river are shown in Figure 2.3. From Hardwar to Farakka, the river follows almost equal gradients. Like its gradients, the Ganges basin has a diversified climate (semi-arid to humid) from the origin to the outfall. The average annual precipitation in the basin is 1,070 mm. In India, Nepal and Bangladesh, the mean annual precipitations are 908 mm, 1,860 mm and 1,568 mm, respectively. Information on precipitation in the Chinese (Tibetan) part of the basin is not available.
16
M. Monirul Qader Mirza Ganga
Ramganga
Yamuna Chambal
Betwa
Ken Tons Go mt i Ghagra Sone Gandak Punpun Patna Buri Kosi Farakka Mahananda
Dwarka Ajay
Bangladesh
Hardinge Bridge
Damodar Go rai
Rupnarayan Hooghly
Figure 2.2. Schematic diagram of the Ganges River System.
Mean annual runoff of the Ganges River at Farakka and Hardinge Bridge is estimated to be 415 x 103 million cubic meters (mcm) and 352 x 103 mcm, respectively. These estimates are derived from the discharge data supplied by the Indo-Bangladesh Joint Rivers Commission (1995) and the Bangladesh Water Development Board (BWDB, 2002). Most of the flow occurs during monsoon months (June-September) and the ratio of dry season and monsoon flow is 1:6. Flow pattern of the Ganges at Hardinge Bridge for the typical water year (1966-1967) is shown in Figure 2.4. Among the tributaries of the Ganges, the Yamuna is the most important one and contributes about 52 x 103 mcm of water and drains about one-third of the basin. Other major important tributaries, the Ghagra (Karnali) and the Kosi, drain about 12% and 9% of the basin, respectively. Contribution from snowmelt is important for the dry season flow of the Ganges. At the high end, it has been estimated that snowmelt contributes roughly 10% of the total flow
Hydrological Changes in Bangladesh
17
generated in the Nepalese Rivers (Sharma, 1977; Gyawali, 1989). The Central Water Commission (CWC), Government of India (1988), provides a low estimate of annual snowmelt volume, 813 x 106 m3 of water annually. The volume of snowmelt water1 is only 0.053% of the mean annual flow, indeed a minor contribution (Table 2.2). The CWC (1988) estimates are based on a partial assessment and appear to be at low side compared to other West flowing Himalayan Rivers.
Figure 2.3. Approximate longitudinal profile of the Ganges River.
The river carries enormous sediment loads. The China Bangladesh Joint Expert Team (CBJET) (1991) estimated the average annual suspended sediment load to be 196 million tons, which differs from other estimates. Coleman (1969) estimated that the Ganges River carries 479 million tons of suspended sediment annually, while the Master Plan Organization (MPO, 1986) estimated about 212 million tons. The contribution of individual tributaries to the sediment supply process is not known. However, it is claimed that the Kosi alone contributes 40% to the total sediment load carried by the Ganges (Alford, 1988). The geo-physical behavior of the upstream parts of the Ganges basin distributed over India and Nepal is more complex than the lower part in Bangladesh. This is because of the complex geological structure of the Himalayas, the numerous smaller tributaries and distributaries, variable climates, the variable and complex land use patterns and basin denudation processes, the sediment supply and transport processes, and the variable nature of human interventions. All these factors influence flooding and droughts in the basin.
1
Derived from runoff at Farakka and column 6 of Table 2.2.
18
M. Monirul Qader Mirza
45000 40000 Discharge (m3/sec)
35000 30000 25000 20000 15000 10000
Mar-67
Feb-67
Jan-67
Dec-66
Nov-66
Oct-66
Sep-66
Aug-66
Jul-66
May-66
Apr-66
0
Jun-66
5000
Figure 2.4. Flow pattern of the Ganges at Hardinge Bridge. Table 2.2. Snowmelt contribution in the Ganges systems
Name of Basins
Name of Tributary
Location
Snow melt area (sq. km)
Total average snowfall (106 m3)
1
2
3
4
5
Computed snow melt run-off (106m3) (90% of Col. 5) 6
The Ganges
Yamuna Ganges Karnali Gandak
Tejewala Raiwala Treveni
1,980.00 7,965.00 8,049.00 4,421.00
161.00 480.00 123.00 92.00
145.00 432.00 111.00 83.00
Source: Central Water Commission (CWC) (1988).
Floods and droughts are very common phenomena in the Ganges basin. The former occur because of high and intense precipitation in many parts of the basin, while the latter are caused by inadequate precipitation during the dry months. The total flood-prone area in the basin in India and Bangladesh is 16.1 million ha and 2.21 million ha, respectively, or 4.9% and 15% of each country, respectively. Information on the Nepalese flood-prone area is not available. The basin is highly populated with over 451 million people of which 85% live in India and 9% in Bangladesh. The density of population (900/km2) in the basin in
Hydrological Changes in Bangladesh
19
Bangladesh is almost twice that of India. The large population of the basin largely depends on the Ganges River for food and fiber production and the supply of drinking water. About 64% of the land of the basin is cultivable, with 70% and 56% of the basin areas in India and Bangladesh, respectively (Verghese and Iyer, 1993). Because of the physiography, only 28% of the basin area is cultivable in Nepal. Among other land uses, gross forest cover in the basin is 19%. Individually India and Nepal have 15% and 43% forest cover, respectively [GOI, 1990 and His Majesty’s Government of Nepal (HMG Nepal), 1992].
2.3
The Data
The hydrological data used for this analysis have been collected from various sources. Annual (hydrological year: April-March) peak and annual mean discharge data (1934-1998) for the Ganges River at Hardinge Bridge have been obtained from the Bangladesh Water Development Board (BWDB) (2002) and the French Engineering Consortium (1989). Although the BWDB (2002) data set contains data until the year 2002, discharge data during 1999-2002 was found to be incomplete. Therefore, monthly mean, maximum and minimum discharge data (1965-1998) have been derived from the BWDB (2002) daily data set. Analysis of annual maximum and minimum, monthly maximum and minimum water levels (1965-1993) were reproduced from Mirza (1997b). For the Gorai River, daily discharge and water level data have also been obtained from the BWDB (2002) for the period 1964-1995. Then monthly mean, minimum and annual maximum discharge values have been derived. Water level data have been used for the development of stage-discharge relationships. For the Ganges River at Farakka, monthly and annual mean discharge data (1949-1988) have been received from the Global Runoff Data Centre (GDRC) (1995), Koblenz, Germany and the Indo-Bangladesh Joint Rivers Commission (JRC) (1995), Dhaka, Bangladesh. Annual peak discharge data for the Farakka point have been taken from UNESCO (1976a) and IAHS (1984). These data sets contain some missing observations. Standard procedures were followed to fill in the missing observations. One can be reasonably confident that the quality of the data used in this study is high. The BWDB data are collected and maintained by standard methods/procedures and were used for preparation of the National Water Plan (MPO, 1986), Pre-Feasibility Study for Flood Control in Bangladesh (FEC, 1989), various studies of the Flood Action Plan (FAP) (1990-1995) and the National Water Plan (2001). Water Resources Planning Organization (WARPO) of the Government of Bangladesh carries out studies and planning of water resources of entire Bangladesh based on the BWDB data. The data for the Ganges and the Gorai Rivers are used in the water sharing negotiations between India and Bangladesh. Moreover, as this study has considered mostly monthly and annual mean discharge values, the random errors in the daily data have also been averaged. Therefore, the uncertainty of the mean flow volumes over longer time periods as used in this study was considered to be much less than for the original individual daily values.
20 2.4
M. Monirul Qader Mirza Hydrologic Changes in the Ganges System
This section discusses the results of hydrological analysis2 and statistical tests (Table 2.3) applied to detect changes in hydrology in the Ganges system in Bangladesh during the post-Farakka period. Five statistical tests (F-test, Student’s T-test, Cramer’s test, Kruskal-Wallis test and Mann-Whitney U test) have been applied for the Ganges River at Hardinge Bridge and Farakka and the Gorai River at Gorai Railway Bridge. The statistical tests are described in Annex 2.1 of this chapter. The analysis includes investigation of annual peak discharge, annual maximum water level, annual minimum discharge, annual minimum water level, annual mean discharge, monthly maximum discharge, monthly maximum water level, monthly minimum discharge, monthly minimum water levels and monthly mean discharge. 2.4.1
THE GANGES RIVER AT HARDINGE BRIDGE
Non-homogeneity in the annual peak discharge is evident from Figure 2.5 during the post-Farakka period. Such changes can be introduced by a control structure across a naturally flowing river. Mean, variance, serial correlation coefficients, skewness coefficient, and other parameters may be found unstable (UNESCO, 1976b; Yevjevich, 1972). Possible changes in the peak discharge series have been examined. Pre- and post-Farakka mean annual peak discharge is found to be 48,790 m3/sec and 54,966 m3/sec, respectively. This shows that a 13% increase has occurred. The standard deviations of the two periods have been calculated as 7,299 m3/sec and 11,523 m3/sec, respectively. This indicates a 58% increase in the standard deviation which has occurred during the post-Farakka period. Non-homogeneity has been tested in two stages. First, the F-test for checking the stability of the variance has been applied and found unstable. Therefore, the t-test has not been applied to check the changes in the mean (Dahmen and Hall, 1990). Second, other statistical tests confirmed change in the mean of the two peak discharge series at the Hardinge Bridge. For comparison, statistical tests have also been applied on the peak flow series of the Ganges River at Farakka and the change was found insignificant. This indicates that possibly there is no change in the extreme rainfall events in the Ganges basin in India and Nepal. Otherwise, signs of change should be evident in the unregulated peak flow series at Farakka. Rakecha and Kumar (1994) analyzed trends in the annual extreme rainfall events of 1 to 3 days duration over India. Extreme rainfall series at most of the stations over the Ganges basin show a decrease. They considered the annual extreme rainfall for 316 stations for a period of 80 years (1901-1980). Standard statistical tests were applied to detect trend and persistence. 2
A part of the analysis was published in the Hydrological Sciences Journal 42(5), 13-31 (Mirza, 1997b). Re-analysis was carried out with data sets of extended periods. However, in some places of this article the analytical results from (Mirza, 1997b) have been reproduced with the permission of the publisher.
NS NS
Significant
Significant
NS
NS
-do-
-do-
The Ganges /Hardinge Bridge The Ganges /Farakka
NA
Significant
NA
NA
NS
NS
NS
Significant in February, March, April, May and December NA
NS
Significant
Significant in January
The Gorai /Gorai Rly. Bridge The Ganges /Farakka The Ganges /Hardinge Bridge -do-
NS - not significant. NA - not applied.
Annual Maximum Water-Level Annual Minimum Discharge Annual Minimum Water-Level Annual Mean Discharge
Annual Maximum Discharge
Monthly Mean Discharge
NS
NA
NS
The Ganges /Hardinge Bridge The Gorai/ Gorai Railway Bridge The Ganges /Farakka The Ganges /Hardinge Bridge NA
Significant
-do-
Significant in June NA
Student’s t-Test NS in June, July and August
Significant
Significant
-do-
Monthly Maximum Water-Level Monthly Minimum Water-Level
Monthly Minimum discharge
Significant in September and October NS
F-test
The Ganges /Hardinge Bridge
River/Station
Monthly Maximum Discharge
Hydrologic Parameter
NS
NS
Significant
NS
NS
Significant
Significant
NS
NS Significant
Significant
Significant in April, May, November, December, January, February and March November -June Significant NS
November -June Significant NS
Significant
Significant
NS
NS
Kruskal -Wallis Test
Significant
Significant in February, March, April, May and December November -June Significant NS
November -June Significant NS
Significant
Significant
NS
NS
Cramer’s Test
NS
NS
Significant
Significant
NS
Significant
Significant in April, May, November, December, January, February and March November -June Significant NS
November -June Significant NS
Significant
Significant
NS
Mann -Whitney U Test NS
Table 2.3. Results of the five statistical tests applied to monthly and annual hydrologic series of the Ganges at Hardinge Bridge and Farakka and the Gorai at Gorai Railway Bridge.
Hydrological Changes in Bangladesh 21
M. Monirul Qader Mirza
Pe ak Di scharge (m 3/sec)
22 80000 75000 70000 65000 60000 55000 50000 45000 40000 35000 30000 1930
1940
1950
1960
1970
1980
1990
2000
Year
Figure 2.5. Annual peak discharge of the Ganges at Hardinge Bridge (1934-1998). The series consists of pre- and post-Farakka observations. Horizontal dashed line indicates mean peak discharge of the two periods.
2.4.1.1
Annual Maximum Water Level
Although changes were detected in the peak discharge, no statistically significant changes were found in the annual maximum water levels in the post-Farakka period at the Hardinge Bridge site (Mirza, 1997b). This is perhaps due to the adjustment of the river cross-sectional area. 2.4.1.2
Annual Minimum Discharge
A significant decreasing trend is observed in the annual minimum discharge. While the inter-annual variation is high, the mean has changed by 62%. Statistical tests indicated that the changes in the mean were significant. During pre-Farakka period annual minimum discharge of 1,297 m3/sec was recorded in April 1966. In the post-Farakka period the minimum discharge was recorded at 135 m3/sec in April 1995. 2.4.1.3
Annual Minimum Water Level
The post-Farakka mean of the annual minimum water level decreased by about 18%, or by 112 cm. Figure 2.6 indicates that the situation was in early 1990s was worse than 1976 and 1977 (within box) when the Ganges water was withdrawn unilaterally. Statistical tests found that changes in the mean were significant (Mirza, 1997b).
Hydrological Changes in Bangladesh
23
Annual Minimum Water Level (m +PWD)
7.2 6.8 6.4 6.0 5.6 5.2 4.8 4.4 4.0 1965
1970
1975
1980
1985
1990
1993
Figure 2.6. Annual minimum water level of the Ganges at the Hardinge Bridge (1965-1993) (Mirza, 1997b). Reproduced with the permission of the publisher.
2.4.1.4
Annual Mean Discharge
Statistical tests of the inter-annual mean discharge series do not indicate any increasing or decreasing trend. However, while on an annual basis, the regulation has had little apparent overall effect on the mean discharge, there are large offsetting changes in seasonal discharge. As shown below, during the post-Farakka period, average dry season flow (November-May) at the Hardinge Bridge decreased by 35% while the monsoon flow (June-September) has increased by 11%. Period Pre-Farakka (1965-1974) Post-Farakka (1975-1998)
Dry Season 3,114 2,010
Mean Flow Monsoon 22,240 24,062
Annual 10,458 10,477
In the water resources planning in Bangladesh, changes in the seasonal flow are much more important than changes in the annual mean flow. For example, a reduced dry season flow means disruption in agriculture, fisheries, navigation and the possible extension of the saline water front further inland. On the other hand, excess flood water is detrimental for kharif (a cropping season spanned over April-November) crops and infrastructures. 2.4.1.5
Monthly Maximum Discharge
Analysis of the monthly peak discharge for the monsoon months (June-September) show a maximum 13% increase for the August mean peak discharge. The mean peak discharge of August increased by 10%. Although the statistical tests found these changes insignificant, they may have profound physical implications (in terms of damage) for flood management in Bangladesh. The June and July peak discharge decreased by 26% and 4%, respectively.
24
M. Monirul Qader Mirza
2.4.1.6
Monthly Maximum Water Level
Analysis of the monsoon months indicates that the June water level has decreased by 47 cm. July and August water levels both rose by 12 cm. Statistical tests found changes for all months (except June) to be insignificant (Mirza, 1997b). 2.4.1.7
Monthly Minimum Discharge
All seven months of the dry season have been analyzed. Changes in the monthly minimum discharge for January to May are shown in Figure 2.7, which shows a drastic decline during the post-Farakka period. Statistical tests have found changes in the mean significant.
%Change
2.4.1.8
Nov -26
Dec -40
Jan -47
Feb -54
Mar -59
Apr -58
May -51
Monthly Minimum Water Levels
The March water levels have changed by 17% preceded by a 14.5% change in February. All other dry months have experienced, on average, a 12% decrease. The statistical tests found the changes to be significant (Mirza, 1997b). 2.4.1.9
Monthly Mean Discharge
During the post-Farakka period, spectacular changes occurred in the monthly mean discharge and their standard deviations. Changes in the dry season flows are more pronounced than the monsoon flows as evident from the following: %Change
Jan -42
Feb -51
Mar -55
Apr -52
May -41
Jun -27
Jul 11
Aug 5
Sep 16
Oct -5
Nov -14
Dec -31
Among the seven months of the dry season, the decreases in the flows during March and April are the worst. For dry season agriculture, February and March are the most important months when adequate irrigation is required for the boro (a rice crop usually planted in November-December and harvested in April-May) and the rabi (a cropping season spanned over November-May) crops. The changes in the January-May flow are shown in Figure 2.8. Figure 2.9 shows the time-series of the monthly mean flows for February, March and April. Sharp changes in flow occurred during the two non-water sharing agreement periods (within the box) due to unilateral withdrawal of water by India. These periods were 1976-1977 and 1988-1996. For the Hardinge Bridge site, the Student’s T-test and Cramer’s test detected changes for February, March, April and May. The Kruskal-Wallis and Mann-Whitney U tests identified changes in the months of the dry season from November to May. All five tests found changes in the flow of the five monsoon months to be insignificant. For the Farakka Barrage site, statistical tests found the changes for all 12 months to be insignificant.
Hydrological Changes in Bangladesh
25
6000
Discharge (m3/sec)
5000 Pre-Farakka Post-Farakka
4000 3000 2000 1000 0 NOV
DEC
JAN
FEB
MAR
APR
MAY
Figure 2.7. Mean monthly minimum discharge of the Ganges at Hardinge Bridge.
Discharge (m3/sec)
7000 6000
Pre-Farakka
5000
Post-Farakka
4000 3000 2000 1000 0 NOV
DEC
JAN
FEB
MAR
APR
Figure 2.8. Mean monthly discharge of the Ganges at Hardinge Bridge.
MAY
26
M. Monirul Qader Mirza
3200
2000
3
Discharge (m /sec)
2600
February 1400
800
200 1965
1970
1975
1980
1985
1990
1995
2000
Year
Figure 2.9a.
2800 2400
3
Discharge (m /sec)
2000 1600 1200 March 800 400 0 1960
1965
1970
1975
1980 Year
Figure 2.9b.
1985
1990
1995
2000
Hydrological Changes in Bangladesh
27
2800 2400 Farakka Commissioned
3
Discharge (m /sec)
2000 1600 April 1200 800 400 0 1960
1965
1970
1975
1980
1985
1990
1995
2000
Year
Figure 2.9c. Figure 2.9a, b, and c. Monthly mean discharge of the Ganges for February, March, and April.
2.4.2
THE GORAI RIVER AT GORAI RAILWAY BRIDGE
During the post-Farakka period, significant changes in the Gorai discharge and aggradation of its mouth were reported. By and large, these changes are attributed to the reduced supply from the Ganges River (Nishat and Chowdhury, 1986; Khan, 1986). Changes in the monthly mean and minimum discharge, and possible aggradation in the Gorai off-take, are analyzed below. 2.4.2.1
Monthly Mean Discharge
The analysis shows that mean monthly discharge for all months but July decreased significantly during the post-Farakka period. For the seven months of the dry season, changes in the Gorai River discharge are relatively higher than those for the Ganges River. The discharge starts to decrease in October and continues up to April. The worst month is April when the discharge decreased by 77%, followed by 72% and 57% for March and May, respectively. The December-February change is on average 67% (Figure 2.10). As soon as India began diversion at Farakka, the discharges of the Ganges and particularly, the Gorai River dropped sharply. In March 1977 discharge in the Gorai River came down from a pre-Farakka mean of 190 m3/sec to 51 m3/sec, a 73% decrease, which undoubtedly was due to the diversion effect.
28
M. Monirul Qader Mirza 800
Discharge (m3/sec)
700 600 Pre-Farakka 500
Post-Farakka
400 300 200 100 0 NOV
DEC
JAN
FEB
MAR
APR
MAY
Figure 2.10. Dry season (November-May) mean monthly discharge of the Gorai.
After the signing of the 1977 Water Sharing Agreement on the Ganges, the situation improved slightly. Since the expiry of the second memorandum of understanding (1985 MOU) in 1988, however, dry season flow of the Gorai started to drop sharply once again with decreases in the Ganges River discharge. Available data demonstrates that in the third week of December 1992, the Gorai River dried up completely. This situation repeated in the following dry seasons until the mouth of the river was opened by extensive dredging works (see Chapter 12 on vulnerability and adaptation for the Gorai River restoration program). Recent hydro-morphological situation of the Gorai River is discussed in Chapter 4. 2.4.2.2
Monthly Minimum Discharge
The seven months of the dry season show significant changes. The November, April and March discharge dropped by 57%, 77% and 72%, respectively. Changes in other months are between 57% to 69% (Figure 2.11). 2.4.2.3
Change in the Stage-Discharge Relationship
In the Gorai River at Gorai Railway Bridge, changes have occurred in the stage discharge (Q-H) relationship during the post-Farakka period. Rating curves for three pre- and post-Farakka years have been plotted (Figure 2.12). It is evident that there is an upward shift in the rating curves for 1984/1985 and 1992/1993 when compared to 1974/1975. Changes are more pronounced in the lower tails and the middle sections. The analysis indicates aggradation in the Gorai River, and that for a given discharge; water level is now higher compared to the pre-Farakka condition.
Hydrological Changes in Bangladesh
29
800
Discharge (m3/sec)
700 600 Pre-Farakka 500
Post-Farakka
400 300 200 100 0 NOV
DEC
JAN
FEB
MAR
APR
MAY
Figure 2.11. Dry season (November-May) mean monthly minimum discharge of the Gorai.
Figure 2.12. Stage-discharge relationships for the Gorai for 1974/1975, 1984/1985 and 1992/1993 (Mirza, 1997b). Reproduced with the permission of the publisher.
30
M. Monirul Qader Mirza
For a further check regarding aggradation, a possible shift in the relationship between peak discharge for the Ganges River at the Hardinge Bridge and that of the Gorai has been investigated. Selected periods are 1965-1974 (pre-Farakka) and 1975-1995 (post-Farakka). The fitted regression lines are shown in Figure 2.13. Pre- and post-Farakka annual peak discharge at Hardinge Bridge explained 57% and 72% of the variation of the Gorai peak 4 discharge, respectively. The adequacy of the regression equations was checked. 9500
3
Gorai Peak Discharge (m /sec)
8500 Pre-Farakka
7500 6500
Post-Farakka 5500 Pre-Farakka
4500 3500 25000
Post-Farakka
35000
45000
55000
65000
75000
85000
3
Ganges Peak Discharge (m /sec)
Figure 2.13. Regression relationships between pre- and post-Farakka annual peak discharge at Hardinge Bridge for the Ganges and Gorai at Gorai Railway Bridge. For the pre-Farakka period, y = -846 + 0.15x (R2 = 0.57, F1,8 = 3.28, p < 0.011). For the post-Farakka period y = 1187.6 + 0.091x (R2 = 0.72, F1,18 = 47, p < 0.000002).
The regression equations clearly demonstrate changes in the slope. During the post-Farakka period, the slope has become flatter compared to the pre-Farakka period. This means that, for a given peak discharge at the Hardinge Bridge, the corresponding peak discharge for the Gorai River is now lower compared to the pre-Farakka period. In the post-Farakka period the mean peak discharge of the Gorai River has decreased by slightly over 3% (Figure 2.14). This further indicates that the Gorai River is aggrading due to sediment deposition, which results from decreasing inflow from the Ganges into the Gorai River. It may be argued that the reduced discharge in the Ganges and Gorai Rivers might have been caused by natural factors. Since precipitation is the main factor that causes
4
The adequacy of the regression equations were checked by examining t-values, F-ratios, pattern of residual plots and testing normality of the residuals by the Shapiro-Wilk Test (Cook and Wesberg, 1982).
Hydrological Changes in Bangladesh
31
Discharge (m3/sec)
year-to-year variation in the river discharge, a decrease in precipitation in the upstream drainage basin in India and Nepal is one possible explanation. Mirza et al. (1998) analyzed precipitation records for 10 meteorological sub-divisions within the Ganges basin in India for the period 1871-1994 and 66 stations in Nepal for 1971-1990 and could not identify any significant increasing or decreasing trend (the only exception is the East Madhaya Pradesh which showed slight decreasing trend). Therefore, decreases in mean discharge in the Ganges and the Gorai Rivers should not be attributed to precipitation changes.
9000 8500 8000 7500 7000 6500 6000 5500 5000 4500 4000 1960
1965
1970
1975
1980
1985
1990
1995
2000
Year
Figure 2.14. Annual peak discharge of the Gorai at Gorai Railway Bridge (1965-1995). The series consists of pre- and post-Farakka observations. Horizontal line indicates mean peak discharge of the two periods.
2.5
Conclusions
The analysis suggest that the diversion of water at the Farakka Barrage has caused significant hydrological changes in the dry season discharge of the Ganges system in Bangladesh. Flow regulation by the barrage has induced non-homogeneity in the annual peak flow of the Ganges River in Bangladesh. The statistical tests found most of the hydrological changes significant. The diversion also accelerated the siltation of the Gorai River. The reduced flow in the Ganges system has potentially wide-ranging socio-economic and environmental implications for Bangladesh. For examples, in recent years, extreme low flow in the Gorai River in the dry months has appeared to exacerbate the intrusion of saline water to the inland-most parts of the Southwest part of Bangladesh (Khan, 1993). Reductions in discharge and water quality have significant implications in a number of sectors in Bangladesh and are discussed in Chapter 4,5,7, 8 and 9.
32
M. Monirul Qader Mirza
Annex 2.1. Statistical Tests Applied for the Analysis
The parametric Student’s T-test has been applied only when the variance is found stable (Dahmen and Hall, 1990). The purpose of selecting non-parametric tests is that in many cases parametric tests cannot identify the changes (Sprent, 1989). Null hypothesis and alternative hypothesis have been formulated. Data normality has been checked by applying Kolmogorov-Smirnov one sample test (Essenwanger, 1985). In two cases, monthly maximum water-level for July and monthly minimum discharge for January have not found to be normal. Therefore logarithmic transformation has been made. Critical values for two-sided probability have been used in all the five tests with 0.05 significance level. The five statistical tests applied in the analysis are described below. (i) The F-test (Dahmen and Hall, 1990 and UNESCO, 1976b): This test is applied to check stability of the variance. The test statistic is
Ft =
σ 1 2 s1 2 = σ 2 2 s2 2
2.1
where s2 is the variance. Sample standard deviation s can be computed as: n ª n º 2 x − ( ) ( ( xi )) 2 / n » ¦ «¦ i i =1 » s = « i =1 n − 1 « » « » ¬ ¼
0.5
2.2
where xi is the observation, n is the total number of data in the sample. The null hypothesis is that variance of the splitted sample are equal. (ii) Student’s t-test (Salas et al., 1980): The classical t-statistic is used for testing whether the difference in two means x1 and x 2 for the period 1 and 2 is significant, that is
x1 − x 2
t= s
n1 + n2 n1 . n2
2.3
with n1
s=
¦ (x i =1
n2
− x1 ) + ¦ ( x j − x 2 ) 2 2
i
j =1
n1 + n2 − 2
2.4
Hydrological Changes in Bangladesh Null hypothesis is rejected if | t | > t1-α/2,
33
n1 + n2 − 2
(iii) Cramer’s test (WMO, 1966). This test is applied to examine the stability of a record in terms of a comparison between the overall mean of an entire record and the means of certain parts of the record. To apply Cramer’s test, let x and s be defined respectively as the mean and the standard deviation of the entire record of N observations. That is, let 2.5
N
x Σ x= i=1
i
N
N
s=
Σx i=1
N
√
2
i
(x)
2
2.6
Further, let xk be defined as the mean of the sub-period of n values, to be compared with
x, namely k+n
xk =
Σ
xi n i = k+1
2.7
xk – x s
2.8
Defining
Tk =
n (N – 2) tk = 2 N – n(1 + Tk )
0.5
* Tk
2.9
The statistic t k is distributed as “student’s” t with (N-2) degrees of freedom. This test can be repeated for any desired number and choice of sub-periods in the whole record. (iv) Kruskal-Wallis test (Coshall, 1989). This test is applied for determining equality of sub-sample means. For this test the time series data is divided into m sub-samples with
34
M. Monirul Qader Mirza
lengths
n j (j = 1, 2,..., m) and Rij is the rank of the ith observation of the jth sub-sample in
the ordered complete sample. The test statistic is 2
m R 12 j H= − 3( N + 1) ¦ N ( N + 1) j =1 n j
2.10 m
where, R is the total ranks in the jth sub-sample, i.e. R = ∑ R , and N = ¦ n j
j
ij
sample size. When ties are involved in the ranking procedure,
1–
j =1
j
is the total
H is divided by:
ΣT 3
N –N where T = t3 - t and t is the number of tied observations in a tied group of scores. Under the null hypothesis, for larger nj the statistic follows the Chi-square distribution with (m-1) degrees of freedom. The Kruskal-Wallis test can also be used for multiple comparisons. Dunn (1964) offered a method of conducting multiple comparisons associated with the Kruskal-Wallis test. By this method it is concluded that the effects of treatments U and V, denoted by tu and tv are unequal if:
( Ru − Rv ) ≥ zb
where
β=
α m(m − 1)
,
N ( N + 1) 12
1
1 nu + nv
2.11
zb is a standard normal variable.
If the m sample sizes are equal n1 = n2 = ...........nm = n say, then for small n it is decided that the treatment effects of tu and tv are unequal if |(Ru -Rv)| ≥ y (α, m, n). For larger, but equal sample sizes, Miller (1966) suggested that tu ≠ tv if:
|(Ru -Rv)| ≥ q (α, m)
m(nm + 1) 12
2.12
where q (α, m) is the upper α percentile of the m independent normal variables.
Hydrological Changes in Bangladesh
35
(v) Mann-Whitney U test (Kite, 1988; Essenwanger, 1985). This test is suggested for determining progressive change in the mean value with time. If two sub-samples are not well mixed and the entire sample is ranked, the elements of one sub-sample display relatively low rank numbers while those of the other display relatively high rank numbers. The test statistic U, reflects the low value arising when the sub-samples are not well mixed. Therefore, if the observed U value is less than a certain critical value Ucr, the hypothesis that there is no location difference between the sub-samples is rejected. The test statistic is calculated as the smaller of U1 and U2 where
U 1 = n1n2 +
n1 (n1 + 1) − R1 2
2.13
and
U 2 = n1n2 − U 1
n1 = size of the first sub-sample, n2 = size of second sub-sample, R1 = sum of ranks attributed to members of the first sub-sample in the ranks total sub-sample. When both sub-samples are larger than 20, U is approximately normally distributed with mean n1n2/2 and standard deviation The test statistic
Z is calculated as: n1n2 2 n1n2 (n1+ n2 +1) 12
√
n1n2 (n1+ n2 +1) 12
U−
Z =
√
2.14
The Mann-Whitney test is based on a continuous distribution and if tied observations are encountered a correction must be made. If t is the number of observations tied for a given rank and T = 1/12 (t3 - t) then the Z statistic is
n1n2 2 3 n1n2 (N − N− 2 N(N+1) √ U−
where
N = n1+ n2 , and
ΣT )
2.15
ΣT is the sum of T’s over all groups of tied observations.
36
M. Monirul Qader Mirza
References Abbas A.T., B.M.: 1984, The Ganges Water Dispute, University Press Limited, Dhaka. Alford, D.: 1988, Water Resources and Development at ICIMOD: A Discussion Paper, Unpublished Report, ICIMOD, Kathmandu. Asafuddowla, M.: 1993, Farakka Issue. International Farakka Seminar, October 10, Columbia University, New York. Bangladesh Water Development Board (BWDB): 2002, Discharge and water level data for the Ganges River at Hardinge Bridge and Gorai River at Gorai Railway Bridge, Dhaka. Bangladesh Nepal Task Force on Flood Control: 1990, Report on Flood Mitigation Measures and Multi-purpose Use of Water Resources, His Majesty’s Government of Nepal and Government of Bangladesh, Kathmandu and Dhaka. Bruijnzeel, L.A. and Bremmer, C.N.: 1989, High-Lowland Interactions in the Ganges Brahmaputra Basin: A Review of Published Literature, International Centre for Integrated Mountain Development (ICIMOD) Occasional Paper No. 11, ICIMOD, Kathmandu. Central Water Commission (CWC): 1988, Water Resources of India, CWC, New Delhi, India. China-Bangladesh Joint Expert Team (CBJET): 1991, Study Report on Flood Control and River Training Project on the Brahmaputra River in Bangladesh, Vol. 1 and Vol. 2, Government of Peoples Republic of China and Government of Bangladesh, Beijing and Dhaka. Coleman, J.M.: 1969, Brahmaputra River: channel processes and sedimentation, Sedimentary Geology 3(2/3), 129-239. Cook, R.D.and Wesberg, S.: 1982, Residuals and Influence in Regression, Chapman and Hall, New York. Coshall, J.: 1989, The Application of Nonparametric Statistical Tests in Geography, University of East Anglia, U.K. Dahmen, E.R. and Hall, M.J.: 1990, Screening of Hydrological Data: Tests for Stationarity and Relative Consistency, ILRI Publication No. 49, The Netherlands. Dunn, O.J.: 1964, Multiple comparisons using rank sums, Technometrics 6, 241-252. Essenwanger, O.M.: 1985, World Survey of Climatology. General Climatology 1B. Elsevier. Amsterdam. Flood Plan Coordination Organization (FPCO): 1993. FAP 24 River Survey Project: Hydrological Study-Phase I, FPCO, Dhaka. French Engineering Consortium (FEC): 1989, Prefeasibility Study for Flood Control in Bangladesh. Vol.4: General Development Scheme, FEC, Paris. Global Runoff Data Centre (GRDC): 1995, Discharge data for the Ganges at Farakka, GRDC, Koblenz, Germany. Government of India (GOI): 1990, State of Forest Report 1989, Ministry of Environment and Forest (MOEF), New Delhi. Gyawali, D.: 1989, Water Resources in Nepal, East-West Centre, Hawaii, USA. His Majesty’s Government of Nepal (HMGN): 1992, National Report on United Nations Conference on Environment and Development (UNCED): Nepal, HMG Nepal, Kathmandu. IAHS: 1984, World Catalogue of Maximum Observed Floods. IAHS-AISH Publication, No. 143, IAHS-AISH Press, Wallingford, U.K. Indo-Bangladesh Joint Rivers Commission (JRC): 1995, Discharge data for the Ganges at Farakka, JRC, Dhaka. Khan. A.H.: 1993, Farakka Barrage: Its Impact on Bangladesh-An Overview, unpublished paper, Dhaka. Khan, T.A.: 1986, The Water Resources Situation in Bangladesh. In: Mohammed Ali, George E. Radosevich and Akbar Ali Khan (eds.), Water Resources Policy for Asia, Balkema, The Netherlands. Kite, G.W.: 1988, Frequency and Risk Analysis in Hydrology. Water Resources Publications. Colorado, USA.
Hydrological Changes in Bangladesh
37
Master Plan Organization (MPO): 1986, National Water Plan, MPO, Ministry of Irrigation, Water Development and Flood Control, Dhaka. Miller Jr, R.G.: 1966, On the asymptotic efficiency of certain nonparametric two-sample tests, Annals of Mathematical Statistics 27, 514-522. Ministry of Environment and Forest (MOEF): 1995, National Environment Management Plan: Main Report, MOEF, Dhaka. Mirza, M.M.Q.: 1997a, Modelling the Effects of Climate Change on Flooding in Bangladesh, Unpublished PhD Thesis, International Global Change Institute (IGCI), University of Waikato, Hamilton, New Zealand. Mirza, M.M.Q.: 1997b, Hydrological changes in the Ganges system in Bangladesh in the post-Farakka period, Hydrological Sciences Journal 42(5), 13-31. Mirza, M.M.Q. Warrick, R.A., Ericksen, N.J., Kenny, G.J.: 1998, Trends and persistence in precipitation in the Ganges, Brahmaputra and Meghna basins in South Asia, Hydrological Sciences Journal 43(6), 845-858. Nishat, A. and Chowdhury, S.K.: 1986, Water Quality: problems and needs for integrated control in Bangladesh. In: Mohammed Ali, George E. Radosevich and Akbar Ali Khan (eds.), Water Resources Policy for Asia, Balkema, The Netherlands. Rakhecha P.R. and Kumar, S.M.: 1994, Trends in the annual extreme rainfall events of 1 to 3 day duration over India, Theoretical and Applied Climatology 48, 227-237. Salas, J.D, Delleur, J.W., Yevjevich, V. and Lane, W.L.: 1980, Applied Modeling of Hydrologic Time Series. Water Resources Publications. Colorado, USA. Sharma, C.K.: 1977, River Systems of Nepal, Sangeeta Sharma, Kathmandu. Sprent, P.: 1989, Applied Nonparametric Statistical Methods, Chapman and Hall, New York. UNESCO: 1976a, World Catalogue of Very Large Floods, UNESCO, Paris. UNESCO: 1976b, Floodflow Computations: Methods Compiled from World Experience, UNECSCO, Paris. Verghese, B.G. and Iyer, R.R.: 1993, Converting Water into Wealth: Harnessing the Eastern Himalayan Rivers, Konark Publishers, New Delhi. Yevjevich, V.: 1972, Stochastic Process in Hydrology, Water Resources Publications, Fort Collins, USA. World Meteorological Organization (WMO): 1966, Climatic Change, Technical Note No. 79, WMO, Geneva.
3 ROLE OF FARAKKA BARRAGE ON THE DISASTROUS 1998 FLOOD IN MALDA (WEST BENGAL)1 S.K. Mazumder Intercontinental Consultants and Technocrats Pvt. Ltd. A-8 GreenPark New Delhi-110 016 India
3.1
Introduction
The Farakka Barrage (Figure 3.1 and Box 3.1) was constructed in 1971 across the mighty river Ganga (Ganges) to divert part of the main river flow from Ganga to its tributary, the Hooghly (Figure 3.1). With gradual silting of the Hooghly off-take near Jangipur in the Murshidabad District of West Bengal, upland discharge to the Hooghly was being reduced drastically (Mookerjea, 1974). The problems of the Hooghly are high salinity, heavy siltation, poor navigability and the increasing frequency and intensity of tidal bores (Abbas A.T., 1984). Depth of the Hooghly was reduced due to the deposition of sediments carried by the high tides from the Bay of Bengal. Accelerated sedimentation, usually observed in the zone of saline and freshwater interface, has very high spatial and temporal variation. Annual dredging costs increased to Rs. 315 million (unadjusted) in 2001 from Rs. 75 million in 1973 to permit the navigability of the river where the port of Kolkata is situated (The Hindu, 2001). Model studies at Central Water and Power Research Station (CW and PRS), Pune, as well as at River Research Institute, West Bengal, were carried out to determine the amount of Ganga flow that must be diverted to the Hooghly for flushing out the sediments and restoring its navigability. From these model studies as well as some analytical studies conducted by the hydraulic experts Dr. Hansen from Germany and Engineer Joglekar from India, it was finally decided to divert 1,134 m3/sec (40,000 ft3/sec) of flow. Accordingly, the Farakka Barrage and the feeder canal linking the Ganga with the Hooghly River were constructed at an approximate cost of Rs. 2,000 million (1971 price). Before 1971, the main flow of the Ganga between Farakka and Rajmahal (Figure 3.1) was more or less straight. After the completion of the barrage, the Ganga River upstream of Farakka started shifting gradually towards the Eastern bank towards Malda due to the deposition of sediments on the Western right bank. With the Farakka Barrage at the center,
1
This Chapter was presented in the 8th ICID International Drainage Workshop held in New Delhi, India during 31 January-4 February, 2000. Re-printed with the permission of the International Commission on Irrigation and Drainage (ICID). During the editing process some additional information has been incorporated where necessary.
39 M. Monirul Qader Mirza (ed.), The Ganges Water Dispersion: Environmental Effects and Implications, 39–48. © 2004 Kluwer Academic Publishers. Printed in the Netherlands.
40
S.K. Mazumder
Figure 3.1. Map of Malda District.
the river is developing a typical meander pattern. Upstream of the barrage, it is meandering towards Malda. Downstream of the Barrage it is meandering towards Murshidabad on the opposite Western bank. Being located on the outer side of the meanders, both districts of Malda (upstream) and Murshidabad (downstream) are subjected to devastating erosion (Bandyopadhayay, 1999; Lok Sabha Proceedings, 2003). Both the districts have highly
Farakka Barrage and 1998 Flood in Malda
41
fertile agricultural lands and are considered to be granaries of food for West Bengal. Apart from the loss of these agricultural lands due to erosion, there are also occasional floods that cause damage to the standing crops. In August 1998, the river breached the marginal and afflux embankments upstream of Farakka Barrage causing a disastrous flood in the Malda District. About 2.1 million people out of a total population of 26 million in the district were affected. It also inflicted significant human and economic damage (Section 3.2).
Box 3.1. Salient Features of Farakka Barrage
Length of the barrage Design flood discharge Maximum flood level (u/s) Maximum flood level (d/s) Bed slope of river Clear waterway Total nos. of spillway gates (10.3 m x 6.1 m) Total nos. of river sluices (10.3 m x 7.625 m) Total nos. of scouring sluices (10.3 m x 7.625 m) R.L. of spillway crests Pond level of Farakka reservoir R.L. of sluice crests Total catchment area of the Ganga River u/s of Farakka Average annual runoff at Farakka Average annual sediment load at Farakka Length of Feeder canal Length of marginal embankment Length of afflux embankment Total number of spurs on marginal embankment
-
2,246 m 70,930 m3/sec 26.1 m 25.6 m 1 in 21,000 1,995 m 84 12 12 15.86 m 21.9 m 14.03 1,051,404 km2 1,082,946 mcm 1,667 x 10 6 tons 26 km 25 km 25 km 24 nos
Plan view of Farakka Barrage showing the Weir bays, river sluices, under sluices and Western Feeder Canal is given in Figure 3.2.
The main objective of this chapter is to analyze the various causes of the 1998 flood in Malda and examine the particular role that the Farakka Barrage played in this disastrous flood. In recent years floods have become an important natural hazard in West Bengal (Box 3.2). It is of utmost importance to control the river Ganga both upstream and downstream of the barrage to arrest erosion. Otherwise, the river may outflank the barrage upstream to join Mahananda River, which will wash out a large part of the Malda District, National Highway No. 34, and the railway linking Northeast of India with the rest of the country. Similarly, uncontrolled erosion on the downstream side of Farakka may result in the destruction of the feeder canal, national highway and the railway. It will also affect the Ganges which joins the Hooghly River, and will cause a disaster for West Bengal and Bangladesh. Considering the national importance of the project, it is desirable that the Central Government, which is
42
S.K. Mazumder
maintaining and operating the barrage, should take responsibility2 of training the river upstream and downstream of the Farakka Barrage.
Box 3.2. Flood problem of West Bengal
West Bengal has 37,660 km2 of flood-prone area spread over 111 blocks, while the total geographical area of the state is 88,752 km2. An analysis of the statistics of flood that occurred during 41 years (1960-2000) shows that in only five years the state has not faced severe flood (Table 3.2). The total devastated area exceeded 20,000 km2 in 4 different years and a flood of medium magnitude (between 2,000 km2 and 10,000 km2) occurred on 15 occasions.
3.2
Brief Description of the Flood
On July 21, 1998, the newly constructed fifth retired embankment near Gopalpur village in the Manikchak sub-division of Malda (Figure 3.1) was breached resulting in the flooding of several blocks in Manikchak. There was a heavy rainfall in the catchment areas of West Bengal between Ganga and Mahananda. The recorded maximum rainfall was 418 mm in 48 hours (August 24 and 25, 1998). Water levels in both the rivers Ganga and Mahananda (Table 3.1) (Rupantarer Pathe, 1998) were steadily rising. On August 25, the afflux bundh was breached near the village of Narasinghkuppa in the Malda District. Due to the above breaches, the swollen Ganga waters entered the Malda District. Due to the rise in water levels in both Mahananda and Ganga simultaneously, there was drainage congestion. The tributaries (Fulahar, Kalindri, Pagla, etc.) of the river (Figure 3.1) did not perform their intended task. Instead of draining the runoff from the intervening catchment, they started carrying the floodwaters of the Ganga and Mahananda Rivers to Malda. The standing depth of water from August 25 to September 13 varied from 2 m to 5 m. Damages had occurred earlier due to the breach in flood embankments, especially in 1996. But the flood damage of 1998 was unprecedented. It affected 2.1 million people in the Malda District, 450 people died during and after the flood, 250 cattle were lost, 200,000 houses were totally destroyed, 150,000 houses were damaged, and standing crops in 150,000 hectares were destroyed. The estimated cost of damages of the 1998 flood in Malda was about Rs. 10,000 million (about US$ 250 million at 1998 price).
2
The Central Government of India has recently stepped up and allocated some resources for undertaking erosion control measures. More on this issue is discussed in Chapter 12 on vulnerability and adaptation.
Farakka Barrage and 1998 Flood in Malda 3.3
Causes of Flood and Role of Farakka Barrage
3.3.1
RISE IN HIGH FLOOD LEVEL
43
The principal cause of the 1998 flood was the unprecedented rise in high flood level upstream of the Farakka Barrage (Table 3.1), and the consequent breaching of the flood embankments. The peak discharge in the river Ganga was 75,929 m3/sec, which exceeded all previous records (MWR, 2000). The recorded highest flood level in the Ganga was 26.656 m on September 7 (compared to the designed maximum permissible R.L. of 26.1 m). Afflux and marginal embankments are designed for a maximum afflux of 0.5 m, i.e. the difference between the highest flood levels at upstream (26.1 m) and at downstream (25.6 m). The actual afflux in 1998 was approximately 1 m (26.565 m-25.600 m) i.e. 0.5 m higher than the design afflux. An afflux occurred due to the lateral and vertical constriction of waterways in the barrage and the consequent head losses upstream and downstream of the structure. Had there been no barrage, there would have been very little afflux. 3.3.2
UNOPERATIONAL SPILLWAY GATES
It is reported that a large number of spillway gates on the left bank (Malda side) are non-operational due to heavy siltation on the left side of the barrage upstream. As the river swings from left to right towards the feeder canal (Figure 3.2) upstream of the barrage, the left side of the barrage (on the inner side of the bend) receives the sediments. Figure 3.2 shows the shoaling immediate upstream and downstream of the barrage and the course of the mainstream in the vicinity of the barrage. The more the number of gates become non-functional, the more of the will of waterways will be contracted, resulting in more head losses and greater afflux upstream. 3.3.3
DEPOSITION OF SEDIMENTS UPSTREAM OF BARRAGE
The average annual incoming sediment load that the Farakka withstands is estimated to be 1,667 x 10 6 tons. Before the barrage construction, these sediments used to pass downstream. After the barrage construction, however, most of the incoming sediments are deposited in the reservoir upstream due to the backwater effect. Although there are 12 silt excluders and 12 river sluices near the head regulator (Figure 3.2), their effect is limited to a very small reach near the barrage. As a result, vast amounts of sediments are deposited every year upstream beyond the area of influence of the sluices. In the dry months, the flow available after diversion is insufficient to flush out the sediments deposited upstream. It is natural, therefore, that the bed level of the Ganga River has risen upstream of the Farakka Barrage, resulting in a further rise in the High Flood Level (HFL). Like all other barrages (CBI & P, 1989), the Farakka Barrage has caused aggradation of the river upstream of the barrage, requiring protection of the bank through construction of the embankments. Both the marginal and afflux embankments (upstream of the Farakka Barrage) were constructed to protect the Malda District from the aggravating Ganga River floods. Since the district Malda lies towards the downward slope at a lower elevation, being located on the outer (concave) side of the meandering river, the marginal embankment is subjected to erosion action of the river.
Date Ganga Mahananda
Month
Date Ganga Mahananda
Month
8 26.545 24.560
30 26.185 23.570
9 26.445 24.600
31 26.205 23.610
August
10 26.335 24.650
1 26.245 23.660
3 26.315 23.730
11 26.205 24.640
12 26.005 24.560
September
2 26.265 23.680
13 25.785 24.440
4 26.425 24.050
September
Table 3.1. Water Level (m + PWD) in Ganga and Mahananda Rivers during 1998 Flood
14 25.505 24.280
5 26.525 24.210
15 24.955 23.880
6 26.565 24.380
25.300 23.500
Danger Level
7 26.545 24.470
44 S.K. Mazumder
Farakka Barrage and 1998 Flood in Malda
45
Table 3.2. Area flooded and years of occurrence in West Bengal
Flood Affected Area (km2)
Flooding Year
Below 500
1985, 1989, 1992, 1994 and 1997
5
Between 500-2,000
1962, 1963, 1964, 1965, 1966, 1972, 1975 and 1996
8
2,000-5,000
1960, 1961, 1967, 1969, 1970, 1974, 1976, 1980, 1981 and 1982
10
5,000-10,000
1973, 1977, 1993, 1995 and 1998
5
10,000-15,000
1968, 1979, 1983, 1990 and 1999
5
15,000-20,000
1971, 1986, 1987 and 1988
4
Above 20,000
1978, 1984, 1991 and 2000
4
Total No. of Years
Source: Government of West Bengal, 2003.
Figure 3.2. General layout of the Farakka Barrage and shoaling.
3.3.4
DRAINAGE CONGESTION IN MALDA BASIN
The normal mean monsoon rainfall in the Malda District is about 1,115 mm. In 1998, the total rainfall during the monsoon months was 1,321 mm (206 mm above normal rainfall). The highest intensity of rainfall was 418 mm in 48 hours during August 24-25, 1998. The runoff resulting from the rainfall in the catchment area lying between Ganga and Mahananda (Figure 3.1) is usually drained into the Ganga and Mahananda Rivers through their tributaries Fulahar, Kalindri, Pagla and other drainage channels. Due to the simultaneous rise in water levels in Ganga and Mahananda (Table 3.1), there was drainage congestion.
46
S.K. Mazumder
Instead of draining the runoff from the catchment area, these tributaries were carrying the floodwaters from Ganga and Mahananda in the reverse direction due to the absence of sluice gates at their outlets. The combined flood flow of the rivers and the natural runoff from the intermediate catchment caused the disastrous flood, which lasted for about two weeks (August 23-September 13, 1998). Until the flood levels in the Ganga and Mahananda were lowered and the tributaries and drainage channels started normal functioning, almost the entire district of Malda was submerged with flood waters having depths varying from 2 m to 5 m. 3.3.5
MEANDERING OF GANGA UPSTREAM AND DOWNSTREAM OF FARAKKA BARRAGE
Being in the alluvial flood plain with a mean peak flow of 56,543 m3/sec and a bed slope of 1 in 21,000 (Figure 3.3), the Ganga has been a meandering river (Valentine and Shakir, 1992). It is reported to have caused erosion of both of the banks even in the pre-barrage stage. However, the stretch of the river in between Rajmahal and Farakka was more or less straight. After the construction of the barrage several Chars (sandbars) have formed upstream of the barrage owing to deposition of the sediments in the backwater reach. Bhutni Diara (Figure 3.1) is one such Char formed near the confluence of Fulahar with Ganga upstream of Rajmahal. The main Ganga has now shifted towards the Western side of Bhutni Diara forming a meander. Since this meander is towards the right bank, the following meander is on the left side towards Manikchak/Malda. A meandering river erodes the bank on the outer (concave) side of the bend and the eroded materials are deposited on the inner (convex) side (Garde and Raju, 1985). Figure 3.1 shows that a new Char is forming just upstream of the barrage in the inner (Western) side of the river. With the Farakka Barrage at the center, the river Ganga is developing a new meander (Mazumder and Sen, 1991) with Malda on the outer side of the upstream bend and Murshidabad on the outer side of the downstream bend. It is mainly due to this meandering tendency (Mazumder, 1993) of the river that the districts of Malda and Murshidabad in West Bengal have been subjected to the unprecedented erosion after the barrage construction. Unless the growth of the new Char just upstream of Farakka is arrested (either by dredging or by flushing), the river Ganga will move further towards the Malda side by eroding the banks and the embankments. 3.3.6
BREACHING OF MARGINAL AND AFFLUX EMBANKMENTS
As shown in Figure 3.1, marginal and afflux embankments were constructed on the left bank of the Ganga River in order to protect the lives and life and properties of the people living in the Malda District. But the embankments have been breached almost every year due to the erosive action of the river in its meander reach. So far five retired embankments have been constructed near Manikchak around the breached bank. Also, 24 tranverse spurs have been constructed for the safety of the marginal bundh (Figure 3.1). Four spurs (Nos. 18, 19, 20 & 24) were damaged during the July 1998 flood and the fifth retired embankment near Manikchak was breached. Subsequently, the afflux embankment was also breached on August 25, 1998. These breaches are responsible for the entry of the Ganga water into the Malda District. Located on the outer side of the bend, there is deep
Farakka Barrage and 1998 Flood in Malda
47
erosion near the toe of the marginal bundh. As against a normal high flood depth of 8.5 m, the depth of water measured after the flood was found to be 20 m near the river side toe of the marginal bundh. During the flood, the depth was much higher. The transverse slope of the riverbed in a bend is due to the scour on the outer side and deposition of the scoured materials on the inner side of the meander bend. The transverse slope occurs for stability of the bed due to a secondary current generated as a result of centrifugal force to which water is subjected on the outer side (Wang, 1992). Due to the increased depth as well as the centrifugal force on the outer side, the tractive stress increases rapidly leading to more and more scour. Progressive scour on the outer side and the deposition on the inner side, results in lateral migration of the bend on the outer side and the increase in the curvature of the bend. This causes even higher centrifugal effect and a higher shear stress resulting in more erosion at the outer edge of the bed. No embankment can stand when such deep scour occurs near the toe, unless it is well protected with heavy stone/concrete aprons and sheet piles. The primary cause of the breach in the embankments is the formation of a deep scour hole as the river starts flowing along the embankment.
85000
Discharge (m3/sec)
75000 65000 55000 45000 35000 25000 1945
1950
1955
1960
1965
1970
1975
1980
1985
Year
Figure 3.3. Annual peak discharge of the Ganga at Farakka. Horizontal line indicates mean peak discharge of 56,543 m3/sec. Data source: UNESCO, 1976 and Indo-Bangladesh Joint Rivers Commission, 1995.
Twenty-four spurs have been constructed to date so far to deflect the stream away from the marginal embankment. On the Kosi River, 364 spurs were constructed to save flood embankments (Mazumder, 1985). Yet the embankments got breached. Long spurs cause more head loss and more afflux upstream. The river has been found to be more unstable when too long spurs are made due to the process of initial contraction and subsequent expansion of the stream (Mazumder, 1993). The river may deflect and start flowing along the spurs. Too much contraction and expansion may also cause strong eddy
48
S.K. Mazumder
with strong back flow scouring on the downstream side of the spur (Kulkarni and Wakalkar, 1999). The mainstream may also entrain the eddy fluid resulting in supercritical flow along the bank.
3.4
Conclusions
The 1998 disastrous flood in the Malda District of West Bengal was due to the combined effect of:Rise in high flood level upstream of the Farakka Barrage; deposition of sediment upstream of the barrage; unprecedented rainfall in the catchment lying between Ganga and Mahananda and the simulataneous drainage congestion due to the rise in HFL of Ganga and Mahananda; meandering Ganga River upstream of Farakka and the erosion of the outer bank towards Malda; failure of flood embankments due to the deep scour holes near the embankments; and poor maintenance and low quality construction of protective works.
References Abbas A.T., B.M.: 1984, The Ganges Water Dispute, University Press Ltd., Dhaka. Bandyopadhyay, D.: 1999, To Prevent a National Disaster-The Voice of West Bengal. In: Flood Situation in West Bengal-Agenda for Action, Directed Initiative, Kolkata. Central Bureau of Irrigation and Power (CBI & P): 1989, River Behavior, Management and Training, Volume-I, CBI & P, New Delhi. Garde, R.J. and Raju, K.G.R.: 1985, Sediment Transportation and Alluvial Stream Problems (2nd Edition), Wiley Eastern Ltd., New Dehli. Government of West Bengal: 2003, Flood Information, Government of West Bengal, Kolkata. Kulkarni, S.B. and Wakalkar, V.M.: 1999, Performance of Anti-erosion Works for Protection of Palasbari-Gumi Area along River Brahmaputra, Journal of Hydraulic Engineering 5(2), 22-30. Rupantarer Pathe: 1998, 1998 Flood in Malda-A Special Issue on 1998 Flood. Lok Sabha Proceedings: 2003, Synopsis of Debates, March 5, 2003, Lok Sabha, New Delhi. Mazumder, S.K.: 1985, Effectiveness of Impressions type Groins in River Bank Protection with Particular Reference to River Kosi in India. Paper presented in the “International Conference in Hydraulics of Floods and Flood Control”, British Hydro-mechanics Research Association (BHRA), Cambridge, U.K., September 24-26. Mazumder, S.K. and Sen, P.: 1991, Design Operation and Maintenance of Diversion Structures on Alluvial Rivers, Journal of Institution of Engineers, India 72, 75-88. Mazumder, S.K.: 1993, River Erosion Downstream of a Barrage, Proceedings of CBI & P, April 28-29, Varanasi, India. Ministry of Water Resources (MWR): 2000, Annual Report 2000, Ministry of Water Resources, New Delhi. Mookerjea, D.: 1974, Save the Bhagirathi, Bulletin of the Institution of Engineers, India 23(6), 25-33. The Hindu: 2001, Kolkata port: Government support vital, The Hindu, November 19, 2001 (http://www.thehindubusinessline.com/businessline/logistic/2001/11/19/stories/0919c05s.htm). Valentine, E.M. and Shakir, A.S.: 1992, River Channel Platform-An Appraisal of a Rational Approach, Proceedings of VIII APD-IAHR Congress, Volume II, October 20-23, CW & PRS, Pune, India. Wang, P.: 1992. Numerical Prediction of Transverse Bed Slopes and Bed Profiles in Curved Alluvial Streams, Proceedings of VIII APD-IAHR Congress, Volume II, October 20-23, CW & PRS, Pune.
4 IMPACT OF UPSTREAM HUMAN INTERVENTIONS ON THE MORPHOLOGY OF THE GANGES-GORAI SYSTEM Maminul Haque Sarker Center for Environmental & Geographic Information Services (CEGIS) House # 6, Road # 23/C Gulshan-1, Dhaka 1212 Bangladesh
4.1
Introduction
Channel morphology adjusts in the different time-scale - long, medium and short - to changing water and sediment discharges (Richards, 1982). Long-term influences - climate, hydrologic and gradual tectonics - cause gradual, progressive adjustment of the alluvial channels. Medium-term adjustments are often caused by human activities. Natural hazards like earthquakes and volcanic eruptions are also responsible for medium-term adjustment. Several studies have assessed the medium-term adjustment due to human activities and natural hazards (Kondolf et al., 2002; Yang et al., 2002; Goswami et al., 1999; Simon, 1989; Burnett and Schumm, 1983; Galay, 1983). In these cases, the change in sediment transport is the triggering agent. On the other hand, short-term channel adjustment is caused by individual extreme events, like a catastrophic flood. Human interventions in the rivers system started in the ancient times when man started to cultivate crops. The crop fields are found to generate two-three times higher runoff than those catchments under pasture (Richards, 1982). This causes the increase in flood discharge. Moreover, cultivation yields more sediment to the ultimate destination, which is the river. In a Mississippi catchment sample, it was found that a woodland basin yields three times and that corn cropland yields ten times the sediment of pastureland. Surface water irrigation also changes the flow regime and thus the cultivation of crops changes both flow and sediment regimes of a river system. To meet the food demands of an increasing population, extension of cultivated areas and withdrawal of water for irrigation has increased largely over the last century, particularly in densely populated areas, like in India (Verghese, 1999). Changes in the upstream hydraulic regime of a river system can easily be felt in the downstream. For example, increase in flood discharge due to deforestation in the upstream and a decrease in flow due to the construction of dams can quickly occur in the downstream. These upstream interventions would increase or decrease the water and sediment input, the effects of which on the river morphology could be felt in the downstream several years later. These changes propagate in the downstream with a certain 49 M. Monirul Qader Mirza (ed.), The Ganges Water Dispersion: Environmental Effects and Implications, 49–80. © 2004 Kluwer Academic Publishers. Printed in the Netherlands.
50
Maminul Haque Sarker
speed. This speed is several hundred times less than the speed of flood waves or other hydrological changes. Sarker and Thorne (2003) estimated the speed of downstream propagation of the different morphological aspects of the Jamuna River and according to them it varies from 10 km/year to 50 km/year. The speed of flood wave on the other hand, is more than 100 km/day in the same river. The impact of any upstream change on morphology may vary from river to river. Even within a river it can vary from one reach to the other. For example, a dam generally causes riverbed degradation, but in a river system where the bank and bed materials are highly susceptible to erosion, the effect of the dam can be associated with the changes in planform (Galay, 1983), which is different from riverbed degradation. The response of the river to any sort of interventions can propagate both in the upstream and downstream. Bangladesh as a downstream riparian of two large rivers such as the Brahmaputra and Ganges would be the worse victim, as people of this country do not get any benefit from the upstream interventions, but experience only the adverse effects on the river morphology. Building an understanding on the river process response, and identifying and developing the capability to predict the effects of different interventions are essential for the downstream riparian to minimize the sufferings, the causes of which are actually generated in the far upstream. This chapter attempts to identify the impacts of the upstream interventions on the morphological changes in the Ganges-Gorai system, keeping in mind that identification of the morphological response of the river is highly complex due to a large number of variables. Moreover, one of the major constraints is to separate the changes induced by the natural morphological oscillations of a river from the response of the river to human interventions. In this chapter the approach of identifying the effects is presented in the next section. The geo-morphological settings of the Ganges basin are discussed and an account of the hydro-morphological characteristics of the river. The morphological responses of the Ganges River to the several natural and human interventions, including the Farakka, are presented in the following section, followed by a detailed account of the changes in the Ganges and its impact on the Gorai River. Finally, the future of the Gorai River and its probable implications to the Southwest region of Bangladesh is presented along with a discussion and concluding remarks.
4.2
Approach
The task of recognizing the effect on the morphology of any upstream changes is difficult and complex due to the time lag factor and its varying nature. The propagation speed of morphological changes varies from river to river and reach to reach of the same river depending on the geo-morphological evolution and hydro-morphological characteristics of those rivers and river reaches. A good understanding of the geo-morphological and hydrological characteristics of the river is a pre-requisite to identify the effects on the morphology of a river. Identifying and understanding its previous responses to different types of interventions can largely help to identify and predict recent changes. Therefore,
Morphology of the Ganges-Gorai System
51
attempts were made to assess the Ganges River response to meeting with the Jamuna River in the early nineteenth century as well as the impact of the construction of the Hardinge Bridge - the first major human intervention in the Ganges River. Due to the involvement of the large number of variables, the quantification of the responses of the river in a medium time frame is analytically indeterministic (Richards, 1982). A simple and qualitative relation was proposed by Lane (1955) for predicting the response of the rivers. Later Klaassen (1995) improved the relations introducing the regime relations. Schumm (1969) also proposed qualitative responses of the river to the changes in discharge and sediment input. However, it appears that Lanes proposal would be the better tool to predict the responses of the river, especially in adjusting the width, depth and slopes to the different types of interferences. The Lane relation reads as:
S a * Db ∞Qc * i
4.1
where S = sediment transport (m3/sec), Q = water discharge (m3/sec), D = characteristics bed material size (m), i = energy gradient (slope), and a, b, and c are exponents. Assuming the steady and uniform flow, the momentum equation can be expressed as: 3 1 2 2
Q = CBh i
4.2
where C = Chezy’s roughness coefficient, B = width, and h = depth of the channel. On the other hand, schematized sediment transport equation expresses:
S = mu n
4.3
S = D − p m1u n
4.4
or
where p, m1 and n are constant. Using equations 4.2 and 4.4, as expression can be derived as: n
S = BD − p m1C n (hi )2
4.5
Solving the equations by eliminating h and obtaining the expression for i:
SD p B
n −3 3
n n
∞Q 3 i 3
4.6
Solving the equations by eliminating i and obtaining the expression for h:
SD p B n −1∞Q n h − n
4.7
52
Maminul Haque Sarker
These two equations can be used to assess the one-dimensional response such as the adjustment of flow depth and the slope of the river to the various interventions such as the narrowing of a river, withdrawal of water, mining of sediment and several others. These models help to qualitatively assess the responses to the different types of interventions. To assess the impact of the human interventions in the Ganges-Gorai system, these models are applied first and then the observed changes are compared with the qualitative assessment, which leads towards a conclusion. Most of the analysis and interpretation presented in this chapter regarding the identification of the morphological impact on the Ganges are based on the research and development project of the Center for Environmental & Geographic Information Services (CEGIS) (CEGIS, 2003). The research has used time-series water level and discharge data, time series satellite images dating back to 1973, and historical maps. The author of this chapter was mainly responsible for carrying out the research. Many of the analysis and interpretation regarding the identification of the morphological impact on the Gorai River are based on the environmental baseline study conducted by EGIS (CEGIS’ predecessor) for the Gorai River Restoration Project (EGIS, 2000a). The relevant part of the study was also carried out by the author, some of the results of which are presented in Sarker et al. (1999) and Sarker and Koudstaal (1999). In addition to these previous studies, new observations and interpretations are incorporated to better explain and predict the behavior of the rivers.
4.3
Geo-Morphological Settings
The combined flow of the Bhagirathi and the Alaknanda forms the Ganges. The Bhagirathi originates from the Gangoatri glacier and the Alakananda rises in the Anzkar Range in the West of the Nanda Devi (Figure 4.1). The length of the Ganges from the West of the Nanda Devi to the confluence of the Jamuna River at Aricha is about 2,200 km. Several tributaries have merged to form the main flow of the Ganges. Three trans-Himalayan distributaries the Karnali, Gandak and Sapt Kosi originating in Nepal contribute about 41% of the total annual flow of the Ganges system (Haque, 1997). The Ganges was probably the first river to break through the Indian shield during the Pleistocene (< 2 * 106 years) upheaval (Khan, 1991). The river passed between the Rajmahal Hills and the Dinajpur Shield and flowed South along the course close to the present course of the Hoogly River. Since then the Ganges has brought down huge amounts of sediment along with the Brahmaputra River for the last several hundred thousand years to build up the Bengal Delta - the largest recent delta in the world. The thickness of the sediment in the basin varied from few hundred meters to 16 km close to the Bay of Bengal. The sediment of these two rivers has spread over the ocean floor covering thousands of square kilometers and has formed an almost 3,000 km long deep sea fan. The delta building process was greatly influenced by changes in the base level, i.e., the sea level. During the last glaciations (20,000 years), the sea level was about 100 m below the present level and the coastline was further to the sea. A new phase of the delta building
Morphology of the Ganges-Gorai System
53
Figure 4.1. Catchment of the Ganges, Brahmaputra and Upper Meghna rivers.
processes has been started since the post glaciations (< 20,000 years). Geological evidence suggests that the Ganges was along its oldest course i.e., along the Hoogly at the beginning of this phase (Figure 4.2). Recently developed paleo-geographic maps (Umitsu, 1993; Goodbred and Kuehl, 2000) suggest that the main course of the Ganges shifted from the Bhagirathi to the present course after abandoning several other courses like the Jalingi, Mathabanga, Gorai, Kumar, etc. More than one simultaneously flowing main courses were also evident during the period (Williams, 1919). Williams (1919) described the sequential changes in the courses of the Ganges River, and his description was very close to what was suggested by Umitsu (1993) and Goodbred and Kuehl (2000). But the time-scale suggested by Williams was quite different from that indicated by recent studies. During the shifting of courses from the West to the East, the old courses often became distributaries of the main river. A similar phenomenon was observed in the case of the Gorai River. The Ganges was flowing close to the present course of the Gorai River nearly 5,000 years ago. Later, it shifted its course further East and since then the Gorai has become one of its distributaries. Over time, the importance of the distributaries has changed. The change was caused by delta development processes, the avulsion of tributaries and natural events such as earthquakes or large floods. At the beginning of the nineteenth century the Jamuna River shifted from the East of the Madhupur Tracts (Pleistocene uplifted sediment) to the West (Figure 4.3). According to Williams (1919), this avulsion of the Jamuna River caused the increased discharge through the Gorai River.
54
Maminul Haque Sarker
Figure 4.2. Paleo-geographic maps of the Bengal Delta (Goodbred et al., 2000).
Figure 4.3. Evolution of the main rivers of Bangladesh since the 18th century.
Morphology of the Ganges-Gorai System 55
56
Maminul Haque Sarker
4.4
Hydro-Morphological Characteristics
4.4.1
GANGES RIVER
The Ganges drains the Southern slope of the Himalayas and its total catchment area is about 1,000,000 km2 (Figure 4.1). The river enters Bangladesh through the Chapai Nawabganj District and flows about 100 km along the international border of Bangladesh and India (Figure 4.4) occupying the territory of both countries. From the off-take of the Mathabanga River, the Ganges enters completely into the territory of Bangladesh. The annual average flow as measured at the Hardinge Bridge since the mid-1930s is about 11,000 m3/sec. The average flood water slope of the river is 5 cm/km.
Figure 4.4. The Ganges and Gorai Rivers.
The bed material of the Ganges River consists of fine sand, the median diameter (D50) of which is about 0.14 mm at the Hardinge Bridge. The downstream fining rate of the bed material is about 0.03 mm/100 km (Delft Hydraulics and DHI, 1996a). Suspended sediment
Morphology of the Ganges-Gorai System
57
transport is the dominating mode of bed material transport1 . Among the suspended sediment, 1/3rd is bed material and the other 2/3rd is wash load which consists of silt and clay (Delft Hydraulics and DHI, 1996b). Annually, the river transports 300 to 500 million tons of sediment as measured at the Hardinge Bridge. After starting the sediment gauging at the Hardinge Bridge in the mid-1960s, the sediment transport, especially the bed material (sand fraction) load was found to decrease consistently from the mid-1970s (Figure 4.5). The Ganges is a meandering river, characterized by sweeping meanders and divided flow reaches within the meander belt. The mender belt of the river is limited within an active corridor, which has been produced by the river over centuries (Halcrow et al., 1993). Erosion resistant cohesive materials including the Barind Tract (consisting of Pleistocene sediment) has formed the left boundary of the corridor (CEGIS, 2003). Erosion resistant cohesive materials are also present along the right boundary of the corridor, but is not continuous or in abundance in the upstream of the Hardinge Bridge. Old courses of the Ganges (Figure 4.2) and the distributaries are relatively the older consolidated flood plain along the right corridor at several locations. Therefore, the river has a higher freedom to develop its meander loops along its right bank rather than along its left. Within the active corridor the bank material consists of loosely packed highly erodible materials. The maximum bank erosion in such areas can be as high as 665 m/year along the meandering bends (EGIS, 2000b and Sarker et al., 2003). When the river attacks the boundary of the active corridor consisting of cohesive materials, the rate of bank erosion reduces to few meters per year (CEGIS, 2003). According to Halcrow et al. (1993) the average meandering wavelength of the Ganges is 29 km. The wavelength is in good agreement with the 7 to 10 times the flow width as suggested by Leopold and Wolman (1960). The river changes sinuosity over time and space. Sinuosity between the locations of the Farakka Barrage and the Hardinge Bridge was around 1.20 for 200 years (1780-1973), but increased to 1.37 during the last 30 years (Table 4.1). The reach of the Ganges River between the Hardinge Bridge to Aricha was highly sinuous, i.e., sinuosity was 1.46 in the 18th century as observed in the Rennel’s map (1776). From the beginning of the 20th century this reach has become nearly a straight reach, and sinuosity remains close to 1.10.
1
The total sediment load (transport) in a river can be divided into two categories: bed material load and wash load. Bed material load is defined in accordance with the ISO standards (van Rijn, 1992) the part of the total sediment transport which consists of the bed material the movement rate of which is governed by the transport capacity of the channel.
Wash load is defined as that part of suspended load, which is composed of particle sizes smaller than those found in appreciable quantities in the bed material. A grain size 63 mm is used to separate bed material load from wash load. According to Bagnold (1962) the wash load consists of particles with a fall velocity smaller than 1.6 ui (u = depth-averaged velocity, i = energy gradient) and can be transported in unlimited quantities.
58
Maminul Haque Sarker
Sediment (M tons/day)
12
66-70 75-80
10
81-85
8
86-90 91-95
6 4 2 0 0
20,000
40,000
60,000
80,000
3
Discharge (m /s) Figure 4.5. Changes in the relationship between discharge and bed material transport over time. Table 4.1. Changes in the sinuosity of the Ganges River over time
Reach of the Ganges
Farakka to Hardinge Bridge Hardinge Bridge to Aricha
4.4.2
Straight Length (km)
138 76
Sinuosity 1780
1860
1973
1999
1.24 1.46
1.21 1.20
1.17 1.08
1.37 1.12
GORAI RIVER
The Gorai River has long been a perennial distributary of the Ganges River. At the beginning of this century, the flow of the Nabaganga River joined with the Gorai River at Bardia by a cut called the Halifax cut. This resulted in a partial diversion of the flows through the Nabaganga towards Khulna. It has since evolved to become the preferred drainage path of the Gorai, which now reaches the Bay of Bengal mainly via the Pussur and Sibsa Rivers and several linked tidal creeks inside the Sundarbans mangrove forest (Figure 4.4). The mean annual peak discharge of the Gorai River in the late 1990s is about 4,500 m3/sec; its bed material varies from fine sand to fine sand and silts. The annual average sediment transport is about 50 M tons (for the last 3 decades) in which about 40%
Morphology of the Ganges-Gorai System
59
are bed materials and the rest is wash load consisting of silt and clay. The mean size of bed materials at the mouth of the Gorai River is 0.17 mm (Delft Hydraulics and DHI, 1996c), which is found to be coarser than that in the Ganges River almost at the same location. Coarser grains at the off-take are probably due to a grain sorting process, associated with the sediment input above the transport capacity of the diverted Gorai flows (Sarker and Koudstaal, 1999). The Gorai River flows through relatively erosion resistant materials along a 90 km reach in the upstream. The maximum rate of bank erosion in this reach is a few meters per year, while it is a few tens to hundreds of meters per year at the most downstream reach (EGIS, 2000b, Sarker et al., 1999). The sinuosity of the 90 km long upstream reach is about 1.36, which has remained unchanged over the last 3 decades. There is a bend in the immediate downstream of Kamarkhali (Figure 4.4), the existence of which was observed in the Rennel’s map (1776). The length of the bend has been changing over time; often natural cut-off occurs and subsequently the bend develops again. The most dynamic reach of the Gorai River is the 70 km long downstream reach North of Bardia. The sinuosity of this reach is very high and changes over time (Table 4.2). During the last 3 decades an increasing trend of sinuosity of this reach was observed. Table 4.2. Changes in the sinuosity of the Gorai River over time
Reach of the Gorai
Off-take to Kamarkhali Kamarkhali Bend Downstream Reach
1904-1924*
1973
1.40 2.20
1.35 3.50 1.75
Sinuosity 1984 1.35 2.75 2.05
1997 1.35 3.20 2.20
*data source: Halcrow et al., 1993. Source: EGIS, 2000a.
4.5
Natural and Human Interventions and Their Impacts on the Ganges
Avulsion of the tributaries and shifting of the main course of the river are common types of natural interference in a river system. Willcocks (1930) indicated that all the distributaries of the Ganges such as the Jalingi, Mathabanga, Gorai, etc, were man-made irrigation channels of ancient times. No evidence has been found to support this idea. However, the major human interventions in the river have started only recently i.e., since the beginning of the last century. All of these interventions have medium-term morphological impacts on the river system, which are described in the following.
60 4.5.1
Maminul Haque Sarker AVULSION OF THE JAMUNA RIVER
Until the end of the eighteenth century, the Ganges River was separately discharging to the Bay of Bengal a few kilometers West of the Meghna Estuary (Figure 4.3). The Brahmaputra River flowed to the East of the Madhupur Tract and upon joining with the Meghna River, their combined flow fell into the estuary following approximately the same alignment of the present Lower Meghna River. Between the end of the eighteenth century and early nineteenth century, the flow of the Brahmaputra River started to divert through the course of the Jamuna River and joined with the Ganges at Aricha. The diversion of the flow of the Brahmaputra River to the Jamuna took place gradually - spanning over several decades. For an assessment of the increase in flow (considering the changes of the downstream width), the ultimate adjustment of the river slope can be expressed (Klaassen, 1995) as: n+3
i∞ § Q0 · 2 n ¸ =¨ io ¨© Q0 + ∆Q ¸¹
4.8
where, io and iµ are initial (time, t = 0) and ultimate (after the adjustment at t = µ) energy slopes, Qo is the discharge at t = 0 and ∆Q is the increase of discharge due to diversion. The value of n is 5 and 3 according to the Engelund and Hansen (1967) and Meyer-Peter and Muller (1947) formulas. Delft Hydraulics and DHI (1996c) derived a sediment transport formula for the major rivers of Bangladesh such as the Jamuna, Ganges and Padma Rivers based on Engelund and Hansen, where they got the value 3.66 for ‘n’. The Jamuna River delivered not just the flow, but the sediment as well into the Ganges River. Initially, the Jamuna River supplied the sediment at a higher rate, as the river had to increase its size by eroding its bed and bank to accommodate the increased flow. For the increase in the sediment only, the ultimate adjustment of the slope would be: 3
i∞ § S0 + ∆S · n ¸ =¨ io ¨© S0 ¸¹
4.9
where So is the sediment transport at t = 0 and ∆S is the increase in sediment transport due to the diversion. Combining the above two equations results in nearly ‘no’ changes in the downstream slope of the river. It implies that the ultimate adjustment of the increased discharge and sediment will not have much impact on the Ganges River in the upstream of the confluence. But the gradual diversion of flow through the Jamuna River maintained a higher base level of the Ganges River at the confluence for several decades (Figure 4.6), which may cause the adjustment of the slope of the Ganges by reducing its sinuosity. This explains the reduction of sinuosity of the Ganges River from 1.46 to 1.20 from the location of the Hardinge Bridge to Aricha at the beginning of the nineteenth century (Table 4.1). It should be kept in mind that during the process of diverting of the flow of the Brahmaputra
Morphology of the Ganges-Gorai System
61
to the Ganges, a higher base level had been causing very high flood for several decades around the confluence and thus raised the adjacent flood plain by sedimentation. Similar types of river responses have been reported by Burnett and Schumm (1983). They found that downstream valley uplift due to neotectonic activities had reduced the sinuosity of the Big Colewa Creek in USA to adjust with the new valley slopes. This adjustment was almost similar to the process response of the Ganges River. The sustaining of high base level at Aricha caused the diversion of more water through the Gorai (Williams, 1919).
Q Ganges R.
Q
Q+Q1 Bay
Water level profile: t = t1
h
t = to hn
Riverbed
Bay
hn
t = t∝ hn1 Bay
Figure 4.6. Schematic diagram showing the response (one-dimensional) of a river to the increase in downstream flow.
4.5.2
HARDINGE BRIDGE
The Hardinge Bridge was constructed over the Ganges River in 1916. Generally, the construction of a bridge is associated with the narrowing of a river. The length of a
62
Maminul Haque Sarker
constricted reach can be determined by the length of guide bunds, which is about 3 km to 4 km for the Hardinge Bridge. The immediate impact of the constriction is the increase in flood level, which diminishes with the distance in the upstream (Figure 4.7). The ultimate adjustment of the depth and slope at the constricted reach can be expressed as:
h∞ § B0 · =¨ ¸ ho ¨© B1 ¸¹
n −1 n
4.10
and
i∞ § B1 · =¨ ¸ io ¨© B0 ¸¹
n −3 n
4.11
where ho and hµ are the width-averaged depth at t = 0 and t = µ respectively; Bo and B1 are the flow widths before and after the constriction, respectively. The depth in the constricted reach will increase and if n > 3, the slope of the reach will decrease. The upstream riverbed will be lowered, depending on the length of the constricted reach, the value of n and the amount of constriction i.e., B1/B0 (Figure 4.7). For the guide bunds of 3 km to 4 km and for 50% contriction, the maximum lowering of the bed level could be a few centimeters only, which can hardly be felt. However, the immediate increase of flood level will be diminished within a few years by lowering the riverbed at the constricted reach. Therefore, the morphological changes associated with the constriction due to the Hardinge Bridge may not be significant and not recognizable using maps that were prepared several years apart. As a meandering river the sinuosity of the Ganges in the downstream of the Hardinge Bridge varied between 1.46 to 1.20 in the eighteenth century (Table 4.1). Sinuosity of the river varies spatially and temporarily. But it has been found that sinuosity of the Ganges River in the downstream of the Hardinge Bridge has remained around 1.1 for about a hundred years since the early twentieth century (CEGIS, 2003). The reasons for this are not yet known, though there may be two likely reasons: (i) development of a lineament during the earthquake of 1897 along the present alignment of the Ganges in the downstream of the Hardinge Bridge, (ii) construction of the guide bunds and bank protection structures for the safety of the bridge and the cohesive bank materials along the right bank downstream of the bridge that guide the flow in such as a way that the rivers had to follow a straight course. From examining the old maps (1917, 1924, 1933 and 1960) and satellite images from 1973 to 2002, it has been observed that the Ganges flow was directed to Talbria 13 km downstream of the Hardinge Bridge throughout the period. Bank materials of Talbaria consist of clay, the thickness of which is about 30 m (DHV-Haskoning & Associates, 2000). A further examination of old maps and satellite images from 1973 to 2002, suggested that during the last 40 years the riverbank was along the location of Shilaida about 14 km downstream of Talbaria. Bank materials of Shilaida also consist of clay and are highly erosion resistant (CEGIS, 2003). These observations partly support the second premise.
Morphology of the Ganges-Gorai System
63
Riverbank B0
B1
Bay
Riverbank Water level profile: t = t1 h hn1 io
Bay
Water level profile: t = t ∝
Riverbed: t = t∝ i∝
Bay
Figure 4.7. Schematic diagram showing the response (one-dimensional) of a river to the narrowing of the river at the downstream.
4.5.3
DAMS, BARRAGES, EMBANKMENTS, LAND USE AND DEFORESTATION
Nearly 451 million are directly/indirectly dependent on the Ganges (Chapter 1). There is a large demand for food production in these basins. According to Verghese (1999), per capita agricultural output had declined in the 1980s, although the growth rate was about 1.9%. Increasing population has increased the demand for food, which has resulted in the large-scale human interventions evident in the basin area. These interventions include deforestation, intensive use of land for agriculture, construction of dams, barrages and embankments, etc. Each of these interventions has impacted on the hydro-morphologic regime of the river, which is qualitatively shown in Table 4.3. Schumm (1969) and Richards (1982) presented qualitative channel responses to the different types of human interventions in the river basins. During assessing the impacts on wet and dry season discharge and coarse and fine sediment input as presented in the table, the rainfall and
64
Maminul Haque Sarker
cropping pattern, purposes of the construction of the dams, barrages and embankment in the Ganges basin were taken into account. Therefore, the impacts presented in Table 4.3 would be valid for the particular region and may not be valid for another region. Table 4.3. Qualitative impacts of human interventions
Interventions
Dams Barrage Embankments Land Use Deforestation
Water Input Dry Season Wet Season
0 0 -
0 0 + 0 +
Sediment Input Bed Materials Wash Load (Fine Sand) (Silt + Clay) + 0 +
0 0 + + +
Note: ‘0’, ‘-’ and ‘+’ stand for no change, decrease and increase, respectively.
The impacts of different types of interventions in the Ganges River suggest that there was a decrease in dry season flow and an increase in wet season flow. Decrease in dry season discharge due to human interventions other than the Farakka Barrage can be observed from Figure 4.8. During the last fifty years, the arrival of water at Farakka in the dry season from the upstream has been reduced by 15%.
Figure 4.8. Flow arriving at the location of the Farakka Barrage during the 5 months of the dry season.
Morphology of the Ganges-Gorai System
65
In the monsoon, the impact of the Farakka Barrage can hardly be felt in the downstream. Therefore, the changes in the monsoon flow regime at the Hardinge Bridge can be considered as an impact of the human interventions other than the Farakka Barrage. Mirza (1997) reported that during the monsoon, especially in July, August, September and October the mean monthly flows of the Ganges at the Hardinge Bridge increased by 19%, 10%, 18% and 7%, respectively from the mid-1970s. Decrease in the flow during the remaining 8 months keeps the annual flow volume nearly the same. The results shown in Figure 4.8 and the findings of Mirza (1997) are in line with the qualitative impact assessment of human interventions presented in Table 4.3. The qualitative impact assessment suggests that the wash load must have increased, which caused little influence on the river morphology (except the tidal reaches). The changes in the bed materials depends on the intensity and characteristics of the types of interventions, which is the main triggering agent to the changing river morphology. 4.5.4
FARAKKA BARRAGE
The Farakka Barrage was constructed in 1971 and became operational from 1975. Like a bridge, the barrage constricts the river and increases the upstream flood level to some extent depending on the intensity of the constriction. But the difference between the impact of a barrage and a bridge is that in the case of a barrage the river cannot adjust the depth at the constricted reach as shown in Figure 4.7 due to the presence of a bottom sill. This sill causes a temporary blockage of sediment in the upstream. Impact of the reduction of sediment input in the downstream riverbed can be expressed as: 3
i∞ § So − ∆S · n ¸ =¨ io ¨© So ¸¹
4.12
where ∆S is the temporary blockage of sediment. Impact on the depth of the channel can also be expressed as: 1
h∞ § So · n ¸ =¨ ho ¨© So − ∆S ¸¹
4.13
The effect of sediment storage can be shown schematically through Figure 4.9. Immediately after the construction of the barrage, i.e., at t = t1, the water level in the upstream of the barrage will increase due to constriction. The flood level in the upstream of the barrage would remain high due to the rising of the bed resulting from the blockage of sediment. Mazumder (2000) found that the riverbed level as well as the flood level in the upstream of the Farakka Barrage increased after the construction of the barrage, which caused the disastrous flood in 1998 in Malda, West Bengal, India (see Chapter 3 on the Malda flood).
66
Maminul Haque Sarker
Water level profile: t = hn or h0 Riverbed: t = Bay
Sill of the barrage Water level profile: t = hn Sediment Riverbed: t = t∝
hn1
io
Bay i∝
Figure 4.9. Schematic diagram showing the river response to the blockage of sediment by the sill of a barrage.
Due to the temporary storage of the sediment, the slope and depth of the river in the downstream of the barrage will decrease and increase, respectively (equations 4.12 and 4.13 and Figure 4.9). The river having highly erodible bank materials may react differently. Instead of lowering the riverbed, the river may change the planform. Galay (1983) also observed such cases in some Indian rivers. In the case of the Ganges River it is likely that instead of lowering the bed significantly, the river may decrease its slope by increasing its sinuosity. That was probably what happened in the Ganges River, after the construction of the Farakka Barrage. The sediment transport of the Ganges River at the Hardinge Bridge was found to have decreased in the 1980s and 1990s (Figure 4.5). If sinuosity is observed to have increased due to the decrease in sediment transport, sinuosity of the river would show a phase lag in the downstream. The propagation of the increased sinuosity should continue in the downstream of the Hardinge Bridge. The reach of the river from 20 km in the downstream of the Farakka Barrage to the Hardinge Bridge is divided into three reaches R1, R2 and R3 to identify the occurrence of phase lagging in the downstream (if any). In order to divide the reaches nodal points are selected and the length of the reaches cover a straight distance of 35 km to 45 km, which is about 1 to 1.5 times greater than the meandering wavelength of the Ganges River. The observed changes in the sinuosity of the river reaches are presented in Table 4.4.
Morphology of the Ganges-Gorai System
67
Table 4.4. Changes in the sinuosity of different reaches of the Ganges from the downstream of Murshidabad to the Hardinge Bridge
Year
1973 1980 1984 1989 1993 1997 1999
Reach R1
Sinuosity Reach R2
Reach R3
1.16 1.23 1.21 1.22 1.18 1.25 1.22
1.14 1.18 1.15 1.16 1.31 1.30 1.29
1.18 1.40 1.37 1.40 1.54 1.66 1.67
All the reaches in the upstream of the Hardinge Bridge have increased in sinuosity over the last few decades (Figure 4.10). Increase in the sinuosity of Reach R3 is very significant, while changes in sinuosity of Reach R1 are less compared to the other two reaches. No phase lag in the increase in sinuosity of these reaches is apparent. But increase in sinuosity of Reach R2 was observed to have stopped in the mid-1990s, whereas sinuosity of Reach R3 is continuing to increase. A phase lag in the ceasing of the increase in sinuosity can be assumed - Reach R1 stopped in 1980, R2 in 1993 and R3 is continuing to increase its sinuosity.
1.8
Reach S1
Reach S2
Reach S3
1.7
Sinuosity
1.6 1.5 1.4 1.3 1.2 1.1 1 1970
1975
1980
1985
1990
1995
Year
Figure 4.10. Changes in sinuosity of the different reaches of the Ganges River over time.
2000
68
Maminul Haque Sarker
The most striking thing is that there were almost no changes in sinuosity in the downstream of the Hardinge Bridge, whereas in Reach R3 - the immediate upstream reach of the Hardinge Bridge, sinuosity increased from 1.18 to 1.67 during 1973-1999 (Table 4.1). The only explanation for this phenomenon is that either due to unknown natural causes or due to the man-made hard points around the Hardinge Bridge and the cohesive materials along the Ganges; the river is fixed at a nearly straight course in such a way that it has not increased its sinuosity since the beginning of the twentieth century. In such a case, the river should decrease its slope by lowering its flood or bed level in response to the decrease in sediment input. Specific gauge analysis of the Ganges River at the Hardinge Bridge is performed to check such occurrence (Figure 4.11). No significant changes in the relation between water level and discharge at the Hardinge Bridge can be observed, although there are small changes in the water level within a range of 0.5 m for discharges 20,000 m3/sec and above. Water levels rose about 0.5 m during the 1970s reaching the peak in the early 1980s. Thereafter it started to decrease. During the end of the 1990s the water level dropped more than 0.5 m for discharges of 20,000 m3/sec, 30,000 m3/sec and 40,000 m3/sec from its peak. This variation in water level is in line with the decrease in sediment transport at the Hardinge Bridge. It suggests that instead of increasing the sinuosity, the river downstream of the Hardinge Bridge has lowered its flood slope, if it is assumed that no changes had occurred at the downstream boundary i.e., at Aricha.
40,000 m3/s 30,000 m3/s 13
Water level (m+PWD)
14
12 11
20,000 m3/s 10,000 m3/s
10 9
5,000 m3/s
8 1970
1975
1980
1985 Year
1990
1995
Figure 4.11. Specific gauge analysis of the Ganges River at the Hardinge Bridge.
2000
Morphology of the Ganges-Gorai System
69
To identify the effect of the Farakka Barrage on the Ganges River a number of analysis were performed including a theoretical justification. Among these, two analysis confirmed the increase in sinuosity of the river from the Farakka Barrage to the Hardinge Bridge and decrease in sediment (bed materials) input at the Hardinge Bridge after the construction of the barrage. These results support the theoretical justification. But the analysis to identify the downstream phase lag for the increase in sinuosity and the specific gauge analysis do not yield clear results. An apparent phase lag in the ceasing of the increase in sinuosity and apparent decrease in flood slope in the downstream of the Hardinge Bridge were noticed. Moreover, historical analysis supports that the Ganges River may adjust its slope by changing its sinuosity instead of bed level change. All these analysis indicate that the increase in sinuosity of the Ganges River downstream of the Farakka Barrage to the Hardinge Bridge is most likely to be the result of the sediment trapped in the upstream of the barrage. From 1973 to 1999 the Ganges River has increased about 27 km in length from the Farakka Barrage to the Hardinge Bridge which corresponds to the increase in sinuosity from 1.17 to 1.37 (Table 4.1). This increase in length of the river reach causes a net erosion along its courses both in India and Bangladesh. Bangladesh is the worse sufferer - the net loss of flood plain from 1980 to 1999 has been 12,650 ha while India lost about 4,850 ha of flood plain during the same period (Figure 4.12 and Table 4.5). After filling the storage upstream of the barrage, an equilibrium sediment input will be established. The river may adjust its slope again with its equilibrium sediment input. The expected adjustment would be associated with the reduction in sinuosity by reducing its length. This process has compensated partly or fully for the net flood plain erosion in the last decades through accretion. However, it does not imply that the river will stop bank erosion. In the coming years, it is expected that accretion will dominate over the bank erosion.
4.6
Changes in the Ganges River and its Impact on the Gorai River
Available records of the discharge at the Gorai Railway Bridge (GRB) gauging station from the mid-1940s to the mid-1970s (pre-Farakka) show that the Gorai off-take closed during the dry season only once for a period of two years in the early 1950s. A cyclic process of improvement and deterioration of the mouth of the Gorai and other distributaries is not uncommon and had already been mentioned by Williams (1919). Mean annual hydrographs for different periods show a decreasing discharge (Figure 4.13) of the Gorai River. The peak discharge as well as the duration of floods has reduced. Reductions were more pronounced during the 1988-1996 period. Since 1988, the Gorai flow has begun to close every year during the dry season. Furthermore, the ratio between the annual flow volume of the Gorai and Ganges rivers shows a clear declining trend (Figure 4.14). In the pre-Farakka period (1965-1974) the average ratio was 0.14, which was reduced to 0.09 in the mid-1990s.
Maminul Haque Sarker
70
Figure 4.12. Erosion and accretion along the Ganges River from 1980 to 1999.
Table 4.5. Erosion and accretion along the Ganges River from the Farakka Barrage to the Hardinge Bridge during the period 1980-1999
Erosion/Accretion (ha)
Bangladesh
India
Total Change (1980 to 1999)
Erosion Accretion Net erosion
18, 250 5,600 12,650
13,350 8,500 4,850
31,600 14,100 17,500
Two main reasons for the observed declining trend of the flow through the Gorai River were identified by different studies (Halcrow et al., 1993; Delft Hydraulic and DHI, 1996b; EGIS 2000a; and Sarker and Koudstaal, 1999). One is the morphological change in the Ganges River around the Gorai off-take, which can be treated as part of the natural process rather than a consequence of human interventions. The second is the change in the hydraulic regime of the Ganges, which is related to the dry season diversion of water through the Hooghly River by the Farakka Barrage and withdrawal of water further upstream.
Morphology of the Ganges-Gorai System
71
6000
Pre-Farakka (1964-1974)
Discharge (m3 /s)
5000 4000 3000 2000
Post-Farakka (1975-1988)
1000
Post-Farakka (1989-1996)
0 1-Apr
1-Jun
1-Aug
1-Oct
1-Dec
31-Jan
Date
Figure 4.13. Mean daily discharges of the Gorai River at different periods.
Figure 4.14. Ratio of annual flow volumes of the Ganges and Gorai Rivers.
4.6.1
CHANGES IN THE PLANFORM OF THE GANGES RIVER AROUND THE GORAI OFF-TAKE
The dynamic behavior of the Ganges causes rapid change in the planform around the off-take of the Gorai River. When the main flow of the Ganges is directed to the mouth of the
72
Maminul Haque Sarker
Gorai River, the situation can be termed as a “favorable planform” of the Ganges for the Gorai (Figure 4.15a). In this situation, the Gorai takes off at the outer bend of the main flow of the Ganges River. On the other hand, the planform of the Ganges in 1992 (Figure 4.15b) can be referred to as an “unfavorable planform”, when instead of the outer bend, the off-take fell at the inner bend/crossing of the main flow of the Ganges. This situation favors relatively more sediment to divert towards the Gorai. Moreover, huge bank erosion along the right bank in the upstream of Talbaria produced a huge amount of sediment during the monsoon, a major part of which was deposited at the mouth of the river.
Figure 4.15. Landsat TM images of dry season showing the planform of the Ganges River around the Gorai off-take.
From the 1980s, the planform of the Ganges around the off-take started to become unfavorable for the Gorai. The bend upstream of Talbaria started to erode its right bank from 1987. The maximum erosion was about 800 m from 1987 to 1992. The erosion was 2 extended 7 km to 8 km along its bend. About 55 million m3 of sediment was produced from erosion of the right bank, most of which was deposited along the same bank in the immediate downstream of Talbaria, resulting in the formation of a bar at the mouth of the Gorai River (Figure 4.15b). The relation found between the severe upstream bank erosion and declining of a large anabranch of the Jamuna River by a recent research (EGIS, 2002a) matches with the rapid decline of the Gorai during 1988-1996 (Figure 4.14). From the mid-1990s, erosion in the upstream of Talbaria reduced significantly. Consequently, the bar in front of the off-take also reduced in size. The mouth of the Gorai remained at the inner bend of the main flow of the Ganges throughout the 1990s. 2
To estimate the amount of sediment, average depth of the river along the bend is considered as 15 m based on the bathymetric surveys carried out in the Ganges River around the Gorai mouth by the River Survey Project (FAP 24) from 1994 to 1996 (Delft Hydraulics and DHI, 1996e).
Morphology of the Ganges-Gorai System
73
The major changes in the channel alignment of the Ganges in front of the Gorai off-take mainly depends on the changes in the planform upstream of the Hardinge Bridge (Halcrow et al., 1993 and EGIS, 2000a). The constriction of the Hardinge Bridge acts as a node - the flow along the right bank upstream of the Hardinge Bridge results in the flow along the left bank downstream of the bridge (Figure 4.15a). The unfavorable planform for the Gorai occurs when the Ganges flows along the left bank upstream of the Hardinge Bridge (Figure 4.15b) causing the flow along the right bank upstream of the Gorai mouth. An examination of satellite images suggests that a favorable planform of the Gorai is not inevitable in the next decade. It is not probably the first time that the Gorai River has experienced an unfavorable planform (the closing of dry season flow in the early 1950s is suspected to have been due to an unfavorable planform), but the closing of the the Gorai off-take during the dry season for more than a decade and the substantial decline of monsoon flow took place for the first time in recorded history. Unfavourable planform had prevailed from the mid-1980s, but the decline of the Gorai flow started from the mid-1970s (Figure 4.14), suggesting that the unfavorable planform of the Ganges is not the only cause of the decline. 4.6.2
CHANGES IN THE HYDRAULIC REGIME OF THE GANGES
During the post-Farakka period, the dry season water levels (and flows) at the Hardinge Bridge had changed considerably, but the change in flood water level was insignificant (Figure 4.16). In the post-Farakka period, when there was no treaty, i.e., during 1988-1996, water levels in the dry period were lower than when a treaty was in effect i.e., during 1975-1987 (except 1976). The same fact applies for the discharge (Figure 4.17). This indicates changes in the operation of the Farakka Barrage during the two situations. During the pre-Farakka period, a recession in water levels from 11 m+PWD to 7 m+PWD at the Hardinge Bridge took an average of 4.5 months compared to 2.5 months in the post-Farakka period (1975-1987). In the period 1988-1996, the time needed for this recession (11 m+PWD to 7 m+PWD) reduced even further to 2 months. Halcrow et al. (1993) indicated first and later Delft Hydraulics and DHI (1996a) concluded (using extensive flow and bathymetric surveys and 2D numerical morphological model simulations) that the reduction of this flood recession period reduces the time available for scouring the dry season flow, which is one of the main causes of the cessation of the Gorai flow during the dry season. It also contributes to the accumulation of sediment in the Gorai off-take. This can explain the decrease in the annual flow volume of the Gorai since the Farakka Barrage became operational. Halcrow et al. (1993) reported that the sediment accumulation decreased the depth by 4 m at the 11 km stretch upstream of the river. In the following reach the maximum decrease in depth was 2 m.
74
Maminul Haque Sarker
14
Level (m+PWD)
12
10
8 Pre-Farakka (1964-1974)
6
4 1-Apr
Post-Farakka (1975-1988) Post-Farakka (1989-1996)
1-Jun
1-Aug
1-Oct
1-Dec
31-Jan
Date
Figure 4.16. Changes in daily water levels of the Ganges River at the Hardinge Bridge over time.
The reduction of the annual flow volume in the Gorai River has far reaching impacts on the morphology of the river. Initially, the morphological changes are noticed where the riverbanks are composed of highly erodible materials, i.e., at the downstream reach of the Gorai in the immediate upstream of Bardia (Figure 4.2). The sinuosity of the reach has increased from 1.75 to 2.20 (Table 4.2). EGIS (2000a) found that the rate of erosion and accretion along the reach were reduced by 20% and 30%, respectively for the periods 1973-1984 to 1984-1997. It was found that the river had already reduced in width by 10% during this period.
4.7
Future of the Gorai River
Under natural conditions, a distributary can decline or develop depending on the geological context, processes of delta development and natural hazards such as earthquakes, large floods, avulsion of rivers, etc. In such cases, the time required for the “dying” of a distributary like the other distributaries in the Ganges system is in the scale of hundreds to thousands of years, except in the case of natural hazards. When a large-scale human intervention occurs, it can modify the system as rapidly as a natural hazard. This is what is probably happening to the Gorai River. The crucial aspect of the rapid modification of any river system is that it does not allow the downstream ecosystem, physical and social environments to adjust with the new system without causing major destruction. For example, the study done by Karim (1994) shows that the increase in salinity since the mid-1970s (resulting from the decreased dry season flow of the Gorai River) has reduced timber production in the Sundarbans mangrove forest and has also changed mangrove species distribution within it.
Morphology of the Ganges-Gorai System D ecem ber
N o vem b er 7000 Treaty
3
8000
Discharge (m 3/s)
12000 /s)
8000
Discharge (m
14000
10000
Non-treaty
6000 4000 2000 0 1965
6000 Treaty
5000
3000 2000 1000
1970
1975
1980
1985
1990
1995
0 1965
2000
1970
3000 Treaty
Discharge (m
Discharge (m 3/s)
4000
3000
Non-treaty
2500 2000 1500
1985
1990
1995
2000
2500 Treaty
N on-treaty
2000 1500 1000 500
1000 1970
1975
1980
1985
1990
1995
0 1965
2000
1970
1975
Ye ar
1980
1985
1990
1995
2000
Ye ar
March
April
3000
3000
2500
2500
Treaty
2000
Discharge (m 3/s)
Discharge (m 3/s)
1980
Fe bruary 3500
3
/s)
Janu ary
3500
1975
Ye ar
4500
Non-treaty
1500 1000 500 0 1965
N on-treaty
4000
Ye ar
500 1965
75
Treaty
Non-treaty
2000 1500 1000 500
1970
1975
1980
1985
Ye a r
1990
1995
2000
0 1965
1970
1975
1980
1985
1990
1995
2000
Yea r
Figure 4.17. Mean monthly flow (November to April) in the Ganges River at the Hardinge Bridge.
It was observed that during the post-Farakka period, the dry season flow of the Ganges is declining but for the Gorai River both dry season and monsoon flows are decreasing rapidly. The absence of a water-sharing treaty between Bangladesh and India has worsened the situation. Considering the existence of the prevailing treaty, EGIS (2000a) predicted that due to the changes in the post-monsoon hydraulic regime of the Ganges in the post-Farakka period and due to the deterioration of the Gorai off-take through massive sedimentation over the last decades, restoration of the dry season and monsoon flow of the Gorai are not possible without human intervention. Favourable planform of the Ganges River could prevent the entry of excess sediment into the Gorai and arrest the prevailing declining trend of the ratio of the Gorai/Ganges flow for the time being only. During the period from 1975 to 1998, before the intervention to augment the dry season flow through dredging the riverbed on a pilot basis, the ratio of the Gorai/Ganges flow was continuously decreasing. In this period, the river has experienced both favourable and
76
Maminul Haque Sarker
unfavourable planforms and existence and absence of the water-sharing treaty. This implies that the observed trend of the declining ratio of the Gorai/Ganges flow (Figure 4.15) is the result of water being diverted through the Farakka Barrage and the associated factors listed in Table 4.6. Some of these factors were actually relatively favourable for the Gorai River but some aggravated the situation. If the current trend is extended, the ratio of the flow will be reduced to 0.03 in the next 30 years i.e., in 2030. In that situation the Gorai River will be merely a flood spill channel of the Ganges. Table 4.6. Different aspects that have influenced the Gorai flow (1975-1996) in addition to the Farakka Barrage
Aspects
Period
Effect
Planform
1975-1985 1986-1998 1987-1992
+ +
1975-1987 (except 1976) 1988-1996
+
Severe upstream bank erosion along the right bank Existence of water-sharing treaty Absence of water-sharing treaty
-
The likely developments of the different aspects that will influence the Gorai flow (without any interventions to augment the flow) in the next 3 decades are presented in Table 4.7. Based on the table, an optimistic scenario up to 2030 can be assumed: (i) the planform of the Ganges River will be favourable for the Gorai River, (ii) there will be no bank erosion in the upstream of Talbaria and (iii) there will be a renewal of the water-sharing treaty after 2026. This is better than what had occurred during 1975-1996. In this case, the rate of decrease in the Gorai flow as observed (Figure 4.15) could be slowed down and the ratio of the Gorai/Ganges flow could be higher than 0.03 in 2030. A pessimistic scenario up to 2030 could be assumed as well: (i) the planform of the Ganges River will never be favorable for the Gorai River, (ii) severe bank erosion will occur in the upstream and continue for a longer period (iii) there will be no renewal of the water-sharing treaty after 2026 and (iv) there will be less water available in the Ganges (within Bangladesh) than was negotiated during the less water in the upstream of the Farakka Barrage resulting from the withdrawal of more water in the upstream) (Mirza, 2002). This situation is worse than what is presented in Table 4.6. In this case, the ratio of the Ganges/Gorai flow could be less than 0.03 in 2030. Considering a situation between the optimistic and pessimistic scenarios, Sarker and Koudstaal (1999) predicted that by 2030 the average opening period for the flow would be limited to 4 months/year and that the average flood flow would be 2,000 m3/sec only. Further extrapolation of the trend showed that by 2050 the situation would be worse with
Morphology of the Ganges-Gorai System
77
almost no flow through the Gorai. The resulting salinity intrusion and drainage congestions in the Southwest region could create havoc for the environment in the Southwest region as well as in the Sundarbans. Table 4.7. Different aspects that will influence the Gorai flow (2003-2030) in addition to the Farakka Barrage (without any interventions)
Aspects
Period
Effect
Planform
2003-2010 2011-2030 2003-2030
+/-* +/-
2003-2026 2026-2030
+ +/-
Severe upstream bank erosion along the right bank Existence of water-sharing treaty** Existence/Absence of water-sharing treaty**
*
‘+/-‘ represents an uncertain situation. The existing water-sharing treaty will expire in 2026.
**
4.8
Discussion and Concluding Remarks
A reliable quantification to assess the effect of any intervention on the river morphology of an alluvial river is difficult. It is indeterministic in the analytical point of view. Scarcity of upstream data makes the assessment even more difficult. On the other hand, availability of time series satellite images facilitates close monitoring of the changes in river planform. Lane’s qualitative model helps to explain the historical changes as well as the recent changes in the river. Although it was not possible to estimate the amount of sediment storage upstream of the Farakka Barrage, it can be said that there were some temporary storage upstream of the barrage which is partly liable for the increase in the sinuosity of the Ganges from the Farakka Barrage to the Hardinge Bridge. It is true that the Farakka Barrage is partly responsible for the net erosion that has occurred both in India and Bangladesh (Table 4.4), but it will not be possible to quantify the extent to which nature and the Farakka Barrage is each responsible for causing a net erosion of 17,500 ha during 1980-1999. Even, in a dynamic equilibrium system, a river is never restored to its previous condition due to the continuous changes in its boundary conditions over time (Richards, 1982). It is likely that the Ganges will not be restored to its pre-Farakka condition even when the equilibrium sediment transport establishes after filling the storage in the upstream of the barrage. Therefore, an exact prediction is not possible, even if it were possible to know the sediment storage. The only prediction that can be made is that the sinuosity will
78
Maminul Haque Sarker
decrease and a net accretion will occur along the Ganges from the Farakka Barrage to the Hardinge Bridge in the coming years. The reason for the sustaining of an unusually straight planform in the downstream of the Hardinge Bridge has remained unknown. The guide bunds of the Hardinge Bridge and the associated bank protection structures have a role in controlling the planform a few kilometers downstream of the bridge. This however, does not explain the behavior of the remaining 60 km in the downstream reach of the Ganges River. In addition to the unfavorable planform of the Ganges around the Gorai mouth, the changes in the hydraulic regime of the Ganges River brought about by the operation of the Farakka Barrage causes sedimentation at the mouth of the Gorai River. Different studies carried out over the last decades have come to the same conclusion that the shortening of the recession period of the Ganges River during the post-Farakka restricts the development of dry season channel through retarded scour and therefore the accumulated sediment remains at the mouth of the river during the monsoon. The planform of the Ganges River around the Gorai off-take has a significant impact upon the flow regime. Favorable and unfavorable planform changes might occur in a cyclic order. But no such evidences were observed from the presently available imagery data series of the last 30 years. In any case, the Gorai is not likely to be able to regain its pre-Farakka state. Considering all the factors that are involved in the processes of decrease in the Gorai flow, it can be assumed that in a situation of autonomous development, the river will die within the decade time-scale. Then again, different estimates based on different assumptions may yield different number of decades. It is most likely that there will be human interventions to restore the Gorai River for the sake of the overall environment of the Southwest region of Bangladesh as well as the Sundarbans, the world’s largest mangrove forest. During the last decades the morphology of the Gorai has changed in response to the changes in hydraulic regime. The changes include - raising the riverbed in the upstream reaches, reducing the bankfull width and increase in sinuosity in the downstream. In the future, the situation will be worsening and restoration of the Gorai flow through human interventions will be more difficult than present.
Acknowledgement Many of the analysis and results presented in this chapter are done under the framework of various CEGIS and EGIS projects. The author gratefully acknowledges the works of his colleagues involved in these projects. Special thanks go to Yasmin Khayer, Mohammad Altaf Hossain and Nazneen Akhter for their contributions in processing and analyzing data results which are used in this chapter. The author also thanks Asifa Rahman and Iffat Huque of CEGIS for editorial suggestions.
Morphology of the Ganges-Gorai System
79
References Bagnold, R.A.: 1962, Auto-Suspension of Transported Sediment, Proceedings of Royal Society A(1322), England. Burnett, A.W. and Schumm, S.A.: 1983, Alluvial-River Response to Neotectonic Deformation in Louisiana and Mississippi, Science 222, 49-50. CEGIS: 2003, Ganges River: Morphological Evolution and Predictions, Prepared for Water Resources Planning Organization (WARPO), Dhaka, Bangladesh. Crow, B., Lindquist, A. and Wilson, D.: 1995, Sharing the Ganges: The Politics and Technology of River Development, University Press Ltd., Dhaka, Bangladesh. Delft Hydraulics and DHI (FAP 24): 1996a, Bed Material Sampling in Ganges, Padma, Old Brahmaputra and Jamuna, Special Report No. 8, Prepared for Water Resources Planning Organization (WARPO), Dhaka, Bangladesh. Delft Hydraulics and DHI (FAP 24): 1996b, Sediment Rating Curves and Balances, Special Report No. 18, Prepared for Water Resources Planning Organization (WARPO), Dhaka, Bangladesh. Delft Hydraulics and DHI (FAP 24): 1996c, Morphology of the Gorai off-take, Special Report No. 10, Prepared for Water Resources Planning Organization (WARPO), Dhaka, Bangladesh. Delft Hydraulics and DHI (FAP 24): 1996d, Sediment Transport Predictors, Special Report No. 13, Prepared for Water Resources Planning Organization (WARPO), Dhaka, Bangladesh. Delft Hydraulics and DHI (FAP 24): 1996e, Bathymetric Surveys, Special Report No. 3, Prepared for Water Resources Planning Organization (WARPO), Dhaka, Bangladesh. DHV-Haskoning & Associates: 2000, Feasibility Report, Volume III, Annex C, Gorai River Restoration Project, Prepared for Bangladesh Water Development Board (BWDB), Dhaka, Bangladesh. EGIS: 2000a, Environmental Baseline of the Gorai Restoration Project, Prepared for Bangladesh Water Development Board (BWDB), Dhaka, Bangladesh. EGIS: 2000b, Riverine Chars in Bangladesh: Environmental Dynamics and Management Issues, University Press Limited (UPL), Dhaka, Bangladesh. EGIS: 2002, Developing and Updating Empirical Method for Predicting the Morphological Changes in the Jamuna River, EGIS Technical Note Series No. 29, Dhaka, Bangladesh. Engelund, F. and Hansen, E.: 1967, A Monograph of Sediment Transport in Alluvial Streams, Teknisk Forlag, Copenhagen, Denmark. Galay, V.J.: 1983, Causes of Riverbed Degradation, Water Resources Research 19(15), 1057-1090. Goodbred Jr., S.L. and Kuehl, S.A.: 2000, The Significance of large sediment supply, active tectonism, and eustasy on sequence development: Late Quaternary Stratigraphy and evolution of the Ganges-Brahmaputra Delta, Sedimentary Geology 133(2000), 227-248. Goswami, U., Sarma, J.N. and Patgiri, A.d., 1999, River Channel Changes of the Subansisri in Assam, India, Journal of Geomorphology 30, 227-244. Halcrow and Partners Ltd., DHI, EPC Ltd. and Sthapati Sangshad Ltd, (FAP 4): 1993, Morphological Studies: Southwest Area Water Resources Management Project, Prepared for Flood Plan Coordination Organization (FPCO), Dhaka, Bangladesh. Haque, C.E.: 1997, Hazards in a Fickle Environment: Bangladesh, Kluwer Academic Publishers, Dordrecht, the Netherlands. Karim, A.: 1994, Environmental Impacts. In: Z. Hussain and G. Acharya (eds.), Mangroves of the Sundarbans, Vol. 2: Bangladesh, The IUCN Wetlands Program, Gland, Switzerland. Khan, F.H: 1991, Geology of Bangladesh, The University Press Ltd., Dhaka, Bangladesh. Klaassen, G.J.: 1995, Lane’s balance revisited, Proceedings of 6th International Symposium on River Sedimentation, New Delhi, India. Kondolf, G.M., Piegay, H. and Landon, N.: 2002, Channel response to increased and decreased bed load supply from land use change: contrasts between two catchments, Geo-morphology 45, 35-51.
80
Maminul Haque Sarker
Lane, E.W.: 1955, The importance of fluvial morphology in hydraulic engineering, Proceedings of ASCE 21(745), 1-17. Leopold, L.B. and Wolman, M.G.: 1960, River Meanders, Bulletin of the Geological Society of America 71, 769-794. Mazumder, S.K.: 2000, Role of Farakka Barrage on the Disastrous Flood at Malda (West Bengal) in 1998, Proceedings of 8th ICID International Drainage Workshop, January 31-February 4, 2000, New Delhi, India. Mirza, M.M.Q.: 1997, Hydrological changes in the Ganges system in Bangladesh in the post-Farakka period, Hydrological Sciences Journal 42(5), 613-632. Mirza, M.M.Q.: 2002, The Ganges water-sharing treaty: risk analysis of the negotiated discharge, International Journal of Water 2(1), 57-74. Meyer-Peter, E. and Mueller, R.: 1948, Formulas for Bed-Load Transport, Paper presented in the “Second International IAHP Congress”, Stockholm, Sweden. Richards, K.S.: 1982, Rivers: Form and Process in Alluvial Channels, Methuen, London, UK. Sarker, M.H. and Koudstaal, R.: 1999, Fate of the Gorai River-A Distributary of the Ganges River, Proceedings of Regional Seminar on Conflict Management of International River Basins, BUET, Dhaka, Bangladesh. Sarker, M.H., Huque, I., Alam, M., and Koudstaal, R.: 2003, Rivers, chars, and char dwellers of Bangladesh, International Journal of River Basin Management 1, 61- 80. Sarker, M.H., Kamal, M.M. and Hassan, K.: 1999, Identifying the morphological changes of a distributary of the Ganges in responses to the declining flow using remote sensing, Proceedings of 20th Asian Conference on Remote Sensing, Hong Kong. Sarker, M.H. and Thorne, C.R., 2003; Morphological evolution of the Brahmaputra-Padma-L. Meghna Braided River System, Abstract in Proceedings of Conference on Braided River 2003, University of Birmingham, UK. Simon, A.: 1989, A model of channel response in disturbed alluvial channels, Earth Surface Processes and Landforms 14, 11-26. Schumm, S.A.:1967, River metamorphosis, Proc. Of American Society of Civil Engineers, Journal of Hydraulic Division 95, 255-273. Umitsu, M.: 1993, Late Quaternary Sedimentary Environments and Land Forms in the Ganges Delta, Sedimentary Geology 83(1993), 177-186. Van Rijn, L.C.: 1992, Principles of Sediment Transport in Rivers, Estuaries, Coastal Seas and Oceans, Lecture Notes, International Institute for Hydraulic and Environmental Engineering (IHE), Delft, the Netherlands. Verghese, B.G.: 1999, Water of Hope: From Vision to Reality in Himalaya-Ganga Development Cooperation, University Press Ltd., Dhaka, Bangladesh. Willcocks, S.W.: 1930, Lectures on the Ancient System of Irrigation in Bengal and Its Application to Modern Problems, University of Calcutta. Williams, C.A.: 1919, History of the Rivers in the Ganges Delta 1750-1918, Bengal Secretariat Press, 1919, Reprinted by East Pakistan Inland Water Transport Authority, 1966. Yang, S., Zhao, Q. and Belkin, I.M.: 2002, Temporal variation in the sediment load of the Yangtze River and the influence of human activities, Journal of Hydrology 263, 56-71.
5 EFFECTS ON WATER SALINITY IN BANGLADESH M. Monirul Qader Mirza Adaptation and Impacts Research Group (AIRG), Institute for Environmental Studies (IES), University of Toronto, 33 Willcocks Street, Toronto, ON M5S 3E8 Canada Maminul Haque Sarker Center for Environmental & Geographic Information Services (CEGIS) House # 6, Road # 23/C Gulshan-1, Dhaka 1212 Bangladesh
5.1
Introduction
The diversion of Ganges water in India by the Farakka Barrage and other engineering structures has resulted significant changes in the hydrology of the Ganges River system in Bangladesh. The system is comprised of the main Ganges River; the Mahananda, an important tributary; and the Mathabanga and Gorai, two distributaries. The analysis of discharge data of the Ganges and Gorai Rivers discussed in Chapter 2 demonstrate a significant reduction of water supply in the dry season and a considerable increase in the monsoon. Reduction in dry season discharge in the Ganges system in Bangladesh has generated a series of hydro-environmental implications. The Ganges basin in the Southwest region of Bangladesh receives freshwater through two river systems: Gorai-Modhumati-Nabaganga and Mathabanga-Bhairab-Kobadak (Figure 5.1). They are also termed ‘inland rivers’ (Sir William Halcrow and Partners Ltd., 1993). The Gorai-Modhumati-Nabaganga system, the most important, used to receive a significant amount of water from the Ganges River. The Bhairab is an ancient river system, which flows Southeast from the Ganges-Mathabanga to Khulna. The upper Bhairab has been declining for more than two centuries. The lower reach below Jessore remains active as the river becomes more tidal. For these river systems, rainfall is another source of freshwater mainly in the monsoon. These rivers also receive base flow in the dry season from ground water. Table 5.1 shows the rainfall, runoff and recharge rates in some selected drainage complexes in this region of Bangladesh. The Southern part of the region is dominated by tidal river systems: Raimangal, Malancha, Sibsa, Passur and Baleswar. The tidal wave propagates into the region through 81 M. Monirul Qader Mirza (ed.), The Ganges Water Dispersion: Environmental Effects and Implications, 81–102. © 2004 Kluwer Academic Publishers. Printed in the Netherlands.
82
M.M.Q. Mirza and M.H. Sarker
Figure 5.1. River systems of the Southwest Region of Bangladesh.
these major tidal rivers. The speed of propagation in the rivers varies due to their different cross sectional areas and thus the water levels in adjacent rivers can differ. The tidal rivers contribute salinity intrusion in the region. Freshwater flows from upstream rivers check in
Effects on Water Salinity
83
Table 5.1. Rainfall, runoff and recharge rates in some drainage complexes
Drainage Complex Upper BhairabMathabanga Kaliganga-KumarNabagangaChitra Begabati-ChitraBhairab Gorai-MadhumatiChandanaBarasia Betna-Kobadak
Area (km2)
Rainfall (mm)
Runoff (mm)
Ground Water Recharge (mm)
Runoff Coefficient
1,510 2,813
1,513 1,709
699 732
504 419
0.46 0.43
2,142
1,692
642
503
0.38
2,068
1,699
792
428
0.46
1,462
1,656
658
561
0.40
Source: Sir William Halcrow and Partners Ltd., 1993.
intrusion as well as lower the intensity of salinity. The river system of the Southwest region of Bangladesh starts to be affected by coastal saline water inflow in November, and reaches to a maximum in April and May in response to the magnitude water supply from the Ganges. It is therefore important to investigate the empirical relationship between the flow of the Ganges and Gorai Rivers and salinity in the region. The investigation will help to quantify the amount of water required to check salinity at suggested levels for various purposes. Using the empirical relationships for selected months, salinity levels are projected under the Ganges Water-Sharing Treaty (GWST) signed between Bangladesh and India in December, 1996 (see Annex I).
5.2
Dynamics of River Salinity in the Southwest Region
River salinity in the Southwest region of Bangladesh depends largely on the discharge of the Gorai. This is particularly true for salinity in the Nabaganga-Passur system through which most of the Gorai flow enters the Bay of Bengal. Through the lateral tidal movement and discharge distribution, the Gorai flow influences the salinity beyond the Rupsa-Passur system. During the monsoon, Gorai flow reduces the salinity close to the bay, influencing the salinity at the mouths of nearby large rivers like the Sibsa and Malancha. Salinity in an estuary is very much season dependent. Both monsoon and dry season flow of the Gorai River have effects on salinity. The monsoon flow of the Gorai reduces the salinity near the Bay of Bengal. Since 1988, the Gorai River had ceased to flow during the dry season. From mid May to early June, the river starts to flow with the increase of flow in the Ganges River. A very small flow (25 m3/sec to 50 m3/sec) can influence the salinity at Khulna and Mongla (Figure 5.2a), reducing the salinity downstream but this range of flow may not have any influence on the salinity at Hiron Point. Surface runoff generated from monsoon rain also has influence in reducing the salinity, but the Gorai flow is the main
84
M.M.Q. Mirza and M.H. Sarker
contributor in this regard. When the Gorai flow reaches a range of 100 m3/sec-200 m3/sec, the salinity at Khulna reduces significantly. Salinity at Mongla remains about 1,000 m-mhos when the Gorai flow reaches 2,000 m3/sec. With further increase in flow, salinity at Mongla becomes zero. Generally, an estuary reacts differently during increasing and decreasing discharges. The time lag between the increase of discharge from a steady state to another steady state and the corresponding changes in salinity is much less than the time required to increase the salinity due to the decreasing discharge from one steady state to another. Phase lagging between the increase of Gorai flow and the subsequent decrease in salinity would be small and could not be noticed from measured salinity. But the salinity at Hiron Point measured in a high temporal scale (hourly measurement) was found to react with the pulses of the flow (Figure 5.2b). It shows nearly a 15 days phase lagging. However, salinity at Hiron Point is not less than 2,500 m-mhos, even when the Gorai flow exceeds 6,000 m3/sec. Since the late 1980s the Gorai River has stopped flowing from December to early May and the duration of no flow periods varied from 110 to 180 days a year from 1988 to 1998 (EGIS, 2000). After the pilot priority works (dredging at the mouth of the Gorai River) the dry season flow was restored to some extent for 1999 to 2001. It has been found that the magnitude of the flood flow of the Gorai River does not have noticeable impact on the salinity at the Bardia, Khulna and Mongla. Rather, the period of continued flow during the dry season was the main factor. In 1988 the flood peak was more than 8,000 m3/sec, but the Gorai stopped flowing at the end of November. The peak flow was about 5,000 m3/sec in 1986 and the Gorai continued flowing during the dry season though the magnitude was very small (minimum flow was 20 m3/sec). The consequent impact on salinity was very significant especially at Bardia, Khulna and Mongla. In the former period monthly maximum salinity was several times higher at Bardia, nearly double at Khulna, and 70% higher at Mongla than the later period. Similar phenomena can be observed for the case of discharges in 1994 and 1997 and the subsequent salinity at the same locations (Figure 5.3). With the decreasing discharging at a certain stage (e.g. below 2,000 m3/sec) the salinity of Hiron Point started to increase (Figure 5.2) in mid-October, while the salinity at Mongla started to increase in mid-November. The phase lag between the salinity build up from Hiron Point to Mongla was about a month. Figure 5.3 also shows the phase lag of increasing salinity between Mongla to Khulna and Khulna to Bardia. In both cases, the salinity at Mongla starts to increase in November or December, at Khulna in January and at Bardia in February. The salinity data shown in Figure 5.3 are the monthly maximum salinity. Therefore, it is very difficult to estimate the phase lag between these locations accurately. Preliminary assessment is that the phase lagging of increasing in salinity between Mongla to Khulna and Khulna to Bardia is about a month, implying that the time required to build up the salinity from Hiron Point to Bardia is more than three months. It should be mentioned here that the salinity at Bardia can be noticed only if the Gorai flow ceases in the dry season. To reach equilibrium salinity in a system or at a particular location from one steady state of discharge to another steady state takes several months to a year (Van Dam and
Effects on Water Salinity
85
Schönfeld, 1967), and varies from estuary to estuary (Savenije, 1992). It is very difficult from the field data to estimate the time to reach the salinity at an equilibrium situation for a particular steady state of flow, since before reaching the salinity in equilibrium, a new steady state of discharge would disrupt the process. Salinity, 1991 Salinity (m-m hos)
Salinity
40,000
Hiron Point
(a)
30,000
30,000 Mongla
20,000 10,000
Hiron Point
Khulna
0 1-May
Mongla
20,000
Mongla
10,000
Hiron Point Khulna
0 1-Apr
1-Aug
100 50 0
1-Oct
1-Dec
31-Jan
Salinity 15,000 Hiron Point
10,000
6,000 5,000
5,000 Mongla 0 1-Jul
4,000
16-Jul
31-Jul
15-Aug
Date
Discharge
3,000
D ischarge (m3/s )
Discharge (m3 /s)
7,000
31-May
(a) Salinity (m -mhos)
Discharge in the Gorai River, 1991
16-May Date
1-Apr
Date
2,000 1,000 0 1-Apr
31-May
150
1-May
1-Jun
16-May Date
Discharge
(b)
D ischar ge (m3/s)
Salinity (m-mhos)
50,000
4,000
2,000
0 1-Jul
1-Jun 1-Aug 1-Oct 1-Dec 31-Jan 1-Apr Date
16-Jul
31-Jul
15-Aug
Date
(b)
Figure 5.2. Measured salinity at Hiron Point, Mongla and Khulna in 1991 by SWMC (predecessor of IWM) and the flow through the Gorai.
In the Nabaganga-Rupsa-Passur system, a steady state of discharge (i.e. no flow during the dry season in the Gorai) persisted from 1988 to 1998 for a long time, averaging five months a year. The salinity at Hiron Point, Mongla, Khulna and Bardia (Figures 5.2 and 5.3) shows a continuous increase of salinity for approximately six months or more. It would probably continue if the discharge of the Gorai or the local runoff generated from pre-monsoon rainfall (April-May) does not break the condition of the steady state of discharge in the system. However, it is a reasonable assumption that to reach equilibrium salinity for a steady state of discharge this system requires more than six months.
86
M.M.Q. Mirza and M.H. Sarker
Discharge at Gorai Gor ai Rly. Bridge Br idge 1986- 87
Discharge at Gorai Rly. Bridge 1988-89
8,000 6,000 4,000 2,000
D isc h a r g e (m3 /s)
D is c h a rg e ( m3 /s)
10,000
1-Aug
1-Oct Da te
1-Dec
31-Jan
2,000 1,000 1-Oct
1-Dec
31-Jan
Max. monthly salinity at Bar dia
1986- 87
S alin it y (m - m h o s)
Sa lin ity (m -m ho s)
1-Aug
Date
15,000 1988-89
12,000 9,000 6,000 3,000 0
15,000 1994-95
1997-98
12,000 9,000 6,000 3,000 0
NOV
DEC
JAN
FEB
MAR
APR
MAY
NOV
Mon th
1986- 87
25,000 20,000
S alin it y (m - m h o s)
30,000
DEC
JAN
FEB
MAR
APR
MAY
Max. monthl y sali niMont ty a thKhulna
Max. monthly salinity at Khulna Sa lin ity (m -m ho s)
1997-98
3,000
Max. monthly salinity at Bardia
1988- 89
15,000 10,000 5,000 0
30,000
1994-95
1997-98
25,000 20,000 15,000 10,000 5,000 0
AR APR M AY NOV DEC JAN FE B M MAR MAY Month Max. monthly sali nity at Mongla 1986-87
NOV DEC JAN FEB MAR APR MAY Month Max. monthly salinity at Mongla 30,000
1988-89
S alinit y (m - mhos)
30,000 S alinit y (m - m ho s)
1994-95
4,000
0 1-Jun
0 1-Jun
5,000
25,000 20,000 15,000 10,000 5,000
1994-95
1997-98
25,000 20,000 15,000 10,000 5,000 0
0 NOV
DEC
JAN
F EB Mo nth
MAR
APR
MAY
NOV
DEC
JAN
FEB
MAR
APR
MAY
Mont h
Figure 5.3. Influence of the monsoon and dry season flow of the Gorai River on the monthly maximum salinity at Mongla, Khulna and Bardia.
Effects on Water Salinity 5.3
87
The Data
For this study, hydrological and salinity data were collected from a number of agencies in Bangladesh. Temporal scale discharge data (1965-1998) were derived from the BWDB (2002) daily data set. For the Gorai River, daily discharge data obtained from the BWDB (2002) for the period 1964-1995. Station-wide monthly maximum salinity data (measured at 25oC) for various periods for the stations Bardia, Khulna, Goalpara Power Station, Chalna and Mongla (Figure 5.1) have been supplied by the Indo-Bangladesh Joint Rivers Commission. Measured salinity data used in Figure 5.2 were collected and processed by the Institute for Water Modeling (IWM) (formerly, Surface Water Modeling Center), Dhaka.
5.4
Analytical Methods
Four specific analysis were performed: (1) changes in salinity in the pre- and post-Farakka periods have been carried out; (2) effects of the reduced flow in the Gorai River on salinity were examined by fitting logarithmic equations to monthly mean discharge (for details see Chapter 2) and maximum salinity data at Khulna station. Discharge requirements for the Gorai River for the two threshold salinity levels for February, March and April were determined from the fitted equations. The corresponding discharge for the Ganges at Hardinge Bridge was determined from the linear regression relationships between the monthly mean discharge of the Gorai and Ganges Rivers under certain assumptions. The adequacy of the regression models was checked by standard methods; (3) analysis of ground water salinity were also reported; and (4) implications of the Ganges Water-Sharing Treaty on the salinity of Khulna station were examined.
5.5
Reduced Dry Season Flow and Effects on Salinity
5.5.1
SURFACE WATER SALINITY
A vast network of rivers in the Southwest region of Bangladesh is dependent on the water supply through the Gorai River (Figure 5.1). Water from this river is used for irrigation, industry and urban water supply. Most importantly, the Gorai River flow opposes away the saline waterfront in the Passur River, near Khulna. Monsoon flow is adequate for repelling the salinity intrusion. The dry season flow of the Gorai River is most critical in controlling salinity in a large part of the Southwest region of Bangladesh. Generally, with the decrease of the Gorai flows, the average salinity at Khulna and adjacent areas starts to increase. During spring tides, a very large increase in salinity is noticed. Stronger spring tides push more saline water into the Rupsa-Passur River, but during the following neap tide, the salinity is not totally flushed out. Therefore, a successive build up of salinity occurs with each tidal cycle, which requires sufficient supply of water from the Gorai River to flush it out (MPO, 1987).
88
M.M.Q. Mirza and M.H. Sarker
During the post-Farakka period, salinity in this region of Bangladesh increased significantly (Table 5.2). For example, at the Khulna station, the average monthly maximum salinity for April in the pre-Farakka period was 1,626 micro-mhos/cm (hereinafter referred to as m-mhos/cm). During 1976, when the Gorai discharge declined to 0.5 m3/sec from its pre-Farakka average of 190 m 3/sec, maximum salinity in April increased to 13,000 m-mhos/cm. The Farakka Barrage was commissioned in April 1975 and India unilaterally withdrew water from June 1975 to November 1977. Note that natural causes, which influence the inter-annual variations of salinity might also have had some effect. The salinity situation started to improve after the signing of the 1977 Ganges Water Sharing Agreement. When the Second MOU expired in 1988, the salinity situation again deteriorated. The 500 m-mhos/cm salinity front moved 241 km from the coast in 1986 (MPO, 1986) to 280 km in 1992 (Khan, 1993). The highest salinity ever recorded was in 1992 for February, March and April when the flow in the Gorai River was zero. The April salinity rose to 29,500 m-mhos/cm, 1,800% higher than the pre-Farakka average. How much river flow is required to keep salinity at tolerance levels for agriculture and human consumption? In order to determine the required flows, an empirical analysis has been conducted. The monthly maximum salinity at Khulna station, and monthly mean discharge at Hardinge Bridge for the Ganges River, and at Gorai Railway Bridge for the Gorai River, were considered for the empirical analysis. The analysis was accomplished in two stages. (1) Monthly salinity was plotted against monthly mean discharge, which demonstrated a non-linear relationship. Blühdorn and Arthington (1995) also reported a non-linear relationship between discharge and salinity while assessing the effects of regulation for Barker Creek in Australia. Regression analysis were conducted for three critical dry months - February, March and April and are shown in Figure 5.4. Statistica™ software was used to fit the non-linear relationship between monthly mean discharge of the Gorai River and the maximum salinity at Khulna station. The model {S = a1 + a2 *log10(Q)} parameters were determined using the least square estimation procedure as it aims to minimize the sum of the squared deviations of the observed values for the dependent variable from those predicted by the model. Quasi-Newton estimation procedure 1 was used to minimize the least square loss function {Loss = (Observed-Predicted)2}. Convergence criterion was fixed at 0.0001. The non-linear regression models’ parameters, standard errors and R2 values are shown in Table 5.3.
1
The slope of a function at a particular point can be computed as the first-order derivative of the function at that point. The “slope of the slope” is the second-order derivative, which tells how fast the slope is changing at the respective point, and in which direction. The Quasi-Newton method, at each step, evaluates the function at different points in order to estimate the first-order derivatives and second-order derivatives. It then uses this information to follow a path towards minimum of the loss function.
293
340
2,600
2,300
Khulna
Goalpara Power Station
Chalna
Mongla
3,900
2,625
397
371
7,880
11,510
1,303
3,396
February PrePostFarakka Farakka
7,500
8,950
750
467
11,075
17,310
4,422
8,305
March PrePostFarakka Farakka
11,800
8,675
1,320
1,626
17,150
2,1927
7,422
12,149
April PrePostFarakka Farakka
13,500
12,000
786
1,508
17,100
19,009
5,456
11,208
May PrePostFarakka Farakka
* Salinity expressed in m-mhos/cm and measured at 25oC. Source: Mirza, 1996, Environmental Management 22(5), 711-722. Reproduced with the permission of Springer-Verlag New York Inc.
5,200
6,280
515
1,254
January PrePostFarakka Farakka
Station
Table 5.2. Pre- and post-Farakka monthly maximum salinity* at four stations in the Southwest region in Bangladesh
Effects on Water Salinity 89
90
M.M.Q. Mirza and M.H. Sarker
8000
6000 FEBRUARY
2
S
R = 80.1% 4000
S = -2913.5*log10 (Q) + 7480.4
2000
0 0
50
100
150
200
250
300
350
Q Figure 5.4a.
16000
S
12000
2 R = 80%
MARCH
8000
S = -5381.8*log10 (Q) + 14155
4000
0 0
60
120
180 Q
Figure 5.4b.
240
300
400
Effects on Water Salinity
91
30000 24000
2
R = 72%
APRIL
S
18000 S = -7936*log10 (Q) + 20668 12000 6000 0 0
40
80
120
160
200
240
Q Figure 5.4c. Figure 5.4a, b, and c. Empirical relationship between monthly mean discharge (m3/sec) at Gorai Railway Bridge for the Gorai River and monthly maximum salinity (m-mhos/cm). Source: Mirza, 1996, Environmental Management 22(5), 711-722. Reproduced with the permission of Springer-Verlag New York Inc. Table 5.3. Parameters, standard errors and R2 values for the salinity prediction models
Month
January February March April May
Model Parameters a2 a1
4,450.0 (t18 = 8.50) 7,480.4 (t20 = 12.70) 14,155.2 (t19 = 10.98) 20,677.7 (t19 = 10.98) 27,726.3 (t20 = 7.67)
-1,756.5 (t18 = -3.93) -2,913.5 (t20 = -8.97) -5,381.8 (t19 = -8.90) -7,936.3 (t19 = -6.94) -10,427.0 (t20 = -5.5)
Standard Error a2 a1
R2
524.0
261.0
71.6%
588.9
324.7
80.1%
1,001.1
1,143.9
80.0%
1,882.2
1,143.9
72.0%
3,617.1
1,898.1
60.1%
The t-values for the model parameters indicate that they are significantly different from zero. The R2 values are reasonably high which demonstrate that discharge of the Gorai River has explained most of the variance of the salinity. The parameters, standard error, and R2 values show the adequacy of the models to predict salinity at Khulna station. As a
92
M.M.Q. Mirza and M.H. Sarker
further check, normality of the models residuals was also examined. Although the patterns (not shown here) do not exactly fall on a straight line, Shapiro-Wilk test confirms that the residuals are normally distributed (except for February). (2) The correlation between monthly mean discharge for the Ganges River at Hardinge Bridge and the Gorai River at Gorai Railway Bridge was checked and found to be significant at the 95% confidence level. Then, linear regression relationships between monthly mean discharge for the Gorai and the Ganges Rivers were developed for the three months of the dry season (February-April). The results of the regression analysis are presented in Table 5.4. No observations were deleted from the sample. The low R2 values for March and April are possibly due to some unusual observations for the Gorai River in the post-Farakka period. For all regression equations, high t-values for the slopes indicate that they are significantly different from zero. The F-test for the significance of regression was also conducted (Draper and Smith, 1981). At the 95% confidence level the F values also indicate that slopes are non-zero. The residuals were checked by the standard procedures. The residual plots demonstrated a homoscedastic pattern. Additional checks were made by normal probability plots (Cook and Wesberg, 1982). These checks confirmed the normality of the residuals. Therefore, while there may be limitations to the explanatory power of the regression models, they are considered adequate to estimate the discharge requirements for the Gorai River for any given salinity levels. Table 5.4. Summary of the linear regression relationship between monthly mean discharge of the Gorai and the Ganges Rivers
Month
Intercept
Slope
R2
F
February
-49.1
0.098 (t = 4.89)
0.49
F1,25 = 24.00
March
-20.6
0.159 (t = 3.78)
0.36
F1,25 = 14.35
April
-51.00
0.101 (t = 3.41)
0.32
F1,25 = 11.70
Two salinity thresholds are considered in estimating the discharge requirements in the Gorai and Ganges Rivers. FAO (1976) recommended a 750 m-mhos/cm salinity level for irrigation. However, MPO (1987) accepted a level of 2,000 m-mhos/cm for the worst case scenario. The former threshold is also permissible for human consumption. The discharge requirements resulting from the analysis indicate that in order to keep salinity below either of the threshold limits at Khulna, it is required that April has the highest discharge of 240 m3/sec and 158 m3/sec as opposed to the current 52 m3/sec (Table 5.5). The estimated requirements are consistent with the pre-Farakka mean monthly discharge of the Gorai and Ganges Rivers. The analysis demonstrates the requirement of increased flow for the Ganges River at the Hardinge Bridge by as much as 1,844 m3/sec over the 1,044 m3/sec. The possible implications of increased salinity are discussed in the next sub-section.
Effects on Water Salinity
93
Table 5.5. Monthly mean discharge (in m3/sec) requirements for the Gorai and the Ganges Rivers to limit maximum salinity at 750 m-mhos/cm and 2,000 m-mhos/cm at Khulna
Gorai River Present 750 2,000 Discharge m-mhos/cm m-mhos/cm
Month
February March April
5.5.2
64 46 52
187 201 240
78 125 158
Ganges River 750 2,000 m-mhos/cm m-mhos/cm 2,015 1,951 1,844
1,466 1,573 1,585
GROUND WATER SALINITY
Rahman et al. (2000) analyzed the surface water salinity in the Southwest region of Bangladesh in the context of reduced flow in the Ganges and Gorai Rivers. Figure 5.5 shows the relationship between surface and ground water head of the Khulna and Mongla Port areas. It is evident that both the surface and ground water head maintain a simple harmonic pattern (i.e., conformity between surface and ground water levels). They also found a remarkable variation with time in the ground water quality. During the months of January, March and May, there is a progressive/gradual decline in both surface and ground water head, which has an influence on the quality of ground water. A gradual deterioration of ground water quality was observed in the water samples taken from shallow and deep tube wells in the study area. Distribution of samples in the Piper tri-linear diagram during January (1993) implies that alkalis exceed alkaline earths in all the ground water samples (Figure 5.6). However, four samples (5, 6, 8 and 11) that fall within filed-g are non-carbonate alkali type (primary salinity). This means their chemical properties are dominated by alkalis with high Cl- and SO42- content and water is Na-Cl type. Sample number 1 was collected during January and March and they fall within field-d, which indicates carbonate hardness and its chemical properties are dominated by alkaline earths and weak acids. Samples collected from the same location in May fall within field-g, which indicates non-carbonate alkali and means that its chemical properties are dominated by alkalis and strong acids (Figure 5.6). Ocean water and many brines fall in this area near the right-hand vortex. Some samples (2, 3, 4, 7, 9 and 10) from January, some from March (3, 9, and 10) and some from May (3, 9, and 10) fall within field-f (Figure 5.6), which indicates alkaline water where carbonate alkalis (primary alkalinity) exceeds 50% and gives ground water’s that are inordinately soft in proportion to the content of dissolved solids (Piper, 1953). The rest of the samples of different time periods are characterized by their position in the field-g. Samples that fall within field-g have already attained seawater status and are a warning of the severity of the seawater intrusion problem in the study area. The overall distribution of the analyzed samples in the piper diagram implies that the ground water of the study area has medium to high salinity, which means that the ground water is contaminated by mixing with saline water from the Bay of Bengal.
94
M.M.Q. Mirza and M.H. Sarker Rupsha river head GW-SWH relationship 2.2
Corresponding groundwater head Pasur river head
2.0
Corresponding
1.8
Water head (m)
1.6 1.4 1.2 1.0 0.8 0.6 0.4 0.2 1988
1989
1990
1991
1992
1993
Time (year)
Figure 5.5. Relationship between surface and ground water head. Source: Rahman et al., 2000, Environmental Geology 40(1-2), 31-40. Reproduced with the permission of Spinger-Verlag New York Inc.
5.6
Projection of Salinity under the Ganges Water-Sharing Treaty
Bangladesh and India signed a 30-year Treaty in December, 1996 to share the dry season (January-May) flow of the Ganges River at Farakka (Dixit and Mirza, 1997). For the sharing purposes, each month is divided into three 10-day periods. The average flow at Farakka for the period 1949-1988 was considered for sharing. The sharing arrangement (Table 5.6) is as follows: if the Ganges flow at Farakka is 1,984 m3/sec (70,000 ft3/sec) or less, both countries are to receive 50%; with a flow between 1,984 m3/sec and 2,126 m3/sec (70,000 ft3/sec and 75,000 ft3/sec). Bangladesh receives 992 m3/sec (35,000 ft3/sec), and India receives the rest subject to the condition that India and Bangladesh each shall receive guaranteed
Effects on Water Salinity
95
992 m3/sec of water in alternative three 10-day periods during the period March 1 to May 10; with a flow of 2,128 m3/sec or more, India receives 1,134 m3/sec (40,000 ft3/sec) and Bangladesh receives the balance. Table 5.7 shows the quantity of water Bangladesh and India are likely to receive under the above mentioned sharing formula.
Figure 5.6. Modified Piper tri-linear diagram showing the changes in the water quality of the study area with time: A January; B March; and C May. Source: Rahman et al., 2000, Environmental Geology 40(1-2), 31-40. Reproduced with the permission of Spinger-Verlag New York Inc.
96
M.M.Q. Mirza and M.H. Sarker
Table 5.6. Discharge thresholds and share of water for India and Bangladesh in the 1996 Ganges Treaty*
Availability at Farakka
Share of India
Share of Bangladesh
70,000 cusecs or less 70,000-75,000 cusecs 75,000 cusecs or more
50% Balance flow 40,000 cusecs
50% 35,000 cusecs Balance flow
* See Annex I for the Treaty.
For projecting salinity at Khulna station, mean monthly discharge values under the Treaty were calculated by averaging the share of Bangladesh in the 10-day periods in a given month from column 4 of Table 5.7. Using the empirical models developed earlier, projected salinity (subject to the condition of presence of discharge in the Gorai in the dry season) levels at Khulna station for various months of the dry season are shown in Table 5.8. The table also shows discharges at Gorai River corresponding to the discharges at Hardinge Bridge agreed upon in the Ganges Water-Sharing Treaty. During 1989-1996, there was no water-sharing arrangement between India and Bangladesh for the Ganges. Data available for the period 1989-1992 show that mean values of maximum salinity were 2,600 m-mhos, 6,813 m-mhos, 14,088 m-mhos, 21,666 m-mhos and 20,975 m-mhos, respectively for January, February, March, April and May. Therefore, if discharge values of the Treaty occur and the natural flow of the Gorai River is restored, maximum salinity at Khulna may be reduced by an average of 71%. Apart from the Gorai River discharge, other factors also influence salinity. It fluctuates semi-diurnally in a period of about 12 hours due to flood and ebb tides. Salinity varies fortnightly due to spring and neap tides. Astronomical and meteorological factors influence long-term trends.
5.7
Implications of Increased Salinity2 in Bangladesh
The diversion of Ganges water at Farakka and upstream has caused increased river salinity in the Southwest region of Bangladesh to intrude further inland. This has caused cascading effects for agriculture, forestry, industry and drinking water, as shown in Figure 5.7. Evidence suggests these sectors have suffered significantly as a result of salinity changes in recent years. A brief analysis of the effects is reported below. Details of the losses are discussed in Chapter 7, 9 and 12 on ecosystem, agriculture and vulnerability, adaptation and coping mechanisms.
2
This section has been reproduced with some modifications from Mirza (1996), Environmental Management 22(5), 711-722 with the permission of Springer-Verlag New York Inc.
Effects on Water Salinity
97
Table 5.7. Bangladesh and India’s share of water (m3/sec) in the Ganges Water-Sharing Treaty
Period
Average of 1949-1988 flow*
India’s share*
Bangladesh’s share*
January 1-10 11-20 21-31
3,048 2,769 2,556
1,134 1,134 1,134
1,914 1,635 1,422
February 1-10 11-20 21-28/29
2,447 2,349 2,242
1,134 1,134 1,134
1,313 1,215 1,108
March
1-10 11-20 21-31
2,109 1,954 1,834
1,117 962 992
992 992 841
April
1-10 11-20 21-30
1,791 1,775 1,729
799 992 737
992 783 992
May
1-10 11-20 21-31
1,909 2,086 2,320
992 1,094 1,134
917 992 1,186
* In the Treaty, the flow was shown in ft3/sec. Table 5.8. Projected salinity under the Ganges Water-Sharing Treaty
Month
Discharge (m3/sec) of the Ganges in the Treaty
Discharge (m3/sec) of the Gorai
Maximum salinity (m-mhos/cm)
January
1,649
104
908
February
1,219
70
2,110
March
939
129
2,802
April
922
42
7,755
May
1,037
135
5,517
- Financial loss - Emp loyment loss
Increased financial hardship and poverty
-Economic loss to farmers - Emp loyment loss
Increased financial hardship and poverty
More stress on family income
More health hazard
Loss in water quality
Increased surface and ground water salinity
Increased financial hardship and poverty
- Economic loss - Emp loyment loss
Loss of timber species
Increased forest water/ soil salinity
Figure 5.7. Increased salinity and its possible effects on various economic sectors. Source: Mirza, 1996, Environmental Management 22(5), 711-722. Reproduced with the permission of Springer-Verlag New York Inc.
Corrosion and leakages Sweet water importation
Increased surface and ground water salinity for industries
Loss in agricultural production
Increased irrigation water and soil salinity
Increased River Salin ity
Decreased Water Supply in the River
Upstream Diversion of Water
98 M.M.Q. Mirza and M.H. Sarker
Effects on Water Salinity 5.7.1
99
AGRICULTURE
All rice paddy varieties in Bangladesh are very sensitive to increases in water and soil salinity. Tolerance of rice paddy varieties to salt concentration is reduced sharply when the electrical conductivity exceeds 2,000 m-mhos/cm. For example, at 6,000 m-mhos/cm, the growth of plants (expressed in terms of weight) drops to below 50%. At 16,000 m-mhos/cm conductivity, crop yields approach zero (MPO, 1986) (Table 5.9). Salinity causes substantials harms to young plants which are less resistant to salt. The yield of rice is affected at the transplant stage using irrigation water with a salt concentration of only one-tenth that causes yield reduction after the panicle or the head of the crop emerges (Hussainy, 1987). 5.7.2
FORESTRY
An extensive network of tidal rivers and streams and small drainage channels has crisscrossed the Sundarbans (Figure 5.1). Four mangrove species are dominant in the Sundarbans. They are: Sundari (Heriteria fomes), Gewa (Excoecaria agallocha), Keora (Sonneratia apetala), and Goran (Ceriops decandra). These species require fresh water as well as saline water supplies for their regeneration and growth. The most diverse ecology in the Sundarbans is associated with the Sundari habitat, for which the optimum surface water salinity lies between 10 ppt and 15 ppt. High saline water is not good for the Sundari growth. Above 20 ppt Sundari growth and regeneration are poor (Khan and Vongvisessomjai, 2002). The adverse effects of increased salinity on the ecosystem of the Sundarbans (Figure 5.1) is displayed by the dying tops of Sundari (Heriteria fomes) trees, retrogression of forest types, slowing of growth of forest, and reduced productivity of forest sites (MPO, 1986). However, increases in salinity alone may not be responsible for the top dying of the Sundari trees (see Chapter 7 for details). This may be caused by a synergic effect of a number of factors including: salinity, sedimentation, water logging, cyclone damage, and accumulation of toxic elements from agricultural wastes and port discharge (Sir William Halcrow and Partners Ltd., 1993). Of these factors, observations demonstrate increases in salinity and sedimentation in the coastal rivers/creeks in the post-Farakka period. Information on other factors is not available although they might have some contributions to top dying of Sundari. The economic loss suffered from the Sundari trees is reported to be substantial. In the period 1975-1995, an estimated US$ 320 million timber loss was reported from effects of Farakka Barrage (Swain, 1996). 5.7.3
INDUSTRY
Most of the industries in the Khulna region are reported to have suffered from the increase in salinity (Rahman, 1984; Swain, 1996). The losses resulted due to increased cost of freshwater importation, frequent leakages of condensers due to uses of saline water and production loss and disruption of power supply from the Goalpara Power Station (Rahman,
< 2,000
2,000 to 4,000
4,000 to 8,000
8,000 to 16,000
> 16,000
Non saline (So )
Slightly saline (S1)
Moderately saline (S2)
Saline (S3)
Highly saline (S4)
Source : BARC, 1990.
Electrical Conductivity (m-mhos/cm)
Salinity Class
Table 5.9. Classification of coastal salinity
Only very salt tolerant crops yield satisfactorily
Only salt tolerant crops yield satisfactorily
Yields of many crops are restricted
Yields of very sensitive crops may be restricted
Salinity effects mostly negligible
Plant Growth Condition
68-72
31-50
11-35
1-6
None
Rice Yield Reduction Reported (%)
100 M.M.Q. Mirza and M.H. Sarker
Effects on Water Salinity
101
1984). From December 1975 to June 1976, IECO (1977) estimated that the increased salinity caused industrial losses of US$ 8 million. During the period 1976-1993, the total loss in the industrial sector was estimated to be US$ 37 million (Mirza, 1996). 5.7.4
DRINKING WATER
Surface and ground water used for drinking purposes have become unfit for human consumption over a large area of the Southwest region since the recommended salinity level has exceeded 960 micro-mhos/cm for potable water (MPO, 1987). As a large section of the population is not served by treated water supplies, they are often exposed to and affected by diarrhoeal diseases (Sir William Halcrow and Partners Ltd., 1993). Colwell (1996) reported the growth of V. cholerae (a marine vibrio) in water of low salinity and high temperature in presence of high concentrations of organic nutrients (nitrogen and phosphorus) in the inland coastal areas of Bangladesh. Whether the progression of the saline water front further inland and deterioration of environment in the post-Farakka period have exposed people to more diarrhoeal diseases still needs to be comprehensively investigated.
5.8
Conclusions
The diversion of the Ganges water at Farakka and its upstream has contributed to increases in salinity in the Southwest region of Bangladesh. Over the years, the increased salinity has caused considerable adverse effects on the agriculture, forestry, industry and drinking water sectors. Despite signing of a 30-year Treaty on sharing the dry season flow of the Ganges at Farakka, the discharge situation in the Gorai River has not improved due to severe siltation at its mouth. In the late 1990s, the Government of Bangladesh decided to make physical intervention to remove the blockage at the mouth. Accordingly dredging activities were conducted in the monsoon seasons of 1998, 1999 and 2000. The dredging activities restored dry season flow of the Gorai River temporarily, and was concluded that continued dredging was required to maintain dry season flow of the Gorai River (Groot and Groen, 2001). However, this is technically and financially infeasible (for details see Chapter 12 on vulnerability, adaptation and coping mechanims). The analysis carried out in this chapter demonstrates the need to increase the discharge of the Ganges River at Hardinge Bridge during the dry months in order to limit salinity in the Southwest region at certain threshold limits. It is also required to restore the natural flow of the Gorai River by removing blockage at its mouth (discussed in Chapter 12 on vulnerability and adaptation). Sir William Halcrow and Partners Ltd. (1993) recommended physical intervention by building a control structure at the Gorai mouth and a barrage across the Ganges River in order to increase water supply to the Southwest region of Bangladesh.
102
M.M.Q. Mirza and M.H. Sarker
References Bangladesh Agricultural Research Council (BARC): 1990, Salinity of Coastal Soils, BARC, Dhaka. Bangladesh Water Development Board (BWDB): 2002, Discharge Data for the Gorai River, BWDB, Dhaka. Blühdorn, D.R. and Arthington, A.H.: 1995, The utility of stream salinity models in the integrated management of Australian rivers. In: David M. Harper and Alastair J.D. Ferguson (eds.), The Ecological Basis for River Management, John Wiley and Sons, New York. Colwell, R. R.: 1996, Global Climate and Infectious Disease: The Cholera Paradigm, Science 274, 2025-2031. Cook, R.D. and Wesberg, S.: 1982, Residuals and Influence in Regression, Chapman and Hall, New York. Dixit, A. and Mirza, M.M.Q.: 1997, Who’s Afraid of Farakka’s Accord? Himal 10(1), 56-62. Draper, N and H. Smith: 1981, Applied Regression Analysis, John Wiley and Sons, New York. Environment and Geographic Information Systems (EGIS): 2000, Environmental Baseline of the Gorai Restoration Project, Bangladesh Water Development Board (BWDB), Dhaka. Food and Agricultural Organization of the United Nations (FAO): 1976, Water Quality for Agriculture, FAO Irrigation and Drainage Paper 29, FAO, Rome. Groot, J.K.d. and Groen, P.V.: 2001, The Gorai Re-excavation Project, Terra et Aqua-International Journal on Public Works, Ports and Waterways Development 85, 1-6. Hussainy, S.M.A.: 1987, Major Environmental Problems of Bangladesh: An Overview, Dhaka. International Engineering Company (IECO): 1977, Special Studies, IECO, Dhaka. Khan, A.H.: 1993, Farakka Barrage: Its Impact on Bangladesh-An Overview, Dhaka. Khan, A.T. and Vongvisessomjai, S.: 2002, MIKE-11 Application for Salinity Intrusion in Southwest Bangladesh, paper presented in the 1st Asia Pacific DHI Software Conference, June 17-18, 2002, Bangkok. Master Plan Organization (MPO): 1987, Surface Water Availability, Technical Report No. 10, MPO, Dhaka. Master Plan Organization (MPO): 1986, National Water Plan, Vol. 1, MPO, Dhaka. Mirza, M.M.Q.: 1996, Diversion of the Ganges Water at Farakka and Its Effects on Salinity in Bangladesh, Environmental Management 22(5), 711-722. Piper, A.M.: 1953, A Graphic Procedure in the Geo-chemical Interpretation of Water Analyses, US Geological Survey Groundwater, Note 12, Washington, DC. Rahman, M.M., Hassab, M.Q., Islam, M.S. and Shamsad, S.Z.K.M.: 2000, Environmental impact on water quality deterioration caused by the decreased Ganges outflow and saline water intrusion in South Western Bangladesh, Environmental Geology 40(1-2), 31-40. Rahman, G. M.: 1984, Reducing the Flow of the Ganges: The Consequences for Agriculture in Bangladesh. In: E. Goldsmith and N. Hildyord (eds.), The Social and Environmental Effects of Large Dams, Vol.2: Case Studies, Wodebridge Ecological Centre, U.K. Savenije, H.H.G.: 1992, Rapid Assessment Technique for Salt Intrusion in Alluvial Estuaries, Lecture Note, prepared for IHE, Delft, the Netherlands. Sir Willam Halcrow and Partners Ltd.: 1993, Southwest Area Water Resources Management Project, Vol. 3: Morphological Studies, Sir William Halcrow and Partners Ltd., Dhaka. Swain, A.: 1996, The Environmental Trap: The Ganges River Diversion, Bangladeshi Migration and Conflicts in India, Department of Peace and Conflict Research, Uppsala University, Sweden. Van Dam, G.C. and Schönfeld: 1967, Experimental and theoretical work in the field of turbulent diffusion performed with regard to The Netherlands estuaries and coastal regions of the North Sea, Paper presented at General Assembly of IUGG, Berne, Switzerland.
6 FARAKKA BARRAGE AND ITS IMPACT ON THE HYDROLOGY AND FISHERY OF HOOGHLY ESTUARY M. Sinha Former Director Central Inland Capture Fisheries Research Institute Barrackpore-700120 West Bengal, India
6.1
Introduction
River Ganga (Ganges), the most important river system in India and one of the largest (2,525 km) in the world, drains about one fourth area of the country. It has an annual runoff of about 493 km3 and carries 616 x 106 tonnes of suspended solids to the Hooghly Estuary (Qasim et al., 1988). River Ganga is considered as the second major river of the world in terms of suspended load and is the main contributor of sediments to the Bengal fan, which is the largest deep sea fan in the world (Lisitzin, 1972). After traveling for about 2,075 km in hills and plains in the states of Uttar Pradesh, Bihar and West Bengal, river Ganga divides into two distributaries, Bhagirathi and Padma, in the district of Murshidabad in West Bengal (Figure 6.1). The main channel (river Padma) flows in South-Easterly direction, through Bangladesh where it meets rivers Brahmaputra and Meghna, finally leading to the Bay of Bengal. The other distributary, river Bhagirathi, flows through West Bengal (India). It meanders for about 150 km through Behrampur and Katwa before it is joined by a tributary (river Jalangi) near Nabadwip. Below this confluence the river flows under the name of Hooghly, through Kolkata (formerly Calcutta) and Diamond Harbor and finally reaches its destination (Bay of Bengal). During the course of its 300 km run from Nabadwip to sea face, the Bhagirathi-Hooghly river system receives water from some of its tributaries (rivers Churni, Damodar, Rupnarayan and Haldi) and begins to spread into many small distributaries, forming the great Gangetic Delta. The entire Gangetic Delta circumscribes extensive marshy area, called the Sundarbans, having the world’s largest mangrove vegetation. The Hooghly-Matlah estuarine system, located between 21o-24o N latitude and 88o-89o E longitude, is the largest among the estuaries of Indian coast. It extends for 300 km from North to South and 150 km from East to West. The entire estuarine system is estimated to be about 8,029 sq. km and the total area of Sundarbans estuarine water is about 2,340 sq. km (in India). With the passage of time, heavy siltation, just below the point of its origin, deprived river Bhagirathi of adequate water discharge from the parent river Ganga. This resulted in low freshwater discharge in the Hooghly River and threatened the navigability of Kolkata Port. To overcome the situation and regulate water discharge, Farakka Barrage, 2.58 km in 103 M. Monirul Qader Mirza (ed.), The Ganges Water Dispersion: Environmental Effects and Implications, 103–124. © 2004 Kluwer Academic Publishers. Printed in the Netherlands.
104
M. Sinha
length with 109 bays (approx. 237 m each), was constructed on river Ganga at the border of Malda and Murshidabad Districts of West Bengal (India), just above its division into rivers Padma and Bhagirathi. The barrage was commissioned in April 1975 and since then water from river Ganga directly feeds river Bhagirathi through a man-made feeder canal (Figure 6.1). The feeder canal is 41 km long and 300 m wide and has lock gates. This has increased the volume of freshwater discharge, to the desired level, in river Bhagirathi, and consequently the Hooghly River and its estuary. Resultant to the increased freshwater discharge, the present active tidal regime in Hooghly Estuary is felt only up to a distance of about 200 km from sea face, which was up to a distance of about 300 km during pre-Farakka Barrage period. Hydrobiology and fishery of Hooghly-Matlah Estuary has been regularly monitored by CIFRI (Central Inland Capture Fisheries Research Institute, Barrackpore, West Bengal, India) since the Institute’s inception in 1947. Important published information on hydrobiology and fishery of this estuary, relating to the period before the commissioning of the Farakka Barrage, are by Dutta et al. (1954), Bose (1956), Shetty et al. (1961), Gopalakrishnan (1971), Dutta et al. (1973), Saha et al. (1975), and Jhingran (1991). The observations of Nandy et al. (1983) pertain to the period immediately after the commissioning of the barrage (May, 1975 to April, 1977) and indicate the initial disturbed condition of the estuary, which continued to fluctuate towards stability. Sinha et al. (1996) have enumerated the status of hydrobiology and fishery of the Hooghly-Matlah Estuary during the period 1982-1992 and summarised previous studies to document the resultant changes in the system. CIFRI, during 1995-1996, through an exploratory survey monitored the environment and fishery of the entire stretch of river Ganga (from its origin to sea). The result of this exhaustive survey is presented in the Institute’s publication (Sinha et al., 1998). Of the 43 centers selected for investigations, ten (Nabadwip, Krishnagar, Tribeni, Titagarh, Dakshineswar, Uluberia, Roychowk, Haldia, Kakdwip, and Frazerganj) were on the main Hooghly Estuary, and six (Bhagabatpur, Moipeeth, Canning, Jharkhali, Bagna, and Hasnabad) on the adjoining estuaries (Figure 6.2). Some other information on hydrobiology and fishery of Hooghly Estuary in the post-Farakka Barrage period is also available in Halder et al. (1987), De et al. (1989), Bagchi et al. (1994), De et al. (1994), De and Sinha (1997), De (1998), Sinha and De (1998). Mitra et al. (1997 and 2001) have given complete account of fishery of Hooghly-Matlah Estuary during the periods 1984-1985 to 1993-1994, and 1994-1995 to 1999-2000. The account of impact of Farakka Barrage on the hydrology and fishery of Hooghly Estuary, narrated below, is based on the information collected from the above said publications, the Annual Reports of CIFRI and personal observations.
6.2
The Impact
River course modifications always bring about a change in the hydrobiology and fishery of the river concerned, both upstream and downstream. In most of the cases its effect on fishery of the river is adverse. Construction of Farakka Barrage has adversely affected the fishery of river Ganga in its upstream, especially of the migrant fish population. But the
Hydrology and Fishery of Hooghly Estuary
105
Figure 6.1. Map of India showing the location of Ganga, Bhagirathi, Hooghly River, Padma River, the Farakka Barrage, and the Feeder Canal (Sinha et al., 1996).
fishery of downstream, especially of Hooghly Estuary has shown a continued upsurge after the commissioning of the barrage. It is an accepted fact that the volume of freshwater discharge determines the salinity distribution (Ketchum, 1951) as well as the vertical and horizontal physical structure (Pritchard, 1955) of any estuary. Salinity is the key determinant of all other environmental characteristics of an estuary, including the occurrence and abundance of organisms within it (Gouda, 1996). It can, thus be said that freshwater is the major determining factor for hydrology and fishery of any estuarine system (Dutta et al., 1973). Commissioning of the Farakka Barrage has substantially increased the freshwater discharge in Hooghly Estuary. The increased flushing of river
106
M. Sinha
Bhagirathi, and consequently Hooghly, with by-passed freshwater from Ganga, has naturally resulted in major changes in ecology and associated chemistry of this estuary. Concurrently, significant structural changes in all biological parameters including the fishery resources as well as fishing patterns have also emerged. According to Jhingran (1991), among various hydrological parameters, salinity and temperature are the most significant factors in determining the fishery of the Hooghly Estuary. Nandy et al. (1983) observed no significant changes in the temperature gradient of Hooghly Estuary even after commissioning of the Farakka Barrage. Thus, Sinha et al. (1996) singled out salinity as the principal impact of the Farakka Barrage on the hydrology of Hooghly Estuary. 6.2.1
SALINITY
Hooghly Estuary was initially divided into four arbitrary zones (Figure 6.2) by CIFRI in the early fifties for the purpose of hydrobiological observations and estimation of fish landings (Jhingran, 1991). The zones were: Zone I - extending from Nabadwip to Konnagar, Zone II - extending from Konnagar to Diamond Harbor, Zone III - extending from Diamond Harbor to the mouth of the estuary including the entire lower Sundarbans, and Zone IV including the estuarine zone of the Rupnarayan River. The biological properties, salinity characteristics, temperature, turbidity and the nature of fauna of these zones were studied later and the zonations came to be regarded as biological zonations: freshwater, true estuarine, marine and estuarine zone of Rupnarayan, respectively (Gopalakrishnan, 1971). For the purpose of description hereafter the above zonations have been followed. Maximum, minimum and mean salinity values for each zones, observed during various years, are shown in Table 6.1. The data indicates a significant drop in salinity values, along the entire stretch of the estuary immediately after construction of Farakka (1975-1977). In Zones I and IV, after a sudden decrease in salinity during 1975-1977 (immediately after increased flushing) a gradual rise in salinity was observed. Until 1988-1992 both these zones remained to be freshwater throughout the year. Even during 1994-1998 the average annual salinity of Zone I remained within freshwater limits. The maximum salinity values of Zone IV still remains to be at low euryhaline level throughout the year, unlike the period prior to 1975. In the case of Zones II and III, the decline in salinity continued up to 1982-1987 and, thereafter, showed a slow increase during 1988-1992 and 1994-1998. The higher minimum values and higher averages in these zones since 1982-1987 than in previous years indicate that higher salinity values are being maintained for a considerable period of time now in these two zones. Maximum salinity values, observed during the course of year, at five stations in the estuary during pre-Farakka period (1959-1967) and post-Farakka periods (1975-1977, 1982-1987, 1987-1992 and 1995-1996) are shown in Figure 6.3. It is evident from the same observations that it decreased at all the five stations immediately after construction of the Farakka Barrage (1975-1977). Thereafter, during 1982-1987, 1988-1992 and 1995-1996, the observed trend was of slow increase in salinity at Nabadwip and Barrackpore stations. But at the remaining stations downstream (Uluberia, Diamond Harbor and Kakdwip) the salinity declined during this period. It is apparent from the above that presently the freshwater zone in this estuary extends up to Diamond Harbor and the gradient (true
Hydrology and Fishery of Hooghly Estuary
107
Figure 6.2. Map showing the zonation of Hooghly-Matlah Estuary, used to describe its ecology and fishery. The centers were surveyed during 1995 to 1996.
estuarine zone) up to Kakdwip. The marine zone of the estuary starts only below Kakdwip. Thus, it can be inferred that as an impact of increased freshwater discharge in the Hooghly Estuary, its fresh, true estuarine and marine zones have changed and are presently as shown in Figure 6.4.
Trace
Trace
1.56 (12.56)
Trace
I
II
III
IV
15.58
32.77
23.19
2.60
Maximum
0.02 (0.13)
1.47 (11.91)
0.02 (0.35)
Trace
Minimum
0.45
29.25
11.00
0.04
Maximum
1975-1977
2
0.01 (0.23)
0.89 (12.20)
0.01 (0.39)
0.01 (0.02)
Minimum
1.99
26.52
3.84
0.04
0.03 (0.27)
1.45 (12.70)
0.03 (0.48)
0.02 (0.03)
2.14
29.13
4.29
0.06
Maximum
1988-19923 Minimum
Post-Farakka
Maximum
1982-1987
3
Sources: 1Saha et al. (1975); 2Nandy et al. (1983); 3Sinha et al. (1996); and 4Sinha et al. (1998).
Minimum
Zone
1959-1967
1
Pre-Farakka
0.05 (0.40)
6.06 (23.35)
0.07 (0.81)
0.04 (0.18)
Minimum
5.86
30.70
18.98
2.86
Maximum
1994-19984
Table 6.1. Salinity fluctuations in the Hooghly Estuary during pre- and post-Farakka Barrage periods (%). Figures in parentheses are averages
108 M. Sinha
Hydrology and Fishery of Hooghly Estuary 6.2.2
109
PLANKTON
Available detailed account of plankton concentrations and their composition (freshwater, euryhaline and marine forms) during pre- and post-Farakka Barrage periods are given by Sinha et al. (1996). Table 6.2 shows the average plankton concentrations (units/l) in different zones of this estuary during pre-Farakka (1959-1962) and post-Farakka (1975-1977 and 1985-1991) periods, as given in the said publication.
Figure 6.3. Maximum salinity values (%) at various sampling stations of Hooghly Estuary during different years of observation (Sinha et al., 1996 and 1998).
It is evident from this table that environmental changes due to construction of the barrage resulted in an initial increase in plankton densities in Zones I, II and IV, while in Zone III it was just the reverse. But after about a decade (1985-1991), the plankton densities in Zones I and II recorded a steep fall while a sharp increase occurred in Zone III. In Zone IV an increasing trend in plankton density continued throughout. The sudden increase in plankton densities in Zones I, II and IV, immediately after the commissioning of the Farakka Barrage, was probably due to inundation of previously
110
M. Sinha
exposed fields that had earlier or agricultural crops or natural vegetation. Organic wastes, accumulated through years when these fields were dry probably added to the water productivity. After gradual urilisation of these nutrients the productivity was restored to normal and subsequently decreased due to increased dilution. The reverse trend observed in Zone III may be due to increased water discharge, with not much inundation of sides, resulting in the initial dilution of the plankton population. With a time lag for the export of allochthonous nutrients from the upper zones, the plankton concentration of Zone III showed a sharp increase during 1985-1991, several years following construction of the barrage. According to De (1998), the plankton densities during 1996-1997 were observed as 920 units/liter, 414 units/liter and 1267 units/liter in Zones I, II and III respectively, indicating an overall upward swing in plankton concentration. The species diversity and distributional pattern of plankton in different zones of Hooghly Estuary before construction of the Farakka Barrage has been given by Gopalakrishnan (1971) and Saha et al. (1975). The zone-wise species diversity and distributional pattern of plankton in the post-Farakka period have been described by Nandy et al. (1983) for the period 1975-1977 and by Sinha et al. (1996) for the period 1985-1991. Sinha et al. (1998) have also given a list of plankton in Hooghly Estuary encountered during 1995-1996 survey, but have not classified the availability into four zones or types (freshwater, euryhaline and marine). According to Gopalakrishnan (1971), during pre-Farakka period the species diversity (Table 6.3) was high (79 types). All three forms (freshwater, euryhaline and marine) of plankton (53 species) were available in Zone I with their percentages being 54.7%, 35.8% and 9.5%, respectively. In Zone II from the 67 forms encountered, 36.8% were freshwater, 41.2% euryhaline and the remainder marine. The 50 varieties of plankton in Zone III were mostly marine (42%) and euryhaline (40%) types, with a few (18%) freshwater forms. Plankters encountered in Zone IV (50 types) were composed of 32% freshwater forms, 42% euryhaline forms and 26% marine forms. Sinha et al. (1996) encountered much lower species diversity (58 types) during post-Farakka period (Table 6.3) than those encountered by Gopalakrishnan (1971) before commissioning of the barrage. Of the 44 types encountered in Zone I, 27 (61.4%) were freshwater and the rest euryhaline. The total types of plankton in Zone II were less (40) than in Zone I. The plankton composition in Zone II was also different from Zone I. Twenty-one types (52.5%) were freshwater, 15 (37.5%) euryhaline and 4 (10%) marine plankters. This means that Zone II had a 8.9% decline in freshwater forms and equal increase in euryhaline and marine forms than that of Zone I. Environment nearer to the mouth of estuary (Zone III) harbored much lesser variety of plankton (33), mostly marine/euryhaline. The 41 types of plankton encountered in Zone IV could be divided among three forms which were as follows: 43.9% freshwater forms, 41.5% euryhaline forms and 14.6% marine forms. Percentage composition of different forms of plankton (freshwater, euryhaline and marine) in various zones of Hooghly Estuary, during different years of observation, is also depicted in Figure 6.5.
Hydrology and Fishery of Hooghly Estuary
111
Figure 6.4. Map showing the proposed zonation of Hooghly-Matlah Estuary based on presently observed salinity (Sinha et al., 1996).
45.3 18.3 (40.3) 6.3 (13.9) 20.7 (45.8)
207.5 58.2 (28.0) 36.3 (17.5) 113.0 (54.5)
Total Freshwater forms
Total Freshwater forms
Source: Sinha et al., 1996.
Euryhaline forms
Marine forms
Euryhaline forms
Marine forms
Euryhaline forms
Marine forms
162.2 39.9 (24.6) 30.0 (18.5) 92.3 (56.9)
1959-1962
Total Freshwater forms
Plankton groups
304.4 210.2 (69.1) 10.5 (3.4) 83.7 (27.5)
85.0 55.3 (65.1) 8.3 (9.8) 21.4 (25.1)
219.4 154.9 (70.6) 2.2 (1.0) 62.3 (28.4)
1975-1977
Zone I
103.0 84.5 (82.1) 18.5 (17.9)
24.3 16.2 (66.7) 8.1 (33.3)
78.7 68.3 (86.8) 10.4 (13.2)
1985-1991
95.1 5.9 (6.2) 46.1 (48.5) 43.1 (45.3)
28.5 1.8 (6.4) 6.1 (21.4) 20.6 (72.2)
66.6 4.1 (6.1) 40.0 (60.1) 22.5 (33.8)
1959-1962
222.8 104.3 (46.8) 43.6 (19.6) 74.9 (33.6)
60.6 30.4 (50.2) 19.1 (31.5) 11.1 (18.2)
162.2 73.9 (45.5) 24.5 (15.1) 63.8 (39.4)
1975-1977
Zone II 1975-1977
91.2 7.0 (7.7) 56.3 (61.7) 27.9 (30.6)
53.5 1.9 (3.5) 46.1 (86.2) 5.5 (10.3)
144.7 8.9 (6.2) 102.4 (70.7) 33.4 (23.1)
Phytoplankton 110.2 167.3 82.7 0.4 (75.0) (0.2) 15.1 150.2 (13.7) (89.8) 12.4 16.7 (11.3) (10.0) Zooplankton 5.9 23.9 4.0 2.2 (68.2) (9.2) 0.8 7.7 (12.8) (32.2) 1.1 14.0 (18.9) (58.6) Total Plankton 116.1 191.2 86.7 2.6 (74.6) (1.4) 15.9 157.9 (13.6) (82.6) 13.5 30.7 (11.7) (16.0)
Zone III 1959-1962
1985-1991
600.1 60.4 (10.1) 406.3 (67.7) 133.4 (22.2)
14.8 0.6 (4.2) 12.2 (82.6) 2.0 (13.2)
585.3 59.8 (10.3) 394.1 (67.3) 131.4 (22.4)
1985-1991
123.6 17.3 (14.0) 45.2 (36.6) 61.1 (49.4)
41.0 12.7 (31.0) 6.0 (14.6) 22.3 (54.3)
82.6 4.6 (5.6) 39.2 (47.5) 38.8 (46.9)
1959-1962
153.3 45.4 (29.6) 79.3 (51.7) 28.6 (18.6)
89.2 24.8 (27.8) 55.3 (62.0) 9.1 (10.2)
64.1 20.6 (32.1) 24.0 (37.4) 19.5 (30.5)
1975-1977
Zone IV
295.8 193.2 (65.3) 25.7 (8.7) 76.9 (26.0)
138.4 103.7 (74.9) 2.0 (1.4) 32.7 (23.7)
157.4 89.5 (56.9) 23.7 (15.0) 44.2 (28.1)
1985-1991
Table 6.2. Average plankton concentration (units/litre) and their composition in different zones of Hooghly Estuary during pre- and post-Farakka Barrage periods. Figures in parentheses denote percentages within the zone
112 M. Sinha
Hydrology and Fishery of Hooghly Estuary
113
Table 6.3. Distributional pattern of plankton in Hooghly Estuary during pre- and post-Farakka Barrage periods Pre-Farakka Zone II III IV
Post-Farakka Zone II III IV
Plankton species Chlorophyceae (Green algae)
I
1. Spirogyra sp. 2. Closterium sp. 3. Coelastrum sphaericum 4. Pandorina sp. 5. Chlorobotrys sp. 6. Zygnema sp. 7. Zygnemopsis sp. 8. Chlorella sp. 9. Sphaerocystis sp. 10. Stichococcus sp. 11. Platydorina sp. 12. Dispora sp. 13. Pediastrum spp. 14. Scenedesmus sp. 15. Oocystis sp. 16. Mougeotia spp. 17. Eudorina elegans 18. Tribonema sp. 19. Cosmarium sp. 20. Volvox sp. 21. Borgia planktonica Cyanophyceae (Blue green algae)
+ + + + + + + + + + + + +
+ + + + + + + + + +
+ + + +
+ + + + + +
+ + + + + + + + + + + + + + + -
+ + + + + + + + + + -
+ + + + -
+ + + + + + + + + -
22. Phormidium sp. 23. Oscillatoria sp. 24. Anabaena sp. 25. Nostoc sp. 26. Lyngbya sp. 27. Microcystis sp. 28. Spirulina sp 29. Aphanizomenon sp. 30. Trichodesmium sp. Bacillariophyceae (Diatoms)
+ + + + + + + -
+ + + + + + + +
+ + + + + +
+ + + + + + +
+ + + + + + + -
+ + + + + + -
+ + + -
+ + + + + + + -
31. Synedra ulna 32. Coscinodiscus grani 33. Coscinodiscus spp. 34. Surirella sp. 35. Melosira granulata 36. Melosira spp. 37. Nitzchia sp. 38. Navicula spp. 39. Pleurosigma spp. 40. Asterionella japonica 41. Stephanodiscus sp. 42. Cyclotella spp. 43. Chaetoceros spp. 44. Diploneiis sp. 45. Biddulphia mobilensis 46. B. sinensis 47. Planktoniella sol 48. Lithodesmium spp. 49. Thalaniothrix sp. 50. Ditylum brightwelii 51. Hemidiscus hardmaniannus 52. Hemiaulus sinensis 53. Skelitonema costatum 54. Rhizosolenia sp. 55. Triceratium sp. 56. Bacteriastrum spp. 57. Coscinoria sp.
+ + + + + + + + + + + +
+ + + + + + + + + + + + + + + + + + + + + + + +
+ + + + + + + + + + + + + + + + + + + + + + +
+ + + + + + + + + + + + + + + + + + + + +
+ + + + -
+ + + + + + + -
+ + + + + + + + + + + + + + -
+ + + + + + + -
I
114
M. Sinha
Table 6.3. Continued
Pre-Farakka Zone
Post-Farakka Zone
Plankton species Bacillariophyceae (Diatoms) continued
I
II
III
IV
I
II
III
IV
58. Fragilaria sp. 59. Amphora sp. 60. Amphipleura sp. 61. Bascillaria sp. 62. Coconeis sp. 63. Cylindrotheca sp. 64. Diatomella sp. 65. Diatoma sp. 66. Gyrosigma sp. Chrysophyceae (Flagellates)
+ -
+ -
-
-
+ + + + + + + +
+ + + + + + +
+ + + +
+ + + + + +
67. Ceratium hirudinella 68. C. tripos 69. Euglena spp. 70. Phacus sp. 71. Peridinium spp. 72. Noctiluca milaris 73. Trachelomonas sp. Rotifera
+ + + + + -
+ + + + + + -
+ + + + + + +
+ + + + -
+ -
+ -
+ -
+ -
74. Brachionus spp. 75. Keratella spp. 76. Filinia spp. 77. Asplanchna sp. 78. Ploesoma sp. 79. Notholca sp. Copepoda
+ + + + -
+ + + + -
+
+ + + -
+ + + -
+ + + -
+ + -
+ + + -
80. Diaptomus sp. 81. Pseudodiaptomus spp. 82. Cyclops sp. 83. Microstella sp. 84. Acartiella sp. 85. Paracalanus sp. 86. Bryocamptus sp. 87. Ergasilus sp. Cladocerans
+ + + -
+ + + + -
+ + + + -
+ + + + + -
+ + + -
+ + + -
+ + + + +
+ + + + +
88. Bosmina sp. 89. Moina sp. 90. Daphnia sp. 91. Blsminopsis sp. 92. Ceriodaphnia sp. 93. Diaphanosoma sp. Protozoa
+ + + + + -
+ + + + + +
+ -
+ -
+ + + -
+ + + -
-
+ + + -
94. Difflugia spp. 95. Arcella sp. 96. Vorticella sp. 97. Centropyxis sp. 98. Tintinnidium sp .
+ + + -
+ + + + -
+ + + +
+ + + -
-
-
-
-
Hydrology and Fishery of Hooghly Estuary
115
100% 90%
% of Plankton
80% 70% 60% 50% 40% 30% 20%
Year
1985-1991
1975-1977
1959-1962
1985-1991
1975-1977
1959-1962
1985-1991
1975-1977
1959-1962
1985-1991
1975-1977
0%
1959-1962
10%
Marine Euryhaline Freshwater
Figure 6.5. Quantitative percentage contribution of different forms of plankton in various zones of Hooghly Estuary during different years of observation.
It is evident from above that the zone-wise composition of plankton community has also experienced a significant change due to construction of the barrage. Marine forms have completely disappeared from Zone I and their presence reduces in Zones II and IV. However, the marine forms have considerably increased in Zone III. Coscinodiscus granii, an indicator species for demarcating euryhaline environment in the tidal region, though observed in the post-barrage period in all zones except Zone I, dominated the plankton population of Zone III only, where it contributed to 40%-90% of the total plankton. The abundance of this plankton species was higher during summer months but declined gradually with the onset of the monsoon when the salinity decreased. The absence of certain euryhaline and marine forms of plankton during the post-barrage period is due to a significant decrease in salinity throughout the estuary. But the low occurrence/absence of certain freshwater forms (Volvox, Cosmarium, etc.) is rather surprising. This may be due to changes in hydrographical features of the estuary, which is now more fluvial with a faster current and more turbidity, especially in the upper reaches.
116
M. Sinha
Such changes might have resulted in unfavorable ecological conditions for plankton forms requiring substratum or sufficient light for their propagation and growth. Total absence of protozoan forms in the post-barrage period may also be due to the faster current presently experienced in the estuary. The occurrence of a particular specie is determined more by ecological conditions than by its geographical location (Thompson, 1959). 6.2.3
MACRO-ZOOBENTHOS
Gopalakrishnan (1971) provided a list of group-wise forms of macro-zoobenthos in different zones of Hooghly Estuary prior to the construction of the Farakka Barrage. But it is only qualitative and not quantitative. Macro-zoobenthos of Hooghly Estuary were studied for the first time in detail during 1985-1991 by Sinha et al. (1996). It has also been studied by CIFRI in 1995-1996, during exploratory survey of river Ganga (Sinha et al., 1998). In absence of any information on quantitative availability of macro-zoobenthos of Hooghly Estuary in pre-Farakka Barrage period, it is not possible to assess the impact of barrage construction on this bio-tope. However, the distribution of macro-zoobenthos in Hooghly Estuary (quantitatively and qualitatively (dominant forms)), as observed by Sinha et al. (1996 and 1998), during the post-barrage period, which is shown in Table 6.4. 6.2.4
FISHERIES
6.2.4.1
Fish Catch
The annual average species-wise fish catch from Hooghly-Matlah Estuary for the pre-Farakka Barrage periods (1966-1967 to 1971-1975) and the post-Farakka Barrage periods (1984-1985 to 1989-1990), as reported by Sinha et al. (1996), are depicted in Table 6.5. The average annual fish catch from the estuary increased by 213.2% (9,481 tons yr-1 to 29,720 tons yr-1). Contribution of Zone III (marine zone) to the total annual catch increased from 78.7% in the pre-Farakka Barrage period to 93.9% in the post-Farakka Barrage period. Mitra et al. (1997 and 2001) have given further statistics of fish catch from Hooghly-Matlah Estuary during the period 1990-1991 to 1993-1994 and 1994-1995 to 1999-2000, respectively, wherein also a general increasing trend of fish catch is observed and it reaches to 62,165.4 tons during 1999-2000 (average of 55,915.5 tons yr-1 during 1994-1995 to 1999-2000). The bulk of the catch during these years also came from the marine zone of the estuary (Zone III), which contributed between 94.5% to 96.7% of the total catch. Average annual fish catch from Hooghly Estuary, during different periods of pre- and post-Farakka are depicted in Figure 6.6. The catch of purely marine forms and typically neritic species, such as Liza parsia amongst mullets, Eleutheronema tetradactylum among polynemids, Coilia spp. among anchoives, Tenualosa toli and Ilisha elongata among clupeids and Harpodon nehereus and Trichiurus spp. among other groups, showed a sharp decline or total absence in the
Hydrology and Fishery of Hooghly Estuary
117
upper estuary (Zones I, II and IV) during the post-Farakka period (Table 6.4). A few purely freshwater fishes (Rita rita, Wallago attu, Mystus aor, Ailia coila, Catla catla, Labeo rohita, Labeo bata) and prawn (Macrobrachium rosenbergii) made their appearance in these parts of the estuary during the post-Farakka Barrage period and contributed notably to the species spectrum. During 1994 to 1999-2000, there contribution to the fish catch from upper estuary was over 2% (Mitra et al., 2001). They were not reported from Nabadwip downward (Zone I) prior to 1975. A significant decline in the availability of certain non-commercially important estuarine and marine species (Chanos chanaos, Plotosus canius, Megalops cyprinoides, Elops saurus, Therapon jarbua, Raconda russeliana, and Pellona ditchella,etc.) was also observed. The prime fish, hilsa (Tenualosa ilisha), forms commercially the most important fishery of the estuary in view of its high market value. It forms the mainstay of this estuaries catch if we exclude the winter migratory bagnet fishery of Hooghly Estuary. The monsoon (July-October) hilsa catch contributes bulk (about two-thirds) of the total annual landing of the species from this estuary. The fishery in winter is of a smaller magnitude. Wide fluctuations in hilsa catch are an interesting characteristic of Hooghly Estuary. The annual average landing of this species shows a sharp increase in the post-barrage period. It was 1457.1 ton (15.3%) prior to 1975 and increased to 7352.9 ton (13.2%) during 1994-1995 to 1999-2000. This unusual increase in the catch of hilsa may also be because of the barrage construction, and due to the migration of hilsa to areas above the barrage, resulting in severe depletion of its fisheries in the middle stretches of river Ganga. Hilsa juveniles (fry and fingerlings) constitute a substantial part of hilsa catch from the upper freshwater stretches of the estuary. Indiscriminate exploitation of young ones of hilsa through small meshed nets take a heavy toll of the hilsa juveniles, when these young ones start their downward migration. Mitra et al. (2001) estimated hilsa juvenile catch between 50.9 tons to 63.3 tons (average 57.5 tons) from Hooghly Estuary, during the period 1994-1995 to 1999-2000, which numerically works out to 13.1 million of young fish (weight range 2.2 g to 27 g). Structural changes in species composition of fish communities in the lower estuarine region (Zone III) are observed to be minimal. But since there is a decline in salinity seaward, catches in this zone improved during the post-barrage period by 274% during 1984-1985 to 1989-1990 and by 625% during 1994-1995 to 1999-2000. A significant increase in winter migratory bag net catches during post-barrage period (Saigal et al., 1987; Mitra et al., 1997 and 2001) is the main factor for this high increase of fish catch from the lower estuary. The winter migratory bag-net fishery during the post-barrage period is now about 12 to 15 times of the pre-barrage period. Greater abundance of fish stocks, particularly clupeids, sciaenids, anchovies, ribbon fish, Bombay duck, prawns and other miscellaneous species, coupled with employment of mechanised boats and larger fishing effort (Saigal et al., 1987; Mitra et al., 2001) have resulted in increased fish catch after the commissioning of the barrage.
874.2
IV
1,086.2
II & III
460.3
2,061.1
911.4
273.1 330.0
1,408.1
Sources : 1Sinha et al. (1996); 2Sinha et al. (1998).
2,861.2
I
1995-19962
1,122.0 232.0
466.5
Winter
II III
1985-19911 I
Zone
413.4
805.3
264.5
390.0 66.0
250.7
Density (Units m-2) Summer Monsoon
653.3
1,909.2
683.4
595.0 209.3
708.4
Average
Dominant groups
Molluscs, annelids
Molluscs, polychaetes, oligochaetes, crabs
Molluscs, annelids, prawns, harpecticoid Copepods
Molluscs, annelids, crabs, prawns Molluscs, annelids, gammarids, isopods, prawns, crabs, mud creeper
Molluscs, annelids, insect larvae
Table 6.4. Distribution of macro-zoobenthos based on density in different zones of Hooghly Estuary
118 M. Sinha
-
0.1 (*)
(Family Clupeidae, SF Alosinae) Ilisha elongata (Family Pristigasteridae) Setipinna spp. (Family Engraulidae) Harpodon nehereus (Family Harpodontidae) Trichiurus spp. (Family Trichiuridae) Pama pama (Family Sciaenidae) Sciaena biauritus (Family Sciaenidae) Sillago panijus (Family Sillaginidae) Tachysurus jella (Family Ariidae)
132.9 (42.6)
127.9 (13.3)
Tenualosa ilisha (Family Clupeidae, SF Alosinae) Tenualosa toli
0.9 (0.3)
3.5 (1.1) 47.0 (15.0)
0.8 (0.2) 9.2 (2.9) 0.9 (0.3) 2.5 (0.8) -
0.2 (*)
33.5 (3.5) 1.7 (0.2)
8.6 (0.9) 0.1 (*) 2.9 (0.3) -
II
Zone
Zone I
Species
452.0 (6.0) 172.7 (2.3) 188.8 (2.5) 17.4 (0.2) 176.0 (2.3)
651.1 (8.7) 1,929.1 (25.8)
164.2 (2.2)
16.9 (0.2)
1,077.1 (14.4)
Zone III
709.0 (7.5) 2,067.9 (21.8) 454.0 (4.8) 217.2 (2.3) 190.2 (2.0) 31.9 (0.3) 176.2 (1.9)
1.2 (0.2) 26.7 (3.6) 0.4 (*) 9.1 (1.2) 0.2 (*)
166.7 (1.8)
17.2 (0.2)
1,457.1 (15.3)
Total
20.9 (2.8) 90.1 (12.1)
1.4 (0.2)
0.2 (*)
119.2 (16.1)
IV
Zone
Pre-Farakka period (1966-1967 to 1974-1975)
Table 6.5. Species-wise average annual fish catch in Hooghly Estuary
3.0 (0.4) 4.3 (0.6) -
9.6 (1.4) -
-
-
195.7 (28.9)
Zone I
0.1 (*) 27.7 (5.5) 0.3 (*) 3.1 (0.6) -
27.9 (5.5) 0.5 (0.1)
0.1 (*)
-
2,996.5 (10.7) 3,700.4 (13.3) 303.3 (1.1) 15.3 (*) 597.7 (2.1)
3,243.5 (11.6) 4,932.3 (17.7)
447.3 (1.6)
49.2 (0.2)
25.0 (3.9) 0.6 (0.1) -
12.7 (2.0) -
-
-
144.9 (22.6)
1,017.7 (3.6)
264.6 (52.4)
Zone IV
Zone III
II
Zone
3,756.1 (12.6) 303.6 (1.0) 23.3 (0.1) 597.7 (2.0)
2,996.6
3,293.7 (11.0) 4,932.8 (16.6)
447.4 (1.5)
49.2 (0.2)
1,622.9 (5.5)
Total
Post-Farakka period (1984-1985 to 1989-1990)
Hydrology and Fishery of Hooghly Estuary 119
TOTAL
Other miscellaneous
Freshwater fishes
(Family Polynemidae) Eleutheronema tetradactylum (Family Polynemidae) Coilia spp. (Family Engraulidae) Pangasius pangasius (Family Pangasiidae) Liza parsia Family Mugilidae) Lates calcarifer (Family Centropomidae) Pampus argenteus (Family Stromateidae) Prawns
Polynemus paradisseus
Species
Table 6.5. Continued
1.5 (0.5) 5.7 (1.8) 3.2 (1.0) 0.1 (*)
-
51.8 (16.6) 49.2 (15.8) 312.1 (3.3)
2.3 (0.2) 8.9 (0.9) -
-
367.6 (38.1) 404.8 (42.0) 964.3 (10.1)
2.6 (0.8)
5.7 (0.6)
0.3 (0.1)
II
I
-
Zone
751.1 (10.1) 1,609.3 (21.6) 7,463.1 (78.7)
-
70.9 (0.9) 76.1 (1.0) 42.9 (0.6) 24.1 (0.3)
24.8 (0.3)
18.6 (0.2)
Zone III
167.8 (22.6) 181.3 (24.4) 742.0 (7.8)
-
47.6 (6.4) 40.1 (5.4) 3.5 (0.7) 0.3 (0.4)
1.7 (0.2)
30.3 (4.1)
IV
Zone
1,338.3 (14.1) 2,244.6 (23.6) 9,481.5
-
122.3 (1.3) 130.8 (1.4) 49.6 (0.5) 24.5 (0.3)
26.8 (0.3)
57.2 (0.6)
Total
Pre-Farakka period (1966-1967 to 1974-1975)
Zone
278.0 (41.1) 43.5 (6.4) 134.9 (19.9) 677.0 (2.3)
-
4.2 (0.6) -
-
3.8 (0.6)
I
74.2 (14.7) 1.7 (0.3) 62.7 (12.4) 505.0 (1.7)
-
1.5 (0.3) 2.8 (0.5) 2.4 (0.5) -
-
35.4 (7.0)
II
Zone
1,856.6 (6.6) 7,351.3 (26.3) 27,898.0 (93.9)
452.5 (1.6)
800.3 (2.9) 3.7 (*) 18.0 (0.1) 6.2 (*)
14.6 (*)
91.6 (0.3)
Zone III
210.5 (32.9) 3.7 (0.6) 184.3 (28.8) 640.2 (2.1)
-
0.4 (0.1) -
-
58.1 (9.1)
IV
Zone
2,419.3 (8.1) 48.9 (0.2) 7,733.2 (26.0) 29,720.2
452.5 (1.5)
801.8 (2.7) 11.1 (*) 20.4 (0.1) 6.2 (*)
14.6 (*)
188.9 (10.6)
Total
Post-Farakka period (1984-1985 to 1989-1990) Zone
120 M. Sinha
Hydrology and Fishery of Hooghly Estuary
121
60000
Catch in tons
50000 40000 30000 20000 10000 0 1966-67 to 1974-75
1984-85 to 1989-90
1990-91 to 1993-94
1994-95 to 1999-2000
Year
Figure 6.6. Average annual fish catch from Hooghly Estuary, during the pre- and post-Farakka periods.
6.2.4.2
Fish and Prawn Seed Availability
De et al. (1994) have reported that during the post-Farakka period hilsa spawns in the entire freshwater (Zone I) and gradient (Zone II) stretches of the estuary with the lower and upper limits of the spawning grounds being Kulpi and Medgachi (Figure 6.2) respectively. The observations during pre-Farakka period (Chandra, 1962) have shown that the spawning ground of hilsa is to be confined to a shorter stretch of about 100 km from Kolkata (Bagbazar) to Medgachi. Thus, a considerable extension of spawning ground of hilsa in the estuary has taken place in the post-Farakka period. The additional discharge of freshwater into the system as a result of commissioning of the Farakka Barrage in 1975 has made the estuary more favorable for general habitat as well as spawning of hilsa. According to De and Sinha (1997), during the post-Farakka period, with the decline in salinity and extension of freshwater zone, lesser number of estuarine prawn and fish seed are now available in the Uluberia-Nurpur stretch (Zone II). Seeds of Penaeus monodon and P. indicus have totally disappeared from this stretch. This stretch (between 113 km and
122
M. Sinha
83 km from the mouth of the estuary) was potential seed centers of these two estuarine prawn species before the commissioning of the Farakka Barrage. Presently, the upper limit of availability of seed of these two species has become restricted to 50 km-60 km from the mouth of the estuary.
6.3
Concluding Remarks
It is amply clear from the details given above that with the increased freshwater discharge in Hooghly Estuary, resultant to the commissioning of the Farakka Barrage in April, 1975, the ecology and fishery of this positive estuary has undergone a major change. Increased freshwater discharge has considerably reduced the salinity, which is the key determinant of all other environmental characteristics of an estuary, including the occurrence and abundance of organisms within it. The freshwater zone has extended downwards. The true estuarine and marine zones have been pushed further down and reduced in area. Though the present salinity has shown some rise, Zone I still remains to have freshwater throughout the year. The tidal regime has also undergone change and decreased by about 100 km. Re-zonation of the estuary, as shown in Figure 6.4 is, thus required in view of the changed salinity picture. However, detailed systematic study of ecology of these new zonations is essential to establish their correct biological characteristics. Resultant to changes in salinity, the concentrations as well as species composition of plankton have also shown appreciable change. Plankton concentration has increased substantially in Zone III with the passage of time. Coscinodiscus granii, an indicator species of euryhaline environment, has not been observed in Zone I in post-barrage period. Though seen in other three zones, it now dominates only in Zone III. The fish catch from the estuary has shown a continued marked upward swing in the post-barrage period. This has mainly been caused due to the sharp increase in catch from the marine zone (Zone III) of the estuary. The quantum of catch from the other three zones has not shown proportionate increase. Purely marine forms and typically neritic species have shown a sharp decline or total absence in upper estuary (Zone I) with some purely freshwater fishes making their appearance in this part of the estuary. Observations show that species composition of fish species in the marine zone (Zone III) has changed very little. Hilsa (Tenualosa ilisha), the commercially most important fish species of the estuary, has also shown a sharp increase in catch in the post-barrage period. Increased freshwater discharge, due to the commissioning of the barrage, appears to have made the Hooghly Estuary more favorable for the general habitat as well as breeding of hilsa. It has been observed to spawn in the entire freshwater and gradient stretches of this estuary in the post-barrage period instead of the restricted freshwater stretch of pre-barrage period. It can, thus be concluded that the impact of Farakka Barrage on hydrology and fishery of Hooghly Estuary has been on positive side. Its effect on overall fishery of the estuary has been favorable, a feature generally uncommon with any river course modification.
Hydrology and Fishery of Hooghly Estuary
123
References Bagchi, M.M., D. Nath, K. Saha: 1994, Impact of Farakka Barrage on water and soil characterstics of Hooghly-Matlah estuarine system, Journal of Inland Fisheries Society, India 26(2), 90-98. Bose, B.B.: 1956, Observations on the hydrology of the Hooghly Estuary, Indian Journal of Fisheries 3, 101-118. Chandra, R.: 1962, A preliminary account of the distribution and abundance of fish larvae in the Hooghly Estuary, Indian Journal of Fisheries (A) 9(1), 48-70. De, D.K.: 1998, Hydrobiological changes, fish population trends and production potential of Hooghly estuarine ecosystem with special emphasis on hilsa. In: Management of Inland Open Water Fisheries, Bulletin of Central Inland Capture Fisheries Research Institute 83, 83-89. De, D.K., A. Ghosh, V.K.Unnithan: 1989, Biology and migration of Hooghly hilsa in the context of Farakka Barrage. In: A.G.Jhingran and V.V.Sugunan (eds.), Conservation and Management of Inland Capture Fisheries Resources of India, Inland Fisheries Society of India, Barrackpore, India. De, D.K., M. Sinha, A. Ghosh: 1994, Impact of Farakka Barrage on the spawning of Hilsa, Tenualosa ilisha (Hamilton) in the Hooghly Estuary, Journal of Inland Fisheries Society of India 26(1), 121-124. De, D.K., M. Sinha: 1997, Seasonal abundance of the seed of commercially important prawn and fishes in the Hooghly-Matlah estuary during post-Farakka Barrage period, Journal of Inland Fisheries Society, India 44(2), 201-209. Dutta, N., J.C.Malhotra, B.B.Bose: 1954, Hydrology and seasonal fluctuations of the Plankton in the Hooghly Estuary, Proceedings of Symposium on Marine and Freshwater Plankton in the Indo-Pacific. Dutta, P., G.C.Laha, P.M.Mitra, D.K.De and Others: 1973, Fishery resources of the Hooghly-Matlah estuarine system, Bulletin of Central Inland Fisheries Research Institute, 19. Gopalakrishnan, V.: 1971, The biology of the Hooghly-Matlah estuarine system (W. Bengal, India) with special reference to its fisheries, Journal of Marine Biological Association of India 13, 182-194. Gouda, R.: 1996, Physicochemical parameters in Indian estuaries-An Overview, Pollution Research 15(2), 121-128. Halder, D.D., D.K.De, H.S.Mazumder, B.N.Saigal: 1987, Effect of Farakka Barrage on the seasonal abundance of prawn and fish seed from the lower stretch of Hooghly estuarine system West Bengal, Proceedings of Symposium on the Impact of Current Land use Pattern of Water Resources Development on Riverine Fisheries, Inland Fisheries Society, India. Jhingran, V.G.: 1991, Fish and Fisheries of India (Third Edition), Hindusthan Publishing Corporation, India, Delhi, India. Ketchum, B.: 1951, The flushing of tidal estuaries, Sewage and Industrial Wastes 23, 189-209. Lisitzin, A.P.: 1972, Sedimentation in the world ocean, Society of Economic Palaeontology and Mineralogy, Special Publication 17, 218. Mitra, P.M., H.C. Karamkar, M. Sinha, A. Ghosh, B.N.Saigal: 1997, Fisheries of the Hooghly-Matlah estuarine system-An Appraisal, Bulletin of Central Inland Fisheries Research Institute 67, 49. Mitra, P.M., H.C. Karamkar, A. K. Ghosh, N.C. Mandal, H.K.Sen, B.N. Das: 2001, Fisheries of Hooghly-Matlah estuarine system-Further Appraisal (1994-95 to 1999-2000), Bulletin of Central Inland Fisheries Research Institute 109, 18. Nandy, A.C., M.M. Bagchi, S.K. Majumdar: 1983, Ecological changes in the Hooghly Estuary due to water release from Farakka Barrage, Mahasagar 16, 209-220. Pritchard, D.W.: 1955, What is an estuary: physical viewpoint. In: G.F.Lauff (ed.), Estuaries, American Association for the Advancement of Science, Washington, D.C.
124
M. Sinha
Qasim, S.Z., R. Sengupta, T.W. Kureishy: 1988, Pollution of the seas around India, Proceedings of Indian Academy of Science (Animal Science) 97(2), 117-131. Saha, S.B., B.B.Ghosh, V. Gopalakrishnan: 1975, Plankton of the Hooghly Estuary with special reference to salinity and temperature, Journal of Marine Biology Association of India 17, 107-120. Saigal, B.N., P.M.Mitra, H.C.Karamkar: 1987, Migratory winter bag net fishery in coastal waters of the Hooghly Estuary, National Symposium on Research and Development in Marine Sciences, CMFRI, Cochin. Shetty, H.P.C., S.B.Saha, B.B.Ghosh: 1961, Observations on the distribution and fluctuations of plankton in Hooghly-Matlah estuarine system with notes on their relationship to commercial fish landings, Indian Journal of Fisheries 8, 326-363. Sinha, M., M.K.Mukhopadhyay, P.M.Mitra, M.M.Bagchi, H.C.Karamkar: 1996, Impact of Farakka Barrage on the hydrology and fishery of Hooghly Estuary, Estuaries 19(3), 710-722. Sinha, M., D.K. De, B.C.Jha: 1998, The Ganga-Environment & Fishery, Central Inland Capture Fisheries Research Institute, Barrackpore, West Bengal, India. Sinha, M., D.K.De: 1998, Impact of engineering structures on fish and fisheries in Hooghly estuarine system. In: D.E.Amit Krishna (ed.), Sustainable Development and Environment, Cosmo Publications, New Delhi, India. Thompson, R.H.: 1959, Algae. In: W.T.Edmondson (ed.), Freshwater Biology (Second Edition), John Wiley & Sons, Inc., New York.
7 IMPLICATIONS ON ECOSYSTEMS IN BANGLADESH Ansarul Karim ECOMAC House # 45 (1st Floor), Road # 12A Dhanmomdi, Dhaka 1209 Bangladesh
7.1
Introduction
Rivers and streams with their associated flood basins and upland areas form complexly linked ecosystems in which land, water, plants, animals and humans interact and evolve in response to the interactions of the components of the system. Thus changes in any component of the system will impact the physical, chemical, and biological process occurring within the river system. River systems normally function within the natural ranges of flow, sediment movement, temperature and other variables, in what is termed “dynamic equilibrium.” When changes in these variables go beyond their natural ranges, dynamic equilibrium may be lost, often resulting in adjustments that are detrimental to the integrity of the ecosystem, which includes ecosystem structure, ecological process, regional and historical context, and sustainable cultural practices. The Ganges River ecosystem, which traverses three countries (Nepal, India and Bangladesh) forms one of the largest river ecosystems of the world. The livelihood of millions of people depend on the healthy functioning of this ecosystem. Over the years, human activities have contributed to changes in the dynamic equilibrium of the Ganges River ecosystem. Increase in human population and industrial, commercial, and residential development have placed heavy demands on this river ecosystem. These activities centered on manipulating river ecosystems for a wide variety of purposes, including domestic and industrial water supplies, irrigation, and transportation. The cumulative effects of these activities resulted in significant changes, not only to river corridors, but also to the ecosystems of which they are part. These changes include degradation of water quality, decreased water storage and conveyance capacity, loss of habitat for fish and wildlife, and decreased recreational and aesthetic value. This chapter addresses the implications of the reduced flow of the Ganges due to the upstream diversion of water on the downstream ecosystems located within the Bangladesh territory.
7.2
Bounding the Ganges Dependent Ecosystems
The spatial scale of the ecosystem area that is linked to the flow of the Ganges is a very complex issue. The Government of India recognizes the upper reach of the Gorai in the 125 M. Monirul Qader Mirza (ed.), The Ganges Water Dispersion: Environmental Effects and Implications, 125–161. © 2004 Kluwer Academic Publishers. Printed in the Netherlands.
126
Ansarul Karim
Southwest part of Bangladesh now under the Ganges-Kobadak (G-K) Project as the Ganges Dependent Area (GDA), while Government of Bangladesh (GoB) defines the GDA under the direct influence of the Ganges River flow, both quantitatively and qualitatively. The GDA covers an area roughly one-third of Bangladesh, which includes the Southwest region, the Meghna Estuary and the Northwest region (SWMC, 2000).
7.3
Impact on Physical Environment
The impact of the reduced flow of the Ganges on the physical environment is greatly felt in the reduced availability of surface water, the lowering of the ground water table, the increased salinity in the surface and ground water, the increased salinization of soil, the increased concentration of instream pollutant load and the changing geomorphology of the riverbed. The increased intrusion of seawater into the surface water of Southwest Bangladesh is one of the most visible impacts of reduced flow of freshwater in the Ganges dependent rivers in the region. A complex process of salinization in this region has been documented by a number of research workers. The substantial bodies of independent evidence which can be brought to bear on the question of the extent of salinity intrusion in the post-Farakka period comes from the special studies team fielded by World Bank1 (BWDB, 1977) and also the Gorai River Restoration studies done by the Environment and Geographic Information Services (EGIS), Dhaka, Bangladesh (EGIS, 2001). This special studies team systematically reviewed the historical and current measurements and analyzed them to obtain the best assessments of the extent and causes of change. The study divided the entire left bank of the Ganges into five compartments or North-South sections. Based on their analysis, they confirmed that the dramatic saline intrusion during the post-Farakka period, 1976 and 1977 occurred in the Rupsa-Passur to Gorai-Madhumati catchments area. These findings were further substantiated by the salinity modeling studies supported by the Delft Hydraulics, the Netherlands. 7.3.1
AGRO-ECOLOGY
The special studies claimed that the reduction in agriculture production was caused by moisture stress, while increased salinity also caused physiological drought and delayed planting (see Chapter 9 on agriculture for details). The agriculture of the entire Southwest region of Bangladesh is directly or indirectly dependent on the flow of the Ganges River for water for irrigation and prevention from flood damage. There are three sources of water flowing into this region: 1) the surface water flow of the Ganges, the Brahmaputra and Meghna and its tributaries passing into the region; 2) rainfall runoff from draining from the surrounding countryside; and 3) the 1
The study costs were financed by the International Development Association, a component of the International Bank for Reconstruction and Development (IBRD) under the provisions of Technical Assistance Credit 622-BD to the People’s Republic of Bangladesh.
Implications on Ecosystems
127
contribution from ground water. The reduced flow of the river, can affect the reduced availability and quality of irrigation water particularly salinity. Crops in the GDA are grown both under rainfed and irrigated conditions, with the rainfed practice dominant in 70% of the Net Cultivable Area (NCA). Traditional practices, local varieties and low levels of input and management are commonly associated with the rainfed crop culture. Productivity in general is low, with large year-to-year production fluctuations. Both moisture stress and high salinity during the rabi and pre-monsoon periods and drainage congestion during the monsoons contribute to low and unstable production. 7.3.2
SUNDARBANS MANGROVE ECOSYSTEM
The Sundarbans ecosystem represents a linked “landscape” along the river continuum of the Ganges and its distributaries on the one hand, and coastal processes along the Bay of Bengal on the other hand. Components and ecological variables of the Sundarbans and its linked ecosystems are highly complex. Functioning of the ecosystem is directly linked to the intermixing pattern of the freshwater water flow from upstream and the contiguous marine tidal water. The system is not independent of the neighboring land areas and the coastal process. This is why disturbance in the freshwater flow disturbs the whole process of nutrient flow and also the “envelope” of the physicochemical environment. To understand the possible impact of the reduced flow of the Ganges on the Sundarbans, the ecosystem components were identified and the interrelationships were established as completely as possible, in light of the existing knowledge. A general conceptual model linking different components of the ecosystem and input to the system is illustrated in Figure 7.1. Both the structural and functional characteristics of the Sundarbans ecosystem are described in terms of the following biophysical components: · · · · · · · · 7.3.3
Rivers Sea Mangrove substrate Terrestrial vegetation Terrestrial animals Benthic community Aquatic biota Upper catchment
RIVERS
The rivers (Figure 7.2) constitute to an important component of the Sundarbans ecosystem due to the transportation of freshwater for mangrove development. The prevailing freshwater flow into Bangladesh’s part of the Sundarbans depends on the hydrological conditions of the Ganges distributary system. Some receive limited freshwater and others none. Based on the characteristics of the river systems that pass through the Sundarbans the area can be divided into three sub-systems. The Western Kobadak system has no connection with the Ganges and carries no or very little freshwater to the Sundarbans during the dry season. The Central Gorai sub-system in which the rivers still maintain weak
128
Ansarul Karim
connections with the Ganges and the Shibsha and Passur Rivers and their connecting channels which carry moderate amounts of freshwater during the dry season. The Eastern Baleshwar sub-system is where the rivers carry large amounts of freshwater from the river Kacha and during the dry season, the rivers push the salinity front in the Eastern part of the Sundarbans down to the sea.
Rivers
Upper Catchment
Ground Water
Mangrove Substrate
Mangrove Forest
Terrestrial Fauna
Benthic Co mmunity
Aquatic Habitat
Sea
Figure 7.1. Conceptual ecosystem model of the Sundarbans. Source: EGIS, 2001.
7.3.4
SEA
The biophysical forcing from the adjacent Bay of Bengal is important for the mangrove to function through tidal regime, a source of salinity, nutrient and sediment and they are organisms that use part of their life cycle in both habitats. Sea influence is more important in the Southern part than in the Northern part.
Implications on Ecosystems
129
Basantapur Nalianala
Mongla
Mrigamary Harbarium
Kaikhali
Kobadak
Bogi Gewa Khalii
Harintana
Supotii
Notabeki Kochikhali Hiron Pt.
Katka
Mandarbaria
Figure 7.2. River system of the Sundarbans.
7.3.5
MANGROVE SUBSTRATE
Mangroves develop in different coastal settings. Thom (1982) described at least five types of sedimentary mangroves coasts globally. In alluvial deltas the setting is characterized by the deposition of terrigenous sands, silts and clay. The deltas build seawards over flat offshore slopes composed of fine grained sediments, and also long shore drift of mud reworked sand and shells by wave influence. Mangrove soils are characterized by high
130
Ansarul Karim
water content and often have high levels of salinity, low oxygen content and free hydrogen sulphide. The substrates are often semi-fluids that are poorly consolidated. Depending on the nature of the substrate the plains may contain an array of habitats where mangroves can be established or maintained. The ecosystem process in the mangrove is influenced by the physicochemical and biotic characteristics of the substrate. 7.3.6
MANGROVE VEGETATION
The Sundarbans mangrove vegetation consists of a group of special plants that thrive in a wide gradient of salinity. The vegetation form multi-layered closed woodlands. Historically three different forest types are recognized in the Sundarbans including the Indian part, based on the freshwater-salinity gradient that has led to a change in forest structure. 1) The freshwater type of forest is mostly dominated by Sundri or Sundri-Gewa; 2) the moderately saltwater forest is dominated by Gewa and Goran with scarce Sundri, but it is an important component of the mixture; and 3) the saltwater type consisting of sparsely spaced Gewa of 3 m-5 m in height with dense thickets of Goran. While some discrete forest types are apparent following the salinity gradient from low to high, one can see the repetitive occurrence of the said forest that are interspersed to form a mosaic in the landscape matrix. 7.3.7
MANGROVE FAUNA
The fauna of the Sundarbans mangroves reflects the convergence of three types of environments: · · · 7.3.8
a terrestrial inter-tidal vegetation, a sheltered muddy inter-tidal benthic habitat, and an estuarine aquatic habitat.
TERRESTRIAL FAUNA
The terrestrial vegetation consists of mostly closed multi-layered woodlands and also marshes (grasslands) fringing the forest. The terrestrial fauna is restricted to the forest canopy and the forest floor. A gradient of fresh and marine fauna is found on the inter-tidal substrate and in the lower levels of the forest. Like the flora, the fauna of mangroves is composed of a characteristic assemblage of species (both vertebrates and invertebrates) derived from those in terrestrial, marine and freshwater environments. 7.3.9
AQUATIC BIOTA
The aquatic sub-system of the mangroves provides a gradient of habitat ranging from freshwater to marine. The biota thus consists of plants and animals of freshwater to marine origin. The faunal components include a number of vertebrates including mammals, reptiles, fish and shrimp. The fish fauna occurring within the mangrove environment can be divided into:
Implications on Ecosystems · · ·
131
permanent residents, species that visit the mangroves intermittently as adults, and those occurring seasonally as eggs, larvae and juveniles.
These components vary geographically (Saenger et al., 1977) and also in relation to local topography, tidal range and salinity (Milward, 1982). 7.3.10
BENTHIC BIOTA
The bottom substrate of the mangrove and the estuaries provides a habitat for many sessile, burrowing, crawling and swimming organisms, a storehouse of organic matter and inorganic nutrients, and a site for many chemical exchanges and physical interactions. One might conclude that the primary attribute of estuaries regulates or modifies most physical, chemical, geological, and biological processes throughout the entire estuarine system via a benthic effect. The bottom sediment organisms of an estuary form a ‘biological lattice’ which contains a particular mix of organisms, and as they are associated at a moment in time are called a benthic community structure. Obviously this structure is not static, but it changes much more slowly than the nektonic and planktonic community structures in the overlying water column. Benthic organisms are often classified into non-taxonomic functional categories according to a variety of general characteristics, especially size, microhabitat and feeding type. 7.3.11
UPSTREAM CATCHMENT
The upstream catchment constitutes an important link that influences downstream mangrove development. Through their characteristics of geology, topography, soils and vegetation cover and land use in different catchments influence the runoff to rainfall ratio, and the quality of the runoff water that is ultimately released to their river systems. More than 125 polders have been constructed enclosing 1.3 million ha of land, about 44% of the total land area in the Southwest region at the upper reaches of the rivers flowing through the Sundarbans. A mixture of settlements, with agricultural and shrimp land characterizes the land use in these polders. Agricultural activity in the upstream lands puts a demand on the freshwater from the Gorai for irrigation. Fertilizer and pesticide residue from the agricultural land is also carried downstream with the runoff water. The impact of polderization on the Sundarbans is also evident in the silting of the rivers that once connected the perennial source of freshwater to the Sundarbans.
7.4
Impact of Reduced Freshwater Flow on Vegetation
7.4.1
FLORAL RICHNESS
The availability and proximity of freshwater affects mangrove development. Species distribution is strongly influenced by the extent of freshwater influx either from rainfall or from rivers (Bunt et al., 1982). Salinity is one of the major parameters that governs growth, height, survival, distribution and species composition of plants in the mangroves, which
132
Ansarul Karim
are adapted to different saline conditions. However, the higher concentrations of salt affects plant growth by either limiting the availability of water against the osmotic gradient or increasing the accumulation of ions in the toxic concentration within the plant tissue. The salinity of the river water is a source of salt (either as nutrients or toxicants) to the plants physiological processes. Forest growth declines with an increase in sodium content of the soil due to the increasing maritime influence. In contrast, there is a luxuriant forest growth and high species diversity if the balance swings towards freshwater influence. Historically the Sundarbans has evolved under the reduced salinity, which used to be maintained by large amounts of freshwater from upstream. The decline of forests is directly related to the declining flow of freshwater in the rivers. For example the degradation of mangroves started from the West when the G-K system lost its connection with the Ganges. Depending on the tolerance to salinity, the mangroves of the Sundarbans Reserve Forest (SRF) has been categorized into different groups. Table 7.1 below shows the species grouping based on their salinity tolerance. Table 7.1. Species groups characterized by their relation to freshwater/saline interactions
Ecological Tolerance
Species Group
Narrow ecological amplitude and associated with dominant influence of freshwater
Pongamia pinnata, Intsia bijuga, Ficus Cynometra, Amoora cucullata, Hibiscus tiliceous, Pandanus foetidas
Wide ecological amplitude with dominant freshwater influenced areas
Heritiera fomes, Bruguiera sexangula, Sonneratia apetala Bruguiera gymnorrhiza,
Narrow ecological amplitude and associated with moderate influence of freshwater
Luminitzera racemosa, Bruguiera parviflora, Heritiera fomes
Wide ecological amplitude and dominant in relatively high or little freshwater influence
Excoecaria agallocha, Ceriops decandra, Aegiceras corniculatum, Xylocarpus mekongensis, Xylocarpus granatum, Sonneratia apetala
Species with narrow ecological amplitude dominant in greater maritime influence
Avicennia marina, Aegialitis rotundifolia, Rhizophora apiculata
Source: IUCN, 1994.
Implications on Ecosystems
133
The floral diversity in terms of woody plants (Angiosperm and Pteridophytes) consists of about 123 species. The diversity of mangrove plants of the Sundarbans includes about 130 plant species, belonging to 22 families representing 30 genera. The forest canopy attains a height of about 20 m and is highly stratified in some cases. In the Eastern and North-Central part of the forest there are 4-5 strata, typical of tropical rain forest formation. Epiphytes and woody parasitic species are common. Floral richness is higher in the low saline areas in the Northeast. Increasing the salinity would result in changing the composition and dominance of species. Most affected species due to the reduction in freshwater are the low salt tolerant species like the Sundri, Gewa, Passur Amoor, Singra and Kankra. These species gradually decrease their coverage in areas where salinity level exceeds their favorable ranges. With increasing salinity the number of species are reduced. Many species, with narrow tolerance to salinity (particularly Portresia cocoarctata and Myriostachya wightiana) are well distributed. Shingra (Cynometra ramiflora) and Amur (Amoora cucullata), Hibiscus tiliceos, Phragmitis karka, and Cyperous rotendus will be exterminated from the Gorai impact area. 7.4.2
MORPHODYNAMICS AND VEGETATION CHANGE
Fluvial surfaces are response units to the interaction of stream erosion, accretion and vegetation, with each providing a unique habitat representing a potential niche for vegetation development. Geological and tectonic activity, together with past and present drainage patterns has been instrumental in defining the present geomorphology of the Sundarbans, where at least four morphometric categories are discernible: river or stream creeks, mudflats, ridges and back swamps. While the geomorphic process largely determines the development of mangroves in a region, they are important mainly through producing certain substrate or soil conditions and regulating the inundation time and frequency. An analysis of vegetation along a landform gradient reveals that species assemblage pattern is changed with the changing pattern of landform and its position in relation to the sea level. Thus hydrological factors (sedimentation, drainage density, etc.) that change the morphometric pattern of the landscape are present on the vegetation development in the Sundarbans. It was also revealed that micro-scale geomorphic features provide variable hydrologic regimes. Within the broad limits of their salinity tolerance, species dominate in different geomorphic settings. Changes in elevation in relation to tide level fluctuations restricts certain species to their preferred zone of submersion and exposure period. While the probability of inundation by tidal water decreases with elevation, species become sorted along the micro-topographic gradient according to their flooding tolerance. Each plant has a critical level of inundation above or below where growth declines. Thus within the broad zone of hydric salinity, the structure of the forest declines with the increased elevation. Depending on their position in different morphometric settings, two distinct groups of species can be identified. Species in the foreshore mudflats are Uri, Golpata, Keora (Figure 7.3), Chaila, Jana, Baen, Khalshi, while Sundri, Gewa, Kankra, Passur, Dhundal, Amoor, Singra and Keya are the back swamp species. Goran and Hantal belong to the high
134
Ansarul Karim
elevation ridge species. The geomorphic gradient is typical of the whole delta formation, but the sequence of vegetation is changed under different salinity and management conditions.
Figure 7.3. The Sundarbans showing the Keora and Golpata. Photo courtesy of: Maminul Haque Sarker, CEGIS, Dhaka, Bangladesh.
7.4.3
FOREST TYPES
The Sundarbans vegetation consists of recurrent patches of vegetation types. Overall, the mosaic formed by these patches represents equilibrium for the whole ecosystem. It is however argued that the mosaic of forest types represents the seral stages towards an equilibrium condition of vegetation development (Karim, 1988). Depending on both biotic and abiotic stresses, including management conditions, there are a number of self-maintaining terminal stages of vegetation development which differ from the traditional concept of climax. The most favorable development of vegetation occurs in the freshwater dominating area where Sundri is the dominant plant. Another extreme condition is the terminal community, which is dominated by Goran, a thicket of scrub rather than forest. In both cases, grasses and/or trees dominate the initiating or pioneer stage of vegetation development.
Implications on Ecosystems
135
At the present level of information the potential changes in forest types due to the changing freshwater flow from upstream can best be understood by a comparison of the forest types of the Eastern region with that of the Western region. An attempt is made here to detect the changes in floristic composition that occurred between 1985 and 1995, when the freshwater flow into the Sundarbans was gradually decreasing. Table 7.2 shows the vegetation change from 1985-1995. The data was obtained from the forest department of two vegetation maps depicting polygons of different dominant plant communities. The vegetation changes were detected by overlying the two maps, which is shown in Figure 7.3. Table 7.2. Change of vegetation area (km2) from 1985 to 1995
Vegetation Communities Water Sundri Sundri-Gewa Sundri-Passur Sundri-Passur-Kankra Gewa and Gewa-Mathal (Coppice) Gewa-Goran Gewa-Sundri Goran Goran-Gewa Passur-Kankra Passur-Kankra-Baen Baen Keora Grass and Bare Ground Tree Plantation Sandbar
1985
1995
836.50 1,208.29 21.84 67.32 193.40 373.70 597.97 85.50 571.87 9.55 16.77 9.28 36.61 43.68 3.52 3.97
4.46 750.30 1,061.70 24.71 73.94 213.86 348.96 764.83 83.34 563.70 2.86 25.85 11.47 79.32 58.91 2.10 9.45
Source: EGIS, 2001.
During this period major changes occurred in the Sundri and Gewa dominated areas, with Gewa gradually replacing Sundri as the dominant tree species. Pure Sundri dominated area was reduced by about 86 km2 or about 11% of its previous extent, most of which have converted into Sundri-Gewa and Sundri-Passur-Kankra communities. The Sundri-Gewa community also followed a decreasing trend, losing 146 km2 or more than 10% of its land to Gewa-Sundri and Gewa-Mathal communities. The overall shift is from Sundri to Gewa and from Gewa to other more saline tolerant species. A similar trend is also visible even in the higher saline zone where high saline loving Goran replaces Gewa and Sundri. The Keora dominated area has also increased from 37 km2 to 79 km2, an expansion of 110%. Grass and bare ground areas have also increased by about 15 km2.
136
Ansarul Karim
The general trend during this 10-year period indicates the reduction of commercial valuable species like Sundri and Gewa forests and an increase in less valued smaller tree species. From the map (Figure 7.4) it is evident that the changes occurring during this period are mostly concentrated in the Eastern part of the Sundarbans. This might be because of the changed scenario of salinity regime in the Eastern belt due to the decreasing freshwater influx from the Gorai River. The vegetation community in the Western region seems to have been more stable during this period as the hydrological regime in this area remained stable. The latest inventory shows that the compartments lying within the primary influence area are mostly Sundri dominated forest types. The average height of the trees is 15 m-20 m. i.e. the forest belongs to quality class-1. Under the no Ganges flow condition the normal pattern of vegetation succession in the low saline zone would change to the succession pattern of high saline areas. Moreover, the growth rate of the plants would decrease as a result of stress caused by higher salinity in the soil and water. Table 7.3 shows the forest types in the SRF under no Ganges flow condition salinity ranges. 7.4.4
WOOD PRODUCTION AND SALINITY
The relation of vegetation distribution and environmental interactions indicated that the increased salinity in the environment not only affects the association pattern but also the wood production. Some plants growing luxuriantly in the low saline condition became stunted under the high saline condition. Salinity has a direct negative correlation with wood production. Table 7.4 shows the correlation between merchantable volume and salinity. The relation between salinity and wood production is negatively correlated for the Sundarbans with a correlation coefficient of -0.86 and -0.88 between the wood volume and soil and water, respectively (Table 7.5). 7.4.5
PLANTS OF CONSERVATION SIGNIFICANCE
Mangroves worldwide have been classified into different biogeographic formations. The Sundarbans mangrove belongs to the Indo-Malayan biogeographic region. Due to its floral richness and dominant floral element, mangroves along the Northeastern coast of the Bay of Bengal occupy a unique position among global mangroves. The natural vegetation of the forest is composed of true mangrove trees and mangrove associates. World mangroves in most cases show dominance of family Rhizophoraceae. Unlike other world mangroves and also the Indo-Malayan biogeographic region, the dominant floral element in the Sundarbans is Heritiera fomes a member of Sterculiaceae. An assemblage of species typical to the Sundarbans once extended from Orissa coast through the Sundarbans, from Chakaria, from the Naaf Estuary in Bangladesh to Tanasserim and from the delta of the Irwadi in Mayanmar. Most of the natural vegetation within this distribution range has been cleared for other land use. The near natural vegetation with Sundri dominant species is at present limited only to the freshwater dominating Eastern part of the Sundarbans.
Implications on Ecosystems
137
Figure 7.4. Changes in species composition in the Sundarbans during 1985 and 1995. Source: EGIS, 2001.
Source: EGIS, 2001.
Baen Gewa Gewa-Goran Gewa-Mathal (Coppice) Gewa-Sundri Goran Goran-Gewa Keora Passur-Kankra Passur-Kankra-Baen Sundri Sundri-Gewa Sundri-Passur Sundri-Passur-Kankra Total
Vegetation Community
11,803 (2.9)
394 (0.1)
5,882 (1.5) 13,333 (3.3) 32 (0.0) 1 (0.0) 32,141
6,179 (1.5)
980 (0.2)
2,675 (0.7) 6,133 (1.5)
17,244
13 (0.0) 683 (0.2)
1,276 (0.3)
24,974 (6.2) 18,653 (4.6) 702 (0.2) 1,140 (0.3) 66,328
523 (0.1) 20 (0.0)
18,349 (4.6)
110 (0.0) 1,714 (0.4) 145 (0.0)
882 (0.2) 13,261 (3.3) 11,418 (2.8) 589 (0.1) 31,272 (7.8) 775 (0.2) 7,051 (1.8) 4,266 (1.1) 266 (0.1) 2,589 (0.6) 41,615 (10.4) 58,085 (14.5) 1,744 (0.4) 6,236 (1.6) 180,049
Area in ha (yield/ha) under different ranges of salinity 5-10ppt 10-15 ppt 15-20 ppt 20-25 ppt
Table 7.3. Forest types in the SRF under no Ganges flow condition salinity ranges
2 (0.0) 10,487 (2.6) 2 (0.0) 37 (0.0) 105,807
109 (0.0) 3,074 (0.8) 23,543 (5.9) 968 (0.2) 8,518 (2.1) 7,554 (1.9) 49,409 (12.3) 2,105 (0.5)
>25 ppt
138 Ansarul Karim
Implications on Ecosystems
139
Table 7.4. Relation between merchantable wood volume and salinity in the Sundarbans
Forest Blocks
Total Merchantable Wood Volume (m3/ha)
Soil Salinity (ppt)
Water Salinity (ppt)
4 1 5B 2 3 7 8 5A 6
59.5 53.0 36.6 34.9 23.6 21.6 19.5 18.0 17.0
4.6 7.1 8.0 6.1 9.3 13.2 12.0 14.0 10.0
3.4 3.4 19.0 13.0 12.5 21.0 23.0 19.0 21.0
Source: EGIS, 2001. Table 7.5. Correlation coefficient between total wood volume and dry season salinity
Parameter
Wood volume Soil salinity Water salinity
Wood Volume (m3/ha)
Soil Salinity (ppt)
Water Salinity (ppt)
1 -0.86 -0.88
1 0.77
1
Source: EGIS, 2001.
Salinity is a critical factor for the growth and regeneration of the species, and plant species have already shown a declining trend. Under the FWOP (Future without project) condition Sundri dominated areas will be subjected to increasing salinity. If the declining trends continue unabated this unique forest type will become extinct in 50 years (FRMP, 1998). The Sundarbans low water forests are highly stratified with 4-5 forest strata. With the increase in salinity the forest stratum is reduced to 1-2 strata thus reducing the habitat diversity. Under such situations the only endemic species Cirhopetalum roxburgii Lindl. which occurs in the Eastern part of the forest is likely to be lost. If the East Sanctuary represents all the species found in the other two sanctuaries, it is suggested that there has been or continues to be, a loss of species during the process of change towards a Goran forest type. The underlying dynamics of the above differences appear to be related primarily to the loss of tree species - the cause of which is assumed to be salinity linked. As mentioned, there is a correlation between the salinity and the decline in biodiversity. In the more saline West and South Sanctuaries, there are changes in
140
Ansarul Karim
vegetation with Sundri falling from a high of approximately 50% in the East to 30% in the South and less than 1% in the West. There would appear to be a strong linkage between salinization and the underlying changes reported in the habitat and species data. This conclusion is supported by the expected succession patterns (Karim, 1988) for a range of salinity conditions, and land elevations relative to tidal heights. Sundri is the climax species but only under low salinity and within a primary succession condition. With increasing salinity and stress the climax species is increasingly Gewa, which in higher salinity conditions succeeds the Goran. These latter two species dominate the floral habitat of the saline South and West Sanctuaries. The lack of linkages between all these factors in the management plan raises serious concern at the relevance and priority assigned to the proposed management strategies. Maintaining the proposed dry season isohaline line of 20 ppt below the “Sundri Area” under the FWIP2 (Future with project) high flow scenario will provide habitat for these endangered plant species. Monitoring the regeneration dynamics of the plant species is an important priority that should be incorporated into the overall monitoring of the GRRP and the Sundarbans Biodiversity Conservation Project (SBCP). 7.4.6
WOOD PRODUCTION
Direct evidence on dose-response relationships to quantify the increased volume of wood and non-wood harvest as a consequence of the changing salinity regime is difficult. However, the historical and spatial trend of vegetation change from low salinity to high salinity and the area affected due to the freshwater flow from the Gorai can be the basis for the projection of the future change in the harvestable wood volume. The forest inventories of the Sundarbans (Forestal 1960; ODA, 1984; and FRMP, 1995) and growth data of PSP’s (Karim, 1994) provide an excellent dataset for predicting the changes that have occurred in the past. Predicted salinity change maps and standing timber volume data can be used to ascertain the Gorai impact area within the Sundarbans. The prediction of timber production will depend on the characteristic of vegetation change under the projected scenario. At the present level of ecological information, a relationship can be established only between wood productivity and salinity. EGIS (2001) reported wood volumes for different water salinity levels, and assigned water salinity levels to existing wood volume using this relationship. Based on this relation, prediction of wood volume change under the different scenarios can be made using two alternative models: a Statistical Prediction Model and a Forest Harvest Model. EGIS (2001) reported that a projection of the standing stock volume can be determined with the aid of a statistical model. In this model, prediction is made based on the equations derived from the statistical correlation between water salinity and total wood volume (Karim, 2
Refers to the Gorai River Restoration Project (GRRP). For details see Chapter 12.
Implications on Ecosystems
141
1995). For predicting the wood volume in relation to the predicted salinity change under different scenarios, the forest compartments (the basic unit of forest management) of SRF were the Primary Gorai Impact, Coastal Influence, Western Saline and Eastern Zones. The resultant allocation indicates that the area associated with the Gorai River is 54% of the total land area and 51% of the effective area. EGIS (2001) provides the list of compartments and standing timber volume for 1995 in each zone. The total wood volume per hectare for the primary Gorai Impact Zone is, on average, 43.2 m3/ha compared to an average of 17.2 m3/ha for the Coastal Impact Zone and 10 m3/ha-11 m3/ha for the Western Saline Zone. The expected changes to the Primary Impact Zone were 4.9 million m3 in the FWIP compared to the FWOP prediction. Of this quantity, 3.86 million m3 was associated with the Sundri inventory and 1.22 million m3 for other species category. Table 7.6 below shows the predicted wood volumes under different alternative scenarios. Table 7.6. Summary of projected standing stock volume by species composition for alternative scenarios (million m3)
Zone
Area Sundri (% of total) (million m3)
Other Spp. (million m3)
Total (million m3)
Baseline Scenario Impact Zone a.1 Primary a.2 Secondary b. Saline c. Baleswar d. Total
51 14 33 11 100
4.86 (71%) 0.48 (7%) 0.17 (2.5%) 1.30 (19%) 6.81 (100%)
1.80 (50%) 0.32 (9%) 1.03 (29%) 0.44 (12%) 3.59 (100%)
6.66 (64%) 0.80 (8%) 1.20 (11%) 1.74 (17%) 10.4 (100%)
No flow Scenario Impact Zone a.1 Primary a.2 Secondary b. Saline c. Baleswar d. Total
51 14 33 11 100
0.62 (29%) 0.075 (4%) 0.17 (8%) 1.30 (60%) 2.17 (100%)
1.08 (3.5%) 0.54 (17%) 1.03 (33%) 0.44 (14%) 3.09 (100%)
1.71 (33%) 0.61 (12%) 1.20 (23%) 1.74 (33%) 5.26 (100%)
Source: EGIS, 2001. Data from the Forest Department has been used.
For the Coastal Influence Zone the inventory change is significantly smaller with a gain of 0.56 million m3 of Sundri and unchanged for the other species. In total the inventory change amounts to 5.5 million m3.
142
Ansarul Karim
Further to this is the change in off-take as growth rates vary or change between scenarios. In the FWOP scenarios, 20% of the total volume loss is assumed to be salvaged in the year of loss. The composition of the final inventory for the “No flow scenario” changes are as marked, largely due to the reduced presence of Sundri. While the inventory for the FWIP increases slightly under the model, this makes little difference, as it represents vegetation as final inventory as opposed to being part of the annual off-takes. The contribution of inventory by zones is markedly different under the FWOP scenario, while under the base and FWIP scenarios, the Gorai Impact Zone supports over 70% of the total inventory. This is predicted to decline to 45% in the FWOP. Similarly the proportion of Sundri within this inventory volume will decline from 70% in the base to 41% in the FWOP. The Gorai Impact Zone will support 33% of the total Sundri volume under the FWOP scenario compared with 78%-80% in the base and FWIP scenario. From the above it can be concluded that the primary vegetation cover of the Sundarbans will change markedly under the FWOP and will be maintained under the FWIP scenario providing that the simulated salinity predictions are attainable. The implication of the expected changes to vegetation due to changes in salinity is important for the wider timber supply in Bangladesh. There is a nationwide shortfall of wood for fuel that is predicted to reach 5 million m3 in the year 2008. The Sundarbans have traditionally provided about 45% of the total wood supply. Under the project the Gorai impact area will in the FWOP scenario provide 148,000 m3/year for the period of the project and effectively nothing thereafter. This level of off-take amounts to less than 10% of the current national supply or 21% of the historical level of supply. The continued loss of production from the Sundarbans in the FWOP scenario will clearly increase the shortfall of wood in the national context. A harvest and growth model was developed specifically for application to compartments, which have varying areas and growing conditions in the Sundarbans. Instead of a statistical prediction, this model takes into account the growing stock, in-growth and targeted unofficial rate and effect of top dying in estimating the increment for each of the compartments. It also takes into account the volume of crown wood in projecting the yield forecast. Annual per hectare volume increments are also adopted from the results of the growth analysis of the PSP’s (Karim, 1994). Given the growth and harvest assumptions and stocking levels of the compartments belonging to the “Immediate Gorai Impact Area” and “Coastal Zone Influence Area”, the growth prediction for each of the compartment was carried out for Sundri and Gewa. The predicted estimate of Sundri and Gewa wood volume is given in EGIS (2001). The Sundri timber volume increment was estimated to be 4.86 million m3 (3.86 million estimated by EGIS, 2001), while Gewa was 1.9 million m3 (1.22 million estimated by EGIS, 2001). Table 7.7 shows the 25-year projection of Sundri and Gewa wood (including crown wood) from the base year of 1998. Although the estimated wood volumes of the two models provide comparable results, the statistical prediction model reported by EGIS (2001) underestimates the increment in wood production under the FWIP scenario. This difference is understandable from the model that uses two different approaches. In the present case, in addition to the timber volume,
Implications on Ecosystems
143
crown wood, which has both industrial and ecological value, was also taken into account in the computation. In addition, the removal of trees whether official or unofficial (except dead trees) was considered as growth in the present model. Under the FWIP, the supply of 333,000 m3 per year will continue beyond the end of the project. This amounts to only 22% of the national supply or about 50% of the historical supply level. The loss of commercially valued species within the FWOP scenario represents a major change in the incentive system for the protection of the Sundarbans. At present the Forest Department (FD) has a strong incentive to protect the Sundarbans forest in order to obtain the fees and payments associated with the extraction of the resource. The reduction and eventual loss of commercial species (mainly Sundri) may therefore lead to increased land conversion, such as occurred in the case of the Chakaria Sundarbans in the Southeast of Bangladesh. 7.4.7
FUELWOOD RESOURCES
Fuelwood comes from natural stands of Goran as well as other small trees, such as Singra, Amur and Bhola. Fuelwood also comes from the branches of harvested Sundri, Gewa, and other bigger trees. The Goran production area lies mostly in the Western part of the Sundarbans located outside the Gorai impact area. Under the FWOP scenario there will likely be an increase of the Goran stand in the Gorai impact area at the cost of Sundri production. Crown wood volume that could be obtained from Sundri and Gewa will be reduced under the FWOP scenario. Khulna Hard Board Mill, which is dependent on the Sundri crown wood for its raw material will be affected under the FWOP scenario. Low salinity preference species like Amoor, Singra and Bhola will also be reduced under the FWOP scenario due to the increasing salinity. The present trend of fuelwood production particularly the Sundri and Gewa crown wood volume will continue under the FWIP scenario.
7.5
Impact on Faunal Richness
Vegetation in the mangrove comprises of plants of both aquatic and terrestrial habitats, woody trees, grasses and plankton. Vascular plants are especially important to wildlife. The high content of structural materials (cellulose, lignin and silica) that makes many mangrove plants resistant to decay also makes them abrasive and difficult to eat but useful for shelter from enemies. Salinity or sedimentation that changes vegetation can thus change habitat. Although vertebrates in coastal areas often tend to have broad habitat affinities, a few wildlife species depend upon a single plant species to a great degree. A change in the abundance of such a plant can have profound effects upon associated animals in vegetationally simple mangrove communities.
Source: EGIS 2001.
Total
Coastal Influence Zone 1998 2023 Increment
Immediate Impact zone 1998 2023 Increment
Year
4,203,454
263,910 369,873 105,963
5,509,475 9,606,966 4,097,491
657,078
47,657 66,574 18,918
862,171 1,500,331 638,160
Sundri Timber Volume Crown Wood
Table 7.7. 25-year prediction of wood volume (m3) in the Sundarbans
1,770,074
149,359 627,385 478,026
607,107 1,899,155 1,292,048
Timber Volume
Gewa
171,127
15,332 64,383 49,051
56,819 178,895 122,076
Crown Wood
144 Ansarul Karim
Implications on Ecosystems
145
The mangroves fauna reflects the convergence of two types of environments: (1) a sheltered marine muddy inter-tidal habitat and (2) a terrestrial forest. Unlike other mangroves, mangroves in the Indo-Malayan region are usually multi-layered woodlands more than 10 m in height with a closed canopy. As the terrestrial fauna is found mainly on the substrate and in the lower levels of the forest, vertical partioning of the two dominant kinds of fauna occurs. A third but minor component, a freshwater fauna, may be present along the margins of mangroves in their upper regions. Within the two major faunal components, subdivisions occur. For example, the terrestrial fauna may be restricted to the canopy or to the trunks of trees or be found only on the floor of the mangrove during low tide. In some cases, these animals may be restricted to zones of particular mangrove species, insects may prefer the rough bark of Rhizophora to the smooth bark of Avicennia while some bats feed mainly on the nectar of Sonneratia flowers. Similar subdivisions occur within the marine fauna, with some animals being restricted to the wetter frontal zones of the mangrove among the Rhizophora. Like the terrestrial fauna, the distribution of the marine fauna may be determined by the zonation of the mangroves themselves. The density of pneumatophores and the amount of debris and fallen logs on the forest floor may be important for cryptic and wood inhabiting species by providing cover and protection from desiccation. The density of seedlings and the canopy cover, which provides shade, can be important for species living on the surface of the mud. Herbivorous species may exhibit feeding preferences for particular mangrove species. No data is available on the minimum area of mangroves needed to maintain viable population of higher mammals. It is presumed that larger stands of mangroves may provide sufficient refuges for some of the fauna to survive during adverse conditions such as floods and cyclones. In many cases mangroves are contiguous with the adjacent terrestrial forests and some of the terrestrial fauna occurs in both habitats. Often these animals use the mangroves simply as an extension of the terrestrial habitat but in some cases the mangroves provide an essential seasonal source flood or a suitable site for breeding or laying eggs. The adjacent vegetation type can influence the terrestrial fauna of mangroves. A given type of mangrove may have very different kinds of animals depending on whether the adjacent habitat is a tropical forest or a flood plain. The terrestrial fauna can be affected by the presence of permanent freshwater, the frequency of flooding, variation in rainfall, evaporation and tidal patterns, all of which determine water availability and its temporal distribution at critical times of the year for both sedentary and migratory species. The information on the relation between the habitat quality and the distribution of wildlife in the Sundarbans is scanty. Animal diversity decreases with the decrease of forest strata. The dense forest cover with multiple strata provides varied ecological niches and supports a stable ecosystem. Any reduction of forest cover and strata diversity in the Sundarbans is likely to have an adverse impact on faunal diversity.
146
Ansarul Karim
7.5.1
WILDLIFE AND SALINITY INTERACTIONS
Wildlife is here considered as the higher vertebrates: mammals, birds, reptiles, amphibians, and animals, which have received attention in the inventory reports of the Sundarbans and most often noticed by casual visitors. Salinity patterns affect wildlife in a variety of ways such as salinity tolerance, food availability, habitat preference and predator control. Most estuarine animals, however, show distributions or behaviors that are related to salinity. Large bird species with salinity tolerance and broad diets seem relatively unresponsive to salinity. Some species, particularly those requiring preferred vegetation cover for their habitat and diet, will be affected by salinity. Not much is known from the Sundarbans but studies from the salt marsh and other coastal areas suggest that the mammal community composition shows species sorting along salinity gradients. Muskrats are most common in brackish marshes while nutria are most common in fresh marshes (Abernethy, 1987). Gordon and Tucker (1965) found that the Thailand crab-eating frog spawns after rains when the rainwater freshens the brackish pool, although the frog can tolerate 20% of seawater. Low salinity favors the larval development. Population density may vary with salinity, or different age and sex classes of a population may use habitats with different salinity. Juveniles of American crocodiles cannot tolerate full strength seawater and need estuarine nursery habitats. American alligator juveniles and adult females live in fresh ponds while adult males live mainly in saline marsh creeks. Species may use a mosaic of habitats of different salinity to satisfy their needs. IUCN (1994) lists at least 35 species of reptiles, more than 270 species of birds, and 42 species of mammals although these are not sourced. The later report lists 425 species in the Sundarbans of which 49 species are mammals; 315 birds; 53 reptiles and 8 amphibians. This reporting is very unclear as, on the same page, it states that there are closer to 300 species of fish (pp.100), 290 birds, 42 mammals, 35 reptiles and 8 amphibians. The same report presents the following illustrative table (Table 7.8). Table 7.8. Reported faunal observations in SRF
Groups
Khan (1986)
Sarker (1986)
Scott (1991)
Amphibia Reptilia Aves Mammals
8 50 261 49
10 63 282 41
8 35 270 42
Quite clearly this suggests that for birds and reptiles there is a need for clarification and further work to identify what species are present, the consistency of reports for amphibia and mammals suggests at least some degree of agreement.
Implications on Ecosystems
147
Faunal diversity in the sanctuaries is large, with some 289 terrestrial species identified by Seidensticker and Hai (1983), and 219 aquatic species by Chantarasri (1994). EGIS (2001) confirmed most of these as being present (Table 7.9). Table 7.9. Faunal species in the Sundarbans
Groups
East
South
West
Amphibia Reptilia Aves Mammals Total
3 13 73 12 101
7 11 52 13 83
5 12 49 14 80
Source: EGIS, 2001.
The reduced faunal diversity reported for the West and South Sanctuaries compared to the Eastern Sanctuary mirrors the declining diversity in floral representation. It is noteworthy that the West Sanctuary has some 20% fewer faunal species. Understanding these changes will be addressed through special studies. The extended survey highlights the richness of the East Sanctuary compared to the others. This richness is most notable in the Avian taxa. Most importantly this dataset reports four globally threatened species of which only two are represented in the other sanctuaries. Currently, the sanctuaries represent 33% of SRF mammal species, 27% avian species, 34% reptiles and 40%-50% amphibia. The table above indicates one potential area for monitoring faunal species. Avian species appear to be a good indicator of the status of the underlying habitat and ecosystem in the different sanctuaries. A clear review of the differences of avian species is a clear priority, which should be used to design an avian monitoring program as a potential indicator of change or status of habitat in different areas. Clearly one of the most urgent priorities is to evaluate/confirm the biodiversity in the SRF and then redesign a conservation system that provides an appropriate level accounting for the dynamic changes that are occurring in the three sanctuaries. The distribution of wildlife is also changing, as with the changed vegetation pattern, the trend of which is difficult to ascertain at the present level of information. Given that the data are from secondary documentation, there is a basis for developing monitoring program priorities. For example, species that are not found in the West Sanctuary should be monitored closely in the East Sanctuary. The reported changes to fauna in the West need to be related to changes in habitat and then monitored to establish the trends and how these may be reflected in faunal changes. Earlier wildlife research has hypothesized that the increase in salinity is driving changes to habitat to the extent that faunal populations are moving to avoid high salinity conditions. This should be a priority for the assessment of faunal abundance.
148
Ansarul Karim
A major gap in the existing conservation knowledge is the lack of data on faunal populations. While most comment on the tiger populations there is a need to assess the population of a range of faunal species especially if a species is considered threatened or endangered of which Sarker (1993) identified 46 in the Sundarbans. The relative proportions of ‘at risk’ species for fauna and flora are presented in tables which highlight the importance of the Eastern Sanctuary, which currently has 21% of its species classified as being ‘at risk’. Of the 33 considered to be ‘at risk,’ 4 are considered to be at risk from an international perspective, which alone with the icon of the Royal Bengal Tiger would indicate significant global value in the protection of biodiversity (Table 7.10). Table 7.10. Faunal Taxa breakdown Sanctuary
Order
Family
Genera
Species
Nationally Rare
Globally Threatened
Aves Amphibian Mammals Reptile Total
69 2 11 7 89
72 2 12 10 96
84 5 15 11 115
13 3 16
1 1
Aves Amphibian Mammals Reptile Total
65 3 12 9 89
67 3 12 9 91
80 6 13 10 109
9 2 11
2 2
Aves Amphibian Mammals Reptile Total
81 3 12 10 106
83 3 12 12 110
108 4 12 13 137
24 1 4 29
2 1 1 4
West
South
East
Source: EGIS, 2001.
There is a lack of appreciation and application of the precautionary approach within the management plans despite the claim that it is an important factor in planning. Given the lack of information on faunal biodiversity, especially the linkages between habitat and predator-prey relationships (including prey switching) it is extremely risky to intervene to promote additional tiger prey. To increase spotted deer populations through habitat manipulation when the habitat is undefined, the constraints on populations are unknown, and the effect on the wider habitat and faunal landscape is an extremely risky strategy that does not reflect a precautionary approach. 7.5.2
TERRESTRIAL FAUNA
The area is known for its wide range of flora and fauna including the Royal Bengal Tiger
Implications on Ecosystems
149
(Panthera tigris) (Figure 7.5), over 270 spp. of birds, 35 spp. of reptiles and 42 spp. of mammals are recorded. At present there are some 42 species of mammals within and near the SRF. The larger terrestrial mammals found in the SRF are: Tiger (Panthera tigris), Spotted Deer (Axis axis), Wild Boar (Sus scrofa), Barking Deer (Muntiacus muntjak) and Rhesus Macaque (Macaca mulatta). Fishing cats (Felis viverrinus,) and also jungle cats (Felis chaus) have been reported from the Sundarbans. Different authors provide rough population estimates of the mammals in the Sundarbans. How the terrestrial mammals and the amphibians will be directly affected due to the decrease in freshwater is not known. There are many species of birds, which are opportunistic in the sense that they roost inside the Sundarbans and gather food from the neighboring areas. These birds breed in the mangrove areas as well. It is however apparent that birds which prefer a tall canopy for their nesting will suffer much with the increasing salinity.
Figure 7.5. The Royal Bengal Tiger.
7.5.3
AQUATIC BIOTA AND FISHES
The vast network of rivers and creeks inside the Sundarbans provide habitats of a wide variety of Planktonic (small floating organism) and Nektonic (actively swimming pelagic organisms). Not much is known on the ecology of the aquatic biota of the Sundarbans. The literature dealing with the aquatic biota of the Sundarbans lists at least 7 species of aquatic mammals (4 dolphins, 1 species of gavial, and 2 species of otter), 7 amphibians, and 16 species of reptiles have been reported from the Sundarbans. Prominent among them are 2 species of crocodiles (Crocodylus porosus, Crocodylus palustris), 2 species of monitor lizards, 5 species of snakes and 1 species of river terrapin, 4 species of turtle and 4 species of marine turtles. Among these species Batagur baska and Crocodylus porosus have restricted distribution in the Eastern low saline areas of the Sundarbans. Sundarbans also provide habitat for a rich diversity of fishes, shrimps and molluscs. It includes 53 species of pelagic fish, 124 species of demersal fish, 24 species of shrimps, 7 species of crabs, 2 species of gastropods and 6 species of pelecypods. Besides, the contiguous water in the offshore also supports a large variety of marine organisms.
150
Ansarul Karim
The environment of the Sundarbans as nursery ground of so many marine fishes would deteriorate as salinity rises. This would be due not only to less freshwater in the dry season but also less water supply in the wet season. It is expected that the low saline dominant species would be replaced by medium to high salinity dominant species in this area. Fishes like pungas, bhetki and golda may be invaded by datina, poa and sharks. Of all options, habitat deterioration would increase under the FWOP condition. Expected degradation, is due to the increase of salinity, mainly in the dry season, which would negatively affect the fish population and biodiversity. The aquatic condition of the Sundarbans as the nursery ground for many marine fishes would be severely affected. Marine fishes usually breed in salinity less than 26 ppt, and in the future of this option, salinity higher than this range would be exceeded in several parts of the Sundarbans. Due to the increase of salinity concentrations of ichthyoplankton will be reduced and the reduced use of nursery grounds by marine fishes is expected. As juveniles of many marine species of prawns and fish such as Chaka Chingri (Penaeus indicus), Gura Chingri (Leander stylifera), various sciaenids and ribbon fish (churi mach) migrate into the lower zone of the estuary during the winter and summer months to feed and then return to the sea with the onset of the monsoon, it is expected that these species would invade Northward and Northeastward and low saline dependant species will be affected. With the increase of salinity, sharks will increase and they may have higher predation. However, in spite of species changing, which has a tremendous biological and ecological importance, the total production would not change. Long-term negative impacts would affect marine fish that depend on the Sundarbans for at least some part of their life stages.
7.6
Water Quality and Aquatic Biota
Mangroves are believed to have the capacity to absorb high levels of nutrients, particularly those contained in sewage. It has been shown that heavy metals contained in the sewage sludge are indeed released and are accumulated by species in the mangroves and sea grasses to which it is discharged. In the seedlings of Baen (A. alba) and Xana (R. mucronata) they appear not to be adversely affected by zinc, lead, cadmium and mercury, but such materials, once accumulated in their tissues, can be passed along the food chain, ultimately attaining unacceptably high levels in species consumed by humans. Dredging spoils suspended into the rivers can cause serious problems in estuaries by decreasing the photosynthesis of aquatic plants, by smothering benthic organisms, by reducing the level of dissolved oxygen and by releasing toxic substances, which have accumulated in the sediments. If the sediments are spread over the mangrove floor many of the mangrove plants will die.
Implications on Ecosystems
151
With the increase in intensified agriculture, industrial growth and port activity, the pollution load in the rivers will increase considerably. Mongla Port has no oil spill management plan in operation. Salinity gradients along a river will determine which species penetrate upstream providing suitable habitats which are otherwise present as salinity affects the zonation of mangroves.
7.7
Salinity and Fish
According to EGIS (2001), 53 species of pelagic (27 families), 124 species of demersal (49 families), 24 species of shrimp (5 families), 7 species of crab (3 families), 4 species of lobster, 2 species of snail, 6 species of mussel and 3 species of turtle currently live in the Sundarbans. The Northern and Northeastern part of the Sundarbans have low saline especially in the wet season. There are a number of freshwater species here due to the low salinity: e.g. Golsha Tengra (Mystus cavasius), Poma (Pama pama), Phesa, Pangus (Pangasius pangasius), Golda (Macrobrachium rosenbergii), Rui (Labeo rohita), Catla (Catla catla), Shoal (Channa striatus), Taki (Channa punctatus), Shing (Heteropneustes fossilis), Magur (Clarius batrachus), Koi (Anabas testudineus), Puti (Puntius spp.), etc. In the Western and Southern part (due to non-availability of freshwater), salinity is very high, and species like Datina, which live there are dependent on high salinity. The fishes that use the Sundarbans as a nursery ground and return to the sea or freshwater are Khorsula (Mugil corsula), Golsha Tengra, Goina, Rui, Catla, Shoal, Taki, Pungas Tengra, Shing, Magur, Koi, Puti, Datina (Pomadasys spp.), Bagda (Penaeus monodon), etc. A number of fish species spend most of their life stages outside the Sundarbans, but come to breed there: e.g. Golsha Tengra, Poma, Phesa (Setipinna spp.), Pangus, Golda, Toposhi (Polynemus paradiseus), Pairsha, Chamua Chingri, etc. Reduced salinity induces ichthyoplankton concentration. Marine fish like Gogot (Tachysurus jella), Apula (Osteogeneisus militaris), Lakhya (Polynemus indicus) and Tailla (P. Tetradactylus) come to this area for spawning. Fish that use the Sundarbans as both a nursery and a spawning ground are Golsha, Tengra and some other species. Many marine fishes come to the Sundarbans only for feeding as this area is rich in food organisms: e.g. Chaka Chingri, Chali Chingri, Motka Chingri, Tiger Chingri, Gura Chingri (Leander stylifera), Begi, Ilish (Tenualosa ilisha), Rup Chanda, Gang Thurina, Boiragi, Potka, Shapla Pata, Kamot, Tulardati (Silago domina), Pokki, Pankha, Baim, Churi (Lepturacunthas savale), Lottya (Harpadon neherius), Kaldi, Korina, etc. Juveniles of many marine species of prawns and fishes such as Chaka Chingri (Penaeus indicus), Gura Chingri (Leander stylifera), various sciaenids and ribbon fish (churi mach) migrate into the lower zone of the estuary during the winter and summer months to feed and then return to the sea with the onset of the monsoon.
152
Ansarul Karim
Some fish e.g. Koral (Lates calcarifer), Jaba, Kawn, Chitra, Chapli Chela, Tarial, Borial, Crab, Renua (mudskeeper - Boleophthalmus spp) and others, spend most of their life stages in the Sundarbans. Thus it appears that the Sundarbans plays a vital role in the life cycle of freshwater, brackish water and marine fish forms for their different life stages. Many threatened and endangered species live in the Sundarbans as well: e.g. among them Khorsula (critically endangered) and Pangus (endangered). Table 7.11 summarizes the fish species that pass their different life stages in the Sundarbans. Table 7.11. Fish species list of the Sundarbans according to their life stages
Spawning
Nursery
Feeding and Other
Resident
Golsha Tengra Poma Phesa Pangus Golda Toposhi Pairsha Chamua Chingri Gogot.
Khorsula Golsha Tengra Goina Rui Catla Shoal Taki Pangas Tengra Shing
Chaka Chingri Chali Chingri Motka Chingri Tigar Chingri Gura Chingri Begi Ilish Rup Chanda Gang Thurina
Koral Jaba Kawn Citra Chapli Chela Tarial Borial Crab Renua (Mudskeeper)
Apula Lakhya Tailla
Magur Koi Puti Datina Bagda
Boiragi Potka Shapla Pata Kamot Tulardati Pokki Pankha Baim Churi Lottya Kaldi Korina
Source: EGIS, 2001.
7.8
Fauna of Conservation Significance
7.8.1
MAMMALS
The Sundarbans terrestrial fauna are unique, particularly the Royal Bengal Tiger (Panthera tigris tigris). These species have been considered globally endangered and are included in the Red Databook and CITES schedule-I. Together with the Indian part, the Sundarbans
Implications on Ecosystems
153
provide the last refuge for a viable population of the Royal Bengal Tiger. Reduction in flow regime will be a chronic stress, which involves inflicting a change that operates over a longer period, as a continual pressure on the system. Available information reveals that excepting the Royal Bengal Tiger (Panthera tigris tigris) most of the endangered-recorded faunas are restricted to the freshwater dominant areas. Some large mammals, which were exterminated from the Sundarbans, were also recorded from the Eastern part of the forest. Water buffalo (Bubalis bubalis), single horned rhinos (Rhinoceros unicornis) and swamp deer (Cervus deruchea) are primarily freshwater swamp species. Historical records suggest that the last sighting of these animals were in the North and Eastern part of the forests. The reduction of freshwater flow and associated change in geomorphology and the increasing human pressure probably induced the habitat change ultimately exterminating the species from the area. 7.8.2
BIRDS
More than 350 species of birds have been reported from the Sundarbans, more than most other similar regions of the world. The forest supports 80 species of kingfisher and other passerine birds of which Brown Winged Kingfisher (Palargopsis amauroptera) and the Ruddy Kingfisher (Halocyon coromandra) are found only in the Sundarbans (Khan, 1982). 7.8.3
REPTILES AND AMPHIBIANS
At least 35 species of reptiles and 8 species of amphibians are known to occur in the Sundarbans. The Sundarbans now supports the only population of estuarine crocodile in Bangladesh. A breeding population of the endangered river terrapin Batagur baska was found in the freshwater areas of the Sundarbans, not reported in recent times. Other important reptiles such as the rock python and monitor lizard (Varanus salvator) can only be found in the freshwater areas in the Eastern part of the Sundarbans. The green frog, which is endangered in Bangladesh, was recorded in the Northeastern part of the forest.
7.9
Ecosystem Integrity
Ecosystems are highly integrated systems, with recurrent patterns that only become apparent from the consideration of the whole ecosystem. The most undisturbed natural ecosystems are in equilibrium, a product of internal regulation. The idea is that the interactions between species and its natural environment have evolved, and during its development, the biotic community becomes highly integrated. Integrity also implies an unimpaired condition, or the state of being ‘complete’ or ‘undivided’. Biological integrity is defined as “the ability to support and maintain a balanced, integrated, adaptive biological system having the full range of elements (genes, species, and assemblages) and processes (mutation, demography, biotic interactions, nutrient and energy dynamics, and metapopulation processes expected in the natural habitat of a region)” (Karr, 1996).
154
Ansarul Karim
In practical terms under a setting of environmental interactions, the biotic communities show some degree of regularity in a number of parameters, maintaining relatively constant structures and functions over the long-term. All biotic communities are constructed around a trophic ‘skeleton’ of the ecosystem. Some features of the community may be constrained to be structured in a particular way. Mangroves are open ecosystems and are one of the most fragile ecosystems on earth. Under natural conditions the ecosystem remains in a dynamic equilibrium - a product of interaction of ecological factors. The Sundarbans form an ecological continuum along the gradient of low to high salinity. All species are adapted to the changing gradient and seasonal variation of the salinity. For example, the Sundri dominant forest type is limited to the freshwater dominant Northeastern part. It loses its dominance with increasing salinity. Many of the associated flora and fauna also disappear. It appears that under the FWOP condition the entire Sundri forest type will be subjected to increased salinity inducing a change in floral dominance. Based on the principle of co-evolution it can be predicted that with the change in forest type the faunal assemblage will also change. The delta history of the Ganges basin is a long history of co-evolutionary processes and the interaction between natural and cultural forces of human land use. There has been continued exploitation of the upstream water, which was incorporated into the ecosystem development with natural perturbations of climate at different spatio-temporal scales. They resulted in the establishment of a human maintained dynamic long- and short-term flow equilibrium which the landscape ecologist call “homeorhesis” (from the Greek, meaning the “preserving the flow”) between the natural and cultural artifacts of human exploitation. In homeorhesis, the system is not returned to a stationary state like in homeostatic climax systems, but will move along the same trajectory of change, as long as the changes are not abrupt. As discussed under the earlier scenario, there will be impoverishment of structural and biological diversity. The loss of many rare and endemic plant and animal species is closely tied to the loss of overall gradient of salinity from low to the marine salinity during the dry season, and freshwater to brackish water during the rainy season. Many communities undergo cyclical changes with different parts of the system in different phases of the cycle. The occurrence of a number of patches in the tropical forests represents the dynamic changes in the ecosystem. The individual patches within the ecosystem can have a different collection of species. Overall, the mosaic formed by these patches represents the equilibrium of the whole ecosystem. Obviously, the capacity to maintain metastable condition of the ecosystem depends upon the maintenance of the diversity of patches. Under the FWOP scenario due to the loss of patch diversity, the habitat diversity will also be simplified. A frequently asked question is “What amount of freshwater flow is required to maintain the ecological integrity of the Sundarbans?” Experimental studies on the effect of salinity on different mangrove species indicate that Sundri seedlings show optimal growth at a salinity range of 10 ppt surface salinity. Growth is retarded with the increase in salinity
Implications on Ecosystems
155
and will die at a salinity concentration of 20 ppt (Karim, 1993). Available literature indicates that both species richness and standing tree volume is also highest where the water salinity during the dry period is 28 thousand hectare) (EGIS, 2001).
Figure 7.6. Dissolved oxygen (DO in mg/l) in the river Bhairab at Khulna, minimum monthly values in the KNM analysis series (according to national water quality criteria: DO should be higher than 6.0 mg/l in potable water sources and higher than 5.0 mg/l in other watercourses).
References Abernethy, Y. and Turner, R.E.: 1987, U.S. Forested Wetlands: 1940-1980, Bioscience 37(10), 21-727. Bangladesh Water Development Board (BWDB): 1977, Special Studies, BWDB, Dacca. Bunt, J.S., Williams, W.T. and Clay, H.J.: 1982, River water salinity and the distribution of mangrove species along several rivers in North Queensland, Australian Journal of Botany 9, 111-120. Chaffey, D.R., Millar, F.R. and Sandoun, J.H.: 1985, A Forest Inventory of the Sundarbans, Bangladesh, Land Resource Development Center, U.K. Chantarasri, S.: 1994, Integrated Resource Development of the Sundarbans Reserved Forest, Fisheries Resources Management for the Sundarbans Reserved Forest, UNDP/FAO, Khulna, Bangladesh. Ciesla, W. and Donaubaur, E.: 1994, Decline and Dieback of Trees and Forests: A Global Overview, Food and Agriculture Organization of the United Nations (FAO) Forestry Paper # 120, FAO, Rome. Curtis, S.J.: 1933, Working Plan for the Sundarbans Division for the period from April 1st 1931March 31st 1951, Bengal Government Press, Calcutta.
Implications on Ecosystems
161
Environment and Geographic Information Services (EGIS): 2001, Environmental and Social Impact Assessment of Gorai River Restoration Project-Volume II: Annexes, EGIS, Dhaka. Food and Agriculture Organization of the United Nations (FAO): 1995, Integrated Resource Management Plan of the Sundarbans Reserved Forest, FAO/UNDP, Dhaka. Forestry and Engineering International Ltd. (FORESTAL): 1960, Forest Inventory 1958-1959 Sundarbans, FORESTAL, Vancouver, Canada. Forest Resource Management Project (FRMP): 1995, Report on Forest Resource Management Project (FRMP), Department of Forest, Government of Bangladesh, Dhaka. Forest Resource Management Project (FRMP): 1998, Report on Forest Resource Management Project (FRMP), Department of Forest, Government of Bangladesh, Dhaka. Forest Resource Management Project (FRMP): 2000, Report on Forest Resource Management Project (FRMP), Department of Forest, Government of Bangladesh, Dhaka. Gordon, M.S. and Tucker, V.A.: 1965, Osmotic regulation in the tadpoles of the crab eating frog Rana cancrivora, J. Experimental Biology 42, 437-445. IUCN: 1994, Mangroves of the Sundarbans Volume II: Bangladesh (Z. Hussain and G. Acharya Eds.), IUCN, Bangkok. Karim, A.: 1993, Plant diversity and their conservation in freshwater wetland, In: A. Nishat, Z. Hossain, M.K. Roy and A. Karim (Eds.), Wetlands in Bangladesh, IUCN, Gland, Switzerland. Karim, A.: 1994, The physical environment. In: Mangroves of the Sundarbans Volume II: Bangladesh (Z. Hussain and G. Acharya Eds.), IUCN, Bangkok. Karim, A.: 1995, Ecological Implications of the Changing Natural Flow of Water on the Ganges River Ecosystem. In: H.J. Moudud (Ed.) Women for Water Sharing, Academic Publishers, Dhaka. Karim, A.: 1988, Environment factors and the distribution of mangroves in the Sundarbans with special reference to Sundric C. Heritiera fomes, unpublished PhD Thesis, University of Calcutta, Kolkata, India. Karr, J. R.: 1996, Ecological integrity and ecological health are not the same, In: P. Schulze (Ed.) Engineering Within Ecological Constraints, National Academy Press, Washington, D.C. Khan, M. A. R.: 1986, Wildlife in Bangladesh mangrove ecosystem. Journal of the Bombay Natural History Society 83, 32-48. Khan, M. A. R.: 1982, Wildlife of Bangladesh, a checklist. University of Dhaka, Dhaka. Milward, N.E.: 1982, Mangrove-dependent bioto, In: B.F. Clough (Ed.), Mangrove Ecosystems in Australia, Australian National University Press, Canberra, 56-62. Overseas Development Administration (ODA): 1984, Forest Inventory of the Sundarbans, ODA, London, UK. Saenger, P., Specht, M., Specht, R.L. and Chapman, V.J.: 1977, Mangal and coastal salt-marsh communities in Australia. In (V.J. Chapman Ed.), Ecosystems of the World, Vol. I: Wet Ecosystems, 293-345. Sarker, S. U. and Sarker, N. J.: 1986, Status and distribution of birds of the Sundarbans, Bangladesh, The Journal of Naomi 3: 19-33. Sarker, S.U.: 1993, Ecology of Wildlife UNDP/FAO/BGD/85/011, Field Document # 50, Institute of Forestry and Environmental Sciences, Chittagong, Bangladesh. Scott, D.A.: 1991, Asia and the Middle East Wetlands. In: M. Finlayson and M. Moser (eds.), Wetlands, Oxford, UK. Seidensticker J. and M. A. Hai: 1983, The Sundarbans Wildlife Management Plan: Conservation in the Bangladesh Coastal Zone, International Union for the Conservation of Nature and Natural Resources (IUCN), Gland, Switzerland. Surface Water Modeling Center (SWMC): 2000, Options for the Ganges Dependent Area, SWMC, Dhaka (www.iwmbd.org/html/proj-5269.htm). Thom, B.G.: 1982, Mangrove ecology: A geomorphological perspective. In: B.F. Clough (Ed.), Mangrove Ecosystems in Australia, Australian National University Press, Canberra, 3-17.
8 WATERING THE BANGLADESHI SUNDARBANS Alan Potkin Digital Conservation Facility 910 Fairmont St. De Kalb, Illinois 60115 USA
8.1
Introduction
The “Sundarbans,” is the great aquatic forest still covering much of the Southwestern Ganges Delta, now evidently in a state of ecological degradation caused or worsened by freshwater diversions throughout the Ganges catchments. This water goes to irrigation systems essential to the expansion of agriculture in India and Bangladesh, and to projects that work to reverse the siltation and decline of the Kolkata Port and the salinization of its freshwater supply. The collapse of the Sundarbans would entail the loss both of a major natural treasure and a sustainable stream of forest and fishery products now vital to regional and local economies. Delivery of sufficient freshwater to restore and preserve the Sundarbans could probably be accomplished as a secondary benefit of large engineering works - inter-basin transfer from the Brahmaputra system or upbasin storage in Nepal proposed to augment the dry season discharge of the Ganges River. Formidable technical and social problems will arise in the design and implementation of any such schemes.
8.2
The Forested Mouths of the Ganges
The Sundarbans is the world’s largest estuarine swamp, occupying an area of about 600,000 hectares (ha) in the Southwestern Ganges Delta. The less degraded major portion lies in Bangladesh, the remainder in India. The Bangladeshi Sundarbans - a “Reserve Forest” as well as a “World Heritage Site”1 of the United Nations Educational, Scientific and Cultural Organization (UNESCO). About one-fourth of the area of the Bangladeshi Sundarbans is 1
The Bangladeshi Sundarbans was declared as a “World Heritage Site” in the 21st Meeting of the World Heritage Committee of the UNESCO, held during December 1st - 6th, 1997 at Naples, Italy. The Committee inscribed the site under criteria (ii) and (iv), as one of the world’s largest remaining areas of mangroves, which supports an exceptional biodiversity with a wide range of flora and fauna, including the Bengal Tiger, and provides a significant example of ongoing ecological processes (monsoon rains, flooding, delta formation, tidal influence and plant colonization).
163 M. Monirul Qader Mirza (ed.), The Ganges Water Dispersion: Environmental Effects and Implications, 163–176. © 2004 Kluwer Academic Publishers. Printed in the Netherlands.
164
Alan Potkin
occupied by rivers, canals, and creeks ranging in width from several meters to several kilometers. This vast network of waterways enables almost every corner of the forest to be accessible by boat (Rahman, 2000). The Sundarbans contribute significantly to the economy of Southwestern Bangladesh and to the national economy (Table 8.1). It provides half of the country’s forest products, plus some of its most lucrative inshore fisheries, while still serving as a critical wildlife sanctuary (Blower, 1985) comprising of one-sixth of Asia’s remaining wild tigers. Managing and harvesting the Bangladeshi Sundarbans employs over 300,000 workers during at least part of each year. Royalties from Sundarbans timber, pulp, and fuel wood provide 80% of Bangladesh Forestry Department’s revenues. Table 8.1. Production/Financial Value of Sundarbans
Product or Ecological Value
Sawlogs Fuel Wood Pulp/Hardboard Transmission Poles Nypa Fronds Phoenix Fronds Honey Wax Fish Fish Breeding Protection Coastal Protection Wildlife Reserves
Annual Production (units) 20,000 50,000 130,000 21,000 80,000 6,573 208 52 6,000
m3 m3 m3 nos tons tons tons tons tons
Financial Value (direct/indirect) Million taka/year 300 44 70 27 78 2 8 2 195 3553 320 40
Source: Sir William Halcrow and Partners Ltd., 1993. Values in column 3 are of 1993. Exchange of 1 US$ ≈ Taka 32.00.
8.2.1
FLORA
While a fringe of true Rhizophora mangrove extends along its seaward most reaches, to describe the Sundarbans as a “mangrove” may not be quite correct: the terms “brackish riparian” or “brackish littoral forest” have been proposed as preferable. “Mangrove” usually implies a more marine hydrological regime, less dependent upon freshwater influx, hence an inopportune term possibly, in a fractious international context. The flora of the Sundarbans is dominated by Heritiera fomes, Excoecaria agallocha, Ceriops decandra and Sonneratia apetala. Prain (1903) identified a total of 245 genera and 334 plant species. Since then, there have been considerable changes in the status of
Watering the Bangladeshi Sundarbans
165
various mangrove species and taxonomic revision of the mangrove flora that have occurred (Khatun and Alam, 1987). A definitive inventory (Chaffey et al., 1985) conducted jointly by the Bangladesh Forest Department and the U.K.’s Overseas Development Administration (ODA) determined that: 1. standing volume of timber is marked lower than previously estimated; 2. compared to surveys from the 1950’s, the canopy is much less contiguous; 3. increasingly, on sites where it was formerly dominant, Heritiera fomes “Sundari,” the most desirable lumber and fuel wood species, is being replaced by Excoercaria agallocha ‘Gewa,” a newsprint tree much more tolerant of higher soil and water salinities. Whilst most of the mangroves in other parts of the world are characterized by members of the Rhizophoraceae, Avicenneaceae, or Laganculariaceae, the mangroves of Bangladesh are dominated by the Sterculiaceae and Euphobiaceae (Hussain and Acharya, 1994). In the Eastern part of the Sundarbans where freshwater is relatively plentiful, Sundari (Heritiera fomes) dominates; interspersed with Gewa (Excoercaria agallocha) and Passur (Xylocarpus mekongensis) while Kankra (Bruguiera gymnorrhiza) occurs in areas subject to more frequent flooding. Gewa is the dominant woody species in the Southern part of the Sundarbans. In this part of the forest, seasonal variation in salinity levels is greatest and is characterized by longer duration of moderate salinity (Rahman, 2000). The Western part supports sparse Gewa and dense stands of Goran and discontinuous patches of Hantal palm (Phoenix paludosa) on drier ground and along riverbanks and levees. 8.2.2
FAUNA
The Sundarbans provide a unique ecosystem and extensive habitats for wildlife. A human interface in the Sundarbans in terms of resource extraction and forest management has important effects on wildlife habitats and populations (Rahman, 2000). The river terrapin (Betagur baska), Indian flap-shelled turtle (Lissemys punctata), peacock soft-shelled turtle (Trionyx hurum), yellow monitor (Varanus flavescens), water monitor (Varanus salvator), Indian python (Python molurus) and the Bengal Tiger (Pathera tigris) are some of the resident species. A number of these are protected by legislation; e.g., the Bangladesh Wildlife (Preservation) Order, 1973 (P.O. 23 of 1973). Other species, however, e.g., hog deer (Axis procinus), wild water buffalo (Bubabis bubalis), swamp deer (Cervus duvauceli), Javan rhinoceros (Rhiniceros sondaicus), single horned rhinoceros (Rhinoceros unicornis) and the mugger crocodile (Crocodylus palustris) appear to have become extinct in the Sundarbans around the beginning of the last century (Sarker, 1993). Recent studies have shown that the Bangladesh Sundarbans support diverse biological resources including at least 120 species of commercially important fishes, 270 species of birds, 42 species of mammals, 35 reptiles, and 8 amphibian species. This represents a significant proportion of the species still extinct in Bangladesh (i.e. about 30% of the reptiles, 37% of the birds, and 34% of the mammals) and it includes a considerable number of others that are extinct elsewhere in the country (Scott, 1991). Estimated populations of exemplary wildlife species in the Sundarbans are shown in Table 8.2.
166
Alan Potkin
Table 8.2. Estimated populations of some wildlife of Sundarbans
Animals
Number
Tiger Spotted Deer Wild Boar Rhesus Macaque Otter Crocodile White Bellied-Sea Eagle Water Monitor
450 80,000 20,000 68,000 20,000 100 130 breeding pairs 40, 000
Source: Hussain and Acharya, 1994.
8.2.3
RECENT HYDROLOGICAL CHANGES AND SUNDARBANS
The Sundarbans is complexly dissected and watered by the older distributaries of the Ganges, interconnected through a great web of meandering tidal rivers and creeks (Figure 8.1). The stage and salinity throughout that river net is critical to the physiological ecology of the brackish riparian components of the Sundarbans community. The ODA (1985) study of floristic changes in the Sundarbans with regard to saline stress and cited the phenomenon of “top dying” in Sundari (H. fomes). The study noted that notwithstanding the lack of long-term and baseline data, the observed floristic change suggests a recent alteration of the regional hydrological regime. Given the dynamic processes of river deltas everywhere, major changes in distributary hydrology are commonplace and inevitable: channels are ordinarily abandoned as their beds rise up with silt and their supply of freshwater is throttled by sandbars splaying into off-takes. Conversely, they could be revigorated if their inflows were augmented by upbasin events. These might be natural fluvial processes like course realignments and stream piracies, or controlled releases from artificial impoundments and inter-basin transfers. The classical, arcuate Ganges Delta was laid down from West to East as the river broke into new distributaries, abandoning them sequentially as their off-takes clogged and their beds aggraded above the back swamps (Bagchi, 1944). The Westernmost former mainstem is the channel of the Bhagirathi-Hooghly, reaching past Kolkata, the shortest route to the sea. To orthodox Hindus, the Bhagirathi-Hooghly is the “true mouth” of the sacred Ganges, diverted from heaven by the sweat and sacrifice of its namesake, the mythical King Bhagirat, for the benefit and sanctification of mankind. Married finally to the sea and made pregnant by it, Mata Ganga, “Mother Ganges” birthed holy Sagar Island, where now every January, a Puja festival commemorates those wondrous events. A million pilgrims come then to wade and bathe at Ganga Sagar.
Watering the Bangladeshi Sundarbans
167
Figure 8.1. The Sundarbans and the Southwest Region of Bangladesh.
To hydrologists, there is no “true mouth” but certainly since the Sixteenth Century A.D. (Coleman, 1968), the largest part of the Ganges’ flow - having mostly abandoned the old Hooghly outlet - has been delivered to the Bay of Bengal below confluences with the great Brahmaputra/Jamuna, from Assam and Tibet, and finally through the estuaries of the Meghna, also a major river, draining the monsoon drenched Meghalaya Hills.
168 8.3
Alan Potkin The Ganges-Brahmaputra Link Canal
The first Farakka allocation treaty implemented in 1977 (Chapter 1 and Annex I) allowed India to divert the Ganges waters to the full capacity of the canal to the Hooghly, but only from June through to December. During these months, the discharge of the Ganges at Farakka ranges between 5,700 m3/sec (200,000 ft3/sec) and 71,600 m3/sec (2,500,000 ft3/sec). However, during the dry season (January-May) a more complicated allocation formula came into effect, guaranteeing Bangladesh no less than two-thirds of the available flow, and in any case, assured the release through the Farakka Barrage of at least 1,000 m3/sec (35,000 ft3/sec) downriver to Bangladesh during the leanest ten days of late April, when the ordinary low flow is as little as 1,600 m3/sec (55,000 ft3/sec) (based on 75% availability). In consequence, India might then get only 567 m3/sec (20,000 ft3/sec), far below the flow augmentation required to scour the channel at the very time when the effects of salinization of the lower Hooghly are worst felt and in the accretion of marine sediments borne upriver where the tides are the greatest. In December 1996, Bangladesh and India signed a 30-year Treaty to share the Ganges water at Farakka. The sharing formula agreed in the Treaty is significantly different from that of the 1977. The ‘guarantee clause’ of the 1977 Agreement was dropped (see Article II of the 1977 Agreement in Annex I). Instead of 75% availability of flow, the sharing formula was designed on the basis of 50% availability. In the critical months of March, April and May, with a flow between 1,984 m3/sec and 2,126 m3/sec (70,000 ft3/sec and 75,000 ft3/sec), Bangladesh receives 992 m3/sec (35,000 ft3/sec) and India receives the remaining amount subject to the condition that India and Bangladesh each receive their guaranteed 992 m3/sec of water in alternative three 10-day periods. It must be understood that long before the Ganges reaches Farakka, an appreciable part of its waters have already been diverted for consumptive use inside India by the irrigation commands of the Upper and Lower Ganga canals, and of the pumped canals at Dalman, Bhapali, and Zamania, as well as by countless smaller-scale local extractions (Also discussed in Chapter 1). Both India and Bangladesh agree that in the lean season, the Ganges is already over-allocated and that major augmentation schemes must now be seriously considered. In March 1978, two documents setting out each governments’ intentions with regard to augmentation of the Ganges flow were exchanged by India and Bangladesh. The two proposals presented the cases for and against the two governments’ schemes largely in terms of technical rationality (Crow et al., 1995). The Indian scheme for augmenting the dry season flow of the Ganges consisted of a barrage across the river Brahmaputra and a canal (Table 8.3) to take water from that river to the Ganges at Farakka (Figure 8.2). At a later stage, the Indian government intended to construct three storage reservoirs in the Eastern foothills of the Himalayas to supplement the dry season flow of the Brahmaputra. Each of these five structures - the barrage, the canal and the three dams would be large, and would cost altogether more than US$ 16 billion (Crow et al., 1995).
Watering the Bangladeshi Sundarbans
169
Table 8.3. Salient features of the Ganges-Brahmaputra link canal
Parameters
Unit
Dimension Volume Total Area Lost Lost Area in Bangladesh Discharge Velocity Distance Travels Earth Work (volume equivalent) Rivers Intercepted
334 km x 0.8 km x 9 m 2,47,72,890 m3 3,010 ha 1,003 ha 2,835 m3/sec 0.85 m/sec 480 kms 7 Suez Canals 14
In addition to its huge financial cost, the political, social and environmental costs of the project would be formidable as well. The Indian proposal will bifurcate Northern Bangladesh into hydrologically distinct halves. The project, if implemented, will provide India with the considerable control over the Brahmaputra water. Some 90,000 people might be involuntarily dislocated in Bangladesh (based on the 2001 population) with a further 100,000 oustees inside India. The resettlement cost for Bangladesh could be as high as US$ 40 million2. Resettlement on such a large scale would be problematic in an already densely populated country like Bangladesh.
8.4
Water Development in Nepal
Nepal’s world renowned mountain landscape and booming tourist industry contrasts to Bangladesh, where the landscapes are only locally celebrated and ordinary tourists are kept away by inaccurate but well entrenched reputation for catastrophe and despair. Nonetheless, the two countries aggregate indices of basic well-being, i.e., mean life expectancy, literacy, income, etc., would probably be very nearly equal (World Bank, 1982). Population of Nepal and Bangladesh and Nepal are rising at 2.55% and 1.80%, respectively (doubling between 28 years-40 years (estimated 2001 populations: 130 million Bangladeshis and 24 million Nepalese)). With Nepal’s high quality farmland scarce, most of her forests already cut, and the surviving tracts likely soon to follow, the dominant view among planners there is that “water remains the only natural resource of major consequence in the Kingdom.” Indeed, Nepal holds some 83,000 MW or 15% of the world’s underdeveloped hydroelectric potential (Cruz et al., 1984). However, of this potential, 44,000 MW have been deemed “presently” feasible for exploitation, a figure which can only rise as fossil reserves 2 Estimates based on the resettlement costs of the Jamuna Multi-purpose Bridge (www.citechco.net/jmba).
170
Alan Potkin
elsewhere decline. Nepal’s installed electric generating capacity in 1999 was 316 MW, of which about 83% is hydroelectric and the remainder thermal. Only a small share (around 1%) of Nepal’s potential hydroelectric power capacity currently is being exploited (EIA, 2002).
Figure 8.2. The augmentation proposals of Bangladesh and India. Source: Crow et al., 1995.
The rosy hydel potential may be illusory, given the great difference between the monsoon and lean season discharges of the Himalayan Rivers (two or more orders of magnitude, in catchments with significant snowmelt). Thus, hydropower yield may be extremely limited during the four lowest flow months, unless large-scale storage is deployed behind high dams. The virtue of “run-of-the-river” hydel projects - which do not involve appreciable storage - is that the suspended and bed loads borne from upbasin usually pass through the system unimpeded. Their disadvantage is that they can become almost useless during the leanest season - there’s nothing to run through the penstocks - and their low level weirs provide no downstream flow augmentation. One large problem with such projects is that sediment burdens of the Himalayan Rivers are extraordinarily high; while major mountain reservoirs in Europe and North America typically have projected life spans of several hundred years at the least, similarly designed facilities in Himalayan catchments might silt up in a matter of decades. Reservoirs are
Watering the Bangladeshi Sundarbans
171
ordinarily deemed “dead” when the original impoundment becomes three-fourths filled with sediment and debris. Experience has shown that Indian and Chinese reservoirs are typically filling in with solids at two to five times the originally projected rates of sediment delivery (DOE, 1985). Their usability can be extended only if river through flows are much increased by perforating the dams, with effective storage commensurately much reduced, with ensuring large reductions in the yield of irrigation and hydroelectric outputs. The alternative is to operate the dams at full design capacity for a relatively short time, after which they devolve into expensive artificial waterfalls, possibly still generating some modest quantity of run-of-river hydropower. Also very worrisome is the extreme seismicity of the entire Southern Himalayas: an earthquake of at least Richter 5.0 can be expected to strike the region approximately every two years (Sharma, 1977). The orogeny of the Himalayas is still underway, the local stratigraphy is much shattered, very complexly folded and traversed by numerous active faults capable of producing extremely high-energy seismic events (Matsura, 1983): the last very large shock - which left almost 4,000 dead throughout the Himalayan piedmont - was in 1934, measuring 8.2 on the Richter scale. The great 1897 ‘quake was estimated to have been Richter 8.6 and agriculture was at least temporarily “devastated” over some 200,000 sq. km, from Bihar to Shillong. The 1787 quake, also a monster, in one stroke completely re-routed the river Tista, draining a major sub-basin of the Brahmaputra. The addition of the Tista’s discharge and sediment burden altered the course and morphology of the Brahmaputra and was probably instrumental to its abandonment of the “Old Brahmaputra” channel past Mymensingh town. With the mainstem Brahmaputra flowing thereafter through the Jamuna, a confluence with the Ganges itself thus first became established: subsequent backwater effects possibly revigorated certain Ganges distributaries then already quite moribund but later to become highly important. E.g., the Rennell surveys of 1765-1774 described the Gorai/Madhumati as “a mere creek, unable to float a vessel drawing even a foot or two”. Furthermore, it has also become understood how the hydrostatic pressure of a major new reservoir may itself induce or precipitate a seismic event in areas theretofore showing no recent seismicity: in 1967, the Koynagar earthquake - the first ever recorded for that locale - destroyed 80% of the houses in Koynagar, India, leaving 200 dead. Its epicenter was found to be exactly the site of 1962 Koyna Dam, which fortunately, did not collapse (CSE, 1982). Another geological hazard characterizing Nepal is a Glacial Lake Outburst Flood (pronounced ‘glof’, (Galay, 1985). A GLOF occurs when a natural moraine or ice dam fails partially or catastrophically, thereby releasing the lake formed by the blocked drainage of retreating high-altitude glacier. Most Himalayan glaciers have been in retreat at least since 1840’s; some researchers think that microclimatic effects of widespread deforestation in the
172
Alan Potkin
Himalayan piedmont accelerated glacial melting - already well underway from the global warming trend of recent centuries. In 1985, a GLOF originating above the Dudh Kosi carried away completely the new 200 KW small hydro project near Namche Bazaar, leaving not a trace of the powerhouse and weir. The enormous, though very short lived, increase in the Dudh Kosi’s discharge resulted in extensive undercutting of its banks for many kilometers downstream, which in turn induced sufficient mass wasting to change the entire character of the middle Dudh Kosi from a meandering stream with vegetated shores to a braided channel fronted by almost continuous slumps and rockslides. Thus, even where a GLOF spared the dam, it could so increase the rate of sediment delivery to a large impoundment as to render the project uneconomic, ex post facto. The prediction or prevention of GLOFs remains at a very rudimentary state.
8.5
Social Impacts of Reservoirs
Big new reservoirs in South Asia would almost inevitably inundate well populated valleys. The more remote the project site, the more likely it is that the inhabitants will be marginalized minorities under-represented in the planning process and wielding little clout with the center. Bangladesh’s one very large hydroelectric project has proven terribly disruptive; in 1964, over 80,000 “tribals”, mostly Chakma Buddhist plow farmers, were evicted from the Kaptai impoundment site, in then East Pakistan. Kaptai Lake - in surface area, still the subcontinent’s largest reservoir - inundated virtually all the prime agricultural lowlands of the Karnafuli Valley with the Chittagong Hilltracts, while yielding only 120 MW of hydropower (subsequently expanded to 230 MW - comprising of 2 x 40 MW units and 3 x 50 MW units; with the Bangladesh Power Development Board (BPDB) now considering adding another 100 MW of installed capacity to the Karnafuli facility (Shakti, 2002). Rehabilitation efforts were considered inequitable and generally unsuccessful, with many oustees resorting to nominally illegal slash-and-burn jhum agriculture on impossibly steep slopes inside gazetted reserve forests. In consequence, the Hilltract region was beset by seemingly intractable problems ranging from premature siltation of the Kaptai impoundment - the likely result of jhum deforestation - to a continuing armed resistance by the Shanti Bahini, the tribal “peace army.” Massacres by “Chakma miscreants” of hapless Bengalis, followed by bloody reprisals against the aborigines, occurred repeatedly in the decades following the taking up of the Kaptai Project. But on December 2, 1997 the insurgent Parbattaya Chattagram Jana Samhati Samiti (JSS) and the Government of Bangladesh signed the CHTs Peace Accord and the armed insurgency that continued for 21 years was apparently resolved. Six years later, however, certain key elements of the treaty have not been implemented, threatening a resumption of the violence. In India, more recent evacuation and recompense programs have also turned out
Watering the Bangladeshi Sundarbans
173
unsuccessful: e.g., in Himachal Pradesh, the 131 m high Pong Dam across the River Beas (a tributary of the Sutlej and thence the Indus) inundated the homeland of about 30,000 families - again, mostly tribals who were supposed to be relocated into the project’s command area, 700 km to the Southwest in Rajasthan, a desert state radically different in customs, language, and environment. In theory, the oustees were to be compensated rather liberally, with an allotment of 6.3 ha per family of newly irrigated flatlands, about six times the average previous holding. In fact, only 6,800 families actually elected to emigrate to that strange and distant landscape, of which fully 4,300 were subsequently re-evicted from their new Rajastan farmsteads for “infringements of the allotment rules.” Were it feasible to put the Kosi under human management, the hydropower yield would be enormous - as much as 4,000 MW from a single high dam proposed at Barakchetra, Nepal. The reclamation of agricultural lands could also be extensive. Annual flooding would be greatly reduced, the “wasted” peak monsoon flows conserved and thus, made available for irrigation and other uses. The Kosi is the major Nepali River closest to Bangladesh and Kosi releases allocated to Bangladesh would run the shortest gauntlet across parched North Indian States where the pressures to hijack the water for local use might prove irresistible. The 1981 Kosi High Dam Feasibility Report (CWC, 1981) prepared by the Government of India’s Central Water Commission - and not widely distributed outside that agency examined a conceptive concrete gravity dam, 286 m in height, to be erected across the Sapta Kosi just above its debouchment into the Terai. The proposed Kosi High Dam was sited and designed by Indian engineers without the active cooperation of Nepal, even though the dam and reservoir would both be situated entirely inside Nepalese Territory. (A 1946 Indo-Nepali memorandum of agreement, did however, authorize “joint future investigations” of projects in that vicinity). The report concluded that the structure was buildable and that the benefits would outweigh the costs, but the issue of ensuring water deliveries to Bangladesh was not addressed. Neither was the arcane possibility of using the augmented flows to protect the Sundarbans ecosystems. The probable upstream social and environmental impacts were similarly ignored. The ethnic group bearing the brunt of the Kosi High Dam’s social costs would be to the Rai people, who number about a third of a million; the finest of their traditional lands and amongst the most fertile fields in Nepal - are the former terraces and valley bottoms of the Sun Kosi and the Arun Rivers, the Sapta Kosi’s two Western branches. The Tibeto-Burman Rais embraced the eclectic Nepali mode of Hinduism, which in turn, had integrated them into Hindu society as a formal caste. Rai culture is distinct and well preserved by deep canyon topography barely penetrated by roads and vehicles, and where most commerce is still today borne on the backs of porters. Nineteenth-century English ethnographers identified the Rais as a “suitably-martial race” for recruitment as Gurkha mercenaries; Rais still enlist in considerable numbers into
174
Alan Potkin
Gurkha regiments of the British and Indian armies, and their veterans pensions actually comprise the largest part of the local cash economy. On the trail, male Rais over the age of nine are certain to be carrying a kit of wicked-looking khukri knives, stuffed into a waistband or quickly accessible at the top of the pack load, and handy for cutting firewood, if not much used now for disemboweling enemies. Rai agriculture is distinctive in that landless laborers are atypical: Rai farmers almost always own plots they work, small as these might be. It shows in the landscape: Rai farmsteads are not haphazardly managed for the short-term; excavated terraces are fastidiously well stabilized against erosion with an intricate system of rock-armored drainage channels and dike walls. Given the regions marked seasonal aridity and the unavailability of irrigation water to the mid-slope fields, the Rai staple cereal is not rice but maize; and a kind of cornmeal mush is the mainstay Rai food. Only a portion of the best and moistest Rai lands are suitable for riziculture - especially the old river terraces and the newer deltaic fans at the mouths of the larger secondary streams (called “kholas”). The small amount of rice, which is grown by upcountry Rais is reserved for guests and celebrations, and for making rokshi, a powerful country-liquor vended by the glassful along trailsides by local children. There has not yet been prepared a detailed inundation map showing Rai farmsteads and families to be inundated by such a proposed Kosi project. The absolute number is probably not great: the valleys here are narrow, the alluvial flats are not extensive, and for many kilometers along the main river canyons, precious bottomlands are either absent or too coarse, gravelly, and transient to be much good for agriculture. Thus, the majority - if not the most bountiful - of Rai settlements are likely to be situated considerably upslope of the “maximum pool elevation” of the 200 sq. km reservoir that would form behind the Kosi high dam. In the traditional Rai cosmology (Busta, 1980), the Milky Way is considered the reflection in clear night skies of the white, rapids-studded Sapta Kosi, and worthy therefore, of worship. Whether the Rais would be so worshipping of a deep, still, artificial lake behind the Kosi Dam that buried their richest land beneath 200 m of debris, silt, and cold green water remains yet to be seen.
8.6
Towards Watering the Sundarbans
Can there be an environmental and social calculus that excludes and weighs saving the Sundarbans against inundating fertile and exquisite Kosi headwater canyons plus submerging the culture of the inhabitants - in some effort to define optimum benefits from the entire watershed? The estimated cost (1981) of constructing the Kosi High Dam is US$ 3.4 billion. If the Kosi project’s prime beneficiary were to be the Bangladesh Forest Department, it would take 680 years to pay for itself.
Watering the Bangladeshi Sundarbans
175
Obviously, extraordinary projects like these are undertaken not to maintain the quality of estuarine ecosystems far downbasin but to largely improve agriculture and flood control, to benefit river training and reclamation, and to yield a massive portion of hydroelectric energy. What does all this have to do with the future of the Sundarbans? Geological phenomena not much subject to human cure may be one of the dominant factors in the devolution of the Sundarbans system. If the dewatering and moribundity of the Southwest Ganges Delta is a function primarily of tectonics and subsidence, not of artificial alteration of the hydrological regime, efforts to manipulate that regime more favorable to the ecology of the estuary through auxiliary engineering works may be futile and misdirected. If on the other hand, deterioration of the Sundarbans is indeed the result of anthropogenic hydrological changes, slowing or reversing that process becomes a problem in planning and design. These two questions issues have been answered in the relevant chapters of this book. Our understanding of Sundarbans ecology is now severely limited. If motivated even one-dimensionally by the market value of the timber, we try to restore the freshest sites dominated previously by Sundari, we’ll first have to determine that species’ moisture requirements and its tolerance of stream and soil salinities. Other questions lead from there: what percentage of inundation is necessary and how does that relate to river stage? Is the addition of nutrients bound to sediments formerly deposited by monsoon flooding essential or could the littoral forest be maintained by clear Himalayan waters arriving via excavated canals? Then we’ll have to model a very complex estuary subject to enormous variation in marine and terrestrial in effort to determine the volume, timing and sitting of requisite freshwater deliveries. The necessary research encompasses tidal hydrodynamics to physiological botany to cultural anthropology. Bangladesh does not expect high dams in Nepal to be built at their behest and primarily toward their benefit. But their demand is completely reasonable that should great Himalayan water projects ever be implemented, from the moment of their conception, the vital interests of the lower riparians must be fully considered. For Bangladesh, those interests include bounteous yield of renewable estuarine resources and the proper preservation of Sundarbans nature as a valued part of her peoples’ culture and birthright.
176
Alan Potkin
References Bagchi, K.P.: 1944, The Ganges Delta, University of Calcutta Press, Calcutta. Blower, J.H.: 1985, Sundarbans Forest Inventory Project, Bangladesh: Wildlife Conservation in the Sundarbans, Overseas Development Administration Project Report 151, Land Resources Development Center, Surbiton, Surrey, U.K. Busta, D.B.: 1980, People of Nepal, Ratna Pastaka Bhadar, Kathmandu. Center for Science and Environment: 1982, State of India’s Environment: A Citizen’s Report, CSE, New Delhi. Central Water Commission (CWC): 1981, Feasibility Report: Kosi Dam Project, CWC, New Delhi. Chaffey, D.R., Miller, F.R. and Sandom, J.H.: 1985, A Forest Inventory of the Sundarbans, Bangladesh: Main Report, Appendices 1-15, and Maps. 5 Vols. Overseas Development Administration Project Report 140, Land Resources Development Center, Surbiton, Surrey, U.K. Crow, B., Lindquist, A. and Wilson, D.: 1995, Sharing the Ganges: The Politics and Technology of River Development, University Press Limited, Dhaka. Cruz, M.C., Briones, N.D., and Hufschmidt, M.C.: 1984, Water Resources Management in Asia, East-West Center, Honolulu. Coleman, J.M.: 1968, Brahmaputra River: channel processes and sedimentation, Sedimentary Geology 3(2), 129-239. Department of Environment, Govt. of India: 1985, Annual Report 1984-1985, Ministry of Environment and Forests, New Delhi. Energy Information Administration (EIA): 2002, Country Analysis Briefs: Nepal, Department of Energy, Washington, D.C. Galay, V.J.: 1985, Hindu Kush-Himalayan Erosion and Sedimentation in Relation to Dams, ICIMOD, Kathmandu. Hussain, Z. and Acharya, G. (eds.): 1994, Mangroves of the Sundarbans, Vol. 2: Bangladesh, IUCN, Bangkok, Thailand. Khatun, B.M.R. and Alam, M.K.: 1987, Taxonomic studies in the genus Avicennia Linn. From Bangladesh, Bangladesh Journal of Botany 16(1), 39-44. Prain, D.: 1903, The flora of Sundarbans, The Records of the Botanical Survey of India 114, 231-272. Matsura, S.: 1983, An Ecological Study of the Mass Wasting and Erosion in a Catchment Area of the Nepali Himalayas/ATCHA, Tokyo. Rahman, L.M.: 2000, The Sundarbans: A Unique Wilderness of the World. In: S.F. McCool, D.N. Cole, W.T. Borric, J.C. O’Loughlin (eds.), Wilderness Science in a Time of Change Conference-Volume 2: Wilderness within the Context of Larger Systems; May 23-27, 1999, Missoula, MT, USA, U.S. Department of Agriculture, Forest Service, Rocky Mountain Research Station. Sarker, S.U.: 1993, Ecology of Wildlife (UNDP/FAO/BGD/85/011), Field Document No. 50, Institute of Forestry and Environmental Sciences, Chittagong, Bangladesh. Scott, D.A.: 1991, Asia and the Middle East Wetlands. In: M. Finlayson and M. Moser (eds.), Wetlands, Oxford. Shakti: 2002, Karnaphuli Hydro Power Station, Kaptai. Sharma, C.K.: 1977, River Systems of Nepal, Sangheeta Sharma, Kathmandu. Sir William Halcrow and Partners Ltd.: 1993, Morphological Studies: Southwest Area Water Resources Management Project, Flood Plan Coordination Organization (FPCO), Dhaka. World Bank: 1982, World Development Report, World Bank, Washington, D.C.
9 ADVERSE EFFECTS ON AGRICULTURE IN THE GANGES BASIN IN BANGLADESH M. Monirul Qader Mirza Adaptation and Impacts Research Group (AIRG), Institute for Environmental Studies (IES), University of Toronto, 33 Willcocks Street, Toronto, ON M5S 3E8 Canada Md. Altaf Hossain Center for Environment and Geographic Support Services (CEGIS) House # 6, Road # 23/C Gulshan-1, Dhaka 1212 Bangladesh
9.1
Introduction
The Ganges basin in Bangladesh has a humid climate, but it is vulnerable to drought in the summer as well as during the monsoon months. Mean annual rainfall ranges from 1,270 mm in the Western part of Rajshahi to about 3,000 mm in the coastal region in the South, meaning that the climate of the Western Ganges basin is naturally unfavorable for agriculture. Agricultural activities are largely dependent on the water supply from the Ganges River and its distributaries. The Ganges-Kobadak (G-K) project (Figure 9.1 and Box 9.1), one of the country’s largest surface water irrigation projects based on the water supply from the Ganges River was planned in the 1950s. About one-fourth of Bangladesh’s gross domestic product (GDP) contribution comes from the Ganges basin area, and agriculture contributes about one-third to the GDP of Bangladesh. Over the years, the dominance of the agriculture has declined; in 1972-1973, this sector contributed about one-half of the country’s GDP. Nevertheless, agriculture remains very important to the economy. A one-third share is significantly higher than agriculture’s share to overall GDP in many other Asian countries (Faruquee, 2001). The role of agriculture in the national economy remains crucial not only as the supplier of food and raw materials but also in the most important source of employment (69% of the labor force). However, the commissioning of the Farakka Barrage in 1975 to divert a significant part of the dry season flow of the Ganges has put the agriculture sector in Bangladesh under a severe strain, and has an adverse chain effect on the macro-economy and sustainable development of the country. 177 M. Monirul Qader Mirza (ed.), The Ganges Water Dispersion: Environmental Effects and Implications, 177–196. © 2004 Kluwer Academic Publishers. Printed in the Netherlands.
178
M.M.Q. Mirza and M.A. Hossain
Figure 9.1. The Ganges-Kobadak Irrigation Project.
Adverse Effects on Agriculture
179
Box 9.1 The Ganges-Kobadak Project
In the first plan, t The first plan, the Ganges-Kobadak Irrigation Project was to comprise an area of 700,000 (hectares) ha)irrigated from the Ganges River. One of the main canals in the Jessore Unit would follow the Kobadak River, which contributed to the name of the project. Situated on the right bank of the Ganges and Gorai Rivers (Figure 9.1), the G-K Project comprises of 197,500 ha of cultivable land in the Southwest region of Bangladesh. Irrigable land in the project occupies 142,000 ha. The scheme includes 13 upzillas (sub-districts) in the districts of Khustia, Chaudanga, Jhenaidah and Magura with a total population of approximately 2 million. Phase I (45, 000 ha) of the project, the Khustia unit began in 1954 and was completed in 1970. Phase II comprising of an area of 97, 000 ha in Chuadanga, Jhenaidah and Magura Districts commenced in 1960 and was completed in 1983. It includes an area of 22,885 ha designated as lift irrigation, where water supplied by gravity would not be assured. The G-K Project in its first stage was intended to be supplementary irrigation only, to supplement the rainfall during the monsoon and pre-monsoon season (April-May). A part of the area is irrigated during the dry season during which water supply from the Ganges is crucial. For example, the project provided water to 50,500 ha during the dry season of 2001 in Kushtia, Chuadanga, Magura and Jhenaidah Districts. The project has two pump houses with 153 m3/sec pumping capacity and water is supplied through 1,655 km of irrigation canals. The pumps cannot operate if the water level in the intake channel goes below 4.50 m.
In the Ganges basin the sowing/planting and harvesting times of different crops vary from area to area depending on the agro-climatic condition. A general cropping pattern in terms of agro-climatic condition is shown in Figure 9.2. The traditional practice of Broadcast aus (B.aus) followed by Transplanted aman (T.aman) is the main cropping pattern in the Ganges basin. After construction of the coastal embankment project in the 1960s, the expectation was a gradual increase of the double cropping system. But the reduced flow of the Ganges in Bangladesh has practically put an end to this expectation. Cultivation of B.aus is gradually decreasing because large areas are being affected by salinity. The sharply reduced flow below Farakka during the dry season creates a serious water crisis and aggravates salinity in the Southwest region of Bangladesh. Saline intrusion has degraded soils and the ecosystem leading to decreased agricultural production and increased poverty (Ahmad and Zaman, 2001). The Sundarbans, the largest mangrove forest in the world is also severely threatened (see Chapter 7 on ecosystem). The adverse effects similar to those on the ecosystem and agriculture in downstream Bangladesh caused by diversion of water from the Ganges River have been reported from other parts of the world due to water diversions. Simon (1998) reported an economic loss of tens of millions of dollars due to low stream flow in the Columbia River in the USA. Water diversions in the Columbia basin have forced the U.S. Fish and Wildlife Service to purchase
180
M.M.Q. Mirza and M.A. Hossain
nearly $10 million dollars worth of water rights over five years for downstream flow augmentation (USFWS, 2001). Central Asia’s Aral Sea is one of the most graphic examples of excess diversion of inland waters. Since 1960, this massive lake (once the world’s fourth largest) has lost three-fourths of its volume. In 1998, about 94% of the river flow that once fed the Aral Sea is diverted to irrigate thirsty crops such as cotton. The seas’s salinity levels have tripled and 20 of its 24 fish species have disappeared (Revenga et al., 1998).
Figure 9.2. Climate and the general cropping pattern in Bangladesh.
9.2
Agro-Climate of the Ganges Basin in Bangladesh
9.2.1
RAINFALL
The distribution of average annual rainfall in Bangladesh is shown in Figure 9.3, ranging from about 1,270 mm in the North Western border to 5,000 mm in the North Eastern part of the country, that experiences more than the periodical variation of normal rainfall in the Ganges basin which is very high. About 85% of total annual rainfall occurs during the monsoon months of June-September with only 15% occurring during March-May. Rainfall is rare from October-February.
Adverse Effects on Agriculture
Figure 9.3. Rainfall isohyets (mm) in Bangladesh.
181
182
M.M.Q. Mirza and M.A. Hossain
The Ganges basin area of Bangladesh has the lowest mean annual rainfall in the country, varying from about 1,270 mm in the Western portion of the Rajshahi District to about 3,000 mm along the coastal belt in the South (Figure 9.3). There are also records of no rainfall for several months together in some areas. The country also faces floods in almost every monsoon due to heavy rainfall within the country and floodwater from outside the country. But in every dry season, the situation becomes reverse and the country suffers much from shortage of freshwater due to the reduced flow in the Ganges River and its distributaries caused by the upstream diversion of the Ganges waters at Farakka and its further upstream. The rainfall characteristics of the Ganges basin in Bangladesh are presented in Table 9.1. Since 1976, the annual rainfall in the basin was found to be variable, from 28% to 48% of the average rainfall of 1,549 mm for the period 1961-1976. During the dry season from November-April, rainfall was 177% higher or 49% lower than the 15 years average of 151.5 mm. In 1992-1993, the annual rainfall was 6% lower than the pre-diversion annual rainfall. Total rainfall was about 40% higher in the dry season (November-April) and 79% higher in March-April compared with the 15-year mean rainfall in the corresponding periods (BWDB, 1993). 9.2.2
TEMPERATURE
Adel (2002) compared pre- and post-Farakka annual and summer maximum and minimum temperatures in the Musa Khan, as well as, most of the Baral sub-basins in the Ganges basin. These two sub-basins included parts of the four districts of Nawabgonj, Naogaon, Rajshahi, and Natore. An analysis demonstrates a rise in the annual maximum temperature after 1981 and a drop in the annual minimum temperature after 1982. Adel (2002) concluded that the maximum temperature of 37oC increased to 43oC in just 4 years after 1981 during the post-diversion period. Minimum temperature of about 8oC has dropped to below 5oC in some years following 1982. The average temperature of the 10-year period 1971-1980 remained stable above 8oC. On the other hand, the average minimum temperature for the period 1981-1995 did not exceed 7oC. Fluctuations were more scattered during 1981-1995 than 1971-1980. Adel (2002) also compared summer temperatures for the two periods. The lightly shaded bars represent the pre-baseline and the dark bars represent post-baseline maximum temperatures and an increasing trend is prominent. The post-baseline median temperature is 28.5oC, and the pre-baseline median is 25.5oC. The post-baseline temperature is skewed to the right. The summertime average temperature for the post-baseline years was 30.8oC and that for the pre-baseline years was 29.8oC. It is also observed that in the post-baseline years, warming started at an earlier time in the year and lasted longer than the pre-baseline years. 9.2.3
RELATIVE HUMIDITY
Relative humidity (RH) in the Ganges basin also varies widely. Mean annual RH was found to be the highest 85% at Bhola and the lowest 76% at Jessore (Sir William Halcrow and
Adverse Effects on Agriculture
183
Table 9.1. Rainfall (in mm) characteristics in the Ganges basin in Bangladesh
Period Pre-Farakka 1961-1976 Post-Farakka 1976-1977 1977-1978 1978-1979 1979-1980 1980-1981 1981-1982 1982-1983 1983-1984 1984-1985 1985-1986 1986-1987 1987-1988 1988-1989 1989-1990 1990-1991 1991-1992 1992-1993
Jul-Jun
Nov-Apr
Jan-Apr
Mar-Apr
1,549.0
151.5
129.3
105.3
1,823.8 1,457.4 1,302.5 1,763.4 1,646.0 1,364.8 1,120.2 1,937.0 1,534.0 1,277.5 1,844.2 2,296.8 1,578.2 1,699.8 1,748.5 1,636.2 1,642.3
260.7 212.1 129.3 183.0 419.6 269.7 198.5 84.1 76.8 127.2 223.8 221.0 158.2 306.7 169.5 172.8 212.3
251.0 149.3 125.4 125.7 419.6 203.5 152.6 71.2 76.1 125.9 134.2 184.5 46.1 294.0 113.2 77.1 209.3
213.1 131.2 77.8 67.8 343.8 192.0 118.7 58.3 70.8 120.7 131.6 146.4 28.0 222.5 73.7 5.9 188.5
Source: Bangladesh Water Development Board (BWDB, 1993).
Partners, 1993). In terms of the monthly mean, July and August recorded the highest RH across the basin. Adel (2002) compared changes in RH during the pre- and post-baseline periods in the Baral and Musa Khan sub-basins. He found that the frequency of occurrence of the highest RH increased from 1,635 during the pre-baseline to 2,957 during the post-baseline period. This is because an increase in temperature increases the atmospheric demand for moisture, which is supplied by evapotranspiration, which eventually increases the RH. It was also found that during the post-baseline period, the humidity values rose in the early months and dropped in the later months. Natural and human causes are believed to be responsible for the changed agro-climatic parameters. Adel (2002) concluded that with the diversion of water for about three decades, land features in the Ganges basin in Bangladesh have changed, and consequently, the thermal properties of the surfaces and climates have also changed.
184
M.M.Q. Mirza and M.A. Hossain
9.3
Degraded Agro-Ecological Constraints and Agriculture in the Ganges Basin
9.3.1
SOIL SALINITY
Most crops are sensitive to salinity and their productivity changes with levels of salinity. Soil texture governs the use of irrigation water of varying degrees of salinity. The lighter the texture, the greater the tolerance of saline water. The salinity level of soil rather than the salinity of irrigation water directly affects plant growth. Soil salinity is generally expressed as Ec in micro-mhos/cm at 25oC. In Bangladesh soils are divided into the following five classes (Table 9.2) depending upon the limits of Ec. The salt tolerance of a specific crop varies at different stages depending on the degree of salinity. Table 9.2. Soil salinity classes in Bangladesh (at 25oC)
Soil Class
Salinity Level (m-mhos/cm)
Non-saline Very slightly saline Slightly saline Moderately saline Highly saline
0-2,000 2,000-4,000 4,000-8,000 8,000-15,000 >15,000
Source: BWDB, 1993.
During the 1970s, soil salinity was mainly confined to the Ganges tidal flood plain of the Southwest region. Soil salinity occurred at the South of Khulna and Bagerhat Districts with salinity level ranging between 4,000 m-mhos/cm and 8,000 m-mhos/cm. A rise in salinity level has been noticed however, since 1975. At present, salinity levels at the South of Khulna and Bagerhat town range between 8,000 m-mhos/cm to 15,000 m-mhos/cm during the dry season. Some thanas like Kachua, Mollarhat and Fultala, which were previously non-saline, started turning saline during the 1980s (EGIS, 2001a). Soil salinity occurs mostly in the greater Khulna and Jessore Districts particularly in the dry period due to the penetration of tidal water from the sea and also due to the capillary rise of saline water from the underground water table. The use of saline water for irrigation makes areas more saline by the accumulation of salts in the soil profiles. BWDB (1993) and EGIS (2001a) reported increased soil salinity level in the districts of Khustia, Meherpur, Jhenidah, Faridpur, Gopalgonj, Narail, Magura, Satkhira and Bagerhat from the pre-diversion period (Table 9.3) (Figure 9.4). 9.3.2
EXPANDED SALINE AREA
Soil Research Development Institute (SRDI), Government of Bangladesh carried out
Adverse Effects on Agriculture
185
detailed surveys on soil salinity and prepared maps for 1973 and 1997. They demonstrate that over a period of 24 years, there has been an increasing trend of soil salinity under different classes. Increase in the percentage is, however, much higher under moderate to high saline classes (Table 9.4). River water salinity moves up as far as the Kamarkhali ghat. Since there is an extensive withdrawal of ground water for agricultural use, saline ground water from the South intrudes into the freshwater aquifer in the North (for details see Chapter 5). At present, about half of the Jessore and Magura Districts and all of the Narail District have been affected by soil salinity (EGIS, 2001a). In this area, crop growth on the high lands is affected by soil salinity. B.aus, B.aman, jute, mustard, lentil and boro crops are the main crops affected by salinity. Generally soil salinity affects crops from the first week of March and continues up to May. Table 9.3. Soil salinity in selected districts at 15 cm depth (m-mhos/cm at 25oC)
District Village/Thana MEHERPUR Gangni Meherpur NARAIL Laxmipasha Lohagara SATKHIRA Mirzapur Kalaroa
Year
January
February
March
April
May
1992 1978 1992 1978
2,000