Endocannabinoid Signaling: Methods and Protocols (Methods in Molecular Biology, 1412) 9781493935376, 1493935372
This volume encompasses all major methodologies to interrogate endocannabinoid systems (ECS) and endocannabinoids (eCBs)
128 94 10MB
English Pages 296 [287] Year 2016
Preface
Contents
Contributors
Chapter 1: Need for Methods to Investigate Endocannabinoid Signaling
1 A Modern View of the Endocannabinoid System
2 Conclusions
References
Chapter 2: Extraction and Simultaneous Quantification of Endocannabinoids and Endocannabinoid-Like Lipids in Biological Tissues
1 Introduction
2 Materials
2.1 Tissue Extraction Components
2.2 eCB Internal Standards and Calibration Standards
2.3 LC/MRM
2.4 BCA
3 Methods
3.1 Tissue Isolation and Pre-processing
3.2 Preliminary Steps for Extraction of eCBs from Tissues
3.3 Tissue Weighing
3.4 Extraction of eCBs
3.5 LC/MRM
3.6 BCA Assay
4 Notes
References
Chapter 3: Determination of 2-Arachidonoylglycerol by μSPE-LC-MS/MS
1 Introduction
2 Materials
2.1 Specimens Collection
2.1.1 Tissue
2.1.2 Plasma
3 Methods
3.1 Extraction from Tissue
3.2 Extraction from Plasma
3.3 LC-MS/MS Analysis
4 Notes
References
Chapter 4: Analysis of Omega-3 Fatty Acid Derived N -Acylethanolamines in Biological Matrices
1 Introduction
2 Materials
2.1 Analytical Standard Solutions
2.1.1 Calibration Curve Solutions
2.1.2 Deuterated Standard Spiking Stock Solution
2.1.3 Reconstitution Solution
2.2 Solutions and Reagents
2.3 Consumables
2.4 Equipment
3 Methods
3.1 Sample Collection
3.2 Sample Extraction
3.3 LC-MS Analysis
3.4 Data Processing and Experimental Results
3.5 Modifications to the Sample Preparation Protocol for Matrices Other Than Plasma
3.6 Factors That Influence Levels of n-3 Endocannabinoids
3.7 Choice of Target Analytes
4 Notes
References
Chapter 5: Assay of CB1 Receptor Binding
1 Introduction
2 Materials
2.1 Labeled and Unlabeled Compounds
2.2 Buffers and Equipments
2.2.1 CB1 Binding Assay for Tissues
2.2.2 CB1 Binding Assay for Intact Cells
2.2.3 High-Throughput CB1 Binding Assay
3 Methods
3.1 Protocol 1: CB1 Binding Assay for Tissues
3.1.1 Preparation of Membrane Homogenates
3.1.2 Assay Using Vacuum Filtration Manifold Millipore® Model 1225
3.2 Protocol 2: CB1 Binding Assay for Adherent Living Cells
3.3 Protocol 3: CB1 Binding Assay for High-Throughput Screening
3.4 Data Analysis
3.4.1 Protocols 1 and 2
3.4.2 Protocol 3
4 Notes
References
Chapter 6: The Displacement Binding Assay Using Human Cannabinoid CB2 Receptor-Transfected Cells
1 Introduction
2 Materials
2.1 Cell Culturing
2.2 Radioligand Displacement Binding Assay
3 Methods
3.1 Cell Culturing
3.2 Displacement Binding Assay
3.3 Analysis of the Results
4 Notes
References
Chapter 7: Assay of TRPV1 Receptor Signaling
1 Introduction
2 Materials
3 Methods
3.1 Cell Culture and Transfection
3.2 Fluo-4 AM Loading
3.3 Fura-2 AM Loading
3.4 Assay of TRP-Mediated Elevation of Intracellular Ca2+ in Transfected HEK-293 Cells
3.5 Measuring Ca2+ in TRP Transfected HEK-293 Cells
3.6 Study of Other TRPs Using the Calcium Assay
4 Notes
References
Chapter 8: A Functional Assay for GPR55: Envision Protocol
1 Introduction
2 Materials
3 Methods
3.1 ERK1/2 Phosphorylation Assay
3.2 Data Analysis
4 Notes
References
Chapter 9: The Cyclic AMP Assay Using Human Cannabinoid CB2 Receptor-Transfected Cells
1 Introduction
2 Materials
2.1 Cell Culture
2.2 Cyclic AMP Assay
3 Methods
3.1 Cell Culture
3.2 Cyclic AMP Assay
3.3 Analysis of the Results
4 Notes
References
Chapter 10: Assay of GTPγS Binding in Autoradiography
1 Introduction
2 Materials
2.1 Slide Preparation
2.2 Tissue Preparation
2.3 Assay Components
3 Methods
3.1 Gelatine-Coated Slides
3.2 Tissue Preparation
3.3 Assay
3.4 Image Analysis
4 Notes
References
Chapter 11: Protocol to Study β-Arrestin Recruitment by CB1 and CB2 Cannabinoid Receptors
1 Introduction
2 Materials
2.1 Cell Culture
2.2 Assay
2.3 Detection and Analysis
3 Methods
3.1 Cell Culture
3.2 Ligands Under Investigation
3.3 PathHunter® Assay Protocol
3.3.1 Plating Cells
3.3.2 Treatment of Cells and Incubation
3.3.3 Detection and Measurements
3.4 Data Analysis
3.5 Results
3.6 Conclusions
4 Notes
References
Chapter 12: Assay of NAT Activity
1 Introduction
2 Materials
2.1 Partial Purification of Ca-NAT from Rat Brain
2.2 Purification of Recombinant PLA/AT-2
2.3 Enzyme Assay
3 Methods
3.1 Partial Purification of Ca-NAT from Rat Brain
3.2 Purification of Recombinant PLA/AT-2
3.3 Enzyme Assay
4 Notes
References
Chapter 13: Assay of NAPE-PLD Activity
1 Introduction
2 Materials
2.1 Radiolabeled Components
2.2 Unlabeled Components
2.3 Equipment
3 Methods
3.1 Substrate Preparation
3.2 Preparation of Tissue and Cell Samples
3.3 Enzyme Assay
3.4 TLC
4 Notes
References
Chapter 14: Assay of FAAH Activity
1 Introduction
2 Materials
2.1 Chemicals
2.2 Equipment
3 Methods
3.1 Sample Preparation
3.2 Substrate Mix Preparation
3.3 Enzymatic Reaction
4 Notes
References
Chapter 15: Assay of NAAA Activity
1 Introduction
2 Materials
2.1 Preparation of NAAA from Rat Lung
2.2 Preparation of Recombinant NAAA
2.3 Synthesis of Radiolabeled Substrate
2.4 Enzyme Assay
3 Methods
3.1 Preparation of NAAA from Rat Lung
3.2 Preparation of Recombinant NAAA
3.3 Synthesis of Radiolabeled Substrate
3.4 Enzyme Assay
4 Notes
References
Chapter 16: Assay of DAGLα/β Activity
1 Introduction
2 Materials
2.1 Enzymatic Assay Components
2.2 Components for TLC
3 Methods
3.1 Enzymatic Assay
3.2 TLC Preparation and Development
4 Notes
References
Chapter 17: Assay of Monoacylglycerol Lipase Activity
1 Introduction
2 Materials
2.1 Reagents
2.1.1 Lipids
2.1.2 Buffers and Growth Medium
2.1.3 Solvents and Chemicals
2.2 Equipment
2.3 Supplies and Apparatuses
3 Methods
3.1 Enzyme Preparation
3.1.1 Cell Homogenate
3.1.2 Tissue Homogenate
3.1.3 Homogenate of MGL-Overexpressing HeLa Cells
3.2 Setting Up the Enzyme Reaction
3.3 Lipid Extraction
3.4 LC/MS Analysis
3.5 Calculation of MGL Activity
3.5.1 Standard Curve
3.5.2 Calculations
4 Notes
References
Chapter 18: A Sensitive and Versatile Fluorescent Activity Assay for ABHD6
1 Introduction
2 Materials
2.1 Basic Incubation Cocktail
2.2 Components of the Coupled-Enzyme System
2.3 Other Reagents
2.4 Glycerol Standards and Glycerol Quality Control
2.5 Reagents for Cell Culture
2.6 Equipment
3 Methods
3.1 Enzyme Preparation
3.2 Activity Assay
3.3 Guidelines for Calculations
4 Notes
References
Chapter 19: A Sensitive and Versatile Fluorescent Activity Assay for ABHD12
1 Introduction
2 Materials
2.1 Basic Incubation Cocktail
2.2 Components of the Coupled-Enzyme System
2.3 Other Reagents
2.4 Glycerol Standards and Glycerol Quality Control
2.5 Reagents for Cell Culture
2.6 Equipment
3 Methods
3.1 Enzyme Preparation
3.2 Activity Assay
3.3 Guidelines for Calculations
4 Notes
References
Chapter 20: Assay of Endocannabinoid Uptake
1 Introduction
2 Materials
2.1 Components and Reagents
2.2 Cell Culture Material
2.3 Buffers and Stock Solutions
3 Methods
3.1 Cell Culture Maintenance
3.2 Three-Phase AEA Uptake Assay
3.3 Three-Phase 2-AG Uptake Assay
4 Notes
References
Chapter 21: Assay of Endocannabinoid Oxidation by Cyclooxygenase-2
1 Introduction
2 Materials
2.1 General
2.2 In Vitro Assays
2.3 Cell Assay
2.4 LC-MS/MS
3 Methods
3.1 In Vitro Assay
3.2 Cell Assay
3.3 LC-MS Analysis
4 Notes
References
Chapter 22: Oxygenation of Anandamide by Lipoxygenases
1 Introduction
2 Materials
2.1 Buffers and Solutions
2.2 Preparation of Enzymes
3 Methods
3.1 Production of Hydroperoxy- AEA
3.2 Reduction of Hydroperoxy-AEA to Hydroxy-AEA
3.3 Purification of Hydroxy-AEA
3.4 Analytical Characterization
3.5 Chemical Data of the Oxygenated Derivatives
4 Notes
References
Chapter 23: Assay of Endocannabinoid Oxidation by Cytochrome P450
1 Introduction
2 Materials
2.1 Components for Metabolic Reactions
2.2 Components for Metabolite Extraction and Analysis
3 Methods
3.1 General Protocol for the Preparation of Tissue Mitochondria and Microsomes
3.2 Metabolic Reactions
3.3 Extraction of Metabolites and Known Standards
3.4 Liquid Chromatography-Mass Spectrometry Analysis
3.5 Data Analysis
4 Notes
References
Chapter 24: Assessing Gene Expression of the Endocannabinoid System
1 Introduction
2 Materials
2.1 RNA Isolation
2.2 Determination of RNA Yield and Integrity
2.3 RT Reaction
2.4 qRT-PCR Reaction
3 Methods
3.1 RNA Isolation
3.2 Determination of RNA Yield and Integrity
3.3 RT Reaction
3.4 qRT-PCR
3.4.1 Comparative Ct Method (ΔΔCt)
4 Notes
References
Chapter 25: Western Blotting of the Endocannabinoid System
1 Introduction
2 Materials
2.1 Buffers and Solutions
2.2 Gel Apparatus Assembly
2.3 Gel Electrophoresis and Blotting Equipment
3 Methods
3.1 Typical Tissue Preparation
3.2 Preparing Cultured Cells
3.3 Running the Gel
3.4 Transferring the Gel
3.5 Western Blot
4 Notes
Chapter 26: Quantitation of Plasma Membrane (G Protein-Coupled) Receptor Trafficking in Cultured Cells
1 Introduction
2 Materials
2.1 Plasmids and Cell Lines
2.2 Buffers and Solutions
2.3 Plate Preparation
2.4 Cell Line Preparation
2.5 Detection Equipment
3 Methods
3.1 Making Stable Cell Lines
3.2 Live Cell Screening for Expression Lines
3.3 Internalization Assay
3.4 Recycling Assay
4 Notes
References
Chapter 27: Measuring ECS Interaction with Biomembranes
1 Introduction
2 Materials
2.1 Components for Liposome Preparation
2.2 Components for Isolation of Rat Liver Membranes
2.3 Protein Solution
2.4 FRET Components
3 Methods
3.1 Liposome Preparation
3.2 Fluorescence Measurements
4 Notes
References
Chapter 28: Visualization of Endocannabinoids in the Cell
1 Introduction
2 Materials
2.1 Cell Culture
2.2 Cover Slips
2.3 Solutions and Imaging Equipment
3 Methods
3.1 Cell Culture
3.2 Incubation with b-AEA
3.3 Labeling with b-AEA
3.4 Cell Examination
4 Notes
References
Index
Recommend Papers


![Cancer Cell Signaling: Methods and Protocols (Methods in Molecular Biology Vol 218) [1 ed.]
9781588290755, 9781592593569, 1588290751](https://ebin.pub/img/200x200/cancer-cell-signaling-methods-and-protocols-methods-in-molecular-biology-vol-218-1nbsped-9781588290755-9781592593569-1588290751.jpg)
- Author / Uploaded
- Mauro Maccarrone (editor)
File loading please wait...
Citation preview
Methods in Molecular Biology 1412
Mauro Maccarrone Editor
Endocannabinoid Signaling Methods and Protocols
METHODS
IN
MOLECULAR BIOLOGY
Series Editor John M. Walker School of Life and Medical Sciences University of Hertfordshire Hatfield, Hertfordshire, AL10 9AB, UK
For further volumes: http://www.springer.com/series/7651
Endocannabinoid Signaling Methods and Protocols
Edited by
Mauro Maccarrone Department of Medicine, Campus Bio-Medico University of Rome, Rome, Italy
Editor Mauro Maccarrone Department of Medicine Campus Bio-Medico University of Rome Rome, Italy
ISSN 1064-3745 ISSN 1940-6029 (electronic) Methods in Molecular Biology ISBN 978-1-4939-3537-6 ISBN 978-1-4939-3539-0 (eBook) DOI 10.1007/978-1-4939-3539-0 Library of Congress Control Number: 2016941495 © Springer Science+Business Media New York 2016 This work is subject to copyright. All rights are reserved by the Publisher, whether the whole or part of the material is concerned, specifically the rights of translation, reprinting, reuse of illustrations, recitation, broadcasting, reproduction on microfilms or in any other physical way, and transmission or information storage and retrieval, electronic adaptation, computer software, or by similar or dissimilar methodology now known or hereafter developed. The use of general descriptive names, registered names, trademarks, service marks, etc. in this publication does not imply, even in the absence of a specific statement, that such names are exempt from the relevant protective laws and regulations and therefore free for general use. The publisher, the authors and the editors are safe to assume that the advice and information in this book are believed to be true and accurate at the date of publication. Neither the publisher nor the authors or the editors give a warranty, express or implied, with respect to the material contained herein or for any errors or omissions that may have been made. Printed on acid-free paper Humana Press is a brand of Springer Springer Science+Business Media LLC New York is part of Springer Science+Business Media (www.springer.com)
Preface Since the isolation and characterization of the active phytocannabinoids in the cannabis (Cannabis sativa) plant, including the most psychoactive ingredient Δ9-tetrahydrocannabinol (THC), and after the identification and cloning of the target of THC, the type-1 cannabinoid receptor, and of its endogenous counterparts collectively termed “endocannabinoids (eCBs),” many efforts have been produced to study the different physiological functions modulated by what is now known as “endocannabinoid system (ECS).” eCBs are derivatives of arachidonic acid, resembling other lipid transmitters such as prostaglandins or leukotrienes. They are conjugated with ethanolamine to form fatty acid amides, or with glycerol to form monoacylglycerols; so far, N-arachidonoylethanolamine (anandamide, AEA) and 2-arachidonoylglycerol (2-AG) represent the best studied and most active members of each class, respectively. In the last 20 years, an ever-growing interest towards the manifold activities of eCBs in pathophysiology has boosted the development of chemical, biochemical, and molecular biological assays to specifically measure the endogenous levels of eCBs, along with the specific activity of distinct elements of the ECS. These include membrane and nuclear receptors (and signaling pathways thereof), biosynthetic and hydrolytic enzymes, as well as membrane transporters and oxidative enzymes. Not only the functional activity of these entities but also their gene and protein expression has attracted attention, because its regulation has emerged as a major determinant of eCB biological activity. Therefore, a manual that puts together all major methodologies to interrogate ECS and eCB signaling appears timely and will help chemists, drug designers, biochemists, molecular biologists, cell biologists, pharmacologists, and (electro)physiologists to navigate the mare magnum of endocannabinoid research. Rome, Italy
Mauro Maccarrone
v
Contents Preface. . . . . . . . . . . . . . . . . . . . . . . . . . . . . . . . . . . . . . . . . . . . . . . . . . . . . . . . . . Contributors . . . . . . . . . . . . . . . . . . . . . . . . . . . . . . . . . . . . . . . . . . . . . . . . . . . . . . . . . .
v ix
1 Need for Methods to Investigate Endocannabinoid Signaling . . . . . . . . . . . . . Mauro Maccarrone 2 Extraction and Simultaneous Quantification of Endocannabinoids and Endocannabinoid-Like Lipids in Biological Tissues . . . . . . . . . . . . . . . . . . Laura Bindila and Beat Lutz 3 Determination of 2-Arachidonoylglycerol by µSPE-LC-MS/MS . . . . . . . . . . . Natalia Battista and Manuel Sergi 4 Analysis of Omega-3 Fatty Acid Derived N -Acylethanolamines in Biological Matrices . . . . . . . . . . . . . . . . . . . . . . . . . . . . . . . . . . . . . . . . . . . Renger F. Witkamp and Michiel G.J. Balvers 5 Assay of CB1 Receptor Binding . . . . . . . . . . . . . . . . . . . . . . . . . . . . . . . . . . . . Valeria M. Catani and Valeria Gasperi 6 The Displacement Binding Assay Using Human Cannabinoid CB2 Receptor-Transfected Cells . . . . . . . . . . . . . . . . . . . . . . . . . . . . . . . . . . . . . . . Maria Grazia Cascio, Pietro Marini, and Roger G. Pertwee 7 Assay of TRPV1 Receptor Signaling . . . . . . . . . . . . . . . . . . . . . . . . . . . . . . . . Aniello Schiano Moriello and Luciano De Petrocellis 8 A Functional Assay for GPR55: Envision Protocol. . . . . . . . . . . . . . . . . . . . . . Sharon Anavi-Goffer and Ruth A. Ross 9 The Cyclic AMP Assay Using Human Cannabinoid CB2 Receptor-Transfected Cells . . . . . . . . . . . . . . . . . . . . . . . . . . . . . . . . . . . . . . . Pietro Marini, Maria Grazia Cascio, and Roger G. Pertwee 10 Assay of GTPγS Binding in Autoradiography. . . . . . . . . . . . . . . . . . . . . . . . . . Marina Gabaglio, Pamela Prini, Erica Zamberletti, Tiziana Rubino, and Daniela Parolaro 11 Protocol to Study β-Arrestin Recruitment by CB1 and CB2 Cannabinoid Receptors . . . . . . . . . . . . . . . . . . . . . . . . . . . . . . . . . . . . . . . . . . Marjolein Soethoudt, Noortje van Gils, Mario van der Stelt, and Laura H. Heitman 12 Assay of NAT Activity . . . . . . . . . . . . . . . . . . . . . . . . . . . . . . . . . . . . . . . . . . . Toru Uyama and Natsuo Ueda 13 Assay of NAPE-PLD Activity . . . . . . . . . . . . . . . . . . . . . . . . . . . . . . . . . . . . . Filomena Fezza, Nicolina Mastrangelo, and Mauro Maccarrone 14 Assay of FAAH Activity. . . . . . . . . . . . . . . . . . . . . . . . . . . . . . . . . . . . . . . . . . Monica Bari, Monica Feole, and Mauro Maccarrone
1
vii
9 19
27 41
57 65 77
85 95
103
113 123 131
viii
Contents
15 Assay of NAAA Activity. . . . . . . . . . . . . . . . . . . . . . . . . . . . . . . . . . . . . . . . . . Kazuhito Tsuboi and Natsuo Ueda 16 Assay of DAGLα/β Activity . . . . . . . . . . . . . . . . . . . . . . . . . . . . . . . . . . . . . . Tiziana Bisogno 17 Assay of Monoacylglycerol Lipase Activity . . . . . . . . . . . . . . . . . . . . . . . . . . . . Kwang-Mook Jung and Daniele Piomelli 18 A Sensitive and Versatile Fluorescent Activity Assay for ABHD6 . . . . . . . . . . . Juha R. Savinainen, Dina Navia-Paldanius, and Jarmo T. Laitinen 19 A Sensitive and Versatile Fluorescent Activity Assay for ABHD12 . . . . . . . . . . Juha R. Savinainen, Dina Navia-Paldanius, and Jarmo T. Laitinen 20 Assay of Endocannabinoid Uptake . . . . . . . . . . . . . . . . . . . . . . . . . . . . . . . . . Mark Rau, Simon Nicolussi, Andrea Chicca, and Jürg Gertsch 21 Assay of Endocannabinoid Oxidation by Cyclooxygenase-2 . . . . . . . . . . . . . . . Shalley N. Kudalkar, Philip J. Kingsley, and Lawrence J. Marnett 22 Oxygenation of Anandamide by Lipoxygenases . . . . . . . . . . . . . . . . . . . . . . . . Guus van Zadelhoff and Mario van der Stelt 23 Assay of Endocannabinoid Oxidation by Cytochrome P450 . . . . . . . . . . . . . . Natasha T. Snider, Vyvyca J. Walker, and Paul F. Hollenberg 24 Assessing Gene Expression of the Endocannabinoid System. . . . . . . . . . . . . . . Mariangela Pucci and Claudio D’Addario 25 Western Blotting of the Endocannabinoid System . . . . . . . . . . . . . . . . . . . . . . Jim Wager-Miller and Ken Mackie 26 Quantitation of Plasma Membrane (G Protein-Coupled) Receptor Trafficking in Cultured Cells . . . . . . . . . . . . . . . . . . . . . . . . . . . . . . . . . . . . . . Jim Wager-Miller and Ken Mackie 27 Measuring ECS Interaction with Biomembranes . . . . . . . . . . . . . . . . . . . . . . . Clotilde B. Angelucci, Annalaura Sabatucci, and Enrico Dainese 28 Visualization of Endocannabinoids in the Cell . . . . . . . . . . . . . . . . . . . . . . . . . Sergio Oddi, Antonio Totaro, and Mauro Maccarrone Index . . . . . . . . . . . . . . . . . . . . . . . . . . . . . . . . . . . . . . . . . . . . . . . . . . . . . . . . . . . . . . .
137 149 157 169 179 191 205 217 227 237 247
255 267 277 283
Contributors SHARON ANAVI-GOFFER • Department of Behavioral Sciences, Ariel University, Ariel, Israel; Institute of Medical Sciences, University of Aberdeen, Aberdeen, UK CLOTILDE B. ANGELUCCI • Faculty of Veterinary Medicine, University of Teramo, Teramo, Italy MICHIEL G.J. BALVERS • Division of Human Nutrition, Wageningen University, Wageningen, The Netherlands; Clinical Chemistry and Haematology Laboratory, Gelderse Vallei Hospital, Ede, The Netherlands MONICA BARI • Department of Experimental Medicine and Surgery, Tor Vergata University of Rome, Rome, Italy NATALIA BATTISTA • Faculty of Bioscience and Technology for Food, Agriculture and Environment, University of Teramo, Teramo, Italy LAURA BINDILA • Institute for Physiological Chemistry, University Medical Center, Mainz, Germany TIZIANA BISOGNO • Endocannabinoid Research Group, Institute of Biomolecular Chemistry, National Research Council, Pozzuoli, Italy; Center of Integrated Research, Campus Bio-Medico University of Rome, Rome, Italy MARIA GRAZIA CASCIO • School of Medicine, Medical Sciences & Nutrition, Institute of Medical Sciences, University of Aberdeen, Foresterhill, Scotland, UK VALERIA M. CATANI • Department of Experimental Medicine and Surgery, Tor Vergata University of Rome, Rome, Italy ANDREA CHICCA • Institute of Biochemistry and Molecular Medicine, NCCR TransCure, University of Bern, Bern, Switzerland CLAUDIO D’ADDARIO • Faculty of Bioscience and Technology for Food, Agriculture and Environment, University of Teramo, Teramo, Italy; European Center for Brain Research (CERC)/Santa Lucia Foundation, Rome, Italy ENRICO DAINESE • Faculty of Bioscience and Technology for Food, Agriculture and Environment, University of Teramo, Teramo, Italy MONICA FEOLE • Department of Medicine, Campus Bio-Medico University of Rome, Rome, Italy FILOMENA FEZZA • Department of Experimental Medicine and Surgery, Tor Vergata University of Rome, Rome, Italy MARINA GABAGLIO • Department of Biotechnology and Life Sciences, University of Insubria, Busto Arsizio (VA), Italy VALERIA GASPERI • Department of Experimental Medicine and Surgery, Tor Vergata University of Rome, Rome, Italy JÜRG GERTSCH • Institute of Biochemistry and Molecular Medicine, NCCR TransCure, University of Bern, Bern, Switzerland NOORTJE VAN GILS • Department of Medicinal Chemistry, Leiden Academic Center for Drug Research, Leiden University, Leiden, The Netherlands LAURA H. HEITMAN • Department of Medicinal Chemistry, Leiden Academic Center for Drug Research, Leiden University, Leiden, The Netherlands
ix
x
Contributors
PAUL F. HOLLENBERG • Department of Pharmacology, University of Michigan, Ann Arbor, MI, USA KWANG-MOOK JUNG • Department of Anatomy and Neurobiology, University of California, Irvine, Irvine, CA, USA PHILIP J. KINGSLEY • A.B. Hancock Jr. Memorial Laboratory for Cancer Research, Department of Biochemistry, Vanderbilt Institute of Chemical Biology, Vanderbilt Center in Molecular Toxicology, Vanderbilt-Ingram Cancer Center, Vanderbilt University School of Medicine, Nashville, TN, USA; Department of Bio Chemistry, Vanderbilt Institute of Chemical Biology, Vanderbilt Center in Molecular Toxicology, Vanderbilt-Ingram Cancer Center, Vanderbilt University School of Medicine, Nashville, TN, USA SHALLEY N. KUDALKAR • A.B. Hancock Jr. Memorial Laboratory for Cancer Research, Department of Biochemistry, Vanderbilt Institute of Chemical Biology, Vanderbilt Center in Molecular Toxicology, Vanderbilt-Ingram Cancer Center, Vanderbilt University School of Medicine, Nashville, TN, USA JARMO T. LAITINEN • School of Medicine, Institute of Biomedicine/Physiology, University of Eastern Finland, Kuopio, Finland BEAT LUTZ • Institute for Physiological Chemistry, University Medical Center, Mainz, Germany MAURO MACCARRONE • Department of Medicine, Campus Bio-Medico University of Rome, Rome, Italy; European Center for Brain Research/IRCCS Santa Lucia Foundation, Rome, Italy KEN MACKIE • Department of Psychological and Brain Sciences, Indiana University, Bloomington, IN, USA PIETRO MARINI • School of Medicine, Medical Sciences & Nutrition, Institute of Medical Sciences, University of Aberdeen, Foresterhill, Scotland, UK LAWRENCE J. MARNETT • A.B. Hancock Jr. Memorial Laboratory for Cancer Research, Department of Biochemistry, Vanderbilt Institute of Chemical Biology, Vanderbilt Center in Molecular Toxicology, Vanderbilt-Ingram Cancer Center, Vanderbilt University School of Medicine, Nashville, TN, USA; Department of Chemistry, Vanderbilt Institute of Chemical Biology, Vanderbilt Center in Molecular Toxicology, Vanderbilt-Ingram Cancer Center, Vanderbilt University School of Medicine, Nashville, TN, USA; Department of Pharmacology, Vanderbilt Institute of Chemical Biology, Vanderbilt Center in Molecular Toxicology, Vanderbilt-Ingram Cancer Center, Vanderbilt University School of Medicine, Nashville, TN, USA NICOLINA MASTRANGELO • Department of Medicine, Campus Bio-Medico University of Rome, Rome, Italy ANIELLO SCHIANO MORIELLO • Istituto di Chimica Biomolecolare, Consiglio Nazionale delle Ricerche (CNR), Pozzuoli, Italy DINA NAVIA-PALDANIUS • School of Medicine, Institute of Biomedicine/Physiology, University of Eastern Finland, Kuopio, Finland SIMON NICOLUSSI • Institute of Biochemistry and Molecular Medicine, NCCR TransCure, University of Bern, Bern, Switzerland SERGIO ODDI • Faculty of Veterinary Medicine, University of Teramo, Teramo, Italy; European Center for Brain Research/Santa Lucia Foundation IRCCS, Rome, Italy DANIELA PAROLARO • Department of Biotechnology and Life Sciences, University of Insubria, Busto Arsizio (VA), Italy; Fondazione Zardi-Gori, Milano, Italy ROGER G. PERTWEE • School of Medicine, Medical Sciences & Nutrition, Institute of Medical Sciences, University of Aberdeen, Foresterhill, Scotland, UK
Contributors
xi
LUCIANO DE PETROCELLIS • Istituto di Chimica Biomolecolare, Consiglio Nazionale delle Ricerche (CNR), Pozzuoli, Italy DANIELE PIOMELLI • Department of Anatomy and Neurobiology, University of California, Irvine, Irvine, CA, USA; Department of Pharmacology, University of California, Irvine, Irvine, CA, USA; Department of Biological Chemistry, University of California, Irvine, Irvine, CA, USA; Drug Discovery and Development, Istituto Italiano di Tecnologia, Genoa, Italy PAMELA PRINI • Department of Biotechnology and Life Sciences, University of Insubria, Busto Arsizio (VA), Italy MARIANGELA PUCCI • Faculty of Bioscience and Technology for Food, Agriculture and Environment, University of Teramo, Teramo, Italy MARK RAU • Institute of Biochemistry and Molecular Medicine, NCCR TransCure, University of Bern, Bern, Switzerland RUTH A. ROSS • Department of Pharmacology and Toxicology, Faculty of Medicine, University of Toronto, Toronto, ON, Canada; Institute of Medical Sciences, University of Aberdeen, Aberdeen, UK TIZIANA RUBINO • Department of Biotechnology and Life Sciences, University of Insubria, Busto Arsizio (VA), Italy ANNALAURA SABATUCCI • Faculty of Bioscience and Technology for Food Agriculture and Environment, University of Teramo, Teramo, Italy JUHA R. SAVINAINEN • School of Medicine, Institute of Biomedicine/Physiology, University of Eastern Finland, Kuopio, Finland MANUEL SERGI • Faculty of Bioscience and Technology for Food, Agriculture and Environment, University of Teramo, Teramo, Italy NATASHA T. SNIDER • Department of Cell Biology and Physiology, University of North Carolina at Chapel Hill, Chapel Hill, NC, USA MARJOLEIN SOETHOUDT • Department of Bio-Organic Synthesis, Leiden Institute of Chemistry, Leiden University, Leiden, The Netherlands; Department of Medicinal Chemistry, Leiden Academic Center for Drug Research, Leiden University, Leiden, The Netherlands MARIO VAN DER STELT • Department of Molecular Physiology, Leiden Institute of Chemistry, Leiden University, Leiden, The Netherlands ANTONIO TOTARO • European Center for Brain Research/Santa Lucia Foundation IRCCS, Rome, Italy KAZUHITO TSUBOI • Department of Biochemistry, Kagawa University School of Medicine, Kagawa, Japan NATSUO UEDA • Department of Biochemistry, Kagawa University School of Medicine, Kagawa, Japan TORU UYAMA • Department of Biochemistry, Kagawa University School of Medicine, Kagawa, Japan JIM WAGER-MILLER • Department of Psychological and Brain Sciences, Indiana University, Bloomington, IN, USA VYVYCA J. WALKER • Department of Medicine – Nephrology, University of Alabama at Birmingham, Birmingham, AL, USA RENGER F. WITKAMP • Division of Human Nutrition, Wageningen University, Wageningen, The Netherlands GUSS VAN ZADELHOFF • Cellular Protein Chemistry, Faculty of Science, Utrecht University, Utrecht, The Netherlands ERICA ZAMBERLETTI • Department of Biotechnology and Life Sciences, University of Insubria, Busto Arsizio (VA), Italy
Chapter 1 Need for Methods to Investigate Endocannabinoid Signaling Mauro Maccarrone Abstract Endocannabinoids (eCBs) are endogenous lipids able to activate cannabinoid receptors, the primary molecular targets of the cannabis (Cannabis sativa) active principle Δ9-tetrahydrocannabinol. During the last 20 years, several N-acylethanolamines and acylesters have been shown to act as eCBs, and a complex array of receptors, metabolic enzymes, and transporters (that altogether form the so-called eCB system) has been shown to finely tune their manifold biological activities. It appears now urgent to develop methods and protocols that allow to assay in a specific and quantitative manner the distinct components of the eCB system, and that can properly localize them within the cell. A brief overview of eCBs and of the proteins that bind, transport, and metabolize these lipids is presented here, in order to put in a better perspective the relevance of methodologies that help to disclose molecular details of eCB signaling in health and disease. Proper methodological approaches form also the basis for a more rationale and effective drug design and therapeutic strategy to combat human disorders. Key words Anandamide, 2-Arachidonoylglycerol, Enzyme assays, Immunochemical assays, Intracellular trafficking, Localization, Metabolic routes, Oxidative pathways, Receptor binding assays, Signal transduction
1
A Modern View of the Endocannabinoid System Two G protein-coupled receptors, termed type-1 (CB1) and type-2 (CB2) cannabinoid receptors, are activated by Δ9tetrahydrocannabinol (THC), the major psychoactive component of cannabis (Cannabis sativa) extracts like hashish and marijuana [1]. Endogenous counterparts of THC [collectively termed “endocannabinoids (eCBs)”], their target receptors, and the enzymes responsible for their synthesis and degradation form an entirely new endogenous signaling system, also known as the “endocannabinoid system (ECS)” [2–4]. The most important eCBs are two arachidonic acid derivatives: N-arachidonoylethanolamine (anandamide, AEA) and 2-arachidonoylglycerol (2-AG), shown in Table 1.
Mauro Maccarrone (ed.), Endocannabinoid Signaling: Methods and Protocols, Methods in Molecular Biology, vol. 1412, DOI 10.1007/978-1-4939-3539-0_1, © Springer Science+Business Media New York 2016
1
2
Mauro Maccarrone
Table 1 Endocannabinoids (eCBs), their molecular targets, and their biosynthetic and catabolic enzymes
Bioactive lipids
Molecular targets
Biosynthetic enzymes
Catabolic/oxidative enzymes
CB1 CB2 TRPV1 PPARα PPARγ GPR55
NAT iNAT NAPE-PLD ABHD4 Lyso-PLD GDE1
FAAH NAAA LOXs COX-2 Cyt P450
ω − 6 eCBs O OH
N H
PTPN22
N-arachidonoylethanolamine (anandamide, AEA) O OH
O
OH
2-Arachidonoylglycerol (2-AG)
CB1 CB2
PLCβ DAGLα
MAGL FAAH
TRPV1
DAGLβ
ABHD6
CB1 CB2
Possibly as for other NAEs
Possibly as for other NAEs
Possibly as for other NAEs
Possibly as for other NAEs
ω − 3 eCBs H N OH O
N-docosahexaenoylethanolamine (DHEA) PPARγ O N H
OH
CB1 CB2
N-eicosapentaenoylethanolamine (EPEA) PPARγ Abbreviations: ABHD4/6/12 α/β-hydrolase domain 4/6/12, CB1 type-1 cannabinoid receptors, CB2 type-2 cannabinoid receptors, COX-2 cyclooxygenase-2, Cyt P450 cytochrome P450, DAGLα/β diacylglycerol lipase α/β, FAAH fatty acid amide hydrolase, GPR55 orphan G protein‐coupled receptor 55, LOXs lipoxygenases, MAGL monoacylglycerol lipase, NAAA N-acylethanolamine-hydrolyzing acid amidase, NAPE-PLD N-acyl-phosphatidylethanolaminehydrolyzing phospholipase D, NAT N-acyltransferase, iNAT Ca2+-independent N-acyltransferase, PLCβ phospholipase Cβ, lyso-PLD lyso-phospholipase D, PPARα/γ peroxisome proliferator‐activated receptor α/γ, PTPN22 protein tyrosine phosphatase, non-receptor type 22, TRPV1 transient receptor potential vanilloid type 1 channel
They belong to the large families of N-acylethanolamines and 2-monoacylglycerols, respectively. Besides these ω − 6 (n − 6) fatty acid compounds, two metabolically important ω − 3 (n − 3) fatty acid ethanolamines have been discovered: N-eicosapentaenoylethanolamine (EPEA) [5] and N-docosahexaenoylethanolamine (DHEA) [6], also shown in Table 1. The latter two substances have been proposed as additional CB1/CB2 agonists [7], but their pharmacology and biological relevance remain to be clarified. The actions of eCBs and congeners are controlled through not yet fully characterized cellular mechanisms that include key agents responsible for their biosynthesis, degradation, and oxidation.
3
Investigating Endocannabinoid Signaling
Remarkably, during the last few years multiple pathways have been described for the metabolism of AEA (Fig. 1), and of 2-AG (Fig. 2), as detailed in a recent review [8]. Briefly, the main route for AEA biosynthesis consists of two enzymatic reactions. The first is a fatty acyl chain transfer from membrane phospholipids to a phosphatidylethanolamine, resulting in the formation of N-acylphosphatidylethanolamine (NAPE), by a yet-unidentified Ca2+-dependent N-acyltransferase (NAT) [9], or by a Ca2+-independent counterpart (iNAT) [10]. The second step is catalyzed by a NAPE-specific type D phospholipase (NAPEPLD) that is the most relevant enzyme among multiple players in AEA formation from NArPE [9, 10], as shown in Fig. 1.
O
ABHD4
HO CH O O P O O
Glycero-p-AEA
NAT
O O C R1 O R2 C O CH O O P O O−
OH
1
Phospholipids
O O P O X O−
O
PLA2
N H
PLC O N H
Phospho-AEA
O
OCR1 HO CH O O P O
NArPE O N H
OCOR O CH
O O P O OH
NAPE-PLD
Phosphatase
GDE-1
O N H
O−
−
Lyso-NArPE Lyso-PLD
O N H
OH
OH
N H HO
5- LOX
COX-2 FAAH NAAA
OH
N H
N H
AEA
11-HETE-EA O
H N
O
PGH2-EA
OH
12- LOX
O
H N
O OH
12-HETE-EA 15- LOX N H OH
15-HETE-EA
Arachidonic acid
OH H2N
OH
5,6 EET-EA
OH
O
O
OH
O
O
O
Cyt P450 O
O
OH
HO HO
OH O
OH
O OH
HN
Ethanolamine O OH
OH
PGD2-EA
OH
HO
PGE2-EA
H N
OH
PGF2-EA
Fig. 1 Alternative biosynthetic, degradative, and oxidative pathways of AEA and congeners. AA arachidonic acid, ABHD4 α/β-hydrolase domain 4, pAEA phospho-AEA, COX-2 cyclooxygenase-2, Cyt P450 cytochrome P450, EET-EA epoxyeicosatrienoyl ethanolamides, EtNH2 ethanolamine, FAAH fatty acid amide hydrolase, GP-AEA glycerophospho-AEA, GDE1 glycerophosphodiester phosphodiesterase 1, 12-HAEA 12-hydroxyanandamide, 12-LOX 12-lipoxygenase, NAAA N-acylethanolamine-hydrolyzing acid amidase, NAPE-PLD N-acyl-phosphatidyl ethanolamine-hydrolyzing phospholipase D, NAT N-acyltransferase, iNAT Ca2+-independent N-acyltransferase, lyso-NArPE lyso-N-arachidonoylphosphatidylethanolamine, NArPE N-arachidonoylphosphatidylethanolamine, pNArPE N-arachidonoylethanolamine plasmalogen, PLA2 phospholipase A2, PLC phospholipase C, lyso-PLD lyso-phospholipase D, PMF2α prostamides F2α, PTPN22 protein tyrosine phosphatase, non-receptor type 22
4
Mauro Maccarrone
O
OCOR1 O CH
Phospholipids
PLC
O
O O P O X O−
PLA1
O
OCOR1 O CH
OH O CH
O O P O− O−
OH
DAG
2-AG-3P O OH
DAGL
O
O
2-AG
OH
O
PLC
OH
COX-2
OH
FAAH MAGL ABHD6 ABHD12
15- LOX O
OH OH
O
OH OH
OH
O
HO O
11-HETE-G
OH O
15-HETE-G
PGH2-G
OH O
OH OH
O
O
12-HETE-G O
O
O
12- LOX
OH
O OH
O
HO OH
PGE2-G
OH OH
O
OH
OH
Arachidonic acid
OH
O HO
OH
HO
OH HO
15-HETE-G
O
Glycerol
OH OH
OH OH
PGF2-G OH OH
O O
OH
PGD2-G
Fig. 2 Alternative biosynthetic, degradative, and oxidative pathways of 2-AG and congeners. AA arachidonic acid, 2-AG-3P 2-arachidonoylglycerol-3-phosphate, COX-2 cyclooxygenase-2, DAG diacylglycerol, DAGL diacylglycerol lipase, 12-HETE-G 12-hydroxy-arachidonoyl-glycerol, ABHD6/12 α/β-hydrolase domain 6/12, 12LOX 12-lipoxygenase, MAGL monoacylglycerol lipase, PLC phospholipase C, PLCβ phospholipase Cβ, PGE2-G prostaglandin glycerol E2-G
As for the biosynthesis of 2-AG and congeners, the best known biosynthetic pathway requires the combined action of phospholipase C (PLC) and diacylglycerol lipase (DAGL that is present in two forms, α and β) [11], but alternative pathways of 2-AG biosynthesis are also known, as shown in Fig. 2. Degradation of eCBs and congeners can start with their transmembrane uptake, a process that remains highly debated because true “eCBs membrane transporters (EMT)” have not yet been cloned; however, EMT activity and pharmacological inhibition have been repeatedly described [12]. Once inside the cell, eCBs are hydrolyzed to terminate signal transduction. The main catabolic enzyme of AEA is fatty acid amide hydrolase (FAAH) [13], a widely distributed intracellular membrane-bound serine hydrolase [14]. An additional lysosomal cysteine hydrolase termed
Investigating Endocannabinoid Signaling
5
N-acylethanolamine-hydrolyzing acid amidase (NAAA) is also known [15], and cleaves AEA and congeners under acidic conditions (Fig. 1). As for 2-AG and congeners, monoacylglycerol lipase (MAGL) is the main responsible for their degradation, along with two additional serine hydrolases, known as α/β-hydrolase domain 6 and 12 (ABHD6 and ABHD12) [16]. Moreover, the oxidative metabolism of eCBs has (patho)physiological relevance, because it leads to the production of new biologically active metabolites [17]. In particular, AEA and 2-AG are metabolized by lipoxygenases (LOXs) [18] and by cyclooxygenase-2 (COX-2) [17–19], and additionally AEA can be oxygenated also by cytochrome P450 [20], as shown in Figs. 1 and 2. Incidentally, it should be stressed that an emergent issue is how eCBs can reach their distinct sites of action within the cell (e.g., membrane or nuclear receptors, or metabolic enzymes) at the right time and at the right concentration, in order to trigger the appropriate response to a stimulus [21]. In this context, the existence of intracellular storage organelles (adiposomes or lipid droplets) [22], as well as of constitutive intracellular transporters (AEA intracellular transporters, AITs), has been reported for AEA [2]. A functional role for these AITs in eCB signaling has been recently documented [23], providing a proof of concept that indeed they can drive eCBs towards distinct transduction pathways. This is particularly striking in the central nervous system, where at each synapse distinct ECS elements in different neuronal and non-neuronal cells contribute to proper neurotransmission [24, 25]. The same complexity in other organs of our body (e.g., cardiovascular, digestive, musculoskeletal, immune, and reproductive systems) has been the subject of a comprehensive review [26]. Finally, strong pharmacological and biochemical evidence has demonstrated that eCBs are able to interact also with nonCB1/non-CB2 receptors, further increasing the complexity of the ECS and of the signaling pathways trigged thereof (Fig. 3). In particular, the best known of these targets is the transient receptor potential vanilloid type 1 (TRPV1) channel, which is activated by both AEA [27] and 2-AG [28]. Other potential receptors activated by eCBs are peroxisome proliferator‐activated receptor (PPAR) α and γ [29], and the orphan G protein‐coupled receptor GPR55 [30]. In Table 1 old and new members of the ECS are listed together. Unsurprisingly, ECS has been shown to regulate different physiological processes in the central nervous system [2–4] and at the periphery [26], thereby suggesting that its signaling may foster the development of pathway-selective drugs for therapeutic benefit [2–4].
6
Mauro Maccarrone
eCBs CB /CB /GPR55 1 2
TRPV1
eCBs (+) [Ca2+]i
(+) cPLA2
(+) caspases
(-) or (+) AC
(+) cytochrome c release
(+) MAPK and FAK
(+) mitochondrial uncoupling
(+) K+ channels
(+) pro-apototic kinases
(-) Ca2+ channels
eCBs
inside
PPARs
(+) or (-) iNOS (+) cdc42/rac1/rho
nucleus
outside (+) Genes involved in energy homeostasis and inflammation
Fig. 3 Signal transduction pathways triggered by endocannabinoids through their main target receptors. AC adenylyl cyclase, CB1 type-1 cannabinoid receptor, CB2 type-2 cannabinoid receptor, cPLA2 cytosolic phospholipase A2, eCBs endocannabinoids, FAK focal adhesion kinase, GPR55 orphan G protein‐coupled receptor 55, MAPK mitogen-activated protein kinase, iNOS inducible nitric oxide synthase, PPARs peroxisome proliferator‐activated receptors, TRPV1 transient receptor potential vanilloid type 1 channel
2
Conclusions Taken together, it appears all the more important to develop methods and protocols that allow to properly assay activity and location of the different ECS elements, possibly with specifications that make the same method fully effective in different cells, tissues, and organisms. For most ECS elements reliable methods are indeed available, and will be presented in this theme issue on “Endocannabinoid signaling: Methods and protocols” by those who developed and/or improved them over the last few years. Such a book is a manual that puts together all current methodologies to investigate eCB signaling in a timely manner. Thus, I believe that it will help chemists, drug designers, biochemists, molecular biologists, cell biologists, pharmacologists, and (electro)physiologists to successfully navigate with appropriate tools the mare magnum of eCB research.
Investigating Endocannabinoid Signaling
7
Acknowledgements I like to thank Dr. Filomena Fezza and Monica Bari (Tor Vergata University of Rome, Rome, Italy) for kindly preparing the artwork. This investigation was partly supported by funding from the Italian Ministero dell’Istruzione, dell’Università e della Ricerca (grant PRIN 2010-2011). References 1. Pertwee RG, Howlett AC, Abood ME et al (2010) International union of basic and clinical pharmacology. LXXIX. Cannabinoid receptors and their ligands: beyond CB1 and CB2. Pharmacol Rev 62:588–631 2. Maccarrone M, Guzmán M, Mackie K et al (2014) Programming of neural cells by (endo) cannabinoids: from physiological rules to emerging therapies. Nat Rev Neurosci 15:786–801 3. Di Marzo V, Stella N, Zimmer A (2015) Endocannabinoid signalling and the deteriorating brain. Nat Rev Neurosci 16:30–42 4. Di Patrizio NV, Piomelli D (2012) The thrifty lipids: endocannabinoids and the neural control of energy conservation. Trends Neurosci 35:403–411 5. Artmann A, Petersen G, Hellgren LI et al (2008) Influence of dietary fatty acids on endocannabinoid and N-acylethanolamine levels in rat brain, liver and small intestine. Biochim Biophys Acta 1781:200–212 6. Lucanic M, Held JM, Vantipalli MC et al (2011) N-acylethanolamine signalling mediates the effect of diet on lifespan in Caenorhabditis elegans. Nature 473:226–229 7. Brown I, Cascio MG, Wahle KW et al (2010) Cannabinoid receptor-dependent and -independent anti-proliferative effects of omega-3 ethanolamides in androgen receptor-positive and -negative prostate cancer cell lines. Carcinogenesis 31:1584–1591 8. Fezza F, Bari M, Florio R et al (2014) Endocannabinoids, related compounds and their metabolic routes. Molecules 19: 17078–17106 9. Ueda N, Tsuboi K, Uyama T (2013) Metabolism of endocannabinoids and related N-acylethanolamines: canonical and alternative pathways. FEBS J 280:1874–1894 10. Jin XH, Uyama T, Wang J et al (2009) cDNA cloning and characterization of human and mouse Ca(2+)-independent phosphatidylethanolamine N-acyltransferases. Biochim Biophys Acta 1791:32–38
11. Bisogno T, Howell F, Williams G et al (2003) Cloning of the first sn1-DAG lipases points to the spatial and temporal regulation of endocannabinoid signaling in the brain. J Cell Biol 163:463–468 12. Chicca A, Marazzi J, Nicolussi S et al (2012) Evidence for bidirectional endocannabinoid transport across cell membranes. J Biol Chem 287:34660–34682 13. McKinney K, Cravatt BF (2005) Structure and function of fatty acid amide hydrolase. Annu Rev Biochem 74:411–432 14. Fezza F, De Simone C, Amadio D et al (2008) Fatty acid amide hydrolase: a gate-keeper of the endocannabinoid system. Subcell Biochem 49:101–132 15. Tsuboi K, Takezaki N, Ueda N (2007) The N-acylethanolamine-hydrolyzing acid amidase (NAAA). Chem Biodivers 4:1914–1925 16. Blankman JL, Simon GM, Cravatt BF (2007) A comprehensive profile of brain enzymes that hydrolyze the endocannabinoid 2-arachidonoylglycerol. Chem Biol 14:1347–1356 17. Rouzer CA, Marnett LJ (2011) Endocannabinoid oxygenation by cyclooxygenases, lipoxygenases, and cytochromes P450: cross-talk between the eicosanoid and endocannabinoid signaling pathways. Chem Rev 111:5899–5921 18. Van der Stelt M, van Kuik JA, Bari M et al (2002) Oxygenated metabolites of anandamide and 2-arachidonoylglycerol: conformational analysis and interaction with cannabinoid receptors, membrane transporter, and fatty acid amide hydrolase. J Med Chem 45:3709–3720 19. Funk CD (2001) Prostaglandins and leukotrienes: advances in eicosanoid biology. Science 294:1871–1875 20. Snider NT, Walker VJ, Hollenberg PF (2010) Oxidation of the endogenous cannabinoid arachidonoyl ethanolamide by the cytochrome P450 monooxygenases: physiological and pharmacological implications. Pharmacol Rev 62:136–154
8
Mauro Maccarrone
21. Maccarrone M, Dainese E, Oddi S (2010) Intracellular trafficking of anandamide: new concepts for signaling. Trends Biochem Sci 35:601–608 22. Oddi S, Fezza F, Pasquariello N et al (2008) Evidence for the intracellular accumulation of anandamide in adiposomes. Cell Mol Life Sci 65:840–850 23. Kaczocha M, Vivieca S, Sun J et al (2012) Fatty acid-binding proteins transport N-acylethanolamines to nuclear receptors and are targets of endocannabinoid transport inhibitors. J Biol Chem 287:3415–3424 24. Mechoulam R, Hanuš LO, Pertwee R et al (2014) Early phytocannabinoid chemistry to endocannabinoids and beyond. Nat Rev Neurosci 15:757–764 25. Soltesz I, Alger BE, Kano M et al (2015) Weeding out bad waves: towards selective cannabinoid circuit control in epilepsy. Nat Rev Neurosci 16:264–277
26. Maccarrone M, Bab I, Bíró T et al (2015) Endocannabinoid signaling at the periphery: 50 years after THC. Trends Pharmacol Sci 36:277–296 27. Di Marzo V, De Petrocellis L (2010) Endocannabinoids as regulators of transient receptor potential (TRP) channels: A further opportunity to develop new endocannabinoidbased therapeutic drugs. Curr Med Chem 17:1430–1449 28. Zygmunt PM, Ermund A, Movahed P et al (2013) Monoacylglycerols activate TRPV1-a link between phospholipase C and TRPV1. PLoS One 8, e81618 29. Pistis M, Melis M (2010) From surface to nuclear receptors: the endocannabinoid family extends its assets. Curr Med Chem 17:1450–1467 30. Ross RA (2009) The enigmatic pharmacology of GPR55. Trends Pharmacol Sci 30: 156–163
Chapter 2 Extraction and Simultaneous Quantification of Endocannabinoids and Endocannabinoid-Like Lipids in Biological Tissues Laura Bindila and Beat Lutz Abstract Extraction and quantification of endocannabinoids (eCBs) from biological tissues are essential to unravel their changes in physiological and pathophysiological conditions. We describe here an analytical protocol for extraction of endocannabinoids, anandamide (AEA) and 2-arachidonoyl glycerol (2-AG), endocannabinoid-like lipids such as palmitoyl ethanolamide (PEA) and oleoyl ethanolamide (OEA), as well as arachidonic acid (AA) from biological tissues using liquid-liquid extraction method and simultaneous quantification by liquid chromatography multiple reaction monitoring (LC/MRM). Key words Endocannabinoids, Endocannabinoid-like lipids, Liquid-chromatography, Multiple reaction monitoring, Lipid extraction
1
Introduction The endocannabinoids (eCBs), anandamide (AEA) and 2-arachidonoyl glycerol (2-AG), and endocannabinoid-like lipids such as palmitoyl ethanolamide (PEA) and oleoyl ethanolamide (OEA) are bioactive lipids originating from the degradation of phospholipids and serve themselves as substrate to other bioactive lipids, such as the large family of lipid signaling molecules of the prostaglandin class. The endocannabinoid (eCB) system is involved in the regulation of a multitude of physiological and pathophysiological mechanisms in central and peripheral nervous system, immune system and peripheral organs, and is recognized as potential therapeutic target system. Accordingly, the determination of the spatial and temporal dynamics of the eCB levels of various physiological and pathophysiological states in various biological matrices has become a relevant goal in (pre)clinical research. Mass spectrometry (MS) is nowadays the core technology in molecular characterization of biological matrices, and has been in
Mauro Maccarrone (ed.), Endocannabinoid Signaling: Methods and Protocols, Methods in Molecular Biology, vol. 1412, DOI 10.1007/978-1-4939-3539-0_2, © Springer Science+Business Media New York 2016
9
10
Laura Bindila and Beat Lutz
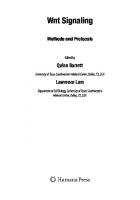
fact the crucial technology in discovery and quantification of endocannabinoids. Advances in the MS technology, particularly in MS-based quantitative assay using liquid chromatography (LC) coupled to multiple reaction monitoring (MRM), have allowed fast and so far the most sensitive quantitative assay for eCBs in various biological matrices, tissues, cells, and biological fluids [1–3]. Main challenges associated with quantification of eCBs stem from their originally low concentration in biological matrices, the diversity of biological matrices where they are present, and their rapidly changing levels during and post sample isolation through ex vivo degradation and synthesis, and chemical modification such as isomerization and oxidation. Such artificial changes in the eCB levels readily occur due to small variations in temperature and time of tissue sampling and handling, materials and equipment for tissue processing, and extraction conditions, making the comparative studies as well as inter- and intra-laboratory reproducibility challenging. Here we describe an analytical protocol for simultaneous profiling of AEA and 2-AG, 1-AG, PEA, OEA, and AA using liquidliquid extraction and quantitative assessment by LC/MRM. This protocol is amenable for a variety of biological tissues originating from brain, peripheral organs, bones, fat tissues, and muscles in terms of (a) tissue handling and extraction of eCBs with minimum and controlled ex vivo alteration of their levels, (b) inter- and crossstudy reproducibility of the quantitative eCB data, (c) easy adaptability to various type, size, texture, and composition of tissues, and (d) amenability to higher throughput processing [4–7] (Fig. 1).
5.0e6 Intensity. cps
2-AG-d5 4.0e6 3.0e6 PEA-d4 2.0e6
AEA-d4
1-AG-d5 2-AG
1.0e6 AEA 0.0
4.2
4.4
OEA PEA OEA-d2
1-AG
4.6 4.8 Time, min
5.0
5.2
5.4
Fig. 1 Schematic representation of the analytical workflow for extraction and quantification of AEA, 2-AG, 1-AG, PEA, OEA, and AA
Quantification of Endocannabinoids
2
11
Materials Prepare all solutions for extraction of eCBs and LC/MRM analysis using LC/MS-grade water and solvents. Use only freshly prepared solutions.
2.1 Tissue Extraction Components
1. Homogenization solution: 0.1 M Formic acid. 2. Extraction solution: Ethylacetate/n-hexane (9:1; v/v). 3. Extraction tubes: 1.2 ml Strips (see Note 1). 4. 1.5 ml Tubes for recovery of the lipid extracts (see Note 2). 5. Steel balls (see Note 3). 6. Precision balance maintained at 4 °C. 7. Evaporator. 8. Tissue lyser. 9. Centrifuge. 10. Vortex.
2.2 eCB Internal Standards and Calibration Standards
1. Deuterated standards: AEA-d4, 2-AG-d5, AA-d8, OEA-d2, PEA-d4, 1-AG-d5. Aliquot the original samples in acetonitrile and store at −20 °C (see Note 4).
2.3
1. LC solvents: Solvent A 0.1 % formic acid in water; solvent B 0.1 % formic acid in acetonitrile.
LC/MRM
2. Standard: AEA, 2-AG, AA, OEA, PEA, 1-AG. Aliquot the original samples in acetonitrile and store at −20 °C (see Note 5).
2. LC glass vials with siliconized inserts (see Note 6). 3. LC column: 2.5 μm C18(2)-HST column, 100 mm × 2 mm, combined with a pre-column (C18, 4 mm × 2 mm). 4. Autosampler maintained at 4 °C. 5. LC instrument. 6. 5500 QTrap triple-quadrupole linear ion trap mass spectrometer equipped with a Turbo V Ion Source (AB SCIEX) and polarity switching mode or another triple-quadrupole mass spectrometer. 7. LC quality control sample: Mix deuterated eCB standards and standard eCBs to an equimolar mixture in acetonitrile/water (1:1, v/v). Store at −20 °C before use. 8. Acetonitrile/water solution (1:1, v/v), prepare fresh and maintain at 4 °C. 9. Acetonitrile/isopropanol solution (1:1, v/v), prepare fresh and maintain at 4 °C.
12
2.4
Laura Bindila and Beat Lutz
BCA
1. Fluostar instrument. 2. BCA working reagent and calibrants. 3. BCA well plates. 4. 1.5 ml Tubes.
3
Methods
3.1 Tissue Isolation and Pre-processing
1. Isolate the tissue according to its source within the same time frame for all samples to be investigated (see Note 7). 2. If necessary to dissect tissue or remove specific (sub)areas of tissues, or perform punches, carry out this step on ice or at cold temperature (see Note 8). 3. Use precooled 1.5 or 2 ml tubes to transfer the tissue following sampling. 4. Snap freeze immediately the tissue and store at −80 °C (see Note 9).
3.2 Preliminary Steps for Extraction of eCBs from Tissues
1. Equilibrate extraction tubes to 4 °C for 30 min. 2. Equilibrate balance at 4 °C and calibrate. 3. Precool centrifuge at 4 °C. 4. Prepare fresh homogenization and extraction solution, cool, and keep at 4 °C. 5. Place tubes containing the frozen tissue on dry ice. 6. Cool steel balls at 4 °C.
3.3
Tissue Weighing
1. Tare the cooled extraction tubes on balance (see Note 10). 2. Transfer the frozen tissue from the original tubes to the extraction tubes and weigh (see Notes 11 and 12). 3. Place the extraction tubes containing the weighed tissue immediately on dry ice.
3.4 Extraction of eCBs
1. Prepare spiking solution of deuterated internal standards: Set the target concentration of each internal standard in the final extracts (50 μl) for LC/MRM analysis. Prepare a mixture of deuterated eCB standards in acetonitrile to a 20 times higher concentration than the target concentration in the final extracts for LC/ MRM. The volume of spiking solution needed is 50 μl × no. of samples + no. of calibration solutions × 50 μl. Keep the spiking solution at 4 °C till extraction of samples (see Note 13). 2. Add cold steel balls in the extraction tubes. 3. Dilute 1:20 in acetonitrile a volume of spiking solution corresponding to 50 μl × no. of samples. Perform this step on ice.
Quantification of Endocannabinoids
13
4. Accurately pipette 50 μl of the diluted cold spiking solution to each sample. 5. Add 500 μl of cold homogenization solution, followed by 300 μl cold extraction solution (see Note 14). 6. Place the extraction tubes in tissue lyser holder and prepare a counterbalance plate. 7. Homogenize without delay in tissue lyser. Typical settings for homogenization: one cycle of 30 s at 30 Hz (see Note 15). 8. Transfer immediately the extraction tubes from tissue lyser to precooled (4 °C) centrifuge. 9. Centrifuge the extraction tubes for 10 min at 8000 × g, at 4 °C. 10. Transfer the extraction tubes in a precooled metal rack and place them at −20 °C for 10–30 min to freeze the lower aqueous phase. 11. Recover the organic phase into 1.5 ml tubes. These tubes will contain the lipid extracts. 12. Place the tubes containing the organic phase into pre-set evaporator at 37 °C and evaporate to dryness. These tubes will contain the extracted lipids, e.g., eCBs (see Note 16). 13. Store the remaining aqueous phase from step 10 at −20 °C (see Note 17). 3.5
LC/MRM
1. Calibration curve solutions: Prepare fresh, on the day of analysis, a mixture of standard eCBs in acetonitrile in an LC glass vial. Pipette increasing volumes of this standard eCB mixture into LC glass vials in order to create a calibration curve. Add 50 μl of spiking solution of internal standards (see Subheading 3.4) to each vial and complement with appropriate volume of acetonitrile up to 500 μl and then add 500 μl of water in each vial to make up for 1 ml each calibration solution (see Note 18). 2. Accurately pipette cold 50 μl acetonitrile/water into the tubes containing the dry lipid extracts. 3. Vortex for 30 s at room temperature. 4. Centrifuge for 3 min at 10,000 × g at 4 °C. 5. Transfer 30 μl of the sample solutions from tubes into LC glass inserts, placed into LC glass vials, and close with open lid caps (see Note 19). 6. Place the sample-containing LC vials and the vials containing calibration standards into autosampler maintained at 4 °C. 7. Set the following conditions for LC/MRM method (see Note 20): LC gradient: Increase acetonitrile containing 0.1 % formic acid over 2 min from 55 to 90 %, and maintain it at 90 % for 5.5 min.
14
Laura Bindila and Beat Lutz
LC flow rate: 300 μl/min. LC injection volume: 20 μl; use pre- and post-syringe cleaning. Ion source: +4800 V for positive ion mode, −4500 V for negative ion mode; curtain gas: 40; temperature (TEM): 550 °C; ion source gas 1 and 2: 50; polarity switching time: 50 ms. MRM transitions in positive ion mode: AEA, m/z 348.3 to m/z 62.1; AEA-d4, m/z 352.3 to m/z 62.1; 2-AG, m/z 379.1 to m/z 287.2; 2-AG-d5, m/z 384.2 to m/z 287.2; PEA, m/z 300.2 to m/z 62.1; PEA-d4, m/z 304.2 to m/z 62.1; OEA, m/z 326.2 to m/z 62.1; OEA-d2, m/z 328.2 to m/z 62.1. Compound parameters in positive ion mode: EP: 10 V; dwell time: 20 ms; DP: 70 V; CE: for AEA, AEA-d4, 2-AG, 2-AGd5 22 V, for OEA, PEA, PEA-d4 21 V and for OEA-d2 23 V; CXP: for AEA, AEA-d4 9 V, for 2-AG, 2-AG-d5 30 V, for OEA, OEA-d2, PEA, PEA-d4 10 V. MRM transitions negative ion mode AA, m/z 303.05 to m/z 259.1; AA-d8, m/z 311.04 to m/z 267.0. Compound parameters in negative ion mode: EP: −10 V; dwell time: 50 ms; DP: −200 V; CE: −19 V; CXP: −12 V. 8. Equilibrate the LC/MRM system with the instrument default method for equilibration, for 2–5 min. 9. Equilibrate LC/MRM system with the method for eCB analysis for 5–10 min. 10. Verify the performance of the LC/MRM using the LC quality control sample. 11. Write a sample batch for LC/MRM analysis. A minimum of three calibration curves are necessary: one at the beginning of the batch, one in the middle of the batch, and one at the end of the batch. Place a wash run before and after every calibration curve. For the wash run inject 20 μl of acetonitrile/isopropanol (1:1, v/v). Run regularly LC quality control samples (it can also be a calibration solution) between samples without pre- or post-quality control wash run. Run minimum five washes: by injecting 20 μl of acetonitrile/ isopropanol (1:1, v/v) after batch analysis, followed by control sample of the system (see Note 21). 12. Following analysis remove the LC glass vials containing the samples from the autosampler, replace the open lid caps with closed lid caps, and store the remaining solution at −20 °C. 13. Quantify the data using the Analyst software. 14. Import the Analyst-calculated concentrations of eCBs into an Excel sheet. Input the tissue weight and/or protein amount corresponding to every sample and normalize the values of the Analyst-calculated concentrations of eCBs to tissue weight and/or protein content.
Quantification of Endocannabinoids
15
15. Perform statistical analysis when sample groups are to be compared. 3.6
BCA Assay
1. Remove the extraction tubes containing the aqueous phase from −20 °C and let it thaw for 30 min. 2. Dilute 1:10 a volume of 20 μl aqueous phase and run BCA assay according to the provider’s instructions. Repeat the measurement with another dilution rate if the protein values are out of range. 3. Retrieve and store the protein concentration data.
4
Notes 1. 2 ml Precellys tubes can alternatively be used when the tissue samples are large and do not fit into the 1.2 ml strips. 2. When processing more samples, in our hands more than 20, we use microtiter plates or deep well plates to increase the speed of pipetting. 3. Even though one steel ball can be used, we find it more effectively to use small steel balls for homogenization with the tissue lyser. Ceramic beads can alternatively be used. 4. We typically dilute the deuterated standards as obtained from provider in acetonitrile and further aliquot. To avoid isomerization or other chemical modifications we do not thaw and freeze these aliquots for multiple use, but use them one time for tissue extraction. 5. We typically dilute the standards as obtained from provider in acetonitrile and further aliquot. To avoid isomerization or other chemical modifications we do not thaw and freeze these aliquots for multiple use, but use them one time for tissue extraction. 6. When processing more than 20 samples we use coated (e.g., silic-onized) microtiter or deep well plates for LC/MRM analysis to increase the speed of pipetting. Moreover, the storage of the rest samples post-analysis is more space effective. 7. Because postmortem alteration of eCB levels is readily occurring it is essential that tissue sampling is as fast as possible, irrespective of the tissue origin, to prevent such alterations. Moreover, for reliable comparative studies and minimum variability in the eCB levels due to tissue sampling procedure, the time required for sampling has to be equal for all samples to be compared in one or more biological replicate analysis. 8. When tissue dissection or isolation of specific subregions of tissues is necessary, place the original tissue directly on ice to perform such isolation. Also, any transport of the tissue from
16
Laura Bindila and Beat Lutz
one bench or lab to another has to be carried out on ice. For tissues such as brain, we typically freeze the entire brain at −80 °C prior to dissection, and then for brain region isolation we thaw the brain on ice and perform the isolation at 4 °C. This way the time and temperature conditions necessary to perform region isolation can be controlled to be similar and short for all samples to be compared to prevent variability in the rate of ex vivo synthesis/degradation of eCBs. 9. For tissue samples where multiple types of analysis has to be carried out from the same tissue source, but precluding pitfalls due to tissue heterogeneity, we pulverize the tissue and split for the corresponding analysis. When the tissue samples are hard tissues such as bone, or fibrous tissues such as heart and lungs, we cut the tissue in smaller pieces while frozen using a steel scissors or cutter to enhance the homogenization step. 10. Place the balance in the cold room to carry out the weighing or use a balance with a temperature control, maintaining it at 4 °C to avoid tissue thawing. Also, make sure that you do not hold the tubes in your hands more than necessary to avoid thawing of the tissue. The tissue weighing is time consuming, when analyzing large number of samples. We do weigh the tissue only if the biological question specifically requires normalization of the eCB values to tissue weight, or when reference/comparison to previously published data on eCB levels/tissue weight is necessary (see Note 17). 11. For larger tissues, we reduce the tissue sample by cutting or by pulverization and splitting the sample. We typically do not process tissue samples larger than 30 mg using this extraction method. This is due to increased difficulty for lipid-proteinphase separation under the limited volume of homogenization and extraction solvent used for these tubes and additionally because the homogenization becomes often ineffective, or requires too many homogenization cycles that lead to temperature increase in the sample, hence ex vivo eCB level alteration. 12. For very small tissues, such as biopsies or punches, we do not weigh the tissue at all, because it leads to fast, uncontrollable thawing during handling, which in turn leads to ex vivo degradation/synthesis of the eCBs and consequently to large variability in the eCB levels. In such cases, protein content (determined by a protein assay of the aqueous phase, see below extraction procedure) will be used to normalize the eCB values. 13. The target concentration of the internal standards in the final extracts is set based on preliminary tests on reference tissues. We typically use a target concentration of deuterated standards corresponding to the middle calibration curve of the LC/ MRM, which in turn is tailored using reference tissue to encompass the reference values of eCB levels for the tissue type under investigation.
Quantification of Endocannabinoids
17
14. Irrespective of the tissue type, we invariably perform tissue lysis/homogenization with extraction solvent included. In our hands, this gave the highest abundance of the endogenous eCBs in LC/MRM analysis, possibly due to a more effective release of eCBs from their location in the tissue. 15. Visually inspect the homogenized samples after one cycle and assess if pieces of tissue are still visible. If so, repeat for one or two cycles of homogenization. Homogenization and extraction solvent volume can additionally be added, if the phase separation is not appropriate that is usually the case for very large samples. 16. If not possible to analyze immediately the samples by LC/ MRM, store the dried extracts at −20 °C. 17. The aqueous phase can be used to determine the protein content of the tissue by a protein assay and normalize the eCB values to this content (see also Note 12) as an alternative to weight for small tissue samples such as biopsies and punches. We typically use normalization to protein content because of increased throughput possible, as compared to weighing. 18. The calibration curve range is tailored to the tissue type using reference tissue. We use the eCB levels determined in a reference. 19. We typically transfer 30 μl of the extracts into LC vials or well plates for analysis. The leftover 20 μl of extracts are immediately frozen and stored at −20 °C for an additional analytical replicate if necessary, or can be used for additional analysis in another ionization mode, if polarity switching is not available on the mass spectrometer. 20. The parameters and conditions for LC/MRM are valid for the lab equipment mentioned here. For other MS, LC instruments, or other LC column provider type all these settings have to be optimized accordingly. When polarity switching mode is not available, you can use the rest of the eCB extract to analyze the sample in the additional ionization mode. 21. Typically, we run a quality control every 20 biological samples and a calibration curve every 40 biological samples.
Acknowledgments This work has been financially supported by Collaborative Research Unit of the German Research Council FOR926 (central project CP1) and BMBF collaborative project LOGIN. We thank Claudia Schwitter, Raissa Lerner, and Julia Post for technical support in establishing the protocols.
18
Laura Bindila and Beat Lutz
References 1. Zoerner AA, Gutzki FM, Batkai S et al (2011) Quantification of endocannabinoids in biological systems by chromatography and mass spectrometry: a comprehensive review from an analytical and biological perspective. Biochim Biophys Acta 1811:706–723 2. Buczynski MW, Parsons LH (2010) Quantification of brain endocannabinoid levels: methods, interpretations and pitfalls. Br J Pharmacol 160: 423–442 3. Lerner R, Lutz B, Bindila L (2013) Tricks and tracks in the identification and qualification of endocannabinoids. eLS. Wiley, Chichester. doi:10.1002/9780470015902.a0023407 4. Duerr GD, Heinemann JC, Gestrich C et al (2014) Impaired border zone formation and adverse remodeling after reperfused myocardial
infarction in cannabinoid CB2 receptor deficient mice. Life Sci 14:324–325 5. Lomazzo E, Bindila L, Remmers F et al (2015) Therapeutic potential of inhibitors of endocannabinoid degradation for the treatment of stressrelated hyperalgesia in an animal model of chronic pain. Neuropsychopharmacology 40:488–501 6. Jergas B, Schulte K, Bindila L et al (2014) O-2050 facilitates noradrenaline release and increases the CB1 receptor inverse agonistic effect of rimonabant in the guinea pig hippocampus. Naunyn Schmiedebergs Arch Pharmacol 387:621–628 7. Wenzel D, Matthey M, Bindila L et al (2013) Endocannabinoid anandamide mediates hypoxic pulmonary vasoconstriction. Proc Natl Acad Sci U S A 110:18710–18715
Chapter 3 Determination of 2-Arachidonoylglycerol by μSPE-LC-MS/MS Natalia Battista and Manuel Sergi Abstract LC-MS/MS is a powerful analytical technique that provides unequivocal identification and reliable quantification of the analytes, using Selected Reaction Monitoring or Multi Reaction Monitoring acquisition mode. 2-Arachidonoylglycerol (2-AG) is the most abundant endocannabinoid, which plays a major role in a wide variety of physiological and pathological processes. Analysis of 2-AG by means of LC-MS/MS allows the detection of very low concentrations in biological samples. Here, we describe how to determine 2-AG levels in tiny samples of tissues and plasma through LC-MS/MS, by using very quick and easy to perform extraction procedures, with reduced solvent consumption. Key words 2-AG, μSPE, LC-MS/MS, Plasma, Tissue
1
Introduction High-performance liquid chromatography (HPLC) is a wellestablished separation technique that is able to solve numerous analytical problems. Several developments have been done recently to improve HPLC performance, the most important possibly being Ultra High Performance Liquid Chromatography (UHPLC or UPLC) [1, 2]. Yet, due to the cost of UPLC hardware, chromatographic research addressed to improve HPLC performance in terms of faster separation and efficiency. Thus, when UPLC is not available, alternative devices and technologies have been developed for fast chromatography: high-temperature liquid chromatography (HTLC), and use of monolithic supports or of column with superficially porous packing materials based on silica particles with nonporous cores [3]. The latter solution is very interesting, because it allows obtaining high efficiency with common HPLC devices. Liquid chromatography–mass spectrometry or tandem mass spectrometry (LC-MS or LC-MS/MS) is largely replacing gas chromatography (GC)-MS in most biomedical applications, as
Mauro Maccarrone (ed.), Endocannabinoid Signaling: Methods and Protocols, Methods in Molecular Biology, vol. 1412, DOI 10.1007/978-1-4939-3539-0_3, © Springer Science+Business Media New York 2016
19
20
Natalia Battista and Manuel Sergi
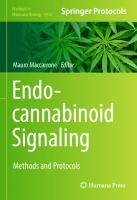
they do not require derivatization steps and are capable of simultaneous determination in a single analysis with reduced sample pretreatment [4]. Moreover, MS/MS is considered necessary to provide unequivocal identification and quantification of analytes, due to the high selectivity of the MS detector [5]. The quadrupole is the most common mass analyzer, due to its cheapness and high performance allowed by high efficiency transmission. The first implementation of a two-dimensional MS (MS/MS or MS2) was obtained with a triple quadrupole mass analyzer that is nowadays the most common device. The first and third (Q1 and Q3) quadrupoles are separative, and the second (Q2) is usually a collision cell, where the ions can be fragmented, as depicted in Fig. 1. MS2 enables the reduction of background noise and increase in selectivity, two features that also allow different types of experiments: Full Scan (FS), Selected Ion Monitoring (SIM), Product Ion Scan (PIS), Precursor Ion Scan, Selected Reaction Monitoring or Multi Reaction Monitoring (SRM or MRM), the latter being most widely used for the confirmatory analysis of target molecules. LC and MS coupling is not straightforward, as chromatographic separation occurs with neutral molecules in high operating pressure solution, while MS responds to ions in the gas phase and requires deep vacuum [6]. The most widely used technique is electrospray ionization (ESI), which is suitable for the analysis of medium to highly polar compounds. Atmospheric pressure chemical ionization (APCI) is more efficient for nonpolar (hydrophobic) analytes, which do not readily form ions in solution [7]. Instead, thermally labile compounds may decompose in the ionization source, since APCI requires a heated nebulizer [7].
Fig. 1 Schematic description of a triple quadrupole mass spectrometer: first quadrupole (Q1), second quadrupole (Q2), which acts as a collision cell, and third quadrupole (Q3)
2-AG Analysis
21
2-Arachidonoylglycerol (2-AG) is the most abundant endocannabinoid, identified for the first time in brain tissues [8]. 2-AG plays a major role in a wide variety of physiological and pathological processes [9]. The measurement of circulating levels of 2-AG in several biological matrices, including also fluids such as blood [10–12] and seminal plasma [13], is an essential step to determine both “signaling” and “metabolic-intermediate” levels of this endocannabinoid [14]. Despite great improvements in instrumentation, the quantitation of 2-AG remains an analytical challenge, also because of its instability that makes it easily isomerize into 1-AG [15].
2
Materials 2-AG and [2H8]-2-AG standard (0.26 mM, 100 μg/ml in acetonitrile). Acetone, acetonitrile, chloroform, formic acid, and methanol are of RS-Plus grade. Ultrapure water is produced by a Milli-Q Plus apparatus. OMIX C18 tips. Kinetex C18-XB chromatographic column (100 × 2.1 mm) packed with 2.6 μm average diameter core-shell particles, and provided with a guard column.
2.1 Specimens Collection
Tissues must be snap-frozen in liquid nitrogen after collection (see Note 1) and stored at −80 °C (see Note 2).
2.1.1 Tissue 2.1.2 Plasma
1. Collect blood in a Vacutainer tube with sodium citrate. 2. Centrifuge blood in the collection tube for 15 min at 150 × g with brake off switch. 3. Remove the tube from the centrifuge. 4. Transfer plasma (top layer) to a 15 ml centrifuge tube. Be careful not to aspirate cells from the buffy coat (cellular) layer. 5. Centrifuge plasma in the 15 ml centrifuge tube for 15 min at 1000 × g. 6. Transfer plasma into a 8 ml glass vial and store at −80 °C (see Note 2).
3
Methods
3.1 Extraction from Tissue
1. Warm at room temperature and vortex the [2H8]-2-AG standard (stored at −80 °C). 2. Prepare a solution of internal standard (IS) in ice-cold methanol, in order to add 50 pmoles of [2H8]-2-AG per sample.
22
Natalia Battista and Manuel Sergi
3. Add 1 ml IS solution per 8 ml glass vial and keep the vial on ice. 4. Weight the frozen tissue and put it in the vial containing the IS solution. 5. Homogenize the tissue with an Ultra Turrax T25, keeping the vial on ice (see Note 3). 6. Add 2 ml chloroform per vial with vortexing. 7. Add 1 ml water per vial with vortexing. 8. Centrifuge the mixture at 2000 × g at 4 °C for 10 min. 9. Collect the lower organic phase using a Pasteur pipette, and discard the upper aqueous layer and the protein disk. 10. Evaporate the solvent to dryness in the vial under a gentle nitrogen stream. 11. Plug a Pasteur pipette 5–3/4″ length with glass wool. 12. Prepare a suspension of Silica Gel G (60-Å 230–400 Mesh ASTM) in chloroform (1:1, v/v) and load 1 ml of this suspension onto the Pasteur pipette from step 11. 13. Dissolve the dried lipids into 1 ml chloroform. 14. Load the sample onto the Silica G gel column. 15. Wash the vial with 1 ml of chloroform and repeat step 14. 16. Elute the analyte from the column with 1 ml of chloroform/ methanol (9:1, v/v) and recover the eluate. Repeat step 16. 17. The collected eluate is dried under a gentle nitrogen stream. 18. Dissolve the dried lipids into 100 μl methanol and transfer the mixture to 1 ml glass vial with 0.1 ml conical glass insert. 19. The vial is transferred into the autosampler for the LC-MS/ MS analysis. 3.2 Extraction from Plasma
1. Warm at room temperature and vortex the [2H8]-2-AG standard stored at −80 °C. 2. Prepare a solution of IS in 200 mM formic acid in ice-cold methanol, in order to add 2 pmoles of [2H8]-2-AG per sample. 3. Mix 100 μl of plasma with 100 μl of IS solution. 4. Sonicate the sample in an ultrasonic bath for 6 min at room temperature. 5. Centrifuge at 17,500 × g for 6 min at 4 °C. 6. Recover the upper phase and transfer into a 1 ml glass vial with 0.1 ml conical glass insert. 7. Condition the μSPE tip by flushing four times a 1:1 ultrapure water/acetonitrile solution and four times a 1:1 ultrapure
2-AG Analysis
23
water/200 mM formic acid in methanol using an automatic propipette. 8. Load the sample by inserting the OMIX C18 tip into the vial containing the sample, and perform five load/release cycles. 9. Wash with 100 μl of a 9:1 (v/v) water/methanol solution (five load/release cycles). 10. Elute the analytes with 50 μl of 10 mM formic acid in methanol. Repeat this step five times, performing five load/release cycles for each step. 11. The collected eluate is transferred into 1 ml glass vial with 0.1 ml conical glass insert. 12. The vial is transferred into the autosampler for the LC-MS/ MS analysis. 3.3 LC-MS/MS Analysis
The chromatographic run is carried out by means of a Series 200 system with 2 μ-LC pumps and autosampler from Perkin Elmer (Norwalk, CT, USA). The HPLC system is coupled to an API 2000 triple quadrupole mass spectrometer from ABSciex (Toronto, ON, Canada), equipped with a TurboIonSpray source. The mobile phases are water (A) and 2.5 mM formic acid in methanol (B), at a flow rate of 0.4 ml min−1. Only 0.1 ml min−1 is driven into the ion source by means of a 1:4 split. A gradient elution is applied, so that the organic phase increases from 80 to 84 % in 3 min and then to 100 % in 1 min. After 3 min at 100 % of organic phase, the column is led to the original ratio of 20 % B and 80 % A within 3 min, in order to enable equilibration of the column. A timed switch valve (10-PORT Valco valve connected to the instrument) drives the effluent to the source only from 3 to 6.5 min. The resulting total run-time is 10 min. All the analytes are detected in positive ionization mode with a capillary voltage of 5000 V and nebulizer gas (air) at 90 psi, while the turbo gas (nitrogen) is at 40 psi and 400 °C. For each analyte, two MRM transitions are selected. All sources and instrument parameters for the monitored analytes are tuned by injecting standard solutions at a concentration of 100 ng ml−1 (containing 10 mM of formic acid) at 10 μl min−1 by a syringe pump. Peak areas for the selected ions are determined using ABSciex package Multiview 1.4 and quantitation is performed by the IS method. The selected transitions, together with the main LC-MS/ MS parameters, are reported in Table 1 (see Note 4). The quantification of 2-AG is accomplished by the use of deuterium-labeled IS vs a calibration curve in methanol acidified with 10 mM formic acid, in a 2.64–528 nM range (see Note 5). A chromatogram showing the separation between 2-AG and 1-AG, obtained with the above described experimental conditions, is reported in Fig. 2.
24
Natalia Battista and Manuel Sergi
Table 1 LC-MS/MS parameters for 2-AG and its IS Analyte
RT (min)
Q1 (amu)
DP (V)
FP (V)
EP (V)
Q3 (amu)
CE (V)
CXP (V)
2-AG
4.2
379.1
21
400
7
287.2
21
15
269.1
26
14
295.0
21
15
2
[ H8]-2-AG
4.2
387.2
21
400
7
RT retention time, Q1 precursor ion mass, DP declustering potential, FP focusing potential, EP entrance potential, Q3 product ion mass, CE collision energy, CXP cell exit potential
Fig. 2 Chromatogram of 2-AG and 1-AG obtained by LC-MS/MS in MRM acquisition mode
2-AG Analysis
4
25
Notes 1. Use only Teflon caps, glass vials, and glass pipettes. 2. Biological samples must be snap-frozen at −80 °C immediately after collection. 3. It may be useful to normalize the amount of lipids to the protein content of the samples (cells or tissues). Before starting the extraction procedure, take 20 µl aliquots from the homogenates and determine protein concentration by using a Bradford protein concentration assay. 4. Perform quantitative analysis by selecting the [M + H]+ adduct: 2-AG may form [M + Na]+ adducts which do not lead to any fragmentation. It is important to verify the ratio between the [M + H]+ adduct and the [M + Na]+ adduct, to avoid dramatic loss in sensitivity. 5. Plot calibration curves as the peak area ratio of the analyte over its respective IS against the nominal concentration of the calibrator, by least square linear regression.
References 1. Nguyen DT, Guillarme D, Rudaz S et al (2006) Fast analysis in liquid chromatography using small particle size and high pressure. J Sep Sci 29:1836–1848 2. Wren SA, Tchelitcheff P (2006) Use of ultraperformance liquid chromatography in pharmaceutical development. J Chromatogr A 1119:140–146 3. Guillarme D, Ruta J, Rudaz S et al (2010) New trends in fast and high-resolution liquid chromatography: a critical comparison of existing approaches. Anal Bioanal Chem 397:1069–1082 4. Stout PR, Bynum ND, Mitchell JM et al (2009) A comparison of the validity of gas chromatography- mass spectrometry and liquid chromatography- tandem mass spectrometry analysis of urine samples for morphine, codeine, 6-acetylmorphine, and benzoylecgonine. J Anal Toxicol 33:398–408 5. Maralikova B, Weinmann W (2004) Confirmatory analysis for drugs of abuse in plasma and urine by high-performance liquid chromatography-tandem mass spectrometry with respect to criteria for compound identification. J Chromatogr B Analyt Technol Biomed Life Sci 811:21–30 6. Arpino PJ (1982) On-line liquid chromatography/mass spectrometry? An odd couple! Trends Anal Chem 1:154–158
7. Maurer HH (2007) Current role of liquid chromatography-mass spectrometry in clinical and forensic toxicology. Anal Bioanal Chem 388:1315–1325 8. Sugiura T, Kondo S, Sukagawa A et al (1995) 2-Arachidonoylglycerol: a possible endogenous cannabinoid receptor ligand in brain. Biochem Biophys Res Commun 215:89–97 9. Maccarrone M, Guzmán M, Mackie K et al (2014) Programming of neural cells by (endo) cannabinoids: from physiological rules to emerging therapies. Nat Rev Neurosci 15:786–801 10. Thomas A, Hopfgartner G, Giroud C et al (2009) Quantitative and qualitative profiling of endocannabinoids in human plasma using a triple quadrupole linear ion trap mass spectrometer with liquid chromatography. Rapid Commun Mass Spectrom 23:629–638 11. Zoerner AA, Batkai S, Suchy MT et al (2011) Simultaneous UPLC-MS/MS quantification of the endocannabinoids 2-arachidonoyl glycerol (2AG), 1-arachidonoyl glycerol (1AG), and anandamide in human plasma: Minimization of matrix-effects, 2AG/1AG isomerization and degradation by toluene solvent extraction. J Chromatogr B Analyt Technol Biomed Life Sci 883:161–171
26
Natalia Battista and Manuel Sergi
12. Sergi M, Battista N, Montesano C et al (2013) Determination of the two major endocannabinoids in human plasma by μ-SPE followed by HPLC-MS/MS. Anal Bioanal Chem 405:785–793 13. Lewis SEM, Rapino C, Di Tommaso M et al (2012) Differences in the endocannabinoid system of sperm from fertile and infertile men. PLoS One 7:e47704
14. Murataeva N, Straiker A, Mackie K (2014) Parsing the players: 2-arachidonoylglycerol synthesis and degradation in the CNS. Br J Pharmacol 171:1379–1391 15. Battista N, Sergi M, Montesano C et al (2014) Analytical approaches for the determination of phytocannabinoids and endocannabinoids in human matrices. Drug Test Anal 6:7–16
Chapter 4 Analysis of Omega-3 Fatty Acid Derived N -Acylethanolamines in Biological Matrices Renger F. Witkamp and Michiel G.J. Balvers Abstract The adequate quantification of endocannabinoids can be complex due to their low endogenous levels and structural diversity. Therefore, advanced analytical approaches, such as LC-MS, are used to measure endocannabinoids in plasma, tissues, and other matrices. Recent work has shown that endocannabinoids that are synthesized from n-3 fatty acids, such as docosahexaenoylethanolamide (DHEA) and eicosapentaenoylethanolamide (EPEA), have anti-inflammatory and anti-tumorigenic properties and stimulate synapse formation in neurites. Here, an LC-MS based method for the quantification of n-3 endocannabinoids DHEA and EPEA which is also suited to measure a wider spectrum of endocannabinoids is described. The chapter contains a step-by-step protocol for the analysis of n-3 endocannabinoids in plasma, including sample collection and solid phase extraction, LC-MS analysis, and data processing. Modifications to the protocol that allow quantifying n-3 endocannabinoids in tissues and cell culture media will also be discussed. Finally, conditions that alter endocannabinoid concentrations are briefly discussed. Key words Endocannabinoids, n-3 Fatty acids, Docosahexaenoylethanolamide, Eicosapentaenoylethanolamide, Solid phase extraction, LC-MS
1
Introduction According to the current (IUPHAR) classification system, endocannabinoids constitute a relatively small group of fatty acid-derived endogenous ligands of the cannabinoid receptors CB1 and CB2 [1]. From a biochemical perspective, these endocannabinoids are part of a large family of structurally related amides, esters, and ethers of fatty acids, which are continuously formed and degraded in a dynamic equilibrium. The so-far best studied group of endocannabinoids is the class of N-acylethanolamines (NAEs), which comprises conjugates of fatty acids to ethanolamine, such as arachidonoylethanolamide (AEA, anandamide) [1]. Other examples of endocannabinoids include glycerol esters, such as 2-arachidonoylglycerol (2-AG), and the dopamine conjugate N-arachidonoyldopamine (NADA) [1].
Mauro Maccarrone (ed.), Endocannabinoid Signaling: Methods and Protocols, Methods in Molecular Biology, vol. 1412, DOI 10.1007/978-1-4939-3539-0_4, © Springer Science+Business Media New York 2016
27
28
Renger F. Witkamp and Michiel G.J. Balvers
Next to AEA, ethanolamine conjugates have been described for palmitic acid, stearic acid, and the n-3 fatty acids docosahexaenoic acid and eicosapentaenoic acid [2–5]. It has been shown that cells are able to “combine” different fatty acids and biogenic amines, thus producing several possible permutations of fatty acid amides [6, 7]. Studies have also demonstrated that the local relative availability of their fatty acid precursors, which is amongst others determined by diet, plays an important role in determining the pattern of amide conjugates formed [2, 3]. The high diversity and dynamics of endocannabinoids and related compounds in tissues demands for adequate methods for the quantification. Recently published reports are all using advanced analytical chemical techniques, such as gas chromatography coupled to mass spectrometry (GC-MS) or liquid chromatography coupled to mass spectrometry (LC-MS), to meet this challenge [8]. MS-based methods use the molecular mass of a compound to detect it, which allows simultaneously measuring a broad range of compounds in a single sample. The molecular mass of a compound is more specific than, e.g., its ultraviolet (UV) absorbance characteristics, and therefore MS analysis results in higher specificity. Another advantage of MS over optical detectors is that similar molecules of different molecular weight can be measured even when there is no chromatographic separation. Typically, published methods on the quantification of “classical” endocannabinoids and related compounds are focusing on a limited number of molecules derived from selected precursor fatty acids, such as AEA, 2-AG, palmitoylethanolamine (PEA), and oleoylethanolamine (OEA). However, increasing data underline the (patho-) physiological relevance of compounds derived from other biologically important fatty acids. For instance, n-3 fatty acids are abundantly present in brain and important for brain functioning. We have also shown, using LC-MS, that n-3 fatty acid-derived endocannabinoids such as docosahexaenoylethanolamine (DHEA) and eicosapentaenoylethanolamine (EPEA) are present in mammalian plasma and other tissues, in concentrations similar to that of the “classical endocannabinoids” (see Fig. 1 for molecular structures) [4, 5, 9]. Work from our lab and others has also shown that DHEA and EPEA have biological effects on immune cells [10, 11], cancer cells [12, 13], and hippocampal cells [14]. Based on their affinity for CB1 and CB2, DHEA and EPEA could be classified as “true” endocannabinoids, although much of their bio-activity appears to be not directly related to cannabinoid receptors alone [11, 12]. In this chapter, we describe a protocol for the quantification of the n-3 fatty acid-derived endocannabinoids DHEA and EPEA in plasma using LC-MS. This method allows determining a wider spectrum of endocannabinoids, including AEA, 2-AG, and NADA, which we will also address briefly where relevant. Depending on
Assay of ω-3 Endocannabinoids
29
Fig. 1 Molecular structures for DHEA and EPEA
the sensitivity of the LC-MS system, 0.1–1 ml of plasma is sufficient to obtain adequate peaks. Plasma is collected from blood, and a plasma extract is made using acetonitrile (ACN), which is subsequently washed and concentrated using solid phase extraction (SPE). The eluate from the SPE step is evaporated to dryness, reconstituted, and subsequently analyzed using LC-MS. Proper data analysis is also crucial. Modifications to determine endocannabinoid levels in other matrices will also be discussed.
2
Materials Water and solvents should be of high purity. Different suppliers might use different terminology, such as “LC-MS grade” or “ULC grade.” Fresh, ultrapure deionized water is preferred, as it is present in most labs. MQ water of >18 MΩ at 25 °C is a good option. Polypropylene-based plastics show good recoveries during the sample preparation; glass should be avoided, in particular for the vacuum concentration step [15].
2.1 Analytical Standard Solutions 2.1.1 Calibration Curve Solutions
Prepare a set of calibration solutions in ACN containing the concentrations described in Table 1. Store at −80 °C (see Note 1). All calibrators have the same concentration of deuterated analogues. During LC-MS analysis, both the intensity of the natural compound (e.g., AEA) and its deuterated analogue (e.g., AEA-d8) will be measured. The AEA:AEA-d8 ration will be proportional to the concentration. Deuterated standards will also be spiked to the plasma samples in exactly the same amounts as present in the calibrators (see Note 2).
30
Renger F. Witkamp and Michiel G.J. Balvers
Table 1 Overview of concentrations in calibration curve solutions cal8
cal7
cal6
cal5
cal4
cal3
cal2
cal1
Concentration (ng/ml) AEA
406.50
135.50
45.17
15.06
5.02
1.67
0.56
0.19
2-AG
5617.00
1872.33
624.11
208.04
69.35
23.12
7.71
2.57
DLE
140.40
46.80
15.60
5.20
1.73
0.58
0.19
0.064
OEA
140.40
46.80
15.60
5.20
1.73
0.58
0.19
0.064
PEA
140.40
46.80
15.60
5.20
1.73
0.58
0.19
0.064
SEA
69.50
23.17
7.72
2.57
0.86
0.29
0.10
0.032
DHEA
140.40
46.80
15.60
5.20
1.73
0.58
0.19
0.064
EPEA
500.00
166.67
55.56
18.52
6.17
2.06
0.69
0.23
31.25
31.25
31.25
31.25
31.25
31.25
31.25
31.25
AEA-d8 2-AG-d8
750
750
750
750
750
750
750
750
PEA-d4
12.5
12.5
12.5
12.5
12.5
12.5
12.5
12.5
OEA-d4
31.25
31.25
31.25
31.25
31.25
31.25
31.25
31.25
These are values that are normally used on our lab. Typically, our lower limit of quantification (LLOQ) is in the range of cal1 or cal2
2.1.2 Deuterated Standard Spiking Stock Solution
Prepare the spiking solution containing 312.5 ng/ml AEA-d8, 7500 ng/ml 2-AG-d8, and 312.5 ng/ml OEA-d8 in ACN (see Note 2). Store at −80 °C.
2.1.3 Reconstitution Solution
Prepare the reconstitution solution containing 12.5 ng/ml PEAd4 in ACN. Store at −80 °C. It is recommended to make amounts sufficient to run hundreds of samples.
2.2 Solutions and Reagents
1. 100 mM phenylmethanesulfonyl fluoride (PMSF) solution in isopropanol. Store at 4–8 °C. A volume of 10 ml of 100 mM PMSF solution is sufficient to collect hundreds of samples. PMSF is an enzyme inhibitor which also inhibits fatty acid amide hydrolase (FAAH), the principal NAE-degrading enzyme (see Note 3). 2. Deuterated standard spiking work solution containing 100 μM PMSF. Make a tenfold dilution of the deuterated standard spiking stock solution in acetonitrile, and add 100 mM PMSF to a final concentration of 100 μM. Make this solution fresh for every batch. Ensure that the stock solution has reached room temperature before opening the vial.
Assay of ω-3 Endocannabinoids
31
3. MQ water with 0.133 % trifluoroacetic acid (TFA). Store at room temperature. Prepare fresh solution for each batch. A bottle containing 1 l of MQ-0.133 % TFA is sufficient for approximately 60 plasma samples (15 ml/sample). 4. 20 % ACN in MQ + 0.1 % TFA. Store at room temperature. Prepare fresh solution for each batch. A bottle containing 100 ml is sufficient for 50 samples (2 ml/sample). 5. 80 % ACN in MQ + 0.1 % TFA. Store at room temperature. Prepare fresh solution for each batch. A bottle containing 100 ml is sufficient for 50 samples (2 ml/sample). 6. LC eluents A: 40 % MQ water : 40 % methanol : 20 % ACN + 0.1 % formic acid (FA). 7. LC eluents B: 70 % methanol : 30 % ACN + 0.1 % FA. 2.3
Consumables
For each plasma sample, the following is required: 1. One plasma collection tube containing ethylenediaminetetraacetic acid (EDTA), minimum volume 5 ml, and a 1.5 ml Eppendorf cup; 1 ml of plasma or less is required (see Note 4). 2. One 15 ml tube with screw cap (polypropylene plastic). 3. One 50 ml tube with screw cap (polypropylene plastic). 4. One C8 SPE column (Agilent, Bond Elut C8, 200 mg, 3 ml cartridge). 5. One 2 ml Eppendorf cup (polypropylene plastic). 6. One LC injection vial (amber, screw cap) with insert. Most LC systems will accept 12 mm × 32 mm vials (see Note 5).
2.4
Equipment
1. Fume hood. 2. Pipettes, including a large-volume dispenser. 3. Vortexer. 4. Centrifuge suited for 15 ml volume tubes. 5. SPE high-volume cartridges + adapter. 6. SPE manifold, including vacuum pump and stopcocks. 7. Vacuum concentrator. 8. Chromatography column suited for MS analysis, C8. 9. LC-MS/MS system equipped with an electrospray ionization (ESI) source (see Note 6).
3
Methods
3.1 Sample Collection
1. Prior to the collection of blood from the subject, pre-cool the centrifuge to 4 °C.
32
Renger F. Witkamp and Michiel G.J. Balvers
2. Aliquot the PMSF solution; the 100 mM PMSF stock solution needs to be diluted in plasma to a final concentration of 100 μM in isopropanol. Aliquot 1.5 μl of the 100 mM PMSF solution in each 1.5 ml Eppendorf tube that will be used to store the plasma in after collection and centrifugation. Once 1.5 ml plasma is added (step 5, below), the final concentration will be 100 μM PMSF. 3. Collect venous blood, e.g., from the antecubital vein, in the EDTA tube (see Note 4). Measures to limit hemolysis are recommended as this might release degrading enzymes or intercellular endocannabinoids. 4. Immediately after blood collection, spin down the tubes in a centrifuge for 10 min at 2000 × g and 4 °C. Tubes that cannot be immediately centrifuged should be stored on ice, but should always be centrifuged within 20 min after collection. Especially when working with a high number of samples, this might lead to some variation in time between blood collection and centrifugation. In our experience, this has never led to any obvious artifactual changes in measured endocannabinoid levels. 5. Immediately after centrifugation, collect the plasma and transfer 1.5 ml to the Eppendorf tube containing the PMSF. Store the sample at −80 °C (see Notes 7 and 8). 3.2 Sample Extraction
Organic solvents and acids are used during sample extraction. Take all necessary precautions to create a safe working environment. This includes performing all steps with organic solvents and acids in a fume hood, and wearing gloves and safety glasses at all times. 1. Thaw the plasma samples. Ensure that all samples have reached room temperature before proceeding to the ACN extraction step. This may take 30–60 min. 2. While the plasma samples are thawing, prepare the deuterated standard spiking work solution. 3. Transfer 1.0 ml of plasma to a clean 15 ml tube. 4. Add 4.0 ml of the deuterated standard spiking work solution to the 1.0 ml plasma. The ACN will precipitate all proteins and highly lipophilic compounds, while keeping the endocannabinoids in solution. The ACN will completely mix with the plasma. While adding this solution to the plasma, keep the tube on a vortexer running at a gentle pace. Vortexing the sample will improve the reproducibility of the precipitation. 5. Centrifuge the 15 ml tubes at 3000 × g for 5 min at room temperature. 6. After centrifugation, collect the supernatant and transfer to a clean 50 ml tube. To each 50 ml tube, add 15 ml of the 0.133 % TFA solution. This will dilute the ACN from step 4 again to 20 %, which is adequate for the subsequent SPE clean-up.
Assay of ω-3 Endocannabinoids
33
7. Prepare the SPE manifold; the vacuum pump is connected to the glass manifold, and the SPE columns are connected on the manifold through plastic stopcocks that allow controlling the flow rate of fluids through the column. 8. Activate the C8 SPE column by applying 1 ml of methanol on the column’s filter bed. Allow the methanol to run through the filter by gravitational pull; the stopcock has to be in the “open” position. The stopcock should be closed just before the bottom of the meniscus reaches the surface of the filter; the filter should remain wet (see Note 9). 9. Wash the C8 SPE column by applying 1 ml of MQ water on the filter. Allow the water to run through the filter by using the vacuum pump that creates a mild vacuum (600–700 mBar) in the manifold. The stopcock has to be in the “open” position, and should be closed just before the bottom of the meniscus reaches the surface of the filter. The vacuum pump can be turned off when all columns are washed. Again, the filter should remain wet. There may be some variation in the time needed to clear the water through the filter. It is advised to wash the columns a few at the time, to prevent columns running dry (see Note 10). 10. Load the 20 ml of sample (from step 6) to the SPE column. First, fill the SPE column with 2 ml of sample, then connect the high-volume cartridge and adapter on the SPE column, and add the remaining 18 ml. Open the stopcock and turn on the vacuum pump again. It might take a few minutes before all samples have run through the SPE column’s filter; once completed, close the stopcock again. Loading the sample in the 20 % ACN in MQ water + 0.1 % TFA solution is critical for binding of the endocannabinoids to the filter. A higher organic solvent content may prevent the endocannabinoids to bind to the column. 11. Open the stopcocks again and wash the column with 2 ml % ACN in MQ water + 0.1 % TFA solution. This will wash away any unbound residue that remained in the filter; the endocannabinoids will remain bound to the filter. Close the stopcocks once the wash has completed. 12. Prepare the manifold for eluting the SPE columns. Turn off the vacuum pump, and gently release the vacuum from the manifold. Open the manifold, discard the fluid that has accumulated in the manifold; this contains organic solvents and TFA. Adjust the collection vessel rack to accommodate the 2 ml sample collection tubes. Ideally, the outlet tip of the gasket’s tube connector should be positioned just over the 2 ml tube. Close the manifold again. Ascertain that all outlet tips are still positioned over the 2 ml collection tubes. 13. Elute the SPE columns by adding 2 ml of 80 % ACN in MQ + 0.1 % TFA on the SPE columns. Open the stopcocks and
34
Renger F. Witkamp and Michiel G.J. Balvers
activate the vacuum pump again (600–700 mBar); the eluent should drip in the 2 ml collection tube. Close the stopcock immediately when the column is completely eluted to prevent air violently blowing in the sample and spilling it. It is advised to elute the columns a few at the time to prevent this. 14. When all samples are eluted, switch off the vacuum pump and gently release the vacuum. Transfer the 2 ml collection tubes to a vacuum concentrator and evaporate the sample to full dryness. It may take a few hours before the samples are completely dry. Dried extracts can be stored in −80 °C until LC-MS analysis, or immediately analyzed (see Note 11). 3.3
LC-MS Analysis
Before LC-MS analyses can be performed, a method has to be programmed. Therefore, the different aspects of the method, such as chromatography, ion optics settings, and mass spectrometer scan events, have to be (experimentally) optimized for the LC-MS system. Operating LC-MS systems requires specific training and expertise, and is usually delegated to specialized technicians. Published reports provide a good starting point for optimizing the LC-MS settings, but differences between hardware from different manufacturers may exist. It is therefore difficult to provide a general step-by-step guide on how to perform LC-MS analyses, but some general points of attention will be discussed in this section. 1. The chromatography should be optimized to yield symmetric peaks and minimize ion suppression. We have good experience with gradient elution using eluents that contain water, methanol, and acetonitrile (eluents A and B, see Subheading 2). Due to the lipophilic nature of the extract, ion suppression may negatively influence peak heights. Ion suppression can be prevented by modifying the chromatography, hence increasing peak height but usually also analysis time. Special attention should be paid when monoacylglycerol esters such as 2-AG are to be determined; 2-AG undergoes isomerization to 1-AG in aqueous media, which may have to be resolved chromatographically depending on the research question. 2. We have good experiences with various C8 columns for “conventional” high-performance liquid chromatography (HPLC) analysis (e.g., Waters Xterra MS C8) or ultra-performance liquid chromatography (UPLC) analysis (e.g., Waters Acquity C8 BEH UPLC). Generally, UPLC columns can be operated against higher backpressures, allowing higher flow rates, improved separation, and shorter run times. In our hands, a 2.1 × 100 mm UPLC C8 column and a 12-min gradient elution protocol with eluents A and B (see Subheading 2.2) resulted in adequate peak shape and recoveries [9]. Never use salt-containing eluents for MS analysis! The chromatography,
Assay of ω-3 Endocannabinoids
35
together with the sensitivity of the MS, will determine the injection volume of the autosampler. Too high sample volumes may deteriorate peak shape. Typically, depending on the available hardware (and sample loops), the injection volume will range between 2 and 10 μl. 3. All individual compounds should be infused directly into the system in order to tune the MS for the different endocannabinoids. In our hands, the parent of DHEA is visible at m/z 372 and EPEA at m/z 346, which correspond to their protonated forms. Generally, all ethanolamides, including DHEA and EPEA, yield a dominant m/z 62 fragment when subjected to collision-induced dissociation (CID). This fragment corresponds to the ethanolamine moiety. Different classes of endocannabinoids, such as monoacylglycerols or the acyldopamines, yield different fragmentation patterns. Too high CID energies may lead to further fragmentation of the dominant fragment, thus resulting in reduced signal intensities. It is therefore important to select the appropriate optimal CID energy, which has to be determined through experimentation. 4. The performance of an LC-MS method depends on the quality of the sample, the chromatographic separation, and the optimization of MS settings. It is highly recommended to perform a validation to establish the system performance. Items include inter- and intraday accuracy and precision, linearity, limit of quantification/detection (LOQ/LOD), freeze-thaw stability, ion suppression, and recovery. 3.4 Data Processing and Experimental Results
Chromatograms have to be critically reviewed and adjusted if necessary to ensure that high-quality data are reported for further (statistical) processing. Attention has to be paid to a few aspects, such as retention time shifts, quality control (QC) samples, and fit of calibration curves. 1. The accuracy of the calibration curve is essential as it influences the reported concentration for each sample. Usually, each calibration curve is analyzed in duplicate or triplicate for each run, and a single regression equation is generated. The curve fit can be optimized to achieve good accuracy in the concentration range relevant to the “unknown” study samples, e.g., by modifying the curve type or “weighing.” The quantification software provides several options to achieve this. In addition, calibration points at concentrations that are not relevant for the study samples may be unselected, to ensure that the calibration curve has optimal fit in the relevant concentration range. 2. Although most software suites allow for automatic peak processing, it is recommended to check all integrations manually. Especially in matrices where low concentrations are expected,
36
Renger F. Witkamp and Michiel G.J. Balvers
such as in plasma, small background interferences (“noise”) may interfere with peak integration and may severely influence the results. We have good experience with using peak areas. 3. Correct for the concentration factor that occurs during sample preparation. The software reports concentrations as they were found in the extract. In case of plasma, 100 μL extracts contains the endocannabinoids from 1 ml of original material, meaning that the reported concentrations are to be divided by 10. 4. It is difficult to give reference values for endocannabinoids in plasma because their levels are modified by a variety of factors (see Subheading 3.6). We have found human plasma concentrations for most endocannabinoids in the low ng/ml range [9, 15]. DHEA is present in human plasma whereas EPEA was undetectable [5]. However, EPEA is found in tissues at concentrations in the ng/g range of animals fed a n-3 fatty rich diet [4]. 3.5 Modifications to the Sample Preparation Protocol for Matrices Other Than Plasma
We have applied the sample preparation protocol for a variety of matrices, such as adipose tissue, liver, intestinal tissue, and cell culture media. Here we briefly describe modifications to the standard protocol for a selection of matrices other than plasma. Like most tissues, adipose tissue contains higher concentrations of endocannabinoids compared to plasma. In our experience, adipose tissue did not require SPE sample pre-treatment. A simple extraction step using ACN followed by sonication was sufficient to accurately determine endocannabinoid levels. To 50–100 mg of adipose tissue, 1 ml of ACN containing deuterated standards is added, the sample is sonicated for 5–10 s, and centrifuged for 5 min at 12,000 × g on a table-top centrifuge. The supernatant is transferred to a clean 2 ml Eppendorf tube. To the tissue, again 1 ml of ACN is added, sonicated, and centrifuged, and the supernatant is pooled. The 2 ml of ACN extract is evaporated to full dryness, and subjected to LC-MS analysis as described. Liver and gut tissue contains high concentrations of endocannabinoids. In our experience, 100 mg freeze-dried liver and 50 mg freeze-dried gut tissue contain quantifiable amounts of n-3 fatty acid-derived endocannabinoids. Liver or gut tissue is processed similar to plasma, using SPE. First, the tissue is extracted using 2 × 1 ml of ACN and sonication. The 2 ml of supernatant is diluted with 8 ml of MQ + 0.1 % TFA, and subjected to SPE clean-up similar to plasma. Cell culture medium may also contain endocannabinoids. In our experience, using 3T3-L1 adipocytes, 2 ml of medium contained quantifiable endocannabinoid levels. To 2 ml of medium, 2 μl of TFA and the deuterated standards are added, and the acidified medium is directly applied onto activated C8 SPE columns and processed as described for plasma. Different strategies may be used to improve endocannabinoid yield from cultured cells, such
Assay of ω-3 Endocannabinoids
37
as increasing cell numbers, prolonging medium incubation time, or stimulation with ionomycin to stimulate immediate release of endocannabinoids in the medium. 3.6 Factors That Influence Levels of n-3 Endocannabinoids
Generally, endocannabinoid levels depend on a variety of factors, including dietary composition of fatty acids, the presence of inflammation, and postprandial status. DHEA is normally found in human and mouse plasma, but we have not been able to detect EPEA in human plasma [4, 5, 15]. Experience from animal studies demonstrated that EPEA is only detectable in plasma when the animals were fed a diet rich in n-3 fatty acids for 6 weeks [4]. Whether EPEA is present in human plasma after eating n-3 rich diets is not known at present. Both DHEA and EPEA have been consistently found in mouse tissues such as adipose tissue, liver, and gut. Generally, with increased n-3 fatty acid content in the diet, or during inflammation, DHEA and EPEA levels were increased [4, 16]. Also cultured 3 T3-L1 adipocytes released quantifiable amounts of DHEA and EPEA in the medium [5].
3.7 Choice of Target Analytes
The method described in this chapter is suited to quantify the levels of DHEA and EPEA in plasma and other matrices. As mentioned above, using exactly the same sample preparation steps, a wider spectrum of endocannabinoids can be measured, including the classical endocannabinoids AEA and 2-AG. These molecules can be quantified parallel to DHEA and EPEA in the same sample, which requires adding the desired compounds to the calibration curve and MS settings. Most MS triple quadrupole equipment can easily scan 10–20 compounds in one sample. In our experience, quantifying DHEA and EPEA together with the other endocannabinoids provided additional information that helped to understand the dynamic context in which n-3 endocannabinoids are present. For instance, with our more comprehensive analytical approach, we were able to demonstrate that specific fatty acid enriched diets cause a shift in multiple endocannabinoids, rather than affecting only one or two endocannabinoids [4]. It thus seems that establishing a comprehensive “endocannabinoid profile” reveals changes that were not detected using methodology that only focuses on a limited number of endocannabinoids.
4
Notes 1. It is needless to say that stock solutions and calibrators have to be prepared precisely. The concentrations in Table 1 depict the ranges that we routinely measure, but this depends on the MS available in the lab. Therefore, depending on the sensitivity of the available equipment, different concentration ranges may apply in other labs.
38
Renger F. Witkamp and Michiel G.J. Balvers
2. During LC-MS analysis, the ratio of an endocannabinoid to its deuterated analogue (=isotope ratio) is measured. The ratio is proportional to the concentration in the sample; therefore, it is crucial that the amount of deuterated compound that is spiked to the sample is identical to the amount present in the calibrators. Deuterated standards are normally not present in biological materials and are therefore added to the sample during sample preparation. Measuring isotope ratios has several advantages, because it intrinsically corrects for any sample spill during the sample preparation or any other factors that may vary between samples. It also corrects for so-called ion suppression. Ion suppression is the phenomenon where ionization of the compound of interest is suppressed due to interference of other molecules in the sample, leading to apparently lower peaks. With a carefully selected deuterated analogue that elutes from the LC column at the same time, both molecules are equally affected by ion suppression, thus the isotope ratio remains stable. Different deuterated standards can be used. We have good experiences with using deuterated AEA (AEAd8) for the quantification of DHEA and EPEA. In the protocol presented here, deuterated 2-AG and NADA are also added to allow for the quantification of a wider range of endocannabinoids. 3. Endocannabinoids are degraded by a variety of enzymes, such as FAAH and monoacylglycerol lipase (MGL). Although FAAH is normally present within the cell, it may also be present in the plasma when cells are lysed, for instance due to mechanical stress during the venapunction. Therefore, as a precaution, it is recommended to store plasma in the presence of FAAH inhibitors, such as PMSF. 4. Different anticoagulants are available to prevent ex vivo blood clotting, such as citrate, heparin, and EDTA. Generally, it is known that the anticoagulant can affect the performance of LC-MS. Anticoagulants may cause interfering peaks in the chromatogram, and it is therefore recommended to investigate the presence of interfering peaks. In our hands, we did not encounter any interferences with EDTA. 5. Different LC systems are available, with either binary or quaternary pumps, autosamplers that accept different types of vials or plates, and operate at different pressures. When using only 2 eluents for the chromatography, a binary LC system is adequate. In the protocol presented here, the dried extract is reconstituted in 100 μl of ACN; for most autosamplers, this means that vials with inserts have to be used. The right type of vial and the appropriate injection needle height have to be selected in the LC systems settings.
Assay of ω-3 Endocannabinoids
39
6. Mass spectrometry is an advanced analytical technique that allows characterizing and/or quantifying levels of molecules in a certain matrix. Different types of MS machines are available, which all have their particular strengths, weaknesses, and area of application. For accurate and sensitive quantification of multiple compounds, a so-called triple-quadrupole or tandem MS (annotated as MS/MS) is usually the first choice. A tandem MS system consists of three mass filters (“quadrupoles”) that are connected in series. The second quadrupole acts as a collision cell. The detector is positioned after the third quadrupole. Intact ions of interest, “parent ions,” are selected in the first quadrupole and move on to the collision cell, where they are subjected to collision with inert gas, such as argon. As a result, the parent ions will dissociate into fragments, known as “daughter ions.” The daughter ion will continue their flight to the third quadrupole, where only selected daughter ions of one specific mass-over-charge (m/z) ratio will be passed on to the detector. Thus, an ion that hits the detector is a selected fragment from a selected parent ion. Through this “dual selection” a high level of specificity can be achieved. 7. Information on the long-term stability of endocannabinoids in plasma at −80 °C is scarce. However, considering the potential absorption of endocannabinoids to plastics, and the presence of degrading enzymes in the biological matrix, endocannabinoids are generally considered unstable [8]. Therefore, we recommend analyzing the endocannabinoid levels at the earliest convenience. 8. It is needless to say that blood and plasma should be treated as potentially infectious materials. Therefore, wear gloves when handling blood or plasma. It is common to take additional precautions, such as compulsory Hepatitis B vaccination for all personal handling human materials. 9. The methanol unfolds the C8 aliphatic chains in the filter bed, allowing the binding of lipophilic substances to the filter. Hence, this step is known as “activation.” 10. This washing step is needed to wash away any overabundant methanol that may prevent compound binding in the sample loading step. 11. The vacuum concentration step is critical for good recoveries. We have compared different techniques to dry the SPE extract, including evaporation under nitrogen flow and freeze-drying. In our hands, we obtained the most robust results and highest recoveries by drying the samples in a vacuum concentrator centrifuge. Please be aware that the vacuum concentrator has to be compatible to work with organic solvents and acids.
40
Renger F. Witkamp and Michiel G.J. Balvers
References 1. Pertwee RG, Howlett AC, Abood ME et al (2010) International union of basic and clinical pharmacology. LXXIX. Cannabinoid receptors and their ligands: beyond CB1 and CB2. Pharmacol Rev 62:588–631 2. Artmann A, Petersen G, Hellgren LI et al (2008) Influence of dietary fatty acids on endocannabinoid and N-acylethanolamine levels in rat brain, liver and small intestine. Biochim Biophys Acta 1781:200–212 3. Matias I, Carta G, Murru E et al (2008) Effect of polyunsaturated fatty acids on endocannabinoid and N-acyl-ethanolamine levels in mouse adipocytes. Biochim Biophys Acta 1781:52–60 4. Balvers M, Verhoeckx K, Bijlsma S et al (2012) Fish oil and inflammatory status alter the n-3 to n-6 balance of the endocannabinoid and oxylipin metabolomes in mouse plasma and tissues. Metabolomics 8:1130–1147 5. Balvers MGJ, Verhoeckx KCM, Plastina P et al (2010) Docosahexaenoic acid and eicosapentaenoic acid are converted by 3T3-L1 adipocytes to N-acyl ethanolamines with anti-inflammatory properties. Biochim Biophys Acta 1801:1107–1114 6. Bradshaw HB, Raboune S, Hollis JL (2013) Opportunistic activation of TRP receptors by endogenous lipids: Exploiting lipidomics to understand TRP receptor cellular communication. Life Sci 92:404–409 7. Di Marzo V, Bisogno T, De Petrocellis L (2007) Endocannabinoids and related compounds: walking back and forth between plant natural products and animal physiology. Chem Biol 14:741–756 8. Zoerner AA, Gutzki F-M, Batkai S et al (2011) Quantification of endocannabinoids in biological systems by chromatography and mass spectrometry: a comprehensive review from an analytical and biological perspective. Biochim Biophys Acta 1811:706–723 9. Balvers MGJ, Wortelboer HM, Witkamp RF et al (2013) Liquid chromatography–tandem mass spectrometry analysis of free and esterified
fatty acid N-acyl ethanolamines in plasma and blood cells. Anal Biochem 434:275–283 10. Meijerink J, Plastina P, Vincken J-P et al (2011) The ethanolamide metabolite of DHA, docosahexaenoylethanolamine, shows immunomodulating effects in mouse peritoneal and RAW264.7 macrophages: evidence for a new link between fish oil and inflammation. Br J Nutr 105:1789–1807 11. Meijerink J, Poland M, Balvers MGJ et al (2015) Inhibition of COX-2-mediated eicosanoid production plays a major role in the anti-inflammatory effects of the endocannabinoid N-docosahexaenoylethanolamine (DHEA) in macrophages. Br J Pharmacol 172:24–37 12. Brown I, Cascio MG, Wahle KWJ et al (2010) Cannabinoid receptor-dependent and -independent anti-proliferative effects of omega-3 ethanolamides in androgen receptor-positive and -negative prostate cancer cell lines. Carcinogenesis 31:1584–1591 13. Rovito D, Giordano C, Vizza D et al (2013) Omega-3 PUFA ethanolamides DHEA and EPEA induce autophagy through PPARγ activation in MCF-7 breast cancer cells. J Cell Physiol 228:1314–1322 14. Kim HY, Spector AA, Xiong ZM (2011) A synaptogenic amide N-docosahexaenoylethanolamide promotes hippocampal development. Development 96:114–120 15. Balvers MGJ, Verhoeckx KCM, Witkamp RF (2009) Development and validation of a quantitative method for the determination of 12 endocannabinoids and related compounds in human plasma using liquid chromatographytandem mass spectrometry. J Chromatogr B 877:1583–1590 16. Balvers MGJ, Verhoeckx KCM, Meijerink J et al (2012) Time-dependent effect of in vivo inflammation on eicosanoid and endocannabinoid levels in plasma, liver, ileum and adipose tissue in C57BL/6 mice fed a fish-oil diet. Int Immunopharmacol 13:204–214
Chapter 5 Assay of CB1 Receptor Binding Valeria M. Catani and Valeria Gasperi Abstract Type-1 cannabinoid receptor (CB1), one of the main targets of endocannabinoids, plays a key role in several pathophysiological conditions that affect both central nervous system and peripheral tissues. Today, its biochemical identification and pharmacological characterization, as well as the screening of thousands of novel ligands that might be useful for developing CB1-based therapies, are the subject of intense research. Among available techniques that allow the analysis of CB1 binding activity, radioligand-based assays represent one of the best, fast, and reliable methods. Here, we describe radioligand binding methods standardized in our laboratory to assess CB1 binding in both tissues and cultured cells. We also report a high-throughput radioligand binding assay that allows to evaluate efficacy and potency of different compounds, which might represent the basis for the development of new drugs that target CB1 receptor-dependent human diseases. Key words Type-1 cannabinoid receptor, CP55.940, Filtration assay, Radioligand-receptor binding, SR141716
1 Introduction Type-1 cannabinoid receptor (CB1), the first identified and cloned receptor of Δ9-tetrahydrocannabinol [1], represents one of the main targets of endocannabinoids [2, 3]. It is highly expressed in brain, but also in peripheral organs (e.g., lung, liver, and kidney) and cells, including T lymphocytes and platelets [4]. Due to its broad localization, CB1 is involved in the regulation of several physiological processes at both central nervous system and periphery, such as neurogenesis, reward, cognition, learning, memory, immune response, and body energy homeostasis [4–6]. In addition, several pathological conditions have been shown to correlate with up- or downregulation of this receptor. Overactive CB1 signaling, for example, promotes the development of obesity, insulin resistance, and dyslipidemia [6]. Therefore, the design of novel CB1 ligands that might be useful
Mauro Maccarrone (ed.), Endocannabinoid Signaling: Methods and Protocols, Methods in Molecular Biology, vol. 1412, DOI 10.1007/978-1-4939-3539-0_5, © Springer Science+Business Media New York 2016
41
42
Valeria M. Catani and Valeria Gasperi
therapeutics for prevention and/or treatment of CB1-dependent human disorders is very active [6]. One of the main techniques used for the biochemical identification and pharmacological characterization of CB1 is based on the use of a radioactive ligand, such as [3H]CP55.940 [2]. The basic outline of radioligand-CB1 binding assays is very easy and fast to perform: a preparation containing CB1 is incubated with radioactive (hot) [3H]CP55.940, thus forming the radioactive complex [3H]CP55.940/CB1. After reaching equilibrium, this complex is usually separated from unbound hot [3H]CP55.940 by membrane filtration (still the most efficient, fast, and convenient method), and quantified by liquid scintillation counting. The use of an unlabeled (cold) CB1 ligand, such as the antagonist/inverse agonist SR141716 or rimonabant [7], able to selectively displace hot [3H]CP55.940 from CB1 sites, allows then to assess CB1 binding activity. Noteworthy, we observed that, although CB1 binding assay with filtration might work well with membrane homogenates from both tissues and cells, the most reproducible and reliable results are obtained by working with intact cultured cells without a filtration step. Against this background, here we describe two relatively simple, but extremely powerful, methods that we have standardized in our laboratory and that we commonly employ to interrogate the presence of CB1 in unknown samples, as well as to identify potential changes in its activity, under either physiological (e.g., in young versus aged tissues, or during cell differentiation) or pathological conditions (e.g., healthy versus diseased tissues). We also describe a standardized high-throughput CB1 binding assay that, by employing human CB1 over-expressing membranes, allows to screen large libraries of compounds. This method is a useful assay to identify novel CB1 ligands that might represent the basis for developing innovative therapeutics against CB1dependent human diseases.
2 Materials Prepare all buffers and solutions by using ultrapure water and analytical grade reagents. Prepare and store all reagents at −20 °C (unless indicated otherwise). 2.1 Labeled and Unlabeled Compounds
[3H]CP55.940 [5-(1,10-dimethylheptyl)-2-[(1R,5R)-hydroxy-(2R)(3-hydroxypropyl)-cyclo-hexyl]phenol]. CP55.940.
CB1 Binding Assay
43
SR141716, rimonabant [N-piperidino-5-(4-chlorophenyl)-1(2,4-dichlorophenyl)-4-methyl-3-pyrazole carboxamide] (Cayman Chemicals Ann Arbor, MI, USA). 2.2 Buffers and Equipments
Buffer A: 2 mM Tris-EDTA, 320 mM sucrose, 5 mg/ml BSA, 5 mM MgCl2, pH 7.4.
2.2.1 CB1 Binding Assay for Tissues
Buffer B: 50 mM Tris–HCl, 2 mM Tris-EDTA, 3 mM MgCl2, pH 7.4. Buffer C: 50 mM Tris–HCl, 2 mM Tris-EDTA, 3 mM MgCl2, 5 mg/ml bovine serum albumin (BSA), 50 μM phenylmethylsulfonyl fluoride (PMSF) (to add immediately before use), pH 7.4. Buffer D: 50 mM Tris–HCl, 1 mg/ml BSA, pH 7.4. 0.1 % Triton in Buffer D, pH 7.4. Glass/Teflon Potter homogenizer. Ultra-Turrax T 25. 15 ml polypropylene tubes. Vortex mixer. Water bath or Thermoblock for 15 ml tubes, or incubator set at 37 °C. Whatman GF/C Glass Microfiber filters (binder free), diameter 25 mm, with 1.2 μm pore size. Vacuum filtration manifold, Millipore® model 1225 (Merck- Millipore Co., Darmstadt, Germany). Vacuum pump. Liquid scintillation cocktail (Ultima Gold™ XR). 10 ml scintillation vials. Liquid scintillation β-counter.
2.2.2 CB1 Binding Assay for Intact Cells
1. Incubation buffer: 50 mM Tris–HCl, 5 mM MgCl2, 1 mM CaCl2, 320 mM sucrose, 2 mg/ml BSA, pH 7.4. 2. Washing buffer: 50 mM Tris–HCl, 500 mM NaCl, 1 mg/ml BSA, pH 7.4. 3. Phosphate-buffered saline (PBS): 137 mM NaCl, 2.7 mM KCl, 10 mM Na2HPO4, 1.8 mM KH2PO4, pH 7.4. 4. Sterile 24-well plates for cell cultures. 5. Incubator for cell cultures set at 37 °C. 6. Liquid scintillation cocktail (Ultima Gold™ XR). 7. 10 ml scintillation vials. 8. Liquid scintillation β-counter.
44
Valeria M. Catani and Valeria Gasperi
2.2.3 High-Throughput CB1 Binding Assay
1. Binding buffer: 50 mM Tris–HCl, 5 mM MgCl2, 1 mM CaCl2, 2 mg/ml BSA, pH 7.4. 2. Pre-soaking buffer for FC-filter plate: 50 mM Tris–HCl, 0.33 % polyethylenimine (PEI), pH 7.4. 3. Washing buffer: 50 mM Tris–HCl, 500 mM NaCl2, 1 mg/ml BSA, pH 7.4. 4. 0.1 % Triton in buffer D, pH 7.4. 5. Incubator set at 37 ° C. 6. Polypropylene 96-well plate with lid. 7. Human CB1 over-expressing membranes (Merck-Millipore Co., Darmstadt, Germany). 8. MultiScreenHTS 96-well filter plate (Merck-Millipore Co., Darmstadt, Germany). 9. Vacuum pump. 10. FC-96-well plate. 11. Liquid scintillation cocktail (Ultima Gold™ XR). 12. 10 ml scintillation vials. 13. Liquid scintillation β-counter.
3 Methods 3.1 Protocol 1: CB1 Binding Assay for Tissues 3.1.1 Preparation of Membrane Homogenates
This protocol is recommended for low-throughput assays, or for just a few experiments with tissue samples. Perform all steps (Fig. 1) on ice and keep samples on ice or in a refrigerated centrifuge, in order to preserve CB1 functionality. 1. Resuspend tissue (see Note 1) in pre-cooled buffer A (fresh weight/volume ratio = 1 g/4 ml), and homogenize it on ice (see Note 2). 2. Centrifuge the membrane homogenate at 1000 g and 4 °C for 10 min. 3. Save the supernatant (S1) in a tube on ice. 4. Resuspend the pellet with the same volume of buffer A used in Step 1, and centrifuge again at 1000 g and 4 °C for 10 min. 5. Save the supernatant (S2) and add it to S1. 6. Repeat Steps 4 and 5 to obtain S3, and discard the pellet. 7. Centrifuge the collected volume (S1 + S2 + S3) at 39,000 g and 4 °C for 30 min. 8. Discard the supernatant. 9. Resuspend the resulting pellet in the smallest possible volume of cold buffer B.
CB1 Binding Assay
45
Fig. 1 Schematic representation of membrane homogenate preparation. See Subheading 3.1.1 for further details. P pellet; S supernatant
10. Calculate protein concentration with any commercially available assay, such as Bradford assay. 11. Membrane homogenate is now ready for CB1 binding assay (see Note 3). 3.1.2 Assay Using Vacuum Filtration Manifold Millipore® Model 1225
Each condition in the assay must be repeated in triplicate, in order to calculate average and standard error of the mean (S.E.M.). Prepare also three tubes that contain only pre-warmed buffer C and [3H]CP55.940 (i.e., reaction blank, Bk) (Fig. 2). All incubations are carried out at 37 °C in pre-warmed buffer C, at a final reaction volume of 500 μl. 1. For each sample, prepare three 15 ml polypropylene tubes (in triplicate), marked as TB (total binding), NSB (nonspecific binding), and SR1 (CB1 antagonist/inverse agonist SR141716). Add in each tube the reagents in the following order: (a) Pre-warmed buffer C (up to 500 μl).
Fig. 2 Schematic representation of the procedure to analyze CB1 binding activity in membrane homogenates by using filtration assay. (a) TB (total binding, that contains buffer C and membrane proteins), NSB (nonspecific binding, that contains buffer C, membrane proteins and cold CP55.940), SR1 (that contains buffer C, membrane proteins and the CB1 antagonist/inverse agonist SR141716), and Bk (blank of reaction, that contains buffer C only) tubes are pre-incubated at 37 °C for 15 min. (b) After adding [3H]CP55.940 to each tube, samples are incubated for 1 h at 37 °C. (c) At the end of the incubation, reaction is blocked by adding 2 ml of ice-cold buffer D to the tubes. (d) The content of each tube is then transferred to a GF/C Glass fiber filter, placed in the filter plate of vacuum filtration manifold, Millipore® model 1225. (e) Vacuum traps the complex [3H]CP55.940/CB1 receptor onto the glass fiber filter, while unbound radioligand is removed through cycles of washes with ice-cold buffer D and vacuum. (f) Each filter is transferred to 10 ml scintillation vial, and residual radioactivity is measured in a liquid scintillation β-counter. See Subheading 3.1.2 for further details
CB1 Binding Assay
47
(b) Membrane homogenate. For murine brain membranes, we usually use 50–100 μg/test (see Note 4). (c) CP55.940 at a final concentration of 1 μM, for NSB (see Note 5), or SR141716 at a final concentration of 0.1 μM, for SR1 (see Note 6). 2. Vortex and incubate for 15 min at 37 °C (Fig. 2a). 3. Add [3H]CP55.940. For murine brain membranes, we use it at the final concentration of 0.4 nM (see Note 7). 4. Vortex and incubate for 1 h at 37 °C (Fig. 2b). 5. In the meantime, place in a Petri dish, with tweezers, as many GF/C glass fiber filters as the number of tubes, and pre-soak them in cold buffer D (see Note 8). 6. 10 min before terminating the reaction, place (with tweezers) each filter in the numbered filter plate of the vacuum filtration manifold. 7. Turn on vacuum to remove excess of buffer D from glass fiber filters. 8. Block the vacuum. 9. Terminate reaction by adding 2 ml of ice-cold buffer D to each tube (see Note 9) (Fig. 2c). 10. Vortex and transfer each sample to the corresponding filter plate (Fig. 2d). 11. Apply vacuum (for not more than 2 min) to trap the complex [3H]CP55.940/CB1 receptor onto the filter, and remove unbound radioligand (see Notes 10 and 11) (Fig. 2e). 12. Block the vacuum. 13. Wash each tube with 2 ml of ice-cold buffer D. 14. Repeat steps 11–13. 15. Wash each filter twice with 2 ml of ice-cold buffer D (Fig. 2e). 16. Apply vacuum. 17. Block the vacuum and allow filters to dry at room temperature (see Note 12). 18. Transfer with tweezers each dried filter in the corresponding scintillation vial, containing 500 μl of 0.1 % Triton in buffer D. 19. Add 3.5 ml of liquid scintillation cocktail, and read radioactivity by a scintillation β-counter (see Note 13) (Fig. 2f). 3.2 Protocol 2: CB1 Binding Assay for Adherent Living Cells
Each condition in the assay must be repeated in triplicate, in order to calculate average and S.E.M. All incubations are carried out at 37 °C in pre-warmed incubation buffer (final volume of reaction for 24-well plate = 300 μl).
48
Valeria M. Catani and Valeria Gasperi
1. Plate cells in order to reach 90–100 % confluence on the day of the assay (see Note 14). For each sample, prepare three wells (in triplicate), marked as TB (total binding), NSB (nonspecific binding), and SR1 (CB1 antagonist/inverse agonist). For blanks (Bk), add culture medium to three wells, without cells. 2. On the day of the experiment, carefully wash each well twice with 1 ml of PBS. 3. After removing PBS, add to each well incubation buffer up to 300 μl. 4. Add CP55.940 for NSB (at a final concentration of 1 μM for HeLa cells) (see Note 5), or SR141716 (at a final concentration of 0.1 μM for HeLa cells), for SR1 (see Note 6). 5. Incubate for 10 min at 37 °C. 6. Add [3H]CP55.940 (at a final concentration of 2.5 nM for HeLa cells) (see Note 7). 7. Incubate for 1 h in an incubator set at 37 °C. 8. At the end of the incubation, carefully remove the incubation buffer. 9. Carefully rinse cells 4 times with 1 ml of ice-cold washing buffer. 10. After removing washing buffer, add 300 μl of 0.5 M NaOH, and pipet up and down for several times to lyse cells. 11. Transfer solution to a 10 ml scintillation vial. 12. Add 3.5 ml of liquid scintillation cocktail, and immediately read radioactivity in a scintillation β-counter. 3.3 Protocol 3: CB1 Binding Assay for High-Throughput Screening
Each condition in the assay must be repeated at least in triplicate, in order to calculate average and S.E.M. Prepare also three wells that will contain only pre-warmed binding buffer and [3H] CP55.940 (i.e., blank of reaction, Bk). All incubations are carried out at 37 °C in pre-warmed binding buffer, at a final reaction volume of 200 μl. 1. Add the reagents to each well of a polypropylene 96-well plate, in the following order: (a) Pre-warmed binding buffer (up to 200 μl). (b) CB1 over-expressing membranes (10 μg/well, except for the blanks). (c) CP55.940 for NSB, SR141716 for SR1 (see Notes 4 and 5), or test compounds (see Note 15). 2. Cover the lid and carefully shake the plate. 3. Incubate for 20 min at 37 °C. 4. Add [3H]CP 55.940 at the final concentration of 2.5 nM, to start the reaction.
CB1 Binding Assay
49
5. Cover the lid and carefully shake the plate. 6. Incubate for 1 h at 37 °C. 7. In the meantime, pre-soak FC-filter plate with 200 μl of 50 mM Tris–HCl containing 0.33 % PEI (see Note 8). 8. 10 min before terminating the reaction, turn on vacuum to remove PEI from filters. 9. Wash filters 3 times in washing buffer. 10. Transfer reaction solution from 96-well plate to the FC-filter plate, and filter by turning on vacuum. 11. Wash 4 times with 300 μl of washing buffer. 12. Allow filters to dry, by placing the plate for 30 min in an incubator at 37 °C. 13. Transfer each filter to the corresponding scintillation vial containing 500 μl of 0.1 % Triton in buffer D. 14. Add 3.5 ml of liquid scintillation cocktail and read radioactivity in a scintillation β-counter (see Note 13). 3.4 Data Analysis
It is recommended to repeat each condition in the assay at least in triplicate, in order to calculate mean and S.E.M.
3.4.1 Protocols 1 and 2
To calculate CB1 binding activity (usually expressed as fmol or pmol per mg of membrane protein), do as follows: 1. Subtract disintegrations per minute (DPM) mean value of blank (Bk) from every other mean value. 2. Calculate SB by subtracting DPM relative to NSB from those relative to TB. 3. Knowing that 1 nCi corresponds to 2200 DPM, convert DPM in nCi. 4. To calculate moles of bound [3H]CP55.940 to CB1, divide the obtained nCi for the specific activity of [3H]CP55.940 (such a value, expressed as Ci/mmol, is reported in the datasheet provided by the manufacturer) (see Note 16). 5. Divide the moles by the mg of proteins used in the assay (see Note 17). 6. Calculate SR141716 displacement according to the formula: % of inhibition = 100 -
[3H ] CP55.940 SB - SR141716 SB [3H ] CP55.940 SB
7. Calculate differences among two or more groups by inferential statistics: Student’s t–test (unpaired or paired data) or
50
Valeria M. Catani and Valeria Gasperi
Mann Whitney U test/Wilcoxon’ signed ranks test; ANOVA (or repeated-ANOVA) with Bonferroni post hoc test or Kruskal– Wallis test, followed by Mann–Whitney U test. 3.4.2 Protocol 3
To calculate IC50 and Ki values of novel CB1 ligands (agonists/ antagonists/inverse agonists), calculate SB of [3H]CP55.940 (see above how to convert DPM of SB into fmol or pmol per mg of membrane proteins), in the presence of unlabeled test compound at each concentration tested. By using GraphPad Prism software for Science (San Diego, CA), plot each value and determine IC50 and Ki values by nonlinear regression analysis of onesite competition binding curve. It should be stressed that Ki is dependent on IC50 value, as indicated by the Cheng and Prusoff equation: Ki = IC50 / éë1 + ([ L] / K D ) ùû
where [L] is the fixed concentration of [3H]CP55.940 used in the assay, and KD is its equilibrium dissociation constant (see Table 1 and Fig. 3). Therefore, prior to performing competition binding studies, you should know (or eventually calculate through saturation binding assay) KD value of the radioligand used.
Table 1 Experimental data of heterologous competition binding studies performed by incubating membranes over-expressing human CB1 receptor with 2.5 nM [3H]CP55.940, and increasing concentrations (0–1000 nM) of SR141716 [SR141716]a
Specific binding of [3H]CP 55.940b
0.00
17,088.23 ± 558.42
0.10
16,344.45 ± 281.93
0.50
15,353.87 ± 128.72
1.00
11,165.90 ± 272.95
2.50
10,851.56 ± 92.94
5.00
10,288.43 ± 203.93
10.00
5500.12 ± 291.70
100.00
1725.14 ± 77.32
1000.00
526.40 ± 18.21
Values are the means ± S.E.M. of three independent experiments, each performed at least in quintuplicate a The concentration of SR141716 is expressed as nM b Binding values are expressed as fmol/mg of membrane protein
CB1 Binding Assay
[3H]CP55.940 binding (fmol/mg prot)
a
51
20000
15000
10000
5000
0 −15.0
−12.5
−10.0
−7.5
−5.0
−2.5
0.0
2.5
5.0
[SR141516], nM
b
Best-fit values Bottom Top LogIC50 IC50 Ki
820.2 16397 0.6836 4.826 3.666
[3H]CP 55.940 (Constant)
2.500
[3H]CP 55.940 KD *(Constant) Std. Error Bottom Top
7.900
LogIC50
0.06064
474.9 375.8
95% confidence Intervals Bottom Top LogIC50
−145.5 to 1786 15633 to 17161 0.5603 to 0.8069
IC50 Ki Goodness of Fit
3.633 to 6.411 2.760 to 4.870
Degrees of Freedom
34
2
R
0.9569
Fig. 3 Representative heterologous competition curve of SR141716 against [3H]CP55.940 binding to membrane preparations over-expressing CB1. Binding assays were performed in our laboratory by using MultiScreenHTS 96-well filter plate, as described in Subheading 3.3. (a) Human CB1 over-expressing membranes (10 μg/test) were incubated with 2.5 nM [3H]CP55.940 in the presence of increasing concentrations (0–1000 nM) of unlabeled SR141716. (b) Experimental data (reported in Table 1) were used to calculate IC50 and Ki values by nonlinear regression analysis of one-site competition binding curve, through GraphPAD Software for Science version 5 (San Diego, CA). *To calculate IC50 and Ki values of SR141716, we have previously calculated KD (obtained value = 7.9 ± 1.9 nM) of hot CP55.940 through saturation binding assays
4 Notes 1. We recommend to work with fresh tissues; if it is not possible, keep tissues frozen at −80 °C until the day of the assay, and thaw them on ice in the presence of pre-cooled buffer A.
52
Valeria M. Catani and Valeria Gasperi
2. For soft tissues (like brain), homogenize samples with a Glass/ Teflon Potter homogenizer. To facilitate homogenization of fibrous tissues (e.g., muscle), prior1 to using Glass/Teflon Potter homogenizer, mince samples with scissors and, then, with an Ultra-Turrax T25. 3. Membrane homogenates from fresh tissues can be aliquoted, frozen on dry ice, and stored at −80 °C for no longer than one week. In order to preserve receptor binding activity, do not store membranes from frozen tissues, but proceed immediately with CB1 receptor binding assay. 4. Protein concentration to be used in the assays depends on CB1 receptor expression levels; thus we recommend to perform a dose–response curve for unknown biological samples. 5. In addition to binding to receptors of interest (specific binding, SB), radioligands can also interact nonspecifically (nonspecific binding, NSB) with proteins that are not of interest, as well as with the tube walls (during incubation) or with the filters. To overcome this problem, use an excess of CP55.940 at a final concentration that is at least 1000-fold higher than that used for [3H]CP55.940. Indeed, in the presence of an excess of cold CP55.940, CB1 receptors are virtually all occupied by the unlabeled ligand, and hence the hot ligand can only bind to nonspecific sites. Ideally, NSB should be less than 50 % of the Total Binding (TB). 6. SR141716 is a highly potent antagonist/inverse agonist of CB1 that displays almost 300-fold selectivity for CB1 over type-2 cannabinoid receptor (CB2); Ki values are 1.800 ± 0.075 nM and 514 ± 30 nM, respectively [2]. Therefore, we recommend to use SR141716 at a concentration lower than the Ki value for CB2. 7. [3H]CP55.940, as other tritiated ligands, has high specific activity; therefore, we recommend to use it at a concentration equal or below its KD value. For unknown samples, calculate [3H]CP55.940 KD through saturation binding experiments that measure TB and NSB at various concentrations of hot CP55.940. Calculate KD and Bmax for specific binding, by using a one-site binding hyperbola nonlinear regression analysis (i.e., with GraphPad Prism), as shown in Table 2 and Fig. 4. 8. To minimize ligand binding to filters, you can also pre-soak glass fiber filters in 0.1–0.5 % PEI (a cationic polymer that neutralizes the negative charge of the glass fiber filter) in buffer D. Prior to filtration of receptor sample, filter PEI solution away, and then wash with ice-cold buffer D for at least three times.
CB1 Binding Assay
53
Table 2 Experimental data of saturation binding assay of [3H]CP55.940 to murine brain membrane homogenate ([3H]CP 55.940)a
Total binding (TB)b
Nonspecific binding (NSB)b
Specific binding (SB)b
0.10
372.50 ± 17.65
77.49 ± 5.95
295.01 ± 14.62
0.25
751.46 ± 29.94
152.94 ± 11.09
598.52 ± 27.84
0.50
1199.12 ± 19.33
272.49 ± 39.45
926.63 ± 20.10
1.00
3175.15 ± 145.71
596.71 ± 51.70
2578.44 ± 154.68
2.50
6418.74 ± 233.15
1288.23 ± 50.84
5130.51 ± 245.02
5.00
8997.04 ± 267.42
2556.41 ± 85.48
6440.63 ± 376.47
10.00
11,941.20 ± 536.31
3849.46 ± 312.21
8091.74 ± 653.32
Values are the means ± S.E.M. of three independent experiments, each performed in triplicate a The concentration of [3H]CP 55.940 is expressed as nM b Binding values are expressed as fmol/mg of membrane protein
9. A drastically reduced temperature (with ice-cold buffer D) during the washing step will prevent and/or slow down dissociation of bound ligands from CB1. 10. Control vacuum pump in order to have enough pressure to rapidly filter the samples and prevent ligand dissociation, yet without affecting filter integrity or the amount of membranes retained on the filter. If possible, use a control pressure valve. 11. Time of filtration negatively correlates with ligand KD; it can range from 20 min for ligands with a KD = 0.1 nM, to 10 s for ligands with a KD = 10 nM. 12. Dry filters require less liquid scintillant to achieve maximum signal than wetted filters. If filters are not completely dried prior to the addition of scintillation liquid cocktail, the residual water present in the filters can interact with the scintillant, thus reducing counting efficiency. 13. Since radioligand embedded within the filter requires some time to become accessible to the liquid scintillant, read radioactivity in the vial at least after 6 h of incubation. 14. We usually plate HeLa cells the day before the experiment, at a concentration of 100,000 cells/well, in a 24-well plate. We recommend to set up a growth curve with different cell types, in order to optimize cell concentration. 15. We advise to use at least 6–8 concentrations for each test compound: the lowest concentration should be at least 1/10 of KD for CP55.940, while the highest concentration should be approximately 10-fold over such KD (see Table 2 and Fig. 4).
54
Valeria M. Catani and Valeria Gasperi
a
15000
TB SB NSB
[3H]CP55.940 binding (fmol/mg prot)
12500
10000
7500
5000
2500
0
0
2
4
6
8
10
12
[[3H]CP55.940], nM
b
Best-fit values Bmax Kd Std. Error Bmax
10773 3.224 560.8
Kd
0.4104
95% confidence Intervals Bmax Kd Goodness of Fit
9637 to 11909 2.393 to 4.055 38
Degrees of Freedom
0.9682
Fig. 4 Representative saturation curve of [3H]CP55.940 binding to whole brain membrane homogenates, performed in our laboratory. Binding assays were performed by using a vacuum filtration manifold, Millipore® model 1225, as described in Subheading 3.1.2. (a) Increasing concentrations (0–10 nM) of the synthetic agonist of CB receptors [3H]CP55.940 were incubated with whole brain membrane homogenates (50 μg/test), in the absence [Total Binding (Filled square TB)] or in the presence of 1 μM unlabeled CP55.940 [Nonspecific Binding (triangle NSB)]. NSB mean values were subtracted to relative TB mean values, in order to obtain Specific Binding (circle SB). (b) Experimental data (reported in Table 2) were used to calculate Bmax (expressed as fmol/mg membrane protein) and KD (expressed as nM), by using nonlinear regression analysis for one-site binding hyperbola, through GraphPAD Software for Science version 5 (San Diego, CA)
16. If data are expressed as CPM (counts per min), you need to know the efficiency of your β-counter for [3H], in order to apply the following formula: Efficiency = Net CPM of standard / known DPM of standard. 17. In case of CB1 receptor binding assay performed with intact living cells, data may also be reported as fmol or pmol per 106 cell. In this case, it is important to know the exact amount of confluent cells in the well.
CB1 Binding Assay
55
References 1. Matsuda LA, Lolait SJ, Brownstein MJ et al (1990) Structure of a cannabinoid receptor and functional expression of the cloned cDNA. Nature 346:561–564 2. Pertwee RG, Howlett AC, Abood ME et al (2010) International Union of Basic and Clinical Pharmacology. LXXIX. Cannabinoid receptors and their ligands: beyond CB1 and CB2. Pharmacol Rev 62:588–631 3. Tantimonaco M, Ceci R, Sabatini S et al (2014) Physical activity and the endocannabinoid sytem: an overview. Cell Mol Life Sci 71:2681–2698 4. Gasperi V, Evangelista D, Savini I et al (2015) Downstream effects of endocannabinoid on
blood cells: implications for health and disease. Cell Mol Life Sci 72:3235–3252 5. Mechoulam R, Parker LA (2013) The endocannabinoid system and the brain. Annu Rev Psychol 64:21–47 6. Gatta-Cherifi B, Cota D (2015) Newinsights on the role of the endocannabinoid systemin the regulation of energybalance. Int J Obes (Lond). doi:10.1038/ijo.2015.179 7. Rinaldi-Carmona M, Barth F, Heaulme M et al (1994) SR141716A, a potent and selective antagonist of the brain cannabinoid receptor. FEBS Lett 350:240–244
Chapter 6 The Displacement Binding Assay Using Human Cannabinoid CB2 Receptor-Transfected Cells Maria Grazia Cascio, Pietro Marini, and Roger G. Pertwee Abstract Displacement binding assays are nonfunctional assays mostly used with the aim of determining whether a certain compound (plant-derived or synthetic) is able to bind to a specific receptor with high affinity. Here, we describe the displacement binding assay that is carried out with a radioligand and CHO (Chinese Hamster Ovarian) cells stably transfected with the human cannabinoid CB2 receptor. Key words Binding, Cannabinoid CB2 receptors, Agonist, Antagonist, Ligand, Radioligand, Affinity
1
Introduction The aim of radioligand-binding experiments is to study the binding of drugs to specific receptors. Drugs that bind to a receptor and mimic the action of an endogenous ligand by inducing a biological response are defined as agonists. On the other hand, competitive antagonists are also able to bind to a receptor, but unlike agonists, they do not induce a biological response themselves, but instead, block the action of an agonist or endogenous transmitter. It is difficult to differentiate agonists from antagonists by using radioligand displacement binding assays; thus such compounds are referred to in these assays as ligands [1]. To perform displacement binding assays, the values of two parameters need to be known: (1) the equilibrium dissociation constant (KD), which is the concentration of ligand that will occupy 50 % of the receptors, and (2) the Bmax, which is the total density of the receptors under investigation in that preparation. Specifically, the KD (unit M) gives an idea about the strength of the binding of a ligand to its receptor; the lower this value, the higher the affinity of the ligand for that particular receptor. The Bmax is expressed as amount of ligand bound/ mg of protein. Importantly, the determination of the maximum density of receptors in a particular tissue can be done using
Mauro Maccarrone (ed.), Endocannabinoid Signaling: Methods and Protocols, Methods in Molecular Biology, vol. 1412, DOI 10.1007/978-1-4939-3539-0_6, © Springer Science+Business Media New York 2016
57
58
Maria Grazia Cascio et al.
a radioligand binding assay. The values of both KD and Bmax can be determined using “Saturation Binding Assays,” detailed descriptions of which can be found elsewhere [2, 3]. Here we describe the displacement binding assay that is carried out using Chinese Hamster Ovarian (CHO) cells stably transfected with the human cannabinoid CB2 receptor. This assay requires the use of a radioligand, and hence can only be performed by suitably qualified researchers (registered radiation workers). Ideal candidates for radiolabeling are compounds with: (a) high affinity for the receptor under investigation (KD in the low nanomolar range), (b) low nonspecific binding, (c) receptor selectivity, and (d) high specific activity that will increase the sensitivity of the assay. In experiments directed at determining the affinity of certain ligands for cannabinoid CB2 receptors, we use tritiated CP55,940 (also known as [3H]CP55,940). Thus, CP55,940 is a well-established, high affinity ligand for these receptors that does however lack selectivity (it also binds potently to the cannabinoid CB1 receptor). Because of this nonselectivity, it is recommended that binding assays with [3H]CP55,940 are performed with, for example, CB2-transfected cells, or their membranes, rather than with tissues that naturally express both CB1 and CB2 receptors. The method used in our laboratory to perform displacement binding assays is very simple and involves three main steps: (1) cell culturing and scraping; (2) performance of the assay; and (3) analysis of the results.
2 2.1
Materials Cell Culturing
1. Cells: CHO cells transfected with cDNA encoding human CB2 receptors are commercially available (e.g., ValiScreen Cannabinoid CB2 (human) cell line, Perkin Elmer, USA). 2. Culture medium: use sterile Dulbecco’s modified Eagle’s medium nutrient mixture F-12 HAM, supplemented with 1 mM L-glutamine, 10 % fetal bovine serum (FBS), 1 % penicillin–streptomycin, and 0.6 % G418 [3,5-dihydroxy-5-methyl4- methylaminooxan-2-yl[oxy-2-hydroxycyclehexy]oxy2-(1-hydroxyethyl0oxane-3,4-diol;400 mg/ml]. 3. Nonenzymatic cell dissociation solution: dissolve 1 mM EDTA in distilled water, and then sterilize this solution by using an autoclave (see Note 1). 4. Use phosphate buffer saline (PBS); this is commercially available. 5. For cell culturing use plastic flasks (surface cell culture: 80 cm2). 6. To expand the cells, use plastic flasks (surface cell culture: 175 cm2).
Assay of CB2 Binding
2.2 Radioligand Displacement Binding Assay
59
This assay is carried out in nonsterile conditions; thus, all the following solutions are nonsterile. 1. Test compounds: dissolve the compounds under investigation in the appropriate solvent (e.g., dimethyl sulfoxide; DMSO) at a concentration of 10 or 100 mM, splitting the solution into 50 μl aliquots and storing each aliquot at −20 °C (see Note 2). 2. Prepare the binding/washing buffer (Tris/BSA buffer) in distilled water as follows: 50 mM Tris HCl, 50 mM Tris Base, 0.1 % w/v bovine serum albumin (BSA), pH 7.4. 3. To target cannabinoid CB2 receptors, use [3H]CP55,940 as the radioligand (e.g., provided by PerkinElmer). 4. To determine the amount of nonspecific binding, prepare a solution of CP55,940 in DMSO at a concentration of 1 mM. 5. To perform the assay, use plastic 96 deep-well plates. 6. The assay is stopped by vacuum filtration, using a 24-well sampling manifold (e.g., Brandel Cell Harvester) and Brandel GF/B filters (see Note 3). 7. To quantify the radioactivity, the filters are oven-dried (85 °C, 60 min) and then placed in 5 ml of scintillation fluid (e.g., Ultima Gold XR, PerkinElmer) and counted by liquid scintillation spectrometry (Beta counter).
3 3.1
Methods Cell Culturing
Perform the following steps under sterile conditions. 1. Monolayers of human CB2-transfected CHO cells are maintained at 37 °C and in 5 % CO2 in medium flasks (surface cell culture: 80 cm2), and are passaged twice weekly using a nonenzymatic cell dissociation solution (1 mM EDTA). 2. When cells reach 80–85 % confluence, remove medium from the flask, wash the cells with 10 ml of PBS, add 5 ml of nonenzymatic cell dissociation solution, place the flask in an incubator (at 37 °C) for 2–3 min, gently detach the cells, and add 5 ml of culture medium. 3. Expand cells by adding 2 ml of medium (containing the cells) to 25 ml of culturing medium by using four big flasks (surface cell culture: 175 cm2). To keep the cell line, add 1 ml of the medium containing the cells to 25 ml of culturing medium in a medium flask (surface cell culture: 80 cm2). 4. Place both medium and big flasks in an incubator (37 °C and in 5 % CO2) until confluence is reached (see Note 4). 5. When confluence is reached (80–85 %), remove cells from the flasks by scraping and then freeze them as pellets at −20 °C until they are required.
60
Maria Grazia Cascio et al.
6. On the day of the experiment, defrost cells, dilute in Trisbuffer that does not contain BSA (50 mM Tris HCl and 50 mM Tris Base), and homogenize with a 1-ml handheld homogenizer. 7. Perform a protein assay (e.g., by using a Bio-Rad Dc kit, Hercules, CA, USA) (see Note 5). 3.2 Displacement Binding Assay
1. The assay is carried out using 96 deep-well plates in a total volume of 500 μl, using Tris/BSA buffer. 2. Using Tris/BSA buffer and stock solutions of each test compound (e.g., 10 mM in DMSO), prepare decreasing concentrations of the test compound so that a dose–response curve can be drawn (see Note 6). Also prepare a control solution by using Tris/BSA buffer, with the same % of vehicle (e.g., DMSO) present in each diluted solution (e.g., 0.1 %). 3. Using Tris/BSA buffer and a stock solution of CP55,940 (1 mM), prepare a solution of CP55,940 (10 μM) that will be used to determine the nonspecific binding (concentration in the assay is 1 μM). 4. Prepare [3H]CP55940 in Tris/BSA buffer at the appropriate concentration (see Note 7). 5. Using Tris/BSA buffer, prepare a solution of proteins (from the pellet of hCB2-transfected cells) so that a known amount of proteins can be added (in our experiments we use 25 μg of proteins) (see Note 8). 6. Pipette 350 μl of Tris/BSA buffer, 50 μl of [H3]CP55940 at an appropriate concentration (e.g., 0.7 nM), 50 μl of varying concentrations of the test drug, and 50 μl of cell membranes at an appropriate dose (e.g., 25 μg) into the wells of a 96 deepwell plate, progressing along each row from left to right. 7. Incubate the 96 well plates at 37 °C in a darkened water bath for 60 min. 8. Terminate the assay by adding ice-cold Tris/BSA buffer and then performing rapid vacuum filtration with a 24-well sampling manifold (e.g., Brandel Cell Harvester), and Brandel GF/B filter papers that have been soaked in Tris/BSA buffer at 4 °C for 24 h. 9. Wash each well 3/4 times with Tris/BSA buffer. 10. Dry the filter papers in an oven for 60 min at 85 °C. 11. Place each of these filter papers in a different scintillation vial and add 4 ml of scintillation fluid. 12. After soaking each filter paper in the scintillation fluid for 60 min, measure radioactivity with a beta counter. Values will be in cpm (counts per minute).
61
Assay of CB2 Binding
3.3 Analysis of the Results
1. The percentage (%) of “specific binding” is calculated as follows: mean cpm for control - mean cpm for CP55, 940 (1 M ) mean cpm for control
´ 100
2. The percentage of any displacement produced by each concentration of the test compound is calculated as follows: mean cpm for control - mean cpm for ligand at a particular concentration ´ 100 mean cpm for control - mean cpm for CP55, 940 (1 M )
4
Notes 1. The cell dissociation solution is also commercially available. 2. Avoid multiple thawing of the same aliquot, since this may result in the degradation of chemically unstable compounds. We recommend that the same aliquot is not used more than twice. 3. Before use, filters are soaked in Tris/BSA buffer at 4 °C for at least 24 h. 4. CHO cells grow up quickly. Usually, confluence is reached after 3 days. 5. The protein assay can be carried out as follows: (a) Prepare standards and unknown(s) (X) as shown in the table (Table 1) below (this scheme is suitable for a Biorad Kit). (b) Add the KIT manufacturer).
reagents
(as
described
by
the
(c) After 15 min read absorbance at 750 nm. (d) Construct the BSA standard curve by using the absorbance values of each standard solution (see table above), in order to perform linear regression analysis (e.g., using GraphPad Prism software). (e) Determine the concentration (mg/ml) of proteins in your sample (X), by using the above BSA standard curve to interpolate the absorbance value of your sample, then multiply the value obtained by 2 (this is the cell dilution factor; e.g., as described above, we added 50 μl of Trisbuffer to 50 μl of cell solution, thus we have diluted the cells by a factor of two). (f) Make a solution containing cells at a known concentration for use in the assay.
62
Maria Grazia Cascio et al.
Table 1 BSA standard curve for the quantification of the content of unknown proteins A
B
C
D
E
F
Conc (mg/ml)
1.5
0.75
0.45
0.3
0.15
X
Standard BSA (μl)
100
50
30
20
10
50
Tris-Buffer (no BSA) (μl)
–
50
70
80
90
50
Please note that: (1) A–E are the concentrations of BSA used to build the BSA standard curve, which in turn is used to determine the concentration of proteins in your sample, and (2) by adding 50 μl of Tris-Buffer to 50 μl of cell solution, your sample is diluted twice and this should be taken into account in the calculation of the cell sample concentration
6. To construct a log concentration-response curve for the compound under investigation, prepare a stock solution by dissolving the test compound in DMSO (e.g., 10 mM), and then making serial dilutions to obtain solutions that have one of the following concentrations (X): 10, 1 μM, 100, 10, and 1 nM, ensuring that the concentration of vehicle in each solution remains constant (e.g., 0.1 %). Please note that: (1) each of these concentrations should be 10X, since 50 μl of each solution is added in the assay in a final volume of 500 μl (thus the solution will be diluted 10 times), and (2) in a sigmoidal log concentration-response curve, these concentrations are expressed as log M (Fig. 1). Example of Drug Dilutions (from a 10 mM stock solution in DMSO) Please note that the dilutions indicated on the left side of the scheme below should be made by using your stock solution solvent (in this case, DMSO). Assay Conc 10 mM 20:180
1 mM 20:180
0.1 mM 20:180
10 µM
20:180
1 µM
10:990 Trib/BSA buffer 10:990 Tris/BSA buffer 10:990 Tris/BSA buffer 10:990 Tris/BSA buffer 10:990 Tris/BSA buffer
100 µM
10000 nM
10 µM
1000 nM
1 µM
100 nM
100 nM
10 nM
10 nM
1 nM
7. The concentration of [3H]CP55940 we use in our experiments is 0.7 nM. The binding parameters (Bmax and KD) for [3H] CP55940 are determined by fitting data from saturation-
Assay of CB2 Binding
63
Fig. 1 Displacement of [3H]CP55940 by compound A from specific binding sites on hCB2 CHO cell membranes. Each symbol represents the mean percentage displacement ± SEM
binding experiments to a one-site saturation plot by using GraphPad Prism. For commercially available cells stably transfected with human CB2, like the ones we use in our laboratory, these parameters are provided by the manufacturer. 8. Before any displacement binding assay is carried out, the protein content should be optimized by testing increasing concentrations of proteins versus a constant concentration of [3H] CP55,940. References 1. Bigott-Hennkens HM, Dannoon S, Lewis MR et al (2008) In vitro receptor binding assays: general methods and considerations. Q J Nucl Med Mol Imaging 52:245–253 2. Zettner A (1973) Principles of competitive binding assays (saturation analysis).
Equilibrium techniques. Clin Chem 19: 699–705 3. Zettner A, Duly PE (1974) Principles of competitive binding assays (saturation analyses). II. Sequential saturation. Clin Chem 20:5–14
Chapter 7 Assay of TRPV1 Receptor Signaling Aniello Schiano Moriello and Luciano De Petrocellis Abstract The transient receptor potential vanilloid-1 ion channel (TRPV1) is a non-selective ligand-gated cation channel. It is an integrator of a wide variety of exogenous and endogenous physical and chemical stimuli, including capsaicin, noxious heat (>42 °C), and protons (pH 42 °C) and low pH (90 % confluent prior to harvesting for the assay.
3.2 Ligands Under Investigation
1. High-throughput screening can be performed using a single high final concentration (often 10 μM) of each ligand. Instead, full dose-response curves of ligands are necessary for determination of their potency and efficacy. 2. Stock solutions of ligands under investigation are made in DMSO (or acetonitrile for endocannabinoids). These stock solutions should be diluted to the desired concentration in cell culture medium. Make sure that there is an equal amount of organic solvent (e.g., DMSO or acetonitrile) present in every dilution (see Note 3). For agonistic assays, compound dilutions should be five times the desired final concentration, while for antagonistic assays (and the EC80 of a reference agonist) the pre-made concentrations should be ten times the desired final concentration.
Protocol to Study β-Arrestin Recruitment by CB1 and CB2…
107
3. In all assays, also the Emax of a reference full agonist should be taken (e.g., CP55,940 at a final concentration of 10 μM). 3.3 PathHunter® Assay Protocol
1. Cells are harvested by adding 1 ml of Trypsol.
3.3.1 Plating Cells
3. Inactivate trypsin solution by addition of 4 ml of cell culture medium.
2. Incubate for a maximum of 5 min at 37 °C and 5 % CO2.
4. Transfer to Falcon tube and spin down (5 min at 1000 × g). 5. Resuspend pellet in 1 ml of cell culture medium, and count living cells by adding 10 μl of cell suspension to 10 μl of trypan blue. 6. Dilute the cells further with cell culture medium, to get a density of 2.5 × 10⁵ cells/ml (=5000 cells/well). 7. Add 20 μl of cell suspension per well in the 384-well plate. Make sure that you fill enough wells for background measurements, i.e., 3 wells containing only medium (negative control) and 3 wells containing unstimulated cells (basal activity). In case of antagonistic assay, include also 3 wells containing cells stimulated by EC80 of the reference agonist (positive control that is used as Emax). 8. Incubate cells overnight (between 16 and 18 h) at 37 °C and 5 % CO2. 3.3.2 Treatment of Cells and Incubation
Antagonistic assay: 1. Dilute antagonists of interest into cell culture medium to 10× the desired final concentration. 2. Add 2.5 μl of antagonist solution per well. 3. Incubate for 30 min at 37 °C and 5 % CO2. 4. Add 2.5 μl of a 10× EC80 solution of CP55,940, also to wells for background measurements (EC80 of CP55,940 needs to be determined prior to the assay). 5. Make sure that there is an equal amount of DMSO or acetonitrile in all wells (≤1 % per well), including those for background measurements. 6. Incubate for 90 min at 37 °C and 5 % CO2. Agonistic assay: 1. Dilute agonists of interest into cell culture medium to 5× the desired final concentration. 2. Add 5 μl of agonist solution per well. 3. Make sure that there is an equal amount of DMSO or acetonitrile in all wells (≤1 % per well), including those for background measurements. 4. Incubate for 90 min at 37 °C and 5 % CO2.
108
Marjolein Soethoudt et al.
3.3.3 Detection and Measurements
1. Add 12 μl of detection mixture to each well that contains cells, as well as to 3 empty wells to measure background luminescence. 2. Incubate for 60 min in the dark at RT. 3. Measurement of the chemiluminescence of the plate can be done by any multi-mode or luminescence plate reader (see Note 4).
3.4
Data Analysis
Raw experimental data is analyzed by using the nonlinear regression curve fitting program GraphPad Prism. Potency, inhibitory potency, or efficacy values (EC50, IC50, or Emax, respectively) of ligands can be obtained by choosing the nonlinear regression option “log (agonist or inhibitor) vs. response.” All data points are corrected for both background luminescence and negative control. The response of agonists in each sample is normalized to the effect of a reference agonist (e.g., 10 μM CP55,940), and the response of antagonists is normalized to the EC80 of a reference agonist (e.g., CP55,940). Basal activity of the cells is set at 0 %.
3.5
Results
We applied the protocol described here to characterize the well-known cannabinoid receptor reference ligands CP55,940, Rimonabant, SR144528, JWH133, and WIN55212-2 (see Fig. 2 and Table 1). Our findings correlate well with literature data [6, 13, 16].
3.6
Conclusions
The Pathunter® β-arrestin recruitment assay is easy to use and delivers reproducible results. In addition, its 384-well format enables high-throughput screening, a useful feature in early drug discovery research. We successfully applied this assay to characterize a set of cannabinoid receptor reference ligands, and would therefore recommend its use to other researchers in the field.
4
Notes 1. Perkin Elmer’s white-walled 384-well assay plates are delivered in a sterile environment, and they should be kept that way by opening them only in an appropriate flow cabinet. Do not touch the plates at the bottom, because greasy fingerprints can give extra background and/or decrease reading efficiency of the plate reader. Also make sure that there is no dust in the wells, because this will give extra background and will increase well-to-well variation. 2. All PathHunter™ detection reagents should be aliquoted in Eppendorf tubes and stored at −20 °C upon receipt. Reagents can only be thawed and refrozen two times. When the reagents
Protocol to Study β-Arrestin Recruitment by CB1 and CB2…
109
Fig. 2 Dose-response curves of cannabinoid ligands on β-arrestin recruitment in PathHunter® CHOK1hCB1_ bgal or CHOK1hCB2_bgal cells. (a and b) Basal activity of the cells was set at 0 %, and the efficacy was calculated as a percentage of the maximum effect induced by 10 μM CP55,940 (set at 100 %). (c) Cells were pre-incubated with the EC80 concentration of CP55,940 (25 nM or 46 nM for the CB1 or CB2 receptor, respectively) for 30 min, and then they were treated with varying antagonist concentrations. The potency of antagonists was calculated as a percentage of the maximum effect induced by the EC80 concentration of CP55,940 (set at 100 %). The present results were obtained from three or four (with CP55,940) independent experiments, performed in duplicate
Table 1 Potency and efficacy data of cannabinoid receptor ligands obtained with the PathHunter® β-arrestin recruitment assay hCB2
hCB1
Agonists
pEC50 ± SEM
Emax ± SEM
pEC50 ± SEM
Emax ± SEM
WIN55212-2
7.95 ± 0.41
82 ± 8
6.80 ± 0.21
109 ± 7
CP55,940
8.54 ± 0.11
100 ± 1
8.25 ± 0.2
99 ± 1
JWH133
7.97 ± 0.16
73 ± 3
5.56 ± 0.05
33 ± 3
Antagonists
pIC50 ± SEM
Max inhibition ± SEM
pIC50 ± SEM
Max inhibition ± SEM
Rimonabant
5.36 ± 0.04
−89 ± 3
8.26 ± 0.04
−105 ± 1
SR144528
7.11 ± 0.18
−133 ± 5
5.56 ± 0.13
−82 ± 5
The values shown are obtained from three or four (CP55,940) independent experiments performed in duplicate
110
Marjolein Soethoudt et al.
are used for the detection mixture, they are thawed to RT in the dark, and then are mixed in the abovementioned ratio. Once the detection mixture is made, it is stable for 24 h at RT in the dark. 3. Stock solutions of ligands under investigation are made in DMSO or acetonitrile. Always make sure that there is an equal amount of organic solvent present in every dilution (≤1 %), in order to avoid disturbances due to the solvent. To obtain an equal concentration of organic solvent in every dilution, a dilution series in 100 % DMSO or acetonitrile should be made that is no less than 100× (agonist) or 200× (EC80 reference agonist or antagonist) the desired final concentration. Dilute this series accordingly in cell culture medium to 5× or 10× the desired final concentration, depending on whether an agonistic or antagonistic assay is performed. 4. The exposure time to read samples can depend on the instrument used. For example, the settings for a Wallac EnVision™ 2104 Multilabel reader should be: (a) Instrument settings: EnVision Single emission, with single emission mirror block. (b) Filters: ●
Emission filter Luminescence 700.
●
Mirror module Luminescence.
(c) Install the emission filter in the Emission Filter Slides correctly. The filters must occupy adjacent slots in the Emission Filter Slide. (d) The mirror needs to be manually changed to the top position within the machine, and selected in the software before use. (e) Allow the lamp to warm up for at least 10 min. (f) Use protocol LUM Single (1.0 s read).
Acknowledgements The authors wish to thank DiscoveRx for their technical assistance.
Protocol to Study β-Arrestin Recruitment by CB1 and CB2…
111
References 1. Rang HP, Dale MM, Ritter JM et al (2008) Rang and Dale’s pharmacology, 6th edn. Elsevier, Edinburgh 2. Hamm HE (1998) The many faces of G protein signaling. J Biol Chem 273:669–672 3. Shenoy SK, Drake MT, Nelson CD et al (2006) Beta-arrestin-dependent, G proteinindependent ERK1/2 activation by the beta2 adrenergic receptor. J Biol Chem 281:1261–1273 4. Whalen EJ, Rajagopal S, Lefkowitz RJ (2011) Therapeutic potential of β-arrestin- and G protein-biased agonists. Trends Mol Med 17:126–139 5. Violin JD, Lefkowitz RJ (2007) Beta-arrestinbiased ligands at seven-transmembrane receptors. Trends Pharmacol Sci 28:416–422 6. Atwood BK, Wager-Miller J, Haskins C et al (2012) Functional selectivity in CB2 cannabinoid receptor signaling and regulation: implications for the therapeutic potential of CB2 ligands. Mol Pharmacol 81:250–263 7. Bosier B, Muccioli GG, Hermans E et al (2010) Functionally selective cannabinoid receptor signalling: therapeutic implications and opportunities. Biochem Pharmacol 80:1–12 8. Price MR (2005) Allosteric modulation of the cannabinoid CB1 receptor. Mol Pharmacol 68:1484–1495 9. Han S, Thatte J, Buzard DJ et al (2013) Therapeutic utility of cannabinoid receptor
10.
11. 12.
13.
14.
15.
16.
type 2 (CB2) selective agonists. J Med Chem 56:8224–8256 DiscoveRx. http://www.discoverx.com/ technologies- platforms/enzyme-fragmentcomplementation-technology/pathhunterefc-cell-based-assay-platform/ protein-protein-interactions/gpcrs-b-arrestin Zhang R, Xie X (2012) Tools for GPCR drug discovery. Acta Pharmacol Sin 33:372–384 Patel A, Murray J, McElwee-Whitmer S et al (2009) A combination of ultrahigh throughput PathHunter and cytokine secretion assays to identify glucocorticoid receptor agonists. Anal Biochem 385:286–292 Van der Lee MMC, Blomenröhr M, van der Doelen AA et al (2009) Pharmacological characterization of receptor redistribution and betaarrestin recruitment assays for the cannabinoid receptor 1. J Biomol Screen 14:811–823 Van Der Lee MMC, Bras M, van Koppen CJ et al (2008) beta-Arrestin recruitment assay for the identification of agonists of the sphingosine 1-phosphate receptor EDG1. J Biomol Screen 13:986–998 DiscoveRx. http://www.discoverx.com/ DiscoveRx/media/ContentFiles/ DataSheets/93-0001L.pdf Yin H, Chu A, Li W et al (2009) Lipid G protein-coupled receptor ligand identification using beta-arrestin PathHunter assay. J Biol Chem 284:12328–12338
Chapter 12 Assay of NAT Activity Toru Uyama and Natsuo Ueda Abstract In animal tissues, N-acyltransferase (NAT) catalyzes the first reaction in the biosynthetic pathway of bioactive N-acylethanolamines, in which an acyl chain is transferred from the sn-1 position of the donor phospholipid, such as phosphatidylcholine, to the amino group of phosphatidylethanolamine, resulting in the formation of N-acylphosphatidylethanolamine. NAT has long been known to be stimulated by Ca2+, and hence it has been referred to as Ca2+-dependent NAT. On the other hand, members of the phospholipase A/acyltransferase (PLA/AT) family (also known as HRAS-like suppressor family) show Ca2+-independent NAT activity. In this chapter, we describe (1) partial purification of Ca2+-dependent NAT from rat brain, (2) purification of recombinant PLA/AT-2, and (3) NAT assay using radiolabeled substrate. Key words N-acylphosphatidylethanolamine, NAPE, N-acyltransferase, Ca-NAT, COS-7 cell, HRASLS family, PLA/AT family, Rat brain, Radioisotope, Thin-layer chromatography
1
Introduction In animal tissues, bioactive N-acylethanolamines are formed from glycerophospholipids via N-acylphosphatidylethanolamines (NAPEs), a unique class of glycerophospholipid species possessing three long fatty acyl chains per one molecule [1]. The formation of NAPE is catalyzed by N-acyltransferase (NAT), which transfers an acyl chain from the sn-1 position of the donor phospholipid, such as phosphatidylcholine (PC), to the amino group of phosphatidylethanolamine (PE) (Fig. 1). NAT has long been known, and exists in mammalian tissues such as brain and testis as a membrane-associated protein; it is stimulated by Ca2+ [2–4]. However, this enzyme has not been highly purified or cloned to date. In this chapter, we refer to this enzyme as Ca2+-dependent NAT (Ca-NAT). Alternatively, we found that HRASLS-5, a protein belonging to the HRAS-like suppressor (HRASLS) family, has a NAPE-forming NAT activity [5]. Later, we revealed that all members of this family (HRASLS1–5) show NAT activity as well as phospholipase A1/A2 activity [1]. Based on these findings, we proposed to call HRASLS1–5 as phospholipase A/acyl-
Mauro Maccarrone (ed.), Endocannabinoid Signaling: Methods and Protocols, Methods in Molecular Biology, vol. 1412, DOI 10.1007/978-1-4939-3539-0_12, © Springer Science+Business Media New York 2016
113
114
Toru Uyama and Natsuo Ueda
R2
O O H2C O C R1 C O CH O H2C O P O
NH2
OH PE (Acyl acceptor)
O O H2C O *C R3 R4 *C O CH O H2C O P O OH
N+
14C]Dipalmitoyl-PC (Acyl donor)
Ca-NAT PLA/AT
O H2C OH R4 *C O CH O H2C O P O
N+
OH
R2
O O H2C O C R1 C O CH O H2C O P O OH N
14C]Palmitoyl-lyso
PC
O N *C R3 H H
14C]Palmitoyl-PE
Fig 1 Formation of N-[14C]palmitoyl-PE by NAT. Asterisks show the positions of the radiolabel
transferase (PLA/AT)-1–5, respectively [6]. Largely different from Ca-NAT, PLA/AT family proteins exist in both membrane and cytosol, and their NAT activity is not stimulated by Ca2+ [5–9]. In this chapter, we first describe partial purification of Ca-NAT from rat brain [5], as well as purification of recombinant PLA/ AT-2, a PLA/AT family member exhibiting a relatively high NAT activity, from mammalian cells [10]. We then introduce our assay method to detect NAT activity with radioactive substrate. As an alternative method to detect NAPE produced by recombinant PLA/AT family proteins, we [10] and Golczak and colleagues [11] reported tandem mass spectrometry.
2
Materials
2.1 Partial Purification of Ca-NAT from Rat Brain
1. Pregnant Wistar/ST rats. 2. HiTrap Q anion-exchange column (bed volume, 5 ml) (GE Healthcare, Piscataway, NJ, USA).
NAT Assay
115
3. Buffer A: 20 mM Tris–HCl (pH 7.4), 0.32 M sucrose. 4. Buffer B-1: 20 mM Tris–HCl (pH 7.4), 0.5 % (w/v) Nonidet P-40. 5. Buffer B-2: 20 mM Tris–HCl (pH 7.4), 0.5 % (w/v) Nonidet P-40, 100 mM NaCl. 6. Buffer B-3: 20 mM Tris–HCl (pH 7.4), 0.5 % (w/v) Nonidet P-40, 200 mM NaCl. 7. Buffer B-4: 20 mM Tris–HCl (pH 7.4), 0.5 % (w/v) Nonidet P-40, 500 mM NaCl. 8. Protein assay dye reagent concentrate for Bradford protein assay (Bio-Rad, Hercules, CA, USA), and bovine serum albumin (BSA) as a standard. 9. Motor-driven Polytron homogenizer with a stainless-steel generator shaft of 12 mm in diameter (Kinematica, Littau, Switzerland). 10. Potter-type Teflon-glass grinder. 2.2 Purification of Recombinant PLA/AT-2
1. COS-7 cells. 2. Culture medium for COS-7 cells: Dulbecco’s modified Eagle medium (DMEM) with 10 % fetal calf serum and 0.1 mM nonessential amino acids. 3. 0.05 % Trypsin/0.02 % ethylenediaminetetraacetic acid (EDTA). 4. Phosphate-buffered saline (PBS). 5. Lipofectamine 2000. 6. pEF6/Myc-His vector harboring C-terminally FLAG-tagged human PLA/AT-2 cDNA [9] (see Note 1). 7. Branson Sonifier model 250 equipped with a tapered microtip (end diameter of 1/8 in.) (Branson, Danbury, CT, USA). 8. Buffer C: 20 mM Tris–HCl (pH 7.4). 9. Buffer D: 50 mM Tris–HCl (pH 7.4), 150 mM NaCl, 0.05 % (w/v) Nonidet P-40. 10. Anti-FLAG M2 affinity gel and FLAG peptide.
2.3
Enzyme Assay
1. 1,2-[1′-14C]dipalmitoyl-PC (45,000 cpm/2 μl in ethanol): Dilute 1,2-[1′-14C]dipalmitoyl-PC (toluene/ethanol (1:1) solution, 1.11–2.22 TBq/mmol, 37 MBq/ml) (PerkinElmer Life Science, Boston, MA, USA) with ethanol. 2. 4 mM 1,2-Dipalmitoyl-PC in chloroform/methanol (2:1, by vol.). 3. 7.5 mM 1,2-Dioleoyl-PE in chloroform/methanol (2:1, by vol.). 4. 50 mM Dithiothreitol. 5. 0.5 M Glycine-NaOH (pH 9.0).
116
Toru Uyama and Natsuo Ueda
6. 10 % (w/v) Nonidet P-40. 7. 0.1 M CaCl2. 8. Round-bottom 5 ml glass test tubes (12 mm diameter × 90 mm length). 9. Nitrogen gas cylinder with a regulator. 10. Water bath-type sonicator. 11. Stop solution: Chloroform/methanol (2:1, by vol.). 12. Calibrated 100 μl glass micropipets and a rubber aspirator tube (Drummond Scientific, Broomall, PA, USA) (see Note 2). 13. Conventional hair dryer held by a clamp and a stand. 14. Precoated silica gel 60 F254 aluminum sheet for thin-layer chromatography (TLC) (20 × 20 cm, 0.2 mm thickness): Cut it into equal halves (20 × 10 cm each) by scissors or a guillotine paper cutter. 15. TLC solvent: Chloroform/methanol/28 % ammonium hydroxide (80:20:2, by vol.). Mix 400 ml of chloroform, 100 ml of methanol, and 10 ml of 28 % ammonium hydroxide in a 500 ml glass bottle, and shake it well. Store at 4 °C. 16. Rectangular glass TLC tank (inside dimension: 235 × 105 × 210 mm) with a glass lid: Attach Whatman 3MM filter paper to the inner wall and pour the TLC solvent (120–150 ml) into the tank (see Note 3). Place the tank in cold room (4 °C). 17. Imaging analyzer FLA-7000 with an Imaging Plate (20 × 40 cm) and a cassette (Fujifilm, Tokyo, Japan).
3
Methods
3.1 Partial Purification of Ca-NAT from Rat Brain
1. Keep pregnant Wistar/ST rats in an animal facility and obtain their infants (see Note 4). 2. Anesthetize 2-day-old infants, and sacrifice them by decapitation. Isolate the brains from infants, and wash them with ice-cold PBS (see Note 5). Weigh the brains in a glass beaker (see Note 6). 3. Keeping the glass beaker on ice, mince the brains with scissors, and add five times volume (ml/g of tissue weight) of ice-cold Buffer A. 4. Homogenize the tissues using a Polytron homogenizer at setting 7 in an ice-water bath three times for 20 s each (see Note 7). 5. Centrifuge homogenates at 800 × g for 15 min at 4 °C, and further centrifuge the resultant supernatant at 105,000 × g for 55 min at 4 °C. 6. Transfer the pellet (membrane fraction) to a precooled chamber of a Teflon-glass grinder with a spatula. Add twice a volume (ml/g of tissue weight) of ice-cold Buffer A to the
NAT Assay
117
chamber in the ice-water bath, and suspend the pellet with the aid of the grinder. 7. Transfer the prepared membrane fraction to a polypropylene tube and freeze it in a −80 °C freezer. After thawing the membrane fraction, perform another centrifugation at 105,000 × g for 55 min at 4 °C. 8. To solubilize Ca-NAT with the nonionic detergent Nonidet P-40, resuspend the pellet in Buffer B-1 with a Potter-type Teflon-glass grinder as described in step 6, and centrifuge it again at 105,000 × g for 55 min at 4 °C. 9. The resultant clear supernatant contains the solubilized CaNAT. Determine the protein concentration, according to the manufacturer’s instructions for protein assay dye reagent concentrate for Bradford protein assay. Use 0.25–6 μg of BSA in 250 μl volume of reactions to plot a standard curve. Freeze the supernatant at −80 °C until use. 10. Equilibrate a HiTrap Q anion-exchange column with at least 15 ml of Buffer B-1 (see Note 8). 11. Slowly thaw the solubilized Ca-NAT (50 mg of protein), which was frozen in step 9, and load it onto the pre-equilibrated HiTrap Q anion-exchange column. 12. Wash the column with 15 ml of Buffer B-2, followed by 20 ml of Buffer B-3. 13. Elute Ca-NAT with 6 ml of Buffer B-4. Use this eluate as partially purified Ca-NAT. 14. Determine protein concentration as described in step 9. Store at −80 °C until use. 3.2 Purification of Recombinant PLA/AT-2
1. Culture COS-7 cells at 37 °C to 90 % confluency in three 150 mm dishes, containing DMEM with 10 % fetal calf serum in a humidified 5 % CO2 and 95 % air incubator (see Note 9). 2. Introduce 25 μg/dish of the expression vector pEF6/Myc-His harboring cDNA of C-terminally FLAG-tagged human PLA/ AT-2 into COS-7 cells, using 75 μl/dish of Lipofectamine 2000 according to the manufacturer’s instructions and culture the cells for 48 h (see Note 10). 3. Treat the cells with 0.05 % trypsin/0.02 % EDTA for 2 min and harvest the suspended cells from three dishes into a 50 ml polypropylene tube. Centrifuge the cell suspension to collect cells at 4 °C. Wash the cells with 10 ml of ice-cold PBS and centrifuge at 4 °C. Perform this step again with a total of two washings. 4. Suspend the cell pellet with 4 ml of Buffer C in the same tube and sonicate the cells using a Branson Sonifier at the amplitude 3 three times for 3 s each. Add 20 μl of 10 % Nonidet P-40 to the resultant cell homogenate. Centrifuge the cell homogenate
118
Toru Uyama and Natsuo Ueda
at 105,000 × g for 55 min at 4 °C. Use the supernatant as the cytosolic fraction (see Note 11). 5. To pre-equilibrate anti-FLAG M2 affinity gel, add 4 ml of Buffer D and 1 ml of the gel (50 % slurry) in a 5 ml polypropylene tube. Centrifuge the gel at 3000 × g for 5 min at 4 °C. Discard the supernatant, add 5 ml of Buffer D to the tube, suspend the gel by gentle mixing, and centrifuge it under the same conditions. Perform this washing step by centrifuging three times. 6. Add the cytosolic fraction (about 4 ml) to the tube containing 0.5 ml of anti-FLAG M2 affinity gel pre-equilibrated with Buffer D, and incubate it overnight at 4 °C under gentle mixing. 7. Pack the gel into a column with a filter disc and wash it three times each with 12 ml of Buffer D. 8. Elute the FLAG-tagged PLA/AT-2 protein with Buffer D containing 0.1 mg/ml of FLAG peptide. Collect every 0.5 ml fraction. Use active fractions as purified PLA/AT-2 (see Note 12). 9. Determine protein concentration of active fractions as described in Subheading 3.1, step 9. Store at −80 °C until use. 3.3
Enzyme Assay
1. The reaction mixture necessary for one assay (80 μl) can be prepared with 10 μl of 0.5 M glycine-NaOH (pH 9.0), 4 μl of 50 mM dithiothreitol, 0.5 μl of 10 % Nonidet P-40, and 65.5 μl of water (see Note 13). When Ca-NAT is used as NAT, 5 μl of 0.1 M CaCl2 is also included and the same amount of water is reduced, so that the reaction mixture remains 80 μl. Prepare the required amount of this reaction mixture in a glass tube, according to total number of samples to be assayed at a time. 2. The substrate mixture necessary for one assay can be prepared with 1 μl of 4 mM 1,2-dipalmitoyl-PC, 1 μl of 7.5 mM 1,2-dioleoyl-PE and 2 μl of 1,2-[1′-14C]dipalmitoyl-PC (45,000 cpm/2 μl in ethanol) (see Note 14). According to the total number of samples to be assayed at a time, prepare the required amount of this substrate mixture in a 5 ml glass test tube, and evaporate it to dryness under the stream of nitrogen gas (see Note 15). 3. Transfer the reaction mixture prepared in step 1 into this glass tube. Sonicate the solution for 20 s in a water bath-type sonicator and vigorously mix it by vortex. Perform this sonication and mix three times in total. 4. Dispense 80 μl of the mixture to each glass test tube. 5. Start the enzymatic reaction by adding 20 μl of the enzyme source (Ca-NAT, 23 μg protein or PLA/AT-2, 0.15 μg protein) to the tube and vortex it briefly (see Note 16). Allow the enzymatic reaction to proceed for 30 min by incubating the tube at 37 °C in the water bath.
NAT Assay
a
119
10 cm
20 cm
1 cm
1 cm
2 cm
1.5 cm
b
Palmitic acid PC Lyso PC +
PLA/AT-2
Fig 2 Marking of TLC plate (a) and an example of thin-layer chromatograms (b) in NAT assay using the purified human PLA/AT-2. NPPE N-palmitoyl-PE
6. Terminate the reaction by adding 320 μl of stop solution (see Note 16). Mix it vigorously by vortex. 7. Centrifuge the tube at 2000 × g for 5 min at 4 °C. 8. Draw an 18 cm horizontal line at 2 cm apart from the bottom edge on an aluminum TLC sheet by a soft pencil, leaving 1 cm blanks at both side edges. Draw short vertical lines at 1.5 cm interval across the horizontal line to form 12 lanes per sheet (Fig. 2a). 9. Spot 100 μl of the lower chloroform layer on each lane along the horizontal line (see Note 17). Use glass micropipet, which is connected to a rubber aspirator tube, under airflow by a hair dryer (see Note 18). After spotting all the samples, leave the plate under airflow for a few minutes to evaporate the solvent completely. 10. Immerse the lower edge ( Km is advisable. In our assay with mouse brain, Km is approximately 3.5 μM; thus we suggest a final AEA concentration of 10 μM. It should be noted that radiolabeled substrate often has a very low concentration that can be calculated from the specific activity (reported in the data sheet) as the ratio between radioactivity and amount (Ci/mmoles). Therefore, it is necessary to adjust the final substrate concentration by adding unlabeled AEA.
Fig. 2 Michaelis–Menten curves of mouse brain FAAH activity, determined by using 40 μg of proteins and different concentrations of substrate ([14C-ethanolamine]AEA, 0–20 μM range). Nonlinear regression analysis of the kinetic data allowed to calculate apparent Km (μM) and maximum velocity (Vmax, expressed as pmol/(min mg of protein)) for [14C]-AEA hydrolysis
FAAH Assay
135
Fig. 3 FAAH activity in a dose-response curve for mouse brain sample. Range of protein concentration was 5–200 μg
6. The optimal protein concentration for FAAH assay depends on the amount of enzyme present in the sample. In the present protocol FAAH concentration refers to mouse brain. In general, a dose-dependence curve of FAAH activity should be built for every new sample, in order to ascertain the optimal protein concentration to be used (Fig. 3). 7. If you have an [14C]-AEA batch with a specific activity of 55 mCi/ nmoL and a concentration of 0.1 mCi/mL, and a 2 M stock solution of unlabeled AEA, the following is an example of mix composition for 100 reactions (500 μl), each performed in a 1.5 mL Eppendorf tube. Note that all steps must be performed on ice: (a) [14C]-AEA = 0.009 μCi × 100 reactions = 0.9 μCi (corresponding to 9 μL from batch). (b) Cold AEA 100× (i.e., 1 mM) = 5 nmoL × 100 = 500 nmoL of AEA (corresponding to 50 μL from 10 mM AEA stock solution). Solutions (a) and (b) will be diluted with ethanol to a final volume of 500 μL (5 μL× 100 reactions). Note that it is recommended to prepare an excess of mix, compared to the planned experimental activities. 8. For a better quantitation, it is recommended to recover the same volume of the aqueous phase from all samples, even if it does not correspond to the whole volume of the phase. The scintillation liquid is added to the aqueous phase in a 7:1 ratio (scintillation liquid/aqueous phase, vol/vol). We usually use a 3.5 mL:0.5 mL ratio. 9. At the end of sample centrifugation, two phases will be observed: the lower is the organic phase, and the upper is the aqueous phase containing labeled ethanolamine.
136
Monica. Bari et al.
10. Radioactivity of [14C]-ethanolamine is expressed as disintegrations per minute (dpm) that must be transformed in moles by using the specific activity of the substrate mix (Ci/mmol), and keeping in mind that 1 μCi = 2.22 × 10⁶ dpm. The resulting moles of ethanolamine will be divided by the reaction time (min) and the protein content (mg) in the reaction mixture, to obtain the specific activity of FAAH as moles/(min mg of protein). References 1. Maccarrone M, Bab I, Bíró T et al (2015) Endocannabinoid signaling at the periphery: 50 years after THC. Trends Pharmacol Sci 36:277–296 2. Fezza F, Bari M, Florio R et al (2014) Endocannabinoids, related compounds and their metabolic routes. Molecules 19:17078–17106 3. Deutsch DG, Ueda N, Yamamoto S (2002) The fatty acid amide hydrolase (FAAH). Prostaglandins Leukot Essent Fatty Acids 66:201–210 4. Cravatt BF, Giang DK, Mayfield SP et al (1996) Molecular characterization of an enzyme that degrades neuromodulatory fattyacid amides. Nature 384:83–87 5. Giuffrida A, Beltramo M, Piomelli D (2001) Mechanisms of endocannabinoid inactivation: biochemistry and pharmacology. J Pharmacol Exp Ther 298:7–14 6. Ramos JA, González S, Sagredo O et al (2005) Therapeutic potential of the endocannabinoid system in the brain. Mini Rev Med Chem 5:609–617 7. Bedse G, Romano A, Lavecchia AM et al (2015) The role of endocannabinoid signaling
8.
9.
10.
11.
12.
in the molecular mechanisms of neurodegeneration in Alzheimer’s disease. J Alzheimer’s Dis 43:1115–1136 Fezza F, De Simone C, Amadio D et al (2008) Fatty acid amide hydrolase: a gate-keeper of the endocannabinoid system. Subcell Biochem 49:101–132 Bari M, Battista N, Fezza F et al (2006) New insights into endocannabinoid degradation and its therapeutic potential. Mini Rev Med Chem 6:257–268 Fezza F, Battista N, Bari M et al (2006) Methods to assay anandamide hydrolysis and transport in synaptosomes. Methods Mol Med 123:163–168 Maccarrone M, Bari M, Finazzi AA (1999) A sensitive and specific radiochromatographic assay of fatty acid amide hydrolase activity. Anal Biochem 267:314–318 Gattinoni S, De Simone C, Dallavalle S et al (2010) Enol carbamates as inhibitors of fatty acid amide hydrolase (FAAH) endowed with high selectivity for FAAH over the other targets of the endocannabinoid system. ChemMedChem 5:357–360
Chapter 15 Assay of NAAA Activity Kazuhito Tsuboi and Natsuo Ueda Abstract N-acylethanolamine-hydrolyzing acid amidase (NAAA) is a lysosomal hydrolase degrading various N-acylethanolamines at acidic pH. Since NAAA prefers anti-inflammatory and analgesic palmitoylethanolamide to other N-acylethanolamines as a substrate, its specific inhibitors are expected as a new class of anti-inflammatory and analgesic agents. Here, we introduce an NAAA assay system, using [14C]palmitoylethanolamide and thin-layer chromatography. The preparation of NAAA enzyme from native and recombinant sources as well as the chemical synthesis of N-[1′-14C]palmitoyl-ethanolamine is also described. Key words NAAA, N-acylethanolamine-hydrolyzing acid amidase, Palmitoylethanolamide, Antiinflammatory agent, Rat lung, HEK293 cell, Thin-layer chromatography, Radioisotope
1
Introduction The major degradative pathway for bioactive N-acylethanolamines, including palmitoylethanolamide, oleoylethanolamide, and arachidonoylethanolamide (anandamide), is hydrolysis to free fatty acids and ethanolamine catalyzed by fatty acid amide hydrolase (FAAH) and N-acylethanolamine-hydrolyzing acid amidase (NAAA) [1]. NAAA is a lysosomal cysteine hydrolase acting at acidic pH and prefers palmitoylethanolamide, which shows anti-inflammatory and analgesic actions, to other N-acylethanolamines in in vitro cell-free assay systems [2]. NAAA is abundantly expressed in macrophages [3, 4], and specific NAAA inhibitors have been reported to increase local levels of endogenous palmitoylethanolamide in inflammation models, and to exhibit anti-inflammatory and analgesic effects [5]. Thus, the NAAA assay is considered an important method for screening and developing new anti-inflammatory and analgesic agents. Here, we introduce our NAAA assay system, using N-[1′-14C] palmitoyl-ethanolamine ([14C]palmitoylethanolamide) as a substrate (Fig. 1). In this system, thin-layer chromatography (TLC) is used to separate the produced [14C]palmitic acid from the remaining substrate. We also refer to the preparation of NAAA enzyme
Mauro Maccarrone (ed.), Endocannabinoid Signaling: Methods and Protocols, Methods in Molecular Biology, vol. 1412, DOI 10.1007/978-1-4939-3539-0_15, © Springer Science+Business Media New York 2016
137
138
Kazuhito Tsuboi and Natsuo Ueda
*
*
+
H2O N-[1'-14C]Palmitoyl-ethanolamine
[14C]Palmitic Acid
Ethanolamine
Fig. 1 Hydrolysis of N-[1′-14C]palmitoyl-ethanolamine by NAAA. Asterisks show the positions of the radiolabel
from both native [6] and recombinant [2] sources, as well as the chemical synthesis of N-[1′-14C]palmitoyl-ethanolamine. Another radioactive palmitoylethanolamide reported is [1,2-14C] N-palmitoylethanolamine [7]. In the latter case, the radioactive product, [1,2-14C]ethanolamine, is water soluble and remains in the aqueous phase after the extraction of [14C]palmitoylethanolamide by chloroform/methanol (1:1, v/v). The radioactivity of the product can be then measured by a liquid scintillation counter. In addition, NAAA assay can be performed by mass spectrometry [8], or fluorometrically with N-(4-methylcoumarin)palmitamide, a fluorescent analog of palmitoylethanolamide, as a substrate [9].
2
Materials
2.1 Preparation of NAAA from Rat Lung
1. Wistar rats (male) (see Note 1). 2. Homogenization buffer: 20 mM Tris–HCl (pH 7.4), 0.32 M sucrose. 3. Motor-driven Polytron homogenizer with a stainless-steel generator shaft of 12 mm in diameter (Kinematica, Littau, Switzerland). 4. Phosphate-buffered saline (PBS). 5. Potter-type Teflon-glass grinder. 6. Protein assay dye reagent concentrate for Bradford protein assay (Bio-Rad, Hercules, CA, USA) and bovine serum albumin (BSA) as a standard.
2.2 Preparation of Recombinant NAAA
1. Human embryonic kidney 293 (HEK293) cells. 2. Culture medium for HEK293 cells: Dulbecco’s modified Eagle medium (DMEM) with 10 % fetal calf serum and 0.1 mM nonessential amino acids. 3. Poly-L-lysine-coated 100 mm plastic cell culture dishes: Dissolve 5 mg of poly-L-lysine hydrobromide (molecular weight 30,000–70,000) in 50 ml of sterile water. Coat the culture surface with 2–3 ml of the poly-L-lysine solution for 10 min. Remove the solution (see Note 2), and rinse the culture surface with some sterile water. Aspirate off the water, and air-dry the surface under ultraviolet light in the clean bench.
NAAA Assay
139
4. pcDNA3.1(+) mammalian expression vector harboring human NAAA cDNA [2] (see Note 3). 5. Lipofectamine 2000. 6. 0.05 % Trypsin/0.02 % ethylenediaminetetraacetic acid (EDTA). 7. PBS. 8. Branson Sonifier model 250 equipped with a tapered microtip (end diameter of 1/8 in.) (Branson, Danbury, CT, USA). 9. Protein assay dye reagent concentrate for Bradford protein assay (Bio-Rad). 2.3 Synthesis of Radiolabeled Substrate
1. [1-14C]Palmitic acid (ethanol solution, 1.48–2.22 GBq/mmol, 3.7 MBq/ml) (PerkinElmer Life Science, Boston, MA, USA). 2. Liquid scintillation counter. 3. Liquid scintillation mixture with a bottle-top dispenser. 4. Polyethylene 6 ml vials and glass vials. 5. 2-Aminoethanol (monoethanolamine). 6. Oxalyl chloride (see Note 4). 7. Methylene chloride. 8. Conical 10ml glass tubes with a screw cap. 9. Diethyl ether. 10. Nitrogen gas cylinder with a regulator. 11. Ethanol. 12. Conventional hair dryer held by a clamp and a stand. 13. Precoated silica gel 60 F254 glass plate for TLC (20 × 20 cm, 0.2 mm thickness). 14. TLC solvent A: The organic phase of isooctane/ethyl acetate/ water/acetic acid (5:11:10:2, by vol.). Mix 100 ml of isooctane, 220 ml of ethyl acetate, 200 ml of deionized water, and 40 ml of acetic acid in a 500 ml glass bottle, and shake it well. After standing, transfer the upper organic phase to another bottle with a glass pipette. Store at room temperature (r.t.). 15. Rectangular glass TLC tank (inside dimension: 235 × 105 × 210 mm) with a glass lid: Attach Whatman 3MM filter paper to the inner walls, and pour TLC solvent A (120–150 ml) into the tank (see Note 5). 16. Imaging analyzer FLA-7000 with an imaging plate (20 × 40 cm) and a cassette (Fujifilm, Tokyo, Japan). 17. Chisel (12 mm blade in width) and microspatula. 18. Paraffin paper (15 × 15 cm). 19. Glass Buchner funnel with a G1 filter disc at the bottom. 20. Methanol.
140
Kazuhito Tsuboi and Natsuo Ueda
21. Rubber bulb with a reservoir: Connect the bulb to a glass Buchner funnel via a glass tube penetrating a silicone stopper. 22. 40 mM Non-radiolabeled palmitoylethanolamide: Dissolve 10 mg of palmitoylethanolamide in 835 μl of ethanol (see Note 6). 23. Dimethyl sulfoxide. 2.4
Enzyme Assay
1. 0.5 M Citrate–sodium phosphate buffer (pH 4.5): Weigh 5.25 g of citric acid monohydrate, and add water to make 50 ml of 0.5 M citric acid. Weigh 8.95 g of Na2HPO4·12H2O, and add water to prepare 50 ml of 0.5 M Na2HPO4. Mix the solutions in a ratio that results in a pH value of 4.5. 2. 60 mM Dithiothreitol: Dissolve 185 mg of dithiothreitol in 20 ml of water. Dispense into 1 ml aliquots. Store at −20 °C. A fresh aliquot should be used every time before assay. 3. 4 % (w/v) Nonidet P-40: Weigh 1.6 g of Nonidet P-40 in a 50 ml plastic tube. Add about 35 ml of water, and rotate the tube for several hours or overnight at 4 °C. Adjust the volume to 40 ml with water. Store at 4 °C. 4. 1 % BSA: Dissolve 0.2 g of BSA (Cohn Fraction V) in 20 ml of water. Dispense the solution in 1.5 ml plastic tubes, and store at −20 °C. 5. 3 M NaCl: Dissolve 8.77 g of sodium chloride in water to make 50 ml solution. 6. [14C]Palmitoylethanolamide (10,000 cpm/10 nmol/5 μl of dimethyl sulfoxide): Prepare as described in Subheading 3.3. 7. Round-bottom 5 ml glass test tubes (12 mm diameter × 90 mm length). 8. Stop solution: Diethyl ether/methanol/1 M citric acid (30:4:1, by vol.) (see Note 7). Store at –20 °C. 9. Calibrated 100 μl glass micropipets and a rubber aspirator tube (see Note 8). 10. Conventional hair dryer held by a clamp and a stand. 11. Precoated silica gel 60 F254 aluminum sheet for TLC (20 × 20 cm, 0.2 mm thickness): Cut it into equal halves (20 × 10 cm each) by scissors or a guillotine paper cutter. 12. TLC solvent B: Chloroform/methanol/28 % ammonium hydroxide (40:10:1, by vol.). Mix 400 ml of chloroform, 100 ml of methanol, and 10 ml of 28 % ammonium hydroxide in a 500 ml bottle and shake it well. Store at 4 °C. 13. Rectangular glass TLC tank (inside dimension: 235 × 105 × 210 mm) with a glass lid: Attach Whatman 3MM filter paper to the inner walls, and pour TLC solvent B (120– 150 ml) into the tank (see Note 5). 14. Imaging analyzer FLA-7000 with an imaging plate (20 × 40 cm) and a cassette (Fujifilm).
NAAA Assay
3
141
Methods
3.1 Preparation of NAAA from Rat Lung
1. Anesthetize male Wistar rats, and sacrifice them by decapitation (see Note 9). Isolate lungs, and wash them with ice-cold PBS. Weigh the tissues in a glass beaker (see Note 10). 2. Keeping the glass beaker on ice, mince the lungs with scissors and add nine times volume (ml/g of tissue weight) of ice-cold homogenization buffer. Homogenize the tissues using a Polytron homogenizer at setting 7 in an ice-water bath three times for 20 s each (see Note 11). 3. Centrifuge the homogenate at 800 × g for 15 min at 4 °C. Transfer the supernatant to another centrifuge tube. 4. Centrifuge the supernatant at 12,000 × g for 30 min at 4 °C. Discard the resultant supernatant, and transfer the pellet to a precooled chamber of a Teflon-glass grinder with a spatula. Add one-seventh of the homogenate volume of ice-cold PBS to the chamber in an ice-water bath (see Note 12), and suspend the pellet with the aid of the grinder. 5. Transfer the suspended pellet to a polypropylene tube, and freeze it in a −80 °C freezer. Thaw the sample in a water bath at r.t., and freeze it again at −80 °C (see Note 13). These two cycles of freezing and thawing result in the solubilization of NAAA from lysosomes. 6. After thawing, ultracentrifuge the sample at 105,000 × g for 50 min at 4 °C. The solubilized NAAA is recovered in the supernatant. 7. Transfer the supernatant into a new tube. Determine the protein concentration (typically 2–3 mg/ml), according to the manufacturer’s instruction for protein assay dye reagent concentrate for Bradford protein assay. Use 0.25–4 μg of BSA as a standard in 250 μl volume of reactions. Dispense the NAAA preparation into aliquots, and store at −80 °C until use.
3.2 Preparation of Recombinant NAAA
1. Culture HEK293 cells at 37 °C to 90 % confluency in a polyL-lysine-coated 100 mm dish containing the culture medium in a humidified 5 % CO2/95 % air incubator (see Note 14). 2. Introduce 8 μg of the expression vector pcDNA3.1(+) harboring cDNA of human NAAA into the cells using 36 μl of Lipofectamine 2000 according to the manufacturer’s instruction and culture the cells for 48 h. 3. Suspend the cells with the aid of 0.05 % trypsin/0.02 % EDTA. Transfer the cell suspension to a 50 ml polypropylene conical tube, and centrifuge it to collect the cells. Wash the cells with 10 ml of PBS, followed by centrifugation. Discard the supernatant, suspend the cells again with 1 ml of PBS, and transfer the suspension of cells to a 1.5 ml tube.
142
Kazuhito Tsuboi and Natsuo Ueda
4. After another centrifugation, resuspend the cells with 1 ml of PBS, and sonicate the cells using a Branson Sonifier at amplitude 3 in an ice-water bath three times for 3 s each (see Note 11). 5. Store the resultant cell homogenate at −80 °C until use as NAAA preparation. Determine the protein concentration (expected to be around 3 mg/ml), according to the manufacturer’s instruction for protein assay dye reagent concentrate for Bradford protein assay. Use 0.25–4 μg of BSA as a standard in 250 μl volume of reactions. 3.3 Synthesis of Radiolabeled Substrate
1. To measure the radioactivity of [1-14C]palmitic acid, dilute 5 μl of original [1-14C]palmitic acid solution with 120 μl of ethanol (see Note 15). Add 5 μl of the diluted [1-14C]palmitic acid solution into a polyethylene 6 ml vial containing 3 ml of liquid scintillation mixture (in triplicate). To subtract background radioactivity, add 5 μl of ethanol into another vial containing 3 ml of the scintillation mixture. Vortex all the vials, put them in bigger glass vials, and count the radioactivity with a liquid scintillation counter (see Note 16). 2. Based on the measured value of radioactivity, transfer [1-14C] palmitic acid solution, corresponding to 1 × 10⁸ cpm, to a conical 10 ml glass tube with a screw cap. Evaporate the solvent ethanol completely by nitrogen gas stream (see Note 17). 3. Add 200 μl of methylene chloride into the glass tube, and vortex it well. 4. In the safety cabinet, add 10 μl of oxalyl chloride into the tube. Close the cap tightly, and keep the solution at r.t. for 2 h. Vortex the tube at 0, 1, and 2 h. [14C]Palmitoyl chloride is now produced. 5. Weigh 0.2 g of 2-aminoethanol in another conical 10 ml glass tube, and add 2 ml of methylene chloride into the tube. Vortex the solution, and place the tube on ice. 6. Open the tube containing [14C]palmitoyl chloride (from step 4), and evaporate the solvent completely by nitrogen gas stream (see Note 17). Add 200 μl of 2-aminoethanol solution (prepared in step 5) into the tube. Close the cap and vortex the mixture. 7. Stand the mixture on ice for 30 min. Vortex it at 0, 10, 20, and 30 min. The synthesis of N-[1′-14C]palmitoyl-ethanolamine ([14C]palmitoylethanolamide) is now completed. 8. Add 1 ml of water and 2 ml of diethyl ether into the tube, and vortex the mixture well.
NAAA Assay
143
9. Centrifuge the mixture at 1600 × g for 10 min at r.t.. Transfer the upper organic layer to another conical 10 ml glass tube with a Pasteur pipette. 10. Add 2 ml of diethyl ether to the lower aqueous layer, and vortex the mixture well. Centrifuge the mixture again at 1600 × g for 10 min at r.t. Transfer the resultant upper organic layer into the glass tube containing the upper organic layer collected in step 9. 11. Repeat step 10. 12. Evaporate the combined organic layer by nitrogen gas stream (see Note 17). 13. Add 800 μl of ethanol, and vortex the sample (see Note 18). 14. (Optional) Before the purification by preparative TLC (steps 15–24), it is possible to confirm successful synthesis of [14C] palmitoylethanolamide by the following method. Spot 1 μl of the sample on an aluminum TLC sheet (10 cm height, described in Subheading 2.4, item 11). Also, spot ~50,000 cpm of [14C] palmitic acid as a control beside the sample. Follow steps 15– 18 except that the development of the TLC sheet and the exposure of an imaging plate to the sheet are 20 min and 30–60 min, respectively. More than 95 % of [14C]palmitic acid is typically converted to [14C]palmitoylethanolamide, which migrates more slowly than [14C]palmitic acid on the TLC sheet. 15. Draw an 18 cm horizontal line at 2 cm apart from the bottom edge on a glass TLC plate by a soft pencil, leaving 1 cm blanks at the both side edges (see Fig. 2a). Spot the entire sample along the line with a pipetman and a 200 μl tip under airflow by a hair dryer (see Note 19). After spotting, leave the plate under the airflow for a few minutes to evaporate the solvent completely. a
b 20 cm
14
20 cm
[ C]Palmitic Acid
14
1 cm
1 cm
2 cm
[ C]Palmitoylethanolamide
Origin
Fig. 2 Marking of TLC plate (a) and an example of thin-layer chromatogram (b) in the purification of the synthesized [14C]palmitoylethanolamide
144
Kazuhito Tsuboi and Natsuo Ueda
16. Immerse the lower edge (