Economic Growth: Advances in Analysis Methodologies and Technologies (SpringerBriefs in Applied Sciences and Technology) 3031383621, 9783031383625
This book assesses the main interrelationships between economic growth processes, life cycle sustainability assessment a
145 13 4MB
English Pages 157 [150] Year 2023
Acknowledgements
About This Book
Contents
About the Author
1 Economic Growth: Sigma and Beta Convergence Processes Worldwide
1.1 Introduction
1.2 Data Analysis and Sigma Convergence
1.3 Results for the Beta Convergence
1.4 Discussion and Conclusions
References
2 Clubs of Convergence: Insights from the Main Groups of Countries
2.1 Introduction
2.2 Sigma Convergence and Catch-Up Rates
2.3 Findings for Cluster Analysis and Beta Convergence
2.4 Discussion and Conclusions
References
3 World Trends: Differences and Similitudes Between Absolute and Conditional Convergence
3.1 Introduction
3.2 Sigma Convergence and Data Analysis
3.3 Results for Conditional Beta Convergence with Panel Data
3.4 Discussion and Conclusions
References
4 Constant, Decreasing or Increasing Returns to Scale: Evidence from the Verdoorn and Kaldor Laws
4.1 Introduction
4.2 Data Analysis
4.3 Results for the Kaldor Model
4.4 Discussion and Conclusions
References
5 Circular and Cumulative Processes in Economic Growth: The Importance of the External Demand
5.1 Introduction
5.2 Data Assessment
5.3 Findings Considering the Developments of Thirlwall and Those of the New Economic Geography
5.4 Discussion and Conclusions
References
6 Interrelationships Between Economic Growth and Sustainability: Highlights from the Literature
6.1 Introduction
6.2 Bibliometric Analysis
6.3 Insights from the Literature
6.4 Discussion and Conclusions
References
7 Sustainable Development: Contributions from Life Cycle Cost Analysis
7.1 Introduction
7.2 Bibliographic Data Assessment
7.3 Contributions from the Literature for the Topics Analysed
7.4 Discussion and Conclusions
References
8 Social Life Cycle Assessment: Relationships with the Economic Growth
8.1 Introduction
8.2 Co-occurrence, Bibliographic Coupling and Co-citation Links Analysis
8.3 A Literature Review Based on Bibliographic Data
8.4 Discussion and Conclusions
References
9 Machine and Deep Learning: Their Roles in the Context of the Economic Growth Processes and Sustainability Assessment
9.1 Introduction
9.2 Keywords, Countries, Organisations, Cited Authors, Documents and Cited Sources as Items
9.3 Literature Review Based on Bibliometric Information
9.4 Discussion and Conclusions
References
10 Economic Growth, Sustainability Assessment and Artificial Intelligence: Combinations Among These Three Dimensions
10.1 Introduction
10.2 Metrics from the Scopus Database
10.3 Predict European Farming Costs with Machine Learning Approaches
10.4 Discussion and Conclusions
References
Recommend Papers


![Advances in Fuzzy Group Decision Making (SpringerBriefs in Applied Sciences and Technology) [1st ed. 2021]
3030862070, 9783030862077](https://ebin.pub/img/200x200/advances-in-fuzzy-group-decision-making-springerbriefs-in-applied-sciences-and-technology-1st-ed-2021-3030862070-9783030862077.jpg)


- Author / Uploaded
- Vitor Joao Pereira Domingues Martinho
File loading please wait...
Citation preview
SpringerBriefs in Applied Sciences and Technology Vitor Joao Pereira Domingues Martinho
Economic Growth: Advances in Analysis Methodologies and Technologies
SpringerBriefs in Applied Sciences and Technology
SpringerBriefs present concise summaries of cutting-edge research and practical applications across a wide spectrum of fields. Featuring compact volumes of 50 to 125 pages, the series covers a range of content from professional to academic. Typical publications can be: • A timely report of state-of-the art methods • An introduction to or a manual for the application of mathematical or computer techniques • A bridge between new research results, as published in journal articles • A snapshot of a hot or emerging topic • An in-depth case study • A presentation of core concepts that students must understand in order to make independent contributions SpringerBriefs are characterized by fast, global electronic dissemination, standard publishing contracts, standardized manuscript preparation and formatting guidelines, and expedited production schedules. On the one hand, SpringerBriefs in Applied Sciences and Technology are devoted to the publication of fundamentals and applications within the different classical engineering disciplines as well as in interdisciplinary fields that recently emerged between these areas. On the other hand, as the boundary separating fundamental research and applied technology is more and more dissolving, this series is particularly open to trans-disciplinary topics between fundamental science and engineering. Indexed by EI-Compendex, SCOPUS and Springerlink.
Vitor Joao Pereira Domingues Martinho
Economic Growth: Advances in Analysis Methodologies and Technologies
Vitor Joao Pereira Domingues Martinho Agricultural School (ESAV) CERNAS-IPV Research Centre Polytechnic Institute of Viseu (IPV) Viseu, Portugal
ISSN 2191-530X ISSN 2191-5318 (electronic) SpringerBriefs in Applied Sciences and Technology ISBN 978-3-031-38362-5 ISBN 978-3-031-38363-2 (eBook) https://doi.org/10.1007/978-3-031-38363-2 © The Editor(s) (if applicable) and The Author(s), under exclusive license to Springer Nature Switzerland AG 2023 This work is subject to copyright. All rights are solely and exclusively licensed by the Publisher, whether the whole or part of the material is concerned, specifically the rights of translation, reprinting, reuse of illustrations, recitation, broadcasting, reproduction on microfilms or in any other physical way, and transmission or information storage and retrieval, electronic adaptation, computer software, or by similar or dissimilar methodology now known or hereafter developed. The use of general descriptive names, registered names, trademarks, service marks, etc. in this publication does not imply, even in the absence of a specific statement, that such names are exempt from the relevant protective laws and regulations and therefore free for general use. The publisher, the authors, and the editors are safe to assume that the advice and information in this book are believed to be true and accurate at the date of publication. Neither the publisher nor the authors or the editors give a warranty, expressed or implied, with respect to the material contained herein or for any errors or omissions that may have been made. The publisher remains neutral with regard to jurisdictional claims in published maps and institutional affiliations. This Springer imprint is published by the registered company Springer Nature Switzerland AG The registered company address is: Gewerbestrasse 11, 6330 Cham, Switzerland
Acknowledgements
This work is funded by National Funds through the FCT—Foundation for Science and Technology, I.P., within the scope of the project Refa UIDB/00681/2020. Furthermore, we would like to thank the CERNAS Research Centre and the Polytechnic Institute of Viseu for their support. I would also like to thank all those who have contributed in some way to this work. A special thanks to my wife Lúcia Domingues Martinho and my two daughters Inês Domingues Martinho e Isabel Domingues Martinho.
v
About This Book
This book analyses the economic growth frameworks worldwide and assesses interrelationships between economic evolution, life cycle sustainability assessment approaches and new technologies in the framework of the digital transition. In other words, it intends to bring more insights into the world’s economic dynamics and sustainability dimensions. Additionally, it aims to highlight how life cycle methodologies and artificial intelligence can better support different actors for more sustainable economic growth. Readers of the book benefit, for example, from diverse perspectives on the contributions of evaluation methodologies and digital technologies to more sustainable economic growth. This is important, namely for the students, policymakers and public institutions. Economic growth will be analysed using the concepts of sigma and beta convergence from Neoclassical Theory and the Verdoorn– Kaldor law of Keynesian developments. For sustainability assessments, the methodologies associated with social life cycle assessment and life cycle cost analysis will be considered. In the context of digital technologies, special emphasis will be given to artificial intelligence approaches.
vii
Contents
1
2
3
4
Economic Growth: Sigma and Beta Convergence Processes Worldwide . . . . . . . . . . . . . . . . . . . . . . . . . . . . . . . . . . . . . . . . . . . . . . . . . . . . 1.1 Introduction . . . . . . . . . . . . . . . . . . . . . . . . . . . . . . . . . . . . . . . . . . . . . 1.2 Data Analysis and Sigma Convergence . . . . . . . . . . . . . . . . . . . . . . 1.3 Results for the Beta Convergence . . . . . . . . . . . . . . . . . . . . . . . . . . . 1.4 Discussion and Conclusions . . . . . . . . . . . . . . . . . . . . . . . . . . . . . . . References . . . . . . . . . . . . . . . . . . . . . . . . . . . . . . . . . . . . . . . . . . . . . . . . . . . .
1 1 2 11 17 18
Clubs of Convergence: Insights from the Main Groups of Countries . . . . . . . . . . . . . . . . . . . . . . . . . . . . . . . . . . . . . . . . . . . . . . . . . . 2.1 Introduction . . . . . . . . . . . . . . . . . . . . . . . . . . . . . . . . . . . . . . . . . . . . . 2.2 Sigma Convergence and Catch-Up Rates . . . . . . . . . . . . . . . . . . . . 2.3 Findings for Cluster Analysis and Beta Convergence . . . . . . . . . . 2.4 Discussion and Conclusions . . . . . . . . . . . . . . . . . . . . . . . . . . . . . . . References . . . . . . . . . . . . . . . . . . . . . . . . . . . . . . . . . . . . . . . . . . . . . . . . . . . .
21 21 22 29 34 35
World Trends: Differences and Similitudes Between Absolute and Conditional Convergence . . . . . . . . . . . . . . . . . . . . . . . . . . . . . . . . . . 3.1 Introduction . . . . . . . . . . . . . . . . . . . . . . . . . . . . . . . . . . . . . . . . . . . . . 3.2 Sigma Convergence and Data Analysis . . . . . . . . . . . . . . . . . . . . . . 3.3 Results for Conditional Beta Convergence with Panel Data . . . . . 3.4 Discussion and Conclusions . . . . . . . . . . . . . . . . . . . . . . . . . . . . . . . References . . . . . . . . . . . . . . . . . . . . . . . . . . . . . . . . . . . . . . . . . . . . . . . . . . . .
37 37 38 46 46 50
Constant, Decreasing or Increasing Returns to Scale: Evidence from the Verdoorn and Kaldor Laws . . . . . . . . . . . . . . . . . . . 4.1 Introduction . . . . . . . . . . . . . . . . . . . . . . . . . . . . . . . . . . . . . . . . . . . . . 4.2 Data Analysis . . . . . . . . . . . . . . . . . . . . . . . . . . . . . . . . . . . . . . . . . . . . 4.3 Results for the Kaldor Model . . . . . . . . . . . . . . . . . . . . . . . . . . . . . . 4.4 Discussion and Conclusions . . . . . . . . . . . . . . . . . . . . . . . . . . . . . . . References . . . . . . . . . . . . . . . . . . . . . . . . . . . . . . . . . . . . . . . . . . . . . . . . . . . .
53 53 54 63 63 67
ix
x
5
6
Contents
Circular and Cumulative Processes in Economic Growth: The Importance of the External Demand . . . . . . . . . . . . . . . . . . . . . . . . . . . . 5.1 Introduction . . . . . . . . . . . . . . . . . . . . . . . . . . . . . . . . . . . . . . . . . . . . . 5.2 Data Assessment . . . . . . . . . . . . . . . . . . . . . . . . . . . . . . . . . . . . . . . . . 5.3 Findings Considering the Developments of Thirlwall and Those of the New Economic Geography . . . . . . . . . . . . . . . . . 5.4 Discussion and Conclusions . . . . . . . . . . . . . . . . . . . . . . . . . . . . . . . References . . . . . . . . . . . . . . . . . . . . . . . . . . . . . . . . . . . . . . . . . . . . . . . . . . . . Interrelationships Between Economic Growth and Sustainability: Highlights from the Literature . . . . . . . . . . . . . . . . . . . . . . . . . . . . . . . . . . . . . . . . . . . . . . . . . . . . 6.1 Introduction . . . . . . . . . . . . . . . . . . . . . . . . . . . . . . . . . . . . . . . . . . . . . 6.2 Bibliometric Analysis . . . . . . . . . . . . . . . . . . . . . . . . . . . . . . . . . . . . . 6.3 Insights from the Literature . . . . . . . . . . . . . . . . . . . . . . . . . . . . . . . . 6.4 Discussion and Conclusions . . . . . . . . . . . . . . . . . . . . . . . . . . . . . . . References . . . . . . . . . . . . . . . . . . . . . . . . . . . . . . . . . . . . . . . . . . . . . . . . . . . .
69 69 70 76 76 79
81 81 83 89 89 91
7
Sustainable Development: Contributions from Life Cycle Cost Analysis . . . . . . . . . . . . . . . . . . . . . . . . . . . . . . . . . . . . . . . . . . . . . . . . . 93 7.1 Introduction . . . . . . . . . . . . . . . . . . . . . . . . . . . . . . . . . . . . . . . . . . . . . 93 7.2 Bibliographic Data Assessment . . . . . . . . . . . . . . . . . . . . . . . . . . . . . 94 7.3 Contributions from the Literature for the Topics Analysed . . . . . . 102 7.4 Discussion and Conclusions . . . . . . . . . . . . . . . . . . . . . . . . . . . . . . . 103 References . . . . . . . . . . . . . . . . . . . . . . . . . . . . . . . . . . . . . . . . . . . . . . . . . . . . 104
8
Social Life Cycle Assessment: Relationships with the Economic Growth . . . . . . . . . . . . . . . . . . . . . . . . . . . . . . . . . . . . . . . . . . . . . . . . . . . . . . . 8.1 Introduction . . . . . . . . . . . . . . . . . . . . . . . . . . . . . . . . . . . . . . . . . . . . . 8.2 Co-occurrence, Bibliographic Coupling and Co-citation Links Analysis . . . . . . . . . . . . . . . . . . . . . . . . . . . . . . . . . . . . . . . . . . . 8.3 A Literature Review Based on Bibliographic Data . . . . . . . . . . . . . 8.4 Discussion and Conclusions . . . . . . . . . . . . . . . . . . . . . . . . . . . . . . . References . . . . . . . . . . . . . . . . . . . . . . . . . . . . . . . . . . . . . . . . . . . . . . . . . . . .
9
Machine and Deep Learning: Their Roles in the Context of the Economic Growth Processes and Sustainability Assessment . . . . . . . . . . . . . . . . . . . . . . . . . . . . . . . . . . . . . . . . . . . . . . . . . . . 9.1 Introduction . . . . . . . . . . . . . . . . . . . . . . . . . . . . . . . . . . . . . . . . . . . . . 9.2 Keywords, Countries, Organisations, Cited Authors, Documents and Cited Sources as Items . . . . . . . . . . . . . . . . . . . . . . 9.3 Literature Review Based on Bibliometric Information . . . . . . . . . 9.4 Discussion and Conclusions . . . . . . . . . . . . . . . . . . . . . . . . . . . . . . . References . . . . . . . . . . . . . . . . . . . . . . . . . . . . . . . . . . . . . . . . . . . . . . . . . . . .
107 107 108 115 115 117
119 119 120 128 129 130
Contents
10 Economic Growth, Sustainability Assessment and Artificial Intelligence: Combinations Among These Three Dimensions . . . . . . 10.1 Introduction . . . . . . . . . . . . . . . . . . . . . . . . . . . . . . . . . . . . . . . . . . . . . 10.2 Metrics from the Scopus Database . . . . . . . . . . . . . . . . . . . . . . . . . . 10.3 Predict European Farming Costs with Machine Learning Approaches . . . . . . . . . . . . . . . . . . . . . . . . . . . . . . . . . . . . . . . . . . . . . 10.4 Discussion and Conclusions . . . . . . . . . . . . . . . . . . . . . . . . . . . . . . . References . . . . . . . . . . . . . . . . . . . . . . . . . . . . . . . . . . . . . . . . . . . . . . . . . . . .
xi
133 133 134 140 141 143
About the Author
Vitor Joao Pereira Domingues Martinho is Coordinator Professor with Habilitation at the Polytechnic Institute of Viseu, Portugal, and holds a Ph.D. in Economics from the University of Coimbra, Portugal. He was President of the Scientific Council, President of the Directive Council and President of the Agricultural Polytechnic School of Viseu, Portugal, from 2006 to 2012. He participated in various technical and scientific events nationally and internationally, has published several technical and scientific papers, is referee of some scientific and technical journals and participates in the evaluation of national and international projects. Occasionally, he is Guest Professor at Portuguese Higher Education Institutions and participates in several technical and scientific projects.
xiii
Chapter 1
Economic Growth: Sigma and Beta Convergence Processes Worldwide
Abstract The economic growth process worldwide has been subject to several disturbances with different origins. These disruptions have consequences on the economic dynamics of the countries with impacts on human living conditions and the efforts for more sustainable development. These old and new challenges call for contributions that allow for a better understanding of the current contexts, namely in terms of economic evolution and how the interactions between diverse nations have been affected. In this framework, this chapter intends to assess the convergence process worldwide, considering statistical information from the World Bank for the gross domestic product (GDP) per capita and the last decades. To achieve these objectives, the developments from the Neoclassical Theory were considered, specifically those related to the sigma and beta convergence approaches. To better support the methodologies taken into account, structural breaks were also tested. The findings obtained highlight the differences in the dynamics of economic growth in distinct sub-periods over the last decades. Keywords World bank · Structural breaks · Panel data · Neoclassical theory
1.1 Introduction Economic growth worldwide depends on several factors, some of them are already clearly identified in the scientific literature, such as trade. Trade openness may contribute, in certain conditions, to reduce poverty [1]. A concern of the scientific community is to identify patterns for this economic growth and try to understand if these frameworks present dynamics of convergence, or divergence, between the regions and countries. Sigma and beta convergence concepts are among the approaches considered to assess these contexts. The GPD per capita is the variable often considered to analyse the trends of convergence. Nonetheless, these sigma and beta concepts have been also used to assess the convergence in other variables [2] and indicators [3]. Sometimes these approaches are combined with different models and methodologies [4], © The Author(s), under exclusive license to Springer Nature Switzerland AG 2023 V. J. P. D. Martinho, Economic Growth: Advances in Analysis Methodologies and Technologies, SpringerBriefs in Applied Sciences and Technology, https://doi.org/10.1007/978-3-031-38363-2_1
1
2
1 Economic Growth: Sigma and Beta Convergence Processes Worldwide
including spatial autocorrelation methods [5], welfare indices [6] new techniques [7] and environmental efficiency [8]. This convergence analysis has been carried out in some cases for the whole economy and in other circumstances by sectors [9], branches [10] and activities [11]. In these phenomena of convergence, the policies designed by the governments and the international organisations have their impacts. This is particularly relevant in economic unions, such as the European Union, where European policies have great influence on the socioeconomic dynamics of the member-states and the respective processes of convergence [12]. This is visible, for example, in the frameworks of European higher education [13]. But, the economic policies and the respective funds’ transfer of the governments worldwide are also crucial to improve the development in regions with greater difficulties [14]. External shocks, such as the financial crisis of 2008/2009, also have their impacts on the economic growth dynamics and, consequently, on the processes of convergence, or divergence, between regions and countries [15]. Another issue in these economic growth dynamics is the discussion about whether convergence is absolute or conditioned to specific particularities of regions and countries, namely in terms of human capital [16]. The signs of convergence, or divergence, depend too on the periods of assessment considered [17] and on the approaches taken into account [18]. Considering the frameworks described before, this research aims to analyse the process of convergence worldwide, considering the Neoclassical Theory developments [19] and the sigma and beta convergence concepts [20, 21]. To achieve these objectives, statistical information was considered for the GDP per capita from the World Bank database [22]. Some countries were removed because of the lack of data. The speed of convergence was calculated following the study of Tondl [23]. For the regressions and statistical analyses carried out, panel data approaches were taken into account [24–26], as well as the procedures proposed by the Stata software [27–29]. For a better understanding of the contexts analysed, unknown breaks were tested through the Quandt likelihood ratio (QLR) test [30–32]. For the literature review, the Web of Science Core Collection database was consulted [33].
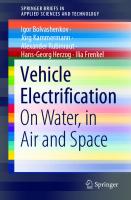
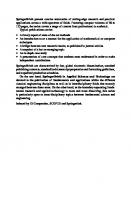
1.2 Data Analysis and Sigma Convergence In general, the GDP per capita increased continuously worldwide over the period 2000–2021, with the exception of the years associated with the world shocks related to the global financial crisis and the pandemic COVID-19 (Fig. 1.1). Figure 1.2 reveals signs of structural breaks (QLR test) for this variable in 2018. These findings, for this time series, need to be analysed deeper in future research.
1.2 Data Analysis and Sigma Convergence 18000 16000 14000 12000 10000 8000 6000 4000 2000 0
Fig. 1.1 Evolution of the world GDP per capita, over the period 2000–2021
Fig. 1.2 Testing for structural breaks in the world GDP per capita, over the period 2000–2021
3
4
1 Economic Growth: Sigma and Beta Convergence Processes Worldwide
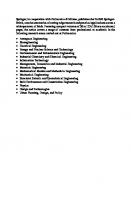
The sigma convergence for the world GDP per capita, assessed through the coefficient of variation, shows trends of convergence until 2009 and after until 2020 (Table 1.1). These outcomes highlight the disruptions promoted by the external shocks associated with the financial crisis and COVID-19 in the convergence tendencies verified over the period 2000–2021 for this variable. Figure 1.3 presents evidence of structural breaks for the coefficient of variation of the world GDP per capita in the year 2016. Luxembourg, Macao SAR (China), Qatar, Bermuda, Singapore, United Arab Emirates, San Marino, Brunei Darussalam, Switzerland, Ireland and Norway are some of the countries with the highest averages, across the period 2000–2021, for the world GDP per capita (Table 1.2). Romania, Argentina, Chile, Malaysia, Kazakhstan, Antigua and Barbuda, Uruguay, Mexico, Bulgaria and Mauritius of some of the nations with intermediate averages for the GDP per capita in the period considered (Table 1.3). The following countries are some of those with the lowest averages (Table 1.4): Eswatini; Vietnam; Bolivia; Angola; Philippines; Morocco; Samoa; Cabo Verde; and Tonga. Table 1.1 Sigma convergence (coefficient of variation) for the world GDP per capita, over the period 2000–2021
Time
Coefficient of variation
2000
1.171
2001
1.168
2002
1.162
2003
1.157
2004
1.159
2005
1.143
2006
1.134
2007
1.118
2008
1.092
2009
1.077
2010
1.090
2011
1.104
2012
1.097
2013
1.104
2014
1.085
2015
1.043
2016
1.035
2017
1.033
2018
1.031
2019
1.021
2020
1.010
2021
1.027
1.2 Data Analysis and Sigma Convergence
5
Fig. 1.3 Testing for structural breaks in the coefficient of variation of the world GDP per capita over the period 2000–2021 Table 1.2 Highest averages, across the period 2000–2021, for the world GDP per capita
Country name
Average GDP per capita
Luxembourg
111,617.664
Macao SAR, China
98,170.132
Qatar
93,934.835
Bermuda
85,359.243
Singapore
78,565.758
United Arab Emirates
75,330.792
San Marino
69,579.896
Brunei Darussalam
65,979.936
Switzerland
65,749.360
Ireland
63,773.555
Norway
62,000.141
Kuwait
60,035.325
USA
56,085.468
Denmark
52,463.470
Netherlands
52,037.626
Austria
51,627.298 (continued)
6 Table 1.2 (continued)
1 Economic Growth: Sigma and Beta Convergence Processes Worldwide
Country name
Average GDP per capita
Hong Kong SAR, China
50,332.500
Iceland
49,777.222
Germany
48,268.091
Sweden
47,840.682
Belgium
47,837.581
Bahrain
47,498.101
Canada
45,643.907
Finland
45,547.704
Australia
45,045.684
UK
43,262.273
Saudi Arabia
43,183.394
France
42,606.178
Italy
42,529.247
Japan
38,909.262
New Zealand
38,720.641
Spain
37,513.140
Aruba
37,363.348
Cyprus
37,265.072
Oman
36,819.316
Bahamas, The
35,143.348
Israel
34,717.055
Malta
34,687.616
Korea, Rep
34,220.048
Czechia
33,567.262
Puerto Rico
33,415.863
Slovenia
33,289.052
Portugal
31,642.689
Greece
31,313.650
Estonia
28,611.815
Curacao
26,499.493
Lithuania
26,487.836
Hungary
25,991.403
Libya
25,821.945
St. Kitts and Nevis
24,945.797
Trinidad and Tobago
24,941.329 (continued)
1.2 Data Analysis and Sigma Convergence Table 1.2 (continued)
Table 1.3 Intermediate averages, across the period 2000–2021, for the world GDP per capita
Country name
7
Average GDP per capita
Slovak Republic
24,852.335
Croatia
24,819.473
Poland
24,303.782
Equatorial Guinea
23,856.948
Latvia
23,464.871
Russian Federation
23,100.674
Seychelles
23,078.993
Panama
22,658.165
Turkiye
21,788.406
Country name
Average GDP per capita
Romania
21,418.236
Argentina
21,355.184
Chile
21,247.325
Malaysia
21,224.837
Kazakhstan
20,351.568
Antigua and Barbuda
19,853.073
Uruguay
18,804.526
Mexico
18,603.244
Bulgaria
17,833.496
Mauritius
17,552.297
Costa Rica
16,898.748
Suriname
16,749.352
Montenegro
16,685.437
Maldives
16,533.940
Lebanon
15,980.462
Barbados
15,797.152
Palau
15,780.378
Belarus
15,521.140
Gabon
14,576.129
Serbia
14,367.630
Thailand
14,174.396
St. Lucia
14,008.129
Iran, Islamic Rep
13,936.516 (continued)
8 Table 1.3 (continued)
1 Economic Growth: Sigma and Beta Convergence Processes Worldwide
Country name
Average GDP per capita
Brazil
13,840.412
North Macedonia
13,376.690
Botswana
13,308.222
Dominican Republic
13,132.279
Grenada
13,060.749
South Africa
12,970.939
Colombia
12,123.288
St. Vincent and the Grenadines
11,872.993
Ukraine
11,639.821
Azerbaijan
11,360.428
Dominica
11,348.761
Paraguay
11,181.649
Bosnia and Herzegovina
10,837.181
Algeria
10,798.603
Guyana
10,792.768
Fiji
10,702.146
Ecuador
10,389.241
Jordan
10,363.122
Albania
10,339.423
Georgia
10,224.804
Sri Lanka
9953.539
Jamaica
9901.550
Peru
9844.463
Tunisia
9809.547
China
9597.875
Armenia
9576.679
Egypt, Arab Rep.
9391.740
Belize
9109.654
Moldova
9073.832
Namibia
8947.628
Turkmenistan
8820.440
Indonesia
8597.434
Iraq
8503.629
Mongolia
8468.287
Bhutan
7913.419
El Salvador
7674.463
Guatemala
7532.328
1.2 Data Analysis and Sigma Convergence Table 1.4 Lowest averages, across the period 2000–2021, for the world GDP per capita
9
Country name
Average GDP per capita
Eswatini
7210.458
Vietnam
6791.206
Bolivia
6764.556
Angola
6762.031
Philippines
6253.417
Morocco
6180.713
Samoa
5530.274
Cabo Verde
5487.302
Tonga
5473.843
West Bank and Gaza
5292.356
Lao PDR
5186.467
Uzbekistan
5160.212
Honduras
4854.734
Mauritania
4851.732
Nicaragua
4845.330
Sudan
4540.024
Nigeria
4517.567
Congo, Rep.
4451.420
India
4445.906
Pakistan
4227.881
Kyrgyz Republic
4204.969
Marshall Islands
4069.346
Cote d’Ivoire
4019.905
Ghana
3981.348
Kenya
3844.331
Tuvalu
3804.400
Bangladesh
3701.081
Micronesia, Fed. Sts
3427.823
Cameroon
3386.998
Sao Tome and Principe
3380.537
Papua New Guinea
3321.136
Comoros
3055.499
Haiti
3016.282
Timor-Leste
2986.536
Senegal
2933.490
Cambodia
2923.932 (continued)
10 Table 1.4 (continued)
1 Economic Growth: Sigma and Beta Convergence Processes Worldwide
Country name
Average GDP per capita
Zambia
2900.240
Myanmar
2884.235
Vanuatu
2880.322
Nepal
2820.853
Benin
2752.084
Tajikistan
2501.292
Solomon Islands
2322.261
Lesotho
2258.526
Zimbabwe
2115.046
Gambia, The
2025.691
Guinea
2024.442
Tanzania
2013.191
Mali
1973.348
Kiribati
1956.277
Uganda
1830.118
Afghanistan
1790.624
Togo
1754.049
Guinea-Bissau
1720.061
Burkina Faso
1700.136
Madagascar
1523.739
Chad
1521.816
Rwanda
1520.877
Liberia
1466.341
Sierra Leone
1432.730
Ethiopia
1373.745
Malawi
1297.930
Niger
1048.328
Mozambique
1037.332
Central African Republic
959.173
Congo, Dem. Rep.
879.806
Burundi
792.734
There are signs of structural breaks for the world GDP per capita growth rates, over 2000–2021, in 2016 (Fig. 1.4). These results for the structural breaks with the QLR test need further assessment in future research.
1.3 Results for the Beta Convergence
11
Fig. 1.4 Testing for structural breaks in the world GDP per capita growth rate over the period 2000–2021
1.3 Results for the Beta Convergence Considering the results obtained in the previous section for the years 2009 and 2020 (with the data analysis and the sigma convergence) and for the years 2016 and 2018 (with the QLR test), a regression with the convergence model was carried out taking into account dummies variables for these years. These findings for the model with panel data are those presented in Table 1.5. The results found confirm disturbances in 2009 and 2020, but not in 2016 and 2018. On the other hand, there is no beta convergence worldwide for the period 2000–2021, considering that the coefficient of convergence has no statistical significance. There is not also evidence of beta convergence for the period 2000–2008 (Table 1.6) and for the period 2009–2019 (Table 1.7). The signs of beta convergence appear in the period 2009–2020 (Table 1.8) and 2009–2021 (Table 1.9). In these models, the dependent variable is the GDP per capita growth rate.
0.006 0.006
0.000
− 0.081*
Dummy2018
Dummy2020
Note *Statistically significant at 1%
0.016
0.006
− 0.004
Dummy2016
0.048*
0.006
− 0.041*
Dummy2009
Constant
0.002
− 0.003
Logarithm of GDPpc lagged
Prais–Winsten regression, correlated panels corrected standard errors (PCSEs)
Standard error
Coefficient
Independent variable
Approach
3.000
0.003
0.000
0.934
− 13.990
0.516
− 0.080
0.000
0.139
P > |z|
− 0.650
− 7.150
− 1.480
Z
Beta convergence (%) 138.340*
Hausman test 52.501*
Pesaran’s test of cross-sectional independence
Table 1.5 Results of the beta convergence for the world GDP per capita with panel data, over the period 2000–2021
28,025.920*
13.621*
Modified Wald test Wooldridge test for for groupwise autocorrelation heteroskedasticity
12 1 Economic Growth: Sigma and Beta Convergence Processes Worldwide
Constant
Logarithm of GDPpc lagged
0.003
0.044** 0.022
− 0.002
2.000
− 0.680
Independent Coefficient Standard Z variable error
Note *Statistically significant at 1%; **Statistically significant at 5%
Prais–Winsten regression, correlated panels corrected standard errors (PCSEs)
Approach
0.045
0.497
23.370*
65.550*
61,948.510*
10.337*
P > |z| Beta Hausman Pesaran’s test of Modified Wald Wooldridge convergence test cross-sectional test for groupwise test for (%) independence heteroskedasticity autocorrelation
Table 1.6 Results of the beta convergence for the world GDP per capita with panel data, over the period 2000–2008
1.3 Results for the Beta Convergence 13
Constant
Logarithm of GDPpc lagged
0.002
0.036** 0.014
− 0.002
2.550
− 1.090
Independent Coefficient Standard Z variable error
0.011
0.275
138.160* 28.481*
140,000.000*
3.715***
P > |z| Beta Hausman Pesaran’s test of Modified Wald Wooldridge convergence test cross-sectional test for groupwise test for (%) independence heteroskedasticity autocorrelation
Note *Statistically significant at 1%; **Statistically significant at 5%; ***Statistically significant at 10%
Prais–Winsten regression, correlated panels corrected standard errors (PCSEs)
Approach
Table 1.7 Results of the beta convergence for the world GDP per capita with panel data, over the period 2009–2019
14 1 Economic Growth: Sigma and Beta Convergence Processes Worldwide
Constant
Logarithm of GDPpc lagged
0.062*
− 0.006*
0.015
0.002
4.060
− 3.030
Independent Coefficient Standard Z variable error
Note *Statistically significant at 1%; **Statistically significant at 5%
Prais–Winsten regression, correlated panels corrected standard errors (PCSEs)
Approach
0.000
0.002
0.577
205.260* 142.204*
71,213.190*
4.642**
P > |z| Beta Hausman Pesaran’s test of Modified Wald Wooldridge convergence test cross-sectional test for groupwise test for (%) independence heteroskedasticity autocorrelation
Table 1.8 Results of the beta convergence for the world GDP per capita with panel data, over the period 2009–2020
1.3 Results for the Beta Convergence 15
Constant
Logarithm of GDPpc lagged
0.049*
− 0.004*
0.009
0.001
5.500
− 3.600
Independent Coefficient Standard Z variable error
Note *Statistically significant at 1%
Prais–Winsten regression, correlated panels corrected standard errors (PCSEs)
Approach
0.000
0.000
0.359
204.480* 147.280*
35,765.880*
14.069*
P > |z| Beta Hausman Pesaran’s test of Modified Wald Wooldridge convergence test cross-sectional test for groupwise test for (%) independence heteroskedasticity autocorrelation
Table 1.9 Results of the beta convergence for the world GDP per capita with panel data, over the period 2009–2021
16 1 Economic Growth: Sigma and Beta Convergence Processes Worldwide
1.4 Discussion and Conclusions
17
1.4 Discussion and Conclusions This research aimed to analyse the economic growth dynamics worldwide. For that, the convergence tendencies of the world GDP per capita over the period 2000–2021 were assessed, considering data from the World Bank. This statistical information was analysed through the models of the Neoclassical Theory and the respective concepts of sigma and beta convergence. The possibility of existing structural breaks in the time series was also tested with the QLR test. In the regressions, the methodologies associated with the panel data were taken into account. One of the focuses of the scientific literature about economic growth is to understand if the economic growth worldwide follows convergence/divergence trends among regions inside the countries, nations and parts of the world. Sigma and beta convergence are concepts often present in the studies related to the convergence assessments and a relevant part of the literature includes in the research the GDP per capita. Nonetheless, other variables and methodologies have been considered. The policy instruments, the respective support programmes and the international organisations play here a fundamental role in territorial cohesion worldwide. The external shocks, particularly those that occurred with the global financial crisis and the COVID-19 pandemic, had their impacts on the dynamics of economic growth. The impacts from the external shocks verified in the last decades are visible in the data analysis and the sigma convergence assessment for the entire sample considered. In any case, the impacts on the reduction of the GDP per capita seem to be greater with the pandemic than with the global financial crisis; however, the consequent signs of divergence look proportionally lower in the COVID-19 context. Of course, more data about the consequences of the pandemic are needed, but from this analysis, it appears that the implications of the global financial crisis had proportionally a greater impact on the divergence process worldwide. To test the potential existence of structural breaks in the times series, a previous regression with variable dummies and panel data was carried out that confirmed the presence of breaks in 2009 and 2020. Taking into account, these findings several regressions were performed for different sub-periods that revealed the existence of convergence tendencies in 2009–2020 and 2009–2021. In terms of practical implications, more statistical information is needed, particularly for more recent years, to better assess the impacts of the COVID-19 pandemic on the economic growth dynamics, but seems that the disruptions promoted by the global financial crisis were proportionally greater than by the pandemic. In any case and despite the need for more assessments to confirm these findings, these two external shocks had impacts on the evolution of the GDP per capita worldwide and consequently on the dynamics of economic growth. These results suggest the need for adjusted policies to deal with the respective consequences on the population’s well-being. For future research, it could be interesting to investigate the possibility of the existence of convergence clubs between countries.
18
1 Economic Growth: Sigma and Beta Convergence Processes Worldwide
Acknowledgements This work is funded by National Funds through the FCT—Foundation for Science and Technology, I.P., within the scope of the project Refa UIDB/00681/2020. Furthermore we would like to thank the CERNAS Research Centre and the Polytechnic Institute of Viseu for their support.
References 1. Y. Li, J. Wang, K. Oh, Effects of globalization on the convergence of poverty levels among Asian countries. Int. Econ. J. 36, 193 (2022) 2. M. Abdollahian, Z. Yang, Towards trade equalisation: a network perspective on trade and income convergence across the twentieth century. New Polit. Econ. 19, 601 (2014) 3. N. Wang, X. Fu, S. Wang, H. Yang, Z. Li, Convergence characteristics and distribution patterns of residential electricity consumption in China: an urban-rural gap perspective. Energy 254 (2022) 4. A. Abdullah, H. Doucouliagos, E. Manning, Are regional incomes in Malaysia converging? Pap. Reg. Sci. 94, S69 (2015) 5. V. Balash, O. Balash, A. Faizliev, E. Chistopolskaya, Economic growth patterns: spatial econometric analysis for Russian regions. Information 11 (2020) 6. C. Mendez, Lack of global convergence and the formation of multiple welfare clubs across countries: an unsupervised machine learning approach. Economies 7 (2019) 7. M. Gonzalez, M. Navarro, Patterns of convergence in Spanish regions: an application of Phillips-Sul’s methodology. Revista de Estudios Regionales 165 (2017) 8. J. Yang, R. Zou, J. Cheng, Z. Geng, Q. Li, Environmental technical efficiency and its dynamic evolution in China? Industry: a resource endowment perspective. Resour. Policy 82 (2023) 9. G. Butnaru, M. Mironiuc, C. Huian, A. Haller, Analysis of economic growth in tourism under the impact of terrorism and of the waves of refugees. Amfiteatru Econ. 20, 885 (2018) 10. E. Felice, The roots of a dual equilibrium: GDP, productivity, and structural change in the Italian regions in the long run (1871–2011). Eur. Rev. Econ. Hist. 23, 499 (2019) 11. A. Shingal, The services sector in India’s States: a tale of growth convergence and trade. World Econ. 37, 1773 (2014) 12. A. Iancu, Economic convergence applications—second part. Romanian J. Econ. Forecast. 8, 24 (2007) 13. T. Agasisti, C. Perez-Esparrells, G. Catalano, S. Morales, Is expenditure on higher education per student converging across EU-15 Countries? Stud. High. Educ. 37, 235 (2012) 14. R. Ginanjar, V. Zahara, S. Suci, I. Suhendra, Human development convergence and the impact of funds transfer to regions: a dynamic panel data approach. J. Asian Fin. Econ. Bus. 7, 593 (2020) 15. S. Nagy, D. Siljak, Is the European union still a convergence machine? Acta Oeconomica 72, 47 (2022) 16. M. Herbst, P. Wojcik, Economic growth and income divergence in the polish subregions: some determinants and spatial patterns. Ekonomista 175 (2012) 17. J. Martinez-Carrion, R. Maria-Dolores, Regional inequality and convergence in Southern Europe. Evidence from height in Italy and Spain, 1850–2000. Revista de Economia Aplicada 25, 75 (2017) 18. Y. Turganbayev, Regional convergence in Kazakhstan. Post-Communist Econ. 28, 314 (2016) 19. R.M. Solow, A contribution to the theory of economic growth. Q. J. Econ. 70, 65 (1956) 20. R.J. Barro, X. Sala-I-Martin, Convergence across states and regions. Brook. Pap. Econ. Act. 1991, 107 (1991) 21. X.X. Sala-i-Martin, Regional cohesion: evidence and theories of regional growth and convergence. Eur. Econ. Rev. 40, 1325 (1996)
References
19
22. World Bank, World Bank Open Data. https://data.worldbank.org 23. G. Tondl, The Changing Pattern of Regional Convergence in Europe. Robert Schuman Centre (EUI), RSC No. 97/53, 130688 24. N. Islam, Growth empirics: a panel data approach. Q. J. Econ. 110, 1127 (1995) 25. D. Hoechle, Robust standard errors for panel regressions with cross-sectional dependence. Stand. Genomic Sci. 7, 281 (2007) 26. O. Torres-Reyna, Panel Data Analysis Fixed and Random Effects Using Stata (v. 6.0) (2007) 27. StataCorp, Stata 15 Base Reference Manual (2017) 28. StataCorp, Stata Statistical Software: Release 15 (2017) 29. Stata, Statistical Software for Data Science|Stata. https://www.stata.com/ 30. R.E. Quandt, Tests of the hypothesis that a linear regression system obeys two separate regimes. J. Am. Stat. Assoc. 55, 324 (1960) 31. H.-J. Kim, D. Siegmund, The likelihood ratio test for a change-point in simple linear regression. Biometrika 76, 409 (1989) 32. D.W.K. Andrews, Tests for parameter instability and structural change with unknown change point. Econometrica 61, 821 (1993) 33. Web of Science, Web of Science Core Collection. https://www.webofscience.com/wos/woscc/ basic-search
Chapter 2
Clubs of Convergence: Insights from the Main Groups of Countries
Abstract The dynamics of economic growth present differences in several sub-periods of the last decades and specific world regions. This evidence for groups of countries seems to show signs of clubs of convergence where the economic growth in some groups follow a trend that is distinct from the tendencies presented in other contexts. A deeper interpretation of these scenarios may bring relevant contributions to identify weaknesses and strengths, particularly for economies with greater development difficulties. In this context, it is aimed in this chapter to highlight the dynamics of convergence in the world regions and a specific sub-period over the last decades. For that, statistical information from the World Bank was considered. These data were analysed through approaches related to sigma and beta convergence. Panel data methodologies were considered for the regressions carried out and, for a better understanding of these processes, catch-up rates were also calculated. The results found show constraints verified in some world regions that may provide relevant insights for future research and policy design. Keywords Gross domestic product (GDP) per capita · World regions · Sigma and beta convergence · Catching-up processes
2.1 Introduction International trade plays a fundamental role in the performance of the economic growth of countries and regions, including in the processes of convergence, or divergence, between countries, particularly in the European Union [1]. These processes of convergence worldwide involve phenomena of catching-up among poor and rich countries or regions. Sometimes economies converge to the same steady state and, in other contexts, different economies with different characteristics converge to different steady states, which reveals the existence of convergence clubs. In these circumstances, some economies converge to the same steady state which is different from those to which other economies eventually converge. This presence of convergence clubs was found, © The Author(s), under exclusive license to Springer Nature Switzerland AG 2023 V. J. P. D. Martinho, Economic Growth: Advances in Analysis Methodologies and Technologies, SpringerBriefs in Applied Sciences and Technology, https://doi.org/10.1007/978-3-031-38363-2_2
21
22
2 Clubs of Convergence: Insights from the Main Groups of Countries
for example, in the African framework [2] and nations [3]. These clubs were too found for the human capital in China [4] and in the contexts of East Asia [5]. The assessments performed to show if the economies converge, or divergence, have been carried out at national and regional levels [6], and for the different world contexts, including between members of regional economic integration organisations, such as the Association of Southeast Asian Nations (ASEAN) [7]. These analyses also have considered the new approaches developed by the scientific community [8]. The spatial models are among the recent developments to extend the original methodologies considered for the economic growth investigation [9]. The consideration of spatial dependence may be particularly important in the convergence analysis [10]. These dynamics of economic growth and the associated processes of convergence, or divergence, are impacted by the world events, such as the global financial crisis, favouring some economies and harming others [11]. Considering these contexts, this chapter intends to analyse the processes of convergence worldwide, considering the developments from the theory [12], the sigma and beta approaches [13, 14] and the contributions of Islam [15] for the models with panel data. The possibility of the existence of convergence clubs [16, 17] was assessed, testing the sigma and beta convergence in groups of countries created through cluster analysis. For a deeper analysis of the processes of convergence, catch-up rates were calculated [18], as well as the speed of convergence [19]. For the panel data regressions, the Hoechle [20], Torres-Reyna [21] and Stata software [22–24] procedures were taken into account. For the literature survey, the Web of Science [25] database was used. The data were obtained from the World Bank [26]. Some nations were excluded due to the availability of statistical information.
2.2 Sigma Convergence and Catch-Up Rates The results for the sigma convergence of the world GDP per capita, over the period 2009–2020, show signs of divergence among 2009 and 2011, some convergence in 2012, divergence in 2013 and after convergence trends until 2020 (Table 2.1). In any case, there is evidence of a strong contraction of the GDP per capita in 2020, as a consequence of the contexts associated with the COVID-19 pandemic (Fig. 2.1). The years 2015 and 2020 present the lowest values for catch-up rate means, revealing that, on average, the gap between each country and the world-weighted average decreased in these years (Fig. 2.2). Some of the countries with the highest catch-up rate averages, across the period taken into account (2009–2020), for the world GDP per capita are the following (Table 2.2): France; Sint Maarten (Dutch part); Australia; Ireland; Libya; Equatorial Guinea; Sweden; Germany; Canada; UK; Greece; and Italy. Azerbaijan, Afghanistan, Brazil, Luxembourg, Malawi, West Bank and Gaza, Mozambique, Congo (Dem. Rep.), Niger, Solomon Islands, Sierra Leone and Comoros are some of the nations with intermediate averages for the catch-up rates (Table 2.3). The lowest catch-up
2.2 Sigma Convergence and Catch-Up Rates Table 2.1 Sigma convergence (coefficient of variation) for the world GDP per capita, over the period 2009–2020
Fig. 2.1 GDP per capita averages, across world countries, over the period 2009–2020
23
Time
CV
2009
1.076
2010
1.085
2011
1.098
2012
1.091
2013
1.096
2014
1.077
2015
1.036
2016
1.028
2017
1.027
2018
1.025
2019
1.020
2020
1.009
22500 22000 21500 21000 20500 20000 19500
19000 18500 18000
rate averages appear, for example, in the following countries (Table 2.4): Bhutan; St. Kitts and Nevis; Indonesia; Croatia; Brunei Darussalam; Belarus; Vietnam; Bosnia and Herzegovina; Thailand; Moldova; and Chile. The catch-up rate averages are negative for the countries with the intermediate and lowest values, showing that the gap in the GDP per capita between the respective countries and the world-weighted average decreased in the period considered.
24
2 Clubs of Convergence: Insights from the Main Groups of Countries
Fig. 2.2 Catch-up rate averages, across world countries, for the GDP per capita, over the period 2009–2020
15 10 5 0 -5 -10
-15 -20 -25 -30 -35 -40 Table 2.2 Highest average catch-up rates, across the period 2009–2020, for the world GDP per capita
Country name
Average catch-up rates
France
91.076
Sint Maarten (Dutch part)
51.948
Australia
19.377
Ireland
18.628
Libya
16.001
Equatorial Guinea
14.307
Sweden
12.014
Germany
11.913
Canada
11.372
UK
10.582
Greece
10.031
Italy
8.750
Bahrain
8.689
The Bahamas
8.190
Hong Kong SAR, China
7.526
Iceland
6.667
Singapore
6.271
United Arab Emirates
5.832
Aruba
5.710
Denmark
5.561 (continued)
2.2 Sigma Convergence and Catch-Up Rates Table 2.2 (continued)
Country name
25
Average catch-up rates
Belgium
5.416
USA
4.507
Spain
4.454
Curacao
4.376
Netherlands
3.117
Turkmenistan
2.382
Trinidad and Tobago
2.103
Switzerland
1.562
Lebanon
1.492
Austria
1.276
Norway
1.130
Antigua and Barbuda
1.075
Barbados
0.946
Maldives
0.910
Cyprus
0.882
Puerto Rico
0.872
St. Lucia
0.836
Jordan
0.808
Argentina
0.795
Suriname
0.779
Dominica
0.608
Angola
0.438
Belize
0.403
Congo, Rep.
0.347
Sudan
0.226
Jamaica
0.214
South Africa
0.152
Iran, Islamic Rep.
0.097
Tunisia
0.088
Central African Republic
0.080
Haiti
0.068
Vanuatu
0.061
Madagascar
0.046
Chad
0.044
Burundi
0.041
The Gambia,
0.041 (continued)
26
2 Clubs of Convergence: Insights from the Main Groups of Countries
Table 2.2 (continued)
Country name
0.027
Algeria
0.025
Liberia
0.019
Micronesia, Fed. Sts.
0.015
Kiribati
0.008
Lesotho
Table 2.3 Intermediate average catch-up rates, across the period 2009–2020, for the world GDP per capita
Average catch-up rates
Cabo Verde
0.002
Guinea-Bissau
− 0.010
Mali
− 0.010
Country name
Average catch-up rates
Azerbaijan
− 0.012
Afghanistan
− 0.012
Brazil
− 0.013
Luxembourg
− 0.018
Malawi
− 0.019
West Bank and Gaza
− 0.026
Mozambique
− 0.028
Congo, Dem. Rep.
− 0.030
Niger
− 0.030
Solomon Islands
− 0.031
Sierra Leone
− 0.032
Comoros
− 0.034
Nigeria
− 0.035
Ecuador
− 0.039
Zambia
− 0.047
Honduras
− 0.060
Cameroon
− 0.061
Namibia
− 0.066
Uganda
− 0.071
Zimbabwe
− 0.095
Burkina Faso
− 0.095
Togo
− 0.098
Benin
− 0.098
Mauritania
− 0.104
Kyrgyz Republic
− 0.108
Senegal
− 0.109 (continued)
2.2 Sigma Convergence and Catch-Up Rates Table 2.3 (continued)
27
Country name
Average catch-up rates
Samoa
− 0.112
Tanzania
− 0.126
Rwanda
− 0.130
Papua New Guinea
− 0.134
Grenada
− 0.144
Nicaragua
− 0.151
Guinea
− 0.157
Gabon
− 0.179
Sao Tome and Principe
− 0.181
Pakistan
− 0.198
Ukraine
− 0.202
Kenya
− 0.202
Ethiopia
− 0.231
El Salvador
− 0.244
Iraq
− 0.254
Nepal
− 0.259
Qatar
− 0.269
Guatemala
− 0.271
Tajikistan
− 0.300
Tuvalu
− 0.302
Eswatini
− 0.317
Tonga
− 0.318
Bolivia
− 0.332
Mexico
− 0.332
Fiji
− 0.344
Cote d’Ivoire
− 0.355
Cambodia
− 0.378
St. Vincent and the Grenadines
− 0.387
Portugal
− 0.396
Ghana
− 0.402
Palau
− 0.427
Morocco
− 0.452
Timor-Leste
− 0.459
Egypt, Arab Rep.
− 0.489
Marshall Islands
− 0.497
India
− 0.519
Myanmar
− 0.537 (continued)
28
2 Clubs of Convergence: Insights from the Main Groups of Countries
Table 2.3 (continued)
Table 2.4 Lowest average catch-up rates, across the period 2009–2020, for the world GDP per capita
Country name
Average catch-up rates
Peru
− 0.539
Bangladesh
− 0.539
Philippines
− 0.556
Colombia
− 0.564
Botswana
− 0.572
Uzbekistan
− 0.632
Montenegro
− 0.710
Lao PDR
− 0.808
North Macedonia
− 0.853
Albania
− 0.857
Paraguay
− 0.887
Kosovo
− 0.910
Country name
Average catch-up rates
Bhutan
− 0.916
St. Kitts and Nevis
− 1.000
Indonesia
− 1.013
Croatia
− 1.096
Brunei Darussalam
− 1.136
Belarus
− 1.155
Vietnam
− 1.161
Bosnia and Herzegovina
− 1.189
Thailand
− 1.191
Moldova
− 1.199
Chile
− 1.214
Sri Lanka
− 1.236
Mongolia
− 1.250
Armenia
− 1.322
Serbia
− 1.325
Mauritius
− 1.400
Costa Rica
− 1.404
Georgia
− 1.448
Uruguay
− 1.574
Nauru
− 1.598
Dominican Republic
− 1.599
Russian Federation
− 1.868
Cayman Islands
− 1.890 (continued)
2.3 Findings for Cluster Analysis and Beta Convergence Table 2.4 (continued)
29
Country name
Average catch-up rates
Bulgaria
− 1.897
Panama
− 2.144
Macao SAR, China
− 2.246
China
− 2.464
Guyana
− 2.546
Kazakhstan
− 2.659
Bermuda
− 2.816
Seychelles
− 3.098
Malaysia
− 3.128
Romania
− 4.151
Slovak Republic
− 4.188
Hungary
− 4.391
Turkiye
− 4.781
Slovenia
− 4.863
Latvia
− 4.929
Poland
− 6.042
San Marino
− 6.151
Japan
− 6.550
Oman
− 7.501
Czechia
− 8.407
Estonia
− 8.422
Israel
− 10.208
Lithuania
− 11.219
New Zealand
− 12.947
Kuwait
− 16.690
Korea, Rep.
− 22.416
Saudi Arabia
− 28.256
Malta
− 96.461
Finland
− 541.985
2.3 Findings for Cluster Analysis and Beta Convergence To analyse the existence of convergence clubs among the investigated countries, four clusters were identified through cluster analysis for the GDP per capita. On average, the GDP per capita increases from clusters 1 to 4. The results of the convergence model with panel data (the dependent variable is the GDP per capita growth rate) for clusters 1, 2, 3 and 4 are those presented, respectively, in Tables 2.5, 2.6, 2.7 and 2.8. The speeds of convergence are, respectively, the following: 15%; 31%; 13%;
Logarithm of GDPpc lagged
Regression with Driscoll–Kraay standard errors, fixed effects
Note *Statistically significant at 1%
Constant
Independent variable
Approach
0.309
0.036
− 0.137*
1.189*
Standard error
Coefficient
3.840
− 3.740
Z
0.003
0.004
P > |z|
14.695
Beta convergence (%) 139.720*
Hausman test 67.775*
Pesaran’s test of cross-sectional independence
10,553.000*
Modified Wald test for groupwise heteroskedasticity
48.614*
Wooldridge test for autocorrelation
Table 2.5 Results for the beta convergence with panel data for the GDP per capita, across world countries and over the period 2009–2020 (cluster 1)
30 2 Clubs of Convergence: Insights from the Main Groups of Countries
Constant
Logarithm of GDPpc lagged
2.704**
− 0.266**
0.909
0.090
2.970 0.014
30.870
66.060*
46.014*
20,322.720*
5.733**
P > |z| Beta Hausman Pesaran’s test of Modified Wald Wooldridge convergence test cross-sectional test for groupwise test for (%) independence heteroskedasticity autocorrelation
− 2.950 0.014
Independent Coefficient Standard Z variable error
Note *Statistically significant at 1%; **Statistically significant at 5%
Regression with Driscoll–Kraay standard errors, fixed effects
Approach
Table 2.6 Results for the beta convergence with panel data for the GDP per capita, across world countries and over the period 2009–2020 (cluster 2)
2.3 Findings for Cluster Analysis and Beta Convergence 31
Constant
Logarithm of GDPpc lagged
1.310*** 0.588
2.230 0.050
15.710*
25.4780*
3111.070*
36.107*
P > |z| Beta Hausman Pesaran’s test of Modified Wald Wooldridge convergence test cross-sectional test for groupwise test for (%) independence heteroskedasticity autocorrelation
− 2.210 0.051 12.841
Standard Z error
− 0.121*** 0.054
Independent Coefficient variable
Note *Statistically significant at 1%; ***Statistically significant at 10%
Regression with Driscoll–Kraay standard errors, fixed effects
Approach
Table 2.7 Results for the beta convergence with panel data for the GDP per capita, across world countries and over the period 2009–2020 (cluster 3)
32 2 Clubs of Convergence: Insights from the Main Groups of Countries
Constant
Logarithm of GDPpc lagged
4.412**
− 0.387**
1.920
0.168
2.300 0.044
48.885
8.080**
5.273*
21,289.180*
45.023*
P > |z| Beta Hausman Pesaran’s test of Modified Wald Wooldridge convergence test cross-sectional test for groupwise test for (%) independence heteroskedasticity autocorrelation
− 2.300 0.044
Independent Coefficient Standard Z variable error
Note *Statistically significant at 1%; **Statistically significant at 5%
Regression with Driscoll–Kraay standard errors, fixed effects
Approach
Table 2.8 Results for the beta convergence with panel data for the GDP per capita, across world countries and over the period 2009–2020 (cluster 4)
2.3 Findings for Cluster Analysis and Beta Convergence 33
34
2 Clubs of Convergence: Insights from the Main Groups of Countries
and 49%. The convergence is stronger between the countries with higher GDP per capita averages. The poorer countries continue to deserve special attention from governments and international organisations.
2.4 Discussion and Conclusions This chapter proposed to analyse the existence of convergence clubs worldwide, over the period 2009–2020, considering statistical information from the World Bank for the GDP per capita. These data were analysed with the concepts of sigma and beta convergence and approaches (catch-up rates between each country and the weighted average for the countries considered) to assess the presence of catching-up processes. Panel data methodologies were taken into account for the results obtained with the regressions. In the processes of convergence, it is expected that occur phenomena of catchingup between the poor and rich countries/regions. At the beginning of the convergence theory, the idea was that all countries would tend to converge for the same steady state and later appeared the hypothesis of the existence of convergence clubs, where it was admitted that some countries may converge to a different steady state from other countries with distinct characteristics and conditions. The findings for the sigma convergence reveal that, in general, there are signs of convergence until 2020 and the data analysis shows a strong contraction of the GDP per capita with the COVID-19 pandemic. Additionally, the catch-up rates averages were negative in 2020, showing that the gap between each country and the world decreased. In fact, the beginning of the world crises seems to be characterised by periods of convergence, the problem appears to occur when the countries internalise the consequences of the shocks and in the recovery processes. The regressions carried out for the different world clusters of countries (obtained considering the values of GDP per capita with cluster analysis methodologies), over the period 2009–2020, show that the speed of convergence is greater for clusters 2 and 4 (the GDP per capita averages increase from cluster 1 to cluster 4). This means that the poorer countries deserve special attention from the national and international communities. In terms of practical implications, the results highlight the impacts of the COVID19 pandemic on the economic growth dynamics. On the other hand, the findings found for the catching-up process and the speed of convergence call for special attention, particularly with the poorer countries. In terms of policy recommendations, it is suggested to design more programmes of financial assistance for countries with greater economic difficulties to support them to overcome the consequences of external shocks. For future research, it could be relevant to try understanding the effects of other variables, particularly those associated with human capital, on these convergence patterns.
References
35
Acknowledgements This work is funded by National Funds through the FCT—Foundation for Science and Technology, I.P., within the scope of the project Refa UIDB/00681/2020. Furthermore we would like to thank the CERNAS Research Centre and the Polytechnic Institute of Viseu for their support.
References 1. L. De Benedictis, L. Tajoli, Openness, similarity in export composition, and income dynamics. J. Int. Trade Econ. Dev. 16, 93 (2007) 2. A. Ibourk, Z. Elouaourti, Regional convergence and catching up process in Africa: a tale of three clubs. Reg. Sci. Policy Pract. 1 (2023) 3. K. You, S. Dal Bianco, Z. Lin, J. Arnankwah-Arnoan, Bridging technology divide to improve business environment: insights from African nations. J. Bus. Res. 97, 268 (2019) 4. O.M. Valerio Mendoza, M. Tamas Borsi, F. Comim, Human capital dynamics in China: evidence from a club convergence approach. J. Asian Econ. 79, 101441 (2022) 5. Z.Y. Zhang, Can the rest of East Asia catch up with Japan: some empirical evidence. Jpn. World Econ. 15, 91 (2003) 6. I.S. Kano, I. Lengyel, Convergence clubs of nuts3 regions of the V4 group. E M Ekon. Manage. 24, 22 (2021) 7. L.K. Lim, M. McAleer, Convergence and catching up in ASEAN: a comparative analysis. Appl. Econ. 36, 137 (2004) 8. T. Misiak, Is the division of western and Eastern Poland still valid? The evolution of regional convergence in Poland. Econ. Bus. Rev. 8, 145 (2022) 9. M. Pietrzykowski, Convergence in GDP per capita across the EU regions-spatial effects. Econ. Bus. Rev. 5, 64 (2019) 10. K. Tipayalai, C. Mendez, Regional convergence and spatial dependence in Thailand: global and local assessments. J. Asia. Pac. Econ. (2022) 11. M. Iwanicz-Drozdowska, P. Smaga, B. Witkowski, Financial development. Have postcommunist countries converged? Transform. Bus. Econ. 15, 389 (2016) 12. R.M. Solow, A contribution to the theory of economic growth. Q. J. Econ. 70, 65 (1956) 13. R.J. Barro, X. Sala-I-Martin, Convergence across states and regions. Brook. Pap. Econ. Act. 1991, 107 (1991) 14. X.X. Sala-i-Martin, Regional cohesion: evidence and theories of regional growth and convergence. Eur. Econ. Rev. 40, 1325 (1996) 15. N. Islam, Growth empirics: a panel data approach. Q. J. Econ. 110, 1127 (1995) 16. W.J. Baumol, Productivity growth, convergence, and welfare: what the long-run data show. Am. Econ. Rev. 76, 1072 (1986) 17. M. Chatterji, Convergence clubs and endogenous growth. Oxf. Rev. Econ. Policy 8, 57 (1992) 18. European Union, Catching-Up, Growth and Convergence of the New Member States 19. G. Tondl, The Changing Pattern of Regional Convergence in Europe. Robert Schuman Centre (EUI), RSC No. 97/53, 130688 20. D. Hoechle, Robust standard errors for panel regressions with cross-sectional dependence. Stand. Genomic Sci. 7, 281 (2007) 21. O. Torres-Reyna, Panel Data Analysis Fixed and Random Effects Using Stata (v. 6.0) (2007) 22. StataCorp, Stata 15 Base Reference Manual (2017) 23. StataCorp, Stata Statistical Software: Release 15 (2017) 24. Stata, Statistical Software for Data Science|Stata. https://www.stata.com/ 25. Web of Science, Web of Science Core Collection. https://www.webofscience.com/wos/woscc/ basic-search 26. World Bank, World Bank Open Data. https://data.worldbank.org
Chapter 3
World Trends: Differences and Similitudes Between Absolute and Conditional Convergence
Abstract The world economic growth and the respective trends of convergence/ divergence are influenced by several factors which make these processes different worldwide in the function of the specific conditions of each context. For example, the Endogenous Growth Theory suggests that the processes of convergence are not unconditional and there is not only one steady state, but there are several steady states and the convergence trends are conditional and depend on the influence of certain variables, specifically those related to human capital. Considering these perspectives, this study aims to assess the processes of conditional convergence worldwide, taking into account data associated with the gross domestic product (GDP) per capita and variables related to human capital. This statistical information was assessed through approaches associated with the sigma and beta convergence and panel data. The insights obtained reveal that, in fact, the indicators related to human capital may play a determinant role in the convergence tendencies in some circumstances and over the period considered. Keywords Econometric models · Neoclassical theory · Endogenous growth theory
3.1 Introduction A usual discussion in the scientific literature, particularly in the economic one, about the processes of convergence is if these frameworks have patterns of absolute or conditional convergence. In other words, the question is if the economies converge for the same steady state independently of their characteristics, or if the convergence is conditioned to some specific particularities, specifically the human capital. These were some of the aspects, between others, taken into account by Cermeno [1] for the Mexican states. The absolute and conditional convergences were also tested for the following contexts: British regions [2]; renewable energy use in European countries [3]; cities and counties in China [4]; total factor productivity in developing and developed countries [5]; Western Balkan countries [6]; groups of countries with and without fossil fuel endowments [7]; between the former © The Author(s), under exclusive license to Springer Nature Switzerland AG 2023 V. J. P. D. Martinho, Economic Growth: Advances in Analysis Methodologies and Technologies, SpringerBriefs in Applied Sciences and Technology, https://doi.org/10.1007/978-3-031-38363-2_3
37
38
3 World Trends: Differences and Similitudes Between Absolute …
socialist countries [8]; Eastern Partnership Countries and the European Union tendencies [9]; Indian states [10]; European Union countries [11]; and North and South of Cyprus [12]. Another not consensual discussion is about the adequacy of the methodology considered to test the hypothesis of absolute and conditional convergence [13]. This divergence in the opinions about the patterns of economic growth and the methodologies used is old and, in some cases, is based, for example, on different perspectives about the returns to scale. The idea of absolute convergence is based on the developments of the Neoclassical Theory [14], considering assumptions of decreasing returns to scale and that the poorer economies have economic growth rates higher than the richer ones and in this way, countries and regions converge for the same steady state. Nonetheless, the Endogenous Growth Theory demonstrated that economic growth is dependent on the characteristics of each economy and in this way is conditioned by the human capital stock and by technological change and innovation [15, 16]. In these frameworks, it is expected to find increasing returns to scale and endogenous technological change [17, 18]. From this perspective, this study aims to analyse the conditional convergence of the GDP per capita, considering the sigma and beta concepts [19, 20], panel data methodologies [21–26] and statistical information from the World Bank [27]. Some countries were not considered because data for some years of this period were missing. The data considered are those associated with the GDP per capita and the following proxies for the human capital stock and skills: school enrolment, secondary (% gross); school enrolment, tertiary (% gross). The Web of Science [28] database was considered for the literature analysis.
3.2 Sigma Convergence and Data Analysis There is a clear trend of sigma convergence over the period considered (2013–2020) for the world gross domestic product per capita, that were more accentuated between the years 2013 and 2015 (Table 3.1). There are also signs of convergence for the world school enrolment, secondary (% gross), particularly after 2016 (Fig. 3.1). The world school enrolment, tertiary (% gross) presents different tendencies of convergence. In any case, it occurs for this variable, with disturbances in 2015 and 2028 (Fig. 3.2). Greece, Australia, Turkiye, Grenada, Korea (Rep.), Puerto Rico, Finland, Belarus, Spain, USA, Singapore, Argentina and Chile are between the countries with the highest averages for school enrolment in tertiary (% gross) (Table 3.2). Some of the nations with intermediate averages for school enrolment in tertiary (% gross) are the following (Table 3.3): Kazakhstan; Fiji; Georgia; United Arab Emirates; Brazil; Hungary; Armenia; Romania; San Marino; Slovak Republic; Bahrain; and China. Ghana, Aruba, Samoa, Cameroon, St. Vincent and the Grenadines, Bhutan,
3.2 Sigma Convergence and Data Analysis
39
Table 3.1 Sigma convergence (coefficient of variation) for the world GDP per capita, over the period 2013–2020 Time
Coefficient of variation
2013
1.107
2014
1.087
2015
1.046
2016
1.038
2017
1.037
2018
1.035
2019
1.025
2020
1.015
0.400 0.350 0.300 0.250 0.200 0.150 0.100 0.050 0.000
2013
2014
2015
2016
2017
2018
2019
2020
Fig. 3.1 Sigma convergence (coefficient of variation) for the world school enrolment, secondary (% gross), over the period 2013–2020
Seychelles, Nepal, São Rome and Principe, Benin and Togo are some examples of countries with the lowest averages for school enrolment in tertiary (% gross) averages (Table 3.4).
40
3 World Trends: Differences and Similitudes Between Absolute …
0.700 0.680 0.660 0.640 0.620 0.600 0.580 0.560 0.540
2013
2014
2015
2016
2017
2018
2019
2020
Fig. 3.2 Sigma convergence (coefficient of variation) for the world school enrolment, tertiary (% gross), over the period 2013–2020 Table 3.2 Averages, across the period 2013–2020, for the world school enrolment, secondary (% gross), and world school enrolment, tertiary (% gross) [countries with the highest values for the school enrolment, tertiary (% gross)] Country name
School enrolment, secondary (% gross)—average
School enrolment, tertiary (% gross)—average
Greece
104.527
135.597
Australia
144.727
115.112
Turkiye
103.491
102.540
Grenada
114.092
99.199
98.809
96.245
Korea, Rep. Puerto Rico
86.500
94.700
Finland
148.903
90.125
Belarus
104.090
89.129
Spain
125.085
88.764
USA
98.542
88.375
Singapore
105.839
88.369
Argentina
107.653
88.326
Chile
101.918
87.424
St. Kitts and Nevis
109.591
85.861
Netherlands
114.971
85.005
Austria
100.141
83.553 (continued)
3.2 Sigma Convergence and Data Analysis
41
Table 3.2 (continued) Country name
School enrolment, secondary (% gross)—average
Latvia
110.697
83.167
97.917
82.704
Denmark
129.701
81.453
Ukraine
96.261
81.413
Russian Federation
101.690
81.397
Norway
116.093
80.654
New Zealand
116.563
80.351
Slovenia
112.862
79.892
Iceland
117.359
77.239
Belgium
158.793
76.894
Ireland
Macao SAR, China
School enrolment, tertiary (% gross)—average
129.184
75.653
Hong Kong SAR, China 104.695
74.410
Estonia
113.340
72.061
Lithuania
108.262
71.717
Peru
103.211
70.935
99.936
70.825
Bulgaria
97.865
70.580
Canada
112.347
69.553
Sweden
142.910
69.065
Cyprus
Germany
98.601
68.915
Poland
109.944
68.795
Croatia
99.447
67.176
Portugal
119.179
65.570
Czechia
103.306
65.054
France
103.870
64.990
Iran, Islamic Rep.
86.255
64.839
Saudi Arabia
111.827
64.774
Israel
104.396
63.825
Japan
101.833
63.489
Italy
101.667
63.452
94.869
63.055
Uruguay
116.608
62.834
Mongolia
94.776
62.071
122.420
60.640
95.889
60.092
101.841
59.855
Serbia
UK Albania Switzerland
(continued)
42
3 World Trends: Differences and Similitudes Between Absolute …
Table 3.2 (continued) Country name
School enrolment, secondary (% gross)—average
School enrolment, tertiary (% gross)—average
Montenegro
90.587
56.643
Kuwait
95.595
55.661
Palau
129.993
54.689
Moldova
107.246
54.557
Malta
101.119
54.229
80.032
54.198
Costa Rica
128.531
53.920
Colombia
97.088
53.737
Dominican Republic
Table 3.3 Averages, across the period 2013–2020, for the world school enrolment, secondary (% gross), and world school enrolment, tertiary (% gross) [countries with the intermediate values for the school enrolment, tertiary (% gross)] Country name
School enrolment, secondary (% gross)—average
School enrolment, tertiary (% gross)—average
Kazakhstan
109.805
53.600
94.046
53.493
Georgia
101.670
53.282
United Arab Emirates
101.456
53.162
Brazil
103.268
51.728
Hungary
103.546
51.561
Armenia
85.777
49.943
Romania
91.330
49.241
San Marino
60.776
48.984
Slovak Republic
90.945
48.949
Bahrain
99.935
48.036
Fiji
China
47.598
Thailand
107.604
47.144
Ecuador
102.440
46.669
Panama
76.862
45.996
Bosnia and Herzegovina
45.738
Kyrgyz Republic
93.522
44.749
West Bank and Gaza
87.672
44.260
Algeria
43.989 (continued)
3.2 Sigma Convergence and Data Analysis
43
Table 3.3 (continued) Country name
School enrolment, secondary (% gross)—average
School enrolment, tertiary (% gross)—average
Malaysia
83.814
43.176
North Macedonia
80.587
41.141
Mauritius
96.970
40.785
Oman
105.285
38.734
Mexico
101.235
37.630
Philippines
87.891
34.672
Jordan
66.492
34.065
Egypt, Arab Rep.
85.062
34.024
Indonesia
85.394
33.901
Tunisia
89.708
33.350
Morocco
80.933
32.157
Brunei Darussalam
97.013
31.888
El Salvador
77.032
28.570
Vietnam Azerbaijan
28.433 94.450
Jamaica
27.197 27.169
India
73.592
27.043
Tajikistan
88.500
26.925
Botswana
26.807
Maldives
83.303
26.143
Cayman Islands
80.334
25.888
Marshall Islands
64.353
25.823
Belize
83.568
24.429
Bermuda
76.915
24.110
Cabo Verde
92.858
23.667
Namibia
23.321
Honduras South Africa
22.407 105.223
22.149
Gabon
73.063
21.066
Guatemala
52.574
20.425
Sri Lanka
98.870
19.759
Nicaragua Luxembourg
19.324 103.908
19.118
Curacao
99.287
18.942
Myanmar
61.206
18.816 (continued)
44
3 World Trends: Differences and Similitudes Between Absolute …
Table 3.3 (continued) Country name
School enrolment, secondary (% gross)—average
School enrolment, tertiary (% gross)—average
Tonga
95.071
18.400
Bangladesh
69.498
18.218
Sudan
45.117
17.166
Lao PDR
63.158
16.433
St. Lucia
89.049
16.366
Qatar
16.270
Table 3.4 Averages, across the period 2013–2020, for the world school enrolment, secondary (% gross), and world school enrolment, tertiary (% gross) [countries with the lowest values for the school enrolment, tertiary (% gross)] Country name Ghana
School enrolment, secondary (% gross)—average 70.165
Aruba
School enrolment, tertiary (% gross)—average 16.011 15.868
Samoa
93.721
14.890
Cameroon
52.026
14.673
St. Vincent and the Grenadines
106.800
14.570
Bhutan
84.276
14.425
Seychelles
80.140
14.132
Nepal
73.256
13.905
Sao Tome and Principe
78.919
13.737
Benin
55.519
13.180
Togo
56.327
12.857
Cambodia
54.830
12.364
Nigeria
46.825
11.980
Senegal
48.424
11.771
Turks and Caicos Islands
73.366
11.549
Congo, Rep.
66.444
11.420
Lesotho
61.615
10.557
Kenya
10.540
Uzbekistan
93.372
10.080
Pakistan
40.261
9.740
Ethiopia
34.236
9.558
Afghanistan
53.092
9.493
Angola
50.671
9.257 (continued)
3.2 Sigma Convergence and Data Analysis
45
Table 3.4 (continued) Country name
School enrolment, secondary (% gross)—average
School enrolment, tertiary (% gross)—average
Cote d’Ivoire
46.635
9.071
Guinea
37.341
8.909
Comoros
59.013
8.876
Zimbabwe
52.406
8.497
Rwanda
40.004
7.202
Congo, Dem. Rep.
44.859
6.846
Eswatini
75.828
6.748
Mozambique
32.673
6.692
Burkina Faso
36.116
5.991
Mauritania
33.988
5.431
Mali
41.485
5.146
Madagascar
37.200
4.987
Uganda
26.635
4.842
Tanzania
29.091
4.588
Burundi
44.385
4.251
Niger
20.386
3.536
Chad
22.019
3.343
Paraguay Malawi Antigua and Barbuda Bahamas, The Barbados
1.417 39.408
1.127
108.904 76.895 105.560
Bolivia
90.411
Central African Republic
16.087
Djibouti
48.981
Dominica
96.905
Equatorial Guinea Liberia
38.725
Micronesia, Fed. Sts. Nauru
88.016
Papua New Guinea
46.974
Sierra Leone
40.301
Suriname
77.237 (continued)
46
3 World Trends: Differences and Similitudes Between Absolute …
Table 3.4 (continued) Country name Timor-Leste
School enrolment, secondary (% gross)—average
School enrolment, tertiary (% gross)—average
77.711
Trinidad and Tobago Tuvalu
71.322
Vanuatu
52.924
3.3 Results for Conditional Beta Convergence with Panel Data Table 3.5 reveals the existence of absolute beta convergence (speed of convergence of about 29%) for the world GDP per capita (the dependent variable in the model considered is the GDP per capita growth rate), over the period considered (2013– 2020). These findings are confirmed in Table 3.6 for a model considering independent variables as proxies for human capital. Nonetheless, the results presented in this table exclude the hypothesis of convergence conditioned by the variables considered for human capital. The evidence of convergence conditioned by the school enrolment in tertiary (% gross) growth rate appears in Table 3.7, when the model allows for more lags in the regression, showing that the effects of human capital education on the economy are delayed in time.
3.4 Discussion and Conclusions This study intends to investigate the hypothesis of conditional convergence worldwide, particularly analysing the impact of variables related to human capital on the economic growth dynamics between world countries. For that, data from the World Bank (for the period 2013–2020) were considered for the GDP per capita and the following variables as proxies for the human capital: school enrolment, secondary (% gross); school enrolment, tertiary (% gross). This statistical information was analysed with panel data methodologies and taking into account the concepts of sigma and beta convergence. A usual discussion in the scientific literature is about if the regions and countries converge for the same steady state, following patterns of absolute convergence, or if the convergence tendencies are conditioned by specific characteristics of the economies. Another not-unanimous discussion is about the methodologies taken into account to assess the processes of economic growth. Particularly, the Endogenous Growth Theory brought new developments to support the understanding of the convergence trends found between different economies. The sigma convergence highlights trends of convergence, for the GDP per capita, over the period considered, specifically between 2013 and 2015. Signs of convergence
Constant
Logarithm of GDPpc lagged
2.345** 0.769
− 0.249** 0.083
3.050
− 3.020
Independent Coefficient Standard Z variable error
Note *Statistically significant at 1%; **Statistically significant at 5%
Regression with Driscoll–Kraay standard errors, fixed effects
Approach
0.023
0.023
28.661
141.080* 163.486*
80,149.280**
54.906*
P > |z| Beta Hausman Pesaran’s test of Modified Wald Wooldridge convergence test cross-sectional test for groupwise test for (%) independence heteroskedasticity autocorrelation
Table 3.5 Results for the beta convergence of the world GDP per capita, considering panel data over the period 2013–2020
3.4 Discussion and Conclusions 47
2.464** 1.016
0.006
Constant
0.027
0.017
− 0.251** 0.105
TER growth − 0.010
SEC growth
Logarithm of GDPpc lagged
2.420
− 1.730
0.620
− 2.400
Independent Coefficient Standard Z variable error
0.052
0.134
0.556
0.053
28.893
80.800*
430,000.000*
33.023*
P > |z| Beta Hausman Pesaran’s test of Modified Wald Wooldridge convergence test cross-sectional test for groupwise test for (%) independence heteroskedasticity autocorrelation
Note *Statistically significant at 1%; **Statistically significant at 10%; SEC growth, School enrolment, secondary (% gross) growth rate; TER growth, School enrolment, tertiary (% gross) growth rate
Regression with Driscoll–Kraay standard errors, fixed effects
Approach
Table 3.6 Results for the beta convergence of the world GDP per capita, considering panel data over the period 2013–2020 and the model extended with variables as proxies to the human capital
48 3 World Trends: Differences and Similitudes Between Absolute …
Constant
2.464**
0.721
3.420
0.750 − 2.370
− 3.390
0.023
0.017
SEC growth
0.074
Standard Z error
TER growth − 0.010*** 0.004
− 0.251**
Logarithm of GDPpc lagged
Independent Coefficient variable
0.014
0.055
0.484
80.800*
430,000.000*
33.023*
Beta Hausman Pesaran’s test of Modified Wald Wooldridge convergence test cross-sectional test for groupwise test for (%) independence heteroskedasticity autocorrelation
0.015 28.893
P> |z|
Note *Statistically significant at 1%; **Statistically significant at 5%; ***Statistically significant at 10%; SEC growth, School enrolment, secondary (% gross) growth rate; TER growth, School enrolment, tertiary (% gross) growth rate
Regression with Driscoll–Kraay standard errors, fixed effects
Approach
Table 3.7 Results for the beta convergence of the world GDP per capita, considering panel data over the period 2013–2020, the model extended with variables as proxies to the human capital and allowing more lags in the regression
3.4 Discussion and Conclusions 49
50
3 World Trends: Differences and Similitudes Between Absolute …
were also found for the world school enrolment, secondary (% gross), and the world school enrolment, tertiary (% gross). For example, among the countries with the highest averages for school enrolment in tertiary (% gross) are the following: Greece, Australia, Turkiye, Grenada, Korea (Rep.), Puerto Rico, Finland, Belarus, Spain, USA, Singapore, Argentina and Chile. The results obtained from the regressions carried out reveal that the world GDP per capita follows a pattern of absolute convergence, for the period 2013–2020, the sample used and the approaches taken into account. The variables considered as proxies for the human capital have a residual impact and the respective coefficient of regression has statistical significance only when more lags were considered for the regressions (showing some time delay in the implications). In terms of practical implications, the economic processes of convergence worldwide are, namely, present evidence of absolute convergence over the period 2013– 2020, for the sample considered and the methodologies used. It is suggested more studies with other variables to test the conditional convergence in the sample considered and to test other approaches. For future research, it could be important to compare these results with those obtained with the models associated with the divergence theory. Acknowledgements This work is funded by National Funds through the FCT—Foundation for Science and Technology, I.P., within the scope of the project Refa UIDB/00681/2020. Furthermore we would like to thank the CERNAS Research Centre and the Polytechnic Institute of Viseu for their support.
References 1. R. Cermeno, Negative growth and convergence of the Mexican states—a panel data analysis. Trimestre Economico 68, 603 (2001) 2. D. Curran, British regional growth and sectoral trends: global and local spatial econometric approaches. Appl. Econ. 44, 2187 (2012) 3. M. Jankiewicz, The convergence of energy use from renewable sources in the European countries: spatio-temporal approach. Energies 14 (2021) 4. G. Li, C. Fang, Spatial econometric analysis of urban and county-level economic growth convergence in China. Int. Reg. Sci. Rev. 41, 410 (2018) 5. S. Miller, M. Upadhyay, Total factor productivity and the convergence hypothesis. J. Macroecon. 24, 267 (2002) 6. S. Nagy, D. Siljak, Economic convergence of the Western Balkans towards the EU-15. Revista Finanzas y Politica Economica 11, 41 (2019) 7. M. Oliver, G. Upton, Are energy endowed countries responsible for conditional convergence? Energy J. 43, 205 (2022) 8. D. Siljak, Beta convergence among former socialist countries. South East Euro. J. Econ. Bus. 13, 72 (2018) 9. D. Siljak, S. Nagy, Convergence and transition of the eastern partnership countries towards the European Union. Entrepreneurial Bus. Econ. Rev. 7, 221 (2019) 10. A. Sofi, S. Durai, Income convergence in India: evidence from nonparametric panel data. J. Econ. Stud. 44, 400 (2017)
References
51
11. O. Stoica, A. Roman, D. Diaconasu, Real convergence and European integration with focus on the new member states. Sci. Ann. Econ. Bus. 66, 215 (2019) 12. V. Yorucu, O. Mehmet, Absolute and conditional convergence in both zones of Cyprus: statistical convergence and institutional divergence. World Econ. 37, 1315 (2014) 13. R. Chumacero, On the power of absolute convergence tests. Stud. Nonlin. Dyn. Econometr. 10 (2006) 14. R.M. Solow, A contribution to the theory of economic growth. Q. J. Econ. 70, 65 (1956) 15. R.E. Lucas, On the mechanics of economic development. J. Monet. Econ. 22, 3 (1988) 16. R.J. Barro, Economic growth in a cross section of countries. Q. J. Econ. 106, 407 (1991) 17. P.M. Romer, Increasing returns and long-run growth. J. Polit. Econ. 94, 1002 (1986) 18. P.M. Romer, Endogenous technological change. J. Polit. Econ. 98, S71 (1990) 19. R.J. Barro, X. Sala-I-Martin, Convergence across states and regions. Brook. Pap. Econ. Act. 1991, 107 (1991) 20. X.X. Sala-i-Martin, Regional cohesion: evidence and theories of regional growth and convergence. Eur. Econ. Rev. 40, 1325 (1996) 21. N. Islam, Growth empirics: a panel data approach. Q. J. Econ. 110, 1127 (1995) 22. D. Hoechle, Robust standard errors for panel regressions with cross-sectional dependence. Stand. Genomic Sci. 7, 281 (2007) 23. O. Torres-Reyna, Panel Data Analysis Fixed and Random Effects Using Stata (v. 6.0) (2007) 24. StataCorp, Stata 15 Base Reference Manual (2017) 25. StataCorp, Stata Statistical Software: Release 15 (2017) 26. Stata, Statistical Software for Data Science|Stata. https://www.stata.com/ 27. World Bank, World Bank Open Data. https://data.worldbank.org 28. Web of Science, Web of Science Core Collection. https://www.webofscience.com/wos/woscc/ basic-search
Chapter 4
Constant, Decreasing or Increasing Returns to Scale: Evidence from the Verdoorn and Kaldor Laws
Abstract The discussions in the scientific literature about economic growth trends are vast and not unanimous. The economic theory has different opinions about economic growth that disagree, sometimes, if the economies tend to converge or diverge over time. In fact, the Neoclassical Theory argues that the economies tend to converge for the same steady state and the Keynesian Theory defends that the processes of economic growth promote divergence between countries/regions through increasing returns to scale. In the processes of divergence, the richer economies improve their performance and the poorer countries become worse. Taking into account these contexts, this research intends to test the existence of increasing returns to scale, using data for output and employment growth. For these analyses, the approaches related to the Verdoorn and Kaldor laws were considered. The results obtained highlight the existence of increasing returns to scale in some frameworks and reveal the importance of national and international policies implementation to promote a more balanced and sustainable development. Keywords Circular and cumulative processes · Economic growth · Keynesian theory · External demand
4.1 Introduction The presence of decreasing, constant and increasing returns to scale has generated not unanimous debate in the economic literature. Particularly the Keynesian Theory argues that the economic growth trend follows processes with learning by doing and spillover effects in the presence of increasing returns to scale and promote self-reinforced circular and cumulative phenomena, where richer economies become richer and the poorer ones become worse. These contexts were explained, for example, by Kaldor [1, 2] through their laws, where the manufacturing sector is the engine of the economy and the productivity growth is endogenous and dependent on the output growth (Verdoorn law [3]). These laws were reconsidered by, for example, McCombie [4], Parikh [5] and Stoneman [6]. The importance of the manufacturing © The Author(s), under exclusive license to Springer Nature Switzerland AG 2023 V. J. P. D. Martinho, Economic Growth: Advances in Analysis Methodologies and Technologies, SpringerBriefs in Applied Sciences and Technology, https://doi.org/10.1007/978-3-031-38363-2_4
53
54
4 Constant, Decreasing or Increasing Returns to Scale: Evidence …
sector for the economy is also associated with its capacity to produce tradable goods, appearing here the manufacturing exports as a determinant variable [7]. In addition, some extended models have been considered [8]. The Verdoorn–Kaldor laws have been taken into account for studies related to the following issues worldwide: European regions [9]; Turkish contexts [10]; open economy Stock-Flow Consistent models [11]; Chinese framework [12]; Peruvian manufacturing sector [13]; Portuguese agroforestry activities [14]; and Australian economy [15]. The systematic review of Barreto et al. [16] highlighted some gaps in the literature about the Kaldor developments in the Pacific Alliance and the Association of Southeast Asia Nations, namely those related to the lack of research that comparatively assess the determinants of Kaldor and the scarcity of studies about convergence, or divergence, among nations and trade unions. This literature survey shows that the Kaldor laws were the target of criticism and diverse studies reconsidered these laws, proposing, in some cases, alternative models and approaches trying to make compatible the different points of view. In any case, the developments of Kaldor have been taken into account by diverse studies as methodologies to assess the presence of increasing returns to scale. Kaldor proposed that in the Verdoorn law productivity growth should be replaced by employment growth to avoid spurious relationships. In this alternative approach, the presence of increasing returns to scale is confirmed with statistically significant and positive coefficients close to zero. In this way, this chapter proposes to estimate the relationship between the employment growth (using as proxies the following variables: total labour force; employment in industry (% of total employment); and employment to population ratio, 15+, total (%) and the output growth (gross domestic product (GDP) per capita) with panel data [17–21]. For the literature assessment, the Web of Science information was taken into account [22]. The statistical information was obtained from the World Bank [23] (some countries were excluded because of the lack of data).
4.2 Data Analysis Over the period 2014–2020, the world GDP per capita averages increased until 2019 and decreased drastically in 2020 because of the COVID-19 pandemic (Fig. 4.1). A similar pattern was found for the world labour force (total) averages (Fig. 4.2) and for the world employment to population ratio [15+, total (%)] averages (Fig. 4.4). A different trend was found for the world employment in industry (% of total employment) averages (Fig. 4.3). Qatar, Oman, Czechia, Slovak Republic, Bahrain, Lesotho, Tunisia, Slovenia, Iran (Islamic Rep.), Turkmenistan, United Arab Emirates, Belarus, Poland and Hungary are countries between those with the highest averages for employment in industry (% of total employment) (Table 4.1). The intermediate averages appear in countries such as Indonesia, Honduras, Lebanon, Brazil, Argentina, Belgium, Benin, Iraq,
4.2 Data Analysis
55
22000
21500
21000
20500
20000
19500
19000
2014
2015
2016
2017
2018
2019
2020
Fig. 4.1 World GDP per capita averages, over the period 2014–2020
19600000 19400000 19200000
19000000 18800000 18600000 18400000 18200000 18000000 17800000
2014
2015
2016
2017
2018
2019
2020
Fig. 4.2 World labour force (total) averages, over the period 2014–2020
Bangladesh, Cabo Verde, Switzerland, New Zealand, Kazakhstan, France and South Africa (Table 4.2). The lowest averages for employment in industry (% of total employment) occur, for example, in the following nations (Table 4.3): Armenia; Belize; Netherlands; Moldova; Singapore; St. Lucia; Jamaica; Samoa; Botswana; Nepal; Greece; Cameroon; Sudan; Azerbaijan; Kenya; and Fiji.
56
4 Constant, Decreasing or Increasing Returns to Scale: Evidence …
20 20 20 20 20
20 19 19
2014
2015
2016
2017
2018
2019
2020
Fig. 4.3 World employment in industry (% of total employment) averages, over the period 2014– 2020
57 57 56 56 55 55 54
54
2014
2015
2016
2017
2018
2019
2020
Fig. 4.4 World employment to population ratio [15+, total (%)] averages, over the period 2014– 2020
4.2 Data Analysis
57
Table 4.1 Averages, across the period 2014–2020, for the world GDP per capita (PPP, constant 2017 international $), the labour force (total), employment in industry (% of total employment) and employment to population ratio [15+, total (%)] [countries with the highest values for the employment in industry (% of total employment)] Country name
GDP per capita, PPP Labour force, (constant 2017 total international $)
Employment in industry (% of total employment)
Employment to population ratio, 15+, total (%)
Qatar
95,627.880
1,956,237.000
54.022
87.265
Oman
34,399.010
2,346,927.000
42.859
67.250
Czechia
37,995.140
5,367,420.000
37.741
57.825
Slovak Republic
29,921.790
2,739,405.000
36.335
54.410
Bahrain
48,791.710
815,379.900
35.155
70.577
Lesotho
2546.647
918,518.100
34.211
53.732
Tunisia
10,762.210
4,154,056.000
33.371
39.535
Slovenia
36,054.590
1,019,096.000
32.980
53.875
Iran, Islamic Rep.
14,546.700
27,183,863.000
32.830
37.559
Turkmenistan
13,438.870
1,937,513.000
32.189
44.975
United Arab Emirates
69,405.530
6,310,136.000
32.087
79.478
Belarus
18,742.970
5,007,011.000
31.508
60.276
Poland
30,008.140
18,355,950.000
31.404
53.883
Hungary
29,533.030
4,661,290.000
31.315
52.861
Algeria
11,601.230
11,921,481.000
31.142
36.860
Bosnia and Herzegovina
13,334.940
1,357,076.000
31.067
36.432
North Macedonia
15,670.610
953,386.300
30.746
42.808
6117.560
1,156,871.000
30.024
32.679
Bulgaria
21,336.240
3,337,607.000
30.022
51.093
Estonia
33,482.900
692,787.400
29.713
58.768
Romania
26,645.820
9,023,435.000
29.603
51.814
China
14,216.420
775,000,000.000
28.392
64.921
Malaysia
25,516.530
15,688,240.000
27.574
62.714
Germany
52,300.280
43,482,178.000
27.500
58.527
Croatia
26,679.550
1,828,699.000
27.201
45.674
Sri Lanka
13,060.970
8,541,381.000
27.151
50.496
West Bank and Gaza
(continued)
58
4 Constant, Decreasing or Increasing Returns to Scale: Evidence …
Table 4.1 (continued) Country name
GDP per capita, PPP Labour force, (constant 2017 total international $)
Employment in industry (% of total employment)
Employment to population ratio, 15+, total (%)
Trinidad and Tobago
26,901.150
696,797.100
27.015
56.817
Russian Federation
26,208.170
74,500,975.000
26.994
59.185
Turkiye
26,936.600
31,971,493.000
26.660
45.827
Egypt, Arab Rep.
10,541.820
30,282,457.000
26.504
39.901
Italy
40,916.500
25,796,876.000
26.281
43.934
Tonga Suriname Vietnam
6068.929
36,456.140
26.260
52.901
18,004.360
235,997.600
26.176
51.189
9095.433
54,831,232.000
25.902
74.646
Serbia
16,802.980
3,222,882.000
25.875
46.082
Mexico
19,602.700
53,916,412.000
25.582
57.617
Austria
53,762.520
4,581,889.000
25.406
57.773
Lithuania
33,727.040
1,473,155.000
25.271
55.936
Kuwait
50,436.510
2,358,619.000
25.045
70.726
Korea, Rep.
40,669.930
28,212,462.000
25.013
60.918
Cambodia
3948.049
8,101,282.000
24.905
73.267
Mauritius
21,542.960
607,207.700
24.870
54.759
India
5934.782
483,000,000.000
24.703
45.369
Japan
40,812.340
67,473,751.000
24.654
58.912
Saudi Arabia
45,781.080
14,331,142.000
24.633
53.759
Portugal
32,493.340
5,217,548.000
24.535
53.153
Ukraine
12,078.350
21,287,194.000
24.481
51.020
Eswatini
8217.111
372,089.100
24.377
39.101
Pakistan
4838.578
69,152,900.000
24.108
49.299
18,221.780
218,777.100
24.047
56.445
6822.323
13,040,428.000
23.792
53.524
Latvia
28,556.190
999,722.900
23.705
55.433
Guyana
12,930.380
289,088.100
23.597
45.816
Kyrgyz Republic
4943.431
2,508,554.000
23.441
58.383
Thailand
16,764.460
40,077,312.000
23.177
67.573
Maldives Uzbekistan
(continued)
4.2 Data Analysis
59
Table 4.1 (continued) Country name
GDP per capita, PPP Labour force, (constant 2017 total international $)
Employment in industry (% of total employment)
Employment to population ratio, 15+, total (%)
Chile
24,387.790
8,791,460.000
22.839
54.787
Congo, Rep.
4233.233
2,094,090.000
22.510
53.712
Morocco
7791.333
11,805,201.000
22.194
41.575
8505.250
2,663,315.000
22.017
56.090
46,843.160
2,722,990.000
21.977
54.177
El Salvador Finland
Table 4.2 Averages, across the period 2014–2020, for the world GDP per capita (PPP, constant 2017 international $), the labour force (total), employment in industry (% of total employment) and employment to population ratio [15+, total (%)] [countries with the intermediate values for the employment in industry (% of total employment)] Country name
GDP per capita, PPP (constant 2017 international $)
Labour force, total
Employment in Employment to industry (% of total population ratio, employment) 15+, total (%)
Indonesia
10,873.290
130,000,000.000
21.897
64.305
Honduras
5313.987
4,130,448.000
21.452
59.639
Lebanon
16,779.390
2,116,086.000
21.437
42.367
Brazil
14,702.040
103,000,000.000
21.256
56.118
Argentina
22,682.120
19,625,894.000
21.049
53.727
Belgium
50,078.120
5,079,672.000
21.022
49.998
Benin
2987.148
4,266,069.000
20.881
63.447
Iraq
9737.329
10,127,626.000
20.689
36.828
Bangladesh
4865.680
66,168,886.000
20.680
54.886
Cabo Verde
6220.334
233,556.700
20.667
50.554
Switzerland
69,140.920
4,893,004.000
20.604
64.989
New Zealand 41,832.400
2,702,366.000
20.525
66.635
Kazakhstan
24,996.810
9,105,877.000
20.493
66.687
France
44,007.330
30,526,419.000
20.298
50.363
South Africa 13,761.950
23,306,143.000
20.237
43.643
Mongolia
11,558.620
1,295,922.000
20.151
56.719
St. Vincent and the Grenadines
13,409.550
52,573.430
20.110
52.245
8051.635
5,375,556.000
20.052
66.797
38,332.510
22,987,144.000
20.044
47.176
Bolivia Spain
(continued)
60
4 Constant, Decreasing or Increasing Returns to Scale: Evidence …
Table 4.2 (continued) Country name Jordan
GDP per capita, PPP (constant 2017 international $)
Labour force, total
Employment in Employment to industry (% of total population ratio, employment) 15+, total (%)
9731.331
2,573,506.000
19.832
32.526
Colombia
14,182.470
25,260,152.000
19.803
61.282
Australia
48,356.740
13,013,555.000
19.761
61.436
Norway
63,543.820
2,781,467.000
19.684
61.560
Uruguay
22,733.350
1,734,930.000
19.642
58.807
Canada
47,865.680
20,127,037.000
19.600
60.996
USA
59,803.620
164,000,000.000
19.539
58.937
Guatemala
8303.476
6,258,970.000
19.532
58.415
Sao Tome and Principe
3899.538
65,760.710
19.504
46.579
Malta
41,680.550
238,083.900
19.472
55.505
Senegal
3211.931
4,205,124.000
19.417
46.023
Albania
12,678.900
1,355,232.000
19.407
49.025
Togo
1969.377
2,684,919.000
19.300
56.124
Comoros
3223.957
204,328.400
19.300
40.571
Afghanistan
2079.949
9,113,680.000
19.280
41.695
Paraguay
13,280.850
3,120,653.000
19.172
66.069
Denmark
54,713.430
2,959,586.000
19.018
58.139
Dominican Republic
16,342.220
4,738,589.000
18.917
58.146
Panama
29,152.860
1,904,438.000
18.668
60.065
Brunei Darussalam
61,161.920
210,387.600
18.558
58.975
3254.030
2,362,844.000
18.512
38.694
Tajikistan Ireland
77,213.720
2,357,904.000
18.458
57.207
UK
45,338.160
34,108,358.000
18.395
59.963
Ecuador
11,514.980
7,874,375.000
18.345
62.600
Barbados
15,621.510
144,810.300
18.328
57.481
Sweden
51,428.780
5,314,277.000
18.309
59.561
Libya
20,948.570
2,093,503.000
18.090
38.096
Montenegro
19,271.140
277,406.700
18.046
45.468
Costa Rica
19,757.760
2,403,290.000
18.044
55.596
Ghana
4938.831
12,865,424.000
17.926
66.098
Nicaragua
5537.941
2,888,327.000
17.911
61.931
Mauritania
5242.803
978,814.700
17.882
37.115 (continued)
4.2 Data Analysis
61
Table 4.2 (continued) Country name Philippines
GDP per capita, PPP (constant 2017 international $)
Labour force, total
Employment in Employment to industry (% of total population ratio, employment) 15+, total (%)
7805.927
43,263,531.000
17.763
58.014
Iceland
54,116.010
211,787.600
17.632
73.406
Israel
38,848.120
3,981,697.000
17.362
60.727
Cyprus
37,740.910
632,863.900
17.350
55.466
Somalia
1064.974
2,657,734.000
16.939
27.631
Myanmar
4308.901
24,196,284.000
16.820
62.006
Namibia
10,236.380
898,361.400
16.761
47.244
Peru
12,165.930
17,311,215.000
16.667
72.561
Table 4.3 Averages, across the period 2014–2020, for the world GDP per capita (PPP, constant 2017 international $), the labour force (total), employment in industry (% of total employment) and employment to population ratio [15+, total (%)] [countries with the lowest values for the employment in industry (% of total employment)] Country name
Armenia
GDP per capita, PPP Labour force, (constant 2017 total international $)
Employment in industry (% of total employment)
Employment to population ratio, 15+, total (%)
12,515.470
1,411,089.000
16.594
54.183
8896.615
167,101.700
16.446
59.019
Netherlands
54,459.650
9,246,983.000
16.273
61.029
Moldova
11,550.900
965,509.900
16.254
41.456
Singapore
93,479.960
3,463,092.000
15.863
67.852
St. Lucia
Belize
14,533.880
98,674.000
15.651
56.046
Jamaica
9862.851
1,424,277.000
15.629
60.628
Samoa
6065.488
69,406.430
15.499
49.105
14,429.150
996,255.300
15.354
50.256
3507.960
7,660,761.000
15.319
35.531
28,457.350
4,748,039.000
15.166
40.504
Botswana Nepal Greece Cameroon
3665.425
9,987,295.000
14.595
69.265
Sudan
4457.092
11,533,622.000
14.587
39.909
14,350.370
4,830,308.000
14.529
61.535
Azerbaijan Kenya
4334.459
21,545,497.000
14.382
71.231
Fiji
12,262.170
371,223.000
14.341
55.100
Equatorial Guinea
20,427.330
492,210.400
14.248
50.894
Gabon
14,510.630
651,952.600
14.215
38.161 (continued)
62
4 Constant, Decreasing or Increasing Returns to Scale: Evidence …
Table 4.3 (continued) Country name
GDP per capita, PPP Labour force, (constant 2017 total international $)
Employment in industry (% of total employment)
Employment to population ratio, 15+, total (%)
Hong Kong SAR, China
58,292.270
3,955,264.000
13.854
58.661
Puerto Rico
34,098.220
1,137,679.000
13.084
35.962
Rwanda
1961.772
4,217,316.000
12.923
50.940
Georgia
13,517.460
1,963,011.000
12.753
56.400
115,972.800
385,644.100
12.338
68.348
Nigeria
5173.477
62,427,848.000
12.175
54.746
Haiti
3120.975
4,752,428.000
11.981
56.614
Timor-Leste
3502.362
518,072.400
11.668
63.960
33,260.480
226,996.700
11.661
64.573
Cote d’Ivoire
4710.963
9,162,952.000
11.620
62.866
Luxembourg
114,032.000
298,535.300
11.321
56.323
Zambia
3357.575
5,662,793.000
10.593
54.955
Solomon Islands
2577.935
323,433.300
10.044
83.287
Guinea-Bissau
1809.683
609,679.100
10.031
54.178
10,625.550
352,437.700
9.987
60.808
Macao SAR, China
Bahamas, The
Bhutan Lao PDR
7122.395
2,826,999.000
9.780
57.970
Madagascar
1523.572
13,320,977.000
9.620
84.153
Congo, Dem. Rep.
1032.674
29,819,359.000
9.477
62.908
Zimbabwe
2263.225
5,616,112.000
9.410
61.633
Ethiopia
1962.096
51,063,976.000
9.331
78.265
Papua New Guinea
3846.963
2,773,866.000
8.981
46.300
Sierra Leone
1639.803
2,486,455.000
8.956
52.806
Uganda
2159.953
14,855,970.000
8.418
67.696
Liberia
1516.427
2,128,708.000
8.415
74.493
Chad
1656.131
4,750,541.000
8.384
59.907
Mozambique
1268.406
12,513,764.000
8.198
76.133
Mali
2122.422
6,957,598.000
8.070
67.972
Angola
7195.468
12,693,828.000
7.692
69.703
Malawi
1465.600
6,729,274.000
7.678
65.050
Vanuatu
2954.590
121,184.900
7.474
67.978 (continued)
4.4 Discussion and Conclusions
63
Table 4.3 (continued) Country name
GDP per capita, PPP Labour force, (constant 2017 total international $)
Employment in industry (% of total employment)
Employment to population ratio, 15+, total (%)
Niger
1166.949
8,148,303.000
7.248
73.016
Gambia, The
1963.666
793,322.600
6.798
56.986
Tanzania
2433.187
26,025,626.000
6.622
81.526
826.067
1,825,545.000
6.455
66.484
Burkina Faso
1979.918
7,118,726.000
6.415
62.410
Guinea
2329.042
3,798,061.000
6.397
51.554
Djibouti
4397.465
224,267.400
5.634
23.580
Burundi
758.494
4,726,887.000
3.476
78.329
Central African Republic
4.3 Results for the Kaldor Model Taking into account the world labour force (total) growth rates as the dependent variable, Table 4.4 shows that there is evidence of strong increasing returns to scale (the coefficient of the independent variable is statistically significant and close to zero). These signs disappear when the employment in industry (% of total employment) growth rates is considered as the dependent variable (Table 4.5). Considering the importance of the manufacturing sector for the Kaldor model, these findings need deeper assessment in future research. The signs of increasing returns to scale reappeared when the employment to population ratio [15+, total (%)] growth rates were taken into account as the dependent variable (Table 4.6).
4.4 Discussion and Conclusions This chapter aims to test for the existence of increasing returns in the economic growth processes worldwide and to find signs that support the perspectives of divergence trends between the world countries defended, for example, by the literature associated with the Keynesian Theory. For that, the developments related to the Verdoorn and Kaldor laws were taken into account for regression with panel data. The statistical information was obtained from the World Bank for the period 2014–2020. As proxies for employment, the following variables were considered: total labour force; employment in industry (% of total employment); and employment to population ratio, 15+, total (%). Some of the disagreements at the basis of the discussions about if economic growth follows trends of convergence or divergence are related to the perspectives about scale economies. In fact, the authors associated with the Keynesian Theory
0.012*
Constant
Note *Statistically significant at 1%
0.089*
GDPpc growth rate
Prais–Winsten regression, correlated panels corrected standard errors (PCSEs), without autocorrelation
Coefficient
Independent variable
Approach
0.001
0.027
Standard error
8.500
3.340
Z
0.000
0.001
P > |z|
37.330*
Hausman test 25.986*
Pesaran’s test of cross-sectional independence
27,000,000.000*
Modified Wald test for groupwise heteroskedasticity
0.795
Wooldridge test for autocorrelation
Table 4.4 Results for the Kaldor model, with panel data over the period 2014–2020, considering the labour force (total) growth rates as the dependent variable
64 4 Constant, Decreasing or Increasing Returns to Scale: Evidence …
GDPpc growth rate
Regression with robust fixed effects 0.000
0.070
− 0.028
0.006*
Standard error
Coefficient
Note *Statistically significant at 1%
Constant
Independent variable
Approach
14.180
− 0.400
Z
0.000
0.693
P > |z|
22.500*
Hausman test 1.370
Pesaran’s test of cross-sectional independence
5,600,000.000*
Modified Wald test for groupwise heteroskedasticity
0.000
Wooldridge test for autocorrelation
Table 4.5 Results for the Kaldor model, with panel data over the period 2014–2020, considering the employment in industry (% of total employment) growth rates as the dependent variable
4.4 Discussion and Conclusions 65
GDPpc growth rate
Prais–Winsten regression, correlated panels corrected standard errors (PCSEs), without autocorrelation
0.030 0.002
− 0.004**
Standard error
0.193*
Coefficient
6.450 − 2.540
Z
Note *Statistically significant at 1%; **Statistically significant at 5%
Constant
Independent variable
Approach
0.011
0.000
P > |z|
30.080*
Hausman test 49.789*
Pesaran’s test of cross-sectional independence
36,000,000.000*
0.291
Modified Wald test Wooldridge test for groupwise for heteroskedasticity autocorrelation
Table 4.6 Results for the Kaldor model, with panel data over the period 2014–2020, considering the employment to population ratio [15+, total (%)] growth rates as the dependent variable
66 4 Constant, Decreasing or Increasing Returns to Scale: Evidence …
References
67
argue that economic growth worldwide follows patterns in the presence of increasing returns to scale, where the richer economies become richer and poorer ones become poorer. In these processes of divergence, the manufacturing sector plays a crucial role, considering its capacity to produce tradable goods, highlighting in this way the importance of international trade for the economic dynamics and the differences among countries. The COVID-19 pandemic had a relevant impact on the GDP per capita worldwide, as well as on the labour force and world employment. In any case, world employment in the industry seems to follow a different pattern that may be better explored in future research. Among the countries with the highest averages for employment in industry (% of total employment) are, for example, the following: Qatar, Oman, Czechia, Slovak Republic, Bahrain, Lesotho, Tunisia, Slovenia, Iran (Islamic Rep.), Turkmenistan, United Arab Emirates, Belarus, Poland and Hungary. The results obtained for the Kaldor model (relation between the employment growth and the output growth, where the employment is endogenous) present that there are strong signs of increasing returns to scale and this may compromise the processes of convergence in the medium and long terms. On the other hand, there are no signs of increasing returns to scale, when employment in the industry is considered. In terms of practical implications, there is evidence of increasing returns to scale in some circumstances and this may compromise the trends of convergence. In any case, more studies ate suggested to bring more contributions about these tendencies. More policies and programmes are needed to better support the countries with more economic weaknesses. For future research, it is suggested to analyse the contributions of other approaches and theories for these frameworks. Acknowledgements This work is funded by National Funds through the FCT—Foundation for Science and Technology, I.P., within the scope of the project Refa UIDB/00681/2020. Furthermore we would like to thank the CERNAS Research Centre and the Polytechnic Institute of Viseu for their support.
References 1. N. Kaldor, Causes of the Slow Rate of Economic Growth of the United Kingdom: An Inaugural Lecture (Cambridge University Press, London, 1966) 2. N. Kaldor, Strategic Factors in Economic Development (NewYork State School of Industrial and Labor Relations, Cornell University, Ithaca, NY, 1967) 3. P.J. Verdoorn, Fattori the Regolano Lo Sviluppo Della Produttività Del Lavoro. L’Industria 1, 3 (1949) 4. J. Mccombie, Economic-growth, Kaldor laws and the static dynamic Verdoorn law paradox. Appl. Econ. 14, 279 (1982) 5. A. Parikh, Differences in growth-rates and Kaldors laws. Economica 45, 83 (1978) 6. P. Stoneman, Kaldors law and British economic-growth—1800–1970. Appl. Econ. 11, 309 (1979)
68
4 Constant, Decreasing or Increasing Returns to Scale: Evidence …
7. N. Marconi, C. Reis, E. de Araujo, Manufacturing and economic development: the actuality of Kaldor’s first and second laws. Struct. Change Econ. Dyn. 37, 75 (2016) 8. P. Tridico, R. Pariboni, Inequality, financialization, and economic decline. J. Post Keynesian Econ. 41, 236 (2018) 9. A. Angeriz, J. Mccombie, M. Roberts, New estimates of returns to scale and spatial spillovers for EU regional manufacturing, 1986–2002. Int. Reg. Sci. Rev. 31, 62 (2008) 10. E. Bairam, Economic-growth and Kaldor law—the case of Turkey, 1925–78. Appl. Econ. 23, 1277 (1991) 11. E. Carnevali, Price mechanism and endogenous productivity in an open economy stock-flow consistent model. Metroeconomica 72, 22 (2021) 12. J. Hansen, J. Zhang, A Kaldorian approach to regional economic growth in China. Appl. Econ. 28, 679 (1996) 13. F. Jimenez, Growth and premature deindustrialization in Peru 1950–2015: a Kaldorian analysis. Revista Economia 40, 155 (2017) 14. V. Martinho, Socioeconomic impacts of forest fires upon Portugal: an analysis for the agricultural and forestry sectors. Sustainability 11 (2019) 15. P. Plummer, M. Taylor, Enterprise and competitive advantage in the Australian context: a spatial econometric perspective. Spat. Econ. Anal. 6, 311 (2011) 16. D. Barreto, C. Arenas, J. Sanchez, C. Varon, J. Duque, P. Rubio, Determinants of Economic Growth in Founder Countries of the a Pacific and Athelliance ASA and the Association of Southeast Asia Nations: Approach from a Systematic Literature Review (Equidad & Desarrollo, 2022) 17. D. Hoechle, Robust standard errors for panel regressions with cross-sectional dependence. Stand. Genomic Sci. 7, 281 (2007) 18. O. Torres-Reyna, Panel Data Analysis Fixed and Random Effects Using Stata (v. 6.0) (2007) 19. StataCorp, Stata 15 Base Reference Manual (2017) 20. StataCorp, Stata Statistical Software: Release 15 (2017) 21. Stata, Statistical Software for Data Science|Stata. https://www.stata.com/ 22. Web of Science, Web of Science Core Collection. https://www.webofscience.com/wos/woscc/ basic-search 23. World Bank, World Bank Open Data. https://data.worldbank.org
Chapter 5
Circular and Cumulative Processes in Economic Growth: The Importance of the External Demand
Abstract The Keynesian Theory and the New Economic Geography defend that the economic growth processes follow trends of divergence, through self-reinforced circular and cumulative phenomena, promoted by increasing returns to scale. The Keynesian Theory explains these processes highlighting the importance of the external demand and based on the Verdoorn law, where the productivity growth is endogenous and dependent on the output growth. The New Economic Geography developments are based on the real wage differences between economies and on transport costs. Following these contexts and the current conjuncture worldwide, this chapter proposes to test the impacts of external demand and real wages (as engines of circular and cumulative phenomena) on output growth. For that, statistical information associated with output growth, exports growth and wages was considered. To analyse these data, the Thirlwall law and the developments of the New Economic Geography were taken into account. The findings identified to reveal the importance of exports and employment compensation for the economic growth patterns worldwide and the relevance of dealing with these differences to promote more sustainable development. Keywords Keynesian theory · New economic geography · Output growth · Real wages
5.1 Introduction Tradable goods and international trade appear as important variables in the Keynesian models [1], namely with the contributions of Thirlwall [2] for the Keynesian Theory through developments that later became known as the Thirlwall law. The idea is that the output growth is dependent on the export growth [3]. Thirlwall followed, for example, the research of Verdoorn [4] and Kaldor [5, 6]. These developments of Thirlwall were considered and discussed by several studies [7, 8] and generated debate [9, 10]. In any case of highlighting the following frameworks where these approaches were taken into account: Brazilian context [11]; © The Author(s), under exclusive license to Springer Nature Switzerland AG 2023 V. J. P. D. Martinho, Economic Growth: Advances in Analysis Methodologies and Technologies, SpringerBriefs in Applied Sciences and Technology, https://doi.org/10.1007/978-3-031-38363-2_5
69
70
5 Circular and Cumulative Processes in Economic Growth
Spanish economy [12]; Portuguese and Spanish economic dynamics [13]; the economic context in Argentina [14]; government policies and exports in the growth processes [15]; the presence of structural heterogeneity [16]; Indian economy [17]; Kazakhstan context [18]. On the other hand, the New Economic Geography reinforced the idea of increasing returns to scale and the existence of circular and cumulative processes, where real wages and transport costs are some of the most important variables. In summary, the economies with higher real wages attract more population and economic activity and this is promoted by the intention of being closer (population and economic sectors) to save transport and communication costs [19, 20]. This creates self-reinforced processes of agglomeration, where the economic activity and population tend to concentrate in poles. Generally, two poles are generated, one stronger and a second weaker. This explains why the economic sectors and the population are agglomerated in big cities and regions inside the countries and worldwide expressions such as core-peripheral countries are found. The only forces of anti-agglomeration come from sectors dependent on immobile production factors, such as agriculture (dependent on immobile land). Considering these perspectives from the literature [21], this chapter intends to bring more contributions about the interrelationships between the output (gross domestic product (GDP) per capita) growth, the external demand [exports of goods and services (annual % growth)] and the wages [compensation of employees (% of expense)]. The statistical information for these variables was obtained from the World Bank [22] (some nations were removed, because statistical information for some years was missing), and these data were analysed through panel data approaches, following the procedures proposed by Hoechle [23], Torres-Reyna [24] and the Stata software [25–27].
5.2 Data Assessment The COVID-19 pandemic promoted several disruptions worldwide in different domains, including in the world GDP per capita (Fig. 5.1). These impacts are also visible in the world compensation of employees (% of expense) averages (Fig. 5.2) and world exports of goods and services (annual % growth) averages (Fig. 5.3). Nonetheless, there were some signs of a downward trend in these variables in previous years. Some of the nations with the highest averages for the exports of goods and services (annual % growth) are the following (Table 5.1): Ireland; Mongolia; Madagascar; Serbia; Cambodia; North Macedonia; Romania; Cyprus; Kiribati; Philippines ; Armenia; Poland; Lithuania; Moldova; Malta; Australia; Hungary; and Morocco.
5.2 Data Assessment
71
29500 29000 28500 28000 27500 27000 26500 26000 25500 25000
24500
2013
2014
2015
2016
2017
2018
2019
2020
2019
2020
Fig. 5.1 World GDP per capita averages, over the period 2013–2020
25
25
24
24
23
23 2013
2014
2015
2016
2017
2018
Fig. 5.2 World compensation of employees (% of expense) averages, over the period 2013–2020
Some of the countries with the lowest averages are, for example, Austria, Germany, Brazil, Guatemala, Japan, Canada, Dominican Republic, Cote d’Ivoire, Marshall Islands, Ghana, Indonesia, UK, Spain, Malaysia and Norway (Table 5.2).
72
5 Circular and Cumulative Processes in Economic Growth
10
5
0 2013
2014
2015
2016
2017
2018
2019
2020
-5
-10
-15
-20 Fig. 5.3 World exports of goods and services (annual % growth) averages, over the period 2013– 2020
Table 5.1 Averages, across the period 2013–2020, for the world GDP per capita (PPP, constant 2017 international $), compensation of employees (% of expense) and exports of goods and services (annual % growth) [countries with the highest values for the exports of goods and services (annual % growth)] Country name
GDP per capita, PPP (constant Compensation Exports of goods and services 2017 international $) of employees (annual % growth) (% of expense)
Ireland
74,287.033
25.461
12.976
Mongolia
11,426.893
16.975
12.265
1519.510
49.430
8.805
16,627.580
15.421
7.853
Madagascar Serbia Cambodia
3854.235
44.149
7.824
North Macedonia
15,475.400
14.949
7.408
Romania
26,076.893
18.520
7.376
Cyprus
37,206.528
29.417
6.588
Kiribati
1972.898
37.682
6.538
Philippines
7656.543
36.135
6.124
Armenia
12,285.697
20.992
6.000
Poland
29,443.409
13.836
5.779
Lithuania
33,084.788
16.082
5.449
Moldova
11,333.831
11.879
5.321 (continued)
5.2 Data Assessment
73
Table 5.1 (continued) Country name
GDP per capita, PPP (constant Compensation Exports of goods and services 2017 international $) of employees (annual % growth) (% of expense)
Malta
40,887.155
30.634
4.797
Australia
48,155.224
10.576
4.563
Hungary
29,008.597
18.480
4.401
Morocco
7611.470
45.925
4.383
Bosnia and Herzegovina
13,103.361
26.852
4.364
Slovenia
35,577.021
17.762
4.136
Luxembourg 113,909.349
20.196
3.926
Singapore
92,470.053
24.850
3.720
Bulgaria
21,033.103
18.626
3.614
Latvia
28,076.049
17.563
3.302
Costa Rica
19,543.662
43.613
3.219
2098.386
38.789
3.186
Slovak Republic
29,512.860
14.839
3.078
Turkiye
26,558.619
23.550
3.074
Netherlands
54,107.201
7.695
3.071
Georgia
13,295.290
18.588
3.026
Czechia
Mali
37,453.429
12.653
2.963
Congo, Rep.
4342.225
28.733
2.778
Nepal
3442.251
21.320
2.751
Croatia
26,359.574
15.171
2.658
Sweden
51,057.956
9.245
2.545
Portugal
32,187.031
21.143
2.523
Cameroon
3637.522
38.486
2.430
Belgium
49,843.926
6.178
2.423
Russian Federation
26,223.698
14.080
2.389
Nicaragua
5497.515
38.033
2.387
Denmark
54,309.159
11.023
2.350
Israel
38,546.649
23.464
2.248
Paraguay
13,139.618
52.539
2.167
Estonia
32,988.181
16.472
2.166
United Arab Emirates
68,524.188
34.951
2.138 (continued)
74
5 Circular and Cumulative Processes in Economic Growth
Table 5.1 (continued) Country name
GDP per capita, PPP (constant Compensation Exports of goods and services 2017 international $) of employees (annual % growth) (% of expense)
West Bank and Gaza
6117.647
54.554
2.044
Switzerland
68,883.347
6.927
2.035
Greece
28,376.543
20.850
1.954
Korea, Rep.
40,213.834
10.094
1.689
Finland
46,653.841
7.809
1.644
Table 5.2 Averages, across the period 2013–2020, for the world GDP per capita (PPP, constant 2017 international $), compensation of employees (% of expense) and exports of goods and services (annual % growth) [countries with the lowest values for the exports of goods and services (annual % growth)] Country name
GDP per capita, PPP (constant 2017 international $)
Compensation of employees (% of expense)
Exports of goods and services (annual % growth)
Austria
53,666.923
10.564
1.624
Germany
52,007.021
5.756
1.603
Brazil
14,833.217
11.440
1.563
8232.307
35.188
1.553
Japan
40,657.003
5.905
1.513
Canada
47,720.565
10.495
1.416
Dominican Republic
15,993.882
37.401
1.309
Cote d’Ivoire
4608.907
36.481
1.133
Marshall Islands
4693.180
37.686
1.094
Guatemala
Ghana
4897.731
36.305
1.055
Indonesia
10,689.394
15.628
1.032
UK
45,069.898
14.141
1.021
Spain
37,961.386
6.666
1.013
Malaysia
25,120.830
32.470
0.985
Norway
63,335.716
15.379
0.928
Albania
12,514.199
24.055
0.887
Botswana
14,393.567
44.825
0.790
Peru
12,097.770
18.894
0.740
Sri Lanka
12,855.122
27.621
0.702
France
43,858.153
18.170
0.692 (continued)
5.2 Data Assessment
75
Table 5.2 (continued) Country name
El Salvador Italy Bangladesh
GDP per capita, PPP (constant 2017 international $)
Compensation of employees (% of expense)
Exports of goods and services (annual % growth)
8441.548
41.212
0.686
40,835.448
13.323
0.595
4749.059
23.438
0.405
Iceland
53,622.591
23.989
0.352
Chile
24,340.762
21.168
0.255
USA
59,383.032
9.316
0.230
Belarus
18,750.779
12.812
0.228
New Zealand
41,543.481
24.031
0.136
9844.823
38.928
0.028
Kazakhstan
24,837.310
6.362
− 0.013
South Africa
13,793.882
14.054
− 0.249
Saudi Arabia
45,767.731
54.943
− 0.518
Bhutan
10,413.489
36.887
− 0.584
Uruguay
22,621.604
25.478
− 0.805
Namibia
10,222.098
44.882
− 0.909
Thailand
16,599.198
27.556
− 0.912
Jamaica
2547.941
42.784
− 1.093
14,092.794
10.674
− 1.321
Ethiopia
1906.602
11.145
− 1.796
Solomon Islands
2579.669
34.530
− 3.194
Mauritius
21,243.551
34.795
− 3.432
Vanuatu
2947.456
46.346
− 3.601
Ukraine
12,196.135
13.560
− 4.471
Lesotho Colombia
9957.701
48.001
− 4.702
Bahamas, The
33,331.213
34.451
− 5.305
Equatorial Guinea
21,516.793
20.201
− 6.293
16,954.511
24.238
− 6.323
121,176.470
30.430
− 7.596
Jordan
Lebanon Macao SAR, China
76
5 Circular and Cumulative Processes in Economic Growth
5.3 Findings Considering the Developments of Thirlwall and Those of the New Economic Geography The developments of Thirlwall suggest that the external demand (exports) of tradable goods is the engine of economic growth. These developments become known in the economic theory as the Thirlwall law. The subjacent idea is that output growth is dependent on international trade. Following these perspectives, a regression was carried out considering the world GDP per capita growth rate as the dependent variable and the exports of goods and services (annual growth rate) as the independent variable (Table 5.3). The results confirm the positive and statistically significant relationship between these two variables. The New Economic Geography emphasise the importance of wages to promote circular and cumulative processes of agglomeration of the population and economic activities. The findings presented in Table 5.4 show that, in fact, the GDP per capita growth rate positively impacts the compensation of employees (% of expense) growth rate. For the world GDP per capita growth rate as dependent variables, the results were not statistically significant, showing that the impacts are from the GDP per capita to the compensations of employees.
5.4 Discussion and Conclusions This research aims to investigate the relationships between international trade and the wages of the workers with the output of the countries. To achieve these proposals, developments associated with the Keynesian Theory (namely those related to the Thirlwall law) and the New Economic Geography were taken into account. These theories predict increasing returns to scale in the dynamics of economic growth and consequently tendencies of divergence among regions and countries, through selfreinforced processes of circular and cumulative phenomena. Data from the World Bank were considered for the period 2013–2020 and the following variables: GDP per capita; exports of goods and services (annual % growth), as proxies for the external demand; and compensation of employees (% of expense), as proxies for the wages. From the theory, it is expected that the external demand (the exports) promotes positive externalities on the output (some of the explanations for these processes become known in the theory as the Thirlwall law). In practice, these assumptions argue that output growth is endogenous and dependent on international trade growth and subsequently through the Verdoorn–Kaldor laws this has implications on the competitiveness of the economies. On the other hand, the New Economic Geography defends that the population and economic activity tend to agglomerate to save transport and communication costs.
0.005
Constant
0.003
0.026
Standard error
1.330
11.070
Z
Note *Statistically significant at 1%; **Statistically significant at 5%
0.289*
Exports of goods and services (annual growth rate)
Prais–Winsten regression, correlated panels corrected standard errors (PCSEs), without autocorrelation
Coefficient
Independent variable
Approach
0.184
0.000
P > |z|
6.040**
Hausman test 39.194*
Pesaran’s test of cross-sectional independence
35,693.590*
Modified Wald test for groupwise heteroskedasticity
1.336
Wooldridge test for autocorrelation
Table 5.3 Results for the model with the GDP per capita growth rates as the dependent variable, considering panel data over the period 2013–2020
5.4 Discussion and Conclusions 77
GDPpc growth rate
Prais–Winsten regression, correlated panels corrected standard errors (PCSEs), without autocorrelation
Note *Statistically significant at 1%
Constant
Independent variable
Approach
0.075 0.005
− 0.006
Standard error
0.221*
Coefficient
2.920 − 1.170
Z
0.244
0.003
P > |z|
15.970*
Hausman test 12.317*
Pesaran’s test of cross-sectional independence
140,000.000*
2.682
Modified Wald test Wooldridge test for groupwise for heteroskedasticity autocorrelation
Table 5.4 Results for the model with the compensation of employees (% of expense) growth rates as the dependent variable, considering panel data over the period 2013–2020
78 5 Circular and Cumulative Processes in Economic Growth
References
79
The pandemic impacted the world compensation of employees (% of expense) averages (Fig. 5.2) and world exports of goods and services (annual % growth) averages. These trends, however, seem to come already from previous years. Ireland, Mongolia, Madagascar, Serbia, Cambodia, North Macedonia, Romania, Cyprus, Kiribati, Philippines, Armenia, Poland, Lithuania, Moldova, Malta, Australia, Hungary and Morocco are some of the countries with the highest averages for exports of goods and services (annual % growth). The regressions carried out with panel data, to try to test the assumptions related to the Thirlwall law, show that, in fact, the GDP per capita growth rate is endogenous and dependent on the exports of goods and services (annual growth rate). On the other hand, considering the New Economic Geography, the findings reveal that the compensation of employees (% of expense) growth rate is dependent on the world GDP per capita. In terms of practical implications, international trade is determinant for the processes of economic growth worldwide and these dynamics impact employment conditions, namely the compensation of employees dynamics. It is recommended special attention, by the policy and decision-makers, about the trade dynamics and employment conditions in the design of policy instruments and measures. For future research, it could be interesting to bring more insights into economic growth and sustainability. Acknowledgements This work is funded by National Funds through the FCT—Foundation for Science and Technology, I.P., within the scope of the project Refa UIDB/00681/2020. Furthermore we would like to thank the CERNAS Research Centre and the Polytechnic Institute of Viseu for their support.
References 1. D. Ciriaci, D. Palma, The role of knowledge-based supply specialisation for competitiveness: a spatial econometric approach. Pap. Reg. Sci. 87, 453 (2008) 2. A.P. Thirlwall, The balance of payments constraint as an explanation of international growth rate differences. BNL Q. Rev. 32, 45 (1979) 3. D. Alencar, F. Jayme, G. Britto, Growth, distribution, and external constraints: a post-Kaleckian model applied to Brazil. Rev. Polit. Econ. 33, 44 (2021) 4. P.J. Verdoorn, Fattori the Regolano Lo Sviluppo Della Produttività Del Lavoro. L’Industria 1, 3 (1949) 5. N. Kaldor, Causes of the Slow Rate of Economic Growth of the United Kingdom: An Inaugural Lecture (Cambridge University Press, London, 1966) 6. N. Kaldor, Strategic Factors in Economic Development (NewYork State School of Industrial and Labor Relations, Cornell University, Ithaca, NY, 1967) 7. R. Blecker, New advances and controversies in the framework of balance-of-paymentsconstrained growth. J. Econ. Surv. 36, 429 (2022) 8. M. Davila-Fernandez, J. Oreiro, M. Davila, Endogenizing non-price competitiveness in a BoPC growth model with capital accumulation. Struct. Change Econ. Dyn. 44, 77 (2018) 9. P. McGregor, J. Swales, Thirlwall law and balance of payments constrained growth—further comment on the debate. Appl. Econ. 23, 9 (1991)
80
5 Circular and Cumulative Processes in Economic Growth
10. J. McCombie, Thirlwalls law and balance of payments constrained growth—more on the debate. Appl. Econ. 24, 493 (1992) 11. D. Alencar, E. Strachman, Balance-of-payments-constrained growth in Brazil: 1951–2008. J. Post Keynesian Econ. 36, 673 (2014) 12. J. Alonso, Growth and the external constraint: lessons from the Spanish case. Appl. Econ. 31, 245 (1999) 13. C. Garcimartin, V. Kvedaras, L. Rivas, Business cycles in a balance-of-payments constrained growth framework. Econ. Model. 57, 120 (2016) 14. J. Massot, R. Merga, A balance-of-payments-constrained growth model for a small commodity exporting country: Argentina between 1971 and 2016. Int. Rev. Appl. Econ. 36, 562 (2022) 15. G. Morlin, Growth led by government expenditure and exports: public and external debt stability in a supermultiplier model. Struct. Change Econ. Dyn. 62, 586 (2022) 16. H. Nishi, A multi-sectoral balance-of-payments-constrained growth model with sectoral heterogeneity. Struct. Change Econ. Dyn. 39, 31 (2016) 17. A. Razmi, Balance-of-payments-constrained growth model: the case of India. J. Post Keynesian Econ. 27, 655 (2005) 18. Z. Ybrayev, Balance-of-payments-constrained growth model: an application to the Kazakhstan’s economy. Eurasian Econ. Rev. 12, 745 (2022) 19. P. Krugman, Increasing returns and economic geography. J. Polit. Econ. 99, 483 (1991) 20. M. Fujita, P. Krugman, A.J. Venables, The Spatial Economy: Cities, Regions, and International Trade (The MIT Press, 1999) 21. Web of Science, Web of Science Core Collection. https://www.webofscience.com/wos/woscc/ basic-search 22. World Bank, World Bank Open Data. https://data.worldbank.org 23. D. Hoechle, Robust standard errors for panel regressions with cross-sectional dependence. Stand. Genomic Sci. 7, 281 (2007) 24. O. Torres-Reyna, Panel Data Analysis Fixed and Random Effects Using Stata (v. 6.0) (2007) 25. StataCorp, Stata 15 Base Reference Manual (2017) 26. StataCorp, Stata Statistical Software: Release 15 (2017) 27. Stata, Statistical Software for Data Science|Stata. https://www.stata.com/
Chapter 6
Interrelationships Between Economic Growth and Sustainability: Highlights from the Literature
Abstract The great discussions currently are about how to make compatible economic growth and sustainability. In other words, the big challenge for the next years is to identify strategies that promote economic growth and human well-being without compromising the environment and the future of the planet. This is, in fact, a hard task for the current and next generations. The needs of humanity for more food and employment are in an increasing trend and these frameworks call for continuous economic growth worldwide, but these tendencies are supported often compromising the availability of resources for the next generations. The objective of this research is to bring more insights from the scientific literature about the interrelationships between economic growth and sustainability. For that, several documents, obtained from the Scopus database and related to the issues here addressed, were considered. These documents were analysed through bibliometric approaches and following the VOSviewer software procedures. With this research, several contributions for more sustainable economic growth were presented. Keywords Bibliometric analysis · Systematic review · VOSviewer · Scopus database
6.1 Introduction The manufacturing sector plays a fundamental role in economic growth, but, in some circumstances and sectors, the industry has relevant impacts on climate change and, consequently, on sustainability. These contexts call for a deeper understanding of the supply chains to better identify approaches for more sustainable development [1]. The sustainability of the tourism sector also has aroused the curiosity of the scientific community [2], including its relationship with water quality [3] and environmental degradation [4].
© The Author(s), under exclusive license to Springer Nature Switzerland AG 2023 V. J. P. D. Martinho, Economic Growth: Advances in Analysis Methodologies and Technologies, SpringerBriefs in Applied Sciences and Technology, https://doi.org/10.1007/978-3-031-38363-2_6
81
82
6 Interrelationships Between Economic Growth and Sustainability …
Public policies are crucial to make compatible the different dimensions of sustainability. This is true for the Mexican frameworks [5] as it is for other frameworks worldwide. Renewable energy policies, for instance, may be interesting instruments to promote economic growth without compromising the environmental dimensions [6]. The needs for continuous, and ever-increasing, economic growth create additional pressures on the available resources, specifically on the water [7], and bring new concerns about greenhouse gas emissions. This is particularly worrying in the agricultural sector, where the concerns with food security may compromise, in certain cases, the goals to mitigate the carbon emissions. The understanding of the relationships between food security and carbon emissions is crucial to control global warming [8]. Land tenure is another dimension to take into account in the discussions about food security [9]. If economic growth creates difficulties to deal with climate change, global warming also impacts economic asymmetries [10]. Another current concern for the governments is the sustainability of urban infrastructures and the associated changes verified in the last decades. In fact, currently, there is a continuous migration of the population from the rural areas to the cities [11], creating problems of desertification in some regions and difficulties of overpopulation in the cities [12]. Of course, there are differences in these phenomena worldwide, but this is a real trend verified in many nations. The new technologies may bring new perspectives for a greener economy [13]. Considering this literature survey, this chapter aims to highlight insights from the literature about the relationships between economic growth, sustainability and climate change worldwide. For that, a bibliometric analysis and systematic review [14] were carried out based on 959 documents obtained on a search performed on 17 May 2023 in the Scopus [15] database for the following topics: “economic growth”; and “sustainability”; and “climate change”. For the bibliometric analysis, the VOSviewer software procedures were followed [16–18]. For the bibliometric analysis, bibliographic data were considered, as well as the following links: cooccurrence; bibliographic coupling; and co-citation. The metrics were obtained with full counting and the next conditions: 1 as the minimum number of occurrences of a keyword; 1 as the minimum number of documents of a country; 1 as the minimum number of documents of an organisation; 1 as the minimum number of citations of an author; 0 as the minimum number of citations of a document; and 1 as the minimum number of citations of a source. To identify the top items (keywords, countries, organisations, authors, documents and sources), the total link strength metric was taken into account [19].
6.2 Bibliometric Analysis
83
6.2 Bibliometric Analysis The keywords with the highest values for the total link strength metric (related to the number of documents where they appear together) are the following (Table 6.1): climate change; sustainable development; sustainability; economic growth; economics; and economic development. These keywords highlight a clear concern with the impacts of carbon dioxide on the relationships between economic growth, sustainability and climate change. On the other hand, this group of keywords shows that, sometimes, different expressions are used to express the same context. The keywords with higher relatedness present also a relevant number of occurrences (Fig. 6.1) and average citations. China, Turkey, Pakistan, UK, Malaysia, USA, Nigeria, Australia, India and Spain are the countries of affiliation of the authors with the biggest total link strength (Table 6.2). The top 10 countries of affiliation have also an important number of documents (Fig. 6.2) and citations. Between the organisations with the greatest values for the total link strength appear the following (Table 6.3): Faculty of Economics Administrative and Social Sciences, Istanbul Gelisim University; Institute of Climate Change, Universiti Kebangsaan Malaysia; School of Management and Economics, Beijing Institute of Technology; Australian National University’s, Fenner School of Environment and Society; and Australian Griffith University. Some of the top 10 organisations have also a relevant number of documents (Fig. 6.3) and citations. Table 6.1 Top 10 all keywords items, with the highest total link strength, for co-occurrence links and the following topics: “economic growth”; and “sustainability”; and “climate change” All keywords
Total link strength
Occurrences
Average publication year
Average citations
Climate change
6740
510
2018
30
Sustainable development
5301
355
2018
33
Sustainability
4799
406
2018
29
Economic growth
4580
344
2019
28
Economics
3061
187
2017
36
Economic development
2764
142
2019
39
Carbon dioxide
2573
136
2019
43
Environmental economics
1902
112
2018
45
Environmental sustainability
1851
98
2019
46
Economic and social effects
1723
87
2019
39
84
6 Interrelationships Between Economic Growth and Sustainability …
Fig. 6.1 All keywords items for co-occurrence links and the following topics: “economic growth”; and “sustainability”; and “climate change” Table 6.2 Top 10 countries items, with the highest total link strength, for bibliographic coupling links and the following topics: “economic growth”; and “sustainability”; and “climate change” Countries
Total link strength
Documents
Citations
Average publication year
China
39,151
135
3516
2020
Turkey
32,217
62
3046
2021
Pakistan
20,783
44
914
2022
UK
18,704
100
3512
2017
Malaysia
18,088
55
1470
2021
USA
16,110
150
3823
2016
Nigeria
12,320
21
850
2021
Australia
11,450
75
2577
2016
India
11,109
72
736
2019
Spain
10,260
46
1005
2020
6.2 Bibliometric Analysis
85
Fig. 6.2 Countries items for bibliographic coupling links and the following topics: “economic growth”; and “sustainability”; and “climate change” Table 6.3 Top 10 organisations items, with the highest total link strength, for bibliographic coupling links and the following topics: “economic growth”; and “sustainability”; and “climate change” Organisations
Total link strength
Documents
Citations
Average publication year
Faculty of Economics 13,828 Administrative and Social Sciences, Istanbul Gelisim University, Istanbul, Turkey
13
408
2021
Institute of Climate Change, Universiti Kebangsaan Malaysia, Bangi, 43600, Malaysia
12,935
10
180
2022
School of Management and Economics, Beijing Institute of Technology, Beijing, 100081, China
9476
9
397
2022
Australian National University’s, Fenner School of Environment and Society, Australia
6463
1
47
2010
Griffith University, Australia
6463
1
47
2010 (continued)
86
6 Interrelationships Between Economic Growth and Sustainability …
Table 6.3 (continued) Organisations
Total link strength
Documents
Citations
Average publication year
Faculty of Social Sciences and Humanities, Universiti Kebangsaan Malaysia, Bangi, 43600, Malaysia
6453
5
97
2022
Department of Finance & Accounting, Akfa University, 1st Deadlock, 10th Kukcha Darvoza Street, Tashkent, Uzbekistan
6070
4
171
2022
Faculty of Engineering And Built Environment, Universiti Kebangsaan Malaysia, Bangi, 43600, Malaysia
5812
4
60
2022
Faculty of Information Science and Technology, Universiti Kebangsaan Malaysia, Bangi, 43,600, Malaysia
5812
4
60
2022
Economic and Finance Application and Research Center, ˙IStanbul Ticaret University, Istanbul, Turkey
4417
3
6
2022
The authors with the highest total link strength (related to the number of times they are cited together) and the respective citations are those presented in Table 6.4 and Fig. 6.4. The top 10 documents are those exhibited in Table 6.5. Energy policy, Energy, Environmental Science and Pollution Research, Sustainability and Science are some of the sources with the biggest total link strength (Table 6.6), and some of these items (sources) have a significant number of citations (Fig. 6.5).
6.2 Bibliometric Analysis
87
Fig. 6.3 Organisations items for bibliographic coupling links and the following topics: “economic growth”; and “sustainability”; and “climate change”
Table 6.4 Top 10 cited authors items, with the highest total link strength, for co-citation links and the following topics: “economic growth”; and “sustainability”; and “climate change” Cited authors
Total link strength
Citations
Shahbaz, M.
51,977
475
Hargroves, K.
49,988
65
Adebayo, T.S.
45,783
359
Ozturk, I.
43,154
398
Smith, M.
41,824
62
Desha, C.
40,229
54
Bekun, F.V.
38,566
334
Stern, N.
35,702
125
Kirikkaleli, D.
32,200
256
Stasinopoulos, P.
32,099
42
88
6 Interrelationships Between Economic Growth and Sustainability …
Fig. 6.4 Cited authors items for co-citation links and the following topics: “economic growth”; and “sustainability”; and “climate change” Table 6.5 Top 10 documents items, with the highest total link strength, for bibliographic coupling links and the following topics: “economic growth”; and “sustainability”; and “climate change” Documents
URL
Total link strength
Citations
Raihan [20]
https://doi.org/10.1007/s10 669-022-09848-0
606
23
Raihan [21]
https://doi.org/10.1016/j. nexus.2022.100144
597
8
Smith [22]
https://doi.org/10.4324/978 1849776370
561
47
Raihan [23]
https://doi.org/10.1016/j. nexus.2022.100067
556
24
Raihan [24]
https://doi.org/10.1007/s41 685-023-00278-7
547
3
Raihan [25]
https://doi.org/10.1007/s40 710-022-00590-y
543
16
Shujah-Ur-Rahman [26]
https://doi.org/10.1007/s11 356-019-06343-z
536
77
Raihan [27]
https://doi.org/10.1016/j.rcr adv.2022.200096
515
37
Amin [28]
https://doi.org/10.1080/135 04509.2023.2166142
495
0
Raihan [29]
https://doi.org/10.1016/j. nexus.2022.100148
494
4
6.4 Discussion and Conclusions
89
Table 6.6 Top 10 cited sources items, with the highest total link strength, for co-citation links and the following topics: “economic growth”; and “sustainability”; and “climate change” Cited sources
Total link strength
Citations
Energy Policy
54,331
1141
The Stern Review: The Economics of Climate Change
38,919
39
Plan B 3.0: Mobilizing to Save Civilization
36,792
36
Oecd Environmental Outlook to 2030
30,845
31
Energy
26,272
556
Environ Sci Pollut Res
23,381
588
Sustainability
22,237
633
Factor Five: Transforming the Global Economy Through 80% Improvements in Resource Productivity
21,806
22
Science
20,723
438
Global Environment Outlook: Environment for Development (Geo-4) Report
19,741
19
Fig. 6.5 Cited sources items for co-citation links and the following topics: “economic growth”; and “sustainability”; and “climate change”
6.3 Insights from the Literature Renewable energy use, technological innovation, digital transition, sustainable cities and economic sectors, human capital and adjusted policies are some of the dimensions highlighted by the literature (Table 6.7) to make compatible economic growth and sustainability in times of concern with consequences of the climate change.
6.4 Discussion and Conclusions This chapter intends to highlight insights into the relationships among economic growth and sustainability. To achieve these objectives, a bibliometric analysis and a literature review, based on this bibliometric assessment, were carried out. A search on the Scopus database was performed on 17 May 2023 for the topics: “economic growth”; and “sustainability”; and “climate change”. This bibliometric analysis followed the procedures proposed by the VOSviewer software. In this assessment co-occurrence, bibliographic coupling and co-citation links were considered.
90
6 Interrelationships Between Economic Growth and Sustainability …
Table 6.7 Some highlights from the literature Documents
URL
Insights
Raihan [20]
https://doi.org/10.1007/ s10669-022-09848-0
Using more renewable energy and technological innovation may mitigate Malaysia’s emissions, however economic growth reduce the environmental quality
Raihan [21]
https://doi.org/10.1016/j. nexus.2022.100144
Variables that contribute to reduce the environmental quality in Bangladesh
Smith [22]
https://doi.org/10.4324/ 9781849776370
Separate economic growth from environment
Raihan [23]
https://doi.org/10.1016/j. nexus.2022.100067
Renewable energy and smart farming to improve the environmental sustainability
Raihan [24]
https://doi.org/10.1007/ s41685-023-00278-7
Potentialities from agriculture to mitigate emissions in Vietnam
Raihan [25]
https://doi.org/10.1007/ s40710-022-00590-y
Renewable energy, sustainable cities and tourism to promote environmental sustainability
Shujah-Ur-Rahman [26]
https://doi.org/10.1007/ s11356-019-06343-z
Renewable energy and human capital to achieve sustainability
Raihan [27]
https://doi.org/10.1016/j. rcradv.2022.200096
Renewable energy use and sustainable forest planning to better environmental sustainability
Amin [28]
https://doi.org/10.1080/ 13504509.2023.2166142
Practical signs and policy suggestions for sustainability
Raihan [29]
https://doi.org/10.1016/j. nexus.2022.100148
Practices to increase the environmental sustainability
Some economic sectors and activities, such as manufacturing, are fundamental for economic growth, but bring also, in some circumstances, negative impacts on climate change and environmental sustainability. The national and international policies and institutions have here a crucial role to make more compatible economic growth with sustainable development. The main challenge for the stakeholders is to make compatible the needs of economic growth, because of the employment (for example), and the preservation of the planet’s natural resources. Climate change, sustainable development, sustainability, economic growth, economics and economic development are some of the keywords found in the documents analysed, revealing concerns, for example, with the impacts of carbon dioxide emissions. Some of the relevant countries of affiliation of the authors for the network assessed (taking into account the approaches followed) are the following: China; Turkey; Pakistan; UK; Malaysia; USA; Nigeria; Australia; India; and Spain. The relevant sources are, for example, the following: Energy policy; Energy; Environmental Science and Pollution Research; Sustainability; and Science.
References
91
The literature review based on the bibliometric analysis highlight, to make compatible economic growth with sustainability (mitigating climate change) the importance of the use of renewable energy, promote innovation, consider the artificial intelligence approaches, promote urban sustainability and design adjusted policies and programs. In terms of practical implications, it seems that there is a field to be explored about these topics, particularly including other domains from the science and extending the network to other countries and organisations. In terms of policy recommendations, it is suggested to create conditions and programs to promote more studies on topics less explored in countries with fewer research dynamics and generate conditions to make more visible some work already realised and not published. For future research, it could be relevant to analyse the relationships between sustainability and the life cycle tools. Acknowledgements This work is funded by National Funds through the FCT—Foundation for Science and Technology, I.P., within the scope of the project Refª UIDB/00681/2020. Furthermore we would like to thank the CERNAS Research Centre and the Polytechnic Institute of Viseu for their support.
References 1. A. Rajeev, R.K. Pati, S.S. Padhi, Sustainable supply chain management in the chemical industry: evolution, opportunities, and challenges. Resour. Conserv. Recycl. 149, 275 (2019) 2. A. Molina-Collado, M.L. Santos-Vijande, M. Gómez-Rico, J.M. Madera, Sustainability in hospitality and tourism: a review of key research topics from 1994 to 2020. Int. J. Contemp. Hosp. Manag. 34, 3029 (2022) 3. B.D. Moyle, D.B. Weaver, S. Gössling, C.-L. McLennan, A. Hadinejad, Are water-centric themes in sustainable tourism research congruent with the UN sustainable development goals? J. Sustain. Tour. 30, 1821 (2022) 4. M. Shahbaz, M.F. Bashir, M.A. Bashir, L. Shahzad, A bibliometric analysis and systematic literature review of tourism-environmental degradation nexus. Environ. Sci. Pollut. Res. 28, 58241 (2021) 5. N. Aguilar-Rivera, Sustainable biofuels. Strategy for growth and energy security. Revista Mexicana de Economia y Finanzas Nueva Epoca 17, 1–29 (2022) 6. C. Magazzino, P. Toma, G. Fusco, D. Valente, I. Petrosillo, Renewable energy consumption, environmental degradation and economic growth: the greener the richer? Ecol. Indicat. 139, 108912 (2022) 7. W. Bai, L. Yan, J. Liang, L. Zhang, Mapping knowledge domain on economic growth and water sustainability: a scientometric analysis. Water Resour. Manage 36, 4137 (2022) 8. P. Cheng, H. Tang, F. Lin, X. Kong, Bibliometrics of the nexus between food security and carbon emissions: hotspots and trends. Environ. Sci. Pollut. Res. 30, 25981 (2023) 9. E. Salmerón-Manzano, F. Manzano-Agugliaro, Worldwide research trends on land tenure. Land Use Policy 131, 106727 (2023) 10. M.M. Khine, U. Langkulsen, The implications of climate change on health among vulnerable populations in South Africa: a systematic review. Int. J. Environ. Res. Public Health 20(4), 3425 (2023) 11. A. Sharifi, A.R. Khavarian-Garmsir, Z. Allam, A. Asadzadeh, Progress and prospects in planning: a bibliometric review of literature in urban studies and regional and urban planning, 1956–2022. Prog. Plan. 173, 100740 (2023)
92
6 Interrelationships Between Economic Growth and Sustainability …
12. A.L.C. Ferrer, A.M.T. Thomé, A.J. Scavarda, Sustainable urban infrastructure: a review. Resour. Conserv. Recycl. 128, 360 (2018) 13. P. Tamasiga, H. Onyeaka, E.H. Ouassou, Unlocking the green economy in African countries: an integrated framework of FinTech as an enabler of the transition to sustainability. Energies 15(22), 8658 (2022) 14. D. Moher, A. Liberati, J. Tetzlaff, D.G. Altman, Preferred reporting items for systematic reviews and meta-analyses: the prisma statement. BMJ 339, b2535 (2009) 15. Scopus, Scopus database, https://www.scopus.com/search/form.uri?display=basic#basic 16. N.J. van Eck, L. Waltman, Software survey: VOSviewer, a computer program for bibliometric mapping. Scientometrics 84, 523 (2010) 17. N.J. van Eck, L. Waltman, Manual for VOSviewer version 1.6.19 (2023). https://www.vosvie wer.com/documentation/Manual_VOSviewer_1.6.19.pdf 18. VOSviewer, VOSviewer—Visualizing scientific landscapes, https://www.vosviewer.com// 19. V.J.P.D. Martinho, Impacts of the COVID-19 pandemic and the Russia-Ukraine conflict on land use across the world. Land 11, 10 (2022) 20. A. Raihan, R.A. Begum, M.N.M. Said, J.J. Pereira, Relationship between economic growth, renewable energy use, technological innovation, and carbon emission toward achieving Malaysia’s Paris agreement. Environ. Syst. Decis. 42, 586 (2022) 21. A. Raihan, D.A. Muhtasim, S. Farhana, M.A.U. Hasan, M.I. Pavel, O. Faruk, M. Rahman, A. Mahmood, Nexus between economic growth, energy use, urbanization, agricultural productivity, and carbon dioxide emissions: new insights from Bangladesh. Energy Nexus 8, 100144 (2022) 22. C.D. Smith Charlie Hargroves, M. Harrison, Cents and Sustainability: Securing Our Common Future by Decoupling Economic Growth from Environmental Pressures (Routledge, London, 2011) 23. A. Raihan, A. Tuspekova, The nexus between economic growth, renewable energy use, agricultural land expansion, and carbon emissions: new insights from Peru. Energy Nexus 6, 100067 (2022) 24. A. Raihan, An econometric evaluation of the effects of economic growth, energy use, and agricultural value added on carbon dioxide emissions in Vietnam. Asia-Pac. J. Reg. Sci. (2023). https://doi.org/10.1007/s41685-023-00278-7 25. A. Raihan, D.A. Muhtasim, M.I. Pavel, O. Faruk, M. Rahman, Dynamic impacts of economic growth, renewable energy use, urbanization, and tourism on carbon dioxide emissions in Argentina. Environ. Process. 9, 38 (2022) 26. Shujah-ur-Rahman, S. Chen, S. Saud, N. Saleem, M.W. Bari, Nexus between financial development, energy consumption, income level, and ecological footprint in CEE countries: do human capital and biocapacity matter? Environ. Sci. Pollut. Res 26, 31856 (2019) 27. A. Raihan, A. Tuspekova, Toward a sustainable environment: nexus between economic growth, renewable energy use, forested area, and carbon emissions in Malaysia. Resour. Conserv. Recycl. Adv. 15, 200096 (2022) 28. N. Amin, H. Song, M.S. Shabbir, M.U. Farrukh, I. Haq, Moving towards a sustainable environment: do disaggregated energy consumption, natural resources, financial development and economic globalization really matter? Int. J. Sustain. Dev. World Ecol. 30(5), 515–532 (2023). https://doi.org/10.1080/13504509.2023.2166142 29. A. Raihan, A. Tuspekova, Towards sustainability: dynamic nexus between carbon emission and its determining factors in Mexico. Energy Nexus 8, 100148 (2022)
Chapter 7
Sustainable Development: Contributions from Life Cycle Cost Analysis
Abstract To promote more sustainable developments, several approaches have been developed to support more adjusted assessments and the processes of policy design by governments and international organisations. The life cycle assessment and the life cycle cost analysis are examples of methodologies used to better understand the impacts of products and investments on sustainability. Nonetheless, the scientific literature shows that there is a field to be explored about the contributions of the life cycle cost analysis for more sustainable development. Considering these motivations, this research proposes to highlight contributions from the literature about the interrelationships among sustainability and life cycle cost analysis. To achieve these objectives, various documents from the Scopus database were considered for topics associated with these issues. These documents were assessed through co-citation links and considering authors, sources and documents as items. The top documents identified through this bibliometric analysis were taken into account for a survey of the literature. The results obtained provide relevant insights on the relationships between sustainable development and the life cycle cost analysis. Keywords Co-citation links · Authors, sources and documents items · Highlights from the literature
7.1 Introduction The life cycle assessment and life cycle cost(ing) analysis/assessment are among the approaches considered in the sustainable development investigation, as parts of the life cycle sustainability assessment [1]. The life cycle cost analysis is an interesting methodology to assess the economic dimensions of products and processes, supporting the stakeholders to follow more sustainable developments [2]. The use of life cycle methodologies in the agricultural sector is increasing [3], but there is still some work to do, namely because the life cycle cost analysis is not yet harmonised for agri-food productions [4].
© The Author(s), under exclusive license to Springer Nature Switzerland AG 2023 V. J. P. D. Martinho, Economic Growth: Advances in Analysis Methodologies and Technologies, SpringerBriefs in Applied Sciences and Technology, https://doi.org/10.1007/978-3-031-38363-2_7
93
94
7 Sustainable Development: Contributions from Life Cycle Cost Analysis
The scientific literature has analysed the consideration of the life cycle cost analysis in the following topics: pavement networks [5]; construction industry [6, 7]; wastewater treatment [8]; building life cycle evaluation [9]; gold mining activities [10]; solid oxide fuel cells [11]; and green roofs [12]. The scientific literature has brought relevant insights about the relevance of bibliometric analysis as support for systematic reviews. In fact, the bibliometric approaches provide adjusted information to more objectively identify the documents to be surveyed through systematic review [13, 14]. There are still, however, some gaps in the literature about the interlinkages between sustainable development and life cycle cost analysis, showing that there is a field to be explored about the contributions of the life cycle costing assessment for sustainability. Considering these motivations, this research proposes to bring more insights into the contributions of the life cycle cost analysis for sustainable development worldwide and the different sectors. For that, 1489 documents were considered. These documents were obtained from the Scopus [15] database, in a search that was carried out on 17 May 2023, for the following topics: “sustainable development”; and “life cycle cost*”. These studies were analysed through bibliometric analysis, following the VOSviewer procedures [16–18], which was taken into account as support for a literature survey [19]. To identify the top items analysed (all keywords, countries, organisations, authors, documents and sources), it was followed the approaches considered by Martinho [20], for example. In the figures presented in the remaining structure of this chapter, the distance between items represents the relatedness. On the other hand, the dimensions of the circles and labels represent the number of occurrences for the co-occurrence links, the number of documents for the bibliographic coupling links and the number of citations for the co-citation links [17].
7.2 Bibliographic Data Assessment Figure 7.1 and Table 7.1 highlight the keywords with the highest occurrences and total link strength, respectively. Table 7.1 also shows that keywords with the biggest values for the total link strength metric have a too important number of occurrences and average citations. These keywords reveal the relevance of the life cycle analysis tools to better support decision making and promote more sustainable development. USA, China, Germany, Italy, UK, Spain, Australia and Portugal are the countries with more relatedness with other countries (the relatedness for bibliographic coupling links is based on the number of references they share) and with a relevant number of documents and citations (Fig. 7.2 and Table 7.2). The top 10 organisations with the greatest values for the total link strength are those presented in Table 7.3. These organisations of affiliation of the authors are, for example, from Spain, Brazil, Germany and Hungary. The dimensions of the circles and labels presented in Fig. 7.3 are related to the number of documents of each item (organisation) and the proximity of the items is associated with the relatedness.
7.2 Bibliographic Data Assessment
95
Fig. 7.1 All keywords as items and co-occurrence links for the topics: “sustainable development”; and “life cycle cost*”
Figure 7.4 and Table 7.4 exhibit the metrics for the cited authors considering cocitation links. The authors with the highest values for the total link strength are, for example, the following: Heijungs, R.; Frangopol, D.M.; Finkbeiner, M.; Hunkeler, D.; Azapagic, A.; Traverso, M.; Huppes, G.; Kucukvar, M. For the co-citation links the relatedness is based on the number of times the items are cited together. The dimension of the circles and labels in Fig. 7.4 symbolises the number of citations and the proximity represents the relatedness. Table 7.5 shows the top 10 documents for bibliographic coupling links (relatedness based on the number of references the items share and in this way, it is expected that they are related to the same issue). The sources with the highest total link strength and relevant citations (Fig. 7.5 and Table 7.6) are related to energy, sustainability, life cycle assessment and cleaner production. The majority of the top 10 sources are associated with energy, such as: Energy; Energy Build.; Appl. Energy; Energy Policy; Renew. Sustain. Energy Rev.; and Energy Build. These findings reveal that there is a field to be explored in other domains.
96
7 Sustainable Development: Contributions from Life Cycle Cost Analysis
Table 7.1 Top 10 all keywords as items, with the biggest total link strength, and co-occurrence links for the topics: “sustainable development”; and “life cycle cost*” All keywords
Total link strength
Occurrences
Average publication year
Average citations
Sustainable development
18,774
1382
2016
20
Life cycle
15,618
1094
2017
20
Costs
10,288
686
2017
17
Cost–benefit analysis
6460
398
2017
17
Environmental impact
6434
390
2017
25
Sustainability
5756
358
2017
30
Life cycle assessment
5635
305
2019
31
Life cycle assessment (lca)
5389
311
2017
27
Life cycle analysis
4740
239
2018
32
Decision making
4602
289
2017
25
Fig. 7.2 Countries as items and bibliographic coupling links for the topics: “sustainable development”; and “life cycle cost*”
7.2 Bibliographic Data Assessment
97
Table 7.2 Top 10 countries as items, with the biggest total link strength, and bibliographic coupling links for the topics: “sustainable development”; and “life cycle cost*” Countries
Total link strength
Documents
Citations
Average publication year
USA
20,020
346
6711
2015
China
15,059
140
2963
2019
Germany
13,037
120
2959
2015
Italy
12,827
125
3634
2019
UK
11,189
101
2621
2016
Spain
10,032
61
1146
2019
Australia
9439
75
2390
2016
Portugal
6956
40
1058
2018
Netherlands
5943
42
2724
2017
France
5902
33
1162
2018
Table 7.3 Top 10 organisations as items, with the biggest total link strength, and bibliographic coupling links for the topics: “sustainable development”; and “life cycle cost*” Organisations
Total link strength
Documents
Citations
Average publication year
Departament 2466 D’enginyeria Mecanica, Urv, Universitat Rovira I Virgili, Av. Paisos Catalans, 26, Tarragona, 43007, Spain
1
35
2019
Escola de Engenharia, Programa de Pós-Graduação em Engenharia Civil, UFF, Universidade Federal Fluminense, Rua Passo Da Pátria, 156, 3° Andar—Bloco D, São Domingos, Cep 24210-240 Niteróirj, Brazil
2466
1
35
2019
Escola Politécnica, 2466 Departamento de Construção Civil, Ufrj, Universidade Federal do Rio de Janeiro, Av. Athos da Silveira Ramos, 149, Ct, Bloco D, Sala 207, Ilha do Fundão, Rio de Janeiro, Rj Cep 21941-590, Brazil
1
35
2019
(continued)
98
7 Sustainable Development: Contributions from Life Cycle Cost Analysis
Table 7.3 (continued) Organisations
Total link strength
Documents
Grea Research Group, Inspires Research Centre, Universitat de Lleida, Pere de Cabrera S/N, Lleida, 25001, Spain
2466
1
35
2019
Materials Science & 2466 Physical Chemistry, Department of Materials Science & Physical Chemistry, Universitat de Barcelona, Martí I Franqués, 1, Barcelona, 08028, Spain
1
35
2019
Institute of Environmental Science and Technology (ICTA)
1976
2
111
2018
Sostenipra (ICTA-IRTA-Inèdit)
1976
2
111
2018
Institute of Sustainability in Civil Engineering, Rwth Aachen University, Aachen, Germany
1618
2
47
2021
Faculty of Civil 1595 Engineering, Technische Universität Dresden, Dresden, 01069, Germany
2
46
2021
John Von Neumann Faculty of Informatics, Obuda University, Budapest, 1034, Hungary
2
46
2021
1595
Citations
Average publication year
7.2 Bibliographic Data Assessment
99
Fig. 7.3 Organisations as items and bibliographic coupling links for the topics: “sustainable development”; and “life cycle cost*”
Fig. 7.4 Cited authors as items and co-citation links for the topics: “sustainable development”; and “life cycle cost*”
100
7 Sustainable Development: Contributions from Life Cycle Cost Analysis
Table 7.4 Top 10 cited authors as items, with the biggest total link strength, and co-citation links for the topics: “sustainable development”; and “life cycle cost*” Cited authors
Total link strength
Citations
Heijungs, R.
21,963
299
Frangopol, D.M.
17,908
274
Finkbeiner, M.
17,324
192
Hunkeler, D.
15,814
263
Azapagic, A.
14,266
227
Traverso, M.
14,205
159
Huppes, G.
13,984
199
Kucukvar, M.
13,245
138
Ciroth, A.
12,857
193
Zamagni, A.
12,232
126
Table 7.5 Top 10 documents as items, with the biggest total link strength, and bibliographic coupling links for the topics: “sustainable development”; and “life cycle cost*” Documents
URL
Total link strength
Naves [21]
https://doi.org/10.1016/j.solener.2018. 04.011
660
35
Costa [1]
https://doi.org/10.1016/j.scitotenv.2019. 05.435
543
95
Fauzi [22]
https://doi.org/10.3390/su11030636
532
69
Miah [23]
https://doi.org/10.1016/j.jclepro.2017. 08.187
487
79
Neugebauer [24]
https://doi.org/10.1016/j.jclepro.2015. 04.053
450
67
Hoogmartens [25]
https://doi.org/10.1016/j.eiar.2014. 05.001
407
208
399
6
Hu [26]
Citations
Zimek [27]
https://doi.org/10.3390/su11123283
381
14
Degieter [4]
https://doi.org/10.1016/j.scitotenv.2022. 158012
364
4
De Luca [28]
https://doi.org/10.1016/j.jclepro.2017. 10.119
340
93
7.2 Bibliographic Data Assessment
101
Fig. 7.5 Cited sources as items and co-citation links for the topics: “sustainable development”; and “life cycle cost*” Table 7.6 Top 10 cited sources as items, with the biggest total link strength, and co-citation links for the topics: “sustainable development”; and “life cycle cost*”
Cited sources
Total link strength
Citations
J. Clean. Prod.
53,127
1463
Int. J. Life Cycle Assess.
34,048
851
Energy
31,962
688
Energy Build.
26,156
624
Sustainability
25,849
635
Appl. Energy
21,469
388
Build. Environ.
18,907
455
Energy Policy
17,449
405
Renew. Sustain. Energy Rev.
16,385
356
Energy Build
16,291
267
102
7 Sustainable Development: Contributions from Life Cycle Cost Analysis
7.3 Contributions from the Literature for the Topics Analysed The contributions presented in Table 7.7 highlight the importance of the different life cycle tools (life cycle analysis, life cycle cost analysis and social life cycle analysis) for the sustainability assessment. However, these tools are still under development, particularly because of difficulties associated with the lack of data (namely for the economic and social dimensions). On the other hand, a standardisation is missing for these approaches and respective indicators, which brings additional constraints when it is intended to promote some comparability. More research about these topics may bring added value, specifically to integrate the different life cycle tools in a comparable framework. Table 7.7 Insights from the literature Documents
URL
Highlights
Naves [21]
https://doi.org/10.1016/j.solener. 2018.04.011
Life cycle cost analysis as an important base for the life cycle sustainability assessment
Costa [1]
https://doi.org/10.1016/j.scitotenv. 2019.05.435
Life cycle costing is part of the life cycle sustainability assessment
Fauzi [22]
https://doi.org/10.3390/su11030636
Potentialities of life cycle sustainability assessment
Miah [23]
https://doi.org/10.1016/j.jclepro. 2017.08.187
Joining environmental and economic assessments
Neugebauer [24]
https://doi.org/10.1016/j.jclepro. 2015.04.053
Lack of data and different indicators provided by distinct institutions hamper the implementation of assessment tools
Hoogmartens [25]
https://doi.org/10.1016/j.eiar.2014. 05.001
Relationships between life cycle analysis, life cycle costing and cost–benefit analysis
Hu [26]
Life cycle costing is an important tool for the sustainability assessment
Zimek [27]
https://doi.org/10.3390/su11123283
Practical and methodological constraints limit the implementation of life cycle tools
Degieter [4]
https://doi.org/10.1016/j.scitotenv. 2022.158012
Harmonising the life cycle cost analysis is recommended to guarantee comparability
De Luca [28]
https://doi.org/10.1016/j.jclepro. 2017.10.119
Life cycle sustainability assessment is still under development
7.4 Discussion and Conclusions
103
7.4 Discussion and Conclusions This study intends to bring more insights from the literature about the contributions of the life cycle cost analysis for sustainability. In this way, a search on 17 May 2023 was carried out in the Scopus database for the topics: “sustainable development”; and “life cycle cost*”. From this search, 1489 documents were identified that were assessed through bibliography data analysis and following the VOSviewer software procedures. In this assessment were analysed keywords, countries, organisations, cited authors, documents and cited sources items from different links. The life cycle cost analysis appears in the literature as part of the life cycle sustainability assessment and has been considered to analyse the economic dimensions of products and processes. This approach has been taken into account in assessments related to the construction and related activities, for example, but there is still some work to do in other sectors and activities, particularly those associated with agricultural practices and products. The bibliometric analysis highlights some relevant (considering the approaches here considered based, specifically on the total link strength) keywords in the documents identified, such as the following: sustainable development; life cycle; costs; cost–benefit analysis; environmental impact; and sustainability. These findings highlight the importance of life cycle tools to support decision-makers. The USA, China, Germany, Italy, the UK, Spain, Australia and Portugal are some of the relevant countries. Finally, a relevant part of the top 10 sources (with the highest total link strength) is focused on the energy fields. The systematic review highlights the relevance of the life cycle tools; however, there is still some work to do, specifically to: bring more insights for the development of these tools; mitigate difficulties associated with the lack of data; standardise the indicators and approaches; create comparable frameworks among the different life cycle tools. In terms of practical implication, the bibliometric analysis and the literature review highlight the need for more research to better develop the life cycle tools, the importance of these methodologies for the sustainable development assessment and more standardisation of the associated indicators and approaches. For policy recommendations, it could be pertinent to create regulations and guidelines for the implementation of these tools in the different economic sectors and activities. For future research, it is suggested to investigate the tools to assess the social dimensions in the economic growth processes. Acknowledgements This work is funded by National Funds through the FCT—Foundation for Science and Technology, I.P., within the scope of the project Refa UIDB/00681/2020. Furthermore, we would like to thank the CERNAS Research Centre and the Polytechnic Institute of Viseu for their support. This work is also co-financed by the PRR—Plano de Recuperação e Resiliência (República Portuguesa) and the European NextGeneration EU Funds (recuperarportugal.gov.pt) through application PRR-C05-i03-I-000030—“Carbo2Soil—Reforçar a Complementaridade entre agricultura e pecuária para aumentar a fertilidade dos solos e a sua capacidade de sequestro de carbono”.
104
7 Sustainable Development: Contributions from Life Cycle Cost Analysis
References 1. D. Costa, P. Quinteiro, A.C. Dias, A systematic review of life cycle sustainability assessment: current state, methodological challenges, and implementation issues. Sci. Total Environ. 686, 774 (2019) 2. T. Ahmad, M.J. Thaheem, Economic sustainability assessment of residential buildings: a dedicated assessment framework and implications for BIM. Sustain. Cities Soc. 38, 476 (2018) 3. A.I. De Luca, N. Iofrida, P. Leskinen, T. Stillitano, G. Falcone, A. Strano, G. Gulisano, Life cycle tools combined with multi-criteria and participatory methods for agricultural sustainability: insights from a systematic and critical review. Sci. Total Environ. 595, 352 (2017) 4. M. Degieter, X. Gellynck, S. Goyal, D. Ott, H. De Steur, Life cycle cost analysis of agri-food products: a systematic review. Sci. Total Environ. 850, 158012 (2022) 5. W.S. Alaloul, M. Altaf, M.A. Musarat, M.F. Javed, A. Mosavi, Systematic review of life cycle assessment and life cycle cost analysis for pavement and a case study. Sustainability 13(8), 4377 (2021) 6. M. Ershadi, F. Goodarzi, Core capabilities for achieving sustainable construction project management. Sustain. Prod. Consum. 28, 1396 (2021) 7. J.V. Neto, J.R. De Farias Filho, Sustainability in the civil construction industry: an exploratory study of life cycle analysis methods. Int. J. Environ. Technol. Manage. 16, 420 (2013) 8. M. Furness, R. Bello-Mendoza, J. Dassonvalle, R. Chamy-Maggi, Building the ‘bio-factory’: a bibliometric analysis of circular economies and life cycle sustainability assessment in wastewater treatment. J. Clean. Prod. 323, 129127 (2021) 9. S. Geng, Y. Wang, J. Zuo, Z. Zhou, H. Du, G. Mao, Building life cycle assessment research: a review by bibliometric analysis. Renew. Sustain. Energy Rev. 76, 176 (2017) 10. Z.M. Konaré, D.D. Ajayi, S. Ba, A.K. Aremu, Application of life cycle sustainability assessment (LCSA) in the gold mining sector: a systematic review. Int. J. Life Cycle Assess. 28, 684–703 (2023) https://doi.org/10.1007/s11367-023-02160-2 11. K.M.A. Salim, R. Maelah, H. Hishamuddin, A.M. Amir, M.N. Ab Rahman, Two decades of life cycle sustainability assessment of solid oxide fuel cells (SOFCs): a review. Sustainability 14(19), 12380 (2022) 12. T.P. Scolaro, E. Ghisi, Life cycle assessment of green roofs: a literature review of layers materials and purposes. Sci. Total Environ. 829, 154650 (2022) 13. V.J.P.D. Martinho, Agri-food contexts in Mediterranean Regions: contributions to better resources management. Sustainability 13, 12 (2021) 14. V.J.P.D. Martinho, Bibliographic coupling links: alternative approaches to carrying out systematic reviews about renewable and sustainable energy. Environments 9, 2 (2022) 15. Scopus, Scopus database, https://www.scopus.com/search/form.uri?display=basic#basic 16. N.J. van Eck, L. Waltman, Software survey: VOSviewer, a computer program for bibliometric mapping. Scientometrics 84, 523 (2010) 17. N.J. van Eck, L. Waltman, Manual for VOSviewer version 1.6.19 (2023) https://www.vosvie wer.com/documentation/Manual_VOSviewer_1.6.19.pdf 18. VOSviewer, VOSviewer—visualizing scientific landscapes, https://www.vosviewer.com// 19. D. Moher, A. Liberati, J. Tetzlaff, D.G. Altman, Preferred reporting items for systematic reviews and meta-analyses: the PRISMA statement. BMJ 339, b2535 (2009) 20. V.J.P.D. Martinho, Agricultural Policy: A Driver for Structural and Technological Change (Springer International Publishing, Cham, 2022) 21. A.X. Naves, C. Barreneche, A.I. Fernández, L.F. Cabeza, A.N. Haddad, D. Boer, Life cycle costing as a bottom line for the life cycle sustainability assessment in the solar energy sector: a review. Sol. Energy 192, 238 (2019) 22. R.T. Fauzi, P. Lavoie, L. Sorelli, M.D. Heidari, B. Amor, Exploring the current challenges and opportunities of life cycle sustainability assessment. Sustainability 11, 3 (2019) 23. J.H. Miah, S.C.L. Koh, D. Stone, A hybridised framework combining integrated methods for environmental life cycle assessment and life cycle costing. J. Clean. Prod. 168, 846 (2017)
References
105
24. S. Neugebauer, J. Martinez-Blanco, R. Scheumann, M. Finkbeiner, Enhancing the practical implementation of life cycle sustainability assessment—proposal of a tiered approach. J. Clean. Prod. 102, 165 (2015) 25. R. Hoogmartens, S. Van Passel, K. Van Acker, M. Dubois, Bridging the gap between LCA, LCC and CBA as sustainability assessment tools. Environ. Impact Assess. Rev. 48, 27 (2014) 26. M.-M. Hu, C.-B. Zhang, L. Dong, P.-C. Xiang, Q. Zhang, Economical pillar of sustainability assessment on resource circulation-development and application of life cycle costing approach. Zhongguo Huanjing Kexue/China Environ Sci 38, 4788 (2018) 27. M. Zimek, A. Schober, C. Mair, R.J. Baumgartner, T. Stern, M. Füllsack, The third wave of LCA as the “decade of consolidation.” Sustainability 11, 12 (2019) 28. A.I. De Luca, G. Falcone, T. Stillitano, N. Iofrida, A. Strano, G. Gulisano, Evaluation of sustainable innovations in olive growing systems: a life cycle sustainability assessment case study in southern Italy. J. Clean. Prod. 171, 1187 (2018)
Chapter 8
Social Life Cycle Assessment: Relationships with the Economic Growth
Abstract The social impacts of the economic growth processes are often underestimated, sometimes because of the difficulties in effectively assessing these implications and other times due to a scale of priorities where the economic dimensions appear with special relevance. The social life cycle assessment appears as an approach to highlight the impacts of the life cycle of the products on the social human conditions. Another question is about the various interrelationships between the social life cycle assessment and economic growth. It seems interesting to investigate how the social life cycle assessment influences economic growth and how the economic trends deal with these social analyses. In this way, this chapter investigates the several interrelationships among the social life cycle assessment and the economic growth highlighted by the scientific literature. From this perspective, several scientific documents were considered for these subjects. These documents were first explored through bibliometric analysis and after considering a literature survey for the top documents. This chapter highlights how the social life cycle assessment may contribute to a more sustainable economic development. Keywords Bibliographic data · Life cycle costs analysis · VOSviewer · Systematic review
8.1 Introduction The social dimensions are one of the areas of sustainability that have been gaining relevance in scientific research related to sustainable development. An example of this importance is the increasing consideration in the literature of tools such as social life cycle assessment. This approach supports stakeholders in assessments related to the social impacts of products throughout their life cycle [1]. In the construction sector, for example, generally, the focus of the social life cycle assessment is on the production stage [2], ignoring other phases of the supply chain from the extraction of raw materials to the end of life of products, where the social impacts are also real and need to be taken into account. © The Author(s), under exclusive license to Springer Nature Switzerland AG 2023 V. J. P. D. Martinho, Economic Growth: Advances in Analysis Methodologies and Technologies, SpringerBriefs in Applied Sciences and Technology, https://doi.org/10.1007/978-3-031-38363-2_8
107
108
8 Social Life Cycle Assessment: Relationships with the Economic Growth
The social life cycle assessment is part of the life cycle sustainability analysis. These approaches need standardisation, identification of boundaries, construction of adjusted databases, development of categories to better compare studies and improve the assessment methodologies [3]. Specifically, the social life cycle assessment is a tool under development and can be considered at different levels (products, economic sectors, regions and countries) [4]. This methodology appears among the topics associated with sustainable processes, value creation and competitive advantage [5]. Four phases may be identified for this approach, particularly the following: beginning; uncertainty; development; and search for harmonisation [6]. The literature highlights the consideration of the social life cycle assessment concepts and guidelines in studies that include the following fields: production of feedstocks for biodiesel in Brazil [7]; food supply chain [8]; and circular economy [9, 10]; industry 4.0 [11]; building sector [12, 13]; municipal solid waste [14]. In summary, the social life cycle analysis may provide interesting insights for the sustainability assessments, where the new technologies associated with the digital transition may bring relevant added value. Nonetheless, more studies are needed to develop more databases and categories and improve the standardisation of the methodologies applied. In this scenario, this research proposes to bring more contributions from the literature about the relationships among the economic dimensions and the social life cycle assessment. To achieve these objectives, 347 documents were taken into account from the Scopus [15] database, on a search carried out on 17 May 2023, for the following topics: “economic”; and “social life cycle”. These studies were assessed through bibliometric analysis (following, for example, the research of Martinho [16]) and systematic review [17]. For the bibliometric analysis, the procedures proposed by the VOSviewer software were considered [18–20].
8.2 Co-occurrence, Bibliographic Coupling and Co-citation Links Analysis In general, the social life cycle assessment as a tool to analyse and promote sustainable economic growth is interrelated with the other tools for the life cycle sustainability assessment, and this is visible in the metrics presented for the top keywords in Fig. 8.1 and Table 8.1. The top 10 keywords appear in documents published between 2017 and 2019. The keyword “life cycle” is the one with the highest total link strength and seems that with the biggest number of occurrences. Germany, Italy, the USA, Spain, Brazil, France, Netherlands, China, Canada and Hong Kong are the top 10 countries with the highest total link strength (Table 8.2). These countries exhibit also important values for the number of documents and citations (Fig. 8.2 and Table 8.2). The average publication year for the documents published by the authors of these countries ranges between 2017 and 2020.
8.2 Co-occurrence, Bibliographic Coupling and Co-citation Links Analysis
109
Fig. 8.1 Co-occurrence links and all keywords items for the topics: “economic”; and “social life cycle”
The top 10 organisations with the highest relatedness with other organisations are presented in Table 8.3 and between them are, for example, the following: Centre for Environmental and Marine Studies (CESAM), Department of Environment and Planning, University of Aveiro; European Commission-Joint Research Centre, Institute for Environment and Sustainability—Sustainability Assessment Unit; BWI Center for Industrial Management, Department of Management, Technology, Economics, Eth Zurich; Civil and Environmental Engineering, University of California, Berkeley; and Environmental and Ecological Engineering, Purdue University. Some of these organisations have also a relevant number of documents (Fig. 8.3 and Table 8.3). The top 10 cited authors (with the highest total link strength) are those exhibited in Table 8.4, and the top 10 documents are presented in Table 8.5. Figure 8.4 shows the cited authors for co-citation links. In this figure, the dimension of the circle and labels represents the number of citations and the proximity symbolises the relatedness (number of times they were cited together). Figure 8.5 and Table 8.6 present some metrics for co-citation links and cited sources items. The cited sources with the biggest values for the total link strength are, namely the International Journal of Life Cycle Assessment and the Journal of Cleaner Production in the different versions for their designations.
110
8 Social Life Cycle Assessment: Relationships with the Economic Growth
Table 8.1 Co-occurrence links and top 10 all keywords items, with the greatest total link strength, for the topics: “economic”; and “social life cycle” All keywords
Total link strength
Occurrences
Average publication year
Average citations
Life cycle
2960
187
2019
23
Life cycle assessment
2404
129
2018
45
Sustainable development
2373
149
2019
29
Social life cycle 2153 assessment
144
2019
25
Social life
2080
120
2019
23
Economic and social effects
1748
115
2019
23
Sustainability
1649
98
2019
37
Life cycle analysis
1602
76
2019
24
Article
1535
65
2018
43
Environmental impact
1271
67
2017
39
Table 8.2 Bibliographic coupling links and top 10 countries items, with the greatest total link strength, for the topics: “economic”; and “social life cycle” Countries
Total link strength
Documents
Citations
Average publication year
Germany
21,013
58
2981
2017
Italy
20,025
54
1311
2019
USA
13,620
39
1419
2018
Spain
12,516
38
800
2020
Brazil
11,150
23
791
2019
France
9868
19
993
2018
Netherlands
8399
15
325
2018
China
7742
18
422
2019
Canada
7551
17
606
2018
Hong Kong
6523
10
179
2019
8.2 Co-occurrence, Bibliographic Coupling and Co-citation Links Analysis
111
Fig. 8.2 Bibliographic coupling links and countries items for the topics: “economic”; and “social life cycle” Table 8.3 Bibliographic coupling links and top 10 organisations items, with the greatest total link strength, for the topics: “economic”; and “social life cycle” Organisations
Total link strength
Documents
Citations
Average publication year
Centre for Environmental and Marine Studies (CESAM), Department of Environment and Planning, University of Aveiro, Campus Universitário de Santiago, Aveiro, 3810–193, Portugal
4158
5
118
2021
CIRAD, UPR GECO, Boulevard 3939 de la Lironde, Montpellier Cedex 5, 34398, France
1
59
2018
(continued)
112
8 Social Life Cycle Assessment: Relationships with the Economic Growth
Table 8.3 (continued) Organisations
Total link strength
Documents
Citations
Average publication year
Department of Economic Studies, University «G. D’annunzio», Viale Pindaro 42, Pescara, 65127, Italy
3939
1
59
2018
European Commission-Joint Research Centre, Institute for Environment and Sustainability—Sustainability Assessment Unit, Via Enrico Fermi 2749, T.P. 270, Ispra, Va 21027, Italy
3939
1
59
2018
Irstea, UMR ITAP—ELSA, 361 Rue Jean-François Breton, Montpellier Cedex 5, 34,196, France
3939
1
59
2018
Program of Industrial Engineering (EPII), Faculty of Production and Services Engineering (FIPS), Universidad Nacional de San Agustín de Arequipa (UNSA), Av. Independencia S/N—Pabellón Nicholson, Arequipa, Arequipa, Peru
3925
1
66
2020
Sustainable Production Systems 3925 Laboratory (LESP), Postgraduate Program of Production Engineering (PPGEP), Department of Production Engineering (DAENP), Universidade Tecnológica Federal Do Paraná (UTFPR), Av. Monteiro Lobato S/N, Km. 04, Ponta Grossa, Paraná, Brazil
1
66
2020
BWI Center for Industrial Management, Department of Management, Technology, Economics, Eth Zurich, Switzerland
3911
1
106
2016
Civil and Environmental Engineering, University of California, Berkeley, Ca, USA
3911
1
106
2016
Environmental and Ecological Engineering, Purdue University, West Lafayette, In, USA
3911
1
106
2016
8.2 Co-occurrence, Bibliographic Coupling and Co-citation Links Analysis
113
Fig. 8.3 Bibliographic coupling links and organisations items for the topics: “economic”; and “social life cycle” Table 8.4 Co-citation links and top 10 cited authors items, with the greatest total link strength, for the topics: “economic”; and “social life cycle” Cited authors
Total link strength
Citations
Traverso, M.
50,606
404
Finkbeiner, M.
49,628
390
Ciroth, A.
39,321
357
Hauschild, M.Z.
28,329
244
Jørgensen, A.
27,360
255
Lehmann, A.
25,306
202
Zamagni, A.
25,050
196
Heijungs, R.
21,824
185
Macombe, C.
21,040
152
Valdivia, S.
20,352
180
Table 8.5 Bibliographic coupling links and top 10 documents items, with the greatest total link strength, for the topics: “economic”; and “social life cycle” Documents
URL
Total link strength Citations
Ramos Huarachi [6]
https://doi.org/10.1016/j.jclepro.2020. 121506
1725
66
Di Cesare [4]
https://doi.org/10.1007/s11367-016-1169-7
1554
59
Tsalis [21]
https://doi.org/10.1016/j.jclepro.2017.07.003 1378
Sutherland [22]
https://doi.org/10.1016/j.cirp.2016.05.003
1115
106
Hossain [23]
https://doi.org/10.1007/s11367-017-1373-0
1113
54
Subramanian [24]
https://doi.org/10.1016/j.jclepro.2017.10.006 1113
Chhipi-shrestha [25]
https://doi.org/10.1007/s10098-014-0841-5
979
104
Dubois-iorgulescu [26] https://doi.org/10.1007/s11367-016-1181-y
30
20
975
25
Yang [27]
https://doi.org/10.1016/b978-0-12-818355-7. 922 00005-1
19
Gulisano [28]
https://doi.org/10.1016/b978-0-12-811935-8. 917 00004-4
5
114
8 Social Life Cycle Assessment: Relationships with the Economic Growth
Fig. 8.4 Co-citation links and cited authors items for the topics: “economic”; and “social life cycle”
Fig. 8.5 Co-citation links and cited sources items for the topics: “economic”; and “social life cycle”
8.4 Discussion and Conclusions
115
Table 8.6 Co-citation links and top 10 cited sources items, with the greatest total link strength, for the topics: “economic”; and “social life cycle” Cited sources
Total link strength
Citations
Int. J. Life Cycle Assess.
32,752
1036
Int J Life Cycle Assess.
24,493
896
Sustainability
21,814
516
J. Clean. Prod.
21,621
536
J Clean Prod.
14,500
322
Journal of Cleaner Production
12,270
276
International Journal of Life Cycle Assessment
12,251
241
Int. J. Life Cycle Assess
11,531
367
J. Clean. Prod.
9760
232
The International Journal of Life Cycle Assessment
6506
198
8.3 A Literature Review Based on Bibliographic Data Table 8.7 shows some insights from the literature about the relationships between the following topics: “economic”; and “social life cycle”. The top 10 documents highlight the need for a better reorganisation of definitions and indicators, more studies related to these dimensions and more adjusted support for the system boundaries. Bioeconony, manufacturing and corporate social profile of companies appear as the focus of some research associated with the social life cycle analysis. On the other hand, sustainability is more than the three indices for the environmental, economic and social dimensions. Finally, the UNEP/SETAC Guidelines are presented as relevant support for the social life cycle assessment.
8.4 Discussion and Conclusions This chapter proposes to analyse interrelationships between the economic growth and the social life cycle assessment, bringing more highlights from the scientific literature published in international databases. For that, 347 documents were surveyed through bibliometric analysis with co-occurrence, bibliographic coupling and cocitation links. These documents were obtained from the Scopus database on a search carried out on 17 May 2023 for the topics: “economic”; and “social life cycle”. In this bibliometric assessment, the procedures proposed by the VOSviewer software were followed. The social dimensions have gained importance in the scientific literature associated with the sustainability domains, with increases in the consideration by the researchers of the social life cycle assessment tools. These tools are part of the life
116
8 Social Life Cycle Assessment: Relationships with the Economic Growth
Table 8.7 Insights from a review based on bibliographic data Documents
URL
Ramos Huarachi [6]
https://doi.org/10.1016/j.jcl Bioeconomy is an important focus of the studies related to the social life cycle epro.2020.121506 assessment
Insights
Di Cesare [4]
https://doi.org/10.1007/s11 367-016-1169-7
Tsalis [21]
https://doi.org/10.1016/j.jcl Social life cycle assessment and the corporate social profile of companies epro.2017.07.003
Sutherland [22]
https://doi.org/10.1016/j. cirp.2016.05.003
Manufacturing and the social dimensions of sustainability
Hossain [23]
https://doi.org/10.1007/s11 367-017-1373-0
Life cycle methods integration, sensitivity analysis and more studies are needed
Subramanian [24]
https://doi.org/10.1016/j.jcl Sustainability is more than a sum of three indices epro.2017.10.006
Reorganization definitions and indicators
Chhipi-Shrestha [25] https://doi.org/10.1007/s10 098-014-0841-5
UNEP/SETAC Guidelines for social life cycle assessment
Dubois-Iorgulescu [26]
https://doi.org/10.1007/s11 367-016-1181-y
Better support for the system boundaries
Yang [27]
https://doi.org/10.1016/ b978-0-12-818355-7.000 05-1
Life cycle sustainability assessment dimensions
Gulisano [28]
https://doi.org/10.1016/ b978-0-12-811935-8.000 04-4
Social life cycle assessment is part of the life cycle tools
Note UNEP/SETAC, United Nations Environment Programme/Society of Environmental Toxicology and Chemistry
cycle sustainability assessment and still need standardisation, the definition of boundaries, construction of databases and development of more guidelines. The social life cycle assessment has been considered in domains related to, for example, the feedstock for biodiesel, supply chains, bioeconomy, industry, construction sector and municipal waste. The bibliometric assessment highlights that some of the relevant keywords (with the highest relatedness) are the following: life cycle; life cycle assessment; sustainable development; social life cycle assessment; social life; economic and social effects; sustainability; life cycle analysis; and environmental impact. These keywords show the interrelationships of the social life cycle assessment with the economic dynamics and sustainability. Some of the relevant countries are the following: Germany; Italy; the USA; Spain; Brazil; France; Netherlands; China; Canada; and Hong Kong. The relevant sources are namely the International Journal of Life Cycle Assessment and the Journal of Cleaner Production. The systematic literature review suggests a better definition of indicators for the social life cycle assessment, more research to support the development of these tools,
References
117
the sustainability of more than a sum of indices, and the UNEP/SETAC Guidelines have been taken into account for the assessments based on this life cycle tool. In terms of practical implications, the social life cycle assessment is under development, and more research is needed to support more standardisation and overcome some of the restrictions identified. For policy recommendations, it is suggested to promote scientific contributions based on the already designed UNEP/SETAC Guidelines. For future research, it could be important to understand the interlinkages between economic growth, sustainability and digital transition. Acknowledgements This work is funded by National Funds through the FCT—Foundation for Science and Technology, I.P., within the scope of the project Refa UIDB/00681/2020. Furthermore, we would like to thank the CERNAS Research Centre and the Polytechnic Institute of Viseu for their support. This work is also co-financed by the PRR—Plano de Recuperação e Resiliência (República Portuguesa) and the European NextGeneration EU Funds (recuperarportugal.gov.pt) through application PRR-C05-i03-I-000030—“Carbo2Soil—Reforçar a Complementaridade entre agricultura e pecuária para aumentar a fertilidade dos solos e a sua capacidade de sequestro de carbono”.
References 1. S. Sala, A. Vasta, L. Mancini, J. Dewulf, E. Rosenbaum, Social Life Cycle Assessment: State of the Art and Challenges for Supporting Product Policies. https://doi.org/10.2788/53485 2. J.G. Backes, M. Traverso, Application of life cycle sustainability assessment in the construction sector: a systematic literature review. Process 9(7), 1248 (2021) 3. D. Costa, P. Quinteiro, A.C. Dias, A systematic review of life cycle sustainability assessment: current state, methodological challenges, and implementation issues. Sci. Total Environ. 686, 774 (2019) 4. S. Di Cesare, F. Silveri, S. Sala, L. Petti, Positive impacts in social life cycle assessment: state of the art and the way forward. Int. J. Life Cycle Assess. 23, 406 (2018) 5. N. Marulanda Grisales, in Proc. Int. Bus. Inf. Manag. Assoc. Conf., IBIMA: Educ. Excell. Innov. Manag. Vis., ed. by K.S. Soliman. Sustainable Production as an Alternative for Creating Value and Competitive Advantage: Analysis of Global Research (International Business Information Management Association, IBIMA, 2019), pp. 5357–5369, https://ibima.org/accepted-paper/ sustainable-production-as-an-alternative-for-creating-value-and-competitiveadvantage- analysis-of-global-research/ 6. D.A. Ramos Huarachi, C.M. Piekarski, F.N. Puglieri, A.C. de Francisco, Past and future of social life cycle assessment: historical evolution and research trends. J. Clean. Prod. 264, 121506 (2020) 7. M.W. Costa, A.A.M. Oliveira, Social life cycle assessment of feedstocks for biodiesel production in Brazil. Renew. Sustain. Energy Rev. 159, 112166 (2022) 8. E. Desiderio, L. García-Herrero, D. Hall, A. Segrè, M. Vittuari, Social sustainability tools and indicators for the food supply chain: a systematic literature review. Sustain. Prod. Consum. 30, 527 (2022) 9. C. Mesa Alvarez, T. Ligthart, A social panorama within the life cycle thinking and the circular economy: a literature review. Int. J. Life Cycle Assess. 26, 2278 (2021) 10. T. Stillitano, E. Spada, N. Iofrida, G. Falcone, A.I. De Luca, Sustainable agri-food processes and circular economy pathways in a life cycle perspective: state of the art of applicative research. Sustainability 13, 1 (2021)
118
8 Social Life Cycle Assessment: Relationships with the Economic Growth
11. F.E. Garcia-Muiña, R. González-Sánchez, A.M. Ferrari, D. Settembre-Blundo, The paradigms of industry 4.0 and circular economy as enabling drivers for the competitiveness of businesses and territories: the case of an Italian ceramic tiles manufacturing company. Soc. Sci. 7(12), 255 (2018) 12. S. Y. Janjua, P. K. Sarker, and W. K. Biswas, A Review of Residential Buildings’ Sustainability Performance Using a Life Cycle Assessment Approach, J. Sustain. Res 1, (2019). 13. S. Liu, S. Qian, Towards sustainability-oriented decision making: model development and its validation via a comparative case study on building construction methods. Sustain. Dev. 27, 860 (2019) 14. A. Mirdar Harijani, S. Mansour, Municipal solid waste recycling network with sustainability and supply uncertainty considerations, Sustain. Cities Soc. 81, 103857 (2022) 15. Scopus, Scopus database, https://www.scopus.com/search/form.uri?display=basic#basic 16. V.J.P.D. Martinho, Impacts of the COVID-19 pandemic and the Russia-Ukraine conflict on land use across the world. Land 11, 10 (2022) 17. D. Moher, A. Liberati, J. Tetzlaff, D.G. Altman, Preferred reporting items for systematic reviews and meta-analyses: the PRISMA statement. BMJ 339, b2535 (2009) 18. N.J. van Eck, L. Waltman, Software survey: VOSviewer, a computer program for bibliometric mapping. Scientometrics 84, 523 (2010) 19. N. J. van Eck, L. Waltman, Manual for VOSviewer version 1.6.19 (2023), https://www.vosvie wer.com/documentation/Manual_VOSviewer_1.6.19.pdf 20. VOSviewer, VOSviewer—visualizing scientific landscapes, https://www.vosviewer.com// 21. T. Tsalis, A. Avramidou, I.E. Nikolaou, A social LCA framework to assess the corporate social profile of companies: insights from a case study. J. Clean. Prod. 164, 1665 (2017) 22. J.W. Sutherland et al., The role of manufacturing in affecting the social dimension of sustainability. CIRP Ann. 65, 689 (2016) 23. Md.U. Hossain, C.S. Poon, Y.H. Dong, I.M.C. Lo, J.C.P. Cheng, Development of social sustainability assessment method and a comparative case study on assessing recycled construction materials. Int. J. Life Cycle Assess. 23, 1654 (2018) 24. K. Subramanian, C.K. Chau, W.K.C. Yung, Relevance and feasibility of the existing social LCA methods and case studies from a decision-making perspective. J. Clean. Prod. 171, 690 (2018) 25. G.K. Chhipi-Shrestha, K. Hewage, R. Sadiq, ‘Socializing’ sustainability: a critical review on current development status of social life cycle impact assessment method. Clean Tech. Environ. Policy 17, 579 (2015) 26. A.-M. Dubois-Iorgulescu, A.K.E.B. Saraiva, R. Valle, L.M. Rodrigues, How to define the system in social life cycle assessments? A critical review of the state of the art and identification of needed developments. Int. J. Life Cycle Assess. 23, 507 (2018) 27. S. Yang, K. Ma, Z. Liu, J. Ren, Y. Man, in Life Cycle Sustainability Assessment for DecisionMaking, ed. by J. Ren, S. Toniolo. Chapter 5—Development and Applicability of Life Cycle Impact Assessment Methodologies (Elsevier, 2020), pp. 95–124 28. G. Gulisano, A. Strano, A.I. De Luca, G. Falcone, N. Iofrida, T. Stillitano, in Sustainable Food Systems from Agriculture to Industry, ed. by C.M. Galanakis. 4—Evaluating the Environmental, Economic, and Social Sustainability of Agro-Food Systems Through Life Cycle Approaches (Academic Press, 2018), pp. 123–152
Chapter 9
Machine and Deep Learning: Their Roles in the Context of the Economic Growth Processes and Sustainability Assessment
Abstract Sustainability assessments are crucial for more balanced economic growth, and in these contexts, the new technologies, namely those associated with the digital transition, play a fundamental role. Indeed, the technologies related to the Era 4.0 are a hope for governments and international organisations, for example, to deal with the need of promoting economic growth and, at the same time, reduce the carbon footprint. Nonetheless, these digital approaches require expertise and, sometimes, the stakeholders are not prepared to use these new methodologies, or the infrastructures available are not adjusted to the new requirements. In this framework, this study proposes to analyse the contributions of machine and deep learning for economic growth and sustainability assessments. For that, bibliometric analysis and systematic review were carried out, considering documents related to topics associated with the issues here addressed. The insights obtained highlight the potentialities of the machine and deep learning methodologies for sustainability assessments and economic growth. Keywords Agriculture 4.0 · Life cycle cost analysis · Bibliometric analysis · Literature insights
9.1 Introduction The new technologies from the Era 4.0 may bring interesting contributions to the interlinkages between sustainability and economic growth, specifically improving the efficiency in the use of resources, with added value for economic profitability and carbon footprint mitigation [1]. Of course, there are also weaknesses and threats related to the digital technologies implementation, particularly those associated with the availability of infrastructures and the needed skills of the stakeholders. In any case, there is a way to run with interesting perspectives. Machine learning technologies appear, in some cases, as support for methodologies of assessment of the economic growth performance and the respective variables
© The Author(s), under exclusive license to Springer Nature Switzerland AG 2023 V. J. P. D. Martinho, Economic Growth: Advances in Analysis Methodologies and Technologies, SpringerBriefs in Applied Sciences and Technology, https://doi.org/10.1007/978-3-031-38363-2_9
119
120
9 Machine and Deep Learning: Their Roles in the Context …
that may influence the associated dynamics [2]. These approaches are also considered for predictive analysis. These machine learning methodologies were taken into account, for example, to assess relationships among renewable energies and environmental pollution indicators, for the BRICS, G7 and European Union (EU) countries [3]. Another application of the machine learning tools was in the literature review about the circular economy, green economy and bioeconomy [4]. These digital technologies have been taken into account in the following subjects: causes of environmental sustainability [5]; smart cities (may contribute to make compatible economic growth, adjusted transports, sustainability and adjusted planning for the cities) [6]; energy use, economic performance and environmental impacts [7]; relations among human capital and green growth [8]; impacts of industry 4.0 on environmental, social and governance investment in the energy sector [9]; forecasting the acceptance of reopening a nuclear power plant [10]; precision agriculture [11]; hybrid desalination [12]; and interlinkages among total natural resources, economic growth, human capital and cities changes with carbon footprint [13]. Artificial intelligence opens, indeed, new perspectives for the economic sectors’ performance, with relevant potentialities to improve the transparency in the chains, traceability and sustainability, including in the autonomous vehicles supply circuits [14]. These technologies may support analysis with multi-sector and multi-actor to identify efficient policy designs [15]. Considering these frameworks, this chapter aims to bring more insights into the machine learning contributions to the relationships among economic growth and sustainability, considering bibliometric analysis and literature survey based on the metrics from bibliographic data, considering the PRISMA approach [16]. The documents taken into account were obtained from Scopus [17] database, on a search carried out on 17 May 2023. From this search, 38 documents were identified for the following topics: “economic growth”; and “sustainability”; and “machine learning”. To identify the top items, the total link strength metric was considered [18], and for the bibliometric assessment, the procedures proposed by the VOSviewer software were followed [19–21].
9.2 Keywords, Countries, Organisations, Cited Authors, Documents and Cited Sources as Items Figure 9.1 presents the number of occurrences (dimension of the circles and labels) for the keywords identified and the relatedness (proximity) among the items. Table 9.1 exhibits the total link strength, number of occurrences, average publication year and average citations. The keywords with the highest total link strength are closely related to the topics analysed: economic growth; sustainability; and machine learning. The countries with the greatest total link strength are the following (Table 9.2): UK; China; France; Saudi Arabia; Australia; Tunisia; Pakistan; Ecuador; Taiwan; and Italy. Some of these countries have also a relevant number of documents and
9.2 Keywords, Countries, Organisations, Cited Authors, Documents …
121
Fig. 9.1 Bibliographic data, co-occurrence links and all keywords as items, for the following topics: “economic growth”; and “sustainability”; and “machine learning”
citations. The average publication year for the documents published by the authors affiliated with these countries ranges among 2021 and 2022. Figure 9.2 highlights the number of documents (dimensions of the circles and labels) for each item and the respective relatedness. The top 10 organisations for the highest total link strength presented in Table 9.3 are from Italy, Romania, Saudi Arabia and Tunisia. Figure 9.3 shows the number of documents for each organisation and the relatedness (proximity). Some of these top 10 organisations have also an important number of citations. Figure 9.4 and Table 9.4 exhibit the main metrics for the cited authors and cocitation links for the topics: “economic growth”; and “sustainability”; and “machine learning”. The relatedness of the co-citation links is associated with the number of times the items (authors in this case) are cited together. For the bibliographic coupling links, the relatedness is related to the number of references the respective items share, and for the co-occurrence links, the relatedness is based on the number of documents where the items appear together. Table 9.5 presents the top 10 documents.
122
9 Machine and Deep Learning: Their Roles in the Context …
Table 9.1 Bibliographic data, co-occurrence links and top 10 all keywords as items (considering the metrics total link strength), for the following topics: “economic growth”; and “sustainability”; and “machine learning” All keywords
Total link strength
Occurrences
Average publication year
Average citations
Machine learning
517
25
2021
41
Economics
347
17
2021
52
Sustainable development
331
17
2021
46
Economic growth
299
14
2021
14
Economic growths
273
13
2021
19
Sustainability
232
12
2021
49
Economic and social effects
186
8
2022
15
Economic development
186
6
2022
25
Article
159
5
2022
26
Learning systems
126
6
2021
91
Table 9.2 Bibliographic data, bibliographic coupling links and top 10 countries as items (considering the metrics total link strength), for the following topics: “economic growth”; and “sustainability”; and “machine learning” Countries
Total link strength
Documents
Citations
Average publication year
UK
1350
7
534
2021
China
913
7
61
2021
France
857
4
73
2022
Saudi Arabia
723
4
33
2022
Australia
688
3
2
2022
Tunisia
397
2
5
2022
Pakistan
379
2
27
2021
Ecuador
378
1
21
2022
Taiwan
373
2
47
2021
Italy
343
3
285
2021
9.2 Keywords, Countries, Organisations, Cited Authors, Documents …
123
Fig. 9.2 Bibliographic data, bibliographic coupling links and countries as items, for the following topics: “economic growth”; and “sustainability”; and “machine learning”
The cited sources presented in Fig. 9.5 and Table 9.6 are related to cleaner production (Journal of Cleaner Production), sustainability, computers and electronics, bioresources, environment, water, energy and sensors. Directly associated with energy appear three journals among those with the highest total link strength.
124
9 Machine and Deep Learning: Their Roles in the Context …
Table 9.3 Bibliographic data, bibliographic coupling links and top 10 organisations as items (considering the metrics total link strength), for the following topics: “economic growth”; and “sustainability”; and “machine learning” Organisations
Total link strength
Documents
Citations
Average publication year
Roma Tre University, Italy
722
2
232
2021
University of Teramo, Italy
722
2
232
2021
Department of Administrative Sciences and Regional Studies, Faculty of Juridical, Social and Political Sciences, Dunarea De Jos University, Galati, Romania
615
1
0
2022
Department of Automatic Control and Electrical Engineering, Faculty of Automatic Control and System Engineering, “Dunarea De Jos” University of Galati, Galati, Romania
615
1
0
2022
Department of Business Administration, Faculty of Economics and Business Administration, “Dunarea De Jos” University of Galati, Galati, Romania
615
1
0
2022
Department of 615 Computers and Information Technologies, Faculty of Automatic Control and System Engineering, “Dun˘area De Jos” University of Galati, Galati, Romania
1
0
2022
(continued)
9.2 Keywords, Countries, Organisations, Cited Authors, Documents …
125
Table 9.3 (continued) Organisations
Total link strength
Documents
Citations
Average publication year
Department of Finance, 615 Accounting and Economic Theory, Faculty of Economic Sciences and Business Administration, Transylvania University, Brasov, Romania
1
0
2022
Department of Food Science, Food Engineering, Biotechnology and Aquaculture, Faculty of Food Science and Engineering, “Dunarea De Jos” University of Galati, Galati, Romania
615
1
0
2022
Department of Business Administration, College of Business and Economics, Qassim University, P.O. Box 6640, Buraydah, 51452, Saudi Arabia
612
1
1
2022
Department of Economics, Faculty of Economics and Management of Nabeul, University of Carthage, Tunisia
612
1
1
2022
Fig. 9.3 Bibliographic data, bibliographic coupling links and organisations as items, for the following topics: “economic growth”; and “sustainability”; and “machine learning”
126
9 Machine and Deep Learning: Their Roles in the Context …
Fig. 9.4 Bibliographic data, co-citation links and cited authors as items, for the following topics: “economic growth”; and “sustainability”; and “machine learning” Table 9.4 Bibliographic data, co-citation links and top 10 cited authors as items (considering the metrics total link strength), for the following topics: “economic growth”; and “sustainability”; and “machine learning” Cited authors
Total link strength
Citations
Zhang, J
6637
25
Liu, Y
6311
18
Zhang, Y
5025
16
Wang, X
4749
9
Li, H
4719
10
Wu, J
4535
7
Liu, H
4496
5
Long, F
4424
4
Phuntsho, S
4424
4
Li, J
3831
12
Table 9.5 Bibliographic data, bibliographic coupling links and top 10 documents as items (considering the metrics total link strength), for the following topics: “economic growth”; and “sustainability”; and “machine learning” Documents
URL
Total link strength
Citations
Magazzino [22]
https://doi.org/10.1016/j.renene.2020. 11.050
22
166
Kahia [7]
https://doi.org/10.1016/j.resourpol.2022. 103104
18
1
Magazzino [23]
https://doi.org/10.1016/j.scitotenv.2020. 142510
17
66
Zhou [13]
https://doi.org/10.1016/j.resourpol.2022. 102782
12
21
Cristea [3]
https://doi.org/10.3389/fenvs.2022.100 5806
7
0
Adedoyin [2]
https://doi.org/10.1016/j.techfore.2022. 122044
6
0 (continued)
9.2 Keywords, Countries, Organisations, Cited Authors, Documents …
127
Table 9.5 (continued) Documents
URL
Magazzino [24]
https://doi.org/10.1016/j.jenvman.2021. 112241
Total link strength 6
Citations 53
Wu [25]
https://doi.org/10.1016/j.cam.2019. 112660
6
32
Warsame [26]
https://doi.org/10.1016/j.jclepro.2023. 136856
5
0
Jabeur [5]
https://doi.org/10.1007/s10666-021-098 07-0
5
4
Fig. 9.5 Bibliographic data, co-citation links and cited sources as items, for the following topics: “economic growth”; and “sustainability”; and “machine learning” Table 9.6 Bibliographic data, co-citation links and top 10 cited sources as items (considering the metrics total link strength), for the following topics: “economic growth”; and “sustainability”; and “machine learning” Cited sources
Total link strength
Citations
J. Clean. Prod.
9302
58
Sustainability
6722
66
Comput. Electron. Agricult.
5112
36
Bioresour. Technol.
4848
16
Sci. Total Environ.
4828
37
Water Res.
3388
11
Energy
3358
38
Renew. Sustain. Energy Rev.
3313
26
Renew. Energy
2719
30
Sensors
2603
12
128
9 Machine and Deep Learning: Their Roles in the Context …
9.3 Literature Review Based on Bibliometric Information The new technologies associated with the digital transition have several applications in the different dimensions of sustainability. This is highlighted in Table 9.7, where the following domains were assessed through machine learning methodologies: energy use, economic dynamics, greenhouse gas emissions and environmental quality; municipal waste and social conditions; urbanisation and footprint; patents and economic performance; carbon emissions prediction; and globalisation and sustainable development.
Table 9.7 Highlights from the literature about “economic growth”; and “sustainability”; and “machine learning” Documents
URL
Highlights
Magazzino [22]
https://doi.org/10.1016/j.renene. 2020.11.050
Energy consumption, economic growth and carbon emissions
Kahia [7]
https://doi.org/10.1016/j.resourpol. 2022.103104
Relations among energy use, economic growth and environmental quality with machine learning
Magazzino [23]
https://doi.org/10.1016/j.scitotenv. 2020.142510
Municipal solid waste, wealth and emissions of the waste sector
Zhou [13]
https://doi.org/10.1016/j.resourpol. 2022.102782
Natural resources, economic growth, urbanisation and ecological footprint
Cristea [3]
https://doi.org/10.3389/fenvs.2022. 1005806
Machine learning and prediction approaches to identify relationships between renewable energy and environmental pollution
Adedoyin [2]
https://doi.org/10.1016/j.techfore. 2022.122044
patent intensity has relevant impacts on the South Africa economic growth
Magazzino [24]
https://doi.org/10.1016/j.jenvman. 2021.112241
Linkages among pandemic deaths, air pollution and economic growth with deep and machine learning
Wu [25]
https://doi.org/10.1016/j.cam.2019. 112660
Financial framework and economic growth
Warsame [26]
https://doi.org/10.1016/j.jclepro. 2023.136856
Conflicts, development, and globalisation on environmental quality
Jabeur [5]
https://doi.org/10.1007/s10666-021- Machine learning approaches to predict the tendencies of carbon 09807-0 emissions
9.4 Discussion and Conclusions
129
9.4 Discussion and Conclusions This research intends to assess the contributions of machine learning to sustainability and economic growth, considering insights from the literature. To achieve these objectives, a bibliometric analysis was carried out that was considered to support an oriented literature survey. For that, a search was performed on 17 May 2023 in the Scopus database for the topics: “economic growth”; and “sustainability”; and “machine learning”. For the bibliometric assessment, the VOSviewer procedures were followed, and the following items were taken into account for different links: all keywords; countries; organisations; cited authors; documents; and cited sources. The digital transition may contribute to improve the efficiency in the use of scarce resources, such as water, energy and soil, bringing interesting contributions to the relationships between economic growth and sustainability. This is important, because may mitigate the environmental impacts and increase the income of the economic operators in the different sectors. The lack of digital skills among the stakeholders and the absence of adjusted infrastructures are serious constraints that limit the implementation of the new technologies in some circumstances. In any case, these digital approaches are used as predictive methodologies and to promote sustainability in the supply chains. Considering co-occurrence links, the bibliometric analysis highlights as relevant (with the biggest values for the total link strength) keywords related to the topics here addressed (economic growth, sustainability and machine learning). UK, China, France, Saudi Arabia, Australia, Tunisia, Pakistan, Ecuador, Taiwan and Italy are the countries with greater relatedness. The most relevant cited sources are the following: J. Clean. Prod.; Sustainability; Comput. Electron. Agricult.; Bioresour. Technol.; Sci. Total Environ.; Water Res.; Energy; Renew. Sustain. Energy Rev.; Renew. Energy; and Sensors. It seems that sources focused on the specific dimensions of sustainability are missing here, as well as more sources associated with artificial intelligence. The literature survey based on the bibliometric assessment shows the importance of the digital transition for economic growth and sustainability. On the other hand, this oriented review of the literature reveals that machine learning techniques, for instance, have been taken into account for assessments in diverse contexts of society and science, since municipal waste management, until globalisation and sustainable development. In terms of practical implications, the findings obtained with this research highlight the importance of the new technologies for economic growth more sustainable. On the other hand, it could be relevant to promote the use of these methodologies in other fields of society and science. This narrow perspective of the use of machine learning in the analyses of the interrelationships between economic growth and sustainability is visible in the focus of the most relevant cited sources identified. For future research, it is suggested to analyse the interlinkages among economic growth, assessments and artificial intelligence.
130
9 Machine and Deep Learning: Their Roles in the Context …
Acknowledgements This work is funded by National Funds through the FCT—Foundation for Science and Technology, I.P., within the scope of the project Refa UIDB/00681/2020. This research is also funded by the Enovo company. This study was carried out under the international project “Agriculture 4.0: Current reality, potentialities and policy proposals” (CERNAS-IPV/2022/008). Furthermore, we would like to thank the CERNAS Research Centre and the Polytechnic Institute of Viseu for their support. This work is too co-financed by the PRR—Plano de Recuperação e Resiliência (República Portuguesa) and the European NextGeneration EU Funds (recuperarportugal.gov.pt) through application PRR-C05-i03-I-000030—“Carbo2Soil—Reforçar a Complementaridade entre agricultura e pecuária para aumentar a fertilidade dos solos e a sua capacidade de sequestro de carbono”.
References 1. V.J.P.D. Martinho, C.A.S. Cunha, M.L. Pato, P.J.L. Costa, M.C. Sánchez-Carreira, N. Georgantzís, R.N. Rodrigues, F. Coronado, Machine learning and food security: insights for agricultural spatial planning in the context of agriculture 4.0. Appl. Sci. 12, 22 (2022) 2. F.F. Adedoyin, N. Mavengere, A. Mutanga, A simulation experiment on ICT and patent intensity in South Africa: an application of the novel dynamic ARDL machine learning model. Technol. Forecast. Soc. Change 185, 122044 (2022) 3. D.S. Cristea, C.G. Zamfir, I.A. Simionov, C. Fortea, R.V. Ionescu, M.L. Zlati, V.M. Antohi, D. Munteanu, S.M. Petrea, Renewable energy strategy analysis in relation to environmental pollution for BRICS, G7, and EU countries by using a machine learning framework and panel data analysis. Front. Environ. Sci. 10 (2022) 4. D. D’Amato, N. Droste, B. Allen, M. Kettunen, K. Lähtinen, J. Korhonen, P. Leskinen, B.D. Matthies, A. Toppinen, Green, circular, bio economy: a comparative analysis of sustainability avenues. J. Clean. Prod. 168, 716 (2017) 5. S.B. Jabeur, H. Ballouk, W.B. Arfi, R. Khalfaoui, Machine learning-based modeling of the environmental degradation, institutional quality, and economic growth. Environ. Model. Assess. 27, 953 (2022) 6. A. Jain, I.H. Gue, P. Jain, Research trends, themes, and insights on artificial neural networks for smart cities towards SDG-11. J. Cleaner Prod. 412, 137300 (2023) 7. M. Kahia, T. Moulahi, S. Mahfoudhi, S. Boubaker, A. Omri, A machine learning process for examining the linkage among disaggregated energy consumption, economic growth, and environmental degradation. Resour. Policy 79, 103104 (2022) 8. X. Liu, F. Cao, S. Fan, Does human capital matter for China’s green growth?—Examination based on econometric model and machine learning methods. Int. J. Environ. Res. Public Health 19, 11347 (2022) 9. T. Nitlarp, S. Kiattisin, The impact factors of industry 4.0 on ESG in the energy sector. Sustainability 14, 9198 (2022) 10. A.K.S. Ong et al, Utilization of random forest classifier and artificial neural network for predicting the acceptance of reopening decommissioned nuclear power plant. Ann. Nucl. Energy 175, 109188 (2022) 11. A. Sharma, A. Jain, P. Gupta, V. Chowdary, Machine learning applications for precision agriculture: a comprehensive review. IEEE Access 9, 4843 (2021) 12. H.S. Son, M.S. Nawaz, S. Soukane, N. Ghaffour, Hybrid desalination technologies for sustainable water-energy nexus: innovation in integrated membrane module development. Desalin. Water Treat. 263, 1 (2022) 13. R. Zhou, K.R. Abbasi, S. Salem, A.I. Almulhim, R. Alvarado, Do natural resources, economic growth, human capital, and urbanization affect the ecological footprint? A modified dynamic ARDL and KRLS approach. Resour. Policy 78, 102782 (2022)
References
131
14. M. Arunmozhi, V.G. Venkatesh, S. Arisian, Y. Shi, V. Raja Sreedharan, Application of blockchain and smart contracts in autonomous vehicle supply chains: an experimental design. Transp. Res. Part E Logist. Transp. Rev. 165 (2022) 15. M. Basheer, V. Nechifor, A. Calzadilla, C. Ringler, D. Hulme, J.J. Harou, Balancing national economic policy outcomes for sustainable development. Nat. Commun. 13, 5041 (2022) 16. D. Moher, A. Liberati, J. Tetzlaff, D.G. Altman, Preferred reporting items for systematic reviews and meta-analyses: the PRISMA statement. BMJ 339, b2535 (2009) 17. Scopus, Scopus database, https://www.scopus.com/search/form.uri?display=basic#basic 18. V.J.P.D. Martinho, Agricultural Policy: A Driver for Structural and Technological Change (Springer International Publishing, Cham, 2022) 19. N.J. van Eck, L. Waltman, Software survey: VOSviewer, a computer program for bibliometric mapping. Scientometrics 84, 523 (2010) 20. N.J. van Eck, L. Waltman, Manual for VOSviewer version 1.6.19, (2023), https://www.vosvie wer.com/documentation/Manual_VOSviewer_1.6.19.pdf 21. VOSviewer, VOSviewer—visualizing scientific landscapes, https://www.vosviewer.com// 22. C. Magazzino, M. Mele, N. Schneider, A machine learning approach on the relationship among solar and wind energy production, coal consumption, GDP, and CO2 emissions. Renew. Energy 167, 99 (2021) 23. C. Magazzino, M. Mele, N. Schneider, S.A. Sarkodie, Waste generation, wealth and GHG emissions from the waste sector: is Denmark on the path towards circular economy? Sci. Total Environ. 755, 142510 (2021) 24. C. Magazzino, M. Mele, S.A. Sarkodie, The nexus between COVID-19 deaths, air pollution and economic growth in New York State: evidence from deep machine learning. J. Environ. Manage. 286, 112241 (2021) 25. C.-F. Wu, S.-C. Huang, T. Chang, C.-C. Chiou, H.-P. Hsueh, The nexus of financial development and economic growth across major Asian economies: evidence from bootstrap ARDL testing and machine learning approach. J. Comput. Appl. Math. 372, 112660 (2020) 26. A.A. Warsame, A.H. Abdi, A.Y. Amir, W.N.W. Azman-Saini, Towards sustainable environment in Somalia: the role of conflicts, urbanization, and globalization on environmental degradation and emissions. J. Clean. Prod. 406, 136856 (2023)
Chapter 10
Economic Growth, Sustainability Assessment and Artificial Intelligence: Combinations Among These Three Dimensions
Abstract Sustainability assessment, economic growth and artificial intelligence are related and these interrelationships will be narrower. The question here is how to combine these three dimensions to create a new approach that may be called as “Triple Eco-Digital Assessment”, which promotes more inclusive analysis, and considers the different dimensions associated with sustainability evaluation methodologies, artificial intelligence technologies and economic growth dynamics. In these frameworks, this chapter brings highlights about the several interrelationships between sustainability assessment, economic growth and new technologies and how these linkages may be combined. To achieve these objectives, the top items from the scientific literature were considered (taking into account bibliographic data and co-occurrence, bibliographic coupling and co-citation links). Additionally, the artificial intelligence approaches were considered for an assessment carried out to predict the costs of the farms from the European Union agricultural regions. The main highlights identified bring relevant insights for a more interlinked framework among economic growth, sustainability dynamics and the contexts of artificial intelligence. Keywords Digital transition · Life cycle cost analysis · Sustainable development · Bibliographic data
10.1 Introduction The different economic sectors are faced with diverse challenges in the current contexts worldwide, where the prediction of some costs may be relevant for the planning and production units’ management. This is true for the agricultural sector [1] and for other economic activities. The digital transition and the respective methodologies play a fundamental role in these costs prediction, particularly those associated with the artificial neural network methods [2]. Nonetheless, artificial intelligence also opens new concerns, including ethics and related to human rights, data management and privacy, at the social level and for the workers in the workplace [3]. © The Author(s), under exclusive license to Springer Nature Switzerland AG 2023 V. J. P. D. Martinho, Economic Growth: Advances in Analysis Methodologies and Technologies, SpringerBriefs in Applied Sciences and Technology, https://doi.org/10.1007/978-3-031-38363-2_10
133
134
10 Economic Growth, Sustainability Assessment and Artificial …
In any case, artificial intelligence has been referred to in studies related to the following domains: economic perspectives of coal-source-focused cities in conditions of low carbon strategies [4]; digital transition in the urban facilities and services [5]; urban development in contexts of cities expansion and transformation [6]; water resource planning and management [7]; consequences of social media on geopolitics and economic growth worldwide [8]; in assessment associated with the index of sustainable economic welfare in the Chinese framework [9]; automated examinations of tunnels [10]; forecasting carbon emissions and footprint [11]; river quality analysis [12]; and industry 4.0 and how the companies are involved in these new realities [13]. The interrelationships between artificial intelligence, economic growth and life cycle analysis were considered by Naveenkumar et al. [14] for the management of municipal solid waste; however, it seems that there is here a long way to run, particularly to highlight the potentialities of these interlinkages for the a more sustainable development. These gaps in the literature justify more research about the interactions among economic growth, sustainability assessment and artificial intelligence technologies and suggest that can be proposed a new approach which represents these interrelationships. This approach may be called as “Triple Eco-Digital Assessment” and may be more one contribution to alert the stakeholders to the need of putting together economic growth, sustainability and smart technologies. This may contribute to improvements in the efficiency of the processes and negative environmental impact mitigations. For that, a bibliometric analysis was considered [15, 16], as well as a focused review [17]. On a search carried out on 17 May 2023 on the Scopus [18] database, 69 documents were found for the following topics: “economic growth”; and “assess*”; and “artificial intelligence”. The top items were identified [19], and the procedures proposed by the VOSviewer [20–22] software were followed. An application of the artificial intelligence methodologies was presented at the end of this study for the European Union framework.
10.2 Metrics from the Scopus Database For the topics “economic growth”; and “assess*”; and “artificial intelligence”, Fig. 10.1 and Table 10.1 show that the assessment is important for sustainable development and decision-making. However, between the top 10 keywords (with the biggest total link strength), concepts related to the life cycle sustainability assessment are missing. These top 10 keywords have also a relevant number of occurrences and average citations. The average publication year ranges between 2017 and 2022. The USA, India, China, South Korea, Norway, United Arab Emirates, Lebanon, Australia, Portugal and Denmark are the top 10 countries with the highest total link strength and among these countries are those with an important number of documents and citations (Fig. 10.2 and Table 10.2).
10.2 Metrics from the Scopus Database
135
Fig. 10.1 Metrics for all keywords and co-occurrence links, considering the topics: “economic growth”; and “assess*”; and “artificial intelligence”
The top 10 organisations belong to countries such as Australia, Indonesia, Vietnam and Pakistan (Fig. 10.3 and Table 10.3). Some of these organisations have also a relevant number of citations. The average publication year ranges among 2019 and 2023, showing the topicality of the themes addressed. The main metrics for the most interlinked cited author, considering co-citation links (the relatedness is based on the number of times they are cited together), are presented in Fig. 10.4 and Table 10.4. The top 10 cited authors are the following: Zhang, Y.; Liu, Y.; Karimi, K.; Zhu, X.; Liu, C.; Li, W.; Fosso Wamba, S.; Wang, M.; Chen, G.; and Bhattacharya, S.S. The top 10 documents for bibliographic coupling
136
10 Economic Growth, Sustainability Assessment and Artificial …
Table 10.1 Metrics for the top 10 all keywords (taking into account the total link strength) and co-occurrence links, considering the topics: “economic growth”; and “assess*”; and “artificial intelligence” All keywords
Total link strength
Occurrences
Average publication year
Average citations
Artificial intelligence
836
46
2020
17
Economics
654
29
2019
21
Economic growths
382
20
2019
5
Risk assessment
278
13
2021
5
Sustainable development
225
9
2019
6
Decision making
220
9
2020
11
Economic analysis
188
10
2018
10
Decision support systems
184
7
2017
13
Economic growth
162
11
2022
12
Article
140
3
2019
23
Fig. 10.2 Metrics for countries and bibliographic coupling links, considering the topics: “economic growth”; and “assess*”; and “artificial intelligence”
links (the relatedness is associated with the number of references they share) are exhibited in Table 10.5. The most relevant cited sources are the following (Fig. 10.5 and Table 10.6): Bioresour. Technol.; Ieee Commun. Surveys Tuts.; International Journal of Information Management; Technological Forecasting and Social Change; J. Clean. Prod.; Journal of Business Research; Renew. Sustain. Energy Rev.; Mis Quarterly; Waste Manag.; and Ieee Access. It seems that sources related to other domains of the science are missing here, particularly those related to the sustainability assessment.
10.2 Metrics from the Scopus Database
137
Table 10.2 Metrics for top 10 countries (taking into account the total link strength) and bibliographic coupling links, considering the topics: “economic growth”; and “assess*”; and “artificial intelligence” Countries
Total link strength
USA
1682
India
1120
China
Documents
Citations
Average publication year
9
561
2020
9
108
2020
1006
13
22
2020
South Korea
934
3
4
2022
Norway
904
2
2
2023
United Arab Emirates
886
2
6
2023
Lebanon
840
1
0
2023
Australia
389
5
86
2022
Portugal
261
2
55
2019
Denmark
244
2
42
2018
Fig. 10.3 Metrics for organisations and bibliographic coupling links, considering the topics: “economic growth”; and “assess*”; and “artificial intelligence” Table 10.3 Metrics for top 10 organisations (taking into account the total link strength) and bibliographic coupling links, considering the topics: “economic growth”; and “assess*”; and “artificial intelligence” Organisations
Total link strength Documents Citations Average publication year
Australian Industrial Transformation Institute, Flinders University, Adelaide, Australia
282
1
1
2023
Australian Institute for Machine Learning, University of Adelaide, Adelaide, Australia
282
1
1
2023
Centre for Work Health and Safety, Parramatta, Nsw, Australia
282
1
1
2023
(continued)
138
10 Economic Growth, Sustainability Assessment and Artificial …
Table 10.3 (continued) Organisations
Total link strength Documents Citations Average publication year
Independent Consultant, University of Adelaide, Adelaide, Australia
282
1
1
2023
South Australian Centre for Economic Studies, University of Adelaide, Adelaide, Australia
282
1
1
2023
Bina Nusantara University, Jalan Hang Lekir I No. 6, Senayan, Indonesia
222
1
15
2019
Department for 222 Management of Science and Technology Development, Ton Duc Thang University, Ho Chi Minh City, Viet Nam
1
15
2019
Department of Economics, The Islamia University of Bahawalpur (Iub), Bahawalpur, Pakistan
222
1
15
2019
Faculty of Social Sciences and Humanities, Ton Duc Thang University, Ho Chi Minh City, Viet Nam
222
1
15
2019
School of Business, Bina Nusantara University, Jl. Kebon Jeruk Raya No. 27. Kebon Jeruk, Jakarta Barat, Indonesia
222
1
15
2019
Fig. 10.4 Metrics for cited authors and co-citation links, considering the topics: “economic growth”; and “assess*”; and “artificial intelligence”
10.2 Metrics from the Scopus Database
139
Table 10.4 Metrics for top 10 cited authors (taking into account the total link strength) and cocitation links, considering the topics: “economic growth”; and “assess*”; and “artificial intelligence” Cited authors
Total link strength
Citations
Zhang, Y.
4815
17
Liu, Y.
3540
17
Karimi, K.
3520
5
Zhu, X.
2866
5
Liu, C.
2536
7
Li, W.
2340
8
Fosso Wamba, S.
2227
11
Wang, M.
2213
6
Chen, G.
2126
4
Bhattacharya, S.S.
2118
3
Table 10.5 Metrics for documents and bibliographic coupling links, considering the topics: “economic growth”; and “assess*”; and “artificial intelligence” Documents
URL
Links
Citations
Cebulla [3]
https://doi.org/10.1007/s00146-022-01460-9
1
Alexopoulos [23]
https://doi.org/10.1109/istas52410.2021.9629125
1
0
Haseeb [24]
https://doi.org/10.2991/ijcis.d.191025.001
2
15
1
Fig. 10.5 Metrics for cited sources and co-citation links, considering the topics: “economic growth”; and “assess*”; and “artificial intelligence”
140
10 Economic Growth, Sustainability Assessment and Artificial …
Table 10.6 Metrics for top 10 cited sources (taking into account the total link strength) and cocitation links, considering the topics: “economic growth”; and “assess*”; and “artificial intelligence” Cited sources
Total link strength
Citations
Bioresour. Technol.
4253
47
Ieee Commun. Surveys Tuts.
4002
23
International Journal of Information Management
2985
26
Technological Forecasting and Social Change
2201
22
J. Clean. Prod.
1930
21
Journal of Business Research
1434
15
Renew. Sustain. Energy Rev.
1386
16
Mis Quarterly
1162
11
Waste Manag.
1161
9
Ieee Access
1035
9
10.3 Predict European Farming Costs with Machine Learning Approaches In this section, considering data from the Farm Accountancy Data Network (FADN) [25] for 2020 and following the IBM SPSS Modeler [26] software procedures for machine learning methodologies will be identified the models with better accuracy to predict farming costs (total inputs costs) in the European Union regions. As predictors, the other variables presented in this database were taken into account. In the FADN database for each region, statistical information for a representative farm is presented. The models with better accuracy (lower relative error) are those associated with the linear regressions, chi-squared automatic interaction detection (CHAID) and random forest, for example. The worse performances were found for the decision trees (Tree-AS) and support vector machine (SVM) (Table 10.7). On the other hand, the most important predictive variables are, respectively, the following (Table 10.8): farm net value added; total intermediate consumption; total labour input; depreciation; yield of wheat; cows’ milk & milk products; fertilisers; total liabilities; and subsidies on external factors. These findings show the importance of the competitiveness of the farms for the level of input costs, as well as the level of use of some inputs, such as fertilisers and labour. These contexts are also influenced by subsidies.
10.4 Discussion and Conclusions
141
Table 10.7 Results with machine learning approaches to predict total input costs in the European Union farms Model
Build Time
Correlation
Number of Fields
Relative Error
Regression
22
1.000
119
0.000
Linear
22
1.000
45
0.000
Linear-AS
22
0.998
176
0.004
CHAID
22
0.995
22
0.010
Random forest
22
0.994
176
0.013
Random trees
22
0.979
176
0.044
C&R tree
22
0.974
42
0.051
Neural net
22
0.968
167
0.063
Tree-AS
22
0.600
1
0.640
SVM
22
0.709
167
1.114
Note Regression, linear regression; linear, linear regression; Linear-AS, linear regression; CHAID, chi-squared automatic interaction detection; random forest, tree model as the base model; random trees, multiple decision trees; C&R tree, classification and regression tree; neural net, neural network; Tree-AS, decision trees; SVM, support vector machine
Table 10.8 Most important predictive variables in the machine learning models
Nodes
Importance
Subsidies on external factors (e)
0.010
Total liabilities (e)
0.010
Fertilisers (e)
0.011
Labour input (hrs)
0.015
Cows’ milk & milk products (e/farm)
0.016
Yield of wheat (q/ha)
0.020
Depreciation (e)
0.025
Total labour input (AWU)
0.026
Total intermediate consumption (e)
0.027
Farm net value added (e)
0.062
10.4 Discussion and Conclusions This research aimed to highlight the interrelationships between economic growth, sustainability assessment and artificial intelligence and show how these three dimensions may be combined. For that, 69 documents were assessed through bibliometric analysis. These documents were found on a search carried out on 17 May 2023 in the Scopus database for the topics: “economic growth”; and “assess*”; and “artificial intelligence”. For this bibliometric assessment, the procedures proposed by the VOSviewer software were followed. To highlight the importance of artificial intelligence for assessments related to sustainability and economic dimensions, some
142
10 Economic Growth, Sustainability Assessment and Artificial …
results were presented for the prediction of costs in the European Union farms (data from the FADN were considered for 2020). The artificial intelligence approaches may support the stakeholders in the different tasks related to the management and planning of the production units belonging to the diverse economic costs, including the prediction of costs in the agricultural sector. In any case, the implementation of artificial intelligence brings new challenges, specifically those associated with ethical dimensions and human rights. The literature survey highlights that the interlinkages among economic growth, sustainability assessment and artificial intelligence have not been explored enough by the scientific community. The metrics from the bibliographic data reveal that the most relevant keywords (considering the approaches here used) are the following: artificial intelligence; economics; economic growths; risk assessment; sustainable development; decision making; economic analysis; and decision support systems. Some important keywords for the topics here addressed are missing, particularly those related to the sustainability assessment. The most important countries of affiliation are the following: USA; India; China; South Korea; Norway; United Arab Emirates; Lebanon; Australia; Portugal; and Denmark. In the cited sources, again, it seems that the sustainability assessment dimensions may be deeper explored in future research. In the prediction of the total input costs for the farms of the European Union regions, the results show that the linear regressions, CHAID and random forest models are those with better accuracy. In turn, the most important predictors are the farm net value added, total intermediate consumption, total labour input, depreciation, yield of wheat, cows’ milk & milk products, fertilisers, total liabilities and subsidies on external factors. In terms of practical implications, it is suggested to create an approach, which may be designated as “Triple Eco-Digital Assessment”, to promote more research about the interlinkages among economic growth, sustainability assessment (with life cycle tools, for example) and artificial intelligence. For policy recommendation, it could be important to rethink the agricultural subsidies in the European Union based on studies related to the impacts of the respective instruments on the costs of the farms, on the farming competitiveness and the use of some resources (such as the fertilisers and the labour). Acknowledgements This work is funded by National Funds through the FCT—Foundation for Science and Technology, I.P., within the scope of the project Refa UIDB/00681/2020. This research is also funded by the Enovo company. This study was carried out under the international project “Agriculture 4.0: Current reality, potentialities and policy proposals” (CERNAS-IPV/2022/008). Furthermore, we would like to thank the CERNAS Research Centre and the Polytechnic Institute of Viseu for their support. This work is too co-financed by the PRR—Plano de Recuperação e Resiliência (República Portuguesa) and the European NextGeneration EU Funds (recuperarportugal.gov.pt) through application PRR-C05-i03-I-000030—“Carbo2Soil—Reforçar a Complementaridade entre agricultura e pecuária para aumentar a fertilidade dos solos e a sua capacidade de sequestro de carbon”.
References
143
References 1. V.J.P.D. Martinho, Main Factors That Explain the Use of Fertilisers on Farms in the European Union: Contributions to a More Sustainable Development, in Impacts of Climate Change and Economic and Health Crises on the Agriculture and Food Sectors (IGI Global, 2022), pp. 155–184 2. V.J.P.D. Martinho, Fertiliser cost prediction in European Union farms: machine-learning approaches through artificial neural networks. Open Agric. 8(1), 20220191 (2023), https:// doi.org/10.1515/opag-2022-0191 3. A. Cebulla, Z. Szpak, C. Howell, G. Knight, S. Hussain, Applying ethics to AI in the workplace: the design of a scorecard for Australian workplace health and safety. AI Soc. 38, 919 (2023) 4. Y. Deng, W. Jiang, Z. Wang, Economic resilience assessment and policy interaction of coal resource oriented cities for the low carbon economy based on AI. Resour. Policy 82, 103522 (2023) 5. R. Gupta, Intelligent Technology, Systems Support, and Smart Cities (Springer Science and Business Media Deutschland GmbH, 2023) 6. H. Huang, K. Chen, H. Zhang, L. Ren, Planning and coordinated response mechanism of economic and ecological services in urban expansion. Economic Res. Ekon. Istraz. 36, 2400 (2023) 7. U. Iqbal, M.Z.B. Riaz, J. Barthelemy, P. Perez, M.B. Idrees, The last two decades of computer vision technologies in water resource management: a bibliometric analysis. Water Environ. J. 1–17, (2023) https://doi.org/10.1111/wej.12845 8. M.M. Kamruzzaman, Impact of social media on geopolitics and economic growth: mitigating the risks by developing artificial intelligence and cognitive computing tools. Comput. Intell. Neurosci. 2022, 12 (2022) 9. Y. Liu, X. Zhu, Y. Wang, Revisiting and evaluation of the index of sustainable economic welfare based on artificial intelligence: data from 30 Chinese Provinces from 2003 to 2019. Environ. Dev. Sustain. 25, 3123 (2023) 10. A. Sjölander, V. Belloni, A. Ansell, E. Nordström, Towards automated inspections of tunnels: a review of optical inspections and autonomous assessment of concrete tunnel linings. Sensors 23 (2023) 11. M. Zadmirzaei, F. Hasanzadeh, A. Susaeta, E. Gutiérrez, A novel integrated fuzzy DEA—artificial intelligence approach for assessing environmental efficiency and predicting CO2 emissions. Soft Comput. (2023) 12. N. Zamri, M.A. Pairan, W.N.A.W. Azman, M. Gao, Finding optimal strategies for river quality assessment using machine learning and deep learning models. Model. Earth Syst. Environ. 9, 615 (2023) 13. V.F.B. Zilli, C.D. Paredes Crovato, R.D.R. Righi, R.I.G. Mejia, G. Pesenti, D. Singh, I4.0I: a new way to rank how involved a company is in the industry 4.0 Era. Future Internet 15 (2023) 14. R. Naveenkumar, J. Iyyappan, R. Pravin, S. Kadry, J. Han, R. Sindhu, M. K. Awasthi, S. L. Rokhum, G. Baskar, A strategic review on sustainable approaches in municipal solid waste management and energy recovery: role of artificial intelligence, economic stability and life cycle assessment, Bioresour. Technol. 379 (2023) 15. V.J.P.D. Martinho, Agri-food contexts in Mediterranean regions: contributions to better resources management. Sustainability 13, 12 (2021) 16. V.J.P.D. Martinho, Bibliographic coupling links: alternative approaches to carrying out systematic reviews about renewable and sustainable energy. Environments 9, 2 (2022) 17. D. Moher, A. Liberati, J. Tetzlaff, D.G. Altman, Preferred Reporting items for systematic reviews and meta-analyses: the PRISMA statement. BMJ 339, b2535 (2009) 18. Scopus, Scopus database, https://www.scopus.com/search/form.uri?display=basic#basic 19. V.J.P.D. Martinho, Impacts of the COVID-19 pandemic and the Russia-Ukraine conflict on land use across the world. Land 11, 10 (2022) 20. N.J. van Eck, L. Waltman, Software survey: VOSviewer, a computer program for bibliometric mapping. Scientometrics 84, 523 (2010)
144
10 Economic Growth, Sustainability Assessment and Artificial …
21. N.J. van Eck, L. Waltman, Manual for VOSviewer Version 1.6.19, (2023). https://www.vosvie wer.com/documentation/Manual_VOSviewer_1.6.19.pdf 22. VOSviewer, VOSviewer—visualizing scientific landscapes, https://www.vosviewer.com// 23. M. Alexopoulos, K. Lyons, K. Mahetaji, K. Chiu, in 2021 IEEE International Symposium on Technology and Society (ISTAS). Evaluating the disruption of COVID-19 on AI Innovation Using Patent Filings (2021), pp. 1–6 24. M. Haseeb, M. Sasmoko, L.W.W. Mihardjo, A.R. Gill, K. Jermsittiparsert, Economic impact of artificial intelligence: new look for the macroeconomic assessment in Asia-Pacific region. Int. J. Comput. Intell. Syst. 12, 1295 (2019) 25. FADN, Several statistics, https://agriculture.ec.europa.eu/data-and-analysis/farm-structuresand-economics/fadn_en 26. IBM SPSS Modeler, SPSS modeler—overview, https://www.ibm.com/products/spss-modeler