Water, Wastewater, and Sludge Filtration [1 ed.] 9780849369834, 9781003068655, 9781000142044, 9781000120714, 9781000098914
A comprehensive and up-to-date account of filtration in solid-liquid separation processes, with a sharp focus on the inf
388 67 14MB
Pages [292] Year 1989
Overview of Deep Bed Filtration: Different Types and Mathematical Models. Theoretical Approach of Deep Bed Filtration. Direct Filtration. Applications of Deep Bed Filtration in Wastewater Treatment. Microstraining. Precoat Filtration. Cartridge Filtration. Reverse Osmosis. Ultrafiltration. Microfiltration. Electrodialysis. Vacuum Filtration. Pressure Filtration. Centrifuges for Sludge Treatment. Index.
Recommend Papers

![Wastewater Sludge Processing [1 ed.]
0471700541, 9780471700548](https://ebin.pub/img/200x200/wastewater-sludge-processing-1nbsped-0471700541-9780471700548.jpg)


![Sonochemical Water and Wastewater Decontamination [4]
9783111137919](https://ebin.pub/img/200x200/sonochemical-water-and-wastewater-decontamination-4-9783111137919.jpg)


![Water, Wastewater, and Sludge Filtration [1 ed.]
9780849369834, 9781003068655, 9781000142044, 9781000120714, 9781000098914](https://ebin.pub/img/200x200/water-wastewater-and-sludge-filtration-1nbsped-9780849369834-9781003068655-9781000142044-9781000120714-9781000098914.jpg)
- Author / Uploaded
- C. Visvanathan (Author)
- Roger Ben Aim (Author)
File loading please wait...
Citation preview
Water, Wastewater, and Sludge Filtration Editor
Saravanamuthu Vigneswaran, D.Eng., Dr.Sc. Associate Professor Environmental Engineering Division Asian Institute of Technology Bangkok Thailand
Co-Editor
Roger Ben Aim, Dr.Sc. Professor and Director Institut du Genie des Procedes Agro-Alimentaires Agen France
CRC Press, Inc. Boca Raton, Florida
Library of Congress Cataloging-in-Publication Data
Water, wastewater, and sludge filtration / editor, Saravanamuthu Vigneswaran ; co-editor, Roger Ben Aim. p. cm. Includes bibliographies and index. ISBN 0-8493-6983-5 1. Water—Purification—Filtration. 2. Sewage—Purification— Filtration. 3. Filters and filtration. I. Vigneswaran, Saravanamuthu, 1952- . II. Ben-Aim, Roger. TD441.W37 1989 628.3— del 9
88-9505 CIP
This book represents information obtained from authentic and highly regarded sources. Reprinted material is quoted with permission, and sources are indicated. A wide variety of references are listed. Every reasonable effort has been made to give reliable data and information, but the author and the publisher cannot assume responsibility for the validity of all materials or for the consequences of their use. All rights reserved. This book, or any parts thereof, may not be reproduced in any form without written consent from the publisher. Direct all inquiries to CRC Press, Inc., 2000 Corporate Blvd., N.W., Boca Raton, Florida, 33431. © 1989 by CRC Press, Inc.
International Standard Book Number 0-8493-6983-5 Library of Congress Card Number 88-9505 Printed in the United States
PREFACE This work gives the readers some information on the various solid/liquid separation processes available for water and wastewater treatment. It will be especially useful to practicing engineers and technologists involved in treating water and wastewater in that they will find this book to be a comprehensive review of the various treatment processes, with their corresponding general/specialized application in water and wastewater treatment. Since there are a number of books written by eminent authors on process fundamentals and mechanisms, this treatise concentrates more on the influence of the process variables on the treatment efficiency and on the various types and field of application of these processes. In order to obtain a high level of expertise in each of the subject areas covered, we invited experts in the field to contribute chapters focusing on their area of interest. Each chapter has been written by an author who has actively contributed to the present state of the art of the process discussed in the chapter. This book consists of 14 chapters arranged in a sequence that reflects the current stage of development. That is to say, deep bed filtration — a method evolved at an earlier period to treat water — is dealt with in the first four chapters. Chapters 1 and 2 give a brief review of the modifications which have occurred over the years in conventional deep bed filtration, along with theoretical approaches. Whereas the major breakthrough in conventional deep bed filtration — direct filtration with its specific applications, is described in Chapter 3, Chapter 4 will be of special interest to wastewater treatment plant engineers, in that it deals with the application of deep bed filtration to treatment of different types of wastewater. It is a comparatively new phenomenon and should be a valuable addition to the technical data base on the above-mentioned subject. Other treatment processes, such as microstraining, cartridge filtration, and precoat filtra tion, which were developed at a later stage and used for pretreatment and for specific treatment purposes, are considered in the next three chapters. Membrane filtration processes, a gift from chemical engineering to environmental engi neering, which can be used to remove a wide range of dissolved particles (molecule to submicron level) are being currently used to recover valuable metals and to obtain a highquality water. Chapters 8 through 11 discuss all membrane processes, namely, reverse osmosis, electrodialysis, ultrafiltration, and microfiltration, with its specific applications in water and wastewater treatment. Chapters 12 through 14 discuss three different sludge dewatering methods commonly used, namely, vacuum filtration, pressure filtration, and centrifugation. Though sludge treatment is usually the last operation in any water or wastewater treatment plant, never theless, it is a very important operation. Its importance can be gauged, when one considers that all the contaminants removed from the treated water/wastewater are accumulated as the sludge and have to be treated and safely disposed of. Widely discussed sludge dewatering methods such as vacuum filtration and pressure filtration are treated in a general sense, while centrifugation is detailed in a rather comprehensive manner. We are indebted to Professor R. Gimbel of the University of Duisburg, S. Ripperger of AKZO, Wuppertal, West Germany; Dr. L. Coccagna of Culligan Italiana S.p.A., Italy; Professor K. Fujita of the University of Tokyo, Japan; Mr. P. A. Jackson of E. Beaudrey and Co., France; Dr. R. Illner of Manville de France, S.A.; Professor R. Audinos of the Universite Paul Sabatier, Toulouse, France; and Professor C. Alt of the University of Stuttgart, West Germany, who have contributed to this book. We thank Professor A. Rushton of the University of Manchester Institute of Science and Technology, Manchester, U.K., for his kind review of the chapter on vacuum filtration. We also thank those who have kindly consented to the reproduction of their figures and tables in this work. Special thanks are to Mr. S. Bhuvendralingam, Mr. F. Rahman, Mr. S. Kugaprasatham,
and Mr. V. Balakrishnan for their kind help in completing this book. Mrs. R. Siengsukon and Mrs. P. Sthapitanonda contributed much to the completing of the book through their typing of the manuscript. S. Vigneswaran R. Ben Aim
THE EDITORS Dr. Saravanamuthu Vigneswaran is presently an Associate Professor in the Division of Environmental Engineering of the Asian Institute of Technology, Bangkok, Thailand. Dr. Saravanamuthu Vigneswaran was graduated in 1975 from the University of Sri Lanka, Peradeniya Campus with a B.Sc. honors degree in chemistry and obtained the M.Sc. degree in environmental engineering in 1978 from the Asian Istitute of Technology. He was awarded the degree of Docteur Ingenieur in 1980 and Docteur es Sciences degree in 1987 in the field of chemical engineering from the Universite de Montpellier, France and Institut National de Poly technique de Toulouse, France, respectively. He has published more than 60 research papers. His current interests are solid-liquid separation techniques in water and wastewater treatment, such as deep bed filtration and membrane processes. He also works in the area of pollutant transport in subsurface envi ronment. Dr. Roger Ben Aim is Professor of Chemical Engineering at the Institut National Polytechnique de Toulouse, France. Dr. Roger Ben Aim obtained his engineering degree and degree of Docteur es Sciences from the Ecole Nationale Superieure des Industries Chimiques, Nancy, France, in 1961 and 1970, respectively. In 1972, Professor Ben Aim participated in the creation at the University of Montpellier of a water engineering department and of a research laboratory on chemical engineering applied to water and wastewater treatment. He was head of this laboratory untill 1980. Professor Roger Ben Aim also established two technical research centers in Agen, France, namely, the Institut de la Filration et des Techniques Separatives (IFTS) and the Institut du Genie des Procedes Agro-Alimentaires (IGEPA). He was also the Director of IFTS from 1981 to 1985 before assuming the position of director in IGEPA, which is affiliated with the Institut National Poly technique de Toulouse. Professor Ben Aim has published widely in the field of solid-liquid separation techniques in water and wastewater treatment and presented numerous lectures at national and inter national meetings at universities and institutes.
CONTRIBUTORS Christian Alt, Dr.-Ing. Professor in Ordinary Emeritus Department of Chemical Engineering University of Stuttgart Stuttgart, West Germany Remy Audinos, Dr. Sc. Professor Department of Chemical Engineering Paul Sabatier University Toulouse, France Roger Ben Aim, Dr.Sc. Professor and Director Institut du Genie des Procedes AgroAlimentaires Agen, France Luciano Coccagna R & D Manager Culligan Italiana, S. p. A. Bologna, Italy Kenji Fujita, Ph.D. Professor Department of Urban and Sanitary Engineering University of Tokyo Tokyo, Japan
Rolf Gimbel, Dr.-Ing. habil. Institute of Water Technology Univesity of Duisburg Duisburg, West Germany R. Illner Group Plant Manager Manville de France Saint Cloud, France E. P. Jackson, Engenieur ECP General Manager E. Beaudrey & Cie Paris, France Siegfried Ripperger, Dr.-Ing. Manager of Development and Application Technical Membranes AKZO, Enka AG Wuppertal, West Germany Saravanamuthu Vigneswaran, D.Eng., Dr. Sc. Associate Professor Environmental Engineering Division Asian Institute of Technology
Bangkok, Thailand
TABLE OF CONTENTS Chapter 1 Overview of Deep Bed Filtration: Different Types and Mathematical M odels................... 1 Saravanamuthu Vigneswaran and Roger Ben Aim Chapter 2 Theoretical Approach of Deep Bed Filtration...........................................................................17 Rolf Gimbel Chapter 3 Direct Filtration............................................................................................................................57 Luciano Coccagna Chapter 4 Applications of Deep Bed Filtration in Wastewater Treatm ent............................................77 Kenji Fujita Chapter 5 Microstraining..............................................................................................................................101 E. P. Jackson Chapter 6 Precoat Filtration........................................................................................................................ 117 R. Illner Chapter 7 Cartridge Filtration..................................................................................................................... 129 Saravanamuthu Vigneswaran Chapter 8 Reverse O sm osis.........................................................................................................................139 Saravanamuthu Vigneswaran Chapter 9 Ultrafiltration............................................................................................................................... 159 Saravanamuthu Vigneswaran Chapter 10 Microfiltration..............................................................................................................................173 Siegfried Ripperger Chapter 11 Electrodialysis..............................................................................................................................191 Remy Audinos and Saravanamuthu Vigneswaran Chapter 12 Vacuum Filtration...................................................................................................................... 225 Saravanamuthu Vigneswaran
Chapter 13 Pressure Filtration...................................................................................................................... 237 Saravanamuthu Vigneswaran Chapter 14 Centrifuges for Sludge Treatm ent........................................................................................... 249 Christian Alt Index.............................................................................................................................................275
1 Chapter 1 OVERVIEW OF DEEP BED FILTRATION: DIFFERENT TYPES AND MATHEMATICAL MODELS Saravanamuthu Vigneswaran and Roger Ben Aim
TABLE OF CONTENTS I.
Introduction.......................................................................................................................... 2
II.
Improvements on Rapid F ilte r.......................................................................................... 2 A. Improvements on Filter M e d ia...........................................................................2 B. Improvements on Flow Rate................................................................................2 C. Elimination of Some Operationsfrom Conventional Water T reatm ent.............................................................................................................. 3
III.
Filter Backwash M ethods.................................................................................................. 4 A. Choice of Backwash M ethod............................................................................... 4 B. Backwashing with Effluent from Other Filter U n its........................................5
IV.
Optimization of Filter Design...........................................................................................7
V.
Mathematical M odels........................................................................................................ 9 A. Filtrate Q uality....................................................................................................... 9 B. Headloss................................................................................................................. 11 1. Clean B e d .................................................................................................11 2. Clogged B ed............................................................................................. 12
References
14
2
Water, Wastewater, and Sludge Filtration I. INTRODUCTION
Filtration technologies are classified under two major categories, depending mainly on the mode of filtration: slow sand filtration and rapid sand filtration. Slow sand filter, which includes biological activity in addition to physical and chemical mechanisms for removing impurities from the raw water, is especially suitable for small community water supplies, because of its large areal requirement. Numerous documents are available on this technology . 1' 7 Rapid filter, on the other hand, due to its lower areal requirement (25 to 150 times less than slow sand filter) is used widely as a final clarification unit in municipal water treatment plants. It is becoming increasingly important in wastewater treatment, particularly when water reuse is envisaged. The applications of filtration in wastewater are discussed in detail in Chapter 4. II. IMPROVEMENTS ON RAPID FILTER A. Improvements on Filter Media The conventional rapid filter generally uses sand with an effective size of 0.6 mm and a uniformity coefficient of 1.5 to 2. This results in stratification of filter medium after the backwash, in which the finer medium remains at the top and the coarser medium at the bottom of the filter bed. To overcome this problem, two alternatives have been proposed: dual or multimedia filtration; or coarse size, narrowly graded media filtration. In dual-media filtration, the size and specific gravity are carefully selected to minimize intermixing. The commonly used media are anthracite coal and sand. Various research workers have given optimum size ratios to avoid intermixing (Table 1). Extensive research has been carried out to study the advantages and disadvantages of intermixing of filter media in dual media filtration . 1315 While a group of researchers feel that the grain size of course anthracite and fine sand should be chosen in such a way that the intermixing at the interface is minimized, others believe that controlled mixing among filter media is beneficial. A detailed design of media is discussed in the literature . 16,17 Another alternative is to replace a graded single medium with a coarse, narrowly graded medium of larger depth. This arrangement results in deeper penetration of the suspended solids and thus higher storage capacities which would lead to a longer run. The selection of size depends on the raw water and required effluent qualities. The commonly used size range is 0.9 to 1.1 mm. This arrangement can meet an increase in demand in existing units because it can be operated at a higher filtration rate. However, deeper penetration of the solids would entail a higher backwashing requirement. The rate of air and water used for backwashing depends on the size of medium. For example, sand of 2 mm effective size requires a washing rate of 90 to 110 m 3/m2*h of air and 19 to 24 m 3/m2*h of water. B. Improvements on Flow Rate Conventional rapid filtration operates at a constant rate of approximately 5 m 3/m 2’h. Research work on the variation of flow rate has indicated that high-rate filtration and declining-rate filtration are advantageous for most cases. If one achieves the desired filtrate quality with a higher filter rate at an operational and maintenance cost comparable to that of a conventional rapid filter, then one could achieve a significant capital saving by using a high-rate filter. Similarly, research has indicated that declining-rate filtration produces a better effluent quality than the conventional process. Therefore, if one could obtain the same amount of filtered water with equal capital investments, then declining-rate filtration would have a definite advantage over conventional rapid filtration. Another advantage of using declining-rate filtration is that it does not require automatic rate control.
3 Table 1 CALCULATED SIZE RATIOS TO AVOID MIXING Calculated effective size ratio (anthracite: sand) 2.38 : 1
2.63 : 1
2.73 : 1
3.00 : 1 2.07 : 1
Comment
Ref.
Neglects settling, based on laminar flow backwash Neglects backwashing, considers hind ered settling Neglects backwashing, considers hind ered settling Based on experience Based on pilot-scale study
8
9
10
11 12
The concept of declining-rate filtration is not new. Basically, no rate controller is used in this system, and instead it is replaced by a fixed orifice. The filtration rate in this system is allowed to decline from a maximum value at the beginning of the run, when the filter is clean, to a minimum value at the end of the filter run, when the filter is in need of backwashing. In practice, several (a minimum of four) filters are used in series, and the water level is maintained essentially at the same level in all operating filters at all times. This is achieved by providing a relatively large influent header pipe or channel common to all the filters, with a relatively large influent valve or gate to each individual filter. Details on the declining-rate filter operational principles, design criteria, and plant operations in developing countries can be found elsewhere . 17 21 High-rate filtration in which the filtration rate is about 10 to 20 m 3/m 2*h, as compared to the rate of conventional rapid sand filtration which is of the order of 5.0 m 3/m 2*h, is useful in upgrading existing plants. Such high filtration rates are possible, thanks to the development of (1) dual-media or multimedia and (2) control of flocculation by polyelectrolytes. This process uses a dual or mixed-media bed, while maintaining the required effluent quality with the entire bed being used efficiently for effective filtration action. High-rate filters with dual or coarse-medium arrangements have been successfully used in the West, and the accumulated experience, as well as specific data, supports the concept that further application of these processes is warranted . 22 This could be one of the economic solutions for the expansion of existing water treatment plants and for the construction of new plants. In order to fully exploit the economic benefits, filters should be designed in order to operate at the highest practical rate, being economical at the same time, though washing must be done more frequently . 23 Here, more attention should be paid to the selection of the filter media and filtration rate so that the filtrate quality meets the required standard. C. Elimination of Some Operations from Conventional Water Treatment Conventional water treatment plants generally use the following unit operations: rapid mixing, flocculation, sedimentation, filtration, and disinfection. Depending on the quality of the water, one or more unit operations can be eliminated, thereby achieving a costeffective water treatment. Direct filtration falls into the above category. Filters used in direct filtration thus differ little in construction from those for conventional treatment. The primary difference in the operation of the two systems is related to solids storage capacity and backwashing requirements.
4
Water, Wastewater, and Sludge Filtration
Direct filtration was first explored during the early 1900s, but these attempts were not successful, due to the rapid clogging of the sand beds. The development of coarse-sand filters has made it possible to store greater amounts of floe within the filter bed without excessive headloss, and has thus increased the feasibility of the direct filtration process. Further advances in filter design and the availability of a wider selection of chemical co agulants have resulted in a variety of filtration systems being designed in which coagulating chemicals are employed. The flocculation basin is either eliminated or reduced in size, and the sedimentation basin is not utilized. Such processes thus have only screening, rapid mixing, coagulation, and flocculation prior to filtration. All suspended solids and floes formed are deposited in the filter, which is usually a multi-media, granular bed containing coal, sand, and perhaps other constituent media. The American Water Works Association (AWWA) Filtration Committee’s report24 on a worldwide survey of 70 operating and pilot plants has indicated that waters with less than 40 units of color, turbidity consistently below 5 formazine turbidity units (FTU), iron and manganese concentrations less than 0.3 mg/€ and 0.05 mg/€, respectively, and algal counts of up to 2 0 0 0 per m€ (measured in absorption units at 1 0 0 0 nm) appear to be perfect candidates for direct filtration. Turbidity and color removals are consistently attained in this process. By efficient postchlorination, bacteria and virus removal problems can be elimi nated. Most of the literature favors the use of dual or mixed media for direct filtration . 25,26 Direct filtration can be successfully used for low -turbid waters, because of its lower capital and operational cost. It does not require any sophisticated equipment, although skilled operators are needed in order to monitor the filters. Attention should be paid to the possibility of poor bacteriological quality of the filters due to badly polluted raw water. Details on direct filtration with its applications are discussed in Chapter 3. III. FILTER BACKWASH METHODS In a filter operation, suspended solids become clogged in the filter bed. This phenomenon leads to development of headloss in the filter unit. When the headloss reaches the maximum allowable limit, or when the effluent quality deteriorates below the required quality level, the filter run should be stopped and the bed should be cleaned. This filter-cleaning operation is done by the filter backwash method. Various methods of backwashing exist. They include: (1) high-rate backwash with water alone; (2) low-rate backwash with water alone; (3) water backwash with surface-wash auxiliary; (4) water backwash with air auxiliary; and (5) backwashing with the effluent from other units. An additional method is to take washwater from the high-pressure distribution systems. This method wastes energy, but results in low installation costs. A pressure-reducing valve is normally required so as not to blow out the filter. A. Choice of Backwash Method The past experiences in the filter backwashing show that the choice of a backwash method partly depends on the type of filter medium used. The different factors influencing the backwash effectiveness in a filter unit are 1. 2. 3. 4.
Media size — coarse media will behave differently, depending on the backwashing method employed. Media shape — rounded grains are generally thought to be easier to clean than angular or flat grains. Media density — denser material needs higher velocities to suspend it in the upflow. Water quality — different waters behave differently in mud-ball formation and in the attachment of particles to the grains.
5 5.
Coagulant used — the amount and type of coagulant used: metallic coagulants or poly electrolytes change the adhesiveness of the film formed around the grains. Weak and strong floes will also behave differently with regard to ease of backwashing.
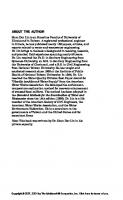
The first four backwashing methods listed above have been used extensively. The last one looks more promising, due to its low capital and operational costs. Therefore, the first four methods are only summarized in Table 2, which indicates their design criteria and applicability, whereas the last method is discussed in detail. B. Backwashing with Effluent from Other Filter Units In this method of backwash, which results in “ inter-filter backwashing” filters, the filter units of a treatment plant have to be interconnected as shown in Figure l . 36 The effluent from the interconnected units is collected by a single drainage channel, and the filter effluent outlet is located at a higher level than that of the washwater trough of the individual units. So, one cleans a particular unit by closing the inlet and opening the drainage outlet of this particular unit. The water level in the unit is thus lowered, and a positive head (Hb) is created in this unit, which reverses the direction of the flow through the filter bed. The backwashing will start with the effluent from the adjoining units that provide the upward flow. Once the filter-cleaning operation is finished, the outlet (drainage) is closed, and the inlet of this unit is opened to resume the filtration process. Schulz and Okun37 briefly describe the design principles as presented below. The head available for backwashing (Hb) is the difference in elevation between the effluent weir and the gullet lip in the filter. To obtain sufficient head for backwashing, the depth of the filter box must be substantially greater than for conventional filters. The filter box for the plant in Cali, Colombia has a depth of 6 m, compared with a depth of about 3 m in conventional filters. Also, filter bottoms must be designed with much lower headlosses than conventional filters — only 20 to 30 cm of headloss compared with about 1 to 1.4 m for conventional filters. The filter bottom can be produced from concrete beams with plastic tube orifices inserted along the beam. The spacing of the orifices dictates the headloss in the system. As long as the underdrain systems are interconnected, the backwash velocities will be low enough in the plenum so that the wash water distribution will be fairly uniform. Therefore, by increasing the depth of the water over the filter beds to about 1.5 to 2.5 m, limiting the headloss in the underdrain system to about 20 to 30 cm, interconnecting the underdrain system, and using dual-media filter beds, the backwashing headloss can be made sufficient to produce the desired expansion of the filter media. Interfilter washing filtration units can be designed either with unrestricted or restricted declining flow rate. The following precautions must be taken into account in designing this mode of backwash:27 • •
• •
For one filter to be washed with the flow of the others, the total production of the plant must be at least equal to the wash-water flow needed to clean one filter. The filter units must supply enough water for the required backwash rates. A minimum of four filter units, capable of working at a rate one third higher, is necessary to minimize the peak flow produced when one unit is out of service for washing. The filters must be so designed that one may be taken out of service for repairs without interruption of the normal operation of the others. The underdrain must be specially designed to produce low headloss. This is feasible because the filters are completely open at the bottom, and the wash-water flow rate is, therefore, very low.
Expansion of medium Time of washing Time of air scour application Amount of washwater needed Efficiency of cleaning action Applicability
Backwash rate Pressured backwash water Air scour rate Surface wash rate Pressure of surface scour water Porosity range during expansion
Parameters
High
Low Good Single media only
Low Fair Single media only
High
Low
Single and multimedia filters
Single and multimedia filters
Good
High 3— 4 min 3— 4 min
Low 2— 3 min 2— 3 min
27 m3/m2h -
18— 27 m3/m2*h
27 m3/m2h -
Low 3— 6 min 3— 6 min
>18 m3/m2*h 2.5— 5 kg/cm2
15— 18 m3/m2*h 2.5—5 kg/cm2
Air scour followed by high-rate water backwash27 30 34
18 m3/m2*h 2.5—5 kg/cm2
Air scour followed by low-rate water backwash2730
Single and multimedia filters
Good
High
High 2— 3 min 2— 3min
36— 46 m3/m2'h
2.5— 5 kg/cm2
Simultaneous air and low-rate water backwash, followed by high-rate backwash33
Water backwash with air auxiliary
80— 100% 3— 6 min
0.68— 0.7
>37.5 m3/m2*h 2.5 — 5 kg/cm2
High-rate water backwash272 ’9
Simultaneous air and low-rate water backwash, followed by low-rate water backwash2730 33
Low-rate water backwash
Table 2 RECOMMENDED DESIGN VALUES OF VARIOUS BACKWASH METHODS
Single media filters
High
This type of filter backwashing is used when mud-ball formation oc curs on the top of filter bed
10— 12 m3/m2*h 1.5— 4 kg/cm2
15— 18 m3/m2h 0.25— 0.5 kg/cm2
Water backwash with surface-wash auxiliary82 ’ 7 35
Water, Wastewater, and Sludge Filtration
7
■DRAIN VALVE
FIGURE 1.
FALSE BOTTOM
Backwashing of one filter with the flow of the others.
This system can be used for both single- and multimedia filters, but it requires four or more filter units in order to operate effectively. The advantages of this system are as follows: 1.
2. 3.
4.
This filter is easier to build than conventional filters. Only two valves are needed for filter control; the entire system can be designed with concrete channels or box conduits; and it is possible to eliminate the elaborate piping, valves, and control systems common to conventional filtration schemes. 37 There is no need for headloss gauges (since the headloss is evident to the operator, who can observe the water level in the filters), flow -rate controllers, washing equipment, or pipe gallery. Capital and maintenance costs can, therefore, be considerably reduced. There is a minimum of mechanization. As a result, the system is simple in design, operation, and maintenance. The backwash water is applied to the bed, using the head development in the unit, so one does not need to pump water into the bed. This leads to a reduction in the capital and operational costs. When one filter is taken out of service for backwashing, the filtration rate variations are slow and smooth. Once the headloss is fixed, the washing starts very slowly, and, therefore, a sudden expansion of the bed is prevented.
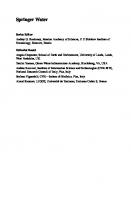
However, for a proper cleaning operation one requires higher headloss (55 to 80 cm). To create this headloss in the unit, the height of the freeboard of the filter unit has to be increased. This leads to an increase in the construction cost of the filter unit. Filter backwashing with this method has been practiced in Australia for a long time, and has been successfully used in more than 100 installations in the U .S . 36 Filters of this kind have also been operating satisfactorily in large plants in Latin America, including those serving the cities of Mexico City (24 m3/s); Monterrey, Mexico (24 m 3/s); Rio Grande, Brazil ( 6 m 3/s); and Cali, Colombia (4 m 3/s), as well as in Peru, Bolivia, and the Dominican Republic. 3637 IV. OPTIMIZATION OF FILTER DESIGN An optimum is achieved when the filter design and operation cause the filter to reach its headloss limit at the same time as the filtrate quality deteriorates to an unacceptable value (Figure 2 ) . 38 This is achieved when the line relating time of run to filter depth for a given headloss limit intersects a similar line for a given filtrate quality (Figure 3). The shapes of
CONCENTRATION C
Water, Wastewater, and Sludge Filtration
FIGURE 2.
Optimum operation concept.
DEPTH
FIGURE 3.
L
Optimum filter run and depth for given conditions.
9 these lines depend on which mathematical models are used, but the principle is valid for all models. The mathematical models are used with experimental data obtained with laboratory or pilot-scale filters at specified conditions for optimization of filter design. V. MATHEMATICAL MODELS Rapid filtration is a dynamic and complex process where particle retention is a function of filter depth and filtration time. The filter performance is generally characterized by the filtrate quality and headloss across the filter bed. These two factors depend on: Size and nature of filter medium Size distribution and nature of particles in suspension Depth and porosity of bed Filtration rate Concentration of suspension The dependence of filter performance on chemical and surface characteristics of particles, filter medium, and flocculent makes the process difficult to model. This is the reason that most of the models are semiempirical in nature. Numerous mathematical models have been put forward to explain filtration behavior at various stages, and they can, in general, be classified into two groups: microscopic and macroscopic. In this chapter, only a brief summary of selected macroscopic models used to predict concentration and headloss profiles is presented. The mathematical models in detail are discussed in Chapter 2. A. Filtrate Quality The first mathematical model is based on material balance and kinetic equations . 39,40 The first-order kinetics assumed (Equation 1) is then verified from experimental results. — = -A.C dZ
(1)
where C is the local concentration of suspension (v/v), Z is the bed depth (L), and X is the filtration coefficient (L - 1)* The general form of material balance of particles in an element of filter of depth (AZ) and a cross-sectional area of H at time t can be written as :41 Accumulation rate = rate of variation in flow of particles [Wo- + eC)] + ^
- HD
= 0
(2)
where H a AZ is the volume of particles retained, fleCAZ is the volume of particles in motion entrained by liquid, UmC is the particle flow entrained by the fluid, — is the diffusional flux of particles, e is the porosity of clogged bed (e = e0 - (3a), e0 is the clean bed porosity, actual volume of deposit 1 . ------------- — -------- —----- r , and a is the specific compacted volume of deposit J deposit (v/v). The above equation can be simplified by using the following hypotheses, which are applicable in the case of deep-bed filtration.
[
•
Velocity of suspension is constant throughout the filter run.
10
Water, Wastewater, and Sludge Filtration Table 3 k VS. a RELATIONSHIPS
Type of suspension
Ref.
Model
Discrete (D)
X = X0 + c'a
27
D
X = Xn — c'a
30
Flocculant (F)
dC — = be dZ
31
aq c
X = X0(l - a /a u)
D
(i) X = X0 + Q a - c()a2/(e0 - a)
D
32 28,33
(ii) X = X0 + Q a — ba2 (iii)
5/8 + 2.4 • 10 ~ 3 • N6/5 • Nr 2/5]
(43)
with Nvdw = H 132/9'TTTiap2 vf. In various papers, the effect of electrical double layer forces has been discussed in more detail. 86' 88 From these one can conclude that, under common conditions in water treatment, these forces either have only a minor influence on y \ T or> if theyare strongly repulsive, they almostcompletely prevent particle deposition. According to Spielmanand Cukor,87 the double layer forces may be neglected (using Happel’s cell model) as long as the following semiempirical relationship is satisfied: T
exnl —
N„
NvdW • k 2
•
NJ • A,
V Nn vdw V , • Ka,, -|
expL ~ N Rr ^
'
r
.-4 .4I J
• Ka "I< 1 v l ^ ...............
fm,„ = (tD)m + (ap - r h) • [ ( f ? r + r " r (Rh ' 2 ap - R’ )'*
,46.
Due to the difficulties of quantifying the net adhesion force, which is the result of various short-range and long-range surface forces (as discussed above), it is not yet possible to calculate frres only by use of theoretical approaches. Therefore, these forces have to be determined with special experiments under conditions relevant for water treatment. For example, this hasbeen done for the adhesion of quartz particles andglass microspheres on quartz plates, whichled to the results given in Figure 14. From such adhesion force distri butions, one obtains an estimation for y 0 H by setting the calculated value for frmin equal to the applied separation force in the model system. With this procedure, the y 0 Hvalues implied in the theoretical results shown in Figure 10 have been obtained. It is discussed in detail elsewhere . 5’22,95 A more realistic theoretical treatment of adhesion behavior should take into account the general possibility for multiple contacts of a particle on the collector surface. As is shown schematically in Figure 15, depending on the point of incidence, each particle that does not come to a stable deposition at this point may have more-or-less additional adhesion possi bilities on its way along the collector surface. Thereby, the adhesion probability for each situation decreases with increasing 0 (as long as 0 < tt/ 2 ), which is due to the increase of the wall shear forces. Thus, a particle approaching the collector exactly on the flow axis and coming into contact at 0 = 0 has an adhesion probability of 100%. On the other hand, a particle approaching the collector on a limiting trajectory of type I (i.e., coming into contact with the collector surface at 0 = tt / 2 for the first time) has a minimum adhesion probability at this position. To determine the mean overall adhesion probability for a large number of particles con tacting the collector (mathematically, the expectation value for y 0 ,h ) > one has to integrate the adhesion probabilities for particles with different points of incidence over the total
spheres
glass
particle diam eter
in |xm
15
20
25
B
particle diam eter
10
30 in p.m
35
FIGURE 12. Effect of differently structured filter materials on the initial filter efficiency: (A) without polymer addition; (B) with 16 |xg/€ 222K.
Yo/ Yo
Water, Wastewater, and Sludge Filtration
(fgr*f
yr-
collector surface res FIGURE 13. surface.
®Q
44
point of rotation
Model to describe the adhesion probability of a stationary particle in contact with the collector
separation force (10~10 N) FIGURE 14. Adhesion force distribution of quartz particles and micro glass spheres on quartz plates in tap water (normal and tangential separation forces, dp = 30 to 35 |±m)
----------------- d k ------------------ --FIGURE 15. Model to describe the particle adhesion behavior under consideration of multiple contacts on the collector surface.
collector surface. This has to be done by taking into account the varying probabilities for the realization of each point of incidence. For such a treatment, one has to consider the socalled dynamic adhesion behavior, demonstrated as an example in Figure 16. As one can see, there exists a strong dependency of the adhesion probability (corresponding to the amount of adhering particles) from the time of contact between particle and quartz plate. Here, the separation force acting on the particles after contact was the gravity force normal to the plate surface. Furthermore, it may be seen that the addition of a cationic polyelectrolyte (100 |xg/€ of Praestol 222K) considerably improves the adhesion probability even for very small contact times. The consideration of the dynamic adhesion behavior in the theoretical treatment of deep bed filtration in water treatment is discussed in more detail else where. 5,22,99 Despite a certain progress which has been achieved for this fundamental problem, there still remains a lot of research work to be done in this field.
46
Water, Wastewater, and Sludge Filtration
FIGURE 16. Dependence of the adhesion probability from the time of contact between particle and plate with and without polyelectrolyte addition (100 |xg/€ 222K, adsorption time for the cationic polyelectrolyte: 2 h).
C. The Filter Efficiency in the Dynamic Filtration Phase In the dynamic filtration phase, the efficiency of a deep bed filter is increasingly influenced by the amount of deposit collected in the filter bed. Generally, to calculate the particle deposition in this phase on a microscopic basis, one has to consider the same relations for the relevant parameters as has been already discussed for the initial phase. Additionally, one has to take into account the following effects: • • •
Change of the geometry of the filter bed by the deposit of turbid matter. This modifies the hydrodynamic forces and torques influencing the particle deposition mechanisms. The surface forces are no more restricted to particle-collector interactions; however, additional particle-particle interactions have to be considered. By modified flow conditions, as well as by impinging effects due to approaching particles, detachment of already deposited single particles or particle agglomerates may take place.
Most of the theoretical work related to the dynamic filtration phase is restricted to the macroscopic description of the filter behavior. This is because a comprehensive microscopic descripton of the particle removal processes is not yet available for the initial filtration phase and because such a treatment is even more complicated by the effects of the deposits in the filter. Only for very simplifying assumptions do there exist some microscopic approaches to describe the dynamic filtration phase. However, these are not yet applicable to practical problems. Considering a filter bed consisting of initially smooth collectors, one can distinguish between the following typical cases:
47 •
•
•
Formation of a homogeneous layer of deposit (with constant thickness) around the collector surface. Such behavior has been partly observed for the removal of hydroxideflocs in model filters . 19102103 Formation of a homogeneous layer of deposit mainly on the upstream side of the collector. Such morphologies, resulting in a relatively low increase of pressure drop, have been observed with particles of high density, such as quartz, kaolin, and lime stone . 5,102’104 Formation of a quite heterogeneous morphology of deposit by favored agglomeration at the collector surface. Such agglomerates may be detached by drag forces and subsequently held back in constrictions of filter pores . 105 This can block single pores or even whole regions of the filter bed.
For the case of a homogeneous layer of deposit with constant thickness Wnek et al . 106 considered both a mass balance and an electrical charge balance and their effect on the deposition mechanisms. For this, they made some very simplifying assumptions and obtained only partial agreement between theory and experiment. 107 This also applies for the results of Rajagopalan and Chu , 108 where a good agreement between theory and experiment was only possible by introducing a fitting constant in the kinetic approach (to account for particle detachment), which corresponds to the macroscopic theory of Mints. 13 Tien et al . 35 proposed a model that distinguishes between two phases of the dynamic behavior of a deep bed filter. In the first phase, they consider a spherical collector model, assuming the deposit to be distributed in a homogeneous shell around the collector and describing the flow field according to Happel’s model. Assuming further negligible double layer forces and an adhesion probability of 1 0 0 %, it was possible to derive the correction function fx (cr, Y) in an explicit manner on the basis of Equation 43. In a similar way, fp (cr, Y) has been derived on the basis of the Carman-Kozeny equation. For the second phase they considered a model of diverging and converging capillaries to describe the geometry of the filter bed. In the correction functions fx and fp, the increasing portions of blocked capillaries with increasing deposit were taken into account. Despite the very much simplified assumptions, quite a good agreement between theory and experiment has partly been obtained, at least in their tendency. But, indeed, the determination of a certain amount of deposit “ crtrans” characterizing the transition from phase 1 to phase 2 represents some kind of fitting process. To model the dynamic filter behavior without any assumptions concerning the deposit morphology, Pendse and Tien 109,110 simulated the formation of the morphology by the subsequent deposition of single particles, again under the assumption of an irreversible particle adhesion. But the comparison of theoretical with experimental results showed a too high increase of the filter efficiency in theory with increasing deposit. In later works , 18,111,112 a better agreement between such theoretical simulations and ex periments was obtained by considering a particle adhesion probability < 100%. But there are still remarkable discrepancies. The reason for these may be seen in the strongly simplified particle trajectory calculations in these simulations on the basis of single particle behavior, as well as in particle adhesion behavior which is not realistic enough. For example, the latter has been considered without taking into account the dynamic particle adhesion process as it has been discussed above. Thus, to simulate the dynamic phase of deep bed filtration on a very fundamental basis, there still remains a lot of work to be done in the future. Due to some qualitative considerations, 5 one can expect for this phase of filtration that the structure of the filter material should have a strong influence on filter behavior, as it has been already discussed for the initial phase. An example is demonstrated in Figure 17. Besides the positive effects of strongly structured filter materials in the initial phase, there is also a remarkable enhancement of the ultimate specific deposit crs for materials like filter
water
coke grains
100mg/l Sikron H200
B
2 3 U 5 deposit o • 103
dp = 5 pm
tap water
filter coke grains
100mg/l Sikron H200
dK = 1,5 - 2,0mm
FIGURE 17. (A) Change of the elementary filter efficiency y for 25 |xm-quartz particles with increasing deposit a by using differently structured filter materials (L = 15 cm, vf = 10 m/h). (B) Change of the elementary filter efficiency y for 5 (xm-quartz particles with increasing deposit a by using differently structured filter materials (L = 15 cm, vf = 10 m/h)
filter efficiency
49
o c ?► Q) 0t ) _ O) 0) *o o> o
E
0)
N I> — o c
0)
E
0)
specific deposit 6 in 10 FIGURE 18. Change of the elementary filter efficiency with increasing deposit for different additions of a cationic polyelectrolyte.
coke in comparison to relatively smooth glass spheres. These effects may be partly explained by the relatively low shear forces acting on particles deposited in the cavities of the filter grain surface. The importance of the particle adhesion behavior under conditions of larger deposits is also demonstrated in Figure 18. Here, the elementary filter efficiency is plotted vs. the specific deposit collected in the filter bed for different amounts of one cationic polyelectrolyte (222K) added to the model suspension. As one can see, by the addition of 40 jxg/€ as well as of 300 |xg/€, in both cases there was a remarkable improvement of y0 and of a s. But the lower polyelectrolyte addition leads to a higher initial filter efficiency in comparison to the results with 300 (xg/€ of 222K. On the other hand, the higher polyelectrolyte addition causes a higher ultimate deposit. This can be qualitatively explained by the fact that, with increasing deposit, the particle adhesion process determines more and more the overall filter behavior. In the same way, particle adhesion is improved by higher amounts of adsorbed poly elec trolytes; however, it was observed that smaller amounts mainly enhance the particle transport mechanisms." But such effects, which may be quite important (especially for practical conditions), are not yet predictable on the basis of a fundamental theory for the dynamic phase of deep bed filtration. ACKNOWLEDGMENT The author gratefully acknowledges the assistance of Mrs. Dagmar Schimer and Mrs. Dipl.-Ing. Pia Lipp, M.Sc. in preparing the manuscript.
50
Water, Wastewater, and Sludge Filtration
LIST OF SYMBOLS Dimension
Symbol a aK ap a* A As b B c Ci
ci Cv Co
dK
Dd DP e e
P min r P res
PC 0
(feD)m
fx f. F g H Io
J J Jx k L n n nK
NG N,
NLo Npe Nr
Fitting constant Collector radius Particle radius Empirical constant describing particle detachment Constant Porosity function (Equation 30) Outer cell radius according to Happel’s model Function of (Equation 39) Volume concentration of one type of turbidity Volume concentration of particles of type i Concentration of turbidity in the elementary filter layer j Total volume concentration of turbidities Volume concentration of one type of turbidity in the filter inlet Grain diameter Particle diameter Axial dispersion coefficient Particle diffusion coefficient (Equation 15) Elementary charge Fitting constants Unit vector Correction function for the course of the pressure within the filter bed Adhesion force at least necessary for stable particle deposition Net adhesion force normal to the collector surface 0 -Component of the gravity force 0 -Component of the drag force (parallel to the collector sur face) Correction function for the filter coefficient General function of a Cross section of the filter bed Acceleration of gravity Hamaker constant Modified Bessel-function of first kind and order zero J-function Particle flux Flux of particles coming into contact Boltzmann constant Total filter bed depth Number of particles Ion concentration Number of collectors in an elementary filter layer Gravity number (Equation 15) Inertia number (Equation 15) Dimensionless Hamaker constant (Equation 39) Peclet number (Equation 15) Interception number (Equation 15)
m m
m
m m m2/s m2/s As 1 1
N N N N 1
m2 ms-2 Nm 1 1
m 3s _ 1 m3s -1 NmK-1 m 1
m-3
51 LIST OF SYMBOLS (continued) Symbol NydW N* OR P P Pv Po r rP r* rP Rh Rk t T vf vr v0 V w y1 1 /2 Y z z z i
(tD)m 8
7 7 7o 7o 7 o ,h 7 o ,T 7 o ,T
AG Apv Apv,o e eo ^0
i £p
Dimension Number for the influence of van der Waals’ forces (Equation 43) Number for the influence of the electrical double layer forces (Equation 44) Artificial roughness on the grain surface Porosity function Pressure Pressure drop Pressure in the filter inlet Radial coordinate Radial coordinate of the center of the particle Dimensionless radial coordinate (Equation 29) Dimensionless radial coordinate of particle center (Equation 42) Characteristic height of surface protrusion for particle adhesion Thickness of the “ contact shell” around a collector Filter running time Absolute temperature Filtration rate Radial component of v 0 -component of v Fluid velocity (vector) Porosity function (Equation 29) Function of the surface potential (Equation 37) Parameter vector Filter bed depth Valence of counterions Valence of ions of type i Torque acting on a stationary particle in a shear field Distance between particle and collector surface Elementary filter efficiency Mean y-value for the total filter bed height Elementary filter efficiency in the initial phase Particle removal efficiency of one collector in the initial phase Particle adhesion probability in the initial phase Particle transport efficiency in the initial phase Transport efficiency of one collector in the initial phase Distance from the flow axis Pressure drop in a filter bed Pressure drop in a clean filter bed Porosity of the filter bed Relative dielectric constant Absolute dielectric constant Porosity of the clean filter bed Zetapotential Zetapotential of particle Dynamic viscosity
1 1
m 1
Nm - 2 Nm “ 2 Nm ” 2 m m 1 1
m m s K m s- 1 m s- 1 m s- 1 m s-1 — 1
— m — — Nm m 1 1 1 1 1 1 1
m Nm - 2 Nm ~ 2 1 1
As V _1m 1
V V kg m _ 1s~
52
Water, Wastewater, and Sludge Filtration LIST OF SYMBOLS (continued) Dimension
Symbol ^1 0 0p K K
X X ^■0
V pf
Pp a a
o v T
\Jr
V %
Particle removal efficiency of one collector Angular coordinate Angular coordinate of the particle center Wall shear gradient Reciprocal thickness of the double layer (reciprocal DebyeHiickel length) Filter coefficient Characteristic electromagnetic wavelength Filter coefficient for the initial phase Kinematic viscosity Liquid density Particle density Specific deposit of a distinct type of particle Mean o -value for the total filter bed height Specific deposit of particles of type, i Ultimate specific deposit Total specific deposit Corrected time variable (Equation 3) Stream function Electrical potential Stem - or surface-potential
1
— — s _1 m- 1 m- 1 m m- 1 m 2s - 1 kg m 3 kg m ~ 3 1 1 1 1 1
s
m3s ~ 1 V V
REFERENCES 1. Herzig, J. P., Leclerc, D. M., and Le Goff, P., Flow of suspensions through porous media, Ind. Eng. Chem., 62, 8, 1970. 2. Rajagopalan, R. and Tien, C., The theory of deep bed filtration, in Progress in Filtration and Separation, Vol. 1, Wakeman, R. J., Ed., Elsevier, Amsterdam, 1979, 179. 3. Tien, C. and Payatakes A. C., Advances in deep bed filtration, AIChE J., 25, 737, 1979. 4. Iwasaki, T., Some notes on sand filtration, J. AWWA, 29, 1591, 1937. 5. Gimbel, R., Abscheidung von Triibstoffen aus Fliissigkeiten in Tiefenfiltem, in Veroffentlichungen des Bereichs und des Lehrstuhls fur Wasserchemie am Engler-Bunte-lnstitut der Universitat Karlsruhe, Vol. 25, Bereich und Lehrstuhl fur Wasserchemie am Engler-Bunte-Institute der Universitat Karlsruhe, Karlsruhe, 1, 1984. 6. Lister, M., The numerical solution of hyperbolic partial differential equation by the methodof character istics, in Mathematical Methods for Digital Computers, Ralston A. and Wilf, H. S., Eds., John Wiley & Sons, New York, 1960, 165. 7. Lapidus, L., Digital Computation for Chemical Engineers, McGraw-Hill, New York, 1962. 8. Aris, R. and Amundson, N. R., Mathematical Methods in Chemical Engineering, Vol. 2, Prentice Hall, Englewood Cliffs, N.Y., 1973. 9. Filtration in der Wasseraufbereitung, I. Grundlagen, DVGW-Arbeitsblatt W 210, ZfGW-Verlag, Frankfurt, 1983. 10. Ives, K. J., Rapid filtration, Water Res., 4, 201, 1970. 11. Rolke, D., Vergleichende Untersuchungen an Trocken- und Uberstaufiltem zum Mechanismus der Partikelablagerung in Kiesbettfiltem, Dissertation, University of Karlsruhe, Karlsruhe, 1973. 12. Gimbel, R., Untersuchungen zur Partikelabscheidung in Schnellfiltem, Dissertation, University of Karlsruhe (TH), Karlsruhe, 1978. 13. Mints, D. M., Modem Theory of Filtration, Int. Water Supply Assoc., London, 1966, PI. 14. Ives, K. J., Theory of Filtration, Int. Water Supply Assoc., London, Vol. 1, 1969, K3.
53 15. Ives, K. J., Capture mechanisms in filtration, in The Scientific Basis of Filtration, Ives, K. J., Ed., Noordhoff, Leyden, 1975, 183. 16. Ives, K. J., Mathematical models of deep bed filtration, in The Scientific Basis of Filtration, Ives, K. J., Ed., Noordhoff, Leyden, 1975, 203. 17. Spindler, P., Modelle und Beschreibungen von Filtrationsvorgangen: Konzentrationsverlauf, in Veroffentlichungen des Bereichs und des Lehrstuhls fiir Wasserchemie am Engler-Bunte-lnstitut der Universitat Karlsruhe, Vol. 5, Bereich und Lehrstuhl fiir Wasserchemie am Engler-Bunte-Institute der Universitat Karlsruhe, Karlsruhe, 1971, 92. 18. Tien, C. and Gimbel, R., On the development of a comprehensive model of deep bed filtration, Symp. Preprints Water Filtration, Koninklijke Vlaamse Ingenieursvereniging, Antwerp, 1982, 1.1. 19. Stein, P. C., A Study of the Theory of Rapid Filtration of Water through Sand, D. Sc. thesis, Massachusetts Institute of Technology, Cambridge, Mass., 1940. 20. Feben, D., Theory of flow in filter media, J. AWWA, 52, 940, 1960. 21. Adin, A. and Rebhun, M., Components of deep-bed filtration-mathematical model, Symp. Preprints Water Filtration, Koninklijke Vlaamse Ingenieursvereniging, Antwerp, 1982, 1.15. 22. Zitzmann, W., Sehn, P., and Gimbel, R., Zur Bedeutung der Partikelhaftung bei der Tiefenfiltration, in Verdffentlichungen des Bereichs und des Lehrstuhls fiir Wasserchemie am Engler-Bunte-lnstitut der Uni versitat Karlsruhe, Volume 20, 1982, 561. 23. Anon., Water Filtration — The Mints-Ives controversy 1970 — 73, Filtr. Sep., 13, 131, 1976. 24. Heertjes, P. M. and Lerk, C. F., The functioning of deep bed filters, Trans. Inst. Chem. Eng., 45, T129, 1967. 25. Spindler, P., Beitrag zur Beschreibung des Konzentrationsverlaufes in Schnellfiltem der Wasseraufbereitung, Dissertation, University of Karlsruhe, Karlsruhe, 1973. 26. Ives, K. J., Simplified rational analysis of filter behaviour, Proc. Inst. Civ. Eng., 25, 345, 1963. 27. Shekhtman, Y. M., Filtration of suspensions of low concentration, Institute of Mechanics of U.S.S.R. Academy of Science, Moscow, 1961. 28. Maroudas, A. and Eisenklam, P., Clarification of suspensions: a study of particle deposition in granular media. II: A theory of clarification, Chem. Eng. Sci., 20, 875, 1965. 29. Sherwood, Th. K., Pigford, R. L., and Wilke, C. R., Mass Transfer, McGraw Hill, New York, 1975. 30. Thomas, H. C., Heterogeneous ion exchange in a flowing system, J. Am. Chem. Soc., 66, 1664, 1944. 31. Adin, A. and Rebhun, M., A model to predict concentration and head-loss profiles in filtration, J. AWWA, 69, 444, 1977. 32. Adin, A., Solution of granular bed filtration equation, J. Environ. Eng. Div., 104 EE3, 471, 1978. 33. Happel, J., Viscous flow in multiparticle systems: slow motion of fluids relative to beds of spherical particles, AIChE J., 4, 197, 1958. 34. Albert, G., Modelle und Beschreibungen von Filtrationsvorgangen — Filterwiderstand, in Verdffent lichungen des Bereichs und des Lehrstuhls Fiir Wasserchemie am Engler-Bunte-lnstitut der Universitat Karlsruhe, Vol. 5, 1971, 74. 35. Tien, C., Turian, R. M., and Pendse, H., Simulation of the dynamic behaviour of deep bed filters, AIChE J., 25, 385, 1979. 36. Scheidegger, A. E., The Physics of Flow through Porous Media, University of Toronto Press, Toronto, Canada, 1974. 37. Payatakes, A. C., Tien, C., and Turian, R. M., A new model for granular porous media, Part I. Model formulation; Part II. Numerical solution of steady state incompressible newtonian flow through periodically constricted tubes, AIChE J., 19, 58, 1973. 38. Chow, J. C. F. and Soda, K., Laminar flow in tubes with constriction, Phys. Fluids, 15, 1700, 1972. 39. Fedkiw, P. and Newman, J., Mass transfer at high Peclet numbers for creeping flow in a packed-bed reactor, AIChE J., 23, 255, 1977. 40. Payatakes, A. C. and Neira, M. A., Model of the constricted unit cell type for isotropicgranular porous media, AIChE J., 23, 922, 1977. 41. Neira, M. and Payatakes, A. C., Collocation solution of creeping Newtonian flow through periodically constricted tubes with piecewise continuous wall profile, AIChE J., 24, 43, 1978. 42. Neira, M. and Payatakes, A. C., Collocation solution of creeping Newtonian flow through sinusoidal tubes, AIChE J., 25, 725, 1979. 43. Brinkman, H. C., A calculation of the viscous force exerted by a flowing fluid on adense swarm of particles, Appl. Sci. Res., A 1, 24, 1947. 44. Kuwabara, S., The forces experienced by randomly distributed parallel circular cylindersor spheres in a viscous flow at small Reynolds numbers, J. Phys. Soc. Jpn., 14, 527, 1959. 45. Happel, J. and Brenner, H., Low Reynolds Number Hydrodynamics with Special Application to Particulate Media, Noordhoff, Leyden, 1973. 46. Fitzpatrick, J. A., Mechanisms of Particle Capture in Water Filtration, Ph. D. thesis, Harvard University, Cambridge, Mass., 1972.
54
Water, Wastewater, and Sludge Filtration
47. Spielman, L. A. and Fitzpatrick, J. A., Theory for particle collection under London and gravity forces, J. Colloid Interface Sci., 42, 607, 1973. 48. Rajagopalan, R. and Tien, C., Trajectory analysis of deep bed filtration with the sphere-in-cell porous media model, AIChE J., 22, 523, 1976. 49. Chu, B., Intermolecular Forces, Interscience, New York, 1966. 50. Hamaker, H. C., The London-van der Waals attraction between spherical particles, Physica, 4, 1058, 1937. 51. Gregory, J., The calculation of Hamaker constants, Adv. Colloid Interface Sci., 2, 396, 1969. 52. Kruyt, H. R., Colloid Science, Vol. 1., Elsevier, Amsterdam, 1952. 53. Lifshitz, E. M., The theory of molecular attractive forces between solids, J. Exper. Theoret. Phys. U.S.S.R., 29, 94, 1955. 54. Dzyaloshinskii, J. E., Lifshitz E. M., and Pitaevskii, L. P., Van der Waals forces in liquid films, J. Exper. Theoret. Phys. U.S.S.R., 37, 229, 1959. 55. Gregory, J., Approximate expressions for retarded van der Waals interaction, J. Colloid Interface Sci., 83, 138, 1981. 56. Gregory, J., Interfacial phenomena, in The Scientific Basis of Filtration, Noordhoff, Leyden, 1975, 53. 57. Israelachvili, J. N., Forces between interfaces in liquids, Adv. Colloid Interface Sci., 16, 31, 1982. 58. Ninham, B. W., Surface forces — the last 30 A, Pure Appl. Chern., 53, 2135, 1981. 59. Visser, J., Adhesion of colloidal particles, Surf. Colloid Sci., 8, 3, 1976. 60. Langbein, D., Theory of van der Waals attraction, in Springer Tracts in Modern Physics, No. 72, SpringerVerlag, Berlin, 1974. 61. Osmond, D. J. W., Vincent, B., and Waite, F. A., The van der Waals attraction between colloid particles having adsorbed layers, I. A reappraisal of the “ Void effect” ; II. Calculation of interaction curves, J. Colloid Interface Sci., 42, 262, 1973. 62. Everett, D. H., The effect of adsorption on the interaction between solid particles, Pure Appl. Chem., 48, 419, 1976. 63. Sato, R. and Ruch, R., Stabilization of Colloidal Dispersions by Polymer Adsorption, Dekker, New York, 1980. 64. Vincent, B., Bijsterbosch, B. H., and Lyklema, J., Competitive adsorption of ions and neutral molecules in the Stem layer on silver iodide and its effect on colloid stability, J. Colloid Interface Sci., 37, 171, 1971. 65. Lyklema, J., Principles of the stability of lyophobic colloidal dispersions in non-aqueous media, Adv. Colloid Interface Sci., 2, 65, 1968. 66. Napper, D. H., Polymeric stabilization, Colloidal Dispersions, 43, 99, 1981. 67. Riihrwein, R. A. and Ward, D. W., Mechanism of clay aggregation by polyelectrolytes, Soil Sci., 73, 485, 1952. 68 La Mer, V. K. and Healy, T. W., The role of filtration in investigating the flocculation and redispersion of colloidal dispersions, J. Phys. Chem., 67, 2417, 1963. 69. Kitchener, J. A., Principles of action of polymeric flocculants, Br. Polymer J., 4, 217, 1972. 70. Scheutjens, J. M. H. M. and Fleer, G. J., Effect of polymer adsorption and depletion on the interaction between two parallel surfaces, Adv. Colloid Interface Sci., 16, 361, 1982. 71. Di Marzio, E. A. and Rubin, R. J., Adsorption of a chain polymer between two plates J. Chem. Phys., 55, 4318, 1971. 72. Sontheimer, H. and Albert, G., Untersuchungen iiber die Wirkung makromolekularer Flockungsmittel, Chem. Ing. Techn., 46, 487, 1974. 73. Israelachvili, J. N., Forces between interfaces in liquids, Adv. Colloid Interface Sci., 16, 31, 1982. 74. Tabor, D., Attractive surface forces, Colloidal Dispersions, 43, 23, 1981. 75. Keesom, W. H., Die van der Waals’schen Kohasionskrafte, Phys. Z., 22, 129, 1921. 76. Debye, P., Die van der Waals’schen Kohasionskrafte, Phys. Z., 21, 178, 1920. 77. Iler, R. K., The Chemistry of Silica, John Wiley & Sons, New York, 1979. 78. v. d. Tempel, M., Interaction forces between condensed bodies in contact, Adv. Colloid Interface Sci., 3, 137, 1972. 79. Krupp, H., Particle adhesion — theory and experiment, Adv. Colloid Interface Sci., 1, 111, 1967. 80. Johnson, K. L., Kendall, K., and Roberts, A. D., Proc. R. Soc. London, Ser. A., 324, 1971, 301. 81a. Muller, V. M., Yushehenko, V. S., and Derjaguin, B. V., On the influence of molecular forces on the deformation of an elastic sphere and its sticking to a rigid plane, J. Colloid Interface Sci., 77, 91, 1980. 81b. Muller, V. M., Yushehenko, V. S., and Derjaguin, B. V., General theoretical consideration of the influence of surface forces on contact deformations and the reciprocal adhesion of elastic spherical particles, J. Colloid Interface Sci., 1, 92, 1983. 81c. Muller, V. M., Derjaguin, B. V., and Toporov, Y. B., On two methods of calculation of the force of sticking of an elastic sphere to a rigid plane, Colloids Surfaces, 7, 251, 1983. 82. Levich, V. G., Physicochemical Hydrodynamics, Prentice-Hall, Englewood Cliffs, N.J., 1962.
55 83. Pfeffer, R. and Happel, J., An analytical study of heat and mass transfer in multiparticle systems at low Reynolds numbers, AIChE J., 10, 605, 1964. 84. Cookson, J. Th., Removal of submicron particles in packed beds, Environ. Sci. Technol., 4, 128, 1970. 85. Kim, J. S. and Rajagopalan, R., A Comprehensive equation for the rate of adsorption of colloidal particles and for stability ratios, Colloids Surfaces, 4, 17, 1982. 86. Rajagopalan, R., Stochastic Modelling and Experimental Analysis of Particle Transport in Water Filtration, Ph.D. diss., Syracuse University, Syracuse, N.Y., 1974. 87. Spielman, L. A. and Cukor, P. U., Deposition of non-Brownian particles under colloidal forces., J. Colloid Interface Sci., 43, 51, 1973. 88. Onorato, F. J., The Effect of Surface Interactions on Particle Deposition in Aqueous Media — Single Collector Study, Dissertation, Syracuse University, Syracuse, N.Y., 1980. 89. Rajagopalan, R. and Tien, C., Single collector analysis of collection mechanism in water filtration, Can. J. Chem. Eng., 55, 246, 1977. 90. Payatakes, A. C., Rajagopalan, R., and Tien, C., Application of porous media models to the study of deep bed filtration, Can. J. Chem. Eng., 52, 722, 1974. 91. Payatakes, A. C., Tien, C., and Turian, R. U., Trajectory calculation of particle deposition in deep bed filtration, I. Model formulation; II. Case study of the effect of the dimensionless groups and comparison with experimental data, AIChE J., 20, 889, 1974. 92. Fitzpatrick, J. A. and Spielman, L. A., Filtration of aqueous latex suspensions through beds of glass spheres, J. Colloid Interface Sci., 43, 350, 1973. 93. Ghosh, M. M., Jordan, T. A., and Porter, R. L., Physicochemical approach to water and wastewater filtration, J. Environ. Eng. Div., 101, 71, 1975. 94. Rajagopalan, R. and Tien, C., Experimental analysis of particle deposition on single collectors, Can. J. Chem. Eng., 55, 256, 1977. 95. Gimbel, R. and Sontheimer, H., Recent results on particle deposition in sand filters, Symp. Pap. Deposition and Filtration of Particles from Gases and Liquids, London Society of Chemical Industry, Loughborough, Sept. 6 to 8, 1978. 96. Gimbel, R. and Sontheimer, H., EinfluB der Oberflachenstruktur von Filtermaterialien auf die Partikelabscheidung in Tiefenfiltem, Vom Wasser, 55, 131, 1980. 97. Gimbel, R., EinfluB der Filterkomstruktur auf das Verhalten von Tiefenfiltem, gwf-wasser/abwasser, 123, 220, 1982. 98. Gimbel, R., Influence of the filter grain surface structure on the transport and adhesion mechanisms in deep-bed filters, Proc. Symp. on Water Filtration, Elsevier, Antwerp, 1982. 99. Sehn, P. and Gimbel, R., Effect of polymers on particle adhesion mechanisms in deep bed filtration, in Solid-Liquid Separation, Gregory, J., Ed., Ellis Horwood, Chichester, 1984, 315. 100. Gimbel, R. and Tien, C., Particle adhesion on collector surfaces — The interplay between hydrodynamics and surface conditions of particles, Symp. on Recent Developments in Interfacial Phenomena Related to the Environment, AIChE, preprint, Washington, D.C., 1983. 101. Gimbel, R. and Sontheimer, H., Untersuchungen zur Wirksamkeit von kationischen Polyelektrolyten bei der Triibstoffentfemung in Schnellfiltem, Vom Wasser, 51, 65, 1978. 102. Cleasby, J. L. and Baumann, E. R., Selection of optimum filtration rates for sand filters, Bulletin 198, Iowa State Univ. Sci. Technol. Eng. Exp. Stn. Bull., LX No. 34, 1962. 103. Gregory, J. and Wishart, A. J., Deposition of latex particles on alumina fibers, Colloids Surfaces, 1, 313, 1980. 104. Ison, C. R. and Ives, K. J., Removal mechanisms in deep-bed filtration, Chem. Eng. Science, 24, 717, 1969. 105. Payatakes, A. C., Park, H. Y., and Petrie, J., A visual study of particle deposition and reentrainment during depth filtration of hydrosols with a polyelectrolyte, Chem. Eng. Sci., 36, 1319, 1981. 106. Wnek, W. J., Gidaspow, D., and Wasan, D. T., The role of colloid chemistry in modeling deep-bed liquid filtration, Chem. Eng. Sci., 30, 1035, 1975. 107. Wnek, W. J., The Role of Surface Phenomena and Colloid Chemistry in Deep Bed Liquid Filtration, Ph.D. dissertation, Illinois Institute of Technology, Chicago, 1973. 108. Rajagopalan, R. and Chu, R. Q., Dynamics of adsorption of colloidal particles in packed beds, J. Colloid Interface Sci., 86, 299, 1982. 109. Pendse, H. and Tien, C., A simulation model of aerosol collection in granular media, J. Colloid Interface Sci., 87, 225, 1982. 110. Pendse, H., A Study of Certain Problems Concerning Deep Bed Filtration, Ph.D. dissertation, Syracuse University, Syracuse, N.Y., 1979. 111. Chiang, H. -H., Transient Behaviour of Deep Bed Filtration, Ph.D. dissertation, Syracuse University, Syracuse, N.Y., 1983. 112. Chiang, H. W., and Tien, C., Transient behaviour of deep bed filters, in Solid-Liquid Separation, Gregory, J., Ed., Ellis Horwood, Chichester, 1984.
56
Water, Wastewater,
Sludge Filtration
113. Bradke, H. J., Vergleichende Filterversuche und Betriebserfahrungen mit der Filter-Konditionierung (Flockungsfiltration) bei der Aufbereitung von Oberflachenwassem, in Veroffentlichungen des Bereichs und des Lehrstuhls fiir Wasserchemie der Universitat Karlsruhe, Vol. 5, 1971, 236. 114. Edzwald, J. K., Becher, W. C., and Tambini, S. J., Aspects of direct filtration in treatment of low turbidity humic waters, Symp. Preprints Water Filtration, Koninklijke Vlaamse Ingenieursvereniging, Ant werp, 1982, 4.39. 115. Rebhun, M., Fuhrer, Z., and Adin, A., Contact flocculation-filtration of organic colloids, Symp. Preprints Water Filtration, Koninklijke Vlaamse Ingenieursvereniging, Antwerp, 1982, 4.25. 116. Hsiung, K. and Cleasby, J. L., Prediction of filter performance, J. Sanit. Eng. Div., 94 SA6, 1043, 1968. 117. Sontheimer, H., Flockungsfiltration, in Veroffentlichungen des Bereichs und des Lehrstuhls fiir Wasser chemie am Engler-Bunte-Institut der Universitat Karlsruhe, Vol. 5, 1971, 159. 118. Grohmann, A., Horstmann, J., and Sollfrank, U., Direct filtration tests with pipe flocculation, Symp. Preprints Water Filtration, Koninklijke Vlaamse Ingenieursvereniging, Antwerp, 1982, 1.35.
57 Chapter 3 DIRECT FILTRATION Luciano Coccagna
TABLE OF CONTENTS I.
Direct Filtration in Water Treatment.............................................................................58
II.
Application of Direct Filtration..................................................................................... 60
III.
Chemical Conditioning.................................................................................................... 61 A. Disinfecting A g en ts.............................................................................................61 B. pH Adjustment..................................................................................................... 62 C. Metal Coagulants..................................................................................................62 D. Filtration A ids.......................................................................................................63
IV.
Filter Design..................................................................................................................... 63
V.
Limits to Direct Filtration and Advanced Systems of Filtration...............................65 A. Consideration of Limits to Direct Filtration.................................................... 65 B. Example of Improvements in Direct Filtration: OFSY® In-Series Filtration...............................................................................................6 8 Application of In-Series Direct Filtration.................................................................... 69 A. Turbidity R em oval.............................................................................................. 69 B. Algae Removal..................................................................................................... 70 C. Color R em oval..................................................................................................... 71 D. Clarification of Effluents from Biological TreatmentUnits of Sewage W ater..................................................................................................... 72 E. Upgraded Removal of Phosphorus from SewageW a te r................................. 72 F. Arsenic Rem oval..................................................................................................72
VI.
VII.
Information on Costs........................................................................................................73
References
75
58
Water, Wastewater, and Sludge Filtration I. DIRECT FILTRATION IN WATER TREATMENT
Throughout history, man has always sought the clearest water possible for his drinking requirements, or that water which has already undergone natural filtration by passing through the ground. By way of example, although the Romans could have drawn water from the nearby Tevere River, they constructed superb waterworks to derive water from springs located at a considerable distance from the city. These waterworks are still employed in the municipal water supplies of Rome . 1 Many cities have experienced a great increase in population, thus forcing man to seek new sources of water which, often enough, are not as clear as desirable. History is studded with rudimentary examples of filtering systems, although the true era of modem filters dates from the beginning of the 19th century. At the same time, filters were the only possible means for treating water at extremely low filtering velocity, e.g ., 0 . 1 m 3/m 2*h, which entailed longer operating cycles before requiring a manual cleaning of the filter. This manual operation consisted of both the removal of the surface layer of sludge and the renewal of the filtering bed by adding the minerals which had inevitably been lost. The flare-up of epidemics, the search of their cause, and, above all, the acquired knowledge that water was the primary vehicle for their spreading, contributed to the importance of filtration or the capacity exerted by filters for retaining various kinds of microorganisms. Up to now, this concept has not been considered carefully. As a matter of fact, the process of disinfection still relies mainly on chemicals, whereas, in actual fact, the filter is a true disinfecting system and above all a system which makes disinfection more effective. At the beginning of the 2 0 th century, the importance of coagulation-flocculation was realized in the removal of colloidal and dispersed particles. The extraordinary properties of chlorine, as well as its derivatives, as a disinfecting agent were thus acknowledged. This introduced a substantial change into water treatment technology. The filter no longer plays a unique role but becomes a complementary part to that treatment hereinafter referred to as conven tional treatment of coagulation-flocculation-sedimentation-filtration. Ever since then, conventional treatments have undergone substantial improvements and filters, as well, have been modified so as to achieve a better operation from a mechanical and hydraulic standpoint. However, direct filtration or water treatment carried out by filters alone was brought back at a later stage, that is at the end of World War II, and it was in the 1960s that numerous studies were carried out on the filtration mechanism. Filtration is undoubtedly the most complex system of water treatment. Even the various attempts at mathematical modeling were not successful in pin-pointing performance exactly without resorting to experimental tests. Further studies2 are still required. Moreover, any mathematical model that was found to be successful for specific conditions would in practice be scarcely useful owing to the wide variability of natural waters. As a matter of fact, when dealing with filtration, the following five factors must be considered: 1. 2. 3. 4. 5.
Filter design (physicochemical, physical, and geometric characteristics of filtering material) Water and related variables, i.e., temperature, saline content and therefore viscosity, density, and ionic strength Suspended solids (size, shape, density, electric charge density) and those solids that can be rendered insoluble during treatment Nature, quantity, and instructions on how to employ coagulant and flocculant chemicals Operating conditions (filtering velocities and variations, pressure, backwashing, etc.)
There is no single way of defining direct filtration. It is generally meant that in this process there is no other treatment aiming at the removal of suspended solids such as sedimentation,
59
FIGURE 1.
Direct filtration with preflocculation and contact flocculation.
flocculation, hydrocyclones, etc. prior to filtration. In practice, the concept of direct filtration has been developed along two different guidelines as illustrated in Figure l . 3 They are (1) coagulation-flocculation as a preliminary step well-separated from filters; and (2 ) coagulationflocculation as an integral part of those mechanisms governing filtration. These two concepts have led to different evaluations of similar conditions. As a matter of fact, the target of coagulation-flocculation as a separate stage from filters is to obtain a floe “ designed” to penetrate through the bed in depth and to resist the shear forces. The different sizes of filter medium are necessary for “ sieving” floes of different size, whereas the influence exerted by the intermixing of layers may be either positive or negative according to whether or not it hinders the gradual action of mechanical filtration as highlighted by the increase in pressure drop within the filtering bed. In the case of contact flocculation, achieved by the injection of chemicals in line and with contact time and velocity gradient only just sufficient to ensure the even distribution of chemicals in the water, the importance of filtering layers is closely related to the forces governing the attachment and detachment mechanisms. Therefore, it is important from a theoretical point of view to avoid suspended solids with coarse sizes or scattered size distribution. These will enhance the detachment phenomenon provoked by the avalanche effect, especially when the filtering cycle is in an advanced stage. From this standpoint, the definition of direct filtration as previously established cannot satisfy the principles that render it possible and convenient. In other words, a preliminary separation of the coarser particles from water may be more appropriate without altering the principal of direct filtration. If, on the contrary, the preliminary step of coagulation-flocculation led to the formation of large and/or too weak floes, there would be an excess pressure drop and/ or a premature breakthrough of turbidity. Still, direct filtration with a separate coagulation-flocculation step is based on interceptionocclusion principles which exploit the gravitational and inertial transport forces, whereas in contact flocculation, Brownian motion plays an important role in addition to the above forces. In contact flocculation, the filter is considered as a true reactor, and the chemical
60
Water, Wastewater, and Sludge Filtration
and physicochemical reactions which give rise to insoluble compounds occur within the granular bed. When speaking of direct filtration, from now on it will mean filtration based on the principles of contact flocculation, since from our experience this has proved to be the most effective. II. APPLICATION OF DIRECT FILTRATION As previously explained, the concept of filtration is strictly connected to an idea of clearness, which in turn is connected with a subjective sensory perception. The instruments commonly employed to measure the turbidity of water are ineffective in providing objective values of immediate application. This is the reason for the necessity to know the concentration of suspended solids and the distribution of the particle sizes. For instance, the comparison between the turbidity value in formazine turbidity units (FTU) and the concentration of suspended matter can provide useful information which is known as “ fineness coefficient” , i.e., the colloidal degree of suspension. Rather than turbidity itself, this factor makes it possible to anticipate the coagulant quantity to be employed for the treatment, thus rendering direct filtration “ feasible ” .4 In fact, often it is the quantity of coagulant to be employed that affects the treatment in terms of pressure drop and effluent turbidity, rather than the removal of suspended solids itself. In the literature one often reads that the optimal operation of filters is achieved when the maximum permissible pressure drop matches the maximum permissible effluent turbidity. If this statement is accepted, it follows that direct filtration is convenient when the above target can be achieved only by means of filters capable of producing enough water in a reasonably long stretch of time. From time to time, this concept, related to the periodical operation of filters (service-regeneration or backwashing) has been differently defined in terms of volumes/quantities, i.e., • • • •
Volume of product water per square or cubic meter of filtering media Total weight of retained particles per square or cubic meter of filtering media Percentage of water necessary to carry out regeneration as to product water Energy cost per cubic meter of treated water
These are a few examples of how the choice of treatment can be determined case by case, according to a criteria of quality/quantity or economy. In actual fact, the economy parameter comprises them all: the only variation is given by the “ weight” that each factor might have according to local conditions. Many attempts at determining the limit of applying direct filtration5 to the removal of turbidity (5 to 10 FTU up to 100 FTU and beyond) may be found in the literature. However, these limits must be related to specific experimental conditions by taking into account factors such as filter design, turbidity characteristics, etc. In our experience, assuming that filters must operate continuously with a quantity of backwash water not exceeding 1 0 % in relation to product water, the first limit to be taken into account is the quantity of coagulant necessary to attain the required limpidity. For instance, the alum quantity should not exceed 15 mg/€. In many cases, 5 mg/€ of alum have provided excellent results, even with water having 1 0 0 mg/€ of suspended solids, whereas in some other cases a turbidity content of 20 FTU in water has called for more than 100 mg/€ of alum to attain an acceptable level of quality. In this regard, jar tests provide useful indications. However, it must be considered that direct filtration with contact flocculation, when compared to the jar test procedure, permits a decrease in the amount of coagulant which ranges from a minimum of 50% to 90% and beyond. The reasonable average concentration of suspended solids formed by silt and clay in surface water that can be treated by direct filtration is up to 40 to 50 mg/ € . 6
61
bQCl^ CHC13+OTHERS /O H
/ HUMIC
OH
COOH
O X ID A T IO N ^ -------------- ^ \
H O C ^ CHCl3.OTHERS
OH
OH
CH3 CHC13+OTHERS OH FIGURE 2.
OH
Typical formation of chloroforms out of decaying products of humic acids.
Direct filtration can also be employed for the removal of dissolved substances. It is quite common to employ filters to remove iron and manganese after oxidation. Filters also find a widespread application in the removal of substances rendered insoluble by appropriate chemical reactions (phosphates, tannin, humic and fulvic acids, etc.). As far as iron and manganese are concerned, the concentration of just over 1 mg/€ gives rise to drawbacks, mainly when the raw water is originally limpid, such as in the case of well water. It may sound like a paradox, but naturally turbid water is less of a problem since it can develop a particularly strong mechanism of attachment. In many cases, the level of turbidity is of no significance. For instance, algae can easily clog the filters even when water has little turbidity content. In the same way, the possibility of having direct filtration to remove other pollutants, such as phosphorus, arsenic, color, etc. depends mainly on the initial concentration, since coagulants are dosed as a function of it and give rise to high pressure drops. III. CHEMICAL CONDITIONING A. Disinfecting Agents To prevent both microbic growths in the filters and the formation of mud-balls, it is necessary to keep the filtering bed disinfected. For this purpose, common disinfecting agents, e.g., chlorine compounds, provide excellent results. However, nowadays, chlorine derivatives are a source of great concern on account of their capacity to give rise to organic halogenated compounds, chlorine-bromine in particular, as methane derivatives (trihalomethanes, THM; Figure 2). This occurs when water contains organic precursors, such as humic acids, products of algal metabolism, etc. Hence, the importance of tackling this problem with great attention, for instance, by determining in advance the THM formation potential (THMFP). This is the reason alternative disinfecting chemicals, like chloramines, chlorine dioxide, ozone, have been taken into consideration. However, none of them is faultless: chloramine has a very poor capacity to destroy bacteria, viruses, spores, etc.; chlorine dioxide decays to chlorite which is harmful to human beings (methemoglobinemia); besides being toxic, ozone may give rise either to mutagenic sub stances or to unknown substances whose degree of harmfulness cannot be determined easily. Our experience leads us to favor those treatments that tend to remove, or at least to reduce, the content of organic precursors, thus avoiding at the same time the need for a prechlorination
62
Water, Wastewater, and Sludge Filtration
or, generally speaking, a predisinfection. It is preferable to solve the disinfecting problems related to filters by carrying out shock disinfections during backwash. B. pH Adjustment Almost all naturally soft water has a pH value ranging from 6 to 8.5. The pH values, less than 7, are typical of surface water with little mineral content and telluric water with a high concentration of carbon dioxide. The importance of pH in water treatment is accounted for by at least three factors: 1.
2. 3.
Together with other parameters, it determines the degree of aggressiveness of water and, consequently, its corrosive action when in contact with filter components and the construction material of distributing systems. On the contrary, high pH values lead to scaling. It may seem incredible, but even today, important municipal water supplies disregard this parameter, thus wasting a great amount of money in order to carry out repairs and energy to pump water through water mains partially occluded with rough walls owing to limestone deposits, not to mention the damaging effects to health due to inorganic micropollutants dissolved in aggressive water, e.g., lead, zinc, cadmium, copper, etc. pH values affect the removal of humic acids and iron; optimal pH can be of vital importance to the desired results. Finally, pH determines the choice of coagulants. In fact, regardless of the degree of efficiency of metal salts commonly employed, aluminum and iron sulfates or chlorides in particular, the residual contents of cations after treatment cannot be ignored since their concentration strictly depends on the operating pH. For instance, when employing aluminum salts, pH should not be lower than 6 or higher than 7.5, thus avoiding an aluminum concentration over the limit 0 . 1 to 0 . 2 mg/f. For these reasons, pH adjustments are necessary both before and after filtration.
C. Metal Coagulants Aluminum, iron sulfates, and chlorides are commonly employed. In theory, chlorides are to be preferred owing to the high ratio between the number of anions to the cations. In practice, the variations in the degree of efficiency of coagulants are not so high as to justify the higher cost of one product in comparison with the other. Far more important are the considerations relevant to pH, hydration, and polymerization degree of metal hydrolysis products, and volume of polynuclear compounds giving rise to floes. In fact, floes of metal hydroxide are almost incompressible and, therefore, take up a great volume. As a result, in many cases, pressure drops are not caused by the substances removed (hydrophobic colloids in particular), but by the metallic hydroxide precipitates which exert an adsorption action on hydrophobic colloids. Therefore, there is a direct relationship between volume of floes and dosage of coagulant, whereas there is an inverse relationship between dosage of coagulant and length of filtration cycle .4 Consequently, in relation to this last consideration, it can be said that direct filtration may not be an advantage when a dosage of metal ion above 2 to 2.5 mg/€ is required to obtain an acceptable degree of coagulation. With regard to the above, direct filtration is more easily applicable to hydrophobic colloids than to hydrophilic ones. The former require a small quantity of coagulant, where its electrostatic action as counter-ion prevails, whereas in the latter, adsorption is predominant if not a direct stoichiometric relationship of the coagulant with hydrophilic colloids, e.g., humic and fulvic acids. This also accounts for the consid erable amount of coagulant employed in filtration, or, more generally, in clarification of water with a moderate turbidity. As a matter of fact, in dilute suspension, colloids have little possibility of colliding, and thus coagulants must act as flocculation support (sweep
a
COAGULANT DOSAGE A
b
COAGULANT DOSAGE
c
B
COAGULANT DOSAGE C
FIGURE 3. (A) Coagulation of concentrated hydrophobic colloids; (B) coagulation of dispersed hydrophobic colloids with restabilization step; (C) coagulation of hydrophilic colloids.
FIGURE 4.
Flocculation and bridging mechanism with polyelectrolytes.
flocculation) besides providing ions for the neutralization of colloidal electric charges (Figure 3). D. Filtration Aids
This is a blanket name for polyelectrolytes or those substances whose purposes are to provide a bridging mechanism. Owing to electrostatic charges, many polymers can also act as coagulant agents. In our experience, the use of polyelectrolytes as primary coagulants in direct filtration leads to more drawbacks than advantages from an operational standpoint, i.e., difficulty in determining dosages as a function of variations in water characteristics, higher pressure drops, etc. Commonly, the organic poly electrolytes of synthetic origin are employed, although ef ficient natural polyelectrolytes (alginates) or inorganic ones (activated silica) are available. The choice of polymer flocculant is strongly affected by operating conditions and acquired experience. The best possible dosage can be determined only by running trial tests. It is, therefore, not necessary to go into further details. As a general rule, it can be said that the cationic polymers will act better if the previous dosage of metallic coagulant is poor, whereas nonionics and anionics provide a good operation only when the “ zeta potential” value is almost neutral. It must be stressed that the proper use of polyelectrolytes is related to the necessity of altering the composition of floes and of forming a chemical bridge between the material deposited on the filtering bed and that still dispersed in water (Figure 4). IV. FILTER DESIGN Basically, two kinds of filters are employed in water treatment, i.e., single-layer sand filter, and dual or multi-media filter. The first kind is commonly employed in conventional treatment as a polishing unit after the sedimentation. It is fed by gravity, and the filtering bed is made up of 1.5 to 2 m of silica sand having a granule size ranging from 0.5 to 1 mm with a good degree of uniformity
64
Water, Wastewater, and Sludge Filtration Table 1 TYPICAL FILTERING MATERIALS
Layer Coarse
Medium Fine
Filter medium Plastic Pumice Coal (anthracite, palm kernel) Sand Garnet (or other heavy minerals)
Density (g/mf)
Typical size range (mm)
Layer depth (cm)
0.4— 0.6 0.45 0.7— 1.0
1.0— 3.0 1.5— 2.5 1.0—2.0
40—60
1.3— 1.5 2.0— 2.4
0.4— 1.0 0.2 —0.6
20— 30 10— 20
(uniformity coefficient less than 1.4 to 1.5). Filtration velocities are fairly low, of the order of 4 to 5 m 3/m 2-h, and even in the so-called rapid filters, velocity does not exceed 8 to 10 m 3/m 2-h. In many cases, the operation of this filter has been improved by converting it into a dual-media filter with part of the sand being replaced by anthracite carbon. Multimedia filters, commonly used in direct filtration, work under pressure, and the depth of the filtering bed does not exceed 1 m. Filtering velocities are very high, up to 20 m 3/m2*h and beyond. In the case of swimming pool water filtration, velocities can even reach 40 to 45 m 3/m 2,h. Filtering material is selected so as to have a decreasing granule size along the direction of water flow. Since water usually flows from the top to the bottom, filter media are chosen according to their specific weight. Table 1 shows the standard characteristics of a multimedia filter. To continue with filter design, other filters which deserve mentioning are filters with upward flow employing only one kind of filtering material of different granule size; bi-flow filters with simultaneous downward and upward flow of water; filters with continuous wash of filtering material. The major differences in design are the distribution modes of the inlet water and, above all, of the water employed for backwashing. The latter condition is essential for the good operation of filters and considerably affects the choice of the filtering medium of the bed. It is evident that regardless of the distribution system employed, this must ensure an even distribution of water throughout the filtering bed. At the same time, backwashing must guarantee the detachment and removal of the accumulated dirt by fully utilizing the shear forces of water flow and possibly by adding chemicals enhancing the detachment or the dissolution of strong links. There are many contrasting opinions and solutions for this operational aspect of filters, i.e., backwashing by water and air, backwashing by water only, control of bed expansion, velocity and volume of water to be employed, etc. No final criteria can be established, as it depends on the choice of filtering medium, operating modes, and experience of manu facturers. Another important aspect is a constant water flow as a function of operating pressure. In filters operating at a constant rate, headloss increases gradually, more or less automatically, as filters become clogged by dirt, whereas in filters operating on a declining rate (constant pressure), flow rate decreases gradually as a function of the increase in pressure drop. This latter condition is frequently experienced in filters working under pressure, although the different characteristics of pumps may partially alter the trend of the declining rate. This accounts for the application of declining rate to direct filtration systems. A further reason is provided by the fact that as long as laminar flow conditions prevail in the filter, which is normal when the filter is clean, the decrease in flow rate is directly proportional to the pressure drop and is very often negligible. With the clogging of filter bed, a turbulent
65
a)
____ PRESSURE DROP
b)
DECREASE IN FLOW RATE
PRESSURE DROP FLOW RATE
FIGURE 5. (a) Flow rate and pressure drop in clogged filters (turbulent flow); (b) flow rate and pressure drop during filter run (laminar flow).
flow begins, and the decrease in flow rate will have a quadratic trend with the increase in pressure drop. Therefore, by examining the pressure drop curve, it is possible to tell to what extent the filtration cycle can be conveniently “ pushed” , as well as whether the filter has become clogged owing to causes such as inadequate backwashing, mud-ball formation, etc. (Figure 5). V. LIMITS TO DIRECT FILTRATION AND ADVANCED SYSTEMS OF FILTRATION A. Consideration of Limits to Direct Filtration The basic operational difference between sedimentation and filtration lies, in the first instance, in the continuous removal of deposited sludge (this mechanism is governed by simple rules which can be easily checked by average laboratory equipment), whereas in the case of direct filtration, the build-up of separated particles continuously modifies the physical, chemical, and chemicophysical characteristics of separation to such an extent as to render impossible the application of any mathematical model. In other words, one has to go for experimental verification of basic parameters relevant to filter characteristics, the suspended substances to be filtered, and the interaction between the two. Laboratory tests make it possible to establish the superiority of one filter design over another, but it is impossible to apply the same conclusions to different conditions like different raw waters, filter medium, flocculant, etc. Qualitative descriptions are more appropriate than theoretical considerations in making the results more meaningful and in indicating further steps to be taken. By way of example, the classical continuity equation (Equation 1) dc
1 —f
da
dl
V
dt
( 1)
indicates that the decrease in suspension concentration (dc) with the bed depth (dl), is inversely proportional to the filtration velocity and depends upon the subsequent rate of build-up of deposited dirt (da). The removal efficiency is also a direct function of (1 —f) where f is the porosity of the filter bed. However, neither “ f” nor “ v ” is constant. Further
66
Water, Wastewater, and Sludge Filtration
FIGURE 6. quality).
Optional exploitation of filter run (maximum pressure drop matches permissible effluent
differential equations are necessary to describe the variations of these two factors as a function of time as well as the influence exerted by these variations on other parameters. The actual practice of direct filtration is, therefore, based on experimental observations, assuming that the optimal filtering cycle is obtained when the maximum permissible pressure drop matches the maximum permissible effluent quality (Figure 6 ) . 7 11 Generally speaking, the best results offered by direct filtration are due to a thorough exploitation of the filtering bed (deep bed filtration), whereas the efforts in conventional filtration aim at achieving a layer of sludge on the surface of the bed as the most suitable filtering medium. As is clearly shown by the continuity equation, it follows that in the case of direct filtration, the most critical parameter is the effluent quality, whereas the pressure drop gives rise to drawbacks. To be more accurate, even in the case of contact flocculation both of the above conditions can be achieved by employing, for instance, poly electrolytes. Even a condition described by Figure 7 may be possible. In other words, an apparent optimal condition, maximum differential pressure matching maximum effluent quality, may be at tained even without having achieved an optimal filtration cycle. In fact, the nonlinear increase in pressure drop indicates that the surface clogging has occurred together with premature breakthrough related to the detachment mechanisms. This is precisely the reason why it is difficult to employ filter aids in direct filtration. On the other hand, in the removal of natural turbidity (without using polymers), occurrence of breakthrough due to effluent turbidity long before the occurrence of a significant pressure drop is absolutely normal (Figure 8 ). Hence, in this case, it becomes necessary to carry out backwashing of filters even when the filters have not achieved their potential capacity of “ stocking” solids. In the same way, the continuity equation shows the impossibility of obtaining an acceptable level of effluent quality when the raw water turbidity is very high. These problems must also be related to those arising from the operating procedures, like connection and discon nection of pumps, possible variations both in flow velocities and in inflow turbidity. Based on past research, the following conclusions on the feasibility of applying direct filtration can be drawn:
67
(15)
The conservation of the electric charge yields the value of the electric current density?: T ^ v F - J j
(16)
j
Combining flux Equation 15 and charge conservation Equation 16, the gradient of the electric potential , which is the same for all ionic species present in solution, can be explicitly expressed. Substituting the gradient of the electric potential obtained, in the flux Equation 15, an expression for ionic flux can be written as follows: J j = - D j • Cj [gracl ln(aj) - Zj 2 (Vzj)
ln(aj)l + (Vaj)
'*
( 17)
j
If solutions are dilute, the first two terms of the second part of the flux equation depend only on the activity aj of the sole ion j. Thus the flux equation is simplified as the following: 1 } = ~ D }C}K m ^ a d ln(aj) + (t/Zj) • (?/F)
(18)
In theabove equation, the coefficient Km is equal to unity in the case of a solution phase and is very low within a membrane phase . 15 If the solution phase 1 is dilute, one can substitute the concentration Cj in place of the activity aj? and thus flux density Jj! can be written as: J* = - D jC jgralliK C j) +
(19) Zj ^
206
Water, Wastewater, and Sludge FUtration m pa cpI cpI
mpc cpI
cpI
m pa cpI cpI
I
s
E
\
FIGURE 14. Concentration profiles in bulk solution and in membrane unit (b = concentrate solution; d = dilute solution; Cj = ion concentration; cpl = concentration polarization layer; mpa = membrane permeable to anions; mpc = membrane permeable to cations).
In the case of commercially available membranes, the following equation can be written for the membrane phase m with current density being not too low and Km = 0. T
(20)
=
z, F
Equation 19 is true for the two solution phases and for the four concentration polarization layers, whereas Equation 20 is true for the two membrane phases of each unit cell. 3. The Steady State At steady state, the migration and diffusion fluxes of counterion j through solutions b and d and the concentration polarization layers (cpl) are the same as the migration flux through the corresponding ion permeable membrane (ipm) and are equal to the total flux (Figure 14), i.e.: *Jj
j ,c p l,d , i p m
’J j.ip m
j ,c p l,b , i p m
(21)
Using the expressions of the flux densities through the membrane, Jj5ipm? and solution phase (only in one concentration polarization layer of the solution phase), *Tj>cpUpm> (i.e., using the Equations 20 and 19) one obtains: timi
Dj gracl q + zj F
(22)
Zj F
In an electrodialysis stack, the flux is perpendicular to the surface of the flat membranes. Furthermore, the integration of Equation 22 is quite easy and gives a simple relationship (Equation 23) between concentration polarization layer thickness 8 , electrical current density i, bulk concentration in the liquid solution, and concentration Cjn near the membrane for a counterion.
207 In the course of this integration, the values of the diffusity Dj and the transport numbers are assumed constant and as the term i-8 /Zj is either negative or positive, the charge of ion j accordingly has been taken as rS/|Zj|. 4. The Critical Current When the concentration of the counterion near the membrane falls to zero, i.e., Cjn =
(24)
0
the critical or limiting current density, icrit, is expressed as: ,,
F
D,
lZjl -------jm
ic r it -
C jl
(2 5 )
®
From the above equation, it is clear that the critical current increases with the increase in bulk concentration C^ of the ion j in the liquid, and the diffusion coefficient Dj. However, its value decreases as the difference in the two transport numbers, tjm— tj, and the concen tration polarization layer thickness 8 increase. In particular, the effect of the thickness is very important. The concentration polarization layer in this case is different and a little thinner than the hydrodynamic limit layer. Classical hydrodynamics considerations show that the thickness is related to the Reynolds number . 16 Therefore, a high limiting current density can be achieved by controlling the thickness with a high stream flow rate in a thin channel. Consequently, the term \critIC]X, called by Cowan and Brown 17 the polarization parameter, is nearly independent of concentration, but is related to velocity 18 and, consequently, to the Reynolds number. 19 Therefore, once this polarization parameter has been determined for a system, it can be used to estimate the limiting current density for the same stack operating with the same solution, but for different concentrations. C. T ransport and Efficiency in a Unit Cell The overall electrokinetic phenomenon in a membrane stack can be understood by com bining all individual phenomena in existing membrane and solution phases. As previously indicated, the discussion is confined to ED only, but this will be analogous to other electro membrane processes as well. 1. Ionic Fluxes For a unit cell, the flux of an ion j out of the dilute compartment will mainly result from the transport through the corresponding ion permeable membrane, J j,jpm (in this case, j is the counterion). However, because the transport numbers are not equal to zero or unity, there is also a flux, Jjjim, for the counterion coming into the dilute stream through the other membrane of the cell (in this case j is the coion). Here, the membrane jim is impervious to the ion j . Consequently, the net flux Jjuc of this ion j out of the unit cell (uc), is J j, u c ~
J j. jp m
“
J j. j i m
(26)
Using Equation 20 for the flux density through a membrane, the net absolute flux of ion j out of the unit cell can be written as:
J j ,uc
~
|z | p
(tjJ p m
I jj im )
(2 2 )
208
Water, Wastewater, and Sludge Filtration
Thus, one can define the current transport efficiency r\t as:
Introducing the value of the net flux, the current efficiency Tjt can be written as: (29) Hence, the electric current efficiency for ion transport is equal to the difference in transport numbers of ion j through each kind of ion permeable membrane. From this point of view, one can see that it is very important to use membranes with transport numbers as close as possible to unity for the counterion and zero for the co - ion . 20 2. Water Transfer In concentrated solution or in systems involving a high degree of desalination or de mineralization, water can be transported from the dilute compartment to the concentrate one. In practice, since microporous membranes are used to obtain a high flux of certain ionic species, the effect of the osmotic flow cannot be neglected. Since a counterion is transported through the pore under the influence of the applied electric potential, it experiences a frictional force due to the surrounding solvent and ex changes its momentum (i.e., its mass velocity vector). In a neutral membrane, the momentum absorbed by the solvent exactly balances with that transferred from the co-ion, which is moving in the opposite direction. Therefore, the external electric potential has no effect on solvent flow. However, if the membrane is electrically charged by means of fixed charges, the counterion is more concentrated in the pores than the co-ion. Thus, the momentum transferred from both ions to the solvent do not balance each other, and the solvent receives a net force in the same direction of the movement of the counterion. If the convective flux, in the presence of any pressure gradient across the membrane, is also taken into account, one can write the osmotic flux for the solvent, i.e., water transfer, through the membrane as 2 (30) where tWm is the so-called electroosmotic transport number. Physically, the transport number is the number of moles of solvent transferred by 1 mol of electricity in the absence of hydraulic and osmotic pressure gradients. Furthermore, most ionic species are transported through an ion permeable membrane in their hydrated form. The corresponding transport of solvent water in the hydrated form is, in general, of the same order of magnitude as that of pure electroosmosis, i.e., (31) where hj is the hydration number of each ionic species j, and the summation is carried out over all ionic species participating in transport across the membrane. 12 Thus, the total solvent water through the membrane is:
209 Therefore, one can define an apparent electroosmotic transport number t*wm through the membrane as: Cm =
+ tjm hj
(33)
This water transfer occurs in the same direction as the flux of the counterion; in other words, it goes out of the diluting compartment into the concentrating compartment. Con sequently, it causes a dilution of the concentrate and a concentration of the dilute solution. This action defies the very purpose of the ED method. So, for a constant salt transport, a large water transfer will necessitate an additional current to meet the desalted or concentrated product quality specifications. It also reduces the quantity of product obtainable from a given amount of feed to the dilute stream. The effect of water transport on the efficiency with which the current is used to separate salt and water is quite ambiguous. If it is assumed that this water transport reduces only the amount of electricity used for salt transport, the remaining quantity is proportional to (1 — t ^ ) and the effect of water transport on current efficiency can be given by: Tlw = (1 ” twm)
(34)
3. Electrode Reactions Throughout the diluting and concentrating cells of an electrodialysis stack and in the membranes, electrical conduction is due to ionic transport. Thus, the relative movement of electric charges carried by the ions is, in fact, the current itself. At the electrodes, the mechanism of electrical conduction changes abruptly from ionic to electronic. Using noble metal electrodes, such as platinum, this transition is accomplished by the addition of electrons to the ions present in the solution at cathode and by removing the electrons at anode. Thus, in many situations (not particularly in high sulfate low chloride solutions), it is found that the anode reaction discharges oxygen from water with the simultaneous production of hydrogen ions: 3 H20 - > 1/2 0 2 + 2 H 30 + + 2 e “
(35)
In consequence, the solution in the anodic compartment, the anolythe, becomes more acidic with time. The formation of 0 2 or some oxidizing materials at the anode causes rapid deterioration of the stack components, especially the electrodes. The principal cations present in typical brine used at cathode are much less readily discharged than the hydrogen ion, and the net result of this is the water electrolysis reaction at the cathode. 2 H20 + 2 e~ —* H2 + 2 OH~
(36)
As a consequence, the solution in the cathodic compartment, the catholyte, becomes more basic as the electrodialysis process proceeds. Alkaline solution, if allowed to enter the stack, is likely to produce precipitation of insoluble hydroxides. These electrode reactions are always associated with the industrial electrodialysis operation and introduce two problems: 1.
The products of electrode reactions may be harmful to the electrodialysis stack or may interfere with the continued operation of the system. Because of this, it is usual to provide hydraulic isolation of the two electrode stream compartments at the end of the electrodialysis stack and to use some chemical resistant ion permeable membranes.
210
2.
Water, Wastewater, and Sludge Filtration The catholyte basicity can be controlled by the addition of inorganic acids, such as sulfuric acid, to the cathode stream and reduced by mixing the anolyte. Additional power must be supplied to provide the energy for electrode reactions.
D. Current Efficiency of the Stack The total external voltage AU that is needed to operate a practical electrodialysis stack is the sum of three principal potential drops. These three potential drops are associated with the electrode AUe, the ohmic drops within solution and membrane phases AUr, and the concentration potential across the membrane at the membrane-solution interface AUp: AU = AUe + AUr + AUp
(37)
1. The Stack Resistance The resistance of the operational portion of an ED stack is itself the sum of several resistances. The readily identifiable factors for a unit cell are the resistance of the bulk diluted and concentrated solutions, rd and r5, the resistance of the four and concentration polarization layers (the sum of these four is rcpl), and the resistance of the two membranes used, rapm and rcpm, ruc = rd + rb + rapm + rcpm + rcpl
(38)
Among the eight resistances indicated, the main values are generally attributed to the dilute stream and its concentration polarization layers and the membranes. If it is assumed that the inner solutions of the membrane phases are similar to the dilute solution, it is obvious that the resistance of a unit cell can be related to the concentration Cd of the dilute stream as follows: ruc = kd • C - g-
(39)
where kd and gx are positive constants between two limited values of the concentration of the dilute stream; kd is directly related to the equivalent conductance of the diluting solution. In some cases it is possible to expand it into a series. Thus, the voltage drop in the unit cell is AUUC = AUr>uc + AUp,uc = ruc • i
(40)
In this expression, for constant concentrations, when the density i of the electric current is increased, AUr uc still remains proportional to i, but AUp uc increases exponentially. On the other hand, as the applied voltage to the stack AU is increased, the current density i goes towards an asymptotic value: i.e., towards the critical current icrit. 2. Concentration Potential When a mole of electricity travels in a solution from point 1 to point 2, where concentration of salts are not equal, it is partially carried by anion and partially by cation, as indicated by transport numbers. In this case, the quantity of energy for the transport of an ion is equal to the product of the change in its free energy (Gibbs energy) and the transport number. For all the ions, the whole energy is the sum of these partial energies, and the corresponding potential drop is given by the chemical junction potential AUj_2 such as : 12
211
These potential drops exist in each layer of the unit cell where concentration varies. Con sequently, the total potential drop is the sum of these elementary cell voltages. However, in the whole stack, all the cell voltages caused by the differences in the concentrations of concentrated and diluted streams, as well as those coming from the con centration polarization layers, cancel each other. Only the cell voltage caused by the mem brane pairs remains, which, for a unit cell, reduces to: (42) This is expressed for the stack by a concentration polarization efficiency T]p. 3. Electrodes and Manifold Leakage At useful current densities, the electrode potential AUe will generally be about the same as that for the electrolysis of water, i.e., 2.3 volts. However, this voltage can be reduced to a small fraction of the total voltage by increasing the number of unit cells used in series between a given pair of electrodes. The additional power supplied in a stack to provide the electrode reactions is expressed as an electric efficiency r\e. The current leakage through the manifold system can, in principle, be completely elim inated. To achieve high coulomb efficiencies, that is, high utilization of the quantity of electricity added to the stack, it is important to minimize the current through the internal dilute and concentrate ducts, since electric current through these two paths bypasses the membranes of the unit cells and does not contribute to the separation by ED. In the case of high concentration of salt, the electrical leakage can be minimized by feeding or discharging solution to or from each compartment through separate distributors that are connected to the main duct through high electric resistance hydraulic connections, generally with a small diameter. Thus, the leakage current in a unit cell stack is usually less than 2%. This is expressed for the stack by an electric efficiency %. 4. Overall Efficiency The overall efficiency of an electrodialysis stack, t], is the product of the six principal, individually identified efficiencies: the three voltage terms, T]e , T]r, and T|p , respectively, associated with the electrode reactions; the total resistance, the polarization potentials, and the three current terms r\{, r\n and associated with the manifold leakage, ions, and water transport: ti
= 'ne-'nr'V'nr-'nr'n.
(43)
The first and second terms of this overall efficiency are primarily functions of the stack design; the third term depends on the operating conditions, salinity, and current density; the fourth depends on design factors, such as cell spacers and membrane thickness, and on operating conditions; and the fifth and sixth terms mainly functions of the membrane selected. The major inefficiency in stack operation is associated with the product inp’T]r; the product T|e*r|f is seldom less than 0.9, and the product will not be affected by any design in which the electric resistance and concentration polarization losses have not been minimized in a careful manner. V. PROCESS AND EQUIPMENT DESIGN A. Material Balance Under the forced flow conditions imposed in conventional electrodialysis, relative mixing
212
Water, Wastewater, and Sludge Filtration
of the main flowing streams and concentration polarization layers gives an average effect which is either demineralization or concentration, according to the compartment under consideration. The quantity of salt transferred from one stream to another is directly related to current density i and effective area A of each unit cell. The total number of cells is N. As a mole of electricity passes through a unit cell, it transports a given amount of salt. A mole of electricity carries 96,500 C, i.e., 96,500 A*s or 26.4 A*h. So, the number of moles of a z:z salt (i.e., a salt for which anion and cation have the same absolute charge number z) theoretically transported in a unit time is Anuc = ^
zF
(44)
In cell and stack design, serious considerations have to be given to minimize the current that will flow through the manifold. Therefore, it is safe to assume that the total ionic flux that flows through adjacent compartments is the same over the whole stack. According to this, the quantity of electricity acts each time it passes through a unit cell, and thus it acts N times. Taking into account the current efficiency t j , the total number of moles (An) transferred per unit time in the stack is AS - „ ^ zF
(45)
This quantityof mole is extracted from the dilution stream and brought into theconcentration stream during a unit time with an absolute flux density J through themembrane area NA. Therefore, An can also be written as follows: An = NA • J
(46)
If ED is operated in batch mode over a time t, the quantity of matter transferred from the demineralizing volume Vd to the concentrating volume Vb induces a variation in concentra tions Cd and Cb, respectively. This can be written as: An • t = —A(Vd • Cd) = A(Vb • Cb)
(47)
where A refers to the difference with respect to the value at initial time. If water transfer is not the main criterion, volumes do not vary much, but concentration decreases or increases according to the stream, as given by the following equations: An • t = —Vd • ACd = Vb • ACb
(48)
If ED is a continuous process, assuming that streams are running through the ducts with rates Qd and Qb, An can be written for this case as follows: An =
- A(Qd • Cd) = A(Qb • Cb)
(49)
If water transfer is low and the flow rates are constant in each stream, the ionic transfer can be written as: An = - Qd • ACd = Qb • ACb
(50)
213 Equations 45 and 47 (or Equation 49) contain seven variables, and it is, therefore, necessary to fix four of them. Frequently, volume or rate of the solution to be treated and its variation in concentration are fixed by local considerations. In solving these equations, the following two cases were considered. In the first case, for the ED stack chosen, since the three variables N, A, i are always together in the product form NAi, one has to calculate two of them by some other means. The third one can then be calculated because the product of the three is known from the above-mentioned set of equations. It has been previously shown that the current density i is always smaller than that given by the polarization parameter. Knowing the value of i, the product NA can be calculated. The fourth variable to be fixed is a choice between the variation in concentration of brine Cd and its rate Qb or its volume Vb in order to solve these equations. However, in this case, the ED run time t should also be specified. In the second case, a suitable ED stack is used for which the product NA is fixed and the current density i is obtained from the polarization parameter. The fourth parameter chosen is either the variation in concentration or flow rate. B. Demineralization Factor For steady state conditions, the demineralization that can be achieved in the stack, or the stack area required for a fixed degree of demineralization, can be derived by considering the relationship between flux density and salt transfer. In this calculation, the ED stack is considered to be a perfectly mixed reactor. In the case of a differential membrane area of width X and length dz, a material balance equation can be written for a constant flow rate Q. Q*dC±J*N*Xdz = 0
(51)
Here, the flux density Jj>uc is taken as constant for the N unit cells with an absolute value J. Taking the value of J expressed with the current density i from Equations 45 and 46, and introducing the voltage drop in the unit cell as indicated by Equation 40, the above material balance equation can be rewritten as: Q • dC — N • Xdz = 0 zF ruc
(52)
Since most applications of ED are concerned with demineralization of brackish water or solutions, further discussions are confined to these cases. For a diluting solution, taking into account the Equation 39 for the voltage drop in the unit cell, the previous equation is modified to: -n AU Qd ' dCd + zF " k f Cd8,N ' Xdz = °
(53)
Supposing the coefficient g is equal to unity, which is always true in a restricted domain of concentration, integration of Equation 53 from the inlet of the stack to the outlet (i.e., through the length of travel, Z), yields: f
AUuc NXZ -|
(54)
214
Water, Wastewater, and Sludge Filtration
where q is the demineralizing factor relating the concentration at entrance (Cd) and outlet (Cj) for dilute and can also be written as follows:
Equation 55 may be used to estimate the degree of demineralization as a function of cell dimension XZ, overall current efficiency r\, applied voltage drop per unit cell AUUC, average equivalent conductance per unit length kd and flow rate Qd. It should be noted that the term X/Qd is inversely proportional to linear velocity for any given thickness Y. The ratio AUuc/Kd may also be expressed in terms of current as i/Cd in a form analogous to the critical parameter. Substituting the above in Equation 54 yields: (56) It may be seen that for a stack with given geometry and for any flow rate Qd, this expression is valid as long as the circulation is in a series or parallel mode. In the latter case, the flow in each unit cell is Qd/N, the length of channel is NZ, and the ratio NZ/Qd is the same as in the case of a circulation in series. From the relationship established empirically between the critical parameter (i/Cd) and linear velocity, useful ratios of i/Cd and X/Qd may now be chosen without any consideration to resistance or voltage requirements. C. Power Requirement In conventional ED, the direct current electrical power P required for ion transport in the stack, where solutions are circulated in parallel in N unit cells of area A is P = N • (iA) • AUuc
(57)
Substituting for AUUC from Equation 54, and for i from Equations 45 and 50, and in combination with the following equation, (58) one obtains a value of the power requirement P on an absolute basis as: (59) To obtain the energy E for a unit product, P is divided by the flow rate Qd. (60) Equation 60 is particularly useful to estimate energy requirements for desalination or de mineralization, because the parameter kd is nearly constant for dilute solutions. The energy consumption increases with concentration Cd and flow rate Qd of the solution to be de mineralized. It increases also as the concentration Cd in dilute is reduced; but i decreases as the area (NA) of stack membrane is increased.
215 D. Instrumentation Electrodialysis is a process which involves the transport of ions from one solution to another. So, the results of ED are directly related to the quantity and the kind of ions present in the solution. 1. Sensors When the objective of the electrodialysis process is the production of potable water or demineralized solution of specified salinity, the most common method of quality and process control is by means of electric sensing equipment. With proper temperature compensation, the variable under control may be detected by a properly calibrated sensor. The easiest method, and also the safest, is to use conductivity measurements. This gives the overall ionic content of the solution within a precision of about 5%. As the sensing part of a conductivity cell are the two metallic electrodes, there is no normal wear. But, some times, one can notice mechanical failures, or chemical or electrochemical corrosion, related to the nature and the velocity of the solution. Hence, this kind of sensor may be used for long periods without recalibration. A more specific method is the use of potentiometry or amperometry. Theoretically, these ionometric methods give the value or the amount of a known ion such as proton, pH, or anions such as chloride, bromide, cyanide, fluoride, fluroborate, iodide, sulfide, or cations such as ammonium, barium, cadmium, calcium, copper, lithium, potassium, sodium, etc. when their concentrations are not too high. However, the given value may be wrong if there are some interfering ions. As the sensing part of the electrochemical chain are the two redox electrodes, they require daily maintenance. In some cases, there is fouling of the ion selective membranes. Therefore, the maintenance should also include cleaning and periodical change of the membrane. For a suitable use, daily calibration of the sensing equipment is necessary. 2. Control For a continuous process, essential instrumentation would be no more than the use of a light or an alarm system to indicate excess product salinity. Further control may entail automatic plant shutdown and product diversion to some specific tank or waste, when the product salinity is too high. Automatic voltage control from conductivity feedback signals would be desirable, but this type of system would have to operate within polarization limited voltages. A batch process requires little more than the conductivity sensor and on -off control. Recirculation is continued at any voltage current or salinity level until the required salinity product is reached. At this time, the product flow is diverted to storage by actuating a threeway valve. A liquid level control in the holding tank actuates a feed value when the tank is nearly empty, and recirculation will be resumed when the conductivity sensing element detects saline water or solution coming out of the stack. Use of a conductivity sensor to initiate the batch recirculation and discharge function guarantees a product solution of desired salinity, but does not control the time required for demineralization. Therefore, variations in feed salinity or temperature will cause corre sponding variations in batch cycle time. Similarly, feed-water variation in a continuous process would not alter the product flow rate, but would yield a product with varying salinity. A conductivity sensor alone, in this case, can do little more than sound an alarm or divert the product when its salinity is above the specified value. As ED is used in many cases for the production of drinking water, product with constant salinity is more desirable than a constant production rate. The product water is usually stored for subsequent use.
216
Water, Wastewater, and Sludge Filtration VI. OPERATING CONDITIONS
A. Pre- and Posttreatment To achieve optimum performance, ED requires pretreatment like other membrane sepa ration processes. In the case of drinking water production, the presence of suspended matter, colloidal or organic materials, soluble salts near their saturation levels, or materials readily oxidizable to an insoluble state in natural brackish water gives rise to problems in electro dialysis systems. Thin compartments and narrow manifold channels become traps for sus pended particles flowing through them. Therefore, a fine prefiltration with a 10-prni cartridge filter is essential. Colloidal and organic matter tends to “ p°ison” membranes of an electrodialysis stack. Most colloids are poly anions, such as the silicates, hydroxides of ferric ions, humic acids, phenol derivatives, etc. which carry a net negative charge. In consequence, these substances get collected on or in the anion permeable membranes. These foulants may form a film which, in turn, may retard the transfer of the ion through the membrane or neutralize the fixed charges of the membranes. Neutralization of the membrane charges and deposition increase the electric resistance of the ED stack and reduce the ionic flux out of the diluting stream. This frequently creates physical damage to the membrane structure. It has been found that for raw water containing ferric ions (Fe3 +) in an amount greater than 0.3 mg/€, or hydrogen sulfide (H2S) above 0.3 mg/€, or manganese ion (Mn2 +) above 0.1 mg/€, pretreatment becomes essential. The pretreatment in this case involved oxidation of the inorganic ions followed by filtration to remove the resultant insoluble species formed. When process water contains colloids, detergents, organic degradation products, etc., clarification via coagulation, flocculation, and filtration may be used. Organic fouling could be avoided by using an activated carbon cartridge when the turbidity exceeds 2.0 NTU. Biological fouling can be prevented by the addition of chlorine to the raw water. However, chlorine must be removed before the water enters the stack, because an excessive amount of chlorine degrades membrane and electrode materials, since it forms oxidation products. A good sterility may be obtained with some other products, such as sodium azide, etc. Salts near their saturation level present another type of problem. Since ED is a process which involves the transport of ions from one side of a membrane to another, the concentration of salts in the concentration polarization layer on the concentrate side of each membrane will be higher than in the feed or bulk concentrated stream. A solution containing significant quantities of calcium carbonate and sodium bicarbonate is particularly likely to cause pre cipitation on the concentrate side of the anion membranes because concentration polarization, at this point, results in the transport of hydroxyl ions into the concentrate stream. The most common method for solving this problem is the acidification of either the concentrate solution or the entire feed stream before it enters the membrane stack. Saturation with respect to calcium sulfate presents a more severe problem because acidification has little effect on its solubility. However, one can use acidification under critical conditions, since the maximum solubility of calcium sulfate is at pH = 4.0, and the supersaturation provides for precipitation after some limited delay. Water saturated with calcium sulfate requires presoftening before treatment in an ED stack. Posttreatment is required, in some cases, because of the change in pH brought about by the process itself. The product stream will have a pH lower than the feed water because of the polarization on the anion membrane. Therefore, it may be necessary to increase the pH of the product water. Chlorination is also used as a posttreatment for the product water. B. Current Reversal or Pulsing The symmetry of the alternating anion and cation permeable membrane system made obvious to the early investigators that reversing the polarity of the applied DC current
217 automatically interchanges the functions of adjacent diluting and concentrating compart ments. Whenever the membranes are suspected of producing a sieve effect, rather than acting as a pure ion transfer phase, current reversal is practiced on a periodical basis, in an attempt to discharge electromechanically entrapped colloids and/or macromolecules to restore original membrane properties. Current reversal removes foulants from the membrane and brings them into the bulk solution. Although the effectiveness of this procedure depends on the type of membrane and on the nature of contaminants that foul the membrane, the reversal of hydrogen and hydroxyl ion transfer and the accompanying interchange of pH effect at membrane surfaces is the significant defouling factor. When fouling substances are weak acids or bases, or amphoteric, the reversal in pH results in a change in the polarity of substances. When polarity reversal is used for an ED batch process, care must be taken on the reversal of hydraulic streams in order to prevent mixing of diluting and concentrating solutions. This is generally achieved by a set of conductimetric cells on emerging streams which automatically acts on three-way valves when they notice a conductivity lower or higher than the fixed value. The water content of both solutions is directly related to the hold-up volume of the stack compartments. So, the time reversal is generally about V2 h. Current pulsing is not used, even if it alleviates scaling problems and improves efficiency, because it needs specific electric power sources, particularly in the case of high flow rates. Thus, polarity reversal, which is used more often, causes the dispersion of concentration polarization layer and reduction of slime and colloid deposit. Moreover, in the case of water production, electrodialysis with polarity reversal (EDR process) eliminates the need of acidifying the brine stream. However, polarity reversal must be supplemented with regular chemical cleaning. C. Cleaning In spite of good operating conditions and management, a decrease in efficiency of an ED stack is noticed over a long period of time. This is readily seen by some decrease in the electric current through the stack. In the case of given diluting, concentrating, and electrode solutions, if the current differs from its nominal value when the same voltage is applied, it implies the occurrence of some irreversible polarization. In this case, it is necessary to use stronger cleaning methods than the previously mentioned methods. Generally, chemical cleaning is a good method. First, the stack is alternately washed with an acid solution and an alkaline solution. These solutions are carefully made with an acid or alkali which acts on mineral deposits or some organics. If there is organic matter, use of enzyme is beneficial. However, acids, alkalis, enzymes, etc. used have to be carefully selected to restore the nominal value of transport fluxes and to avoid any irremediable failure of the stack materials, primarily the membranes, but also the spacer gaskets, electrodes, ducts, etc. Care must be taken with the temperature and duration of each step of the cleaning process. When good sterilization is not used, or generally after long rest periods, the growth of some algae or other microorganisms may be noticed. As the membranes, spacer gaskets, and electrodes are simply clamped together in an ED stack, it is very easy to dismantle them in order to subject them to a thorough cleaning. Contrary to some other membrane processes, it is possible to brush ED membranes without damage. In the case of biological fouling, the main problem is the cleaning of the ducts, pipes, and associated valves.
218
Water, Wastewater, and Sludge Filtration Table 1 PRODUCTION OF POTABLE WATER FROM BRACKISH WATER Plant P 1
Plant location Area of the plant Design of equipment Number of units (parallel) Number of stacks (series) Number of unit cells (per stack) Capacity of the plant Overall conversion Membrane area Membrane utilization Flow rate Spacer gasket Current density according to stage 1-2-3-4 Voltage per unit cell per stage Governing Parameters Type of ED Process TDS of feed TDS of dilute solution Reduction in each stage pH Temperature Economy Energy consumption (total) Pretreatment
Posttreatment
Cleaning
Foss Reservoir, Okla., U.S.
18 4 320 11,355 m3/d 70%
Tortuous
Continuous Brine recycle 1800 mg/€ 300 mg/€ 35% 7.5—8.0
Plant II29 Nodroma, Algeria 22 x 12 m2 2
4 840 2,530 m3/d 85% 1,680 m2 75% 20 cm/s Sheet 23-10-5-2 mA-cm 2 1.5-0.9-0.8-0.75 volts Reversal Continuous 2600 mg/€ 150 mg/€
25— 30°C
By lime softening process, clari fication, dual media filtration with sand and anthracite followed by 10 |xm cartridge filter and ad justment of pH to 7.5— 8.0 Addition of sulfuric acid and hexamethaphosphate into brine to minimize Ca scaling; product water is chlorinated Required if TDS of the product water exceeds 500 mg/€; cleaning with 3% vol. of 50% caustic soda sol and 5% NaCl for about 5 h
2.4 kWh/m3 Antifouling 1.2 g/m3
1 h/d with HC1 5.6 g/m3
VII. APPLICATIONS ED finds wide application in potable water, industrial water, and wastewater treatment. Some of the specific applications are highlighted in the following tables (Tables 1 to 7). VIII. CONCLUSION ED is an attractive electromembrane process for desalting water or diluting or concentrating ionic species in solution. As electricity is used as the driving force for separation, the process may be used for wide-ranging separation problems. Moreover, since there is no significant mass or energy hold-up in the stack, it may be started or stopped according to the needs. If operating parameters are chosen properly, it may be used without any trouble over a long period of time.
219 Table 2 DEMINERALIZATION OF INDUSTRIAL WATER24
Table 3 DESALTING OF LACTOSE FROM PERMEATE OF SULFURIC CASEIN29
Plant Location, U.S.S.R. Plant Location, New Zealand Design of equipment Number of units — 1 to 3 Number of stacks — 2 per unit Number of unit cells — 200 per stack Membrane area — 0.48 x 0.75 m2 Membrane utilization — 60% Capacity of unit — 500 m3/d Flow rate — 25 cm/s Spacer gasket tortuous path — 900 cm Current density — 33 mA/cm2 Voltage — Up to 400 V Governing parameters Type of ED — Continuous Process — Continuous TDS of feed — 4000 mg/€ pH — 6.5— 8.5 Economy Current efficiency ( t j ) — 40— 60%
Table 4 DESALTING OF CHEESE WHEY FOR BABY FOOD22 23 29 Plant Location, France Design of equipment Number of stacks = 1 Number of unit cells = 700 Membrane area - 350 m2 Capacity of plant = 200 kg/h Governing parameters Type of ED — Reversal Process — Batch Feed Insoluble — 20% Ash content 8.5% of insoluble 17 g/kg of feed Demineralizing factor — 81 % Deacidification — 62% Temperature — 40°C Costs Investment — $300,000 U.S. Operational — $0.042/kg of insoluble
Design of equipment Number of units — 02 Number of unit cells — 1,200 Membrane area = 600 m2 Capacity of plant = 20,000 kg/h Governing parameters Type of ED — Reversal Process — Batch Feed Insoluble — 5% Ash content 13% of insoluble 7.2 g/kg of feed Demineralization factor — 50% Deacidification — 30% Temperature — 35°C Costs Investment — U.S. $550,000 Operational — U.S. $0.025/kg of insoluble
Table 5 DEMINERALIZATION OF SKIM MILK Design of equipment Number of stacks — 4 Number of unit cells = 150 per stack Membrane area = 50 m2 Flow rate = 30— 50 cm/s Governing parameters Demineralization factor = 90% Temperature = 18— 20°C pH = 4.6 to 4.8 Economy Energy consumption (transport) 0.1 to 0.3 kWh/m3
220
Water, Wastewater, and Sludge Filtration
Table 6 WATER REUSE IN ELECTROPLATING INDUSTRY Plant I25 26 Feed solution
Plant location Design of equipment Number of units Number of stacks Number of unit cells Membrane area Membrane utilization Flow rate Recovery rate Spacer gasket Current density Governing parameters Type of ED Process TDS of feed TDS of dilute solution Temperature and pH Demineralization fac tor Economy Energy consumption Pumps Transport Net profit
Electroplating rinse of nickel galvanization (NiS04) Japan
Plant II27 Rinse water in cyanide copper plating Limoges, France 1
1, coupled with electrodeposition bath 50 0.48 m2 per unit 70 kg Ni/d 3 cm/s 90% 2 mm thick 10 mA/cm2 Continuous Continuous 5— 7 g/€
1 per unit
0.5 x 0.5 m2 per unit 10 kg Cu/d 94% Sheet
Reversal Continuous 8 h/d 1000 mg/€ 222 mg/€
Same as electroplating bath >100
1 kWh/kg Cu 1 kWh/kg Cu $0.33/kg Ni
$4/kg Cu
Table 7 RECOVERY OF SODA IN PAPER MILL FROM BLACK LIQUOR28 Design of equipment Number of stacks = 2 in series Residence time = 80 min Current density = 10— 15 mA/cm2 Governing parameters: TDS of feed = 7— 10% Economy Energy consumption transport = 21— 80 kWh/kg Posttreatment: Electrogravitational precipitation of lignin
221
NOTA TIONS Roman Letters
a A C D E F hj
Activity Area Concentration Diffusion coefficient Energy per unit volume Charge of one mole of electron Hydration number
i J k K m n N P P Q r R s t T U v V
Current density Flux density Coefficient Constant Mobility Number of moles Number of unit cells Power Pressure Flow rate Membrane resistance Gas constant Partial enthalpy Time Temperature Potential Partial volume Volume Velocity Width, overall width Thickness, overall thickness Overall length Charge number of ion j
x,X y,Y Z Zj
m2 kg m ~ 3 m2 s - 1 Jm 3 Cb-eq g _1 moles of water per mole of ion amp m 2 kg m - 2 s - 1
s
1
W Pa m3 s - 1 ohm m 2 J kg"1 K J kg - 1 K " S K V m 3 kg - 1 m3 m s _1 m m m eq g-kg- 1
Greek Letters
jjij i|ij c|> r| A 8
Electrochemical potential Permselectivity Internal electric potential Efficiency Variation in Thickness of the concentration polariza tion layer Subscripts
b d e j
Of Of Of of
brine dilute electrode ion j
J-kgV
1
1 1
Water, Wastewater, and Sludge Filtration
222
NOTATIONS (continued) Subscripts
1 m n p r s S t W uc apm cpl cpm ipm jim jpm EOO HYD 1,2
Of bulk solution Of membrane Near the membrane Of polarization Of resistance Of salt, of electrolyte Of fixed charge Of transport Of water Of unit cell Of anion permeable membrane Of concentration polarization layer Of cation permeable membrane Of ion permeable membrane Of membrane impervious to ion j Of membrane permeable to ion j Of electroosmotic Of hydration Points Superscripts
* ' e s
Of reference Apparent Of inlet Of outlet
REFERENCES 1. Audinos, R. and Isoard, P., [Glossary of technical terms in membrane processes], SFF/IDEXPO, Cachan, Paris, 1986. 2. Shaffer, H. and Mintz, M., Electrodialysis, in Principles of Desalination, Spiegler, K., Ed., Academic Press, New York, 1966, chap. 6. 3. Pierrard, P., Recent progress in electrodialysis, Ind. Aliment. Agric., 93, 569, 1976. 4. Hattenbach, K. and Kneifeld, K., The effect of cell thickness and flow velocity on water cost in desalination by electrodialysis, Desalination, 58, 33, 1986. 5. Maurel, A., Water desalination by electrodialysis, J. Genie Chimique, 2850-1 to 2858-12, Techniques de l ’lngenieur, Paris, 1978; Bonnin, A., Electro-dialysis, Genie Chimique, J 28401 to 2840-21, Techniques de l ’lngenieur, Paris, 1988. 6. Lacey, R. and Loeb, S., Industrial Processing with Membranes, Wiley-Interscience, New York, 1972. 7. Narayanan, P., Harkare, W., Adhikary, S., Dave, N., Chauhan, D., and Govindan, K., Performance of an electrodialysis desalination plant in rural area, Desalination, 54, 145, 1985. 8. Hellferich, F., Ion Exchange, McGraw Hill, New York, 1962. 9. Molau, G., Heterogeneous ion-exchange membranes, J. Membr. Sci., 8, 309, 1981. 10. Meares, P., Membrane Separation Processes, Elsevier, Amsterdam, 1976. 11. Donnan, F., The theory of membrane equilibrium in the presence of a non dialysable electrolyte, Z. Elektrochem., 17, 572, 1912. 12. Lakshminarayanaiah, N., Transport Phenomena in Membranes, Academic Press, New York, 1969.
223 13. Winger, A., Bodamer, G., and Kunin, K., Some electrochemical properties of new synthetic ion exchange membranes, J. Electrochem. Soc., 100, 179, 1953. 14. De Groot, R. and Mazur, P., Non Equilibrium Thermodynamics, North-Holland, Amsterdam, 1963. 15. Sun Tak Hwang and Kammermeyer, K., Membranes in Separation, Wiley-Interscience, New York, 1975. 16. Vetter, K., Electrochemical Kinetics, Academic Press, New York, 1967. 17. Cowan, D. and Brown, J., Effect of turbulence on limiting current, Ind. Eng.Chem., 51, 1445, 1959. 18. Wilson, J., Demineralization by Electrodialysis, Butterworths, London, 1960. 19. Audinos, R., Conductimetric determination of the limiting current for low Reynoldsnumbers inelectro dialysis, Electrochim. Acta, 25, 405, 1980. 20. Passino, R., Biological and artificial membranes and desalination of water, Pontificae Academiae Scientiarum Scripta Varia, Elsevier, Amsterdam, 1976. 21. Applegate, L., Membrane separation processes, Chem. Eng., 91, 65, 1984. 22. Okada, K., Tomita, M., and Tamura, Y., Electrodialysis in the treatment of dairy products. II. Devel opment of electrodialysis, Milchwissenschaft, 31, 1, 1977. 23. Leitz, F. and Eisenmann, J., Electrodialysis as a separation process, Am. Inst. Chem. Eng., Symposium Series, 77, 204, 1981. 24. Shishliannikov, L. and Alzhanov, F., Operating experience of EDU-series electrodialysis plants used in different industries in the USSR, Desalination, 58, 77, 1986. 25. Jorgensen, S., Industrial Waste Management, Elsevier, Amsterdam, 1979. 26. Itoi, S., Electrodialysis of effluent from treatment of metallic surfaces, Desalination, 28, 193, 1979. 27. Audinos, S., Improvement of metal recovery by electrodialysis, J. Membr. Sci., 27, 143, 1986. 28. Radhamohan, K. and Basu, S., Electrodialysis in the regeneration of paper mill spent liquor, Desalination, 33, 185, 1980. 29. Societe de Recherches Techniques et Industrielles (SRTI), private communication, 1986.
225 Chapter 12 VACUUM FILTRATION Saravanamuthu Vigneswaran
TABLE OF CONTENTS I.
Introduction..................................................................................................................... 226
II.
Operation and Types of Vacuum F ilters.................................................................... 226 A. Principle of Operation....................................................................................... 226 B. Different Types................................................................................................... 226
III.
Design of Vacuum Filters............................................................................................. 227 A. Design Based on Experience...........................................................................228 B. Design Based on Specific Resistance of C ake.............................................. 228 C. Design Based on Filter Leaf Test....................................................................229
IV.
Operating Param eters.................................................................................................... 231 A. Vacuum Level.....................................................................................................231 B. Degree of Drum Submergence........................................................................ 232 C. Drum Speed.......................................................................................................232 D. Filter M edium ................................................................................................... 232
V.
Perform ance....................................................................................................................232 A. Sludge Solids Concentration............................................................................. 232 B. Pretreatment........................................................................................................ 232 1. Chemical Conditioning......................................................................... 232 2. Application of Filter Aids.................................................................... 233
VI.
A pplications....................................................................................................................233 A. Water Treatment Plant Sludges........................................................................ 233 B. Domestic Wastewater Sludge............................................................................235 C. Industrial Waste S ludge.................................................................................. 235 1. Metal-Finishing Waste Sludge............................................................235 2. Pulp and Paper Industry Sludge.......................................................... 235 3. Other Types of Sludges........................................................................235
VII.
Advantages and Disadvantages ofVacuum Filtration.............................................. 235
References....................................................................................................................................236
226
Water, Wastewater, and Sludge Filtration I. INTRODUCTION
Vacuum filters have been used in wastewater treatment for dewatering of sludges for more than half a century. A vacuum filter is a cylindrical rotating drum covered with a filter medium, a portion of the circumference being submerged in the sludge to be filtered, and water is drawn through the filter medium by an applied internal vacuum. The main purpose of vacuum filtration is to reduce the sludge volume significantly by dewatering in order to facilitate the subsequent sludge treatment or disposal. Although the vacuum filter achieves higher yields than other dewatering processes (es pecially when compared to pressure filtration), use of vacuum filters may be declining nowadays because of high operating costs resulting from chemicals for sludge conditioning and energy consumption. Higher initial purchase costs are also required for these machines. The comparison of three commonly used dewatering equipments are summarized in Table 1. II. OPERATION AND TYPES OF VACUUM FILTERS A. Principle of Operation Figure 1 shows the main component of a drum or scraper-type rotary vacuum filter. The unit consists mainly of a horizontal cylindrical drum that rotates and is partially submerged (from 25 to 30%) in a vat of raw (or conditioned) sludge. The drum is divided into sectors spanning the length of the drum, each of which may be placed under vacuum by means of automatic valving . 3 As each sector revolves through the sludge vat, a vacuum is applied, resulting in the formation of a layer of sludge on the filter medium. The vacuum remains on this sector as it emerges from the vat, resulting in the continuous drainage of moisture from the sludge layer. Drainage continues until the section reenters the sludge vat. At this point the de watered sludge cake is automatically removed from the filter medium . 3 Figure 1 also illustrates the various operating zones encountered during a complete rev olution of the drum. These zones are for cake forming, cake drying, and cake discharging. The submerged surface of the drum is referred to as the cake-forming zone. Vacuum applied to submerged drum sectors causes filtrate to pass through the medium and cake to be formed on the surface of the medium. As the drum rotates, each section is successively carried through the cake forming zone, where the cake is formed within the filter vat, and de watered outside the vat. The cake drying zone represents from 40 to 60% of the drum surface and terminates at the point where vacuum is shut off. At this point, the sludge cake enters the cake discharge zone where the cake is removed from the medium .3 B. Different Types The design problems are less severe in vacuum filters than in centrifuge or pressure filters because of the low driving force used on vacuum filters. This facilitates the operation of vacuum filtration on a continuous basis. By far the greatest number of applications for vacuum filters is on continuous basis. However, batch filters have found their use in other areas. Following are the two types of batch vacuum filters used: vacuum leaf filter and vacuum nutsche. Batch filters become suitable when process conditions change frequently, causing the need for variable filtration or cake washing times .4 Continuous filters operate without interruption where the feed is fed continuously and the filtrate and de watered sludge is continuously discharged. There are four types of continuous vacuum filters: rotary drum, rotary disc, rotary horizontal, and horizontal belt or endless cloth vacuum filters. This chapter will not review the different types in detail, as this topic is discussed in detail in various literature. 3,4
227 Table 1 DEWATERING EQUIPMENT COMPARISON
Capital costs Operating costs (energy, chemicals, maintenance, labor) Cake solid concentration Solid recovery
Vacuum filter
Pressure filter
Centrifuge
3X 3X
2X 3X
X 2X
2X 3X
3X 3X
X X
From Spinosa, L. and Eikum, S., Characterization, Treatment and Use of Sewage Sludge, L ’Hermite, P. and Oh, H., Eds., D. Reidel Publishing Com pany, Holland, 1981, 69. ©1981 ECSC, EEC, EAEC, Brussels and Luxem bourg. With permission.
FIGURE 1. Main components of a drum rotary vacuum filter. (From Svarovsky, L., Chem. Eng., July 2, 1979, p. 62. With permission.)
III.
DESIGN OF VACUUM FILTERS
The design of vacuum filter can be carried out in three ways as indicated below: • • •
Design based on experience Design based on filter leaf test Design based on specific resistance of cake
228
Water, Wastewater, and Sludge Filtration Table 2 SPECIFIC RESISTANCE OF SEWAGE SLUDGES Sludge type
r(m kg-1)
Raw sludge Raw sludge after coagulation Digested sludge Digested sludge after coagulation Activated sludge
10— 30 3— 10 3— 30 2— 20
x x x x
1013 1011 1013 1011
A— 12 x 1013
From Coackley, P. and Wilson, F., Filtr. Sep., 8, 61, 1971. With permission.
A.
Design Based on Experience The easiest way of designing a vacuum filter is making use of the data available from previous experiences. Data available on similar sludge (with the same chemical conditioning) can be used. As a guideline, typical filter yield values for different sludges are presented in Table 2. B.
Design Based on Specific Resistance of Cake6,7 During the sludge dewatering by filtration, a cake of increasing thickness is built up on the medium surface. In practical application of the vacuum filtration process, the hydraulic resistance of the medium (Rf) is assumed to be negligible compared to that of the sludge cake. The cake can be considered as a water-saturated porous medium through which the liquid flows. Therefore, applying Darcy’s law, dV _ AK AP dt ~ |x L dV AP where — is the volumetric flow rate; — is the pressure gradient in the flow direction; A dt L is filter area; K is the Darcy coefficient of permeability; L is the sludge cake thickness; and (x is the viscosity It ismore convenient infiltration theory to correlate filtration rate and pressure gradient by means of hydraulic resistance,in place of hydraulic permeability. If one defines the resistance as R = ^, then Equation 1 becomes:
™ dt
= A 4P (J.LR
In a vacuum filter, although the major resistance is contributed by the filter cake, inclusion of the resistance by the filter medium in Equation 2 gives, dV _ APA dt ~~ |x(LR + Rf) where Rf is the resistance of filter medium.
(3)
229 The volume of the cake can be expressed as LA = vV
(4)
where v = volume of cake deposited per unit volume filtrate. Substituting for L in Equation 3: dV _ APA2 dt ~~ |jl (Rv V + RfA) It is more convenient to express the quantity of cake in dry weight (W) per volume instead of volume of cake per volume of filtrate . 6 Similarly, the cake resistance can be represented by r (resistance per unit weight) instead of R (resistance per unit volume). Thus: dV _ APA2 dt ~~ |x(WrV + RfA) where W = weight of dry cake solidsper unit volume of filtrate, and r = specific resistance. Assuming constant pressure over a time t, and integratingEquation 6 with respect to time t, l
= p.rW V
V
jx R f
2APA2
APA
Equation 7 is a straight line of type y = a,x + a2, where P - rW
a, = —----- 1 2APA2
,
and
a7 = 2
P-Rf
------ AP• A
(8 )
It should thus be possible to calculate the specific resistance of filter cake from an experimental study with Buchner funnel apparatus (Figure 2) by measuring the filtrate volume 2 AP A 2aL at various times, t. One can find the specific resistance (r = ------------ ) from the linear (xW plot of t/V vs. V. The experiment is conducted by pouring a constant volume of sludge into the funnel with filter paper and imposing the vacuum at time zero. The amount of filtrate is then recorded at various times. The pressure (AP) is measured with a vacuum gauge. The cake deposited per volume of filtrate, W, can be calculated from Equation 9, which is derived from the material balance equation. C C
W = --------— ----- 100(CK - CG)
(9)
where Ck = cake solids concentration (%), and C0 = feed solids concentration (%). C.
Design Based on Filter Leaf Test6,8 Rotary vacuum filters are frequently designed and selected on the basis of leaf testing to determine attainable filtering and washing rates. A typical cycle of a vacuum filter consists of 30 sec of submerged operation, 60 sec of drying under vacuum but not submerged, and 30 sec off the filter. In other words, 25% of
230
Water, Wastewater, and Sludge Filtration
VACUUM
FIGURE 2.
Buchner funnel experimental set-up.
the drum circumference is submerged, and 25% is not covered by the fabric as the cake is discharged. Sludge drying occurs on the remaining 50%. Such a cycle can be simulated with a filter leaf, which is a small model of the prototype filter (Figure 3). The filter leaf consists of a round disc of about 10 cm in diameter, over which the filter medium is placed. This disc is connected to a vacuum source, through a graduated cylinder which is used to collect the filtrate. The filter leaf is kept in a beaker containing the sludge to be dewatered for a specified submerged time (usually in the order of 30 sec). The filter leaf is then taken out of the beaker containing sludge and kept under vacuum for a time period equal to the time that the filter would experience drying in prototype; the vacuum is then turned off. The cake is scraped off the filter leaf and analyzed for solids content, and the toal dry cake solids produced is calculated while the filtrate is analyzed for suspended solids and thus the solids recovery. The solids recovery in any dewatering device is calculated from a solids balance. If the feed flow rate and solids concentration are Q0 and CG, the filter cake flow and solids concentrations are Qk and Ck, and the filtrate flow and solids concentrations are Qf and Cf, one can write the following equations. From liquid flow balance, Qo ~ Qf + Q k
( 10)
QoCo = QfCf + q kc k
(I D
From solids flux balance,
Substituting Equation 10 in Equation 11, Qo(C0 Qk -
CK
Cf) Cf
(12)
231
FIGURE 3. Laboratory-scale leaf filter model. (From Cheape, D. W., Jr., Chem. Eng., June 14, 1982, p. 141. With permission.)
Percent recovery of dry solids (% R) is mass of dry solids as cake x 100 mass of dry feed solids
Qk x 100 - CK KVK C0Q0 Ck (Cq - Cf) x 100 Co(CK - Cf)
(13)
A great advantage of the filter leaf test is that the same medium used in the prototype is also used in the filter leaf test. This leads to a realistic approximation of the prototype operation . 6
IV. OPERATING PARAMETERS The selection of vacuum level, degree of drum submergence, drum speed, and medium type are very important in order to obtain optimum performance. A.
Vacuum Level The vacuum applied affects the degree of de watering of sludge. Although the vacuum imposed on the sludge can be adjusted, it usually does not exceed 50 cm of Hg (or 6 8 kPa),
232
Water, Wastewater, and Sludge Filtration
due to the power costs and compressible nature of wastewater sludges. Higher vacuums tend to produce nonpervious cakes which decrease the sludge yield. B. Degree of Drum Submergence The higher the submergence of the drum, the greater the percentage of cycle time for the pickup of solids on the filter surface. This will result in large cake thicknesses, but the moisture content of sludge will be high. On the other hand, decrease of drum submergence tends to decrease the time devoted for pickup of solids which results in production of thinner but drier cakes. C. Drum Speed An increase in drum speed results in the reduction of sludge-drum contact time, which will lead to the production of cake with higher moisture content. On the other hand, a slower drum speed will result in a drier cake but with a lower filter yield. D. Filter Medium The filter medium is of a fabric type which is used to cover the drum. The fabric can be categorized as an open or tight medium. Open media have large pores (or openings), while tight media have small openings. The smaller the opening, the higher the removal of fine particles. However, the opening cannot be so tight as to resist the flow through the medium. Common media used are rayon, acrylic, polyesters, poly olefins, wire screens, and stainless steel coils. Although stainless steel coils have the advantage of resisting wear and tear, they are more expensive. The ideal medium should be chemically resistant to the materials to be removed while providing minimum resistance to filtrate flow. V. PERFO R M A N C E Like the other types of mechanical dewatering equipments, optimum performance of vacuum filters also depends on the type of sludge and its solids concentration, conditioning, and filter operating conditions. A. Sludge Solids Concentration3 The sludge solids concentration has a significant influence on the filter yield. An increase in the feed sludge solids concentration usually results in a substantial increase in filter yields. A practical upper limit of 8 to 10% is used because, at greater solids concentrations, the sludge pumping becomes difficult and costly. The practical lower limit is kept at 3% because, below this concentration, it is difficult to produce sludge filter cakes. In practice, the sludge from various processes (both aerobic and anaerobic processes) have low solids concentration, and pretreatment of the sludge is necessary for successful appli cation of vacuum filtration. B. Pretreatment 7. Chemical Conditioning Sludge is conditioned by biological, chemical, and/or physical treatment to enhance the de watering characteristics of sludge. A variety of physical methods for altering sludge characteristics are available to facilitate the de watering operation, like heating, freezing of sludge, use of admixtures, ultrasonic vibrations, and solvent extraction. All these can be used, although none of them are as yet in common use when compared with chemical conditioning .9 Particle size is considered to be an important parameter affecting the dewaterability of sludge. The primary objective of chemical conditioning is, therefore, to
233 increase the particle size by adding chemicals which enable the particles to agglomerate into fewer large particles, or floes. The formation of such floes aids the dewatering process of the sludge. The common conditioning chemicals (or coagulants) for wastewater sludges are FeCl3, Fe2 (S 04)3, alum, and lime. Before coagulants can combine with the solid fraction of the sludge, it must satisfy the coagulant demand of the liquid fraction . 10 This is especially true when the alkalinity of the sludge is excessive. As a precipitant of bicarbonate (alkalinity), lime may be substituted for the portion of the coagulant that combines with the liquid fraction. It should be noted that lime forms only a precipitate with the fraction and does not form floes. Coagulant or conditioner requirements should first satisfy the liquid-fraction requirement approximated by the stoichiometry of the chemical reaction, i.e., for FeCl3. 10 2FeCl3 + 3Ca(HC0 3) 2 - > 2Fe(OH ) 3 ( j ) + 3CaCl2 + 6C 0 2 ( | ) 1 mg/1 as C aC 0 3 alkalinity requires (2 X 162)/(3 X 106) = 1.08 mg/1 of FeCl3 The conditioner requirement should also satisfy the solid fraction requirement, which is a matter of experience. It should be noted that the coagulant demand of the liquid fraction (or alkalinity) can be reduced either by lime addition (as a precipitant) or by washing out the alkalinity with water of low alkalinity. This process is called elutriation . 10 Commonly, FeCl3 up to 2.5% of the weight of dry solids is used to condition raw or digested municipal sludges, but up to 7% is used for activated sludge. In addition, approx imately 7 to 10% lime may be required. But, if the sludge is elutriated, the required FeCl3 may be reduced by as much as 80% and lime addition may not be necessary. Table 3 gives the typical conditioner doses used for various sludges. While conditioning with FeCl3 and lime is one of the most typical practices, the use of organic polymers or polyelectrolytes is gaining in popularity, although the use of FeCl3 and lime will result in the production of drier cakes. There are instances where the total quantity of water present in both sludge solid cake and chemical solid cake produced from FeCl3 and lime conditioning is greater than that produced from polymer conditioning. 2. Application o f Filter Aids Many industries have adopted vacuum filtration process, using diatomite filter aids, in order to reduce the cost of filtered products. Diatoms consisting predominantly of silica which are insoluble in the process liquors form a strong filter cake/matrix, of great porosity that allows liquids to pass through at a fast rate, but which traps suspended solids on the outer surface, thus preventing cake penetration into the filtrates. 11 Hence, by the use of filter aids, very high flow rates or high de watering rate can be obtained.
VI. APPLICATIONS Vacuum filtration is commonly used in de watering of various kinds of sludges. Some of them are highlighted below. A. Water Treatment Plant Sludges In water treatment plant, sludge is produced in different steps:
2.0
Activated 2.3 20
4.0
Digested (elutriated)
Food industrial activated Fly ash
4.0
Raw
Type of sludge
Total solids (%)
Polypropylene
72 Polypropylene Polypropylene
Polypropylene
47
— —
Polypropylene
Filter cloth
54
Volatile (%) Ca(OH)2 30 FeCl3 Ca(OH)2 45 FeCl3 Ca(OH)2 60 FeCl3 Ca(OH)2 20 —
Chemical dosage as % dry feed sludge solids 400—500 10 400 —500 10 400—500 18 400—500 400— 500
Pressure (mmHg) 18.0 15.0 8.0 17.6 21.6
80 83 86 32
Filtrate rate (kg/m2-h)
77
Cake moisture content (%)
Table 3 PERFORMANCE OF VACUUM FILTRATION FOR DIFFERENT TYPES OF SLUDGES12 Water, Wastewater, and Sludge Filtration
235 •
•
Alum sludge, from coagulation-sedimentation processes, is bulky and gelatinuous with low solids content that is difficult to de water; solid content in this sludge is about 0 .1 to 0.5% Sludge from filter backwash, which has the solid content of 100 to 300 ppm
Water treatment plant sludge is inorganic in nature and does not exert any oxygen demand. Clay or lime may be used with the alum as conditioning agents to improve thickening and dewatering properties of this sludge. B. Domestic Wastewater Sludge The major application of vacuum filter is in this field since the mid-1920s, although the era of vacuum filtration is declining. Table 3 gives the performance of vacuum filters for different sludges. 12 C. Industrial Waste Sludge 1. Metal-Finishing Waste Sludge The metal finishing process, for example, involves a wide variation of pH, in addition to the presence of toxic heavy metals. Main waste results from rinsing and periodical discarding of baths. The treatment methods which produce sludges include oil separation, reduction of chromates, oxidative destruction of cyanides, and precipitation of metal hy droxides from the treated waters. Average discharge solids from a vacuum filter is about 2 0 to 25% dry substance, and filtrate having high turbidity must be sent back to the clarifier or polished. Feed concentration must be 4 to 8 % solids for successful operation of vacuum filter. Therefore, a thickening tank is used in between clarifier and vacuum filter. 2. Pulp and Paper Industry Sludge Sludges are obtained from coarse screening, SS removal, BOD removal, and color re duction. Most of the sludges come from SS and BOD removals. Thickening precedes de watering. Drum belt or coil types of vacuum filters are commonly used in dewatering. Sludges from pulping and paper making produces cakes varying from 20 to 30% solids. A filter rate of 30 kg/m2*h is normally used for dewatering of primary waste solids. Biological wastes may be combined with primary wastes for vacuum filtration. Chemical addition aids the vacuum filtration process. Chemical conditioners, such as ferric chloride, alum, or polyelectrolytes, are observed to double the capacity of the vacuum filter for poorly filterable sludges. Such chemical treatment is generally necessary when activated sludge is included in the sludge to be de watered. 3. Other Types o f Sludges In the inorganic chemical industry, for the complete removal of harmful solid wastes such as metal (mercury, arsenic, etc.), sulfates are removed (recovered) by vacuum filtration. Sludge from the titanium dioxide industry, cane sugar refining processes, the glass man ufacturing industry, etc., could also be de watered using vacuum filtration.
VII. ADVANTAGES AND DISADVANTAGES OF VACUUM FILTRATION Advantages •
•
The proportion of solids in sludges is increased (almost doubled), which will result in the reduction of sludge volume, thus the transport cost. Sludge handling, too, becomes easier. Incineration costs are reduced by the increase in calorific value of sludge through the reduction of moisture.
236 • • • • • • • •
•
Water, Wastewater, and Sludge Filtration The reduction of moisture reduces the possibility of anaerobic digestion and, thus, odor problems. The disposal through landfill is facilitated because of the reduced possibility of con taminant leachate. It is compact in size and hence suitable for congested localities. It results in good performance in de watering digested sludges. It is a convenient process for the operator because of minimum contact with the sludge. Labor requirements for this process are minimal. It is a continuous process (stopped only for maintenance work). It is flexible in handling different types of sludges because the optimum operating conditions may be determined through laboratory studies, such as filter leaf test, for different sludges. It is well suited for hazardous wastes too.
Disadvantages • • • • • • • • • • •
It is not comparable to sand-bed treatment if land is available. It requires a high initial investment. Expert operating skills are needed. Chemical conditioning is needed in general and is a must for fresh sludges. Periodic maintenance of vacuum filtration is essential. It is not a complete process and further sludge treatment is needed before ultimate disposal. It is not suitable for smaller towns and rural areas because of the lack of expertise and high initial investment. Clogging of the filter is a common problem. Filter yield in vacuum filtration reduces with time because of a gradual increase in clogging. Filter material may deteriorate due to certain sludge characteristics. Closer monitoring of operating parameters is essential for effective performance.
REFERENCES 1. Spinosa, L. and Eikum, S., Dewatering of municipal sludges, in Characterization, Treatment and Use of Sewage Sludge, L ’Hermite, P. and Oh, H., Eds., D. Reidel Publishing, Holland, 1981, 69. 2. Svarovsky, L., Advances in solid-liquid separation I, Chem. Eng., July 2, 62, 1979. 3. Process Design Manual for Sludge Treatment and Disposal, EPA 625/1-79-011, Office of Technology Transfer, U.S. Environmental Protection Agency, Washington, D.C., 1979. 4. Egee, L. P., Vacuum filtration, in Process Equipment Series, Vol. 1, Bhatia, M. V. and Cheremisinoff, P. N., Eds., Technomic Publishing., Lancaster, PA, 1979. 5. Coackley, P. and Wilson, F., Flocculation with special reference to water and wastewater engineering, Filtr. Sep., 8, 61, 1971. 6. Vesilind, A. P., Treatment and Disposal of Wastewater Sludges, Ann Arbor Science, Ann Arbor, Mich., 1979. 7. Coackley, P. and Jones, B. R. S., Vacuum filtration I, Sewage Ind. Wastes, 28, 963, 1956. 8. Cheape, D. W., Jr., Leaf tests can establish optimum rotary-vacuum filter operation, Chem. Eng., June 14, 141, 1982. 9. Weber, W., Jr., Physico-chemical Process for Water Quality Control, Wiley Interscience, New York, 1972, 550. 10. Fair, G. Mi., Geyer, J. C., and Okun, D. A., Elements of Water Supply and Wastewater Disposal, John Wiley & Sons, New York, 1971, 608. 11. Basso, A. J., Vacuum filtration using filter-aids, Chem. Eng., April 19, 1982, 159. 12. Sugaya, K., private communications, Ishigaki Mechanical Industry Co., Ltd., Tokyo, 1987.
237 Chapter 13 PRESSU RE FILTRA TIO N Saravanam uthu Vigneswaran
TA BLE OF CONTENTS I.
Introduction.................................................................................................................... 238
II.
Principle and Theory...................................................................................................... 238
III.
Different T ypes...............................................................................................................240 A. Plate and Frame Presses and Recessed-Plate P resses..................................240 B. Sheet Filters....................................................................................................... 240 C. Shell and Leaf Filters .......................................................................................241 D. Variable Volume Filters................................................................................... 241
IV.
Design Parameters........................................................................................................ 243 A. Pressure D ro p .................................................................................................... 243 B. T emperature....................................................................................................... 244 C. Initial Mass F lu x ............................................................................................... 244 D. Filtration T im e .................................................................................................. 244 E. Downtim e...........................................................................................................244
V.
Applications of Pressure Filters................................................................................... 245
References....................................................................................................................................247
238
Water, Wastewater, and Sludge Filtration I. IN TRO D U C TIO N
Pressure filters are used for solid-liquid separation of sludge by the application of pressure on the solid-liquid mixture in order to squeeze out the liquid through a filter medium. The objectives of pressure filtration may be either: 1. 2.
To get a cake of higher solids content of 30 to 80% from slurries with a solids content ^ 5 to 40%, or To obtain a very clear filtrate from a liquid containing very fine particles (=^0.05 pm ) 1
The filter medium, which retains the solids and passes the liquid through it, must withstand the stress and strain during the application of high pressure. It is generally made of a cloth of natural or synthetic fibers, coil springs, a wire mesh fabric, or sheets made of particulate or fibrous materials such as diatomite, asbestos, or glass fiber bonded together with epoxy resin for added strength. II. PRIN C IPLE AND TH EO RY When pressure is applied to a slurry, the liquid flows out from the pores of the particles and through the filter medium, which acts as a support. Particles deposited on the filter medium increase the thickness of the cake. Some of the particles may even penetrate the medium, depending on the pore size of the medium. Retention of particles by the filter medium and the growth of cake thickness increases the medium resistance to the flow of liquid. If applied pressure is kept constant, then the feed flow rate will decrease. However, constant feed flow rate could be maintained by either increasing the pressure or by limiting the cake thickness on the filter medium. The basic filtration equation, as derived from Darcy’s Law, is as follows:2 AP • A
Q =
( 1)
where Q is the volumetric flow rate of the feed suspension; V is the total volume of filtrate passed through the filter in time t; A is the face area of the filter; Ap is the applied pressure drop across the cake and filter medium, which may vary with time; |x is the filtrate viscosity; Rf is the medium resistance; rav is the average specific resistance of sludge; and C is the feed concentration. If no loss of volume in the cake is assumed,
For higher feed concentrations, the volume of the feed slurry and the filtrate differ signif icantly. Therefore, a correction based on the effective concentration is necessary as follows:2
(3)
C,'C o rrected C
1 _ (m - o ps p
239 where m is the mass ratio of wet to dry filter cake; ps is the solids density; and p is the liquid density. The above correction is required in order to express the mass of solids in terms of the filtrate volume. Although the medium resistance (Rf) is theoretically constant, in practice, it varies with time due to the penetration of solids onto the medium. The specific cake resistance is dependent on the approach velocity, feed concentration, applied pressure drop, and the degree of flow consolidation that the cake undergoes with time. It decreases with velocity and feed concentration . 2 The effect of pressure on specific resistance (r) is conventionally expressed as: r = r0(Apc)n
(4)
where n is a constant of compressibility which takes a value of 0.5 to 1 . 1 ; Apc is the pressure drop across the cake; and rGis the cake resistance per unit applied pressure drop. Because each layer in a cake is subjected to a different pressure drop, an average value for specific resistance (rav) has to be taken. This value is defined as follows:2 AP, f Ap< d(Pc) Jo
(5)
r
Substituting Equation 4 in Equation 5, rav = (1 - n)r0(APc)n In Equation 1, substituting Equation dV dt
6
(6 )
for rav and Equation 2 for Q, AP • A
V (1 - n)r0(APc)nc — + |xRf
(7)
At constant filter area (A) and pressure, integration of the above equation gives: £ = V
(1
- n)r0(APc)"c|i. A + jiR f AAP 2APA2
The values of rG, n, and Rf could be determined from pilot-scale filtration tests, bomb-filter tests, or from a compression-permeability cell .2 Hence, Equation 1 may be solved for any mode of operation, such as constant pressure, constant rate, or variable rate and variable pressure, which are discussed in the latter sections. One could use the following equation to calculate the pressing time (more exactly the length of time to complete a press) which assumes that filtration continues until the chambers of the press are full of cake . 3 = 0.321n)d2(Cf - C„) APCo(100 - C J where T is the length of time to complete a press (h), d is the distance between cloths in cm; C0 and Cf are the sludge solids % during the initial and final stages; r is the specific
240
Water, Wastewater, and Sludge Filtration
resistance of the sludge (in cm/g); AP is the pressure in bars; and j] is the viscosity of the filtrate in centipoise. III. D IFFER EN T TYPES Pressure filters are classified into two groups, namely, batch and continuous pressure filters, based on their mode of operation. Even though the latter type of filters is desirable, they are not common in practice because of their complex nature and high cost. The ad vantages of batch pressure filters are • • •
Rapid filtration of fine particles, which would otherwise be at a low rate The compact nature of the filters, with a high filtering area per unit plant space occupied The flexibility of operation provided by them at a relatively low initial cost1
The disadvantage with the batch pressure filter is its high operating cost, especially when manually operated. Batch pressure filters are operated in step-wise sequence for each cycle as mentioned below: • • • • • •
Forming the filter cake Removing unfiltered slurry Washing the filter cake Compressing the filter cake to remove excess liquid Blowing air or gas through the cake to discharge excess liquid Discharging the cake Batch pressure filters can be grouped into three different types:
1. 2. 3.
Filter presses (e.g., plate and frame, recessed plate, and sheet filters) Leaf, plate, candle (tubular) filters (e.g., shell and leaf filters) Variable-volume filters (e.g., membrane filters)
Cartridge filters and strainers, too, are pressure filters, but they are usually used online to remove small amounts of solids from liquid streams. A. Plate and Frame Presses and Recessed-Plate Presses Filter presses consist of plates and frames in alternate sequence and can move along a guide (Figure 1). Plates have corrugated surfaces over which a filter medium, normally a woven cloth, is placed. Slurry feed enters through ports, and liquid flows out through the filter medium. There are various physical combinations in feeding slurry, drain, and guide. Another variation is the recessed-plate filter press which does not have any frame; the plate itself is recessed to allow the formation of cake. The advantage of plate and frame filter presses is that cake thickness could be varied by additional frames, which is important when handling slurries having variable characteristics. Compatibility with mechanized discharge and minimized leakage problems are the only advantages of recessed plate filter presses. Feed pressures for filter presses range from 690 kPa to as high as 6900 kPa. B. Sheet Filters Thin sheets (2 mm to 6 mm ) 1 are used to trap fine particles in the pores, similar to that in a deep bed filter, in order to obtain a clear filtrate. Trapped particles are flushed out and sheets are used repeatedly until they produce a filtrate acceptable in quality.
241
FIGURE 1. Plate and frame filter press. (From Moir, D. N., Chem. Eng., 89, 47, 1982. With permission.)
C. Shell and Leaf Filters In this category of filters, a number of hollow filter elements are used to separate solids. A closed vessel houses the filter elements on which solids are deposited, while liquid flows into the elements and out of the vessel. Major advantages of this type of filter are that it could be used for inflammable and toxic substances, as the filtrate and cake are contained in a closed vessel. The arrangement of a closed vessel also facilitates heating or cooling during, or at the end of, the filtration cycle . 1 These filters are classified according to the orientation of filter elements and their shape. D. Variable Volume Filters This class of filters has the additional feature of compressing the cake formed at the end of pressure filtration, thus producing drier cake which is easier to handle. Compression is achieved by means of inflating the membranes towards the filter medium once the feed is stopped (Figure 2). Compression of cake in this type of filter is more uniform; thus, cake washing is efficiently done. Membranes are used in rectangular and cylindrical shape filter presses. Another type of filter using compression to reduce the volume is the belt-filter press (Figure 3). Two acutely angled belts compress the slurry within their narrow gap, their edges being sealed by special belts. The cake is discharged at the end of a converging section. The belts can be either vertical or horizontal. Cake solids concentration ranges from 35 to 60% and belts of width up to 2.5 m are available. 3 The operational cost of the belt-filter press is much lower than that of other types of pressure filters, although it does not lead to high solid recovery and cake solid concentration.
Filtering
FIGURE 2.
Cake Discharge
Operating cycles of variable volume filter.7
High p ressure
Compression Washing of Filter Cloths
-fe.
ts> Water, Wastewater, and Sludge Filtration
243 FEED
■FILTRATE
RIBBON OF FILTER CAKE
FIGURE 3. Belt-filter press. (From Svarovsky, L., Chem. Eng., 89, 62, 1979. With permission.)
IV. D ESIG N PARAM ETERS In the design of pressure filters, as the characteristics and flow rate of slurry to be dewatered are known, the pressure filter can be designed to produce the required quality of cake. The following variables are to be chosen in order to obtain optimum performance of a pressure filter. • • • • •
Pressure drop Slurry temperature Initial mass flux Filtration time Downtime
Apart from the above variables, the filtration constant for a given set of slurry, filter medium, flow rate of slurry, and operating pressures has to be known, and can be calculated from pilot-scale testing. To get reliable data, the slurry to be used in pilot-scale testing should be similar to that to be dewatered in full-scale plant. The flow rate and operating pressure to be tested should also cover the full-scale values to be used. The batch pressure filters could be operated chiefly in the following modes: constant pressure only, constant rate only, or constant rate followed by constant pressure. In all batch filters, removal of cake, with or without washing, and precoating of the filter medium are done during each cycle. This time is called the downtime. A. Pressure Drop The output per unit area of filter (mass flow rate) will increase with the pressure drop. When selecting a pressure, it should be the maximum possible for a given material of construction and for a given configuration of the filter press. Pilot-scale testing should be conducted to verify whether the cake is effectively dewatered at the design pressure drop.
244
Water, Wastewater, and Sludge Filtration
INITIAL MASS FLUX FIGURE 4.
Typical average mass flux vs. initial mass flux curve.
B. Temperature The work required to dewater the sludge includes the necessary work against viscous forces during the expulsion of liquid. Increasing the temperature will decrease the viscosity and the viscous forces, making the process of filtration easier. However, the design tem perature should be chosen such that the slurry and the filter medium are not adversely affected. The possibility of exploiting the waste heat by heat recovery or by cooling in another process should be investigated, but heating purely for the purpose of increasing the mass flow rate may not be economical. C. Initial Mass Flux Brown5 derived the following equation for average mass flow rate (W) (liquid) during the total filter cycle, _ A[2xK * AP0f - (KAP/G , ) 2] 1 2 w = (ef + ed)x where A is the area of the filter, m2; x is the mass fraction of the solids in the slurry (expressed as a fraction of the liquid in the slurry); K is the filtration constant, kg m “ 3-s; Ap = pressure drop, N/m2; 0f = filtration time, h; 0d = downtime, h; G! = initial mass flux, kg/(m 2-h). Figure 4 shows the effect of initial mass flux on the maximum average mass flux (W/A)max for a given pressure drop (based on Equation 10). Once the pressure drop across the filter has been decided, the initial mass flux could be chosen from Figure 4 such that it is closer to the value of (W/A)max when the curve becomes asymptotic. D. Filtration Time Figure 5 shows the effect of filtration time on the average mass flux (based on Equation 10). This figure shows the existence of an optimum (W/A)max for a particular filtration time. Therefore, filtration time can be chosen such that the average mass flux (for the given G,) is maximum. E. Downtime As the downtime generally depends on the technique of cake removal, cake washing, and precoating the filter medium, it is difficult to manipulate it once a filter has been constructed. Careful choice of minimum downtime is a must to increase the output of the filter press.
(i
u)
245
FIGURE 5.
Typical average mass flux vs. filtration time curve.
Table 1 INDUSTRIAL APPLICATIONS OF DIFFERENT TYPES OF PRESSURE FILTERS Industry
Application
Chemical
Separation of organic and inorganic salts from suspension; removal of un dissolved particles; separation of un treated reagents; catalysts; liquid clarification To prepare consistent raw materials for production Recovery of coal and clay suspension Separation of precipitated materials
Ceramics Coal wastes Dye stuffs Wastewater treatment
Dewatering sludges for disposal; pol ishing of effluent
Fats and food produc tion Kaolin, chalk
Squeezing, refining Concentration before drying
Sugar industry Paper industry
Refining Treatment of paper mill sludge
Type of filter Plate and frames; leaf, plate, and candle
Recessed plate filter press
Recessed and plate and frame filter press Recessed plate, plate and frame filter presses, belt filter press Recessed, plate and frame Recessed plate, tube presses Circular plate, membrane Belt filter press
V. A PPLICA TIO N S O F PRESSU R E FILTERS Many industries use filter presses either in their production or in their sewage treatment. Different filter presses are used for similar industrial applications, due to the fact that characteristics of slurries vary; also, various filter press designs have wide-ranging appli cations. Selection of a particular type of filter press depends mainly on the filtering char acteristics of slurry, physical and chemical properties, compressibility, and chemical nature (organic, or inert), besides the objective of solid-liquid separation. Table 1 lists industries and their application of pressure filters with the type most commonly used .6 The performance of the pressure filter for different types of sludges is summarized in Table 2.
48
4.0
2.1
5.1 3.4 2.6
2.2
39.0 3.0 3.8
Digested (elutriated)
Activated
Water supply Industrial waste Food industrial activated
Chemical industrial activated
Broken stone waste Aluminum hydroxide Chemical sedimentation — —
_
_
—
—
_
75
55
4.0
Volatile (%)
Raw
Type of sludge
Total solids (%)
Polypropylene Polypropylene Polypropylene
Polypropylene
Polypropylene Polypropylene Polypropylene
Polypropylene
Polypropylene
Polypropylene
Filter cloth
— —
Ca(OH)2 Ca(OH)2 FeCl3 Ca(OH)2 FeCl3
Ca(OH)2 FeCl3 Ca(OH)2 FeCl3 Ca(OH)2 FeCl3
Chemical
30 20 10 16 20
25 9 40 10 55 18
Percent
Chemical dosage as % dry feed sludge solids
490 490 490
490
490 490 490
294
294
294
Filtration
1470 1470 1470
1470
1470 1470 1470
1470
1470
1470
Compression
Pressure (kPa)
23 75 58
77
52 68 78
68
55
55
Cake moisture content (%)
Table 2 PERFORM ANCE OF PRESSURE FILTRATION FO R DIFFERENT TYPES OF SLUDGES 7
20.0 1.7 2.1
2.8
2.5 3.3 2.1
2.0
4.4
3.7
Average mass flux (kg/m2*h)
Water, Wastewater, and Sludge Filtration
247 REFEREN CES 1. Moir, D. N., Selecting batch filters, Chem. Eng., 89, 47, 1982. 2. Svarovsky, L., Advances in solid-liquid separation. I, Chem. Eng., 86, 62, 1979. 3. Jones, B. R. S., Vacuum sludge filtration. II. Prediction on filter performance, Sewage Ind. Wastes, 28, 1103, 1956. 4. Svarovsky, L., Advances in solid-liquid separation. Ill, Chem. Eng., 86, 72, 1979. 5. Brown, T. R., Designing batch pressure filters, Chem. Eng., 89, 58, 1982. 6. Hooton, J. A. and Thomas, C. M., Filter Presses, in Process Engineering Technique Evaluation — Filtration, Suttle, H. K., Ed., Morgan-Grampian Publishers, Kent, England, 1969, 11. 7. Sugaya, K., private communication, Ishigaki Mechanical Industry Co., Tokyo, 1987.
249 Chapter 14
C EN TRIFUGES FOR SLUDGE TR EA TM EN T Christian Alt
TA BLE O F CONTENTS I.
Introduction.................................................................................................................... 250 A. Case H isto ry..................................................................................................... 250 B. Application of Centrifuges...............................................................................251
II.
Sedimentation Centrifuges...........................................................................................252 A. Theory of Centrifugal Sedimentation............................................................ 253 B. The Unit Area Equivalent................................................................................254 C. Operation and Performancesin Wastewater Sludge Dewatering and Thickening..................................................................................................255
III.
Different T ypes.............................................................................................................. 256 A. The Scroll Discharge SolidBowl Centrifuge................................................. 256 1. Principles of O peration........................................................................256 2. Perform ances.........................................................................................260 3. Theoretical Prediction........................................................................... 263 4. Conclusions............................................................................................ 265 B. The Disc-Type Centrifuge................................................................................ 265 1. Principles of O peration........................................................................265 2. Application and Perform ance..............................................................270 3. Theoretical Prediction........................................................................... 271
IV.
Conclusions..................................................................................................................... 272
References
272
250
Water, Wastewater, and Sludge Filtration I. IN TRO D U C TIO N
A. Case History Spin machines, used to remove a component from a multiphase mixture, may be among the earliest devices used in human evolution. Even in the latter part of the 19th century, there were centrifugal separation units which may be designated as centrifuges as defined at present. First of all, centrifuges were applied in food processing and mineral separation and later in the chemical industry. When environmental engineers realized the possible use of the centrifuge in the field of sludge treatment, centrifuges had already reached an advanced stage of development. Though there were increasing local requirements for conventional drying beds for the dewatering of sludges, it proved critical, especially in densely populated regions, due to high land requirements in addition to unsightliness and odor problems. Attempts were made to apply centrifuges in the beginning of the 20th century in Germany, using the centrifugal filter (Hermann Schafer at Cologne-Riehl). This centrifugal filter was preferred because of its enlarged filtration area compared to the conventional basket device. Moreover, this machine was able to operate quasi-continuously, and gave a sufficient yield. The rotor consisted of four tapered chambers crossed on a vertical shaft. A radial filter leaf on one side of the chamber was able to retain the solids more or less completely, while the other side of the chamber could be moved about automatically, discharging the filter cake. In the year 1904, this centrifuge was improved and enlarged into a six-chamber rotor, in collaboration with the manufacturer in Hannover-Linden. This type was used for many years in Frankfurt-on-Main and other communities in Germany, before the substitution of the filtering rotor by a solid bowl in which solids are removed by settling, and where the fine particles of sludge are found in a lesser amount in the clarified liquid. At this time, it was found to be impossible to remove the final 2 % of solids from the filtrate from the centrifugal filter. The new unit consisted of a base-bearing solid bowl with vertical axis of rotation, into which the sludge was fed through a tube extending down to the bottom of the bowl. In the course of the upward motion of the sludge, the solids migrated through the liquid radially to the bowl wall by centrifugal forces. The liquid spilled over the solids and was discharged by the machine via a skimmer arranged at the top and nearer to the shaft. The bowl could rotate with an elevated speed up to 1320 rpm. The rotation speed, as expressed, does not give adequate information about the increase in the migration velocity of the solids; the acceleration number of the g-factor was introduced, which describes the ratio of the acceleration in the centrifugal field to that in gravity. This can be expressed as: rco2 z = — = 5.59 x 10 - 4 Dn2 g
(1)
where z is the acceleration number, r the inner radius of the bowl, D the inner diameter of the bowl, n the revolutions per minute, and co the angular velocity in radians per second. The machine described above had an acceleration number (z) of 877, which in comparison to present machines is remarkable; this unit had only a 900-mm bowl. The solids were discharged automatically, in accordance with earlier patents of ter Meer (leader in centrifuge development) by dropping the bowl wall hydraulically. Consequently, this machine operated discontinuously with three distinct periods: loading, de watering, and solids discharge. A modified device with a bipartite bowl was used in the U.S. (first in Milwaukee and then in Baltimore) in the 1920s, mainly for fundamental studies . 1 It should be noted that, from the present view, this machine was comparatively complicated. Among
251 other types, there were drainage rings where retained solids formed a filter cake which acted like a filter medium for the removal of finer particles. At that time, however, the pretreatment of flocculation in order to remove fine particles was not so common as today. Additional problems were observed with the inevitable variations in sludge composition and characteristics of municipal wastewater sludges from plant to plant and within the plants themselves. In those days, centrifuges were not very flexible in regulation parameters. Furthermore, the parameters themselves were not studied in detail, and reactions, when the parameters were adjusted, could not be evaluated. This was also the case in chemical industries where centrifuges were applied widely. In conjunction with a lack of preventive maintenance of centrifuges in conventional wastewater plants, use of centrifuges became limited in the following decades. Moreover, vacuum filters and filter presses were introduced and frequently preferred, particularly in wastewater sludge de watering, because these devices appeared to be attractive in terms of cost. From 1925 to 1950, numerous studies in centrifugal dewatering were conducted, and since 1950, the centrifuges are being used again. This was mainly due to the improved scroll discharge solid bowl centrifuge together with the application of flocculants. Scroll discharge solid bowl centrifuges, frequently called decanters, operate continuously. The separation efficiencies were remarkable, on the order of 60 to 70%, though this was still not satisfactory in terms of economy. That may be due to the application of inorganic flocculants, since recycle of the clarified liquid may give rise to some undesirable effects. This was overcome by the use of poly electrolytes. B. Application of Centrifuges At present, centrifuges accomplish diverse tasks in wastewater treatment. Centrifuges are essentially used in two stages of sludge separation: sludge dewatering and sludge thickening . 2 The following types of sludges can, in general, be separated by centrifuges of different types: primary raw sludge to some extent with waste-activated or humus sludge, digested primary sludge, mixed digested sludge, extended aeration sludge, septic tank sludge, and excess activated sludge. In general, centrifuges can treat a large quantity of sludge and requires relatively a smaller space. The latter may be of interest where space is limited, and in the case of future extension. Centrifuges are now extremely versatile in regard to adjustment of sludge characteristics (by correct choice of operating parameters as well as by varied equipment and accessories). In wastewater sludge separation, the closed housing of centrifuges is felt to be advantageous to avoid odor problems. Even though the success of centrifugal separation in wastewater treatment resulted mainly from introduction of the polyelectrolytes, efforts are being made to use centrifuges without flocculants, if possible, to save the comparatively high cost of the polyelectrolytes. For example, in sludge de watering, 1.5 to 3 kg of flocculants per ton of solids are needed. At present, wastewater treatment requires a comparatively high degree of separation. Sludges, which are not easily separated, should have, for instance, 20 to 30% (or more) solids mass fraction in the solids discharge, while the effluent should have less than 0.3% in solids mass fraction. It should be noted that the solids density, which is an essential factor in the settling, is close to that of water, and the original particle size distribution of the nonflocculated solids may vary between 40 and 10 p,m. In the case of the activated sludge, the particle size distribution is down to a few microns. In activated sludge thickening, although the desired solids content in the thickened sludge may be obtained without problems, the removal of the very fine particles from the liquid requires comparatively high acceleration numbers of the centrifuge when flocculants are not used (or are used in inadequate quantity). Only a few categories of centrifuges are available for the dewatering and thickening of
252
Water, Wastewater, and Sludge Filtration
wastewater sludges: the scroll discharge solid bowl centrifuge, the disc-type centrifuge, and the imperforate basket centrifuge. All of them belong to the class of sedimentation centri fuges. The scroll discharge solid bowl centrifuge is, at present, preferentially used in municipal wastewater sludge dewatering, compared to the imperforate basket centrifuge, which may be found in Europe only in rare cases. The two could also be used with restrictions for thickening of activated sludges, while the disc-type centrifuge is preferred in the thickening process and especially in the case of handling bulking sludges. The evaluation of centrifuges is based mainly on effectiveness of separation, apart from reliability and economy. The effectiveness of separation could be estimated according to the solids removal (in fact, the effectiveness of the separation of the two phases, the solid and the liquid phase). The mass recovery for the individual phase is given by: For the solids:
~ - S ||
=
100
X
s0(s2 - s,)
(2)
where, @s is the solids mass recovery percent, s0 the solids mass fraction in the feed, s: the solids mass fraction of the effluent, and s2 the solids mass fraction of the solids discharge. For the liquid formed in concentrations: 0 L = - s ~ ° l)(C^ ~ ^ (P s
Co)(^ 2
x 100
(3)
Cl)
where 0 L is the liquid mass recovery percent, c0 the concentration of the feed (kg/m3), c t the concentration of the effluent (kg/m3), c 2 the concentration of the solids discharge (kg/ m3), and ps the density of dry solids. The separation efficiency E can thus be obtained as: E = (@s + ©L - 100) = (s2 - sQ)(s0 - st) x s0(s2 -
S
100
0(100 - s0)
x
100
(4 )
or for concentrations: E = (Cj c0(c2
CoKCo
Ci)(Ps
O P s
x
10Q
(5 )
C0)
For example, in the case of dewatering of a raw primary sludge, when the feed has a solids mass fraction (s0) of 1.5%, the effluent Sj of 0.3%, and the solids discharge 20%, the solids mass recovery 0 S and the separation efficiency can be computed as 70% and 57.5%, respectively. II. SED IM EN TA TIO N C EN TRIFUGES Sedimentation centrifuges have proved to be sufficiently effective, reliable, and econom ical in wastewater sludge de watering and thickening practice, and can be used in place of
253 other separation devices like vacuum filters, filter presses, and press belt filters, etc. Though the performances may frequently differ, economic considerations favor the centrifugal sep aration. Due to the very different compositions and characteristics of each and every waste water sludge, no general rule can be laid down to facilitate the selection and assessment of the most appropriate separation device. Only in a few plants, especially the large capacity ones, have experiments been carried out to study sludge characteristics in relation to operating parameters. Sedimentation centrifuges consist of a solid bowl or imperforate basket which has a vertical or horizontal axis of rotation. The sludge fed into the bowl forms an annular pool caused by the centrifugal forces. Solids are removed through migration of the particles across the liquid towards the wall of the bowl. The centrifugal force makes the migration velocity very much higher over the gravitation settling speed. The liquid, as well as the solids, are then discharged via separate components of the centrifuge. The simplest type of centrifuge is the imperforate basket batch type (Figure 1 ) which follows the principle of centrifugal sedimentation. It could be applied, with restrictions, to the other types with an evaluation of the physical correlations. A. Theory of Centrifugal Sedimentation The settling of discrete particles under centrifugal forces can be given by Stokes’ law (similar to gravitational settling). (Ps - PL)dp
" “ i8„
‘