Trading with Ichimoku Clouds: The Essential Guide to Ichimoku Kinko Hyo Technical Analysis (Wiley Trading) [1 ed.] 0470609931, 9780470609934
The essential guide to today's hottest technical indicator-the Ichimoku Kinko Hyo cloud chart Ichimoku Kinko Hyo is
434 49 10MB
English Pages 210 [237] Year 2010
Contents......Page 8
Introduction......Page 10
1- Ichimoku Components......Page 28
TENKAN SEN......Page 31
KIJUN SEN......Page 37
CHIKOU SPAN......Page 46
KUMO CLOUD COMPONENTS......Page 52
SENKOU SPAN A......Page 54
SENKOU SPAN B......Page 55
KUMO CLOUD......Page 57
COMPONENTS......Page 68
STRATEGY DESCRIPTION......Page 69
BACKTESTING......Page 72
EURUSD - A TWO·YEAR BACKTEST......Page 73
SUMMARY -TWO YEARS OF BACKTESIING......Page 161
EXMIINING THE BACKTESTING RESULTS......Page 164
5 - Ichimoku Strategies......Page 176
Tenkan Sen/Kijun Sen Crossover Strategy......Page 177
Kijun Sen Crossover Strategy......Page 181
Kuno Cloud Breakout Strategy......Page 182
Future Senoku Crossover Srtategy......Page 183
ICHIMOKU TIME ELEMENTS......Page 188
7 - Applied Trader Psychology......Page 198
THE PROBLEM WE HAVE WITH GETTING IN OUR OWN WAY......Page 199
IS THERE A CONSPIRACY AGAINST THE SMALL TRADER?......Page 200
TRADERS MYTH - SMART PEOPLE MAKE THE BEST TRADERS......Page 201
LOSING TRADES ARE ACCEPTABLE......Page 202
A SECCESSFUL SYSTEM WILL FORTIFY YOUR CONVICTIONS......Page 203
SELF-SABOTAGE AND HOW IT APPLIES TO YOUR TRADING......Page 205
IN SUMMARY - TRADER PSYCHOLOGY OVERALL......Page 206
8 - Day Trading with Ichimoku......Page 208
CONSEQUENCES OF TRADING WITHOUT A TRADING PLAN......Page 211
TRADING PLAN......Page 212
BACKTESTING......Page 213
CONCLUSION......Page 219
9 - Conclusion......Page 220
Ichimoku Analysis Sheet......Page 222
Bibliography......Page 226
About the Author......Page 228
Index......Page 230
Recommend Papers


![The ART of Trading: Combining the Science of Technical Analysis with the Art of Reality-Based Trading (Wiley Trading) [1 ed.]
0470187727, 9780470187722, 9780470280164](https://ebin.pub/img/200x200/the-art-of-trading-combining-the-science-of-technical-analysis-with-the-art-of-reality-based-trading-wiley-trading-1nbsped-0470187727-9780470187722-9780470280164.jpg)

![Chart Your Way To Profits: The Online Trader's Guide to Technical Analysis with ProphetCharts (Wiley Trading) [2 ed.]
0470620021, 9780470620021, 0470648864, 9780470648865](https://ebin.pub/img/200x200/chart-your-way-to-profits-the-online-traders-guide-to-technical-analysis-with-prophetcharts-wiley-trading-2nbsped-0470620021-9780470620021-0470648864-9780470648865.jpg)


![Trading with Ichimoku Clouds: The Essential Guide to Ichimoku Kinko Hyo Technical Analysis (Wiley Trading) [1 ed.]
0470609931, 9780470609934](https://ebin.pub/img/200x200/trading-with-ichimoku-clouds-the-essential-guide-to-ichimoku-kinko-hyo-technical-analysis-wiley-trading-1nbsped-0470609931-9780470609934.jpg)
- Author / Uploaded
- Manesh Patel
File loading please wait...
Citation preview
Trading with Ichimoku Clouds
,
Founded in 1807, John Wiley & SOilS is the oldest independent publish ing company in Ule United States. WiUl oices in North America, Europe,
Australia and Asia, Wiley is globally committed to developing and market ing print and elecronic products and services for our customers' profes sional and personal knowledge and understanding. The Wiley Trading series features books by raders who have survived the market's ever changing temperament and have prospered-some by reinvening systems, others by getting back to basics. Whether a novice trader, professional or somewhere in-between, hese books will provide the advice and strategies needed to prosper today and well into the future. For a list of ailable titles, visit our Web site at www.WileyFinance.com.
n
Trading with Ichimoku Clouds The Essential Guide to Ichimoku Kinko Hyo Technical Analysis
tlANESH PA'I'EL
i ILY
John Wiley & Sons, Inc.
1II
Copyright 0 2010 by E,!.!. Capitai ine. The right of Manesh Pael to be idenied as the author
has been assel1ed in accordance with the Copyright, Designs and Patents Act 1988. Publishcd by John Wiley & Sons, Inc., Hoboken, New Jcrsey.
]'ublished simultaneously in Canada.
Chans used ith pcmlission of TTadeStalion, Inc. No pa, of this publication may be reproduced, stored in a retrieval system, or transmitted in any fonn or by any means, electronic, mechanical, photocopying, rccording, scnning, or othe'ise, except s pennitted under Sec.ion 107 or 108 of the 1976 United States Copyright Act, without eit.her the prior writen pemlission of the Publisher, or au.horization through payment of the appropriate per-copy fee to the Copyright Clearance Center, Inc., '22 Rosewood Driw, Dam'ers, MA 01923, (978) 750-8400, fax (978) G46-8GOO, or on the web at ww.copyrighl.com.
Requess to the Publisher for pennission should be addressed to the
Pemlissions Department, John Wiley & Sons. lnc., I I I River S.reet,. Hoboken, NJ 07030, (201)
748-fJ I, fax (201) 748-f()8, ur online at hltp:lwww.wiley.cugopemlis>iuns.
Limit of LiabitityDisdaimer of Warranty: While the publi>her and auhor have used their best
dfons n prepring this book, they make no representations or warrdnies wih respect LO the accuracy or completeness of the cuntent> of ls book and >pecilcally di>claim any implied
warranti; of merchantabilit.y or fltne>s for a prticular lu)use. No warranty may be created
or extended by sales repre>entative> or written >ale> materiab. The advice and strategies contained herein may not be suitable for your situatiun. You >hould consult wih a professional where appropriate. :either he publisher nor author shal be liable for any loss of proit or any other ;ummercial danlages, including but not limited to special, incidental, consequential, or other damages. For general infonlJation on our other products and selviees or for technical support, plese contact our Customer Care Deparment within the Unied States at (800) 762·2974, outside the United States at. (317) 572-3993 or fax (317) 572-4002. Wiley also publishes its books n a vaiety of electronic fomlats. Some content that appears in
print may not be available in electronic books. For more infonnation about Wiley products, visit. our web site at ww.wiley.com.
Library ofCoIgress Cata/ogillg-ifl-PubUccltioll Dclta; Patel, Manesh. Trading with Ichimoku clouds: the essential guide to Ichimoku Kinko Hyo technical
analysis I Manesh Patel.
p. cm. - (Wiley trading series)
Includes bibliographical references and index. ISBN 978-4M70-OO99J-4 (cloth)
J. hwestmen.analysis.
2. Stocks-Prices-Charts, diagrams, etc.
HG4529.P38 2010 332.f3'2042-dc22
L Title.
2009052168 Printed in the United States of America.
10
9
8
7
6
5
4
3
2
,v
I am
ded'icat'ing lhis book to my la.leJalher Ra,manla. . Pald-afa,lher who encouraged me to be the best I can and to follow my dtea.ms. If t wele notfo' him, I 'would not be who I am today. A portion of the proceeds rom this book will be given to various chariies around he world in his name.
v
l
Contents
Introduction
Ix
Background
IX
Components of a Trading System
�IIAI·�K.
Ichlmoku Components
1
4
Tenkan Sen
10
Kijun Sen
19
Chikou Span Kumo Cloud Components
25
27
Senkou Span A
28
Senkou Span B
30
Kumo Cloud
t;IIAI·'rI�K :
xv
Ichlmoku Trading Plan
41
41
Components Strategy Description
42
t:IIAI·'I'.�K3
45
Ichlmoku 8ackl,esting
Backtesting EURUSD-A Two-Year Backlest Summary-Two Years of Backtesting
45
46
134
137 Examining the Backlest Results Optimize Trading Plan
137 144 vII
CONTENTS
"ill
149 Ideallchimoku Strategy
150
(;II;\I"I'I:H 6
llil
Ichlmoku 'I'tme Elements
Ichimoku Time Elements (;II\I"I':H 7
Applied 'l'l 'uder I'sychoht�yl Doug Laughlin
Is It as Easy as Just Being Taught a New System? The Problem We Have with Getting in Our Own Way Is There a Conspiracy Against the Small Trader? Traders Myth-Smart People Make the Best Traders Losing Trades Are Acceptable A Successful System Will Fortify Your Convictions Self-Sabotage and How It Applies to Your Trading
161
171 172 172 173
17.
175
176
178
In Summary-Trader Psychology Overall
179
Cllf\I"I'EH 8
181
DI�' 'l'I'ldlng "'lth I:hlmoku
Consequences of Trading without a Trading Plan
185
Trading Plan
186
Backtesting
192
Conclusion CII\ J "I'EH 9
18'
Conclushtn
193
Ichlmoku Anulysls Sheet
195
Blbllogl'aph�'
199
About the Authol'
�1I1
Index
�03
Introduction
Rf\CKGROUND �Japanese Candles" is a phrase that s well known among the trading cam
mWlity. f the phrase is searched on he Intenet, 3,810,000 serches are
available in the Google search engine today. In comparison, if �Ichimoku" is searched, 141,000 searches appear, which is quite a difference. Steve Nison brought Japanese Candlesticks to the Westen world and did a great job illusrating how it cn be used to become a successful trader. He left a huge mark on the trading community, and today institutions down to he average retail trader use Japnese Candlesicks in some form or fashion in their technical analysis. This book brings Ule next phrase of Japanese technical analysis to the Westen world, �Ichimoku Kinko Hyo." Ichimoku Kinko Ryo is a system
Umt has been used successfuly hroughout Japn for years but never has progressed fOrvard in the Western world. If a trader combines Japanese Candles with Ichimoku Kinko Byo, a powerful system is available to him or her. In fact, it increases the probability of trading drastically and can be evidenced by trading in a "paper" account after reading this book Japanese
Candlesticks ll not be discussed furher in this book and any addiional
infomlation regarding this topic is avaiJable through Steve Nison's books and training seminars.
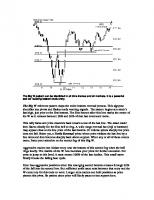
By the time this book is published, the market will be one that has not been experienced previously; not even historical traders can predict what the future holds. There are no historical references to the current market models. We have seen the volatility index (VlX) (Figure 1.1), which aver aged a value of \0 to 12 for a number of years in the middle of this decade, and exceeded 50 for the lrst time during the collapse of the global flnancial markets. Why is this market different from any other historical period? One of he biggest reasons that he market is so different is technology. With the advent of the Intenet, infonnation can be received globa.y in a matter of milliseconds. During the crash of 1929, no computers were avail able and television was n its early stages. The first televised live broad cast from a plane had just occurred. Two years earlier, the biggest news
INTRODUCTION
,..
•
••
••
••
••
•
•
•
•
�I(.UKE 1.1
•
•
•
•
•
•
•
TradeStation Monthly Chart of SVIX.X Volatility Index
worldwide was: "n 1927, he president of the American Telephone and Telegraph Company in New York talked by phone to Herbert Hoover in Washington, more Ulan 200 miles away. The president of ile telephone company was able to see clearly the face of Mr. Hoover as he talked. This proved to the world hat elecricity could be used to carry sight as well as sound. " During le mid-1980s, computers were still in heir early stages. It was the beginning of the personal computer era-Microsoft was introducing the operation system MS-DOS 3.2, Apple was inroducing the Mac Plus, IBM was launching the irst laptop computer, and so forth. Technology be gan to advance drasically in a short period. The size of a microchip was getting smaller and smaller and the computing power within the microchip was exponentilly i.ncreasi.ng in a short amount of ime. What normally took a room full of technological resources to do was now available in the size of a desktop computer.
A perfect example of the rapid change n technoloy is mainframes.
Back n the 1970s, IBM dominated the mame "space." Mframes were perfomling the compuing power needed by various industry groups. It would normlly take an entire room size of more han 1,000 square feet just to be able to store this technology. Not only that, the room needed
the ability to store all the cabling and lso required e support of a
Introduction
l
high-powered cooling system. The expense associated wih mainframes was in the magnitude of more than $100,000. Only big corporations and uni versities could afford such "luxuries." Smll companies had to perform cl culations by hand or they had to hire some of these larger corporations to perform the task they needed. With the introduction of personal computers in the mid-1980s, small compnies and private individuals were now able to directly participate in the computer era. Prices dropped from a six-igure number to a magnitude of $3,000 to $5,000. My personal experience back
in the 1980s was with the Apple JE and then progressed forward with the
BM XT machines will Microsoft DOS. These were he days where there really was no graphical interface and everything was in the form of pure text.
n the 1990s, technology introduced the concept of the Tntemet and the
World Wide Web. A drasic event in a smll town in India now can be heard and seen throughout the world in a matter of seconds. lnfomlation trav eled the world in microseconds compared to days/weeks/monlls as it did in earlier decades. III regard to the inancial markets, one event in a partic ular market caused an instant �chain reaction" across llfinancial markets
globally within a short amount of time. Not only can the events occur in stantly but they can also affect everyone, that is, lower, middle, and upper classes worldwide. By the late 1990s, almost every individual around the world had some sort of investment in some inancial market, either tluough an online real-time brokerage account, money market account, CD, retire
ment account (401(k)), and so fOrl. Control was now in the hnds of an
emoional retail customer compared to a professional trader.
In s book, you len lle key aspects of becoming a professional
trader. I walk you through the complete process of trading wih Ichimoku Kinko Hyo. After you read he book, vrious resources are avilable to you to make sure that your joumey into the "Ichimoku world" is successful.
l'yI).�S of' 'I'.'ading In order to trade, two key questions always need to be addressed: Quesion
I: When and what price should we enter the trade?
Question 2: When and what price should we exit a rade? There are two analytical models-Technical Analysis nd Fundamen tal Analysis-that help the trader get the answers to these quesions. Tech nical nalysis consists of looking at price and ime action for a prticular instrument. Today, online brokerage accouns along with other inns of fer a reil customer htuldreds of indicators for price and time analysis. The indicators are sometimes called "studies" and they are mahematical
xii
INTRODUCTION
formulas that represent price and time acion in a cerain way. Wih a cer tain rule set, Ule graphical indicator tells a trader key information on what has been happening with price over a certain time period. Examples of some indicators are Moving Averages, Average True Range (ATR), Stochas tic, Pivot points, and so forth. Hundreds of different srategies can be found wih Jlese indicators. Srategies take the various indicators and come up with a certain set of rules hat the trader cn follow to rade. Iinite numbers of possihle strate gies call be created for a trading system by a trader with the hundreds of indicators available. Furthermore, some strategies focus only on certain markets and on certain time frames. The days of trading based on a sim ple stratey re gone! Technical charts are now clutered with indicators, lines, text, graphical objects, and so forth. The charts are so cluttered that
it is hrd for anyone new to understnd a chart at "lrst glance." t takes
days and even monhs for someone to understand how to trade based on
someone's rading system. My background is engineering and as a result, I tend to overcompli cate Ulings as many engineers have a tendency to do. Before he days of Ichimoku Kinko Hyo, I mainly traded stocks. f someone looked at m y charts before I adopted Ichimoku Kinko Hyo, he or she would be com pletely confused. In perfomling a technical analysis, I would irst start by drawing Fibonacci lines and Gnn lines.lf this reveled a possible enry, I would then look at the Commodity Channel Indicator (CCI), the Average and see f it
T11e Range indicator, and he stochastic indicator. If I got a "green light" from
those indicators
hen I would look at the m.rket
indexes
supported my decision in the direction I planned to take.
r never wanted to trade aginst the market in general and as a result, I
would look at he Trading Index lndicator (TRIN) nd then analyze the S&P
futures with FibonaccilGanniCCIIATR, and so forth. f everything "lined
up" on my two-monitor screen, then] moved forwrd to trade based on piv
ots. I hope that everyone followed that because I was insane back in those days. I look back nd wonder how] understood he complicated process that I created. That is a lot of work just to analyze
one stock. You
can im
age how hard it was to analyze all5,OOO-plus stock insments. One person stated it perfectly to me when they saw my screens: "death by indicators."
Unlike technical analysis, which is graphical, the second analtical model-fundamental analysis-is based on numbers. Let us first look at fundamental analysis for stocks and how i t is used. In fundamental valu ation for stocks, you are looking to buy a stock based on Ulat company's being undervalued. In order to detellline if a company is being wlderval ued, a "fair vlue" for a company needs to be determined. Some traders may use a ProiEamings (PIE) ratio to deteline whether to purchase a
xiii
Introduction
stock. For example, if a PE raio of to is used, then any stock at a PE of 10 or less could be purchased.
One of the key things I look at s the 10 PE ratio level on a chart. f you
see a PIE raio of 10, normlly you see technical support in hat prticular
stock. Other variations that may be used are stocks at a PE level of to
or less as well as Cash to Short Term CST) Liability's level of50 percent. This would indicate the stock is trading at a low emings multiple. The stock s well funded in temlS of its debt exposure, llof his obviously has
nothing to do with technicals or charing-it's inancial company analysis. But when overlying these stocks onto a cht you may be able to apply support levels to this fundamenal analysis.
Today, f you listen to the news, you will see that many companies pro
vide many revisions to their numbers and also many companies are "cook ing he books." They mnipulate numbers before eangs IlIlOWlcements just to drive the stock price higher. Based on these mnipulated values, fun damentlists will buy/sell he stock lithe truth comes out, heir invesbnent will be destroyed completely. In the last couple of years, many companies
rust the results f his s happening more and more often? Let us say that a
have been geting n rouble based on "accouning practices." How can you company is not manipulaing the numbers and they announce a good quar
ter, why does a stock go down when they beat estimates and have good fundamental values? Why will some insruments move more than 20 per cent faster than their enings percentage groWtJl? There is no direct an
swer to these questions. Everything depends on speculaion, which is not predictable. Here s ll aricle n USA Toda.y on June 27, 2002, on a com pallY called WorldCom: VorldCom's accounting game is stunning 'investors who thought lhe loophole lhe teiecomfil'm used was sewn shut years ago. Showing Owl accounting gi-mm'icks nwy f.de but never teafly go a'way, WorldCom acknowledged it impOperly "capitalized" costs. Th'is shen,nigan was believed to be one lhat i, s quicdy detected by aalysts a.nd, if not, used to fudge books by much smaller amounts. "ds had been a huge problem at one time, but it has receded
over the yean," sa.ys Robert ls of Lehman Bros. "How was lhis oveltooked by people who m'e supposed to be looking .t "t?" he asks.
Wor/dCom used lhe gimmick to a level never befoe seen. he
compa,ny showed
·
$1.4 b"fl:ion proit in 2001, mther than a loss,
by uS'ing wh.t's essentially te oldest ttick in lhe book.
Rather limn subtr.cting cerla:in costs-which .nalysts Irink were jor taint.ining telecom systems-'om profit, it called them long-term investments. Doing lhis allowed W01tdCom to inlate
lv
INTRODUCTION
over time, r,lha than aff at once up front.
emnings beca,use from e.rn'ings
le
costs of long-tn! 'investments .re subtwted
WorldCom wouldn't say which costs were 'incorrecUy mcol'ded Things to kep i, n mind about impr'oper capitaUzation: High-proile cmnpanies have pulled 'it off before. It's an easy way for high-g1'Owth companies to de/a,y l'ecording costs, says HOWQ,rd Schiht, president of lhe Centerfol' Fia, ndal Resem'ch & Anal.ysis.
For insl,nce, Amrica Online paid a $3.5 millionjine to the Se
of trial. diskettes
curilies and Exchange Commission 'in 2000 to settle charges it cap
'italized the costs of ma ,iring out thousands nid-'90s.
in lhe
w SEC found that by not charging the expense right a/way, AOL
1'eported a proit instead oj a 10ssJor Ihme year·s. AOL s.ys it stopped
capitalizing lhe costs in Oclober 1996 bemuse it changed its busi
ness model. "t's was completely dfent, as AOL's accounting was
alwaysJully disclosed and AOL did not admit any wrongdoing 'in its settlement aglCement," sa,ys spokeswoman Ann Brackbill. Any company in Q,ny industy can use lhe l,ctic. We have discussed fundamentaJ analysis for stocks but are the cur rencies the same? How do you now apply fundamental analysis to trading currencies? In order to answer his question, central bank policies need to be discussed. First, Ulere is hawkish (which is a bias towrd raising inter
est rates). A bank can do his to stop inlation, to reduce money supply, and so forth. Normally f the future of a currency has higher interest rates,
then he value of hat currency should increase. Next, here is a central bnk policy that is dovish (which is bias toward lowering interest rates). This policy is used to increase money supply, help stimulate an economy, and so forth. f you can find a currency pair with one COlUltry being dovish and another being hawkish then you have a great currency rade from a fWldamental viepoint. For example, in Ule past few yers, Ule Japanese yen (Japan had a Zero Interest Rate Policy) versus almost any currency. If you have ever herd of Ule fmous concept "crry rade," it is dealing with the Japanese yen and other currency pirs. Since he nancial mrket meltdown, the United States has had a policy of keeping rates under 1 per cent for n extended period of time. As a result, the U.S. dollar is a crry trade with the Japnese yen nd has subsequently led to a decline i n the U.S. dollr. So far, fWllamental anlysis for stocks and currencies has been dis cussed and it is apparent that you have to know a lot of ormation in
order to rade stocks and currencies wih his approach. How do e other insruments such as commodity futures (Con, Wheat, Soybeans, Feeder
Cattle, and so forth) fare with fundamental analysis? If you are trading all
Introduction
v
these instruments, you have o have a "global" view of everything that is
going on in he world n order to rade. Some traders have taken the time
to leam, especially with the Intemet; however, for many people that is vir
tually impossible. The main goal of this book is to simplfy trading. All the fundamental
aspects of each instrument and market will be
bult into
price. Therefore,
we are only going to rely on price action on the charts to deteline when
to trade and when not to trade. Ts is the assumpion behind Ichimoku Kinko Hyo, a technical system. .f you are a fundamental trader, my sugges tion would be to combine the technical and fundamental analysis togeher as part of your trading system. Remember, your trading system has to be something you are comfortable with and fits your �personaUty." Anything short of that llbefa.il.ure.
Now, we are going to proceed forward and start to create he founda
tion "blocks" for you to become a professional trader using the Tchimoku
Kinko Byo system.
C O �I"ONlNl'S O F A TRAilING S'S'I'IC�I Trading .nd investing .re very simple processes and we human be
nalely, we have a lol oj biases thal enler into trading decisions.
ings try to make it 'into something much more complex. U1fortu
f believe people get exaclfy what lhey want out of lhe markets and
most people are afraid of success or.ilure. As a resull, they tend o
resist clwnge and continue to follow their natural. biases and lose 'in the ma,rkets. When you get lid oj the fem', you tend to get id of the biases.
As Jor risk, most people don't understand t, including a lot of
professionals, and what's really interest'ing is that once you under stand risk and porfolio managment, you can design
,
tmding sys
tem with al,most any IVel oj pe1jOl'lnance. -Van
K. Tharp
Backgl'ollnd
a lot about life b y observing nature's creatures, obser vations that can beneit every aspect of someone's life. Let us examine a
People can leam
cougar and how it hlts for prey. The cougar is one of nature's fiercest
creatures. When hlting for prey, a cougar is strategic. If a cougar Inds a herd of deer, it will wait patiently observing the entire herd looking for th e weakness wilin he herd. The reason for lis is lat the cougar can only
INTRODUCTION
run at top speed for short distances. Therefore, it is imperative to get close to its prey
s
s
possible before making a killing srike. Otherwise, the
opportunity will be lost and it may be some ime before the next one ap pears. The more days that the cougar goes without food, the slower it il
be able to n, thus making it harder and harder to atack its prey. So why are we talkillg about cougars?
Playing the market is very much like tlle cougar's hunt for prey. Whether you are trading the Forex market, the Futures market, the Op tions mrket, the Equities market, and so fortll, you must have a pl.n be
fore entering each trade. If you do not, it llbe harder and hrder to ind opportuniies because each lost opportwtity will take a toll mentally, phys
ically, and psychologically on your well-being. Therefore, you must observe he insrument grealy before execuing
a trade. In another words, you must become an a.nalyst before a trader. r you are a trader before an analyst then you will be "rolling dice" at each
opportunity. Just like the cougar obsenres its prey for weaknesses before becoming a hWlter, you must analyze before trading, ollerwise success will get further and further away.
An nalyst observes he instrument p.tiently wltil an opportunity is
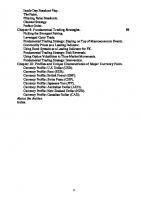
seen. Once an opportunity is present, a plan is executed. The plan consists of entry criteria, money management, and so forth. igure 1.2 s an example
of a good rading plan. A ue rader llnot play a "probabiliy game" but
instead wait for the mrket to "show" him or her the opportunity hrough paience and discipline.
Someone once told me "Trading i s neither logical nor predictable." Af ter years of rading, I can honestly say that statement is completely rue. It
A!!�l I I.li
Fundamental PIE PEG Earnings
Find Trades
''' '\ Scans
Decillion
6
YES
CNBC
Technical
Magazine Newspapers
High Probabili�
Ichimoku System
NO
Set Alerts
Future TiOO
FIGUKI� 1.2
Trading Plan Example
How: Option
Fulures
Instrument
Execute
)' ( MOO" Manageme mnt M
Introduction
:wll
is a probability gme, You have to have a system to help increase your prob� ability of success or you are just gambling. By rolling a dice, a person has a probability of 50 percent on the desired outcome. Therefore, one of our goals is to trade with a higher probability of success than 50 percent. How do you do that? This can be achieved by creating a trading system that max imizes proits when you are right and inimizes losses when you re wrong (i.e., play trends instead of consolidation pattens). A trend is when price goes in a certain direction for a long period of ime whereas a consolidaion pattem is where price goes "back and forth" among a range of prices. Trudin: .-.11
My mentor always st.ated the following: A System with out a proper mind set leads to ruin; however, Ule proper ind set perfectly aligned with he right mind set leads to Success." When evaluaing trading systems and plns, we lways ask the follow ing two questions: "
I.
Does le system/plan cover he mind set required to trade he system?
2.
Does the system/plan cover the personality required to rade the system?
hy do we ask these questions? There are many different trading plans out there. Each plan requires a pariculr mind set and personlity from the rader using he system. Does your plan match your pesonl iy nd mindset? If not hen you are bound to fil. Take lhe time to ind what w'ks · you! If the trading plan we create n this book is not for you then change it so you are comfortable with it. Do not use it if you are not comfortable with it. The irst component of the trading system is the trading plan. A trding plan is where you take a certain srategy and execute it wih a certain set of rules. It takes all he emotions and decision-making process completely out so someone just has to follow the rading plan and play the odds. The muority of retail traders today do not have a trading plan and are �blindly" trading. WiUlOut a plan, hey are gambling instead of system trading. ll they know is that they want to make money. Therefore, they go through a rial and error scenario to nd a stratey hat works for hem. If by chance, the strategy starts to fail, they drop that srategy and seek another one. They switch strategies as much as le "mood" changes in Ule mrket. This is a dangerous stratey because if volatiliy is high then the market is swinging up and down drasically. s a result, lere will be no consistency in rading, Without consistency, traders become less patient and the less patient a person is, the higher he probability that a mistake will be made (i.e., higher losses). This is a vicious cycle that many cannot escape!
INTRODUCTION
1-
-
•
-
1' /
••
"
nGUKE I.�I
•
•
TradeStation Daily (hart, Daily (hart of SINDU February 2 7 , 2007
A perfect example of his is shown in Figure
1.3.
It is a chrt of the
Dow Jones Indusial Average on May 1, 2007. On s date, the market went down drasically and there was a massive sell-off as people panicked.
A few months later on April 18, 2007, the market had completely reraced 100 percent back to the original price before the big drop. In fact, the market coninued to proceed higher. How many people do you think had a trading plan on Febuary 27, 2007? How many people had "built-in� stops? lf you examine the price acion before his major drop, you will see Ulat the markets have been going higher and higher for the last couple of years. Before February 2007, the market had been
in
a major bull run. The price
acion set a mode of "quick easy cash" mentaliy. People could buy and walk away nd expect a 10 percent average yearly profit, which was three imes more than a money market savings account. Many people thought it was a "sure bet" hat tiley started to use margin to hold positions for hat quick percentage retn. They did itis in heir regular brokerage ac counts along with their retirement accounts. When he market decided to correct itself, a couple of down days caused major panic across le globe. It happened in the stock market, currency market, bond market, commod ity market, and so forh. The big daily down bar is the panic hat took place. The people who had a trading plan most likely were out before that major down day occurred. If you were trading wih Ichimoku, you would have
Introduction
'-.
"
I�IGUR. 1.4
TradeStation Daily Ichimoku Chart, Chart ofS1NOU Feb 28, 2007
been out of the market eiher one or two days before the major down day (igu,e T.4J, A rading plan should consist of he following four components; I.
What instruments will be raded nd when?
a. Instrument examples: Stock, Exchange�Traded Fwlds, Option, u ture, and so forth.
b. Time frame: Tick, 1 minute, 3 minutes, 120 minutes, daily, weekly 2.
Enry Rules: R.
Fundamental: PEG, PE, Cash flow, and so forh
b. Technical Analysis:
Ichimoku, Moving Average, Average True
Range, Fibonacci, Gann Theory, Pivots, Volume Spread analysis, and so forth 3.
Money Management:
a. Stop: lf you are wrong, where ll you get out of the trade? Believe it or not, there are many traders who do not use a stop at ll. They are fearful that the brokers/market makers will see their stop and
n
le price to hit ll the stops. That s true in some cases especially
i f you are trading lower ime frames. However, what will happen to
your account f a news announcement comes and moves price dras tically in a matter of milliseconds? Wih the use of an automated
INTRODUCTION trading system with the latest technology, mUlions of trades can now be executed in less Ulan one second! Do you want to be on Ule other side of the trade? Notice, I have used he word ustop" compred to "stop loss." In my mentoring, the biggest obstacle for someone to overcome is the psychology of the word "loss" in "stop loss." The word "loss" has a negative meaning that people fear and try to avoid. When it does occur, Ule person's state of mind is altered to a point where logical hinking no longer occurs nd "panic" sets in. Many people believe hey do not pnic when Uley have a loss but here are many forms of panic. Here is a great analogy to prove the point: In elementary school, there are two boys, the st boy's name is Ben nd he second boy's name is Frank. Frank has a perfect atten dance and is proud of his accomplishment and strives every day to make sure he maintins hat status. One day, Frnk was walkng to
school as he nonna.y does each day. s he was walking, nother
boy named Ben approaches Frnk. Ben hits Frank in the stomach
for no apparent reason and hen walks away. Frank does not under stnd why Ben did hat so he does not take any action. The second day Frank walks to school and runs into Ben again. Again, Ben hits Frank in the stomach nd then wlks away. The third day comes and Frank, who is afraid of getting hit, decides to take another route
to school in order to avoid Ben. Frank avoids Ben but he arrives to school late. The route he had to take was a route that took longer
hn he expected. s perfect attendance was ruined in one day due to Ben! So what
is
the morl? Frank got hit once but kept on follow
ing his plan to go to school as he normally does. When the second time occurred, he was cautious but not prepred because he did not think it would happen agn but it did. The third time, he re acted but he lost s perfect attendance. He was so worried about Ben he forgot about this periect attendance, which was important to him. When rading, if you view the word "stop" as a loss, it is a neg ative state of mind. If it occurs once, twice, three times, and so on, sooner or later it will alter your slate of mind to a point where you will start to react to it instead of following your "game plan." If you get stopped out of a rade that melS you luere wrong. Remember, the goal is to have a trading stratey that minimizes losses when you re wrong and maximizes proits when you are right. Notice I said minimize not none? Usi.ng the word "none" is not real, it is a dream world.
Introduction
b. Proit target: Some strategies use a proit target and some don't. It
is a not a must compared to c.
a
Stop.
Position sizing: s the trend develops, you have an option of adding
or removing posiions. One strategy is where you enter he initial
position with a low contrac/share size. This is done to lower risk and to "test the ield." If the trend develops len you add more and more posiions on pulJbacks. The second strategy is the reverse of Ule st one and you stt wih a large number of contraclSl
shares. s the trend develops, you remove positions at mjor support/resistance values. Each posiion sizing strategy has its
pro/cons. You can research both types further; however, remem ber, you must select a plan hat its your personality. like risk at ll then
do
f you do not
not do any position sizing or any scaling in
(adding) as the trend develops.
d. Time EntrylExit: Some strategies focus around time. They ypically
do his because volume is high or low during he trad.ng time of
interest.
e. Money Management 1.
Risk per Trade: These parameters deine he most risk that a trader is willing to take per lrade.
f the trade
is long term, the
risk per trade will be higher compared to someone who is trad ing on a short-term ime frme. For exmple, most people who trade daily charts for currencies have a max risk of 200 pips per
trade. They are wilng to accept this value because hey are ex pecing to be in a trade for one month to four months averaging arowld 40..plus pip proit. They are expecing a 2: 1 profi/risk raio on the trade. So why does his matter? The reason is that we are trading a system and not gambling. Evething is deined in a system so you are playing the "numbers." If you have a loss on two trades nd win on nother trade, you know Ulat at least
you ll break even because the one win provided 400 pips in
proit and he two losses totaled 400 pips. Together, it equls zero. Therefore, your worst-case scenario is one winning trade takes care of two losses. l.
Risk per Month: The risk per month should be based on he per centage of capital you have to invest. You want to make sure Olat
you do not lose ll your money in one month and end up with out any cash to trade anoher month. Remember, you have to
reat this like a business. There wl. be some negative monUlS due to the market consolidating. During hose times, your system is supposed to minimize the losses. During trend monhs, your sys tem is supposed to maximize profits. Risk per month can also be called "drawn down."
xxii
INTRODUCTION
ll.
RisklReward Ratio: The risk/reward ratio is an important calcu
lation. t is key because we re rading a trend system. The gol of a trend system is to maximize proits when you are right and
minimize losses when you are wrong. n order to achieve his,
the ris/reward ratio for your system has to be less than one. No tice, I said your system. You may have some trades that have a RisReward ratio greater than one, but overall, the backtest re sults should show your system has a risk/reward ratio less than one. n heory, if you can opimize your system to a point where
ll trades have a ris/reward of less than one, then you have a
great system. This can only happen wih time as you len more about the optimization part of backtesting.
4. Trade Post Analysis: Probability Factor, RisklReward Anlysis, Loss
Analysis. In a later chapter, we illustrate how to �backtest" a system. Once he system has been backtested, you can get a lot of n i formaion from the backtest results. The resuls should show you the probabiliy of winning compared to losing, average RisklReward per trade, and so forth. Infonnaion that should be used to detemline whether the sys
tem needs to be "tweaked" or optimized. For example, f you are look·
ing for a 12 percent retun a year then your backtest results should give an average of 12.0 percent per yer. U it does not hen Ule system needs to be altered in order to achieve your long-tenn goals. Once the
system backtest resuls meet the enire rader's requirements, he sys tem is traded in a live environment with actual cash. Now, the results need to be recorded for the live account because what has happened in he past does not necessarily mean it will occur in the future. There fore, post analysis of the trades has o be maintained to veriy that the system wllproduce the long-term goals of your business.
Re member, a trading plan is like a business plan to a business, it is a must and the key for a business to be successful.
n this book, we len he Ichimoku Kinko Eyo trading system. A trad ing plan is created step by step around one Ichimoku Kinko Hyo strategy.
Technical Slslems
The second component for our trading system
is going to be Ule technical analysis component. So what is a technical system? Is it ibonacci? Is it Gann boxes? Is it Pivot Points? ibonacci, Gann boxes, Pivot Points, and so forth, are some forms of support and resistance values. In fact, every technical system is some fonn of support and resis.ance. So what is support and resistnce? Support is when a user is short a posiion n i Ule market (betting on the insrument going down) and price
Introduction
11
-
..,
, "-'
- .- '1
!. '
. ..
•
.-
.. �;UR: 1.5 TradeStation Daily Ichimoku Chart. Chart of SINDU Nov 9, 2009 gets to a vlue (Le., support price where it cmmot go lower at aU). f it is a strong support level then price will reverse off that value and start to go
higher (Figw-e 1.5). Support is referred to by raders as the "floor." Resistance is when a user is long a position in the market (betting on he instrument going up) and price gets to a vlue, that is, resisnce price
where it cannot seem to higher at U (Figure level Ulen price
1.6). f it is a strong resistnce
wllreverse of Ulat value and strt to go lower. Resisnce
is referred to by traders as he �ceiling.'"
f everyhing is based on support and resistance then why not use a
technical system hat is simple, one that shows all the minor and major support and resistance values? lchimoku Klnko Hyo is a technical system
that illustrates support and resisance values n a simpliied foml. In fact,
he system was built on the idea that at �one glance" you should be able to
detennine whether an instrument is in equilibrium (consolidation) or out of equilibrium (trending). The most valuable aspect of Ichimoku Kinko Hyo is that it looks for history to repeat itself now and also in the future. Through the Ichimoku chts, you cn see past "events" easily and make current decisions based
on past events. W.O. Gml, one of he most successful raders of ll ime,
studied past events in order to detennine future events. Ichimoku llows he trader to do the same. It shows the past, present, and the future (Fig ure I.7) hrough its five indicators. Some people will argue that past events
INTRODUCTION
,
I
,
1 ,
-
1;'If;lIKI� 1.6
TradeStation Daily Ichimoku Chart, Chart of SINDU Nov 9, 2009
- - ,.,
' T .,� 1
. - .·r"".. .i ;..
�r·
,
1"If�UKI� 1.7
',"I
"
'
I
i
!' J I
\
•
.-'
, _.
TradeStation Daily Ichimoku Chart, Chart of SINDU Nov 9, 2009
Introduction
x'
wll not necessarily repeat n the future. That s rue but how else can we
increase the probability of success? This is the best way to increase he probability of success in trading. In this book, we are not going to discuss the history of lchimoku Kinko from Nicole Elliott is he best place to discover the orin of the
Hyo in great detail. Ichinoku
Clouds
Charts: An Int1Oduction to Ichinwku Kinko
Ichimoku Kinko Hyo System. It goes through details on how Goichi Hosada discovered Ichimoku inko Byo in 1948 to Hidenobu Sasaki, he person who wrote a book about Ichimoku Kinko Hyo in Japanese. It is not im portant for us to len how he created the system to use it. It is important for us to len the system and know how to use it to become a successful
trader. Therefore, we wll not focus on his topic at all.
The next section talks about all the individual components that make up the Ichimoku Kinko Byo system. Everyone must understand the indi vidual components of Ichimoku in order to be a successful trader. Many traders choose to use only one or two of the Ichimoku components to trade. That is ine but everyone should lean all the components at some point in order to understand what indicator is used to determine what piece of infoation. You have
o
realize why there are ive components
to Ichimoku compared to two or three.
I
: II \ I' ' .: H
t
Ichimoku Components
efore r start to explain all the Ichimoku components, I need to dis cuss some background infonnaion. First, I use he daily ime frame as the main reference time frame throughout the book. However, this does not mean that Ichimoku nko Hyo only works for le daily time frame. Today, Ichimoku is used at the tick level, I minute, 3 minutes, 5 min utes, 60 minutes, 120 minutes, dily, weekly, and so forh. The reason why I discuss the daily time frme is that every thing moves at a �slower pace" than the minute ime frme. You can "see" everyhing s way. n order to be able to trade a faster time frame like a 5 minute, you must master the dily time frame. The next question everyone asks now is: Should we look at a lower time frame along with le daily ime frame? To answer hat quesion you have to look at the three d ifferent types of trades that exist:
B
I.
Trend: Price goes in one direction for a long period of time. Dur ing a trend, he higher time frames 'inluence he lower ime frmes where the lower time frames are supporing the higher ti me frames (Figure 1.1).
2.
Countertrend: Price has gone in a certain direction for a long time aleady. Now, the trader believes that the trend is over and the rader wants to trade ag,insl the trend. During a countertrend move ment, the lower ime frames Q,re not supporting the trend. They are going against le trend to a poin t they inluence he high ime rames (Figure 1.2).
I
TRADING WITH ICHIMOKU CLOUDS
2
-i
.... _ , ...
�I(.UK� 1 . 1
TradeStation Daily Ichimoku Chart/3D m Chat of $INDU Nov 9, 2009
�I(.UK: 1.2
TradeStation Daily Ichimoku Chat/3D m Chart of RIMM Nov 9, 2009
:1 . Consolidaion: Price is not going in one pariculr direction at
ll. It
s going back and forth between major support and resistance values (Figure 1,3),
If you do not know how to recognize whether n instrument s trend ing, in a countertrend mode, or a consolidation mode then you will get con fused when you look at the lower time frames. Using multiple ime frames is n advance optimization technique. Once you rade the daily ime frame for a while, you will len when price s trending, going against he rend, or in a consolidation pattem.
Ichimoku Componenrs
I"IGUHE 1 .�J
3
TradeStation Daily Ichimoku Chart/30m Chart of DBA Nov 9, 2009
The Ichimoku Kinko Hyo system is made up of ive components (igu,e
1 .4}
1 . Tenkan Sen (red) 2.
Kijun Sen (green)
�.
Chikou Span (Ught puple)
FmUHE 1.4
TradeStation Daily Ichimoku Chart of $INDU Nov 1 3 , 2009
4
TRADING WITH ICHIMOKU CLOUDS
". Senkou A
l, Senkou B n the book, ll the pictures wll be in black and white. However, ll charts on my web site (www.eiicapital.com) are color-coded. r have
included the color codes for le various indicators hat I use on a
nomlal day-ta-day basis so you ll be able to recognize them on the web site.
The Ichimoku ive components together tell the entire �story� be hind the chart for a particular instrument. Many people have trie d to use only two or three components and have failed miserably, The key for an Ichimoku rader is to understnd each element individully and then Wl
derstand how and why they work together. Once you master that, you ll
be able to trade Ichimoku with no problems.
In addition, the indicators re referenced based on price, not time.
There is a ime element to Ichimoku inko Hyo, which is discussed ll a
later secion.
TENAN SEN The irst indicator I discuss is the Tenkan Sen. It represents the shorHerm movement for price. The color that represents the Tenkan Sen is red. The formula for the Tenkan Sen (red) is: (Highest High + Lowest Low) 2 Most retail and insituion traders use a
. for 9 penods
10 period simple moving aver
age of closing prices (SMA) to represent the short tel. By using the aver age of he Highest High nd the Lowest Low instead of the closing prices, the Tenkan Sen takes into account the inter-day volatiliy. Figure 1.5 shows boh the Tenkn Sen and a 9 period SMA for le Europe-USD dollar (EURUSD). Notice during he trend the Tenkan Sen did not go above the illter-day low except for one ime, whereas the 9 pe riod SMA penerated the inter-day low more than nine times. By using the average of the Highest High and he Lowest Low instead of closing prices, the Tenkan reflects short-tel price movement better. In fact, you can use the Tenkan as a slop once you have entered a rade. For beginners, a stop is where you will get out of a trade i f you made a mistake (Le., the risk of the rade). When you place an order, you should always have a stop order against le eny order so if you are wrong, the rade will automaically
Ichimoku Components
f'lGUHE • . �
5
TradeStation Daily Ichimoku Chart of EURUSD Nov 9, 2009
exit. Many people lose all heir money in heir accouns because they forget or did not want to place a Stop order. You la've to place . slop order to be a successful tr.del'. One question I get all Ule time s: Why a 9 period? Why not 10, which relects the trading days in he week or two weeks? That is a good question and relly there is no right answer for it, When Ichimoku was first invented in Japan) nine was chosen to relect the trading days for that period of time. Times have changed so people hink that this value should be changed, too. I have not experimented with other period values for any of he Ichimoku indicators as ohers have done so already. J do not plan to do so in he future either. I would raher spend my time analyzing chars and working WiUl he parameters hat have worked and been proven over time. There are five Ichimoku indicators. If you change one formula then you will have to adjust the other formulas, How many dierent combinations do you Utink here are when you have to alter all five indicators periods? There are housands . . . For the Tenkan Sen, there are a few things to note: • Seniment • Bullish: If price s above the Tenkan Sen (Figure 1.6). • Be.rish: If price s below he Tenkan Sen (Figure 1.7) . • The Tenkan Sen should be pointing in the sa,me din!cHon as the trend. The steeper he angle, he greater the trend. n Figure 1.8, Ule Tenkan Sen is pointing upward with a steep angle, This is showing that the insument is in a srong bullish (upward) rend.
i
TRADING WITH ICHIMOKU ClOUDS
" If.UKI� 1 . 6
TradeStation Daily Ichimoku Chart o f Feeder Cattle Nov 9, 2009
-_.._-_...-
••
.
.
. . � -._ .
- .. "
. .
.
.
.
• ••
.
_.
•
•
•
FIGURE t . 7
TradeStation Daily Ichimoku Chart of BBD Nov 9, 2009
'IGUKI� I.K
TradeStation Daily lchimoku Chart of AAPL Aug 1 , 2009
Ichimoku Compon.nts
?U;UHE 1.9
7
TradeStation Daily Ichimoku Chart of AAPL Aug 1 , 2009
• If the Tenkan Sen s lat then it indicates that price m.y consolidate n the short teon. f you are in a trade that is open hen you should proceed with caution because the short-term trend could reverse soon (Fig",e 1.9). • Tenkan Sen is a short�eon support/resistance value. When price crosses the Tenkan Sen it is a major accomplishment because it has broken a major short�term support/resistance value (Figure 1.10). • During a rend, if price crosses lhe Tenkan Sen in Ule opposite d.rec� tion of the trend, it can indicate one of three different scenarios . • Minor Short�Teon Pullback: A minor pullback is where price crosses over the Tenkan Sen but never crosses over the jun Sen. ter it
I?IGUHF. 1 , 1 It
TradeStation Daily Ichimoku Chart of AAPL Aug 1 , 2009
8
TRADING WITH ICHIMOKU CLOUDS
•
I
·1
i [
I
i
,
"
'IGUKI� t . 1 1
,!
I , ,
.
L
I' J
.,
TradeStation Daily Ichimoku Chart of SPX Aug 7, 2009
crosses the Tenkan Sen, price then continues on the original path of he trend (Figure l . 1 1). TItis normally happens when short-term traders take profit. The long-term traders continue to hold their cur rent posiions.
• Major Short-Teml Pullback: A major pullback ll have price cross
ing boh the Tenkan Sen and jun Sen in he opposite direction of
the rend. Once it has done that, price eventually coninues on the originl trend crossing back over both of hem again (Figille 1. 12). In his scenario, long-tel position traders are taking
some
proits.
They are not closing out heir entire position at ll because hey be
lieve the instrument will continue the rend after the major pullback has inished. • Countertrend: The third scenrio is similar to the second scenario
where price crosses over boh he Tenkan Sen and the jun Sen. The crossover takes place in the opposite direcion of the trend. How ever, the major trend never resumes. Either he insrument enters a consolidation pattem (sideways) or a new trend fomlS (Figure 1.13).
n s scenario, the long-term raders are exiing heir positions com pletely. They can do so over some cases.
a
certain time period or all at once in
Ichimoku Components
9
�-
j
I
�IGURE 1 . 1 2
-
1
TradeStation Daily Ichimoku Chart of SPX Aug 7, 2009
,.
I�IGURF. 1 . 1 :'
TradeStation Daily Ichimoku Chart of SPX June 29, 2009
"
II
TRADING WITH ICHIMOKU CLOUDS
-
1"f.UK� 1 . 1 4
-
•
•
•
TradeStation Daily Ichimoku Chart ofSPX March 9, 2009
• The
Tenkan Sen should be lose to pice. lf price and the Tenkan Sen re close to ech oller then the rend has been developing slowly ill out much interference from volatility. If price escapes from the Tenkan Sen then llere is a igh chance that price will pull back and ry to go meet the Tenkan Sen because it was out of equilibrium too much. Figure 1.14 is a g ood illustration of this scenrio. Sometimes, price may even go all the way to the iun Sen and pst it for a major pullback or a trend reversl. Therefore, you have to be caeful when price is out of equilibrium with Tenkan Sen.
KIJUN SEN The second indicator r discuss is he Kijull Sen. t represents the medium
term movement for price. Therefore, it caters to a majority of the traders n
the market. The color that represents the Ki jun Sen is green. The fonnula for
the jn Sen is: (Highest High + Lowest Low) 2
.
for ·26 penods
II
Ichimoku Components
.
"".
.'10 _ . .- .. : . . . .. ..-.. -�..
F·.GUH: I . I 5
TradeStation Daily Ichimoku Chart of SPX Nov 9, 2009
The ijun Sen is similar to the 30 period simple moving average that most retil and insitution traders use (Figure 1 .15). Just like Ule Tenkn Sen, the Kijun Sen is based on the Highest High and the Lowest Low. In stead of he 9 period of he Tenkn Sen, the Kijun Sen is based on 26 pe riods. For a daily time frame, the jUl Sen roughly represens one monh (and one trading week and one rading day) of history where the Tenkan Sen represented roughly } 12 weeks (not including weekends on the chart). This is assuming I am not cOlUlting the weekends. The ijun Sen is one of he key indicators for the Ichimoku system. Many Ichimoku strategies focus around this one indicator. Here are the things to note about he Kijun Sen: • Sentiment • Bulish: Ifprice s above the Kijun Sen (Figure 1.16) . • Beaish: If price is below the jun Sen (Figure 1.17) . • The ijun Sen should be pointing n Ule same direction as Ule trend.
The steeper the angle, the greater the trend. In Figure 1.18, the Kijun Sen was flat and then started to move upward. Tle Kijun Sen only moved up when the current price was higher than the average of the Highest High and the Lowest Low for the last 26 days. Unlike the Tenkan Sen, price has to move a lot in order to inluence the Kijun Sen.
12
TRADING WITH ICHIMOKU ClOUDS
!
/
f
I ....:.. T,
"
I
I '
.�'- ; ••. -'
nGUKE 1 . 1 6 TradeStation Daily Ichimoku Chart of M i n i Gold Futures Nov 1 0 , 2009
-
•
nGUK� t . 1 7
-
-
-
-
TradeStation Daily Ichimoku Chart of USDJPY Nov 1 1 , 2009
13
Ichimoku Componenrs
j "
...�:
1-
I,
--�
,
j
-r ,
,
,"
FmUHE 1 . 1 8 Jan 2 5 , 2008
n
• •
•
•
TradeStation Daily Ichimoku Chart of Mini Gold Futures
using he Kijun Sen, we know that the trend has to be a minimum 26 days established. What does thjs mean? Will we miss the beginning of Ule trend? The answer to that quesion is yes. We will definitely miss the beginning of the trend because we are W.iing for the trend to establish itself. Why take a risk if price has not proven itself to us lat a trend can exist? If we get into a trade that is not in a trend then it is n consolidaion. With consolidaion, your account ll swing positive and negaive and back and forth. When the Kijun Sen is flat, it indicates that the price is consolidating and not trending (Figure 1.19). The jn Sen is a key support/resistance value. When price crosses the Kijun Sen, it is a major accomplishment because it broke a major support/resisnce value (Figure 1.19). W hen price crosses the Kijun Sen, it indicates that a trend change m.y occur. This is key to determine f a major pullback or a trend reversal is about to occur. Neither one of them can occur until price crosses over he jn Sen (Fi gure 1.19). With price crossing over the Kijun Sen, one of two possible scenarios can occur: • Minor pullback: Price will bounce off Ule Kijun Sen and continue on the original trend path. Some people took proit but the mjor
TRADING WITH ICHIMOKU ClOUDS
14
.,"
0'
..•.
nGUKl� 1 . 1 9 TradeStation Daily Ichimoku Chart ofS&P M i n i Futures Nov 9, 2009
�players" are stll holding their positions and possibly increasing hem now with he minor pullback. People really believe that the trend ll coninue srong (Figure
1.20) .
• Major pullback: Price will cross over he KjWl Sen and eventu ally cross back to continue the major rend that was occuning (Figure
l.21). Long-term traders gained some profits but Uley still
have some open posiions because they believe the instrument will continue to move in the direction of he trend. • Trend reversal: Price crosses the Kjun Sen once and then never
crosses back over he Kjun Sen to continue the major trend. Instead, the insument will enter a consolidation period or a trend reversal (Figure
1.22). The majority of the long�term raders re exiting their
positions. • The Kijun Sen should be
close to price. When price is far away from the
Kjun Sen it shows lat price has moved at a faster rate iJlan the Kjun Sen (Figure
1.23). A good trend has price and the Kjun Sen moving at a constant rate. Since the Kjun Sen represents 26 days, Ulere s a high probabiliy that price will retract toward the Kjun Sen causing a major
pullback or even a trend lJversal. So how far is r considering the Kjun Sen s based on
26 periods? To
detene what is ur," you can look back in time (history, previous bars)
15
Ichimoku Components
_.
••
l
, _.
,-
I
,·---,,"
,1
,' I , , " , }. '
1
'
.
-.
.�.'
-
�IGURE 1.20
-
•
•
TradeStation Daily Ichimoku Chart of AAPL Nov 6, 2009
I
-
.
"
.. .
,••
•
I�IGURE 1 . 2 1
-
-
-
TradeStation Daily Ichimoku Chart of AAPL Nov 9, 2009
at other major pullbacks and trend reversals and determine what is "far" for price versus he jIl Sen. Figure 1.23 illustrates one example of how you look at historical charts to determine the value of "r." The problem with looking back historically for a deinite vlue for wr" is hat it varies with time. During high volatility these values will be bigger than d'ing low volaWily. Therefore, the "far" value needs to be adjusted WiUl volility.
16
TRADING WITH ICHIMOKU CLOUDS
/ ', .
,
....
_.-
Flf.UKE 1.22
TradeStation Daily Ichimoku Chart of Mini Gold Future
May 30, 2008
FIG'JKI� 1 .2;4
TradeStation Daily Ichimoku Chart of SPX Nov 9, 2009
Ichimoku Componenrs
17
..
,
,
�
.
I�IGUR. 1.24 TradeStation Daily Ichimoku Chart of SPX Nov 9, 2009
Some traders use volatility indicators such as a muliple of Average True Range. Figure 1.24 shows how he price on June 8, 2009, was greater thn 2xATR and a pullback occurred. Therefore, one possible rule call be if price is greater Uln or equal to 1.5xATR then price can be considered "far" away from Kl.iun Sen. Let us look at one more example to understand he relationship of price and ijun Sen. In Figure 1.25 you can see that price dropped and Ule berish (downward) trend continued. When the trend continued, he Kijun Sen was pointing downward. Later, the Kijun Sen went lat, which n i dicated hat price was consolidating. Snce the Kijun Sen remained lat for a long period, it forced price and the Tenkan Sen to "meet it" instead of Ule Kijun Sen resuming its downward trend movement. Up to this point, we have discussed the relationship of price and Tenkan Sen and hen price nd Kijun Sen. Now, let us put it aU togeher to discuss the relaionship among price, Tenkan Sen, and Kijun Sen. The anlogy I like to use in my class to best illusrate the relationship among these three variables is where a couple is going for a wlk in the park wih heir child. The couple's names are John and Mary and heir son's name is Ben. Ben represents price, John represents the Kijun Sen, and Mary repre sents the Tenkan Sen. InitiaUy, when he journey begins n Ule park, U three are together. They walk in the same direction together. Ben, like
18
TRADING WITH ICHIMOKU ClOUDS
"I(iUK� 1.25 TradeStation Daily Ichimoku Chart of Mini Gold Futures Feb 1 0, 2009
most children, ries continuously to wJk faster than his parents. How ever, both Mary and John keep Ben in order and keep him close to Ulem at
all imes. Mter some ime, John gets an important phone call from work. When Jolm receives the phone call, everyone is togeUler. However, af ter some ime, John strts to walk slower due to his phone call. As he walks slower, he begins to rl both Mary and Ben. May and Ben COl tinue to walk at the nomlal pace so hey are moving ahead of John gradu ally. They re doing hat because he phone call conversaion is disturbing the peaceful walk so they want some distnce between John and them selves. s Ule phone call continues, John is further and furher away rom Mry and Ben. This creates some different scenios for the walk. They are as follows. The irst scenario is where John makes a decision to continue to walk at a slow pace in hope of catching up will boh Mary and Ben. However, s some time goes on, May and Ben will be so far ahead Ulat tlley will not be able to see John anymore. This ll pose a big problem because now Mary has to make some choices for herself. One choice is hat boll My and Ben stop and wait for John to catch up. This is assuming that John has not completely stopped walking. There is no way Mary knows that because John is not in viewing range anymore. Second, she can let Ben continue to
Ichimoku Components
19
walk a little further head of her while she walks slower in hope for John to catch up. If Ben gets too far from her, she il call out o him either to stop wlking so she can catch up with him or she will cll Ben to come to her. Once one of these two events occurs, Ben and Mary will have to wait for John to come. If he does not come after a long period of time, Mary will have to assume he has stopped walking completely so they will have to go back to ind him. Once they find John, they have to make a decision on whether ley want to continue to walk in he park or to go home. The second scenario is where John makes a decision to stop walking completely due to he phone call. Mary sees lat Jom has stopped walking but boh Mary and Ben continue to walk forward. When they get to a point they cannot see John anymore, they wllstop and retun to where John had stopped walking. These are just two of many dfferent scenarios that can occur in this analogy. You should think of them all because this will give you a great insight on the relationship of price, ijun Sen, and Tenkan Sell. You can take it one step further and associate the concept of pullbacks to the analogy, too.
C I I I K O U S'AN
The third indicator r discuss is the Chikou Span (Figure 1.26). It represents the momentum of price. n oler words, it tells you f a trend can occur or not occur. Remember, a trend is where price moves in one direction for a long period of time. The color that represents the Chikou Span is purple. The formula for the Chikou Span is: Curent Price Shifted back 26 periods Simple as it sounds, it is the indicator that most people cannot under stand. Also, it is one of my favorite Ichimoku indicators. Basically, it is to day's price sifted back 26 periods. You compare today's price movements to price from 26 periods ago (Figure 1.27). Here are the lings to note about the Chikou Span: • Seniment • Bullish: If the Chikou Span IS above pnce from 26 peiods ago (Figure 1.28). • Bearish: f the Chikou Spn is below price from 26 periods ago (Figure 1.29).
TRADING WITH ICHIMOKU ClOUDS
20
,.
.,'
••
•
•
'IGUKI� 1.26 Nov 1 0, 2009
•
•
-
TradeStation Daily Ichimoku Chart of Mini Gold Futures
-
,.
-
•
••
•
••
••
•
•
nGUKI� t .27 Nov 1 0 , 2009
•
•
•
•
•
TradeStation Daily Ichimoku Chart of M i n i Gold Futures
-
Ichimoku Componenrs
.... _ _. ....
11
, , " •
.H'-�"
. , ..L .
i _ "., , ""
,
"
.
,
Ji
FmUHE 1.28 TradeStation Daily Ichimoku Chart of Mini Gold Futures Nov 1 0. 2009
.., •
-t l� -'� \.. ,.
.
,
.
'
Bearish
->
Price above Kuma Cloud Price below Kuma Cloud
Consolidation
->
Price within
->
No Shadows
Kuma Cloud Kuma Shadows
Strong Bullish
(Kuma Clouds behind price)
Strong Bearish Weak Bullish Weak Bearish
->
->
-
>
No Shadows
Shadow Shadow
195
190
TRADING WITH ICHIMOKU CLOUDS
Result
Relationship Tenkan Sen/Kijun Sen
Bullish or Bearish?
Bullish -> Tenkan Sen > Kjun Sen Bearish -> Kijun Sen > Tenkan Sen Neutral -> Kijun Sen
Distance of Price vs. Kijun Sen?
Close ->
> (weak) Are they in the Kumo Cloud?
Consolidation -> Kijun Sen i n Kumo Cloud (weak) Consolidation -> Tenkan Sen in Kuma Cloud (weak) No Consolidation (strong)
Distance of Price vs. Tenkan Sen?
Close -> (strong) Far -> > (weak)
Is Kijun Sen flat?
Consolidation -> Flat (weak) Pointing in direction of trend (strong)
Chikou Span
Bullish or Bearish?
Bullish -> Chikou above Price (past) Bearish -> Chikou below Price (past)
Is it in Kumo Cloud?
Consolidation -> Within Kumo Cloud (weak) No consolidation (strong)
Future Movement
Will run into price -> Weak
(if consolidates, will it run into
Will not run into price -> Strong
price)
Kumo Future
Bullish or Bearish?
Bullish -> Senkou A > Senkou B Bearish -> Senkou B > Senkou A
Ichimoku Analysis Sheet
197
Relationship
Result
Bullish
FSA
(t-> pOinting up)
t
-
strong
,
-
weak
-
->
fiat
I
�+ pointing down
FSA
+
FS8
Future Senkou A
t
-
-
FSA -> Future Senkou B
,
t
Bearish
FSA
FS8
I 1 ,
strong
-
weak
,
Ichimoku Indicators ->
(Highest High + lowest
low)/2 for 9 Periods Kijun Sen (green)
Green
->
(Highest High + lowest
low)/2 for 2 6 Periods Chikou Span (purple)
Purple
strong
-
t
Red
weak
-
j
-
Tenkan Sen (red)
strong
->
Current Price projected
back 26 periods Kumo Cloud Senkou Span A
White outline -> ITenkan Sen + Kijun Sen)/2 projected forward 26 periods
Senkou Span B
Purple outline
->
(Highest High +
lowest low)/2 for 5 2 periods projected forward 26 periods
FOREX
Buy Entry/Stop
Spread + Buffer
Sell Entry/Stop
Buffer
weak
198
TRADING WITH ICHIMOKU CLOUDS
Website: Blog:
W.eiicapital.com
ww. blog.kumotrader.com
DISCUSSION BOARD: ww. kumotrader.com WIKI: ww. ichimoku.org Copynght © 2 0 1 0 E.1.1. Capital Group. All Rights Reserved.
Bibliography
lchimok. Char.>: An lntrod'lcl'ion to IcJdmoku Kinko Clouds, Nicole Elliotl,
Harriman Trading, 2007. /cltimoku. Ki1!ko Stlldies, Hidenobu Sasaki, Toshi Raider PubLishing, 1996. Technical Auulysis Eplnined, 4Lh ed., .iartn Pring, \IcGraw-Hill, 2002. Trade YOW" Wu,y to Fino,lCial Pn:edom, Van K. Tharp, McGraw-Hill, 2007. Markel Forecasting Cot1Se, V.D. Gain. e Missing Peace in Your Life!, Robert M. Wiiams, M.A., \lyrddill Publications,
2004. www.usatoday.comJeducate/coliegelbusines/casesmdiesl20030128-accollningfra udl.pdf. www.smartmoney.com/invesnglslocksidownIall-of-a-day-trader-99161. www.1920-30.comlscicllcdlele.ision.hmI. www.compulerhope.coistory/198090.hm. www.cllidlecharts.com/.
Charts All charts were kn from TradeSlaion. www.lradestalioIl.com
Useful References Ichimoku Wiki: www.ichillloku.org Ichimoku Discussion Porum: www.kumorader.com Market Technicians Association: www.mta.org Ichimoku Blog: www.blog.kumotrader.com E.l.I. Capital: www.eiicapitai.com
199
200
About the Author
M
anesh Patel
s
a highly respected trader and educator. He gradu
ated with an MS in Electrical Engineering with a mjnor in Eco nomics. He has worked 16 years in the ield of telecommunications
and has traveled throughout the world filling roles as sales engineer, devel opment manager, business development, and test engineer. While working in the ield of telecommunications, Manesh's passion
has always been trading. He has been trading since 1996. n 2007, Manesh left telecommunication and statted to trade full time. Today, Manesh s a commodity trader advisor and president of E.I.I. Capital Group. He is an Ichinoku trader, educator, and advisor who trades stocks, currencies, futures, opions, and so forth, for various global mar kets. His mission in life is to help everyone become a successful trader.
201
202
Index
Ajustmens:
Berish rules, basic:
bearish alert, 3
for Future Kumo Cloud Crossovcr
stops/stop orders, 83
for ideal Ichimoku strategy, 150
while in bull trade, 63
for jun Sen Cross Sratey, 154
buffers, 72
StTategy, 157-158
Advanced srategies rading pian,
for Kumo Cloud Breakout Straegy,
Alerts, 60. See also bearish alerts;
for Tenkan SenlKijun Sen Cross
152
bullish alerts
conservaUve alert, 54
156 Sratey, 151 Bearish sentiment:
Kijun Sen alert, 66
Chikou Span, 19
vertical lines s, 165
Kijun Sen, 11
Analysis:
Kumo Cloud, 30
of bullish n i dicators, 48
Tenkan Sen, 5
of Ichimoku indicators, 46, 48, 134
Analysis assumptions, 161
Bearish stratey: entry rules, 44
Applied trader psychology, 171-180 Average rue range, 17, 42
money management rules, 44 Bearish trade, 66, 127
Backtesng. See also Ichimoku lJacktcsLing:
stops/stop orders of, 129 Bearish trading rules, 80
Buffers. See also trading plan: adjusting, 72
day tTading, 186-192 results examination, 137-144
uearish buffer, 72
Bearish (downward) treml, 17
buffer adjustment, 72
Bearish alert adjustment during bullish
enry and stop
trade, 63 95, 101, 116, 120, 124, 127, 129 according to trading plan 60 ,
adjusting while in bull trade, 63 above major support, 54 Bearish buffer: as entry and stop, 72
stops/stop orders, 2
bearish buffer, 72
entry buffers, 91, 139
Bearish alerts, 50, 51, 60, 66, 70, 76, 93,
s
s
Bearish momentum indicator, 22
exillcntry buffers, 42-44 optimized buffer, 70 in trading plan, 111 Bullish (trcnd reversal) momentum indicator, 24 Bullish alerts, 50, 70, 80, 95, 101, 108, 114, 116, 120 above Kuma Cloud, 54 Bullish enry, 60, 108
203
204
INDEX
Bullish indicators, analysis of, 48
open white space, 22
Bullish rules, basic:
visual
for Future Kumo Cloud Crossover
Straegy, 157
square box, 24
weak momentum, 22 Chikou Span distance from price, 75
for ideal lchimoku strategy, 150
Chik ou Span indicator, 19-25
for Kijun Sen Cross Srategy, 154
CloSing price:
for Kuma Cloud Breakout StTatey, 155-156 for Tenkan SeKijul Sen Cross Strategy, 161
Bullish sentiment:
Chikou Span, 50 vs. simple moving average (SA), 4 Clouds, pes of, 27 Compliance with trading plan, 56, 61, 70, 83, 91
Chikou Span, 19
Conclusions, 193
Kijun Sen, 1 1
Coict among indicators, 54
Kuma Cloud, 30, 35
Conscious behavior vs. subconscious
Tenkan Sen, 5 Bullish strategy: entry rules, 43 money management nles, 43 Bullish trade, 91, 105, 111 bearish alert adjustment during, G3 for preserve mode, 106
behavior, 178 Consc ious helief system S.
subconscious belief system, 178 Conservative alert, 4
Consoidation l (fla) trend:
Chikou Span, 22 future Kumo Cloud, 39 Kijun Sen, 17
Bullish trade support, 80
Consolidation indicator, 13
Bulls i h Lrading, rules for, 80
Consolidation momentum indicator, 24 Consolidaion trades, 2
Carson, Johnny, 177 Charles Schwab (SCH), 183
Conspircy against small raders, 173-174
Chart setup, 63
Conspiracy theory, 174
Chikou Span:
Coninuation trades, 65, 114
bearish momentum indicator, 22 bearish sentiment, 19 bullish (rend reversal) momentum indicator, 24
Continuation trades without major
pullback,66 Countertrend trades, 1-2, 8 Currency trading, 42-44
bullish seniment, 19
Current Senkou Span A, 27-28
dosing price, 50
Current seniment Kumo Cloud, 30
conditions for, 154
Curve fitting, 80
cOlsolidaUon, 22 consoliuation momentum indicator,
24 Pibonacci values, 24-25
Daily imeframes, I, 161 Dangerous moves, 124 Day trading:
formula of, 19
about, 181-184
historical price distance, 93, 108
backtesling, 186-192
major resistance values, 24
goal for, 185
major support values, 24
trading plan for, 185-186
momentum of price, 19
WitJlOut a trading plan, J 84-185
in open space, 150
Dennis, Richard, 172, 176
205
Index
Direction of Kijun Sen, I I Direction of Tenkan Sen, 5
Future Kumo Cloud Crossover Sratey:
Discipline, 185
about, 156
Drawdown, 141, 177, 178
basic bearish rules for, 157-158 basic bullish rules for, 157
Efects of jl Sen distance rom price, 135
Future price reversals, 168
Future Senkou Span A, 27-28
Emotions and rading, 178
Future sentiment Kumo Cloud, 30
Entry and stop as bearish buffer, Gann, W. D., 161
72 Entry buffers, 91, 139
Gaps/gapping, 73, 184-185, 188, 190
Entry checks, 60
movement of, 190
Entry risk, 139, 141
threshold/stop values, 186-187
Entry rules:
Goals:
bearish strategy, 44
for day trading, 185
bullish stratey, 43
for lrading plan, 76
KijWl Sell distance from, 116
Good loses, 178
Enry rade statistics, 61, 73, 84, 89, 91, 92, 105, III, 113, 129 Entry values, 116
Herd following, 173, 178 High volaility:
Europe-USD dollr (EURUSD), 4
future Kumo Cloud, 39
Europe-USD dollar (EURUSD)
Kijun Sen, 15
two-year backtest, 46-134 Examination of Ichimoku indicators, 127 Eit condiions,
84
Historical price distmlce, 93, 108
Historical lesling, 177. See also
backtesting
Historical rading 's. live trading, 46
Exit/entry buffers, 42-44 Exit lrade staistics, 163
Ichimoku backtesting: about, 4-46
Fail proof systems, 176 Fai l ure causes, 173
Europe-USD dollr (EURUSD) two-year backtcst, 46-134
Fbonacci values, 24-25
summary, 134-135
Flat Senkou Span B, 35
lchimoku components:
i
Fonnula:
about, 1-4
for Chikou Span, 19
Chikou Span n i dicator, 19-25
for jun Sell, 10
Kijlln Sen indicator, 10-19
for Tenkan Sen, 4
Kumo Cloud, 30-39
Foundation strategy, 147, 149
Kumo Cloud components, 25-27
Free rades, 61, 83, 88, 106
Sellkou Spm] A, 27-28
Future bearish sentiment, 30
Senkou Span B, 28-30
Future bullish sentiment, 30
Tenkan Sen indicator, 4-10
Future Kumo Cloud, 27, 50 consolidation, 39 high volatiity, 39 Senkou Span A and Senkou Span B spacing, 39
Ichimoku indicators, 51, 56, 58 analysis of, 46, 48, 134
bullish trade SUPPOlt, 80 examination of, 127
Ichimoku Kinko Hyo system, 3-4
lli
Ichimoku slrategies: about, 149-150 ideal Ichimoku srategy, 150-159 types of, 149 Ichimoku lime elements, 161-170 Ichimoku time values, 165 Ichimoku trading plan: components of, 4142 stratey description, 42-44 Ideal lchimoku stTatey: basic bearish rules for, 150 basic bullish rules for, 150 Future Kuma Cloud Crossover Strategy, 156-159 jun Sen Cross Strategy, 154-155 Kuma Cloud Breakout Srategy, 155-156
Tenkall Sen/Kijull Sen Cross Strategy, 15--154 Indicatos, \3. See also Ichimoku indicators analysis of, 48 bearish momentum indicator, 22 bullish (trend reversal) momentum indicator, 24
bullish indicators, 48 bullish Tade t support, 80 Chikoll Span indicator, 19-25 conljct among, 54 consolidation indicator, 13 consolidation momentum indicator, 24
Kijun Sen indicator, 10-19 Tenkan Sen indicator, 4-10 volaility indicators, 17 Individual pain threshold, 178 Inter-day volatility, 4 Intenal beliefs, 179 Internal biases, 173 Invesment club, 183 Job cycle, 181-182 Kijun Sen: bearish (downward) trend, 17 berish sentiment, 11
INDEX
bullish sentiment, II consolidation (lat) trend, 17 consolidation indicator, 13 direcion 0[, 11 distance from in entry rules, 116 formula of, 10 high volaility, 15 major pullback, 13, 14 minor pullback, 13-14 price and, 14-17 and price and Tenkan Sen, 17-19 price distance from, 80, 108, I l l , 116, 120
price .qualized with, I I I as stops/stop orders, 127 suppor/resistance value, 13 trend reversal, 11, 14 26 period SA, 11 volatility, 15 Kijun Sell alert, 66 Kijun Sen Cross Strategy, 154-155 Kijun Sen distance from price, 95, 129, 130, 134
Kijun Sen n i dicator, 10-19 Kumo Cloud, 30-39 beaish seniment, 30
bullish alert above, 54 bullish seniment, 30, 35 current sentiment, 30 iat Senkou Span B, 35 future berish sentimem, 30 future bullish seniment, 30 future sentiment, 30 Kumo shadow, 35 major resistance values, 35 major resistance values from Senkou Span 8, 39 major support values, 35 major support values from Scnkou Span B, 39 medium bearish srengtJl, 35 medium bullish senLiment, 30 Senkou A, 50 Senkoll Span A peaks, 39 strengul of, 30 strong bearish strengh, 35
207
Index
strong bullish sentiment, 30
Tenkan Sen and KUun Sen n, 66, 70 types of, 27
Margin/margin calls: m i pact on Mazeska, 182-184 use of, 42, 181
weak bearish strength, 35
Market movements, 168
weak bullish sentiment, 30
Mx drawdown, 141
Kumo Cloud Breakout Strategy, 155-156
Maximum entry risk level, 141 1azeska, Charles, ]82-184
basic bearish rules for, 156
ledium bearish strengh, 35
basic bullish rules for, 155-156
Medium bultish seniment, 30
Kumo Cloud components, 25-27
Minor pultback, 13-14
Kumo shadow, 35
Minor short-tenn pullback, 7-8 Mistake correcion, t 86
Laughlin, Doug, 170 Leverage, 182 Live lrading vs. historical trading, 46 Losing trades, 175
Mistake/non-complilllce wih trading plan, 54, 56, 72, 84, 105
Momentum of price, 19 Money management, 60 1oney mlllagement rules:
Loss acceplance, 175-176
bearish srategy, 44
Losses:
bullish stratey, 43
lessons from, 188 loss acceptance, 175-176
portfolio risk percentage, 73 Multiple instruments trading, 114
mitigation of, 139, 141 pip loss, 111
Nontradeable days, 189
psychology of rading, 175-176
Non-trading days, WI
stops/stop orders and, 73 trade losses, 178, 190
Open space, 88, 108, 153
n i trading plan, 139
Open white space, 22
Low volatility, 15
Optimization, 141 advanced technique, 147
M\ior pullbacks, 88 coninuation trades without, 66
considerations for, I l l , 120, 144 of rading plan, 144-147
Kijun Sen, 13, 14
Optimization trade, I I I
price movement, 66
Optimized buffer, 70
and price movement, 66
Overconidence, 182, 184
on trend trades, 124 M\ior resisnce values, 187 Chikou Span, 24
Patel, 1anesh, 180 Peaks:
KUlllo Cloud, 35
Chikou, 24-25
Senkou Span B, 39
Senkou Span A, 39
1\ior short-lelll pullback, 8
Personal conviction, 177
1\ior support values:
Personal trading style and trading
Chikou Span, 24
plan, 172
Kumo Cloud, 35
Pip level for exit, 144
Senkou Spll\ B, 39
Pip loss, 1 1 1
1,jor support values from Senkou Span B, 39
Pip rule for lat conditions, 105 Pip spread, 185-186
208
INDEX
Play mOlley vs. rel money, 178
Risk/reward ratio, 137, 139, 144
Portfolio risk percentage, 73
Rogers, Jimmy, 178
Possible price reversals, 165 Post-analysis: backlest results examination, 137-144 trading plan opimizaion, 144-147 Preserve mode, 63, 83, 88, i06, 127 Price: Chikou Spn distance from, 75 e(feclS of Kijun Sen distance from, 135 equalized with Kijun Sen, 1 1 1
Rules. See aso bearish rules, basic;
bullish Ules, basic; rading plan:
for bearish rading, 80 for lmllish trading, 80 entry JUles, 43, 44 Kijun Sen distance in enry rules, 116 money management rules, 43, 44, 73 pip rule for lat conditions, 105 trading plan rule change, 139
Kijun Sen and, 14-17 Kijun Sen distance from, 80, 95, 108, 1 1 1 , 116, 120, 129, 130, 134 short-len\ price movement as, 4 s.
Tenkan Sen, 83
Tellkan Sen and, 10 and Tenkan Sen and Kijun Sen, 17-19 Tenkan Sen distance from, 80, 101, 105, 108, III
vs. time elements, 4 Price gaps. See gap/gapping:
Price movement and major pulback, 6
Safety value, I I I
Sell-desructive traits, 179
Self-sabotage in Tading, t 178-179 Senkou, 50 Senkou Spml A, 27-28 current, 27-28 fommla for, 27 future, 27-28 peaks, 39 Senkou Span A and Senkou Span B spacing, 39
Senkou Span A peaks, 39 Senkou Span B, 28-30
Price predicions, 66
fiat, 39
Price reversals, 163-164, 165, 168
major resistance values, 39
Proit, pip level for exit, 144
major support values, 39
Proit maximizaion, 139, 144
Shon-teml consolidaion, 7
Psychology of trading:
Shon-teml price movement, 4
about, 171-172
Short-term supporUresistance, 7
conspiracy against smll traders,
Simple moing average (SA), 4
173-174
S.
closing price, 4
failure causes, 173
Smart people as traders, 175
intemal biases, 173
Statisics, 45
loss acceptance, 1 7--176
Slops/stop orders, 4-5, 61, 184
sell-sabotage in trading, 178-179
acljusing, 83
smart people as traders, 175
bearish buffer as, 72
summary, 180
of bearish trade, 129
trading syslem and personal
gaps/gapping, 186-187
conviction, 177-178
Kijun Sen as, 127 movement of, 63
Real money vs. play money, 178
Tenkan Sen as, 70, 127
Reasons for trading plan, 101
on trade with a loss, 73
Resistance values, 187
usage of, 73
209
Index
Strategy combinaions, 159
Toghraie, Adrienne, 179
Strength of Kumo Cloud, 30
Toni.qhl Show, 177
Strong bearish srength, 35
Trade enry, 83
Strong bullish sentiment, 30
Trade exit, 83, 86, 91, 107, 189
Subconscious behavior vs. conscious
Trade log, 178
behavior, 178 Subconscious belief system
Trade losses, 178, 190 s.
conscious belief system, 178 Supportiresistance value, 13
Trader psycholoy, 179 Trade statistics, 64, 73, 75, 86-88, 91, 92, 1--107, 111, 113. See lso enry rade statistics
Taxes, 182, 183
actual, 130
10130 Crossover strategy, 150
exit, 163
Tenkan Sen: bearish sentiment, 5 bullish sentiment, 5 countertrend, 8 direction of, 5
Trade wih a loss on stop/stop orders, 73 Trade Your Wa.y to Financial Preed01n (Tharp), 175 Trading:
fommla of, 4
and emotions, 178
major short-term pullback, 8
time elements for, 165
minor short-term pullback, 7-8
Trading behavior, 175
price and, 10
Tradi.llg days, 161
and price and Kijun Sen, 17-19
Trading failure rate, 173
price distance from, 0, 83, 108, I I I
Trading frequency, 176
short-ternl consolidation, 7
Trading insruments, 176
shor-tenl sllpportiresistance, 7
Trading multiple instruments, 114
as stops/stop orders, 70, 127 when flal, 84, 105 Tenkan Sen aI Kijun Sen in Kumo Cloud, 66, 70 Tenkml Sen ! Kijun Sen without
Trading plan, 41-42, 46. See also Ichimoku lrading plan
for advanced srategies, 152 alteraions o, 141
bearish alert according lo, 60
buffer, III
buffer n i the bullish and bearish
105
buffers in, III
Tenkan Sen distmlce rom price, 101, Tenkml Sen imlicaLor, 4-10 Tenkml Se/Kijun Sen Cross Strategy, 150-154 Dasic Demish rules for, 151 basic bullish rules for, 151
rule, 139 as business plan, 193 complimlce with, 56, 61, 70, 83, 91 continuaion trades without major pullback under, 66 for day rading, 18--186
Tharp, Van, 175, 179
day rading WiUlOut a, 184-185
Theoy of rmlges, 163
goals for, 76
Time elements. See also Ichimoku time
losses in, 139
ime elements; W. D. Gmm t elements: influence on price reversals, 168 vs.
price, 4
for trading, ]65
Time frames, 1
mistake/non-compliance wih, 54, 56, 72, 84, 105 modiications to, 1--186 personal trading style, 172 and personl rading style, 172 reasons for, 101
INDEX
210
Trading plan
(Co.tinued)
Validation, 46
rule change, 139
Vertical lines s alerts, 165
Tenkan Scn and jIl Sell wihout
Vince, Ralph, 175
bufer, I I I trades lost by trading plan rules, 141
Visual square box, 24 Volatility:
winning percentage, 139
high, 15, 39
Trading plan limits, 116, 120
inter-day, 4
Trading plan optimization, 144-147
j un Sen, 1 5
Trading plan rule, 54
\OW, 1 5
Trading system and personal conviction, 177-178 Trading systems, 45, 171
Volatiliy indicators, 1 7 Wa. S,reel J01ll.al, 172
Trining coaches, 179
W. D. Gann ime elements, 161, 168
Trend beginning, 101
Weak bearish srength, 35
Trend change, 50, 66
Wek bullish sentiment, 30
Trend continuation trade, 88, 93
Weak momentum, 22
Trend reversals, 1 1 , 14
Web sies, 4, 193
Trend riding, 84
Weekends, 161
Trend trades, 1
Weekly imerames, 161
011
major pullback, 124
Turles lrading system, 172, 176 26 Period SMA, 1 1
Winning percentage, 45, 139, 175, 177 Written trading plan, 4142