Source Localization and Spectrum Analyzing of EEG in Stuttering State upon Dysfluent Utterances 7133654361, 1257035100
Abstract... Purpose: The present study which addressed adults who stutter (AWS) attempted to investigate power spectral
115 49 5MB
English Pages [13] Year 2023
Introduction
Materials and Methods
Participants
Experimental Tasks and Design
Electrical Neuroimaging—EEG Acquisition
Quantitative analysis of the EEG
Filtering and Artifact Rejection
Separation of Trials Related to Fluent and Dysfluent Utterances
Estimation of the EEG Spectral Powers and Source Localization
Statistical Analysis
Results
Statistical Analysis
Results of the SP Dataset
Results of the IS Dataset
Discussion
Conclusion
Limitations and Future Directions
Acknowledgments
References
Recommend Papers


![Open Source Intelligence Techniques: Resources for Searching and Analyzing Online Information [8, 8 ed.]
9798578577086](https://ebin.pub/img/200x200/open-source-intelligence-techniques-resources-for-searching-and-analyzing-online-information-8-8nbsped-9798578577086.jpg)
![[Master's Thesis] Analyzing the Trimming Activity of Solid-State Drives in Digital Forensics](https://ebin.pub/img/200x200/masters-thesis-analyzing-the-trimming-activity-of-solid-state-drives-in-digital-forensics.jpg)
![Open Source Intelligence Techniques: Resources For Searching And Analyzing Online Information [6 ed.]
1984201573, 9781984201577](https://ebin.pub/img/200x200/open-source-intelligence-techniques-resources-for-searching-and-analyzing-online-information-6nbsped-1984201573-9781984201577.jpg)
- Author / Uploaded
- Masoumeh Bayat
- Reza Boostani
- Malihe Sabeti
- Fariba Yadegari
- Mohammadreza Pirmoradi
- KS Rao
- Mohammad Nami
- Similar Topics
- Medicine
File loading please wait...
Citation preview
Original Article
Source Localization and Spectrum Analyzing of EEG in Stuttering State upon Dysfluent Utterances
Clinical EEG and Neuroscience 1–13 © EEG and Clinical Neuroscience Society (ECNS) 2023 Article reuse guidelines: sagepub.com/journals-permissions DOI: 10.1177/15500594221150638 journals.sagepub.com/home/eeg
Masoumeh Bayat1 , Reza Boostani2, Malihe Sabeti3, Fariba Yadegari4, Mohammadreza Pirmoradi5, KS Rao6, and Mohammad Nami1,6,7,8 Abstract Purpose: The present study which addressed adults who stutter (AWS) attempted to investigate power spectral dynamics in the stuttering state by answering the questions using quantitative electroencephalography (qEEG). Method: A 64-channel electroencephalography (EEG) setup was used for data acquisition at 20 AWS. Since the speech, especially stuttering, causes significant noise in the EEG, 2 conditions of speech preparation (SP) and imagined speech (IS) were considered. EEG signals were decomposed into 6 bands. The corresponding sources were localized using the standard low-resolution electromagnetic tomography (sLORETA) tool in both fluent and dysfluent states. Results: Significant differences were noted after analyzing the timelocked EEG signals in fluent and dysfluent utterances. Consistent with previous studies, poor alpha and beta suppression in SP and IS conditions were localized in the left frontotemporal areas in a dysfluent state. This was partly true for the right frontal regions. In the theta range, disfluency was concurrence with increased activation in the left and right motor areas. Increased delta power in the left and right motor areas as well as increased beta2 power over left parietal regions was notable EEG features upon fluent speech. Conclusion: Based on the present findings and those of earlier studies, explaining the neural circuitries involved in stuttering probably requires an examination of the entire frequency spectrum involved in speech. Keywords stuttering state, power spectra, speech preparation, imagined speech Received May 7, 2022; revised November 20, 2022; accepted December 20, 2022.
Introduction Stuttering is a neurodevelopmental disorder1 that occurs in almost 5% of children extending into their adulthood in 1% of cases.2 This condition is characterized by involuntary prolongations, repetitions, hesitations, and blocks in sounds, syllables, and words that interfere with the normal speech stream.3,4 Besides hampering the patients’ quality of life, stuttering has been shown to affect interpersonal relationships and socioeconomic opportunities in adults who stutter (AWS).5,6 Stuttering is a challenging disorder from a clinical and pathological perspective. Stuttering research has capably distinguished the person who stutters (ie, stuttering “trait”) and the act of stuttering (ie, stuttering “state”).7 Yet, the question of whether an underpinning neural factor is involved in stuttering fluctuations has remained open. According to Etchell et al., from over 110 original research articles that examined structural and functional neural bases of developmental stuttering 31 studies used electroencephalography (EEG).3 EEG retains a good time resolution for recording neural activity in the brain. This feature makes EEG a viable option for speech preparation (SP) and production studies.
Despite the EEG’s low spatial resolution and sensitivity to muscle artifacts, its low cost and availability have made it the most common method for neuroimaging in stuttering research.
1 Department of Neuroscience, School of Advanced Medical Sciences and Technologies, Shiraz University of Medical Sciences, Shiraz, Iran 2 Department of Computer Sciences and Engineering, School of Engineering, Shiraz University, Shiraz, Iran 3 Department of Computer Engineering, Islamic Azad University, North Tehran Branch, Tehran, Iran 4 Department of Speech and Language Pathology, University of Social Welfare and Rehabilitation Sciences, Tehran, Iran 5 Department of Clinical Psychology, School of Behavioral Sciences and Mental Health, Iran University of Medical Sciences, Tehran, Iran 6 Neuroscience Center, INDICASAT-AIP, Panama City, Republic of Panama 7 Dana Brain Health Institute, Iranian Neuroscience Society-Fars Chapter, Shiraz, Iran 8 Academy of Health, Senses Cultural Foundation, Sacramento, CA, USA
Corresponding Author: Mohammad Nami, Department of Neuroscience, School of Advanced Medical Sciences and Technologies, Shiraz University of Medical Sciences, Shiraz, 7133654361, Iran. Email: [email protected]
2 The functional roles of neural oscillations in stuttering have been studied extensively. Analyses of the EEG spectra at rest in AWS have reported a reduction in EEG power from the alpha band and higher (especially the beta band) and some increase in power of the low-frequency bands (delta band).8,9 Considering that reduced beta power is a main characteristic of limitations in the supply of neuronal energy, Alm hypothesized that stuttering is related to some impairment in the energy supply to neurons. He proposed 2 ways in which a reduced supply of energy results in stuttering.10 In direct effect theory, stuttering is caused by a reduced rate of firing by energy-deprived neurons involved in speech production. Moreover, he suggested an indirect effect hypothesis wherein metabolic impairments cause an elevated tonic level of synaptic dopamine, which, in turn, results in stuttering. Anomalies of the dopamine system have been implicated in stuttering, particularly because of pharmacological effects and theoretical links between stuttering and the basal ganglia.11–13 Alm et al. proposed that the basal ganglia–thalamo–cortical motor circuits are likely to play a key role in stuttering. They proposed that the impaired ability of the basal ganglia to produce timing cues for the initiation of the next motor segment in speech is a core dysfunction in stuttering.12 Some investigations suggested that stuttering is characterized by delayed neural timing.14 Beta oscillations originating from premotor and motor regions are influenced by basal ganglia and its sensorimotor functions and reflect internal timing so they can capture motor-to-sensory feedforward projections.13,15,16 The role of beta suppression in predictive motor planning, which typically occurs prior to movement onset, has been articulated in previous research. Preparation for overt speech production is specifically associated with left-lateralized alpha and beta suppression in temporal cortices and beta suppression in motor-related brain regions.16 It is assumed that beta suppression before speech production reflects a feed-forward process upon speech motor planning and within relevant sensory regions critical for speech monitoring. Alpha oscillations are also sensitive to basal ganglia-based inhibitory signals as well as sensory-to-motor feedback.17 Both overt syllable and word productions yield similar alpha/beta inhibition, which preempts speech production and becomes strongest during muscle activity.18 Given the role of alpha and beta oscillations in SP and stuttering,19 these frequency bands have been investigated in the stuttering trait, and evidence of significant differences in SP processes between AWS and fluent speakers (FS) has been reported.20–24 Studies on SP using high temporal resolution imaging in the stuttering state are scant and have yielded contradictory results. Some research reported meaningful differences in signals prior to stuttered and fluent words.25,26 On the other hand, others found no meaningful differences between fluent and stuttered utterances according to the power spectrum during the preparation phase.27,28 Motor imagery (MI) is another condition that has been used in stuttering research. Imagined stuttering is shown to be in considerable agreement with overt stuttering in terms of regional
Clinical EEG and Neuroscience 0(0) brain activation.29,30 High temporal resolution studies that investigated imagined speech (IS) postulated that although covert (ie, imagined) speech does not require movement or generate reafferent feedback, forward models of the speech targets and expected sensory feedback are incurred via a purely internal loop.31,32 In support of this notion, Jenson et al showed that neural oscillations in syllable production and imagine are compared using the standardized low-resolution electromagnetic tomography (sLORETA) algorithm.18 They later submitted significantly decreased alpha and beta suppression in the left hemisphere for the stuttering trait upon both syllable overt and covert production.33 However, since AWS also has fluent speech, it is expected that both efficient and impaired feedforward and feedback internal modeling would be achieved upon the stuttering state in IS. However, this has not yet been investigated in detail. Different algorithms have been proposed for localizing sources when EEG signals are recorded from different channels. Low-resolution electromagnetic tomography (LORETA)34 and sLORETA35 have been successfully applied to the source—localize event-related potentials (ERPs), power spectral analysis, and assessment of functional connectivity in the stuttering.8,9,36,37 Joos et al. found decreased functional connectivity for highfrequency oscillations between motor speech areas and the contralateral premotor and motor areas, in addition to a positive correlation between functional connectivity at low-frequency oscillations and stuttering severity using sLORETA.8 Hypothesizing that speech processing occurs on different timescales, the entrainment of neural oscillations has to be considered from a comprehensive perspective. In this regard, we planned to investigate the power spectra almost across the frequency bands, as outlined in the methodology section of the present report. That said, we took a paradigm based on addressing 50 specific questions/command statements through which the neural substrates of the stuttering state using continuous were investigated using continuous task-concurrent EEG recording. The subjects were asked to answer the written questions/command statements (verbal stimuli) aloud. They were trained to imagine their own productions exactly the same as the original answer (the same words, the same fluency pattern). Neural oscillations related to SP and IS production was, respectively, analyzed. Considering the distinct role of high and low-frequency bands in the literature related to the stuttering trait, the present study attempted to test possible deviations in oscillatory brain dynamics occurring in SP and IS in the stuttering state in AWS in an exploratory way. The study then extracted enough stuttered and fluent natural oral speech in fluent (without using fluency-inducing methods) and dysfluent samples for cross-compared using the sLORERTA.
Materials and Methods Participants Twenty native Persian-speaking men (mean age: 35±4 years, range: 21-42) with persistent developmental stuttering and no
Bayat et al
3
known history of hearing, speech–language (other than stuttering) disorders, or neurological problems were enrolled. The participants received reasonable compensation for their participation (as per the institutional review board approval). The subjects were right-handed38 and their stuttering severity was mild to severe based on the Persian version of Stuttering Severity Instrument–version 4 (SSI-4)39 evaluated by 2 qualified independent speech and language pathologists (SLPs). Participants gave written and verbal instructions in a separate session. These data were derived from a study addressing the question of the effect of quantitative electroencephalography (qEEG)-informed transcranial electrical stimulation (tES) together with speech therapy on stuttering remediation in AWS. All experimental procedures were approved by the intuitional ethical review board. Written informed consent was obtained from all participants.
Experimental Tasks and Design Two SLPs designed 50 verbal stimuli with short responses in such a way their probable replies encompass various phonemic, semantic, and syntactic contexts. Verbal stimuli were randomly repeated 5 times in 50 verbal stimuli blocks (a total of 250 trials). For each subject, only items were analyzed that the participant, through 5 repetitions, stuttered in some cases and was fluent in others. The signals accompanying fluent and stuttered responses were then averaged separately for every verbal stimulus. The number of accepted trials (verbal stimuli) for every participant is shown in Table 1. Then, data were averaged for each participant/state and 20 trials of fluent responses were compared with the same number of trials of nonfluent responses for 2 conditions of SP and IS separately. This was an attempt to equalize the sample sizes of the fluent and stuttered utterances. Every trial comprised 8 icons standing for 8 events, presented on a PC screen with Psychtoolbox-3 through open-source
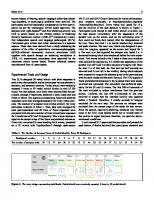
MATLAB and GNU Octave functions for vision and neuroscience research (available at http://psychtoolbox.org/docs/ DownloadPsychtoolbox). Every verbal trial lasted for 15 s, and the timeline of the task duration is shown in Figure 1. Participants were trained to read verbal stimuli in silence, say the best answer immediately after the appearance of the speaker icon on the screen, and cut the articulation even if they could not finish their answer after the disappearance of the icon. Then, they had 1 s to decide whether they stuttered and push a button. The next icon, which was designed to proclaim the imagine, appeared on the screen and stayed for 3 s. The next icon that signaled the whisper also lasted 3 s. A shortened training block was introduced before the main experiment. Two events related to the 2 tasks in these time windows were selected for analysis [ie, 2.5 s before the appearance of the speaker icon (SP) and 2 middle seconds of imagine (IS) (from the total 3 s of this task, the first and last half seconds are removed and 2 s are left in the middle), during which subjects were required to imagine the answers given in the previous step with the same words and the same fluency]. The EEG signals of fluent and stuttered utterances in the accepted trials were source localized and compared. The procedure was performed separately for the SP and IS events. The first 500 milliseconds of ISs were excluded to reduce interference from the previous section. Likewise, the last 500 milliseconds of ISs were removed to ensure that the intended activity was captured before it finished. Therefore, 2 middle seconds of imagine remained for the next step. The sections on whisper were excluded from the current stage of the study for later review. Since the speech, especially stuttering, produces very intense noise in the EEG, most studies prefer not to include parts of this section in signal analyses; therefore, we used the abovementioned conditions. A well-trained SLP supervised the procedure and pressed the push button if she/he believed that participants stuttered and
Table 1. The Number of Accepted Items of Verbal Stimuli in Every 20 Participants. Participants’ number
1
2
3
4
5
6
7
8
9
10
11
12
13
14
15
16
17
18
19
20
The number of accepted trials
34
15
17
40
28
8
35
15
11
41
32
13
24
17
25
21
13
9
14
25
Figure 1. The study design representing task blocks. Verbal stimuli were randomly repeated 5 times in 50 verbal stimuli.
4 that trial was correctly accomplished. On the other hand, if a participant did not stutter but had the wrong timing (answering before the appearance of the relevant cues) or excessive movement in task execution, the SLP pushed the button to mark the trial as rejected. This pattern was also used for trials that the subjects left unanswered. The 2 available push buttons were synchronized with the EEG recording system with a trigger box and marked trials. The second SLP saw the recorded videos of the subjects being tested during the task and distinguished the trials by their fluency offline. Finally, trials were analyzed as dysfluent if they had been triggered twice and were considered stuttered by the second evaluator, and as fluent if they were without triggers and were considered fluent by the second SLP. In this study, the individual’s own assessment of the presence or absence of stuttering was effective in determining trials. Prior to the test, individuals were instructed to identify the least uncomfortable feeling, even if it was not audible, as a stuttered response. On the other hand, speech therapists were asked to label the trials as stuttered only when they were completely certain. This would have managed the usual problems in stuttering state studies. We had to accept the risk of possible rejection of some trials mistakenly. Therefore, trials in which the subjects had commission errors were rejected and excluded from the experiment.
Electrical Neuroimaging—EEG Acquisition EEG data were obtained at a sampling rate of 512 Hz using a 64-channel Brainvision amplifier (Mulgrave, Australia). The active electrodes were mounted on an elastic cap using the standard 10–10 system of electrode placement, and the electrical impedance of scalp electrodes was set below 5 KΩ. The participants were instructed to minimize eye blinks and body movements during the 2 experimental sessions. About 2-minute pauses between blocks were considered to avoid fatigue and muscle tension, but there were no pauses within a block. The parallel port system delivered a marking pulse when each icon was displayed to align the EEG signals for proper offline analyses.
Quantitative analysis of the EEG Filtering and Artifact Rejection. EEG signals of each subject were filtered through a Butterworth bandpass filter (fifth-order) with cut-off frequencies of 0.75 and 45 Hz in MATLAB-based EEGLAB_14_1_2b open-source software.40 Signals were referenced to average. Bad channels, if any, were interpolated using the spherical method for each participant. The independent component analysis (ICA) training was accomplished with the “runica” algorithm in EEGLAB.41,42 The ADJUST 1.1.1 tool (an open-source EEGLAB plugin available at https://sccn.ucsd.edu/wiki/Plugin_list_all) was used to detect nonneural sources. ADJUST is a completely automatic algorithm that identifies artifactual independent components by combining stereotyped artifact—specific spatial and temporal
Clinical EEG and Neuroscience 0(0) features. Features are optimized to capture blinks, eye movements, and generic discontinuities in a feature selection dataset. The algorithm then provides a fast, efficient, and automatic method for using ICA for artifact removal.43 After removing the detected components using the ADJUST plugin, an experienced neuroscientist visually inspected the components resulting from muscle tension artifacts. Components corresponding to blinking or speaking tension were also removed. MATLAB R2018b software was used to process and analyze the data for each subject. Separation of Trials Related to Fluent and Dysfluent Utterances. The separation of fluent and dysfluent trials was performed using MATLAB software. Signals of fluent and dysfluent trials in every 2 tasks (ie, SP and IS) were separately averaged for each subject for every verbal stimulus in all electrodes in accepted verbal stimuli, as shown in Table 1. Estimation of the EEG Spectral Powers and Source Localization. The power was averaged for fluent and dysfluent answers in every subject over nonrejected repetitions of the nonexcluded verbal stimuli for each task separately. Signals were filtered by a Butterworth IIR filter using MATLAB function to obtain the power of the 6 frequency bands: delta (0.75-4 Hz), theta (4-8 Hz), alpha (8-12 Hz), beta1 (12-16 Hz), beta2 (16-20 Hz), and beta3 (20-28 Hz). Then, the sLORETA code transcript in MATLAB estimated the location of the distributed intracerebral sources, estimating the band powers of EEG signals after the band-pass filter was applied. To improve localization accuracy, a realistic head model was employed instead of the conventional spherical model to estimate the lead-field matrix.
Statistical Analysis Two conditions (SP and IS) and 6 bands of power were compared in the fluent and dysfluent states. For statistical analyses, a paired t-test was used to derive the statistical significance of every SP and IS condition for 6 bands of power, separately, between the 2 states of the same subjects. Localization algorithms were applied to the intended band power. After Bonferroni adjustment for multiple comparisons, the significance level was detected (P≤.001) and the effect size was calculated for significant differences. The effect size is the magnitude of a hypothesis observed through an experimental investigation.44 Estimates of effect size are useful for determining the practical or theoretical importance of an effect, the relative contributions of factors, and the power of analysis.45 Therefore, we used the effect size for the difference in means given by Cohen’s formula.46 Based on the current research, the rules of thumb for effect sizes are defined as d (.01) = very small, d (.2) = small, d (.5) = medium, d (.8) = large, d (1.2) = very large, and d (2.0) = huge.47 All statistical procedures were performed using MATLAB R2018b software.
Bayat et al
5
Results
The power scales for each band (based on dB) and the results of the sLORETA application for the SP condition are shown in Figures 2 (delta and theta) and 3 (alpha and beta).
Statistical Analysis Differences in activity between groups were statistically analyzed on a voxel-by-voxel basis using the paired t-test, and the threshold was set to P < .05, using a nonparametric permutation test with 5000 randomizations accounting for multiple whole-brain comparisons. According to the paired t-test, localized powers of band frequencies were found to have significant differences over 11 out of 12 investigated statuses between fluent and dysfluent signals. P-values of statistical tests for delta, theta, alpha, beta1, beta2, and beta3 for SP were less than .05. The measures for IS were as follows: 0.17 for the delta and less than 0.05 for each of the 5 other frequency bands. The effect size measures for the aforementioned bands through SP were 0.2, 0.63, 0.52, 0.52, 0.70, and 0.65, respectively. The effect size for the IS condition were 0.1, 0.54, 0.73, 0.52, 0.63, and 0.55, respectively. High inter-rater reliability was found (Kappa = 0.91, P