Surface Physics (Springer Tracts in Modern Physics) 3540075011, 9783540075011
Some wear. Shelf wear. Pencil marks on first end page. Pages are clean and binding is tight.
143 40 11MB
English Pages 125 [134] Year 1975
Recommend Papers


- Author / Uploaded
- K. MŸller (Contributor) P. Wissmann (Contributor)
File loading please wait...
Citation preview
Springer Tracts in Modern Physics 77 Ergebnisse der exakten Naturwissenschaften
Editor: G. Hohler Associate Editor: E. A. Niekisch Editorial Board: S. Flugge J. Hamilton F. Hund H. Lehmann G. Leibfried W. Paul
Manuscripts for publication should be addressed to:
G. Hohler lnstitut fur Theoretische Kernphysik der Universitat Karlsruhe 75 Karlsruhe 1, Postfach 6380 Proofs and all correspondence concerning papers In the process of publication should be addressed to:
E. A. Niekisch lnstitut fur Grenzflachenforschung und Vakuumphysik der Kernforschungsanlage Julich, 517 Julich, Postfach 365
Surface Physics Contributions by
P.Wi6mann and K. MQIler
With 58 Figures
Springer-Verlag Berlin Heidelberg New York 1975
Privatdozent Dr. P. Wi•mann lnstitut for Physikalische und Theoretische Chemie, Universit&t Erlangen-N~Jrnberg, 852 Erlangen, Egerlandstr. 3 Prof. Dr. Klaus M(~ller Lehrstuhl for Festk6rperphysik, Universit~t Erlangen-NOrnberg, 852 Erlangen, Erwin-RommeI-Str. 1
ISBN 3-540-07501-1 Springer-Verlag Berlin Heidelberg New York ISBN 0-387-07501-1 Springer-Verlag New York Heidelberg Berlin Library of Congress Cataloging in Publication Data. Wi6mann, Peter, 1936. Surface physics. (Springer tracts in modern physics; 77). Bibliography: p. Includes index. 1. Metallic films - Electric properties. I. Mii]]er, K]aus. 1934. Joint author. II.Title. II1. Series. QC1. $797. vol. 77. [TN690].539', 08s. [669',95]. 75-30720. This work is subject to copyright. All rights are reserved, whether the whole or part of the materials is concerned, specifically those of translation reprinting, re-use of illustrations, broadcasting, reproduction by photocopying machine or similar means, and storage in data banks. Under § 54 of the German Copyright Law where copies are made for other than private use, a fee is payable to the publisher, the amount of the fee to be determined by agreement with the publisher. © by Springer-Verlag Berlin Heidelberg 1975. Printed in Germany. The use of reg,istered names, trademarks, etc. in this publication does not imply, even in the absence of a specific statement, that such names are exempt from the relevant protective laws and regulations and therefore free for general use. Printing and bookbinding: Sr~hlsche UniversitStedruckerei, Giel~en.
Contents
The Electrical Resistivity of Pure and Gas Covered Metal Films By P. WiEmann. With 48 Figures 1. 2. 3. 4.
Introduction .••••••.•••••..•••.•••.• .•..•.•.•.•.•••.••.••.••• • Experimental. • . • . • . • • • . • . . . • . • . . . • . • • . • . • • • • • • • . • . • • • • . • • • . • • • 4 Structure of the Films ..••...•.•••••.......•••. .•.•..••.•.•••• 13 The Resistivity of Pure Metal Films ..••.•.•.•.•.•.•..••..••• •• 23 4.1 Theoretical Treatment .•....•••..•••.•••...•.. •..•...•..•.. 23 4.1.1 The Theory of Fuchs and Sondheimer •••••.••••••.••.•• 24 4.1.2 The Theory of Mayadas and Shatzkes ..••••••.•.••.•••• 25 4.1.3 The Scattering Hypothesis .•.•....•.•...•.•••..•... .• 26 4.1. 4 Comparison of the Theories .•.•..•....•••.•.•...•.•• . 29 4.2 Experimental Results ••••.•.• .' •••••••...••.••.•••.•.•.• •••.. 33 5. The Temperature Dependence of Resistivity of Pure Metal Films. 44 5. 1 Theoretical Aspects................. ... . . • . • • • . • • • • • . • . . . . 44 5.2 Experimental Results .•.•..••••..••.••••...... •..•.••.••••. 46 5.3 Limits of the Free Electron Gas Model .••••.•.•••.••••.•.•• 52 6. Resistivity Change Due to Gas Adsorption ••.•.•••..•••••.•.••.. 57 6. 1 Theoretical Treatment.............. .......... . . . . • . • • . . • . . 57 6. 1. 1 Suhrman Model.......... . . • • . • . . . • • • • • • • • • • • • . . • . . . . . 57 6. 1. 2 Sachtler Model.. . • . • . • . . . . . . . • . • • . . . • • . . . • • • • . . • . • . . 59 6. 1 . 3 Fuchs-Sondheimer Model. • • . . • • . • . . . . . • . • • . • • • • • • . • • • • 61 6.1.4 The Scattering Hypothesis ••.•.••.•••.•.•••.••.•.•• .• 62 6.2 Experimental Results •.•..••••••••.•.•..•.•.• .••••.••...... 63 6.2.1 Effect of Film Thickness •••••.••.•••.•••••.•.•.•• ••• 63 6.2.2 Effect of Annealing Temperature •••..•••••••••••••..• 67 6.2.3 Effect of Measuring Temperature .•.••.••...••••••.•.. 70 6.3 The Maximum Value of Resistivity Increase •••.•.•••.•.••••. 72 6.4 The Discussion of the Over-all Curve ~p(n) •••••.•••.•.•..• 77 6.5 Changes in Hall Constant and Thermoelectric Power •.•..•.•. 80 7. Resistivity and Heat of Adsorption .•.•••..•••...•.•••..•..• .•. 83 8. Concluding Remarks...... . • • . . . . • • . • . • • • . • • . • • • . . . • • • . • . • . • . • . • 86 References.... . • . • • . • • • . . • . . . • . . . . • . . • . • . . • • . . . • . . . • . • . • . • . . • . . • . 89
v
How Much Can Auger Electrons Tell Us About Solid Surfaces? By K. Muller. With 10 Figures 1. Introduction..................................................
97
2. The Distribution N (E) . . . . • . • . . • • . • . . . . . . . . . . . . . . . . . . . • . . . . . . • .
98
3. Energy Levels of the Sample .••.•..•••.•.........•.•...•...•..•
99
4. Some Important Interactions ..••...•..•.•..•............•.....• 100 4. 1 Inelastic Loss Spectroscopy ( ILS) • • • . . • . . • . • . • . • . . . . . . . . . . 100 4.2 Disappearance Potential Spectroscopy (DAPS) •.•.........••. 100 4.3 Appearance Potential Spectroscopy (APS) . • . . . . . . . . . . . . . . . . . 102 4. 4 Auger Electron Spectroscopy (AES) • . . • . • . . . • • . . . • . . . . . . . . • . 102 4.5 Photoelectron Spectroscopy (XPS, UPS) ......•...•....•..•.• 103 5. Instrumentation .......•.•.........••••.•.....•.••...•....•.••• 103 6. Auger Transitions.... . • . . . • . . . . . . . • . • . • • • . . . . . . . • . • . . . . . . . • . • . 105 7. Inspection of an Auger Spectrum •...•.•..•..........•.••.•.•..• 106 8. The Qualitative Element Analysis ......•.•..•.•.••.......•..... 107 9. Steps Towards Quantitative Analysis •...•..........•.•.•.•.•... 109 10. Deconvolution .....•..•.••..•.•.....•...••.•..........•........ 112 11. Line Shape and the Density of States. . . • • . • . • . • . . • . . . . . • • . . . . • 113 12. Line Shape and Chemical Environment ......•....••.•............ 115 13. Auger Electrons from Compound Solids. . . . . . . • . • . • . . • . • . • . . • • . • . 117 14. The Concept of Cross Transitions ..•......•.•...•....•......... 118 15. A Potential Example: Cs-C... . • . • . . . . . . . . • . . • • . . . . . . . . • . . . • • . . . 119 1 6 . Metal Oxides. . • . • . . . • . . • . . . • . • . . . . . • . • . • . . • . . . . . . . . . . . . . . . • . . . 1 21 17. Conclusion .•.•.....•.•....................•.....•.•........... 123 Abstract ..•.......•.....••.•.•.•.•...••.•.•.•....•.....•.•...•...• 123 Acknowledgement . . . • . . . . . . . . . . . . • . . . . . • . • • . . . . . . . . . . . . . . . . . . . . . . . • . 123 References. . . . • . • • . • . . . • . . . . • . • . . . • . . . . . . . . • . • . • . . . . • . . • . • . • • . . . . • 12 4
VI
P. WiBmann
The Electrical Resistivity of Pure and Gas Covered Metal Films
1. Introduction Resistivity measurements have received wide attention from experimental as well as theoretical side in order to gain insight into the electrical and structural properties of evaporated metal films lately. The relatively simple experimental arrangement and high accuracy are perhaps the main reasons for the popularity of this method. Motivating factors for the study of the thin film behaviour were many and varied such as:
(a) Analyzing the thickness dependence of the film resisti-
vity for getting information about the mean free path of conduction electrons /1/
(b) Developing integrated circuits, whose characteris-
tics largely depend on the thin films used in their fabrication /2/ (c) Investigations of the "electronic factor" involved in heterogeneous catalysis by means of adsorption experiments performed on films produced under well defined UHV-conditions, where a clean film surface may be presumed to result /3/. Meanwhile, there is extensive experimental material at hand in the literature /4-8/. Nevertheless, it may be stated without any exaggeration, that an uniform interpretation of the results under review has not been possible till now. Difficulties begin already with the explanation of the experimental results of the resistivity behaviour of the pure, uncovered films. They show specific resistivities which lie much higher than that of the bulk material. The thinner the film, the more marked is the effect. Size effect theory of FUCHS /9/ and SONDHEIMER /10/ has been used for the interpretation of this result in the literature nearly exclusively till now. According to this theory the conduction electrons suffer at the outer film surfaces at least a partially diffused scattering, which gives rise to an extra resistivity term especially at small thicknesses. The quantitative analysis of the experimental data shows, however, distinct deviations from the theoretical calculations /11/.
Table I: Fuchs Specularity p of Evaporated Au Films
reference
p
/12/
0 -
/13/
0 - 0,8
/14/
0
/15/
0
/16/
0 - 0,9
/17/
0 -
In other cases different authors have found extremly different numerical values for the characteristic Fuchs specularity of one and the same material, as can be seen, for instance, for gold films in table I. The values fluctuate between total specular {p=1) and completely diffuse {p=o) scattering. These fluctuations were correlated with the influence of surface roughness on the scattering behaviour by most of the authors /12-17/. Such an interpretation seems, however, to be arbitrary. An effect of crystallite boundary scattering /18-20/ or an influence of adsorption of foreign gas molecules, at least at the boundary of film/substrate, can also play an important role. The results become specially vague when the resistivity measurements on the polycrystalline gold films point at p=o, whereas optical reflection experiments on the same films can only be explained on the precondition that p=1 /21,4/. Many difficulties appear while attempting to explain adsorption . experiments too. Experimentally one always finds an resistivity increase with increasing coverage. This resistivity increase, which becomes larger for decreasing thickness, was interpreted formerly by a diminuation of the number of free electrons in the films. According to the ideas developed first by SUHRMANN and co-workers /22/ the binding between adsorbent and adsorbate should be mainly polar, i.e. there should be a direct transition of the conduction electrons from the metal to the adsorbed molecules. This model, however, does not exclude the possibility of electron displacements leading to a decrease in resistivity. Early works performed under relatively bad vacuum conditions appear to confirm such a decrease indeed /23,24/. Later on, however, it was shown, that at low coverages the resistivity increases in each case /25,26/. Besides this the thickness dependence given by the experiments shows a marked deviation from the
2
theoretical calculation based on the Suhrmann model /27/. SACHTLER and co-workers /28/ proposed, therefore, to explain the resistivity increase as a demetallisation effect. The surface atoms of the adsorbent should form a surface complex with the adsorbed gas molecules and thus loose their metallic state to a certain extent. In this way the film thickness would be diminuated by approximately an atomic layer thus increasing the resistivity. With the help of this model a resistivity increase of about a few per cent could be explained, but the model fails completely in interpreting the 30 % increase observed in the case of CO-adsorption on about 100 ~ thick copper films /29/. It remains ambiguous, too, as to why the CO relatively weakly bound on copper causes such a big resistivity increase in comparison to the case of nickel, where the CO is bound more strongly /3/. Summarizing it may be stated, that models discussed in the literature so far do not give a complete picture for quantitative descriptions of the resistivity behaviour of clean and gas covered metal films. Aim of this article is, therefore, to demonstrate new possibilities for the discussion of the above mentioned resistivity effects taking into account the results published by the author in various papers in the recent past /30-39/. Mainly the properties of nickel and copper films shall be taken into consideration. These metals are particularly suited for the study of adsorption phenomena, because both have a face-centered cubic structure with nearly the same lattice constant, but differ in their electronic structure. Thus nickel shows, contrary to copper, a considerable number of unfilled holes in the d-band. Through comparison of the results obtained for these metals it should be possible, therefore, to answer, amongst other things, how far the assumption of a single band model is an admissible approximation in calculating thin film resistivity. For these nickel and copper films it will be attempted to explain the experimental data under the assumption of a largely specular scattering of the conduction electrons at the undisturbed film surfaces and to trace back the observed thickness dependence of resistivity of the clean films to the scattering of the electrons at crystallite boundaries. The resistivity increase caused by gas adsorption can then be explained without any problem by a creation of new scattering centers at the film surfaces, similar to the scattering centers produced
3
by alloyed foreign atoms in the bulk. It will be checked, whether the influence of film thickness, annealing temperature, measuring temperature and gas coverage on the resistivity increase of the systems investigated here could be explained satisfactorily with the help of this hypothesis. Further on it will be attempted to take into account the temperature coefficient of resistivity, thermoelectric power and Hall effect measurements. In this way the limits of applicability of the suggested simple model can be made clear. Results obtained on films other than nickel and copper are taken into account only in special cases because of the reasons given in section 2. The resistivity of very thin, discontinuous metal films /40,41/ cannot be discussed at all within the frame-work of the present article. Such films show strong structural and electronic characteristics, for the interpretation of which special models have to be developed /7/. With reference to the discussion of galvanomagnetic properties of the films like magnetoresistance effect /10,42,43/, anomalous skin effect /10,44/ and eddy current size effect /45/ we must refer to the corresponding literature too. The explanation of available experimental data, especially in the case of nickel and copper, is very complicated because simple models for the description of galvanomagnetic properties of the transition metals do not suffice as a rule /46-48/.
2. Experimental A series of experiments on the resistivity behaviour of thin metal films has been performed by different authors on various systems, resulting in a large amount of experimental data on clean (see the review articles /1,4-7/) as well as on gas covered films (see, for instance, BLIZNAKOV and LAZAROV /49/, GEUS and ZWIETERING /8,50/, MURGULESCU and IONESCU /51/, COMSA /52/, PONEC and KNOR /53/, SACHTLER /28/, SUHRMANN /22/ and WEDLER /3/). On the first view, some of the
4
existing data seem to show a rather poor consistency. The reason lies in the fact, that the films used by different authors often differ strongly in their structural properties due to varying deposition conditions. In order to be able to compare the results of the resistivity measurements on uncovered films alone the following parameters must check: material, structure, temperature and purity of the substrate, rate and geometry of evaporation, residual gas pressure and composition, material, thickness and annealing treatment of the films, and measuring temperature. Or, at least it should be possible to estimate with sufficient accuracy the influence of the above mentioned parameters on resistivity behaviour. Obviously this is possible only in very few cases. High purity of the film surface and the used gases is necessary for adsorption experiments additionally, and an uniform distribution of the adsorbate on the surface must be assured. Therefore, the discussion of the experimental results in the present paper shall be limited to measurements which satisfy following conditions: (a) films must have been evaporated and investigated under UHV-conditions; (b) the structure of the films must be largely known; (c) thickness, annealing temperature, measuring temperature and gas coverage should have been varied systematically, keeping all other parameters of preparation strictly constant; (d) the gases to be adsorbed should be simple molecules such as CO, N2 and H2 , in order to rule out the possibility of decay at the surface (like in the systems Ni/H 2o /54/ and Ni/CH 4 /55/, or of penetration into the metal (like in the system Ni/0 2 /56/); (e) the coverage must be known to a sufficient accuracy; (f) data on the absolute change of resistivity must be given, because data on the relative change only do not suffice for a quantitative comparison with theory. In table II the papers are listed, which fulfil more or less the above mentioned conditions. Column 1 gives the system investigated, column 2 the author and column 3 the reference of the paper. Column 4- 6 indicates, whether emphasis was given to thickness (d), annealing temperature (AT) or measuring temperature (MT) dependence, column 5
+
-
-
-
/63/
/64/
WIEBAUER
RUDOLF
Cu/CO
Cu
*
-
-
-
+
/62/
KOCK
Cu/CO
+
+
-
-
-
-
+
-
-
-
d
c
a
a
a
b,
a
b,
(a)
(a)
fig. 1
1
1
0,83
0,83
1*
11 2
0,83
11 2
F
the geometric factor was not possible. Therefore, F was set equal to one arbitrarily.
In this case quadratical platinum foils were used, for which a calculation of
+
+
-
+
+
+
WOLFING
Ni
+
-
-
-
-
+
+
/60/
RICHTER
Ni/N 2
/61/
-
+
+
+
-
+
/59/
REICHENBERGER
Ni/H 2
+
+
-
-
+
/58/
WISSMANN
Ni/CO
-
-
HE
-
TP
+
/57/
WENZEL
Ni/CO
TCR
MT
AT
d
reference
Author
System
experimental device:
-
1
1
11 4
1
1 12
1
1 18
11 4
f
Discussed in Detail in this Paper
additional investigation of
~easurements
systematical variation of
Table II: List of the Resistivity
. ··-
··-··-·---
-
/29,70/
/29,70/
/11,57a,71/
/65-69/
/65/
/27,65,66/
literature for comparison
____.- c
AS F p 5
w F
p
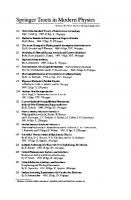
Fig.1a
Measurement cell for-the determination of resiotivity of evaporated metal films. Details are given in text. The gas shower S and the additional substrate AS are not shown on their e~uatorial position for clarity reasons
7 - 9 informes, whether the temperature coefficient of resistivity (TCR) , thermoelectric power (TP) or Hall effect (HE) were investigated additionally. The literature references of those authors, who have published comparable resistivity data on the same system, are given in column 13. A comparison shows, that under the presumption of similar preparation conditions of the adsorbent all results are in surprisingly good agreement and have a remarkable reproducibility. All the authors listed in table II investigated films evaporated at a residual gas pressure less than 5 · 1o- 10 Torr at a rate of about 10 ~/min. Glass held at 77K was used as substrate except in one case
/64/, where silicon single crystals were used. Thickness measurements were always undertaken after completion of the resistivity investigation by dissolving the film and thereafter analysing quantitatively with the help of different colorimetric methods /72/. In the paper /64/ thickness was determined additionally by continuous registration of a vibrating-quartz-crystal monitor.
7
MF
TT TT
TT
b) Fig.1b-d
c)
MS
d)
Additional substrates according to WENZEL /57/, WIEBAUER /63/ and RUDOLF /64/. TT =tungsten terminals, MF =molybdenum contact film, MS = molybdenum sheet
The experimental arrangement is shown schematically in fig. 1. The spherical glass bulb used in this or a similar form in all works is represented by fig. 1a. This bulb provides the extra advantage of less microroughness of substrate compared to the optically plane polished glass substrates /73/. The filament W, which consists of a spectrally pure nickel wire or of small spectrally pure copper riders fixed on a spiral of a tungsten wire, is situated at the center of the cell, providing an uniform film on the inner wall of the bulb. Two ringformed platinum foils P are fused on the inner walls facing each other, thus making possible resistivity measurements after connecting the foils with a Wheatstone bridge by means of two respective feed-throughs F. The connection to the vacuum pumpline is provided by C. The gas doses are given by breaking ampules, which were previously filled in a separate ultrahighvacuum system with a known amount of the desired chemically pure gas. If the cooling traps and the ionisation gauge are both separated from the cell by manipulating from outside magnetically two glass valves of ball-socket type, then it can be guaranteed, that the gas is adsorbed nearly quantitatively on the film. Therefore, the coverage can be immediately represented by n
= number
of the adsorbed molecules
cm 2 of the geometrical surface
Sometimes a measurable equilibrium pressure develops over the film. Then the n-values are provided with an adequate correction factor,
-4
which becomes noticeable only at extremly high pressures (p > 10 8
1.0 ~
E
C).
~
~
l
/X x, 0
O.B 0.6
OA
a
----ox
//I X
/;lb I
0
0.2 0 , 0
X I I
,o
2
n f!notecu/es/cm 2) Fig.2
Resistivity increase due to CO-adsorption at 77 K. Gas shower in use (a) and not in use (b) (WEDLER and FOUAD /27/)
Torr) . A shower S serves the purpose of uniform distribution of the gas on the film. That such a shower is necessary in cases where one wants to study the resistivity change with respect to coverage of immobile adsorbed gas molecules may be taken from fig. 2. In this figure, the relative change
~p/~pmax
of the resistivity of a nickel
film held at 77K is plotted against the carbon monoxide coverage /27/. In the first stages of adsorption the gas is bound preferentially on the equator region of the cell, if the shower is not used (o). This results in a smaller increase in resistivity compared to the increase with the shower in use (x). At 273K the CO-molecules would have sufficient mobility on the surface in order to compensate for a nonuniform distribution /27/. In some cases (see table I column 10) an additional substrate AS is installed in the cell. This may be a glass substrate with moltenin tungsten contacts and polished optically plane surface (fig. 1b and 1c) or a single-crystal silicon substrate with evaporated molybdenum contacts (fig. 1d). Details of the experimental arrangements are described elsewere /57-64/, but in all cases the resistivity increase due to gas adsorption coincides within the experimental error, whether measurement is performed on the spherical bulb or on a plane substrate /57,59/. In all the devices the main problem is the determination of the
9
factors f and F, which are necessary for the calculation of specific resistivity of the film p from the measured resistance R according to the relation p
d
F·f R
(1)
Although the dimensionless /11/ geometry factor F is easy to be calculated for the different arrangements of the contacts shown in fig. 1a - d (numerical values in table II column 11), the determination of the correction factor f is troublesome, because it describes phenomena which are difficult both to measure or to calculate. This factor takes into account, that the fused platinum foils can loosen itself from the glass substrate indistinguishable for the eye (see fig. 1a), or that the transition between the glass surface and the tungsten terminal can be damaged by air bubbles, which might be opened due to polishing process (see fig. 1b and 1c), or that a part of the molybdenum contact film can lift itself during thermal treatment of the silicon substrate (see fig. 1d). In all these cases it is to be expected, that f takes up values greater than one. Further it should be noticed, that the cylinder geometry model /11/ which is presumed for the calculation of the geometry factor F in the case of spherical cells, is applicable to the real situation only in the first approximation. For a more exact treatment the recesses left by the connections to vacuum system, gas shower, evaporation source etc. should be taken into account. Even if all these recesses are designed to be as near to the cell equator as possible, an estimation shows, that in an unfavourable case an error of about 30 % in the calculation of F must be reckoned with. This error should be assigned to a corresponding increase of the f-value too. For an experimental determination of the correction factor f the product fp calculated by (1) is plotted against the film thickness d for unannealed nickel films freshly evaporated at 77K (fig. 3). One can easily recognize the good reproducibility of the individual measuring points. A different f-value must generate a parallel displacement of the curves in such a double logarithmic plot. The figure shows, that this effect is really seen. If one chooses, as standard, the precision measurements of REICHENBERGER (o) /59/, obtained with the device of fig. 1b, then for all other series of measurements under consideration the correction factors listed in table I column 12 can
10
5
22~----~s~---~~~2----2~----~s----~wJ
0
-d[A]
Fig.3
Resistivity p of nickel films freshly evaporated at 77 K as a function of film thickness d [WENZEL (e) /57/, REICHENBERGER (D) /59/ and WOLFING (•)
/61/]
be deduced. But it should be mentioned, that in unfavourable cases /71/ the magnitude of the f-values can take up to more than three. The corresponding plot for copper films is shown in fig. 4, where this time the films were annealed at 293K. Again one recognizes, that the resistivity values decrease with increasing thickness. Here also a vertical displacement of the curves related to individual series of measurements is distinguishable. If one chooses the p-values of RUDOLF (!) /64/ measured with the arrangement of fig. 1d as a standard, then one gets the f-values shown in table II column 12 for copper films. Intentionally experimental conditions have been treated relatively in detail in this section. For, unfortunately, the comparison and the interpretation of the resistivity measurements of the published literature is complicated by the fact that the evaporation parameters of the films remain largely unknown in many cases. This led to a general opinion, that the resistivity change due to adsorption could be reproduced rather poorly and the results might be partially contradictory /4,7/. That this is not the case in practice can be deduced from the series of measuring points plotted in fig. 3, which were obtained by different authors. The relative deviation of the individual points
11
5
Cu AT= MT
~
293K
5
-dfAJ
Fig.4
Thickness dependence of the resistivity of evaporated copper films. [KOCK (o) /62/, WIEBAUER (e) /63/ and RUDOLF (A) /64/]
from the plotted curve does not amount to more than 20 %. That deviations of this order of magnitude cannot be avoided in spite of keeping all production
parameter~
mentioned at the beginning of this section
carefully constant, may have several reasons. Firstly, the thickness determination carried out calorimetrically /72/ has a built-in accuracy of about 5 % only, and is related to a mean d-value without taking into account the variations of film thickness over the entire surface under investigation. Secondly, the evaporation process includes a few parameters the influence of which has not found proper consideration among authors doing this work. The rate of heating up of the substrate at the beginning of annealing process /30/ and a different pressure or composition of the residual gas due to a different purification treatment given to the glass cell /74/, the filament /75,76/ or other metal parts inside the cell /77/ may be counted amongst the above mentioned parameters. If the uncertainties related to the structure of the films could be by-passed some how, then the reproducibility and the accuracy of the results can be increased considerably. This is demonstrated in fig. 5, where the relative resistivity change 6R/R is plotted against CO-coverage, using a 100
R thick
copper film as adsorbent. The film
was evaporated at 77K on a glass substrate and annealed for an hour at 340K /62/. After it has cooled down to 77K again the film was exposed to gas coverage (x). One recognizes clearly, that the 6R/R-
12
~0
r-;. ~ ~
~
1
30
20
,.,x
X
_x-
0 X
Sl/ 0
qs
~0
--•n Fig.5
/
x-o
/0
10 0
/
0/
0/
l5
{jo 15 molecules/em~
Resistivity increase of a 100 ~thick copper film at the first (x) and second (o) cycle of CO adsorption (KOCK /62/)
values rise at first with increasing coverage and then achieve a saturation value before reaching the monolayer coverage. If, now, the film is heated up to 273K once again, then the adsorbed CO is desorbed totally and can be pumped out from the gas phase. i\fter recooling to 77K the adsorption experiment can be repeated on the same film. On performing this one gets values which are plotted additionally in fig. 5 (o). Both the measurement series lie approximately on the same curve providing an excellent check on the reproducibility.
3. Structure of the Films From the discussion presented in the preceding section it is clear, that for an interpretation of electrical properties of the films the knowledge of their structure is of utmost importance. In this paragraph, therefore, a short review of the results of structure investigations on nickel and copper films is to be given. If the metal to be investigated is condensed under UHV-conditions on a glass substrate,
13
·----·
103 /
5
0
o
/~o /
/~
o/
5 / 5
------·
o
.7
a) Ni
/e
102
5
5
5
0
/
/0
0
Fig.6
/
0
/
0
db /
/
0"_.. d[A] -'
/
5
/ 0
b) Cu
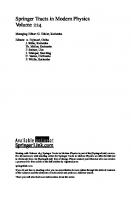
Mean crystallite size D as a function of film thickness d (AT a) Nickel films /31,79/ b) Copper films /78/
293 K)
then polycrystalline films are produced which are built-up of many individual crystallites. These crystallites show, in general, various orientations and different shapes. Their averaged extension is characterized by the mean crystallite size, which can be determined either by evaluation of the line - breadth of x-ray diffraction peaks /31,78/, or by direct observation of the transmission electron micrographs /73,79/. The x-ray values characterize the extension of the crystallites in a plane perpendicular to the film whereas the electron micrographs give their extension in the film plane. Fig. 6a shows a plot of the mean crystallite size D for nickel films evaporated at 77K and annealed at room temperature with respect to film thickness d. A logarithmic scale has been chosen both for abscissa and ordinate. One recognizes easily, that the D-values given by x-ray measurements (empty circles /31/) and electron micrograph evaluations (filled circles /79/) are in good agreement with the solid curve drawn additionally in fig. 6a. The crystallites possess,
14
--·-.-
./. /
~-o-
2
-o-- o- --o-
#._0 .... /
2
10
5
/
0
/
/
/
2
10 10~------~------~~----~~----~ 800 600 400 200 AT [K]
Fig.7
Mean crystallite size D of 250 ~ thick nickel films as a function of annealing temperature AT /31,79/
therefore, the same dimensions in both the directions. In other words, they show - independent of the film thickness - an approximately cubic shape. At very low thickness (below 150
Rl, the crystallite size is
equal to film thickness. These films, therefore, are composed of one crystallite layer only. For thicknesses above 150
R the
points lie
below the 45°-line, plotted additionally in fig. 6a (dashed line). That means, the crystallite size is smaller than the film thickness. Obviously the films now consist of more than one layer of crystallites, arranged one above the other. The dependence of the mean crystallite size D on annealing tempe-
R
thickrature AT is shown in fig. 7 for a nickel film of about 250 ness. Here a linear scale is chosen for the abscissa. The x-ray results are again presented by empty circles and the electron micrograph results by filled circles. One recognizes, that at low annealing temperatures all D-values lie on one curve rising with increasing annealing. For AT
~
450K the dimensions given by x-ray data reach a
limiting value which corresponds approximately to the film thickness, while on the other hand the electron micrographs give much higher D-values. Obviously the growth of the crystallites in the direction perpendicular to the film plane is limited by the film thickness, whereas the growth in the film plane can proceed uninhibited. In this way the crystallites take up a laminar shape, as can also be seen from the schematic representation of fig. 8. 15
AT ... 150K
AT-.~
300K
AT:w 450K
Fig.8
-~
D11 AilJ.L D1. =d
Schematic representation of crystallite growth ln evaporated nickel films due to annealing
The measuring temperature has only little effect on the structure. Due to different thermal expansion coefficients of film and substrate a temperature change may cause either a development of a tension in the film or a removal of it /31/. Results in agreement with the above observations are obtained for the structure of copper films too. However, the specific surface energy is so large in this case /80/, that above 340K a strong coagulation sets in causing the films to crack /62/. One observes according to fig. 6b, that already at room temperature the crystallite size equals the film thickness for all thicknesses under investigation. Obviously the relation (2)
illustrated in fig. 6b by a straight line, is valid in the present case. This relation has been proved by other authors in the case of aluminium films /20/ too, and seems to represent the normal behaviour. Even under the best vacuum conditions it should be expected, that the films deposited at low temperatures contain a perceptible amount of built-in residual gas. A rough calculation shows, that at an eva10-10 poration rate of 10 ~/min and a residual gas pressure of Torr the film should be contaminated by a ratio of about
1000,
if each gas molecule arriving at the surface remains stuck. The ex-
16
5
5
/0-70L........&...----'"----'---......-.....I._ __,__....J 100 200 300 1,00
-AT{K]
Fig.9
Desorption spectrum of a "clean" nickel film (WEDLER et al /65a/)
perimental proof of the built-in foreign molecules is obtained with the help of desorption spectra typically shown in fig. 9 for a "clean" nickel film /65a/. This approximately 400 ~thick nickel film was deposited at a residual gas·pressure of 2 · 10- 10 Torr at 77K and thereafter heated up slowly. One recognizes, that at certain temperatures distinct pressure peaks appear which can be analysed with the help of a mass spectrometer. It turns out, that these peaks can be traced back to the desorption of N2 nearly exclusively. N2 is one of the main components which the residual gas comprises of /76/. Obviously the gas built-in by the evaporation process is displaced during crystal growth towards the crystallite boundaries and is partially desorbed. The other main component of the residual gas is CO. Since this
desorbs noticeably only at temperatures above 450K /65c/, it is to be expected that even at room temperature the crystallite boundaries still retain a certain amount of CO. In the case of copper films, a complete desorption of CO at room temperature should happen /3/. On the other hand, WILSON and SINHA /81/ have demonstrated recently, that copper films deposited in an argon atmosphere show higher resistivities than normal, which they interpret by a noticeable inclusion of gas atoms in the films even at room temperatur. As can be deduced from fig. 8 qualitatively, the roughness of the film surface should decrease with increasing annealing. This result is confirmed, if roughness factor fR is determined from adsorption
17
~
0
~
~
'-
3
...._0::
.......
...._0::
2
"·0~ e-......._.
1 0
700
0
200
300
-o•-
400
500
AT[K]
~ 0
~ ~
6
'-
..s: ..s: 4
.......
1
'\li
t.
~
t.~t.
2 00
A
700
200
't.
---11-
300
400
500
AT [K] Fig.10
Effect of annealing on roughness factor fR of nickel and copper films. Data obtained by RICHTER /60/ (o: Ni/N 2 ), WISSMANN /58/ (e: Ni/CO) and DAYAL /70/ (~: Cu/CO)
measurements*. fR, which is defined by the relation true surface geometrical surface is plotted against the annealing temperature for nickel /58,60/ and copper /70/ films in fig. 10. The value of fR for highly annealed films is set equal to one arbitrarily, which seems reasonable considering the result of fig. 8. In fig. 10 it is shown explicitly that with decreasing annealing the roughness factor increases by a factor of three in the case of nickel and six in the case of copper.
* The coverage, at which a certain equilibrium pressure in the gas phase is established, serves as a measure for fR in this case /27/.
18
Fig.11
Replica of the surface of a 200 ~thick nickel film annealed at 293 K (a) and 673 K (b), respectively (GERDES /79/). Width of the photograph corresponds to 1,2 ~
A more detailed picture of the surface is obtained by using replica technique. Carbon-platinum films were deposited on the nickel film surface and than investigated in a transmission electron microscope after dissolving the nickel. Fig. 11 gives two photographs of such replica of differently annealed nickel films (d ~ 200 ~) /79/. It is easily recognized from the photographs that no islands or holes develop in the film, and that the surface becomes more homogeneous with increasing annealing. For a nickel film of 250 ~ thickness and annealed at 473K the evaluation of stereo photographs led to a roughness factor of fR
~
1,1 /79/, which agrees well with the qualitative picture
of fig. 8. An increasing alignment of the individual crystallites towards (111) takes place simultaneously with crystal growth and smoothening of the surface. This is demonstrated by fig.
12a. Here a pole figure
is presented, which was obtained by means of a x-ray texture analysis of the (111)-peak of a highly annealed nickel film /30/. One recognizes, that the intensity maximum falls at y
= 0°.
The strongly
broadend secondary maximum also stems from (111)-planes which are inclined to the film surfaces by y = 70,5°. The highly annealed films, therefore, tend towards (111)-fiber texture, i.e. the individual crystallites are arranged with their (111)-lattice planes parallel to the substrate without any preferential azimuthal orientation. If one follows the intensity along the axis A, then the texture profile given in fig. 13c is obtained /30/. One recognizes once more,
19
X-ray tube
'{J
' em ' ''-..:--1--::>....,.
Counter tube
b)
a) Fig.12
Pole figure of a polycrystalline (a) and single-crystal (b) nickel film /30,58/
-.-.rt.~.
-45°
I
0
-7
6 4
I
0
+45°
a) AT"" ISOK
Fig.13
8
-T b) AI= 293K
c)
+45°.
AT= 483K
Texture profiles obtained along the axis A of fig. 12a for different /58/ annealing temperatures (d z 800
R)
that the extent of the preferential (111)-orientation in the highly annealed film is specially marked. If the annealing is performed only at room temperature, then a large number of crystallites of other orientations is observed, and in the case of unannealed films the distribution of crystallites of different orientation is completely random /58/.
20
5"
t:/Jm
- -r/-1=
5.2 5.0
,_8 I'I
,_6 _II_.......... ';' &::::;. ~
t
'·'o 4.8
'·' 4.20
-I__.........
~/ 200
a) Ni
,00
200
,_6
Fig.14
/y
AT [K]
.r--1b) Cu
,00
AT[K]
Change of work function¢ with increasing annealing temperature AT for nickel (a) /35/ and copper (b) /62/ films
To make clear how far the texture profiles provide an indication of the distribution of different indexed lattice planes in the surface, the same films were investigated by low energy electron diffraction /75/. No measurable diffraction peaks could be observed in any case. This result shows, that a remarkable disorder in the surface structure is present even at the highest annealing temperatures, for, in the other case the diffraction pattern should have shown a characteristic (111)-ring maximum /82/. Further important conclusions about the surface orientation can be derived from the measurements of work function. In fig. 14a the work function ¢ of clean nickel films is plotted against annealing temperature /35/, and fig. 14b shows the corresponding dependence
21
Fig.15
LEED-pattern of a ( 111)-oriente d s ingle-crystal copper film /58/
for copper films /62/. The ¢-value determined for a (111)-orie nted single-cry stal nickel surface is represente d by a dashed line additionally /83/. One recognizes that the unannealed films possess a relatively low work function which is in good agreement to the conor of steps and roughnesse s in the surface /87/. The work function rises then with increasing annealing and approaches the value determined for a clean (111)-surf ace. Here, however, a certain fluctuatio n in the values is obvious, which points
cept of high indexed
sur~aces
at a remaining disorder in the surface even in the highly annealed
films. The production of less disordered (111)-surf aces becomes possible, if one uses single-cry stal substrates instead of amorphous glass. If one glows a (111)-orie nted silicon crystal in ultrahigh-v acuum to approxima tely 1200 K just before starting the evaporatio n process, then nickel and copper films deposited at room temperatur e show to a large extent single-cry stal structure /39/. Fig. 12b gives the pole figure obtained in the case of a 500 ~ thick nickel film It is easy to discern the sharp secondary maxima, which points additional ly at an appearance of azimuthal preferenti al orientatio n as compared to fig. 12a. On the same film diffractio n patterns in a LEED-appa ratus are found too /39/. Fig. 15 shows a typical photograph . The sharpness of the diffractio n patterns indicates, that the surface structure has achieved a degree of order which is comparable to bulk single crystals.
22
If the silicon substrate is not glowed above 1100 K before evaporation, then the Auger electron spectrum of the silicon surface shows a marked oxygen peak /84,75/. Obviously this oxygen hinders the epitaxial growth of the films and no single-crystal structure can develop. A similar result is obtained if evaporation procedure was performed under bad vacuum conditions. In all these cases the films show a more or less marked (111)-fibre texture similar to that obtained for glass substrates.
4. The Resistivity of Pure Metal Films 4.1 Theoretical Treatment As was mentioned in the introduction the calculation of the resistivity behaviour of pure metal films has been done mostly with the help of size-effect theory of FUCHS and SONDHEIMER /9,10/. According to this theory a fraction (1-p) of the conduction electrons is diffusedly scattered at the film surfaces, leading to an increase in resistivity in comparison to the bulk. Unfortunately some simplifying assumptions had to be made in the development of the theory, which are difficult to realize or even cannot be approximated by experimental conditions. The assumptions in question are mainly the following: (a) disorder in the films should be independent on film thickness; (b) the films should have clean and plane parallel limiting surfaces; (c) the precondition of a single parabolic conduction band should be a permissible approximation; (d) scattering process should take place isotropically and can be characterized by an effective mean free path of the electrons (which already implies the applicability of Matthiessen's rule
23
/85/), and by a single surface scattering parameter p. That in case of nickel films at least the presumptions (a) and (b) are not fulfilled at all can be seen from fig. 8 immediately. Therefore, in this section we shall endeavour to discuss the theory of MAYADAS and SHATZKES /86/ and a scattering hypothesis /33/ additionally, which allow a description closer to reality.
These authors solved the Boltzmann transport equation under the assumptions (a) -
(d). A simple boundary condition could be set up
following the plane parallelism of the film surfaces (or outer crystallite surfaces, see fig.
16a), which enables integration. The re-
sult is /1 I 1 with x
-s 1 --..:e::...____ (3/2) x (1-p) f (1/s 3 - x 2 ;s 5 ) ...:... s ds x 1-pe
(3)
= d/1 0
where p and d are the resistivity and thickness of the film, p 0 is the resistivity of the bulk with same density of lattice defects as the film, 1 0 is the corresponding mean free path of the electrons and p is the fraction of electrons specularly reflected at the film surfaces, i.e. scattered elastically without any change of momentum component in the direction of the electrical field. For sufficiently high thicknesses (d >> 1 0
)
eq. 3 simplifies to
/107/ (4)
Lately many authors have tried to widen the region of applicability of the theory through suitable modifications. In this relation, mainly, the case of different scattering parameters p and q due to the transition film /vacuum and film/ substrate /88-90/, of nonspherical Fermi surfaces /91-93/, and of an anisotropic mean free path /94/ has been investigated. Special interest was shown for the study of the dependence of scattering parameter p on incidence angle of the electrons /95-100/ and on the roughness of film surface /97-102/. Due to space limitation it is not possible to discuss these extensions
24
Fuchs - Sondheimer
Mayodos - Shatzkes
outer aystallite surface
inner crystallite surface b)
a)
Fig.16
Outer and inner crystallite surface according to Fuchs-Sondheimer and Mayadas-Shatzkes boundary conditions (schematically)
of the theory in detail here, literature mentioned and books /4/ or review articles /5,6/ may be consulted for this.
Retaining the assumptions (b) - (d) these authors tried to describe the thickness dependence of disorder by an one-dimensional grain boundary model /86/. This is achieved by modifying the boundary conditions thus affecting the limits of integration of the Boltzmann equation in comparison to Fuchs-Sondheimer theory. Under the assumption that the individual crystallite boundaries are separated by a mean distance D (see fig. 16b), the film resistivity is calculated to be 3
po/P with a.
[(1/3 - a./2 + a. R 1-R
2
- a. 3 ln ( 1 + 1/a.l]
(5)
1 0 /D
which for a. > 1 by the theory of Fuchs-Sondheimer. If one connects the characteristic
constants according to the relation
Z A= 0.375 (1-p)
( 18)
then (15) goes over to (4). Also a comparison of (15) with the exact Sondheimer relation (3) shows practically no deviation in the thick-
*
It should be mentioned, that this equation differs only slightly from the well - known Nordheim formula /108/
p/p 0 = 1 + 1 0 /d The difference consists only in introducing an additional scattering parameter ZA in the case of (15).
29
fJ 5
'-o
~
'
l
0.
2
~~ 0--0
------0----o----o
10° 5
Fig.18
5
2
/0-1
2
p/p 0 (refer to (15)) and 6p/p (refer to (20)) as a function of film thickness d
ness dependence when the connecting equation Z A= 0.435 (1-p) is chosen. That is demonstrated in fig.
( 19) 18. Here the correlation be-
tween resistivity p and thickness d is plotted in a double logarithmic way according to (3) choosing for the sake of simplicity p
=
o.
If one were to plot in the same figure the curve given by (15) and (19), then there would be no recognizable deviation. In order to illustrate this point fig.
18 contains additionally, on the same
abscissa, the relative difference between both function values p(3) - p(15) p (3)
(20)
Obviously, the deviations in the region
d/10 > 0.2
(21)
are less than 3 %. Only this region is of interest, however, to a comparison with experimental data. For, it is known from the investigations of TCR /11/ or work function /35/, that nickel films of thicknesses less than a critical thickness of about 40 ~ crack or show, at least, a quite abnormal electrical behaviour, which can be attributed to an island structure /40/. At the same time a mean free path of the order of 133 ~is to be expected at 273 K /11/, so that con-
30
ductivity measurements on the continuous films are meaningful only for thicknesses in the range d/1 0 > 40/133. Thus, the condition (21) is satisfied thoroughly. A similar discussion holds for copper films which have a higher 1 0 -value (about 387
R at
293 K /4/) but crack on
the other hand at a higher critical thickness (75
R /62,70/).
Taking into consideration, that the thicknesses cannot be determined in general to an accuracy better than 3 % and that the thickness enters according to (1) quadratically in the final expression (22)
R
it becomes obvious, that the deviations presented in fig.
18 lie with-
in the experimental error. For the description of electron scattering at the grain boundaries (12) should be used. This equation goes over into (6) calculated by Mayadas and Shatzkes for sufficiently large crystallites, so far as one connects the characteristic constants according to the relation (23)
1,50 R/(1-R) The graphical representation of (12) is given in fig.
19. In this
case too, the difference from the exact Mayadas function (5) is negligibly small, if one chooses a suitable connection of the constants. For
z* A*=
1,35 R/(1-R)
(24)
the relative difference of both function values p(5) -
p(12)
p (5)
is plotted in fig.
(25)
19 additionally, it carries a value less than
1 , 5 % for 1-R ~
D
1
> 0.002
(26)
0
This is an accuracy, which cannot be achieved in an experimental determination of mean crystallite size in any way /31,73/. The nonfulfillment of the condition(2~means, according to fig.
19, p/p0
31
r,.·! f -J%
-x-- -~- -x- -x--- ~--A--X
.--;-
-x- -x- --K- -x I I ~--x --~
5
c§i>
.....
r
/()2
5
10 1
5 /00
~~o~~~--r-~~---r~,~~,~--~5~~,0~o~--~5~~----~s--10 ~:;
-..l:B....Jl.. R t0
Fig.19
p/p 0 (refer to (12)) and
~p/p
(refer to (25)) as a function of mean
crystallite size D
values above 600. Such high resistivities can be obtained only in the case of films with island structure, for which the models discussed here are not applicable at all /7/. In the case in which the crystallites posses an approximately cubic shape so that (2) is valid, (17) changes into P = Po
[1
+ (ZA + z* A*) 10/d]
(27)
This relation corresponds to (15) largely and it is immediately obvious, that a separation of the both involved scattering processes cannot be performed by the measurement of thickness dependence alone. On the other hand, a quantitative calculation of the quantities Z, z*, A and A* is impossible for the time being, because no sufficient information is available for the number and the properties of the individual scattering centers. Therefore, other data such as the resistivity change caused by gas adsorption (see section 6.3) should rather be taken into account in order to get more information and to come to more definite statements. (27) has another very important consequence. By comparison with experimental data it is possible, no doubt, to check its applicabili-
32
ty as far as the thickness dependence of the resistivity is concerned. But on the other hand no conclusions can be drawn about the magnitude of 1 0
.
With that an essential goal of earlier works, that is, to ex-
perimentally determine the mean free path of the conduction electrons by resistivity measurements on thin films /1/, has been put into question once again. Summarizing, it may be stated that the thickness dependence of resistivity calculated with the help of the scattering hypothesis does not differ much from that calculated with the help of FuchsSondheimer and Mayadas-Shatzkes theories. In the following, therefore, we shall utilize for interpretations only the relations (12) and (15), which remain valid in the presence of rough crystallite surfaces also.
4.2 Experimental Results Before attempting any comparison of the experimental results with theoretically calculated values we must point out, that just in the case of nickel and copper films the correctness of certain assumptions underlying all the theories is disputable /109/. This concerns specially the assumption of a free electron gas, in which the scattering process is described by only one effective mean free path 1 0 and a single effective cross section ZA. For it is known from investigations on bulk metals, that such a simple model can describe only the resistivity behaviour - within certain limits - with sufficient accuracy /103,111,112/. On the other hand, for the interpretation of other
electrical properties like temperature coefficient of resistivity, thermoelectric power or Hall constant /112-116/ more complicated factors like band overlapping, non-spherical Fermi surfaces, anisotropic scattering /111/ and electron spin coupling /117/ should be taken into account. Due to this, it is to be expected, therefore, that in order to discuss the thin film behaviour only the resistivity measurements can be interpreted with the help of the theories described in section 4.1, whereas for the interpretation of other electrical properties the true band structure must be taken into consideration. So we shall limit our discussion at first only to the resistivity of the nickel and copper films. In the case of nickel one should imagine while using a single-parabolic-band model, that here essentially the s-electrons are responsible for conductivity by suffering extra scattering at the holes of the d-band /111/. The influence of a form of
33
5 ll
AT= 293K
o
AT= 373K
5
2
5
bulk
22~----~5~---,-0~2~---2~----~5~---,~0J.
-d[AJ Fig.20
Thickness dependence of resistivity of nickel films (MT /61/)--- computed from (12) ---computed from (15)
273 K, WOLFING
the Fermi surfaces more close to reality may be taken into account by introducing an effective electron density neff /112/, but it can be easily shown, that this quantity neff cancels itself in the derivation of (12) and (15). In a later chapter (5) we shall point out a few paradoxes, which result on the application of the very rough free electron gas model for the interpretation of more complicated electrical properties of nickel and copper films. Limitations of this simple model will be, then, more distinct. Fig. 20 shows the thickness dependence of the resistivity of evaporated nickel films measured by W6LFING /61,36/. The films were deposited on a glass substrate held at 77 K. After finishing the evaporation process the films were annealed at 293 K
(~)
and 373 K (o),
respectively, for an hour, and finally resistance measurements were
34
~
~
6
15
~
0
~
6
~
E u
~
~ ,
f
10
6
-t. '(t:t.
'h
5
o
1.1'/!J.
.
t.~
/;.
~
~6
~ ~t.
- o-
6
o_ ... o o CO---o
A'
o- ---
-==~- o o-o o 00
-100
200
!!!E.._ d[J.J
800
8 ~
E u ,9:
~
.;
..
/;.
6 6/. 6 t.66 /6
/j,/6
/66
Cl
C)-
00
Fig.21
200
.;oo
600 -D[A]
Plot of the points of fig. 20 in order to prove (28)
performed at MT* = 273 K. Both axis are on a logarithmic scale to provide a direct comparison with the theoretical curves shown in fig. 18 and 19. Such curves are plotted additionally in fig. 20 using for calculation (15)
(dashed line) and (12)
(solid line). Obviously
the theoretical curves and the experimental values coincide only for higher film thicknesses, whereas for d < 70 ~ the measured values lie
too high. One recognizes, however, that the curve calculated from (12) shows a larger radius of curvature and describes the experimental values a little bit more closely. The constants p 0
,
ZA and Z'f A* needed for the calculation of the
theoretical curves were taken in a preceding step from a plot pd against d and pD against D, respectively. Fig. 21 shows these plots for the same measured values as in fig. 20. According to the relations
* MT stands for measuring temperature
35
JO,
'E' u
0
c;
c....
!
0
0
/0 0 273
373
473
573
- -... AT[K) ~
]
7.5
~ I
~
....
0
~0
0
0
~
0
~ 45
!
Fig.22
0
273
373
573 473 -AT[K]
p and ~p/~T of a 200 ~ thick nickel film as a function of annealing temperature AT (MT = 273 K) /58/. Solid curves computed from (12)
(28)
and
pD
p0 D + z* A* p0 1 0
which can be easily derived by transforming (15) and (12), the experimental values must lie on straight lines. Fig. 21 veryfies this, in fact, for large thickness ranges (in the case of fig. 21b the thickness dependence of the mean crystallite size D given in fig. 6a was taken into account). The constants determined from the axis intercept and the slope of the straight lines shown in fig. 21 are presented in table III. (12) can also be used for the description of the dependence of film resistivity on annealing treatment. The resistivity must decrease as the mean crystallite size increases with increasing temperature. This decrease is observed indeed (fig. 22a), but the values measured for nickel films lie distinctly lower than the curve computed with the help of the experimentally determined relationship
36
....
'l
**
*
Cu
Ni
/36/ /36/
293
373
/4/
/64/
293**
bulk
/64/
293
/11,118/
/36/
293
bulk
Reference
AT* [K]
1, 67
1, 9
2,9
6, 1 4
9,5
19
13
Po [ )lrlcm
J
Single crystal film (refer to fig. 23b)
AT stands for annealing temperature
Metal 0
-
70
R.
A further support for the correctness of this interpretation is to be seen in the fact that the effect of annealing temperature on ATCR can also be explained in the same way. The ATCR-values obtained for
R
thickness are plotted in fig. 22b nickel films of approximately 200 against annealing temperature, where a drop is clearly seen. This drop
49
~ '....E
c:
..,::t.
~ ~~
r
0
'-...__o
0
o-----
0
0-----
bulk
5 0 8
~
4
r
\ 0 0
6
r::c:r:.
0
10
~
~ "'E
Fig.27
15
\ o'Oo
o
~
bulk
2 05
10 2
5
10
-
d[.S.J
10 4
ATCR and Hall constant for copper films (MT = 273 K) as a function of film thickness d (WEDLER and WIEBAUER /63a/)
can be described qualitatively by (32c) using numerical values from table IV (solid curve in fig. 22b). Contrary to this falling curve, if Matthiessen's rule were rigorously valid, then no dependence on annealing temperature is to be expected from (32). It remains to explain, how a temperature dependence of the scattering parameter may occur. This effect is not restricted to nickel films only, but has also been found by other authors working on alkali metal /125/ and noble metal films /130,131/. For its interpretation the following mechanisms might be considered: (a) Tunneling of the electrons through a potential well between the crystallites: The formation of such potential wells is well-known in the case of ultra-thin metal films /133/ and semiconductor films /134/, and should result in a negatived (ZA)/dT /135/. (b) Effect of thermally induced stresses: Completely annealed films are nearly free of stress /31,136/. After recooling, however, lattice distortions develop in the films due to different thermal expansion coefficients of film and substrate. These distortions, which cause a lattice contraction in the direction perpendicular to the film, can lead to an increase as well as to a decrease of
50
film resistivity /137-141/. (c) Change in the phonon spectrum due to lattice disorder: In a simple picture one could imagine, that the uppermost atoms in the film surface or at the crystallite boundaries have, on the average, a larger spacing compared to the bulk because of missing neighbouring atoms. This effect is expected to be specially marked in the surroundings of a surface irregularity causing an increasing amplitude of vibrations /8/. This would lead to a positive d(ZA)/dT-value. (d) Influence of anisotropic scattering: Since relaxation times of phonon and impurity scattering show different anisotropies, the resistivity component due to phonon scattering depends on the film thickness /142,143/. This effect can be calculated with the help of small-angle scattering models /143-145/. In the case of dilute copper alloys also experimental evidence exists, indicating that deviations from the validity of Matthiessen's rule may be contributed to such an anisotropic scattering /146/. In the present work we found only positive d(ZA)/dT-values (refer to table IV): The mechanism (a), therefore, may be excluded. Nevertheless, it is difficult to decide, which of the other mechanisms preponderates. The good agreement of the experimental 6 0 -values of the nickel films with the bulk value and the great difference of the d(ZA)/dT-values determined for films annealed at 293 K and 373 K seem to indicate that either the mechanisms (c) or (d) might be responsible whereas (b) is highly unlikely. Experimental values obtained for evaporated copper films of different thicknesses are plotted in fig. 27a (the corresponding resistivity values were given in fig. 23a). One finds a constant ATCRvalue for thicknesses greater than 200 ~' which deviates only very little from the bulk value. Similar to the case of highly annealed nickel films the ATCR-value rises only for thicknesses less than the critical thickness defined above. Simultaneously an increase in the Hall constant is observed (fig. 27b). We shall extend, therefore, our discussion to include this quantity in the following.
51
5.3 Limits of the Free Electron Gas Model We have seen in the preceding sections, that the resistivity behaviour and the temperature dependence of resistivity can be interpreted with astonishing successes with the help of the simple model of free electron gas even in the case of nickel and copper films. The two-band-structure of these transition metals, departures from the spherical shape of the Fermi surface and anisotropic electron scattering need not be taken into consideration while discussing the effect of thickness and annealing temperature dependence. One is tempted to try to utilize the same simple model for explaining effects of more complicated nature like Hall effect of thermoelectric power. The attempt seems to be quite fruitful fig.
at the first sight, looking at
27b, which shows the thickness dependence of Hall constant RH
(copper films, MT
= AT =
273 K, measured by WIEBAUER /63/). Explana-
tion of this dependence succeeds with the help of the scattering hypothesis without any additional assumptions. Since the Hall constant given by /1/ ~
=
(37)
1/eN
is a direct measure of the density N of free electrons, it is clear that for higher thicknesses a constant RH-value is arrived at, which does not differ much from the bulk. The rise in RH for thicknesses below 200
Rcan
be traced back
again to the influence of roughness mentioned already at the end of section 4.2. According to /63/ UH - I
·
B/d
(38)
where UH is the Hall voltage, I the current through the film and B the magnetic flux, UH should increase inversely proportional to the film thickness d. Therefore, similar to resistivity behaviour one gets the effect, that the areas of lower thicknesses enter the average with a disproportionately higher weight thus producing too high UH and RH values. It must be added, however, that, strictly speaking, we cannot come to a decision on the basis of Hall effect measurements alone, whether one or the other of the models presented in section 4.1 is to be preferred. For, it can be easily checked, that the thickness dependence shown in fig. 27b may also be interpreted with the aid of FUCHS-SOND-
52
10
~0
8
~o - o - - -
6
0-
------bulk
"' 2
1
~ ~
05
1:::
o:."'
I
8 6
102 2
5
-iO--
5
0
0
]{)()
TO'
2
-drAl
o-~-o-
"' 2
Fig.28
2
/OJ
o
d=37o/..
X
bulk
200 300 -MT[I