Reference Materials in Measurement and Technology: Proceedings of the Fifth International Scientific Conference RMMT 2022 3031491998, 9783031491993
The book covers in particular state-of-the-art scientific research about product quality control and related health and
140 46 13MB
English Pages 483 [461] Year 2024
Contents
Reference Materials in the Healthcare and Pharmaceutical Industries
Certified Reference Material of Tylosin Tartrate
Introduction
Materials and Methods
Reagents, Solutions, and Materials
Instruments and Conditions
Sample Preparation of the RM Source Substance
Sample Analysis by IR Spectroscopy
HPLC Sample Analysis
Establishment of Metrological Characteristics of the Candidate RM
Results and Discussion
Determination of the Certified Value of the RM and Evaluation of the Standard Uncertainty from the Method of Determining the Certified Value
RM Uniformity Study
RM Stability Study
RM Metrological Characteristics
Conclusion
References
Virus-Like Particles: Properties and Characteristics of Reference Materials
Introduction
Analytical Review
Requirements for the Characteristics of CRMs for Virus-Like Particles
Materials and Methods
Determining the CRM Purity Mass Balance
Amino Acid Analysis with Isotopic Dilution
Results and Discussion
Conclusion
References
Reference Materials for the Composition of Antimicrobial Substances
Introduction
Terminology
Materials and Methods
Results and Discussion
Conclusion
References
Nominal Reference Materials of Biological Substances
Introduction
Theoretical Analysis
Materials and Methods
Type Approval Procedure in Case of Readily (Commercially) Available Source Material: On the Example of GSO 11607-2020
Type Approval Procedure in the Absence of a Readily (Commercially) Available Source Material: On the Example of GSO 11661-2020
Results and Discussion
Conclusion
References
Caffeine Quantification Via High-Precision Coulometric Titration
Introduction
Materials and Methods
CRM Material
Reagents
Equipment
Caffeine Identification
Coulometric Titration Procedure
Results and Discussion
Uncertainty Budget
Conclusion
References
Primary Reference Procedure for Measuring the Mass Fraction and Molar Concentration of Copper and Zinc in Biological Materials by Isotope Dilution Mass Spectrometry
Introduction
Materials and Methods
Measurement Method
Equipment and Materials
Research Object
Results and Discussion
Selection of Optimal Methodological Decisions
Confirmation of Highest Accuracy
Conclusion
References
Molecular Diagnostics of Oncological Disease: Prospects for the Development of a Reference Material for the HER2 Gene Content
Introduction
Materials and Methods
Results and Discussion
Conclusion
References
Application of Reference Materials in the Analysis of Medicinal Plant Raw Materials and Herbal Medicinal Products
Introduction
Materials and Methods
Results and Discussion
Conclusion
References
Reference Materials in the Field of Quality of Life
Determination of Sunflower Seed Oil Content Using Natural Sunflower Oil: Calibration of a Pulsed NMR Analyzer
Introduction
Materials and Methods
Results and Discussion
Conclusion
References
Measurement of Carbon Isotope Ratio in Vanillin Using the CM-CRDS Method: Achieving an Expanded Uncertainty Below 0.1‰
Introduction
Materials and Methods
Equipment Preparation
Sample and Reference Material Preparation
Measurements
Data Processing
Measurement Accuracy Control
Results and Discussion
Conclusion
References
Development of Isotopic Reference Materials for 13C-Urea Breath Tests
Introduction
Materials and Methods
Results and Discussion
Conclusion
References
On Developing Metrological Assurance to Identify and Quantify the Content of Non-infectious Food Protein Allergens of Animal or Plant Origin in Food Products
Introduction
Materials and Methods
Description of the Enzyme-Linked Immunosorbent Assay (ELISA)
The Certification Procedure of Measurement Techniques
Results and Discussion
Conclusion
References
Measurement Techniques for the Composition of Air Environments: Development and Application
Introduction
Reasons for the Development of New Techniques for Measuring the Composition of Air Environments
Methodology for Developing Measurement Techniques
Selection of Measurement Objects and Measurable Indicators
Analysis of Measurement Techniques (Existing or Previously Valid) for Selected Objects and Indicators
Selection of Measurement Techniques and Procedures
Selection of the Names of the Components to Be Determined
Establishing the Necessary Measurement Ranges of the Components to Be Determined
Establishing a Procedure for the Analytical Sampling Stage
Establishing a Procedure for the Methodological Analytical Stage
Establishing a Measurement Procedure for an Analytical Sample
Establishing the Accuracy Indicators of the Measurement Technique
Specifying Accuracy Algorithms for Measurement Results
Determining the Form of Presenting the Measurement Results
Forming a Measurement Technique Document
Technique Characterization
Implementation and Application of Techniques
Development and Application of CRMs Adequate for Analytical Samples
Practical Implementation of the Proposed Methodology
Conclusion
References
Primary Reference Measurement Procedures in the Food Industry: Usage Experience and Development Prospects
Introduction
Materials and Methods
Results and Discussion
Conclusion
References
Bismuth Determination by Controlled-Potential Coulometry: Developing a Highly Accurate Procedure Based on GET 176
Introduction
Materials and Methods
Materials
Methods
Results and Discussion
Conclusion
References
Reference Materials of the Oil Refining, Gas, and Fuel Industry
Use of Reference Materials-Imitators for Metrological Support of Gas Analytical Measuring Instruments
Introduction
Theoretical Analysis
Mathematical Approaches
Results and Discussion
Conclusion
References
Prospects for the Development of Reference Materials of the Wobbe Index
Introduction
Materials and Methods
Selection of a Method for Determining Gas Density
Practical Justification and Testing of the Pycnometer Method for Determining Gas Density
Results and Discussion
Conclusion
References
Reference Materials for Physical Properties
Melting Point Certified Reference Materials for Organic Substances: Development Prospects
Introduction
Materials and Methods
Results and Discussion
Conclusion
References
Application of the Traceability Concept in Determining the Mechanical Properties of Metals Under Static Tension Using a GSO 11854-2021 Reference Material
Introduction
Materials and Methods
Results
Discussion
Conclusion
References
Metrological Support for Titration Isothermal Calorimetry: Prospects for the Development of Certified Reference Materials
Introduction
Materials and Methods
Project Design
Equipment
CRM Candidate Materials
Results and Discussion
Defining Target Uncertainty
Methods and Instruments for Studying Uniformity and Stability
Testing the Method of CRM Characterization
Conclusion
References
Study of Certified Reference Materials for Temperature and Specific Enthalpy of Phase Transitions of Metals and Metal Salts
Introduction
Theoretical Background
Materials and Methods
Reagents
Equipment
Research Methods and Procedure
Results and Discussion
Conclusion
References
Development of Reference Materials for AC Magnetic Properties of Cold-Rolled Non-oriented Electrical Steel
Introduction
Materials and Methods
Determination of Metrological Characteristics
Results and Discussion
Conclusion
References
Certified Reference Materials for the Phase Transition Temperature of Organic Substances Based on Anhydrous Sodium Acetate and Sodium Methansulfonate
Introduction
Materials and Methods
Reagents
Equipment
Research Methods and Procedure
Results and Discussion
Conclusion
References
Certified Reference Materials for the Phase Transition Temperature (Curie Temperature) Based on Alumel, Nickel, and Iron Silicide
Introduction
Materials and Methods
Reagents
Equipment
Research Methods and Procedure
Results and Discussion
Conclusion
References
Reference Materials of Absorbed Dose: Expanding Dynamic Range and Improving Measurement Accuracy
Introduction
Theoretical Background
Materials and Methods
Preparation of Film Samples-Blanks
Selection of Films by the Value of the Initial Optical Density
Irradiation Facilities of the State Standard GET 209-2014 with Radionuclide Sources
Means for Measuring Optical Density
Results and Discussion
Dependence of the Induced Optical Density of the Selected Sets of Films on the Absorbed Dose
Discussion and Conclusions
References
Development of Measures for Metrological Support of Raman Spectroscopy
Introduction
Materials and Methods
Materials
Apparatuses and Laboratory Ware
Glass Synthesis
Determination of Metrological Characteristics and Estimation of Expanded Uncertainty
Results and Discussion
Conclusion
References
Estimation of Uncertainty in Charpy Pendulum Impact Test Using the Reference Material
Introduction
Materials and Methods
Results
Discussion
Conclusion
References
Mathematical Methods for Characterization of Reference Materials and Risks of False Solutions
New Algorithms for Estimating the Certified Characteristic of CRMs for Substances and Materials Using Interlaboratory Certification
Introduction
Description of Algorithms for Processing the Results of Interlaboratory Experiments
Results
Conclusion
References
On the Stability Assessment of Reference Materials
Introduction
Comparative Analysis
Selecting the Number of Dimensions
Estimation of Regression Parameters
RM Stability Characteristics
Period of Stability Research
Standard Uncertainty from Instability
Conclusion
Appendix 1: Determination of Inequality (2)
Appendix 2: Quadratic Equation for Determining the RM Period of Validity
Appendix 3
References
Algorithms for Evaluating the Homogeneity of Reference Materials for the Composition and Properties of Dispersed and Monolithic Materials
Introduction
Theoretical Part
Evaluation of Dispersed Media Homogeneity
Homogeneity Evaluation of Monolithic Materials
Experimental
Let Us Consider Several Typical Examples When Evaluating the Heterogeneity of Dispersed Materials
Let Us Consider a Typical Example When Evaluating the Heterogeneity of Monolithic Materials
Conclusion
References
A Comparative Analysis of OIML Documents and Russian Rules on the Use of Reference Materials
Introduction
How to Determine Whether the RMs Used Are Within the Scope of State Control and Supervision
Necessary Criteria for the Compliance of a CRM with the Requirements
CRM Metrological Control
Conclusion
References
Recommend Papers


![Proceedings of the 28th International Cryogenic Engineering Conference and International Cryogenic Materials Conference 2022: ICEC28-ICMC 2022, ... in Science and Technology in China, 70) [1st ed. 2023]
9819961270, 9789819961276](https://ebin.pub/img/200x200/proceedings-of-the-28th-international-cryogenic-engineering-conference-and-international-cryogenic-materials-conference-2022-icec28-icmc-2022-in-science-and-technology-in-china-70-1st-ed-2023-9819961270-9789819961276.jpg)

File loading please wait...
Citation preview
D. I. Mendeleyev Institute for Metrology
Reference Materials in Measurement and Technology Proceedings of the Fifth International Scientific Conference RMMT 2022
Reference Materials in Measurement and Technology
Egor P. Sobina · Sergey V. Medvedevskikh · Olga N. Kremleva · Ivan S. Filimonov · Elena V. Kulyabina · Anna V. Kolobova · Andrey V. Bulatov · Vladimir I. Dobrovolskiy Editors
Reference Materials in Measurement and Technology Proceedings of the Fifth International Scientific Conference RMMT 2022
Editors Egor P. Sobina UNIIM—Affiliated Branch of the D. I. Mendeleyev Institute for Metrology Yekaterinburg, Russia
Sergey V. Medvedevskikh UNIIM—Affiliated Branch of the D. I. Mendeleyev Institute for Metrology Yekaterinburg, Russia
Olga N. Kremleva UNIIM—Affiliated Branch of the D. I. Mendeleyev Institute for Metrology Yekaterinburg, Russia
Ivan S. Filimonov All-Russian Scientific Research Institute for Optical and Physical Measurements Moscow, Russia
Elena V. Kulyabina All-Russian Scientific Research Institute for Metrological Service Moscow, Russia
Anna V. Kolobova D. I. Mendeleyev Institute for Metrology Saint Petersburg, Russia
Andrey V. Bulatov Saint Petersburg State University PetroAnalytica LLC Saint Petersburg, Russia
Vladimir I. Dobrovolskiy All-Russian Scientific Research Institute of Physicotechnical and Radio Engineering Measurements Moscow, Russia
ISBN 978-3-031-49199-3 ISBN 978-3-031-49200-6 (eBook) https://doi.org/10.1007/978-3-031-49200-6 Translation from the Russian language edition: “Measurement Standards. Reference Materials.” by Sergey V. Medvedevskikh et al., © Author 2023. Published by UNIIM. All Rights Reserved. © D. I. Mendeleyev Institute for Metrology 2024 This work is subject to copyright. All rights are solely and exclusively licensed by the Publisher, whether the whole or part of the material is concerned, specifically the rights of reprinting, reuse of illustrations, recitation, broadcasting, reproduction on microfilms or in any other physical way, and transmission or information storage and retrieval, electronic adaptation, computer software, or by similar or dissimilar methodology now known or hereafter developed. The use of general descriptive names, registered names, trademarks, service marks, etc. in this publication does not imply, even in the absence of a specific statement, that such names are exempt from the relevant protective laws and regulations and therefore free for general use. The publisher, the authors, and the editors are safe to assume that the advice and information in this book are believed to be true and accurate at the date of publication. Neither the publisher nor the authors or the editors give a warranty, expressed or implied, with respect to the material contained herein or for any errors or omissions that may have been made. The publisher remains neutral with regard to jurisdictional claims in published maps and institutional affiliations. This Springer imprint is published by the registered company Springer Nature Switzerland AG The registered company address is: Gewerbestrasse 11, 6330 Cham, Switzerland Paper in this product is recyclable.
Contents
Reference Materials in the Healthcare and Pharmaceutical Industries Certified Reference Material of Tylosin Tartrate . . . . . . . . . . . . . . . . . . . . . . Anastasia Yu. Gulyaeva, Alexei Y. Khrushchev, Svetlana V. Kolyachkina, Victoria B. Muravieva, and Svetlana V. Antonova Virus-Like Particles: Properties and Characteristics of Reference Materials . . . . . . . . . . . . . . . . . . . . . . . . . . . . . . . . . . . . . . . . . . . . . . . . . . . . . . . . . Elena V. Kulyabina, Tatiana V. Kulyabina, Tatyana V. Grebennikova, Valeria V. Morozova, and Vitaly Yu. Morozov Reference Materials for the Composition of Antimicrobial Substances . . . . . . . . . . . . . . . . . . . . . . . . . . . . . . . . . . . . . . . . . . . . . . . . . . . . . . . . Elena V. Kulyabina, Andrey E. Shchekotikhin, Anna N. Tevyashova, Tatiana V. Kulyabina, and Valeria V. Morozova
3
23
31
Nominal Reference Materials of Biological Substances . . . . . . . . . . . . . . . . Valeria V. Morozova, Elena V. Kulyabina, Vitaly Yu. Morozov, and Tatiana V. Kulyabina
41
Caffeine Quantification Via High-Precision Coulometric Titration . . . . . Alexandr Yu. Shimolin
53
Primary Reference Procedure for Measuring the Mass Fraction and Molar Concentration of Copper and Zinc in Biological Materials by Isotope Dilution Mass Spectrometry . . . . . . . . . . . . . . . . . . . . Elena V. Vostroknutova, Tatiana N. Tabatchikova, Pavel V. Migal, Elena L. Lebedeva, Egor P. Sobina, Alena V. Sobina, and Marina F. Kuznetsova
71
v
vi
Contents
Molecular Diagnostics of Oncological Disease: Prospects for the Development of a Reference Material for the HER2 Gene Content . . . . . . . . . . . . . . . . . . . . . . . . . . . . . . . . . . . . . . . . . . . . . . . . . . . . . . . . . . . 107 Maxim S. Vonsky, Andrei L. Runov, Tatyana S. Goryachaya, Anna M. Koltsova, Elena V. Kurchakova, Vladimir D. Nazarov, Sergey V. Lapin, Alexandra V. Mazing, and Vladimir L. Emanuel Application of Reference Materials in the Analysis of Medicinal Plant Raw Materials and Herbal Medicinal Products . . . . . . . . . . . . . . . . . 119 Tatyana K. Ryazanova and Vladimir A. Kurkin Reference Materials in the Field of Quality of Life Determination of Sunflower Seed Oil Content Using Natural Sunflower Oil: Calibration of a Pulsed NMR Analyzer . . . . . . . . . . . . . . . . 137 Oleg S. Agafonov and Sergey M. Prudnikov Measurement of Carbon Isotope Ratio in Vanillin Using the CM-CRDS Method: Achieving an Expanded Uncertainty Below 0.1‰ . . . . . . . . . . . . . . . . . . . . . . . . . . . . . . . . . . . . . . . . . . . . . . . . . . . . . . . 149 Ian K. Chubchenko Development of Isotopic Reference Materials for 13 C-Urea Breath Tests . . . . . . . . . . . . . . . . . . . . . . . . . . . . . . . . . . . . . . . . . . . . . . . . . . . . . . . . . . . . . 167 Ian K. Chubchenko On Developing Metrological Assurance to Identify and Quantify the Content of Non-infectious Food Protein Allergens of Animal or Plant Origin in Food Products . . . . . . . . . . . . . . . . . . . . . . . . . . . . . . . . . . . 181 Olesya Ye. Pervukhina, Anna S. Sergeeva, Maria P. Krasheninina, Valeriya V. Studenok, Evgenii S. Mashkov, Pavel A. Petukhov, and Valentina N. Maigurova Measurement Techniques for the Composition of Air Environments: Development and Application . . . . . . . . . . . . . . . . . . . . . . . . 197 Olga B. Ponomareva, Yulia V. Kanaeva, and Mariia V. Gaiko Primary Reference Measurement Procedures in the Food Industry: Usage Experience and Development Prospects . . . . . . . . . . . . . . 217 Anna S. Sergeeva, Anastasia V. Kasilyunas, Elena G. Parfenova, and Sergey V. Medvedevskikh Bismuth Determination by Controlled-Potential Coulometry: Developing a Highly Accurate Procedure Based on GET 176 . . . . . . . . . . 233 Veniamin M. Zyskin and Alena V. Sobina
Contents
vii
Reference Materials of the Oil Refining, Gas, and Fuel Industry Use of Reference Materials-Imitators for Metrological Support of Gas Analytical Measuring Instruments . . . . . . . . . . . . . . . . . . . . . . . . . . . . 251 Anna V. Kolobova, Leonid A. Konopelko, Timofei B. Sokolov, and Olga V. Fatina Prospects for the Development of Reference Materials of the Wobbe Index . . . . . . . . . . . . . . . . . . . . . . . . . . . . . . . . . . . . . . . . . . . . . . . . . . . . . . . . . . . . . 267 Natalia A. Malginova, Elena N. Korchagina, and Yaroslav V. Kazartsev Reference Materials for Physical Properties Melting Point Certified Reference Materials for Organic Substances: Development Prospects . . . . . . . . . . . . . . . . . . . . . . . . . . . . . . . . . 281 Yaroslav V. Kazartsev, Elena N. Korchagina, and Igor V. Solovev Application of the Traceability Concept in Determining the Mechanical Properties of Metals Under Static Tension Using a GSO 11854-2021 Reference Material . . . . . . . . . . . . . . . . . . . . . . . . . . . . . . 295 Ilona N. Matveeva, Vladimir V. Tolmachev, and Anastasia A. Zabelina Metrological Support for Titration Isothermal Calorimetry: Prospects for the Development of Certified Reference Materials . . . . . . . . 307 Karina A. Mishina Study of Certified Reference Materials for Temperature and Specific Enthalpy of Phase Transitions of Metals and Metal Salts . . . . . . . . . . . . . . . . . . . . . . . . . . . . . . . . . . . . . . . . . . . . . . . . . . . . . . . . . . . . . . 323 Andrei M. Nepomiluev, Artyom P. Shipitsyn, and Anastasiya E. Tyurnina Development of Reference Materials for AC Magnetic Properties of Cold-Rolled Non-oriented Electrical Steel . . . . . . . . . . . . . . . . . . . . . . . . . 343 Sergey V. Serdjukov, Tatiana I. Maslova, Irina S. Tsay, and Ekaterina A. Volegova Certified Reference Materials for the Phase Transition Temperature of Organic Substances Based on Anhydrous Sodium Acetate and Sodium Methansulfonate . . . . . . . . . . . . . . . . . . . . . . . . . . . . . . . 355 Artyom P. Shipitsyn, Andrei M. Nepomiluev, and Anastasiya E. Tyurnina Certified Reference Materials for the Phase Transition Temperature (Curie Temperature) Based on Alumel, Nickel, and Iron Silicide . . . . . . . . . . . . . . . . . . . . . . . . . . . . . . . . . . . . . . . . . . . . . . . . . . . 367 Artyom P. Shipitsyn, Andrei M. Nepomiluev, and Anastasiya E. Tyurnina
viii
Contents
Reference Materials of Absorbed Dose: Expanding Dynamic Range and Improving Measurement Accuracy . . . . . . . . . . . . . . . . . . . . . . . 381 Vladimir P. Tenishev Development of Measures for Metrological Support of Raman Spectroscopy . . . . . . . . . . . . . . . . . . . . . . . . . . . . . . . . . . . . . . . . . . . . . . . . . . . . . . 393 Anna A. Yushina, Vladimir A. Aseev, and Alexander D. Levin Estimation of Uncertainty in Charpy Pendulum Impact Test Using the Reference Material . . . . . . . . . . . . . . . . . . . . . . . . . . . . . . . . . . . . . . . . . . . . . 407 Iuliia S. Chentsova, Vladimir V. Tolmachev, and Anastasia A. Zabelina Mathematical Methods for Characterization of Reference Materials and Risks of False Solutions New Algorithms for Estimating the Certified Characteristic of CRMs for Substances and Materials Using Interlaboratory Certification . . . . . . . . . . . . . . . . . . . . . . . . . . . . . . . . . . . . . . . . . . . . . . . . . . . . . . 419 Petr M. Aronov, Egor P. Sobina, Pavel V. Migal, Olga N. Kremleva, Valeriya V. Studenok, Valeriy A. Firsanov, and Sergey V. Medvedevskikh On the Stability Assessment of Reference Materials . . . . . . . . . . . . . . . . . . . 431 Pavel V. Migal, Egor P. Sobina, Petr M. Aronov, Olga N. Kremleva, Valeriya V. Studenok, Valery A. Firsanov, and Sergey V. Medvedevskikh Algorithms for Evaluating the Homogeneity of Reference Materials for the Composition and Properties of Dispersed and Monolithic Materials . . . . . . . . . . . . . . . . . . . . . . . . . . . . . . . . . . . . . . . . . . 445 Egor P. Sobina, Petr M. Aronov, Pavel V. Migal, Olga N. Kremleva, Valeriya V. Studenok, Valery A. Firsanov, and Sergey V. Medvedevskikh A Comparative Analysis of OIML Documents and Russian Rules on the Use of Reference Materials . . . . . . . . . . . . . . . . . . . . . . . . . . . . . . . . . . . 465 Narine G. Oganyan and Vladimir I. Dobrovolskiy
Reference Materials in the Healthcare and Pharmaceutical Industries
Certified Reference Material of Tylosin Tartrate Anastasia Yu. Gulyaeva , Alexei Y. Khrushchev, Svetlana V. Kolyachkina , Victoria B. Muravieva , and Svetlana V. Antonova
Abstract Antibiotics are widely used to combat various infectious diseases in animals. The uncontrolled use of antibiotics leads to antibiotic residues in food products that are easily transmitted to humans through food chains. The quality of medicinal products and the food safety of animal products is controlled by determining the content of drug residues using reference materials (RMs). In this study, we develop a certified RM (CRM) for the composition of tylosin tartrate. The methodology involved selection of a procedure for preparing the initial RM and methods for measuring the content of tylosin tartrate. As a result, HPLC was used for quantitative determination of the certified value of the measured quantity (mass fraction of tylosin). In accordance with RMG 93-2015 and GOST ISO Guide 35-2015, the standard uncertainty of the RM certified value from the characterization method, heterogeneity and instability of the material was estimated. The expanded uncertainty of the certified value was calculated. A new CRM GSO 11632-2020 for the composition of tylosin tartrate was approved. The CRM can be used for certifying
A. Yu. Gulyaeva (B) · S. V. Kolyachkina Department for Pharmaceutical Medicines Safety Control, 5 Zvenigorodskoye highway, Moscow 123022, Russia e-mail: [email protected] S. V. Kolyachkina e-mail: [email protected] A. Y. Khrushchev · V. B. Muravieva · S. V. Antonova Laboratory for Quality Control of Medicines, 5 Zvenigorodskoye highway, Moscow 123022, Russia e-mail: [email protected] V. B. Muravieva e-mail: [email protected] S. V. Antonova e-mail: [email protected] A. Yu. Gulyaeva · A. Y. Khrushchev · S. V. Kolyachkina · V. B. Muravieva · S. V. Antonova The Russian State Center for Animal Feed and Drug Standardization and Quality, Moscow, Russia © D. I. Mendeleyev Institute for Metrology 2024 E. P. Sobina et al. (eds.), Reference Materials in Measurement and Technology, https://doi.org/10.1007/978-3-031-49200-6_1
3
4
A. Yu. Gulyaeva et al.
measurement methods and controlling the measurement results of the mass fraction of tylosin in veterinary medicinal products, food, and animal feed. Keywords Tylosin · Reference material · Medicinal product · Veterinary medicine · Food safety · Customs union
Abbreviations Used CRM HPLC
Certified reference material High performance liquid chromatography.
Introduction In the contemporary world, the topic of the use of antibiotics for the treatment of infectious diseases in medicine and veterinary practice, along with the use of growth stimulants in animal husbandry, is particularly acute [1–5]. For the widespread use of antibiotics in the industry, such requirements are imposed as ease of use, rapid absorption and long-term elimination, high therapeutic efficacy, stability of finished dosage forms, and low cost. The listed parameters correspond to widely-used drugs based on tylosin [6, 7]. According to the information provided on the website of the State Register of Medicines for Veterinary Use in the territory of the Customs Union countries (Russian Federation, Republic of Belarus and Republic of Kazakhstan),1 as of September 2022, more than 150 drugs containing tylosin and its salts have been registered [1]. Tylosin has a broad therapeutic effect and is well tolerated in all animal and poultry species. In medicines for veterinary use, both tylosin in the form of a base and its salt, tylosin tartrate, are used as an active substance. The preparations are produced in the form of powder, microgranules and solutions. It is administered with drinking water, in the form of a mixture with feed, via aerosol treatments and incubation egg treatments, as well as in the form of injectable and oral solutions. Non-compliance with veterinary requirements for the use of such drugs can lead to the manifestation of toxic and allergic reactions in animals. It is also worth noting that the use of antibiotics in animal husbandry in violation of the requirements of the instructions 1
State Register of Medicines for Veterinary Use (2022) Available via Galen. https://galen.vetrf. ru/#/registry/pharm/registry?page=1. Accessed 15 July 2022 (In Russ.). Veterinary drugs Republic of Belarus. Available via vetsnab.info. https://vetsnab.info/veterinar nye-preparaty/. Accessed 15 July 2022 (In Russ.). State register of veterinary drugs and feed additives of the Republic of Kazakhstan. Available via Ministry of Agriculture of the Republic of Kazakhstan. https://www.gov.kz/memleket/entities/ moa/documents/details/471966?lang=ru. Accessed 15 July 2022 (In Russ.).
Certified Reference Material of Tylosin Tartrate
5
for their use may lead to the accumulation of residues in foods such as milk, eggs, meat and offal, which poses a risk to humans when eating these products [8, 9]. One of the main adverse reactions when using such products of animal origin in food is the development of resistance in microorganisms to antimicrobial drugs, which can lead to the appearance of bacteria of high virulence and reduce the effectiveness of measures for the treatment of infectious diseases of humans and animals [3, 8, 10, 11]. A number of authors have noted that residual traces of tylosin can result in allergic reactions or dysbiosis, as well as having carcinogenic, mutagenic and hepatotoxic effects [12, 13], which can cause complex, incurable and long-term infections in humans, leading to higher costs [3, 4, 8–10]. As a result of these undesirable effects, as well as in connection with the circulation of substandard and counterfeit medicines, quality control of medicines in civil circulation is carried out in the territory of the Russian Federation along with the monitoring of food safety [1, 14–20]. According to the requirements of the Technical Regulations of the Customs Union TR CU 034/2013 and TR CU 021/2011 [21, 22], the monitoring of the content of tylosin residues in order to establish veterinary safety is subject to meat and offal of all types of productive animals, as well as milk and eggs. The current legislation of the Customs Union establishes the following maximum permissible levels of residual amounts of tylosin in animal products: milk and eggs—prohibited (at the sensitivity level of the method definition); meat, liver, kidneys, raw fat—no more than 0.1 mg/kg. In order to determine tylosin levels, microbiological and physicochemical methods of analysis are used, including planar chromatography, high-performance liquid chromatography, capillary electrophoresis, and voltammetry [23–27]. All of the listed measurement methods, as a rule, include the use of a reference material (RM) of an approved type. Thus, RMs are an important component for ensuring the unity, comparability and traceability of measurement results necessary to guarantee the quality of medicines, including monitoring the accuracy of measurement results and confirming the authenticity of the substance under study, thus ensuring the establishment of metrological characteristics that meet the requirements of 102-FZ [28–30]. To date, commercial tylosin RM products are defined by the following standards: Tylosin United States Pharmacopeia Reference Standard No. 1703805; Tylosin British Pharmacopoeia Reference Standard No. BP349; Tylosin European Pharmacopoeia (EP) Reference Standard No. T2880000; Tylosin HPC Standards GmbH No. 674913 (Germany)2 [31]. However, the use of these RMs in Russia is currently difficult due to logistical constraints. The preliminary analysis by the authors of the information submitted to the Russian Federal Foundation for Ensuring the Uniformity of Measurements3 as of
2
Tylosin (2022) Merck. https://www.sigmaaldrich.com/DE/en/substance/tylosin916101401690. Accessed 17 October 2022. 3 Foundation for Ensuring the Uniformity of Measurements (2022). https://fgis.gost.ru/fundmetro logy/registry/19. Accessed 17 October 2022 (In Russ.).
6
A. Yu. Gulyaeva et al.
May 2022 indicates the absence of a sufficient number of approved RM types necessary for metrological support of measurements related to food safety, which are subject to technical regulations TR CU 034/2013, TR CU 021/2011, as well as those concerning the quality of medicines for veterinary use. Attention is drawn to the problem of ensuring the nomenclature of RM in the field of healthcare and pharmaceutical industry in works [31–35]. Therefore, the purpose of this study is to develop a RM-approved type of composition of tylosin tartrate. The objectives of the study include the following: justification of the selection of a candidate substance for the role of RM; implementation of input control of the candidate material of RM; determination of the procedure for certification of RM; testing for type approval; establishment of metrological characteristics of RM.
Materials and Methods Reagents, Solutions, and Materials A highly purified pharmaceutical substance of tylosin tartrate with a quality certificate (produced by Sigma-Aldrich, Germany) was used as a candidate material for the RM. The American Pharmacopoeia tylosin RM (reference spectrum)4 was used as a basis for comparison within the measurement of the certified characteristic. To confirm the authenticity of the candidate material, the tylosin tartrate RM of the American Pharmacopoeia5 was used. The following reagents and consumables were used during the measurements: acetonitrile, ACS reagent ≥ 99.5%, H.H., CAS No. 75-05-8; sodium perchlorate, ACS reagent ≥ 98.0%, H.H., CAS No. 7601-89-0; concentrated hydrochloric acid 37%, H.H., CAS No. 7647-01-0; distilled water according to GOST 6709-96; a syringe filter with a pore size of 0.45 microns; a tip for dispensers of various volumes.
Instruments and Conditions The samples were analyzed: • by IR spectroscopy using an IR-Fourier spectrometer infrared model NicoletiS50 (Thermo Fisher Scientific, USA), with the following instrumental and software
4
Tylosin LOT F0C008 (2022) Available via. https://static.usp.org/pdf/EN/referenceStandards/cer tificates/1703805-F0C008.pdf. Accessed 17 October 2022. 5 Tylosin Tartrate (2022) Available via. https://store.usp.org/product/1703850. Accessed 17 October 2022.
Certified Reference Material of Tylosin Tartrate
7
settings: summation of 16 measurements; DTGS KBr detector; beam splitter— KBr; signal gain—1; speed—0.6329; aperture—100; interpolation—level 2; apodization “N-B strong”; phase correction—Mertz [36, 37]. • by the HPLC method. Separation was carried out on a column Luna 5u C(18) 100A 250 * 4.60 mm in isocratic mode, using a mixture of 9.8% sodium perchlorate solution and acetonitrile as an eluent. Detection was carried out in the ultraviolet region of the spectrum at a wavelength of 290 nm. This wavelength was chosen in the course of experimental studies using the parameters of the developed technique as being the most optimal for obtaining a peak of sufficient intensity.
Sample Preparation of the RM Source Substance In accordance with the general requirements of the State Pharmacopoeia of the Russian Federation [38] for pharmaceutical substances and foreign pharmacopoeias for the quality of the substance tylosin tartrate, a list of quality indicators for the input control of the RM was developed. In this regard, the following basic requirements were determined for the organic substance selected for research as a candidate substance for the role of RM: appearance, solubility, color and transparency of the solution, mass fraction of tyramine, mass fraction of tylosin, mass loss during drying. Special attention was paid to determining the authenticity of the RM. To confirm the authenticity of RM substances, physicochemical methods were used: IR spectroscopy in the middle range and the high-performance liquid chromatography (HPLC) method. The authenticity and quality of the substance were evaluated according to the requirements of the OFS.1.2.1.1.0002.15 and OFC.1.2.1.2.0005.15 of the State Pharmacopoeia of the Russian Federation [39, 40].
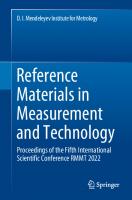
Sample Analysis by IR Spectroscopy The analysis of the candidate RM was carried out by IR spectroscopy by programmatically comparing the spectral data of the test substance and RM Tylosin Tartrate No. 1703850 of the American Pharmacopoeia (reference spectrum) in the average IR range of 400–4000 cm−1 (Fig. 1).6 To assess the correspondence of the spectra, the positions and relative intensities of the main bands on the reference spectrum were compared with those of the candidate certified reference material. In addition, the OMNIC software (search standards classification analysis algorithm) was used to more accurately analyze the correspondence of spectra in the entire range according to the “wave number” and “signal 6
Tylosin Tartrate (2022) Available via. https://store.usp.org/product/1703850. Accessed 17 October 2022.
Fig. 1 IR spectra of the reference spectrum of the candidate reference material of tylosin tartrate (a) and reference material of tylosin tartrate No. 1703850 of the American Pharmacopoeia (b)
8 A. Yu. Gulyaeva et al.
Certified Reference Material of Tylosin Tartrate
9
intensity” characteristics and calculate the total correlation coefficient (R) as a function of data variance on a scale from 0 to 100% (a coefficient value of 100 indicates full compliance) [41]. In the course of the IR spectroscopy studies, the correlation coefficient between the spectrum of the test sample and the reference spectrum was 96.2%, which indicates its identity in structure and chemical composition to the reference spectrum (R > 0.95%).
HPLC Sample Analysis The RM candidate material was analyzed by HPLC with spectrophotometric detection in the ultraviolet region of the spectrum at a wavelength of 290 nm by comparing the retention time of the main peaks of the test substance and RM Tylosin Tartrate No. 1703850 of the American Pharmacopoeia. During the confirmation of the authenticity of the material by HPLC, it was found that the retention time of the main peaks of the material coincided with the retention time of the main peaks of the basis for comparison (Figs. 2 and 3). After the input control was carried out and the compliance of the candidate RM with the stated requirements was established, the feedstock was packaged at (50 ± 10) mg in sealed glass transparent ampoules for medicines for conducting studies to determine the metrological characteristics of the RM.
Fig. 2 Chromatogram of reference base: the reference material of tylosin tartrate No. 1703850 American Pharmacopeia
Fig. 3 Chromatogram of the candidate reference material for the composition of tylosin tartrate
10
A. Yu. Gulyaeva et al.
Establishment of Metrological Characteristics of the Candidate RM Taking into account the requirements of RMG 93-2015 [42] and GOST 8.315-2019 [43], a method was chosen for the RM characterization using a certified measurement technique based on applying an external standard. In this connection, as part of the planned work, MU A-1/065 Methodology for Measuring the Content of Tylosin in the Tylosin Tartrate Substance by High-Performance Liquid Chromatography7 was developed and certified. The technique is based on the application of the HPLC method with spectrophotometric detection in the ultraviolet region of the spectrum at a wavelength of 290 nm. The study of the homogeneity and stability of the RM was carried out using a certified method of measuring the mass fraction of tylosin (MU A-1/065) in accordance with the provisions of RMG 93-2015.
Results and Discussion There are several methods for determining the certified value of RM, for example: the method of direct determination of quantitative content (titration method), the indirect method (mass balance method) and the external standard method. Tylosin consists of four main closely related compounds, the ratio between which may vary. Therefore, we assumed that the use of the non-aqueous titration method cannot guarantee reliable results. At the same time, the American and European Pharmacopoeias suggest using a microbiological method for the quantitative determination of tylosin. This method is based on the ability of tylosin to inhibit the growth of microorganisms. In this case, the determinations are carried out by diffusion into agar on a dense nutrient medium by comparing the sizes of growth inhibition zones of test cultures of microorganisms. However, a characteristic feature of the method of diffusion into agar is its labor intensity and long time duration. Here, the measurement results depend on many factors, including the properties of test microorganisms, nutrient media, the designation of the antibiotic, as well as the skills of the employee conducting the research [44]. In addition to the microbiological method of diffusion into agar, along with the generally accepted pharmacopeial method, an instrumental HPLC method can be used to determine the content of tylosin in the RM [36, 45]. Thus, in order to confirm the certified value (mass fraction of tylosin), it was decided to combine the microbiological method of diffusion into agar with the HPLC method. The method of measuring the content of tylosin in the tylosin tartrate substance using the microbiological method is based on the ability of the tylosin molecule 7
MU A-1/063 Method for Measuring the Content of Tylosin in the Tylosin Tartrate Substance by the Microbiological Method (2020). Available via FIF EUM. https://fgis.gost.ru/fundmetrology/reg istry/16/items/1010594. Accessed 7 October 2022 (In Russ.).
Certified Reference Material of Tylosin Tartrate
11
to diffuse in agar media and form suppression zones in which the used strain of Micrococcus luteus ATCC 9341, which is sensitive to the antibiotic, does not grow. The determinations are carried out by diffusion into agar on a dense nutrient medium by comparing the sizes of growth inhibition zones of test cultures of microorganisms. The method for measuring the content of tylosin in the tylosin tartrate substance by HPLC (MU A-1/065) is based on the application of the HPLC method with spectrophotometric detection in the ultraviolet region of the spectrum at a wavelength of 290 nm. The respective metrological characteristics of the methods for measuring the mass fraction of tylosin by the microbiological method of diffusion into agar and the HPLC method are presented in Tables 1 and 2. The results of the certification of methods and the establishment of metrological characteristics (Tables 1 and 2) indicate that the method for determining the basic substance by HPLC has a higher accuracy compared to the method based on the microbiological method. At the same time, according to the results of the measurements of the tylosin content by both methods, a convergence of the results within the error of the methods was noted. Taking into account the fact that the measurement of the content of tylosin in the substance of tylosin tartrate by HPLC has lower labor costs, as well as higher accuracy of determination, it was chosen for further work on the development of the tylosin RM. The HPLC method was used to evaluate the certified value of the mass fraction of tylosin in the RM, as well as to study its stability and uniformity. Table 1 Metrological characteristics of the method for measuring the content of tylosin in the substance of tylosin tartrate by high performance liquid chromatography Measured value
Tylosin content measuring range, mcg/mg
Relative extended uncertainty with confidence probability P = 0.95, Up*, %
Mass fraction of tylosin
From 800 to 1100 inclusive
3.2
*
Corresponds to the boundaries of the relative error with a confidence level of P = 0.95
Table 2 Metrological characteristics of the method for measuring the content of tylosin in the substance of tylosin tartrate by the microbiological method Measured value
Tylosin content measuring range, mcg/mg
Relative extended uncertainty with confidence probability P = 0.95, Up*, %
Mass fraction of tylosin
From 800 to 1100 inclusive
6
*
Corresponds to the boundaries of the relative error with a confidence level of P = 0.95
12
A. Yu. Gulyaeva et al.
Table 3 Results of determining the certified value of the certified reference material for the composition of tylosin tartrate; standard uncertainty from the method of characterizing the certified value of the certified reference material ˆ Certified characteristic Certified value of the RM A, Standard uncertainty from the mcg/mg characterization method Aˆ of the RM, uchar Mass fraction of tylosin, mcg/ mg
968.9
15.78 mcg/mg
Determination of the Certified Value of the RM and Evaluation of the Standard Uncertainty from the Method of Determining the Certified Value The certified characteristic for determining the certified value of the RM of the composition of tylosin tartrate is the mass fraction of tylosin, mcg/mg. In order to determine the certified RM value in randomly selected samples of the material, the mass fraction of tylosin was measured according to the developed and certified MU A-1/065 method at various levels of intermediate precision, as described above. The evaluation of the results obtained to establish the certified value and the standard uncertainty from the method of determining the certified value of the RM was carried out in accordance with RMG 93-2015. The obtained value of the certified RM characteristic and standard uncertainty from the method of determining the certified RM value are shown in Table 3. The obtained results were further applied to the evaluation of the extended uncertainty of the certified value of the RM of the composition of tylosin tartrate.
RM Uniformity Study The study of the uniformity of the RM was carried out simultaneously with the determination of the certified value. Considering that the candidate RM is a dispersed material, the homogeneity study was performed by repeated measurements of the certified value in several samples randomly selected from the entire volume of the RM. Thus, ampoules with the material (N = 12) were taken from the entire prepared batch, from which the necessary amount was then taken by weighing for measurements (J = 2) under repeatability conditions. Operations with samples and measurements of the mass fraction of tylosin were carried out in accordance with the measurement procedure MU A-1/065 described above. Processing of the obtained results was carried out according to the scheme of onefactor analysis of variance in accordance with the provisions of RMG 93-2015. The
Certified Reference Material of Tylosin Tartrate
13
Table 4 Results of assessing the heterogeneity of the certified reference material for the composition of tylosin tartrate Certified characteristic
Mass fraction of tylosin, mcg/mg
SS e
Results of intermediate calculations SS h
SS e
SS h
Standard uncertainty from the heterogeneity of the RM, uh , mcg/mg (absolute)
203.50
1838.46
16.96
167.13
8.67
SS e sum of the squares of the deviations of the measurement results from the average values of each sample SS h sum of squared deviations of the average results for each sample from the arithmetic mean of all measurement results SS e square of the standard deviation of the average sample results SS h square of the standard deviation of the average results between samples
results of the evaluation of the heterogeneity of the material with the composition of tylosin tartrate are given in Table 4. The obtained results were used in the evaluation of the expanded uncertainty of the certified value of the RM.
RM Stability Study For the stability study, which aimed to determine the shelf life and storage conditions of the RM, as well as the standard uncertainty from the instability of the RM, an isochronous stability study method referred to as the “accelerated aging method” was used, taking into account the provisions of RMG 93-2015 and GOST ISO Guide 35-2015 [46]. The principle of this method consists in increasing the impact of factors that cause the trend of the certified characteristic over a period of time much shorter than the shelf life of the RM. To calculate the aging time, the Van’t Hoff rule was used for slow reactions: when heated at 10 °C, the reaction rate increases 2–4 times in accordance with RMG 93-2015. To study long-term and short-term stability, a pre-calculated number of the required RM specimens were randomly selected and established at low and elevated temperatures. The following conditions are chosen as the intended storage conditions: the RM is stored in sealed ampoules, separately from food and feed, in a dry place protected from light at a temperature of +4 to −18 °C. To study stability, 13 selected specimens were established at low and elevated temperatures to study long-term stability. The duration of the stability study was calculated based on the estimated shelf life of the RM (4 years) and fixed storage temperature values. The duration of the stability study τ was estimated by the formula:
14
A. Yu. Gulyaeva et al.
τ=
T 2
t1 −t0 10
,
(1)
where T is the estimated shelf life of the RM sample; t 0 , t1 is the storage temperature of the RM and the storage temperature of RM during accelerated aging, respectively. The period of stability study at the temperature of the intended storage conditions (+ 4 °C) and elevated temperature (+ 43 °C) was 96 days. Measurements were carried out at regular intervals once every twelve days. The results of assessing the long-term stability of the RM are presented in Table 5. To assess the effect of low temperatures, 5 RM samples were selected and placed in the freezer of a household refrigerator at a temperature of −18 °C. Measurements of the values of the certified characteristic were carried out once every five days. All measurements were carried out under repeatability conditions according to the measurement method MU A-1/065 to establish a certified value in accordance with the above-described parameters of chromatographic analysis. The results were processed in accordance with GOST ISO Guide 35-2015. To calculate the standard deviation associated with the slope of the graphical dependence of the mass fraction of tylosin on time, the following formula was used: s ( )2 , X X − i i=1
s(b1 ) = / ∑n
(2)
where s is the standard deviation of the points from the line; s(b1 ) is the standard deviation of b1 ; Table 5 Results of assessing the long-term stability of the certified reference material for the composition of tylosin tartrate Time period, days
Estimated shelf life, T, days
Mass fraction of tylosin, mcg/mg
Standard uncertainty from instability of the RM, ustab , mcg/mg 3.41
12
178.8
973
24
357.6
965
36
536.4
968
48
715.2
971
60
894.0
968
72
1072.8
969
84
1251.6
968
96
1430.4
976
Certified Reference Material of Tylosin Tartrate
Xj
15
is the number of days during natural storage, corresponding to days during “accelerated” aging, days; is the average number of days in natural storage, days.
X
The inequality was used to estimate the slope level: |b1 | < t0.95,n−2 · s(b1 ),
(3)
where t 0.95,n−2 is Student’s t-test (t-criterion) for n is 2 degrees of freedom and p = 0.95 (95% confidence level); s(b1 ) is the standard deviation of b1 ; b1 is the slope of the graphical dependency. The calculation results are summarized in Table 6. The obtained data, which indicate the fulfillment of the inequality according to formula 3, allow us to conclude that the slopes are insignificant; consequently, that the instability of the RM is not observed. Based on the results of the stability control studies and tests to assess the effect of a reduced temperature of −18 °C, the shelf life of the tylosin tartrate RM is 4 years when stored at temperatures from +4 to −18 °C. To establish the metrological characteristics of RM, the standard uncertainty from instability ustab at time t was estimated by the formula: ustab = s(b1 ) · T = 3.41 mcg/mg,
(4)
where s(b1 ) is the standard deviation of b1 ; is the estimated shelf life of the RM, days. T The obtained value ustab was taken into account when determining the extended uncertainty of the certified value of the RM. Table 6 Results of studying the stability of the certified reference material for the composition of tylosin tartrate and assessing the effect of low temperatures Indicator
Stability study under Studies of the effect of low conditions of “accelerated temperatures on the RM (at − aging” at elevated temperature 18 °C) (at + 43 °C)
s(b1 )
0.00239
0.004887
Student’s t-test (t-criterion) for 2.365, with n = 7 (n − 2), t0.95, n2
2.776, with n = 4
|b1| < t0.95, n-2 . s(b1)
|0.001374| < 0.013567
|0.0020| < 0.00565
16
A. Yu. Gulyaeva et al.
Table 7 Normalized metrological characteristics of the certified reference material for the composition of tylosin tartrate Certified characteristic
Interval of permissible certified values of the reference material, mcg/mg
Permissible values of relative extended uncertainty at k = 2, %
Mass fraction of tylosin
From 800 to 1100 inclusive
6
RM Metrological Characteristics The extended uncertainty of the certified value of the RM composition of tylosin tartrate was calculated according to RMG 93-2015 according to the formula: ͡
U ( A) = 2 ·
/
u 2char + u 2h + u 2stab ,
(5)
where U(Â) is the expanded uncertainty where coefficient of the scope k = 2; uchar is the standard uncertainty from the method of establishing the certified value of the standard RM; uh is the standard uncertainty of heterogeneity of the RM; ustab is the standard uncertainty of instability of the RM. The normalized metrological characteristics of the developed RM are given in Table 7. As part of the tests for the approval of the RM type, the traceability of the measurement results to the “mass fraction” unit of magnitude reproduced by GET 208-20198 was ensured by conducting confirmatory measurements of the mass fraction of the main substance on the GWET 208-1-2016 state secondary standard of mass fraction units and mass (molar) concentrations of organic components in liquid and solid substances and materials based on gas and liquid chromatography [42].
8
GET 208-2019 State primary standard of units of mass (molar) fraction and mass (molar) concentration of organic components in liquid and solid substances and materials based on liquid and gas chromatography-mass spectrometry with isotope dilution and gravimetry: D. I. Mendeleyev Institute for Metrology. Available via FIF EUM. https://fgis.gost.ru/fundmetrology/registry/12/items/ 1382717. Accessed 17 October 2022 (In Russ.).
Certified Reference Material of Tylosin Tartrate
17
Conclusion Based on the results of the study, the GSO 11632-2020 tylosin tartrate approved composition pattern9 was developed. The RM material is a substance of tylosin tartrate, a hygroscopic powder from white to slightly yellow; the material is packaged in (50 ± 10) mg in sealed glass ampoules equipped with a label. Normalized metrological characteristics: mass fraction of tylosin—800–1100 mcg/mg; relative extended uncertainty at k = 2; P = 0.95 equal to 6%. The RM is stored separately from food and feed in sealed ampoules in a dry, light-protected place at a temperature from plus 4 °C to minus 18 °C; shelf life −4 years. To achieve this goal, the following tasks have been solved: the input control of the material has been carried out; the procedure for certification of the RM has been determined; tests have been carried out for type approval and the metrological characteristics of the RM have been established. To establish the content of the certified RM value, two methods were used: the microbiological method of diffusion into agar and the HPLC method. However, since the method of quantitative determination of the certified value of the measured value (mass fraction of tylosin) by HPLC has a higher accuracy compared to the method based on the microbiological method, the measurements were carried out by HPLC. At the same time, according to the results of the measurements of the tylosin content by both methods, a convergence of the results within the error of the methods was noted. In accordance with RMG 93-2015 and GOST ISO Guide 35-2015, the standard uncertainty of the certified value of the RM was estimated from the method of characterization, as well as from the heterogeneity and instability of the material. The expanded uncertainty of the certified value has been calculated. The traceability of the measurement results to the “mass fraction” unit of magnitude reproduced by GET 208-2019 has been established by conducting confirmatory measurements of the mass fraction of the main substance at GWET 208-1-2016. The theoretical significance of the conducted research lies in the fact that the results of the research part can be used for metrological support of measurements related to food safety, which are subject to technical regulations TR CU 034/2013 and TR CU 021/2011, as well as the quality of medicines for veterinary use. The practical significance of the obtained results consists in the possibility to expand the possibility of certification of measurement methods and control of the accuracy of measurement results of the mass fraction of tylosin in veterinary medicines, in food and food raw materials, animal feed, as well as various environmental facilities. In addition, the RM can be used to determine the authenticity of tylosin in medicines and establish the sensitivity of pathogenic microorganisms to tylosin.
9
GSO 11632-2020 Reference materials of the composition of tylosin tartrate. Available via FIF EUM. https://fgis.gost.ru/fundmetrology/registry/19/items/1384760. Accessed 17 October 2022 (in Russ.).
18
A. Yu. Gulyaeva et al.
Acknowledgements The research was carried out at the Russian State Center for Animal Feed and Drug Standardization and Quality (VGNKI) as part of the research work on the project “Development of certified reference materials (GSO) of tylosin and doxycycline” (2019–2020) as part of the State work “Applied scientific research”. All measurements were carried out using the equipment of the Russian State Center for Animal Feed and Drug Standardization and Quality. Contribution of the Authors Gulyaeva A. Yu.—general research management, development of the research concept, collection and analysis of experimental data, collection of literature data, preparation of documents on RM tests for type approval, writing a draft of the article; Khrushchev A. Y.—acquisition and analysis of experimental data on IR spectroscopy, revision of the text; Kolyachkina S. V.—conducting research, developing methods, experimental data acquisition; Muravieva V. B.—conducting research, developing methods, experimental data acquisition; Antonova S.V.—collection of literary data, revision of the text. Conflict of Interest The article was prepared on the basis of a report presented at the V International Scientific Conference “Reference Materials in Measurement and Technology” (Yekaterinburg, September 13–16, 2022). The article was admitted for publication after the abstract was revised, the article was formalized, and the review procedure was carried out. The version in the Russian language is published in the journal “Measurement Standards. Reference Materials” 2023;19(2):19–34. (In Russ.) https://doi.org/10.20915/2077-1177-2023-192-19-34.
References 1. Tretyakova OS, Zadnipryany IV (2021) The domestic system of state quality control of medicines and medical devices at the present stage. Tauride Med Biol Bull 24(4):59–68 (in Russian). https://doi.org/10.37279/2070-8092-2021-24-4-59-68 2. Manyi-Loh C, Mamphweli S, Meyer E, Okoh A (2018) Antibiotic use in agriculture and its consequential resistance in environmental sources: potential public health implications. Molecules 23(4):795. https://doi.org/10.3390/molecules23040795 3. Baynes RE, Dedonder K, Kissell L, Mzyk D, Marmulak T, Smith G et al (2016) Health concerns and management of select veterinary drug residues. Food Chem Toxicol 88:112–122. https:// doi.org/10.1016/j.fct.2015.12.020 4. Bacanlı M, Basaran N (2019) Importance of antibiotic residues in animal food. Food Chem Toxicol 2(125):462–466. https://doi.org/10.1016/j.fct.2019.01.033 5. Castanon JIR (2007) History of the use of antibiotic as growth promoters in European poultry feeds. Poult Sci 86:2466–2471. https://doi.org/10.3382/ps.2007-00249 6. Mark G (2016) Tylosin, 4th edn. In: Saunders handbook of veterinary drugs. In: Small and large animal, pp 826–827. https://doi.org/10.1016/B978-0-323-24485-5.00579-9 7. Tolkach NG (2012) Treatment of calves, gastroenteritis patients, using tilozinovyx antibiotics. Trans Educ Establis “Vitebsk Order “Badge Honor” State Acad Veterinary Med” 48(1):145–148 (in Russian) 8. Makarov DA, Komarov AA, Selimov RN (2017) Ensuring the chemical safety of food products in the Russian Federation. Product Quality Control 5:21–26 (in Russian) 9. Gulyaeva AY, Akmaev ER, Muravieva VB, Khrushchev AY, Soboleva NI, Bondarenko VO et al (2022) Development of the certified reference material for tylosine tartrate. In: Reference materials in measurement and technology: proceedings V international scientific conference, 13–16 Sept 2022, VNIIM, Yekaterinburg, Russia, pp 57–58 (in Russian) 10. Zainullina AR, Petuhova EV, Yakovleva GY (2017) Creation of a microbiological express method for the determination of antibiotics in milk. Bull Technol Univ 20(21):119–122 (in Russian)
Certified Reference Material of Tylosin Tartrate
19
11. Bakai KA, Priyma AD, Safronova VA, Nesterenko IS (2021) Development of an express method for the determination of tylosin in livestock products. Proc All-Russ Res Inst Exper Veterinary Med Named After Ya.R. Kovalenko 82:34–39 (in Russian). https://doi.org/10.31016/viev2021-18-4 12. Chaplygina OS, Prosekov AY, Belova DD (2022) Determination of antibiotic residues in animal products. Proc Voronezh State Univ Eng Technol 84(1):140–148 (in Russian). https://doi.org/ 10.20914/2310-1202-2022-1-140-148 13. Moudgil P, Bedi JS, Aulakh RS, Wang M-L et al (2019) Antibiotic residues and mycotoxins in raw milk in Punjab 15 (India): a rising concern for food safety. J Food Sci Technol 56(11):5146– 5151. https://doi.org/10.1007/s13197-019-03963-8 14. Melnikova OA (2020) The concept of falsified, counterfeit and poor-quality medicinal products from the legal standpoint. Medical Law 2:29–36 (in Russian) 15. Ilikbaeva ES (2018) Counterfeit animal drugs as a component of a target of crime stipulated in article 238.1 of the criminal code of the Russian federation. Theor Pract Soc Dev 5:144–146. https://doi.org/10.24158/tipor.2018.5.29 16. Kolanovi´c BS, Bilandži´c N, Varenina I, Boži´c D (2014) Tylosin content in meat and honey samples over a two-year period in Croatia. J Immunoassay Immunochem 35(1):37–47. https:// doi.org/10.1080/15321819.2013.784198 17. Tatarchuk OP (2004) Tylosin tartrate: rational antibiotic therapy. Veterinary 4:11–12 18. Tolkach NG (2012) Treatment of calves, gastroenteritis patients, using tilozinovykh antibiotics. Trans Educ Establish “Vitebsk Order “Badge Honor” State Acad Veterinary Med” 48(1):145– 148 (in Russian) 19. Cháfer-Pericás C, Maquieira A, Puchades R (2010) Fast screening methods to detect antibiotic residues in food samples. TrAC Trends Anal Chem 29(9):1038–1049. https://doi.org/10.1016/ j.trac.2010.06.004 20. Liu Y, Deng Y, Li S, Chow FW-N, Liu M (2022) Monitoring and detection of antibiotic residues in animal derived foods: solutions using aptamers. Trends Food Sci Technol 125:200–235. https://doi.org/10.1016/j.tifs.2022.04.008 21. TR CU 034/2013 (2013) On safety of meat and meat products: technical regulations of the customs union. Available via electronic fund of legal and regulatory technical documents. https://docs.cntd.ru/document/499050564. Accessed 17 Oct 2022 (in Russian) 22. TR CU 021/2011 (2011) On food safety: technical regulations of the customs union. Available via electronic fund of legal and regulatory technical documents. https://docs.cntd.ru/document/ 902320560. Accessed 17 Oct 2022 (in Russian) 23. Ahmed MBM, Sree YHA, Abdel-Fattah SM et al (2013) Determination of tylosin, spiramycin, and erythromycin residues in Egyptian buffaloes’ meat by thin-layer chromatographybioautography. J Planar Chromatogr Mod TLC 26(5):409–416. https://doi.org/10.1556/JPC. 26.2013.5.4 24. Deryabina VI, Nyung PhK, Akeneev YuA, Safonov DN (2014) Voltammetric method for the determination of tylosin tartrate in drugs used in veterinary medicine. Achieve Sci Technol APK 2:72–74 (in Russian) 25. Lan C, Yin D, Yang Z, Zhao W, Chen Y, Zhang W et al (2019) Determination of six macrolide antibiotics in chicken sample by liquid chromatography-tandem mass spectrometry based on solid phase extraction. J Analyt Methods Chem: 6849457. https://doi.org/10.1155/2019/684 9457 26. Yaneva Z, Georgieva N, Koinarski V, Petrova D (2015) Rapid RP HPLC method with PDA detection for tylosin determination in liquid samples. Trakia J Sci 13:309–314. https://doi.org/ 10.15547/tjs.2015.s.02.066 27. Przenioslo-Siwczy´nska M, Grelik A, Kwiatek K (2020) Identification and quantification of tylosin in animal feed by liquid chromatography combined with electrospray ionisation mass spectrometry. J Veterinary Res 64:299–304. https://doi.org/10.2478/jvetres-2020-0031 28. Gulyaeva AY, Kis IV, Kolyachkina SV, Khrushchev AY (2020) Certified reference materials of antibacterial substances: principle of development. Measure Stand Ref Mater 16(4):27–38 (in Russian). https://doi.org/10.20915/2687-0886-2020-16-4-27-38
20
A. Yu. Gulyaeva et al.
29. Guljaeva AJ, Kis IV, Koljachkina SV, Komarov AA (2018) Veterinary reference materials, vol Ru. In: Reference materials in measurement and technology: proceedings III international scientific conference, 11–14 Sept 2018, Yekaterinburg, Russia. UNIIM, Yekaterinburg, pp 54–55 (in Russian) 30. Federal Law “On ensuring the uniformity of measurements” No. FZ-102 of 26.06.2008 (in Russian). Available via. http://pravo.gov.ru/proxy/ips/?docbody=&firstDoc=1&lastDoc=1& nd=102122832. Accessed 17 Oct 2022 (in Russian) 31. Bohm DA, Stachel CS, Hackenberg R, Gowik P (2011) Preparation and characterisation of in-house reference material of tylosin in honey and results of a proficiency test. Anal Chim Acta 700(1–2):58–62. https://doi.org/10.1016/j.aca.2011.01.058 32. Osintseva EV, Medvedevskikh SV (2015) Trends in field of reference materials in Russia. Measure Stand Ref Mater 4:3–21 (in Russian). https://doi.org/10.20915/2077-1177-2015-0-43-21 33. Osintseva EV (2015) Trends for development of reference material list in the Russian Federation. In: Reference materials in measurement and technology: proceedings II international scientific conference, 14–18 Sept 2015, Yekaterinburg, Russia. UNIIM, Yekaterinburg, pp 68–70 (in Russian) 34. Studenok VV, Kremleva ON (2022) Reference materials in the healthcare and pharmaceutical industries. Mechanisms for planning the necessary range of reference materials. In: Problems of metrological support in healthcare and the production of medical equipment: collection of abstracts of the IX scientific and technical conference, 26–30 Sept 2022, Sochi, Russia. VNIIOFI, Moscow, pp 47–49 (in Russian) 35. Studenok VV, Kremleva ON (2019) Reference materials in the system of metrological assurance of quantitative analysis. Industr Labor Diagn Mater 85(1(II)):130–134 (in Russian). https://doi. org/10.26896/1028-6861-2019-85-1-II-130-134 36. Blackwell PA, Lützhøft H-C, Ma H-P, Halling-Sørensen B, Boxall A, Kay P (2004) Fast and robust simultaneous determination of three veterinary antibiotics in groundwater and surface water using a tandem solid-phase extraction with high-performance liquid chromatography-UV detection. J Chromatogr A 1045(1–2):111–117. https://doi.org/10.1016/j.chroma.2004.05.063 37. Shokhinaa OS, Medvedevskikh MYu, Krashenininaa MP, Makarova SG, Krylovb AI, Tkachenkob IY et al (2017) Development of the state secondary measurement standard and certified reference materials for composition on the basis of liquid and gas chromatography. Measure Stand Ref Mater 13(1):9–26 (in Russian). https://doi.org/10.20915/2077-1177-201713-1-9-26 38. State Pharmacopoeia of the Russian Federation, XIV edn., 4 vol. Ministerstvo zdravookhraneniia RF Publ., Moscow (2018). Available via. https://minzdrav.gov.ru/poleznye-resursy/xivizdanie-gosudarstvennoy-farmakopei-rossiyskoy-federatsii (in Russian) 39. OFS.1.2.1.1.0002.15 spectrometry in the infrared region. In: State Pharmacopoeia of the Russian Federation, XIII edn. Ministerstvo zdravookhraneniia RF Publ., Moscow. Available via. https://femb.ru/record/pharmacopea13 (in Russian) 40. OFS.1.2.1.2.0005.15 high performance liquid chromatography. In: State Pharmacopoeia of the Russian Federation, XIII edn. Ministerstvo zdravookhraneniia RF Publ., Moscow. Available via. https://femb.ru/record/pharmacopea13 (in Russian) 41. Baibing L, Julian M, Elaine BM (2004) Generalized partial least squares regression based on the penalized minimum norm projection. Chemometr Intellent Labor Syst 72(1):21–26. https:// doi.org/10.1016/j.chemolab.2004.01.026 42. RMG 93-2015 (2016) State system for ensuring the uniformity of measurements. Estimation of metrological characteristics of reference materials. Standartinform, Moscow, 27 p (in Russian) 43. GOST 8.315-2019 (2019) State system for ensuring the uniformity of measurements. Reference materials of composition and properties of substances and materials. Basic principles. Standartinform, Moscow, 34 p (in Russian) 44. Kuleshova SI (2015) Testing activity of antibiotics by agar diffusion. Sci Centre Expert Eval Med Prod Bull 3:13–17 (in Russian)
Certified Reference Material of Tylosin Tartrate
21
45. Dwi WA, Dwi AR, Muhtar PA, Haryanto A, Fitriana I (2022) Validation method for determining enrofloxacin and tylosin levels in broiler liver, kidney, and muscle using high-performance liquid chromatography. Veterinary World 15(2):268–274. https://doi.org/10.14202/vetworld. 2022.268-274 46. GOST ISO Guide 35-2015 (2017) Reference materials. General and statistical principles for certification. Standartinform, Moscow, 58 p (in Russian)
Virus-Like Particles: Properties and Characteristics of Reference Materials Elena V. Kulyabina , Tatiana V. Kulyabina , Tatyana V. Grebennikova , Valeria V. Morozova , and Vitaly Yu. Morozov
Abstract Virus-like particles (VLPs) have long attracted the attention of biologists and metrologists due to their dual nature. Despite their similarity to viruses, VLPs lack a virus DNA or RNA, thereby posing no threat of infection. The development of methods for the creation and standardization of VLPs, as well as for monitoring their characteristics, represents an important problem in the field of biotechnology and molecular biology. In this work, we aim to substantiate the requirements, methods, and instruments used to ensure the traceability of VLP-based certified reference materials (CRMs). The following methods for characterization of biological and physicochemical properties of such CRMs were considered: mass balance; high-performance liquid chromatography-mass spectrometry (HPLC-MS); gas chromatography-mass spectrometry (GC-MS); Karl Fischer coulometric titration; ion chromatography; inductively coupled plasma mass spectrometry; and isotope dilution. It was established that VLP-based CRMs should meet the following requirements: the presence of molecular patterns common to many pathogenic biological agents (PBAs) but absent in the organism; traceability to SI units; the absence of own genetic material; the presence only of inactivated homogenous strains when used for vaccine delivery. VLP-based CRMs facilitate metrological support in the field of medicine and vaccine production. E. V. Kulyabina (B) · T. V. Kulyabina · V. V. Morozova All-Russian Scientific Research Institute for Metrological Service, 46 Ozernaya str., Moscow 119361, Russia e-mail: [email protected] T. V. Kulyabina e-mail: [email protected] T. V. Grebennikova National Research Center for Epidemiology and Microbiology Named After Honorary Academician N.F. Gamaleya of the Ministry of Health of the Russian Federation, 18 Gamalei str., Moscow 123098, Russia V. V. Morozova California State University, 5241 N. Maple Ave., Fresno, CA, USA V. Yu. Morozov JSC Volga, 1 str. Gorky, Balakhna, Nizhny Novgorod Region 606400, Russia © D. I. Mendeleyev Institute for Metrology 2024 E. P. Sobina et al. (eds.), Reference Materials in Measurement and Technology, https://doi.org/10.1007/978-3-031-49200-6_2
23
24
E. V. Kulyabina et al.
Keywords Virus-like particles · VLPs · Reference materials · Requirements to reference materials · Vaccines
Introduction Virus-like particles (VLPs) represent an important object in the field of vaccine production and vaccine application, which makes research into the properties and characteristics of VLPs highly promising. VLPs are specifically-engineered nanostructures that resemble viruses, thus being capable of penetrating the target body cells (those intended to be penetrated). VLPs contain no own genetic material, i.e., neither DNA nor RNA, which is their significant and unique advantage. As a result, VLPs can efficiently deliver medicines to the target molecules without posing a threat of infection. VLPs are widely used to deliver drugs or vaccines not only to human [1], but also to animal [2] and plant cells [3]. These particles can be designed to perform both transport and antibacterial functions [4]. Acting as pre-concentrated antimicrobial agents that cause a rapid and local response, VLPs destroy the cell membrane by creating new, non-cellular pores at precise landing points on the membrane. This approach makes it possible to create virus-like frameworks with biologically regulated properties. Vaccine delivery is an important function of VLPs [5, 6]. Their inherent properties, such as multimeric antigens the size of viruses, highly organized and repetitive structure, and the absence of infectivity, make VLPs suitable for inducing safe and effective humoral and cellular immune responses. VLP-based vaccines have been approved for treating hepatitis B virus and human papillomavirus, as well as for veterinary use [2] for the prevention of porcine circovirus infection. Consequently, the structural characterization of VLPs is an important requirement for triggering an immune response in the body. Standardization of VLP properties, their creation methods, and approaches to monitoring their characteristics represent an important task in the field of biotechnology and molecular biology. Metrological traceability is the most important tool for ensuring the comparability and reliability of measurement results in laboratory medicine. In turn, metrological traceability is ensured by certified reference materials (CRMs), which allow the reproducibility and traceability of delivery systems to be determined in correlation with their physicochemical and biological properties. In this work, we aim to substantiate the requirements, methods, and instruments used to ensure the traceability of VLP-based certified reference materials in Russian metrology.
Virus-Like Particles: Properties and Characteristics of Reference Materials
25
Analytical Review Virus-like particles contain no RNA or DNA of a pathogenic infectious agent, are non-infectious and structurally native, immunologically relevant viral antigens or proteins recognized by the immune system. VLPs morphologically resemble their living virus counterparts and are easily recognized and processed by the antigenpresenting cells of the immune system. In other words, due to their affinity to living viruses, the introduction of VLPs into the body triggers its immune response. VLPs are good candidates for vaccine development due to their ability to induce a protective immune response. The human immune system has evolved to recognize the non-infectious self and the infectious non-self. The body has learned to elicit a strong immune response against microbial infections, at the same time as not responding to its own molecules. The human immune system consists of innate (nonspecific) and adaptive (specific) types [7, 8]. Innate immunity represents the first line of defense of the host against microbial infections. After the pathogen crosses the physical barriers of the host, such as the mucous membranes of the nose, mouth, eyes or skin, the immune system initiates an innate immune response within minutes. The cells of the innate immune system can recognize the common characteristics of a pathogenic biological agent (PBA) and trigger a response. The PBA-related structure, size, shape (e.g., icosahedron), molecular outer shell composition or socalled molecular patterns are molecules or properties (patterns) common to many PBAs, usually absent in humans but present in viral infection molecules. Molecular patterns, the ordered structure of the pathogen molecule, and the surface configuration can be recognized by pattern recognition receptors found in the body cells, which in turn leads to increased immunogenicity. In such a manner, innate immune perception mechanisms are triggered, which in turn stimulates antigen creation. Standardization of VLP properties and methods of their determination presents a real challenge for metrologists [1]. Therefore, the development of methods and instruments for metrological support of VLP characteristics is a relevant research task. Virus-like gene delivery systems represent a rapidly developing field of gene therapy. However, the lack of validated measurement techniques and reference materials of approved types (CRMs), which are used to deliver the necessary material into cells, justifies the need to develop appropriate CRMs and methods for comparative analysis of the characteristics of both synthetic and virus-derived gene delivery systems. The task of harmonizing the approaches to their characterization and test programs seems relevant. A review of the studies performed in this field shows that the problem of VLP standardization is increasingly attracting research attention. There are CRMs traceable to SI units, which are used to determine the reproducibility and traceability of delivery systems in correlation with their physicochemical and biological properties. For example, a CRM based on high-purity nucleic acids was previously developed in [9]. This well-characterized CRM provides an effective tool for assessing the accuracy of next-generation sequencing (NGS) assays, thus facilitating the quantification
26
E. V. Kulyabina et al.
of total nucleic acids. However, this CRM is not homogeneous, and its components are not fully characterized, which can lead to variations in measurement results. Briones et al. [10] described the development of an RM for virus-like particles traceable to the International System of Units (SI). The RM major component is the C3-triskelion peptide, designed in the form of an icosahedron. It was established that the proteins and peptides in the composition of the RM are traceable to the International System of Units through the corresponding reference materials. Taking into account the experience in the development of CRMs [9, 10], it can be assumed that commutative CRMs of approved types should be created in order to obtain highly-accurate and well-characterized VLPs.
Requirements for the Characteristics of CRMs for Virus-Like Particles According to the conducted analytical review, the CRM material of virus-like particles must: • have an affinity to live viruses; • have a spiral, cylindrical, or icosahedron surface configuration, to be easily recognized by the immune system as alien, not inherent to the organism; • have a repetitive structure; • have the size of viruses; • have molecular patterns common to many PBAs, but absent in human, animal, or plant organisms; • be traceable to SI units; • exhibit an antibacterial action when used as a virus-like scaffold with biologically regulated properties; • not contain its own genetic material, i.e., DNA or RNA of pathogenic biological agents. In the case of vaccine delivery, it can only contain inactivated strains; • be homogeneous. The RM envelope material must contain a known, measured with a specified uncertainty, mass fraction of the main component. According to regulatory guidelines for advanced therapeutic drugs (e.g., 2009/120/EC [11]), such as gene therapy products, the RM must be relevant and specific for the products and substances used for comparison. Its physicochemical properties must be characterized and documented [10]. The requirements for the material include its accessibility; it must assemble into a virus-like particle in an understandable and predictable way, delivering the contents of the capsule into the body cells. For example, triskelion is synthetically available, predictably assembled into VLPs, which encapsulate and transfer genes into human cells and are devoid of the side effects typical of the virus [10].
Virus-Like Particles: Properties and Characteristics of Reference Materials
27
Materials and Methods The following methods and instruments for determining the certified characteristics (including qualitative properties) of VLP-based CRMs are proposed.
Determining the CRM Purity Mass Balance Similar to any CRM of a biological nature, the purity of the proteins and/or peptides used as a VLP envelope must be initially confirmed. To this end, their comparison with the corresponding CRMs of proteins/peptides with established traceability to the International System of Units should be carried out. The mass balance method can be considered appropriate for these purposes. Purity is understood as the mass fraction of the main component minus the mass fraction of all impurities in the material from 100%, according to RMG 55–2003 [12] by formula (1): wmc = 100%−wr c − wsol − winorg ,
(1)
where wmc wr c wsol winorg
is the mass fraction of the main component in a sample, %; is the mass fraction of related compounds, %; is the mass fraction of water and organic solvents, %; is the mass fraction of inorganic impurities, %.
The mass fractions of related compounds are determined by HPLC-MS, e.g., using an X500R QTOF mass spectrometer, AB Sciex Pte. Ltd, Singapore. The mass fraction of water and organic solvents can be simultaneously calculated by determining the loss in weight during drying, based on the general pharmacopoeial article OFS.1.2.1.0010.15 [13]. However, the mass fraction of water and organic solvents can be determined by two separate methods. The mass fraction of water is determined by the Karl Fischer coulometric titration method, e.g., using an automatic Karl Fischer titrator CA-31, KF-3, and CA-310, Nittoseiko Analytech Co. Ltd. The mass fraction of residual organic solvents can be determined by mass spectrometry by passing a sample through a GC-MS gas chromatograph, e.g., using a Hexin GCMS 1000 gas chromatography mass spectrometer, Guangzhou Hexin Instrument Co., Ltd, China. The mass fraction of inorganic impurities can be determined by ion chromatography using, e.g., a Dionex ICS-6000 ion chromatograph, Thermo Fisher Scientific Inc., USA, or using, e.g., an NexION 2000 inductively coupled plasma mass spectrometer, PerkinElmer, Inc. In addition, a sulfated ash test can be used, where the material placed in a crucible is heated on an electric hotplate with a closed heating element and a thermostat until charred. After cooling down, the residue is moistened
28
E. V. Kulyabina et al.
with concentrated sulfuric acid and carefully heated until the sulfuric acid vapor is removed. The crucible is then placed in a muffle furnace and calcined at 600 °C until the residue has been completely reduced to ash. The percentage of the residue is equal to the total mass fraction of inorganic impurities.
Amino Acid Analysis with Isotopic Dilution Amino acid analysis determines the purity of a material by measuring the mass fraction of amino acid residues that are constituent amino acids of the RM. The existing amino acid CRMs with established metrological traceability to the SI system should be used as the basis for comparison. The availability of these CRMs ensures accurate and traceable quantification of the material. The use of two orthogonal methods for analyzing the characteristics of an RM will provide accurate values of its characteristics traceable to SI units.
Results and Discussion The conducted research allows the following conclusions to be drawn. VLPs constitute the main type of materials for targeted drug delivery. VLPs satisfy the need for non-toxic and biologically differentiated activity, enabling efficient solutions for structural homogeneity by mimicking the envelope and architecture of viral capsids. VLPs are promising candidates for vaccine development due to their properties: • the size similar to that of viruses; • a highly organized and repetitive structure; • the absence of infectious activity. These properties ensure the safety of VLPs and a predictable cellular immune response. CRMs for VLPs traceable to SI units play a crucial role in VLP standardization. Such CRMs can be used to determine the reproducibility and traceability of delivery systems in correlation with their physicochemical and biological properties. Since monomers are packed around the surface of a VLP capsid, forming a regular nanoscale grid, the VLP quantification is limited to the quantification of its monomer. Proteins and peptides of a therapeutic or diagnostic value should be compared with corresponding CRMs of polypeptide materials with established traceability to the International System of Units. This ensures the CRM traceability to SI units. The first and necessary step in the development of such materials is to verify their purity with established traceability to SI units.
Virus-Like Particles: Properties and Characteristics of Reference Materials
29
Conclusion The described approach to the characterization of CRMs for virus-like particles is expected to facilitate their future development and harmonization of approaches to their characterization and testing procedures. The development of CRMs for protein-based VLPs will ensure the metrological traceability of measurement results of their characteristics, calibration of measuring instruments used in bioanalysis [14], and conditions for creating vaccines devoid of side effects. The study of VLPs and CRMs based thereon will improve the system of metrological support for laboratory medicine [15]. Acknowledgements The authors express their gratitude to Prof. Lev Konstantinovich Isaev for his invaluable recommendations on the topic under consideration; to Fyodor Vladilenovich Bulygin for fruitful discussions; to Olga Nikolaevna Melkova, VNIIMS Lead Engineer. This study did not receive financial support in the form of a grant from any organization of the state, commercial, or non-profit sector. Author Contribution Kulyabina E. V.—research supervision, methodology development; Kulyabina T. V.—editing the article text, validation, control; Grebennikova T. V.—research concept development, material collection; Morozova V. V.—article draft preparation, carrying out the research; Morozov V. Yu.—formal analysis, research data supervision. Conflict of Interest The article was prepared on the basis of a report presented at the V International Scientific Conference “Reference Materials in Measurement and Technology” (Yekaterinburg, September 13–16, 2022). The article was admitted for publication after the abstract was revised, the article was formalized, and the review procedure was carried out. The version in the Russian language is published in the journal “Measurement Standards. Reference Materials” 2023;19(4):27–34. (In Russ.). https://doi.org/10.20915/2077-1177-2023-194-27-34.
References 1. Burns JR, Lamarre B, Pyne ALB, Noble JE, Ryadnov MG (2018) DNA origami inside-out viruses. ACS Synth Biol 7(3):767–773. https://doi.org/10.1021/acssynbio.7b00278 2. Bárcena J, Blanco E (2013). Design of novel vaccines based on virus-like particles or chimeric virions. In: Mateu M (ed) Structure and physics of viruses. Subcellular biochemistry, 68, 631–665. https://doi.org/10.1007/978-94-007-6552-8_21 3. Matsumura EE, Guo F, Boogers D, Oevelen DV, Vu ST, Falk BW (2022) Citrus sudden deathassociated virus as a new expression vector for rapid in planta production of heterologous proteins, chimeric virions, and virus-like particles. Biotechnol Rep 35:e00739. https://doi.org/ 10.1016/j.btre.2022.e00739 4. Castelletto V, de Santis E, Alkassem H, Lamarre B, Noble JE, Ray S (2016) Structurally plastic peptide capsules for synthetic antimicrobial viruses. Chem Sci 7:1707–1711. https://doi.org/ 10.1039/c5sc03260a 5. Syomin BV, Ilyin YV (2019) Virus-like particles as an instrument of vaccine production. Molekulyarnaya Biologiya 53(3):367–379. https://doi.org/10.1134/S0026898419030157
30
E. V. Kulyabina et al.
6. Jané-ValbuenaJ NML, Spencer SM, Walker SB, Baker TS, Ya C et al (1999) Reovirus virion-like particles obtained by recoating infectious subvirion particles with baculovirusexpressed sigma3 protein: an approach for analyzing sigma3 functions during virus entry. J Virol 73(4):2963–2973. https://doi.org/10.1128/JVI.73.4.2963-2973.1999 7. Zepp F (2010) Principles of vaccine design-lessons from nature. Vaccine 28(Suppl 3):14–24. https://doi.org/10.1016/j.vaccine.2010.07.020 8. Flint SJ, Enquist LW, Racaniello VR, Skalka AM (2003) Virus offence meets host defense. Principles of virology: molecular biology, pathogenesis, and control of animal viruses, 2nd edn. ASM Press, Washington, pp 531–584 9. Kalman LV, Datta V, Williams M, Zook JM, Salit ML, Han JY (2016) Development and characterization of reference materials for genetic testing: focus on public partnerships. Ann Lab Med 36(6):513–520. https://doi.org/10.3343/alm.2016.36.6.513 10. Briones A, Martos G, Bedu M, Choteau T, Josephs RD, Wielgosz RI, Ryadnov MG (2022) An SI-traceable reference material for virus-like particles. iScience 25(5):104294. https://doi.org/ 10.1016/j.isci.2022.104294 11. Directive 2001/83/EC of the European Parliament and of the Council on the Community code relating to medicinal products for human use as regards advanced therapy medicinal products. Available via. https://www.ejprarediseases.org/wp-content/uploads/2021/10/ DIRECTIVE-2009-120-EC.pdf. Accessed 10 Aug 2022 (in Russian) 12. RMG 55-2003 (2004) State system for ensuring the uniformity of measurements. Reference materials for composition of pure organic substances. Methods of certification. Principles basic. IPK Izdatelstvo standartov, Moscow, 12 p (in Russian) 13. OFS.1.2.1.0010.15 loss on drying. Available via Farmakopeia.rf. https://pharmacopoeia.ru/ofs1-2-1-0010-15-poterya-v-masse-pri-vysushivanii/. Accessed 10 Aug 2022 (in Russian). 14. Kulyabina EV, Kulyabina TV (2013) Use of state standard specimens and test mixtures for verification and calibration of measurement provisions used in biological research. Meas Tech 56:1429–1431. https://doi.org/10.1007/s11018-014-0395-2 15. Kulyabina EV (2017) To the relationship between the possibility of surviving of human being as a biological species and the level of metrological support for laboratory medicine and bioassay. Zakonodatel’naja i prikladnaja metrologija 6(151):49–51 (in Russian)
Reference Materials for the Composition of Antimicrobial Substances Elena V. Kulyabina , Andrey E. Shchekotikhin , Anna N. Tevyashova , Tatiana V. Kulyabina , and Valeria V. Morozova
Abstract The present study aims to generalize the experience of creating state reference materials (GSOs) of active substances and determine their main characteristics, standardized both in the State Pharmacopoeia of the Russian Federation and in the regulatory documents of the measurement uniformity assurance system. In connection with the violation of supply chains, the acquisition and use of foreign reference active substances became quite problematic or even impossible. As a consequence of the current difficult situation with the insufficient nomenclature of GSOs, the domestic manufacturers and developers faced urgent problems in creating them. The development of antimicrobial reference active substances will solve urgent issues of strengthening the technological sovereignty of Russia, minimize the import dependence of the Russian economy, as well as ensure the targets of the Strategy for Scientific and Technological Development of the Russian Federation to be achieved. The conclusions of the study can be applied in creating GSOs to substitute imported reference materials or surpass their level. Keywords Reference material · Active substances · Antimicrobials · Metrological traceability · RF scientific and technological development strategy
E. V. Kulyabina (B) · T. V. Kulyabina · V. V. Morozova All-Russian Scientific Research Institute for Metrological Service, 46 Ozernaya str., Moscow 119361, Russia e-mail: [email protected] T. V. Kulyabina e-mail: [email protected] A. E. Shchekotikhin · A. N. Tevyashova G. F. Gause Institute of New Antibiotics, 11 Bolshaya Pirogovskaya str., Moscow 119021, Russia V. V. Morozova California State University, 5241 N. Maple Ave., Fresno, CA, USA © D. I. Mendeleyev Institute for Metrology 2024 E. P. Sobina et al. (eds.), Reference Materials in Measurement and Technology, https://doi.org/10.1007/978-3-031-49200-6_3
31
32
E. V. Kulyabina et al.
Introduction Antimicrobials are one of the most widely used groups of medicines. They apply to various areas of medicine both in terms of a treatment and precautions. The quality control of medicines in accordance with the requirements of the State Pharmacopoeia of the Russian Federation typically provides for the use of reference materials (RMs), including chemical reference substances (CRSs) [1–4]. The need to use the RM of not only the active substance, but also its impurities, is enshrined in regulatory legal acts and in the State Pharmacopoeia of the Russian Federation. To date, the disrupted supply chain of foreign RMs1 has led to problems in the production of medicines, since RMs of active substances and their impurities are used by manufacturers as a daily basis for comparing the characteristics when producing each batch of medicines. The logistical difficulties of supplying the RMs of active substances result in the need to solve urgent issues of their import substitution and strengthening of the Russian technological sovereignty. A comparative analysis of RMs, necessary for the production of medicines, included in the list of Vital and Essential Medicinal Products of the Russian Federation,2 as well as RMs, registered in Federal Information Fund for Ensuring the Uniformity of Measurements (FIF OEI)3 as of May 2022 showed the absence of approved type RMs of active substances, antimicrobials [5–7], including aminoglycosides, oxalzolidines, glycopeptides, macrolides, and lincomycins. Taking into account the requirements of the Decree of the Government of the Russian Federation dated April 14, 2022 No. 653 [8], as well as the general requirements of the Federal Law dated June 26, 2008, No. 102-FZ [9], the Russian scientific community faces the task of developing a unified approach that summarizes the best practices of complete studies on the RMs of active substances and their impurities. The implementation of this work will contribute to the strength of the Russian technological sovereignty and minimize the import dependence of the Russian economy on foreign supplies. It is worth noting that the idea and content of the study is among the most significant areas of scientific development that affect world science as a whole and refers to biotechnology, physical chemistry, and cellular technologies [10]. The present study aims to summarize the information on the existing domestic approved type RMs of active substances, as well as to establish generalized approaches to the development and characterization of antimicrobial reference substances. 1
Reference materials of active substances, manufactured in accordance with the requirements of United States Pharmacopoeia (USP), European Pharmacopoeia (EP), and British Pharmacopoeia (BP) by the National Institute of Biological Standards and Control (NIBSC) and national metrological institutes of other countries. 2 Scroll vital and essential medicines for medical applications. Available via https://www.consul tant.ru/document/cons_doc_LAW_335635/a80818c7d9593b31dbdbd0d3418aec02298bd57d6d/. Accessed 4 August 2022 (In Russ.). 3 Federal Information Fund for Ensuring the Uniformity of Measurements. Available via FIF EUM. https://fgis.gost.ru/fundmetrology. Accessed 10 August 2022 (In Russ.).
Reference Materials for the Composition of Antimicrobial Substances
33
Terminology Table 1 shows the RM definitions, provided in the International Vocabulary of Metrology—VIM 3 [11] and the XIV State Pharmacopoeia of the Russian Federation [12]. Active substances—medicinal products in the form of one or more pharmacologically active substances, both synthetic and natural, intended for the production, manufacture of medicinal products and determining their effectiveness [13].
Table 1 Reference material terminology International vocabulary of metrology—VIM 3 XIV RF state pharmacopoeia 5.13 (6.13) Reference material (RM)—a material, sufficiently homogeneous and stable with reference to specified properties, which has been established to be fit for its intended use in measurement or in examination of nominal properties
Reference materials (RMs)—substances, used to perform the quality control of the investigated medicinal products using physico-chemical and biological methods in order to confirm the compliance of medicinal products with the requirements of regulatory documentation established during the implementation of the state registration, as well as to calibrate the reference materials of the manufacturer of medicinal products used for the quality control and other purposes in the circulation of medicinal products Chemical Reference Substance (CRS) is a reference material manufactured in accordance with the pharmacopoeial monograph (PM). [OFS.1.1.0007.18. Reference materials]
5.14 (6.14) Certified reference material (CRM)—a reference material, accompanied by documentation issued by an authoritative body and providing one or more specified property values with associated uncertainties and traceabilities, using valid procedures
Certification of reference materials—a study aimed at establishing the values of the certified characteristics in accordance with the test program and/or methodology, followed by the execution of appropriate documents (passport, RM application data sheet, layouts of primary and secondary packaging labels). The RM certification involves testing for homogeneity, stability, determining optimal storage and transportation conditions Certified value of reference materials is the value of the RM certified characteristic, established during its certification and provided in the passport and other RM documents with its error or uncertainty. The certified value is represented by a number expressing the value of the reproduced RM value in the established units. [OFS.1.1.0007.18. Reference materials]
34
E. V. Kulyabina et al.
Antimicrobials—substances of natural, semi-synthetic or synthetic origin that causes death or delays the growth of bacteria, mycoses, viral diseases, and protozoal infections (caused by protozoa) [14]. Antibiotics—natural compounds, as well as semi-synthetic or synthetic analogues, that suppress the development of microorganisms at low concentrations (up to 1 µg/mL). First of all, their action is aimed at bacteria and fungi, at the same time as being used as cytostatic (antitumor medicines). A number of them are able to block the replication of viruses [14].
Materials and Methods In most cases, in terms of materials for the manufacture of RMs, commercially available substances of known manufacturers, supplied with certificates of analysis indicating the mass fraction of the main component and, preferably, the methods of analysis, are used. Otherwise, RM manufactures themselves synthesize and purify the RM material. However, when the information on the mass fraction and methods is not available, it is necessary to conduct a mandatory procedure for identifying the main substance. NMR spectroscopy, mass spectrometry, UV spectrophotometry or IR spectrometry can serve as the main physical and chemical identification method [15, 16]. The general pharmacopoeial monograph “OFS.1.1.0007.18. Reference Materials” [17] establishes the following test methods: NMR spectrometry, mass spectrometry, infrared spectrometry, and element analysis for the structural description; establishing the content of organic and inorganic impurities, water, and residual solvents, loss on drying for the purity determination; method of mass balance for the quantitative determination. When testing the RMs of active substances for the type approval, it is mandatory to determine the content of related compounds. As an example, let us consider antibiotic RMs developed jointly by the FSBI Gause Institute of New Antibiotics and All-Russian Research Institute of Metrological Service. As a result of the work,4 GSO 11413-2019 (natamycin composition), GSO 11532-2020 (olivomycin A composition), GSO 11532-2020 (amphotericin B mass fraction) state reference materials were developed together with a reference measurement procedure (RMP) for the composition (purity) of the initial active 4
The work was performed within the framework of the “Bioanalitika” research and development work, an integral part of the “Komponent” research and development work, a state contract dated 06/16/2017, No. 120-93. This work was carried out in order to ensure the comprehensive development of the metrological assurance in the field of bioanalytical measurements; creation of tools and methods for the metrological assurance of measurements in the field of bioanalytical measurements, including laboratory diagnostics; ensuring reliable measurement results obtained using measuring instruments by creating the reference materials of active substances; ensuring the reliability of measuring the composition (purity) of initial active substances used for the manufacture of medicinal products traceable in accordance with the legislation on the measurement uniformity assurance.
Reference Materials for the Composition of Antimicrobial Substances
35
substances: Amphotericin B, Olivomycin A, Natamycin.5 The main feature of these RMs is that they comply with both the norms of the RF Pharmacopoeia and GOSTs of the Measurement Uniformity Assurance System (OEI GOST). In the course of the study, the error of the metrological characteristics of the GSOs, presented in Table 2, was established as directly depended on the quality of the RM raw material, synthesis and purification processes. The specified reference measurement procedure establishes the requirements related to the conditions of operations, whose implementation ensures the obtainment of the given measurement results with the established accuracy indicators. During the developmnet of the RMP, works were carried out on the selection of measurement methods and used equipment; the full uncertainty budget was calculated. In the procedure of measuring the composition (purity) of initial active substances, a measurement method of determining the mass fraction of the analyzed active substance as “100% minus impurities” was implemented. Summarizing the results of the performed tests and the developed approaches to the methods of the antibiotic RM characterization, the following theses can be formulated. If the RM manufacturer has to achieve a compliance with the requirements of the RF State Pharmacopoeia and OEI GOSTs, it is necessary to conduct tests for determining the following characteristics: • appearance [13]; • solubility [17]; • identification (or “authenticity” in the terminology of the RF State Pharmacopoeia) and confirmation of the substance chemical structure is typically carried out by the primary method of NMR spectrometry, HPLC-MS/MS, ultravioletvisible absorption spectrophotometry [18], infrared absorption spectroscopy [19]; • mass fraction of the main substance component is determined by the mass balance method, where the mass fractions of all impurities are subtracted from 100%; • related substances are determined using gas chromatography (GC) or HPLC methods [20], for residual organic solvents, for example, GC method is used [21]; • the total amount of inorganic impurities is determined using the sulfate ash method [22], componentwise analysis if performed using atomic emission spectrometry [23] and atomic absorption spectroscopy [24]; • since, for specific substances, pharmacopoeial monographs normalize either the water content or the loss on drying, depending on the substance, either the water content by Karl Fischer titration method, or the loss on drying should be determined [25].
5
FR.R1.31.2019.00005 Reference method for measuring the composition (purity) of the original pharmaceutical substances: Amphotericin B, Olivomycin A, Natamycin. Available via FIF EUM. https://fgis.gost.ru/fundmetrology/registry/8/items/834985. Accessed 10 August 2022 (In Russ.).
36
E. V. Kulyabina et al.
Table 2 Certified metrological characteristics of active substance GSOs Certified characteristics
Interval of accepted certified values, %
Accepted values of relative expanded uncertainty, at P = 0.95 and k = 2, %
GSO 11413-2019 reference materials of natamycin composition Mass fraction of natamycin
95.0–99.5
3
Mass fraction of related compounds
0.1–5
3
Total mass fraction of inorganic impurities
0.1–5
3
Potassium (K) mass fraction Calcium (Ca) mass fraction Sodium (Na) mass fraction
0.01–5
2
Total mass fraction of water and organic solvents
0.1–5
3
GSO 11532-2020 reference materials of olivomycin A composition Olivomycin A mass fraction
95.0–99.5
3
Mass fraction of related compounds
0.1–5
3
Total mass fraction of inorganic impurities
0.1–5
3
Chromium (Cr) mass fraction Calcium (Ca) mass fraction Iron (Fe) mass fraction
0.01–5
2
Mercury (Hg) mass fraction
0.01–5
2
Total mass fraction of water and organic solvents
0.1–5
3
GSO 11532-2020 reference materials of amphotericin B mass fraction Amphotericin B mass fraction 95.0–99.5
3
GSO 11732-2021 reference materials of gramicidin C hydrochloride (soviet) substance composition Gramicidin C hydrochloride (soviet) mass fraction
95.0–99.5
6
Mass fraction of related compounds
0.1–5
3
Total mass fraction of inorganic impurities
0.003–5
5
Chromium (Cr) mass fraction Calcium (Ca) mass fraction Iron (Fe) mass fraction
0.001–2 0.001–2 0.001–1
3 2 2
Total mass fraction of water and organic solvents
0.1–5
1
Reference Materials for the Composition of Antimicrobial Substances
37
In order to comply with the test program for the type approval of RMs, it is necessary to conduct additional tests for RM uniformity, short-term and long-term stability, as well as to establish requirements to RM storage, transportation conditions, and their shelf life. Determining the metrological traceability of RM characteristics is also a mandatory test section. The characteristics of these RMs can be traced to State Primary Standards GET 196-2015.6 Verified measuring instruments of approved types are used to perform all described test methods. For example, the main measuring instruments can include: analytical scales,7 dispensers,8 spectrophotometer,9 IR-Fourier spectrometer,10 highperformance liquid chromatograph,11 pH-meter,12 as well as measuring glassware, necessary auxiliary equipment, reagents, and solvents.
Results and Discussion Applying the approaches described above to the characterization of active substance RMs, the approved type RMs were manufactured with the following certified characteristics given in Table 2. Considered in Table 2 RMs are used in the manufacture of different batches of medicines to analyze and compare various batches of each medicine. The same procedure is carried out for the case of changes in the technological process or replacement of excipients, which can be carried out using the RMs of the composition and properties for these medicines. 6
GET 196-2015 State primary standard of units of mass (molar) fraction and mass (molar) concentration of components in liquid and solid substances and materials based on spectral methods: Custodian Institute All-Russian Research Institute for Optical and Physical Measurements. Available via FIF EUM. https://fgis.gost.ru/fundmetrology/registry/12/items/397882. Accessed 10 August 2022 (In Russ.). 7 FIF OEI No. 54391-13 Non-automatic scales, Sartorius Weighing Technology GmbH, Germany. Available via FIF EUM. https://fgis.gost.ru/fundmetrology/registry/4/items/366830. Accessed 10 August 2022 (In Russ.). 8 FIF OEI No. 36152-07 Automatic and mechanical single-channel dispensers, BIOHIT OYJ, Finland. Available via FIF EUM. https://fgis.gost.ru/fundmetrology/registry/4/items/345455. Accessed 10 August 2022 (In Russ.). 9 FIF OEI No. 67389-17 Spectrophotometers, JASCO International Co., Ltd, Japan. Available via FIF EUM. https://fgis.gost.ru/fundmetrology/registry/4/items/381335. Accessed 10 August 2022 (In Russ.). 10 FIF OEI No. 66036-16 Fourier transform infrared spectrometers, Thermo Fisher Scientific, USA. Available via FIF EUM. https://fgis.gost.ru/fundmetrology/registry/4/items/379856. Accessed 10 August 2022 (In Russ.). 11 FIF OEI No. 47938-17 High-performance liquid chromatographs, LLC IH EkoNova, Russia. Available via FIF EUM. https://fgis.gost.ru/fundmetrology/registry/4/items/359326. Accessed 10 August 2022 (In Russ.). 12 FIF OEI No. 15495-02 pH meters, Metrohm Ltd., Switzerland. Available via FIF EUM. https:// fgis.gost.ru/fundmetrology/registry/4/items/313568. Accessed 10 August 2022 (In Russ.).
38
E. V. Kulyabina et al.
Conclusion In the course of the study, the authors analyzed the main factors affecting the metrological assurance of studies aimed at the RMs of antimicrobial active substances. The main approaches to the methods of characterizing antibiotic RMs are formulated. The developed approach was tested by creating the state reference materials of antimicrobial medicines GSO 11413-2019, GSO 11532-2020, GSO 11532-2020, and GSO 11732-2021. The development of domestic antimicrobial RM production solves the urgent issues of strengthening the Russian technological sovereignty, minimizing the import dependence of the Russian economy, and ensuring the achievement of the targets set by the Scientific and Technological Development of the Russian Federation, its priorities and perspectives. These GSOs will ensure reliable and metrologically traceable measurement results obtained using medical products related to measuring instruments. Acknowledgements The work was carried out with the support of the State Contract “Komponent” Research and Development work dated June 16, 2017 No. 120-93 and its integral part “Bioanalitiks” Research and Development work. The authors express their gratitude to Professor L. K. Isaev and Dr. Sci. (Engineering) Professor A. Yu. Kuzin for their support and invaluable advice on the topic in question, to Dr. Sci. (Engineering) F. V. Bulygin for constant live participation in the formation of a scientifically grounded position of the authors, to Leading Researcher of the FSBI “VNIIMS” O. N. Melkova and Leading Researcher of the FSBSI “NIINA” Cand. Sci. (Chemistry) S. E. Solov’yova for the invaluable contribution to this work. Author Contribution Kulyabina E. V.—development of research concept, obtaining funding, development of methodology, supervision of research; Shchekotikhin A. E.—management of research work, provision of research materials; Tevyashova A. N.—conducting research work, curating data; Kulyabina T. V.—text verification and editing, validation, control; Morozova V. V.—draft writing, preparation and creation of visual materials. Conflict of Interest The article was prepared on the basis of a report presented at the V International Scientific Conference “Reference Materials in Measurement and Technology” (Yekaterinburg, September 13–16, 2022). The article was admitted for publication after the abstract was revised, the article was formalized, and the review procedure was carried out. The version in the Russian language is published in the journal “Measurement Standards. Reference Materials” 2023;19(4):17–26. (In Russ.). https://doi.org/10.20915/2077-1177-2023-194-17-26.
References 1. Volkova RA, Fadeikina OV, Klimov VI, Sakanyan EI, Olefir YuV, Merkulov VA et al (2016) Topical issues related to reference standards in the sphere of circulation of biological products. BIOprepar Prevent Diagn Treat 16(4):229–236 (in Russian) 2. OFS.1.1.0007.18 reference materials. In: State Pharmacopoeia of the Russian Federation, XIV edn. Available via E-DOSIER—Electronic Ecologist. https://e-ecolog.ru/docs/i1SAF4PopseP GDpTLcOJ. Accessed 10 Aug 2022 (in Russian)
Reference Materials for the Composition of Antimicrobial Substances
39
3. Merkulov VA, Sakanyan EI, Klimov VI, Shemeryankina TB, Yashkir VA, Barmin AV (2015) Modern approaches to development of reference substances for evaluation of the quality of pharmaceuticals. Pharmaceut Chem J 49(11):54–56 (in Russian). https://doi.org/10.30906/ 0023-1134-2015-49-11-54-56 4. Gurevich KG, Urakov AL, Rozit GA, Klen E, Samorodov AV, Khaliullin FA (2021) Synthesis and antiplatelet and anticoagulant activity of thietane-containing 2-(5-bromo-2,4-dihydro-3oxo-1,2,4-triazolyl-4)acetate salts. Pharmaceut Chem J 55(5)3–8. https://doi.org/10.30906/ 0023-1134-2021-55-5-3-8 5. Buravchenko GI, Maslov DA, Alam MdS, Grammatikova NE, Frolova SG, Vatlin AA (2022) Synthesis and characterization of novel 2-acyl-3-trifluoromethylquinoxaline 1,4-dioxides as potential antimicrobial agents. Pharmaceuticals 15(2):155. https://doi.org/10.3390/ph1502 0155 6. Omelchuk OA, Tevyashova AN, Shchekotikhin AE (2018) Recent advances in antifungal Recent advances in antifungal drug discovery based on polyene macrolide antibiotics. Russ Chem Rev 87(12):1206. https://doi.org/10.1070/RCR4841 7. Solovieva SE, Olsufyeva EN, Preobrazhenskaya MN (2011) Chemical modification of antifungal polyene macrolide antibiotics. Russ Chem Rev 80(2):103–126. https://doi.org/10.1070/ RC2011v080n02ABEH004145 8. Decree of the Government of the Russian Federation “On Amendments to the Decree of the Government of the Russian Federation of February 18, 2022 No. 208” dated 14 Apr 2022, № 653. Available via Official Internet portal of legal information. http://publication.pravo.gov.ru/ document/0001202204150017. Accessed 10 Aug 2022 (in Russian) 9. Federal Law “On ensuring the uniformity of measurements” of 26 June 2008, № FZ-102. Available via Official Internet portal of legal information. http://pravo.gov.ru/proxy/ips/?doc body=&firstDoc=1&lastDoc=1&nd=102122832. Accessed 10 Aug 2022 (in Russian) 10. Gokhberg LM, Grebenyuk AY (2022) Top 20 frontiers of world science. In: Higher School of Economics. Available via. https://issek.hse.ru/news/562631350.html?ysclid=l6by0ug65785 7283217. Accessed 10 Aug 2022 (in Russian) 11. JCGM 200:2012 international vocabulary of metrology—basic and general concepts and associated terms (VIM), 3rd edn. Available via BIPM. https://www.bipm.org/documents/20126/207 1204/JCGM_200_2012.pdf/f0e1ad45-d337-bbeb-53a6-15fe649d0ff1. Accessed 10 Aug 2022 12. State Pharmacopoeia of the Russian Federation, XIV edn. Available via Farmakopeia.rf. https:// pharmacopeia.ru/. Accessed 10 Aug 2022 (in Russian) 13. OFS.1.1.0006.15 pharmaceutical substances. Available via Farmakopeia.rf. https://pharma copoeia.ru/gosudarstvennaya-farmakopeya-xiii-online-gf-13-online/ofs-1-1-0006-15-farmat sevticheskie-substantsii/. Accessed 10 Aug 2022 (in Russian) 14. Shchekotikhin AE, Olsuf’eva EN, Iankovskaia VS (2022) Antibiotics and related compounds. Laboratoriia znanii, Moscow, 511 p (in Russian) 15. Goncharuk VV, Syroeshkin AV, Smirnov AN, Lesnikov EV, Popov PI, Uspenskaya EV et al (2006) New laser methods for determining the authenticity and quality control of medicines. RUDN J Med 2(34):90–95 (in Russian) 16. Gegechkori VI, Shulga NA, Shchepochkina OI, Gorokhovets NV, Levko AA, Chadova NN et al (2021) Procedure of matter identification of reference material for composition of azithromycin with use of spectral method. Measure Stand Ref Mater 17(3):21–34 (in Russian). https://doi. org/10.20915/2687-0886-2021-17-3-21-34 17. OFS.1.2.1.0005.15 solubility. Available via Farmakopeia.rf. https://pharmacopoeia.ru/ofs-1-21-0005-15-rastvorimost/. Accessed 10 Aug 2022 (in Russian) 18. OFS.1.2.1.1.0003.15 spectrophotometry in the UV and visible regions. Available via Farmakopeia.rf. https://pharmacopoeia.ru/ofs-1-2-1-1-0003-15-spektrofotometriya-v-uf-i-vid imoj-oblastyah/. Accessed 10 Aug 2022 (in Russian) 19. OFS.1.2.1.1.0002.15 spectrometry in the infrared region. Available via Farmakopeia.rf. https://pharmacopoeia.ru/ofs-1-2-1-1-0003-15-spektrofotometriya-v-uf-i-vidimoj-oblastyah/. Accessed 10 Aug 2022 (in Russian)
40
E. V. Kulyabina et al.
20. OFS.1.2.1.2.0005.15 high performance liquid chromatography. Available via Farmakopeia.rf. https://pharmacopoeia.ru/ofs-1-2-1-2-0005-15-vysokoeffektivnaya-zhidkostnaya-hromatogr afiya/. Accessed 10 Aug 2022 (in Russian) 21. OFS.1.2.1.2.0004.15 gas chromatography. Available via Farmakopeia.rf. https://pharmacop oeia.ru/ofs-1-2-1-2-0004-15-gazovaya-hromatografiya/. Accessed 10 Aug 2022 (in Russian) 22. OFS.1.2.2.2.0014.15 sulfate ash. Available via Farmakopeia.rf. https://pharmacopoeia.ru/ofs1-2-2-2-0014-15-sulfatnaya-zola/. Accessed 10 Aug 2022 (in Russian) 23. OFS.1.2.1.1.0004.15 atomic emission spectrophotometry. Available via Farmakopeia.rf. https://pharmacopoeia.ru/ofs-1-2-1-1-0004-15-atomno-emissionnaya-spektrofotometriya/. Accessed 10 Aug 2022 (in Russian) 24. OFS.1.2.1.1.0005.18 atomic absorption spectrometry. Available via E-DOSE. https://e-ecolog. ru/docs/DpD9SKSnYdLA5wcXytHjA. Accessed 10 Aug 2022 (in Russian) 25. OFS.1.2.1.0010.15 loss on drying. Available via Farmakopeia.rf. https://pharmacopoeia.ru/ofs1-2-1-0010-15-poterya-v-masse-pri-vysushivanii/. Accessed 10 Aug 2022 (in Russian)
Nominal Reference Materials of Biological Substances Valeria V. Morozova , Elena V. Kulyabina , Vitaly Yu. Morozov , and Tatiana V. Kulyabina
I personally saw what looked like an animal, but I can’t be absolutely positive that it wasn’t a mineral. I think that what was involved was really energy rather than matter. Relatively speaking, it would be easiest to describe the whole thing as a phenomenon hovering somewhere on borderland of dimensions and designations, on the abutment of color, shape, odor, mass, length and breadth, contours, shadows, darkness and so on and so forth. Slawomir Mro˙zek, “Streap-Tease” Translation by Edward Rothert (Bettencourt da Silva R., Ellison S. L. R. (eds.) (2021) Eurachem/CITAC Guide: Assessment of performance and uncertainty in qualitative chemical analysis. First Edition, Eurachem. Available via Eurachem. https://www. eurachem.org. Accessed 8 November 2022).
Abstract For biological substances, nominal examination traceability currently remains an unresolved issue. This is primarily associated with the lack of certified nominal reference materials (RMs), as well as requirements and practices for using tools in the field of metrology that could ensure nominal examination traceability for such properties as “nucleic acid sequence (RNA and DNA),” urine color; and letter codes. The study justifies the relevance of developing an application theory for such tools in Russian metrology, as well as the specified aspects. The differences V. V. Morozova (B) · E. V. Kulyabina · T. V. Kulyabina All-Russian Scientific Research Institute for Metrological Service, 46 Ozernaya str., Moscow 119361, Russia e-mail: [email protected] E. V. Kulyabina e-mail: [email protected] T. V. Kulyabina e-mail: [email protected] V. V. Morozova California State University, 5241 N. Maple Ave., Fresno, CA, USA V. Yu. Morozov JSC “Volga, 1 Gorky str., Balakhna, Nizhny Novgorod Region 606400, Russia © D. I. Mendeleyev Institute for Metrology 2024 E. P. Sobina et al. (eds.), Reference Materials in Measurement and Technology, https://doi.org/10.1007/978-3-031-49200-6_4
41
42
V. V. Morozova et al.
between measurement and nominal examination are outlined. Also, a draft chain of nominal examination traceability to an international harmonization protocol is proposed. Methods for ascertaining certified RM characteristics of human mitochondrial DNA fragment and inactivated SARS-CoV-2 “GC2020/1” strain are presented, including additional characteristics attributed to the “nucleic acid sequence” property. It is established that the uncertainty of nominal properties can be expressed as probability or confidence level. The authors note the role of nominal RMs in the reliable identification of nominal properties in biological substances. This study provides the foundation for implementing the presented conclusions in a new branch of metrology concerned with developing methods and means for ensuring reliable nominal examination of substances and materials. Keywords Nominal properties · Nominal reference materials · Nominal examination · Traceability · JCTLM · Quality criteria
Introduction Since its establishment as a scientific discipline, metrology has been concerned with measurement, as well as the ways and means of achieving the required accuracy. However, new branches of human knowledge that have existed for over half a century now do not apply the term “measurement.” Instead, they use the terms “testing” and “examination,” which are usually associated with the methods of scientific knowledge rather than measurement methods. This refers to the studies of the human genome [1], comparison of study results against known color scales, as well as the analysis of shapes, surface smoothness, and border serrations in different cell types, etc. In all of the above examples, scientists face the need to compare study results in order to ensure the traceability of obtained values without measuring them, i.e., without any reference to the units of physical quantities of the International System of Units (SI). For example, when mapping the human genome, the most important property is the nucleotide sequence of human DNA, which cannot be measured via comparison against a unit of length, concentration, or any other unit of measurement. Traceability is ensured to an elementary nucleotide—adenine, guanine, cytosine, and thymine. That is, this traceability system is based on fundamental constants in the form of nitrogenous bases that make up any living thing—humans, animals, plants, and even viruses, which are not considered to be alive, yet are also made up of nucleotides (only in their case, uracil nucleotide replaces thymine). The nominal examination of foodstuffs is dictated by the need to provide the population with quality products. For example, consumers need to be certain that they buy a product that is exactly as advertised on the label or that they have paid for and purchased expensive, healthy seafood rather than something that only looks similar. Consumption of counterfeit foods can lead to serious health consequences, including fatal outcomes.
Nominal Reference Materials of Biological Substances
43
In clinical and laboratory medicine, nominal examination is often of key importance when executing the orders of judicial and prosecutorial authorities. For example, when establishing paternity, it is crucial to determine the exact nucleotide sequence of a test subject’s DNA. Also, reliable identification of the SARS-CoV2 coronavirus is essential to containing the spread of the virus and reducing the socioeconomic burden [2, 3]. A theoretical literature analysis and an analysis of implemented practical works reveal that the nominal examination of nucleic acid sequences (RNA and DNA) has been considered extensively by the leading national metrology institutes: e.g., National Institute of Standards and Technology)1 [4, 5], National Institute of Metrology of China (NIM, China),2 and Korea Research Institute of Standards and Science (KRISS) [6]. However, a series of specific (procedural) issues pertaining to the nominal examination of “nucleic acid sequence (RNA and DNA)” remain underexplored. Russia is yet to address the issues associated with the wide use of terminology relating to nominal properties; development and certification of procedures for determining such properties; as well as creation, testing, and type approval of nominal reference materials (RMs). According to the literature review, further examination is required to better understand tools for ensuring nominal examination traceability for such properties as “nucleic acid sequence (RNA and DNA),” urine color, and letter codes, as well as to formulate requirements and establish application practices. The study aims to identify and analyze the main factors affecting the creation of means and methods for the metrological support of nominal examination, ensuring the traceability of nominal properties.
Theoretical Analysis According to ISO/IEC Guide 99:2007, a nominal property constitutes “a property of a phenomenon, body, or substance, where the property has no magnitude.” These include, for example, the shape of the leukocyte nucleus, urine color, cerebrospinal fluid color, taxon, nucleic acid sequence (RNA and DNA), i.e., such properties of an object to which the terms “magnitude” and “measurement” are not applicable. Nominal properties are inherent in any living organism—humans, animals, and plants, any creature that contains nucleic acids, ribonucleic acid (RNA) and 1
Certificate of Analysis, Standard Reference Material 2392 Mitochondrial DNA Sequencing (Human). Available via NIST. https://tsapps.nist.gov/srmext/certificates/2392.pdf. Accessed 8 November 2022. Certificate of Analysis, Standard Reference Material 3246 Ginkgo biloba (Leaves). Available via NIST. https://tsapps.nist.gov/srmext/certificates/3246.pdf. Accessed 8 November 2022. 2 Reference material certificate Chinese quartet family 1 (monozygotic twin family-mother). Human whole genomic DNA sequence reference material from B-lymphoblastoid cell lines. Available via NCRM. https://www.ncrm.org.cn/Repository/0950c4e0-e829-420c-b494-f88cba1fd576. pdf. Accessed 8 November 2022 (In Cn).
44
V. V. Morozova et al.
deoxyribonucleic acid (DNA), in its composition. Future scientific and technological advances (including measurement technologies) will probably permit the “measurement” of nominal properties; however, the values such properties are currently determined through their “examination” [7]. According to [7], a nominal property is a “property of a phenomenon, body, or substance, where the property has no size,” whereas nominal property value is a “feature common to equivalent individual nominal properties.” Despite difficulties associated with ensuring the traceability of nominal properties, such work is necessary to ensure reliable identification of humans, animal source foods, fishery resources, and, finally, the SARS-CoV-2 coronavirus. In turn, reliable identification is impossible without using a measure of nominal properties, such as RMs. As noted above, the terminology of nominal properties differs from that of physical quantities. Thus, a nominal examination standard realizes the definition of a given nominal property, with specified nominal property value and associated examination uncertainty, serving as a reference [8]. Essentially, the only difference from the classical concept of “standard” lies in the use of the term “examination” instead of the term “measurement.” When it comes to defining the primary reference procedure for nominal examination, the difference lies in the use of the term “examination result.” So, how is the term “examination result” defined? An examination result constitutes nominal property values attributed to the examined property along with any other relevant and available data [8]. Since the conventional metrology terminology used for the units of physical quantities is not applicable to nominal properties, the hierarchical traceability scheme must be presented in a form corresponding to the traceability of nominal properties, for example, for the nucleotide sequence of DNA or RNA, or of any nucleic acids. Drawing on the interim guidelines approved by the Ministry of Health of the Russian Federation,3 we propose a draft chain of nominal examination traceability (see Fig. 1). The approach to ensuring the nominal examination traceability shown in the figure serves as a guideline for our projects that are underway. To date, only RMs for quantitative properties have been approved and registered in the Federal Information Fund for Ensuring the Uniformity of Measurements, e.g.: • mass fraction of various substance components, e.g., pharmaceutical substances: GSO 11413-2019, GSO 11732-2021, GSO 11360-2019, and GSO 11532-20204 ; 3
Interim guidelines dated April 16, 2020 “Drug therapy for acute respiratory viral infections (ARVI) in outpatient practice during the COVID-19 epidemic. Version 2” (developed by the scientific community: I. M. Sechenov First Moscow State Medical University, National Medical Research Center of Phthisiopulmonology and Infectious Diseases, National Medical Research Center for Therapy and Preventive Medicine). Available via Information and legal portal Garant.ru. https:// www.garant.ru/products/ipo/prime/doc/73816786/. Accessed 8 November 2022 (In Russ.). 4 GSO 11413-2019 Reference material type-approved for natamycin composition. Available via FIF EUM. https://fgis.gost.ru/fundmetrology/registry/19/items/889620. Accessed 8 November 2022 (In Russ.).
Nominal Reference Materials of Biological Substances
45
Fig. 1 Draft chain of nominal examination traceability (nucleotide sequence of DNA or RNA, or nucleic acids) established through calibration hierarchy
• mass concentration: e.g., protective antigen in a solution—GSO 10922-2017, recombinant virus protein in a solution—GSO 10921-20175 ; • catalytic concentration RM, e.g. of enzymes: GSO 11387-2019 and GSO 113862019. GSO 11732-2021 Reference material for the composition of gramicidin S hydrochloride (Soviet). Available via FIF EUM. https://fgis.gost.ru/fundmetrology/registry/19/items/1392008. Accessed 8 November 2022 (In Russ.). GSO 11360-2019 Reference material type-approved for the mass fraction of amphotericin B. Available via FIF EUM. https://fgis.gost.ru/fundmetrology/registry/19/items/719091. Accessed 8 November 2022 (In Russ.). GSO 11532-2020 Reference material of type-approved for the composition of olivomycin A. Available via FIF EUM. https://fgis.gost.ru/fundmetrology/registry/19/items/1236979. Accessed 8 November 2022 (In Russ.). 5 GSO 10922-2017 Reference material type-approved for the mass concentration of a recombinant protective antigen against Bacillus anthracis in phosphate-saline solution. Available via FIF EUM. https://fgis.gost.ru/fundmetrology/registry/19/items/389279. Accessed 8 November 2022 (In Russ.). GSO 10921-2017 Reference material type-approved for the mass concentration of Ebola virus recombinant glycoprotein in phosphate saline. Available via FIF EUM. https://fgis.gost.ru/fundme trology/registry/19/items/389280. Accessed 8 November 2022 (In Russ.).
46
V. V. Morozova et al.
However, RMs for which nominal, as well as quantitative, properties of a substance can be certified are already available. For example, in addition to the certified characteristics of mass fraction/concentration, GSO 11607-20206 and GSO 11661-20207 must be certified for DNA and RNA nucleotide sequences, due to which these certified reference materials (CRMs) are actually used and without which it is impossible to control the operation of genome analyzers/sequencers.
Materials and Methods The study presents methods and means of determining the certified characteristics of specified CRMs, including non-certified, nominal properties provided in the type description.
Type Approval Procedure in Case of Readily (Commercially) Available Source Material: On the Example of GSO 11607-2020 When the source material for CRM production, specifically a purified PCR product, was readily (commercially) available, the following procedure was used. A purified PCR product obtained via high-precision amplification of a commercial DNA preparation having a known nucleotide composition was used as the original sample for CRM preparation. The purified and desalted PCR product was 50-fold diluted in 1000 mm3 of deionized water, and this solution was used to fill a quartz cuvette having an optical path length of 10 mm. The optical density was determined at 260 nm (A260 ) and 320 nm (A320 ), thus determining DNA concentration in the test sample. The obtained DNA concentration was used to dilute the product to the final concentration. The DNA nucleotide sequence of the CRM was determined using type-approved and verified measuring instruments (MIs)—genome analyzers and sequencers, e.g., a genome analyzer (Roche Diagnostics GmbH, Germany) or a capillary electrophoresis genetic analyzer (Institute for Analytical Instrumentation RAS, St. Petersburg). The known nucleotide sequence was used to determine the mass fraction of each nucleotide. For each nucleotide, the relative fraction of the nucleotide in the DNA nucleotide sequence Di was calculated using Eq. (1): 6
GSO 11607-2020 Type-approved reference material of human mitochondrial DNA fragment from HL-60 cell line culture (fragment 5999-7792). Available via FIF EUM. https://fgis.gost.ru/fundme trology/registry/19/items/1383975. Accessed 8 November 2022 (In Russ.). 7 GSO 11661-2020 Type-approved reference material of the inactivated SARS-CoV-2 “GK2020/ 1” strain. Available via FIF EUM. https://fgis.gost.ru/fundmetrology/registry/19/items/1384811. Accessed 8 November 2022 (In Russ.).
Nominal Reference Materials of Biological Substances
Di = (Ki · 100)/N,
47
(1)
where Di is the relative fraction for each nucleotide in the DNA nucleotide sequence, %; Ki is the number of each nucleotide in the sequence, units; i is the designation for a nucleotide, which is a “tetrit,” a unit of nucleotide measurement that takes four values: A, G, C, and T; N is the sequence size equal to the number of nucleotides in the sequence, units. Taking the molecular weight of each nucleotide into account, nucleotide mass fraction was calculated as per Eq. (2): Wi = (Di · Mi )/m,
(2)
where Wi is the mass fraction of each nucleotide, %; Mi is the molecular weight of each nucleotide, g; m is the mass of the DNA nucleotide sequence comprising N nucleotides, g. Following the type approval procedure, CRMs can be used for MI verification/ calibration, provided that they comply with the mandatory requirements set in the hierarchy schemes, procedures for certifying measurement standards, or procedures for MI verification, as well as for accuracy control and certification of measurement procedures and for providing traceability of measurement results.
Type Approval Procedure in the Absence of a Readily (Commercially) Available Source Material: On the Example of GSO 11661-2020 In the absence of a readily (commercially) available source material for CRM production, sufficient amounts of the culture of a pathogenic biological agent (e.g., SARSCoV-2 coronavirus) were produced via PCR (polymerase chain reaction)6 to determine the concentration of coronavirus RNA. The most available, highly sensitive, and specific method for the identification of SARS-CoV-2 nucleic acids in biological samples is the real-time PCR method with fluorescence-hybridization detection [9, 10]. Therefore, special attention was paid to studying the analytical sensitivity of reagent kits for the detection of SARS-CoV-2 nucleic acids. RNA concentration in the CRM was determined using real-time PCR with fluorescence-hybridization detection. The calibration characteristic (calibration line) was plotted as a dependence between the number of threshold cycles and the logarithm of initial concentration. In order to plot the calibration line, we used calibration
48
V. V. Morozova et al.
solutions comprising a diluted plasmid preparation of a known concentration (determined via a spectrophotometric method) and containing SARS-CoV-2 fragments. The concentration was measured via the spectrophotometric method using a V-730 spectrophotometer (Jasco International Co. LTD, Japan). An integral step in CRM creation consisted in the inactivation of the pathogenic biological agent at + 95 °C. The certified value was determined in accordance with the certified procedure for determining the certified RM value (mass concentration), which was developed and certified by a national metrology institute. In the case of SARS-CoV-2, the AllRussian Scientific Research Institute of Metrological Service (VNIIMS) developed and approved a procedure for measuring the certified value of mass concentration for the CRM of the inactivated SARS-CoV-2 “GK2020/1” strain.8 The DNA nucleotide sequence of the CRM was determined via next-generation sequencing (NGS) [11] using type-approved and verified MIs—genome analyzers/ sequencers, which were indicated above. In addition, the study used a mini centrifuge equipped with rotors for 0.2 cm3 /0.6 cm3 /1.5 cm3 microtubes, having a speed of at least 2400 rpm; pipettes, such as Eppendorf Research Plus single-channel pipettes having a variable volume of (0.5–200) µL; an electric household refrigerator as per GOST 26678-85, having a refrigerating compartment to maintain temperatures from 2 to 8 °C and a freezing compartment to maintain a temperature not exceeding −18 °C; as well as auxiliary reagents and solutions. Following the type-approval procedure, CRMs can be used first of all for the reliable identification of pathogenic biological agents (viruses or bacteria); certification of procedures and accuracy control intended to determine viral and bacterial RNA concentration, number of nucleotides in the coding RNA genomic region and the nucleotide sequence in a specific single-stranded RNA genomic region of viruses and bacteria; as well as in the assessment of the sensitivity and specificity of reagent kits intended for the detection of pathogenic biological agents. Also, the CRMs can be used for the verification and calibration of analyzers, real-time PCR thermocyclers, and MIs designed to identify/determine the concentration of viral and bacterial strains and to perform genetic analysis (genetic analyzers), provided that the metrological and technical characteristics of these CRMs meet the requirements of procedures for MI verification and calibration.
Results and Discussion Revisiting the discussion about the relevance and possibility of creating nominal CRMs, we should consider the traceability assurance of characteristics attributed to such CRMs and note the opinion of our colleagues from CCQM Working Group on Nucleic Acid Analysis (CCQM-NAWG), specifically Dr. Alison Devonshire, the 8
FR.1.31.2020.38562 Procedure for measuring the certified value of mass concentration for the CRM of the inactivated SARS-CoV-2 “GK2020/1” strain. Available via FIF EUM. https://fgis.gost. ru/fundmetrology/registry/16. Accessed 8 November 2022 (In Russ.).
Nominal Reference Materials of Biological Substances
49
leader of Analyte Group 2: Nucleic Acids Review Team,9 regarding the traceability of DNA sequence CRMs. JCTML-EC-07 Annex II [12] cites molecular biology experts who call for full coordination in order to ensure a harmonized approach to nucleotide sequence traceability. One of the criteria for confirming the identification of a nucleic acid sequence CRM is estimated uncertainty, which is recommended to be expressed as the probability of sequencing the examined nucleic acid fragment correctly. If all the criteria presented in JCTML-EC-07 Annex II are met, then the certified nominal property values of the sequence CRM will be traceable to nucleotides that are not SI units but are internationally recognized referent units [12].
Conclusion For biological substances, nominal examination traceability remains an unresolved issue at the moment. This is primarily associated with the lack of nominal CRMs, as well as requirements and practices for using tools in the field of metrology that could ensure nominal examination traceability for such properties as “nucleic acid sequence (RNA and DNA)”, urine color; and letter codes. In the course of the study, we analyzed the main factors affecting the metrological support of nominal examination and the traceability of nominal properties. These factors include inadequate terminology; lack of internationally-accepted provisions in Russian GOSTs regarding the traceability of nominal properties; lack of legislative regulations ensuring traceability, etc. On the example of GSO 11607-2020 and GSO 11661-2020, it is established that CRMs certified for the quantitative characteristics of mass fraction/concentration can also be certified for DNA and RNA nucleotide sequences. The presented conclusions enable the application of these CRMs for the metrological support of clinical and laboratory medicine, as well as ensuring the quality of food items and the identification reliability of the test object. Thus, it is shown that nominal CRMs of biological substances fit into the draft traceability chain presented in the figure, establishing the DNA or RNA nucleotide sequence through a hierarchy of calibrations traceable to nucleotides, which are not SI units but are internationally recognized referent units [12]. The specified example of traceability assurance illustrates how the global metrology community can successfully work together to solve an important problem. It seems reasonable to adopt a unified view on ensuring the traceability of nominal properties, as well as other characteristics, which will be discussed in detail by the present authors in future works. The presented conclusions can be applied to the creation of a new branch of metrology that will be concerned with developing methods and means for ensuring reliable nominal examination of substances and materials. 9
Analyte Group 2: Nucleic Acids Review Team. Available via BIPM. https://www.bipm.org/en/ committees/jc/jctlm/wg/jctlm-rt-nucleic-acids. Accessed 8 November 2022 (In Russ.).
50
V. V. Morozova et al.
Acknowledgements The authors express their gratitude to Lev K. Isaev, Dr. Sci. (Eng.), Professor, for his invaluable advice on the topic under consideration; Fedor V. Bulygin, Dr. Sci. (Eng.), for active participation in the formation of scientifically grounded position of the authors; Olga N. Melkova, Leading Engineer, All-Russian Scientific Research Institute of Metrological Service; Vladimir A. Gushchin, Cand. Sci. (Biol.), Head of the Reference Center for Coronavirus Infection and the Laboratory of Mechanisms of Population Variability of Pathogenic Microorganisms, National Research Center for Epidemiology and Microbiology named after Honorary Academician N. F. Gamaleya of the Ministry of Health of the Russian Federation; Artem P. Tkachuk, Cand. Sci. (Biol.), Head of the Laboratory of Translational Biomedicine, National Research Center for Epidemiology and Microbiology named after Honorary Academician N. F. Gamaleya of the Ministry of Health of the Russian Federation; Alexander A. Volkov, Leading Researcher, Russian Federal Research Institute of Fisheries and Oceanography; and Svetlana Yu. Fomina, Head of the Department of Habitat Monitoring, Aquatic Biological Resources and Products of Their Processing, Research Institute of Fisheries and Oceanography, without whom this work could not have been completed. The research did not receive financial support in the form of a grant from any organization in the public, commercial or non-profit sectors. Contribution of the Authors Morozova V. V.—writing a draft of the article, conducting research, preparing and creating visual materials; Kulyabina E. V.—management of research work, development of the research concept, development of methodology; Morozov V. Yu.—formal analysis, data curation; Kulyabina T. V.—revision of the text, validation and control of measurements. Conflict of Interest The article was prepared on the basis of a report presented at the V International Scientific Conference “Reference Materials in Measurement and Technology” (Yekaterinburg, September 13–16, 2022). The article was admitted for publication after the abstract was revised, the article was formalized, and the review procedure was carried out. The version in the Russian language is published in the journal “Measurement Standards. Reference Materials” 2023;19(3):45–54. (In Russ.). https://doi.org/10.20915/2077-1177-202345-54.
References 1. International Human Genome Sequencing (2004) Finishing the euchromatic sequence of the human genome. Nature 431(7011):931–945. https://doi.org/10.1038/nature03001 2. Braybrook Ju, Hugget J, Melanson JE, Campbell J (2022) CCQM roadmap to metrology readiness for infectious disease pandemic response. Available via ResearchGate. https://www. researchgate.net/publication/364029856_CCQM_Roadmap_to_Metrology_Readiness_for_ Infectious_Disease_Pandemic_Response. Accessed 8 Nov 2022 3. A standard sample of the coronavirus strain has been created in Russia. Konsortsium Kodeks [updated 11 Feb 2021]. Available via Techexpert. https://cntd.ru/news/read/v-rossii-sozdanstandartnyy-obrazec-shtamma-koronavirusa?ysclid=le5nj09s3m572223264. Accessed 8 Nov 2022 (in Russian) 4. McKenney K, Hoskins J, Tian J, Reddy P (1997) DNA molecules as standard reference materials I: development of DNA identification sequences and human mitochondrial DNA reference sequences. J Res Nat Inst Stand Technol 102(1):53–62. https://doi.org/10.6028/jres.102.005 5. Levin BC, Hancock DK, Holland KA, Cheng H, Richie KL (2003) Human mitochondrial DNA—amplification and sequencing—standard reference materials—SRM 2392 and SRM 2392-I. In: NIST special publication 260–155. Standard reference materials. Washington, US, Government printing office, 93 p. Available via NIST. https://www.nist.gov/system/files/doc uments/srm/sp260-155.pdf. Accessed 8 Nov 2022
Nominal Reference Materials of Biological Substances
51
6. Yo-K Bae, Kim J, Sung J, Yang I (2022) Developing the Korean human genomic DNA reference material for genomic sequencing. Available via BIPM. https://www.bipm.org/ documents/20126/53306924/P20-J_YLee_JCTLM_2019_KRISS_Poster_Developing_the_ Korean_human_genomic_DNA_reference_material.pdf/f47feb69-fd6a-6a5f-73d2-939716 328559. Accessed 8 Nov 2022 7. Nordin G, Dybkaer R, Forsum U, Fuentes-Arderiu X, Pontet F (2018) Vocabulary on nominal property, examination, and related concepts for clinical laboratory sciences (IFCC-IUPAC Recommendations 2017). Pure Appl Chem 90(5):913–935. https://doi.org/10.1515/pac-20110613 8. Kulyabina EV, Morozova VV, Morozov VYu, Kulyabina TV (2022) On the possibility of creating a metrological traceability chain of the research results of nominal properties of biological substances. Legal Appl Metrol 5:39–45 (in Russian). Available via Elibrary.ru. https://eli brary.ru/item.asp?id=49816166 9. Cheng MP, Papenburg J, Desjardins M, Kanjilal S, Quach C, Libman M et al (2020) Diagnostic testing for severe acute respiratory syndrome—related coronavirus-2: a narrative review. Ann Internal Med 172(11):726–734. https://doi.org/10.7326/M20-1301 10. Shen M, Zhou Y, Ye J, Abdullah Al-Maskri AA, Kang Y, Zeng S et al (2020) Recent advances and perspectives of nucleic acid detection for coronavirus. J Pharm Biomed Anal 10(2):97–101. https://doi.org/10.1016/j.jpha.2020.02.010 11. Rousseau F, Gancberg D, Schimmel H, Neumaier M, Bureau A, Mamotte C et al (2009) Considerations for the development of a reference method for sequencing of haploid DNA— an opinion paper on behalf of the IFCC Committee on Molecular Diagnostics, International Federation of Clinical Chemistry and Laboratory Medicine. Clin Chem Lab Med 47(11):1343– 1350. https://doi.org/10.1515/CCLM.2009.319 12. JCTML-EC-07 (2003) Annex II. JCTLM WGI. Nucleic acid review team: criteria to assess the quality of nominated nucleic acid reference materials with stated nominal properties. Available via BIPM. https://www.bipm.org/documents/20126/53185286/JCTLM-EC-07_Annex_II.pdf/ fd696763-8247-f607-957f-13f7f778ea5a. Accessed 8 Nov 2022
Caffeine Quantification Via High-Precision Coulometric Titration Alexandr Yu. Shimolin
Abstract Caffeine has traditionally been used to assess and control the metrological characteristics of liquid chromatographs. In recent years, with increasing requirements for the traceability of measurement results, the use of caffeine as a reagent for verification, calibration, and type approval tests has started to contradict the effective regulations governing measurement uniformity. This study aims to develop and test a procedure of caffeine quantification in caffeine via the primary method of coulometric titration for the metrological support of high-performance liquid chromatography (HPLC) with an accuracy of no more than 1%abs. In the course of work, a detailed analysis of methods for determining caffeine content in various matrices was carried out; in addition, a procedure for determining caffeine mass fraction in caffeine via coulometric titration was developed and tested. A comparison of the obtained results with caffeine mass fraction measurements performed using HPLC confirmed the commutativity of coulometric titration and HPLC. The developed procedure of caffeine quantification in caffeine via coulometric titration employing GET 176 can be used to develop a caffeine composition reference material and to provide metrological traceability of HPLC measurements on its basis to state primary standards reproducing the “mass fraction of components” and to SI units. Keywords Standard · GET 176 · Coulometry · Iodometry · Caffeine · HPLC · High-performance liquid chromatography · Traceability · Procedure · Coulometric titration
Abbreviations FIF EUM HPLC
Federal Information Fund for Ensuring the Uniformity of Measurements High-performance liquid chromatography
A. Yu. Shimolin (B) UNIIM—Affiliated Branch of the D. I. Mendeleyev Institute for Metrology, Yekaterinburg, Russia e-mail: [email protected] © D. I. Mendeleyev Institute for Metrology 2024 E. P. Sobina et al. (eds.), Reference Materials in Measurement and Technology, https://doi.org/10.1007/978-3-031-49200-6_5
53
54
GVET 208-1
GET 176
IR MI RM UV spectrum SS CT
A. Yu. Shimolin
State Secondary Standard of the units of mass fraction and mass (molar) concentration of organic components in liquid and solid substances and materials based on gas and liquid chromatography State Primary Standard of the units of mass (molar, atomic) fraction and mass (molar) concentration of components in liquid and solid substances and materials based on coulometry Spectrum—infrared wavelength spectrum Measuring instrument Reference material Ultraviolet wavelength spectrum Standard system implementing coulometric titration as part of GET 176
Introduction The method of high-performance liquid chromatography (HPLC) finds wide application in chemical, pharmaceutical, food, and oil refining, and other industries, as well as in environmental protection. The HPLC is used for the quality control of raw materials and finished products, monitoring of technological processes, in scientific research, as well as for the monitoring of environmental safety indicators and for other analytical tasks. As a chemical compound, caffeine has traditionally been used to control the metrological characteristics of liquid chromatographs equipped with spectrophotometric (including those with a diode matrix), refractive index, and evaporative light scattering detectors. However, as of January 01, 2022, Russia had no one type of certified reference materials (CRMs) required for the verification, calibration, and testing of measuring instruments (MIs), including type approval testing, as well as for the plotting of calibration characteristics for liquid chromatographs and accuracy control of measurement procedures in the process of their application. An analysis of the Federal Information Fund for Ensuring the Uniformity of Measurements (FIF EUM)1 also revealed a lack of methods for measuring caffeine mass fraction within the range of 97–100% with an accuracy of at least 1%. According to data from the Federal Information Fund as of May 2022, caffeine is used to verify 14 out of 62 types of liquid chromatographs. In 2021 alone, 1421 such chromatographs were verified using a caffeine reagent. Taking into account Rosstandart Order No. 2510 as of July 31, 2020 [1] and the general requirements of Federal Law No. 102-FZ as of June 26, 2008 [2], such practice is flawed as it violates the principle of measurement result traceability to State Primary Standards. What is more, the current level of science and technology imposes serious requirements for the metrological characteristics of CRMs used as calibrants. Thus, it is necessary 1
Federal Information Fund for Ensuring the Uniformity of Measurements. Available via FIF EUM. https://fgis.gost.ru/fundmetrology. Accessed 4 August 2022 (In Russ.).
Caffeine Quantification Via High-Precision Coulometric Titration
55
to develop a highly accurate procedure for determining caffeine mass fraction in caffeine using a primary method of analysis [3] for the subsequent release of a CRM of caffeine. In analytical practice, several methods for quantifying caffeine in caffeinecontaining matrices are known. Thus, the determination of caffeine microquantities in drugs as per [4] is proposed to be carried out via voltammetry with the use of iodine photogenerated from a potassium iodide solution. As the main method for analyzing caffeine in coffee, GOST 29148-97 [5] proposes a photometric method relying on the hydrolytic oxidation of caffeine to tetramethyl purpuric acid and subsequent photometric determination of the color intensity of its solution at a wavelength of 540 nm. However, the photometric method is designed for a relatively low content of caffeine (up to 2.3%), specifying a measurement repeatability of 0.15%abs (6.5%rel) and an interlaboratory precision of 0.3%abs (13%rel), which clearly does not satisfy the requirements for the procedure under development. In addition, according to [6], the method does not take into account the features of actual coffee samples, specifically changes in the spectral characteristics of the examined coffee extract due to the possible presence of impurities depending on the type of coffee. The shift of the solution absorption peak from 540 nm can result in significantly underestimated data. Also, an appendix to GOST 29148-97 provides a complicated reference spectrophotometric method, which requires the use of diatomaceous earth; it is designed for similarly low levels of caffeine and does not significantly increase the accuracy of analysis. Prior to the introduction of GOST 29148-97 to determine caffeine in coffee and caffeine-containing products, the method of iodometric titration was widely used. This method is based on the quantitative precipitation of caffeine in the form of its periodide in the presence of sulfuric acid using iodine solution in potassium iodide; then this compound is broken down with ethyl alcohol. The released iodine is titrated with sodium thiosulfate (hypo) solution with the addition of starch as an indicator near the endpoint of titration. Determination is also possible with the potentiometric equivalence point fixation [7]. The method is still used for the qualitative identification of “caffeine” substance according to the eponymous article GF RF XIV FS.2.1.0116.18 of State Pharmacopoeia [8]. The anhydrous acid-base titration method considered in [9, 10] is based on caffeine exhibiting pronounced basic properties in glacial acetic acid, which allows it to be titrated with a standard perchloric acid solution. With a slight modification, the method was included in GF RF XIV FS.2.1.0116.18 as the most preferable caffeine quantification method. This method provides an accuracy of up to 0.3%rel. However, its use is associated with working with substances included in the list of narcotic drugs, psychotropic substances, and their precursors to be controlled approved by Government Decree No. 665 as of July 02, 2015 [11], which complicates the application of this procedure. The procedure proposed in this article is based on a primary method of analysis [3]—coulometric titration—which establishes metrological traceability to SI units (kilogram, ampere, and second). The method is based on the use of electrogenerated iodine and a coulometrically standardized sodium thiosulfate solution,
56
A. Yu. Shimolin
which is essentially a development of iodometry. While conditions for 100% current efficiency when electrogenerating iodine and the procedure of sodium thiosulfate standardization are described in [12–14], a procedure for determining caffeine via coulometric titration has not been described before. In Russia, coulometric titration is implemented in GET 176-2019 State Primary Standard of the units of mass (molar, atomic) fraction and mass (molar) concentration of components in liquid and solid substances and materials based on coulometry (GET 176)2 [15]. Its measurement capabilities in the application field of methods relying on electrogenerating iodine for CRM certification were confirmed within international key comparisons CCQM K152 Assay of Potassium Iodate [16] and published in the BIPM calibration and measurement capability database [17]. In [6, 7], the authors present data on the comparability of caffeine measurements in organic matrices via iodometry, HPLC, as well as photocolorimetry and capillary electrophoresis within the caffeine mass fraction measurement range of 0.02–6.0%. However, despite the availability of published data on good comparability of caffeine determination results via the specified methods, additional studies are required on the comparability (commutativity) of coulometric titration and HPLC when determining caffeine in a pure substance with an accuracy of not more than 1% abs. Thus, this study aims to develop a procedure of caffeine quantification in caffeine via coulometric titration for metrological support of HPLC when determining caffeine in a pure substance with an accuracy of not more than 1% abs. To this end the following objective has been set: development and testing of a procedure for determining caffeine mass fraction in pure caffeine via coulometric titration; establishment of metrological characteristics defining the method; comparison of results with those obtained using HPLC.
Materials and Methods CRM Material As test material, the study used a caffeine reagent, batch No. 0618, industrially produced for the pharmacopoeia (supplied by CHEMMIX, Russia). The material constitutes white crystals soluble in water. The molar mass is 194.1908 g/mol [18].
2
GET 176-2019 State primary standard of units of mass (molar, atomic) fraction and mass (molar) concentration of components in liquid and solid substances and materials based on coulometry (includes 3 installations on the basis of constant current coulometry, controlled potential coulometry and inductively coupled plasma mass spectrometry): Custodian Institute UNIIM—Affiliated Branch of the D. I. Mendeleyev Institute for Metrology. Available via FIF EUM. https://fgis.gost.ru/fundme trology/registry/12/items/1382712. Accessed 4 August 2022 (In Russ.).
Caffeine Quantification Via High-Precision Coulometric Titration
57
Reagents The study used the following substances and materials: GSO 11713-2021 Certified reference material of potassium iodate,3 batch No. 1 [19]; 5-aqueous sodium thiosulphate, solution having a concentration of 0.1 mol/dm3 ; acetate buffer solution (pH 4.4–4.6) having a concentration of 0.5 mol/dm3 (anolyte); sodium nitrate, solution having a concentration of 0.5 mol/dm3 (catholyte); chemically pure potassium iodide; chemically pure sulfuric acid, solution having a concentration of 2 mol/dm3 ; chemically pure sodium carbonate.
Equipment The studies were carried out using a standard system implementing coulometric titration (SS CT) that is part of GET 176 (Fig. 1). The SS CT was adjusted to conduct iodometric titration in accordance with the flowchart, used MIs, reagents, and materials described in [14].
Caffeine Identification For the identification of analyzed substance (caffeine), UV and IR spectral data were collected (for results see Figs. 2, 3 and 4). The test substance was identified on the basis of the UV spectrum by means of GVET 208-1-2016 State Secondary Standard of the units of mass fraction and mass (molar) concentration of organic components in liquid and solid substances and materials based on gas and liquid chromatography (GVET 208-1)4 [20] under the following conditions: Method
HPLC, GF RF XIV FS.2.1.0116.18
Column
ZORBAX eclipse XDB-C18 (analytical 4.6 × 250 mm 5-µ)
Mobile phase (MPA)
Tetrahydrofuran
Mobile phase B (MPB)
Acetonitrile (continued)
3
GSO 11713-2021 Reference material for the composition of potassium iodate (UNIIM KIO3 CRM). Available via FIF EUM. https://fgis.gost.ru/fundmetrology/registry/19/items/1391862. Accessed 4 August 2022 (In Russ.). 4 GVET 208-1-2016 State Secondary Standard of the units of mass fraction and mass (molar) concentration of organic components in liquid and solid substances and materials based on gas and liquid chromatography: Custodian Institute UNIIM—Affiliated Branch of the D. I. Mendeleyev Institute for Metrology. Available via FIF EUM. https://fgis.gost.ru/fundmetrology/registry/11/ items/399340. Accessed 4 August 2022 (In Russ.).
58
A. Yu. Shimolin
(continued) Mobile phase C (MPC)
1.36 g of sodium acetate trihydrate dissolved in 1000 cm3 with glacial acetic acid at pH = (4.5 ± 0.1)
Elution mode
Isocratic, MPA:MPB:MPC (2.0:2.5:95.5)
Solvent
2.0 cm3 MPA; 2.5 cm3 MPB; 95.5 cm3 MPC
Mass concentration of the solution
0.21 mg/cm3
Input volume
10 mm3
Flow rate
1 cm3 /min
Temperature of the column oven
25 °C
Detection conditions
275 nm
Retention time
13.1 min
Substance identification on the basis of the IR spectrum was performed by means of a Nicolet iS5 FT-IR spectrometer (Thermo, USA). Measurement conditions are as follows: Detector
DTGS KBr
Beamsplitter
KBr
Wavenumber range, cm−1
3495.26–499.96
Number of sample scans
16
Number of reference scans
16
Resolution
4.000
Mirror speed
0.4747
Aperture
100.00
The UV spectrum of the test substance was 275 nm, which corresponds to the “caffeine” substance (273 nm according to GF RF XIV FS.2.1.0116.18). The chromatograms 2 and 3 revealed impurity peaks corresponding to the following substances: theobromine, theophylline, and benzoic acid. The results of substance identification according to the IR spectrum are shown in Table 1. The correspondence between the examined substance and the “caffeine” compound was estimated at 97.70%.
Coulometric Titration Procedure A caffeine sample sufficient for ten measurements (1 g) was dried for 12 h in a drying chamber (Binder, Germany) at (70 ± 1) °C; then it was cooled to room temperature in a desiccator over phosphorus pentoxide.
Caffeine Quantification Via High-Precision Coulometric Titration
59
Fig. 1 Standard system implementing the coulometric titration as a part of GET 176-2019 state primary standard of the units of mass (molar, atomic) fraction and mass (molar) concentration of components in liquid and solid substances and materials based on coulometry
Fig. 2 Chromatogram of the test substance (caffeine)
Fig. 3 Chromatograms of the test substance (caffeine) and solvent
60
A. Yu. Shimolin
Fig. 4 UV spectrum of the substance with a retention time of 13.1 min at a wavelength of 275 nm
Table 1 Results of caffeine identification on the basis of the IR spectrum using the Nicolet iS5 FT-IR spectrometer Index
Degree of correspondence, %
Reference compound
Spectral library
10
98.08
Caffeine
HR spectra IR demo
184
97.70
Caffeine
Georgia state forensic drugs
184
97.70
Caffeine in KBR
Georgia state crime lab sample library
A potassium iodate sample sufficient for ten measurements (3 g) was dried for two hours in the drying chamber at (110 ± 5) °C; then it was cooled to room temperature in a desiccator over phosphorus pentoxide. All electrolytes were prepared using deionized water, which was additionally stripped of oxygen, and stored under a constant flow of high-purity argon (henceforth referred to as ‘degassed water’). A (0.050 ± 0.002) g caffeine probe was placed in a pre-weighed 100 cm3 flask and weighed by means of a CP225D analytical balance (Sartorius, Germany) with an accuracy of 1·10−5 g via substitution weighing, taking the air buoyancy correction into account [21]. The probe mass was calculated as the difference of two weighings. A (0.070 ± 0.002) g potassium iodate probe was placed in a flask containing the caffeine test portion and weighed using substitution weighing with an accuracy of 1 × 10⁻⁵ g, factoring in the air buoyancy correction. The probe mass was calculated as the difference of two weighings. A probe of sodium thiosulfate solution (about 10 cm3 ) pre-standardized according to [14] under stability conditions [22] was collected using a disposable syringe and weighed by means of a balance with an accuracy of up to 1 × 10⁻⁵ g, factoring in the air buoyancy correction. The probe mass was calculated as the difference of two weighings. Degassed water was added to the mixture of caffeine and potassium iodate, which increased the volume of the solution to 30 cm3 . After that, the flask was sealed tightly with a cork and mixed thoroughly until crystals were completely dissolved.
Caffeine Quantification Via High-Precision Coulometric Titration
61
About 2 g of potassium iodide was added to a conical flask containing 50 cm3 of dilute sulfuric acid and mixed intensively until crystals dissolved; then about 20 cm3 of the mixture was immediately collected and added to the flask containing the solution of caffeine and potassium iodate. The sample solution turned a deep purple, and a brown precipitate was formed. The flask containing the solution was tightly sealed with a cork and weighed using a balance with an accuracy of 1 × 10⁻⁴ g, factoring in the air buoyancy correction. Following the weighing operation, the flask was kept in a dark for 15 min. A preliminary titration procedure was carried out using a SS CT as per [14]. Then, an aliquot of about 5 cm3 was collected from the flask using a syringe fitted with an end filter whose membrane size did not exceed 0.45 µm; the filter was removed; the syringe with the aliquot was weighed by means of a balance having an accuracy of 1 × 10⁻⁵ g via substitution weighing, taking the air buoyancy correction into account, to be transferred into the coulometric cell. Then the sodium thiosulfate probe was added drop by drop to the working chamber of the cell until the indicator signal dropped. The excess sodium thiosulfate was additionally titrated using iodine electrogenerated at a current of 1 mA with 5-s pulses. The result of a single measurement was determined using a summary formula including each measurement step: ACfn =
1 4
· MCfn ·
(
6·AKIO3 ·m KIO3 ·m aliq MKIO3 ·m sol
− Chypo · m hypo + m Cfn · m sol
'
(U1 ·(t1 −t1 )+U2 ·t2 ) z·F·R
)
· m aliq
× 100%,
where ACfn AKIO3
MKIO3 , MCfn m KIO3 , m Cfn , m aliq , m sol C hypo U1 U2 U3 t1' t1 t2
caffeine mass fraction, %; mass fraction of potassium iodate determined via coulometric titration with an absolute expanded uncertainty (k = 2; P = 0.95) of no more than 0.05%; molar mass of potassium iodate and caffeine, respectively, g/mol; masses of the potassium iodate, caffeine, aliquot, and solution following the reaction, respectively, g; quantity of sodium thiosulfate in the probe, mol/kg of the solution; voltage of the generator current during preliminary titration, V; voltage of the generator current during the main titration, V; voltage of the generator current during the final titration, V; total duration of preliminary titration, s; time corresponding to the preliminary titration endpoint, s; time of main titration, s;
62
A. Yu. Shimolin
Table 2 Results of measuring caffeine mass fraction in five dissolved samples of caffeine Sample number, n
Results of parallel determinations, % 1
2
3
Average caffeine mass fraction in the sample, %
SD of the average value for the sample, %
1
99.750
99.770
100.283
99.934
0.17
2
99.986
99.867
99.608
99.820
0.11
3
99.435
99.977
100.410
99.941
0.28
4
99.989
100.492
99.841
100.107
0.20
5
100.222
100.020
99.866
100.036
0.10
Average caffeine mass fraction in the material, % Standard deviation of the average measurement result (n = 15), %
t3 z F mhypo R
99.968 0.075
time corresponding to the final titration endpoint, s; number of electrons involved in the reaction (z = 2); Faraday constant, C/mol (F = 96,485.33212 C/mol); probe mass, taking into account the air buoyancy correction, g; resistance of the standard resistor, Ω.
In order to determine the comparability of caffeine mass fraction measurements via coulometric titration and HPLC, caffeine was quantified using GVET 208-1 under the conditions specified in GF RF XIV FS.2.1.0116.18.
Results and Discussion In the course of the study, measurements were performed for five dissolved caffeine samples, i.e., three parallel determinations for each sample (for measurement results see Table 2).
Uncertainty Budget The uncertainty budget was estimated using algorithms described in GOST 34100.32017/ISO/IEC Guide 98-3:2008 [23]. The calculation results are shown in Table 3. In order to confirm the commutativity, caffeine mass fraction in caffeine was measured five times via HPLC using GVET 208-1. The measurement results are presented in Table 4. The results of measuring caffeine mass fraction in caffeine showed good agreement between the applied methods of coulometric titration and HPLC.
R
M
F
z
B
B
B
B
mhypo
B
U3
B
t3
t1
B
mtest
67.6056
t1'
B
B
0.01007
U1
B
B
99.968
Repeatability
1
96,485.332120
194.1908
10.001477
0.51711
5.288701
160.8926
0.01006
38.84140
s V
7.83 × 10⁻⁵ s g Ω
7.78 × 10⁻⁵ 10−6
g Ω
–
C/mol
g/mol –
C/mol
5.00 × 10⁻⁶ 0
g/mol
8.32 × 10⁻³
5.00 ×
1.03 × g
g
s 1.14 × 10⁻⁵
5.59 ×
s
V
%
10−5
10−5
1.03 × 10⁻⁴
6.89 ×
0.075
Unit
10−4
V
s
s
V
%
ui
A
Uncertainty
xi
Unit
Value
Characteristic
Type
N
R
R
R
R
R
R
R
R
R
R
N
Distribution
10−1
10−4
3.98 ×
1
4.13 × 10⁻⁷
5.15 × 10⁻¹
10−1
2.03 × 10⁻²
18.9
2.10 ×
3.36
2.10 ×
10−4
2.10 × 10⁻⁴
6.00 ×
1
ci
%/–
%/(C/mol)
%/(g/mol)
%/Ω
%/g
%/g
%/s
%/ V
%/s
%/s
%/V
1
Unit
Sensitivity coefficient
Table 3 Uncertainty budget of caffeine mass fraction measurement in caffeine via coulometric titration by means of GET 176
%
2.16 ×
1.99 ×
0
2.06 × 10⁻¹²
4.28 × 10⁻³
10−6
1.58 × 10⁻⁶
2.16 × 10⁻⁴
10−8
2.63 × 10⁻⁴
1.17 × 10⁻⁸
2.16 × 10⁻⁸
∞
∞
∞
∞
∞
∞
∞
∞
∞
∞
∞
15
νι
(continued)
%
%
%
%
%
%
%
%
%
%
%
7.48 × 10⁻² 4.13 × 10⁻⁵
Unit
Product c i ui
Caffeine Quantification Via High-Precision Coulometric Titration 63
msol
maliq
Completeness of precipitation
B
B
B
MKIO3
B
–
Ar purity
B
Impurities
Illumination
B
m KIO3
–
Impact of O2
B
B
–
Diffusion
B
B
0.19583
C hypo
–
5.28870
115.95859
219.9998
0.157204
–
–
xi
B
Value
Characteristic
Type
Table 3 (continued)
mol/kg
g
g
g/mol
g
mol/kg
mol/kg
mol/kg
mol/kg
mol/kg
mol/kg
Unit mol/kg mol/kg mol/kg mol/kg mol/kg mol/kg
3.77 × 10⁻⁵ 10−7
1.00 × 10⁻² 10−3
1.86 × 10⁻⁷ 10−8
g g mol/kg
5.00 × 10⁻²
7.78 × 7.78 × 10−5
g/mol
2.20 × 10⁻³ 10−5
g
7.78 × 10⁻⁵
1.65 ×
1.00 ×
9.94 ×
Unit
ui
Uncertainty
R
R
R
R
R
R
R
R
R
R
R
Distribution
2.93 × 1
1.21 × 10⁻³
10−4
3.72 × 10⁻⁵
25.0
1
1
1
1
1
10.4
ci
%/(mol/kg)
%/g
%/g
%/(g/mol)
%/g
%/(mol/kg)
%/(mol/kg)
%/(mol/kg)
%/(mol/kg)
%/(mol/kg)
%/(mol/kg)
Unit
Sensitivity coefficient
1.65 ×
2.28 ×
5.00 × 10−2
9.43 × 10⁻⁸
10−8
8.18 × 10⁻⁸
1.95 × 10⁻³
10−8
1.86 × 10⁻⁷
1.00 × 10⁻³
1.00 × 10⁻²
9.94 × 10⁻⁷
3.92 × 10⁻⁴
c i ui
Product
∞
∞
∞
∞
∞
∞
∞
∞
∞
∞
∞
νι
(continued)
%
%
%
%
%
%
%
%
%
%
%
Unit
64 A. Yu. Shimolin
0.091 0.18
Absolute combined standard uncertainty, uc , %
Absolute expanded uncertainty (k = 2; P = 0.95), U, %
%
%
%
%
0.051
Unit
0.075
g/g
%/(g/g)
c i ui
Product
Type B absolute standard uncertainty, uB , %
0.99964
3.94
Unit
Type A absolute standard uncertainty, uA , %
R
ci
Sensitivity coefficient %
g/g
3.00 × 10⁻⁴
Distribution
%
Unit
ui
Uncertainty
99.968
Unit
Certified value
AKIO3
B
xi
Value 1.18 × 10⁻³
Characteristic
Type
Table 3 (continued)
∞
νι
Caffeine Quantification Via High-Precision Coulometric Titration 65
66
A. Yu. Shimolin
Table 4 Results of measuring caffeine mass fraction in caffeine via HPLC by means of GVET 208-1 Number of the measurement
Caffeine mass fraction in caffeine, %
1
99.970
2
99.971
3
99.972
4
99.972
5
99.969
Average mass fraction of caffeine, A, %
99.97
Type A absolute standard uncertainty, uA , %
0.0005
Type B absolute standard uncertainty, uB , %
0.199
Absolute combined standard uncertainty, uc , %
0.4
Absolute expanded uncertainty (k = 2; P = 0.95), U, %
0.8
The standard deviation of measurement results obtained for samples at the level of 0.05% indicates sufficient completeness of iodine extraction, completeness of precipitation, degree of filtration, as well as minimization of errors associated with aliquot sampling and the influence of atmospheric oxygen. The accuracy indices of the developed procedure exceed those of widely used anhydrous titration procedures (0.3%) [9], as well as significantly exceeding those of the described iodometric procedures (0.9%) [9]. Thus, the developed procedure for determining caffeine mass fraction in caffeine via coulometric titration can be applied in the development of a caffeine composition RM of for metrological support of HPLC measurements.
Conclusion Due to the wide application of high-performance liquid chromatographs in various industries, it is essential to establish and control their metrological characteristics. For verification, calibration, type approval tests, as well as for the construction of calibration characteristics for liquid chromatographs and accuracy control of measurement procedures during their use, the most convenient means of metrological support are reference materials for the composition of pure substances and their solutions with SI-traceability. In the study, a procedure for measuring caffeine mass fraction in caffeine via coulometric titration was developed and tested. The following metrological characteristics were determined for the developed procedure: caffeine mass fraction measurement range—97.00–99.99%; expanded uncertainty (P = 0.95; k = 2) – 0.18%, which in terms of accuracy is 2–6 times better than the used titration-based procedures. Another advantage of the described procedure consists in avoiding the need to use
Caffeine Quantification Via High-Precision Coulometric Titration
67
reagents that have to be taken into special account (precursors). A comparison of the obtained results with caffeine mass fraction measurements performed using HPLC confirmed the commutativity of coulometric titration and HPLC, which allows coulometric titration to be used for the development of caffeine composition RMs for the metrological support of HPLC. The article proves the theoretical possibility of using coulometric iodometric titration for high-precision quantification of pure purines. The developed procedure of caffeine quantification in caffeine via primary coulometric titration employing GET 176 can be used to develop a caffeine composition RM and to provide metrological traceability of HPLC measurements on its basis to state primary standards reproducing the “mass fraction of components” and SI units. Acknowledgements The study was funded by UNIIM—Affiliated Branch of the D. I. Mendeleyev Institute for Metrology. The authors express their gratitude and deep appreciation to staff from the Laboratory of Moisture Measurement and Reference Materials of UNIIM for measuring caffeine mass fraction via HPLC by means of GVET 208-1. Contribution of the Authors Morozova V. V.—writing a draft of the article, conducting research, preparing and creating visual materials; Kulyabina E. V.—management of research work, development of the research concept, development of methodology; Morozov V. Yu.—formal analysis, data curation; Kulyabina T. V.—revision of the text, validation and control of measurements. Conflict of Interest The article was prepared on the basis of a report presented at the V International Scientific Conference “Reference Materials in Measurement and Technology” (Yekaterinburg, September 13–16, 2022). The article was admitted for publication after the abstract was revised, the article was formalized, and the review procedure was carried out. The version in the Russian language is published in the journal “Measurement Standards. Reference Materials” 2023;19(4):115–127. (In Russ.). https://doi.org/10.20915/2077-1177-2023-19-4115-127.
References 1. Order of the Ministry of Industry and Trade of the Russian Federation “On approval of the procedure for verification of measuring instruments, requirements for the verification mark and the content of the verification certificate” No. 2510 of 31.07.2020. Available via Official Internet portal of legal information. http://publication.pravo.gov.ru/Document/View/000120 2011230010. Accessed 8 Aug 2022 (in Russian) 2. Federal Law “On ensuring the uniformity of measurements” No. FZ-102 of 26.06.2008. Available via Official Internet portal of legal information. http://pravo.gov.ru/proxy/ips/?docbody=& firstDoc=1&lastDoc=1&nd=102122832. Accessed 8 Aug 2022 (in Russian) 3. Richter W (1997) Primary methods of measurement in chemical analysis. Accred Qual Assur 2:354–359. https://doi.org/10.1007/s007690050165 4. Turusova EV, Nasakin OE (2022) The application of photo-generated iodine for quantitative determination of caffeine in medicines. Russ J Biopharmaceut 14(4). https://doi.org/10.30906/ 2073-8099-2022-14-4-33-38 5. GOST 29148-97 (2010) Natural instant coffee. Specifications. Interstate Council for Standardization, Metrology and Certification, Minsk, 16 p (in Russian)
68
A. Yu. Shimolin
6. Vorontsova OS (2015) Comparative analysis of methods for caffeine determination in coffee, soluble coffee and energy drinks. Zdorove i okruzhajushhaja sreda 25–2:193–196 (in Russian) 7. Solov’eva SI, Serazhutdinova LD, Malyh MA, Dolgunina LV, Vasil’eva EV (2021) Comparative analysis of methods for determining caffeine in coffee. Kontrol’ kachestva produkcii. Available via Standards and quality. https://ria-stk.ru/mos/adetail.php?ID=8214. Accessed 8 Aug 2022 (in Russian) 8. GF RF XIV FS.2.1.0116.18 (2018) State Pharmacopoeia of the Russian Federation, XIV edn., 4 vols. Moscow. Available via Ministry of Health of the Russian Federation. https://minzdrav.gov.ru/poleznye-resursy/xiv-izdanie-gosudarstvennoy-farmakopei-ros siyskoy-federatsii. Accessed 8 Aug 2022 (in Russian) 9. Mjakinkov AG (2003) Determination of the caffeine content in tea and coffee by classical analytical methods. Referativnyj zhurnal 1:304 (in Russian) 10. Evlashenkova IV, Askalepova OI, Aleshina IG (2000) Determination of caffeine content in tea and coffee by classical analytical methods. Izvesti VUZov. Pishhevaja tehnologija 2–3:88–90 (in Russian) 11. Decree of the Government of the Russian Federation “On amendments to certain acts of the Government of the Russian Federation in connection with the improvement of control over the circulation of narcotic drugs, precursors of narcotic drugs and psychotropic substances” No. 665 of 02.07.2015. Available via Official Internet portal of legal information. http://pub lication.pravo.gov.ru/Document/View/0001201507100016?index=1&rangeSize=1. Accessed 8 Aug 2022 (in Russian) 12. Ma L (2002) Determination of the purity of potassium iodate by constant-current coulometry. Accred Qual Assur 7(4):163–167. https://doi.org/10.1007/s00769-002-0441-7 13. Toshiaki A, Mariko M, Tatsuhiko T (2007) Precise coulometric titration of sodium thiosulfate and development of potassium iodate as a redox standard. Talanta 73(2):346–351. https://doi. org/10.1016/j.talanta.2007.03.052 14. Shimolin AJ, Sobina AV, Zyskin VM (2017) Potassium iodate purity determination by high precision coulometric titration: New measurement procedure implementation. In: New measurement procedure implementation: collection of works 2nd international ural conference on measurements (UralCon), Chelyabinsk, 16–19 Oct 2017. IEEE, Chelyabinsk, 311–315. https://doi.org/10.1109/URALCON.2017.8120729 15. Sobina AV, Terentiev GI, Zyskin VM, Shimolin AY (2017) State primary standard based on coulometry GET 176–2013: role in the metrological support of analytical measurements and development prospects. In: 175 years of VNIIM im. DI. Mendeleev and the national system for ensuring the uniformity of measurements. International scientific and practical conference, St. Petersburg, 14–15 June 2017, abstracts, pp 92–93 16. Sobina A, Shimolin A, Sobina E, Tabatchikova T, Ortiz-Aparicio JL, Lara-Manzano JV et al (2020) Report of the CCQM-K152. Assay of potassium iodate Metrologia. Metrologia 58(1A):08005. https://doi.org/10.1088/0026-1394/58/1A/08005 17. Key Comparison Data Base. Calibrition and Measurement Capabilityes. Available via KCDB. https://www.bipm.org/kcdb/cmc/quick-search?includedFilters=&excludedFilters=& page=0&keywords=iodate+uniim. Accessed 8 Aug 2022 (in Russian) 18. Atomic weights of the elements 2019 (2021). Available via Queen Mary University of London. https://www.qmul.ac.uk/sbcs/iupac/AtWt. Accessed 8 Aug 2022 (in Russian) 19. Shimolin A, Sobina A (2022) Development of a reference material for the composition of potassium iodate. In: We are the future. I All-Russian scientific and practical conference of young scientists and specialists dedicated to the 180th anniversary of the All-Russian Research Institute of Metrology named after V. I. DI. Mendeleev, collection of theses of reports, Publ. Premium Press, St. Petersburg, pp 248–251 (in Russian) 20. Shokhinaa OS, Medvedevskikh MYu, Krashenininaa MP, Makarova SG, Krylovb AI, Tkachenkob IY et al (2017) Development of the state secondary measurement standard and certified reference materials for composition on the basis of liquid and gas chromatography. Measurement standards. Ref Mater 13(1):9–26 (in Russian). https://doi.org/10.20915/ 2077-1177-2017-13-1-9-26
Caffeine Quantification Via High-Precision Coulometric Titration
69
21. Perel’man VI (1963) Brief reference book of the chemist, 6th edn. Goskhimizdat, Moscow, 620 p (in Russian) 22. Asakai T, Hioki A (2015) Reliability in standardization of sodium thiosulfate with potassium dichromate. Microchem J 123:9–14. https://doi.org/10.1016/j.microc.2015.05.012 23. GOST 34100.3-2017/ISO/IEC Guide 98-3:2008. Uncertainty of measurement. Part 3. Guide to the expression of uncertainty in measurement. Standartinform, Moscow, 105 p (in Russian)
Primary Reference Procedure for Measuring the Mass Fraction and Molar Concentration of Copper and Zinc in Biological Materials by Isotope Dilution Mass Spectrometry Elena V. Vostroknutova , Tatiana N. Tabatchikova, Pavel V. Migal , Elena L. Lebedeva , Egor P. Sobina , Alena V. Sobina , and Marina F. Kuznetsova
Abstract This study describes the process of developing a primary reference procedure for measuring the mass fraction and molar concentration of copper and zinc in biological materials by isotope dilution mass spectrometry (ID-ICP-MS). In order to improve the measurement accuracy, optimal conditions for sample preparation and measurement were determined. Uncertainty sources were examined, with each source assessed in terms of its contribution to the uncertainty budget. The measurement range of copper and zinc mass fraction and molar concentration comprised from 1·10–6 to 1.5·10–3 % and from 2 to 20 μmol/dm3 , respectively. The relative expanded measurement uncertainties of copper mass fraction, zinc mass fraction, copper molar concentration, and zinc molar concentration were found to be equal to 7.1–7.5%, 8.9–9.2%, 8.8%, and 8.6%, respectively. The developed procedure can be used to establish metrological characteristics of reference materials (RMs) for the E. V. Vostroknutova (B) · T. N. Tabatchikova · P. V. Migal · E. L. Lebedeva · E. P. Sobina · A. V. Sobina · M. F. Kuznetsova UNIIM—Affiliated branch of the D. I. Mendeleyev, Yekaterinburg, Russia e-mail: [email protected] T. N. Tabatchikova e-mail: [email protected] P. V. Migal e-mail: [email protected] E. L. Lebedeva e-mail: [email protected] E. P. Sobina e-mail: [email protected] A. V. Sobina e-mail: [email protected] M. F. Kuznetsova e-mail: [email protected] © D. I. Mendeleyev Institute for Metrology 2024 E. P. Sobina et al. (eds.), Reference Materials in Measurement and Technology, https://doi.org/10.1007/978-3-031-49200-6_6
71
72
E. V. Vostroknutova et al.
composition of lyophilized blood serum and reconstituted lyophilized blood serum, to control the accuracy of measurement results obtained using other measurement techniques of similar quantities, and to carry out high-precision measurements of copper and zinc mass fraction and molar concentration for arbitration purposes in lyophilized blood serum and reconstituted lyophilized blood serum. Keywords Primary reference procedure · Lyophilized blood serum · Inductively coupled plasma mass spectrometry method · Isotope dilution method
Abbreviations DRC KED SPRP ID-ICP-MS FIF AMU AS RM
Dynamic reaction cell Kinetic energy discrimination State primary reference procedure Isotope dilution inductively coupled plasma mass spectrometry Federal Information Fund for Assuring Measurement Uniformity Assessment samples Reference material
Introduction One important field of medical research deals with the determination of those trace elements in the human body that ensure the processes of growth, hematopoiesis, respiration, metabolism, etc. Among the variety of such trace elements, only nine can be considered essential. This means that any deficiency in these elements or their imbalance may lead to clinical symptoms or significant changes in the state of human organs and systems. Copper and zinc are both essential elements. Copper is involved in iron metabolism, connective tissue formation, energy production at the cellular level, melanin production, nervous system maintenance. Zinc is a trace element necessary for normal cell growth and cell division, having a stabilizing effect on cell membranes and participating in antioxidant defense systems. Deficiency or excess of copper and zinc in the human body may cause or indicate pathological conditions. The deficiency of copper causes disorders associated with stunted growth, skin depigmentation, anemia, etc. However, its excess levels may harm the nervous and excretory systems, trigger allergic reactions, etc. Zinc deficiency results in stunting, dermatitis, infertility, immunodeficiency, and lymphoid tissue reduction. Measurements of copper and zinc contents are used to support the diagnosis of intoxications or occupational diseases, to assess copper and zinc balance, to identify their deficiency or excess states [1–21]. Accurately measured copper and zinc contents are informative markers at early clinical diagnostic stages.
Primary Reference Procedure for Measuring the Mass Fraction …
73
Trace element contents can be measured using atomic absorption spectrometry, inductively coupled plasma atomic emission spectrometry, inductively coupled plasma mass spectrometry, and inverse voltammetry [22–26]. As of 01.02.2022, the Federal Information Fund for Assuring Measurement Uniformity (FIF AMU),1 provides a list of approved (certified) measurement procedures. This list includes 10 reference measurement procedures for potassium, calcium, sodium, magnesium, and lithium in blood serum and blood plasma, as well as 18 certified reference procedures for measuring mercury, niobium, tantalum, rare-earth elements, aluminum, isotopes uranium-238, uranium-235, total uranium, thallium, lead, nickel, cadmium, beryllium, arsenic, selenium, bismuth, manganese, chromium, titanium, copper, zinc in various biological objects, including blood plasma, blood, urine, serum, red blood cell mass, etc. The relative error limits of the measurement procedures presented in both FIF AMU and available literature [23–26] range from 15 to 45% depending on the measurand. Foreign publications describe methods for measuring the content of mercury, lead, and cadmium in biological materials by neutron activation analysis, inductively coupled plasma mass spectrometry, including isotope dilution [27–29]. Leading metrological institutes use isotope dilution inductively coupled plasma mass spectrometry (ID-ICP-MS) for accurate determination of the content of such toxic metals, as lead, mercury, and cadmium [30]. The researchers in [29] found the characteristic relative expanded uncertainty of lead mass fraction measured by isotope dilution at 47.76 ng/g to be < 1% at P = 0.95 and k = 2. The work [27] described the method of cadmium determination in blood and serum samples and determined the relative expanded uncertainty of cadmium measurements to be < 1% at P = 0.95 and k = 2 for the mass fraction of 90.85 μg/kg, and < 10% at P = 0.95 and k = 2 for the mass fraction of 0.0468 μg/kg. It should be noted that isotope dilution, as one of the most high-precision methods, has been recognized as having the potential to be the primary method by the Consultative Committee for Amount of Substance (CCQM) [31]. This allows primary reference measurement procedures to be developed on its basis. An analysis of the FIF AMU list shows a lack of state primary reference procedures (SPRPs) for measuring copper and zinc in biological materials, which could provide a metrological basis for the creation of reference materials (RMs). The FIF AMU also lacks RMs for the composition of biological materials with certified characteristics of copper and zinc content. Therefore, it appears relevant to develop an SPRP for the content of copper and zinc that could provide the basis not only for characterization of RMs for the composition of biological materials, but also for ensuring reliability, objectivity, and comparability of measurement results in medical laboratory diagnostics. The ID-ICP-MS methods seems promising for the development of an SPRP on its basis.
1
Federal Information Fund for Ensuring the Uniformity of Measurements. Available via FIF EUM. https://fgis.gost.ru/fundmetrology/registry. Accessed 17 October 2022 (In Russ.).
74
E. V. Vostroknutova et al.
In this work, we aim to develop an SPRP for the content of copper and zinc based on the ID-ICP-MS method. To achieve this aim, the following objectives were formulated: to determine optimal sample preparation conditions, to evaluate the effect of matrix elements, to determine and optimize the conditions of mass spectrometry analysis, to correct the mass discrimination effect, to evaluate the metrological characteristics of the developed SPRP, and to confirm its accuracy.
Materials and Methods Measurement Method The ID-ICP-MS method is based on changing the natural isotope composition of the element under determination (measurand) in sample (x) by adding a known quantity of an RM with the isotope composition different from that found in nature (y), followed by measuring the isotope ratio in sample (x) and in the sample mixture with the additive (referred to as a spike) (b). Given the natural isotope composition of the element in the sample, the mass of the added nonnatural RM, and the mass of the sample, the mass fraction (molar concentration) of the measurand can be found using the following equation: ) ∑ ( K y1 · R y1 − K b1 · Rb1 K xi · Rxi m y Mx · ∑i Xx = Xy · · · · K − X bl , m x M y (K b1 · Rb1 − K x1 · Rx1 ) i K yi · R yi
(1)
where X y is the mass fraction (molar concentration) of the measurand in the RM solution with a modified isotope composition (hereinafter referred to as the spike), % (μmol/dm3 ); Mx is the molar mass of the measurand in the sample, g/mol; My is the molar mass of the measurand in the spike, g/mol; R y1 is the measured isotope ratio in the spike; Rb1 is the measured isotope ratio in the mixture of sample and spike; Rx1 is the measured isotope ratio in the sample; K x1 , K y1 , K b1 are correction coefficients of the isotope ratio in the sample, spike, and the sample and spike mixture, related to the mass discrimination effect; my is the spike mass, mg; mx is the sample mass, mg; ∑ Rxi is the sum of the measurand isotope ratio to the reference isotope i
∑
R yi
in the sample; is the sum of the measurand isotope ratio to the reference isotope
i
in the spike;
Primary Reference Procedure for Measuring the Mass Fraction …
i K X bl
75
is the number of isotopes of the measurand; is the sample dilution factor; is the mass fraction (molar concentration) of the measurand in a blank sample, % (μmol/dm3 ).
An isotope free from interferences is taken as the reference isotope of the element under determination. The index 1 refers to the variable isotope ratio when a spike is introduced in the sample. The main idea of the ID-ICP-MS method consists in measuring the isotope ratios R yi , Rbi , Rxi , which are shifted relative to the true value due to the mass discrimination effect. This effect is corrected by introducing the coefficients K xi , K yi , K bi for each isotope ratio. These coefficients are estimated on the basis of experimental data and data from isotope composition standards, as well as reference data on the natural isotope composition of elements [32].
Equipment and Materials The measurement procedure was developed using a Nexion 2000 inductively coupled plasma mass spectrometer (Perkin Elmer, USA) included in the GET 176-2019 state primary standard2 [33]. A distillacid BSB-939-IR acid purification system (Berghof, Germany) and a DVS-M/1H-2 combined membrane unit (NPK Mediana-Filter, Russia) for nitric acid and water preparation were used as auxiliary equipment. In order to implement the procedure based on the isotope dilution method, RMs with the following metrological characteristics were developed: • GSO 11931-2022 RM for the isotope composition of copper solution (Cu65-10): the range of permissible certified values of copper mass fraction from 0.9·10–3 % to 1.1·10–3 %, the permissible relative expanded uncertainty of the certified value of mass fraction (at k = 2, P = 0.95) not exceeding 0.5%; the range of permissible certified values of 63 Cu isotope fraction from 0.3% to 0.5%, the permissible expanded relative uncertainty of the certified value of 63 Cu isotope fraction (at k = 2, P = 0.95) not exceeding 10%; the range of permissible certified values of 65 Cu isotope atomic fraction from 99.5 to 99.7%, the permissible relative expanded uncertainty of the certified value of 65 Cu isotope atomic fraction (at k = 2, P = 0.95) not exceeding 0.1%; • GSO 11933-2022 RM for the isotope composition of zinc (Zn68-10): the range of permissible certified values of zinc mass fraction from 0.9·10–3 % to 1.1·10–3 %, the permissible relative expanded uncertainty of the certified value (at k = 2, P 2
GET 176-2019 State primary standard of units of mass (molar, atomic) fraction and mass (molar) concentration of components in liquid and solid substances and materials based on coulometry (includes 3 installations on the basis of constant current coulometry, controlled potential coulometry and inductively coupled plasma mass spectrometry): Custodian Institute UNIIM—Affiliated Branch of the D. I. Mendeleyev Institute for Metrology. Available via FIF EUM. https://fgis.gost.ru/fundme trology/registry/12/items/1382712. Accessed 17 October 2022 (In Russ.).
76
E. V. Vostroknutova et al.
= 0.95%) not exceeding 0.5%; the range of permissible certified values of 64 Zn isotope fraction from 0.1% to 0.6%, the permissible relative expanded uncertainty of the certified value of 64 Zn isotope fraction (at k = 2, P = 0.95%) not exceeding 10%; the range of permissible certified values of 66 Zn atomic fraction from 0.1% to 0.6%, the permissible expanded relative uncertainty of the certified value of 66 Zn atomic fraction (at k = 2, P = 0.95) not exceeding 10%; the range of permissible certified values of 67 Zn isotope fraction from 0.1% to 0.6%, the permissible relative expanded uncertainty of the certified 67 Zn isotope fraction (at k = 2, P = 0.95) not exceeding 10%; the range of permissible certified values of 68 Zn isotope atomic fraction from 98.0% to 99.0%, the permissible expanded relative uncertainty of the certified value of 68 Zn isotope atomic fraction (at k = 2, P = 0.95) not exceeding 0.1%; the range of permissible certified values of 70 Zn isotope fraction from 0.01% to 0.05%, the permissible relative expanded uncertainty of the certified value of 70 Zn isotope fraction (at k = 2, P = 0.95) not exceeding 20%. RMs for the composition of pure metal solutions in mineral acids were used as RMs of natural isotope composition: • GSO 10942-2017 RM for the composition of copper (Cu-1000) solution: the range of permissible certified values of Cu mass fraction from 800 to 1200 mg/kg, the range of permissible relative error of the certified mass fraction value (P = 0.95) within ± 0.5%, the permissible relative expanded uncertainty of the certified mass fraction (at k = 2, P = 0.95) not exceeding 0.7%; • GSO 11243-2018 RM for the composition of zinc (Zn-1000) solution: the range of permissible certified values of Zn mass fraction from 800 to 1200 mg/kg, the range of permissible relative error of the certified mass fraction value (P = 0.95) within ± 0.5%, the permissible expanded relative uncertainty of the certified mass fraction value (at k = 2, P = 0.95) not exceeding 0.7%.
Research Object The research object comprised lyophilized human serum produced by Vector-Best JSC, lyophilized fetal bovine blood serum produced by Biolot LLC, and reconstituted lyophilized human and fetal bovine blood serum.
Primary Reference Procedure for Measuring the Mass Fraction …
77
Results and Discussion Selection of Optimal Methodological Decisions Sample Preparation Conditions Lyophilized human and animal serum, as a rule, is readily soluble in water. However, its dissolution in water leads to a risk of incomplete extraction of the elements under determination. In order to select an optimal solvent, preliminary measurements of the mass fraction of copper and zinc in lyophilized human serum dissolved by two methods were carried out. Within the framework of the first method (acid decomposition), lyophilized blood serum weighing 0.3 g was placed in a polyethylene test tube followed by addition of 5 cm3 pre-purified concentrated nitric acid and incubation for 1 h. Subsequently, the test tube was exposed to 80 °C in a desiccator for 1 h followed by cooling and bringing the solution mass to 50 g by 1% nitric acid solution. For measurements, the obtained solution was five-fold diluted with 1% nitric acid solution. Within the framework of the second method (dissolution in water), lyophilized blood serum weighing 0.3 g was placed in a polyethylene test tube followed by addition of 5 cm3 deionized water and dissolution of the sample by small circular movements during 30 min. Upon visual inspection of the end of dissolution, the solution mass in the test tube was brought to 50 g by 1% nitric acid solution. For measurements, the obtained solution was five-fold diluted with 1% nitric acid solution. In the as-obtained solutions, the mass fraction of copper and zinc was measured by inductively coupled plasma mass spectrometry in the dynamic reaction cell (DRC) mode. The standard addition method was used for measurements. RMs for the composition of copper (GSO 10942-2017) and zinc (GSO 11243-2018) solutions were introduced as additives. Table 1 presents the measurement results of the mass fraction of copper and zinc by the most common naturally occurring isotopes for lyophilized blood serum samples prepared by the described two methods. Table 1 shows that acid decomposition is the most optimal method for preparing samples of lyophilized blood serum. In comparison with acid decomposition, the method of dissolution in water leads to underestimation of the measurement results of the mass fraction of copper and zinc. Table 1 Measurement results of the mass fraction of copper and zinc in lyophilized blood serum samples prepared by two different methods, i.e., acid decomposition and dissolution in water Element, mass of the isotope for which the mass fraction is measured
Measurand mass fraction, mg/kg Acid decomposition
Dissolution in water
63 Cu
9.44
8.32
64 Zn
9.64
8.15
78
E. V. Vostroknutova et al.
A preliminary mass spectrometry analysis by the Total Quant method showed that the main matrix elements in blood serum are sodium, magnesium, phosphorus, sulfur, and potassium. Table 2 shows the obtained results of measuring the mass fractions of matrix elements in lyophilized human and fetal bovine blood serum by the Total Quant method. The matrix elements of lyophilized serum can potentially form polyatomic ions that match the isotopes of the elements under study in terms of the m/z ratio. Table 3 summarizes the possible polyatomic ions formed from the matrix elements of lyophilized serum. In order to assess the effect of possible interference and matrix effects on the measurement results of copper and zinc contents, model solutions were prepared similar in composition to those of lyophilized blood serum samples under study. The mass fraction of copper and zinc comprised 9 μg/kg. The mass fraction of matrix elements varied across the range: sodium from 0 to 150 mg/kg, magnesium from 0 to 1 mg/kg, sulfur from 0 to 50 mg/kg, phosphorus from 0 to 2 mg/kg. A 1% nitric acid solution was used as a background. The mass fraction of elements in the prepared model solutions is given in Table 4. Measurements of the mass fraction of copper and zinc in model solutions were performed by linear graduation in different measurement modes of the inductively coupled plasma mass spectrometer, including the standard mode, dynamic reaction cell (DRC) mode, and kinetic energy discrimination (KED) mode. Table 2 Measurement results of the mass fraction of elements in lyophilized human and fetal bovine blood serum obtained by the Total Quant method Element
Na
Element mass fraction, mg/kg Lyophilized human blood serum
Lyophilized fetal bovine blood serum
24,246
43,839
Optimal dilution factor of lyophilized serum 800
Mg
162
426
700
P
672
1063
700
S
350
421
40
K
1050
6324
-
Ca
806
2244
-
Table 3 Possible polyatomic ions formed from the matrix elements of lyophilized serum
Polyatomic ion formation
Isotope under study
+ 40 Ar → 23 Na40 Ar+ 31 P + 16 O16 O → 31 P16 O16 O+
63 Cu
23 Na
25 Mg
+ 40 Ar → 25 Mg40 Ar+
+ 40 Ar → 24 Mg40 Ar+ + 16 O16 O → 32 S6 O16 O+
24 Mg 32 S
26 Mg
+ 40 Ar → 26 Mg40 Ar+
65 Cu 64 Zn 66 Zn
Primary Reference Procedure for Measuring the Mass Fraction …
79
Table 4 Mass fraction of elements in the prepared model solutions Mass fraction of the element, μg/kg
Model solution No
Cu
Zn
Na
Mg
S
P
Solution 1
9
9
0
0
0
0
Solution 2
9
9
30,000
200
10,000
400
Solution 3
9
9
60,000
400
20,000
800
Solution 4
9
9
120,000
800
40,000
1600
Solution 5
9
9
150,000
1000
50,000
2000
Figures 1 and 2 present the dependences of the measured value of the mass fraction of copper by 63 Cu isotope on the mass fraction of the sodium and phosphorus matrix elements, obtained in different measurement modes. It can be seen from Figs. 1 and 2 that an increase in the mass fraction of the sodium and phosphorus matrix elements leads to an increase in the mass fraction of copper by 63 Cu isotope in the standard mode of measurements. This is associated with the formation of polyatomic ions given in Table 4. The results obtained in the DRC and KED measurement modes are not affected by the increase in the mass fraction of sodium and phosphorus. Figure 3 shows the obtained correlation between the increase in the mass fraction of the magnesium matrix element and the copper mass fraction measured by 65 Cu isotope. Na 14
63Cu
mass fraction, μg/kg
13 12 11 10 9 8 7 6 0
20
40
60
80
100
120
140
Na mass fraction, mg/kg Standard mode
DRC
Fig. 1 Measurement results of copper mass fraction by fraction of the sodium matrix element
KED 63 Cu
9 μg/kg Cu
isotope as a function of the mass
80
E. V. Vostroknutova et al.
P
63Cu
mass fraction, µg/kg
14.0 13.0 12.0 11.0 10.0 9.0 8.0 0.0
0.2
0.4
0.6
0.8
1.0
1.2
1.4
1.6
1.8
2.0
P mass fraction, mg/kg Standard mode
DRC
Fig. 2 Measurement results of copper mass fraction by fraction of the phosphorus matrix element
65Cu
mass fraction, µg/kg
Mg
9 μg/kg Cu
KED 63 Cu
isotope as a function of the mass
12 11 10 9 8 7 6 0
0.2
0.4
0.6
0.8
1
Mg mass fraction, mg/kg Standard mode
DRC
Fig. 3 Measurement results of copper mass fraction by fraction of the magnesium matrix element
KED 65 Cu
9 μg/kg Cu
isotope as a function of the mass
It was found that, in the standard mode, an increase in the mass fraction of magnesium in a model solution from 0 to 1 mg/kg leads to a decrease in the mass fraction of copper measured by 65 Cu isotope. However, in the DRC and KED modes, the amount of magnesium has no significant effect on the mass fraction of copper by 65 Cu isotope. Therefore, a matrix effect manifested in the suppression of a signal
Primary Reference Procedure for Measuring the Mass Fraction …
81
18
Mg
64Zn
mass fraction, µg/kg
17 16 15 14 13 12 11 10 9 8 0
0.2
0.4
0.6
0.8
1
Mg mass fraction, mg/kg Standard mode
DRC
KED
9 μg/kg Zn
Fig. 4 Measurement results of zinc mass fraction by 64 Zn isotope as a function of the mass fraction of the magnesium matrix element
of the measurand isotope, 65 Cu in this case, is observed in the standard mode. As a consequence, the copper mass fraction measured by 65 Cu isotope decreases under an increase in the magnesium mass fraction. Figures 4 and 5 shows the correlation between an increase in the mass fraction of the magnesium matrix element and the mass fraction of zinc measured by 64 Zn and 66 Zn isotopes in different measurement modes. The DRC mode eliminates spectral overlaps on the 64 Zn and 66 Zn masses, thus reducing the matrix effect. In the DRC mode, an increase in the magnesium mass fraction in a model solution from 0 to 1 mg/kg is not significant when measuring the zinc mass fraction by 64 Zn and 66 Zn isotopes. Figure 6 shows the dependence of the zinc mass fraction by 64 Zn isotope on the mass fraction of the sulfur matrix element in different measurement modes. The DRC mode eliminates spectral overlaps on 64 Zn isotope under the sulfur mass fraction of < 20 mg/kg. When the sulfur mass fraction exceeds 20 mg/kg, the zinc mass fraction measured by 64 Zn isotope increases and the DRC mode ceases to be effective in eliminating spectral overlaps. Therefore, the mass fraction of the sulfur matrix element in the studied solution should not exceed 20 mg/kg. The dilution factor of the original lyophilized serum should be selected such that possible spectral overlaps and matrix effects be avoided. Otherwise, the results of isotope ratio measurements by the ID-ICP-MS method will be distorted. According to the conducted studies into spectral overlaps and matrix effects, the optimal dilution factors of the original lyophilized blood serum are presented in Table 2.
82
E. V. Vostroknutova et al.
Mg
16
66Zn
mass fraction, µg/kg
15 14 13 12 11 10 9 8 0
0.2
0.4
0.6
0.8
1
Mg mass fraction, mg/kg Standard mode
DRC
KED
9 μg/kg Zn
Fig. 5 Measurement results of zinc mass fraction by 66 Zn isotope as a function of the mass fraction of the magnesium matrix element
64Zn
mass fraction, µg/kg
S
18 17 16 15 14 13 12 11 10 9 8 0
10
20
30
40
50
60
S mass fraction, mg/kg Standard mode
DRC
KED
9 μg/kg Zn
Fig. 6 Measurement results of zinc mass fraction by 64 Zn isotope as a function of the mass fraction of the sulfur matrix element
As a result of the conducted studies, the following optimal sample preparation conditions were determined: (1) A weighted portion of lyophilized human serum is dissolved in pre-purified concentrated nitric acid followed by incubation for at least 1 h in a desiccator
Primary Reference Procedure for Measuring the Mass Fraction …
83
at 80 °C until termination of nitric oxide vapor release. Subsequently, working solutions for measurements in 1% nitric acid solution are prepared. (2) Reconstituted lyophilized blood serum is prepared by dissolving 0.6 g of lyophilized blood serum in 5.0 cm3 of deionized water followed by stirring until a homogeneous suspension is formed. Afterwards, aliquots are taken and working solutions in 1% nitric acid solution are prepared. The conducted investigation into the effect of matrix elements on analytes in different mass spectrometer modes found DRC to be the most optimal mode for measuring blood serum solutions. The DRC mode not only neutralizes possible overlaps, but also demonstrates sufficient sensitivity at low analyte concentrations. Matrix effects are reduced by diluting the sample by at least 800 times. The following solutions were prepared for subsequent measurements: (1) A sample solution in 1% nitric acid solution under the dilution factor of not < 800; (2) A sample solution with a spike: the mass fraction of the analyte from 6.0·10–7 to 3.0·10–5 % and that of the introduced spike were selected depending on the mass fraction (molar concentration) of the analyte in the sample solution; the amount of the spike was calculated from the basic equation of isotope dilution method (1) such that the isotope ratios 65 Cu/63 Cu and 68 Zn/64 Zn were close to unity. (3) A blank sample solution consisting of a solution of reagents in the same quantities as those used for preparing the sample solutions; (4) A blank sample solution with addition of RMs for the composition of copper and zinc (GSO 11931-2022 and GSO 11933-2022). All solutions were prepared using the gravimetric method. Selection and Optimization of Mass Spectrometry Conditions in the DRC Mode When selecting optimal conditions for measurements using a mass spectrometer in the DRC mode, the main parameters included the detection limit of copper and zinc, the relative standard deviation (RSD) in the measurements of the 65 Cu/63 Cu, 66 Zn/ 64 Zn, 67 Zn/64 Zn, 68 Zn/64 Zn, and 70 Zn/64 Zn isotope ratios, as well as the maximum intensity of the studied 63 Cu, 65 Cu, 64 Zn, 66 Zn, 67 Zn, 68 Zn, 70 Zn isotopes in model solutions and the studied solutions of lyophilized blood serum. The following parameters affecting the process of measurements in the DRC mode were investigated: reaction gas consumption, high-frequency voltage applied to the cell quadrupole (RPq), and the rate of argon flow through the atomizer. Ammonia was used as a reaction gas for operation of the mass spectrometer in the DRC mode. In order to establish the optimal flow rate of ammonia, the detection limits of copper and zinc were determined by measuring the mass fraction of copper and zinc by 63 Cu, 65 Cu, 64 Zn, 66 Zn, 67 Zn, 68 Zn, 70 Zn isotopes in 1% nitric acid solution by linear graduation. During the experiment, the ammonia flow rate was
84
E. V. Vostroknutova et al.
varied across the range of 0.1 to 1 cm3 /min. The detection limits of copper and zinc were determined for all isotopes at different ammonia flow rates by the 3σ criterion. The obtained results are presented in Figs. 7 and 8. In addition, the isotope ratios of 65 Cu/63 Cu, 66 Zn/64 Zn, 67 Zn/64 Zn, 68 Zn/64 Zn, 70 Zn/64 Zn in the working solution of lyophilized blood serum at different ammonia
Detection limit, LoD•108, %
1.2 1 0.8 0.6 65Сu 63Cu
0.4 0.2 0 0
0.15
0.3
0.45
0.6
0.75
Ammonia flow rate,
cm3/min
0.9
1.05
Fig. 7 Dependence of copper detection limits by 63 Cu and 65 Cu isotopes as a function of ammonia flow rate in the reaction cell
Detection limit, LoD•108, %
45 40 35 30
64Zn
25
66Zn
20
67Zn
15
68Zn
10
70Zn
5 0 0
0.15
0.3
0.45
0.6
0.75
Ammonia flow rate,
cm3/min
0.9
1.05
Fig. 8 Dependence of zinc detection limits by 64 Zn, 66 Zn, 67 Zn, 68 Zn, 70 Zn isotopes as a function of ammonia flow rate in the reaction cell
RSD of isotope ratio measurements, %
Primary Reference Procedure for Measuring the Mass Fraction …
85
50 45 40 35 30
65Сu/63Cu
25
66Zn/64Zn
20
67Zn/64Zn
15
68Zn/64Zn
10
70Zn/64Zn
5 0 0.15
0.35
0.55
Ammonia flow rate,
0.75
0.95
cm3/min
Fig. 9 Dependence of the RSD of isotope ratio measurements on the ammonia flow rate in the reaction cell
flow rates were measured. Figure 9 shows the dependence of the RSD of measurements of isotope ratios on the ammonia flow rate in the reaction cell. The optimum value of ammonia flow rate was determined to be 0.45 cm3 /min. Under this value, the lowest detection limits of copper and zinc for all isotopes and the lowest relative RSD of measurements of the 65 Cu/63 Cu, 66 Zn/64 Zn, 67 Zn/64 Zn, 68 Zn/64 Zn, 70 Zn/64 Zn isotope ratios are observed. In order to establish optimal values of high-frequency voltage applied to the cell quadrupole (RPq), the signal intensities of 63 Cu, 65 Cu, 64 Zn, 66 Zn, 67 Zn, 68 Zn, 70 Zn isotopes were measured in the working solution of lyophilized blood serum. The RPq value was varied from 0.1 to 0.9 V. Dependences of the signal intensity of 63 Cu, 65 Cu, 64 Zn, 66 Zn, 67 Zn, 68 Zn, 70 Zn isotopes on RPq values are shown in Fig. 10. Measurements of the isotope ratios of 65 Cu/63 Cu, 66 Zn/64 Zn, 67 Zn/64 Zn, 68 Zn/ 64 Zn, 70 Zn/64 Zn in the working solution of lyophilized blood serum at different RPq values were conducted. The dependence of the RSD of measurements of isotope ratios on the RPq value is shown in Fig. 11. The maximum signal intensity of 63 Cu, 65 Cu, 64 Zn, 66 Zn, 67 Zn, 68 Zn, 70 Zn isotopes is observed at RPq = 0.2 V. However, the minimum RSD of measurements of 65 Cu/ 63 Cu, 66 Zn/64 Zn, 67 Zn/64 Zn, 68 Zn/64 Zn, 70 Zn/64 Zn isotope ratios is observed at RPq = 0.3 V. Under this value, the output signal intensity decreases insignificantly compared to RPq = 0.2 V. For the isotope dilution method, the determining factor in selecting the optimum RPq value consists in the minimum value of the RSD of isotope ratio measurements. Thus, the optimum RPq value was determined to be 0.3 V.
86
E. V. Vostroknutova et al.
140000
Signal intensity
120000 100000
65Cu 63Сг
80000
64Zn 60000
66Zn 67Zn
40000
68Zn
20000
70Zn 0 0
0.2
0.4
0.6
0.8
RPq, В
RSD of measurements of isotope ratios, %
Fig. 10 Dependences of the signal intensity of 63 Cu, 65 Cu, 64 Zn, 66 Zn, 67 Zn, 68 Zn, 70 Zn isotopes on RPq values
30 25 20 65Cu/63Cu 66Zn/64Zn
15
67Zn/68Zn 10
68Zn/64Zn 70Zn/64Zn
5 0 0.1
0.2
0.3
0.4
0.5
0.6
0.7
0.8
0.9
RPq, В Fig. 11 Dependences of RSD of measurements of isotope ratios 65 Cu/63 Cu, 66 Zn/64 Zn, 67 Zn/64 Zn, 68 Zn/64 Zn, 70 Zn/64 Zn on RPq values
Primary Reference Procedure for Measuring the Mass Fraction …
87
14000
Signal intensity
12000 10000
65Cu 63Cu
8000
64Zn 6000
66Zn 67Zn
4000
68Zn
2000
70Zn 0 0.6
0.7
0.8
Argon flow,
0.9
1
1.1
dm3/min
Fig. 12 Dependence of the signal intensity of 63 Cu, 65 Cu, 64 Zn, 66 Zn, 67 Zn, 68 Zn, 70 Zn isotopes on the rate of argon flow through the atomizer
In order to estimate the effect of argon flow rate through the atomizer, the signal intensity of 63 Cu, 65 Cu, 64 Zn, 66 Zn, 67 Zn, 68 Zn, 70 Zn isotopes in the working solution of lyophilized blood serum was studied under the argon flow rate varied across the range from 0.6 to 1.0 dm3 /min. The results obtained are shown in Fig. 12. The isotope ratios of 65 Cu/63 Cu, 66 Zn/64 Zn, 67 Zn/64 Zn, 68 Zn/64 Zn, and 70 Zn/64 Zn were also studied in the working solution of lyophilized blood serum at different rates of argon flow. The results are shown in Fig. 13. As can be seen from Figs. 12 and 13, the optimum argon flow rate ranges between 0.96–0.98 dm3 /min. At this value, the maximum signal intensity from 63 Cu, 65 Cu, 64 Zn, 66 Zn, 67 Zn, 68 Zn, and 70 Zn isotopes and the minimum value of the RSD of the 65 Cu/63 Cu, 66 Zn/64 Zn, 67 Zn/64 Zn, 68 Zn/64 Zn, 70 Zn/64 Zn isotope ratios are observed. Table 5 summarizes the established optimal values for determination of copper and zinc mass fractions in lyophilized blood serum by mass spectrometry in the DRC mode. The parameters of plasma power and argon flow rate through the outer burner tube were taken from the manufacturer’ specification. Correction of Mass Discrimination Effect Mass discrimination is manifested in a decrease in the measurement sensitivity when moving from heavier to lighter isotopes, expressed as a bias in the measured isotope ratio relative to its true value. In addition to the mass discrimination effect, biases in measured isotope ratios also depend on the mass spectrometer settings [34, 35]. The following solutions were used to correct the mass discrimination effect:
E. V. Vostroknutova et al.
RSD of measurements of isotope ratios, %
88
25
20
65Zn/63Zn
15
66Zn/64Zn 10
67Zn/64Zn 68Zn/64Zn
5
70Zn/64Zn
0 0.6
0.7
0.8
0.9
1
1.1
1.2
Argon flow, cm 3/min Fig. 13 Dependence of the RSD of measurements of 65 Cu/63 Cu, 66 Zn/64 Zn, 64 Zn, 70 Zn/64 Zn isotope ratios on the rate of argon flow through the atomizer
67 Zn/64 Zn, 68 Zn/
Table 5 Mass spectrometry measurement parameters Parameter
Value
Plasma power, W
1350
Argon flow rate through the outer burner tube, dm3 /min Argon flow rate through the atomizer,
dm3 /min
16 From 0.96 to 0.98
High-frequency voltage applied to the cell quadrupole (RPq), B
0.3
Resolution, u
From 0.7 to 0.8
Atomizing chamber
Cyclone chamber
Ammonia flow rate into the reaction cell, cm3 /min
0.45
(1) A solution of RMs for copper (GSO 10942-2017) and zinc (GSO 11243-2018) with natural isotopic composition and the mass fraction of copper and zinc from 6.0·10–7 to 3.0·10–5 %. The isotope ratios of copper and zinc were calculated according to the natural isotopic composition of elements by IUPAC [32] using the expression Ristand =
Ai , Ar e f
(2)
where Ai is the atomic fraction of the i-th isotope according to IUPAC data [32]; Ar e f is the atomic fraction of the reference isotope.
Primary Reference Procedure for Measuring the Mass Fraction …
89
(2) Solutions of copper and zinc RMs with equimolar isotopic composition, which comprise a mixture of copper and zinc RMs with natural isotopic composition (GSO 10942-2017, GSO 11243-2018) and RMs for the isotopic composition of copper and zinc (GSO 11931-2022, GSO 11933-2022) (hereinafter the RM mixture). The amount of RM mixed solutions was calculated from the basic equation of the isotope dilution method such that the obtained isotope ratios for 65 Cu/63 Cu and 68 Zn/64 Zn isotope pairs in the resulting mixture were close to unity. (3) A solution of RMs for the isotopic composition of copper and zinc (GSO 119312022 and 11933-2022, respectively) with the mass fraction of copper and zinc from 6.0·10–7 to 3.0·10–5 %. The isotope ratios of copper and zinc were calculated according to the CRM data sheets and an expression similar to (2). Correction coefficients were established during measurements of the as-prepared solutions and calculated by the formula Ki =
Ristand + K bias , Rimsr
(3)
where Ristand is the actual value of i-th isotope ratio calculated by (2); for the RM mixture, Ristad was calculated by the basic equation of ID-ICP-MS (1); Rimsr is the i-th measured isotope ratio; K bias are the coefficients associated with the correction for the optimization of mass spectrometer operation parameters; in our calculations, K bias = 0 due to the conducted optimization of mass spectrometer operation parameters. The values of correction coefficients obtained from the measurement results of the RMs of natural isotopic composition were further applied to the measured values of isotope ratios in the samples. The values of the correction coefficient obtained from the measurement results of the RM mixture were applied to correct the bias of isotope ratios measured in the samples with a spike. The values of the correction coefficient obtained from the measurement results of the RM solution for isotopic composition were applied to correct the bias of isotope ratios in the blank sample with a spike. Measurement Procedure Figure 14 outlines the procedure of measurements using the isotope dilution method. In order to correct the effect of mass discrimination, the sequence of measurements of prepared solutions was designed as follows: (1) before and after measurements of isotope ratios in the sample and blank sample, isotope ratios were measured in a solution of RMs of natural composition; (2) before and after measurements of isotope ratios in the sample with a spike, isotope ratios were measured in the RM mixture solution; (3) before and after isotope ratios were measured in the blank sample with a spike, isotope ratios were measured in the spike solution.
90
E. V. Vostroknutova et al.
Fig. 14 Measurement procedure for the mass fraction and molar concentration of copper and zinc in biological materials (matrices)
Between the introduction of samples and solutions, the input system was flushed with a 1% nitric acid solution. The sequence of measurements started with measurements of isotope ratios in solutions of natural isotopic composition (sample solution, blank sample, solution of natural isotopic composition). Afterwards, isotope ratios were measured in equimolar mixtures (sample with spike, solution of equimolar isotope composition) and then in solutions with modified (enriched) isotopic composition (blank sample with spike, spike solution). The mass fraction of copper and zinc in lyophilized serum and the molar concentration of copper and zinc in reconstituted serum were calculated using expression (1). Accuracy Estimation The metrological characteristics of the developed measurement procedure were established following algorithms described in RMG 61–2010, GOST 34100.3–2017/ ISO/IEC Guide 98–3:2008 [36, 37]. Statistical data obtained by measuring the mass fraction and molar concentration of copper and zinc in assessment samples (AS) were used to estimate the random uncertainly component (type A measurement uncertainty). The relative total standard measurement uncertainty (uc ) is the sum of the type A (uA ) and type B (uB ) relative standard uncertainties: uc =
/
u 2A + u 2B ,
(4)
Primary Reference Procedure for Measuring the Mass Fraction …
91
The type A relative standard uncertainty is estimated based on measurements of the mass fraction and molar concentration of copper and zinc in AS obtained under conditions of inter-laboratory testing precision, i.e., at different times and by different operators. The type B relative standard uncertainty is estimated based on the equation of measurements (1) by the formula ┌ | m ∑ 100 | uB = cε2 · u 2ε , ·√ Xi ε=1
(5)
where cε is the sensitivity coefficient of Σ-th uncertainty component determined from the equation of measuring the mass fraction (molar concentration) of the measurand in a sample as a partial derivative of the function by Σ-th uncertainty component; u ε is the standard uncertainly of measuring the Σ-th equation component; X i is the arithmetic mean value of the mass fraction (molar concentration) of the measurand, % (μmol/dm3 ). Standard uncertainties of the mass fraction [u(X yi )] of the measurand in the spike are calculated from the relative expanded uncertainties of certified mass fraction given in the RMs data sheets for isotopic composition (GSO 11931-2022 and GSO 11933-2022) u(X yi ) =
U0 · X yi , 2 · 100
(6)
where U0 is the relative expanded uncertainty of the certified value of copper or zinc mass fraction at k = 2 and P = 0.95, %; X yi is the certified value of copper or zinc mass fraction in RMs for the isotopic composition of solutions, %. Standard weighing uncertainties (u(m)) are calculated from the data provided in the calibration certificates of the balances used. The molar weight of copper and zinc in the sample and in the spike are calculated as follows M=
∑
Mai · Ai ,
(7)
where Mai is the molar weight of the i-th isotope given in [32], g/mol; Ai is the atomic fraction of the i-th isotope given in [32] for natural isotopic composition or in the data sheets of RMs for the isotopic composition of copper and zinc solutions (GSO 11931-2022 and GSO 11933-2022). The standard uncertainty of the copper and zinc molar weight is estimated as
92
E. V. Vostroknutova et al.
┌ | n n ∑ |∑ u(M) = √ (Ai · u(Mai ))2 + (Mai · u(Ai ))2 , i=1
(8)
i=1
where u(Mai ) is the standard uncertainty of the molar weight of the i-th isotope given in [32], g/mol; u( Ai ) is the standard uncertainty of the atomic fraction the i-th isotope taken from the data sheets of RMs for the isotopic composition of copper and zinc solutions, or from [32]. Data on the atomic weights of the isotopes of various elements can be found in [32]. The standard uncertainties of the mass discrimination correction coefficients are calculated as follows /( )2 ( )2 1 Ristand · u(Ristand ) + − 2 · u(Rimsr ) + u(K bias )2 , (9) u(K i ) = Rimsr Rimsr where u(Ristand ) are the standard uncertainties of isotope ratios in the RM for the natural isotopic composition of copper solution and the RM for the enriched isotopic composition of copper solution, calculated as follows ┌ )2 ) |( )2 (( | 1 Ai √ u(Ristand ) = · u( Ai ) + − 2 · u(Ar e f ) , Ar e f Ar e f
(10)
where u( Ai ) is the standard uncertainty of the atomic fraction of the i-th isotope; u( Ar e f ) is the standard uncertainty of the atomic fraction of the reference isotope (63 Cu for copper and 64 Zn for zinc); u(Rimsr ) are the standard uncertainties of the measured isotope ratios, which are the standard deviation of the arithmetic mean of isotope ratio measurements. ┌ ) | 2 ( |∑ Rir ms − Rir ms 2 √ . u(Rir ms ) = n · (n − 1) j=1
(11)
where u(K bias ) = 0.001 is the standard uncertainty of correction for optimization of mass spectrometer operation parameters; j = 2 is parallel determinations of the i-th isotope ratio. The dilution factor of a lyophilized serum sample is calculated according to the sample preparation procedure K =
m r.0 m r.1 · , m0 m1
(12)
Primary Reference Procedure for Measuring the Mass Fraction …
93
where m 0 is the weight of the sample portion taken for the preparation of the initial sample solution, g; m r.0 is the weight of the initial sample solution, g; m 1 is the weight of an aliquot of the sample solution taken for dilution, g; m r.1 is the weight of the sample solution after dilution, g. The standard uncertainty of the dilution factor of a lyophilized blood serum sample was calculated as follows ┌ |( )2 ( )2 | 1 m r.1 | m · m · u(m r.0 ) + − mmr.02 · mmr.1 · u(m 0 ) 0 1 1 )2 ( 0 )2 , u(K ) = | (13) √ (m m r.0 m r.1 1 r.0 + m 0 · m 1 · u(m r.1 ) + − m 2 · m 0 · u(m 1 ) 1
where u(m r.0 ), u(m 0 ), u(m r.1 ), u(m 1 ) are standard uncertainties of weighing of sample portions and sample solutions, g. The sample dilution factor of a reconstituted lyophilized serum sample was calculated according to the sample preparation procedure K' =
m0 m r.1 · · 106 , V0 · Msti m 1
(14)
where m 0 is the weight of an aliquot of lyophilized serum solution taken for measurements, g; V0 is volume of an aliquot of reconstituted serum taken for measurements, cm3 ; m 1 is the weight of an aliquot of the solution taken for dilution, g; m r.1 is the weight of the diluted solution, g; Msti is the molar weight of copper and zinc in reconstituted serum, g/mol. The standard uncertainty of the dilution factor of the reconstituted lyophilized serum sample was calculated as follows ┌ |( )2 ( )2 | m r.1 m r.1 m0 1 | V ·M · · u(m + − · · u(V ) ) 0 2 0 m m V ·M 1 1 | (0 sti )2 ( 0 sti )2 ( ) | u K ' = 106 · | + m 0 · 1 · u(m r.1 ) + − m r.12 · m 0 · u(m 1 ) , | ( V0 ·Msti m 1 V ·M m 0 sti 1 ) √ + − mmr1·1 · V m·M0 2 · u(Msti ) 0
(15)
sti
where u(V0 ) are the standard uncertainties of measuring the selected aliquot volume, cm3 ; u(Msti ) is the standard uncertainty of the molar weight of the i-th element in the sample, calculated according to [32], g/mol. The mass fraction (molar concentration) of measurands in the blank sample was calculated based on the measured isotopic ratios in the blank sample and the blank sample with a spike, using the basic measurement equation of the isotopic dilution method. The evaluation of the uncertainty of measuring the mass fraction (molar
94
E. V. Vostroknutova et al.
concentration) in a blank sample was carried by analyzing the measurement equation in accordance with GOST 34100.3-2017/ISO/IEC Guide 98-3:2008 [37]. The relative standard uncertainty of measuring the mass fraction (molar concentration) of measurands in a blank sample comprised 45% (at P = 0.95). The expanded standard uncertainty of measurements of the mass fraction (molar concentration) of copper and zinc was calculated by the formula U = 2 · uc.
(16)
The relative expanded uncertainty of measurements of copper and zinc mass fraction in blood serum is calculated according to the formula Uo =
U · 100. Xi
(17)
Tables 6 and 7 present typical uncertainty budgets for measurements of copper and zinc mass fraction in blood serum. The maximum values from those presented in Table 8 are taken as the metrological characteristics of the developed state primary reference procedure (SPRP).
Confirmation of Highest Accuracy The highest accuracy of the developed SPRP was confirmed by its comparative analysis with similar SPRP produced in other countries, information about which is available in the database of the Joint Committee for Traceability in Laboratory Medicine (JCTLM). Foreign procedures for measuring the concentration of copper and zinc in biological objects included in the JCTLM database [38] were developed on the basis of neutron activation analysis, with the relative expanded uncertainty of measurements ranging from 2 to 10%. Table 9 presents information on such procedures registered in the JCTLM database. The highest accuracy of the developed SPRP was confirmed experimentally by the COOMET 849/RU/2021 comparisons “Pilot comparison to determine the content of metals in blood serum.” The comparison results were processed in accordance with the COOMET document R/GM/14:2006 “COOMET Recommendation. Guidelines for the evaluation of COOMET key comparisons data” [39] according to the COOMET protocol 849/RU/21. The conducted comparisons showed that the results obtained by the developed SPRP agree well with those obtained by other procedures at the same time as exhibiting the lowest uncertainty levels. The highest accuracy of measurements obtained using the SPRP for the mass fraction and molar concentration of copper and zinc in biological materials (matrices) is achieved and confirmed by: • the use of inductively coupled plasma mass spectrometry with isotope dilution as a measurement method. Isotope dilution has been recognized by the Consultative
Rx65/63
K y63/63
Measured 65/63 ratio in the sample
Mass discrimination correction for R y63/63 in the spike
Rx63/63
K x65/63
Mass discrimination correction for Rx65/63
MstCu
Rb65/63
Measured 65/63 ratio in the sample with the spike
Measured 63/63 ratio in the sample
K b65/63
Mass discrimination correction for Rb65/63
Molar weight of the measurand in the sample
R y65/63
Measured 65/63 ratio in the spike
R y63/63
K y65/63
Mass discrimination correction for R y65/63
K x63/63
135.104
mx
Sample weight
Measured 63/63 ratio in the spike
2.2492
m yCu
Spike weight
Mass discrimination correction for Rx63/63 in the sample
1.01105
X yCu
Component mass fraction in the spike
63.5460
1.0000
1.0000
1.0000
1.0000
0.4844
0.9193
1.1082
0.8855
49.773
2.12·10–5
0.000975
X Cu
Repetition
Value
Designation
Description
Uncertainty source
0.068
0
0
0
0
0.0078
0.0053
0.0055
0.0063
0.6755
0.0701
0.0001
0.00088 0.00167 − 0.00098 − 0.00098 0.00098 0.00098
− − − − − −
0.00002
− 0.00161
−
g/mol
− 0.00202
7.20·10–6
− −
− 4.04·10–8
−
0.0 1.6
0
0.0
0.0
0.0
20.0
7.2
13.7
19.5
7.5
0.004
0.0
0.0
2.9
27.0
(continued)
Contribution (%)
1.04·10–6
0
0
0
1.30·10–5
4.69·10–6
− 8.93·10–6
− 1.27·10–5
4.86·10–6
− 2.84·10–9
1.83·10–13
1.83·10–9
g
1.90·10–5
1.76·10–5
u ε · cε
2.51·10–10
g
1.0·10–4
1.000 46.101
cε
2.51·10–6
%
%
Unit of measurement
4.1·10–8
1.8·10–5
uε
Table 6 Uncertainly budget of measuring copper mass fraction in blood serum
Primary Reference Procedure for Measuring the Mass Fraction … 95
2.14·10–5 2.77·10–5 5.54·10–5 5.68
Type A standard uncertainly, uA
Type B standard uncertainly, uB
Total standard uncertainty, uC
Expanded uncertainly (k = 2 P = 0.95), U , %
Relative expanded uncertainty (k = 2 P = 0.95), Uo , %
− 3.79
−
− 1.04·10–9
− 2.36·10–7
− 865.44
%
u ε · cε − 1.69·10–7
cε − 0.00002
g/mol
Unit of measurement
1.76·10–5
0.287
865.437
K
Dilution factor
2.7·10–10
5.96·10–10
X blCu
Copper mass fraction in the blank sample
uε 0.011
M yCu
Molar weight of the measurand in the spike
Value 64.9212
Designation
Description
Uncertainty source
Table 6 (continued)
0.0
0.4
0.3
Contribution (%)
96 E. V. Vostroknutova et al.
0.80821 1.2474 0.8272
mx
K y68/64
R y68/64
K b68/64
Rx68/64
K y64/64
R y64/64
Mass discrimination correction for R y68/64
Measured 68/64 ratio in the spike
Mass discrimination correction for Rb68/64
Measured 68/64 ratio in Rb68/64 the sample with the spike
K x68/64
Sample weight
Mass discrimination correction for Rx68/64
Measured 68/64 ratio in the sample
Mass discrimination correction for R y64/64 in the spike
Measured 64/64 ratio in the spike 1.0000
1.0000
0.4391
126.118
2.1022
0
0
0.0022
0.0160
0.0062
0.00521
0.6306
0.0403
g
m yZn
Spike weight 0.000433
g
6.0·10–5
1.0117
X yZn
Component mass fraction in the spike 49.773
%
4.3·10–8
1.89·10–5
%
1.8·10–5
0.000998
Unit of measurement
X Zn
uε
Repetition
Value
Designation
Description
Uncertainty source
Table 7 Uncertainly budget of measuring zinc mass fraction in blood serum
1.000
2.97·10–6
1.44·10–6
6.56·10–4
0
0
5.57·10–6
− 4.01·10–6
− 6.42·10–4 3.48·10–4
− 5.17·10–6
2.83·10–8
4.49·10–8 − 9.91·10–4
1.08·10–7
− 4.45·10–9
3.03·10–8
1.15·10–6
1.80·10–5
u ε · cε
2.69·10–6
− 1.03·10–5
5.05·10–4
27.061
cε
0.00
0.00
2.70
10.44
7.50
9.68
0.05
0.20
0.01
0.06
2.16
33.67
(continued)
Contribution (%)
Primary Reference Procedure for Measuring the Mass Fraction … 97
0.4171 0.5585
0.1104
1.0000 0.9263
K y67/64
R y67/64
K x64/64
Rx64/64
K x66/64
Measured 67/64 ratio in the spike
Mass discrimination K y70/64 correction for R y70/64 . in the spike
R y70/64
Mass discrimination correction for R y67/64 in the spike
Measured 70/64 ratio in the spike
Mass discrimination correction for Rx64/64 in the sample
Measured 64/64 ratio in the sample
Mass discrimination correction for Rx66/64 in the sample
1.0000
0.0093
0.7625
R y66/64
Measured 66/64 ratio in the spike
1.1427
K y66/64
Mass discrimination correction for R y66/64 in the spike
Value
Designation
Description
Uncertainty source
Table 7 (continued)
0.0304
0
0
0.0006
0.0426
0.0021
0.0938
0.0038
0.0384
uε
Unit of measurement
cε 8.68·10–8
1.29·10–8 1.16·10–7
5.74·10–11 1.40·10–8
9.15·10–10 0
0 9.04·10–6
2.26·10–6
3.39 ·10–6 1.24·10–6
2.75 ·10–8 3.28 ·10–7
1.66·10–6 4.91·10–4
4.91·10–4 2.98·10–4
u ε · cε
16.93
0.00
0.00
0.00
0.03
0.00
0.22
0.02
0.16
(continued)
Contribution (%)
98 E. V. Vostroknutova et al.
2.24·10–5
Total standard uncertainty, uC
1.15·10–6 33·10–5
0.2873
Type B standard uncertainly B, uB
865.4370
3.31·10–7
− 1.57·10–6
− 8.65·102
3.60·10–6
7.82·10–6
− 1.61·10–7
2.40·10–10
4.85·10–6
0.62
2.94
0.30
6.74
0.00
0.94
0.43
2.32·10–7 5.02·10–7
1.62
8.62·10–7
4.85·10–6
2.58
(continued)
Contribution (%)
1.38·10–6
u ε · cε
− 7.53·10–6
cε
Type A standard uncertainly, uA
K
%
gol
g/mol
Unit of measurement
1.80·10–5
Dilution factor
Zinc mass fraction in the X bl Z n blank sample
My Z n
0.460
0.000049
1.81·10–9
0.0099
0.1035
4.11·10–9
Rx70/64
Measured 70/64 ratio in the sample
2.2506
0.0004
0.021
K x70/64
Mass discrimination correction for Rx70/64 in the sample
0.0900
0.0195
67.9000
Rx67/64
Measured 67/64 ratio in the sample
1.0517
0.0030
Molar weight of the component in the spike
K x67/64
Mass discrimination correction for Rx67/64 in the sample
0.6066
uε
65.3778
Rx66/64
Measured 66/64 ratio in the sample
Value
Molar weight of the Mst Z n component in the sample
Designation
Description
Uncertainty source
Table 7 (continued)
Primary Reference Procedure for Measuring the Mass Fraction … 99
Unit of measurement
cε
4.48
uε
Relative expanded uncertainty (k = 2 P = 0.95), Uo (%)
Value 4.47·10–5
Designation
Expanded uncertainly (k = 2 P = 0.95), U (%)
Description
Uncertainty source
Table 7 (continued) u ε · cε Contribution (%)
100 E. V. Vostroknutova et al.
Primary Reference Procedure for Measuring the Mass Fraction …
101
Table 8 Measurement range, accuracy parameters Research object
Measurand, unit of measurement
Measurement range Relative total standard uncertainty, u,l,0 , %
Relative expanded uncertainty at k = 2 and P = 0.95, U L,0 , %
Lyophilized human and fetal bovine blood serum
Copper mass fraction, %
From 1·10–6 to 5·10–5 inclusive
3.7
7.5
Above 5·10–5 up to 3.4 1.5·10–3 inclusive
6.9
From 1·10–6 to 5·10–5 inclusive
4.3
8.7
Above 5·10–5 up to 4.4 1.5·10–3 inclusive
8.8
Copper molar concentration, μmol/dm3
From 2 to 20 inclusive
4.1
8.3
Zinc molar concentration, μmol/dm3
From 2 to 20 inclusive
4.1
8.1
Zinc mass fraction, %
Reconstituted humn and fetal bovine blood serum
Table 9 Measurement procedures included in the database of the Joint Committee for Traceability in Laboratory Medicine (JCTLM) Procedure, country
Measurement method
Measurement range
Relative expanded measurement uncertainty, %
Registration in JCTLM
Radiochemical neutron activation analysis method for copper in blood serum (USA)
Radiochemical neutron activation analysis
From 100 ng/g to unlimited with dilution
From 3 to 10%
+
Radiochemical neutron activation analysis method for copper in whole blood (USA)
Radiochemical neutron activation analysis
From 100 ng/g to unlimited with dilution
From 3 to 10%
+
Instrumental neutron activation analysis method for zinc in blood serum (USA)
Radiochemical neutron activation analysis
From 100 ng/g to unlimited with dilution
From 2 to 10%
+
102
E. V. Vostroknutova et al.
Committee for Amount of Substance (CCQM) as the primary and highly accurate method in comparison with other measurement methods; • the use of state-of-the-art equipment that implements the method of inductively coupled plasma mass spectrometry with isotope dilution, i.e., a NexION 2000B mass spectrometer with inductively coupled plasma included in GET 176–2019; • the use of RMs for isotopic composition, as well as IUPAC reference data to account for the output signal drift and to calculate the correction coefficients of isotope ratios associated with the mass discrimination effect; • the involvement of highly-qualified personnel with large experience in the field of analytical chemistry and metrology, as well as in international key comparisons.
Conclusion The establishment and control of metrological characteristics of procedures used to determine trace elements in biological materials represents a relevant research task due to wide application of such measurements in medical laboratory diagnostics. The metrological assurance of comparability and traceability of measurement results in clinical medicine is carried out using RMs of biological materials characterized using high-precision measurement techniques. There is a lack of primary reference methods for measuring copper and zinc in biological materials, as well as RMs for the composition of biological materials with certified characteristics of copper and zinc content. In view of this, the authors aimed to develop and test a procedure for measuring copper and zinc contents based on the ID-ICP-MS method. The study included determination of optimal sample preparation conditions, evaluation of the effect of matrix elements, selection of optimal mass spectrometry measurement conditions, and accounting for the mass discrimination effect. Uncertainty sources were studied, with the contribution of each to the uncertainty budget being estimated. During characterization of the proposed procedure, the following metrological characteristics were determined: the measurement range of copper and zinc mass fraction from 1·10–6 to 1.5·10–3 %, the measurement range of copper and zinc molar concentration from 2 to 20 μmol/dm3 , the relative expanded uncertainty of copper mass fraction measurements from 7.1 to 7.5%, the relative expanded uncertainty of zinc mass fraction measurements from 8.9 to 9.2%, the relative expanded uncertainty of copper molar concentration measurements 8.8%, the relative expanded uncertainty of zinc molar concentration measurements 8.6%. The developed measurement procedure was approved as the state primary reference measurement procedure of copper and zinc mass fraction and molar concentration in biological materials (matrices) by the order of the Federal Agency on Technical Regulation and Metrology (Rosstandart) No. 2693 from 26.10.2022 and was further included in the FIF EUM. The practical significance of the obtained results consists in the possibility of applying the developed procedure for establishing the metrological characteristics of
Primary Reference Procedure for Measuring the Mass Fraction …
103
RMs for the composition of blood, controlling the correctness of measurement results obtained using other measurement techniques of similar quantities, performing highprecision measurements of copper and zinc mass fraction in blood serum in disputable situations. Acknowledgements The studies were carried out at UNIIM—Affiliated Branch of the D. I. Mendeleyev Institute for Metrology as part of the development work “Development of a reference complex for measuring the mass flow of cryogenic liquids; a set of state primary reference measurement procedures; reference installations and reference materials for metrological support of measurements in medical laboratory diagnostics; complex for metrological support of digital electrical substations.” All measurements were carried out using the equipment of UNIIM—Affiliated Branch of the D. I. Mendeleyev Institute for Metrology. Author Contributions Vostroknutova E. V.—collection of literature data, development of a research plan, analysis of experimental data, processing of results, calculation of the uncertainty of measurement results, design of the methodology text, preparation of materials for certification of the methodology, writing a draft of the article; Tabatchikova T. N.—obtaining experimental data, conducting research; Migal P. V.—calculation of the uncertainty of measurement results, revision of the text; Lebedeva E. L.—preparation of materials for certification of measurement procedure, revision of the text; Sobina E. P.—development of the research concept, supervision, revision of the text; Sobina A. V.—collection of literary data, editing of the text; Kuznetsova M. F.—collection of literature data. Conflict of Interest The article was prepared on the basis of a report presented at the V International Scientific Conference “Reference materials in measurements and technologies” (Yekaterinburg, September 13–16, 2022). The article was admitted for publication after the abstract was revised, the article was formalized, and the review procedure was carried out. The author Sobina E. P. are Editor of the book “Reference Materials in Measurement and Technology. RMMT 2022.” The version in the Russian language is published in the journal “Measurement Standards. Reference Materials” 2023;19(3):103–127 (In Russ.). https://doi.org/10.20915/2077-1177-2023-19-3103-127.
References 1. Turnlund JR (1998) Human whole-body copper metabolism. Am J Clin Nutr 67(5):960S-964S. https://doi.org/10.1093/ajcn/67.5.960S 2. Garza NM, Swaminathan AB, Maremanda KP, Zulkifli M, Gohil VM (2023) Mitochondrial copper in human genetic disorders. Trends Endocrinol Metab 34(1):21–33. https://doi.org/10. 1016/j.tem.2022.11.001 3. Wang P, Yuan Y, Ke X, Zhong H, Yang Y, Jin S et al (2021) Biological applications of coppercontaining materials. Bioactive Mater 6(4):916–927. https://doi.org/10.1016/j.bioactmat.2020. 09.017 4. Cunha TA, Vermeulen-Serpa KM, Grilo EC, Leite-Lais L, Brandão-Neto J, Vale SHL (2022) Association between zinc and body composition: an integrative review. J Trace Elem Med Biol 71:126940. https://doi.org/10.1016/j.jtemb.2022.126940 5. Kanwar A, Sharma A (2022) A review on role of zinc as a potent immunity boosting agent. Mater Today Proc 68(4):880–885. https://doi.org/10.1016/j.matpr.2022.06.423
104
E. V. Vostroknutova et al.
6. Nriagu J (2019) Zinc deficiency in human health. In: Encyclopedia of Environmental Health, 2rd edn, pp 489–499. Elsevier, Amsterdam. https://doi.org/10.1016/B978-0-12-409548-9.114 33-2 7. Karkischenko NN, Karkischenko VN, Lyublinskiy SL, Kapanadze GD, Shustov EB et al (2013) Role of microcells in the sports nutrition and safety of metalchelates. J Biomed 1(2):12–41 (in Russian) 8. Kamilova NM, Sadyhov NM, Aliev ChS (2016) Diagnostic and prognostic significance of studying the effect of zinc, copper and selenium on the state of human health. Biomedicina 4:71–77 9. Tanvir EM, Whitfield KM, Ng JC, Shaw PN (2020) Development and validation of an ICP-MS method and its application to determine multiple trace elements in small volumes of whole blood and plasma. J Anal Toxicol 44(9):1036–1046. https://doi.org/10.1093/jat/bkaa033 10. Bazié BSR, Compaoré MKA, Bandé M, Kpoda SD, Méda NBR, Kangambega TMO (2022) Evaluation of metallic trace elements contents in some major raw foodstuffs in Burkina Faso and health risk assessment. Sci Rep 12(1):4460. https://doi.org/10.1038/s41598-022-08470-z 11. Lau ATY, Tan HW, Xu YM (2017) Epigenetic effects of dietary trace elements. Curr Protoc Pharmacol 3:232–241. https://doi.org/10.1007/s40495-017-0098-x 12. Tabrez S, Khan MA (2022) Microbial biofertilizers and micronutrient availability. The role of zinc in agriculture and human health. Springer, Cham, p 461 13. Molenda M, Kolmas J (2023) The role of zinc in bone tissue health and regeneration—a review. Biol Trace Elem Res. https://doi.org/10.1007/s12011-023-03631-1 14. Roohani N, Hurrell R, Kelishadi R, Schulin R (2013) Zinc and its importance for human health: an integrative review. J Res Med Sci 18(2):144–157 15. Mandarano AH, McGargill MA (2022) Copper homeostasis is critical for T cell activation. J Immunol. https://doi.org/10.4049/jimmunol.208.Supp.166.08 16. Chen J, Jiang Y, Shi H, Peng Y, Fan X et al (2020) The molecular mechanisms of copper metabolism and its roles in human diseases. Pflugers Arch Eur J Physiol 472:1415–1429. https://doi.org/10.1007/s00424-020-02412-2 17. Matouke MM, Remawa AA, Ndaghu NN (2022) Copper, zinc, lead, cadmium contents and health hazard inference of consuming Pseudotolithus senegalensis (Valenciennes, 1833) from Usuma dam, Abuja, Nigeria. Sci African 17:e01354. https://doi.org/10.1016/j.sciaf.2022. e01354 18. Wang Y, Li H, Yuan X, Jiang Y, Xiao Z, Li Z (2022) Review of copper and copper alloys as immune and antibacterial element. Trans Nonferrous Metals Soc China 32(10):3163–3181. https://doi.org/10.1016/S1003-6326(22)66011-4 19. Senyushkina ES, Troshina EA (2020) The role of zinc in the synthesis and metabolism of thyroid hormones. Clin Exp Thyroidol 16(3):25–30 (in Russian). https://doi.org/10.14341/ket 12697 20. Nalyotov AV, Matsynin AN, Matsynina MA (2022) Zinc availability is an important indicator of human health. Health Food Biotechnol 4(3):12–18 (in Russian). https://doi.org/10.36107/ hfb.2022.i3.s147 21. Parakhonsky AP (2015) The role of copper in the body and the importance of its imbalance. Nat Human Stud 10(4):73–94 (in Russian) 22. Ke Q, Costa M, Kazantzis G (2007) Chapter 10—Carcinogenicity of metal compounds. In: Gunnar FN et al (eds) Nordberg handbook on the toxicology of metals. Academic Press, New York, pp 177–196. https://doi.org/10.1016/B978-012369413-3/50065-3 23. Andrusishina IN, Lampeka EG, Golub IA, Ermakova OV, Straub OV, Ermakova OV (2011) Spectral methods for assessing the content of macro- and microelements in human biological media in the norm. Trace Elem Med (Moscow) 12(3–4):35–42 (in Russian) 24. Skiba TV, Tsygankova AR, Borisova NS (2016) Direct determination of heavy metals (Cu, Pb, Cd, Zn) in whole blood and ejaculate of bulls by stripping voltammetry using thick-film modified graphite electrodes. In: Analytics of Siberia and Far East: Proceedings of the Xth All-Russian Scientific Conference with International Participation, 12–17 September 2016, Barnaul, Russia Altai State University, Barnaul, p 86 (in Russian)
Primary Reference Procedure for Measuring the Mass Fraction …
105
25. Irnius A, Speièienë D, Pajenèkovskytë K, Tautkus S, Kazlauskas R, Kareiva A (2005) Rapid quantitative determination of metals in blood and liver by FAAS. Chemija 16(3–4):29–33 26. Kim H-J, Lim H-S, Lee K-R, Choi M-H, Kang NM, Lee ChH et al (2017) Determination of trace metal levels in the general population of Korea. Int J Environ Res Public Health 14(7):702. https://doi.org/10.3390/ijerph14070702 27. Murphy KE, Long SE, Vocke RD (2007) On the certification of cadmium at trace and ultratrace levels in standard reference materials using ID ICP-MS. Anal Bioanal Chem 387(7):2453– 2461. https://doi.org/10.1007/s00216-006-0880-9 28. Christopher SJ, Long SE, Rearick MS, Fassett JD (2001) Development of isotope dilution cold vapor inductively coupled plasma mass spectrometry and its application to the certification of mercury in NIST standard reference materials. Anal Chem 73(10):2190–2199. https://doi.org/ 10.1021/ac0013002 29. Murphy KE, Paulsen PJ (1995) The determination of lead in blood using isotope dilution inductively coupled plasma mass spectrometry. Fresenius J Anal Chem 352:203–208. https:// doi.org/10.1007/BF00322327 30. Murphy KE, Guthrie WF, Vetter TW, Turk GC, Palmer ChD, Lewis ME et al (2009) Comparison of clinical methods with isotope dilution inductively coupled plasma mass spectrometry for the new standard reference material 955c lead in caprine blood. J Anal Atom Spectrom 24:1170– 1178. https://doi.org/10.1039/B903060C 31. Ellison SLR, Williams A (eds) (2012) Eurachem/CITAC guide: quantifying uncertainty in analytical measurement, 3rd edn. www.eurachem.org. Accessed 22 Apr 2022 (in Russian) 32. Atomic Masses (2022) In: CIAAW of IUPAC. Available via CIAAW. http://www.ciaaw.org/ atomic-masses.htm. Accessed 22 Apr 2022 (in Russian) 33. Zyskin VM, Shimolin AI, Sobina AV, Terentiev GI (2016) Bating a reference installation based on controlled-potential coulometer method in the frame of improving the state primary standard GET 176 and its measurement capabilities. Ref Mater (2):44–54 (in Russian). https://doi.org/ 10.20915/2077-1177-2016-0-2-44-54 34. Meija J, Mester Z (2008) Paradigms in isotope dilution mass spectrometry for elemental speciation analysis. Anal Chim Acta 607(2):115–125. https://doi.org/10.1016/j.aca.2007. 11.050 35. Rodríguez-González P, Marchante-Gayón JM, Alonso JIG, Sanz-Medel A (2005) Isotope dilution analysis for elemental speciation: a tutorial review. Spectrochim Acta Part B 60(2):151–207. https://doi.org/10.1016/j.sab.2005.01.005 36. RMG 61-2010 (2013) State system for ensuring the uniformity of measurements. Accuracy, trueness and precision measures of the procedures for quantitative chemical analysis. Methods of evaluation. Standartinform, Moscow, p 61 (in Russian) 37. GOST 34100.3-2017/ISO/IEC Guide 98-3:2008 (2018) Uncertainty of measurement. Part 3. Guide to the expression of uncertainty in measurement. Standartinform, Moscow (in Russian) 38. JCTLM Database: higher-order reference materials, methods and services. Available via JCTLM. https://www.jctlmdb.org/#/app/search. Accessed 22 Apr 2022 39. COOMET R/GM/14:2006 Guidelines for the evaluation of COOMET key comparison data. Available via COOMET. http://www.coomet.org/RU/doc/r14_2006.pdf. Accessed 22 Apr 2022 (in Russian)
Molecular Diagnostics of Oncological Disease: Prospects for the Development of a Reference Material for the HER2 Gene Content Maxim S. Vonsky , Andrei L. Runov , Tatyana S. Goryachaya , Anna M. Koltsova , Elena V. Kurchakova , Vladimir D. Nazarov , Sergey V. Lapin , Alexandra V. Mazing , and Vladimir L. Emanuel
Abstract The development of oncological pathologies is closely related to various genomic rearrangements. Studies of DNA isolated from a patient’s biological material, as well as identification and determination of the content of nucleotide sequences acting as cancer biomarkers, can be used to determine genetic factors in cancer development, provide early diagnosis, determine a treatment strategy, monitor it, and confirm the patient’s recovery. The study aims to develop the main approaches to the design of DNA reference materials (RMs) on the example of an HER2 RM to provide metrological support for the molecular diagnostics of oncological pathologies. To that end, a procedure was developed for determining HER2 gene copy number via the digital PCR method. The study demonstrated a repeatability of measurements for the results obtained according to the developed procedure and those obtained using an MLPA commercial kit with human biological material samples. Five permanent tissue cultures were characterized in terms of the copy number ratios of HER2 to CEP17 and RPPH1 sequences. A tissue culture with HER2 gene amplification was identified. The obtained results will be used to create an RM for the copy number ratio of HER2 to RPPH1 and CEP17.
M. S. Vonsky (B) · A. L. Runov · T. S. Goryachaya · E. V. Kurchakova D. I. Mendeleyev Institute for Metrology, Saint Petersburg, Russia e-mail: [email protected] A. L. Runov e-mail: [email protected] E. V. Kurchakova e-mail: [email protected] T. S. Goryachaya · A. M. Koltsova Institute of Cytology of the Russian Academy of Sciences, Saint Petersburg, Russia V. D. Nazarov · S. V. Lapin · A. V. Mazing · V. L. Emanuel Pavlov First Saint Petersburg State Medical University of the Ministry of Health of the Russian Federation, Scientific and Methodological Center for the Russian Health Ministry on Molecular Medicine, Saint Petersburg, Russia © D. I. Mendeleyev Institute for Metrology 2024 E. P. Sobina et al. (eds.), Reference Materials in Measurement and Technology, https://doi.org/10.1007/978-3-031-49200-6_7
107
108
M. S. Vonsky et al.
Keywords Reference materials · Cancer diagnostics · Laboratory medicine · Nucleotide sequence · Sequence copy number
Abbreviations EGFR ISH IS WHO MALDI-TOF MS MLPA SI NGS WHO DNA BIPM NMI PCR qPCR dPCR ddPCR CCQM-NAWG
RNA RM CUC
Epidermal growth factor receptor In situ hybridization WHO international standards Matrix-assisted laser desorption/ionization time-of-flight mass spectrometry Multiplex ligation-dependent probe amplification International System of Units Next-generation sequencing World Health Organization Deoxyribonucleic acid International Bureau of Weights and Measures National metrological metrology institute Polymerase chain reaction Quantitative polymerase chain reaction Digital polymerase chain reaction Droplet digital polymerase chain reaction Working Group on Nucleic Acid Analysis of the Consultative Committee for Amount of Substance: Metrology in Chemistry and Biology Ribonucleic acid Reference material Common Use Center
Introduction According to the World Health Organization (WHO),1 cancer is the leading cause of death in the world, responsible for 16% of all deaths [1]. The National Cancer Institute (USA) defines cancer as a group of diseases characterized by uncontrolled growth and spread of abnormal cells. Cancer always associates with genetic alterations, complex changes at different levels of the genetic organization in malignantly transformed cells [2]. Such changes comprise various mutations that disrupt the primary DNA structure, gene copy number variation per genome and gene 1
World Health Organization. Available via WHO. https://www.who.int/news-room/fact-sheets/det ail/cancer. Accessed 14 October 2022 (In Russ.).
Molecular Diagnostics of Oncological Disease: Prospects …
109
activity alterations. It is true that malignant cell transformation manifests itself in the activation/hyperexpression of cancer-promoting oncogenes and the inactivation/suppressed expression of anti-oncogenes, tumor suppressor genes, whose quantitative parameters can be fully described using bioanalytical measurements. The specified changes involve nominal properties—nucleotide sequences and quantities, i.e., the copy number of certain nucleotide sequences or the copy number ratio of nucleotide sequences. A group of gene mutations is linked to inherited cancer predisposition. The risk of neoplasia in carriers of such mutations is significantly increased. For example, breast cancer is detected in approximately 13% of women throughout their lives. In women carrying mutant BRCA1 or BRCA2 (BRCA1/2) alleles, breast cancer is diagnosed in 55–72 and 45–69% of cases, respectively, by the age of 70–80 [3–5]. In addition, mutant BRCA1/2 allele carriers have an increased risk of developing prostate (up to 22.9% in men), stomach (up to 3.5% in the population), and pancreatic cancers (up to 3% in the population) [6]. A better understanding of mutations and their role in the etiology and pathogenesis of tumors led to the increased use of molecular genetic studies in diagnosing, preventing, and treating malignant neoplasms [7]. It is essential to identity genetic abnormalities when using new antitumor drugs that target specific molecular mechanisms underlying tumor onset and development. Such genetic abnormalities detected via the nucleotide sequence analysis act as biomarkers that provide a molecular portrait of the tumor, enabling personalized clinical treatment decisions. For example, the detection of certain EGFR (epidermal growth factor receptor) mutations in patients with non-small cell lung cancer helps to identify patients indicated for therapy with tyrosine kinase inhibitors [8]; the identification of KRAS mutations is required to individualize antibody treatment in colorectal cancer [9]. In molecular diagnostics there are various methods for genetic biomarker analysis, including polymerase chain reaction with end-point detection (PCR), real-time PCR, quantitative PCR (qPCR), digital PCR (dPCR), in situ hybridization (ISH), multiplex ligation-dependent probe amplification (MLPA), matrix-assisted laser desorption/ionization time-of-flight mass spectrometry (MALDI-TOF), targeted DNA sequencing (Sanger sequencing), and next-generation sequencing (NGS). Thus, it is crucial to ensure the reliability and comparability of measurement results obtained at different laboratories through different methods of molecular diagnostics at different times. In laboratory medicine, metrological traceability is key in ensuring the comparability and reliability of measurement results. Noteworthy is that in molecular diagnostics, traceability is primarily achieved by means of reference materials (RMs) of nucleic acids, DNA and RNA, certified for such characteristics as nucleotide sequence, copy number concentration, or copy number ratio. Presently, a limited number of reference materials are produced worldwide that can be used to transfer units to calibrators included in reagent kits for the molecular diagnostics of genetic tumor markers. For example, two RMs, including one certified reference material, are produced by the National Institute of Standards and Technology (NIST, USA), and five WHO international standards (IS WHO) are
110
M. S. Vonsky et al.
produced by the National Institute for Biological Standards and Control (NIBSC, UK). All the specified RMs are used to transfer the units of DNA sequence copy number ratio, i.e., NIST SRM 2373 [10] and RM 8366 [11]; IS WHO NIBSC 09/ 138, 16/120, 16/250, 18/118, and 18/130. Given that about 300 genetic biomarkers are involved in the diagnostics of cancer, it is imperative to ensure the metrological traceability of DNA sequence copy number measurements. Noteworthy is that high priority is given to measurement uniformity assurance in the molecular diagnostics of cancer by the Working Group on Nucleic Acid Analysis of the Consultative Committee for Amount of Substance: Metrology in Chemistry and Biology (CCQM-NAWG) [12]. For example, the CCQM-P1842 pilot study examined measurement capabilities for identifying mutations in BRAF and EGFR gene sequences and determining the ratio between the copy number of sequences carrying a mutation and the total copy number of these gene sequences. The study confirmed that the use of the dPCR method provides reliable, SI-traceable results of determining the content of genetic tumor markers. Breast cancer is one of the most common malignant pathologies in women worldwide [13]. About 20 to 30% of invasive breast cancers are characterized by an increase in the gene copy number (or gene amplification) of ERBB2 (HER2), i.e., human epidermal growth factor receptor 2. These types of tumors are the most aggressive, requiring special approaches to treatment [14, 15]. The HER2 gene is a proto-oncogene, whose amplification results in an increased expression level, which, in turn, triggers a signaling pathway promoting cell growth, proliferation and an aggressive tumor metastasis [16]. HER2 copy number measurements are essential for choosing the right treatment and drugs, as well as predicting the disease outcome. The crucial role of measuring HER2 gene copy number was noted by the International Bureau of Weights and Measures (BIPM): in 2021, the CCQM approved for the NAWG to conduct CCQM-K176 key comparisons aimed at confirming the capability of national metrology institutes (NMIs) to measure copy number ratios of HER2 to RPPH1 and CEP17 considered to be single-copy. This study is relevant since routine diagnostics often uses ISH methods to detect HER2 gene amplification, which enable the detection of chromosomal rearrangements with high sensitivity and specificity; however, these are essentially subjective expert evaluation methods having uncharacterized accuracy indices. As a reference single-copy gene, test systems applied in laboratory diagnostics often use genes whose copy number per genome may vary [17]. In order to improve the measurement accuracy of gene copy number ratio, routine laboratory diagnostics employs the qPCR method, a relative method that requires the use of calibrators. Thus, it is necessary to ensure the comparability of measurements performed at different laboratories using various methods of molecular diagnostics. 2
CCQM-P184 Copy number concentration and fractional abundance of a mutation (SNV: EGFR or INDEL: BRAF) mixed with wild-type DNA. Comparison Coordinator: National Measurement Institute and LGC Standards, UK. Available via BIPM. https://www.bipm.org/documents/20126/ 61272029/CCQM-P184.pdf/46956277-38bc-0cd8-5ffd-ea4fa67c421b?version=1.1&t=164310 0797100. Accessed 14 October 2022 (In Russ.).
Molecular Diagnostics of Oncological Disease: Prospects …
111
RMs intended for traceability assurance should be provided not only as pure DNA preparations, but also as matrix samples. In this case, it is essential to ensure the commutability of the RM matrix and the matrix of human biological material under study, taking into account the preparation specifics, such as fixation, dehydration, etc. The creation of such RMs requires the development of corresponding measurement capabilities, which is prioritized by the CCQM-NAWG. Pilot and key comparisons explored and confirmed the measurement capabilities for identifying mutations and measuring the copy number proportion of corresponding sequences, demonstrating that the dPCR method provides reliable, SI-traceable results of measuring the content of genetic tumor markers. The study aims to develop the main approaches to the creation of DNA RMs with SI-traceable assigned quantity value (DNA sequence copy number) for the metrological support of molecular cancer diagnostics on the example of the HER2 gene sequence as a biomarker of breast cancer aggressiveness. The study objectives are as follows: calculation of primers and probes to amplify the specific sequences of HER2, RPPH1, and CEP17; DNA isolation from biological material; optimization of the droplet digital PCR (ddPCR) performance; measurements of gene copy number concentrations; analysis of the comparability of measurement results obtained using the ddPCR and routine MLPA methods; determination of the HER2 gene sequence copy number in breast tumor tissue cultures, as well as the feasibility of creating RMs certified for the gene copy number ratios of HER2 to RPPH1 and CEP17.
Materials and Methods The study used cell cultures acquired from the Common Use Center (CUC) “Collection of Vertebrate Cell Cultures”3 of the Institute of Cytology RAS: HeLa S3 cervical cancer tissue culture [18] and five cultures obtained from breast tumors, which could contain an increased genome-wide HER2 gene copy number. The tissue culture was performed in accordance with the culture certificate and took no more than 4–6 passages. Prior to DNA isolation, the cellular biological material was tested for the presence of mycoplasmas via cytochemical methods as per the Pharmacopoeia of the Russian Federation (OFS.1.7.2.0031.15).4 The study also used formalin-fixed and paraffin-embedded samples of biological material from 12 patients diagnosed with breast cancer who were treated at the clinic of the Pavlov First Saint Petersburg State Medical University after giving their voluntary informed consent. 3
CUC “Collection of Vertebrate Cell Cultures” Federal State Budgetary Institution of Science Institute of Cytology of the Russian Academy of Sciences. Available via Community Center Collection of Vertebrate Cell Cultures. https://incras-ckp.ru/. Accessed 12 October 2022 (In Russ.). 4 OFS.1.7.2.0031.15 Test for the presence of mycoplasmas. Available via Pharmacopoeia.ru. https:// pharmacopoeia.ru/ofs-1-7-2-0031-15-ispytanie-na-prisutstvie-mikoplazm/. Accessed 16 October 2022 (In Russ.).
112
M. S. Vonsky et al.
Prior to DNA isolation, all human biological materials were assessed for the malignant tumor volume: tumor tissue comprised at least 70% of the total tissue volume. DNA was isolated from the tissue using the ExtractDNA FFPE kit (Evrogen JSC, Russia) according to the manufacturer’s instructions. The HER2 gene copy number was examined via the MLPA method using SALSA MLPA Probemix P078 Breast tumor (MRC-Holland, Holland) according to the manufacturer’s instructions. For dPCR studies, DNA was isolated from tissue cultures using a commercial DNeasy Blood and Tissue Kit (QIAGEN, Germany) in strict compliance with the manufacturer’s instructions. The purity and concentration of the isolated DNA were assessed spectrophotometrically with a BioSpec-nano instrument (Shimadzu, Japan). Following isolation and purification, the DNA was stored at − 70 °C, while avoiding repeated freeze-thawing. The copy number ratios of HER2 to the gene considered to be a single-copy gene in the human genome was calculated using dPCR measurement results. The measurements were performed with a prototype DNA measuring system that we developed to implement the method of ddPCR; this prototype was calibrated with the use of a human DNA quantitation standard (SRM 2372a, NIST, USA) [19, 20]. Primers and probes for the dPCR amplification were designed using the PrimerQuest© Tool (Integrated DNA Technology, USA). Table 1 presents primer and probe sequences, specifying the size of the amplified sequences (amplicons). Table 1 Primers and probes for the amplification of HER2, RPPH1, and CEP17 gene sequences Gene/sequence
Nucleotide sequence of primers/probe
Amplicon size (in base pairs)
5’-GGTGGCAAAGCAAAGCTATATTC-3’ 102 HER2-EXON4 NC_000017.11: 5’-CGTTTGTCCTGGCCATTCTA-3’ 39,694,639–39,695,571 5’-HEX-ACATGCAAAGCTACTCCCTGAGCA-BHQ1-3’ HER2-EXON16 5’-CCTCTTGGCATGGCTTCTC-3’ NC_000017.11: 5’-TGTAGGGAGAGGAAGAGTTCTG-3’ 39,715,445–39,716,387 5’-HEX-AAGGATGCCAAGGCAGGTAGGAC-BHQ1-3’
96
HER2-EXON24 5’-ATGAGCTACCTGGAGGATGT-3’ NC_000017.11: 5’-CCAGCCCGAAGTCTGTAATTT-3’ 39,724,733–39,725,827 5’-HEXTTGGGACTCTTGACCAGCACGTTC-BHQ1-3’
103
RPPH1 5’-CGGAGCTTGGAACAGACTCA-3’ 97 NC_000014.9: 5’-GGAGAGTAGTCTGAATTGGGTTATG-3’ 20,343,050–20,343,764 5’-FAM-CCTCACCTCAGCCATTGAACTCAC-BHQ1-3’ 5’-AAAGCCACAGGTAAGAAGTAGG-3’ CEP17 NC_000017.11: 5’-CTAGATCACGGCAGCAAGAG-3’ 26,981,721–26,983,000 5’-FAM-CTATTGCAGCACGTGGCACATGG-BHQ1-3’
97
Molecular Diagnostics of Oncological Disease: Prospects …
a
113
b
Fig. 1 Distribution of ddPCR products by fluorescence intensity for: a HER2 gene exon 4 sequences; b RPPH1 gene sequences
The synthesis of primers and probes was performed by Syntol company (Moscow, Russia). The ddPCR was carried out using a ddPCR mastermix for probes (BioRad Laboratories, USA). The ddPCR reactions were performed under the following conditions: pre-denaturation/enzyme activation at 95 °C for 10 min, followed by 60 cycles (94 °C for 30 s, 57 °C for 60 s) and the final stabilization at 98 °C for 10 min. The ddPCR results were analyzed using the QuantaSoft 1.7.4 software (Bio-Rad Laboratories, USA) in automatic and manual modes. The amplification conditions were optimized using purified DNA isolated from HeLa S3 cervical cancer tissue culture. This culture is one of the most common and well-studied model objects in cell biology; it was chosen for the presence of a gene set of interest in the genome. The distribution of ddPCR products by fluorescence intensity for HER2 exon 4 and RPPH1 genes sequences is shown in Fig. 1 (HER2 exon 4—Fig. 1a; RPPH—Fig. 1b).
Results and Discussion The developed procedure for measuring the copy number (the number of the gene sequence copies per genome) of the HER2 gene using the dPCR method was tested as part of the CCQM-K176 key comparisons, the report on which is under preparation. The correct choice of the primer/probe system was confirmed by the agreement between the copy number measurements of sequences belonging to different exons in the HER2 gene. An analysis of the comparison results confirmed the applicability of the developed procedure for measuring the HER2 copy number variation using the copy number ratios of HER2 to CEP17 and RPPH1. The relative standard uncertainty of measurements performed using the developed procedure did not exceed 6%, while the maximum expanded uncertainty amounted to 12% (k = 2).
114
M. S. Vonsky et al.
Table 2 Copy number ratios of HER2 to RPPH1 and CEP17 for samples of human biological material obtained via the MLPA and ddPCR methods Patient No. HER2/CEP17 Copy number (MLPA) ratio HER2/CEP17* (ddPCR) HER2/RPPH1* (ddPCR)
1
2
3
4
5
6
7
> 14
3
> 14
12
5.7 2.8 4
8
9
1.5 1
10
11
12
1
1
1
18.4 2.99 44.4 13.2 5.3 2.5 4.2 1.7 1.1 1.0 1.1 1.0 24.7 2.44 43.6 22.5 5.6 4.3 3.4 1.6 1.1 1.0 2.2 1.0
* Expanded uncertainty for the results obtained using the ddPCR method amounts to 12% (k = 2)
This study compares the results of measuring the HER2 copy number in the biological material of patients following the procedure that we tested as part of international key comparisons and the MLPA-based method used in clinical practice [21]. The measurement results obtained using the ddPCR and MLPA methods are shown in Table 2. Given that the sequence copy number is a counting quantity whose value, according to the SI Brochure: The International System of Units (BIPM),5 is expressed using the unit one, which is a neutral element of any system of units, the ratio of such quantities is expressed as a dimensionless quantity or simply as a number. In all cases, HER2-to-CEP17 copy number ratios obtained using the two techniques are in good agreement (i.e., MLPA values lie within the expanded uncertainty of 12% of the ddPCR values). It was shown that in four of twelve cases, the copy number ratio of HER2 to RPPH1 found on another chromosome differs from that to the CEP17 gene found on the same chromosome 17 (patients 1, 4, 6, and 11). This result confirms the literature data on genomic rearrangements, including on the increased copy number of extensive chromosome regions during a malignant transformation in breast cancer [22]. The demonstrated repeatability of results obtained via the ddPCR and MLPA methods, as well as a wider range of copy number ratios of HER2 to single-copy RPPH1 and CEP17, show the potential of the ddPCR method in the certification of RMs for the copy number ratios of gene sequences. Such RMs will be designed primarily to transfer the gene copy number ratio unit to calibrators included in medical devices for in vitro molecular genetic diagnostics, as well as to be used in clinical practice to calibrate routine procedures and for intralaboratory quality control. The development of DNA RMs certified for genetic abnormalities often requires solving the problem of obtaining renewable biological material. A possible solution to this problem lies in the use of in vitro cultured cell lines whose genetic material contains the required mutations. To examine the feasibility of creating an RM for the copy number ratio of the HER2 gene to the single-copy RPPH1 and CEP17 genes, five breast tumor cell tissue cultures were analyzed. Following in vitro tissue 5
International System of Units (SI). BIPM. Available VNIIM. https://www.vniim.ru/files/SI-2019. pdf. Accessed 10 October 2022 (In Russ.).
Molecular Diagnostics of Oncological Disease: Prospects …
115
culture growth, genomic DNA was isolated and purified as described above. The copy number ratios of the HER2 gene to the RPPH1 and CEP17 genes were measured using the ddPCR method. The measurement results indicate that the examined tissue cultures differ in the copy number content of HER2 gene sequences per genome: for three cultures, the copy number of the HER2 gene sequence remained within the norm, while one culture exhibited a twofold decrease in the HER2 gene copy number and another culture showed a significant increase in this parameter. In the latter case, the copy number ratios of HER2 to RPPH1 and CEP17 showed a significant difference (12.5 ± 1.5 and 8.5 ± 1.0, respectively), indicating that this cell culture underwent multiplication of the chromosome 14 containing the RPPH1 gene, as well as the chromosome 17 fragment where the HER2 gene is localized. The results we obtained on the example of measuring the HER2 gene copy number clearly demonstrate the possibility of using established tissue cultures as a source of renewable biological material for the creation of RMs designed for use in the molecular DNA diagnostics of oncological disease.
Conclusion The study has proposed and tested an approach to the creation of RMs designed to provide metrological support in molecular cancer diagnostics, which relies on the use of established cell cultures. A dPCR-based procedure was developed for measuring the HER2 gene copy number variation. For the developed procedure and the SALSA MLPA Probemix P078 Breast tumor commercial kit (MRC-Holland, Holland), a study examining 12 samples of biological material from breast cancer patients yielded repeatable results. The use of dPCR produced a wider HER2 copy number range as compared to MLPA results, which may inform clinical decisionmaking. Additional measurements of the HER2-to-RPPH1 copy number ratio were shown to reveal cases of genomic rearrangements associated with the increased copy number of the extensive chromosome 17 fragment containing the HER2 and CEP17 genes, at which the HER2-to-RPPH1 copy number ratio remains the same. Five established cell cultures from the CUC “Collection of Vertebrate Cell Cultures” were characterized in terms of the copy number ratios of HER2 to CEP17 and RPPH1. A cell line with HER2 gene amplification was identified. The obtained results will be used in the creation of an RM for the HER2 gene content. The certified values of the copy number ratios of HER2 to RPPH1 and CEP17 will be metrologically traceable to the state primary standard of the unit of DNA sequence copy number (under development). In the new state standard, the storage and transfer of the DNA sequence copy number unit will be realized using transfer standards—DNA reference materials, whose primary structure (nucleotide sequence) will be confirmed via target Sanger sequencing using a NANOFOR 05 genetic analyzer (Syntol, Russia). The theoretical significance of obtained results lies in the justification of applying human cell cultures derived from cancerous tumors as a renewable source of biological material for the creation of matrix RMs of DNA tumor biomarkers.
116
M. S. Vonsky et al.
The results of measuring the HER2 gene content in human cell cultures enable a potential unit transfer of the DNA sequence copy number ratio to calibrators included in medical devices for in vitro molecular genetic cancer diagnostics and intralaboratory quality control. Acknowledgements Cell cultures were provided by the CUC «Vertebrate Cell Culture Collection». The research was supported by the Ministry of Education and Science of the Russian Federation, Agreement № 075-15-2021-683. Contribution of the Authors Vonsky M. S.—development of the research concept, data curation, revision and editing of the text; Runov A. L.—research work, validation, verification, writing a draft version of the article; Gorjachaya T. S.—providing materials for research; Koltsova A. M.—providing materials for research; Kurchakova E. V.—research work; Nazarov V. D.—research work; Lapin S. V.—research work; Mazing A. V.—providing materials for research; Emmanuel V. L.—leadership, supervision, control. Conflict of Interest The article was prepared on the basis of a report presented at the V International Scientific Conference “Reference materials in measurements and technologies” (Yekaterinburg, September 13–16, 2022). The article was admitted for publication after the abstract was revised, the article was formalized and the review procedure was carried out. The version in the Russian language is published in the journal “Measurement Standards. Reference Materials” 2023;19(2):5–17. (In Russ.). https://doi.org/10.20915/2077-1177-2023-192-5-17.
References 1. Sung H, Ferlay J, Siegel RL, Laversanne M, Soerjomataram I, Jemal A et al (2021) Global cancer statistics 2020: GLOBOCAN estimates of incidence and mortality worldwide for 36 cancers in 185 countries. CA: A Cancer J Clin 71(3):209–249. https://doi.org/10.3322/caac. 21660 2. Loeb KR, Loeb LA (2000) Significance of multiple mutations in cancer. Carcinogenesis 21(3):379–385. https://doi.org/10.1093/carcin/21.3.379 3. Kuchenbaecker KB, Hopper JL, Barnes DR, Phillips K-A, Mooij TM, Roos-Blom M-J et al (2017) Risks of breast, ovarian, and contralateral breast cancer for BRCA1 and BRCA2 mutation carriers. JAMA 317(23):2402–2416. https://doi.org/10.1001/jama.2017.7112 4. Antoniou A, Pharoah PDP, Narod S, Risch HA, Eyfjord JE, Hopper JL et al (2003) Average risks of breast and ovarian cancer associated with BRCA1 or BRCA2 mutations detected in case series unselected for family history: a combined analysis of 22 studies. Am J Human Genetics 72(5):1117–1130. https://doi.org/10.1086/375033 5. Chen S, Parmigiani G (2007) Meta-analysis of BRCA1 and BRCA2 penetrance. J Clin Oncol 25(11):1329–1333. https://doi.org/10.1200/JCO.2006.09.1066 6. Li S, Silvestri V, Leslie G, Rebbeck TR, Neuhausen SL, Hopper JL et al (2022) Cancer risks associated with BRCA1 and BRCA2 pathogenic variants. J Clin Oncol 40(14):1529–1541. https://doi.org/10.1200/JCO.21.02112 7. Berger MF, Mardis ER (2018) The emerging clinical relevance of genomics in cancer medicine. Nat Rev Clin Oncol 15(6):353–365. https://doi.org/10.1038/s41571-018-0002-6 8. Haratani K, Hayashi H, Tanaka T, Kaneda H, Togashi Y, Sakai K et al (2017) Tumor immune microenvironment and nivolumab efficacy in EGFR mutation-positive non-small-cell lung cancer based on T790M status after disease progression during EGFR-TKI treatment. Ann Oncol 28(7):1532–1539. https://doi.org/10.1093/annonc/mdx183
Molecular Diagnostics of Oncological Disease: Prospects …
117
9. Cutsem EV, Lenz H-J, Köhne C-H, Heinemann V, Tejpar S, Melezínek I et al (2015) Fluorouracil, leucovorin, and irinotecan plus cetuximab treatment and RAS mutations in colorectal cancer. J Clin Oncol 33(7):692–700. https://doi.org/10.1200/JCO.2014.59.4812 10. He H-J, Almeida JL, Lund S, Steffen CR (2016) Development of NIST standard reference material 2373: genomic DNA standards for HER2 measurements. Biomole Detection Quantification 8:1–8. https://doi.org/10.1016/j.bdq.2016.02.001 11. He H-J, Das B, Cleveland MH, Chen L, Camalier CE, Liu L-C et al (2019) Development and interlaboratory evaluation of a NIST reference material RM 8366 for EGFR and MET gene copy number measurements. Clin Chem Lab Med 57(8):1142–1152. https://doi.org/10.1515/ cclm-2018-1306 12. Milavec M, Cleveland MH, Bae Y-K, Wielgosz RI, Vonsky M, Huggett JF et al (2022) Metrological framework to support accurate, reliable, and reproducible nucleic acid measurements. Anal Bioanal Chem 414(2):791–806. https://doi.org/10.1007/s00216-021-03712-x 13. Alkabban FM, Ferguson T (2022) Breast cancer. Treasure Island, StatPearls Publishing. Available via NIH. https://www.ncbi.nlm.nih.gov/books/NBK482286. Accessed 08 Nov 2022 14. Bose R, Kavuri ShM, Searleman AC, Shen W, Shen D, Koboldt DC et al (2013) Activating HER2 mutations in HER2 gene amplification negative breast cancer. Cancer Discov 3(2):224– 237. https://doi.org/10.1158/2159-8290.CD-12-0349 15. Iqbal N, Iqbal N (2014) Human epidermal growth factor receptor 2 (HER2) in cancers: overexpression and therapeutic implications. Mole Biol Int 852748. https://doi.org/10.1155/2014/ 852748 16. Moasser MM (2007) The oncogene HER2: its signaling and transforming functions and its role in human cancer pathogenesis. Oncogene 26(45):6469–6487. https://doi.org/10.1038/sj. onc.1210477 17. Lee K, Kim HJ, Jang MH, Lee S, Ahn S, Park YS (2019) Centromere 17 copy number gain reflects chromosomal instability in breast cancer. Sci Rep 9(1):17968. https://doi.org/10.1038/ s41598-019-54471-w 18. Scherer WF, Syverton JT, Gey GO (1953) Studies on the propagation in vitro of poliomyelitis viruses. IV. Viral multiplication in a stable strain of human malignant epithelial cells (strain HeLa) derived from an epidermoid carcinoma of the cervix. J Exper Med 97(5):695–710. https://doi.org/10.1084/jem.97.5.695 19. Zhu Y, Lu D, Lira ME, Xu Q, Du Y, Xiong J et al (2015) Droplet digital polymerase chain reaction detection of HER2 amplification in formalin fixed paraffin embedded breast and gastric carcinoma samples. Exper Mole Pathol 100(2):287–293. https://doi.org/10.1016/j. yexmp.2015.11.027 20. Romsos EL, Kline MC, Duewer DL, Toman B, Farkas N (2018) Certification of standard reference material 2372a; human DNA quantitation standard. NIST Special Publ: 260–189. https://doi.org/10.6028/NIST.SP.260-189 21. Stuppia L, Antonucci I, Palka G, Gatta V (2012) Use of the MLPA assay in the molecular diagnosis of gene copy number alterations in human genetic diseases. Int J Mole Sci 13(3):3245–3276. https://doi.org/10.3390/ijms13033245 22. Cousineau I, Belmaaza A (2011) EMSY overexpression disrupts the BRCA2/RAD51 pathway in the DNA-damage response: implications for chromosomal instability/recombination syndromes as checkpoint diseases. Mole Genet Genom 285(4):325–340. https://doi.org/10. 1007/s00438-011-0612-5
Application of Reference Materials in the Analysis of Medicinal Plant Raw Materials and Herbal Medicinal Products Tatyana K. Ryazanova
and Vladimir A. Kurkin
Abstract In order to improve the standardization of medicinal plant raw materials and herbal medicinal products, new approaches to the analysis of plant objects are required. We substantiate the use of reference materials (RMs) in the development of assay procedures using a number of plant raw materials as an example. Biologically active compounds contained in these materials are studied in terms of their chemical composition, stability, and physicochemical properties. Active substances were determined by HPLC-UV. The results were processed using WinASPECT and Microsoft Excel 2016. Assay procedures were developed and validated for determining syringin in Syringa vulgaris bark and Eleutherococcus senticosus rhizomes and roots; rosavin and salidroside in Rhodiola rosea rhizomes and roots; arbutin in Arctostaphylos uva-ursi and Vaccinium vitis-idaea leaves; isosalipurposide in Helichrysum arenarium flowers; anthracene derivatives in Aloe arborescens leaves. Spectrophotometric methods for determining the amount of biologically active phenylpropanoids in terms of eleutheroside B (syringin) in medicinal plant raw materials and herbal medicinal products of Eleutherococcus senticosus and the amount of aralosides in Aralia mandschurica roots were proposed. The feasibility of using the RMs of syringin, rosavin and salidroside, araloside ammonium salts, arbutin, aloins A and B mixtures in assay procedures was substantiated. Keywords Medicinal plant raw materials · Herbal medicinal products · Biologically active compounds · Reference materials · Standardization · High performance liquid chromatography · Spectrophotometry
T. K. Ryazanova (B) · V. A. Kurkin Samara State Medical University of the Ministry of Health of the Russian Federation, Samara, Russia e-mail: [email protected] V. A. Kurkin e-mail: [email protected] © D. I. Mendeleyev Institute for Metrology 2024 E. P. Sobina et al. (eds.), Reference Materials in Measurement and Technology, https://doi.org/10.1007/978-3-031-49200-6_8
119
120
T. K. Ryazanova and V. A. Kurkin
Abbreviations BACs HPLC MPRM HMP RM
Biologically active compounds High performance liquid chromatography Medicinal plant raw material Herbal medicinal product Reference material
Introduction Herbal medicinal products (HMPs) occupy a large share of the pharmaceutical market. The development of novel HMPs is associated with the problem of identification of medicinal plant raw materials (MPRMs), which task requires a combination of physical, physical–chemical, chemical and biological analytical methods [1]. Among the related issues that should be solved are the determination of sample preparation conditions and selection of analyzed substances [individual compound or a group of biologically active compounds (BAC)], analytical methods, and reference materials (RMs) for calculating the BAC content [2–7]. A comparison of the methods used for analyzing MPRMs and HMPs reveals the problem of non-absolute application of the principle of end-to-end standardization in the “MPRM—substance—HMP” series [5–7]. The need to revise the existing pharmacopoeial requirements can be illustrated by the lack of effective methods for the analysis of MPRM containing various BAC, such as simple phenols (Arctostaphylos uva-ursi and Vaccinium vitis-idaea leaves), phenylpropanoids (Eleutherococcus senticosus and Rhodiola rosea rhizomes and roots, Syringa vulgaris bark), flavonoids (Helichrysum arenarium flowers), saponins (Aralia mandschurica roots), anthracene derivatives (Aloe arborescens leaves) [8, 9]. Thus, according to the State Pharmacopoeia of the Russian Federation 14th edition, arbutin in Arctostaphylos uva-ursi and Vaccinium vitis-idaea leaves should be determined by a spectrophotometric technique involving a preliminary purification of the water–ethanol extract by filtering through an alumina layer [10]. However, according to the European and American herbal pharmacopoeias, arbutin should be determined by high-performance liquid chromatography (HPLC) [11–13]. HPLC techniques involve the use of methanol, whose handling requires specific conditions. In addition, arbutin can be measured using the methods of gas chromatography–mass spectrometry and photocolorimetry. The latter is based on the reaction of azo coupling and azo compound [13–16]. The pharmacopoeial technique for quantitative determination of BAC in Aralia manchurica is a multistage and labor-intensive process. This technique involves methanol extraction for 7 h in a Soxhlet extractor combined with an acidic hydrolysis stage, sapogenin precipitation (oleanolic acid) by adding an equal volume of water to the methanol extract, sapogenin precipitate purification, dissolution in a mixture
Application of Reference Materials in the Analysis of Medicinal Plant …
121
of methanol and isobutyl alcohol followed by potentiometric titration with 0.1 N sodium hydroxide solution in a mixture of methanol and benzene [10]. Ultraviolet spectrophotometry can also be used for determining the content of saponins [17]. According to the State Pharmacopoeia of the Russian Federation 14th edition, standardization of raw materials and medicinal preparations of Rhodiola rosea (FS.2.5.0036.15 “Rhodiolae roseae L. rhizomes and roots” and FS.3.4.0008.18 “Rhodiolae roseae L. rhizomes and roots extract liquid”) assumes a quantitative determination of salidroside and the total amount of cinnamic alcohol glycosides expressed in terms of rosavin [10]. The analysis is carried out by the HPLC-UV method (salidroside determined at 219 nm; the total amount of cinnamic alcohol glycosides expressed as rosavin determined at 250 nm). However, the feasibility of determining the total amount of cinnamyl alcohol glycosides expressed in terms of rosavin remains to be controversial. Rosavin is known to be a highly unstable compound. In comparison with other cinnamyl alcohol glycosides, rosavin is more sensitive to the conditions of harvesting and storage of raw materials, largely due to the possibility of enzymatic destruction under the action of vicanosidase. Moreover, the 219 nm wavelength used in the above pharmacopoeial technique for salidroside detection is less specific with respect to related components compared to another absorption maximum of this compound of 278 nm (Fig. 1) [18, 19].
Fig. 1 UV absorption spectra of salidroside (1) and rosavin (2) (solvent—95% ethanol)
122
T. K. Ryazanova and V. A. Kurkin
Various approaches are used for standardization of Eleutherococcus senticosus raw materials and medicinal preparations. Thus, the European Pharmacopoeia 10th edition suggests a qualitative assay of Eleutherococcus raw materials by thin-layer chromatography (TLC) using aesculin and catalpol RMs, a quantitative determination of the amount of B and E eleutherosides using ferulic acid as a standard by HPLC in the gradient elution mode with detection at 220 nm. However, all the three mentioned standards are not contained in the raw material [11]. In Russia, the “Eleutherococcus senticosus rhizomes and roots” pharmacopoeial article suggests a qualitative analysis of the main BAC groups by TLC using an eleutheroside B RM (synonym: syringin), qualitative reactions, and HPLC [10]. Identification of Eleutherococcus in a liquid extract from Eleutherococcus rhizomes and roots is carried out by HPLC, HPLC-UV, and qualitative reactions [10].1 The content of eleutheroside B and the total amount of eleutherosides are determined by HPLC and the spectrophotometric method, respectively [10]. At the same time, eleutherosides represent different BAC classes, which raises the question about the feasibility of determining their total amount. Moreover, an optimal extractant for extracting eleutheroside B (syringin) and the total amount of biologically active eleutherosides is yet to be found. This is related to the fact that the pharmacopoeial method uses 70% ethanol, while 40% ethanol is used for obtaining a liquid extract [10]. Therefore, the existing regulatory approaches and requirements for the quality of Eleutherococcus senticosus rhizomes and roots, adopted in the State Pharmacopoeia of the Russian Federation 14th edition, require revision. It also seems timely to develop a unified method for determining eleutheroside B in Syringa vulgaris bark. This material was suggested as a source of pharmacopoeial syringin RM by VFS 42 2088-92 “Syringin—reference material.” Syringin in Syringa vulgaris bark is identified using spectrophotometric, chromatic and spectrophotometric, and HPLC methods [20]. Despite the biological activity and significance of this raw material for obtaining a pharmacopoeial RM of syringin, Syringa vulgaris bark is not included in the State Pharmacopoeia of the Russian Federation 14th edition [10]. The quality of Syringa vulgaris raw materials is assessed in accordance with VFS 42-2106-92 “Syringa vulgaris bark,” which implies a chromatography mass–spectrophotometry determination of syringin. According to FS.2.5.0007.1 “Helichrysum arenarium flowers,”2 standardization of this MPRM is carried out by the total amount of flavonoids expressed in terms of isosalipurposide [10]. Since Helichrysum arenarium flowers serve as a source for obtaining an isosalipurposide RM, a methodology for quantitative determination of isosalipurposide in Helichrysum arenarium by HPLC is required [21–23].
1
FS.3.4.0009.18 Eleutherococcus prickly rhizomes and roots liquid extract. Available via Pharmacopoeia RF. https://pharmacopoeia.ru/fs-2-5-0053-15-eleuterokokka-kolyuchego-kornevishhai-korni/. Accessed 26 August 2022 (In Russ.). 2 FS.2.5.0007.1 Sand immortelle flowers. Available via Pharmacopoeia RF. https://pharmacopoeia. ru/fs-2-5-0007-15-bessmertnika-peschanogo-tsvetki/. Accessed 26 August 2022 (In Russ.).
Application of Reference Materials in the Analysis of Medicinal Plant …
123
Standardization of aloe species in the British, Japanese, European, and US Pharmacopoeias is performed according to the content of barbaloin (aloin A) by the spectrophotometric method [11, 12, 24–27]. In Russia, the draft versions of the “Aloe arborescens Mill. fresh leaves” and “Aloe arborescens Mill. leaves” pharmacopoeial articles (instead of FS 42 2191 84 and FS 42-2800-91, respectively) presented at the website of the Ministry of Health of the Russian Federation, the quantitative determination is also to be performed by the spectrophotometric method with the expression of the total amount of anthracene derivatives in terms of aloe emodin. All the methods described in literature involve many stages and imply a preliminary acidic hydrolysis combined with oxidation, a liquid–liquid extraction of the resulting aglycones, and subsequent complexation with magnesium acetate [24–28]. In the view of the abovementioned, we aim to substantiate both theoretically and experimentally the application of RMs when developing assay procedures. To this end, we use a number of plant raw materials and medicinal preparations on their basis as an example and determine the chemical composition, stability, and physicochemical properties of BAC contained in these products.
Materials and Methods In this research, we used the following MPRM and HMP samples: commercial samples of Aralia manchurica roots (Ecogreen LLC, 2014); commercial samples of Aralia tincture (JSC Dalhimpharm and JSC Tverskaya Pharmaceutical Factory); Vaccinium vitis-idaea leaves harvested in the Republic of Mari El, Volzhsky District, Volzhsk, 2018; Arctostaphylos uva-ursi leaves harvested in the Republic of Mari El, Volzhskiy district, Volzhsk, 2018; Rhodiolae roseae rhizomes and roots harvested in Altai Krai in 2016–2018; experimental and commercial samples of liquid Rhodiolae roseae rhizome and root extract (extractant—40% ethanol); Syringa vulgaris bark harvested in 2018–2020 in the Botanical Garden of Samara University, in the Samara (Verkhny Suskan village, Ermakovo village) and Saratov (Natalino village) regions; Eleutherococcus senticosus rhizomes and roots harvested in Khabarovsk Krai in 2015–2018; Aloe arborescens Mill. fresh leaves cultivated at the Department of Pharmacognosy with Botany and Phytotherapy Basics and collected in the summer and autumn period of 2020; juice obtained ex tempore from Aloe arborescens Mill. fresh leaves; medicinal preparations “Aloe vera juice” (JSC Vifitech), “Aloe extract liquid,” a solution for subcutaneous administration, by two different manufacturers (JSC Vifitech and JSC Dalkhimpharm). Instrumental methods of analysis rely on the use of RMs. In Russia, however, there are certain difficulties concerning the provision of RMs for medicinal products (MPs), including the lack of national pharmacopoeial certified RMs and their long delivery time, as well as the high cost of foreign pharmacopoeial RMs (European, British Pharmacopoeia, US Pharmacopoeia) [1–3]. In this connection, in cases where RMs were needed, we obtained substances (a mixture of araloside ammonium salts,
124
T. K. Ryazanova and V. A. Kurkin
barbaloin) or individual compounds (arbutin, syringin, rosavin, salidroside, and isosalipurposide). All the obtained materials met the requirements for RMs according to the data of qualitative and quantitative assays, mass spectrometry, 1 H and 13 C–NMR spectroscopy [10, 11]. Individual compounds were isolated using the liquid column chromatography of laboratory water–ethanol extracts prepared from plant raw materials (extractant 70% ethanol at the ratio of raw material to extractant 1:5) using a silica gel sorbent L 40/100 µm (Czech Republic) [29–37]. Elution was performed using solvent mixtures of chloroform–ethyl alcohol 95% in different ratios (100:0 → 0:100). The chromatographic separation was controlled by TLC on Sorbfil PTCAF-A-UF plates in the system “chloroform:95% ethanol:water 26:16:3 (vol%)” with UV-detection of fluorescence quenching areas (at 254 nm) and fluorescing areas (at 366 nm) using a chromatographic irradiator (UV complex UFK-254/365, Petrolaser Ltd.). In addition, the areas stained by treating the plates with a solution of diazobenzene sulfonic acid in a saturated solution of sodium carbonate were identified under natural light. For subsequent purification, chromatographic separation was repeated using other sorbents (polyamide, Sephadex LH-20); crystallization conditions were selected. The yield of the target substances was at least 60.0% of their content in the raw material calculated by quantitative assays. 1 H NMR and 13 C NMR spectra were recorded using Bruker AM 300 (300 MHz) and Bruker DRX 500 (126.76 MHz) NMR spectrometers. Electron-impact mass spectra were recorded using a Kratos MS-30 mass spectrometer at an ionizing electron energy of 70 eV and an ion source temperature of 250 °C. In general cases, sample preparation for the quantitative determination of BAC was performed as follows: about 1 g of raw materials crushed to a particle size to pass through a 2-mm sieve (precisely weighted amount) was placed in a 100 cm3 ground joint flask followed by addition of 30–50 cm3 of water–ethanol mixture (the amount of solvent and the composition of mixture depended on the analyzed MPRM and BAC). The flask was capped and weighed with an accuracy of ± 0.01 g, and then attached to a backflow condenser and heated in a boiling water bath (moderate boiling) for 60 min. Subsequently, the flask was cooled for 30 min, closed with the same stopper, and weighed again. The missing extractant was replenished to the original mass. The extract was filtered through a paper filter (red stripe). For chromatographic studies, the solution was additionally filtered through an MF-Millipore membrane filter (0.45 µm). RM solutions were prepared by solving 0.025–0.030 g (precisely weighted amount) of the particular substances in a suitable solvent in a 50-ml volumetric flask and bringing the solution volume to the mark with the same solvent. For each object under study, the conditions of sample preparation for subsequent analysis were determined. To that end, the extraction ability of different extractants (purified water, 40, 70, and 95% ethanol) was compared, the effect of extraction time (30, 60, or 90 min) and the ratio of “raw material:extractant” (1:30; 1:50, and 1:100) on the yield of active substances was studied [29–37]. UV spectra were recorded using a Specord 40 (Analytik Jena) spectrophotometer. HPLC was performed using a Milichrom-6 (JSC Nauchpribor) chromatograph under the following conditions of reverse-phase chromatography under isocratic elution:
Application of Reference Materials in the Analysis of Medicinal Plant …
125
KAH-6-80-4 steel column (2 mm × 80 mm; Separon-C18), mobile phase—acetonitrile, 1% acetic acid solution in water in different ratios, elution rate—100 µl/min, eluent volume—1500–2500 µl. The optimum ratio of the mobile phase components was determined by peak resolution, the peak asymmetry coefficient. The BAC content was calculated using the method of external standard, with the latter being the individual compounds isolated from plant raw materials and identified with the degree of purity established earlier by the material-balance method. The suitability of the chromatographic system was evaluated in accordance with OFS.1.2.1.2.0001.15 “Chromatography.”3 Statistical processing of the results of quantitative assays was carried out in accordance with OFS 1.1.1.0013.15 “Statistical processing of the results of chemical experiments.”4 The methods were validated according to OFS.1.1.0012.15 “Validation of analytical methods.”5 The correctness of the methods applied was determined by adding a water–ethanol solution, the earlier isolated individual compound under study with the established degree of purity (RM candidate) to the test solution (80, 100, 120% in relation to the compound content in the extract). In addition, experimental syrup samples of Eleutherococcus senticosus, Arctostaphylos uva-ursi, and Vaccinium vitis-idaea were obtained. Considering the recommended dosage of the registered preparation, an Eleutherococcus senticosus syrup was obtained from a liquid extract with a content of 5% of the total weight of the syrup. Syrups from Arctostaphylos uva-ursi and Vaccinium vitis-idaea leaves were prepared according to a standard syrup technology using a decoction of herbal raw materials instead of purified water. Sucrose or sorbitol were used as corrigents. Prior to estimating the content of active components, sample preparation was carried out by diluting an aliquot of tested samples with tenfold of 95% ethanol. The as-obtained solutions were kept for some time until precipitation and filtered through an alumina layer (reagent grade, neutral, Brockmann grade II) with a height of 0.5 cm in a POR 100 glass filter 2 cm in diameter into a 25-cm3 volumetric flask. BAC quantification in experimental and commercial preparations was performed using the approaches described for the respective MPRM.
Results and Discussion Using the methodology described above and HPLC, we developed and validated assay procedures for quantitative determination of arbutin in Arctostaphylos uvaursi and Vaccinium vitis-idaea leaves, syringin in the MPRMs and HMPs of Syringa 3
OFS.1.2.1.2.0001.15 Chromatography. Available via Pharmacopoeia RF. https://pharmacopoeia. ru/ofs-1-2-1-2-0001-15-hromatografiya/. Accessed 26 August 2022 (In Russ.). 4 OFS.1.1.0013.15 Statistical processing of the results of chemical experiments. Available via Pharmacopoeia RF. https://pharmacopoeia.ru/wp-content/uploads/2016/11/OFS.1.1.0013.15-Statistic heskaya-obrabotka-rezultatov-eksperimenta.pdf. Accessed 26 August 2022 (In Russ.). 5 OFS.1.1.0012.15 Validation of analytical methods. Available via Pharmacopoeia RF. https://pha rmacopoeia.ru/ofs-1-1-0012-15-validatsiya-analiticheskih-metodik/. Accessed 26 August 2022 (In Russ.).
126
T. K. Ryazanova and V. A. Kurkin
vulgaris bark and Eleutherococcus senticosus rhizomes and roots, rosavin and salidroside in the MPRMs and HMPs of Rhodiola rosea, arbutin in the MPRMs and HMPs of Arctostaphylos uva-ursi and Vaccinium vitis-idaea, isosalipurposide in the MPRMs and HMPs of Helichrysum arenarium. Table 1 presents the optimal conditions for sample preparation and analysis determined by the highest concentration of extractable BAC. In all cases, the optimal extraction time from the studied range (30, 60, and 90 min) comprised 60 min. For all the assay procedures, the linearity of the peak height dependence on the analyte concentration in the range specified in Table 2 was confirmed. Satisfactory metrological characteristics in terms of accuracy, repeatability, and intermediate precision were obtained. Table 3 presents the quantitative content of BAC in the studied MPRMs obtained by the developed assay procedures, according to the principle of end-to-end standardization of analytical approaches in the “MPRM—phytosubstance—HMP” series. For those cases where it was difficult to identify the individual component that makes the greatest contribution to the biological activity of a particular HPRM and HMP and/or that is most susceptible to degradation processes in the process of harvesting raw materials and their storage, procedures for identifying the total amount of BAC by the spectrophotometric method were developed. Thus, we previously proposed approaches to estimate the quantitative content of the total amount of saponins (aralosides) in the raw materials and preparations of Aralia mandschurica using the total amount of araloside ammonium salts as an RM (referred to as “Saparal”). For that purpose, we modified the technological scheme of Saparal manufacturing [17]. The Saparal samples obtained in the course of our studies represented an amorphous powder of a cream color without odor with the total amount of aralosides exceeding 80% (85.06 ± 1.12%) expressed in terms of the ammonium salt of aralosides A, B, and C with the weigh-average molecular weight. The yield of the finished product ranged between 62.9 and 65.0%. We developed a procedure for quantitative determination of the total amount of Aralia saponins (aralosides) in raw materials and preparations by spectrophotometry of the reaction products of the analytes with concentrated sulfuric acid at 510 nm. The quantitative content was calculated using the data obtained for Saparal or (in cases where a Saparal RM was absent) using the value of the specific absorption index for Saparal upon its interaction with concentrated sulfuric acid considering the total amount of the contained aralosides of 56.0. The optimal extraction conditions were determined to be as follows: 70% ethanol; the “raw material—extractant” ratio of 1:50; extraction time 60 min. This procedure was applied to analyze the total amount of saponins in the samples of Aralia mandschurica roots (ranged from 9.41 ± 0.18 to 10.46 ± 0.15%) as well as in those of commercially available tinctures of Aralia mandschurica (ranged from 1.51 ± 0.05 to 1.72 ± 0.06%). For raw materials and preparations of Eleutherococcus senticosus rhizomes and roots, we propose to replace the pharmacopoeial method for determining the total amount of eleutherosides with a procedure for determining the total amount of biologically active phenylpropanoids. This method consists in obtaining a water-alcohol
1:50
1:30
Purified water
70% ethanol
40% ethanol
70% ethanol
70% ethanol
Vaccinium vitis-idaea
Syringa vulgaris bark
Eleutherococcus senticosus rhizomes and roots
Rhodiolae roseae rhizomes and roots
Helichrysum arenarium flowers
1:50
1:30
1:50
1:50
40% ethanol
Arctostaphylos uva-ursi
Ratio “raw material—extractant” (weight/volume)
Extractant
MPRM
Not required
Not required
Required
Not required
Required
Required
Need for purification (filtering through an alumina layer)
25:75
14:86
15:85
15:85
1:9
1:9
Mobile phase—acetonitrile—1% acetic acid solution
Isosalipurposide
Salidroside
278 nm 360 nm
Rosavin
Syringin (eleutheroside B)
Syringin (eleutheroside B)
Arbutin
Arbutin
Analyte
252 nm
266 nm
266 nm
280 nm
280 nm
Detection
12.84 ± 0.08
2.98 ± 0.07
12.82 ± 0.07
2.84 ± 0.08
2.82 ± 0.08
4.87 ± 0.03*
4.87 ± 0.03*
Retention time, min
Table 1 General description of HPLC methods for the analysis of biologically active compounds in the studied medicinal plant raw materials
Application of Reference Materials in the Analysis of Medicinal Plant … 127
128
T. K. Ryazanova and V. A. Kurkin
Table 2 Metrological characteristics of HPLC assay procedures for biologically active compounds in the investigated medicinal plant raw materials MPRM (BAC)
X, %
ε, % (P = 95%, n = 10)
Concentration range for linearity determination (r2 )
Arctostaphylos uva-ursi (arbutin)
11.2
3.1
0.076–0.49 mg/mL (0.9994)
99.5
Vaccinium vitis-idaea (arbutin)
4.8
2.1
0.076–0.49 mg/mL (0.9994)
99.5
Syringa vulgaris bark (syringin)
5.4
3.2
0.34–0.51 mg/mL (0.9997)
98.8
Eleutherococcus senticosus rhizomes and roots (syringin)
0.089
3.3
0.34–0.51 mg/mL (0.9997)
98.3
Rhodiolae roseae rhizomes and roots (rosavin)
1.4
4.4
0.12–0.96 mg/mL (0.9973)
100.4
Rhodiolae roseae rhizomes and roots (salidroside)
2.9
4.7
0.15–1.47 mg/mL (0.99996)
99.1
Helichrysum arenarium flowers (isosalipurposide)
1.45
4.1
0.20–1.40 mg/mL (0.9964)
97.8
Accuracy, %
Designations X —mean value; P—confidence interval, ε—relative error of the mean value, r2 — determination coefficient
extract from the rhizomes and roots of Eleutherococcus senticosus, its purification by filtering through an alumina layer followed by spectrophotometric determination of the total amount of phenylpropanoids at 266 nm expressed in terms of eleutheroside B (syringin). The conducted experiments into the extraction capacity of different water–ethanol mixtures revealed the most optimal extractant with respect to phenylpropanoids to be 40% ethanol at a “raw material:extractant” ratio of 1:50 and extraction time of 60 min. The metrological characteristics of the spectrophotometric method for determining the total amount of phenylpropanoids expressed in terms of eleutheroside B (filtered through an alumina layer) include the ±4.20 and ± 6.24% relative error of the mean value of active substance quantitative determination in Eleutherococcus senticosus rhizomes and roots and Eleutherococcus senticosus liquied extract (confidence interval of 95%). The total amount of phenylpropanoids in Eleutherococcus senticosus rhizomes and roots ranged from 0.30 ± 0.02 to 0.37 ± 0.02%. We also developed and validated an assay procedure for quantitative determination of the total amount of anthracene derivatives by differential spectrophotometry (absorption maximum at 412 nm), which is expressed in terms of barbaloin contained in the MPRMs and HMPs of Aloe arborescens Mill. During the course of the study, the following significant parameters were determined: extractant composition (40% ethanol), “raw material—extractant” ratio (1:50), and extraction time
Application of Reference Materials in the Analysis of Medicinal Plant …
129
Table 3 Content of active substances in the experimental and commercial HMPs based on the studied MPRMs Need for purification (filtering through an alumina layer)
Analyte
Active substance content, %
Arctostaphylos uva-ursi Experimental syrup
Required
Arbutin
0.86 ± 0.02
Vaccinium vitis-idaea syrup
Experimental
Required
Arbutin
0.70 ± 0.02
Syringa vulgaris tincture
Experimental
Not required Syringin (eleutheroside B)
0.45 ± 0.03
Eleutherococcus liquid extract
Commercial
Required
Syringin (eleutheroside B)
From 0.065 ± 0.003 to 0.089 ± 0.004
Eleutherococcus syrup
Experimental
Required
Syringin (eleutheroside B)
From 0.0026 ± 0.0003 to 0.0029 ± 0.0003
HMP
HMP type
Rhodiolae roseae liquid Commercial extract
Not required Rosavin Salidroside
Helichrysum arenarium Commercial flowers
Not required Isosalipurposide
From 0.21 ± 0.03 to 0.32 ± 0.04 From 0.96 ± 0.04 to 2.75 ± 0.08 From 1.22 ± 0.03 to 1.42 ± 0.03
(60 min). The linearity of the dependence of optical density on the analyte concentration was confirmed; satisfactory metrological characteristics in terms of accuracy, repeatability, and intermediate precision were obtained. The relative error of the mean value when determining the total amount of anthracene derivatives in Aloe arborescens Mill. fresh leaves comprised ± 3.36% (confidence interval of 95%). In accordance with the principles of unification and harmonization of analytical approaches for MPRMs and respective HMPs, we modified the procedure developed for the analysis of raw materials to that of ex tempore Aloe arborescens juice and medicinal products “Aloe vera juice” (JSC Vifitech), “Aloe extract liquid,” a solution for subcutaneous administration (JSC Dalkhimpharm and JSC Vifitech). The content of the total amount of anthracene derivatives expressed as barbaloin comprised 0.50 ± 0.02% in the freshly prepared Aloe arborescens juice, 0.135 ± 0.006% in “Aloe vera juice,” and 0.020 ± 0.001% in “Aloe extract liquid” preparations. On the basis of the conducted research, we formulated a concept for a systematic approach to the analysis of medicinal plant raw materials and herbal medicinal products containing BAC of aromatic and terpenoid nature (Fig. 2). The main provisions of this concept can be formulated as follows:
130
T. K. Ryazanova and V. A. Kurkin
Fig. 2 Principles of the proposed systematic approach to the analysis of medicinal plant raw materials and herbal medicinal products
• when selecting an assay procedure for the quantitative determination of active substances, account should be taken of the intended use of the MPRM (RM source, BAC content, extractant type, etc.), the pharmacotherapeutic significance of the components, technological features (the possibility of isolating BAC from MPRM), and BAC stability (whether labile BACs are present); • when selecting RMs for pharmacopoeial analytical methods, a diagnostically significant substance present in the studied plant or a substance of the same BAC class with similar physical and chemical characteristics should be used; • the principle of unifying approaches to the identification and quantitative determination of active substances in MPRMs, pharmaceutical substances on their basis, and respective HMPs.
Conclusion The conducted research allowed us to scientifically substantiate the use of the following RMs for qualitative and quantitative analysis: syringin (Syringa vulgaris bark and Eleutherococcus senticosus rhizomes and roots), rosavin and salidroside (Rhodiolae roseae rhizomes and roots), the total amount of araloside ammonium salts (Aralia mandschurica roots), arbutin (Arctostaphylos uva-ursi and Vaccinium vitis-idaea leaves), a mixture of aloins A and B (Aloe arborescens fresh leaves). We developed and validated assay procedures for quantitative determination of syringin in the MPRM and HMP of Syringa vulgaris and Eleutherococcus senticosus, the total amount of biologically active phenylpropanoids in the MPRM and HMP of Eleutherococcus senticosus, rosavin and salidroside in the MPRM and HMP of Rhodiolae roseae, arbutin in the MPRM and HMP of Arctostaphylos uva-ursi and Vaccinium vitis-idaea, isosalipurposide the MPRM and HMP of Helichrysum arenarium, the total amount of anthracene derivatives expressed as barbaloin the MPRM and HMP of Aloe arborescens, the total amount of saponins (aralosides) in Aralia mandschurica roots.
Application of Reference Materials in the Analysis of Medicinal Plant …
131
With the purpose of unifying quality requirements and monitoring the influence of the technological process on the extraction efficiency and stability of BAC, the assay procedures developed for identifying active substances in MPRMs should also be used for analyzing both the pharmaceutical substances obtained on their basis and respective HMPs. Acknowledgements The study was carried out within the project “Development of national approaches to the standardization of herbal medicinal products, medicinal plant raw materials and phytobiotechnological products” under the financial government support in the form of a Scholarship of the President of the Russian Federation for young scientists and postgraduates carrying out promising research and development on priority directions of Russian economy modernization. The authors are grateful to the reviewers for their valuable recommendations and constructive attitude. Contribution of the Authors Ryazanova T.K.—conducting research, development of a methodology, formal analysis, validation, writing a draft of the article; Kurkin V. A.—development of the research concept, interpretation of 1 H-NMR, 13 C-NMR spectra, mass spectra and UV spectra of isolated BACs, revision of the text. Conflict of Interest The article was prepared on the basis of a report presented at the V International Scientific Conference “Reference Materials in Measurement and Technology” (Yekaterinburg, September 13–16, 2022). The article was admitted for publication after the abstract was revised, the article was formalized, and the review procedure was carried out. The version in the Russian language is published in the journal “Measurement Standards. Reference Materials” 2023;19(2):47–60. (In Russ.). https://doi.org/10.20915/2077.1177.2023.19. 2-47-60.
References 1. Samylina IA, Kurkin VA, Yakovlev GP (2016) Scientific basis of the development and standardization of herbal medicines. Bull Sci Centre Expert Eval Med Prod Regul Res Med Eval 1:41–44 (in Russian) 2. Volkova RA, Fadeikina OV, Ustinnikova OB, Sakanyan EI, Merkulov VA, Movsesyants AA et al (2020) Current problems with the standard samples of medicines in the Russian Federation. Farmatsiya 69(2):5–11 (in Russian). https://doi.org/10.29296/25419218-2020-02-01 3. Voronin AV, Malkova AV (2020) Methodology for the study of some multicomponent objects of analytical control in forensic chemical expertise and pharmaceutical analysis: monograph. Insoma-press, Samara, 328 p (in Russian) 4. Leontiev DA, Podpruzhnikov YV, Volovyk NV (2016) The role of reference standards in quality assurance for medicines: regulatory and metrological aspects. Drug Dev Registration 3:180–188 (in Russian) 5. Sakanyan EI, Kovaleva EL, Frolova LN, Shelestova VV (2018) Current requirements for the quality of herbal medicinal products. Bull Sci Centre Expert Eval Med Products 8(3):170–178 (in Russian). https://doi.org/10.30895/1991-2919-2018-8-3-170-178 6. Sokol’skaya TA, Shemeryankina TB, Dargaeva TD (2011) Use of reference standards for the analysis of herbal medicines. Bull Sci Centre Expert Eval Med Prod 2:43–46 (in Russian) 7. Shemeryankina TB, Sakanyan EI, Merkulov VA, Bunyatyan ND, Kovalyova EL, Mit’kina LI et al (2014) The requirements for methods of analysis and the quality of pharmacopoeia reference standards for herbal medicines. Bull Sci Centre Expert Eval Med Prod 1:51–54 (in Russian)
132
T. K. Ryazanova and V. A. Kurkin
8. Kurkin VA, Avdeeva EV, Kurkina AV, Pravdivtseva OE et al (2016) The actual aspects of the standardization of medicinal plant materials and phytopharmaceuticals. In: Modern problems of pharmacognosy. Collection of materials of the I Interuniversity student scientific and practical conference, dedicated to the 45th anniversary of the pharmaceutical faculty of the Samara State Medical University, 22 Oct 2016, Samara, Russia. SamSMU, Samara, pp 123–127 (in Russian) 9. Olennikov DN, Zilfikarov IN, Ibragimov TA (2010) Study of the chemical composition of Aloe Arborescens Mill. Khimiya Rastitel’nogo Syr’ya 3:77–82 (in Russian) 10. State Pharmacopoeia of the Russian Federation, XIV edn., 4 vols. Moscow (2018). Available via Ministry of Health of the Russian Federation. https://minzdrav.gov.ru/poleznye-resursy/xiv-izd anie-gosudarstvennoy-farmakopei-rossiyskoy-federatsii. Accessed 26 Aug 2022 (in Russian) 11. European Pharmacopoeia, 10th edn. Available via Council of Europe. https://pheur.edqm.eu/ home. Accessed 26 Aug 2022 12. American Herbal Pharmacopoeia Botanical Pharmacognosy. CRC Press, Boca Raton, American Herbal Medicine Association, Florida, USA, 733 p (2011) 13. Moiseev DV (2011) Determination of arbutine in cowberry leaves by HPLC. Vestnik farmatsii 1(51):40–45 (in Russian) 14. Fedoseeva LM (2003) Analysis of arbutin in underground and aboveground vegetative organs of the thick-leaved bergenia (Bergenia crassifolia (L.) Fitsch.) Growing in Altai. Khimiya rastitel’nogo syr’ya 1:73–77 (in Russian) 15. Chemical information review document for arbutin [CAS No. 497-76-7] and extracts from Arctostaphylos uva-ursi. Available via Semantic Scholar. https://www.semanticscholar.org/ paper/Chemical-Information-Review-Document-for-Arbutin/0d65672d2e6f910a0d935178 6424f32cff65c089. Accessed 26 Aug 2022 16. (2012) EMA/HMPC/573462/2009 Rev.1 committee on herbal medicinal products (HMPC) Arctostaphylos uva-ursi (L.) Spreng., folium 17. Kurkin VA, Ryazanova TK (2018) Quantitative determination of total saponins in Aralia mandshurica plant raw material. Pharm Chem J 52(5):455–458. https://doi.org/10.1007/s11094-0181838-x 18. Kurkin VA, Zapesochnaya GG, Kiryanov AA et al (1989) On the quality of raw materials of Rhodiola rosea. Pharm Chem J 11:1364–1367 (in Russian) 19. Kiryanov AA, Bondarenko LT, Kurkin VA et al (1989) Dynamics of accumulation of rosavidin and salidroside in the rhizomes of Rhodiola rosea. Pharmaceutical Chemistry Journaln 23(4):449–452 (in Russian) 20. Kurkin VA (2003) Phenylpropanoids of medicinal plants. Distribution, classification, structural analysis, biological activity. Chem Nat Compd 2:87–110 (in Russian) 21. Kurkina AV (2012) Flavonoids of pharmacopoeial plants: monograph Etching, Samara State Medical University of the Ministry of Health and Social Development of Russia, Samara, 290 p (in Russian) 22. Kurkina AV (2011) Actual aspects of standardization of medicinal plant materials containing flavonoids. Bull Siberian Med 5:150–153 (in Russian). https://doi.org/10.20538/1682-03632011-5-150-154 23. Kurkina AV, Ryzhov VM (2011) Assay of isosalipurposide in raw material and drugs from the dwarf everlast (Helichrysum arenarium). Farmatsiya 1:12–14 (in Russian) 24. The United States Pharmacopeia and The National Formulary (USP 38-NF 33), The United States Pharmacopeial Convention. Inc.: Rockville, MD (2015) 25. Japanese Pharmacopoeia, 18th edn. The Ministry of Health, Labour and Welfare (2021) 26. Sergunova EV, Sorokina AA (2019) Study of the quality indicators of arborescent aloe (aloearborescens) leaves subjected to different preservation procedures. Farmatsiya 7(68):21–25 (in Russian). https://doi.org/10.29296/25419218-2019-07-04 27. Olennikov D, Rokhin A, Zilfikarov I (2008) Method for determining content of phenolic compounds in Aloe arborescens. Chem Nat Compd 44:715–718 28. Zilfikarov IN, Olennikov D, Ibragimov TA, Chelombit’ko VA, Vandyshev VV (2013) Modern aspects of pharmacognostic and biochemical study of succulent raw material of Aloe arborescens and Callisia fragrans. Publisher Marchotin P. Yu., Moscow Region, Schyolkovo
Application of Reference Materials in the Analysis of Medicinal Plant …
133
29. Kurkin VA, Ryazanova TK, Platonov IA, Pavlova LV (2015) Quantitative determination of arbutin in the leaves of Arctostaphylos uva-ursi (L.) Spreng. Khimija Rastitel’nogo Syr’ja 1:95–100 (in Russian) 30. Kurkin VA, Ryazanova TK, Platonov IA, Pavlova LV (2017) Determination of arbutin in Vaccinium vitis-idaea L. leaves. Pharmaceut Chem J 51(4):34–37 (in Russian) 31. Kurkin VA, Ryazanova TK, Serebryakova AD (2021) Development of approaches to standardization of bark of Syringa vulgaris L. Probl Biol Med Pharmaceut Chem 24(7):37–44 (in Russian). https://doi.org/10.29296/25877313-2021-07-06 32. Kurkin VA, Ryazanova TK, Shmygareva AA, Glushchenko SN (2021) HPLC determination of aloenin in leaves and preparations of Aloe arborescens Mill. Pharmaceut Chem J 55(5):13–18 (in Russian). https://doi.org/10.30906/0023-1134-2021-55-5-13-18 33. Kurkin VA, Ryazanova TK (2021) Current aspects of standardization of Rhodiola rosea L. rhizomes and roots. Pharmaceut Chem J 55(8):40–44 (in Russian). https://doi.org/10.30906/ 0023-1134-2021-55-8-40-44 34. Kurkin VA, Ryazanova TK, Shmygareva AA, Glushchenko SN (2021) The development of methods for determination the total of anthracene derivatives in raw materials and preparations of Aloe arborescens Mill. Khimiya rastitel’nogo syr’ya 3:153–161 (in Russian). https://doi. org/10.14258/jcprm.2021039221 35. Kurkin VA, Ryazanova TK (2021) Standardization problems of medicinal preparations from Rhodiola rosea L. Pharmacy Pharmacol 9(3):185–194 (in Russian). https://doi.org/10.19163/ 2307-9266-2021-9-3-185-194 36. Kurkin VA, Ryazanova TK (2022) Methodological approaches to standardization of rhizomes and roots of Eleutherococcus senticosus. Pharmaceut Chem J 56(3):34–41 (in Russian). https:// doi.org/10.30906/0023-1134-2022-56-3-34-41 37. Ryazanova TK, Kurkina AV, Kurkin VA (2022) Development of approaches to standardization of raw materials and preparations of Helichrysum arenarium. In: From plant biochemistry to human biochemistry. International scientific conference. Moscow, pp 237–241
Reference Materials in the Field of Quality of Life
Determination of Sunflower Seed Oil Content Using Natural Sunflower Oil: Calibration of a Pulsed NMR Analyzer Oleg S. Agafonov
and Sergey M. Prudnikov
Abstract The present study substantiates the application of natural sunflower oil for the calibration of pulsed NMR analyzers, as well as for the identification and quality assessment of oilseeds and their products using the NMR method. Being the essential characteristic of sunflower seeds, the oil content is mandatory for the certification of agricultural products and their cost assessment. The first calibration option includes the measurement of oil NMR characteristics with the oil content determined using the Soxhlet exhaustive extraction. The second option involves the calibration of a NMR analyzer using sunflower oil, obtained by pressing identical cultivars and hybrids, as well as that acquired at a retail network. A comparison of the obtained calibration dependencies showed their similar nature. The application of sunflower oil for the calibration of NMR analyzers provides no increase in the oil content measurement error as compared to the first calibration option. Therefore, using natural oil for the calibration of NMR analyzers can considerably simplify the calibration process, reduce the calibration duration from 3–4 days to 3–4 h, as well as to exclude toxic solvents and additional high-value equipment from the process without essential variations in the oil content measurement error. Keywords NMR analyzer · Calibration · Oil content · Moisture content · Reference materials · Sunflower seeds · Sunflower oil
Abbreviations RM TAG NMR spectroscopy
Reference material Triacylglycerol Nuclear magnetic resonance spectroscopy
O. S. Agafonov (B) · S. M. Prudnikov V. S. Pustovoit All-Russian Research Institute of Oil Crops, Krasnodar, Russia e-mail: [email protected] S. M. Prudnikov e-mail: [email protected] © D. I. Mendeleyev Institute for Metrology 2024 E. P. Sobina et al. (eds.), Reference Materials in Measurement and Technology, https://doi.org/10.1007/978-3-031-49200-6_9
137
138
O. S. Agafonov and S. M. Prudnikov
Introduction In accordance with GOST 22391-2015 [1], the oil-and-fat industry identifies the seed oil content as the main quality indicator of raw materials during their gathering and processing. The oil content comprises the content of raw fat and accompanying lipoid substances, which, together with fat, pass into the ether extract from the seeds. In accordance with GOST 10857-64 [2], the determination of this indicator is based on the method of Soxhlet exhaustive extraction. A drawback of this method consists in its duration, application of toxic chemical solvents, low productivity, and high requirements to the personnel qualification. At present, due to the wide development of technical equipment and information technologies, instrumental methods, such as IR spectroscopy and pulsed NMR methods, which can be used to obtain information about the seed oil content, are quite common. The determination of oil content using the method of IR spectroscopy is typically performed in accordance with GOST 32749-2014 [3]. In the case of sunflower seeds, this method is unpopular due to significant errors (up to 2 abs%) and the dependence of measurement results on the seed appearance and their fineness degree. In addition, this method requires the calibration of IR analyzers using a large number of seeds with a certain value of determined indicators obtained using referee methods [4–8]. In the contemporary Russian oil-and-fat industry, the most widespread instrumental method for determining the oil content of seeds and products of their processing involves pulsed nuclear magnetic resonance (NMR). This is explained by its analytical simplicity, lack of a complex sample preparation, high accuracy (error of not more than 0.6 abs%, which is comparable in accuracy with a referee chemical method), promptness (the analysis of one sample takes < 30 s), lack of the effect caused by the operator’s subjectiveness on the analytical results, as well as ease of implementation. Currently, AMV-1006M (V.S. Pustovoit All-Russian Research Institute of Oil Crops, VNIIMK, Russia) is the most common NMR analyzer used at Russian enterprises. The determination of oil content using this instrument is based on the substantiated scientific and methodological approach with the rank of 0.04 [9]. The calibration of operating NMR analyzers for the determination of oil content in sunflower seeds is carried out using GSO 3107-841 state reference materials [10, 11], which were used for the verification of AMV-1006M NMR analyzers until the expiration of their Type Approval Certificate in 2016. These reference materials (RM) are made on the basis of chemically inert substances-imitators, thermally resistant, resistant to thermal oxidation and ultraviolet effects, as well as having the dielectric properties (of organosilicon liquids) [12–14] of oil NM relaxation characteristics.
1
GSO 3107-84 Reference materials of the approved type of oil content and moisture content of sunflower seeds (set). Available via FIF EUM. www.fgis.gost.ru/fundmetrology/registry/19/items/ 393823. Accessed 12 September 2022 (In Russ.).
Determination of Sunflower Seed Oil Content Using Natural Sunflower …
139
Imitated values of indicated GSO 3107-84 were assigned using an NMR analyzer, whose calibration and testing were performed using sunflower seeds with the oil content determined by the Soxhlet method of exhaustive extraction. The drawbacks of this calibration method include its duration, high requirements to the operator’s qualification, as well as the application of specially prepared traceable seeds. It should be noted that even specially prepared seeds have a scattering in the measured oil content values in individual samples, isolated from one specimen using the method of exhaustive extraction to 1 abs%. This is explained by the fact that seeds represent a natural heterogeneous object [15, 16]. Let us note that one of the key features of the NMR method comprises a functional dependence between the oil content in the analyzed seed sample and the amplitude of the NMR signal obtained from the protons of triacylglycerins (TAG) contained in the oil. At present, the NMR method is widely used for determining the oil content of seeds and oil-containing raw materials [17–24],2 which is explained by its application simplicity, high metrological characteristics, sample preparation simplicity, ecological safety, as well as the non-destructive nature of analysis. More than 350 enterprises of the Russian oil-and-fat industry currently use AMV-1006M NMR analyzers to quickly obtain information on the oil content at all stages of gathering, storage, and processing of oil seeds. At the same time, the calibration of quantitative NMR analyzers represents a complex problem. Currently, several main methods of calibrating quantitative analyzers, used for the quality assessment of lipid-containing raw materials, can be found in literature: • using natural samples3 ,4 ; • using imitator RMs produced from chemically inert substances [13, 14, 24]; • using samples, obtained on the basis of natural components, e.g., oil cakes and oil (see footnote 3) [25]. In this study, we aim to scientifically and experimentally substantiate the application of sunflower oil samples in the calibration of NMR analyzers.
2
The minispec Oil content and moisture in seeds and nuts. Available via: URL: http://spectrante. ru/images/pdf_series/Zernovie.pdf. Accessed 12 September 2022 (In Russ.). 3 Measurement of oil component in dried palm mesocarp. Available via: Oxford Instruments. https://nmr.oxinst.com/assets/uploads/18_Measurement_of_Oil_Content_in_Dried_Palm_ Mesocarp.pdf. Accessed 12 September 2022. 4 Measurement of oil and water in seeds according to ISO 10565. Available via Oxford Instruments. https://nmr.oxinst.com/assets/uploads/3_3344_MR_Oilseeds_App%20Note_ Web.pdf. Accessed 12 September 2022.
140
O. S. Agafonov and S. M. Prudnikov
Materials and Methods Experiments were carried out at the Central Experimental Base of V.S. Pustovoit All-Russian Research Institute of Oil Crops (Krasnodar) in 2021–2022. Traceable sunflower seed samples of VNIIMK5 breeding and two samples of commercially distributed oil were prepared, including the refined and deodorized oil of the “BLAGO” trademark (Russia) and non-refined oil of the “STAVROPOL’E” trademark (Russia), acquired in a retail network. Sunflower samples were cleaned off damaged seeds and waste admixtures. The oil and moisture content of seeds was preliminarily determined using an AMV1006M NMR analyzer in accordance with GOST 8.597-2010 [26]. The seed samples presented in the study belong to contemporary high-productive varieties. The acid number of the seed oil was determined according to GOST 31933-2012 [24, 27] using the titrimetric method with visual indication. The determination of the oil content in seeds was carried out by the method of exhaustive extraction in four repetitions for each sample in order to reduce the measurement error, in accordance with the procedure developed based on GOST 10857-64. The duration of extraction was 24 h, at a temperature providing a number of siphonings from 7 to 10 per hour. The completeness of extraction was checked using a watch glass sample. The average value of four measurements was taken as the final result. The oil from sunflower seeds was obtained using a Laboratoroff PR-L laboratory hand press (LLC Eltemix, Russia) with a force of 12 tons. The obtained oil was further filtered to remove seed particles, trapped in the oil during its pressing, using the FS laboratory filtering paper. In order to construct the oil content calibration curves, from each oil sample, both obtained by pressing and acquired at a retail network, five weighments evenly distributed in the range from 2000 to 7000 g with the accuracy of 0.001 g were taken using an AND HK-50AG laboratory weights (AND, Japan). Prior to measuring the oil proton NMR signals, the prepared samples were thermostated at a temperature of 23 ± 0.5 °C for 2 h in a TVL-K(50)B thermostat (CJSC INSOVT, Russia). The thermostating of samples comprises an important stage, since the temperature has the essential effect on the NM relaxation characteristic of oil samples [21]. 5
Sunflower varieties of VNIIMK breeding, Russia: UMNIK, oil content 30–35%. Available via VNIIMK. https://vniimk.ru/products/belosnezh nyy-sq/. Accessed 12 September 2022 (In Russ.). DZhIN, oil content 44–46%. Available via VNIIMK. https://vniimk.ru/products/dzhinn/. Accessed 12 September 2022 (In Russ.). IMIDZh, oil content 48%. Available via VNIIMK. https://vniimk.ru/about/fgup/Katalog%20B HIIMK.pdf. Accessed 12 September 2022 (In Russ.). SPK, oil content 46–47%. Available via VNIIMK. https://vniimk.ru/products/spk/. Accessed 12 September 2022 (In Russ.). BELOSNEZhNYI, oil content 30–35%. Available via VNIIMK. https://vniimk.ru/products/bel osnezhnyy-sq/. Accessed 12 September 2022 (In Russ.).
Determination of Sunflower Seed Oil Content Using Natural Sunflower …
141
Measurements were conducted using typical AMV-1006M NMR analyzers of the oil and moisture content (VNIIMK, Russia). In accordance with the analytical procedure, when performing measurements by an AMV-1006M NMR analyzer, the volume of each analyzed seed weighment is equal to 25 cm3 . For the control of NMR analyzers and primary processing of NMR signals, obtained using the studied oil samples, the own software was used [28]. The obtained data were statistically analyzed using Statistica and Excel software.
Results and Discussion The main characteristics of sunflower seeds used in the study are presented in Table 1. It is known [2] that, for oilseeds with a moisture content of < 8%, the intensity of NM relaxation characteristics is determined exclusively by the protons of the oil and accompanying substances. This is due to the high degree of connection between water molecules and the protein part of the seeds. The data in Table 1 show that the moisture content of the samples under study is much lower. Therefore, the resulting analytical parameter will further characterize only TAG protons. The seed samples prepared for the analysis characterize the range of the oil content from 32.1 to 56.3%. The seeds are healthy; their acid number corresponds to the first-class sunflower and does not exceed 0.8 mg KOH/g for all samples. At the first stage of the study, we obtained the NM relaxation characteristics of the prepared oilseeds and determined their oil content using the Soxhlet method of exhaustive extraction. The obtained calibration curve, describing the dependence of the oil mass on the amplitude of the NMR signal, is shown in Fig. 1. The resulting curve is characterized by a high correlation coefficient of 0.9999. The main drawback of the described calibration technique is the complexity of implementation, duration, and high requirements for the qualification of personnel. Table 2 shows the calculated values of the oil mass in sunflower seeds and the actual values obtained by the extraction method. Table 2 shows that the maximum error in measuring the oil mass in the analyzed sample by the NMR method does not exceed 28 mg, which, in terms of the oil Table 1 Characteristics of the studied sunflower seeds Seed sample BELOSNEZhNYI
Indicators Oil content, %
Moisture content, %
Oil acid number, mg KOH/g
32.1
6.9
0.6
IMIDZh
41.3
5.2
0.7
DZhIN
42.5
5.5
0.6
SPK
48.2
5.3
0.8
UMNIK
56.3
4.8
0.6
142
O. S. Agafonov and S. M. Prudnikov
Fig. 1 Dependence of the mass of the sunflower oil, obtained by the Soxhlet extraction, on the amplitude of the NMR signal
Table 2 Calculated and actual (obtained by the extraction method) values of the oil mass in sunflower seeds Seed sample
Oil mass in the analyzed sample (Poil ), g
Deviation from the actual value, g
Deviation in terms of the oil content, %
Actual
Calculated
1
2.540
2.539
0.001
0.02
2
3.719
3.706
0.013
0.15
3
3.936
3.932
0.004
0.04
4
4.656
4.684
– 0.028
– 0.29
5
6.164
6.178
– 0.014
– 0.13
content, taking into account the seed moisture content and the mass of the sample with a volume of 25 cm3 , is < 0.29%. At the next stage, the possibility of using oil, obtained by pressing sunflower seeds, for the calibration of an NMR analyzer was investigated. Figure 2 illustrates the dependence of the oil mass on the amplitude of the NMR signal obtained using the oil pressed from sunflower seeds of three contemporary high-oil varieties (Dzhin, Imidzh, SPK). According to the presented curve, the variety special features of seeds cause no significant effect on the amplitude of the oil NMR signal and, consequently, on the obtained analytical dependence. The difference between the obtained curve and that shown in Fig. 1 can be explained by the introduction of different amounts of accompanying substances in the process of oil extraction and pressing.
Determination of Sunflower Seed Oil Content Using Natural Sunflower …
143
Fig. 2 Dependence of the pressed oil mass on the amplitude of the proton NMR signal
Table 3 provides the calculated values of the oil mass in sunflower seeds according to the calibration of an NMR analyzer using pressed oil. The application of a calibration curve, obtained using pressed oil, leads to a maximum measurement error of not more than 32 mg or 0.33 abs% in terms of the oil content taking into account the seed moisture content and the mass of the sample with a volume 25 of cm3 in the entire studied range. At the third stage of the study, two samples of sunflower oil were used: refined and deodorized of the “BLAGO” trademark and non-refined of the “STAVROPOL’E” trademark, acquired at a retail network. Figure 3 plots the dependence of the oil mass on the amplitude of the NMR signal, obtained using oil acquired at a retail network. Table 3 Calculated values of the oil mass in sunflower seeds according to the calibration of an NMR analyzer using pressed oil Seed sample
Oil mass in the analyzed sample (Poil ), g Actual
Deviation from the actual value, g
Deviation in terms of the seed oil content, %
Calculated
1
2.540
2.543
− 0.003
− 0.03
2
3.719
3.710
0.009
0.10
3
3.936
3.936
0.000
0.00
4
4.656
4.688
− 0.032
− 0.33
5
6.164
6.182
− 0.018
− 0.16
144
O. S. Agafonov and S. M. Prudnikov
Fig. 3 Dependence of the commercially distributed oil mass on the amplitude of the proton NMR signal
As in the case of pressed oil, the obtained curve of the dependence between the mass of the analyzed oil sample and the amplitude of the oil NMR signal has a linear nature with the high correlation coefficient. Table 4 provides the calculated values of the oil mass in sunflower seeds according to the calibration of the NMR analyzer using commercially distributed oil. The application of a calibration curve, obtained using commercially distributed oil, leads to a maximum measurement error of not more than 28 mg or 0.35 abs% in terms of the oil content taking into account the seed moisture content and mass of the sample with a volume 25 of cm3 in the entire studied range. Table 4 Results of the oil mass measurement in sunflower seeds according to the calibration, obtained using commercially distributed oil Seed sample
Oil mass in the analyzed sample (Poil ), g Actual
Deviation from the actual value, g
Deviation in terms of the seed oil content, %
– 0.35
Calculated
1
2.540
2.568
– 0.028
2
3.719
3.719
0.000
0.00
3
3.936
3.942
– 0.006
– 0.06
4
4.656
4.683
– 0.027
– 0.28
5
6.164
6.155
0.008
0.08
Determination of Sunflower Seed Oil Content Using Natural Sunflower …
145
At the next stage, the oil samples were studied for the temporal stability of NM relaxation characteristics. Three weighments of both refined deodorized and pressed oil were selected for a storage at a temperature of 8 °C in tightly-closed glass cups. Once a week, the samples were taken out of the refrigerator and thermostated at a temperature of 23 ± 0.5 °C for 4 h followed by threefold measurements of the oil NMR signal amplitude. The mean of three measurements was taken as the measurement result. Further, using the obtained earlier calibration equations, the oil masses of the studied samples were calculated and the deviations from the basic value were determined (Table 5). According to Table 5, the NM relaxation characteristics of the refined oil and, consequently, the calculated values of the oil mass remain stable during the considered storage time. However, for the pressed oil samples, the measured amplitude of the NMR signal of TAG protons considerably altered and led to a decrease in the calculated oil mass value by 570 mg. Thus, according to the results of the temporal stability study, pressed oil samples can preserve their proton NM relaxation characteristics during not more than 5–7 days, while the refined deodorized samples demonstrate the stability during not < 3 months at a temperature of 8 °C. This can be explained by the presence of a large quantity of free radicals, moisture, and other accompanying substances in pressed oil, facilitating the flow of oxidation processes, which lead to an increase in the quantity of free fatty acids and other products of oxidizing reactions. Table 5 Results of the oil mass measurement in the analyzed samples depending on the storage time Week
Deviation of measured oil mass values, g For the samples Refined deodorized 1
2
Pressed 3
1
2
3
0
0.000
0.000
0.000
0.000
0.000
0.000
1
– 0.012
– 0.007
– 0.012
0.048
0.049
0.051
2
0.009
– 0.011
–0.010
0.046
0.051
0.052
3
– 0.012
0.003
– 0.013
0.080
0.084
0.089
4
0.011
–0.010
0.013
0.117
0.117
0.126
5
0.008
0.003
0.011
0.166
0.168
0.173
6
– 0.010
– 0.008
– 0.012
0.214
0.219
0.222
7
– 0.013
– 0.010
0.007
0.264
0.269
0.270
8
0.012
0.009
0.015
0.315
0.317
0.321
9
– 0.011
– 0.009
– 0.007
0.366
0.364
0.368
10
– 0.006
– 0.010
– 0.009
0.427
0.428
0.429
11
0.010
0.012
– 0.003
0.491
0.490
0.491
12
– 0.011
– 0.010
0.010
0.568
0.567
0.566
146
O. S. Agafonov and S. M. Prudnikov
Table 6 Comparative characteristics of NMR-analyzer calibration methods for determining the oil content of sunflower seeds Indicator
Calibration procedure
Used materials
Traceable sunflower seeds
Pressed sunflower oil
Refined sunflower oil
Auxiliary equipment
Scales (Accuracy class—high-II), thermostat, Soxhlet extraction equipment
Scales (Accuracy class—high-II), thermostat, laboratory press
Scales (Accuracy class—high-II), thermostat
Calibration time
3 days
1 day
4h
Personnel qualification requirements
High
Medium
Medium
Sample reusability
None
Can be reused within 3–5 days
Can be reused within 3 months
Comparative characteristics of the studied methods for calibrating an AMV1006M NMR analyzer are presented in Table 6.
Conclusion The conducted research shows that the use of sunflower oil, obtained in different ways, for the calibration of NMR analyzers can significantly facilitate the calibration process, reduce the calibration time from 3–4 days to 3–4 h, as well as to eliminate the use of toxic solvents and additional expensive equipment from the process without significantly increasing the error in determining the oil content of sunflower seeds by the NMR method. Acknowledgments No financial support in the form of a grant from any organization in the public, commercial, or non-profit sector was obtained for the research. All measurements were carried out using the equipment of the V. S. Pustovoit All-Russian Research Institute of Oil Crops. Author cotributions The authors have contributed equally. Conflict of interest The article was prepared on the basis of a report presented at the V International Scientific Conference “Reference materials in measurements and technologies” (Yekaterinburg, September 13–16, 2022). The article was admitted for publication after the abstract was revised, the article was formalized and the review procedure was carried out. The version in the Russian language is published in the journal “Measurement Standards. Reference Materials” 2023;19(2):61–71 (In Russ.). https://doi.org/10.20915/2077-1177-2023-192-61-71
Determination of Sunflower Seed Oil Content Using Natural Sunflower …
147
References 1. GOST 22391-2015 (2019) Sunflower. Specifications. Standartinform, Moscow (in Russian) 2. GOST 10857-64 (2010) Oil seeds. Methods for determination of oil content. Standartinform, Moscow (in Russian) 3. GOST 32749-2014 (2019) Oilseeds, oilcakes and oilmeals. Determination of moisture, oil, protein and fiber by near-infrared reflectance. Standartinform, Moscow (in Russian) 4. Pérez-Vich B, Velasco L, Fernández-Martínez JM (1998) Determination of seed oil content and fatty acid composition in sunflower through the analysis of intact seeds, husked seeds, meal and oil by near-infrared reflectance spectroscopy. J Am Oil Chem Soc 75(5):547–555. https://doi.org/10.1590/fst.20118 5. Inmaculada M, Virginia V, López-González F, Oiz-Jiménez C, Iris O, Belén G et al (2013) Control of quality and silo storage of sunflower seeds using near infrared technology. Grasas y Aceites 64:30–35. https://doi.org/10.3989/gya.096312 6. Saha U, Endale D, Tillman P, Johnson W, Gaskin J, Sonon L et al (2017) Analysis of various quality attributes of sunflower and soybean plants by near infrared reflectance spectroscopy: development and validation calibration models. Am J Anal Chem 8:462–492. https://doi.org/ 10.4236/ajac.2017.87035 7. Grunvald AK, Leite RS, Terra IM, Carvalho CG, Mandarino JM, Andrade CV et al (2009) Calibration curve to predict oil content using near Infrared Reflectance Spectroscopy (NIR) in sunflower trials in Brazil. In: Rio Grande do Sul, Brasilia, 30 de setembro a 1o de outubro 2009. Embrapa Clima Temperado, Brasilia 8. Velasco L, Pérez-Vich B, Fernández-Martínez JM (2007) Relationships between seed oil content and fatty acid composition in high stearic acid sunflower. Plant Breed 126:503–508. https://doi.org/10.1111/j.1439-0523.2007.01371.x 9. Prudnikov SM (2003) The scientific and practical substantiation of methods of identification and quality assessment of oilseeds and products of their processing on the basis of a method of nuclear magnetic relaxation. Dissertation, VS Pustovoit All-Russian Research Institute of Oil Crops (in Russian) 10. Vityuk BY, Gorelikova IA, Prudnikov SM (2002) A simulator of signals of free precession of nuclear magnetic resonance and spin echoes from oil in oilseeds. RF Patent, No. 2191998 (in Russian) 11. Vityuk BY, Aspiotis EH (1980) Standard samples for calibration and verification of NMR analyzers of oil content and moisture content of oilseeds. In: collection of works I All-Union meeting of spectroscopy of coordination compounds, Krasnodar, p 16 (in Russian) 12. Rejhsfel’d VO (eds) (1980) Chemistry and technology of organosilicon elastomers. Leningrad, Chemistry (in Russian) 13. Bazhant V (2010) Silicones—organosilicon compounds, their derivation properties and application. Moscow, Nauka, p 700 (in Russian) 14. Gorodov VV (2018) Synthesis and properties of carboxyl-containing polydimethylsiloxanes. Dissertation, Enikolopov Institute of Synthetic Polymeric Materials Russian Academy of Sciences. https://www.dissercat.com/content/sintez-i-svoistva-karboksilsoderzhashchikhpolidimetilsiloksanov/read (in Russian) 15. Kotlayrova IA, Tereschenko GA, Voloshina OI (2016) Variability of seeds within a head on morphomet-ric traits and seed productivity at the modern sunflower varieties. Oil Crops 1:29–37 (in Russian) 16. Vasilyeva TA, Boyko YuG (2012) Dependence of the size of sunflower seeds on competition between them within baskets. Oil Crops 1:34–41 (in Russian) 17. Ren ZH, Liu C, Wang HZ, Zhang XL, Yang PQ (2008) Simultaneous determination of oil content in oilseed by pulsed NMR. In: Proceedings 2nd international conference Bioinformatics and Biomedical Engineering, Institute of Electrical and Electronics Engineers, Shanghai, China, 16–18 May 2008, pp 2244–2247. https://doi.org/10.1109/ICBBE.2008.892 18. Gambhir PN (1992) Applications of low-resolution pulsed NMR to the determination of oil and moisture in oilseeds. Trends Food Sci Technol 3:191–196
148
O. S. Agafonov and S. M. Prudnikov
19. Guy R (1994) Simultaneous determination of oil and water contents in different oilseeds by pulsed nuclear magnetic resonance. J Am Oil Chem Soc 71:1057–1062 20. Ropp JS, McCarthy MJ (2006) Nuclear magnetic resonance in the analysis of foodstuffs and plant materials. Encyclopedia of analytical chemistry: applications, theory and instrumentation. https://doi.org/10.1002/9780470027318.a1019 21. Praduman Y (2016) Calibration of NMR spectroscopy for accurate estimation of oil content in sunflower, safflower and castor seeds. Current Science 110(1):73–76. https://doi.org/10.18520/ cs/v110/i1/73-80 22. Robertson JA, Morrison WH (1979) Analysis of oil content of sunflower seed by wide-line NMR. J Am Oil Chem Soc 56:961–964. https://doi.org/10.1007/BF02674143 23. Hutton WC, Garbow JR, Hayes TR (1999) Nondestructive NMR determination of oil composition in transformed canola seeds. Lipids 34(12):1339–1346. https://doi.org/10.1007/s11745999-0487-0 24. Kotyk JJ, Pagel MD, Deppermann KL, Colletti RF, Hoffman NG, Yannakakis EJ et al (2005) High-throughput determination of oil content in corn kernels using nuclear magnetic resonance imaging. J Am Oil Chem Soc 82(12):855–862. https://doi.org/10.1007/s11746-005-1155-5 25. Prudnikov SM, Agafonov OS, Zverev LV, Vitiuk BY, Gorelikova IA (2019) Simulator of a free procession of nuclear magnetic resonance and spin echo oil with a different mass fraction of oleic acid in sunflower seeds. RF Patent 2677644 (in Russian) 26. GOST 8.597-2010 (2011) State system for ensuring the uniformity of measurements. Oilseeds and oilseeds residues. Determination of oil and moisture content using pulsed nuclear magnetic resonance spectrometry. Standartinform, Moscow (in Russian) 27. GOST 31933-2012 (2019) Vegetable oils. Methods for determination of acid value. Standartinform, Moscow (in Russian) 28. Agafonov OS, Zverev LV, Prudnikov SM (2019) Software package for control, reception, processing and storage of NMR analyzer information. Certificate of registration of a computer program RU 2019666343, 09.12.2019 (in Russian)
Measurement of Carbon Isotope Ratio in Vanillin Using the CM-CRDS Method: Achieving an Expanded Uncertainty Below 0.1‰ Ian K. Chubchenko
Abstract Isotopic analysis is an effective method for quality control and detection of adulterated food products, with the elemental analyzer isotope ratio mass spectrometry (EA-IRMS) being the conventional approach, specified in relevant regulatory documents. Although measuring the carbon isotope ratio by combustion module cavity ring-down spectroscopy (CM-CRDS) has gained significant interest for isotope analysis of food products, its metrological characteristics remain understudied for analysis of the isotopic composition of vanillin. Therefore, this article focuses on the development of a measurement procedure of the carbon isotope ratio in vanillin in preparation for the international key comparison CCQM-K167 “Carbon Isotope Delta Measurements of Vanillin”. The experimental part of the research was carried out using the reference installation included in the State primary standard for units of molar fraction, mass fraction, and mass concentration of components in gases GET 154-2019. The expanded uncertainty (at k = 2) of this measurement method was < 0.09‰, which is comparable to the best measurements obtained by the EA-IRMS method. The achieved results validate the applicability of the CM-CRDS method for quality control and detection of adulterated vanillin. Keywords Metrology · Stable isotope · Isotope ratio mass spectrometry · Isotope-ratio infrared spectroscopy · CRDS · CM-CRDS · EA-IRMS · Vanillin · 13 12 C/ C · δ13 C · Isotope ratio · Measurement procedure
Introduction Isotopic analysis is an effective method for quality control and detection of adulterated food products, which is widely used in the Russian Federation for quality control and confirmation of juice product safety under TR CU
I. K. Chubchenko (B) D. I. Mendeleyev Institute for Metrology, Saint Petersburg, Russia e-mail: [email protected] © D. I. Mendeleyev Institute for Metrology 2024 E. P. Sobina et al. (eds.), Reference Materials in Measurement and Technology, https://doi.org/10.1007/978-3-031-49200-6_10
149
150
I. K. Chubchenko
023/2011 [1] and alcoholic products under TR EEC 047/2018 [2]. The corresponding measurement methods are regulated by GOST R 55460-2013, GOST R 55518-2013, GOST 32710-2014 [3–5], and in the Federal Information Fund under reg. no FR.1.31.2014.17273, FR.1.31.2016.24753, FR.1.31.2018.31997, FR.1.31.2013.15529, FR.1.31.2016.24962, FR.1.31.2017.28360, and FR.1.31.2012.13424.1 In world practice, the method is used for quality control of food products, including honey [6–8], juices [9], baby food, alcoholic drinks [10], olive oil [11], cheese [12], beef [13], and vanillin [14]. In particular, isotopic analysis plays a crucial role in differentiating natural vanillin from its synthetic analog [15]. The method of elemental analyzer isotope ratio mass spectrometry (EA-IRMS) [16, 17] is widely used in the field of isotope analysis for food products and is regulated in the relevant normative documents. The expanded uncertainty (at k = 2) for the ratio of stable carbon isotopes δ13 CVPDB in vanillin measured by the EA-IRMS method varies from 0.06‰ to 3.8‰ [15, 18–21, 28]. The combustion module cavity ring-down spectroscopy (CM-CRDS) method comprises a rapidly developing technique for measuring carbon isotope ratios in food products that offers a number of advantages, including the ease of operation, a high level of automation, and the low cost of equipment and consumables. A number of scientific papers [22–25] investigated the metrological characteristics of the CMCRDS method in the analysis of the isotopic composition of food products such as honey, milk, lemon, and coconut juices. The standard uncertainty of the measurements of carbon isotope ratio in honey by the CM-CRDS method in the works [23, 26] ranged from 0.01 to 0.32‰, while for lemon juice in the work [22] from 0.02 to 1
FR.1.31.2012.13424 Method for measuring the 13C/12C isotope ratio of ethanol in beer and beer drinks by isotope mass spectrometry. Available via FIF EUM. https://fgis.gost.ru/fundmetrology/ registry/16/items/282517. Accessed 11 November 2022 (In Russ.). FR.1.31.2013.15529 The methodology establishes the procedure for determining the ratio of 18O/16O isotopes of exogenous and endogenous water in wines and musts. Available via FIF EUM. https://fgis.gost.ru/fundmetrology/registry/16/items/281364. Accessed 11 November 2022 (In Russ.). FR.1.31.2014.17273 Method for measuring the ratio of carbon isotopes 13 C/12 C in alcoholic beverages of grape origin by isotope mass spectrometry. Available via FIF EUM. https://fgis.gost. ru/fundmetrology/registry/16/items/280000. Accessed 11 November 2022 (In Russ.). FR.1.31.2016.24753 Method for measuring the oxygen isotope ratio, 18 O/16 O of exogenous and endogenous water in wines and musts by isotope mass spectrometry. Available via FIF EUM. https:// fgis.gost.ru/fundmetrology/registry/16/items/298716. Accessed 11 November 2022 (In Russ.). FR.1.31.2016.24962 Method for measuring ethanol isotope ratios in cognacs and cognac distillates by isotope mass spectrometry. FR.1.31.2016.24962 Method for measuring ethanol isotope ratios in cognacs and cognac distillates by isotope mass spectrometry. Available via FIF EUM. https://fgis.gost.ru/fundmetrology/registry/16/items/298746. Accessed: 11 November 2022 (In Russ.). FR.1.31.2017.28360 Method for measuring the ratios of carbon, oxygen, hydrogen isotopes of ethanol to detect the presence of synthetic alcohol in alcoholic products, as well as in alcoholcontaining food flavorings by isotope mass spectrometry. Available via FIF EUM. https://fgis.gost. ru/fundmetrology/registry/16/items/299163. Accessed 11 November 2022 (In Russ.). FR.1.31.2018.31997 Method for measuring the ratio of oxygen isotopes 18 O/16 O of the water component of ciders and poiret by isotope mass spectrometry. Available via FIF EUM. https://fgis. gost.ru/fundmetrology/registry/16/items/495958. Accessed 11 November 2022 (In Russ.).
Measurement of Carbon Isotope Ratio in Vanillin Using the CM-CRDS …
151
0.28‰. However, no data on the expanded uncertainty (at k = 2) of the measurements of the stable carbon isotope ratio δ13 CVPDB in vanillin by the CM-CRDS method are reported in the scientific literature. The paper [27] describes the methods to address several factors that contribute to the measurement uncertainty budget for substances and materials by the CM-CRDS method, including the impact of the CO2 feed concentration and the influence of the dilution gas on the readings of the CM-CRDS analyzer. In order to reduce the adverse effects, correction factors are proposed in the work [27]. In addition, the sample masses are selected to ensure that the volume fractions of carbon dioxide in the gas mixtures, formed following the combustion of the test and reference materials and entering the analyzer, remain identical, while the same dilution gas is used. However, the development of a technique for measuring the carbon isotope ratio in vanillin by the CM-CRDS method was beyond the scope of this work [27]. This study introduces a method for measuring the carbon isotope ratio in vanillin by the CM-CRDS method, achieving an expanded uncertainty (at k = 2) of < 0.1‰. The indicated value of the expanded uncertainty was selected on the basis of the accuracy analysis of the EA-IRMS method. The objectives of the study were as follows: to determine the factors that contribute to the measurement uncertainty budget of the carbon isotope ratio in vanillin and to eliminate or minimize their adverse effects if possible; to develop a procedure for determining the carbon isotope ratio in vanillin by CM-CRDS; to validate the metrological characteristics of the procedure in international key comparisons. The following methodology can be used to detect the adulteration of vanillin in the food industry.
Materials and Methods The measurement methods were developed in preparation for the international key comparison CCQM-K167 “Carbon Isotope Delta Measurements of Vanillin” organized by the international workshop on isotope ratio measurements of the Consultative Committee for Amount of Substance (CCQM) of the International Bureau of Weights and Measures (BIPM), held from 2019 to 2022. A high-purity sample of natural vanillin, prepared by the National Research Council of Canada (NRC) as part of the international comparison CCQM-K167 was used for analysis. The experimental part was carried out using the reference installation included in the State primary standard for units of molar fraction, mass fraction, and mass concentration of components in gases GET 154-2019,2 which includes a Picarro G2131i cavity ring-down spectrometer (CRDS) (referred to as the analyzer) and a 2
GET 154-2019 State Primary Standard of Units of Mole Fraction, Mass Fraction and Mass Concentration of Components in Gas and Gas Condensate Environments: Custodian Institute VNIIM im. D. I. Mendeleev. Available via FIF EUM. https://fgis.gost.ru/fundmetrology/registry/12/items/136 5155. Accessed 11 November 2022 (In Russ.).
152
I. K. Chubchenko
Picarro combustion module (CM) (referred to as the combustion module) (Fig. 1). The CM-CRDS method involves instantaneous combustion of a sample in the oxidation reactor of the combustion module when oxygen is introduced to the nitrogen flow, the purification of the resulting gas mixture from impurities (NO2 , SO2 , H2 O, and excess oxygen) in the combustion module, and the analysis of the isotopic composition of the formed carbon dioxide by a cavity ring-down spectrometer. The external appearance of the reference setup is shown in Fig. 2. The oxygen of ultra-high purity (volume fraction of oxygen of at least 99.999% according to TU 2114-001-05798345-2007 “Oxygen in liquid and gaseous form of ultra-high purity”) was used as an oxidizing gas (referred to as oxygen). Gaseous nitrogen (volume fraction of nitrogen of at least 99.999%, referred to as nitrogen) was used as a carrier gas. The traceability of the δ13 CVPDB certified value to the
Fig. 1 Functional diagram of reference installation
Fig. 2 External appearance of reference setup
Measurement of Carbon Isotope Ratio in Vanillin Using the CM-CRDS …
153
international reference delta scale VPDB is achieved by using certified reference materials CIPM/104-263 approved by the decision of the BIPM. To calibrate the reference installation, the following international reference materials (RMs) were used: UME CRM 1312 (honey, certified δ13 CVPDB value of − 24.095‰, combined standard uncertainty of 0.039),4 IAEA-CH-3 (cellulose, certified δ13 CVPDB value of − 27.724‰, combined standard uncertainty of 0.041),5 IAEA-600 (caffeine, certified δ13 CVPDB value of − 27.771‰, combined standard uncertainty of 0.043),6 IAEACH-7 (polyethylene, certified δ13 CVPDB value of − 32.151‰, combined standard uncertainty of 0.050).7 NBS22 (mineral oil, certified δ13 CVPDB value of − 30.03‰, combined standard uncertainty of 0.04)8 was used for accuracy control. The samples were weighed using laboratory electronic scales MV 210-A manufactured by CJSC “Sartogosm” in St. Petersburg (referred to as laboratory scales). The measurements were carried out according to the methodology developed at D. I. Mendeleyev Institute for Metrology over a one-month period in 2020. The final report of the international key comparisons CCQM-K167, which confirmed the obtained result, was published in the International Key Comparison Database (KCDB) in 2022.
Equipment Preparation All equipment was prepared for operation in accordance with the operation manuals. Subsequently, a series of tests described below were carried out to verify their serviceability and to achieve optimal metrological characteristics. The detailed substantiation of these tests, along with the factors contributing to the measurement uncertainty budget, can be found in the “Results and Discussion” section. Prior to commencing the operation on the reference installation, nitrogen and oxygen were connected to the combustion module, and the inlet pressure was adjusted. The gas leakage test was carried out in accordance with the CM manual, and the standard nitrogen and oxygen flow rates were configured. However, during the operation, it was observed that the set oxygen flow rate varied over time. Therefore, to 3
104th meeting of the CIPM (Session I), 9 to 10 March 2015. Available via BIPM. https://www. bipm.org/en/committees/ci/cipm/104-_1-2015. Accessed 11 November 2022. 4 UME CRM 1312 Certificate of the Reference Material Honey (unadulterated). Available via. https://rm.ume.tubitak.gov.tr/sertifika/ume_crm_1312_certificate.pdf. Accessed 11 November 2022. 5 IAEA-CH-3 Cellulose. Available via. https://nucleus.iaea.org/sites/ReferenceMaterials/Pages/ IAEA-CH-3.aspx. Accessed 11 November 2022. 6 IAEA-600 Caffeine. Available via: https://nucleus.iaea.org/sites/ReferenceMaterials/Pages/ IAEA-600.aspx. Accessed 11 November 2022. 7 IAEA-CH-7 Polyethylene. Available via. https://nucleus.iaea.org/sites/ReferenceMaterials/Pages/ IAEA-CH-7.aspx. Accessed 11 November 2022. 8 NIST RM 8539 NBS 22 oil (carbon and hydrogen isotopes in oil). Available via. https://www.sig maaldrich.com/RU/en/product/sial/nistrm8539. Accessed 11 November 2022.
154
I. K. Chubchenko
ensure efficient oxidation and improve the reproducibility of the measurement results, the oxygen flow rate was set anew prior to each series of measurements (approximately once every 5 h). In accordance with the operation manual, the combustion module was switched to the heating mode of the oxidation reactor. The heating of the combustion module required at least 12 h. The operating parameters of the combustion module in the software were as follows: “Sample delay”—18 s, “Sample stop”—10 s, “Oxygen stop”—50 s, and “Run time”—900 s. The working parameters for processing the measurement results were preset in Picarro Peak Integration Software: “Pre-trigger time”—10 s, “Post-trigger time”—120 s, “Threshold ratio above baseline”—2000%, “Sample run time”—900 s. In the initial test, the background values of carbon dioxide in nitrogen were measured in order to minimize the influence of carbon dioxide present in nitrogen on the analyzer readings. To achieve this, the Picarro Caddy A2100 continuous flow interface (Fig. 1) was switched from the “atmospheric air” position to the “combustion module” position. Nitrogen was passed through the combustion module without heating the oxidation reactor to the analyzer. The test was considered successful if the analyzer readings for the 12 CO2 component were below 0.1 ppm. In the second test, the background values of carbon dioxide in nitrogen flowing through the heated combustion module were measured in order to minimize the impact of residual carbon in the oxidation reactor on the analyzer readings. To achieve this, the combustion module was switched to the heating mode of the oxidation reactor following the instructions provided in the operation manual. The heating of the combustion module required a minimum of 12 h. During the heating process, residual carbon in the oxidation reactor was oxidized to carbon dioxide and, mixed with nitrogen, was supplied to the analyzer. The test was considered successful if the analyzer readings for the 12 CO2 component were < 0.2 ppm. In the third test, the background values of carbon dioxide in the blank sample were measured in order to minimize the impact of carbon dioxide in oxygen on the analyzer readings. To achieve this, no sample was loaded into the autosampler, and the measurement process was initiated using a portion of oxygen that oxidized the remaining organic contaminants in the reactor. The test was considered successful if the analyzer readings for the 12 CO2 component were < 2.5 ppm. In the fourth test, the background values of carbon dioxide in the tin crucible were measured in order to minimize the effect of residual carbon in the tin crucible on the readings of the analyzer. To achieve this, the empty tin crucible was loaded into the autosampler. The measurement was initiated, with a portion of oxygen supplied to the oxidation reactor, which oxidized the remaining organic contaminants in the reactor and tin crucible. The test was considered successful if the analyzer readings for the 12 CO2 component were < 25 ppm. In the fifth test, the linearity of the analyzer with respect to carbon dioxide concentrations was examined in order to identify and address the influence of analyzer nonlinearity on the measurement result. To carry out this test, gas mixtures with different concentrations but identical isotopic compositions of carbon dioxide were introduced into the analyzer through the Picarro Caddy A2100 gas-distributing system. The gas mixtures containing a gas mixture of carbon dioxide in nitrogen GSO
Measurement of Carbon Isotope Ratio in Vanillin Using the CM-CRDS …
155
10768-2016, cylinder No. 66902 (0.45099%) (referred to as GSO 10768-2016), and nitrogen were prepared using the mixed gas generator GGS-R, Reg. No. in Federal Information Fund 62151-15 (referred to as generator). The linearity of the analyzer was tested in the range of carbon dioxide volume fractions from 2000 to 4000 ppm. The test was considered successful if the deviation of the measured values from the linear dependence was < 0.1 ppm. In the sixth test, the focus was on evaluating the stability of the analyzer to identify and address any potential impact of instability on the measurement results. To carry out this test, the same gas mixture (0.2% CO2 /N2 ) obtained by diluting the GSO 10768-2016 with nitrogen in the generator was injected 10 times into the analyzer through the Picarro Caddy A2100 gas-distributing system. The test was considered successful if the standard deviation of the results was < 0.05‰. In the seventh test, the combustion efficiency of samples at various temperatures in the combustion module was examined in order to evaluate and, if necessary, eliminate the effect of incomplete combustion of the sample on the measurement result. For this task, six IAEA-600 samples were loaded into the autosampler. Three samples were burned at 980 °C, while the remaining three were burned at 1100 °C. The test was considered successful if the difference in arithmetic mean values for different temperatures was < 0.1‰. If the above conditions were violated, the tests were repeated. In case the conditions continued to be unsatisfactory, the factors leading to inadequate results were identified and eliminated. In order to verify the combustion efficiency of the sample in the combustion module, two tests, namely the seventh and the third, were performed during the measurements, with the third test being carried out prior to each series of measurements.
Sample and Reference Material Preparation 0.74 to 0.88 mg of vanillin extracted from one test sample was weighed in tin crucibles on a laboratory scale. Reference materials IAEA-600, IAEA-CH-3, IAEA-CH-7, UME CRM 1312, and NBS22 were processed using the same procedure. The masses of IAEA-600 samples ranged from 0.85 to 1.06 mg, of IAEA-CH-3—from 1.02 to 1.28 mg, of IAEA-CH-7—from 0.54 to 0.65 mg, of UME CRM 1312—from 1.32 to 2.31 mg, and of NBS22—from 0.55 to 0.73 mg. The masses were selected to ensure that the volume fractions of carbon dioxide in the gas mixtures generated following the combustion of the test and reference materials differ by no more than 300 ppm and ranged from 2500 to 3500 ppm. The tin crucibles with samples were tightly compressed into a cube shape to minimize the content of atmospheric air within the crucible. For each series of measurements, two samples of each reference material and one test sample of vanillin were prepared.
156
I. K. Chubchenko
Measurements During laboratory measurements, the following conditions were carefully controlled: • air temperature between 22 and 25 °C, • atmospheric pressure between 99 and 103 kPa, • relative humidity of no more than 60%. Samples packed in tin crucibles were placed in the autosampler, which automatically delivered them to the oxidation reactor in the combustion module heated to 980 or 1100 °C, where they were oxidized to CO2 , H2 O, NOx , and SOx in a flow of nitrogen (100 ml/min) and oxygen (30 ml/min). The oxidation reactor consisted of a hollow quartz heat-resistant glass tube filled with chromium oxide, copper wire, and silvered cobalt oxide separated by silica wool interlayers. Chromium oxide was used to facilitate the sample oxidation. The gas mixture of nitrogen, oxygen, and the oxidation products (CO2 , H2 O, NOx , SOx ) was passed through the copper wire to remove NOx and oxygen, prior to the contact with the silvered cobalt oxide to remove SOx . The resulting gas mixture of CO2 , H2 O, and nitrogen was directed through the H2 O removal trap, i.e., a glass hollow tube filled with magnesium perchlorate and quartz wool, prior to entering a Picarro Caddy A2100 gas distribution system containing two expansion volumes in the form of Swagelok steel cylinders (50 ml) and further to the analyzer for measurements. Each measurement series presented in Table 1 comprised a sequence of measurements of the following samples: Blank test—Control sample (Acetanilide, Thermo Fisher Scientific)—Reference material 2—Reference material 1—Test sample— Reference material 2—Reference material 1.
Data Processing The stable carbon isotope ratio for the analyzed vanillin sample (δ 13 C VPDB , ‰) was calculated using the following formula: δ 13 C V P D B =
) X 1c − X 2c ( mes − X 1mes + X 1c mes mes X t X1 − X2
(1)
where X 1c is the value of the carbon isotope ratio listed in the certificate of RM 1 (of the two specified in the “Materials and Methods” section), X 2c is the value of the carbon isotope ratio listed in the certificate of RM 2 (of the two specified in the “Materials and Methods” section), X tmes is the measured value of the carbon isotope ratio in the test sample, obtained by introducing a correction associated with the nonlinearity of the analyzer for carbon dioxide concentrations (refer to the fifth test in “Equipment Preparation” section), to the analyzer reading X A :
Measurement of Carbon Isotope Ratio in Vanillin Using the CM-CRDS …
157
Table 1 Measurement results of carbon isotope ratio δ13 CVPDB in vanillin Vanillin sample number
Vanillin sample mass, mg
Measured carbon isotope ratio δ13 CVPDB in vanillin, ‰
Reference materials
Temperature in oxidation reactor, °C
1
0.760
– 25.75
IAEA-600 and IAEA-CH-3
980
2
0.800
– 25.80
IAEA-600 and IAEA-CH-3
980
3
0.800
– 25.79
IAEA-600 and IAEA-CH-3
980
4
0.790
– 25.78
IAEA-600 and IAEA-CH-3
980
5
0.880
– 25.84
IAEA-600 and IAEA-CH-3
980
6
0.850
– 25.85
IAEA-600 and IAEA-CH-3
980
7
0.850
– 25.83
IAEA-600 and IAEA-CH-3
980
8
0.860
– 25.87
IAEA-600 and IAEA-CH-3
980
9
0.860
– 25.81
IAEA-600 and IAEA-CH-3
1100
10
0.870
– 25.89
IAEA-600 and IAEA-CH-3
1100
11
0.870
– 25.83
IAEA-600 and IAEA-CH-3
1100
12
0.850
– 25.74
IAEA-CH-7 and UME CRM 1312
980
13
0.870
– 25.86
IAEA-CH-7 and UME CRM 1312
980
14
0.870
– 25.81
IAEA-600 and IAEA-CH-3
1100
15
0.840
– 25.79
IAEA-600 and IAEA-CH-3
1100
16
0.860
– 25.81
IAEA-600 and IAEA-CH-3
1100
17
0.740
– 25.82
IAEA-600 and IAEA-CH-3
1100
18
0.750
– 25.82
IAEA-600 and IAEA-CH-3
1100
19
0.740
– 25.76
IAEA-600 and IAEA-CH-3
1100
158
I. K. Chubchenko
X tmes = X t − 0.0002 ∗ (3000 − Yt )
(2)
where X t is the analyzer reading when feeding test sample, Yt is the measured value of the volume fraction of carbon dioxide in the test sample, X 1mes is the measured value of the carbon isotope ratio in RM 1, obtained by introducing corrections related to the drift and nonlinearity of the analyzer for carbon dioxide concentrations (refer to the fifth test in the “Equipment Preparation” section), to the analyzer reading: ) 1( m X 1 − X 1n 3 ) ( − 0.0002 ∗ 3000 − Y1n
X 1mes = X 1n + X 1n = X 1n
( ) X 1mes = X 1m − 0.0002 ∗ 3000 − Y1m
(3) (4) (5)
X 1n is the analyzer reading when RM 1 is injected prior to feeding a test sample, X 1m is the analyzer reading when RM 1 is injected following feeding a test sample, Y1n is the measured value of the carbon dioxide volume fraction when RM 1 is injected prior to feeding test sample, Y1m is the measured value of the carbon dioxide volume fraction when RM 1 is injected following feeding test sample, X 2mes is the measured value of carbon isotope ratio in RM 2, obtained by introducing corrections associated with drift and nonlinearity of the analyzer for carbon dioxide concentrations (refer to the fifth test in “Equipment Preparation” section), to the analyzer reading: ) 2( m X 2 − X 2n 3 ) ( − 0.0002 ∗ 3000 − Y2n
X 2mes = X 2n + X 2n = X 2n
) ( X 2m = X 2m − 0.0002 ∗ 3000 − Y2m
(6) (7) (8)
X 2n is the analyzer reading when RM 2 is injected prior to feeding a test sample, X 2m is the analyzer reading when RM 2 is injected following feeding a test sample, Y2n is the measured value of the carbon dioxide volume fraction when RM 2 is injected prior to feeding a test sample, Y2m is the measured value of the carbon dioxide volume fraction when RM 2 is injected following feeding test sample,
Measurement of Carbon Isotope Ratio in Vanillin Using the CM-CRDS …
159
Measurement Accuracy Control The periodic accuracy control was carried out using the international standard sample NBS22 as the control sample. The deviation of the carbon isotope ratio measured by this technique in the control 13 cer t sample δ 13 C Vmes P D B from the δ C V P D B value, specified in the certificate, must satisfy the condition | 13 mes |δ C
V P DB
| − δ 13 C VcerPtD B | ≤ 0.1 0/00
(9)
If Condition (9) is unsatisfied, the test procedure is repeated. In case of repeated failure to meet the conditions, the factors leading to unsatisfactory results are identified and addressed.
Results and Discussion The measurement results of the carbon isotope ratio in vanillin using the developed method are presented in Table 1. Each measured value of the carbon isotope ratio δ13 CVPDB in vanillin is calculated by Eq. (1). The sources of uncertainty in measurements are shown in Fig. 3. The factors contributing to the measurement uncertainty budget are marked in bold and underlined on the diagram, while other factors are minimized or eliminated. The first and second tests, described in the “Equipment Preparation” section, provided the means to determine the value of the factor “Background values of carbon dioxide in the dilution gas and oxidizing gas.” The third test helped to minimize the factor “Purity of quartz reactor.” The fourth test allowed the value of the factor “Background values of carbon dioxide in the tin crucible” to be identified. To address the “Combustion efficiency” factor, the seventh test was carried out. To eliminate the factors “Oxidizing gas and dilution gas flow rate” and “Oxidizing gas flow rate,” the standard nitrogen flow rate was adjusted, and the oxygen flow rate was recalibrated prior to each series of measurements. The “Environment” factor was excluded from the measurement uncertainty budget, since the temperature in the measuring cell of the analyzer was maintained at 45.55 ± 0.01 °C in automatic mode, the pressure was 18,667 ± 20 Pa, and the room temperature was maintained within the range of 22–25 °C. To address the factor “Purity of oxidizing gas and dilution gas,” the purity of oxidizing gas and dilution gas was analyzed using GET 154-2019 described in the “Materials and Methods” section. The factors “Purity and homogeneity of test sample” and “purity and homogeneity of RM” were excluded from the measurement uncertainty budget, since high purity and homogeneity are ensured by the manufacturers of the samples.
160
I. K. Chubchenko
Fig. 3 Sources of measurement uncertainty
The source of uncertainty “Reproducibility of measurements” included the following factors: “Calibration” and “Repeatability.” The uncertainty budget of measurements of carbon isotope ratio δ13 CVPDB in vanillin is presented in Table 2. The primary source of uncertainty in the uncertainty budget was attributed to the certified uncertainty values of the used reference materials. The linearity of the analyzer for carbon dioxide concentrations, verified in the fifth test, has no contribution to the uncertainty budget, since corrections (4), (5), (7), Table 2 Uncertainty budget of measurements of carbon isotope ratio δ13 CVPDB in vanillin Type of uncertainty
Source of uncertainty
Value, ‰
Type A
Reproducibility of measurements
0.01
Type B
Certified uncertainty values of reference materials
0.04
Background values of carbon dioxide in tin crucible, dilution gas and oxidizing gas
0.01
Absolute combined standard uncertainty
0.045
Expanded uncertainty (at k = 2)
0.09
Measurement of Carbon Isotope Ratio in Vanillin Using the CM-CRDS …
161
and (8) were applied to the measurement results using the dependence established in the fifth test and shown in Fig. 4. The analyzer instability examined in the sixth test is excluded from the uncertainty budget, since the measurement result was corrected for drift of readings using Eqs. (3) and (6). The developed procedure was used to carry out the measurements of the carbon isotope ratio δ13 CVPDB in vanillin within the framework of the international key comparisons CCQM-K167 [28]. A comparison of the measurement results with those obtained by other participants is presented in Table 3 and Fig. 5. The values measured by the participants are shown in the column δ13 CVPDB . The result obtained by the method developed in this work is denoted as “VNIIM,” with the combined standard uncertainty indicated in the column u(x) being 0.04‰ (obtained at FSUE “VNIIM named after D. I. Mendeleyev”). The expanded uncertainty (at k = 2) of measurements u(x) obtained using the developed method equaled 0.09‰. The DoE values show the deviation of the measurement result from the Key Comparison Reference Value. The expanded uncertainty U95 DoE was calculated by the organizer of comparisons using the Bayesian method. Despite the fact that the participants used the EA-IRMS method which was generally considered to be more accurate in comparison with the CM-CRDS method, the values of measurement uncertainty u(x), U(x), and U95 DoE obtained by the authors are among the lowest values. Figure 5 shows the DoE values obtained by each participant in the key comparisons, which show the deviation of the measurement result from the reference value. For the result obtained using the developed technique, the DoE equals 0.023‰, which is significantly lower than the declared expanded uncertainty of 0.09‰. This confirms the high accuracy and precision of the measurement result obtained by the authors.
Fig. 4 Dependence of analyzer readings of δ 13 C V P D B on the volume fraction of carbon dioxide
162
I. K. Chubchenko
Table 3 Results of the international key comparison CCQM-K167 “Carbon Isotope Delta Measurements of Vanillin” [23] Institution
Country
Method
δ13 CVPDB , ‰
u(x), ‰
U(x), ‰
DoE
U95 DoE
INMETRO
Brazil
EA-IRMS
–25.96
0.056
0.11
–0.127
0.178
JSI
Slovenia
EA-IRMS
–25.87
0.06
0.11
–0.037
0.180
NRC
Canada
EA-IRMS
–25.86
0.03
0.06
–0.027
0.146
NMIA
Australia
EA-IRMS
–25.833
0.041
0.083
0.000
0.156
UME
Turkey
EA-IRMS
–25.82
0.08
0.16
0.013
0.170
NIM
China
EA-IRMS
–25.812
0.048
0.096
0.021
0.166
VNIIM
Russia
CM-CRDS
–25.81
0.04
0.09
0.023
0.154
LGC
United Kingdom
EA-IRMS
–25.72
0.05
0.11
0.113
0.166
Fig. 5 Results of international key comparison CCQM-K167 “Carbon Isotope Delta Measurements of Vanillin” [23]
All participants of the key comparisons carried out the instrument stability test similar to the fifth test (“Equipment preparation” section). All participants except JSI completed the impurity content test for the carrier gas, similar to the first test. An instrument linearity test, similar to the sixth test, was performed by JSI, LGC, NMIA, and NRC. JCI and LGC performed the peak center adjustment test. LGC and NRC performed the EA-IRMS leak test. NIM carried out the following tests prior to each series of measurements: sensitivity evaluation, peak shape test, repeatability, and blank sample analysis, similar to the third test outlined in the “Equipment Preparation” section.
Measurement of Carbon Isotope Ratio in Vanillin Using the CM-CRDS …
163
Table 4 Reference materials used in international key comparisons CCQM-K167 “Carbon Isotope Delta Measurements of Vanillin” [23] Reference material
JSI
VNIIM
NRC
LGC
LGC 1712
+
USGS66
+ +
IAEA-CH-6
+
UME
NMIA
+
+
INMETRO
+ +
BCR-657 USGS65
+
+
UME 1312
+
IAEA-CH-3
+
+ +
USGS40 +
IAEA-600
+ +
+
+ +
+ +
+
USGS61 USGS64
+
+ +
NBS 22 IAEA-CH-7
LGC 1711
NIM
+
+ +
The sample masses of vanillin prepared by the participants ranged from 0.069 to 0.88 mg. The average sample mass for the participants was 0.41 mg, which is lower than the average mass for our method (0.81 mg). The international reference materials used by the participants of the key comparisons are listed in Table 4. The same RMs used in our developed method, namely IAEA-CH-3, IAEA-600, and IAEA-CH-7, were used by three institutions: NIM, NMIA, and NRC. The successful participation in the international key comparisons allowed FSUE “VNIIM named after D.I. Mendeleyev” to be the first laboratory in the Russian Federation to have its calibration and measurement capabilities (CMC)9 listed in the international KCDB BIPM database for isotope ratio measurements. A comparative analysis of the results obtained in the international key comparisons CCQM-K167 confirms the accuracy and declared uncertainty of the measurement results obtained using the developed methodology. Therefore, the aim of the study has been achieved: a method for measuring the carbon isotope ratio in vanillin by CM-CRDS with an expanded uncertainty (at k = 2) of < 0.1 ‰ was developed. To achieve the goal, the following tasks were addressed: identification of factors contributing to the measurement uncertainty budget, implementation of procedures for equipment and sample preparation, establishment of measurement accuracy control procedures, and development of processing procedures for measurement results. 9
CMC Quick search. Available via CIPM MRA database (KCDB). https://www.bipm.org/kcdb/ cmc/quick-search?includedFilters=&excludedFilters=&page=0&keywords=VNIIM+ isotope. Accessed 11 November 2022.
164
I. K. Chubchenko
The results of the international key comparisons CCQM-K167 confirmed the feasibility of measuring the carbon isotope ratio in vanillin by the developed CMCRDS method with an expanded uncertainty (at k = 2) of 0.09 ‰, which corresponds to the best measurements performed by the EA-IRMS method. Further research will focus on the development of procedures for measuring carbon isotope ratios using the CM-CRDS method in other substances and materials.
Conclusion In the course of this study, a procedure for measuring the carbon isotope ratio in vanillin by the CM-CRDS method was developed, achieving an expanded uncertainty (at k = 2) of < 0.1‰. It is demonstrated that the accuracy of the CM-CRDS method is comparable to that of the EA-IRMS method. In order to achieve this goal, the following tasks were addressed. The factors contributing to the measurement uncertainty budget were determined, with part of them being eliminated or minimized. A measurement procedure was developed, including the preparation of equipment and samples, measurement procedure, accuracy control, and data processing. The results of international key comparison CCQM-K167 confirmed the metrological characteristics of the measurement procedure, in particular, the expanded uncertainty (at k = 2) of 0.09‰. The obtained metrological characteristics of the developed measurement method are comparable to the most accurate measurements of the carbon isotope ratio in vanillin using the EA-IRMS method, as well as in other food products (honey, milk, lemon, and coconut juices) using the CM-CRDS method. The practical significance of this result lies in the confirmation of the feasibility of using the CM-CRDS method for quality control and the detection of adulterated vanillin. The traceability of the measurement results to the internationally recognized delta scale of the isotope ratio is ensured by the use of appropriate international reference materials, which guarantees the recognition of the measurement results at the international level. Further research will focus on the development of techniques for measuring the carbon isotope ratio by the CM-CRDS method in other substances and materials analyzed in the food industry, including quality control and safety confirmation of juice products under TR CU 023/2011 and alcohol products under TR EEC 047/ 2018. Acknowledgements All measurements were carried out using the equipment of the Research Department of State Standards in the Field of Physical and Chemical Measurements No. 242, D. I. Mendeleyev Institute for Metrology. The author expresses his gratitude to the workers and Anna V. Kolobova, Cand. Sci. (Eng.), Head of the Research Department No. 242.
Measurement of Carbon Isotope Ratio in Vanillin Using the CM-CRDS …
165
Conflict of Interests The article was prepared on the basis of a report presented at the V International Scientific Conference “Reference Materials in Measurement and Technology” (Yekaterinburg, September 13–16, 2022) as well as at the EGU General Assembly 2020 in online format (May 4–8, 2020) [29]. The article was admitted for publication after the abstract was revised, the article was formalized, and the review procedure was carried out. The version in the Russian language is published in the journal “Measurement Standards. Reference Materials” 2023;19(3):129–144. (In Russ.). https://doi.org/10.20915/2077-1177-2023-19-3129-144.
References 1. TR TS 023/2011 (2011) Technical regulation of the Customs Union. Technical regulations for juice products from fruits and vegetables. https://docs.cntd.ru/document/902320562. Accessed 11 Nov 2022 (in Russian) 2. TP EA϶C 047/2018 (2018) Technical Regulations of the Eurasian Economic Commission “On the safety of alcoholic products.” https://docs.cntd.ru/document/551893590. Accessed 11 Nov 2022 (in Russian) 3. GOST 55460-2013 (2014) Alcoholic production. Identification. Method for determination the relation of isotopes 13 C/12 C carbon dioxide in sparkling wines and fermentation drinks. Standartinform, Moscow, p 8 (in Russian) 4. GOST 55518-2013 (2019) Wine products. Determination of composition of the dissolved carbon dioxide by the isotopic equilibration method. Standartinform, Moscow (in Russian) 5. GOST 32710-2014 (2014) Alcoholic beverages and raw materials for its production. Identification. Method for determination of alcohols and sugars 13 C/12 C isotopes ratio in wines and mashes. Standartinform, Moscow (in Russian) 6. Cienfuegos E, Casar I, Morales P (1997) Carbon isotopic composition of Mexican honey. J Apic Res 36(3–4):169–179 7. Dunn PJH, Hill S, Cowen S, Goenaga-Infante H, Sargent M, Gören AC et al (2019) Lessons learned from inter-laboratory studies of carbon isotope analysis of honey. Sci Justice 59(1):9– 19. https://doi.org/10.1016/j.scijus.2018.08.003 8. Schellenberg A, Chmielus S, Schlicht C, Camin F, Perini M, Bontempo L, Heinrich K et al (2010) Multielement stable isotope ratios (H, C, N, S) of honey from different European regions. Food Chem 121(3):770–777. https://doi.org/10.1016/j.foodchem.2009.12.082 9. Bricout J, Koziet J (1987) Control of the authenticity of orange juice by isotopic analysis. J Agric Food Chem 35(5):758–760. https://doi.org/10.1021/jf00077a027 10. Dordevic N, Camin F, Marianella RM, Postma GJ, Buydens LMC, Wehrens R (2013) Detecting the addition of sugar and water to wine. Aust J Grape Wine Res 19(3):324–330. https://doi. org/10.1111/ajgw.12043 11. Angerosa F, Bréas O, Contento S, Guillou C, Reniero F, Sada E (1999) Application of stable isotope ratio analysis to the characterization of the geographical origin of olive oils. J Agric Food Chem 47(3):1013–1017. https://doi.org/10.1021/jf9809129 12. Camin F, Wietzerbin K, Cortes AB, Haberhauer G, Lees M, Versini G (2004) Application of multielement stable isotope ratio analysis to the characterization of French, Italian, and Spanish cheeses. J Agric Food Chem 52(21):6592–6601. https://doi.org/10.1021/jf040062z 13. Schmidt O, Quilter JM, Bahar B, Moloney AP, Scrimgeour CM, Begley IS, Monahan FJ (2005) Inferring the origin and dietary history of beef from C, N and S stable isotope ratio analysis. Food Chem 91(3):545–549. https://doi.org/10.1016/j.foodchem.2004.08.036 14. Greule M, Mosandl A, Hamilton JTG, Keppler F (2015) Comment on authenticity and traceability of vanilla flavors by analysis of stable isotopes of carbon and hydrogen. J Agric Food Chem 63(21):5305–5306. https://doi.org/10.1021/jf506172q
166
I. K. Chubchenko
15. Hansen AMS, Fromberg A, Frandsen HL (2014) Authenticity and traceability of vanilla flavors by analysis of stable isotopes of carbon and hydrogen. J Agric Food Chem 62(42):10326–10331. https://doi.org/10.1021/jf503055k 16. Dunn PJH, Hill S, Cowen S, Goenaga-Infante H, Sargent M, Gören AC et al (2019) Lessons learned from inter-laboratory studies of carbon isotope analysis of honey. Sci Just J Forensic Sci Soc 59(1):9–19. https://doi.org/10.1016/j.scijus.2018.08.003 17. Chubchenko YK, Konopel’ko LA (2017) Features of determining the isotope composition of carbon in gaseous, liquid, and solid media. Meas Tech 60(6):638–642. https://doi.org/10.1007/ s11018-017-1248-6 18. Rogers KM, Phillips A, Fitzgerald J, Rogers P, Ferguson C, Ja C et al (2021) Authentication of Indonesian coconut sugar using stable carbon isotopes. Food Anal Methods 14(6):1250–1255. https://doi.org/10.1007/s12161-021-01967-9 19. Bensaid FF, Wietzerbin K, Martin GJ (2002) Authentication of natural vanilla flavorings: isotopic characterization using degradation of vanillin into guaiacol. J Agric Food Chem 50(22):6271–6275. https://doi.org/10.1021/jf020316l 20. Bricout J, Fontes JC, Merlivat L (1974) Detection of synthetic vanillin in vanilla extracts by isotopic analysis. J Assoc Off Anal Chem 57(3):713–715. https://doi.org/10.1093/jaoac/57. 3.713 21. Hoffman PG, Salb M (1979) Isolation and stable isotope ratio analysis of vanillin. J Agric Food Chem 27(2):352–355. https://doi.org/10.1021/jf60222a036 22. Mantha M, Kubachka KM, Urban JR, Dasenbrock CO, Chernyshev A, Mark WA et al (2019) Economically motivated adulteration of lemon juice: cavity ring down spectroscopy in comparison with isotope ratio mass spectrometry: round-robin study. J AOAC Int 102(5):1544–1551. https://doi.org/10.5740/jaoacint.18-0401 23. Mantha M, Urban JR, Mark WA, Chernyshev A, Kubachka KM (2018) Direct comparison of cavity ring down spectrometry and isotope ratio mass spectrometry for detection of sugar adulteration in honey samples. J AOAC Int 101(6):1857–1863. https://doi.org/10.5740/jaoacint. 17-0491 24. Grishkanich A, Chubchenko Y, Elizarov V, Zhevlakov A, Konopelko L (2017) SRS-lidar for 13 C/12 C isotops measurements environmental and food. Sensors Syst Next-Generation Satellites XXI 10423:356–366. https://doi.org/10.1117/12.2280016 25. Perini M, Pianezze S, Strojnik L, Camin F (2019) C and H stable isotope ratio analysis using solid-phase microextraction and gas chromatography-isotope ratio mass spectrometry for vanillin authentication. J Chromatogr A 1595:168–173. https://doi.org/10.1016/j.chroma. 2019.02.032 26. Ghosh S, Lee DG, Jung C (2018) A comparative study on the two different methods IRMS and CRDS for estimation of δ 13 C (‰) of honey samples. J Apicult 33(2):99–105. https://doi.org/ 10.17519/apiculture.2018.06.33.2.99 27. Konopelko L, Beloborodov V, Rumiantsev D, Chubchenko Y (2014) Problems of perfecting and metrological assurance of laser gas analyzers. In: International Conference Laser Optics, St. Petersburg, 30 June 2014–04 July 2014. IEEE, p 14545147. https://doi.org/10.1109/LO. 2014.6886390 28. Chartrand MMG, Chubchenko I, Dunn PJH, Garrido BC, Hai L, Liu F-H et al (2022) Final report on CCQM-K167: carbon isotope delta measurements of vanillin. Metrologia 59(1A):08004. https://doi.org/10.1088/0026-1394/59/1A/08004 29. Chubchenko I, Konopelko L (2020) Concentration dependence and scale linearity of the carbon isotope ratio measurement systems based on CRDS. In: EGU General Assembly Conference Abstracts 17571. https://doi.org/10.5194/egusphere-egu2020-17571
Development of Isotopic Reference Materials for 13 C-Urea Breath Tests Ian K. Chubchenko
Abstract Over 30 standards and certified measurement techniques are currently used in Russia to determine carbon, oxygen, and hydrogen isotope ratios. The techniques implemented in these documents are based on foreign reference materials (RMs). Similar domestically-produced RMs are not available, which makes the use of these techniques limited in the near future. This study aims to develop a certified RM (CRM) for the isotopic composition of carbon dioxide for 13 C-urea breath tests. The following objectives were formulated: to develop a technique for obtaining RMs; to manufacture an RM pilot batch; to carry out type approval tests. The RM was manufactured by gravimetric mixing of carbon dioxide of two different isotopic composition from different sources with synthetic air. The mixing ratio was calculated using a specially developed technique. The RM stability was tested by an accelerated aging procedure. Following type approval tests, the developed CRM was included in the Federal Information Fund for Ensuring the Uniformity of Measurements under the registration number GSO 11999-2022. The practical significance of the obtained results is related to the possibility of using the developed CRM for improving the accuracy and validity of 13 C-urea breath tests. Compared to the analogs, the developed CRM demonstrates a higher chemical purity. Keywords Metrology · Stable isotope · Isotope-ratio mass spectrometry · Isotope-ratio infrared spectroscopy · Isotopic reference materials · Isotopic composition reference materials · Isotopic breath test · 13 C-urea breath test
Introduction Isotopic analysis is currently gaining increased popularity in various domains, including the food industry for quality control and safety assurance of juice products according to the Technical Regulation of the Customs Union 023/2011 [1] and alcoholic products according to Technical Regulations of the Eurasian Economic I. K. Chubchenko (B) D. I. Mendeleyev Institute for Metrology, Saint Petersburg, Russia e-mail: [email protected] © D. I. Mendeleyev Institute for Metrology 2024 E. P. Sobina et al. (eds.), Reference Materials in Measurement and Technology, https://doi.org/10.1007/978-3-031-49200-6_11
167
168
I. K. Chubchenko
Union 047/2018 [2], in healthcare for diagnosis and treatment of peptic ulcer disease according to the Order of the Ministry of Health of the Russian Federation No. 611n of June 10, 2021, determination of liver functional status, and doping control of athletes according to WADA1 recommendations, in customs control to confirm the safety and correctness of imported products certification, in meteorology and atmospheric monitoring to analyze the carbon footprint, hydrological cycle, and geochemical carbon cycle, in the oil and gas industry for prospecting and exploration, in forensics to determine the origin of substances and materials, in scientific research to study climate history and adjustment of fundamental physical constants. About 200 measuring instruments (hereinafter referred to as MIs) of element isotopic composition are used in the Russian Federation, which are graduated, calibrated, and verified with the help of about 2000 certified reference materials (hereinafter referred to as CRMs). Today, more than 30 standards and certified measurement techniques are used in the Russian Federation to determine carbon, oxygen, and hydrogen isotope ratios. The techniques implemented in these documents are based on the application of foreign CRMs (IAEA, NIST, IRMM, USGS, etc.). Similar domestically-produced CRMs are not available, which makes the prospects of the widespread use of these techniques highly limited in the near future. Therefore, the development of domestic CRMs for isotopic composition presents an extremely important research task. The characteristic of isotopic composition recommended by IUPAC2 is the delta value of the isotope ratio [4], e.g., the carbon isotope ratio delta value δ13 CVPDB, which is the relative deviation of the isotope ratio value from the zero of the international reference delta scale VPDB. In accordance with BIPM3 CIPM/104-26 [5], the traceability of isotope ratio delta values to the international reference isotope ratio delta scale is ensured by using the appropriate international CRMs specified in CIPM/104-26. The most popular among them are CRMs for the isotopic composition of carbon, oxygen, and hydrogen in liquid, solid, and gaseous media. Thus far, more than 20 hydrogen, 40 carbon, 55 oxygen, and 20 nitrogen CRMs have been developed [5]. However, more than 70% of the CRMs have been expended and are not available for purchase according to the IAEA4 list of available CRMs. The work [6] described a procedure for manufacturing the CRM—GSO 11,037– 20185 —for carbon isotopic composition in carbon dioxide gas mixtures. This procedure implies mixing isotopically pure gases 12 CO2 and 13 CO2 in a predetermined 1
WADA—World Anti-Doping Agency. Available via. https://www.wada-ama.org/en. Accessed 20 August 2022. 2 IUPAC—International Union of Pure and Applied Chemistry. Available via IUPAC. https://iupac. org/. Accessed 20 August 2022. 3 BIPM—Bureau international poids et mesures. Available via BIPM. https://www.bipm.org/en/. Accessed 20 August 2022. 4 IAEA—International Atomic Energy Agency. Available via IAEA. https://www.iaea.org/ru. Accessed 20 August 2022. 5 GSO 11037-2018 Reference materials of carbon isotope composition in carbon dioxide gas mixtures (ISUDU-VNIIM-ES). Available via FIF EUM. https://fgis.gost.ru/fundmetrology/reg istry/19/items/389216. Accessed 20 August 2022 (In Russ.).
Development of Isotopic Reference Materials for 13 C-Urea Breath Tests
169
calculated proportion with oxygen and nitrogen by a gravimetric technique in order to obtain the target volumetric fraction of carbon dioxide-12 and carbon dioxide-13. The tolerance ranges of the certified values are as follows: the carbon dioxide-12 (12 CO2 ) volume fraction—from 0.010 to 99.9%; the carbon dioxide-13 (13 CO2 ) volume fraction—from 0.010 to 1.10%; and the carbon isotopic composition characteristic δ13 CVPDB —from −4 to −55‰. The authors in [7] presented the process of preparing an RM for the isotopic composition of carbon dioxide, which involves gas sampling from different sources, removal of water vapor from the sampled gases, and their sealing in 0.25 dm3 glass ampoules. After sealing, the ampoules are placed in an oven at 70 °C for 24 h in order to accelerate possible isotopic exchange reactions. According to the CRM certificate available on the IAEA website, the VSMOW26 CRM fabrication process involves mixing of three selected freshwater samples obtained from Lake Bracciano, Italy, Lake Galilee, Israel, and a well located near Cairo, Egypt, in appropriate proportions. The δ2 H value of one of the starting materials was changed by a hydrogen diffusion exchange reaction between the starting and deuterated water. The paper [8] described the preparation process of IAEA-6037 CRM, which required 80 kg of Carrara marble crushed and sieved to obtain about 15 kg of fractions with grain sizes of 200 to 500 μm. The selected fraction was homogenized and split into 31 RM samples. It can be seen that the production of RMs for isotopic composition involves, as a rule, collecting samples from different natural origins, mixing them if necessary, correcting the isotopic composition of one of the elements by isotopic exchange reactions, purifying to remove impurities, degassing and demineralization (for liquid RMs), crushing and selecting a certain fraction (for solid RMs), drying, homogenization by mixing, and packaging in sealed ampoules. Homogeneity is conventionally examined by analyzing randomly selected RM samples from a batch. Stability is examined according to ISO Guide 35-2015 [9] by comparison with previously prepared stable RMs. Although the method of mixing of isotopically pure substances is typically used, the as-obtained RMs may not exhibit sufficient chemical purity. In addition, in the case of carbon dioxide, it is impossible to obtain a gas mixture with a given ratio of oxygen isotopes corresponding to the oxygen isotopic composition of exhaled air, alcoholic and food products, and greenhouse gases. The cost of isotopically pure substances is significantly higher than that of pure substances of different isotopic compositions. The main problem consists in the lack of gas CRMs for the isotopic composition of carbon dioxide, which can be used to calibrate, verify, and graduate instruments used in 13 C-urea breath tests. In this test, a patient exhales the first air sample into an isotope analyzer, then takes an aqueous solution of urea enriched with the 13 C carbon isotope, and exhales the second air sample into the isotope analyzer. If H. 6
VSMOW2 Vienna Standard Mean Ocean Water 2 (Hydrogen and Oxygen Isotopes in Water). Available via Merck. https://www.sigmaaldrich.com/RU/en/product/sial/nist8535a. Accessed 20 August 2022. 7 IAEA-603—reference material calcite (CaCO ). Available via IAEA. https://nucleus.iaea.org/ 3 sites/ReferenceMaterials/Pages/IAEA-603.aspx. Accessed 20 August 2022.
170
I. K. Chubchenko
pylori is present in the stomach, the isotopic compositions of the first and second samples will be significantly different [10]. At present, the measurement accuracy of such tests is verified as follows: the operator fills two breath collection bags with exhaled air before performing the test, analyzes them, and compares the results. If the result difference is less than a certain value, the test is considered successful. The drift and linearity of the analyzer by the concentration and CO2 isotope ratio is not assessed. Traceability to the international isotope ratio delta scale is absent. According to the experience of metrological studies of isotope analyzers, the negligence of these factors can lead to significant errors [11–13]. This work is aimed at developing a CRM for the isotopic composition of carbon dioxide for use in 13 C-urea breath tests. To achieve this end, the following objectives were formulated: to develop a technique for developing RMs; to manufacture an RM pilot batch; to carry out type approval tests.
Materials and Methods The material used for CRM preparation included an artificial gas mixture consisting of synthetic air and carbon dioxide, having isotopologues 12 C16 O2 , 13 C16 O2 , and 12 18 16 C O O in its composition. Depending on the components and their content, the mixture was pressurized from 0.1 to 15 MPa in a gas cylinder. The CRM was produced by gravimetric mixing of two carbon dioxides of different isotopic compositions from different sources with synthetic air. Prior to gravimetric mixing, the impurities in the initial pure gases—nitrogen, oxygen, and carbon dioxide—were analyzed. For this purpose, oxygen was fed into an installation based on a gas chromatograph TGA 1326 and MAESTRO GC. The main analyzed impurities were krypton, argon, hydrogen, carbon (II) oxide, carbon (IV) oxide, methane, nitrogen, and water. Nitrogen was fed into an installation based on a gas chromatograph TGA 1326 and Agilent-7890B, as well as electrochemical gas analyzers Delta F310-H0050M and Delta F310E-S10000. The main analyzed impurities were argon, hydrogen, carbon monoxide (II), carbon monoxide (IV), methane, water, and oxygen. Carbon dioxide was fed into an installation based on a gas chromatograph CHROMOS GC 1000 and Agilent-7890B. The main analyzed impurities were hydrogen, carbon monoxide (II), methane, nitrogen, water, and oxygen. In addition, carbon dioxide from two different sources was fed into an isotope ratio mass spectrometer (hereinafter referred to as IRMS), of the isoprime precision model, to measure the isotopic composition. The measured ratios of stable carbon isotope δ13 C and oxygen δ18 O, as well as the measured impurity values in the initial pure gases, were used to calculate the mixing ratio of the components comprising the CRM. The determination of the mass of all components to obtain the required isotopic composition values was performed using a specially developed technique, consisting of the calculation of isotopic distributions of 12 C16 O2 , 13 C16 O2 , and 12 C18 O16 O in the starting components, using the previously measured ratios of stable carbon and
Development of Isotopic Reference Materials for 13 C-Urea Breath Tests
171
oxygen isotopes. The calculation of the mixing ratio of two carbon dioxide gas sources using the given isotope ratios was performed as follows. The carbon isotope ratio 13 C/12 C (13R) was determined from the measured δ13 C values in the two carbon dioxide sources: ) ( 1 + δ 13 C , (1) 13R = 0.01118 · 1000 The oxygen isotope ratios 18 O/16 O (18R) and 17 O/16 O (17R) were determined from the measured δ18 O values in the two sources: )0.52 1 + δ 18 O , 1000 ) ( 1 + δ 18 O , 18R = 0.00208835 · 1000 (
17R = 0.0003931 ·
13
(2)
(3)
The isotopic abundance of carbon-12 (12X ) was determined from the calculated R isotope ratios: 12X =
1 , 1 + 13R
(4)
The isotopic abundances of oxygen-16 (16X ) and oxygen-18 (18X ) were determined from the calculated 17 R and 18 R isotope ratios: 16X =
1 , 1 + 17R + 18R
18X = 16X · 18R 12
(5) (6)
The isotopic abundances of 12 C16 O16 O (626X ), 13 C16 O16 O (636X ), and C18 O16 O (628X ) were determined from the calculated isotopic abundances: 626X = 12X · 16X · 16X,
(7)
636X = (1 − 12X ) · 16X · 16X,
(8)
628X = 12X · 16X · 18X,
(9)
Similarly, the abundances of isotopologues 12 C16 O2 , 13 C16 O2 , and 12 C18 O16 O in the target gas mixture were calculated based on the given δ13 C and δ18 O values. Using the calculated abundances of isotopologues 12 C16 O2 , 13 C16 O2 , and 12 18 16 C O O in the two carbon dioxide sources and the target gas mixture, the Y
172
I. K. Chubchenko
mixing ratio of the two carbon dioxide sources to obtain the target gas mixture was found: Y =
626X mi x − 626X cyl1 , 626X cyl2 − 626X mi x
(10)
where 626X mi x is the abundances of isotopologue 12 C16 O2 in the target gas mixture, 626X cyl1 is the abundances of isotopologue 12 C16 O2 in the first carbon dioxide source, 626X cyl2 is the abundances of isotopologue 12 C16 O2 in the second carbon dioxide source. For the gravimetric mixing of CRM components, the equipment included in GET 154–20198 was used. After preparation, the CRM was reloaded to the IRMS for isotopic composition measurements for CRM validation purposes. At the same time, for the IRMS calibration international RMs (hereinafter referred to as IRMs) NBS18, IAEA-603, IAEA-610, IAEA-611, and IAEA-612,9 representing different natural forms of calcium carbonate CaCO3 , were used. In order to feed the IRMs to the IRMS, CaCO3 was reacted with orthophosphoric acid H3 PO4 , which was prepared according to the procedure described in [14]. For this purpose, 220–380 μg of IRM was placed in a 4 cm3 glass vial. After thoroughly purging the vial with high-purity helium to remove atmospheric air, orthophosphoric acid was injected such that the acid completely covered the IRM. The reaction of interaction between IRM and orthophosphoric acid was carried out at 25 ± 0.1 °C for 24 h in accordance with the recommendations [15]. After the reaction was completed, the obtained CO2 in a helium flow was transferred to the IRM. A total of 120 vials of IRMs, 24 vials of each IRM, were prepared and submitted to the IRMS. The measurements were performed for 8 days. The samples were fed in the following order: IAEA-610 (3 vials)—NBS18 (3 vials)—IAEA-603 (3 vials)—Analyzed gas (10 vials)—IAEA-611 (3 vials)—IAEA-612 (3 vials). Eight repetitions of this sequence over 8 days were performed. Within RM stability and homogeneity control, 40 measurements were carried out in 4 days after the accelerated aging according to RMG 93–2015 [16]. The point of the accelerated aging method was to amplify the factors causing the trend of the certified characteristic 8
GET 154-2019 State Primary Standard of the Unit of Mole Fraction and Mass Concentration of Components in Gas and Gas Condensate Environments: Custodian Institute D. I. Mendeleyev Institute for Metrology. Available via FIF EUM. https://fgis.gost.ru/fundmetrology/registry/12/items/ 1365155. Accessed 20 August 2022 (In Russ.). 9 NBS18 reference material calcite 13 C and 18 O. Available via IAEA. https://nucleus.iaea.org/sites/ ReferenceMaterials/Pages/NBS18.aspx. Accessed 20 August 2022. IAEA-603 reference material calcite (CaCO3 ). Available via IAEA. https://nucleus.iaea.org/ sites/ReferenceMaterials/Pages/IAEA-603.aspx. Accessed 20 August 2022. IAEA-610 reference material carbonate 13 C. Available via IAEA. https://nucleus.iaea.org/sites/ ReferenceMaterials/Pages/IAEA-610.aspx. Accessed 20 August 2022. IAEA-611 reference material carbonate 13 C. Available via IAEA. https://nucleus.iaea.org/sites/ ReferenceMaterials/Pages/IAEA-611.aspx. Accessed 20 August 2022. IAEA-612 reference material carbonate 13 C. Available via IAEA. https://nucleus.iaea.org/sites/ ReferenceMaterials/Pages/IAEA-612.aspx. Accessed 20 August 2022.
Development of Isotopic Reference Materials for 13 C-Urea Breath Tests
173
Fig. 1 General view of reference material heating
by heating the RM. The Vant-Goff formula was used to calculate the heating time. The duration of accelerated aging was 6 days at 80 °C. The pressure in the cylinder during the heating was increased from 9 to 11 MPa. The heating was accomplished with a thermocouple and a heating cable as shown in Fig. 1.
Results and Discussion Following the methodology described above and based on the analysis of existing techniques, RMs for the isotopic composition of carbon dioxide for use in 13 C-urea breath tests were developed. A pilot batch of seven pressurized RM cylinders of two types was produced: an aluminum cylinder of Luxfer and an aluminum cylinder of NPO POISK. Both types of cylinders were equipped with brass valves and had a volume of 1 dm3 . A general view of the RM is presented in Fig. 2. The results of the RM certification and homogeneity test are presented in Table 1. In total, 20 measurements of RMs from each cylinder were performed. Table 1 shows the average X1 R , X2 R values of 10 measurements.
174
I. K. Chubchenko
Fig. 2 General view of the pilot batch of reference materials
The results of the accelerated aging CRM stability tests in the two abovementioned types of cylinders are presented in Table 2. In total, 44 measurements were performed for each cylinder. Table shows the average X1 R , X2 R values of 22 measurements. The results of δ13 C and δ18 O measurements of mixture No. 3 before and after heating are presented in Figs. 3 and 4. The measurement results before and after heating the cylinder are presented to the left and to the right of the vertical line, respectively. A total of 44 measurements were performed in eight days. The standard deviation (SD) was 0.13‰ and 0.24‰ for δ13 C and δ18 O, respectively. The difference between the mean values of the measurement results before and after the heating was less than the SD of the measurement results and was less than 0.1‰, which confirms the stability of the developed CRMs. Tests for the type approval of the developed CRMs were finalized. The CRM was registered in the Federal Information Fund for Ensuring the Uniformity of Measurements (hereinafter referred to as FIF EUM) as GSO 11999-2022. The metrological characteristics of the developed CRMs are presented in Table 3. The expanded uncertainty of the developed CRMs satisfies the requirements for the accuracy of the 13 C-urea breath test [17, 18]. The test is considered positive when the difference in isotopic composition between the samples exceeds 4‰, negative when it is less than 3‰, and intermediate (threshold) when it is between 3‰ and 4‰ [10].
Development of Isotopic Reference Materials for 13 C-Urea Breath Tests
175
Table 1 Measurement results for the delta value of carbon δ13 C and oxygen δ18 O isotope ratios Mixture No.
Certified characteristic
Certified value, ‰
Resulting value of the certified characteristic, ‰ July 28, 2022 X1
1 2 3 4 5 6 7
R*
U***, ‰
August 12, 2022
|X1 − XC **| R
X2 R
|X2 R − XC |
δ13 C
− 5.0
− 4.91
0.09
− 4.69
0.09
0.4
δ18 O
− 12.01
− 11.62
0.39
− 11.77
0.24
0.4
δ13 C
− 27.5
− 27.17
0.33
− 27.18
0.33
0.4
δ18 O
− 29.33
− 29.55
0.22
− 29.41
0.08
0.4
δ13 C
− 43.35
− 43.20
0.15
− 43.11
0.24
0.4
δ18 O
− 24.95
− 24.56
0.39
− 25.08
0.13
0.4
δ13 C
− 5.0
− 4.69
0.31
− 5.04
0.04
0.4
δ18 O
− 12.01
− 11.77
0.24
− 11.71
0.30
0.4
δ13 C
− 27.5
− 27.38
0.12
− 27.21
0.29
0.4
δ18 O
− 29.33
− 29.21
0.13
− 29.15
0.18
0.4
δ13 C
− 43.35
− 43.24
0.11
− 43.16
0.19
0.4
δ18 O
− 24.95
− 24.61
0.34
− 25.19
0.24
0.4
δ13 C
− 43.35
− 43.47
0.12
− 43.41
0.06
0.4
δ18 O
− 24.95
− 24.83
0.12
− 24.78
0.17
0.4
XR ,
* the value of the certified characteristic ** XC , the certified value of the characteristic *** U, the value of the expanded uncertainty at the coverage factor k = 2 assigned to a given RM type (from RM type description)
Metrological characteristics of the developed CRMs were compared with foreign CRMs. The metrological characteristics of CRMs produced by the National Institute of Standards and Technology (hereinafter referred to as NIST), USA are presented in Table 4. As can be seen from Table 3, the expanded uncertainty values of the developed CRMs are higher than those of CRMs produced by NIST. However, the latter cannot be used for the calibration of MIs used for 13 C-urea breath tests due to their insufficient volume of 0.001 dm3 . The volume of the developed CRMs exceeds 10 dm3 . In comparison with the previously developed GSO 11037-2018, GSO 11999-2022 exhibits a higher chemical purity. In addition, the developed preparation technique makes it possible to obtain a gas mixture with a given ratio of oxygen isotopes corresponding to the oxygen isotopic composition of exhaled air, alcoholic and food products, and greenhouse gases. The cost of the developed CRMs is significantly lower than that of isotopically pure GSO 11037-2018. Given the above metrological characteristics, the research aim was successfully achieved. CRMs for the isotopic composition of carbon dioxide for use in 13 Curease breath tests was developed. Moreover, the developed CRMs can be used for
176
I. K. Chubchenko
Table 2 Results of the RM stability test Mixture No.
Cylinder type Certified characteristic
Resulting value of the certified characteristic March 17, 2022 (before heating) X1 R *
3
7
U***
May 6, 2022 (after heating)
|X1 R − XC **|
X2 R
|X2 R − XC |
Luxfer aluminum cylinder, brass valve, volume 1 dm3
Delta value of − 43.09 carbon isotope ratios δ13 C, ‰
0.26
− 42.95
0.4
0.4
− 24.98
0.03
− 24.89
0.06
0.4
NPO POISK aluminum cylinder, brass valve, volume 1 dm3
Delta value of − 43.43 carbon isotope ratios δ13 C, ‰
0.08
− 43.39
0.04
0.4
−24.83
0.12
− 24.88
0.07
0.4
Delta value of oxygen isotope ratios δ18 O, ‰
Delta value of oxygen isotope ratios δ18 O, ‰
* XR , the value of the certified characteristic ** XC , the certified value of the characteristic *** U, the value of the expanded uncertainty at the coverage factor k = 2 assigned to a given RM type (from RM type description) -42.50 -42.60
0
10
20
30
40
-42.70
δ¹³C
-42.80 -42.90 -43.00 -43.10 -43.20 -43.30 -43.40
Measurement number
Fig. 3 Measurement results of the delta value of carbon isotope ratios δ13 C
50
Development of Isotopic Reference Materials for 13 C-Urea Breath Tests -24.20 -24.40
0
10
20
30
177
40
50
-24.60
δ¹⁸O
-24.80 -25.00 -25.20 -25.40 -25.60 -25.80
Measurement number
Fig. 4 Measurement results of the delta value of oxygen isotope ratios δ18 O Table 3 Standardized metrological characteristics of the developed CRMs Certified characteristic, measurement units
Tolerance range of certified values
Expanded uncertainty (U)* tolerance values at k = 2 and P = 0.95
Delta value of carbon isotope ratios δ13 C, ‰
−50 to −5
0.4
Delta value of oxygen isotope ratios δ18 O, ‰
−30 to −5
0.4
The tolerance range of the relative deviation from the nominal values of certified characteristics: ± 2.0‰ for the characteristic “delta value of isotope ratios”; ± 20% for the characteristic “components molar fraction.” * Numerically equal to the tolerance range of the absolute error at the confidence level of P = 0.95 Table 4 Measurement results for the delta value of carbon δ13 C and oxygen δ18 O isotope ratios in CRMs produced by NIST CRM
Delta value of carbon isotope ratios δ13 C, ‰
Expanded uncertainty value δ13 C at the coverage factor k = 2, ‰
Delta value of oxygen isotope ratios δ18 O, ‰
Expanded uncertainty value δ18 O at the coverage factor k = 2, ‰
CRM 8562
− 3.76
0.06
8.45
0.22
CRM 8563
− 41.56
0.12
− 23.72
0.22
CRM 8564
− 10.45
0.08
0.19
0.20
178
I. K. Chubchenko
the calibration of IRMS in the fields of gas, chemical, and food industries, oil refining, healthcare, atmospheric monitoring, and scientific research. Further studies will be focused on the development of CRMs of carbon, oxygen, and hydrogen isotope ratios in liquid, solid, and gaseous media, particularly for the purpose of foreign RM substitution.
Conclusion CRMs for the isotopic composition of carbon dioxide that can be used in 13 C-urea breath tests were developed. This aim was achieved by progressively solving the following problems: development of a technique for obtaining RMs, production of a pilot RM batch, and carrying out RM type approval tests. The obtained CRM was registered in the FIF EUM as GSO 11999-2022. The developed CRMs can improve the accuracy and validity of 13 C-urea breath tests. Although the existing CRMs produced by the National Institute of Standards and Technology, USA, are characterized by lower uncertainty values, they cannot be used for the calibration of MIs used for 13 C-urea breath tests due to their insufficient volume. The expanded uncertainty of the developed CRMs satisfies the requirements for the accuracy of the 13 C-urea breath test. The developed technique can be used to produce RMs with any isotopic composition across a wide range of isotope ratios, which is important for the calibration, verification, and graduation of the respective MIs. Compared to the previously developed GSO 11037-2018, the developed CRMs exhibits a higher chemical purity. In addition, the developed preparation technique makes it possible to obtain a gas mixture with a given ratio of oxygen isotopes corresponding to the oxygen isotopic composition of exhaled air, alcoholic and food products, and greenhouse gases. The cost of the developed CRMs is significantly lower than that of isotopically pure CRMs. The traceability of the certified RM values to the international reference isotope ratio delta scale is ensured by using the appropriate international CRMs, which ensures international recognition of measurement results. Further studies will be focused on the development of CRMs of carbon, oxygen, and hydrogen isotope ratios in liquid, solid, and gaseous media, particularly for the purpose of foreign RM substitution. The developed technique of gravimetric RM preparation from pure substances of different isotopic compositions will be used to obtain materials with a wide range of isotopic composition certified values. Acknowledgements This article was prepared under Contract No. 02567567/12479/0505-20 of December 4, 2020 “Performing a component part of development of a reference complex for measuring the cryogenic liquids mass flow rate; a complex of state primary reference measurement techniques; standard units and reference materials for metrological support of measurements in medical laboratory diagnostics; a complex for metrological support of digital electric substations,” SCh OKR “Sistema-2020-M” code. All measurements were performed using the equipment of the research department of state standards in the field of physical and chemical measurements of D.I.
Development of Isotopic Reference Materials for 13 C-Urea Breath Tests
179
Mendeleyev All-Russian Institute for Metrology (VNIIM). The author would like to thank the staff and the head of the department, Dr. Anna Viktorovna Kolobova, for their help in this study. Conflict of Interest The article was prepared on the basis of a report presented at the V International Scientific Conference “Reference Materials in Measurement and Technology” (Yekaterinburg, September 13–16, 2022). The article was admitted for publication after the abstract was revised, the article was formalized, and the review procedure was carried out. The version in the Russian language is published in the journal “Measurement Standards. Reference Materials” 2023;19(4):51–62. (In Russ.). https://doi.org/10.20915/2077-1177-2023-194-51-62.
References 1. TR TS 023/2011 (2011) Technical regulation of the Customs Union. Technical regulations for juice products from fruits and vegetables. Available via Electronic fund of proven and normative-technical. https://docs.cntd.ru/document/902320562. Accessed 11 Nov 2022 (in Russian) 2. TP EA϶C 047/2018 (2018) Technical Regulations of the Eurasian Economic Commission “On the safety of alcoholic products”. Available via Electronic fund of proven and normative-technical. https://docs.cntd.ru/document/551893590. Accessed 11 November 2022 (in Russian) 3. Order of the Ministry of Health of the Russian Federation (2021) On approval of the standard of medical care for adults with peptic ulcer disease (diagnosis and treatment). No. 611n of 06.10.2021. Available via Official Internet portal of legal information. http://publication.pravo. gov.ru/Document/View/0001202107080026. Accessed 4 Aug 2022 (in Russian) 4. Brand W, Coplen T, Vogl J, Rosner M, Prohaska T (2014) Assessment of international reference materials for isotope-ratio analysis (IUPAC Technical Report). Pure Appl Chem 86(3):425–467. https://doi.org/10.1515/pac-2013-1023 5. 104th Meeting of the CIPM (Session I), 9 to 10 March 2015. Available via BIPM. https://www. bipm.org/en/committees/ci/cipm/104-_1-2015. Accessed 11 Nov 2022 6. Chubchenko YK, Konopel‘ko LA (2018) Development of a new type of reference standard for carbon isotopic composition. Measurem Techn 60:1228–1232. https://doi.org/10.1007/s11 018-018-1344-2 7. Verkouteren MR (1999) Preparation, characterization, and value assignment of carbon dioxide isotopic reference materials: RMs 8562, 8563, and 8564. Anal Chem 71:4740–4746 8. Assonov S, Groening M, Fajgelj A, Hélie JF, Hillaire-Marcel C (2020) Preparation and characterisation of IAEA-603, a new primary reference material aimed at the VPDB scale realisation for δ13 C and δ18 O determination. Rapid Commun Mass Spectrom 34(20):e8867. https://doi. org/10.1002/rcm.8867 9. GOST ISO Guide 35-2015 (2015) Reference materials. General and statistical principles for certification. Standartinform, Moscow, 62 pp (in Russian) 10. Plavnik RG (2017) 13 C-urea breath test for Helicobacter pylori (clinical and organizational aspects). ID MEDPRAKTIKA-M, Moscow, 36 pp (in Russian) 11. Viallon J, Flores E, Moussay P, Chubchenko I, Rolle F, Zhang T et al (2020) An optimized sampling system for highly reproducible isotope ratio measurements (δ13 C and δ18 O) of pure CO2 gas by infrared spectroscopy. Metrologia 57(5):055004. https://doi.org/10.1088/16817575/ab948c 12. Grishkanich A, Chubchenko Y, Elizarov V, Zhevlakov A, Konopelko L (2018) SRS-sensor 13 C/12 C isotopes measurements for detecting Helicobacter pylori. Optical Fibers and Sensors for Medical Diagnostics and Treatment Applications XVIII, vol 10488, pp 198–209. https:// doi.org/10.1117/12.2295927
180
I. K. Chubchenko
13. Vitkin VV, Chubchenko IK, Polischuk AV, Kovalev AV, Popov EE (2019) Raman gas analyzer for detecting carbon isotopologues. J Phys Conf Ser 1399:022033. https://doi.org/10.1088/ 1742-6596/1399/2/022033 14. Ghosh P, Patecki M, Rothe M, Brand WA (2005) Calcite-CO2 mixed into CO2 -free air: a new CO2 -in-air stable isotope reference material for the VPDB scale. Rapid Commun Mass Spectrom 19:1097–1119. https://doi.org/10.1002/rcm.1886 15. Assonov S, Groening M, Fajgelj A, Hélie JF, Hillaire-Marcel C (2020) Preparation and characterisation of IAEA-603, a new primary reference material aimed at the VPDB scale realisation for δ13 C and δ18 O determination. Rapid Commun Mass Spectrom 34:e8867. https://doi.org/ 10.1002/rcm.8867 16. RMG 93-2015 (2016) State system for ensuring the uniformity of measurements. Estimation of metrological characteristics of reference materials. Standartinform, Moscow, 104 pp (in Russian) 17. Popov EE, Polishchuk AV, Chubchenko IK, Kuznetsova OB, Vitkin VV (2022) Helicobacter pylori breath test by the Raman spectroscopy gas analyzer. In: International Conference Laser Optics, 20–24 June 2022, St. Petersburg, Russia (in Russian) 18. Grishkanich A, Chubchenko Y, Kustikova M, Zhevlakov A, Konopelko L et al (2019) Raman and CRDS isotopic resolution spectroscopy for biomedicine applications. J Phys Conf Ser 1379(1):012050. https://doi.org/10.1088/1742-6596/1379/1/012050
On Developing Metrological Assurance to Identify and Quantify the Content of Non-infectious Food Protein Allergens of Animal or Plant Origin in Food Products Olesya Ye. Pervukhina , Anna S. Sergeeva , Maria P. Krasheninina, Valeriya V. Studenok , Evgenii S. Mashkov, Pavel A. Petukhov, and Valentina N. Maigurova
Abstract As specified in Technical Regulations of the Customs Union 022/2011 “Food products in terms of their labeling”, allergen presence in food composition is subject to mandatory control. Creating a metrological assurance system to identify and quantify the content of non-infectious food protein allergens of animal or plant origin in foods includes developing and certifying identification and quantification techniques. Other objectives are performing round-robin comparative tests (proficiency testing), creating and testing reference materials for type approval. Within this research framework, we developed and certified methods to identify and quantify the content of non-infectious food protein allergens of plant (gluten, peanuts, nuts, soybeans) and animal (cow’s milk, chicken eggs, fish, seafood) origin using reagent kits for enzyme-linked immunosorbent assay produced by XEMA LLC. The samples included all types of foods and objects related to requirements for foods, countertop wipe samples obtained during in-process inspection. Quantitative techniques were certified according to the legislative requirements for measurement assurance using imported food allergen reference materials. The lower sensitivity limits (detection limits) for the presence or absence of antigens by allergen protein mass ranged from O. Ye. Pervukhina (B) · A. S. Sergeeva · M. P. Krasheninina · V. V. Studenok · E. S. Mashkov UNIIM—Affiliated Branch of the D. I. Mendeleyev All-Russian Institute for Metrology, Yekaterinburg, Russia e-mail: [email protected] A. S. Sergeeva e-mail: [email protected] M. P. Krasheninina e-mail: [email protected] V. V. Studenok e-mail: [email protected] P. A. Petukhov · V. N. Maigurova XEMA LLC, Moscow, Russia e-mail: [email protected] © D. I. Mendeleyev Institute for Metrology 2024 E. P. Sobina et al. (eds.), Reference Materials in Measurement and Technology, https://doi.org/10.1007/978-3-031-49200-6_12
181
182
O. Ye. Pervukhina et al.
0.001 ppb to 5 ppm. The developed methods ensure food safety when establishing product compliance with the legislation on technical regulation. Keywords Food allergy · Allergens · Measurement technique · Test system · Enzyme-linked immunosorbent assay
Introduction Today, allergy is commonly understood as manifestations of the immune system hypersensitivity to an allergen (antigen) upon repeated contact with it. In case of food allergies, such a reaction occurs when consuming foods in which the main allergens are proteins, both simple and complex (for example, glycoproteins), less often polypeptides (haptens). The latter combine with food proteins and acquire the property of immunogenicity [1]. The ability of a food protein to act as an allergen depends on the presence of an “epitope” in its composition. This is the part of an allergen macromolecule which is recognized by the immune system [1]. Thus, epitopes determine specificity and induce antibody responses [1, 2]. In accordance with the International Food Code [3, 4], the most allergenic foods include cow’s milk, chicken eggs, wheat, peanuts, nuts, soybeans, fish, and seafood (crustaceans and mollusks). These products constitute the so-called “big eight allergens”. Both mild (urticaria) and severe allergic reactions, such as fulminant and lifethreatening food anaphylaxis, can develop in response to the consumption of these foods. In some cases, a minimal amount of the allergen, for example, when inhaling peanut smell or when allergens are ingested with breast milk, can trigger a systemic reaction. Some food allergens are able to change their antigenic properties when foods are cooked. Moreover, enzymes (and after entering the body, digestive fluids) affect them. For instance, protein denaturation when a product is heated makes some products lose their allergenicity while others, on the contrary, become more allergenic [1, 5–7]. For example, roasting peanuts increases their allergenicity. Conversely, some cow’s milk and chicken egg proteins are destroyed and lose this property. If there is an allergic reaction to any food, patients should go to a health facility. Based on a patient’s account of their medical history (anamnesis), doctors clarify and identify the “guilty” food product. After that they suggest the patient undergo skin tests, which give a quick result at a minimum cost. However, the obtained results are often false positive due to cross-reactivity [8]. Subsequently, the patient must stick to a certain strict diet that completely excludes food containing the allergen and to buy foodstuffs labeled as allergen-free. In accordance with the requirements of Technical Regulations of the Customs Union TR CU 022/2011 [9], “components, including food additives, flavorings, dietary supplements, whose use may cause allergic reactions or is contraindicated in certain disease types, are specified in the composition of foods regardless of their quantity.” Thus, the presence of allergens in the composition of food products is subject to mandatory control. At the same time, it should also be considered that the unintentional allergen presence in a food product can result
On Developing Metrological Assurance to Identify and Quantify …
183
from allergen cross-contamination throughout the supply chain, i.e. while storing, transporting, and producing it [10]. With advances in immunology, food allergen detection methods are being improved. While developing such techniques, attention is given to their sensitivity and specificity to facilitate more accurate detection of a particular allergen. Currently, there is an array of methods of analysis. They can be conveniently divided into four large groups: mass spectrometry, nucleic acid-based methods, biosensors, and immunoassay methods [8]. Mass spectrometry is a method of identifying and studying substances. It is based on the ionization of atoms (molecules) in the composition of a substance and the subsequent registration of the mass spectrum of the resultant ions. A significant difference between mass spectrometry and other analytical spectral methods, for example, optical methods, is that they detect radiation or energy absorption by molecules or atoms, while mass spectrometry directly detects substance particles themselves [11, 12]. The method has a fairly high sensitivity. However, it is expensive due to the cost of the equipment for analysis. Nucleic acid-based methods are analytical methods based on the detection of genes encoding the target antigen. These methods have an important advantage over antigen detection since they identify the gene, i.e. a more stable molecule, even after exposure to such factors as high temperature, fermentation, acidity, and so on. Among these methods, the polymerase chain reaction (PCR) is the most common technique [13]. Limitations include the effect of heat treatment on the result due to detectable DNA destruction, difficulties in discriminating between different food products (e.g., eggs and chicken contain the same genetic material), and the inability to detect certain allergens at low concentrations (for example, egg and milk). Biosensors are combination devices consisting of a biochemically or biologically active component (or a biological component, i.e. an enzyme, an antibody, an antigen, a microorganism, a biological membrane) and an electronic transducer. The advantage of biosensors is high biocomponent specificity, as well as its ability to perform recognition without additional energy input (temperature increase, applied potential, and so on) [14, 15]. Limitations of using biosensors are associated with their slow reaction rate, low reproducibility and stability, the difficulty in obtaining bioorganic materials of constant composition, sensitivity to high and low temperatures, bactericidal contamination. Immunoassay diagnostic methods are based on antigen–antibody interaction. Among immunoassay methods, the enzyme-linked immunosorbent assay (ELISA) is the most widely used method [8] as it is sensitive and inexpensive. There are competitive and non-competitive ELISAs. The difference between the two methods is that at the first stage of the competitive method, not only the antigen itself is present, but also its analog. Thus, two antigens compete for binding to antibodies. The non-competitive ELISA lacks the analog of the target allergen. Thus, there is no competition for binding to the antibody. Moreover, this assay has a higher analytical sensitivity and is simple to perform. Currently, ELISA is an internationally recognized method. It is the most frequently used assay for the routine detection of allergens in food products [3].
184
O. Ye. Pervukhina et al.
XEMA LLC (Moscow) has developed reagent kits that enable identification and quantification of the content of non-infectious food protein allergens of animal or plant origin in samples of all types of food products and objects related to the requirements for foods, as well as wipe samples obtained from countertops during in-process inspection. According to the current legislation in the field of technical regulation (No. 184-FZ On technical regulation [16]), certified measurement techniques must be used to assess product compliance with the mandatory requirements. Since 2016, the specialists of the UNIIM, a branch of the D. I. Mendeleev AllRussian Research Institute for Metrology (VNIIM), have been working on the metrological assurance of the enzyme-linked immunosorbent assay using the available instrumental and reference base [17, 18]. The cumulative experience resulted in a consistent methodological approach to the development of a metrological assurance complex for measurements performed using ELISA kits [19]. The complex includes the following types of work: (1) developing and certifying identification and quantification methods; (2) conducting interlaboratory comparative tests (proficiency testing); (3) creating and testing standard reference materials for the composition of allergens for type approval. These studies have significantly contributed to ensuring food safety, improving people’s quality of life, and detecting adulterated food products. However, the issue of quantitative determination of allergens is still relevant. This study aims to develop and certify methods for identifying and quantifying the content of non-infectious food protein allergens of animal or plant origin in samples of all types of food products. Moreover, the investigation also includes objects related to the requirements for foods, as well as countertop wipe samples obtained during in-process inspection.
Materials and Methods Description of the Enzyme-Linked Immunosorbent Assay (ELISA) The reagent kits manufactured by XEMA LLC use a non-competitive (sandwich) ELISA. It has the highest level of sensitivity and specificity due to the use of a pair of matching antibodies [20]. The test sample is applied to the microplate wells whose surface is coated with specific capture antibodies against the allergen. The antigen from the sample binds to the antibodies on the well surface. The microplate is washed to remove unbound antigen. Peroxidase-labeled secondary antibodies to the same antigen are applied to the wells. After repeated washing, the enzyme activity is manifested by adding a chromogen-substrate mixture, a stopping solution. Then it is subjected to optical density measurement on a spectrophotometer at a wavelength of 450 nm. The spectrophotometer blank solution is set to zero. Figure 1 shows the diagram of non-competitive (sandwich) ELISA.
On Developing Metrological Assurance to Identify and Quantify …
185
Fig. 1 Schematic diagram of non-competitive (sandwich) enzyme-linked immunosorbent assay
186
O. Ye. Pervukhina et al.
The technique for measuring the allergen mass fraction in samples is based on the dependence of the optical density of the test solution at a wavelength of 450 nm on the allergen mass fraction. To build a calibration curve, we used calibration solutions containing the allergens under study. They are included in the reagent kit manufactured by XEMA LLC. The calibration curve plot represents a linear proportional relationship described by a first order polynomial.
The Certification Procedure of Measurement Techniques A microplate spectrophotometer (Multiskan FC, Thermo Scientific), a non-automatic Sartorius CPA225D balance (accuracy class I), a laboratory centrifuge CM 6MT (ELMI), automatic dispensers (Biohit), and a set of volumetric glassware were used to certify the methods of quantifying the content of non-infectious food protein allergens of animal or plant origin in food products (measurement techniques). Working samples of flour, grain, bran, and pasta were used as samples to evaluate the accuracy of the gluten content measurement technique. The measurement validity indicators were evaluated by the calculation-experimental method for assessing the quality indicators of the analysis technique (as a characteristic of the error of its components) according to Appendix C of the RMG (CIS Standardization Recommendations) 61-2010 [21]. In order to determine the applicable scope of the measurement techniques, we analyzed the OKVED (RCPEA) 2 groups (All-Russian classifier of products by type of economic activity). The most characteristic members from each group were selected as samples for evaluation. Admittedly or presumably, they did not contain the allergens under study and totaled 34 working samples. These samples of food products and raw foods included barley, sesame seeds, brown rice, minced chicken breast fillet, minced beef, minced pork, frozen cooked shrimps, frozen cod fillet, frozen cooked mussels, canned tomatoes, canned pineapple, frozen chanterelles, lactose-free milk containing 0.5% fat, Rossiysky cheese, cottage cheese containing 9% fat, rye flour, oat bran, buckwheat flour, multi-grain hardtack cookies, sponge cakes, couscous grain, milk chocolate, boiled chicken egg, baby formula, chocolate pudding, whey protein isolate, instant oatmeal porridge, oat milk, rice milk with a coconut flavor, almond milk, vanilla flavoring, food supplement “Clerici Dry Animal Enzyme (chymosin/pepsin)”, corn starch, as well as wipe samples obtained from countertops. Samples of products and food raw materials were taken in accordance with the GOSTs for the analyzed type of food products, or other regulatory and/or technical documents on sample taking in force at enterprises. Next, we prepared sample extracts in accordance with the instructions for ELISA test kits. The indicators of measurement technique precision were evaluated according to the results of the interlaboratory experiment involving five laboratories. The experiment was performed in compliance with GOST R 5725-2-2002 [22]. We assessed the accuracy indicators of quantitative measurement techniques employing the standard
On Developing Metrological Assurance to Identify and Quantify …
187
addition method in accordance with the RMG 61-2010 regulations. The solutions used to introduce additives were prepared by diluting a well-known weighed sample of imported food allergen reference materials: • pure substance of soybean trypsin inhibitor (Trypsin inhibitor from Glycine max (soybean), Product No: T9128, Batch No. SLBR5919V) in dry form 1.0 g with a mass fraction of the standard substance of 100.00%, manufactured by Sigma Aldrich; • pure substance of the sum of the αs1, αs2, β, and κ casein fractions (Casein from cow’s milk, powder, CAS No. 9000-71-9, Product No: C3400, Batch No: SLBZ2763) in dry form 1.0 g with a mass fraction of the standard substance of 91.23%, manufactured by Sigma Aldrich. Additionally, performing the experiment we established the detection limits for the techniques employed to identify non-infectious food protein allergens of animal or plant origin in food products, as well as in wipe samples obtained from countertops.
Results and Discussion In 2018–2022, the collaboration between XEMA LLC and UNIIM, the affiliated branch of the D. I. Mendeleyev all-Russian Institute for Metrology, continued to provide metrological assurance of quality control and food safety [17, 18]. We developed, certified, and tested the applicability of a technique for measuring the gluten content in grain products by enzyme-linked immunosorbent assay using the GLIADIN-ELISA reagent kit manufactured by XEMA LLC. Moreover, we prepared a series of documents entitled “Methods for identifying and quantifying the content of non-infectious food protein allergens of animal or plant origin in samples of all types of food products and objects related to the requirements for food products, as well as wipe samples obtained from countertops during in-process inspection using ELISA reagent kits manufactured by XEMA LLC”. The technique for measuring the gluten content in processed grains by ELISA using the GLIADIN-ELISA reagent kit manufactured by XEMA LLC was devised during elaborating GOST 33838-2016 [23, 24]. According to the Codex Alimentarius Commission [25], gluten is defined as a protein fraction of wheat, rye, barley, oats, or their hybrids, as well as derivatives from this protein fraction. Some people can have an intolerance to gluten. Gluten consists of two fractions: prolamins and glutelins. The gluten content directly depends on the content of the prolamin fraction. The measurement range of the gluten mass fraction is from 2.0 to 100.0 ppm (mg/kg) inclusive. Table 1 gives the metrological characteristics of the measurement technique. Appendix A contains a technique for a qualitative sample analysis of the presence or absence of gluten using an immunochromatographic test strip from the GLUTEN XEMATest Kit Manufactured by XEMA LLC.
188
O. Ye. Pervukhina et al.
Table 1 Values of the accuracy, correctness, repeatability, and reproducibility indices of the technique for measuring the gluten mass fraction Repeatability index (relative standard deviation of repeatability), σr0 , %
Reproducibility index (relative standard deviation of the reproducibility of a single measurement result), σ R0 , %
Correctness index (residual systematic error bounds at confidence coefficient P = 0.95), ± δ c , %
Accuracy index (relative error bounds at confidence coefficient P = 0.95), ± δ, %
10.0
15.0
6.6
30.0
The GLUTEN XEMATest is based on a pair of monoclonal antibodies. It detects gliadin (the main component of gluten) and prolamin glycoproteins (hordein and secalin) related to it. These two make up about 50% of the total gluten content with high sensitivity and specificity, which also hods true after prolonged thermal food processing. Table 2 shows the sensitivity of the GLUTEN XEMATest (detection limit) and the detection range in the extract prepared according to the procedure described in the technique (mass/volume ratio of 1:10) for various prolamins. The results of interlaboratory comparative tests aimed to determine the quality indicators of pasta enabled us to confirm the applicability of the qualitative and quantitative analytical methods for detecting gluten in processed grain products. These tests were performed in accordance with GOST ISO/IEC 17043-2013 [26]. We have also begun developing a reference material [27]. The measurement technique can be used to confirm the compliance of products with the mandatory requirements established in the technical regulation of the Customs Union TR CU 027/2012 [28]. The first document of the series “Methods for identifying and quantifying the content of non-infectious food protein allergens of plant origin in samples of all types of food products and objects related to the requirements for food products, as well as wipe samples obtained from countertops during in-process inspection using ELISA reagent kits manufactured by XEMA LLC” includes the following methods for the qualitative and quantitative analysis of non-infectious food protein allergens of plant origin: 1. The qualitative screening method for detecting the presence or absence of soybean trypsin inhibitor antigen in test samples using the SOYA XEMATest reagent kit.
Table 2 Characteristics of the qualitative determination of the presence or absence of gluten Cereal grain
Prolamin
Limit of detection, mg/kg
Range of detection, mg/kg
Wheat
Gliadin
2
2–2000
Barley
Hordein
2
2–40,000
Rye
Secalin
3
3–200,000
Oats
Avenin
200
200–400,000
On Developing Metrological Assurance to Identify and Quantify …
189
The methodology applies to samples of all types of food products and objects related to the requirements for food products arising during their production (manufacturing), storage, shipment (transportation), sale, and disposal, as well as wipe samples taken from countertops during in-process inspection. It establishes a procedure for a qualitative screening of test samples for the presence or absence of soybean trypsin inhibitor antigen using an immunochromatographic test strip from the SOYA XEMATest kit manufactured by XEMA LLC. Soybean trypsin inhibitors (hereinafter referred to as STI) are proteins present in soybean seeds in an amount of up to 25% of the total protein mass [29]. These proteins interfere with food digestion processes by suppressing the activity of trypsin and chymotrypsin, causing allergic reactions. The Kunitz trypsin inhibitor whose isoforms have molecular mass in the range of 20–25 kDa, as well as the Bauman– Birk inhibitor with a molecular mass of 8 kDa are the main inhibitors which are identified and well-studied. The disulfide bonds in the structure of the inhibitors ensure the high stability of the molecule under various influences. The SOYA XEMATest is based on the immunochromatographic principle. It uses a combination of monoclonal antibodies to detect STI. The target antigen is bound by specific antibodies attached to the stained microparticles. This complex then migrates to the test line where it binds to another specific antibody, forming a colored line indicating a positive result. The lower detection limit of the STI antigen in the extract is about 1 mg/kg (ppm). The upper detection limit is about 2000 mg/kg (ppm). Using the SOYA XEMATest is recommended to conduct a qualitative screening analysis of the test samples for the presence or absence of the STI antigen before employing quantitative methods for measuring the STI mass fraction. If a positive result is obtained, it is concluded that the STI antigen is present in the test sample. 2. The technique for measuring the mass fraction of soybean trypsin inhibitor in samples of all types of food products and objects related to the requirements for food products, as well as wipe samples taken from countertops during in-process inspection, by enzyme-linked immunosorbent assay using the Soybean trypsin inhibitor-ELISA reagent kit manufactured by XEMA LLC [30]. The measurement range of the STI mass fraction is 0.5 to 25.0 μg/kg (ppb) inclusive. The detection limit is 0.1 μg/kg (ppb). Table 3 gives the metrological characteristics of the measurement technique. Table 3 Values of the accuracy, correctness, repeatability, and reproducibility indices of the technique for measuring the STI mass fraction Repeatability index (relative standard deviation of repeatability), σr0 , %
Reproducibility index (relative standard deviation of the reproducibility of a single measurement result), σ R0 , %
Correctness index (residual systematic error bounds at confidence coefficient P = 0.95), ± δ c , %
Accuracy index (relative error bounds at confidence coefficient P = 0.95), ± δ, %
13
18
19
40
190
O. Ye. Pervukhina et al.
3. The technique for the qualitative determination of the presence or absence of noninfectious food protein allergens of plant origin using reagent kits manufactured by XEMA LLC. Table 4 gives the numbers of reagent kits produced by XEMA LLC, the list of allergens with the corresponding target antigens, as well as the lower sensitivity limits (limits of detection) for the presence or absence of antigens (LOD) by allergen protein mass in extracts prepared according to the procedure described in the methodology. The second document in the series (Part 2) [31] includes the following techniques for the qualitative and quantitative analysis of non-infectious food protein allergens of animal origin: 1. The methodology of qualitative screening analysis for the presence or absence of milk antigen in test samples using the Milk XEMATest Reagent Kit. The methodology applies to samples of all types of food products and objects related to the requirements for food products arising during their production (manufacturing), storage, shipment (transportation), sale, and disposal, as well as wipe Table 4 Characteristics of the qualitative determination of the presence or absence of noninfectious food protein allergens of plant origin Kit number
Allergen
Target antigen
LOD, mg/ kg (ppm)
K371P
Pecan
Ca i1—specific fragment of pecan 2S albumin
0.4
K371W
Walnut
Jug r4—specific fragment of walnut 11 S globulin
5.0
K372
Hazelnut
Cor a 9—specific fragment of hazelnut 11S globulin
0.003
K373
Peanut
Ara h1—peanut 7 S vicilin-like globulin
0.005
K374
Almond
Pru du 6—specific fragment of almond 11 S globulin
0.006
K375
Macadamia
Mac i1 and Mac i2—specific fragments of macadamia 11 S globulin
1.0
K376
Cashew
Ana o1—specific fragment of cashew 11 S legumin
1.0
K377
Pistachio
Pis v2—specific fragment of pistachio 11 S legumin
1.0
K378
Brazil nut
Ber e2—specific fragment of Brazil nut 11 S globulin
1.0
K385
Lupine
Lup a5—specific fragment of lupine profiling
0.32
K389
Sesame
Ses i2—specific fragment of sesame 2S albumin 0.14
K392
Celery
Api g1—specific fragment of celery PR-10 pathogenesis-related protein
0.4
K395
Mustard plant
Sin a1—specific fragment of mustard plant 2S albumin
0.10
On Developing Metrological Assurance to Identify and Quantify …
191
samples taken from countertops during in-process inspection. It establishes a procedure for a qualitative screening of test samples for the presence or absence of milk using an immunochromatographic test strip from the Milk XEMATest kit manufactured by XEMA LLC. The Milk XEMATest is based on the immunochromatographic principle. It uses a combination of monoclonal antibodies to detect milk antigens. The lower detection limit of milk antigens in the extract is about 1 mg/kg (ppm). Using the Milk XEMATest is recommended to conduct a qualitative screening analysis of the test samples for the presence or absence of milk antigens before employing quantitative methods for measuring total casein mass fraction. If a positive result is obtained, it is concluded that milk antigen is present in the test sample. 2. The technique for measuring the total casein mass fraction in samples of all types of food products and objects related to the requirements for food products, as well as wipe samples taken from countertops during in-process inspection, by enzymelinked immunosorbent assay using the Milk ELISA reagent kit manufactured by XEMA LLC. Caseins are a group of proteins found in cow’s milk along with whey proteins. Both whey and casein proteins can cause food anaphylaxis. Currently, the allergenicity of caseins cannot be eliminated using known methods such as heating, chemical and enzymatic (for example, curdling) treatment. Caseins are subdivided into α s1 , α s2 , β, and κ fractions (19–25 kDa). Their ratio is relatively constant and amounts to 37, 13, 37, 13%, respectively. Among these, β casein is the largest contributor to food allergy. It consists of 209 amino acids and has 12 genetic variants, i.e. A1, A2, A3, B, C, D, E, F, G, H1, H2 and I, differing in structure [32, 33]. The total casein mass fraction measured by the method is the total content of caseins of the four fractions (αs1, αs2, β, and κ). The measurement range of the total casein mass fraction is 0.5 to 25.0 μg/kg (ppb) inclusive. The detection limit is 0.1 μg/kg (ppb). The coefficient of cross-reacting derivatives (cross-sensitivity) of the sum of the αs1, αs2, β, and κ casein fractions is 100%. γ casein fraction is less than 0.1%. The values of the accuracy indicators in the relative form of the measurement technique coincide with the values given in Table 3. 3. The technique for the qualitative determination of the presence or absence of noninfectious food protein allergens of animal origin using reagent kits manufactured by XEMA LLC. Table 5 gives the numbers of reagent kits produced by XEMA LLC, the list of allergens with the corresponding target antigens, as well as the lower sensitivity limits (limits of detection) for the presence or absence of antigens (LOD) by allergen protein mass in extracts prepared according to the procedure described in the methodology. At present, specialists from UNIIM, the affiliated branch of the D. I. Mendeleyev all-Russian Institute for Metrology and XEMA LLC, are developing methods for preparing homogeneous and stable food reference materials for interlaboratory comparative tests (proficiency testing) in order to introduce (check the efficiency) of the developed methods for the qualitative and quantitative analysis of non-infectious
192
O. Ye. Pervukhina et al.
Table 5 Characteristics of the qualitative determination of the presence or absence of noninfectious food protein allergens of animal origin Kit number Allergen
Target antigen
LOD, mg/kg (ppm)
K350
Crustaceans Specific fragment of crustacean tropomyosin
0.22
K355
Mollusks
Specific fragment of mollusk tropomyosin
2.0
K363
Fish
Specific fragment of fish tropomyosin
0.10
K360X
Egg
Specific fragment of avian egg white ovalbumin 0.5
food protein allergens of plant and animal origin. We also plan to involve laboratories of various food industry enterprises, as well as the reference centers of the Federal Service for Veterinary and Phytosanitary Supervision (Rosselkhoznadzor) and the Federal Service for Surveillance on Consumer Rights Protection and Human Wellbeing (Rospotrebnadzor). Currently, the Federal Information Fund of Measurement Assurance (FIF OEI) does not have reference materials for the composition of food allergens necessary to control the identification and quantification results. In this regard, the next stage in the development of the metrological assurance complex aimed at identifying and quantifying the content of food allergens will be designing and testing for type approval of reference materials for the composition of the “big eight allergens” [3, 6] as the most reliable ways to control the results obtained.
Conclusion In the course of the study, we developed and certified methods for identifying and quantifying the content of non-infectious food protein allergens of plant (gluten, peanuts, nuts, soybeans) and animal (cow’s milk, chicken eggs, fish, seafood) origin in samples of all types of food products and objects related to the requirements for food products, as well as wipe samples obtained from countertops during in-process inspection using ELISA reagent kits manufactured by XEMA LLC. For gluten, soybeans and cow’s milk, the following analysis scheme is proposed: 1) qualitative screening of the samples under study for the presence or absence of the target antigen; 2) quantitative evaluation of the antigen content in the samples with a positive screening test result. It is planned to implement this scheme to detect other food allergens. We have established the detection limits of the methods used to identify noninfectious food protein allergens of animal or plant origin in food samples and countertop wipe samples. Moreover, the techniques for measuring the mass fraction of soybean trypsin inhibitor and total casein provided in the developed documents were certified for compliance with the requirements of Federal Law No. 102-FZ [34] and GOST R 8.563-2009 [35].
On Developing Metrological Assurance to Identify and Quantify …
193
We have also revealed the need for developing reference materials for the composition of food allergens to control the identification and quantification results. The developed methods for identifying and quantifying the content of noninfectious food protein allergens of plant and animal origin make it possible to ensure the safety of food products when establishing product compliance with the requirements of TR CU 022/2011 and TR CU 027/2012. Acknowledgements This research did not receive financial support in the form of a grant from any governmental, for-profit, or non-profit organizations. Author Contributions Pervukhina O. Ye.—development of the research concept, writing a draft of the article, preparing visual materials; Sergeeva A. S.—data curation, checking and editing the text of the article; Krasheninina M. P.—curating the research activity, revision of the text; Studenok V. V.—research work; Mashkov E. S.—research work; Petukhov P. A.—development of the research concept, development of methods, provision of materials for research; Maigurova V. N.—research work, validation. Conflict of Interest The article was prepared on the basis of a report presented at the V International Scientific Conference “Reference Materials in Measurement and Technology” (Yekaterinburg, September 13–16, 2022). The article was admitted for publication after the abstract was revised, the article was formalized, and the review procedure was carried out. The version in the Russian language is published in the journal “Measurement Standards. Reference Materials” 2023;19(3):145–158. (In Russ.). https://doi.org/10.20915/2077-1177-2023-19-3145-158.
References 1. Lepeshkova TS, Beltiukov EK, Naumova VV, Smolenskaia OG, Tsarkova SA, Saveleva EV et al (2021) Food allergy. Diagnosis, treatment and prevention: training manual. UGMU, Yekaterinburg, 113 pp (in Russian) 2. Drannik GN (1999) Clinical immunology and allergology. Astro-print, Odessa, 603 pp (in Russian) 3. Codex Alimentarius: International Food Standarts. Code of practice on food allergen management for food business operators CXC 80-2020.https://www.fao.org/fao-who-codexaliment arius/sh-proxy/en/?lnk=1&url=https%253A%252F%252Fworkspace.fao.org%252Fsites% 252Fcodex%252FStandards%252FCXC%2B80-2020%252FCXC_080e.pdf. Accessed 17 Oct 2022 (in Russian) 4. Heggum C (2022) Codex Alimentarius. Encyclopedia of Dairy Sciences (3rd edn), pp 726–736. https://doi.org/10.1016/B978-0-12-818766-1.00241-5 5. Food allergy: clinical recommendations of the Ministry of Health of the Russian Federation (2018), 50 pp 6. Muraro A, Werfel T, Hoffmann-Sommergruber K, Roberts G, Beyer K, Bindslev-Jensen C et al (2014) EAACI food allergy and anaphylaxis guidelines: diagnosis and management of food allergy. Allergy 69(8):1008–1025. https://doi.org/10.1111/all.12429 7. Liu Q, Lin S, Sun N (2022) How does food matrix components affect food allergies, food allergens and the detection of food allergens? A systematic review. Trends Food Sci Technol 127:280–290. https://doi.org/10.1016/j.tifs.2022.07.009
194
O. Ye. Pervukhina et al.
8. Sena-Torralba A, Pallás-Tamarit Y, Morais S, Maquieira A (2020) Recent advances and challenges in food-borne allergen detection. TrAC Trends Anal Chem 132:116050. https://doi.org/ 10.1016/j.trac.2020.116050 9. TR TS 022/2011 (2011) Technical regulation of the Customs Union “Food products in terms of their labeling”. Available via Legal information system “Legalakt—laws, codes and regulations of the Russian Federation”. https://legalacts.ru/doc/reshenie-komissii-tamozhennogo-soiuzaot-09122011-n-881-o/. Accessed 17 Oct 2022 (in Russian) 10. Remington BC, Baumert J, Blom WM, Bucchini L, Buck N (2022) Allergen quantitative risk assessment within food operations: concepts towards development of practical guidance based on an ILSI Europe workshop. Food Control 138:108917. https://doi.org/10.1016/j.foodcont. 2022.108917 11. Illarionova EA, Syrovatskii IP (2021) Fundamentals of the mass spectrometry method. Practical application of the method: training manual. IGMU, Irkutsk, 49 pp (in Russian) 12. Fan S, Ma J, Liu Z, Ning Y, Cao M, Li Q et al (2023) Determination of egg and milk allergen in food products by liquid chromatography-tandem mass spectrometry based on signature peptides and isotope-labeled internal standard. Food Sci Human Wellness 12(3):728–736. https://doi.org/10.1016/j.fshw.2022.09.006 13. Prado M, Ortea I, Vial S, Rivas J, Calo-Mata P, Barros-Velázquez J (2016) Advanced DNAand protein-based methods for the detection and investigation of food allergens. Crit Rev Food Sci Nutr 56(15):2511–2542. https://doi.org/10.1080/10408398.2013.873767 14. Kariakin AA, Ulasova EA, Vagin MI, Kariakina EE (2002) Biosensors: device, classification and functional characteristics. Sensor 1:16–24 (in Russian) 15. Sheng K, Jiang H, Fang Y, Wang L, Jiang D (2022) Emerging electrochemical biosensing approaches for detection of allergen in food samples: a review. Trends Food Sci Technol 121:93–104. https://doi.org/10.1016/j.tifs.2022.01.033 16. Federal low “About technical regulation” No. FZ-184 of 27.12.2002 (in Russian). Available via Official Internet portal of legal information. https://docs.cntd.ru/document/901836556. Accessed 17 Oct 2022 (in Russian) 17. Medvedevskikh MY, Medvedevskikh SV, Sergeeva AS, Petukhov PA (2020) Methods of identification and quality control of milk and dairy products: development and application in the field of technical regulation. Legal Appl Metrol 4(166):13–16 (in Russian) 18. Medvedevskikh MYu, Sergeeva AS, Studenok VV, Petukhov PA (2020) Development of metrological assurance of measurement of microbial transglutaminase content in nutritive products. Measurem Stand Ref Mater 16(3):53–62 (in Russian). https://doi.org/10.20915/2687-08862020-16-3-53-62 19. Studenok VV, Medvedevskikh MYu, Sergeeva AS (2020) Metrological assurance of enzyme multiplied immunoassay. Current stage and development prospects. In: Reference materials in measurement and technology: Collection of works IV international scientific conference, 1–3 December 2020, St. Petersburg, Russia. UNIIM, Ekaterinburg, pp 110–111 (in Russian) 20. Pei X, Zhang B, Tang J, Liu B, Lai W, Tang D (2013) Sandwich-type immunosensors and immunoassays exploiting nanostructure labels: a review. Anal Chim Acta 758(3):1–18. https:// doi.org/10.1016/j.aca.2012.10.060 21. RMG 61-2010 (2013) State system for ensuring the uniformity of measurements. Accuracy, trueness and precision measures of the procedures for quantitative chemical analysis. Methods of evaluation. Standartinform, Moscow, 62 pp (in Russian) 22. GOST R ISO 5725-5-2002 (2002) Accuracy (trueness and precision) of measurement methods and results. Part 2. Basic method for the determination of repeatability and reproducibility of a standard measurement method. Standartinform, Moscow, 46 pp (in Russian) 23. GOST 33838-2016 (2019) Products of grain processing. Immunoassay method for the determination of gluten. Standartinform, Moscow, 10 pp (in Russian) 24. Method for measuring the gluten content in grain processing products by enzyme immunoassay using the GLIADIN-IFA reagent kit manufactured by OOO KhEMA. Available via FIF EUM. https://fgis.gost.ru/fundmetrology/registry/16/items/1386259. Accessed 17 Oct 2022
On Developing Metrological Assurance to Identify and Quantify …
195
25. CXS 118-1979 (1979) Standard for foods for special dietary use for persons intolerant to gluten. Available via ISDI. https://www.isdi.org/wp-content/uploads/2020/04/CXS-118-1979. pdf. Accessed 17 Oct 2022 26. GOST ISO/IEC 17043-2013 (2013) Conformity assessment. General requirements for proficiency testing. Standartinform, Moscow, 40 pp 27. Krasheninina MP, Sergeeva AS, Medvedevskikh MYu, Miluyshkin AL, Shatalov IS (2018) On the development of a certified reference material of gluten. In: Reference materials in measurement and technology: Collection of works III international scientific conference, Yekaterinburg, 11–14 September 2018. UNIIM, Yekaterinburg, pp 97–99 (in Russian) 28. TR TS 027/2012 (2012) On the safety of certain types of specialized food products, including dietary therapeutic and dietary preventive nutrition: technical Regulations of the Customs Union. Available via Electronic fund of legal and normative-technical documents. https://docs. cntd.ru/document/902352823. Accessed 17 Oct 2022 29. Anderson RL, Wolf WJ (1995) Compositional changes in trypsin inhibitors, phytic acid, saponins and isoflavones related to soybean processing. Journal of Nutrition 125(3Suppl): 581S–588S. https://doi.org/10.1093/jn/125.3_Suppl.581S 30. Methods for identifying and quantifying the content of non-infectious food allergens of plant protein origin in samples of all types of food products and objects related to the requirements for food products, swabs taken from work surfaces during production control, using reagent kits for enzyme immunoassay produced by XEMA LLC. Part 1. Available via FIF EUM. https:// fgis.gost.ru/fundmetrology/registry/16/items/1401610. Accessed 17 Oct 2022 (in Russian) 31. Method for measuring the mass fraction of the sum of caseins in samples of all types of food products and objects related to the requirements for food products, swabs taken from work surfaces during production control, using the enzyme immunoassay method using the MolokoELISA reagent kit manufactured by XEMA LLC, contained in the document “Methods for the identification and quantification of the content of non-infectious food allergens of animal protein origin in samples of all types of food products and objects related to the requirements for food products, swabs taken from work surfaces during production control, using reagent kits for enzyme immunoassay analysis of the production of XEMA LLC”. Part 2. Available via FIF EUM. https://fgis.gost.ru/fundmetrology/registry/16/items/1402514. Accessed 17 October 2022 (in Russian) 32. Monaci L, Tregoat V, van Hengel AJ, Anklam E (2006) Milk allergens, their characteristics and their detection in food: a review. Eur Food Res Technol 223(2):149–179. https://doi.org/ 10.1007/s00217-005-0178-8 33. Swaisgood HE (1993) Review and update of casein chemistry. J Dairy Sci 76(10):3054–3061. https://doi.org/10.3168/jds.S0022-0302(93)77645-6 34. Federal Law “On ensuring the uniformity of measurements” No. FZ-102 of 26.06.2008 (in Russian). Available via Official Internet portal of legal information. http://pravo.gov.ru/proxy/ ips/?docbody=&firstDoc=1&lastDoc=1&nd=102122832. Accessed 17 Oct 2022 (in Russian) 35. GOST 8.563-2009 (2011) State system for ensuring the uniformity of measurements. Procedures of measurements. Standartinform, Moscow, 20 pp
Measurement Techniques for the Composition of Air Environments: Development and Application Olga B. Ponomareva, Yulia V. Kanaeva, and Mariia V. Gaiko
Abstract Accurate and reliable measurements of the composition of air environments (workplace air, ambient air, industrial air emissions) form a solid basis for decision making in the area of environmental quality. This article deals with the problem of developing and testing techniques for measuring air quality parameters. The disadvantages of the existing techniques are identified. A methodology for creating appropriate techniques is proposed. Procedures for developing reference materials (RMs) for internal and external quality control of measurement results are described, along with approaches to estimating the metrological characteristics of measurement techniques. The process of applying measurement techniques is specified. It is shown that techniques for measuring air quality parameters may be divided for two basic stages, i.e., the stage of analytical sampling and the stage of measuring the required indicators in this sample. This approach expands the possibilities of developing and certifying such techniques, thereby increasing the reliability of measurement results. Using the developed approach, the authors have successfully developed 12 techniques for measuring air quality parameters and two certified reference materials (CRMs). Works in this direction are continued. Keywords Measurement technique · Air environment composition indicators · Workplace air · Ambient air · Industrial emissions · Measurement error · Measurement uncertainty · Accuracy assurance · Reference material
O. B. Ponomareva (B) · Y. V. Kanaeva · M. V. Gaiko UNIIM—Affiliated Branch of the D. I. Mendeleyev Institute for Metrology, Yekaterinburg, Russia e-mail: [email protected] Y. V. Kanaeva e-mail: [email protected] © D. I. Mendeleyev Institute for Metrology 2024 E. P. Sobina et al. (eds.), Reference Materials in Measurement and Technology, https://doi.org/10.1007/978-3-031-49200-6_13
197
198
O. B. Ponomareva et al.
Introduction Air quality is an essential condition for public health and environmental safety, both in Russia and globally [1–3]. Air pollution due to industrial emissions is associated with adverse health effects for employees at industrial enterprises [4, 5]. Lead, nickel, and chromium are referred to as highly-toxic hazard substances [6, 7] posing a severe risk of allergic and oncological diseases. Chronic intoxication with nickel or chromium compounds damages nasopharynx and lungs, leads to the appearance of malignant neoplasms and allergic lesions in the form of dermatitis and eczema. Continuous inhalation of chromium (VI) compounds increases the risk of lung, nasal, and sinus cancer. Lead dust may cause neurological, gastrointestinal, blood, and kidney diseases. Prolonged exposure to copper results in eye, nose, and mouth irritation, producing headache, dizziness, vomiting, and diarrhea. Titanium excess is found among people working in chemical and metallurgical plants. Exposure to titanium dust is manifested in coughing, chest pain, and cramps, leading to breathing problems. Inhalation of silicon dioxide is associated with a significant threat to human health [8]. Found in the air in the form of aerosol, silicon dust causes irritation of the upper respiratory tract and bronchus, as well as gastrointestinal tract diseases. Harmful substances in the atmosphere are responsible for climate change and greenhouse effects [9], thus negatively affecting all natural processes and phenomena. Therefore, measures should be taken to reduce the presence of harmful substances by purifying industrial emissions [10], imposing stricter requirements for cars, etc. One essential measure consists in the monitoring of pollutants emitted into the atmosphere. Reliable information on the air composition and characteristics of air environments (workplace air (WA), industrial air emissions (IAE), ambient air (AA)) should underpin the decision-making process in the sphere of public health. The solution of these tasks require: • improved measurement techniques to reliably and accurately monitor the composition of air environments; • a methodology for developing such techniques; • characterization and calibration techniques; • procedures for implementation and application of the developed techniques; • development and application of certified reference materials (CRMs) of approved types, appropriate to the analytical samples selected for measurements.
Measurement Techniques for the Composition of Air Environments …
199
Reasons for the Development of New Techniques for Measuring the Composition of Air Environments In the Russian Federation, new Sanitary Regulations and Standards SanPiN 1.2.368521 [7] were approved in 2021. This document formulates requirements for allowable concentrations of harmful substances in AA and WA environments, which are presented in Table 1. The requirements for industrial air emissions are defined in relation to specific enterprises and are regulated by regional levels of executive power. In accordance with the Federal Law of the Russian Federation No. 102-FZ [11], the implementation of activities in the field of environmental protection refers to the sphere of state regulation of the uniformity of measurements, with such measurements being subject to mandatory metrological requirements. New requirements for measurement ranges of harmful substances in air environments and for their measurement accuracy are introduced in the List of measurements related to the state regulation of ensuring the uniformity of measurements, approved by the Government of the Table 1 Excerpt from SanPiN 1.2.3685-21 for the chromium mass concentration Measurement object
Substance
Maximum allowable concentrations (mg/m3 )
Ambient air
Chromium/expressed as chromium (VI) oxide
0.0015
Workplace air
Chromium hydroxide sulfate/ expressed as chromium (III)/ (chromium sulfate basic)
0.06/0.02
Chromium-2,6-dihydrogen phosphate/by chromium (III)/ (chromium phosphate monosubstituted)
0.06/0.02
Chromium (VI) trioxide (chromium trioxide; chromic anhydride)
0.03/0.01
di-Chromium trioxide/by chromium (III)/(di-chromium trioxide), chromium oxide
3/1
Chromium trifluoride/by fluorine/(chromium fluoride)
2.5/0.5
Chromium trichloride hexahydrate/by chromium (III)
0.03/0.01
Chromium phosphate (chromium orthophosphate)/ (chromium phosphate trisubstituted)
2
Chromic acid salts/expressed as 0.03/0.01 chromium (VI)
200
O. B. Ponomareva et al.
Russian Federation Decree of November 16, 2020 No. 1847 (List of measurements) [12] (see Table 2). For example, the permissible error for measurements of the mass concentrations of organic and inorganic substances in WA in the new List of measurements was increased from 25 to 35%. In addition, the specified List of measurements establishes a permissible error of 10% in measuring the air flow rate when taking WA samples in the measurement range (in dm3 /min) from 0.1 to the value established in the certified measurement technique. An additional requirement is formulated for the mass concentration of harmful substances in WA: “a selective measurement of the harmful substance concentration must be provided in the presence of associated components at ≤ 0.5 of the maximum allowable concentration (MAC), (mg/m3 ).” According to paragraph 72 of SanPiN 2.1.3684-21, “Sanitary and epidemiological measures shall be taken with respect to sources of exposure causing chemical, physical, and biological effects exceeding 0.1 of the MAC (Safe Reference Levels of Impact (SRLI)) and (or) the Maximum acceptable limit (MAL)…” [13]. In accordance with the Federal Law 247-FZ [14], in 2020, obsolete measurement techniques that did not satisfy modern requirements were abolished. In accordance with [11], in the sphere of state regulation, the traceability of measurement results must be ensured; similar requirements are set for laboratories in paragraph 6.5 of GOST ISO/IEC 17025-2019 [15]. Measurement results should correspond to the established measurement accuracy characteristics, which are established through the concept of measurement error in the List of measurements. At the same time, paragraph 7 of GOST ISO/IEC 17025-2019 [15] suggests that laboratories should establish the uncertainty of their measurement results. Since measurements of the content of airborne components belongs to the sphere of the state control for measurement uniformity assurance, the accuracy control of measurement results (internal and external) should be performed using CRMs (if available), which are appropriate for the selected analytical samples. The metrological characteristics of the majority of existing techniques (more than 80%) cannot be established using reference gas mixtures or microflow sources. In this case, the laboratory techniques used to measure the composition of air environments can be divided into two stages: analytical sampling and the analytical stage [16]. For such techniques, an analytical sample taken directly at the place of air sampling is represented by the components absorbed from the air environment onto an appropriate absorbent (filter, sorbent, absorbent solution), rather than a sample of the tested air environment.
Methodology for Developing Measurement Techniques Figure 1 outlines a structural scheme of the proposed methodology for developing measurement techniques. Let us consider the stages shown in Fig. 1 in greater detail.
Industrial air emissions
Workplace air Permissible measurement error limits of mass concentrations of organic and inorganic substances in workplace air for single measurements (single sampling) δn = ± (15–35)%
Permissible measurement error limits of mass concentrations of organic and inorganic substances in ambient air δn = ± (10–25)%
Permissible measurement error limits of mass concentrations of organic and inorganic substances in industrial air emissions δn = ± (8–25)%
Ambient air
Measurement Accuracy standards object
Table 2 Excerpt from the list of measurements related to the state regulation of the uniformity of measurements, approved by the Government of the Russian Federation from November 16, 2020 No. 1847 [12]
Measurement Techniques for the Composition of Air Environments … 201
202
O. B. Ponomareva et al.
Fig. 1 A structural scheme of development of measurement techniques for air environment composition
Measurement Techniques for the Composition of Air Environments …
203
Selection of Measurement Objects and Measurable Indicators Since measurement procedures for different air environments (WA, IAE, and AA) are fundamentally identical, a decision to select one measurement technique for all environments should be taken, with specification of the sampling procedure for each environment. The measured parameters are selected from those most relevant in laboratories.
Analysis of Measurement Techniques (Existing or Previously Valid) for Selected Objects and Indicators The conducted analysis of existing measurement techniques revealed their following shortcomings: (1) the names of the defined components often do not correspond to SanPiN, which leads to inconsistency between the parties involved; (2) some techniques lack information about the sampling rate and the volume of sampled air; (3) incomplete description of the procedure used for obtaining measurement results and the shelf life of reagent solutions; (4) misspellings in the techniques often lead to incorrect results; (5) the applied chemical reactions do not allow determining the content of a particular compound; as a result, the technique determines the total content of the same anions (or cations) from different compounds contained in the analytical sample; (6) the interfering influences that lead to over- or underestimation of the measurement results are not taken into account; (7) the isokineticity of gas flows should be regarded during measurements, which is almost impossible; (8) no CRMs are used for constructing a calibration curve (CC) and for quality control of measurement results, which contradicts [11]; (9) accuracy control is most often limited to verifying the CC stability. (10) the measurement range does not always meet the requirements of statutory instruments, SanPiN 1.2.3684-21 in particular [13]; (11) absence of information about the errors or uncertainty characteristics of measurement results.
204
O. B. Ponomareva et al.
Below, some examples of such techniques are presented. MU 4945-88 [17] (1) The information on how a sample is taken is absent, including whether a filter (and what kind) or an absorbent solution (what kind) is used. No information is given about the speed and duration of air environment aspiration. (2) Procedures for preparing solutions, samples for calibration and accuracy control, etc., are absent. (3) The description of the measurement procedure starts with the words “1–5 ml of a sample solution…”. The question arises at what stage this solution appeared— during sampling or during the preparation of the sample for measurements. MUK 163777 [18] (1) According to the description, it is assumed that the sample volume from one absorption solution depends on the content of ammonia in the sample. For this purpose, “1 and 5 ml are taken to conduct two parallel measurements of the ammonia mass concentration.” As a result, some executors sum up the results obtained using different aliquots. (2) The formula for obtaining the final measurement result (see formula 1) is given in paragraph 4 of the measurement technique. The ammonia concentration X in mg/m3 of air is calculated by the formula: X=
GV1 , V VC T
(1)
where G is the amount of ammonia found in the analyzed solution volume, μg; V is the total sample volume, ml; V 1 is the sample volume taken for analysis, ml; V CT is the air volume sampled for analysis, reduced to standard conditions according to the formula VC T = Vt
(273 + 20)P = Vt K 1 , (273 + t)101.33
where V t is the air volume measured at t°C and a pressure of 101.33 kPa. The formula presented in [18] is incorrect. The authors propose to swap the volume of the sample taken for analysis and the total volume of the sample. Then, when calculating the ammonia mass concentration according to the formula, the measurement result is reduced by several times.
Measurement Techniques for the Composition of Air Environments …
205
Selection of Measurement Techniques and Procedures The main methods currently used to analyze the air environment composition are the following [19–21]. These are: photometry and spectrophotometry; atomic absorption spectrometry; titrimetry; potentiometry; voltammetry (polarography); gas chromatography or high-performance liquid chromatography. When developing the techniques, the most accessible methods for laboratories were selected—photometry and titrimetry. According to [18], the measurement procedure consists of two stages (analytical sampling and analytical stage), which makes it possible to describe the stage of taking an analytical sample for each air environment separately, and then—to measure the content of the component in the analytical sample in accordance with a single procedure.
Selection of the Names of the Components to Be Determined The names of the components to be determined are selected with reference to the names established in the Sanitary Regulations and Standards, based on the possibility of determining the selected indicators by the established measurement method and the possible influence of interfering components on the measurement results of the indicators in analyzed samples.
Establishing the Necessary Measurement Ranges of the Components to Be Determined The establishment of the measurement ranges of the component to be determined is based on the requirements of the current statutory instruments (SIs) and regulatory documents (RDs) (such as, for example: List of measurements [12], SanPiN 1.2.3685-21 [7], SanPiN 2.1.3684-21 [13], etc.). This takes into account the measurement ranges of the components in the previously developed measurement techniques, since the developers of techniques do not have information about all regional SIs. In addition, the following parameters are set for each stage: the volume of the aspirated air environment for the first stage and the measurement range of the mass of the analyzed component in the analytical sample for the second stage.
206
O. B. Ponomareva et al.
Establishing a Procedure for the Analytical Sampling Stage At this stage of the procedure, the equipment, reagents, and materials necessary for taking an analytical sample are selected. The analytical sampling stage should be described in detail for each air environment separately, taking into account the requirements of the current SIs and RDs. At the same time, it is necessary to pay special attention to the indication of the required aspiration rate and time, the volume of the aspirated air environment. When selecting these parameters, the capabilities of the measuring instruments (MIs) used for sampling are also considered. The MI errors must comply with the requirements of SIs and RDs. When obtaining an analytical sample, the component to be determined is absorbed into the appropriate absorbent solution or absorbed onto the selected filter (sorbent) during the air environment sampling process. In addition, at the analytical sampling stage, the atmospheric pressure, the temperature of the air environment in relation to the sampling point, and the pressure or vacuum at the inlet of the sampling device (for industrial emissions) are determined.
Establishing a Procedure for the Methodological Analytical Stage The procedure for establishing the CC (when using the spectral method) is selected based on the following steps: (1) selection of equipment, reagents, materials, and CRMs required to establish a CC. If available, CRMs of approved types for the composition of the determined component solution, traceable to state standards. It is allowed to use other MIs, auxiliary equipment, reagents, materials, and RMs, provided that their metrological, technical, and qualification characteristics are not worse than those specified in the technique; (2) setting the CC range; (3) establishing procedures for preparing calibration samples, taking into account the shelf life of each solution; (4) establishing a procedure for creating a CC, considering the linear dependence of the MI signal on the mass of the analytical sample component to be determined; (5) establishing the number of parallel signals when creating a CC and their permissible range; (6) determining a formula for the relationship between the analytical sample component mass and the MI signal; (7) establishing a standard and procedure for verifying the CC linearity. (8) establishing a standard and procedure for verifying the CC stability.
Measurement Techniques for the Composition of Air Environments …
207
Establishing a Measurement Procedure for an Analytical Sample When preparing the analytical sample for measurements, including establishing a procedure for preparing solutions (including an analytical sample solution) and their shelf lives, procedures are established for measuring the prepared analytical sample and obtaining the measurement result according to the analytical stage of the technique. If necessary, additional aliquoting and/or dilution of the prepared analytical sample shall be provided. In this case, the measurement result of the component mass taking into account the aliquoting and/or dilution factor must fall within the measurement range for the analytical stage of the technique. Based on the aspirated air volume and the determined component mass in the analytical sample, the mass concentration of the measured component is calculated. To this end, the aspirated air volume, adjusted to normal (for AA and IAE) or standard (for WA) conditions, taking into account the atmospheric pressure during sampling, air temperature in the sampling point, the pressure or underpressure value at the sampling device inlet (for industrial emissions), is used.
Establishing the Accuracy Indicators of the Measurement Technique The accuracy indicators are defined in the form of error and uncertainly characteristics of measurement results. For the analytical sampling stage, the error characteristic is established by the computational or computational-experimental method using Annex B of RMG 61-2010 [16, 22]. The uncertainty value is established using GOST 34100.3-2017/ISO/IEC Guide 98-3:2008 [23]. For the analytical stage, the accuracy value (both in the form of an inaccuracy characteristic and in the form of an uncertainty value) is established by applying the algorithm using the samples for evaluation presented in paragraph 5 of RMG 612010 [22]. In this case, the samples for evaluation are used, as adequate as possible to the analyzed analytical samples. The accuracy indicators of the measurement technique are based on the superposition of the accuracy indicators of the analytical sampling stage and the analytical stage.
208
O. B. Ponomareva et al.
Specifying Accuracy Algorithms for Measurement Results Since the measurement technique is divided into two stages, accuracy verification should be conducted for each stage separately. The quality of the analytical sampling stage is controlled by calibration of all MIs used at this stage and periodic visual control of the sampling procedure. Intralaboratory quality control of measurement results (in this case—for the analytical stage of the technique) in accordance with RMG 76-2014 [24] consists of two components: operational control and control of the stability of measurement results. Algorithms used to verify the stability of measurement results are not specified in the technique. Their selection depends on the specifics of a particular laboratory: the frequency of measurements, the variety of measurement conditions, the range of practical measurements, etc. The measurement quality of the analytical stage of the technique is assured using an algorithm based on control samples according to paragraph 5.5 of RMG 762014 [24]. Control samples include those adequate to the analytical samples and similar to the samples used when evaluating the metrological characteristics of this measurement stage.
Determining the Form of Presenting the Measurement Results In accordance with RMG 93-2015 [25], the presentation of measurement results in documents that imply their further use should include the accuracy indicator consisting of no more than two significant digits. The measurement result must end with a digit of the same place as the accuracy indicator.
Forming a Measurement Technique Document The document for the measurement technique is prepared in accordance with GOST R 8.563-2009 [26].
Technique Characterization According to [11], in the state regulation of measurement uniformity assurance, measurement techniques must be characterized, i.e., examined and approved for compliance with the established metrological requirements for measurements. Characterization of measurement techniques is carried out in accordance with the Order of the Ministry of Industry and Trade of December 15, 2015 No. 4091 [27].
Measurement Techniques for the Composition of Air Environments …
209
The certified techniques are included in the Federal Information Fund for Ensuring the Uniformity of Measurements (FIF EUM),1 in which they are assigned a registration number.
Implementation and Application of Techniques The developed measurement techniques are applied in sanitary, ecological, and analytical laboratories, or other departments performing environmental control and/ or air quality monitoring. Such techniques can be applied in other testing and analytical laboratories specializing in similar research. According to paragraph 7.2.1.5 of GOST ISO/IEC 17025-2019 [17], “before implementing the selected techniques in operation, the laboratory shall confirm that it can properly apply the selected techniques, ensuring the required performance. Records of verification shall be stored.” Thus, in order to use the selected technique, the laboratory should: • select (purchase) equipment, materials, reagents, and CRMs that meet the requirements of the technique; • implement the measurement procedure; • confirm that the measurement accuracy values do not exceed those specified in the technique (e.g., by implementing internal control procedures, see RMG 76-2014 [24]) or establishing its own accuracy values not exceeding the accuracy values of the measurement technique (e.g. according to RMG 76-2014, Annexes A, B [24]); • record the obtained results in a document, e.g., a technique implementation report (note that certified measurement techniques are not subject to validation, i.e., changes in the components to be determined, measurement ranges, or application scope); • establish a quality control system for measurement results. To ensure confidence in the measurement results and prevent obtaining low-quality data regarding the air environment, the laboratory shall (according to GOST ISO/IEC 17025-2019 [15]) monitor the reliability of its results through internal control and, if possible, comparison with the results obtained in other laboratories (participation in interlaboratory comparisons, ILC), in accordance with GOST ISO/IEC 17043-2013 [28].
1
Federal Information Fund for Ensuring the Uniformity of Measurements. Available via FIF EUM. https://fgis.gost.ru/fundmetrology. Accessed 4 August 2022 (In Russ.).
210
O. B. Ponomareva et al.
Development and Application of CRMs Adequate for Analytical Samples Existing CRMs [19, 20] are unable to solve the problem of internal and external quality control of air environment measurements. The development of CRMs adequate for analytical samples is a challenge for the analytical community. An approach to creating such samples is described in [29].
Practical Implementation of the Proposed Methodology Since 2020, UNIIM specialists (UNIIM—Affiliated Branch of the D. I. Mendeleyev Institute for Metrology) have successfully used the methodology described in the present article to develop 12 techniques for measuring air environments. The developed techniques were characterized to confirm their compliance with the established metrological measurement standards. The techniques were certified using CRMs of approved types with the description of control procedures for each of the two stages of the technique. The analytical stage is verified using control samples adequate to the analytical samples. In order to ensure requirements for obtaining objective and reliable information used for public life, health and environmental protection purposes, the measurement techniques have been included in the FIF EUM. The developed techniques are presented in Table 3. UNIIM uses samples that are adequate to analytical samples to certify the developed techniques for air environment analysis. Since 2014, the ILC provider UNIIM has been carrying out ILCs using such sample simulators. UNIIM specialists have developed GSO 11278-20192 and GSO 11277-2019.3 The measurement techniques developed at UNIIM are used not only to determine the composition of air environments composition, but also to characterize RMs and samples for quality testing. This increases the metrological level of the work performed. The developed CRMs are used for the internal quality control of measurement results and for conducting ILCs.
2
GSO 11278-2019 Reference materials of the mass concentration of manganese deposited on the AFA-XA filter from the air (V-Mn-03 SO UNIIM). Available via FIF EUM. https://fgis.gost.ru/fun dmetrology/registry/19/items/583284. Accessed 4 August 2022 (In Russ.). 3 GSO 11277-2019 Reference materials of the mass concentration of iron deposited on the AFA-XA filter from the air (In Fe 02 CO UNIIM). Available via FIF EUM. https://fgis.gost.ru/fundmetro logy/registry/19/items/583285. Accessed 4 August 2022 (In Russ.).
Measurement Techniques for the Composition of Air Environments …
211
Table 3 Measurement techniques for the composition of air environments developed at UNIIM Code and name of the Component to measurement technique, FIF EUM be determined registration number
Measurement range, mg/m3
± δ1 , % (U0 2 , %)
M-222-1/2020 Technique for measuring the mass concentrations of iron and iron expressed as iron (III) oxide in workplace air, ambient air, and industrial air emissions by the photometric method, FR.1.31.2020.37587
AA
From 0.025 to 4.0 inclusive
25 (25)
WA
From 0.17 to 267 inclusive
IAE
From 1.0 to 2.0·103 inclusive
AA
From 0.036 to 5.7 inclusive
WA
From 0.24 to 380 inclusive
IAE
From 1.44 to 2.8·103 inclusive
AA
From 0.005 to 2.7 inclusive
WA
From 0.015 to 180 inclusive
IAE
From 0.7 to 1.4·103 inclusive
AA
From 0.008 to 4.3 inclusive
WA
From 0.024 to 280 inclusive
IAE
From 1.2 to 2.2·103 inclusive
M-222-2/2020 Technique for measuring the mass concentrations of manganese and manganese expressed as manganese (IV) in workplace air, ambient air, and industrial air emissions by the photometric method, FR.1.31.2020.37584
Iron
Iron expressed as iron (III) oxide
Manganese
Manganese expressed as manganese (IV) oxide
25 (25)
25 (25)
25 (25)
M-222-3/2020 Technique for measuring the mass concentration of dust (suspended substances) in workplace air, ambient air, and industrial air emissions by the gravimetric method, FR.1.31.2020.37773
Dust (suspended substances)
AA WA IAE
From 0.1 to 4000 inclusive
25 (25)
M-222-4/2020 Technique for measuring the mass concentration of sulfuric acid in workplace air, ambient air, and industrial air emissions by the photometric method, FR.1.31.2020.38606
Sulfuric acid
AA
From 0.2 to 5.0 inclusive
23 (23)
WA
From 0.5 to 25.0 inclusive
IAE
From 0.5 to 30.0 inclusive (continued)
212
O. B. Ponomareva et al.
Table 3 (continued) Code and name of the Component to measurement technique, FIF EUM be determined registration number
Measurement range, mg/m3
± δ1 , % (U0 2 , %)
M-222-5/2020 Technique for measuring the mass concentration of hydrochloric acid in workplace air, ambient air, and industrial air emissions by the turbidimetric method, FR.1.31.2021.39027
Hydrochloric acid
AA WA IAE
From 0.10 to 3000 25 (25) inclusive
M-222-6/2021 Technique for measuring the mass concentration of ammonia in workplace air, ambient air, and industrial air emissions by the photometric method, FR.1.31.2021.39683
Ammonia
AA
From 0.02 to 500.0 24 (24) inclusive
WA
From 0.2 to 2·103 inclusive
IAE
From 0.1 to 3·103 inclusive
M-222-7/2021 Technique for measuring the mass concentrations of total chromium, chromium (VI), chromium (III), and total chromium expressed as chromium trioxide (chromic anhydride) in workplace air, ambient air, and industrial air emissions by the photometric method, FR.1.31.2021.40211
Chromium (VI)
WA
From 0.011 to 9.0 inclusive
AA IAE
From 0.01 to 9.0 inclusive
WA
From 0.011 to 9.0 inclusive
AA IAE
From 0.01 to 9.0 inclusive
WA
From 0.011 to 18.0 25 (25) inclusive
IAE
From 0.01 to 18.0 inclusive
AA
From 0.75·10–4 to 18.0 inclusive
Chromium (III)
Total chromium
Total chromium expressed as chromium trioxide (chromic anhydride) M-222-8/2021 Technique for measuring the mass concentration of oxide nitrogen (IV) in workplace air, ambient air, and industrial air emissions by the photometric method, FR.1.31.2021.40860
WA IAE From 0.02 to 34.6 AA
Oxide nitrogen WA (IV) (nitrogen dioxide) AA IAE
24 (24)
25 (25)
25 (25)
from 1.4 ·10–4 to 34.6 inclusive
From 1.0 to 100 inclusive
24 (24)
From 0.02 to 100 inclusive From 0.02 to 1000 inclusive (continued)
Measurement Techniques for the Composition of Air Environments …
213
Table 3 (continued) ± δ1 , % (U0 2 , %)
Code and name of the Component to measurement technique, FIF EUM be determined registration number
Measurement range, mg/m3
M-222-9/2021 Technique for measuring the total mass concentrations of caustic alkalis (expressed as sodium hydroxide) in workplace air, ambient air, and industrial air emissions by the titrimetric method, FR.1.31.2022.41864
Caustic alkalis expressed as sodium hydroxide
WA
From 0.20 to 1000 21 (21) inclusive
AA IAE
From 0.20 to 1500 inclusive
M-222-12/2021 Technique for measuring the mass concentrations of phenol in workplace air, ambient air, and industrial air emissions by the photometric method, FR.1.31.2022.42311
Phenol
AA WA IAE
From 0.001 to 100 22 (22) inclusive
M-222-13/2021 Technique for measuring the mass concentrations of formaldehyde in workplace air, ambient air, and industrial air emissions by the photometric method, FR.1.31.2022.42312
Formaldehyde
AA WA IAE
From 0.005 to 200 22 (22) inclusive
M-222-14/2022 Technique for measuring the mass concentrations of amorphous silicon dioxide and crystalline silicon dioxide in workplace air, ambient air, and industrial air emissions by the photometric method, FR.1.31.2022.43372
Amorphous silicon dioxide
AA
From 0.0020 to 100 inclusive
1 2
25 (25)
WA IAE From 1.00 to 100 inclusive Crystalline silicon dioxide
AA
From 0.0020 to 100 inclusive
25 (25)
WA IAE From 1.00 to 100 inclusive
Relative error limits (P = 0.95) Relative expanded uncertainty k = 2
Conclusion This article describes the reasons for the development of new techniques for measuring the composition of air environments. A methodology for developing such techniques is designed and implemented in practice. The questions of certifying measurement techniques and their implementation are discussed, along with the development and application of CRMs adequate to the analytical samples used for measurements. The process of practical implementation of the described procedures is described.
214
O. B. Ponomareva et al.
UNIIM specialists continue works on the development of new measurement techniques and new CRMs, which could be used by laboratories to provide reliable information regarding air environment composition. Acknowledgements This research did not receive financial support in the form of a grant from any public, commercial, or non-profit sector organization. Author Contributions Ponomareva O. B.—analysis of the reasons for developing and elaborating the concept of developing measurement techniques for air environment quality indicators, working on the article text, practical implementation of the statements of the article; Kanaeva Y. V.— developing the research design and overall management of the work, analyzing the procedures for implementation and application of the techniques, practical implementation of the statements of the article; Gaiko M. V.—analysis of existing methodological shortcomings in measuring air environment quality indicators, practical implementation of the statements of the article. Conflict of Interest The article was prepared on the basis of a report presented at the V International Scientific Conference “Reference Materials in Measurement and Technology” (Yekaterinburg, September 13–16, 2022). The article was admitted for publication after the abstract was revised, the article was formalized, and the review procedure was carried out. The version in the Russian language is published in the journal Measurement Standards. Reference Materials 2023;19(4):99–113. (In Russ.). https://doi.org/10.20915/2077-1177-2023-194-99-113.
References 1. O’Neill MS, Jerrett M, Kawachi I, Levy JI, Cohen AJ, Gouveia N (2003) Health, wealth, and air pollution: advancing theory and methods. Environ Health Perspect 111(16):1861–1870. https://doi.org/10.1289/ehp.6334 2. Chiarini B, D’Agostino A, Marzano E, Regoli A (2021) Air quality in urban areas: Comparing objective and subjective indicators in European countries. Ecol Ind 121:1–9. https://doi.org/ 10.1016/j.ecolind.2020.107144 3. Isitov DT, Kablukova OD (2016) How atmospheric pollution affects nature. Molodoj uchenyj 9.1(113.1):34–35 (in Russian) 4. Air pollution from industrial emissions. Available via Ecology, reference book. https://ru-eco logy.info/term/77204/. Accessed 4 Aug 2022 (in Russian) 5. Impact of industry on air pollution. Available via Ecology, reference book. https://ru-ecology. info/term/77204/. Accessed 4 Aug 2022 (in Russian) 6. Emissions of pollutants into the atmosphere: sources and regulation. Available via Eco-union. https://ecotoplivo-msk.ru/eko-bedy/promyshlennye-vybrosy.html. Accessed 4 Aug 2022 (in Russian) 7. SanPiN 1.2.3685-21 (2021) Hygienic standards and requirements for ensuring the safety and (or) harmlessness for humans of environmental factors: approved by the Decree of the Chief State Sanitary Doctor of the Russian Federation No 2 of 28.01.2021. Available via official internet portal of legal information. http://publication.pravo.gov.ru/Document/View/000120 2102030022. Accessed 4 Aug 2022 (in Russian) 8. Monn C (2001) Exposure assessment of air pollutants: a review on spatial heterogeneity and indoor/outdoor/personal exposure to suspended particulate matter, nitrogen dioxide and ozone. Atmos Environ 35(1):1–32. https://doi.org/10.1016/S1352-2310(00)00330-7 9. Pavlova EE (2018) Problems of emissions into the environment in Russia and the world. Molodoj uchenyj 23(209):269–273 (in Russian)
Measurement Techniques for the Composition of Air Environments …
215
10. Causes, effects and solutions of industrial pollution. Available via EREPORT.RU. http://www. ereport.ru/prel/prichiny-posledstviya-i-resheniya-promyshlennogo-zagryazneniya-okruzhayu shchej-sredy.htm. Accessed 4 Aug 2022 (in Russian) 11. Federal Law “On ensuring the uniformity of measurements” No. FZ-102 of 26.06.2008. Available via official internet portal of legal information. http://pravo.gov.ru/proxy/ips/?docbody=& firstDoc=1&lastDoc=1&nd=102122832. Accessed 4 Aug 2022 (in Russian) 12. Decree of the Government of the Russian Federation “On approval of the list of measurements related to the field of state regulation of ensuring the uniformity of measurements” No. 1847 16.11.2020. Available via official internet portal of legal information. http://publication.pravo. gov.ru/Document/View/0001202011230047. Accessed 4 Aug 2022 (in Russian) 13. SanPiN 2.1.3684-21 (2021) Sanitary and epidemiological requirements for the maintenance of territories of urban and rural settlements, for water bodies, drinking water and drinking water supply, atmospheric air, soils, residential premises, operation of industrial, public premises, organization and implementation of sanitary and anti-epidemic (preventive) measures: approved by the Decree of the Chief State Sanitary Doctor of the Russian Federation No. 3 of 28. 02. 2021. Available via official internet portal of legal information. http://public ation.pravo.gov.ru/Document/View/0001202102050027. Accessed 4 Aug 2022 (in Russian) 14. Federal Law “On mandatory requirements in the Russian Federation” No. FZ-247 of 31.07.2020. Available via official internet portal of legal information. http://publication.pravo. gov.ru/Document/View/0001202007310002. Accessed 4 Aug 2022 (in Russian) 15. GOST ISO/IEC 17025-2019 (2021) General requirements for the competence of testing and calibration laboratories. Standartinform, Moscow, 28 pp (in Russian) 16. Kropanev AY (2018) Methodologies for analysis of air environment. Certification and arrangement of intra laboratory control of the quality of analysis results. Industrial Laboratory. Diagnostics of Materials 84(8):65–70 (in Russian). https://doi.org/10.26896/1028-6861-2018-848-65-70 17. MU 4945-88 (1992) Guidelines for the determination of harmful substances in welding aerosol. Informacionno izdatel’skij centr Goskomsanjepidnadzora Rossijskoj Federacii, Moscow, 110 pp (in Russian) 18. MUK 1637-77 (1981) Guidelines for the determination of harmful substances in the air. Ministerstvo zdravoohranenija SSSR, Moscow, 252 pp (in Russian) 19. Methods for monitoring atmospheric air pollution by industrial emissions. Available via Infopedia. https://infopedia.su/8x671c.html. Accessed 4 Aug 2022 (in Russian) 20. Zeisler R, Murphy KE, Becker DA et al (2006) Standard reference materials (SRMs) for measurement of inorganic environmental contaminants. Anal Bioanal Chem 386:1137–1151. https://doi.org/10.1007/s00216-006-0785-7 21. Jakunina IV, Popov NS (2009) Methods and devices for monitoring the environment. Environmental Monitoring: a study guide. Izdatel’stvo Tambovskogo gosudarstvennogo tehnicheskogo universiteta, Tambov, 188 pp (in Russian) 22. RMG 61-2010 (2013) State system for ensuring the uniformity of measurements. Accuracy, trueness and precision measures of the procedures for quantitative chemical analysis. Methods of evaluation. Standartinform, Moscow, 58 pp (in Russian) 23. GOST 34100.3-2017/ISO/IEC Guide 98-3:2008 (2018) Uncertainty of measurement. Part 3. Guide to the expression of uncertainty in measurement. Standartinform, Moscow, 104 pp (in Russian) 24. RMG 76-2014 (2015) State system for ensuring the uniformity of measurements. Internal control of quantitative chemical analysis result’s accuracy. Standartinform, Moscow, 104 pp (in Russian) 25. RMG 93-2015 (2016) State system for ensuring the uniformity of measurements. Estimation of metrological characteristics of reference materials. Standartinform, Moscow, 104 pp (in Russian) 26. GOST R 8.563-2009 (2019) State system for ensuring the uniformity of measurements. Procedures of measurements. Standartinform, Moscow, 15 pp (in Russian)
216
O. B. Ponomareva et al.
27. Order of the Ministry of Industry and Trade of the Russian Federation “On Approval of the Procedure for Certification of Primary Reference Methods (Methods) of Measurements, Reference Methods (Methods) of Measurements and Methods (Methods) of Measurements and Their Application” No 4091 of 15.12.2015 28. GOST ISO/IEC 17043-2013 (2014) Conformity assessment. General requirements for proficiency testing. Standartinform, Moscow, 33 pp (in Russian) 29. Bogacheva AM, Ponomareva OB, Kanaeva YV (2018) Development of interlaboratory comparison test samples and reference materials for the quality assurance of air composition measurements. Reference Materials 14(3–4):43–50 (in Russian). https://doi.org/10.20915/2077-11772018-14-3-14-43-50
Primary Reference Measurement Procedures in the Food Industry: Usage Experience and Development Prospects Anna S. Sergeeva , Anastasia V. Kasilyunas , Elena G. Parfenova , and Sergey V. Medvedevskikh
Abstract This article reviews the usage experience and development prospects of four state primary reference measurement procedures (SPRMPs) created to provide metrological support of measurements in the food and agricultural industries. The SPRMPS certified in 2016–2019 include those of the mass fraction of fat, ash, and carbohydrates in food products and raw materials; of the mass fraction of crude fat (oil content) in oilseeds and related products. The mass fraction of fat, crude fat, and oil content is measured using the Randall method; the mass fraction of ash is determined by the thermogravimetric method; the mass fraction of carbohydrates (total sugar) is defined by iodometric titration. The considered SPRMPs were used to develop reference materials (RMs) for the composition of dairy and meat, egg powder, starch, baby food, oilseeds, related products, and compound feeds. SPRMPs implementation required extending the range of the manufactured RMs for new product groups. Highprecision procedures for measuring the mass fraction of fat in liquid dairy products, fish, pastry, confectionery, and pasta products, as well as the mass fraction of lactose in liquid dairy products were developed and certified to describe the characteristics of dairy, pollock fillets, and wheat crackers composition. Keywords Primary Reference Measurement Procedures · Traceability · Certified reference materials · Food products · Food raw materials · Nutritional value
A. S. Sergeeva (B) · A. V. Kasilyunas · E. G. Parfenova UNIIM—Affiliated Branch of the D. I. Mendeleyev Institute for Metrology, Yekaterinburg, Russia e-mail: [email protected] A. V. Kasilyunas e-mail: [email protected] E. G. Parfenova e-mail: [email protected] S. V. Medvedevskikh D. I. Mendeleyev Institute for Metrology, Saint Petersburg, Russia e-mail: [email protected] © D. I. Mendeleyev Institute for Metrology 2024 E. P. Sobina et al. (eds.), Reference Materials in Measurement and Technology, https://doi.org/10.1007/978-3-031-49200-6_14
217
218
A. S. Sergeeva et al.
Abbreviations SPRMP CRMs ILCs PRMP RMP RMs FIF EUM
State primary reference measurement procedure Certified reference materials Interlaboratory comparisons Primary reference measurement procedure Reference measurement procedure Reference materials Russian Federal Information Fund for Ensuring the Uniformity of Measurements
Introduction According to the minutes of the Consultative Committee on the Quantity of Material (CCQM) meeting [1], the primary measurement method is “a method having the highest metrological qualities, whose operation can be completely described and understood, for which a complete uncertainty statement can be written in terms of the SI, and whose results are, therefore, accepted without reference to a standard of the quantity being measured.” The methods potentially related to primary methods of analysis include isotope dilution mass spectrometry, coulometry, and gravimetry, among others [2]. In 2007, the concepts of a “primary reference measurement procedure” and “reference measurement procedure” (PRMP and RMP) were included in the International Vocabulary of Metrology (VIM) (ISO/IEC Guide 99:2007) [3]. The appearance of PRMPs and RMPs is primarily due to the need of building a metrological hierarchy, the top of which is PRMPs, which helps obtain quantity measurement results without their traceability to the unit’s standard of the same magnitude, and which is used to control the correctness of measurement results obtained by other methods. PRMPs are developed and approved for metrological support of the so-called “method-dependent” quantities determined by empirical measurement methods [4]. PRMPs and RMPs have become the most widespread in the world metrological practice related to bioanalysis and clinical diagnostics. Standards have been developed that establish requirements for RMPs in the field of laboratory medicine, for example, ISO 15195:2018 [5]. Discussions are underway on the possibility of recognizing the calibration and measurement capabilities of National Metrological Institutes for operationally-defined quantities by including them in the database of the International Bureau of Weights and Measures (BIPM)1 [6–9]. In the Russian Federation, PRMPs and RMPs were introduced into the state regulation of ensuring the uniformity of measurements in 2014 as part of adopting 1
BIPM—Bureau International des Poids et Mesures. Available via BIPM. https://www.bipm.org. Accessed 26 August 2022.
Primary Reference Measurement Procedures in the Food Industry …
219
254-FZ [10]. The procedure for PRMPs and RMPs certification, as well as the scope of their application were established by the Order of the Ministry of Industry and Trade of the Russian Federation No. 4091 [11]. The most effective application of PRMPs appeared in developing metrological support for the food and agricultural industries to ensure metrological traceability of measurements of generalized and hard to formalize indicators of the nutritional value of food products and food raw materials, such as fat, ash, and carbohydrates. In 2016–2019, the following PRMPs were developed and certified as state PRMPs: • SPRMP of the mass fraction of fat in food products and food raw materials2 ; • SPRMP of the mass fraction of ash in food products and food raw materials3 ; • SPRMP of the mass fraction of carbohydrates in food products and food raw materials4 ; • SPRMP of the mass fraction of crude fat (oil content) in oilseeds and products based on them.5 The results of the SPRMPs development are presented in [12–15]. This study aims to generalize and analyze the experience of using and prospects for the development of SPRMPs for metrological support of measurements in the food industry.
Materials and Methods In the developed SPRMPs, the measurement of the mass fraction of fat is conducted using the Randall method, based on the quantitative extraction of free and chemically or mechanically bound fat from product samples with the subsequent weighing of the fat. In the case of determining total fat in dairy, meat, dry egg products, and baby food, this method is implemented with a preliminary stage of hydrolysis. When determining crude fat (oil content) in oilseeds and products based on them, grains of cereals and legumes, compound feeds, and feed components, preliminary hydrolysis is not performed. 2
FR.PR1.31.2019.00001 State primary reference measurement procedure of the mass fraction of fat in food products and food raw materials M.241.01/RA.RU.311866/2018. Available via FIF EUM. https://fgis.gost.ru/fundmetrology/registry/6/items/595556. Accessed 26 August 2022 (In Russ.). 3 FR.PR1.31.2019.00002 State primary reference measurement procedure of the mass fraction of ash in food products and food raw materials M.241.02/RA.RU.311866/2018. Available via FIF EUM. https://fgis.gost.ru/fundmetrology/registry/6/items/595557. Accessed 26 August 2022 (In Russ.). 4 FR.PR1.31.2019.00005 State primary reference measurement procedure of the mass fraction of carbohydrates in food products and food raw materials. Available via FIF EUM. https://fgis.gost. ru/fundmetrology/registry/6/items/1057023. Accessed 26 August 2022 (In Russ.). 5 FR.PR1.31.2019.00009 State primary reference measurement procedure of the mass fraction of crude fat (oil content) in oilseeds and products based on them. Available via FIF EUM. https://fgis. gost.ru/fundmetrology/registry/6/items/1057069. Accessed 26 August 2022 (In Russ.).
220
A. S. Sergeeva et al.
The measurement of the mass fraction of ash is carried out using a thermogravimetric method, including sample preparation, charring, ashing of the sample of the product, and subsequent gravimetric measurement of the mass of the mineral residue after ashing. The measurement of the mass fraction of carbohydrates (total sugar) is carried out using the method of iodometric titration, based on the oxidation of reducing sugars in an alkaline medium with iodine and titration of unspent iodine with a solution of sodium thiosulfate. Evaluation of the SPRMPs metrological characteristics and high-precision measurement techniques is conducted considering the sources of uncertainty included in the measurement equations, contributions from methodological parameters, heterogeneity of sample material, and operator influence using the algorithms set out in ISO 5725-5:1998 [16], RMG 61-2010 [17], and the EURACHEM/CITAC Guide [4]. The study of metrological reference samples (RMs) of food products and food raw materials composition is carried out in accordance with the ISO Guide 35:2006 [18]. Interlaboratory comparison tests (ILCs) to determine quality and nutritional values are conducted in accordance with the ISO/IEC 17043:2010 [19].
Results and Discussion The SPRMPs of the mass fraction of fat, ash, and carbohydrates in food products and food raw materials, the SPRMP of the mass fraction of crude fat (oil content) in oilseeds and products based on them are intended for high-precision measurements, evaluating the correctness of measurement results obtained using other measurement procedures (methods), including those used to confirm the compliance of the products with the mandatory requirements established in the technical regulations, as well as for the calibration of measuring instruments and determination of the RMs characteristics. The measurement objects and metrological characteristics of the SPRMPs are presented in Table 1. The SPRMPs in conjunction with the State Primary Measurement Standard for the Units of Mass Fraction and Mass (Molar) Concentration of Water in Solid and Liquid Substances and Materials GET 173-2017 [20, 21] and the State Secondary Measurement Standard for the Units of Mass Fraction and Mass (Molar) Concentration of Components in Solid and Liquid Substances and Materials on the Basis of the Volumetric Titrimetric Method GVET 176-1-2010 [22] were used to characterize the RMs of food products and raw materials composition with certified characteristics that determine nutritional value: mass fractions of moisture, protein (crude protein), fat (crude fat, oil content), ash, and carbohydrates (lactose) [23–25]. When implementing the SPRMPs, the need to expand the range of the manufactured RMs for new product groups was identified. Using measurement base of the SPRMPs, high-precision measurement procedures of the mass fraction of fat
Primary Reference Measurement Procedures in the Food Industry …
221
Table 1 Measurement objects and metrological characteristics of SPRMPs FIF EUM No.
Measurement objects
Measured value
Measuring range, %
Absolute expanded uncertainty (k = 2), %
FR.PR1.31.2019.00001
Dairy, grain-dairy, grain, meat, dry egg products, incl. for baby food
Mass fraction of fat
0.1–80
0.08–0.80
FR.PR1.31.2019.00009
Grain and legumes seeds, seeds of oilseeds and associated products, compound feed, and feed components
Mass fraction of crude fat (oil content)
0.2–70
0.15
FR.PR1.31.2019.00002
Grain, grain products, starch, sugar, dairy products, low-lactose, lactose-free, incl. for baby food, compound feed, and feed components
Mass fraction of ash
0.1–40
0.003–0.30
FR.PR1.31.2019.00005
Dairy, grain, grain-dairy, low-lactose and lactose-free products, incl. for baby food
Mass fraction of reducing sugars in terms of lactose monohydrate
0.5–80
0.25
Mass fraction of non-reducing sugars in terms of sucrose
0.5–50
0.30
Mass fraction of carbohydrates (total sugar)
1–80
0.40
in liquid dairy products,6 fish,7 pastry, confectionery, and pasta products8 using the Randall method, as well as the mass fraction of lactose in liquid dairy products using 6
FR.1.31.2020.36184 Measurement procedure of the mass fraction of fat in liquid dairy products using the Randall method. Available via FIF EUM. https://fgis.gost.ru/fundmetrology/registry/16/ items/971941. Accessed 26 August 2022 (In Russ.). 7 FR.1.31.2021.39190 Measurement procedure of the mass fraction of fat in fish using the Randall method M.241.0159/RA.RU.311866/2020. Available via FIF EUM. https://fgis.gost.ru/fundmetro logy/registry/16/items/1386024. Accessed 26 August 2022 (In Russ.). 8 FR.1.31.2022.43775 Measurement procedure of the mass fraction of fat in samples of bakery, confectionery and pasta using the Randall method M.241.0074/RA.RU.311866/2022. Available via FIF EUM. https://fgis.gost.ru/fundmetrology/registry/16/items/1401182. Accessed 26 August 2022 (In Russ.).
222
A. S. Sergeeva et al.
Table 2 High-precision measurement procedures using the equipment for implementing SPRMPs FIF EUM No.
Measurement objects
Measured value
Measuring range, %
Absolute expanded uncertainty (k = 2), %
FR.1.31.2020.36184
Drinking milk
Mass fraction of fat
0.5–6
0.05
Mass fraction of lactose
4–5.5
Drinking cream FR.1.31.2020.36183
Drinking milk Drinking cream
9–42
0.06 0.08
3–8
FR.1.31.2021.39190
Fresh, chilled, boiled, freeze-dried fish
Mass fraction of fat
0.5–20
0.25
FR.1.31.2022.43775
Pastry, confectionery, and pasta products
Mass fraction of fat
0.5–50
0.25
the iodometric titration method9 were developed and certified. The measurement objects and metrological characteristics of high-precision measurement procedures on equipment for the SPRMPs implementation are presented in Table 2. The measurement procedures indicated in Table 2 are used to determine the following RMs characteristics: GSO 11504-2020/GSO 11505-202010 [26], GSO 11687-2021,11 GSO 11962-2022.12 The RMs metrological characteristics are presented in Tables 3 and 4. In addition to the SPRMP of the mass fraction of carbohydrates in food products and food raw materials, the development of measurement procedures of the mass fraction of the main substance in mono- and disaccharides using the methods of iodometric titration and material balance (“100% minus the impurities”) was carried
9
FR.1.31.2020.36183 Measurement procedure of the mass fraction of lactose in liquid dairy products using the iodometric titration method. Available via FIF EUM. https://fgis.gost.ru/fundmetro logy/registry/16/items/971924. Accessed 26 August 2022 (In Russ.). 10 GSO 11504-2020/GSO 11505-2020 Reference materials for the composition of dairy products (set MS-1 RM UNIIM). Available via FIF EUM. https://fgis.gost.ru/fundmetrology/registry/19/ items/1211469. Accessed 26 August 2022 (In Russ.). 11 GSO 11687-2021 Reference materials for the composition of freeze-dried pollock fillets (RP1 RM UNIIM). Available via FIF EUM. https://fgis.gost.ru/fundmetrology/registry/19/items/138 6484. Accessed 26 August 2022 (In Russ.). 12 GSO 11962–2022 Reference materials for the composition of wheat crackers (HB-1 RM UNIIM). Available via FIF EUM. https://fgis.gost.ru/fundmetrology/registry/19/items/1402489. Accessed 26 August 2022 (In Russ.).
Primary Reference Measurement Procedures in the Food Industry …
223
Table 3 Metrological characteristics of GSO 11504-2020/GSO 11505-2020 of dairy products composition: drinking milk (MS-1-1), drinking cream (MS-1-2) Certified characteristic Mass fraction of fat
RMs Index
Interval of certified values, %
Absolute expanded uncertainty (k = 2), %
MS-1-1
0.50–6.00
0.05
MS-1-2
9.00–42.00
0.06
Mass fraction of protein MS-1-1
2.00–4.00
0.04
MS-1-2
1.50–3.50
0.06 0.1
Mass fraction of dry substances
MS-1-1
8.0–15.0
MS-1-2
20.0–55.0
Mass fraction of lactose
MS-1-1
4.00–5.00
MS-1-2
3.00–8.00
0.08
Table 4 Metrological characteristics of GSO 11687-2021, GSO 11962-2022 RM
Certified characteristic
Interval of certified values, %
Absolute expanded uncertainty (k = 2), %
GSO 11687-2021 of freeze-dried pollock fillets composition
Mass fraction of moisture
1.0–10.0
0.2
Mass fraction of nitrogen*
11.20–15.84
0.08
Mass fraction of protein*
70.0–99.0
0.5
Mass fraction of fat*
1.0–15.0
0.4
Mass fraction of moisture
4.00–15.00
0.15
Mass fraction of nitrogen*
1.00–5.00
0.08
Mass fraction of protein*
6.0–30.0
0.5
Mass fraction of fat*
1.5–15.0
0.2
GSO 11962-2022 of wheat rusks composition
* Values are given in terms of dry matter
224
A. S. Sergeeva et al.
out, followed by the creation of the following RMs: GSO 11820-2021,13 GSO 118392021/GSO 11843-2021,14 GSO 11884-2022,15 GSO 11885-2022,16 GSO 11886202217 [15, 27]. Table 5 shows the distribution of RMs by the main groups of food products specified in the Technical Regulations of the Customs and Eurasian Economic Union [28–35]. Along with RMs certified with the use of SPRMPs and high-precision procedures, Table 5 also lists the previously developed RMs widely used in practice with certified values of the mass fraction of moisture, set at GET 173-2017,18 and the mass fraction of nitrogen and protein, set at GVET 176-1-201019 : GSO 89892008,20 GSO 8990-2008,21 GSO 9564-201022 [36], GSO 10148-201223 [37], GSO
13
GSO 11820-2021 Reference materials for the composition of lactose monohydrate (lactose RM UNIIM). Available via FIF EUM. https://fgis.gost.ru/fundmetrology/registry/19/items/1395358. Accessed 26 August 2022 (In Russ.). 14 GSO 11839-2021/GSO 11843–2021 Reference materials for the composition of mono- and disaccharides (a set of carbohydrates RM UNIIM). Available via FIF EUM. https://fgis.gost.ru/fundme trology/registry/19/items/1395634. Accessed 26 August 2022 (In Russ.). 15 GSO 11884-2022 Reference materials for the composition of arabinose (arabinose RM UNIIM). Available via FIF EUM. https://fgis.gost.ru/fundmetrology/registry/19/items/1397882. Accessed 26 August 2022 (In Russ.). 16 GSO 11885-2022 Reference materials for the composition of mannose (mannose RM UNIIM). Available via FIF EUM. https://fgis.gost.ru/fundmetrology/registry/19/items/1397883. Accessed 26 August 2022 (In Russ.). 17 GSO 11886-2022 Reference materials for the composition of sucrose (sucrose RM UNIIM). Available via FIF EUM. https://fgis.gost.ru/fundmetrology/registry/19/items/1397884. Accessed 26 August 2022 (In Russ.). 18 GET 173–2017 State primary measurement standard for the units of mass fraction and mass (molar) concentration of water in solid and liquid substances and materials: Custodian Institute D. I. Mendeleyev Institute for Metrology. Available via FIF EUM. https://fgis.gost.ru/fundmetrology/ registry/12/items/397857. Accessed 26 August 2022 (In Russ.). 19 GVET 176–1–2010 State secondary measurement standard for the units of mass fraction and mass (molar) concentration of components in solid and liquid substances and materials on the basis of the volumetric titrimetric method: Custodian Institute UNIIM - Affiliated Branch of the D. I. Mendeleyev Institute for Metrology. (In Russ.). 20 GSO 8989–2008 Reference materials for the mass fraction of moisture of grain of the 1st categoration. Available via FIF EUM. https://fgis.gost.ru/fundmetrology/registry/19/items/391196. Accessed 26 August 2022 (In Russ.). 21 GSO 8990–2008 Reference materials for the mass fraction of moisture of grain of the 2nd categoration. Available via FIF EUM. https://fgis.gost.ru/fundmetrology/registry/19/items/391195. Accessed 26 August 2022 (In Russ.). 22 GSO 9564–2010 Reference materials for the mass fraction of moisture in grain processing products. Available via FIF EUM. https://fgis.gost.ru/fundmetrology/registry/19/items/390621. Accessed 26 August 2022 (In Russ.). 23 GSO 10148–2012 Reference materials for the mass fraction of moisture in dry dairy products. Available via FIF EUM. https://fgis.gost.ru/fundmetrology/registry/19/items/390034. Accessed 26 August 2022 (In Russ.).
Primary Reference Measurement Procedures in the Food Industry …
225
9563-201024 [22], and GSO 9734-201025 [38]. The candidate materials for the RMs development for excluded food groups are also provided here. Figure 1 shows data on the RMs production using SPRMPs and high-precision measurement procedures using the equipment for implementing SPRMPs for various product groups, which demonstrate an annual increase in demand for manufactured RMs. In 2019–2022, 69, 106, 274, and 428 copies of RMs were released, respectively. The most popular RMs are the ones of dairy products composition. Over the past year, there has also been a significant increase in demand for the RMs of composition of meat products, starch, cereals, and grain-dairy cereals for baby food. The RMs and ILCs samples analyzed using SPRMPs, provide metrological traceability of the assigned values of mass fractions of moisture, protein, fat, and ash in implementing qualification testing programs of laboratories in the field of measuring quality indicators of milk and dairy products, starch and starch products, and egg powder. A total of 7 rounds were held, the total number of participants was 121. Using the RMs, certified with SPRMPs and high-precision measurement procedures, tests were conducted for type approval, and verification methods were developed for express analyzers of food products and food raw materials (Table 6). The manufactured RMs of food products and food raw materials composition also significantly simplified and sped up the verification procedure for the previously approved types of express analyzers, for example, Lactane milk quality analyzers26 and Infratec food analyzers.27 Previously, due to the lack of appropriate RMs, such analyzers were verified using working food samples analyzed by standardized methods. The need to establish certified values of the mass fractions of components in working samples required the verification organizations to have additional specialized premises, test equipment, qualified personnel, the use of a large volume of reagents, and significant time costs. Currently, the express analyzers of food products and food raw materials are checked annually using the developed RMs. In total, more than 190 verifications were carried out in 2020–2022 (Fig. 2). Thus, the presented data demonstrate the high efficiency of using SPRMPs to ensure metrological traceability of measurements in the food and agricultural industry. At the same time, there is an evident necessity of carrying out the work on developing SPRMPs for excluded product groups and their further implementation 24
GSO 9563-2010 Reference materials for the composition of powdered milk (ASM-1). Available via FIF EUM. https://fgis.gost.ru/fundmetrology/registry/19/items/390622. Accessed 26 August 2022 (In Russ.). 25 GSO 9734-2010 Reference materials for the composition of grain and products of its processing. Available via FIF EUM. https://fgis.gost.ru/fundmetrology/registry/19/items/390450. Accessed 26 August 2022 (In Russ.). 26 Milk quality analyzers Laktan 1-4 M. Available via FIF EUM. https://fgis.gost.ru/fundmetrology/ registry/4/items/357087. Accessed 26 August 2022 (In Russ.). Milk quality analyzers Laktan. Available via FIF EUM. https://fgis.gost.ru/fundmetrology/reg istry/4/items/537137. Accessed 26 August 2022 (In Russ.). 27 Infratec 1241, Infratec Sofia i Infratec Nova food analyzers. Available via FIF EUM. https:// fgis.gost.ru/fundmetrology/registry/4/items/376785. Accessed 26 August 2022 (In Russ.).
226
A. S. Sergeeva et al.
Table 5 Distribution of RMs by food product groups [28–35] Technical regulations
Product group
Reference materials
FIF EUM No.
TR TS 015/ 2011
Grain for consumption and feeding
Wheat, barley, rye, soy, compound feed, oilseed processing products
GSO 8989-2008, GSO 8990-2008, GSO 9734-2010, GSO 11268-2019/GSO 11270-2019, GSO 11279-2019/GSO 11283-2019
TR TS 021/ 2011
Flour and cereal products
Wheat flour, durum wheat, rye baking, rye-wheat, wheat-rye, corn; wheat groats, buckwheat, oatmeal, millet ground, barley, rice, corn, semolina; wheat bran, rye; wheat grits; soy flour*
GSO 9564-2010
Starch products
Corn starch, potato starch
GSO 11338-2019/GSO 11339-2019
Sugar
Sucrose, lactose monohydrate, galactose, glucose anhydride, lactulose, fructose, arabinose, mannose
GSO 11820-2021, GSO 11839-2021/GSO 11843-2021, GSO 11884-2022, GSO 11885-2022, GSO 11886-2022
Pastry, pasta products
Wheat rusks
GSO 11962-2022
Confectionery
Chocolate*, dessert paste*
RMs missing
fruit and vegetable Tomato powder*, nut flour* products
RMs missing
Eggs and their Egg powder processed products
GSO 11271-2019
TR TS 024/ 2011
Oilseed raw materials
Sunflower, soy, mustard, rapeseed, flax, cotton
GSO 11284-2019/GSO 11289-2019
TR TS 027/ 2012
Specialized food products
Dry rice, buckwheat, corn, multi-slag porridge
GSO 11144/GSO 11147-2018
Specialized food products components
Soy protein isolate*
RMs missing
Milk and dairy products
Skimmed milk powder, whole milk powder, sour cream FD**, cottage cheese FD, dry cheese, drinking milk, drinking cream
GSO 9563-2010, GSO 10148-2012, GSO 11086-2018/GSO 11091-2018, GSO 11399-2019, GSO 11504-2020/GSO 11505-2020
TR TS 033/ 2013
(continued)
Primary Reference Measurement Procedures in the Food Industry …
227
Table 5 (continued) Technical regulations
Product group
Reference materials
FIF EUM No.
Dairy-based baby food products
Dry milk mixture for baby food, dry rice milk porridge, buckwheat, corn, multi-slag
GSO 11088-2018, GSO 11127-2018/ GSO 11130-2018
TR TS 034/ 2013
Meat and meat products
Beef FD, pork FD
GSO 11274-2019, GSO 11275-2019
EAEU TR 040/2016
Fish and fish products
Pollock fillet FD
GSO 11687-2021
EAEU TR 051/2021
Poultry and its processing products
Poultry FD, canned food*
GSO 11276-2019
* Candidate materials for the RMs development ** FD-freeze drying
No. of RMs items, pcs
241
250
154
200
77 49
150
31
62
30 39
100
5
36 7
5
3
50
2022
55
14
6
2021
32
2020
16
15
2019
0 baby food
dry egg powder, starch, rusks
meat, fish
dairy
feed, oilseeds
Fig. 1 Production of RMs of food products and raw materials composition using SPRMPs and high-precision measurement procedures
for metrological support of measurements of nutritional values, during which the following tasks should be solved: (1) analyzing technical regulations, standardized measurement methods, measuring equipment; preparing development plans for RMs for excluded groups of food products; justifying the scope and measurement ranges of SPRMPs, establishing the requirements for SPRMPs accuracy indicators, providing a margin of accuracy in relation to the standardized measurement procedures and working measuring instruments by 2–3 times, at least; (2) determining measurement parameters and ranges of nutritional values using independent physical and chemical methods (high-performance liquid chromatography, spectrometric analysis, thermogravimetric analysis with mass
228
A. S. Sergeeva et al.
Table 6 Measuring instruments tested for type approval using RMs Measuring instrument no. in FIF EUM
Measuring instruments name and type
Manufacturer
72990-18
Foodscan 2 Food Analyzer
FOSS Analytical A/S, Denmark
77391-20
INFRANEO grain and grain products analyzers
Chopin Technologies, France
78730-20
LactoScope FT-A Milk and Dairy Analyzers
PerkinElmer Analytical Solution B. V., Netherlands
79313-20
MIRA analyzers of milk and dairy products
Bruker Optik GmbH, Germany
80513-20
MilkoScan FT3 Milk and Dairy Analyzers
FOSS Analytical A/S, Denmark
81771-21
Infracont infrared analyzers
Infracont Instruments Ltd., Hungary
85700-22
GrainSense infrared analyzers
GrainSense Oy, Finland
86418-22*
Milkotester Milk Analyzers
Milkotester LTD, Bulgaria
* Tests for type approval carried out in All-Russian Scientific Research Institute for Metrological Service
60
No., pcs
50 40 30
60 52 38
20
41
10 0 U/S dairy analyzers
IR grain, oilseeds, and feed analyzers
IR dairy analyzers
IR food analyzers
Fig. 2 Information on the no. of analyzers verifications using RMs, certified using SPRMPs and high-precision measurement procedures
spectrometric detection), as well as mathematical methods of experiment planning and data processing (sequential search, dichotomy, multifactorial experiment, regression and dispersion analysis); (3) evaluating SPRMPs metrological characteristics considering the sources of uncertainty included in the measurement equations, contributions from methodological parameters, heterogeneity of sample material and operator influence
Primary Reference Measurement Procedures in the Food Industry …
229
using algorithms set out in ISO 5725-5:1998 [16], RMG 61-2010 [17], and the EURACHEM/CITAC Guide [4]. (4) confirming the highest accuracy and equivalence of the SPRMPs by conducting comparisons with metrological institutes of other countries, Russian scientific branch institutes, the organization of the ILCs with the participation of Russian testing laboratories with subsequent processing according to the algorithm [39], analysis of other countries’ CRMs produced by the USA National Institute of Standards and Technology (NIST)28 and the European Institute for Reference Materials and Measurements (IRMM)29 ; (5) developing and conducting tests for the approval of the RMs type, representing previously uncovered groups of food products (confectionery, fruit, and vegetable products, components for specialized food products, canned food). The solution of the tasks set will make it possible to complete the development of SPRMPs and RMs, covering the main groups of food products specified in the Technical Regulations of the Customs and Eurasian Economic Union, to implement metrological traceability of measurements of the mass fraction of fat, ash, and carbohydrates in food products and food raw materials.
Conclusion The analysis of using the SPRMPS of the mass fraction of fat, ash, and carbohydrates in food products and food raw materials, as well as the SPRMP of the mass fraction of crude fat (oil content) in oilseeds and products based on them, has shown. • the high efficiency of using SPRMPs to ensure metrological traceability of measurements in the food and agricultural industry; • the need for developing and implementing new SPRMPs. The action plan for the development of new SPRMPs and RMs is presented in order to cover the main groups of food products presented in the Technical Regulations of the Customs and Eurasian Economic Union. Acknowledgements This study was conducted within the framework of the experimental design work “Purity-2” “Conducting research in the field of measurements of the physical and chemical composition and properties of substances for developing state reference materials in the form of highpurity substances for reproducing and transmitting units of quantities characterizing the chemical composition of solid and liquid substances and developing reference measurement methods.”
28
NIST—National Institute of Standards and Technology. Available via. https://www.nist.gov. Accessed 26 August 2022. 29 IRMM—Institute for Reference Materials and Measurements. Available via. https://joint-res earch-centre.ec.europa.eu/reference-measurement/reference-materials-rm_en. Accessed 26 August 2022.
230
A. S. Sergeeva et al.
Author Contributions Sergeeva A. S.—development of the research concept, data curation, writing a draft version of the article, proofreading, and editing the text of the article; Kasilyunas A. V.—development of methods, validation; Parfenova E. G.—conducting research, implementation of developments; Medvedevskikh S. V.—development of methodology, implementation of formal analysis Conflict of Interest The article was prepared on the basis of a report presented at the V International Scientific Conference “Reference Materials in Measurement and Technology” (Yekaterinburg, September 13–16, 2022). The article was admitted for publication after the abstract was revised, the article was formalized, and the review procedure was carried out. The version in the Russian language is published in the journal “Measurement Standards. Reference Materials” 2023;19(4):83–98. (In Russ.). https://doi.org/10.20915/2077-1177-2023-194-83-98.
References 1. Minutes From the Fifth Meeting (1998) of the Consultative Committee on the Quantity of Material (CCQM) of the Bureau International des Poids et Mesures (BIPM). Sèvres, France 2. Kaarls R, Quinn TJ (1997) The Comité Consultatif pour la Quantité de Matière: a brief review of its origin and present activities. Metrologia 34(1):1–5. https://doi.org/10.1088/0026-1394/ 34/1/1 3. ISO/IEC Guide 99:2007 (2022) International vocabulary of metrology—basic and general concepts and associated terms (VIM). Available via ISO. https://www.iso.org/standard/45324. html. Accessed 26 Aug 2022 4. Quantifying Uncertainty in Analytical Measurement, EURACHEM/CITAC. 3rd ed. 2012. Available via CITAC. https://www.citac.cc/QUAM2012_P1.pdf. Accessed 26 Aug 2022 5. ISO 15195:2018 Laboratory medicine—requirements for the competence of calibration laboratories using reference measurement procedures. Available via ISO. https://www.iso.org/sta ndard/69824.html. Accessed 26 Aug 2022 6. Brown RJC, Andres H (2020) How should metrology bodies treat method-defined measurands? Accred Qual Assur 25:161–166. https://doi.org/10.1007/s00769-020-01424-w 7. Simonet BM, Lendl B, Valcarcel M (2006) Method-defined parameters: measurands sometimes forgotten. TrAC Trends Anal Chem 25(5):520–527. https://doi.org/10.1016/j.trac.2005.09.007 8. DeP B (2008) Essential for metrology in chemistry, but not yet achieved: truly internationally understood concepts and associated terms. Metrologia 45(3):335–341. https://doi.org/10.1088/ 0026-1394/45/3/011 9. Report of the CCQM task group on method defined measurands (2019). Available via BIPM. https://www.bipm.org/documents/20126/28432509/working-document-ID-11268/6ea e4b21-bb0a-db3e-372a-86398d0f107a. Accessed 26 Aug 2022 10. Federal Law “On Amendments to the Federal Law “On Ensuring the Uniformity of Measurements” No. 254-FZ of 21.07.2014. Available via Official Internet portal of legal information. http://publication.pravo.gov.ru/Document/View/0001201407220077. Accessed 26 Aug 2022 (in Russian) 11. Order of the Ministry of Industry and Trade of the Russian Federation “On Approval of the Procedure for Certification of Primary Reference Measurement Procedures (Methods), Reference Measurement Procedures (Methods) and Measurement Procedures (Methods) and Their Application” No. 4091 of 15.12.2015. Available via Official Internet portal of legal information. http://publication.pravo.gov.ru/document/0001201602260008. Accessed 26 Aug 2022 (in Russian)
Primary Reference Measurement Procedures in the Food Industry …
231
12. Medvedevskikh SV, Baranovskaya VB, Medvedevskikh MY, Krasheninina MP, Sergeeva AS (2021) Reference measurement procedure for the determination of mass fraction of fat content in food. Accred Qual Assur 26:165–175. https://doi.org/10.1007/s00769-021-01472-w 13. Medvedevskikh MY, Sergeeva AS, Krasheninina MP, Shokhina OS (2019) State primary reference procedure for the measurement of ash mass fraction in food, foodstuff and alimentary raw materials. Indus Lab Diag Mater 85(6):70–80 (in Russian). https://doi.org/10.26896/10286861-2019-85-6-70-80 14. Sergeeva AS, Parfenova EG, Golynets OS (2020) Development of primary reference measurement procedure and reference materials for mass fraction of crude fat (oil content) in oilseeds and other products on their base. Meas Stand Ref Mater 16(3):37–51 (in Russian). https://doi. org/10.20915/2687-0886-2020-16-3-37-51 15. Golynets OS, Sergeeva AS, Krasheninina MP, Shokhina OS (2022) Development of measurement procedures for the characterization of reference materials for carbohydrate composition of dairy products. Meas Stand Ref Mater 18(2):35–56 (in Russian). https://doi.org/10.20915/ 2077-1177-2022-18-2-35-56 16. ISO 5725-5:1998 Accuracy (trueness and precision) of measurement methods and results— Part 5: Alternative methods for the determination of the precision of a standard measurement method. Available via ISO. https://www.iso.org/standard/1384.html. Accessed 26 Aug 2022 17. RMG 61–2010 (2013) State system for ensuring the uniformity of measurements. Accuracy, trueness and precision measures of the procedures for quantitative chemical analysis. Methods of evaluation. Standartinform, Moscow, 62 pp (in Russian) 18. ISO Guide 35:2006 Reference materials—guidance for characterization and assessment of homogeneity and stability. Available via ISO. https://www.iso.org/standard/60281.html. Accessed 26 Aug 2022 19. ISO/IEC 17043:2010 Conformity assessment—General requirements for the competence of proficiency testing providers. Available via ISO. https://www.iso.org/standard/80864.html. Accessed 26 Aug 2022 20. Gorshkov VV, Koryakov VI, Medvedevskikh MY, Medvedevskikh SV (2010) State primary standard of unit of mass fraction and unit of mass concentration of moisture in solid substances and solid fabricated materials. Meas Tech 53(4):386–390. https://doi.org/10.1007/s11018-0109515-9 21. Medvedevskikh SV, Medvedevskikh MY, Karpov YA (2015) General approaches to the estimation of uncertainty in the results of reproducing units of water content in solids and materials. Meas Tech 58(8):926–933. https://doi.org/10.1007/s11018-015-0819-7 22. Krasheninina MP, Medvedevskikh MY, Medvedevskikh SV, Neudachina LK, Sobina EP (2013) An estimate of the metrological characteristics of a standard sample of the composition of dried whole milk using primary and secondary state standards. Meas Tech 56(9):1076–1082. https:// doi.org/10.1007/s11018-013-0333-8 23. Sergeeva AS, Vostrikova NL, Medvedevskikh MY (2021) Development of food industry metrological assurance complex. Meas Stand Ref Mater 17(1):21–33 (in Russian). https://doi.org/ 10.20915/2687-0886-2021-17-1-21-33 24. Sergeeva AS, Medvedevskikh MY, Studenok VV, Parfenova EG (2020) Use of primary reference measurement techniques in the field of assurance of measurement uniformity. Legal Appl Metrol 5(167):5–9 (in Russian) 25. Medvedevskikh MY, Sergeeva AS (2020) Problems of ensuring metrological traceability of quality control measurement results for food products and food raw materials. Meas Tech 63(3):242–248. https://doi.org/10.1007/s11018-020-01777-1 26. Medvedevskikh MY, Sergeeva AS, Kasilyunas AV, Shatskikh EV, Kolberg NA (2021) Certified reference materials of dairy products composition for IR milk analyzers verification. Food Industry 1:16–19 (in Russian). https://doi.org/10.24411/0235-2486-2021-10003 27. Kasilyunas AV, Medvedevskikh MY, Krashenina MP, Sergeeva AS (2022) Key development stages of reference material for lactose monohydrate composition. J Phys Conf Ser 2192:012020. https://doi.org/10.1088/1742-6596/2192/1/012020
232
A. S. Sergeeva et al.
28. TR TS 015/2011 Technical regulations of the Customs union on Grain Safety. Available via. https://eec.eaeunion.org/upload/medialibrary/317/TR_zerno.pdf. Accessed 26 Aug 2022 (in Russian) 29. TR TS 021/2011 Technical regulations of the Customs union on the safety of food products. Available via. https://eec.eaeunion.org/upload/medialibrary/6ad/TR-TS-PishevayaProd. pdf. Accessed 26 Aug 2022 (in Russian) 30. TR TS 024/2011 Technical regulations of the Customs union on for oil and fat products. Available via. https://eec.eaeunion.org/upload/medialibrary/6f3/TR-TS-MasloGirov.pdf. Accessed 26 Aug 2022 (in Russian) 31. TR TS 027/2012 Technical regulations of the Customs union on the safety of certain types of specialized food products, including dietary therapeutic and dietary preventive nutrition. Available via. https://eec.eaeunion.org/upload/medialibrary/e52/P_34.pdf. Accessed 26 Aug 2022 (in Russian) 32. TR TS 033/2013 Technical regulations of the Customs union on the safety of milk and dairy products. Available via. https://eec.eaeunion.org/upload/medialibrary/789/TR-TS-033_2013. pdf. Accessed 26 Aug 2022 (in Russian) 33. TR TS 034/2013 Technical regulations of the Customs union on the safety of meat and meat products. Available via. https://docs.eaeunion.org/docs/ru-ru/0043629/cncd_11102013_ 68. Accessed 26 Aug 2022 (in Russian) 34. TR EAEU 040/2016 Technical regulations of the Eurasian Economic union on safety of fish and fish products. Available via. https://docs.eaeunion.org/docs/ru-ru/01417575/cncd_20032017. Accessed 26 Aug 2022 (in Russian) 35. TR EAEU 051/2021 Technical regulations of the Eurasian Economic union on the safety of poultry meat and products of its processing. Available via. https://docs.eaeunion.org/docs/ruru/01430504/err_16112021_110. Accessed 26 Aug 2022 (in Russian) 36. Zaporozhets AS, Parfenova EG, Guschina MO (2013) Current state and prospects of development of measurement assurance system for humidity measuring methods and instruments on the basis of certified reference materials. Reference Materials 3:45–49 (in Russian) 37. Parfenova EG, Zaporozhets AS, Guschina MO, Iliyk MV (2013) The use of certified reference materials of moisture mass fraction in dry dairy products for in-process quality control of ice-cream. Ref Mater 4:51–54 (In Russian) 38. Koryakov VI, Medvedevskikh MY, Medvedevskikh SV, Parfenova EG, Sobina EP (2012) Development of standard samples of mass fractions of moisture and protein in grain and grain products. Meas Tech 54(10):1198–1202. https://doi.org/10.1007/s11018-012-9871-8. (In Russian) 39. Aronov PM (2019) Estimation of consensus value of interlaboratory measurement results accompanied by a minimum increase in associated uncertainty. Meas Stand Ref Mater 15(4):49–52 (in Russian). https://doi.org/10.20915/2077-1177-2019-15-4-49-52
Bismuth Determination by Controlled-Potential Coulometry: Developing a Highly Accurate Procedure Based on GET 176 Veniamin M. Zyskin and Alena V. Sobina
Abstract In this work, we develop a procedure for reproducing the units of bismuth mass fraction in metallic bismuth and those of bismuth (III) mass concentration in bismuth nitrate solutions by controlled-potential coulometry based on the GET 176– 2019 State primary standard of mass (molar, atomic) fraction units and mass (molar) concentration of components in liquid and solid substances and materials based on coulometry. The results obtained can be used when manufacturing certified reference materials (CRMs) for the composition of high-purity bismuth and CRMs for the composition of solutions of bismuth (III) ions directly traceable to GET 176–2019. These CRMs may find application in pharmacological, metallurgical, and nuclear industries. Keywords State primary standard · GET 176 · Certified reference material · CRM · Controlled-potential coulometry · Mass fraction · Bismuth · Traceability · Standard uncertainty · Bismuth mass concentration
Introduction Bismuth and its compounds find wide application in metallurgical, chemical, and nuclear industries, as well as in physics, medicine, and pharmacopeia [1–3]. Bismuth alloys with cadmium, lead, and zinc provide an ideal basis for obtaining substances with a melting point below 100 °C [4, 5]. Bismuth compounds are used for the production of magnetoelectric, high-temperature ferroelectric, thermoelectric, and superconducting materials [6–8]. Bismuth alloys with manganese, chromium, indium, or europium allow high-quality powerful and durable permanent magnets to be manufactured [9, 10]. Compounds with gallium, iodine, and germanium are in demand V. M. Zyskin (B) · A. V. Sobina UNIIM—Affiliated Branch of the D. I. Mendeleyev Institute for Metrology, Yekaterinburg, Russia e-mail: [email protected] A. V. Sobina e-mail: [email protected] © D. I. Mendeleyev Institute for Metrology 2024 E. P. Sobina et al. (eds.), Reference Materials in Measurement and Technology, https://doi.org/10.1007/978-3-031-49200-6_15
233
234
V. M. Zyskin and A. V. Sobina
as ionizing radiation detectors in devices for computer tomography, nuclear physics, and geology [11, 12]. Bismuth compounds are part of medical drugs used for the treatment of gastrointestinal and oncological diseases; antiseptic preparations or wound healing agents; contrasting agents for fluoroscopy [13–16]. Preparations containing organic bismuth compounds are among the few agents effective against Helicobacter pylori, a type of bacteria causing gastric and duodenal ulcers [17–19]. The mass fraction of bismuth in alloys, concentrates, and chemical compounds is determined, as a rule, by a photometric method with the use of thiourea according to GOST 28407.1-89 (under the bismuth content of up to 1%) [20], or by a complexometric method with the use of Trilon B (disodium EDTA) of various concentrations in the presence of xylenol orange as an indicator (under the bismuth content ranging from 1 to 90%). In both cases, certified reference materials (CRMs) for the composition of metallic bismuth or CRMs for the composition of solutions of bismuth (III) ions are required to establish the metrological traceability of the measurement results. However, despite such a great practical significance of bismuth, the Federal Information Fund for Ensuring the Uniformity of Measurements1 currently lacks CRMs for the composition of metallic bismuth, according to the data of the FIF EUM as of 1 January 2023. For example, the Vi 00 and Vi 022 CRMs for the composition of bismuth and the CRM for the composition of bismuth concentrates3 have been past their shelf life, and the CRMs with metrological traceability are represented by two CRMs of bismuth (III)4 solutions with the certified mass concentration value of 1 mg/cm3 and the permissible relative error range of ± 1.0% (at P = 0.95). The content of bismuth in medical preparations in terms of dry matter can reach 51% (bismuth subgallate) and 72% (bismuth subnitrate), or even 90% in bismuth oxide. Therefore, the development of an CRM for the composition of high-purity bismuth and its compounds certified by the mass fraction of the main component and having metrological traceability appears to be a relevant research task. In this study, our aim was to develop a procedure for reproducing the units of bismuth mass fraction in metallic bismuth and the units of bismuth (III) mass concentration in bismuth nitrate solutions by controlled-potential coulometry using a reference installation (P-100 coulometric potentiostat-integrator) included in the GET 1
Federal Information Fund for Ensuring the Uniformity of Measurements. Available via FIF EUM. https://fgis.gost.ru/fundmetrology. Accessed 4 August 2022 (In Russ.). 2 GSO 2732-83–2735-83 Reference materials composition of bismuth metal grade Vi 00-02. Available via FIF EUM. https://fgis.gost.ru/fundmetrology/registry/19/items/552242. Accessed 4 August 2022 (In Russ.). 3 GSO 5474-90 Reference materials composition of bismuth concentrate. Available via FIF EUM. https://fgis.gost.ru/fundmetrology/registry/19/items/583301. Accessed 4 August 2022 (In Russ.). 4 GSO 8463-2003 Reference materials composition of a solution of bismuth ions. Available via FIF EUM. https://fgis.gost.ru/fundmetrology/registry/19/items/391720. Accessed 4 August 2022 (In Russ.). GSO 7477-98 Reference materials composition of a solution of bismuth (III) ions. Available via FIF EUM. https://fgis.gost.ru/fundmetrology/registry/19/items/392396 Accessed 4 August 2022 (In Russ.).
Bismuth Determination by Controlled-Potential Coulometry …
235
Table 1 Composition of metallic bismuth, chemically pure No.
Parameter
Result
1
Mass fraction of bismuth, (Bi), %, no less than
99.95
2
Mass fraction of lead, (Pb), %, no more than
0.01
3
Mass fraction of zinc, (Zn), %, no more than
0.0005
4
Mass fraction of iron (Fe), %, no more than
0.001
5
Mass fraction of antimony, (Sb), %, no more than
0.00005
6
Mass fraction of copper, (Cu), %, no more than
0.0001
7
Mass fraction of silver, (Ag), %, no more than
0.00002
8
Mass fraction of arsenic, (As), %, no more than
0.0001
9
Mass fraction of cadmium, (Cd), %, no more than
0.00005
176-2019 State primary standard of mass (molar, atomic) fraction and mass (molar) concentration of components in liquid and solid substances and materials on the basis of coulometry.5 In order to achieve the aim, the following objectives were formulated: • to study the electrochemical oxidation–reduction reaction of the Bi3+ /Bi0 system by obtaining voltammetric curves of cathodic and anodic polarization of a platinum electrode in bismuth nitrate solutions in the presence of nitric and hydrochloric acids; • to determine optimal reaction conditions providing for a 100% current yield; • to establish the uncertainty budget and to investigate the contribution of type A and type B uncertainties when determining bismuth by the method of controlledpotential coulometry.
Materials and Methods Materials Bismuth nitrate solutions were prepared using chemically pure metallic bismuth and analytical-grade pentahydrate bismuth nitrate (III). Tables 1 and 2 describe the characteristics of metallic bismuth and bismuth nitrate, respectively.
5
GET 176-2019 State primary standard of units of mass (molar, atomic) fraction and mass (molar) concentration of components in liquid and solid substances and materials based on coulometry (includes 3 installations on the basis of constant current coulometry, controlled potential coulometry and inductively coupled plasma mass spectrometry): Custodian Institute UNIIM—Affiliated Branch of the D. I. Mendeleyev Institute for Metrology. Available via FIF EUM. https://fgis.gost.ru/fundme trology/registry/12/items/1382712. Accessed 4 august 2022 (In Russ.).
236
V. M. Zyskin and A. V. Sobina
Table 2 Composition of bismuth nitrate, analytical reagent grade No.
Parameter
Result
1
Mass fraction of Bi(NO3 )3 · 5H2 O, %, no less than
99.5
2
Mass fraction of nonsolute in nitric acid, %, no more than
0.002
3
Mass fraction of sulfates (SO4 ), %, no more than
0.005
4
Mass fraction of chlorides (Cl), %, no more than
0.001
5
Mass fraction of iron (Fe), %, no more than
0.001
6
Mass fraction of copper (Cu), %, no more than
0.0005
7
Mass fraction of lead (Pb), %, no more than
0.005
8
Mass fraction of magnesium (Mg), %, no more than
0.0005
9
Mass fraction of calcium (Ca), %, no more than
0.0005
Methods Bismuth (III) solutions were prepared gravimetrically by dissolving a weighted portion of metallic bismuth or bismuth (III) nitrate in nitric acid of high purity according to GOST 11125-84 [21], further purified by distillation in a vacuum unit for low-boiling acid distillation. The content of impurity elements in nitric acid was measured by inductively coupled plasma mass spectrometry (ICP-MS). Solutions with concentrations of 10 g/dm3 were prepared using weighted portions; solutions with concentrations of 4 and 1 g/dm3 were prepared by multiple dilution with deionized water with addition of nitric acid. The concentration of HNO3 in all prepared solutions was 0.25 M. Measurements of the mass fraction of the main component in metallic bismuth and the mass concentration of bismuth in its solutions were carried out using the reference installation included in GET 176-2019, which implements the method of controlled-potential coulometry. The scheme and metrological characteristics of this installation can be found in [22]. The method is based on the reactions of electrochemical reduction of Bi3+ ions to 0 Bi on a platinum gauze at a potential of −150 mV and electrochemical oxidation of Bi0 to Bi3+ at a potential of + 200 mV in an acid medium: Bi3+ + 3e → Bi0 (reduction and separation of metal on a platinum gauze); Bi0 – 3e → Bi3+ (electro-dissolution of the metal from the electrode). The electrochemical reaction is reversible; the formal potential of the Bi3+ /Bi0 system comprises 0 mV relative to the ESr-10107-3.5 silver chloride reference electrode. Titration was carried out using a three-electrode electrolytic cell consisting of a 50 cm3 working chamber and two glass tubes ended with Vicor-glass frits used to separate the cathode and anode spaces. The generator and auxiliary electrodes were platinum gauzes by GOST 6563-75 [23]. The generator electrode was immersed into the working chamber; the auxiliary electrode and the silver chloride reference
Bismuth Determination by Controlled-Potential Coulometry …
237
electrode were immersed into the corresponding glass tubes. The appearance of the electrolytic cell and the general procedure of measurements are given in [24]. Weighing of bismuth portions for dissolution, as well as aliquots of prepared solutions, were carried out taking into account atmospheric buoyancy using a CCE66 mass comparator (Sartorius, Germany), accuracy class I (special), readability 0.000001 g. The density of bismuth nitrate solutions was measured using a DMA 4500 M density meter. The mass fraction of bismuth Am , (%) in metallic bismuth was calculated as follows: Am =
M Bi · (Q i − Q f ) · m M Bi · α · (Ni − N f ) · m · 100% = · 100%. n · F · Kc · m1 · m2 n · F · Kc · m1 · m2
(1)
The mass concentration C mass (g/dm3 ) in bismuth (III) solutions was calculated as follows: Cmass. =
M Bi · α · (Ni − N f ) · ρ M Bi · (Q i − Q f ) · ρ = , n · F · Kc · m n · F · Kc · m
(2)
where M Bi is the molar mass of bismuth, g/mol; Qi is the amount of electricity consumed during the oxidation (reduction) reaction of bismuth, C; Qf is the electricity quantity consumed during the reaction of oxidation (reduction) of the background, C; N i is the number of pulses recorded by an integrator pulse counter during the oxidation (reduction) time i of the sample, pulses; N f is the number of pulses detected by an integrator pulse counter during the oxidation (reduction) of the background, pulses; is the calibration factor determining the quantity of electricity corresponding α´ to 1 pulse at the voltage-to-frequency converter output, C/imp; m is the mass of the bismuth sample solution with allowance for atmospheric buoyancy, g; m1 is the mass of the bismuth portion with allowance for atmospheric buoyancy, g; m2 is the mass of the sample solution placed in the cell with allowance for atmospheric buoyancy, g; ρ is the density of the sample solution, g/dm3 ; n is the number of electrons involved in the electrode reaction; F is the Faraday constant (96,485.33212 C/mol) [25]; K c is the coefficient of electrochemical reaction completion [26]. At the first stage of the work, in order to determine optimal experimental conditions, we analyzed the voltammetric curves of the cathodic and anodic polarization of a platinum electrode in a bismuth nitrate solution with a concentration of 4 g/
238
V. M. Zyskin and A. V. Sobina
dm3 in the presence of 0.25 M nitric and hydrochloric acids in the range from − 250 to +500 mV with respect to a ESr 10107-3.5 silver chloride reference electrode. Voltammetric curves were recorded and processed using a software package included in the P-100 coulometric potentiostat-integrator. The acid concentration of 0.25 M was selected in order to avoid hydrolysis of bismuth nitrate solutions while shifting the reaction of hydrogen release from the solutions toward more negative potentials [27]. The study of the Bi3+ + 3e− → Bi0 electrochemical reduction reaction of bismuth found that, in the presence of HCl, bismuth reduction occurs simultaneously with hydrogen release in the acid solution. In the presence of 0.25 M nitric acid, the reduction process of Bi3+ starts at a potential of −30 mV, with the maximum diffusion current reached at potentials from −80 to −100 mV. Due to the high overvoltage, the hydrogen release initiation potential shifts toward the negative region of up to −250 mV. This allows a dense precipitate completely covering the gauze to be obtained. Under the selected conditions, cathodic and anodic polarization curves of the Pt electrode in solutions containing various amounts of Bi3+ were recorded (Fig. 1). It can be seen that, in the medium of 0.25 M nitric acid, the reduction process of Bi3+ in the range up to −200 mV proceeds without hydrogen release, thus being suitable for bismuth identification. However, an analysis of the 1' -3' anodic curves shows that the oxidation reaction of metallic bismuth released on the electrode is more preferrable for this purpose. The process of Bi0 dissolution from the electrode is much faster than Bi3+ reduction from the solution. The limiting diffusive oxidation current occurring during Bi0 dissolution is approximately twice greater than the cathodic reduction current in each polarization curve due to the higher concentration of bismuth on the electrode, which increases the sensitivity of analysis based on anodic oxidation curves. In addition, the oxidation curves (1' -3' ) clearly show a proportional increase in the limiting diffusion current with increasing Bi3+ concentration in solution (1' — 35 mA, 2' —70 mA, 3' —100 mA).
Results and Discussion The mass concentrations of the prepared solutions were calculated according to the preparation procedure and then measured on the reference installation implementing the controlled-potential coulometry method as part of the GET 176-2019 State primary standard. Table 3 presents the measurement results of the bismuth mass fraction and concentration of the prepared solutions. Figure 2 depicts factors affecting the accuracy of reproducing the unit of bismuth mass concentration in bismuth (III) nitrate solutions using the State primary standard in the form of a cause-and-effect diagram. The relative standard type A uncertainty of reproducing the units of mass concentration was estimated as the relative standard deviation of the measurement result based on seven independent measurements. The relative standard uncertainty type B was estimated by combining uncertainty components caused by sample weighing,
Bismuth Determination by Controlled-Potential Coulometry …
239
Fig. 1 Cathodic and anodic curves for the Pt-electrode in Bi(NO3 )3 solution 1-1' —2 mg of Bi3+ in the presence of 0.25M HNO3 solution, scan frequency 5 mV/s 2-2' —4 mg of Bi3+ in the presence of 0.25M HNO3 solution, scan frequency 5 mV/s 3-3' —6 mg of Bi3+ in the presence of 0.25M HNO3 solution, scan frequency 5 mV/s Table 3 Measurement results of the mass fraction of bismuth in metallic bismuth and the mass concentration of bismuth in bismuth (III) solutions with a nominal concentration of 10 and 1 g/ dm3 , obtained using the controlled-potential coulometry installation as part of the GET 176-2019 State primary standard Metallic bismuth, A = 99.95%
Solutions of bismuth (III) ions, Ccalc = 10.002 g/dm3
Mass fraction of bismuth, A, %
Mass concentration of bismuth, C, g/dm3
1
99.970
9.9907
1.0098
2
99.961
9.9963
1.0105
3
99.953
10.0088
1.0056
4
99.949
9.9944
1.0105
5
99.965
10.0036
1.0027
6
99.947
9.9880
1.0076
7
99.943
10.0072
1.0085
Mean value, A, %
99.955
–
–
Mean value, C , g/dm3
–
9.9984
1.0079
Relative standard type A uncertainty, %
0.0038
0.031
0.108
Relative standard type B uncertainty, %
0.0063
0.006
0.006
Relative combined standard uncertainly, %
0.0073
0.032
0.108
Relative expanded uncertainty (k = 2), %
0.015
0.06
0.22
Sample No.
Solutions of bismuth (III) ions, Ccalc = 1.0062 g/dm3
240
V. M. Zyskin and A. V. Sobina
Fig. 2 Uncertainty sources in reproducing the unit of bismuth mass concentration in bismuth (III) nitrate solutions [22]
measuring the quantity of electricity consumed during electrolysis, as well as determination of the coefficient of electrochemical reaction completion, molecular weight, solution density, and other factors (Fig. 2) by the algorithms described in GOST R 54500.3-2011 [28], which is identic to GUM [29]. Tables 4 and 5 present uncertainty budgets when reproducing the units of bismuth mass concentration in solutions with mass concentrations of 10.0 g/dm3 and 1.0 g/ dm3 , respectively.
1015.65
–
–
ρ
F
Kc
m
Electrolyte impurities
O2 impact
Diffusion
B
B
B
B
B
B
– g – – –
2.0 × 10⁻⁶ 10–6
1.7 × 10⁻³ 5.5 × 10⁻³ 10–3
3.2 ×
− 6.2 ×
0.099984
0.099984
–
–
–
− 9.8 0.099984
(dm3 )−1
%
%
∞
6
∞
∞
∞
∞
∞
∞
∞
∞
∞
∞
∞
6
ν eff
(continued)
g/dm3
1.5 ×
10–4
g/dm3
g/dm3
g/dm3
g/dm3
g/dm3
g/dm3
g/dm3
g/dm3
g/dm3
g/dm3
5.5 × 10⁻⁴
1.7 × 10⁻⁴
10–5
− 2.0 × 10⁻⁵
0
g/dm3
(g/dm3 )/ (C/mol)
− 1.0 × 10⁻⁴
1.1 × 10⁻⁴
1.6 ×
− 10.0
–
6.6 × 10⁻³
10–6
− 4.9 × 10⁶
1.1 × 10⁻⁴
1.7 ×
g/dm3
10–4
3.1 × 10⁻³
0.006
R
R
R
R
R
R
R
R
mol/dm3
10–2
(g/dm3 )/puls
− 1.2 × 10⁻⁴
(g/dm3 )/puls
(C/puls)
(g/dm3 )/
1
Units
Contribution to uc c j uj
Relative standard type B uncertainty, uB0
1.5 ×
6.3 ×
C/mol
0
g/dm3
104
1.2 × 10⁻⁴
4.2 ×
1
Units
Sensitivity factor cj
0.031
–
–
–
g
–
C/mol
1.6 × 10⁻²
R
R
R
N
Probability distribution
Relative standard type A uncertainty, uA0
–
1.02112
1
96,485.33
g/dm3
g/mol
Pulses
Pulses 5.0 × g/mol
208.9804
M
B
10–5
B
Pulses
2803
4.2 × 10⁻²
Nf
B
Pulses
9.2 × 10⁻¹
61,159
Ni
B
C/puls
C/puls
3.9 ×
1.6 ×
α´ 10–9
B
g/dm3
0.0031
10–4
g/dm3
9.9984
Repeatability
A
Units
Uncertainty uj
Units
Estimate
xj
Input value
Type
Table 4 Uncertainty budgets for the reproduction of the units of bismuth mass concentration (10.0 g/dm3 ) in a bismuth (III) nitrate solution
Bismuth Determination by Controlled-Potential Coulometry … 241
Probability distribution
Input values 1. Graduation factor α´ 2. Number of pulses at the voltage-to-frequency converter output N 3. Molar mass of the component M 4. Solution density ρ 5. Faraday constant F 6. Reaction completion coefficient Kc 7. Mass of the solution in the cell m
Units
Sensitivity factor cj
Contribution to uc
%
%
Units 0.06
uj
Uncertainty 0.032
Units
Relative expanded uncertainty, U 0 (k = 2, P = 0.95)
xj
Relative combined standard uncertainty, uc0
Estimate Units
Input value c j uj
Type
Table 4 (continued) ν eff
242 V. M. Zyskin and A. V. Sobina
1003.35
–
–
ρ
F
Kc
m
Electrolyte impurities
O2 impact
Diffusion
B
B
B
B
B
B
–
5.18965
1
96,485.33
–
–
–
g
-
C/mol
g/dm3
g/mol
Pulses
Pulses
– g – – –
2.0 × 10⁻⁶ 10–6
1.7 × 10⁻³ 5.5 × 10⁻³ 10–3
1.5 ×
6.3 ×
C/mol
g/dm3
0
1.6 × 10⁻²
5.0 × g/mol
208.9804
M
B
10–5
B
Pulses
2803
4.2 × 10⁻²
Nf
B
Pulses
4.7 × 10⁻¹
31,591
Ni
B
C/puls
C/puls
3.9 ×
1.6 ×
α´ 10–9
B
g/dm3
0.0011
10–4
g/dm3
1.0079
Repeatability
A
uj
xj
Unit
Uncertainty
Unit
Estimate
Input value
Type
R
R
R
R
R
R
R
R
R
R
R
N
Probability distribution
103
mol/dm3
3.0 ×
0.010079
0.010079
–
–
–
− 1.2 ×
0.010079
− 1.9 ×
∞
∞
∞
∞
∞
∞
∞
∞
∞
∞
∞
6
ν eff
(continued)
g/dm3
1.5 ×
10–5
g/dm3
g/dm3
g/dm3
g/dm3
g/dm3
g/dm3
g/dm3
g/dm3
g/dm3
g/dm3
5.5 × 10⁻⁵
1.7 × 10⁻⁵
10–6
(dm3 )−1
10–1
− 2.0 × 10⁻⁶
0
g/dm3
(g/dm3 )/ (C/mol)
− 1.0 × 10⁻⁵
1.0 × 10⁻⁵
1.5 ×
10–7
− 9.4 × 10⁻⁷
1.0 × 10⁻⁵
1.5 ×
g/dm3
1.0 × 10⁻³ 10–5
Unit
c j uj
Contribution to uc
− 1.0
–
6.4 × 10⁻⁴
10–3
(g/dm3 )/puls
(g/dm3 )/puls
(C/puls)
(g/dm3 )/
1
Unit
− 2.2 × 10⁻⁵
2.2 × 10⁻⁵
4.0 ×
1
cj
Sensitivity factor
Table 5 Uncertainty budgets for the reproduction of the units of bismuth mass concentration (1 g/dm3 ) in a bismuth (III) nitrate solution
Bismuth Determination by Controlled-Potential Coulometry … 243
0.22
Input values 1. Graduation factor α´ 2. Number of pulses at the voltage-to-frequency converter output N 3. Molar mass of the component M 4. Solution density ρ 5. Faraday constant F 6. Reaction completion coefficient Kc 7. Mass of the solution in the cell m
%
%
0.108
Relative expanded uncertainty, U 0 (k = 2, P = 0.95)
Contribution to uc
Relative combined standard uncertainty, uc0
Unit
Sensitivity factor cj %
Probability distribution %
Unit 0.006
uj
Uncertainty 0.108
Unit
Relative standard type B uncertainty, uB0
xj
Relative standard type A uncertainty, uA0
Estimate Unit
Input value c j uj
Type
Table 5 (continued)
∞
6
ν eff
244 V. M. Zyskin and A. V. Sobina
Bismuth Determination by Controlled-Potential Coulometry …
245
Conclusion The conducted studies have confirmed the applicability of the developed procedure based on the P-100 potentiostat-integrator included in GET 176-2019 for reproducing the units of bismuth mass fraction in metallic bismuth with a relative expanded uncertainty of 0.015% and bismuth mass concentration in bismuth (III) solutions in the range from 1.0 to 10.0 g/dm3 with a relative expanded uncertainty of 0.06– 0.22%. The procedure for reproducing the units of bismuth mass fraction in metallic bismuth and the mass (molar) concentration of bismuth in solutions of its salts by controlled-potential coulometry was developed and approved. The results obtained can be used for the development and approval of CRMs for the composition of metallic bismuth with an expanded relative uncertainty of 0.015–0.03% and CRMs for the composition of solutions of bismuth (III) ions in the range from 1.00 to 10.00 g/dm3 with an expanded relative uncertainty of 0.2– 0.4%, having direct metrological traceability of the certified RM values to the GET 176-2019 primary standard. The theoretical significance of the study consists in the development of methodological approaches to the certification procedure of an CRM for the composition of metallic bismuth and an CRM for the composition of bismuth solutions, allowing the accuracy of measurements in pharmacological, metallurgical, and nuclear industries to be improved. The practical significance of the study consists in the possibility of providing metrological traceability of measurement results to the GET 176-2019 primary standard when controlling the release of pharmaceuticals based on bismuth compounds. Acknowledgements The research was performed within the framework of the research theme “Development, improvement, and maintenance of the state primary measurement standards, as well as development and improvement of the state primary reference measurement procedures (methods).” All measurements were performed using the facilities of UNIIM, a branch of D.I. Mendeleyev All-Russian Institute for Metrology. Author Contribution Zyskin V. M.—research concept, measurement technique development, experimental data collection, literature data review, preparation of the original text of the article; Sobina A. V.—supervision, experimental data analysis, revision and editing the text of the article. Conflict of Interest The article was prepared on the basis of a report presented at the V International Scientific Conference “Reference materials in measurements and technologies” (Yekaterinburg, September 13–16, 2022). The article was admitted for publication after the abstract was revised, the article was formalized and the review procedure was carried out. The version in the Russian language is published in the journal “Measurement Standards. Reference Materials” 2023;19(4):129–141. (In Russ.). https://doi.org/10.20915/2077-1177-2023-19-4129-141.
246
V. M. Zyskin and A. V. Sobina
References 1. Dey BC (2022) Bismuth chemical properties (25 Facts you should know). Available via Lambda Geeks. https://lambdageeks.com/bismuth-chemical-properties/. Accessed 4 Aug 2022 2. Polyvjannyj IR, Ablanov AD, Batyrbekova SA (1989) Bismuth. Nauka, Alma-ata, 316 p (in Russian) 3. Denisov VM, Belousova NV, Moiseev GK, Bakhvalov SG, Istomin SA, Pastukhov EA, (2001) Vismutsoderzhashchie materialy: stroenie i fiziko-khimicheskie svoistva (Bismuth-containing materials: structure and physicochemical properties). Russ J Appl Chem 74:900. https://doi. org/10.1023/A:1017453131550 4. Gülseren MK, Kovan V, Tezel T (2023) Three-dimensional printability of bismuth alloys with low melting temperatures. J Manuf Process 92:238–246. https://doi.org/10.1016/j.jma pro.2023.02.057 5. Gu D, Yuan Y, Liu J, Li D, Zhang W, Wu L et al (2022) The electrochemical properties of bismuth-antimony-tin alloy anodes for magnesium ion batteries. J Power Sour 548:232076. https://doi.org/10.1016/j.jpowsour.2022.232076 6. Mohsin TB, Abidul Islam SM, Tonni TT, Rhaman MM (2023) Analysis of conductivity and band-gap energy of bismuth ferrite nanoparticles as prospective photovoltaic material. Mater Today Proc. Available online 8 Feb. https://doi.org/10.1016/j.matpr.2023.01.330 7. Bernard-Granger G, Addad A, Navone C, Soulier M, Simon J, Szkutnik PD (2012) Influence of nanosized inclusions on the room temperature thermoelectrical properties of a p-type bismuth– tellurium–antimony alloy. Acta Mater 60(11):4523–4530. https://doi.org/10.1016/j.actamat. 2012.05.007 8. Karimov KhS, Fatima N, Qasuria TA, Siddiqui KJ, Bashir MM, Alharbi HF (2020) Innovative semitransparent photo-thermoelectric cells based on bismuth antimony telluride alloy. J Alloy Compd 816:152593. https://doi.org/10.1016/j.jallcom.2019.152593 9. Jensen BA, Tang W, Liu X, Nolte AI, Ouyang G et al (2019) Optimizing composition in MnBi permanent magnet alloys. Acta Mater 181:595–602. https://doi.org/10.1016/j.actamat.2019. 10.003 10. Qin X, Sui C, Di L, Wang L, Xu X (2019) Studies on preparation and properties of low temperature phase of MnBi prepared by electrodeposition. J Alloy Compd 787:1272–1279. https://doi.org/10.1016/j.jallcom.2019.02.109 11. El-Sharkawy RM, Abdou FS, Gizawy MA, Allam EA, Mahmoud ME (2023) Bismuth oxide nanoparticles (Bi2 O3 NPs) embedded into recycled-Poly(vinyl chloride) plastic sheets as a promising shielding material for gamma radiation. Radiat Phys Chem 208:110838. https://doi. org/10.1016/j.radphyschem.2023.110838 12. Praveenkumar P, Venkatasubbu DG, Thangadurai P (2019) Nanocrystalline bismuth oxyiodides thick films for X-ray detector. Mater Sci Semicond Process 104:104686. https://doi.org/10. 1016/j.mssp.2019.104686 13. Rameshkumar C, Gayathri R, Subalakshmi R (2021) Synthesis and characterization of undopped bismuth ferrite oxide nanoparticles for the application of cancer treatment. Mater Today Proc 43(6):3662–3665. https://doi.org/10.1016/j.matpr.2020.09.840 14. Shetu SA, Sanchez-Palestino LM, Rivera-Sanchez G, Bandyopadhyay D (2022) Medicinal bismuth: Bismuth-organic frameworks as pharmaceutically privileged compounds. Tetrahedron 129:133117. https://doi.org/10.1016/j.tet.2022.133117 15. Sun H, Sadler PJ (1999) Bismuth Antiulcer Complexes. In: Clarke MJ, Sadler PJ (eds) Metallopharmaceuticals II. Topics in biological inorganic chemistry, vol 2. Springer, Berlin, Heidelberg, pp 159–185. https://doi.org/10.1007/978-3-642-60061-6_5 16. Salvador JAR, Figueiredo SAC, Pinto RMA, Silvestre SM (2012) Bismuth compounds in medicinal chemistry. Future Med Chem 4:1495–1523. https://doi.org/10.4155/fmc.12.95 17. Timakova EV, Bun’kova EI, Afonina LI et al (2021) Synthesis of high-purity basic bismuth(III) succinate as a pharmaceutical substance. Russ J Appl Chem 94:911–919.https://doi.org/10. 1134/S1070427221070077
Bismuth Determination by Controlled-Potential Coulometry …
247
18. Andrews PC, Ferrero RL, Junk PC, Kumar I, Luu Q, Nguyen K (2010) Bismuth (III) complexes derived from non-steroidal anti-inflammatory drugs and their activity against Helicobacter pylori. Dalton Trans 39(11):2861–2868. https://doi.org/10.1039/c000164c 19. Ottlecz A, Romero JJ, Hazell SL, Graham DY, Lichtenberger LM (1993) Phospholipase activity of Helicobacter pylori and its inhibition by bismuth salts. Dig Dis Sci 38(11):2071–2080. https://doi.org/10.1007/BF01297087 20. GOST 28407.1-89 Bismuth concentrate. Methods for determination of bismuth. Gosudarstvennyj komitet SSSR po upravleniju kachestvom produkcii i standartam, Moscow, 6 p (in Russian) 21. GOST 11125-84 (2006) Super pure nitric acid. Specifications. Standartinform, Moscow, 26 p (in Russian) 22. Zyskin VM, Shimolin AI, Sobina AV, Terentiev GI (2016) Bating a reference installation based on controlled-potential coulometry metod in the frame of improving the state primary standard GET 176 and its measurement capabilities. Measure Stand Ref Mater 2:44–54 (in Russian). https://doi.org/10.20915/2077-1177-2016-0-2-44-54 23. GOST 6563-75 (2009) Technical articles made of noble metals and their alloys. Specifications. Standartinform, Moscow, 49 p (in Russian) 24. Zyskin VM, Gusev VN, Terentiev GI, Mogilevskiy AN (2012) The use of precise coulometry with controlled potential for the determination of metrological characteristics of certified reference materials for composi tion of substances. Ref Mater 1:53–60 (in Russian) 25. Mohr PJ, Taylor BN, Newell DB (2019) CODATA recommended 2018 values of the fundamental physical constants: 2014. Available via NIST. http://physics.nist.gov/constants. Accessed 4 Aug 2022 (in Russian) 26. Mogilevskii AN (2000) Precise controlled-potential coulometry: instrumental errors. J Anal Chem 55:1080–1084. https://doi.org/10.1007/BF02757337 27. Rechnitz GA (1963) Controlled-potential analysis. Pergamon Press, Oxford, New York, p 108 28. GOST R 54500.3-2011 (2012) Uncertainty of measurement. Part 3. Guide to the expression of uncertainty in measurement. Standartinform, Moscow, 107 p (in Russian) 29. JCGM 100:2008 Evaluation of measurement data—guide to the expression of uncertainty in measurement. Available via BIPM. https://www.bipm.org/documents/20126/2071204/JCGM_ 100_2008_E.pdf/cb0ef43f-baa5-11cf-3f85-4dcd86f77bd6. Accessed 4 Aug 2022 (in Russian)
Reference Materials of the Oil Refining, Gas, and Fuel Industry
Use of Reference Materials-Imitators for Metrological Support of Gas Analytical Measuring Instruments Anna V. Kolobova , Leonid A. Konopelko, Timofei B. Sokolov, and Olga V. Fatina
Abstract Measurements in the field of gas analysis are one of the types of measurements of the physical and chemical composition and properties of substances, and cover a large amount of measurement tasks in various areas of human activity. The main means of calibration and verification of gas measuring instruments are 1st and 2nd category reference materials: gas mixtures, permeation tubes of gases and vapors, gas generators. The purpose of the research was to summarize the many years of experience of the specialists of the Research Department of State Standards in the field of Physical and Chemical Measurements, D.I. Mendeleyev Institute for Metrology, in terms of the use of reference materials—imitators for metrological support of the measuring instruments. The research considered the main features of the use of reference materials of gas mixtures as imitators of real environments. The main differences between imitators with a real environment were described. Approaches have been developed to assess the possibility of using imitators, the features of testing, calibration and verification of the measuring instruments. The practical significance is the use of the research results by metrologists in solving practical problems that arise during tests, verification and calibration of the measuring instruments. Keywords Gas mixtures · Imitators · Concentration of components · Real environment · Gas analyzers · Ethanol vapor analyzers
A. V. Kolobova (B) · L. A. Konopelko · T. B. Sokolov · O. V. Fatina D. I. Mendeleyev Institute for Metrology, Saint Petersburg, Russia e-mail: [email protected] T. B. Sokolov e-mail: [email protected] O. V. Fatina e-mail: [email protected] © D. I. Mendeleyev Institute for Metrology 2024 E. P. Sobina et al. (eds.), Reference Materials in Measurement and Technology, https://doi.org/10.1007/978-3-031-49200-6_16
251
252
A. V. Kolobova et al.
Abbreviations FIF OEI GET 154-2019
MI GM MT
Federal Information Fund for Ensuring the Uniformity of Measurements State Primary Standard of Units of Mole Faction, Mass Fraction and Mass Concentration of Components in Gas and Gas Condensate Media Measuring instrument Gas mixture Measuring transducer
Introduction As a way of determining the physicochemical composition and properties of substances, gas analytical measurements cover a wide range of measurement problems in various spheres of human activity [1]: • • • • • • • •
monitoring of atmospheric air pollutants (environmental monitoring); monitoring of hazardous substances in the workplace air; monitoring of industrial and automotive vehicle emissions; monitoring of explosive gases and vapors in the workplace air; monitoring of greenhouse gas emissions; monitoring of the component concentration during technological processes; composition control of hydrocarbon feedstock and derived products; monitoring of breath ethanol content, etc.
Over 5000 types of gas analytical measuring instruments (MIs) are registered in the Federal Information Fund for Ensuring the Uniformity of Measurements, which include gas analyzers, detectors, measuring systems, chromatographs, mass spectrometers, etc. Gas analytical MIs are traceable to GET 154-2019 State Primary Standard of Units of Mole Faction, Mass Fraction and Mass Concentration of Components in Gas and Gas Condensate Media operating at the D.I. Mendeleyev Institute for Metrology (VNIIM) [2, 3]. The procedure for transferring the units of component concentration and content from GET 154-2019 to gas analytical MIs using 1st and 2nd class working standards is established in two state hierarchy schemes: • state hierarchy scheme for instruments measuring the component concentration in gas and gas condensate environments, approved by the order of Rosstandart No. 2315 of Dec. 31, 2020 [4];
Use of Reference Materials-Imitators for Metrological Support of Gas …
253
• state hierarchy scheme for instruments measuring ethanol concentration in gas environments, approved by the order of Rosstandart No. 3452 of Dec. 30, 2019 [5]. Gas analytical MIs are verified using primarily 1st and 2nd class working standards [1, 2, 6]: • reference materials (RMs) for the composition of gas mixtures (GMs) in pressure cylinders; • measures-sources of gas and vapor microflows—that are used together with thermal-diffusion generators of GMs; • generators of various GMs. One of the objectives set for the metrological support of gas analytical MIs consists in determining the metrological characteristics of MIs during verification and maintenance with the use of GMs corresponding to real analyzed environments in terms of their characteristics. Real analyzed environments can be both “simple” (binary and quasi-binary mixtures, e.g., methane-air, oxygen–nitrogen, etc.) and “complex.” In the case of “simple” analyzed environments, gas analytical instruments can generally be verified and maintained using GMs that are most similar to real environments. As an example, we can consider gas analyzers of firedamp (methane), whose verification and maintenance are carried out according to the methane-air GM. Examples of “complex” real environments include: • flammable liquid vapors having a low saturation vapor pressure of the component to be determined mixed with air (saturated hydrocarbons in C7 H16 , aromatic hydrocarbons, etc.) and multicomponent mixtures (vapors of petroleum and petroleum products, etc.); • explosive gas mixtures (hydrogen in oxygen, etc.) or non-explosive gas mixtures (hydrogen in carbon dioxide, etc.) that can become explosive when mixed with air; • gas mixtures containing toxic or poisonous components (organophosphorus toxicants; rocket fuel components); • gas mixtures in atmospheric air (containing moisture and undetectable components—argon, carbon dioxide, etc., corresponding to the atmospheric air composition); • gas mixtures in industrial emissions (multi-component gas mixtures characterized by increased temperature and moisture, as well as the presence of chemically active components); • exhaled air with ethanol vapor (humidity of (95 ± 5)%; sample temperature of about +34 °C; carbon dioxide content of about 5%). A high degree of complexity is clearly involved in creating such “complex” gas environments for the metrological support of gas analytical MIs. In some cases, it is impossible or costly and labor-intensive to create GMs that correspond to real analyzed environments in terms of their characteristics. For example, in order to
254
A. V. Kolobova et al.
create air-vapor mixtures of flammable liquid vapors under laboratory conditions, working standards–dynamic systems (GGP-1,1 DGK-NV,2 etc.) are developed and successfully used; however, a certain level of qualification is required from the attending personnel to operate them, which does not solve the issue associated with the in-the-field verification and maintenance of a large number of in-service MIs. In order to address these limitations, an approach has been developed to the use of imitators of real environments, which significantly simplifies the verification and maintenance of MIs, as well as greatly reducing user costs related to MI operation. For example, although RMs for the composition of gas mixtures in pressure cylinders do not fully correspond to real environments in terms of their composition or properties, they still provide a means to transfer the unit of component concentration with the required accuracy. The study aims to identify and analyze the main factors affecting the metrological support of gas analytical MIs, taking into account the specifics of type approval testing and verification of MIs on the example of imitation RMs. To this end, it is necessary to achieve the following objectives: to carry out a theoretical analysis of imitation GMs used for the metrological support of gas analytical MIs; to consider practical examples of static MI characteristics for a real environment and an imitator; to demonstrate algorithms for calculating MI correction factors and error when using imitators; to formulate recommendations for the use of imitation GMs for the metrological support of gas analytical MIs.
Theoretical Analysis Widely used in operation and characterized by high stability, including in transportation and storage, GMs in pressure cylinders are generally used as imitators. The most commonly used GMs are methane-air, propane-air (and the same components in nitrogen), isobutylene-air, etc. The feasibility of using imitators is due to the design and functional features of gas analytical MIs. In the general form, the conversion function of a gas analytical MI can be written as Iout put = K · Cinput ,
(1)
where: Iout put output signal of the MI (indication); 1
Working standard of the 1st class—GGP-1 complex, reg. FIF OEI No 48775-11. Available via FIF EUM. https://fgis.gost.ru/fundmetrology/registry/4/items/360297. Accessed 15 July 2022 (In Russ.). 2 Working standard of the 1st class—DGK-NV dynamic gas mixing complex, reg. FIF OEI number 47882-11. Available via FIF EUM. https://fgis.gost.ru/fundmetrology/registry/4/items/ 359260. Accessed 15 July 2022 (In Russ.).
Use of Reference Materials-Imitators for Metrological Support of Gas …
255
Fig. 1 Functional flow block diagram of a gas analytical MI
Cinput concentration of the analyzed component at the MI input; K generalized conversion factor. A general functional flow block diagram of a gas analytical MI can be represented by a set of three measuring transducers (MTs) [7], as shown in Fig. 1. Let us consider the functional flow block diagram of a MI in more detail (Fig. 1) where the following notations are used: Cinput input quantity (concentration of the component to be determined in the analyzed environment); MT1 “composition–composition” measuring transducer ensuring scale transformation of the analyzed sample, e.g., preparation of the analyzed environment—temperature and flow rate stabilization, purification from mechanical impurities, etc.). Essentially, MT1 serves as a sampling and sample preparation device; MT2 “composition–property” measuring transducer converting the measurand (mass concentration, volume fraction, etc.) into the physicochemical property of the sensing element (resistance, conductance, capacitance, electromotive force, etc.); MT3 “property–output signal” measuring transducer converting the physicochemical property of the sensitive element into the output signal (indications) accessible to the operator; Iout put output MI signal (displayed indications, analog or digital output signal, etc.) Thus, according to the flow block, the generalized conversion factor of the gas analytical MI is functionally related to the conversion factors of individual MI blocks (measuring transducers) K = K1 · K2 · K3,
(2)
where: K 1 , K 2 , K 3 —conversion factors of the corresponding blocks and modules MT1, MT2, and MT3, comprising the MI. The conversion factors K 1 and K 3 are usually the characteristics of MIs that do not change when varying the composition of the analyzed environment. The conversion coefficient K 2 determines the conversion from composition to property and, as a rule, is specific with respect to the composition determining MI selectivity.
256
A. V. Kolobova et al.
As a rule, an imitation GM constitutes a GM which can be characterized as equivalent according to one of the following criteria: • the main component is replaced, i.e., instead of the component to be determined in the real environment, the imitator uses an equivalent—a verification component having similar physicochemical properties; • background component characterizing the real environment is replaced with an equivalent (e.g., the hydrogen–oxygen gas mixture is replaced with a hydrogen– nitrogen gas mixture); • characteristics of the imitator do not fully reflect the real environment (e.g., moisture content, temperature, and the presence of unmeasurable components). When using imitation GMs, it is necessary to ensure that the following inequality is satisfied f (δ1 , δ2 , δ3 ) ≤
δM I , K acc.m.
(3)
where: δ1 δ2 δ3 δM I K acc.m.
error of the analyzed component concentration in a real environment; error of the imitation GM; error of the established factor for the correspondence between the concentration of the analyzed component (real environment) and the imitator; MI error; accuracy margin (as a rule, from 2 to 3).
In this connection, approaches have been developed to assess the feasibility of using imitation GMs for the verification and maintenance of gas analytical MIs: • selection of an imitator, proceeding from the MI operating principle and design; • experimental studies on determining the conversion factor (or conversion function) within the measurement range using GMs corresponding to the characteristics of the real environment and imitation GMs (taking into account data from the MI manufacturer); • experimental studies on the conversion factor spread within a batch of single-type MIs; • experimental studies on the stability of the conversion factor; • establishment of special requirements for measurements and processing measurement results when using an imitator; • estimation of the verification method error, taking into account the error of the imitator and the conversion factor.
Use of Reference Materials-Imitators for Metrological Support of Gas …
257
Mathematical Approaches The feasibility of using imitation GMs is generally assessed at the stage of MI development and/or type approval testing. In some cases, preliminary studies examining the metrological characteristics of MIs are recommended to select imitators. Since 2000, the Research Department for State Standards in the Field of Physicochemical Measurements of VNIIM has conducted a series of studies and tests of several dozen MI types, whose verification and maintenance involves the use of imitation RMs for the composition of gas mixtures in pressure cylinders. As an example, let us consider some types of such MIs and the results of experimental studies on the selection of imitators for individual measurement channels: Example 1 DAF-M3 gas analyzers are designed for continuous automatic mass concentration measurement of hydrocarbons, including petroleum and petroleum products in the air. Here, measurement relies on the photoionization principle. For the examined MI, acetone in air is the real environment, while hexane in air is used as the imitator. The general view of static MI characteristics for the real environment and the imitator is presented in Fig. 2. Hereinafter, the following notations are used in figures showing static MI characteristics: • Cinput —concentration of the component in the analyzed environment at the MI input, in measurand units; • Cmeas —result of measuring the component concentration in the analyzed environment, in measurand units. Example 2 OGS-PGP/M-C3 H8 -A4 gas analyzers are designed for the continuous automatic measurement of lower explosive limit or the volume fraction of flammable gases and liquid vapors in the ambient atmosphere. Here, measurement relies on the optical infrared absorption principle. For the examined MI, the real environment is diesel fuel vapor, while propane in air serves as the imitator. The general view of static MI characteristics for the real environment and the imitator is shown in Fig. 3. Example 3 TP1142 gas analyzers5 are designed for measuring the volume fraction of hydrogen, as well as detecting when it exceeds limits established for the gas 3
DAF-M gas analyzers manufactured by Analitpribor, Smolensk, Russia. Available via FIF EUM. https://fgis.gost.ru/fundmetrology/registry/4/items/530080. Accessed 15 July 2022 (In Russ.). 4 OGS-PGP/M-C H -A gas analyzers manufactured by Pozhgazpribor LLC, St. Petersburg, Russia. 3 8 Available via FIF EUM. https://fgis.gost.ru/fundmetrology/registry/4/items/536997. Accessed 15 July 2022 (In Russ.). 5 TP1142 gas analyzers manufactured by ANAGAZ, St. Petersburg, Russia. Available via FIF EUM. https://fgis.gost.ru/fundmetrology/registry/4/items/1388854. Accessed: 15 July 2022 (In Russ.).
258
A. V. Kolobova et al.
Fig. 2 General view of static characteristics (real environment and imitator) plotted for the DAF-M gas analyzer 60.0 55.0 50.0 45.0
Сmeas., % LEL
40.0 35.0 30.0 25.0 20.0 propane
15.0
diesel fuel 10.0 5.0 0.0 0.0
5.0
10.0
15.0
20.0
25.0
30.0
35.0
40.0
45.0
50.0
55.0
60.0
Сinput, % LEL
Fig. 3 General view of static characteristics (real environment and imitator) plotted for the OGSPGP/M-C3 H8 -A gas analyzer
Use of Reference Materials-Imitators for Metrological Support of Gas …
259
4
3
Cmeas, % vol.
2
1
0 0
0.5
1
1.5
2
-1
2.5
3
3.5
4
hydrogen-nitrogen hydrogen-oxygen
-2
Cinput, % vol.
Fig. 4 General view of static characteristics (real environment and imitator) plotted for the TP1142 gas analyzer
environments of process lines in special systems. Here, measurement relies on the thermoconductometric principle. In this case, hydrogen in oxygen is the real environment, while hydrogen in nitrogen is used as the imitator. The general view of static MI characteristics for the real environment and the imitator is shown in Fig. 4. Example 4 Alcotest 6820 breathalyzers6 are designed for the rapid mass concentration measurement of ethanol vapor in an exhaled air sample. Here, measurement relies on the electrochemical principle. In this case, ethanol in exhaled air is the real environment (humidity—(95 ± 5)%; sample temperature— +34 °C), while ethanol in nitrogen serves as the imitator (humidity—about 0%; sample temperature— + 20 °C). The general view of static MI characteristics for the real environment and imitator is presented in Fig. 5.
6 Alcotest 6820 breathalyzers manufactured by Drager Safety AG & Co. KGaA, Germany. Available via FIF EUM. https://fgis.gost.ru/fundmetrology/registry/4/items/381645. Accessed 15 July 2022 (In Russ.).
260
A. V. Kolobova et al. 0.9 0.8 0.7
Cmeas, mg/l
0.6 0.5 0.4 0.3
wet gas mixture (generator)
0.2
dry gas mixture (cylinder)
0.1 0 0
0.1
0.2
0.3
0.4
0.5
0.6
0.7
0.8
0.9
Cinput, mg/l
Fig. 5 General view of static characteristics (real environment and imitator) plotted for the Alcotest 6820 breathalyzer
According to the results of experimental studies, the correction factors for DAF-M and OGS-PGP gas analyzers (Examples 1 and 2) can be calculated as follows: Ki =
Ci(ver ) Ciconv.t.(ver )
·
Ciconv.t.(det) Ci(det)
,
(4)
where: Ci(ver ) Ciconv.t.(ver ) Ci(det) Ciconv.t.(det)
result of measuring the verification component concentration when feeding the ith GM containing the verification component (on the scale of the component to be determined); conventional true concentration of the verification component in the ith GM containing the verification component; result of measuring concentration obtained when feeding the ith GM containing the component to be determined; conventional true concentration of the component to be determined in the ith GM.
In the general case, the absolute MI error when using imitators is calculated according to the formula Δ = Ci(ver ) − K i · Ciconv.t.(ver ) ,
(5)
Use of Reference Materials-Imitators for Metrological Support of Gas …
261
where: Ci(ver.) Ciconv.t.(ver ) Ki
result of measuring the verification component concentration when feeding the ith GM containing the verification component (on the scale of the component to be determined); conventional true concentration of the verification component in the ith GM containing the verification component; value of the correction factor for the ith verification point.
For the TP1142 (Example 3), the result of measuring the volume fraction of hydrogen in oxygen is calculated as follows according to the measured output signal (DC voltage from 0 to 10 V) when using imitation GMs (hydrogen in nitrogen): C = K · Uout put + Δ N 2 ,
(6)
where: Uout put value of the voltage output signal when feeding the hydrogen in nitrogen GM, V; K conversion coefficient of 0.4%/V; ΔN 2 correction due to the replacement of hydrogen–oxygen GM with hydrogen– nitrogen GM, volume fraction of hydrogen, % (ΔN2 = 1.25%). The basic absolute error in measuring the volume fraction of hydrogen is calculated as follows: ΔC = C − C G MC ,
(7)
where: C G MC volume fraction of hydrogen specified in the GM certificate, %; C volume fraction of hydrogen determined according to the output signal, taking the correction into account, %. For the Alcotest 6820 (Example 4), the result of measuring ethanol mass concentration when feeding GM in a pressure cylinder Ci (mg/L) is calculated according to the following formula C i = Ii ·
101.3 · K GM, P
(8)
where: Ii analyzer indication when feeding the ith GM in a pressure cylinder, mg/L; K G M factor for converting indications, K G M = 1.05; P atmospheric pressure measured using a barometer, kPa.
262
A. V. Kolobova et al.
The absolute error of the analyzer Δi (mg/L) when feeding the ith GM is calculated as follows Δi = Ci − Ciconv.t. ,
(9)
where: Ci mass concentration of ethanol measured when feeding the ith GM, mg/L; Ciconv.t. conventional true mass concentration of ethanol in the ith GM in a pressure cylinder, mg/L. The relative error of the analyzer δi (%) when feeding the ith GM is calculated as follows δi =
Ci − Ciconv.t. · 100, Ciconv.t.
(10)
The conventional true mass concentration of ethanol in the ith GM in a pressure cylinder Ciconv.t. (mg/L) is calculated according to the formula Ciconv.t. = Ciconv.t. (%) · k · 10,
(11)
where: Ciconv.t. (%) conventional true volume fraction of ethanol in the ith GM in a pressure cylinder, %; k conversion factor for the following conditions: + 34 °C and 101.3 kPa, k = 1.828. In some cases, the result of measuring the concentration of the component to be determined is calculated using a combination of the considered approaches: for example, for ARP1.0 acoustic resonance transducers7 (INKRAM, Moscow), both the conversion and correction factors are used in the calculations [8].
7
ARP1.0 measuring acoustic-resonance transducers, manufactured by NPF INKRAM, Moscow, Russia. Available via FIF EUM. https://fgis.gost.ru/fundmetrology/registry/4/items/367156. Accessed 15 July 2022 (In Russ.). ARP1.0 measuring acoustic-resonance transducers, manufactured by LLC NPF INKRAM, Moscow, Russia. Available via FIF EUM. https://fgis.gost.ru/fundmetrology/registry/4/items/138 1989. Accessed 15 July 2022 (In Russ.).
Use of Reference Materials-Imitators for Metrological Support of Gas …
263
Results and Discussion The presented examples show that the application problem of imitation GMs is successfully solved for several MI types varying in terms of the measuring principle, purpose and design, by introducing the conversion factors and corrections determined as a result of MI studies or testing. A special case of imitation GM application is a situation where the study results show that the use of imitation GMs does not require the use of a conversion factor due to the identity of MI indications in the analysis of a real environment and an imitator. For example, AGF-28 automatic stationary gas detectors for the detection of organophosphorus toxicants rely on the mass spectrometry operating principle. Noteworthy is that in order to establish the identity of MI indications when analyzing the real environment and the imitator, virtually the same amount of experimental work is required as when establishing the conversion factor. In special cases, it is established that the use of imitation GMs is impossible, for example, due to a significant spread of the factor within a MI batch or its instability over time; as a rule, such result is typical for measuring instruments relying on semiconductor or thermochemical measurement principles. The imitation method requires careful development of a research (test) program, collection of a large experimental data array, processing of measurement results, as well as development of specific verification procedures. In addition, the following factors should be taken into account when conducting studies: • error of the verification method using imitators must provide the required accuracy margin; • in some cases, special requirements exist with regard to the use of imitators: e.g., when testing breathalyzers, it is necessary to keep sessions conducted using dry and wet mixtures apart in time, etc. The use of imitation GMs is specified in several national and interstate standards, for example, GOST R 8.838-2013, GOST R 8.922-2016, GOST 8.618-2013, GOST 8.629-2013, and GOST R 52350.29.1-2010 [9–13].
Conclusion The study shows the relevance of using imitation GMs for the metrological support of gas analytical MIs. In the work, we performed a theoretical analysis of imitation GMs, defined the main stages involved in studies on the selection of imitation GMs,
8
Stationary automatic gas detectors for the detection of organophosphorus poisonous substances AGF-2, NPO “Pribor”, St. Petersburg, Russia. Available via FIF EUM. https://fgis.gost.ru/fundme trology/registry/4/items/1389113. Accessed 15 July 2022 (In Russ.).
264
A. V. Kolobova et al.
as well as considering practical examples of static MI characteristics for a real environment and an imitator. The algorithms for calculating the MI correction factors and error when using imitators are presented. The study results were used to develop approaches to the selection of imitation GMs and their use during type approval tests and their subsequent verification. Contribution of the Authors Kolobova A. V.—setting the task and developing the concept of research, developing a methodology/method, analyzing research results, implementing the methodology, preparing abstracts, checking and editing the text of the article; Konopelko L. A.—setting the task and developing the concept of research, analyzing the results of research work, developing methodological approaches for implementing the methodology for using equivalents in gas analytical measurements, checking and editing the text of the article; Sokolov T. B.—carrying out research work on the use of equivalents for gas analytical measuring instruments, processing and analyzing the results of research work, implementing the methodology, writing a draft version of the article, preparing/creating visual materials; Fatina O. V.—carrying out research work on the use of equivalents for gas analytical measuring instruments, processing and analyzing the results of research work, implementing the methodology, checking and editing the text of the article. Conflict of Interest The article was prepared on the basis of a report presented at the V International Scientific Conference “Reference Materials in Measurement and Technology” (Yekaterinburg, September 13–16, 2022). The article was admitted for publication after the abstract was revised, the article was formalized, and the review procedure was carried out. The author Kolobova A. V. is the editor of the book “Reference materials in measurement and technology. RMMT 2022.” The version in the Russian language is published in the journal “Measurement Standards. Reference Materials” 2023;19(3):55–64. (In Russ.) https://doi.org/10.20915/2077-1177-2023-193-55-64.
References 1. Pronin AN (ed) (2022) Modern metrology of physical and chemical measurements. OOO TRIUMPH, St. Petersburg, p 561 (in Russian) 2. Kolobova AV, Konopelko LA, Popov OG (2020) State primary standard of units of molar part, mass part and mass concentration of components in gas and gas condensate environs GET 1542019. Meas Stan Ref Mater 16(3):23–35 (in Russian). https://doi.org/10.20915/2687-08862020-16-3-23-35 3. GET 154-2019 (2019) State Primary Standard of Units of Mole Faction, Mass Fraction and Mass Concentration of Components in Gas and Gas Condensate Media: D. I. Mendeleyev Institute for Metrology. Available via FIF EUM. https://fgis.gost.ru/fundmetrology/registry/ 12/items/1365155. Accessed 28 July 2022 (in Russian) 4. On approval of the State verification scheme for measuring instruments for the content of components in gas and gas condensate media: Order of the Federal Agency for Technical Regulation and Metrology dated 31 December 2020 No. 2315. Available via FIF EUM. https://www. gost.ru/portal/gost/home/activity/documents/orders#/order/217676. Accessed 28 July 2022 (in Russian) 5. On approval of the State verification scheme for measuring instruments for the content of ethanol in gaseous media: Order of the Federal Agency for Technical Regulation and Metrology dated 30 December 2019 No. 3452. Available via Kodeks. https://docs.cntd.ru/document/564 647868. Accessed 28 July 2022 (in Russian)
Use of Reference Materials-Imitators for Metrological Support of Gas …
265
6. Kolobova AV (2022) Development of the reference base and means of metrological assurance of gas analytical measurements in the Russian Federation. Meas Tech 7:36–42 (in Russian). https://doi.org/10.32446/0368-1025it.2022-7-36-42 7. Fridman AE (2008) Fundamentals of metrology. Modern course. NPO Professional, St. Petersburg, p 284 (in Russian) 8. Mikhailov AA, Etrekova MO, Storozhenko AS, Bukharov DG, Sokolov TB, Parshikov YuG (2018) Checking out pre-explosive concentrations of combustible gases and vapors by means of acoustic detector. Chem Saf Sci 2(2):139–150. https://doi.org/10.25514/CHS.2018.2.14111 9. GOST R 8.838-2013 (2019) State system for ensuring the uniformity of measurements. Ethanol content analyzers. Verification procedure. Standartinform, Moscow, p 22 (in Russian) 10. GOST R 8.922-2016 (2019) State system for ensuring the uniformity of measurements. Gas analyzers and gas alarm devices for determination of combustible gases and vapors in working zone air. Test methods. Standartinform, Moscow, p 18 (in Russian) 11. GOST 8.618-2013 (2019) State system for ensuring the uniformity of measurements. Gas analyzers and gas alarm devices for determination of combustible gases and vapors in working zone air. Verification procedure. Standartinform, Moscow, p 22 (in Russian) 12. GOST 8.629-2013 (2019) State system for ensuring the uniformety of measurements. Stationary and mobile verification means for combustible gases and vapors gas analyzers and gas alarm devices. General technical requirements. Standartinform, Moscow, p 10 (in Russian) 13. GOST R 52350.29.1-2010 (IEC 60079-29-1:2007) (2011) Explosive atmospheres. Part 29-1. Gas detectors. General technical requirements and test methods of detectors for flammable gases. Standartinform, Moscow, p 40 (in Russian)
Prospects for the Development of Reference Materials of the Wobbe Index Natalia A. Malginova , Elena N. Korchagina , and Yaroslav V. Kazartsev
Abstract The thermophysical properties of gaseous fuel are essential for its industrial applications. The trueness of gas volumetric calorific values is currently ensured using certified reference materials for the net volumetric calorific value of pure gases and gas mixtures traceable to GET 16-2018. However, when determining the Wobbe index, a need arises to measure the relative gas density to air with traceability to GET 18-2014. This study aims to improve the accuracy of the pycnometer method for measuring gas density to establish metrological support for Wobbe index measurements. This method was used to estimate the uncertainty budget of gas density measurements. The mass determination of analyzed gas was found to make the greatest contribution to the combined uncertainty. To minimize the uncertainty, the pycnometer internal volume was increased and determined using the modified procedure. A pycnometer (imitator) having an increased volume and original design was produced. The modified method was tested to improve Wobbe index measurement accuracy. The study results provide a wider possibility of establishing metrological characteristics in the metrological support of Wobbe index analyzers, as well as enabling the application of the procedure for controlling the measurement accuracy of relative gas density to air. Keywords Wobbe index · Volumetric calorific value · Relative gas density · Density determination methods · Pycnometer method · Reference material · Gaseous fuel
N. A. Malginova (B) · E. N. Korchagina · Y. V. Kazartsev D. I. Mendeleyev Institute for Metrology (VNIIM), Saint Petersburg, Russia e-mail: [email protected] E. N. Korchagina e-mail: [email protected] Y. V. Kazartsev e-mail: [email protected] © D. I. Mendeleyev Institute for Metrology 2024 E. P. Sobina et al. (eds.), Reference Materials in Measurement and Technology, https://doi.org/10.1007/978-3-031-49200-6_17
267
268
N. A. Malginova et al.
Introduction The use of alternative gaseous fuels is becoming increasingly popular in most industries today [1]. In 2019, as a result of the 21st Conference of the Framework Convention on Climate Change, Russia joined the Paris Agreement, a UN-ratified international treaty [2] aimed at slowing global climate change. Since then, the Russian strategy for socioeconomic development [3] has focused on reducing greenhouse gas emissions into the atmosphere, specifically those that have a negative impact on the environment and climate. Various types of renewable gaseous fuels are also essential as they can be used to produce thermal energy; they replace fossil fuels, thus reducing greenhouse gas emissions into the atmosphere. One of the main thermophysical parameters characterizing gaseous fuels is the Wobbe index. The Wobbe index is defined as the ratio of the volumetric calorific value of gas to the square root of its relative density to air [4]. This parameter characterizes the interchangeability of combustible gases in technological processes. The Wobbe index of a gas mixture changes when different gases are mixed. The Wobbe index is key in evaluating the interchangeability of gaseous fuels in the thermal power industry [5]. Therefore, Wobbe index measurements are actively used in many processes that require control over the calorific value of gaseous fuels. In order to control and regulate the operating modes of burner devices, it is common nowadays to use Wobbe index analyzers measuring the calorific value of gaseous fuels via direct calorimetric and some indirect methods, together with gas density measurement methods (optical or other [6]). The development and establishment of metrological support in the field of Wobbe index measurements is currently a relevant issue. One of its objectives is to develop Wobbe index reference materials (RMs) for the verification, calibration, and type approval testing of gas calorimeters and Wobbe index analyzers. In 2020–2022 in order to establish and control the metrological characteristics of instruments for measuring the volumetric calorific value of gases, the D. I. Mendeleyev Institute for Metrology (VNIIM) developed and certified GSO 116622020/GSO 11665-2020 and GSO 11904-2022/GSO 11907-2022—type-approved reference material sets for volumetric net calorific value of pure gases: hydrogen, methane, ethane, and propane (in the course of the study described in [7]).1 The certified volumetric net calorific values for the certified reference materials (CRMs) of pure gases and gas mixtures are presented in Table 1. The certified RM values are traceable to the unit of volumetric net calorific value reproduced by the GET 16-2018 State Primary Standard of the Units of calorific
GSO 11662-2020 ÷ GSO 11665-2020 Reference materials type-approved for the volumetric net calorific value of gases (NOES-VNIIM set). Available via FIF EUM. https://fgis.gost.ru/fundmetro logy/registry/19/items/1384812. Accessed: 1 October 2022 (In Russ.). GSO 11904-2022 ÷ GSO 11907-2022 Reference materials type-approved for the volumetric net calorific value of gases (NOES-GS-VNIIM set). Available via FIF EUM. https://fgis.gost.ru/ fundmetrology/registry/19/items/1398624 [Accessed: 1 October 2022]. (In Russ.). 1
Prospects for the Development of Reference Materials of the Wobbe Index
269
Table 1 Certified characteristic, permissible certified value range, and permissible expanded uncertainty of CRMs for the volumetric net calorific value of gases GSO number in the set
CRM index in the set
Permissible certified value range of the volumetric net calorific value, 25/20
Hin f
Permissible relative expanded uncertainty (U)** at k = 2, %
, MJ/m3 *
GSO 11662-2020
NOES-VNIIM -H2
10.03–10.26
0.3
GSO 11663-2020
NOES-VNIIM -CH4
33.35–33.58
0.3
GSO 11664-2020
NOES-VNIIM -C2 H6
59.74–59.98
0.3
GSO 11665-2020
NOES-VNIIM -C3 H8
86.23–86.47
0.3
GSO 11904-2022
NOES-GS-1-VNIIM
3.00–10.00
0.40
GSO 11905-2022
NOES- GS-1-VNIIM
10.00–30.00
0.30
GSO 11906-2022
NOES- GS-1-VNIIM
30.00–36.50
0.20
GSO 11907-2022
NOES- GS-1-VNIIM
36.50–70.00
0.30
Note *the superscript (25/20) indicates standard combustion conditions, i.e., a temperature of 25 °C (298.15 K) and a pressure of 101.325 kPa, as well as standard conditions for gas volume conversion, i.e., a temperature of 20 °C (293.15 K) and a pressure of 101.325 kPa **corresponds to the permissible relative error at a confidence probability of P = 0.95
value, mass calorific value, and volumetric calorific value2 [8]. Noteworthy is that the characterization results are obtained via direct calorimetric measurements using reference gas calorimeters KATET, USVG, and USNG (VNIIM, Russia) which are part of GET 16-2018. However, for reliable measurements of the Wobbe index, it is necessary to determine the relative density of gases to air with established traceability to GET 18-2014 State Primary Density Standard [9]. The need to measure the absolute density of gases arose earlier during COOMET 780/RU-a/193 comparisons of national reference gas calorimeters using gas mixture RMs under the auspices of the International Bureau of Weights and Measures (BIPM) [10]. The metrological organizations of Russia, Turkey, and France took part in these comparisons. In European countries, reference gas calorimeters were developed as part of the GERG project aimed at solving the issues of metrological support in the gas industry.4 The calorimeters used by PTB (Germany) and LNE (France) implement the principle of measuring the mass calorific value of gas, while in Russia volumetric calorific value is determined. This fact necessitated solving the problem of converting 2
GET 16-2018 State Primary Standard of Units of calorific value, mass calorific value, and volumetric calorific value: D. I. Mendeleyev Institute for Metrology. Available via FIF EUM. https:// fgis.gost.ru/fundmetrology/registry/12/items/397842. Accessed 1 October 2022 (In Russ.). 3 COOMET No. 780/Ru/2019 Comparisons of national reference gas calorimeters on samples of gas mixtures. 4 The European gas research group. Available via GERG. https://www.gerg.eu/. Accessed 1 October 2022 (In Russ.).
270
N. A. Malginova et al.
the volumetric calorific value to a mass basis in order to compare results obtained in gas calorimetry. This problem can be solved by determining the analyzed gas density. Therefore, this study aims to develop a modified pycnometer procedure for determining gas density. To this end, the following study objectives were formulated: analysis of methods for determining gas density; selection of the optimal method for measuring gas density to determine the Wobbe index; development of a gas density measurement procedure; estimation of the uncertainty budget for density measurements within the developed procedure; testing of the developed procedure.
Materials and Methods Selection of a Method for Determining Gas Density The following measurement methods are currently used to determine gas density: calculation method, aerostatic method, vibration method, ultrasonic, and pycnometer method, among which calculation and pycnometer methods are the most widely used [10]. The calculation method is based on determining the physicochemical parameters of the gas mixture according to the known component composition and is described in ISO 6976 [11]. This method is designed to determine gross calorific value, net calorific value, density, relative density, and the Wobbe index for natural gas, natural gas imitators, and other gaseous fuels for which the component composition is known. In Russia, this method described in GOST 31369-2008 [12] is combined with the determination of component composition. In the aerostatic method, the examined gas and air pass through vertical tubes under constant pressure. Gas and air columns of equal height are created in the internal cavities of the tubes. The pressure difference in the columns is determined using a differential manometer [13]. The vibration method for determining density relies on the dependence between the parameters of elastic vibrations transmitted to the gas-filled vessel and the analyzed gas density. In most cases, the natural frequency of the resonator, made in the form of a string, rod, tube, plate, or tuning fork, serves as a parameter of elastic vibrations [14]. Ultrasonic density meters are based on the use of ultrasound to determine the density of gaseous media. Since it is possible to perform measurements without direct contact of the sensing elements with the substance under study, this method can be used to study aggressive media [15, 16]. The pycnometer method for measuring gas density is based on the successive weighing of a glass pycnometer of known internal volume that is filled with dry gas, dry air, or nitrogen. This method is described in detail in GOST 17310-2002 and GOST 34721-2021 [17, 18]. In accordance with GOST 34721-2021, the analyzed
Prospects for the Development of Reference Materials of the Wobbe Index
271
gas density is determined by first filling the internal volume of the pycnometer with pure nitrogen and then by the analyzed gas. In the pycnometer method, the confidence limits of the absolute error amount to 0.004 kg/m3 at a confidence probability of P = 0.95. Given that the aerostatic, vibration, and ultrasonic methods are used primarily in the flow mode at high gas flow rates, and the calculation method is applicable only in the case when the component composition of the examined gas mixture is known, the analysis of specified methods led to the choice of the pycnometer method for determining gas density.
Practical Justification and Testing of the Pycnometer Method for Determining Gas Density An uncertainty budget estimation for the pycnometer method shows that the largest contribution to the uncertainty of density measurements is made by the analyzed gas mass. Thus, to test the pycnometer procedure under development, it was decided: • to make a chamber (a pycnometer imitator) of increased volume having the original design (the internal volume of the chamber is increased from 200 cm3 to 1 dm3 in order to increase the mass of test gas inside the chamber); • to evacuate the chamber instead of conducting a dry air blast; • to use a liquid-comparator to determine the internal volume of the chamber. The modified algorithm for determining the gas density is as follows: • • • • •
determine the internal volume of the chamber; evacuate the chamber; determine the mass of the evacuated chamber; fill the chamber with the analyzed gas; determine the mass of the chamber filled with the analyzed gas.
In order to test the modified pycnometer procedure, a spherical pycnometer chamber (imitator) having an internal volume of about 1 dm3 and equipped with two shut-off valves was produced (Figs. 1 and 2). The chamber walls are made of aluminum. The design of shut-off valves allows the chamber to be filled with both gases and liquids. The internal volume of the chamber was determined by filling it with a liquidcomparator (ethyl alcohol as per GOST R 55878-2013 [19]). The ethyl alcohol density was determined using a DMA 4200 M density meter (limit of the absolute error in measuring density—0.0002 g/cm3 ) with traceability to GET 18-2014.5 The 5
GET 18-2014 State Primary Density Standard: D. I. Mendeleyev Institute for Metrology. Available via FIF EUM https://fgis.gost.ru/fundmetrology/registry/12/items/397864. Accessed 1 October 2022 (In Russ.).
272 Fig. 1 A schematic of the pycnometer chamber (imitator)
Fig. 2 A photograph of the manufactured pycnometer chamber (imitator)
N. A. Malginova et al.
Prospects for the Development of Reference Materials of the Wobbe Index
273
filled chamber was kept in a circulation bath at (20.00 ± 0.02) °C for at least four hours. The mass of the filled chamber was determined using Class I scales according to GOST OIML R 76-1-2011 [20]. The conventional true internal volume of the pycnometer chamber (imitator) was determined as follows: V =
m − m evac , cm3 , ρliq
(1)
where m mevac ρ liq
is the mass of the pycnometer chamber (imitator) filled with the liquidcomparator, g; is the mass of the evacuated pycnometer chamber (imitator), g; is the certified density of the liquid-comparator at the temperature t, g/cm3 .
The internal volume of the chamber was determined to be 963.9 ± 1.2 cm3 . The density of the test gas was established by successively determining the mass of the evacuated and gas-filled pycnometer chamber (imitator). The environmental parameters were recorded (temperature, atmospheric pressure, and relative air humidity). The density of gas analyzed at a temperature of 20 °C and a pressure of 101.325 kPa was obtained as follows: ρ=
M1 − M0 , g/cm3 , K ·V
(2)
where M 1 is the result of measuring the mass of the pycnometer chamber (imitator) filled with the analyzed gas, g; M 0 is the result of measuring the mass of the evacuated chamber, g; V is the conventional true internal volume of the pycnometer chamber (imitator), cm3 ; K is the coefficient for converting the analyzed gas density under the experimental conditions (temperature t; atmospheric pressure P) to standard conditions (293.15 K; 101.325 kPa):
K =
293.15 · P , (273.15 + t) · 101.325
(3)
The relative density (to air) of the analyzed gas d was determined according to the formula: d=
ρ , ρair
(4)
274
N. A. Malginova et al.
Table 2 Metrological characteristics of reference gas calorimeters KATET, USVG, and USNG (D. I. Mendeleyev Institute for Metrology, Russia) Characteristic Measurement range,
MJ/m3
Relative expanded uncertainty of unit transfer, P = 0.95
KATET
USVG
USNG
10–66
25–90
3–35
16·10−4
30·10−4
(30 − 40)·10−4
where ρ is the gas density, g/cm3 at t = 20 °C (293.15 K) and p = 101.325 kPa; ρair is the density of dry air having a standard composition at a temperature of t = 20 °C and a pressure of p = 101.325 kPa, g/cm3 as per GSSSD 8-79 [21], amounting to 1.2044 kg/m3 . The Wobbe index of the examined gas (W in MJ/m3 ) was determined as follows: Wgr oss/net =
Hgr oss/net , √ d
(5)
where H gross/net is the gross or net volumetric calorific value of the analyzed gas, MJ/ m3 . According to Eq. 5, the Wobbe index can be determined by measuring the gross and net volumetric calorific value of the examined gas. To measure the volumetric calorific value, VNIIM can use (depending on the examined gas) the reference gas calorimeter KATET or gas calorimeter-comparators USVG or USNG realizing the relative expanded uncertainty in the unit transfer of volumetric calorific value which does not exceed 0.4%. Table 2 provides the metrological characteristics of reference calorimeters.
Results and Discussion In order to test the modified pycnometer procedure, we selected a gas mixture that was used in the COOMET 780/RU-a/19 gas calorimetry comparisons. The mixture was prepared gravimetrically at VNIIM. The certified mole fraction of the component to be determined is as follows: CO2 —40.22%; CH4 —rest. The relative expanded uncertainty of certification amounts to 0.20% at P = 0.95. Table 3 provides gas mixture densities determined as per GOST 31369-2021 (ISO 6976:2016) and according to the modified pycnometer procedure under standard conditions. The difference between results obtained using the modified pycnometer procedure ρpyc and calculated as per GOST 31369-2021 ρcalc was determined as follows: | | |ρ pyc − ρcalc | · 100% = 0.3%. Δρ = ρcalc
(6)
Prospects for the Development of Reference Materials of the Wobbe Index Table 3 Results of determining the gaseous mixture density (CO2 —40.22%, CH4 —rest)
275
Results of determining the gaseous mixture density (CO2 —40.22%, CH4 —rest) as per GOST 31369-2021 (ISO 6976:2016) Gaseous mixture density, kg/m3
1.13797
Expanded uncertainty, k = 2, kg/m3
0.00056
Results of determining the gaseous mixture density (CO2 —40.22%, CH4 —rest) according to the modified pycnometer procedure Gaseous mixture density, kg/m3
1.1415
Expanded uncertainty, k = 2, kg/m3
0.003
Table 4 presents the estimated uncertainty budget of gas mixture density measurements performed using the modified pycnometer procedure. Table 4 Uncertainty budget of gas mixture density measurements (CO2 —40.22%, CH4 —rest) Uncertainty budget of gas mixture density measurements (CO2 —40.22%; CH4 —rest) performed using the modified pycnometer procedure Source of uncertainty
Estimation of the relative uncertainty component, type
Probability distribution
Standard deviation of the arithmetic mean of measurement results (n = 5)
7.4·10−4 Type A
Normal
1
No more than 7.4·10−2
Gas mass measurement
4.0·10−4 Type B
Uniform
1
4.0·10−2
Measurement of the internal chamber volume
7.0·10−4 Type B
Uniform
−1
7.0·10−2
Coefficient for converting gas density to standard conditions
1.0·10−3 Type B
Uniform
−1
1.0·10−1
Influence coefficient
Contribution to the relative combined standard uncertainty, %
Relative combined standard uncertainty, %
No more than 0.15
Relative expanded uncertainty (k = 2; P = 0.95), %
No more than 0.30
276
N. A. Malginova et al.
Conclusion The study was aimed at developing a modified pycnometer procedure for determining gas density. The need for a new procedure primarily arises from the demand for developing Wobbe index RMs due to the increasing requirements of modern industry. The procedure can be used to convert the volumetric calorific value of gas to a mass basis during gas calorimetry comparisons. The main changes introduced into the pycnometer procedure for determining gas density consist in increasing the internal volume of the pycnometer chamber (imitator) and implementing a different method of filling the chamber. In the course of the study, we developed a measurement algorithm and estimated the uncertainty budget. For testing the pycnometer procedure under development, the following gas mixture was chosen: CO2 —40.22%; CH4 —rest. As a result of gas density measurements via the considered method and the calculation method as per GOST 313692021, a discrepancy not exceeding 0.3% was detected, which corresponds to the expanded measurement uncertainty as per the method under development. Of note is that a larger internal volume of the gas-filled chamber led to a decrease in the uncertainty of density measurements, as compared to the conventional pycnometer method, to the level of 0.003 kg/m3 . Thus, the study led to an informed decision to use the modified pycnometer method for determining gas density. The theoretical significance of obtained results consists in testing the modified pycnometer procedure to improve Wobbe index measurement accuracy for gaseous fuel. The obtained study results provide a wider possibility of establishing the metrological characteristics of gas calorimeters and Wobbe index analyzers, including during type approval tests, as well as enabling the application of the procedure for controlling the measurement accuracy of relative gas density to air for other measurement methods. The present study can be further developed in implementing the hydrostatic weighing of a gas-filled vessel to enhance the accuracy of gas density measurements. In order to implement the hydrostatic weighing method, VNIIM developed design documentation for a new spherical closed chamber having an internal volume of 5 dm3 and produced it. Acknowledgements The research was carried out within the COOMET Project 780/RU-a/19 «Pilot comparisons of national reference gas calorimeters using samples of gas mixtures». The authors express their gratitude to the employees of the research department for measurement standards in the field of physicochemical measurements of the D. I. Mendeleyev Institute for Metrology for assistance in preparing gaseous mixtures for comparisons and testing the developed method, as well as to the employees of the research laboratory for measurement standards in the field of measuring the density and viscosity of liquids of the D. I. Mendeleyev Institute for Metrology for consultations and assistance in measurements. All measurements were carried out using the equipment of the D. I. Mendeleyev Institute for Metrology.
Prospects for the Development of Reference Materials of the Wobbe Index
277
Contribution of the Authors Malginova N. A.—development of the research concept, conducting research work, writing a draft of the article; Korchagina E. N.—research management, obtaining funding, revision of the text; Kazartsev Ya. V.—conducting research, revision of the text. Conflict of Interest The article was prepared on the basis of a report presented at the V International Scientific Conference “Reference Materials in Measurement and Technology” (Yekaterinburg, September 13–16, 2022). The article was admitted for publication after the abstract was revised, the article was formalized and the review procedure was carried out. The version in the Russian language is published in the journal “Measurement Standards. Reference Materials” 2023;19(1):5–15. (In Russ.) https://doi.org/10.20915/2077-1177-2023-191-5-15.
References 1. Global gas report 2022. International Gas Union. Available via International Gas Union. https:// www.igu.org/resources/global-gas-report-2022. Accessed 25 Nov 2018 2. Decree of the Government of the Russian Federation (2019) No. 1228 of 21/09/2019 “On the adoption of the Paris Agreement”. Available via Official Internet portal of legal information. http://publication.pravo.gov.ru/Document/View/0001201909240028. Accessed 1 Oct 2022 3. Decree of the Government of the Russian Federation of October 29, 2021 No. 3052-r “On approval of the strategy for the socio-economic development of the Russian Federation with low greenhouse gas emissions until 2050”. Available via Official Internet portal of legal information. http://publication.pravo.gov.ru/Document/View/0001202111010022. Accessed 1 Oct 2022 4. Florisson O, Burrie PH (1989) Rapid determination of the Wobbe index of natural gas. J Phys E Sci Instrum 22(2):123–128. https://doi.org/10.1088/0022-3735/22/2/009 5. Lieuwen T, Mcdonell V, Petersen EL, Santavicca D (2008) Fuel flexibility influences on premixed combustor blowout, flashback, autoignition, and stability. J Eng Gas Turbines Power 130(1):11506–11510. https://doi.org/10.1115/1.2771243 6. Roy PS, Ryu Ch, Park ChS (2018) Predicting Wobbe index and methane number of a renewable natural gas by the measurement of simple physical properties. Fuel 224:121–127. https://doi. org/10.1016/j.fuel.2018.03.074 7. Mishina KA, Korchagina EN, Kazartsev IV (2021) Metrological assurance of gas calorimeter and wobbe index analyser. Meas Stand Ref Mater 17(2):19–32 (in Russian). https://doi.org/10. 20915/2687-0886-2021-17-2-19-32 8. Korchagina EN, Kazartsev IV, Yanovskiy DYu (2017) The reference calorimeter system for metrological assurance of combustion energy measurements. In: Die 22. Calorimetry: collection of abstracts of the conference, 7–9 Juni 2017. Braunschweig, PTB, pp 132–134. Available via https://www.kalorimetrietage.ptb.de/fileadmin/documents/kalorimetrietage/22K altage_2017/Posterabstracts/Mishina_-_abstracts.pdf 9. Chekirda KV, Demyanov AA, Nekliudova AA, Domostroev AV, Sulaberidze VSh (2022) The history of creation and modernization of the state primary standards of units of dynamic, kinematic viscosity of liquid and density. Meas Tech (7):24–29. https://doi.org/10.32446/03681025it.2022-7-24-29 10. Khatskevich EA, Snegov VS (2011) Errors in the results of measuring the density of natural gas using pycnometric and calculation methods. Gas Ind 5:84–85 11. ISO 6976:2016 Natural gas—calculation of calorific values, density, relative density and Wobbe indices from composition 12. GOST 31369-2021 (ISO 6976:2016) (2021) Natural gas. Calculation of calorific values, mass volume, relative density and Wobbe indices from the composition. Russian Institute for Standardization, Moscow, p 52 (in Russian)
278
N. A. Malginova et al.
13. Farzane NG, Iliasov LV (1989) Technological measurements and devices. Vysshaia shkola, Moscow, p 456 (in Russian) 14. Lopatin SC, Pfaiffer Kh (2004) Limit level sensors for liquids. Physical principles of operation and possibilities of vibration sensors. Tech Means Autom 12:24–29 15. Solomichev RI, Slonko AN (2019) Estimation of physical and chemical parameters of natural gas by acoustic method. Sfera Oil Gas 4:46–51 16. Solomichev RI, Slonko AN (2019) Investigation of the metrological characteristics of the system for diagnosing ultrasonic flowmeters UFG in assessing the density of natural gas. Sphere Oil Gas 5:92–95 17. GOST 17310-2002 (2003) Gases. Picknometric method for determination of density. Izdatelstvo standartov, Minsk, p 18 (in Russian) 18. GOST 34721-2021 (2021) Natural gas. Determination of density by picknometric method. Standartinform, Moscow, p 19 (in Russian) 19. GOST R 55878-2013 (2014) Rectified hydrolytic technical ethyl alcohol. Specifications. Standartinform, Moscow, p 20 (in Russian) 20. GOST OIML R 76-1-2011 (2013) State system for ensuring the uniformity of measurements. Non-automatic weighing instruments. Part 1. Metrological and technical requirements. Tests. Standartinform, Moscow, p 136 (in Russian) 21. GSSDS 8-79 (1980) Standard reference data tables. Air is liquid and gaseous. Density, enthalpy, entropy and isobaric heat capacity at temperatures of 70–1500 Km and pressures of 0.1–100 MPa. Standartinform, Moscow, p 12 (in Russian)
Reference Materials for Physical Properties
Melting Point Certified Reference Materials for Organic Substances: Development Prospects Yaroslav V. Kazartsev, Elena N. Korchagina , and Igor V. Solovev
Abstract Measurements of the melting point of high-purity organic substances are crucial in various fields, such as medicine, biology, and perfumery and cosmetic production. This research was aimed at developing melting point certified reference materials (CRMs) for organic substances, with metrological traceability to the SI base units for “temperature” (°C). The study analyzes the metrological assurance in the field of melting point measurements, including a reference complex used to measure the melting point and purity of organic substances in the range of + 40 to + 250 °C. The research also identifies the basic requirements for substances eligible as CRMs. The study presents the results of determining the melting point of benzophenone, benzoic acid, succinic acid, anthracene, and caffeine, along with interlaboratory comparisons. To harmonize the results, a method is suggested, which involves presenting the certified value of the melting point determined by direct measurements and certified values of the optical transparency temperature at various heating rates in the certificates of the developed CRMs. These results have theoretical significance in improving the accuracy of measurements in the field of thermal analysis to a higher quality level. The study also outlines research directions for future work. Keywords Melting point · Melting point analyzers · Melting point certified reference materials · Thermal analysis · Heating rate · Temperature standard
Y. V. Kazartsev (B) · E. N. Korchagina · I. V. Solovev D. I. Mendeleyev Institute for Metrology (VNIIM), Saint Petersburg, Russia e-mail: [email protected] E. N. Korchagina e-mail: [email protected]
© D. I. Mendeleyev Institute for Metrology 2024 E. P. Sobina et al. (eds.), Reference Materials in Measurement and Technology, https://doi.org/10.1007/978-3-031-49200-6_18
281
282
Y. V. Kazartsev et al.
Abbreviations ILC MI CRM FIF EUM
Interlaboratory comparison Measuring instrument Certified reference material Federal Information Fund for Ensuring the Uniformity of Measurements in Russia
Introduction The melting point comprises one of the key physical and chemical properties of organic substances, since it determines other properties, including purity level, saturated vapor pressure, and solubility [1–4]. At present, the field of measuring the melting point of high-purity organic substances includes a large number of methods for thermal analysis of various types [3, 5, 6], used in medicine, biology, and perfumery and cosmetics production [7]. Leading international companies, such as Mettler Toledo, Buchi Labortechnic, Bibby Scientific, and others, are known for their high-quality measuring instruments (MI), including analyzers for the melting point of organic substances, which are characterized by high accuracy, efficiency, and automated measurement process. Over 10 types of such analyzers included in the Federal Information Fund for Ensuring the Uniformity of Measurements (FIF OEI)1 undergo annual periodic verification. These analyzers are widely used in major medical and pharmaceutical companies, various scientific centers, and chemical laboratories. In most melting point analyzers, an indirect method of measurement is used, which involves detecting the point at which the examined substance becomes optically transparent, while melting inside a glass capillary at various heating rates. The state of the samples is typically monitored using a digital camera. The point, at which optical transparency is observed, can be recorded manually or automatically by measuring the intensity of light passing through a sample. Since it is necessary to monitor the optical transparency of the melt during the verification and calibration of such MI, the temperature measures based on phase transitions of metals, whose metrological characteristics can be determined with high accuracy, are difficult to apply [8]. At present, the metrological supervision of this measurement area includes a number of CRMs for the melting point of pure organic substances of foreign origins, such as benzophenone, benzoic acid, and caffeine, as well as some CRMs for other physicochemical properties [9]. The CRMs, whose characteristics are listed in Table 1, are intended for use in the Russian Federation for the verification and calibration of analyzers. 1
Federal Information Fund for Ensuring the Uniformity of Measurements. Available via FIF EUM. https://fgis.gost.ru/fundmetrology. Accessed 7 October 2022.
Melting Point Certified Reference Materials for Organic Substances …
283
Table 1 General information on melting point CRMs approved in the Russian Federation (based on information from FIF EUM) GSO number
Substance
Producer
Certified value, °C
Expanded uncertainty, °C
GSO 7895-2001
Caffein
Sigma-Aldrich Chemie GmbH, Switzerland
235.0–237.0
± 0.3
GSO 11070-2018
Benzophenone
Mettler-Toledo Vostok JSC, Russia
47.6–48.6
± 0.2
GSO 11071-2018
Benzoic acid
Mettler-Toledo Vostok JSC, Russia
122.1–124.8
± 0.2
The certified value of the melting point of these CRMs indicates the temperature, at which the optical transparency of the melted substance occurs, while the certified range of values reflects the dependence of this temperature on the heating rate of a sample. MI manufacturers or suppliers usually provide a set of imported CRMs for instrument calibration. The metrological characteristics of such CRMs established through traceability to foreign primary standards [10] can be determined using standard thermometry methods [11] or by measuring the heat of phase transitions with standard adiabatic calorimeters [12, 13]. Melting point analyzers are typically used in the temperature range from room temperature up to +350–400 °C, although the most practical range for industrial applications is from room temperature to +250 °C, with the measurement uncertainty of the instrument typically standardized by FIF EUM at ±0.3–(±0.5) °C. Therefore, the CRMs produced domestically and internationally, with an expanded uncertainty of the certified value in the range of 0.2–0.3 °C, fail to fully meet the demands of modern industry. In this regard, this study focuses on identifying the characteristics and substantiating approaches to the development of certified reference materials for the melting point of organic substances, having metrological traceability to the basic SI units of the “temperature” (°C). The research objectives include the following: to justify the selection of substances for CRM; to establish the procedure for CRM certification; to assess the limitations that affect the certification process; to evaluate the uncertainty of certified melting point values in order to improve the accuracy of measurements in the field of thermal analysis.
284
Y. V. Kazartsev et al.
Materials and Methods The selection of substances for subsequent approval as melting point CRMs is a critical stage of research, since the properties of the examined substances significantly affect the results of the melting point measurements. The following basic requirements were formulated for the organic substances selected as candidates for CRM: • the melting point of the substance should be within the range from room temperature to +250 °C, taking into account the characteristics of already approved CRMs and the requirements of the approved methods of MI verification; • the substance must be chemically stable during the entire melting process and melt without decomposition or danger of ignition; • the substance must be non-toxic and non-hazardous to human health and analytical equipment in all aggregate states; • the substance should be readily available for purchase, and samples of the initial substance of high purity (at least 99.0 mol.%) should be mass-produced by chemical industry enterprises; • since the open capillary method is used in most ME, the substance should have a low evaporation capacity, which can be estimated from the saturated vapor pressure data. Therefore, the following pure organic substances were selected for research: benzophenone, benzoic acid, succinic acid, anthracene, and caffeine. 5.0 ± 0.1 g of each candidate for CRM, comprising a finely dispersed polycrystalline substance with a molar fraction of the main component of at least 99.0%, was packed in screw-capped glass vials from the original package. The stability and homogeneity of the materials were examined in accordance with the requirements of GOST R 50779.60-2017 [14]. In order to compare the results obtained during the study, the melting point of benzophenone, benzoic acid, and caffeine (GSO 11070-2018, GSO 11071-2018, GSO 7895-2001)2 manufactured by Fluka Chemie AG (Switzerland) and intended for use in optical analyzers were used. It is recommended to define the melting point in order to avoid any ambiguity in its interpretation. Therefore, the melting point is defined as the temperature, at which thermodynamic equilibrium is achieved between the solid and liquid phases of the studied substance, with the liquid phase having the same initial composition as the substance and the number of solid phase crystals tending towards zero [1, 2].
2
GSO 7895-2001 Caffeine melting point reference material. Available via FIF EUM. https://fgis. gost.ru/fundmetrology/registry/19/items/392091. Accessed 7 October 2022. GSO 11070-2018 Reference material for the melting point of benzophenone. Available via FIF EUM. https://fgis.gost.ru/fundmetrology/registry/19/items/593689. Accessed 7 October 2022. GSO 11071-2018 Standard sample of the melting point of benzoic acid. Available via FIF EUM. https://fgis.gost.ru/fundmetrology/registry/19/items/394949. Accessed 7 October 2022.
Melting Point Certified Reference Materials for Organic Substances …
285
With the introduction of the new state verification schedule (SVS) for temperature MI (instead of GOST 8.558–2009 [15]), new requirements for metrological characteristics of temperature measures based on pure organic substances (working standards of the 3rd grade), as well as the reference equipment for temperature units to transfer these measures (working standards of the 2nd grade), were introduced. In order to comply with the requirements for the transfer of the temperature unit, a CryoTherm prototype standard complex for measuring the melting temperature and purity of organic substances was developed and investigated at D. I. Mendeleyev Institute for Metrology (VNIIIM). The standard complex complies with the new GSO for the 2nd-grade operating temperature standard, with a range of confidence error of less than ±0.1 °C for temperature measurements at a confidence probability of 0.95 and the temperature range from +40 to +250 °C. The standard complex described in [16, 17] allows the melting point of organic substances to be measured with traceability to the State Primary Standard of Temperature GET 34-2020.3 The measurements are carried out by recording the temperature variations of the substance during the phase transition, in accordance with the accepted definition of the melting point. Temperature sensors in the standard complex comprise platinum resistance thermometers with nominal values of 50 and 100 ohms, connected to the measurement system based on the Keithley 2002 precision digital multimeter (Keithley Instruments, Inc., USA). The functional diagram of the reference complex is shown in Fig. 1 [17]. The reference complex comprises two units: 1. A unit for measuring the melting point of organic substances in the temperature range of +40 to +250 °C is based on the conventional thermometry method of direct measuring of the phase transition temperature. The analyzed substance is placed in a molybdenum glass ampoule, which is located in a temperature calibrator ensuring the heating mode. The temperature sensor is in direct contact with the studied substance. The melting point is determined by analyzing the graph of the phase transition in the region where the sign of the first derivative changes (the inflection point in the transition to the heating of the liquid phase). 2. The cryometric analysis unit is designed for measuring the melting point and total molar fraction of impurities in organic substances in the range of +40 to +200 °C for substances that have a molar fraction of the main component ranging from 99.000 to 99.995%. Temperature measurements are carried out in the melting cell using a constant heat flux, ensuring that the thermodynamic equilibrium of the substance be reliably determined. The melting point is estimated by analyzing the temperature dependence graph on the reverse fraction of the liquid phase, in the area corresponding to the state of two-phase equilibrium. The inventor’s certificate [18] describes the design of the melting cell developed at VNIIM, while the processing of measurement results is discussed in the works [16, 17]. 3
GET 34-2020 State primary standard of temperature unit in the range from 0 to 3200 °C: D. I. Mendeleyev Institute for Metrology. Available via FIF EUM. https://fgis.gost.ru/fundmetrology/ registry/12/items/1385580. Accessed 7 October 2022.
Fig. 1 Functional diagram of the CryoTherm reference complex designed to meet metrological characteristics of 2nd-grade operating temperature standard
286 Y. V. Kazartsev et al.
Melting Point Certified Reference Materials for Organic Substances …
287
In order to ensure the thermodynamic mode of experiments using the reference complex, a low heating rate of the substance (0.1–0.2 °C/min) is set, along with a prolonged melting process (a minimum of 15 min for 2 g of sample in the region where the two phases coexist). This process is primarily responsible for establishing conditions that lead to thermodynamic equilibrium.
Results and Discussion When processing the measurement results obtained using the unit based on the temperature calibrator, the melting point on the T (temperature) against τ (time) diagram was determined at the inflection point where a sharp increase in temperature occurred, indicating the heating of the substance that transitioned to the liquid phase. The authors believe that this point characterizes the completion of the destruction of the crystalline lattice in the substance, thus allowing the melting point to be determined according to the previously adopted definition. Summary data of the experimental results are presented in Table 2. The melting temperature can also be determined by locating the inflection point on the X-axis from the plot of the heating rate U as a function of temperature T. Moreover, the U–T plot provides insights into the melting process dynamics, along with the thermal stability of a substance under temperature repeatability at the inflection point during multiple “melting-crystallization” cycles (Fig. 2). Here, for succinic acid, much lower reproducibility of the melting point was observed, as well as a different heating rate profile (Fig. 2c), compared to the other studied substances. This finding suggests that the substance may be thermally unstable and unsuitable for use as a CRM. It should be noted that the melting point obtained by classical thermometry (Table 2) often fails to comply with the certified values of the melting point of the approved CRMs (Table 1). Table 2 Melting point of studied substances measured using the CryoTherm reference complex Experiment
Melting point, °C Benzophenone
Benzoic acid
Succinic acid
Anthracene
Caffein
1
47.95
122.27
182.86
216.02
235.45
2
48.00
122.30
182.82
215.88
235.69
3
47.89
122.27
182.81
215.84
235.59
4
47.90
122.28
182.80
–
235.58
5
47.91
122.28
–
–
235.56
6
47.91
–
–
–
235.42
Average value
47.93
122.28
182.82
215.91
235.55
288
Y. V. Kazartsev et al.
Fig. 2 Temperature variations during melting of benzophenone (a), benzoic acid (b), succinic acid (c), anthracene (d), and caffeine (e) at a heating rate of the solid phase within 0.2 °C/min obtained under repeatability conditions (footnotes “1–5” denote diagrams of successive melting cycles of a substance)
Melting Point Certified Reference Materials for Organic Substances …
289
This was confirmed by a comparative analysis of results obtained for substances from the same batches using different methods: classical thermometry and optical transparency. The research focused on CRM samples of benzophenone, benzoic acid, and caffeine, with melting point specifications as per GSO 11070-2018, GSO 11071-2018, and GSO 7895-2001. As presented in Table 3, a difference was observed between the temperature corresponding to the time of complete destruction of the crystal lattice in the substance and the temperature corresponding to the time of occurrence of optical transparency of the melt (the certified value) for benzoic acid and caffeine samples. In order to ensure a reliable comparison between the results obtained using the reference complex and those obtained using instruments based on the optical principle of registration, it is essential to establish accurate data on the occurrence of optical transparency in the melt. In light of the inconsistent measurement results obtained by different methods, an Interlaboratory comparison (ILC) was organized in order to increase the reliability of the data intended for inclusion in the certificates of the CRMs under approval. The ILC was carried out in compliance with the guidance of GOST 17043-2013 [19] using samples of benzophenone, benzoic acid, succinic acid, and anthracene, tested for stability and homogeneity in accordance with the requirements of GOST R 50779.60-2017. During the ILC, seven chemical, pharmaceutical, and medical laboratories in the Russian Federation, used melting temperature analyzers based on the optical principle of registration, produced by different manufacturers. Measurements were carried out at a sample heating rate in a capillary of 0.2 and 1 °C/min in accordance with the requirements of GOST 18995.4-73, GOST 21553-76, and OFS.1.2.1.0011.15 [20–22]. The ILC requires that three melting point determinations be made for each substance at the specified heating rates. Tests were carried out under conditions of method repeatability to establish the degree of consistency of independent measurement results. The statistical processing of the ILC results was carried out in accordance with the requirements of GOST R 50779.60-2017, GOST R ISO 5725-5-2002, GOST R ISO 5725-6-2002, and RMG 103-2010 [15, 23–25]. Table 3 Comparative analysis of melting point values of organic substances obtained by various methods Benzophenone, GSO 11070-2018 (Lot BCBZ6573)
Benzoic acid, GSO 11071-2018 (Lot BCBZ7431)
Caffeine, GSO 7895v2001 (Lot BCBB1813)
CryoTherma
CRM certificateb
CryoTherma
CRM certificateb
CryoTherma
CRM certificateb
47.9
47.9
122.3
122.7
235.6
236.3
a Thermometric method analysis: The temperature corresponding to the inflection point in the phase
transition diagram is recorded, with a heating rate of less than 0.2 °C/min method analysis: The temperature is recorded, which corresponds to the occurrence of optical transparency when heated in a capillary in thermodynamic mode, with a heating rate of 0.2 °C/min
b Optical
290
Y. V. Kazartsev et al.
Table 4 Assigned values of melting point of substances and their expanded uncertainty Studied substance Heating rate, °C/min Assigned value of melting point of substances and its expanded uncertainty, °C Benzophenone
0.2 1
48.76 ± 0.18 49.60 ± 0.53 123.07 ± 0.06
Benzoic acid
0.2 1
124.37 ± 0.11
Succinic acid
0.2
184.57 ± 0.06
1
187.21 ± 0.22
0.2
216.99 ± 0.30
1
217.84 ± 0.04
Anthracene
The melting point values of the studied substances, corresponding to the occurrence of their optical transparency, obtained as a result of the ILC, are listed in Table 4. As observed, the obtained results also exhibit significant discrepancies from the results obtained by the classical thermometry method (Table 2). Furthermore, the data obtained is dependent on the sample heating rate, indicating the method-dependence of the measurement results.
Conclusion The results of the research validate the type of CRMs for melting point based on pure organic substances. Developing such CRMs is a challenging scientific and technical task, since it requires the initial substance, available in sufficient quantities to produce the required CRMs, to have stable characteristics and a high degree of purity. The technical challenges in developing CRMs for melting points are primarily due to limitations in the equipment used for registration and control of the phase transition. The method used to obtain the results is a major factor that affects the results. The authors suggest that it is essential to differentiate between melting temperature as a characteristic of phase transition and the temperature associated with a specific physical effect, such as transparency. The findings assume that the moment of transparency in the melt may not necessarily correspond to the moment of complete destruction of the crystal lattice. The non-uniformity of the temperature field in the heating unit of the analyzer is an additional source of error when measuring the temperature of optical transparency, particularly when the heating element, temperature sensor, and capillary containing the substance are distant from each other. This temperature imbalance of the heated elements becomes particularly noticeable at higher heating rates. In order to address the issue of method-dependence of the certified melting point value, it is recommended to include the certified melting point value determined by
Melting Point Certified Reference Materials for Organic Substances …
291
the classical thermometry method under conditions of approaching thermodynamic equilibrium, as the primary characteristic of the substance in the certificates of the developed CRMs. The temperature of optical transparency at different heating rates (0.2 and 1 °C/min) should be included as an additional characteristic of the substance. Here, the concept of measurement uniformity adopted in the Russian Federation is adhered to, which ensures that the certified CRM value is traceable to the primary standard of the temperature unit. Including additional characteristics specific to the phase transition of a particular substance in the certificates of developed CRMs follows the requirements for CRM development. In order to further enhance the capabilities of the CryoTherm reference complex, it is recommended to integrate a melting point analyzer based on the optical principle of registration. The added functionality will offer the expansion of the range of substances investigated for potential use as CRMs. Following the example of foreign calibration standards, compounds such as vanillin, phenacetin, and saccharin in a wide melting point range may be considered potential CRMs. Broadening the range of CRMs will allow the analyzers to be calibrated for narrower measurement ranges specific to certain tasks, thereby increasing the level of metrological support in this field. The obtained results have both theoretical and practical significance. Theoretical significance is attributed to the development of theoretical and methodological approaches for the certification of CRMs for melting point based on pure organic substances. This improvement can lead to increased accuracy in thermal analysis measurements. The practical significance of the results is related to the expansion of possibilities for establishing and controlling the accuracy and stability of calibration characteristics of melting point analyzers. It can also contribute to the certification of measurement techniques (methods) and accuracy control of measurement results for the temperature of phase transitions of organic substances. The development of multi-parameter CRMs based on pure organic substances, including certified values of melting point and total molar fraction of impurities determined by cryometric analysis, is a promising area of research in this field. The authors suggest that such CRMs have the potential to find wide-ranging applications in scientific research, as well as in various industries. Acknowledgements The research was carried out within the research work “Development and study of melting point measurements based on high-purity organic substances” and development work “Creation of a reference complex for measuring the melting point and purity of organic substances” at the D. I. Mendeleyev Institute for Metrology. All measurements were carried out using the equipment of the D. I. Mendeleyev Institute for Metrology. Contribution of the Authors Kazartsev Ya. V.—development of measurement methodology, programming, conducting research, carrying out a formal analysis of the data obtained, writing a draft of the article, preparation and creation of visual materials; Korchagina E. N.—development of the idea (concept) of the study, management of research and development work, obtaining funding, revision of the article; Solovev I. V.—conducting research, carrying out a formal analysis of the data obtained, revision of the article.
292
Y. V. Kazartsev et al.
Conflict of Interest The article was prepared on the basis of a report presented at the V International Scientific Conference “Reference Materials in Measurement and Technology” (Yekaterinburg, September 13–16, 2022). The article was admitted for publication after the abstract was revised, the article was formalized, and the review procedure was carried out. The version in the Russian language is published in the journal “Measurement Standards. Reference Materials” 2023;19(1):29–40. (In Russ.). https://doi.org/10.20915/2077-1177-2023-191-29-40.
References 1. Aleksandrov Yu (1975) Accurate cryometry of organic substances. Khimiia Publ, Leningrad, p 160 (in Russian) 2. Aleksandrov YuI (2003) Controversial issues of modern metrology in chemical analysis. Izd-vo im NI Novikova, St. Petersburg, p 303 (in Russian) 3. Yalkowsky SH, Alantary D (2018) Estimation of melting points of organics. J Pharm Sci 107(5):1211–1227. https://doi.org/10.1016/j.xphs.2017.12.013 4. Giani S, Riesen R, Schawe JEK (2018) An indirect method for vapor pressure and phase change enthalpy determination by thermogravimetry. Int J Thermophys 39(84):84. https://doi.org/10. 1007/s10765-018-2407-y 5. Feist M (2015) Thermal analysis: basics, applications, and benefit. ChemTexts 1:8. https://doi. org/10.1007/s40828-015-0008-y 6. Jain A, Yalkowsky SH (2007) Comparison of two methods for estimation of melting points of organic compounds. Ind Eng Chem Res 46:8. https://doi.org/10.1021/ie0614428 7. Kazartcev YaV, Korchagina EN, Mishina KA, Shehovtsov DA (2018) On the development of certified reference materials for melting point of high-purity organic substances. In: Collection of works Ith International scientific conference Reference materials in measurement and technology, UNIIM, Ekaterinburg, Russia, 11–14 Sept 2018, pp 79–80 (in Russian) 8. Tiers GVD (1990) Calibration of capillary melting-point apparatus to the international temperature scale of 1990 (ITS-90) by use of fluxed highly pure metals. Anal Chim Acta 237:241–244. https://doi.org/10.1016/S0003-2670(00)83924-0 9. Monte MJS, Santos LMNBF, Fulem M, Fonseca JMS, Sousa CAD (2006) New static apparatus and vapor pressure of reference materials: naphthalene, benzoic acid, benzophenone, and ferrocene. J Chem Eng Data 51(2):757–766. https://doi.org/10.1021/je050502y 10. Kazartcev Ia, Mishina K, Korchagina E, Varganov V (2018) Measuring complex for simultaneous determination of purity and melting point of high-purity organic substances. In: Abstracts 12th European symposium thermal analysis and calorimetry, Brasov, Romania, 27–30 Aug 2018, p 459 11. Moiseeva NP (2001) Methods of constructing an individual calibration characteristic for working platinum resistance thermometers. Meas Tech 44:502–507. https://doi.org/10.1023/ A:1012314420995 12. Gronvold F (1967) Adiabatic calorimeter for the investigation of reactive substances from 25 to 775 degrees C. Heat capacity of alpha-aluminum oxide. Acta Chememica Scandinavica 21:1695–1713. https://doi.org/10.3891/acta.chem.scand.21-1695 13. Gronvold F (1993) Adiabatic calorimetry and solid-state properties above ambient temperature. Pure Appl Chem 65(5):927–934. https://doi.org/10.1351/pac199365050927 14. GOST R 50779.60-2017 (ISO 13528:2015) (2017) Statistical methods. Use in proficiency testing by interlaboratory comparison. Standartinform, Moscow, p 83 (in Russian) 15. GOST 8.558-2009 (2020) State system for ensuring the uniformity of measurements. State verification schedule for means measuring temperature. Standartinform, Moscow, p 13 (in Russian)
Melting Point Certified Reference Materials for Organic Substances …
293
16. Korchagina EN, Kazartsev IaV, Varganov VP, Solovev IV (2019) On the creation of a standard complex for the development of melting temperature measures based on pure organic substances. In: Proceedings of the V international scientific and technical conference modern methods and tools for studying the thermophysical properties of substances, St. Petersburg, 23– 24 May 2019, Federal State Autonomous Educational Institution of Higher Education National Research University ITMO, St. Petersburg, Russia, pp 125–131 (in Russian) 17. Kazartsev IaV, Varganov VP, Korchagina EN, Solovev IV (2020) Standard complex for measuring the melting temperature and the degree of purity of organic substances. Devices 11:48–54 (in Russian) 18. Aleksandrov IuI, Varganov VP, Frenkel IM (1986) Method for determining the parameters of the phase transition solid—liquid and a device for its implementation. RF Patent, SU 1221566 A1 (in Russian) 19. GOST ISO/IEC 17043-2013 (2020) Conformity assessment. General requirements for proficiency testing. Standartinform, Moscow, p 36 (in Russian) 20. GOST 18995.4-73 (2009) Organic chemical products. Methods for determination of melting point interval. IPK Izdatel’stvo standartov, Moscow, p 5 (in Russian) 21. GOST 21553-76 (2001) Plastics. Methods for determination of melting temperature. IPK Izdatel’stvo standartov, Moscow, p 14 (in Russian) 22. OFS.1.2.1.0011.15 Melting point: general pharmacopoeial article: approved and put into effect by the Ministry of Health of the Russian Federation (Order of 29 October 2015 no. 771): date of introduction 01.01.2016. Available via Pharmacopoeia.ru. https://pharmacopoeia.ru/ofs-12-1-0011-15-temperatura-plavleniya. Accessed 7 Oct 2022 (in Russian) 23. GOST R ISO 5725-5-2002 (2002) Accuracy (trueness and precision) of measurement methods and results. Part 5. Alternative methods for the determination of the precision of a standard measurement method. Gosstandart of Russia, Moscow, p 50 (in Russian) 24. GOST R ISO 5725-6-2002 (2002) Accuracy (trueness and precision) of measurement methods and results. Part 6. Use in practice of accuracy values. Gosstandart of Russia, Moscow, p 43 (in Russian) 25. RMG 103-2010 (2011) State system for ensuring the uniformity of measurements. Proficiency testing of test (measurement) laboratories, conducting the tests of substances, materials and environmental objects (for composition and physico-chemical properties) by means of interlaboratory comparisons . Standartinform, Moscow, p 39 (in Russian)
Application of the Traceability Concept in Determining the Mechanical Properties of Metals Under Static Tension Using a GSO 11854-2021 Reference Material Ilona N. Matveeva, Vladimir V. Tolmachev, and Anastasia A. Zabelina
Abstract This paper deals with the specific features of applying approved reference materials as a tool for ensuring traceability and controlling the accuracy of mechanical property measurements. The authors analyzed the theoretical approach based on ISO/IEC Guide 98-3:2008 and calculation algorithms provided by ISO 21748:2017 for evaluating measurement uncertainty. The methodology of using a GSO 118542021 certified reference material of St20 steel mechanical properties for evaluating the uncertainty of static tensile test measurements is considered. In order to ensure the traceability of measurement results, two options for accounting the laboratory systematic component are proposed: as a correction or a contribution to the standard combined uncertainty. According to the conducted study, the modeling approach of theoretical concepts based on ISO/IEC Guide 98-3:2008 and calculation algorithms provided by ISO 21748:2017 (Eq. 1) can be applied by accredited laboratories when assessing uncertainty in accordance with clause 7.6 of GOST ISO/IEC 17025-2019. Keywords Mechanical properties · Static tension · Metrological traceability · Primary reference measurement technique · Reference material
Introduction Determination of the mechanical characteristics of metals under static tension is a key method for identifying their strength and ductility indicators. Static tensile tests represent indirect measurements, where strength (tensile strength, proof strength) and ductility (percentage elongation after fracture, percentage total extension at fracture) are determined using corresponding measurement equations under specified test conditions. In this regard, although the results of determining mechanical properties cannot be correlated with a comparison base in the form of a physical quantity I. N. Matveeva (B) · V. V. Tolmachev · A. A. Zabelina UNIIM—Affiliated Branch of the D. I. Mendeleyev Institute for Metrology, Yekaterinburg, Russia e-mail: [email protected] © D. I. Mendeleyev Institute for Metrology 2024 E. P. Sobina et al. (eds.), Reference Materials in Measurement and Technology, https://doi.org/10.1007/978-3-031-49200-6_19
295
296
I. N. Matveeva et al.
reference, either a primary reference measurement procedure or a reference material (RM) can be applied. However, the use of RMs or primary reference measurement procedures as a comparison base is associated with a number of specific features, which are not immanent to quantitative chemical analysis. These features arise due to the heterogeneity of either RMs or the material used for comparing the results of a laboratory procedure according to GOST 1497-84 [1] with those obtained by a primary reference measurement procedure. Bahng and Roebben [2–4] classify mechanical properties as characteristics that depend on test procedures. A confusion in establishing the traceability of mechanical properties is caused by expressing the results of testing the mechanical properties of metals in SI basic units. Thus, strength in static tensile tests is measured in MPa, which are the units of pressure (force, divided by the area). However, the assumption that the properties of metals in static tensile tests can be traced to force 01basic units, seems to be incorrect, since these properties are measured prior to sample destruction. In order to obtain a response from a sample, it is necessary to use an external action in the form of tension, e.g., under a certain deformation rate. This means that any variations in the method or procedure of external action will affect the measurement results. Therefore, an RM is needed to ensure the traceability of properties and to control the accuracy of applying a particular test method. Adamczak et al. [5–7] discussed various approaches to calculating the uncertainty of strength and ductility characteristics. An essential drawback of these studies involves uncertainty budgeting only on the basis of data on the traceability to the units of force and length, i.e., without using an RM. Tolmachev and Matveeva [8] considered an approach to ensuring the metrological traceability of the results of measuring mechanical properties during static tensile tests to a primary reference measurement technique using RMs. When evaluating the uncertainty of static tensile test results, a contribution of traceability, assessed using RMs, requires accounting for the laboratory systematic component either as a correction or as a contribution to the standard combined uncertainty. In this paper, we aim to study and verify a methodology of using RMs to establish traceability in determining the mechanical properties of metals under static tension. To this end, the following research objectives were formulated: to analyze the theoretical principles specified in ISO/IEC Guide 98-3:2008 [9] and calculation algorithms proposed by ISO 21748:2017 [10] for evaluating measurement uncertainty; to evaluate the uncertainty of static tensile test results using the example of a GSO 11854-20211 reference material of the mechanical properties of St20 steel; to develop an approach based on uncertainty budgeting taking into account the combined effect from all sources of uncertainty, including bias, caused by traceability.
1
GSO 11854-2021 Reference materials of the approved type of mechanical properties of steel grade 20. Available via FIF EUM. https://fgis.gost.ru/fundmetrology/registry/19/items/1395637. Accessed 15 October 2022 (In Russ.).
Application of the Traceability Concept in Determining the Mechanical …
297
Table 1 Metrological characteristics of GSO 11854-2021 CRM of the mechanical properties of grade 20 steel Certified characteristic
RM certified value
Absolute expanded uncertainty of certified values (P = 0.95, k = 2)
Tensile strength Rm , MPa (N/mm2 )* 446
±6
Lower yield strength ReL , MPa (N/ mm2 )*
± 10
250
* For proportional cylindrical samples according to GOST 1497-84 with the original gauge length l0 = 5d0 , where d0 is the original diameter of the parallel length of a circular test piece
Materials and Methods According to JCGM 200:2012 [11] (clause 2.41), metrological traceability is the property of a measurement result whereby the result can be correlated with a reference system through a documented continuous chain of calibrations, each contributing to the measurement uncertainty. In this research, we study the mandatory characteristic of the result of measuring the strength properties of a metal, i.e., the uncertainty of tensile strength, and carry out an analysis of traceability contribution to uncertainty budgeting. The GSO 11854-2021 certified reference material (CRM) of the mechanical properties of St20 steel was selected as a comparison base. A GSO 11854-2021 approved type CRM was obtained as a result of the study and characterization of steel hot-rolled circular products according to GOST 2590-2006 [12] made of St20 steel according to GOST 1050-2013 [13]. The characterization of rolled samples in terms of their tensile strength and lower yield strength was carried out on the State standard of the unit of force of the first category2 provided by GOST 1497-84. The standard uncertainty of the characterization was 0.9 N/mm2 . In order to evaluate the expanded uncertainty of certified values, during the type approval tests, the standard uncertainty from the heterogeneity of the reference material equal to 2 N/mm2 was established. Table 1 provides the metrological characteristics of the CRM of the mechanical properties of St20 steel, established as a result of testing batch No. 1. Various approaches can be used to evaluate measurement uncertainties. All of them include determination of the measurand and careful identification of all possible contributions to an increase in the uncertainty of measurements. Figure 1 illustrates the classification of approaches to the evaluation of uncertainty proposed in [14]. The classification is based on the difference between the evaluation of uncertainty, conducted by the laboratory itself (intralaboratory approach) and uncertainty, based on combined studies in various laboratories (interlaboratory approach).
2
GET 32-2011 State working standard of the unit of force of the first category in the range of values from 1 to 50 kN. Available via FIF EUM. https://fgis.gost.ru/fundmetrology/registry/11/ items/415290. Accessed 15 October 2022 (In Russ.).
298
I. N. Matveeva et al.
Fig. 1 Classification of approaches to the evaluation of uncertainty according to [9]
In this study, we used a modeling approach based on ISO/IEC Guide 98-3:2008. A mathematical model was created, representing an equation that determines the quantitative relationship between the measurand and all dependent quantities, including all components that contribute to the uncertainty of measurements. An evaluation of the standard uncertainties of all individual components of uncertainty was made. Standard deviations of repeated measurements are directly the standard uncertainties for the corresponding components (given the normal distribution). The combined standard uncertainty is calculated by applying the uncertainty propagation law, which depends on the partial derivatives for each input value. The expanded uncertainty U (providing the interval from (y − U) to (y + U) for the measurand y is calculated. For a normal distribution, the coverage factor k = 2 is typically selected. The measurement result, together with its uncertainty, is represented in accordance with the rules of ISO/IEC Guide 98-3:2008. It should be noted that empirical approaches are just as valid as the modeling approach, and sometimes can lead to a more realistic evaluation of uncertainty. In fact, empirical approaches are substantially based on experimental data and long-term experience, thus reflecting the conventional practice.
Application of the Traceability Concept in Determining the Mechanical …
299
Results The statistical model, forming the basis of uncertainty evaluation methods, can be written in the form of Eq. (1) of ISO 21748:2017: R m = R + ξ Rm +
∑
ci xi' + g Rm + e Rm ,
(1)
where Rm
R ξ Rm xi' ci g Rm e Rm
is the measurement result, for which it is assumed that it can be calculated by , Pmax is the maximum force preceding the corresponding function (Rm = PFmax 0 the rupture of the sample, F0 is the initial cross-sectional area); is the (unknown) expected value of ideal results; is the bias due to traceability; is excursion xi ; is the sensitivity factor equal to ∂∂Rxmi ; is rounding of the measurement result according to GOST 1497-84; is a random component of measurement uncertainty under repeatability conditions.
It was assumed that xi' are normally distributed with a zero expected value and variance u 2 (xi ). Given the model described by Eq. (1), the uncertainty of measuring Rm was evaluated using Eq. (2): ( ) ( ) ( ) u 2 (Rm ) = u 2 ξ Rm + c2 (Pmax )u 2 (Pmax ) + c2 (d0 )u 2 (d0 ) + u 2 g Rm + u 2 e Rm ) ) ( ( ( ) ( ) ( ) 4 2 2 8Pmax 2 2 = u 2 ξ Rm + u u (d0 ) + u 2 g Rm + u 2 e Rm , + − (P ) max 2 3 π d0 π d0 (2) where ( ) u 2 ξ Rm is the uncertainty caused by the uncertainty of the estimate obtained based ( ) on the measurements of the reference material with the certified value; u 2 (xi' ) is the uncertainty corresponding to xi' ; u 2 (g Rm ) is the uncertainty due to rounding of the measurement result; u 2 e Rm is the random component of the uncertainty of measuring the reference material under repeatability conditions. The uncertainty, corresponding to the bias due to traceability, can be given by Eq. (3): )2 ( ( ) RmG S O − R m 2 u ξ Rm = u (RmG S O ) + , 3 2
(3)
300
I. N. Matveeva et al.
where u 2 (RmG S O ) is the uncertainty corresponding to the certified value RmG S O used to assess the correctness in a joint study. If a reference material was tested n times ( ) (at least 3 times), the recommended procedure for evaluating the limits of u 2 e Rm is as follows: (a) determination of the mean R m and the standard deviation s R m ; (b) determination of the confidence interval of the mean according to formula (4): ( ) s R t(P, f ) u e Rm = m √ , n
(4)
where is Student’s coefficient; P is the confidence level; f = (n − 1) is the number of degrees of freedom; n is the number of measurements. For P = 0.7 and n = 3, t = 1.386. t
Table 2 represents an example of calculating the uncertainty budget of measuring the “ultimate stress” characteristic.
Discussion An analysis of the uncertainty budget presented in Table 2 distinguishes four equivalent contributions to the combined standard uncertainty: the RM original diameter of the parallel length of a circular test piece, rounding of the result, traceability to an approved type RM, and the random component of measurements under repeatability conditions. Let us consider each of the components individually. The contribution from the initial RM diameter is caused by the tolerance for the diameter of the test piece, equal to 0.10 mm by GOST 1497-84. This contribution, in accordance with JCGM 106:2012 [15], describes the global risk for an object (sample) selected randomly from the production process. The decision about accounting for this contribution should be taken depending on the object under assessment: an individual sample or a test procedure implemented using certain equipment in a laboratory. The requirement of GOST 1497-84 to account for the contribution from the rounding procedure, equal to 10 N/mm2 , is apparently related to the past practice of applying tensile testing machines based on analog signals, which exhibit insufficient sensitivity to dynamic force variations during testing. When contemporary tensile testing machines based on digital signals are used, this contribution can be neglected. The contribution from the random component of RM measurements under the repeatability conditions typically describes the quality of the operator’s work and random effects, occurring during the test procedure in a laboratory using certain equipment, since the material heterogeneity is already taken into account in RM
Designation
Result rounding
Maximum force
( ) u g Rm
u(Pmax ) c(Pmax )
Original u(d0 ) diameter of the c(d0 ) parallel length of a circular test piece
Source of uncertainty
Δd0 √ 3
Rm Pmax
c(Pmax ) =
( ) u g Rm =
g √Rm 12
c(Pmax )u(Pmax )
Δ Rm √ 3
u(Pmax ) =
c(d0 )u(d0 )
c(d0 ) = −2 Rdm0
u(d0 ) =
Formula
Table 2 Uncertainty budget of measuring the “ultimate strength” characteristic
Table 2 GOST 1497-87 g Rm = 10 N/mm2 for σ > 500 N/mm2
Rm = 570 N/mm2 Pmax = 45120 N
Limit of the permissible relative error of the force measurement ΔP P = ±0.5%
Rm = 570 N/mm2 d0 = 10.06 mm
570 45120
= 130 = 0.0126
45120·0.005 √ 3
( ) u g Rm =
N 1.64 mm 2
√10 12
= 2.88 N/mm2
(continued)
c(Pmax )u(Pmax ) = 130 · 0.0126 =
c(Pmax ) =
u(Pmax ) =
Pmax = 45120 N
c(d0 )u(d0 ) = 113·0.0577 = 6.52 N/mm2
√ = 0.0577 Table 8 GOST u(d0 ) = 0.10 3 1497-87 570 = −2 c(d ) 0 Δd0 = ±0.10 mm 10.06 = −113
Applied variables, Example parameters
Application of the Traceability Concept in Determining the Mechanical … 301
( ) u e Rm
Rm , s Rm
Mean and MSE of CRM measurements
Random component of the uncertainty of measuring a GSO under repeatability conditions
Designation
Source of uncertainty
Table 2 (continued)
1 3
i=1
= i=1
3 ∑
R mi
n )2 1 ∑( R mi − R m n−1
R mi
s R m t(P, f ) √ n
i=1
=
s R m t0.7,2 √ 3
┌ | 3 | 1 ∑( )2 =√ R mi − R m 2
( ) u e Rm =
s Rm
n
i=1
∑n
┌ | | =√
Rm =
Formula
t0.7,2 = 1.386 for n=3
R mi —single measurement of a GSO n—number of GSO measurements (n = 3)
( ) u e Rm =
5·1.386 √ 3
= 4 N/mm2
(continued)
Measurement results (465; 470; 475) N/mm2 R m = 470 N/mm2 / ( ) s R m = 21 52 + 0 + 52 = 5 N/mm2
Applied variables, Example parameters
302 I. N. Matveeva et al.
/
u 2 (R
( RmG S O −R m )2 mG S O ) + 3
U (RmG S O ) 2
U (Rm ) = t0.95,νe f f · u(Rm )
U (Rm )
Expanded uncertainty
( (
) + u 4 (ξ Rm ) + u 4 (e Rm ) ) ν (ξ R m ) ν (e R m )
u 4 (Rm )
νe f f
Effective number of the degrees of freedom
4 u 4 (Pmax ) u 4 (d0 ) u g Rm ν(Pmax ) + ν (d0 ) + ν g Rm
νe f f =
u(Rm )
u(Rm ) = / ( ) ( ) ( ) c2 (Pmax )u 2 (Pmax ) + c2 (d0 )u 2 (d0 ) + u 2 g Rm + u 2 ξ Rm + u 2 e Rm
( ) u ξσinst =
u(RmG S O ) =
Formula
Combined standard uncertainty
( ) u ξ Rm
RmG S O u(RmG S O )
Certified GSO value and its uncertainty (Based on the GSO certificate)
Traceability to GSO
Designation
Source of uncertainty
Table 2 (continued)
t0.95,νe f f = 4.303
6 2
=
=
65536 40787
= 1.6
U (Rm ) = 4.303 · 16.0 = 69 N/mm2
16.04 4 44 0+0+0+ 14.2 1 + 2
u(R √ m) = 6.522 + 1.642 + 2.882 + 42 + 14.22 = 16.0 N/mm2
(446−470)2 3
= 3 N/mm2
( ) / u ξ Rm = 32 + 14.2 N/mm2
u(RmG S O ) =
ν(Pmax ) = ∞ νe f f = ν(d0 ) = ∞ ( ) ν g Rm = ∞ ( ) ν ξ Rm = 2 − 1 = 1( ) ν e Rm = 3−1=2
U (RmG S O ) = 6 N/mm2 is the value of the expanded uncertainty of the GSO according to the certificate
RmG S O = 446 N/mm2
Applied variables, Example parameters
Application of the Traceability Concept in Determining the Mechanical … 303
304
I. N. Matveeva et al.
metrological characteristics. In the considered example, the estimate of the contribution is equal to 4 N/mm2 . It is assumed that it is necessary to evaluate the random component for each “operator-tensile machine” system. The contribution from traceability to the RM includes a systematic component, connected with the implementation of the test procedure in a laboratory, including due to the algorithms of tensile testing machine software, and RM heterogeneity. The main affecting factors can be preparatory operations prior to testing (resetting to zero of force and strain sensors, sample fastening type, preliminary loading value), assigned test conditions (deformation rate or loading rate), calculation errors, including in the algorithms of built-in software [8]. The testing rate used in practice is typically close to the maximum values, permitted by the test procedure, since it is necessary to conduct the maximum number of tests per one operator’s work shift. However, the following implicit assumptions are ignored. On the one hand, GOST 1497-84 is a static tensile test method, i.e., reliable results are obtained at a minimum testing rate. On the other, the calibration of tensile testing machines is performed in the static mode, while tests are conducted in the dynamic mode. Therefore, the recorded values of force and elongation may have a systematic error associated with the testing rate. In the analyzed example, the contribution due to traceability is equal to 14.2 N/mm2 . It is assumed that the systematic error should be evaluated for each existing tensile testing machine. The expanded uncertainty in the example has a value of 69 N/mm2 , which is due to the effective number of the degrees of freedom νe f f = 1.6. A reduction in the effective number of the degrees of freedom can be achieved using two approaches. The first is to reduce the systematic component by varying the testing rate. The second can be implemented given that the random component is not less than the contribution from traceability to a GSO.
Conclusion The use of an approved RM as a comparison base represents one of the basic tools for ensuring traceability and controlling the accuracy of mechanical property measurements. The approach based on uncertainty budgeting for the measurement Eq. (1) can be used by laboratories to properly assess the uncertainty of the results of measuring mechanical property characteristics, taking into account the combined effect of all uncertainty sources, as well as the bias due to traceability. The practical significance of the study lies in the possibility of applying the modeling approach of theoretical concepts based on ISO/IEC Guide 98-3:2008 and calculation algorithms provided in ISO 21748:2017 (Eq. 1) by accredited laboratories when evaluating uncertainty according to clause 7.6 of GOST ISO/IEC 17025-2019 [16]. Acknowledgements The authors express their gratitude to Mikhail A. Chesnokov, Chief Metallurgist of JSC «Uralturbo», for the technical assistance provided during testing of the reference
Application of the Traceability Concept in Determining the Mechanical …
305
material for the purpose of type approval. The research did not receive financial support in the form of a grant from any organization in the public, commercial or non-profit sector. Author Contributions Matveeva I. N.—implementation of formal analysis, research work, creation of visual materials; Tolmachev V. V.—development of the research concept, implementation of formal analysis; Zabelina A. A.—research work. Conflict of Interest The article was prepared on the basis of a report presented at the V International Scientific Conference “Reference Materials in Measurement and Technology” (Yekaterinburg, September 13–16, 2022). The article was admitted for publication after the abstract was revised, the article was formalized, and the review procedure was carried out. The version in the Russian language is published in the journal “Measurement Standards. Reference Materials” 2023;19(1):29–40. (In Russ.). https://doi.org/10.20915/2077-1177-2023-1941-50-40.
References 1. GOST 1497-84 (2008) Metals. Methods of tension test. Standartinform, Moscow (in Russian) 2. Bahng GW, Kim JJ, Lee HM, Huh YH (2010) Establishment of traceability in the measurement of the mechanical properties of materials. Metrologia 47(2):32–40. https://doi.org/10.1088/ 0026-1394/47/2/S04 3. Roebben G, Linsinger TPJ, Lamberty A, Emons H (2010) Metrological traceability of the measured values of properties of engineering materials. Metrologia 47(2):23–31. https://doi. org/10.1088/0026-1394/47/2/S03 4. Bahng GW, Cho SJ, Lee HM (2007) A technical approach to establish traceability in materials metrology. Mapan J Metrol Soc India 22(3):145–151 5. Adamczak S, Bochnia J, Kundera C (2012) Stress and strain measurements in static tensile tests. Metrol Meas Syst 19(3):531–540. https://doi.org/10.2478/v10178-012-0046-3 6. Czichos H, Saito T, Smith L (eds) (2011) Springer handbook of metrology and testing. Springer, Berlin, p 1229. https://doi.org/10.1007/978-3-642-16641-9 7. Aydemir B, Cal B (2011) Quality of material tensile test. In: Collection of works 5th international quality conference center for quality. Faculty of Mechanical Engineering, University of Kragujevac, Kragujevac, 20 May 2011, pp 331–336 8. Tolmachev VV, Matveeva IN (2022) The current state of metrological support for static tension tests. Meas Stand Ref Mater 18(1):51–67 (in Russian). https://doi.org/10.20915/2077-11772022-18-1-51-67 9. ISO/IEC Guide 98-3:2008 (2018) Uncertainty of measurement. Part 3. Guide to the expression of uncertainty in measurement 10. ISO 21748:2017 Guidance for the use of repeatability, reproducibility and trueness estimates in measurement uncertainty evaluation 11. JCGM 200:2012 (2012) International vocabulary of metrology—basic and general concepts and associated terms (VIM), 3rd ed. BIPM, p 108. Available via BIPM. https://www.bipm.org/ documents/20126/2071204/JCGM_200_2012.pdf/f0e1ad45-d337-bbeb-53a6-15fe649d0ff1. Accessed 15 Oct 2022 12. GOST 2590-2006 (2010) Round hot-rolled steel bars. Dimensions. Standartinform, Moscow, p 12 (in Russian) 13. GOST 1050-2013 (2014) Metal products from nonalloyed structural quality and special steels. General specification. Standartinform, Moscow, p 36 (in Russian) 14. Measurement uncertainty revisited: alternative approaches to uncertainty evaluation: Technical report 2007. no. 1, Paris, EUROLAB, p 62. Available via EUROLABDeutschland. https://eurolab-d.de/files/measurement_uncertainty_revisited_-_alternative_app roaches_to_uncertainty_evaluation.pdf. Accessed 15 Oct 2022
306
I. N. Matveeva et al.
15. JCGM 106:2012 (2012) Evaluation of measurement data—the role of measurement uncertainty in conformity assessment. BIPM, p 57. Available via BIPM. https://www.bipm.org/doc uments/20126/2071204/JCGM_106_2012_E.pdf/fe9537d2-e7d7-e146-5abb-2649c3450b25. Accessed 15 Oct 2022 16. GOST ISO/IEC 17025-2019 (2021) General requirements for the competence of testing and calibration laboratories. Standartinform, Moscow, p 28 (in Russian)
Metrological Support for Titration Isothermal Calorimetry: Prospects for the Development of Certified Reference Materials Karina A. Mishina
Abstract Isothermal titration calorimetry is used to study the thermal effects of chemical and physicochemical processes. The wide application of this method has revealed a number of problems. Among them is insufficient metrological support for isothermal titration calorimeters, which leads to inconsistency of the results obtained using different models of calorimeters. The electrical and chemical procedures currently used for calibrating calorimeters have several limitations. This work aims to develop an approach to creating certified reference materials (CRMs) for the unit of heat quantity of physical and chemical interactions having metrological traceability to the main SI units. An analysis of the state of metrological support in isothermal titration calorimetry measurements was carried out. The basic requirements for CRM candidate substances were formulated. The target uncertainty of the integral heat of dilution of propan-1-ol solutions was estimated by analyzing the characteristics of measuring instruments, which allowed the requirements for the measurement method used to characterize CRMs to be specified. A method for determining the certified value of integral heat of dilution traceable to the GET 133 State Primary Special Standard of the unit of heat quantity in the field of solution and reaction calorimetry was proposed. Keywords Isothermal titration calorimetry · Measurement uncertainty · Chemical calibration · Certified reference materials · Primary standard
Abbreviations GET 133-2012 CRM
State Primary Special Standard of the unit of heat quantity in the field of solution and reaction calorimetry Certified reference material
K. A. Mishina (B) D. I. Mendeleyev Institute for Metrology (VNIIM), Saint Petersburg, Russia e-mail: [email protected]
© D. I. Mendeleyev Institute for Metrology 2024 E. P. Sobina et al. (eds.), Reference Materials in Measurement and Technology, https://doi.org/10.1007/978-3-031-49200-6_20
307
308
MI ITC SD
K. A. Mishina
Measuring instrument Isothermal titration calorimetry Standard deviation
Introduction Isothermal titration calorimetry (ITC) is a relatively new method for determining the heat of chemical and physicochemical interactions, which has become commercially available since the 1990s. In recent years, the ITC method has been gaining popularity in chemical, medical, and biological research [1–5]. An essential advantage of ITC consists in its ability to study the entire thermodynamic profile of the process during one experiment, including the binding affinity and changes in the enthalpy, entropy, and Gibbs free energy [2]. Every year, more than 500 publications present the results of scientific research obtained using ITC. About 80% of these publications relate to studies of biomolecular interactions: proteins with other proteins, metal ions, fats, nucleic acids, and carbohydrates [2–4]. At the same time, the ITC application is constantly expanding to cover, e.g., enzyme kinetics and medicine characterizations. In [5], Prozeller et al. reported studies of protein and nanoparticle interactions. In light of the growing spectrum of ITC application, as well as tightening requirements for the accuracy and reliability of ITC measurements, the issues of metrological support for isothermal titration calorimeters are attracting increased attention. At present, the accuracy of calorimeters is assured mostly by electrical calibration with subsequent verification using the chemical and physical interactions with known values of thermal effects. Such interactions include chemical reactions, processes of dissolving pure substances or diluting their solutions, and are generally referred to as calibration, test [6], or standard reactions [7]. In this paper, the term “standard reactions” is used. Mention should be made that the current calibration practice is associated with serious metrological problems. Thus, the authors in [8, 9] observed significant differences in the thermal effect of the reaction obtained using different models of calorimeters. The researchers paid attention to discrepancies between the obtained values and those reported in literature, exceeding the claimed uncertainty estimates in some cases. In [12], Myszka et al. presented the results of ABRF-MIRG interlaboratory comparisons, which showed the standard deviation of the reaction thermal effect obtained by the participants to reach about 20%. This value significantly exceeded the accuracy levels stated by laboratories. Some researchers [13, 14] explain such discrepancies with differences in starting materials and procedures for their preparation, emphasizing the need for a primary standard with sufficient stability and accessibility for users, i.e., meeting the requirements for certified reference materials (CRMs). In addition, comparative studies of electrical and chemical calibration procedures [13, 14], as well as recommendations
Metrological Support for Titration Isothermal Calorimetry: Prospects …
309
of the International Union of Pure and Applied Chemistry (IUPAC) [6], show that the use of standard reactions in chemical calibration enables a more accurate determination of the effective cell volume and the energy equivalent of a calorimeter. The IUPAC report [6] suggested a number of reactions that could be used as the standard reaction. At the same time, the possibility of using many of the standard reactions given in literature is limited due to the discrepancy between the thermal effect of the reaction and the operating range and application area of the calorimeter, the risk of contamination of the sample syringe and measuring cell, the lack of commercially available materials, etc. The use of standard reactions is also recommended by manufacturers of measuring instruments (MIs). Thus, the MicroCal and TA Instruments propose sets of reagents (test kits) of their own production in the microcalorimeter operation guidelines. It should be mentioned that these sets are not reference materials per se, as their homogeneity and stability are not guaranteed, nor is the direct traceability to the reference value taken from literature sources. Another question is how the reference measurand value and its uncertainty are determined, since the information on sample preparation and measurement procedures is lacking in the majority of cases. It is noteworthy that the data presented in [7, 8, 13, 16, 17] should be used as reference values with some caution, since previously obtained results may have been subject to systematic effects and presented with a significantly underestimated uncertainty. For example, this may result from the negligence of such important components, as the titrant concentration. Therefore, assessment of the uncertainty of isothermal titration calorimeter measurements represents a relevant research problem attracting the attention of both MI manufacturers [13] and scientific organizations [8, 17–20]. An analysis of published literature and FIF EUM1 data reveals the lack of metrological instruments for ensuring the uniformity of titration calorimetry measurements. This requires CRMs with the certified value of the heat of dissolution, dilution, and reactions capable of ensuring the traceability of measurements to SI units and intended for validating and calibrating MI, as well as for assuring the accuracy of certified and standardized procedures. The present research is aimed at developing a general approach to creating CRMs for the unit of heat of dilution with the established metrological traceability to the main SI units. To this end, the following research objectives were formulated: to review available publications; to justify the selection of candidate substances for CRMs; to determine the procedure for CRM certification; to conduct type-approval tests; and to establish the metrological characteristics of CRMs. In the course of the work, candidate substances were selected based on the conducted literature review; the requirements for CRMs and their target uncertainty were determined; and a measurement method to assess the CRM uniformity and
1
Federal Information Fund for Ensuring the Uniformity of Measurements. Available via FIF EUM. https://fgis.gost.ru/fundmetrology. Accessed 4 August 2022 (In Russ.).
310
K. A. Mishina
stability was proposed. As a result of improving GET 133-2012,2 its functional and measuring capabilities were extended to microcalorimetric measurements. This allowed the use of direct measurements based GET 133-2012 equipment for CRM characterization. The proposed approach was tested on selected candidate CRM substances.
Materials and Methods Project Design The research project was designed taking into account the recommendations of ISO Guide 35 [21]. The developed plan included the following stages: determination of candidate materials for CRM; determination of CRM target uncertainty; planning of experiments, selection and testing of characterization methods and instruments; planning of experiments and selection of methods and instruments for CRM homogeneity and stability studies; homogeneity and stability studies; CRM characterization; uncertainty estimation of the certified value. The CRM material was selected based on a review of publications reporting the use of standard reactions. The advantages and disadvantages of candidate substances, as well as the experience of their practical application, were considered. The evaluation of the target uncertainty of the CRM was carried out based on a study of the application area and characteristics of microcalorimeters stated by their manufacturers, an analysis of interlaboratory experiments, as well as the information on the metrological characteristics of MIs presented in publications. The experimental design, along with the selection and testing of characterization procedures, were developed based on the target uncertainty of CRM. The selection of methods and instruments for studying the CRM uniformity and stability was carried out taking into account the repeatability standard deviation when estimating the thermal effect of the reaction. Future research stages will focus on the CRM uniformity and stability, its characterization, and the assessment of the CRM certified value uncertainty.
2
GET 133-2012 State Primary Special Standard of the unit of heat quantity in the field of solution and reaction calorimetry: Custodian Institute D. I. Mendeleyev Institute for Metrology. Available via FIF EUM. https://fgis.gost.ru/fundmetrology/registry/12/items/397821 2. Accessed 4 August 2022 (In Russ.).
Metrological Support for Titration Isothermal Calorimetry: Prospects …
311
Equipment Preliminary experimental studies were carried out using an MKT reference titration microcalorimeter (VNIIM, Russia) and a NanoITC SV microcalorimeter-comparator (TA Instruments, USA) from the GET 133-2012 composition. The MKT microcalorimeter is a heat flow differential titration microcalorimeter. This installation consists of a two-cell measuring calorimeter unit (sample and reference cells), a dosing system, a temperature monitoring system, a measurement process monitoring system, and an information collection and processing system. The OriginPro 2022B software package is used for processing experimental data. The appearance of the assembled MKT microcalorimeter is shown in Fig. 1. The MKT metrological characteristics include the following values (Table 1): the range of heat quantity, across which the unit is reproduced under special conditions; standard deviation (SD) of estimating the measured value S 0 under the number of independent measurements n, non-excluded systematic error Θ 0 , the total standard deviation of the measured value S 0Σ , tolerance limits of measurement error Δ0Σ , type A standard uncertainty u0A , type B standard uncertainty u0B , combined standard uncertainty u0C , and expanded uncertainty U 0 with the coverage factor k = 2. Fig. 1 MKT reference titration microcalorimeter from GET 133-2012
312
K. A. Mishina
Table 1 Metrological characteristics of the MKT microcalorimeter from GET 133-2012 Measurement error Physical quantity
Range of values, µJ
S0 , %
Θ 0 , % at P = 0.95
S 0Σ , %
Δ0Σ , % at P = 0.95
Heat quantity
100–5000
0.2 ÷ 4.0 (n = 10)
0.8 ÷ 2.9
0.5 ÷ 4.3
1.0 ÷ 8.6
Measurement uncertainty Physical quantity
Range of values, µJ
u0A , %
u0B , %
u0C , %
U 0 , % at k = 2
Heat quantity
100–5000
0.2 ÷ 4.0 (n = 10)
0.4 ÷ 1.5
0.5 ÷ 4.3
1.0 ÷ 8.6
CRM Candidate Materials When selecting candidate substances for CRM development, the following basic requirements were formulated: • candidate materials must ensure the possibility of the standard reaction under a given heat release across the respective range; • candidate materials must be chemically stable during storage and sample preparation; • candidate materials should not cause side chemical reactions with the solvent and calorimeter materials; • candidate materials of the required purity must be commercially available. The problem of selecting suitable CRM materials was studied in a number of works, e.g., in [6, 22]. The reported results of theoretical and practical studies of standard reactions were taken into accound when selecting a CRM candidate substance. Since the aim of the present study was to develop CRMs for assessing the metrological characteristics of MIs, standard reactions requiring complicated sample preparation techniques and intended for a comprehensive quality assurance of microcalorimetric measurement procedures were not considered. For this research, the reactions of barium salts with dibenzo-18-crown-6 and calcium chloride with ethylenediaminetetraacetic acid were identified as promising. Neutralization reactions were also excluded from consideration, as they may be affected by dissolved CO2 . Moreover, substances for such reactions may be corrosively active against some calorimeter materials. In this work, for the development of CRMs for the unit of heat, the dilution reaction of propan-1-ol solutions in water was selected as the standard reaction due to the availability of domestically produced high-purity materials and the simplicity of data preparation and processing techniques. Solutions of different concentrations can be used to evaluate the metrological characteristics of MIs across the entire measurement range.
Metrological Support for Titration Isothermal Calorimetry: Prospects …
313
Table 2 Characteristics of candidate substances Reference material (RM)
Certified characteristic
Value of the certified characteristic
RM for the composition of propan-1-ol solution, GSO 11383-20193
Mass concentration of propan-1-ol
(4.00 ± 0.04) g/dm3
RM for the composition of propan-1-ol, SOP 0023-03
Mass fraction of propan-1-ol
(99.9 ± 0.1) %
Table 2 presents commercial products made from propan-1-ol selected as CRM candidate substances. In order to prepare samples of a given concentration from starting solutions, a procedure that included estimation of uncertainty when determining the concentration of the resultant solutions was developed in accordance with the EUROCHEM/ CITAK CG 4 Guideline [23]. Solutions for preliminary experimental studies were prepared by the gravimetric method without subsequent control by other methods. Pure propanol (RM for the composition of propan-1-ol, SOP 0023-03) was prepared according to the instructions for handling and use given in the RM passport and cooled for at least 1 h at a temperature of 2–6 °C. A solution with a 2% mass fraction was prepared using 2 g of propanol and 98 g of deionized water, which was obtained using a UPVA-5-1 bidistillator (Livam, Russia) as part of GET 133-2012. Sartorius ME 235s scales were used for weighting sample portions.
Results and Discussion Defining Target Uncertainty The operation principle of ITC is described in detail in [2]. The general calorimeter scheme is outlined in Fig. 2. A typical isothermal titration calorimeter consists of two—sample and reference—cells. The control system monitors the cell temperature such that the temperature difference between the cells was close to zero. When a sample is fed into the sample cell, the resulting chemical process is accompanied by a release or absorption of heat, which alters the temperature in the sample cell. The operation of such calorimeters is based on the measurement of the thermoelectric force arising in the thermopile under the passage of a thermal flow from the sample cell to the large metal calorimeter block of the calorimeter.
3
GSO 11383-2019 materials of the composition of propanol solution 1. Available via FIF EUM. https://fgis.gost.ru/fundmetrology/registry/19/items/812255. Accessed 4 August 2022 (In Russ.).
314
K. A. Mishina
Fig. 2 General scheme of an isothermal titration microcalorimeter
Despite the similar principle of operation, the design of various working microcalorimeters is characterized by the following differences: the principle of power compensation; the material, shape, and volume of the calorimeter cells; the design of the sample feeding equipment and stirrer. These differences significantly affect the technical and metrological characteristics of the microcalorimeter. At the same time, manufacturers do not specify the measurement accuracy of the thermal effects of reactions in their official documentation. Therefore, the CRM target uncertainty was estimated based on a review of literature data on the measurement results obtained by modern microcalorimeters, on the estimated standard uncertainty (Table 3), interlaboratory standard deviation from the results of interlaboratory experiments (Table 4), and the standard deviation of repeated observations (Table 5). The researchers in [16] assumed that an uncertainty of about 2% could be achieved when measuring the thermal effect of a reaction. At the same time, a significant dispersion of uncertainty estimates of up to 20% was observed depending on the experimental conditions and data processing methods. Taking into account the more common uncertainty estimates in other publications [17, 24–27] and the typical intralaboratory standard deviation of 1–2%, it was decided to take an approximate relative standard uncertainty of the measurements of the reaction heat effects equal to 4.5%. The target uncertainty of the developed CRM was set at 1.5%, taking into account the required 1:3 ratio of the verification means to the verifiable MI.
Metrological Support for Titration Isothermal Calorimetry: Prospects …
315
Table 3 Measurement uncertainty of the thermal effect of a reaction using microcalorimeters, according to the published data Thermal effect Standard uncertainty of measurements of the thermal of reaction, effect of reaction, u (ΔH), kJ/ ΔH, kJ/mol mol*
Relative standard uncertainty of measurements of the thermal effect of reaction, u0 (ΔH), %*
Source
− 26.6
1.1
4.1
[24]
8.8 ÷ 43.0
0.9**
4.9**
[25]
0.5 ÷ 46.6
0.3**
− 8.8***
1.3
4.4**
[26]
14.3
[17]
46.5***
2.3
5.0
[27]
27.2***
0.5
2.0
[16]
Notes *—the calculation of the uncertainty value given in the source to another form of expression was carried out in accordance with the equations: u 0 (X ) =
u(X ) , X
U = k · uC , **—the value was obtained as the average of the given results. ***—the value was recalculated from kcal/mol to kJ/mol by multiplying by a coefficient of 4.1868.
Table 4 Interlaboratory standard deviation of measurements of the thermal effect of a reaction using microcalorimeters, according to the published data Thermal effect of reaction, ΔH, kJ/mol
Number of participants
SD, kJ/mol
Relative SD, %
Source
− 43.5
14
10.5
24
[10]
− 17.5 15.0
12 12
0.4 0.4
2.3 2.6
[14]
− 9.26 − 8.53
7 6
0.7 0.35
7.5 4.1
[13]
The established metrological and technical requirements for the developed CRMs are shown in Tables 6 and 7.
Methods and Instruments for Studying Uniformity and Stability In accordance with clause 7.5.1 of ISO Guide 35 [21], the method used in the study of uniformity must have good repeatability, i.e., the following equation must be fulfilled:
316
K. A. Mishina
Table 5 Standard deviation of measurements of the thermal effect of a reaction using microcalorimeters, according to the published data Thermal effect of reaction, ΔH, kJ/mol
SD, kJ/mol
Relative SD, %
Source
− 28.8 ÷ − 32.9*
0.3
0.8
[28]
− 27.5 − 20.4
1.1 0.7
4.0 3.4
[29]
55 − 9.07 − 17.4
1 0.05 0.2
2 0.6 1
[18]
− 50.7*
1.7
3.5
[9]
− 46.0
1.2
2.6
[8]
− 1.540 − 0.604 − 0.196
0.01 0.01 0.01
0.7 1.8 2.8
[15]
− 59.5
3.3
5.5
[30]
− 17.5* 15.0*
0.4 0.2
2.1 1.1
[14]
* —the
value was recalculated from kcal/mol to kJ/mol by multiplying by a coefficient of 4.1868
Table 6 CRM certified characteristic, certified value range, and expanded uncertainty range Index of the CRM in the set
Certified value range of the integral heat of dilution, ΔH 0 m , kJ/mol
Relative expanded uncertainty (U) with the coverage factor k = 2, %
ITR-VNIIM-2
− 0.190 ÷ − 0.210
3.0
ITR-VNIIM-5
− 0.600 ÷ − 0.640
3.0
ITR-VNIIM-10
− 1.530 ÷ − 1.560
3.0
Table 7 Technical characteristics of initial materials RS index in the set
Initial substance
Documents regulating the initial substance
ITR-VNIIM-2 ITR-VNIIM-5 ITR-VNIIM-10
CRM for the composition of propan-1-ol, SOP 0023-03
TU 2631-031-56278322-2008
u trg sr , √ = 3 n where sr is the standard deviation of method repeatability, %; n is the number of experiments; utrg is the CRM target uncertainty, %.
(1)
Metrological Support for Titration Isothermal Calorimetry: Prospects …
317
An analysis of standard deviations of repeatability shows that sr = 1% can be achieved under optimal conditions. Therefore, Eq. (1) is fulfilled when n ≥ 4. This assumption was experimentally tested using a NanoITC SV comparator microcalorimeter in a series of experiments to measure the thermal effect of the reaction of calcium chloride and ethylenediaminetetraacetic acid. The obtained average value was −17.58 kJ/mol with an SD of 0.05 kJ/mol (0.3%). When selecting a method for studying stability, its repeatability according to (1) was taken into account. The stability of the measuring system was also considered, due to the long-term nature of stability studies. The stability of the measuring system was considered sufficient when fulfilling the equation: |X t1 − X t0 | X
· 100% ≤
u trg , 3
(2)
where X t1 , X t0 are measurement results at points in time t1 , t0 , accordingly; X is the average of measurement results. The stability study is planned to last for 6 months, according to the conventional approach. The same period was set for assessing the stability of the measuring system. The stability of the measuring system was experimentally tested for an NanoITC SV comparator microcalorimeter in an experiment to measure the thermal effect of the reaction of calcium chloride and ethylenediaminetetraacetic acid. The received deviation |X t1 − X t0 | was 0.07 kJ/mol (0.4%). The conducted studies confirmed the applicability of the NanoITC SV comparator microcalorimeter when studying the uniformity and stability of CRMs.
Testing the Method of CRM Characterization The CRM characterization was carried out by the method of direct measurements using the MKT microcalorimeter from GET 133. The method was tested by measuring the integral heat of dilution of a 2% propan-1-ol solution (n = 2). The obtained value of the integrated heat of dilution was −0.200 kJ/mol. The expanded uncertainty estimated based on the characteristics of the MKT microcalorimeter was 1.4%, which meets the requirements for the CRM target uncertainty under the condition of confirmed uniformity and stability. The obtained results were validated by comparing the measurement results obtained by the MKT calorimeter from GET 133-2012 and literature data [6, 15] obtained by precision calorimetric installations. The results obtained at CIQ-UP (Portugal) are given in accordance with [15]. The uncertainty shown in Fig. 3 is represented by two standard deviations. The results obtained at the Lund University (Sweden) are calculated in accordance with the
318
K. A. Mishina
Fig. 3 Comparative analysis of the integral heat of dilution of a 2% propan-1-ol solution
equation given in [6]. The uncertainty shown in Fig. 3 is represented by two standard deviations of the mean value. The comparison of the integral heat of dilution determined in this study with literature data shows their good agreement. The method of direct measurements using an MKT microcalorimeter can be considered applicable for CRM characterization.
Conclusion When measuring the thermal effects of reactions using isothermal titration microcalorimeters, the results obtained by different MI models frequently disagree with those reported in literature. The present work aimed to contribute to metrological support in this field by launching research into the development of CRMs with the certified value of the integral heat of dilution having established metrological traceability. The research design included selection of initial materials, assessment of the target uncertainty of the heat of dilution, and establishment of requirements for CRMs. To meet these requirements, the methods for homogeneity and stability studies were selected, and a direct method of CRM characterization was proposed and tested, providing traceability to the GET 133 State Primary Special Standard of the unit of heat quantity in the field of solution and reaction calorimetry. In order to complete the
Metrological Support for Titration Isothermal Calorimetry: Prospects …
319
CRM development, future works will include experimental studies into characterization and evaluation of the CRM homogeneity and stability, as well as estimation of the uncertainly of the certified value. The theoretical significance of the research consists in the development of a basic approach to ensuring the traceability and uniformity of ITC measurements using CRMs as a mean of unit transfer and a reference microcalorimeter for their characterization. The practical significance is directly related to the development and application of CRMs intended for the verification and calibration of MIs and accuracy assurance of certified and standardized techniques. Their implementation is expected to increase the accuracy and reliability of measurement results obtained by isothermal titration calorimeters. Acknowledgements The study was carried out as part of the improvement of the GET 133-2012 State Primary Special Standard of the unit of heat quantity in the field of solution and reaction calorimetry. The measurements were performed using the facilities of D. I. Mendeleyev Institute for Metrology. Conflict of Interest The article was prepared on the basis of a report presented at the V International Scientific Conference “Reference Materials in Measurement and Technology” (Yekaterinburg, September 13–16, 2022). The article was admitted for publication after the abstract was revised, the article was formalized, and the review procedure was carried out. The version in the Russian language is published in the journal “Measurement Standards. Reference Materials” 2023;19(3):31–43. (In Russ.). https://doi.org/10.20915/2077-1177-2023-193-31-43.
References 1. Sarge SM, Höhne GWH, Hemminger W (2014) Calorimetry: fundamentals, instrumentation and applications. Wiley-VCH Verlag GmbH & Co. KGaA, Weinheim, p 280. https://doi.org/ 10.1002/9783527649365 2. Kabiri M, Unsworth L (2014) Application of isothermal titration calorimetry for characterizing thermodynamic parameters of biomolecular interactions: peptide self-assembly and protein adsorption case studies. Biomacromolecules 15:3463–3473. https://doi.org/10.1021/ bm5004515 3. Falconer RJ, Penkova A, Jelesarov I, Collins BM (2010) Survey of the year 2008: applications of isothermal titration calorimetry. J Mol Recognit 23(5):395–413. https://doi.org/10.1002/jmr. 1025 4. Falconer RJ, Collins BM (2011) Survey of the year 2009: applications of isothermal titration Calorimetry. J Mol Recognit 24(1):1–16. https://doi.org/10.1002/jmr.1073 5. Prozeller D, Morsbach S, Landfester K (2019) Isothermal titration calorimetry as a complementary method for investigating nanoparticle–protein interactions. Nanoscale 11(41):19265– 19273. https://doi.org/10.1039/c9nr05790k 6. Wadso I, Goldberg RN (2001) Standards in isothermal microcalorimetry. Pure Appl Chem 73(10):1625–1639. https://doi.org/10.1351/pac200173101625 7. Rafols C et al (2016) The Ca2+ –EDTA chelation as standard reaction to validate Isothermal Titration Calorimeter measurements (ITC). Talanta 154:354–359. https://doi.org/10.1016/j.tal anta.2016.03.075
320
K. A. Mishina
8. Baranauskiene L, Petrikait˙e V, Matulien˙e J, Matulis D (2009) Titration calorimetry standards and the precision of isothermal titration calorimetry data. Int J Mol Sci 10(6):2752–2762. https://doi.org/10.3390/ijms10062752 9. Paketuryt˙e V, Linkuvien˙e V, Krainer G, Chen WY, Matulis D (2019) Repeatability, precision, and accuracy of the enthalpies and Gibbs energies of a protein–ligand binding reaction measured by isothermal titration calorimetry. Eur Biophys J 48(11):139–152. https://doi.org/10.1007/s00 249-018-1341-z 10. Dean JA (1999) Lange’s handbook of chemistry. McGraw-Hill Inc., New York, USA 11. Christensen JJ, Hansen LD, Izatt RM (1976) Handbook of proton ionizations heats. WileyInterscience, Hoboken, NJ, USA 12. Myszka DG, Abdiche YN, Arisaka F, Byron O, Eisenstein E, Hensley P (2003) The ABRFMIRG’02 study: assembly state, thermodynamic, and kinetic analysis of an enzyme/inhibitor interaction. J Biomol Tech 14(4):247–269 13. Demarse NA, Quinn CF, Eggett DL, Russell DJ, Hansen LD et al (2011) Calibration of nanowatt isothermal titration calorimeters with overflow reaction vessels. Anal Biochem 417(2):247– 255. https://doi.org/10.1016/j.ab.2011.06.014 14. Velazquez-Campoy A, Claro B, Abian O, Höring J, Bourlon L, Claveria-Gimeno R (2021) A multi-laboratory benchmark study of isothermal titration calorimetry (ITC) using Ca2+ and Mg2+ binding to EDTA. Eur Biophys J 50(3–4):429–451. https://doi.org/10.1007/s00249-02101523-7 15. Adao R, Bai GY, Loh W, Bastos M (2012) Chemical calibration of isothermal titration calorimeters: an evaluation of the dilution of propan-1-ol into water as a test reaction using different calorimeters, concentrations, and temperatures. J Chem Thermodyn 52:57–63. https://doi.org/ 10.1016/j.jct.2011.12.018 16. Kantonen SA, Henriksen NM, Gilson MK (2017) Evaluation and minimization of uncertainty in ITC binding measurements: heat error, concentration error, saturation, and stoichiometry. Biochimica et Biophysica Acta 1861(2):485–498. https://doi.org/10.1016/j.bbagen.2016. 09.002 17. Nguyen TH, Rustenburg AS, Krimmer SG, Zhang H, Clark JD, Novick PA et al (2018) Bayesian analysis of isothermal titration calorimetry for binding thermodynamics. PLoS ONE 13(9):1– 26. https://doi.org/10.1371/journal.pone.0203224 18. Hansen LD, Quinn C (2019) Obtaining precise and accurate results by ITC. Eur Biophys J 48(8):825–835. https://doi.org/10.1007/s00249-019-01399-8 19. Tellinghuisen J, Chodera JD (2011) Systematic errors in isothermal titration calorimetry: concentrations and baselines. Anal Biochem 414(2):297–299. https://doi.org/10.1016/j.ab. 2011.03.024 ˇ 20. Medoš Ž, Cobanov I, Bešter-Rogaˇc M, Šarac B (2021) Usually overlooked problems related with measurements of high-heat efects using power compensation isothermal titration calorimetry. J Therm Anal Calorim 145:87–96. https://doi.org/10.1007/s10973-020-096 63-2 21. ISO Guide 35:2017(E) (2017) Reference materials—Guidance for characterization and assessment of homogeneity and stability, 4th ed., p 114 22. Wadsö I (2000) Needs for standards in isothermal microcalorimetry. Thermochim Acta 347(1– 2):73–77. https://doi.org/10.1016/S0040-6031(99)00418-9 23. Quantifying Uncertainty in Analytical Measurement, EURACHEM/CITAC, 3rd ed. (2012). Available via CITAC: https://www.citac.cc/QUAM2012_P1.pdf. Accessed 26 Aug 2022 24. Darnell A, SikkLy L, Porosk P (2021) Uncertainty of small enthalpy effects measured by isothermal calorimetric titration. J Chem Metrol 15(1):25–37. https://doi.org/10.25135/jcm. 57.21.03.1994 25. Gherrou A, Buschmann H-J, Schollmeyer E (2005) Complex formation of crown ethers and cryptands with Ba2+ in the biphasic system chloroform/water studied by titration calorimetry. Thermochim Acta 425(1–2):1–5. https://doi.org/10.1016/S0040-6031(03)00369-1 26. Buschmann HJ, Mutihac RC, Schollmeyer E (2008) Complex formation of 18-crown-6 with metal cations and ammonium ions in dioxane–water mixtures. Thermochim Acta 472(1–2):17– 19. https://doi.org/10.1016/j.tca.2008.03.010
Metrological Support for Titration Isothermal Calorimetry: Prospects …
321
27. Boyce SE, Tellinghuisen J, Chodera JD (2015) Avoiding accuracy-limiting pitfalls in the study of protein-ligand interactions with isothermal titration Calorimetry. Preprint submitted to Analytical Biochemistry. https://doi.org/10.1101/023796 28. Turnbull WB, Daranas AH (2003) On the value of c: can low affinity systems be studied by isothermal titration calorimetry? J Am Chem Soc 125(48):14859–14866. https://doi.org/10. 1021/ja036166s 29. Grüner S, Neeb M, Barandun LJ, Sielaff F, Hohn Ch (2014) Impact of protein and ligand impurities on ITC-derived protein–ligand thermodynamics. Biochimica et Biophysica Acta 1840(9):2843–2850. https://doi.org/10.1016/j.bbagen.2014.04.018 30. Linkuviene V, Krainer G, Chen WY, Matulis D (2016) Isothermal titration calorimetry for drug design: precision of the enthalpy and binding constant measurements and comparison of the instruments. Anal Biochem 515:61–64. https://doi.org/10.1016/j.ab.2016.10.005
Study of Certified Reference Materials for Temperature and Specific Enthalpy of Phase Transitions of Metals and Metal Salts Andrei M. Nepomiluev , Artyom P. Shipitsyn , and Anastasiya E. Tyurnina
Abstract The development of calibration procedures, as well as the certification of readily available reference materials (RMs) and the improvement of their metrological characteristics, are topical issues for thermal analysis methods. In the course of the work, the necessity of conducting a study in order to expand the range of CRMs for temperature and enthalpy of phase transitions is substantiated. The substantiation of the choice of the measurement procedure and starting materials is given. The conditions for conducting experiments are described in detail, and the choice of these conditions is justified. The developed CRMs passed the metrological examination and were included in the Register of approved types of reference materials FIF EUM as a set of certified reference materials for temperature and specific enthalpy of phase transitions (set SOTSF-2) GSO 11890-2022/GSO 11896-2022. The practical significance of the obtained results is as follows: certified reference materials allow expanding the possibility of establishing and monitoring the stability of the calibration characteristics of thermal analysis installations and measuring instruments; certification of measurement procedures (methods) and accuracy control of the measurement results of the phase transition temperature of metals, metal salts, metal oxides, and polymeric materials, organic and inorganic substances. Keywords Reference material · Thermal analysis · Phase transition temperature · Specific enthalpy of phase transition · State primary standard
A. M. Nepomiluev (B) · A. P. Shipitsyn · A. E. Tyurnina UNIIM—Affiliated Branch of the D. I. Mendeleyev Institute for Metrology, Yekaterinburg, Russia e-mail: [email protected] A. P. Shipitsyn e-mail: [email protected]
© D. I. Mendeleyev Institute for Metrology 2024 E. P. Sobina et al. (eds.), Reference Materials in Measurement and Technology, https://doi.org/10.1007/978-3-031-49200-6_21
323
324
A. M. Nepomiluev et al.
Abbreviations TA DTA TGA DSC STA MP MI RMS CRM
Thermal analysis Differential thermal analysis Thermal gravimetric analysis Differential scanning calorimetry Simultaneous thermal analysis Measurement procedure Measuring instrument Root mean square Certified reference material
Introduction Currently, thermal analysis (TA) refers to a group of methods in which a physical property of a substance is measured as a function of temperature or time while the substance is subjected to a temperature controlled program [1]. The temperature program can include heating, cooling at a constant rate, exposure at a constant temperature (isotherm), and a combination of these modes or a temperature modulation mode with amplitude and frequency setting. One of the most advanced, highly sensitive and, therefore, the most commonly used methods for phase analysis of heterogeneous systems are differential thermal analysis (DTA) and differential scanning calorimetry (DSC). They make it possible to determine the temperature and enthalpy of transitions, the heat capacity and its dependence on thermodynamic parameters, as well as the kinetic characteristics of physical and chemical processes under conditions of a linear temperature variation. Instruments that implement these methods are widely used, quite simple in design, and easy to operate. However, DSC/DTA instruments, unlike adiabatic calorimeters, are not absolute measuring instruments. The values of the amount of released or absorbed heat and heat flow rates are measured under dynamic conditions, and not under heat equilibrium conditions. Therefore, the measurement results of DSC/DTA instruments are influenced by numerous parameters associated with the measured sample, instrument, and operator. The main influencing parameters include: the mass and geometry of the sample, its state of aggregation and thermophysical properties, the type of the measured effect, the magnitude of the measured effect, the dimensions of the crucible and the material from which it is made, the thermal resistance between the calorimeter, the crucible, and the sample, the response time of the heating/cooling device, the design and material of the measuring cell, the position of the sample in the crucible and the crucible in the calorimeter, the type of purge gas, its pressure, and purge rate, the procedure for collecting and processing experimental data. Nevertheless, errors in measuring the phase transition temperature from 0.01 to 0.5 °C, the enthalpy changes of phase transitions from 0.5 to 1.0%, and heat capacity from
Study of Certified Reference Materials for Temperature and Specific …
325
1 to 2% [2] can be achieved in the temperature range from 200 to 800 K subject to careful calibration of DSC/DTA instruments and accurate measurements. In addition, the measurement accuracy of thermophysical properties performed using DSC/ DTA devices can be affected by changes occurring in the device—the drift of electronic parameters and degradation of thermally sensitive elements (thermocouples and thermal resistances). The dynamics of these changes primarily depends on the intensity of MI operation and measurement conditions: heating rate, atmosphere, and sample holder material. Therefore, a fundamental requirement for every thermoanalytical study is the pre-calibration of the respective instrument, which should be performed using uniform and reliable procedures. Calibration is understood as the procedure for establishing the relationship between the value of a quantity determined by the measuring instrument and its true value. The developments of calibration procedures, as well as the certification of readily available reference materials (RMs) and the improvement of their metrological characteristics, are topical issues for thermal analysis methods.
Theoretical Background The range of reference materials used should correspond to the operating ranges of measuring instruments, as well as the materials used for the manufacture of measuring cells and crucibles. Since the development and implementation of the ISO-9000 standard [3], ensuring the comparability and traceability of thermal analytical data has become a fundamental requirement. One of the first calibration procedures for DSC/DTA instruments were those described in [4–6]. But none of them acted as an instrument-independent procedure. In order to unify the calibration methods that existed at that time and reduce the magnitude of systematic measurement errors, the German Society for Thermal Analysis1 formed a working group “Calibration of scanning calorimeters” (1987), whose goal was to develop scientifically based, instrument-independent, and generally accepted calibration procedures, the application of which would significantly reduce the systematic errors of the values measured by DSC/DTA. The results of the working group were published in [7–13] and were adopted by the International Confederation for Thermal Analysis and Calorimetry (ICTAC)2 as a recommendation to its members (2000). Since DSC/DTA instruments are used to determine the temperature and heat of phase transitions, as well as the rate of heat flow (when determining the temperature dependence of the heat capacity of a substance or studying the kinetics of a reaction),
1
Gesellschaft fur Thermische Analyse (GEFTA). Available via GEFTA. https://www.gefta.org/ind ex.php. Accessed 10 October 2022. 2 International Confederation for Thermal Analysis and Calorimetry (ICTAC). Available via ICTAC. http://www.ictac.org/index.html. Accessed 10 October 2022.
326
A. M. Nepomiluev et al.
it becomes necessary to calibrate MI using three scales: temperature, enthalpy, and heat flow. The temperature scale is calibrated by comparing the known phase transition (melting/crystallization) temperatures of RMs with the corresponding temperatures measured at the appropriate heating rate. Then a correction curve is constructed in the given temperature range. Depending on the range to be covered and the shape of the calibration curve, at least three RMs are required to be measured—even if the calibration is linear, a third point is needed to confirm this. Since temperature sensors are most often located inside the device and not in the sample, the need for extrapolation to a zero heating rate requires measuring RMs at three or more heating rates [2]. Melting (crystallization) or a phase transition in a solid appears on the DSC curve as an endo- or exothermic peak; therefore, the enthalpy calibration procedure makes it possible to relate the peak area obtained for the RM to the enthalpy change known for it and obtain peak area to enthalpy conversion factor. Since experience has shown that this factor is a function of temperature and temperature scan rate (or any other of the experimental parameters that should be kept constant throughout the measurement series), the measurements of several enthalpy reference materials are required to cover the entire temperature range of the DSC/DTA instrument. The heat flow rate in the DSC experiment is related to the heat capacity of the sample; and if any reaction occurs in the sample, it is related to the “apparent” heat capacity. The ideal RM for heat flow calibration should be thermodynamically inert (have no phase transformations) over a wide temperature range. From this point of view, α-alumina (polycrystalline corundum or monocrystalline leucosapphire) is a universal RM. With its use, experimental data on heat capacity for other well-studied substances can be reproduced with an accuracy of ± 1%, and in some cases even better [14]. The recommendations of the GEFTA working group for calibrating DSC/DTA instruments and performing subsequent measurements are formulated as follows [15]: • Experimental conditions for calibration and sample measurements should differ as little as possible. Therefore, a valid calibration procedure should specify in detail how to establish reproducible environmental conditions and how to check for non-linearities; • Any asymmetry in heat flows, temperature gradients, and measurement effects should be avoided. It is necessary to create quasi-steady-state conditions. However, a detailed study of the dependence of the measured values on the parameters of the sample and instrument is mandatory to eliminate systematic errors; • Calibrations already performed by the manufacturer of DSC/DTA instruments should be carefully checked; • Calibrations should be checked at regular intervals according to the required accuracy. It also provides information on any long-term systematic changes to the measuring system.
Study of Certified Reference Materials for Temperature and Specific …
327
The recommended substances by GEFTA and ICTAC for use as RMs cover the temperature range from 120 to 1350 °C and mainly refer to materials that determine the fixed points of the International Temperature Scale 1990 (ITS-90) [15] (Table 1). The GEFTA and ICTAC recommendations also describe the procedure for processing experimental data obtained from measurements of RMs on a calibrated DSC/DTA instrument, including a method for determining the characteristic temperatures of endothermic (exothermic) peaks of phase transformations. Figure 1 shows the determination of the characteristic temperatures in the case of an endothermic peak (for example, metal melting) [2]. It is more convenient to determine the values of temperatures T i , T f from the first derivative of the DSC/DTA curve, where the moment of deviation of the DSC/DTA signal from the interpolated baseline is determined much better. Using the example of UNIIM, a competent manufacturer of CRMs for thermophysical properties (SOTS), 6 types of CRMs for temperature and heat of phase transitions were developed based on potassium chloride, as well as gallium, indium, tin, zinc, antimony (set SOTSF, Table 2). The development and certification of CRMs were carried out in accordance with the State verification schedule for means of measuring specific enthalpy and specific heat-conguction of solid frames in the range of temperature from 700 to 1800 K [16] using the National primary special standard GET 67-2013 for the units of specific enthalpy and specific heat of solids at temperatures in the 700–1800 K range [17]. As shown in Table 2, the temperature range provided by the available GSOs is from ~ 300 to ~ 1050 K, and the range of specific heat of fusion is from ~ 28 to ~ 59 kJ/kg. At the same time, TA instruments supplied to the Russian market by leading manufacturers of thermoanalytical equipment, such as “Netzsch-Geratebau GmbH” (Germany), “TA Instruments” and “PerkinElmer, Inc” (USA), “Setaram Instrumentation” (France), and “Mettler-Toledo AG” (Switzerland) cover a much wider range of temperatures and heats of phase transitions: from ~ 90 to ~ 1920 K and from 10 to 1000 kJ/kg, respectively. Moreover, recently a number of high temperature instruments have appeared on the market, the upper limits of the operating range of which are 2273 K (DSC 404 F1/F3 Pegasus, STA 449 F1 Jupiter, Netzsch, Germany), 2673 K (STA 449 F3 Jupiter, Netzsch, Germany, SETSYS Evolution TGA-DTA/DSC, Setaram Instrumentation, France), and even 3073 K (DIL 402 Expedis HT, Netzsch, Germany). The analysis showed that the available list of GSOs for temperatures and heats of phase transitions do not fully provide the measurement ranges of the corresponding thermophysical quantities. In addition, Table 3 indicates the existing limitations on the compatibility of GSO materials with the materials of crucibles used in measurements [8]. Table 3 shows that, for example, GSO 2312-82/2316-82 can be used for graduation, calibration, and temperature verification of thermal analyzers in the case of measurements in non-metallic (ceramic, glass, etc.) crucibles. At the same time, only GSO 2313-82 (In) and GSO 2314-82 (Sn) can be used for graduation, calibration, and
122.38 138.06
933.473 1234.93 1337.33
s.–s.
s.–s.
s.–l.
s.–l.
s.–l.
s.–l.
s.–l.
s.–l.
s.–l.
s.–l.
s.–l.
s.–l.
s.–l.
s.–l.
C5 H10 (Cyclopentane)
C5 H10 (Cyclopentane)
C5 H10 (Cyclopentane)
Water
Gallium
Indium
Tin
Bismuth
Lead
Zinc
Lithium sulfate
Aluminium
Silver
Gold
50
− 93.43
1064.18
961.78
660.323
578.28
419.527
327.46
(271.40)
231.928
156.598
29.764
0
0
0
250
0
10
–
0
0
0
10
50
− 135.09 0.00
69.60
50
− 150.77
398.1
228.1
53.83
60.40
28.62
79.88
8.63
4.91
ΔH, J/g
°C
10.74
25.07
11.25
7.170
3.286
5.569
0.605
0.345
4.881
ΔH, kJ/mol
Uncertainty, ua , μm Specific enthalpyb
2.3
4.6
3.9
0.6
0.4
0.9
1.1
1.1
0.5
Uncertainty, u, %
Note a—uncertainty u is an estimate of the range of values within which the true value lies. The uncertainty of phase transformation temperatures for materials corresponding to the ITS-90 fixed points is zero b—the indicated transition temperatures are average values calculated as a weighted average of the most reliable measurements given in the relevant literature. The indicated uncertainty describes the double experimental standard deviation s.–s.—polymorphic transformation s.–l.—solid–liquid transition (melting)
851.43
692.677
600.61
(544.55)
505.078
429.748
302.914
273.15
179.72
K
Transformation temperature
Type of transformation
Substance
Table 1 Substances recommended for calibration by temperature and specific enthalpy of phase trasformation
328 A. M. Nepomiluev et al.
Study of Certified Reference Materials for Temperature and Specific …
329
Fig. 1 Determination of characteristic DSC/DTA peak temperatures, where: T i is the initial temperature: the first visible deviation of the DSC/DTA curve from the interpolated baseline; T e is the extrapolated peak start temperature: the temperature at which the tangent at the inflection point of the rising slope of the peak crosses the interpolated baseline. The temperature T e is taken as the melting or phase transition temperature; T p is the peak temperature: the temperature corresponding to the largest distance between the DSC/DTA curve and the interpolated baseline; T c is the extrapolated peak end temperature: the temperature at which the tangent at the inflection point of the downward slope of the peak crosses the interpolated baseline; T f is the final temperature: the last visible deviation of the DSC/DTA curve from the interpolated baseline
verification by specific heat of fusion. There is only GSO 1363-78 based on potassium chloride for use with metal crucibles (platinum, steel, etc.), which is clearly not enough for graduation, calibration, and verification of thermal analysis MI. Thus, the study of determining the temperature and heat of phase transitions for the metrological support of MI of higher temperature and traceability to the basic units of physical quantities is of particular relevance. Therefore, the purpose of this work is the development and certification of new RMs for temperature and heat of phase transitions for thermal analysis instruments, primarily for DSC/DTA instruments.
Materials and Methods Reagents The commercially available Netzsch RMs used for calibration of thermal analysis instruments were selected as candidate RMs (Table 4). This list of 24 substances can be divided into three groups: the first is for the low temperature range (from − 87 to 122 °C) and consists mainly of organic compounds;
Error (±)
0.6 1.79
0.03
0.26 0.03
0.12 0.01 0.25
0.06 0.08 0.12
0.06
GSO 2312-82/2316-82 Reference materials of the approved type of temperatures and heats of phase transitions (set SOTSF). Available via FIF EUM. https:// fgis.gost.ru/fundmetrology/registry/19/items/393963. Accessed 10 October 2022 (In Russ.). GSO 1363-78 Reference materials of thermodynamic properties (potassium chloride) (SOTS-5). Available via FIF EUM. https://fgis.gost.ru/fundmetrology/ registry/19/items/394230. Accessed 10 October 2022 (In Russ.).
3
1044.75 357.29
903.76
K K kJ/kg
692.71 692.67
505.20 505.12 59.92
429.85 429.79 28.58
303.04
Certified value
K K
Crystallization point
Melting point, crystallization point
GSO 2315, zinc
K K kJ/kg
Melting point, specific heat of fusion
Melting point, crystallization point, specific heat of fusion
GSO 2314, tin
K K kJ/kg
GSO 2316, antimony
Melting point, crystallization point, specific heat of fusion
GSO 2313, indium
Unit designation K
GSO 1363, potassium chloride
Certified characteristic Melting point
State register number, the material of CRM
GSO 2312, gallium
Table 2 Certified reference materials for thermophysical properties developed by UNIIM3
330 A. M. Nepomiluev et al.
+
•
+
+
Nickel, Ni
Iron, Fe
+
+
+
+
+
+
Aluminum oxidized
•
Silver, Ag
+
Aluminum, Al
+
Gold, Au
+
Silicon dioxide, SiO2
+
o
o
+
Graphite, C
Silica glass
o
o
Boron nitride, BN
o
o
Water, H2 O
Corundum, A12 O3
Cyclopentane, C5 H10
Crucible material Reference material
•
•
•
–
+
–
+
+
+
+
+
Gallium, Ga
Table 3 Interaction of reference materials with crucible materials
+
•
•
–
+
+
+
+
+
+
+
Indium, In
•
•
–
–
+
–
+
+
+
+
+
Tin, Sn
+
•
–
–
+
+
+
+
+
+
+
Lead, Pb
–
•
–
–
+
–
+
?
+
+
+
Zinc, Zn
?
?
+
?
+
+
+
+
+
+
+
Lithium sulfate, Li2 SO4
–
–
–
–
×
×
–
–
+
+
+
(continued)
Aluminum, Al
Study of Certified Reference Materials for Temperature and Specific … 331
+
o
•
?
•
•
•
Gallium, Ga
?
+
?
•
+
Indium, In
?
?
•
–
•
Tin, Sn
•
?
?
–
+
Lead, Pb
Note +—solubility and effect on melting point is not expected −—the melt dissolves the crucible material, which leads to a significant change in the melting point •—partial dissolution and slight effect on the melting point are possible ×—the crucible melts ?—this interaction is unknown o—sealing the crucible can be difficult
+
o
Tantalum, Ta
Tungsten, W
+
+
+
+
Platinum, Pt
+
+
Molybdenum, Mo
Stainless steel
Water, H2 O
Cyclopentane, C5 H10
Crucible material Reference material
Table 3 (continued)
+
?
•
–
–
Zinc, Zn
?
+
?
+
?
Lithium sulfate, Li2 SO4
•
–
?
–
–
Aluminum, Al
332 A. M. Nepomiluev et al.
Study of Certified Reference Materials for Temperature and Specific …
333
Table 4 List of reference materials supplied by Netzsch for calibration of thermal analysis instruments Melting point (phase transition)
Substance
Specific enthalpy, J/g
Note
Formula
Designation
°C
C6 H12
Hexene
− 87.0
K 186.0
− 79.4
C10 H16
Monoterpene
− 64.7
208.3
− 22.3
Hg
Mercury
− 38.8
234.2
− 11.4
H2 O
Water
0.0
273.0
− 333.4
Ga
Gallium
29.8
302.8
− 80.0
C12 H10
Biphenyl
69.2
342.2
− 120.5
C6 H5 COOH
Benzoic acid
122.4
395.4
− 147.4
KNO3
Potassium nitrate
128.7
401.7
− 50.0
In
Indium
156.6
429.6
− 28.6
RbNO3
Rubidium nitrate
164.2
437.2
− 26.6
For metal crucibles
Sn
Tin
231.9
504.9
− 60.5
For ceramic crucibles
Bi
Bismuth
271.4
544.4
− 53.1
For ceramic crucibles
KClO4
Potassium perchlorate
300.8
573.8
− 104.9
Pb
Lead
327.5
600.5
− 23.0
For ceramic crucibles
Zn
Zinc
419.5
692.5
− 107.5
For ceramic crucibles
Ag2 SO4
Silver sulfate
426.4
699.4
− 51.0
For metal crucibles
CsCl
Caesium chloride
476.0
749.0
− 17.2
For metal crucibles
Al
Aluminum
660.3
933.3
− 397.0
K2 CrO4
Potassium chromate
668.0
941.0
− 37.0
For metal crucibles
BaCO3
Barium carbonate
808.0
1081.0
− 94.9
For metal crucibles
Ag
Silver
961.8
1234.8
− 104.6
For ceramic crucibles
Au
Gold
1064.2
1337.2
− 63.7
For ceramic crucibles
For metal crucibles
For metal crucibles
For ceramic crucibles
(continued)
334
A. M. Nepomiluev et al.
Table 4 (continued) Substance
Melting point (phase transition)
Specific enthalpy, J/g
Note
Formula
Designation
°C
K
Ni
Nickel
1455.0
1728.0
− 290.4
For ceramic crucibles
Pd
Palladium
1554.8
1827.8
− 157.3
For ceramic crucibles
the second and third are for the high temperature range and consist of salts (for metal crucibles) and metals (for ceramic crucibles). The main objective in selecting a candidate RM for the development and certification of new GSO for temperature and heat of phase transitions from those given in Table 4 was to expand the temperature ranges provided by new RMs for both metal and non-metal crucibles. Therefore, the GSO set, later called SOTSF-2, included samples of four high-purity metals (wt%): Bi (99.999%), Al (99.999%), Ag (99.99%), Au (99.999%), as well as three samples of high-purity metal salts: Ag2 SO4 (99.999%), CsCl (99.999%), BaCO3 (99.98%). Thus, the temperature range provided by the GSO was supposed to be expanded to 1337.2 K with a total amount of RMs of 10 pieces (6—SOTSF, 4—SOTSF-2) for non-metal crucibles. According to the enthalpy of phase transitions, the upper limit of the range will be 397 J/g with a total number of RMs of 6 pieces (2—SOTSF, 4— SOTSF-2). Similarly, the lower and upper limits of the temperature range provided by the GSO should be 699.4 K and 1081 K with a total number of reference materials of 4 pieces (GSO 1363-78, 3—SOTSF-2) for metal crucibles. According to the enthalpy of phase transitions, the range is from 17.2 to 357.29 J/g with a total amount of RMs of 4 pieces (GSO 1363-78, 3—SOTSF-2).
Equipment All phase transformation temperature studies were performed on a thermal analyzer STA 449 F5 Jupiter (NETZSCH, Germany), which implements the method of simultaneous thermal analysis (STA), which combines the method of differential scanning calorimetry (DSC) and thermal gravimetric analysis (TGA), from the State Primary Standard of units of mass fraction, mass (molar) concentration of water in solid and liquid substances and materials GET 173-2017.4
4
GET 173-2017 State primary standard of units of mass fraction, mass (molar) concentration of water in solid and liquid substances and materials: UNIIM—Affiliated Branch of the D. I. Mendeleyev Institute for Metrology. Available via FIF EUM. https://fgis.gost.ru/fundmetrology/ registry/12/items/397857. Accessed 10 October 2022 (In Russ.).
Study of Certified Reference Materials for Temperature and Specific …
335
The mass of the starting material (candidate RM) was measured on a laboratory balance of special accuracy class I (Sartorius, Germany) with a weighing resolution of 10 μg and an expanded uncertainty of 80 μg. The mass of the crucible and the weight of the crucible with a sample were obtained in ten parallel measurements. The sample mass was determined by the mass differences. The establishment of certified values of the specific enthalpy of phase transformations of new GSO was carried out by direct measurements on the National primary special standard GET 67-2013 for the units of specific enthalpy and specific heat of solids at temperatures in the 700–1800 K range.5 GET 67-2013 is an isothermal mixing calorimeter designed to measure specific enthalpy and specific heat, as well as to study phase transformations in solid and liquid materials in a wide temperature range (from room temperature to 1800 K). A description of the GET 67-2013 design and methods for measuring the specific enthalpy and specific heat capacity are given in [17]. The theory of calorimetric measurements by the mixing method is considered in detail in [18]. The derivation of the equation for measuring the specific enthalpy of phase transformations using an isothermal mixing calorimeter is described in [19].
Research Methods and Procedure The establishment of certified values of the temperature of phase transformations of new GSO was performed using a certified measurement method FR.1.31.2021.40481.6 The indicators of the measurement method are presented in Table 5. The establishment of certified values of the specific enthalpy of phase transformations of new GSO was performed in accordance with the operating manual and technical documentation for GET 67-2013. To reduce the impact of factors affecting the accuracy, the measurements were carried out in accordance with the following procedure: • in accordance with the requirements of ASTM E 967, high-purity Al2 O3 crucibles were used for metal measurements in order to avoid interaction of the test material with the crucible material. High-purity metal salts were measured in platinum crucibles. Closed crucibles were used to reduce the influence of sample color on its heating rate, as well as a more uniform heat distribution; 5
GET 67-2013 State primary special standard of units of specific enthalpy and specific heat capacity of solids in the temperature range from 700 to 1800 K: UNIIM—Affiliated Branch of the D. I. Mendeleyev Institute for Metrology. Available via FIF EUM. https://fgis.gost.ru/fundmetrology/ registry/12/items/397945. Accessed 10 October 2022 (In Russ.). 6 FR.1.31.2021.40481 Method for Measuring Phase Transition Temperatures of High-Purity Metals and Inorganic Compounds by Differential Scanning Calorimetry:: UNIIM—Affiliated Branch of the D. I. Mendeleyev Institute for Metrology. Available via FIF EUM. https://fgis.gost.ru/fundme trology/registry/16/items/1391509. Accessed 10 October 2022 (In Russ.).
336
A. M. Nepomiluev et al.
Table 5 Measurement ranges, values for accuracy, correctness, repeatability, intralaboratory precision of the combined standard and expanded uncertainty Measurement Repeatability, Intralaboratory Correctness, Accuracy, Combined range, °C °C precision, °C °C °C standard uncertainty, °C
Absolute expanded uncertainty, °C P = 0.95 and k = 2
From 28 to 200 incl
0.01
0.05
0.06
0.11
0.055
0.11
From 200 to 400 incl
0.01
0.05
0.12
0.17
0.085
0.17
From 400 to 700 incl
0.02
0.07
0.26
0.33
0.165
0.33
From 700 to 1600 incl
0.02
0.07
0.60
0.67
0.335
0.67
• it is recommended to use a gas with low thermal conductivity, therefore, the measurements were carried out in N2 atmosphere with a purity of 99.99% at a flow rate of 40 ml/min; • the measurements were carried out using a DSC/TG sample holder with an S-type thermocouple and a sensitivity of 1.2 μV/mW; • good contact between the material and the bottom of the crucible is essential to increase the heat transfer and, therefore, the measurement accuracy. In this regard, the starting material was placed in the crucible so as to completely cover the bottom for the case of measuring samples of metal salts; then the compaction was carried out using special equipment, which is a common technique in sample preparation [20]. • samples weighing no more than 20 mg were used to reduce the effect of sample weight on the measurement result; • the thermal analyzer was calibrated using GSO 2312-82/2316-82 and GSO 136378 (set SOTSF), the accuracy indicators of which correspond to the working standards of the 1st category according to the state temperature verification scheme (GOST 8.558-2009 [21]); • a heating rate of 10 °C/min was used during the study of RMs, since high heating rates lead to a shift in heat effects to higher temperatures. This heating rate value is recommended for use in verification methods for TA MI.
Results and Discussion The DSC curves for some materials obtained in determining the certified values of the phase transition temperature of CRMs are shown in Figs. 2, 3, 4 and 5. The DSC curves presented in Figs. 2, 3, 4 and 5 were processed in accordance with the requirements of the MP; two or three sample weights were used for each material.
Study of Certified Reference Materials for Temperature and Specific …
337
Fig. 2 DSC curves of gold samples (Au)
Fig. 3 DSC curves of aluminum samples (Al)
It follows from the obtained data that the standard deviation of the measurement results does not exceed 0.01 °C, which meets the requirements of the MP in the entire temperature range. When determining the certified value of RMs in accordance with GOST ISO Guide 35-2015 [22], studies were carried out, and the contributions to the uncertainty due to heterogeneity of the starting materials, short- and long-term stabilities of materials were estimated. The obtained values of the metrological characteristics are as follows: the phase transition temperature (TPhT ) and specific enthalpy of phase transition (HPhT ) of the investigated batch of CRMs are presented in Table 6.
338
A. M. Nepomiluev et al.
Fig. 4 DSC curves of caesium chloride samples (CsCl)
Fig. 5 DSC curves of barium carbonate samples (BaCO3 )
It should be noted that the melting temperatures of metals coincide within the error of the measurement method used by us with fixed points of the ITS-90 [23]. The HPhT values for metals are close to the data given in [24], as well as in a number of other sources [2, 8, 12, 15]. Similarly the values of the phase transition temperature are consistent with our results better than the values of the enthalpy of phase transformations [25] for metal salts. The existing differences can be primarily due to differences in the chemical composition of micro-impurities in the composition of the substances researched in different studies, as well as some differences in sample preparation and
Study of Certified Reference Materials for Temperature and Specific …
339
Table 6 Metrological characteristics of the certified reference material7 GSO number in the set
Index
Certified characteristic
GSO 11890-2022
SOTSF-2-Ag2 SO4
TPhT , K HPhT , J/g
GSO 11891-2022
SOTSF-2-CsCl
GSO 11892-2022
SOTSF-2-BaCO3
GSO 11893-2022
SOTSF-2-Bi
GSO 11894-2022
SOTSF-2-Al
GSO 11895-2022
SOTSF-2-Ag
GSO 11896-2022
SOTSF-2-Au
Certified value
Limits of the absolute error at P = 0.95
Absolute expanded uncertainty at P = 0.95 and k =2
699.55
± 0.4
± 0.4
51.9
± 0.24
± 0.24
TPhT , K
749.15
± 0.4
± 0.4
HPhT , J/g
17.2
± 0.12
± 0.12
TPhT , K
1081.15
± 1.2
± 1.2
HPhT , J/g
94.9
± 0.45
± 0.45
TPhT , K
544.55
± 0.2
± 0.2
HPhT , J/g
53.1
± 0.2
± 0.2
TPhT , K
933.47
± 1.0
± 1.0
HPhT , J/g
397.0
± 2.0
± 2.0
TPhT , K
1234.93
± 1.3
± 1.3
HPhT , J/g
104.6
± 0.5
± 0.5
TPhT , K
1337.33
± 1.4
± 1.4
HPhT , J/g
63.7
± 0.25
± 0.25
measurements, which is completely difficult to avoid even with the most careful implementation of the GTEFTA and ICTAC recommendations [15]. Taking into account the obtained results for other materials, the correctness of the chosen method and experimental conditions, it can be concluded that the obtained values are representative. The traceability of the certified values of the phase transition temperature is ensured to the temperature unit (°C) reproduced by the State Primary Standard of temperature unit in the range from 0 to 3200 °C GET 34-2020,8 and provided through the use of reference materials of In, Sn, Zn, Al, Ag, and Au, which are the fixed points of the International Temperature Scale (ITS–90). The procedure described above can be recommended for determining the characteristics of other high-purity metals and their salts, as well as for certification of RMs based on them.
7
GSO 11890-2022/11896-2022 Reference materials of the temperature and specific enthalpy of phase transitions of metals and metal salts (SET RM SOTSF-2). Available via FIF EUM. https:// fgis.gost.ru/fundmetrology/registry/19/items/1398408. Accessed 10 October 2022 (In Russ.). 8 GET 34-2020 State primary standard of temperature unit in the range from 0 to 3200 °C: D. I. Mendeleyev Institute for Metrology. Available via FIF EUM. https://fgis.gost.ru/fundmetrology/ registry/12/items/1385580. Accessed 10 October 2022 (In Russ.).
340
A. M. Nepomiluev et al.
Conclusion The purpose of this work was the development and certification of new certified reference materials for phase transition temperature based on high-purity metals and metal salts traceable to SI unit “temperature” °C for thermal analysis measuring instruments, primarily for DSC/DTA instruments. In the course of experimental studies by differential scanning calorimetry using the thermal analyzer STA 449 F5 Jupiter from GET 173-2017, CRM certified values were determined. The procedure was carried out in accordance with GOST ISO Guide 35-2015; the contributions to the uncertainty due to heterogeneity of the starting materials were evaluated; the short- and long-term stabilities of the materials were studied. The obtained metrological characteristics of the investigated batch of CRMs are as follows: the phase transition temperature (TPhT ) and specific enthalpy of phase transition (HPhT ) of the investigated batch of CRMs. The certified TPhT values for the developed CRMs based on high-purity metals (Bi, Al, Ag, Au) are consistent with the temperatures of the ITS-90 fixed points with an accuracy of no worse than ± 0.01 °C. The certified HPhT values for CRMs based on high-purity Bi, Al, Ag, Au are consistent with the results given in [2, 10, 12, 13, 15, 25] in the range from 0.3 to 1.3%. Similarly, there is also a fairly good agreement between the TPhT and HPhT certified values and the reference data for CRMs based on high-purity metal salts (Ag2 SO4 , CsCl, BaCO3 ). For example, the obtained TPhT value for BaCO3 practically coincides, and the HPhT value differs by 2.7% from the results obtained in [25]. The developed CRMs passed the metrological examination and were included in the Register of approved types of reference materials FIF EUM9 as a set of certified reference materials for temperature and specific enthalpy of phase transitions (set SOTSF-2) GSO 11890-2022/GSO 11896-2022. The practical significance of the obtained results is as follows: certified reference materials allow expanding the possibility of establishing and monitoring the stability of the calibration characteristics of thermal analysis installations and measuring instruments; certification of measurement procedures (methods) and accuracy control of the measurement results of the phase transition temperature of metals, metal salts, metal oxides, and polymeric materials, organic and inorganic substances. Acknowledgements The research did not receive financial support in the form of a grant from any organization in the public, commercial or non-profit sector. All measurements were performed using the equipment of the D. I. Mendeleyev Institute for Metrology. Contribution of the Authors Nepomiluev A. M.—development of the research concept, conducting research work; Shipitsyn A. P.—development of a methodology/procedure, implementation of a formal analysis, writing a draft version of the article, conducting research work; Tyurnina A. E.—manuscript revision and editing. 9
Federal Information Fund for Ensuring the Uniformity of Measurements. Available via FIF EUM. https://fgis.gost.ru/fundmetrology/registry/19. Accessed 10 October 2022 (In Russ.).
Study of Certified Reference Materials for Temperature and Specific …
341
Conflict of Interest The article was prepared on the basis of a report presented at the V International Scientific Conference “Reference Materials in Measurement and Technology” (Yekaterinburg, September 13–16, 2022). The article was admitted for publication after the abstract was revised, the article was formalized, and the review procedure was carried out. The version in the Russian language is published in the journal “Measurement Standards. Reference Materials” 2023;19(1):17–27. (In Russ.) https://doi.org/10.20915/2077-1177-2023-191-17-27.
References 1. ASTM E 473-16 (2019) Standard terminology relating to thermal analysis and rheology. https:// doi.org/10.1520/E0473-16 2. Gatta GD, Richardson MJ, Sarge SM, Stölen S (2006) Standards, calibration, and guidelines in microcalorimetry. Part 2. Calibration standards for differential scanning calorimetry (IUPAC Technical Report). Pure Appl Chem 78(7):1455–1476. https://doi.org/10.1351/pac200 678071455 3. ISO 9000:2015 Quality management systems—fundamentals and vocabulary. Available via ISO. https://www.iso.org/ru/standard/45481.html. Accessed 10 Oct 2022 4. Hill JO (1991) For better thermal analysis and calorimetry (Ed.). International confederation for thermal analysis, 3rd ed. 5. DIN 51004:1992 (1994) Thermal analysis; determination of melting temperatures of crystalline materials by differential thermal analysis. Deutsches Institut for Normung, Beuth-Verlag, Berlin, p 4 6. DIN 51007:1994 (1994) Thermal analysis; differential thermal analysis; principles. Deutsches Institut for Normung, Beuth-Verlag, Berlin, p 11 7. Höhne GWH, Cammenga HK, Eysel W, Gmelin E, Hemminger W (1990) Die temperaturkalibrierung dynamischer kalorimeter. PTB-Mitteilungen 100(1):25–31 8. Höhne GWH, Cammenga HK, Eysel W, Gmelin E, Hemminger W (1990) The temperature calibration of scanning calorimeters. Thermochica Acta 160(1):1–12. https://doi.org/10.1016/ 0040-6031(90)80235-Q 9. Cammenga HK, Eysel W, Gmelin E, Hemminger W, Höhne GWH, Sarge SM (1992) Die temperaturkalibrierung dynamischer Kalorimeter II. Kalibriersubstanzen. PTB-Mitteilungen 102(1):13–18 10. Cammenga HK, Eysel W, Gmelin E, Hemminger W, Höhne GWH, Sarge SM (1993) The temperature calibration of scanning Kalorimetrs. Part 2. Calibration substances. Thermochica Acta 219:333–342. https://doi.org/10.1016/0040-6031(93)80510-H 11. Sarge SM, Gmelin E, Höhne GWH, Cammenga HK, Hemminger W, Eysel W (1993) Die kalorische kalibrierung dynamischer Kalorimeter. PTB-Mitteilungen 103:491–512 12. Sarge SM, Gmelin E, Höhne GWH, Cammenga HK, Hemminger W, Eysel W (1994) The caloric calibration of scanning calorimeters. Thermochica Acta 247(2):129–168. https://doi. org/10.1016/0040-6031(94)80118-5 13. Sarge SM, Hemminger W, Gmelin E, Höhne GWH, Cammenga HK, Eysel W (1997) Metrologically based procedure for the temperature, heat and heat flow rate calibration of DSC. J Therm Anal 49:1125–1134. https://doi.org/10.1007/BF01996802 14. Donald GA, Richard WC (2000) Thermodynamic properties of the NaCl+H2 O system. 4. Heat capacities of H2 O and NaCl(aq) in cold-stable and supercooled states. J Phys Chem B 104(35):8563–8584. https://doi.org/10.1021/jp0003914 15. Gmelin E, Sarge SM (1995) Calibration of differential scanning calorimeters. Pure Appl Chem 67(11):1789–1800. https://doi.org/10.1351/pac199567111789
342
A. M. Nepomiluev et al.
16. GOST R 8.872-2014 (2014) State system for ensuring the uniformity of measurements. State verification schedule for means of measuring specific enthalpy and specific heat-conguction of solid frames in the range of temperature from 700 to 1800 K. Standartinform, Moscow, 8 p (in Russian) 17. Kazantsev VV, Cherepanov VI, Sennikova VN, Averkiev MV (2015) National primary special standard GET 67-2013 for the units of specific enthalpy and specific heat of solids at temperatures in the 700–1800 K range. Meas Techn 58(2):121–126. https://doi.org/10.1007/s11018015-0673-7 18. Popov MM (1954) Thermometry and calorimetry, 2nd ed. Moscow University publ, Moscow, p 943 (in Russian) 19. Zharskiy IM, Novikov GI (1988) Physical research methods in inorganic chemistry: textbook for chemical and chemical-technological universities. Vysshaya shkola, Moscow, p 271 (in Russian) 20. Kosova DA, Provotorov DI, Kuzovchikov SV, Uspenskaya IA (2020) Thermal analysis study of phase transformations of magnesium and calcium methanesulfonates. Russ J Inorganic Chem 65(5):752–757. https://doi.org/10.31857/S0044457X20050128 21. GOST 8.558-2009 (2019) State system for ensuring the uniformity of measurements. State verification schedule for means measuring temperature. Standartinform, Moscow, p 8 (in Russian) 22. GOST ISO Guide 35-2015 (2017) Reference materials. General and statistical principles for certification. Standartinform, Moscow, p 62 (in Russian) 23. Preston-Thomas H (1990) The international temperature scale of 1990 (ITS-90). Metrologia 27(1):3–10. https://doi.org/10.1088/0026-1394/27/1/002 24. Sarge SM, Höhne GWH, Cammenga HK, Eysel W, Gmelin E (2000) Temperature, heat and heat flow rate calibration of scanning calorimeters in the cooling mode. Thermochica Acta 361(1–2):1–20. https://doi.org/10.1016/S0040-6031(00)00543-8 25. Earnest CM, Miller ET (2017) An assessment of barium and strontium carbonates as temperature and enthalpy standards. J Therm Anal Calorim 130:2277–2282. https://doi.org/10.1007/ s10973-017-6539-2
Development of Reference Materials for AC Magnetic Properties of Cold-Rolled Non-oriented Electrical Steel Sergey V. Serdjukov, Tatiana I. Maslova, Irina S. Tsay, and Ekaterina A. Volegova
Abstract Electrical steel is a soft magnetic material used in the manufacture of various electrical equipment intended for the transmission and conversion of electricity and used mainly in alternating magnetic fields of industrial frequencies. The key properties of such a material are AC magnetic properties, which are standardized when assessing the compliance of the material with the requirements of both Russian and foreign standards. The article presents information about the aspects of the development of reference materials for AC magnetic properties of electrical cold-rolled non-oriented steel made in the form of strips for the Epstein frame. The main feature of these reference materials is that the value of one of the two certified characteristics (specific power of magnetic losses) is transmitted directly from the State primary standard, and the other (magnetic flux density amplitude) is determined in accordance with a certified measurement procedure. Their use will provide the possibility of a comprehensive and reliable determination of the magnetic characteristics of samples of non-oriented electrical steel normalized in accordance with the requirements of current standards. Keywords Soft magnetic materials · Non-oriented electrical steel · Epstein frame · AC magnetic properties · Specific power of magnetic losses · Magnetic flux density · Reference materials
S. V. Serdjukov (B) · T. I. Maslova · I. S. Tsay · E. A. Volegova UNIIM—Affiliated Branch of the D. I. Mendeleyev Institute for Metrology, Yekaterinburg, Russia e-mail: [email protected] T. I. Maslova e-mail: [email protected] I. S. Tsay e-mail: [email protected] © D. I. Mendeleyev Institute for Metrology 2024 E. P. Sobina et al. (eds.), Reference Materials in Measurement and Technology, https://doi.org/10.1007/978-3-031-49200-6_22
343
344
S. V. Serdjukov et al.
Abbreviations GOST GSO GET SMM RM
National standard Formal name of certified reference material in Russia State primary standard Soft magnetic material Reference material
Introduction Electrical steel is a soft magnetic material (hereinafter referred to as SMM) widely used in industry for the manufacture of generators, transformers, various electric motors, and other electrical equipment intended for the transmission and conversion of electricity. The most important properties of SMMs that determine their consumer appeal are AC magnetic properties—the specific power of magnetic losses for given values of the magnetic flux density amplitude and magnetization reversal frequency, as well as the magnetic flux density amplitude for given values of the amplitude of the magnetic field strength and magnetization reversal frequency [1–7]. Both of these quantities determine the quality of the material and are standardized in the standards regulating the technical requirements for materials. Specifications for rolled products made from electrical steel in the Russian Federation are presented in the standards of technical requirements GOST 21427.2-83, GOST 32482-2013, GOST 33212-2014 [8–10]. The volume of generation and, accordingly, consumption of electricity was 1.131 trillion kWh in Russia in 2021. Reducing energy losses in the production, transmission, and consumption of electrical energy, at least in the amount of fractions of a percent, can save billions of kWh of electricity. This can be achieved by improving the quality of manufactured SMMs through the use of new technological processes (for example, a new complex for laser machining of transformer electrical steel with a capacity of 54 thousand tons per year is being prepared for launch at the Novolipetsk Iron and Steel Works). Another way to reduce losses is to increase the accuracy of quality control of the AC magnetic characteristics of SMMs. Traditionally, measurements of AC magnetic characteristics are carried out on samples made in the form of rings, sheets, or sets of strips for the Epstein frame. The general principle is to pass an alternating current of a given value through the primary (magnetizing) winding and measure the voltage from the secondary (measuring) winding. The sample material serves as a magneto conductor. In this case, the given value of the magnetizing current determines the magnetic field strength in the sample, and the measured voltage is proportional to the magnetic flux density that occurs in the material under study during its magnetization reversal. Windings are applied directly to the sample when measuring ring-shaped samples, and special magnetizing devices are used to measure the characteristics of strip and sheet samples. The method
Development of Reference Materials for AC Magnetic Properties …
345
of measuring stripe-shaped samples in the Epstein frame has received the widest application for determining the properties of SMMs and, as a rule, is indicated in regulatory documents as a referee method when establishing the characteristics of the material under test. The FIF EUM1 analysis revealed that at the moment in Russia there are several certified reference materials (hereinafter referred to as CRMs) for AC magnetic properties made of anisotropic electrical steel (for example, made in the form of rings (GSO 10270-20132 ), sheets (GSO 2129-893 ), and strips for the Epstein frame (GSO 10271-20134 )). The main certifiable characteristic for these CRMs is the value of the specific power of magnetic losses reproduced by the State primary standard of units of power of magnetic losses, magnetic flux density of a constant magnetic field in the range from 0.1 to 2.5 T, and magnetic flux in the range from 1 · 10–5 to 3 · 10–2 Wb GET 198-2017 [11]. In accordance with the State verification scheme for instruments for measuring the power of magnetic losses of magnetically soft materials and the magnetic characteristics of magnetically hard materials,5 the value of specific magnetic losses is transmitted directly from GET 198-2017 to the CRM. The relevance of the development of a new type of RMs for AC magnetic properties of electrical cold-rolled non-oriented steel made in the form of strips for the Epstein frame is due to the fact that they can be used for metrological support of instruments for measuring the magnetic properties of SMMs simultaneously for both AC magnetic characteristics (specific power of magnetic losses and amplitude of magnetic flux density). Thus, the aim of this study was to develop RMs that would be able to provide a complete and reliable determination of the magnetic characteristics of samples of non-oriented electrical steel in accordance with the requirements for these characteristics, while ensuring sufficient stability of the magnetic properties over time. The objectives of the study were analysis and consideration of the characteristic features of the material, determination of the requirements for the preparation of 1
Federal Information Fund for Ensuring the Uniformity of Measurements. Available via. https:// fgis.gost.ru/fundmetrology. Accessed 4 August 2022 (In Russ.). 2 GSO 10270-2013 Reference materials of dynamic magnetic properties of electrical cold-rolled anisotropic steel. Available via FIF EUM. https://fgis.gost.ru/fundmetrology/registry/19/items/ 389912. Accessed 4 August 2022 (In Russ.). 3 GSO 2129-89 Reference materials of specific magnetic losses (electrical steel, cold-rolled anisotropic) set SOTESL. Available via FIF EUM. https://fgis.gost.ru/fundmetrology/registry/19/ items/393998. Accessed 4 August 2022 (In Russ.). 4 GSO 10271-2013 Reference materials of dynamic magnetic properties of electrical cold-rolled anisotropic steel (sotes). Available via FIF EUM. https://fgis.gost.ru/fundmetrology/registry/19/ items/389911. Accessed 4 August 2022 (In Russ.). 5 The state verification scheme for instruments for measuring the power of magnetic losses of magnetically soft materials and the magnetic characteristics of magnetically hard materials was approved by order of Rosstandart dated December 29, 2018 No. 2816 [12]
346
S. V. Serdjukov et al.
the material and the geometric dimensions of the samples, the production of an experimental batch of RMs, and the establishment of metrological characteristics of RMs.
Materials and Methods One of the main criteria in the development of new types of RMs is to ensure the traceability of certified values to the standards of measurement units. Therefore, an important feature of the material for the type of RMs being developed is the ability to characterize non-oriented electrical steel by two magnetic quantities at once during certification of RMs. It was decided that the transfer of the unit size of the specific power of magnetic losses will be carried out by direct measurements on GET 198-2017.6 Samples of electrical cold-rolled non-oriented steel made in the form of strips for the Epstein frame were selected as candidate RMs. The steel is made according to GOST 21427.2-83 [8]. A method for measuring magnetic flux density in alternating magnetic fields of SMM samples by the induction method M.261.0059/RA.RU.311866/20227 was developed and certified to determine certified RM values by the magnetic flux density amplitude value. The measurement procedure is based on the induction method with analog-to-digital conversion of instantaneous voltage values on the measuring winding of the sample (magnetizing device) and voltage on the secondary winding of the mutual inductance coil, the primary winding of which is connected in series with the primary winding of the sample (magnetizing device), into digital codes with subsequent calculation of the magnetic characteristics.
Determination of Metrological Characteristics The approaches outlined in GOST 34100.3-2017/ISO/IEC Guide 98-3:2008 [13] were used to assess the uncertainty of the measurement results of the magnetic flux density amplitude. The standard uncertainty of type A, u A , T, of the magnetic flux density amplitude measurements was calculated as the standard deviation of the mean value: 6
GET 198-2017 State primary standard of units of power of magnetic losses, magnetic induction of a constant magnetic field in the range from 0.1 to 2.5 T and magnetic flux in the range from 1 10−5 to 3 10−2 Wb. Available via FIF EUM. https://fgis.gost.ru/fundmetrology/registry/12/items/ 397884. Accessed 4 August 2022 (In Russ.)]. 7 M.261.0059/RA.RU.311866/2022 Method for measuring magnetic induction in alternating magnetic fields of samples of magnetically soft materials by the induction method. Available via FIF EUM. https://fgis.gost.ru/fundmetrology/registry/16/items/1400432. Accessed 4 August 2022 (In Russ.).
Development of Reference Materials for AC Magnetic Properties …
u Aj
┌ | | =√
∑( )2 1 Xi j − X j , n(n − 1) i=1
347
n
(1)
where X i j is the result of determining the j-th magnetic characteristic, T; X j is the arithmetic mean of the measurement results of the magnetic flux density amplitude under the j-th measurement conditions (set value of the magnetization reversal frequency and amplitude of the magnetic field strength), T; n is the number of measurements on the sample of the magnetic flux density amplitude under the j-th measurement conditions (set value of the magnetization reversal frequency and the amplitude of the magnetic field strength). The standard uncertainty of type B, u B , T, was estimated as a composition of uncertainty components due to the uncertainty of the results of the measuring instruments used and the influence of the measurement method used. The standard uncertainty of type B of the measurement result of the magnetic flux density amplitude was calculated by the formula: ┌ ┌ | m | m ( ) |∑ |∑ ∂ f 2 2 √ · u (x z ) = √ c2 (x z ) · u 2 (x z ), uB = ∂ xz z=1 z=1
(2)
where x z is an estimate of the z-th input quantity contributing to the type B standard uncertainty; u(x z ) is the standard uncertainty of estimating the z-th input quantity; c(x z ) is a sensitivity coefficient describing the change in the output quantity when the z-th input quantity changes. The sensitivity coefficients c(x z ) for each input quantity x z contributing to u B were determined as partial derivatives of the measurement model. Experimental measurement data of SMM samples were used to calculate the numerical values of the sensitivity coefficients. The total standard uncertainty of the certified RM values was calculated using the formula: / (3) u C = u 2char + u 2stab , where u char is the relative standard uncertainty from characterization, %; u stab is the relative standard uncertainty due to instability, %.
348
S. V. Serdjukov et al.
The expanded uncertainty was calculated using the formula: U = k · uC ,
(4)
where k is the coverage factor, k = 2 for P = 0.95. Within- and between-bottle heterogeneity of RMs was not studied, since RM certification is carried out individually, while the certified value is assigned to the entire sample. The equation for measuring the magnetic flux density amplitude Bm , T, for a given value of the magnetization reversal frequency and the magnetic field strength amplitude: Bm =
Uavg + Δ(Bm )ΔHm , 4 f SW2
(5)
where Δ(Bm )ΔHm is the uncertainty component of the variation of the magnetic flux density amplitude due to the uncertainty in establishing the amplitude of the magnetic field strength, T; Uavg is the average value of the voltage on the secondary winding of the sample or magnetizing device, V; f is the magnetization reversal frequency, Hz; S is the cross-sectional area of the sample determined by the shape and geometric dimensions of the sample, m2 ; W2 is the number of turns of the secondary (measuring) winding of the sample or magnetizing device. Type B standard uncertainty was calculated using the formula: ┌( | ( )) )2 | u Uavg 2 ( u( f )Uavg )2 ( u(S)Uavg )2 ( ∂ Bm √ + + + u(Hm ) , (6) uB = 4 f SW2 4 f 2 SW2 4 f S 2 W2 ∂ Hm where ) ( u Uavg is the standard measurement uncertainty of the sinusoidal alternating current voltage on the secondary winding, V; u( f ) is the standard uncertainty of establishing the magnetization reversal frequency, Hz; u(S) is the standard uncertainty in determining the sample cross-sectional area, m2 ; u(Hm ) is the uncertainty of establishing the set value Hm determined by the formula:
Development of Reference Materials for AC Magnetic Properties …
349
┌( | ( ) ) | u Uavg M W1 2 ( Uavg M W1 u( f ) )2 ( Uavg M W1 u(M) )2 √ u(Hm ) = + + , (7) 4 f Mlavg 4 f 2 Mlavg 4 f M 2 lavg where ) ( u Uavg M is the standard uncertainty of measuring the AC voltage on the primary winding of the mutual inductance coil corresponding to the given value Hm , V; u(M) is the uncertainty in determining mutual inductance of the mutual inductance coil determined during calibration, H; u( f ) is the standard uncertainty of establishing the magnetization reversal frequency, Hz; lavg is the average magnetic path length determined by the shape and dimensions of the sample, m; ∂ Bm is the variation of the magnetic flux density amplitude with a variation in ∂ Hm the magnetic field strength amplitude of the sample near the measured value Bm , T A−1 m, determined from the experimentally determined dynamic curves of magnetization of samples of various types of SMMs. In this case, the uncertainties of the input values (frequency, voltage on the primary winding, voltage on the secondary winding, mutual inductance coefficient of the mutual inductance coils, geometric dimensions of the sample) were determined from the calibration results of the measuring instruments used. An example of the uncertainty budget of the measurement result of the magnetic flux density amplitude of a strip sample at a set magnetization reversal frequency f = 400 Hz and a magnetic field strength amplitude Hm = 40 A/m is given in Table 1. When assessing the uncertainty of the measurement results of the specific power of magnetic losses obtained by direct measurements on GET 198-2017, we were guided by the method for calculating the uncertainty in reproducing units of magnetic loss power MRN 02-GET 198-2016. The method establishes the procedure for calculating the uncertainty of reproduction of power units and specific power of magnetic losses on the State primary standard. The standard implements an induction measurement method with analog-to-digital conversion of instantaneous voltage values on the measuring winding of the sample and voltage on the standard reference resistor in the magnetizing circuit into digital codes stored in memory and used to calculate the magnetic characteristics. The stability study of the properties of the candidate RMs was carried out according to the algorithms given in GOST ISO Guide 35-2015 [14] using the measurement results obtained in the period from 2018 to 2022. Five samples of different strip thicknesses with values of magnetic characteristics in all ranges of permissible values of the certified characteristics were selected for study.
T
T T T T %
0.63·10–3 1.64·10–3 1.76·10–3 3.52·10–3 0.44
Type A standard uncertainty, u A
Type B standard uncertainty, u B
Total standard uncertainty, u C
Expanded uncertainty, U (k = 2, P = 0.95) Relative value of expanded uncertainty, U˜
V
0.449·10–2
53.487
0.1230
12.94·104
0.01525
R
R
R
T
T
A/m
A/m
T
m2
0.593·10–4
R
R
0.55·10–3
A/m
∞
A/m
0.12·10–7
40
4131.7
0.750
46.542
∞
S
Uavg
B
B
H
1.05·10–2
0.01
2.5·10–6
400
0.8594
1.54·10–3
0.63·10–3
∞
Hm
B
9
0.16·10–3
R
N
Unit
∞
M
B
A/m V A/m Hz A/m H T A/m T m2 T V
-
cju j
1.03·10–2
Hz
1·10–6
1
Unit
Contribution to uncertainty
0.75·10–6
f
B
V
0.43·10–3
∂f ∂x j
Degrees of freedom, vj
∞
Uavg M
B
T
0.63·10–3
cj =
Probability distribution
0.20·10–2
0.8052
uA
A
Unit
uj
Estimation of the standard Sensitivity coefficient uncertainty
∞
Value estimation
Source
Type
Table 1 Uncertainty budget of the measurement result of the magnetic flux density amplitude of a strip sample at f = 400 Hz, Hm = 40 A/m
350 S. V. Serdjukov et al.
Development of Reference Materials for AC Magnetic Properties …
351
Results and Discussion The metrological characteristics given in Table 2 were obtained based on the results of the studies carried out for the developed type of RMs. The magnitude of the error (uncertainty) depends on the magnetic field strength and magnetization reversal frequency. The values of the certified characteristics can be determined in the magnetization reversal frequency range from 50 to 5000 Hz. The expected frequency of re-determination of metrological characteristics is two years. In addition, a number of requirements are established for the geometric dimensions of the strips: length from 280 to 350 mm, width (30 ± 0.2) mm, thickness from 0.1 to 0.5 mm. The strips should not differ in length by more than ± 0.5 mm. The crosssectional area of the sample should be in the range from 0.5 • 10–4 to 1.5 • 10–4 m2 . Strips after cutting should be annealed to relieve mechanical stress. Strips after annealing should be subjected to aging to stabilize the magnetic properties. The number of strips in the sample should be a multiple of four; one half of the strips is cut along the rolling direction (the limiting angle between the cutting and rolling direction is no more than ± 5°), the other half is cut across the rolling direction. The obtained results make it possible to include in the purpose of this type of RMs their use for certification of measurement procedures for calibration and verification of measuring instruments, as well as for monitoring the metrological characteristics of measuring instruments during type approval tests. Table 2 Metrological characteristics of the developed RMs Result
Certified characteristics Specific power of magnetic losses
Magnetic flux density amplitude
Range of permissible values of the certified characteristics
From 0.1 to 100.0 W/kg
Permissible values of relative expanded uncertainty
From 0.3 to 1.5%
Limits of permissible values of relative error
From ± 0.3 to ± 1.5%
Range of permissible values of the certified characteristics
From 0.01 to 2.0 T
Permissible values of relative expanded uncertainty
From 0.5 to 1.5%
Limits of permissible values of relative error
From ± 0.5 to ± 1.5%
352
S. V. Serdjukov et al.
Conclusion In the course of the study, an approach to the creation of RMs for the metrological support of AC magnetic properties of electrical cold-rolled non-oriented steel made in the form of strips for the Epstein frame was proposed and tested. Based on the results of the study, the authors developed practical recommendations for the geometric dimensions of the samples and the process of preparing the RM material. It was noted that the magnitude of the error (uncertainty) directly depends on the magnitude of the magnetic field strength and magnetization reversal frequency. The metrological characteristics of the investigated RM type were established: • the specific power of magnetic losses in the range from 0.1 to 100.0 W/kg with permissible values of relative expanded uncertainty from 0.3 to 1.5% and limits of permissible values of relative error from ± 0.3 to ± 1.5%; • the magnetic flux density amplitude in the range from 0.01 to 2.0 T with the permissible values of the relative expanded uncertainty from 0.5 to 1.5% and the limits of the permissible values of the relative error from ± 0.5 to ± 1.5%. A pilot batch of RMs was manufactured. The main feature of RMs is that the value of one of the two certified characteristics (specific power of magnetic losses) is transmitted directly from GET 198-2017, and the other (magnetic flux density amplitude) is determined in accordance with the certified measurement procedure. The achieved results are of practical importance, because the developed RMs can provide the possibility of a complete and reliable determination of the magnetic characteristics of samples of non-oriented electrical steel in accordance with the requirements of the current standards. Further research will focus on the development of RMs for AC magnetic properties made in the form of rings and sheets and manufactured for the needs of a wider range of consumers and manufacturers of various SMMs. Acknowledgements The research did not receive financial support in the form of a grant from any organization in the public, commercial or non-profit sectors. Author Contributions S. V. Serdjukov—conducting research work, writing a draft version of the article, preparing visual materials for presenting the results at the conference; T. I. Maslova— development of the research concept, methodology development, conducting research work; I. S. Tsay—planning, management, and control of research activities; E. A. Volegova—control of research, manuscript revision and editing. Conflict of Interest The article was prepared on the basis of a report presented at the V International Scientific Conference “Reference Materials in Measurement and Technology” (Yekaterinburg, September 13–16, 2022). The article was admitted for publication after the abstract was revised, the article was formalized, and the review procedure was carried out. The version in the Russian language is published in the journal “Measurement Standards. Reference Materials” 2023;19(4):73–81. (In Russ.). https://doi.org/10.20915/2077-1177-2023-194-73-81.
Development of Reference Materials for AC Magnetic Properties …
353
References 1. Albrecht M, Malygin MA, Kupec J, Ulvr M, Appino C, Hall M et al (2018) 1337 EURAMET.EM.M-S2: supplementary comparison of national standard facilities in the field of measuring the polarization and specific total power loss in soft magnetic materials. Metrologia 55(1A):01006. https://doi.org/10.1088/0026-1394/55/1A/01006 2. Korzunin GS (2005) The modern status of inspection of certain magnetic characteristics of anisotropic electrical steel (review). Russ J Nondestr Test 10:23–57 (in Russian) 3. Didik IuI, Maliuk VP (1997) Metrological assurance of quality control of soft magnetic materials. Zakonodatelnaia i Prikladnaia Metrologiia 6:36 (in Russian) 4. Sievert J (2000) The measurement of magnetic properties of electrical sheet steel—survey on methods and situation of standards. J Magn Magn Mater 215–216:647–651. https://doi.org/10. 1016/S0304-8853(00)00251-1 5. Sievert J, Ahlers H (1994) The magnetic metrology of materials—a review. Bull Mater Sci 17(7):1393–1399. https://doi.org/10.1007/BF02747236 6. Sievert J, Ahlers H, Fiorillo F, Hall M, Henderson L, Rocchino L (2001) Magnetic measurements on electrical steels using Epstein and SST methods. Technical report, PTB, Germany 7. Vdovin IuA, Veksler AZ, Koneva ZA (1979) Reference materials—an effective means of quality control of electrical steel. Izmeritel’naia Tekhnika 6:54–56 (in Russian) 8. GOST 21427.2-83 (2003) Cold-rolled isotropic electrical-sheet steel. Specifications. IPK Izdatelstvo standartov, Moscow, p 120 (in Russian) 9. GOST 32482-2013 (2014) Gold-rolled grain-oriented electrical steel sheet and strip for transformer. Specifications. Standartinform, Moscow, p 14 (in Russian) 10. GOST 33212-2014 (2015) Non-grain oriented electrical steel strip. Specifications. Standartinform, Moscow, p 14 (in Russian) 11. Volegova EA, Malygin MA, Maslova TI, Volegov AS (2018) GET 198-2017, State primary standard of unit of power of magnetic losses and unit of magnetic induction of constant magnetic field in range from 0.1 to 2.5 T and magnetic flux from 1·10–5 to 3·10–2 Wb. Meas Tech 61(3):199–202. https://doi.org/10.1007/s11018-018-1409-2 12. Order of the Federal Agency for Technical Regulation and Metrology “On approval of the state verification scheme for instruments for measuring the magnetic loss power of soft magnetic materials and the magnetic characteristics of hard magnetic materials” dated December 29, 2018 № 2816. Available via. https://metrcons.ru/info/gosudarstvennye-poverochnye-skhemy/ dekabr-2018/prikaz-ot29-dekabrya-2018-g-2816-ob-utverzhdenii-gosudarstvennoy-povero chnoy-skhemy-dlya-sredstv-izm/. Accessed 4 Aug 2022 (in Russian) 13. GOST 34100.3-2017/ISO/IEC Guide 98-3:2008 (2008) Uncertainty of measurement. Part 3. Guide to the expression of uncertainty in measurement. Standartinform, Moscow, p 106 (in Russian) 14. GOST ISO Guide 35-2015 (2017) Reference materials. General and statistical principles for certification. Standartinform, Moscow, p 60 (in Russian)
Certified Reference Materials for the Phase Transition Temperature of Organic Substances Based on Anhydrous Sodium Acetate and Sodium Methansulfonate Artyom P. Shipitsyn , Andrei M. Nepomiluev , and Anastasiya E. Tyurnina
Abstract The requirements for thermal analysis instruments are increasing in terms of extending the measurement ranges and improving their accuracy with scientific and technological progress in the field of metrological supervision, chemical, and pharmaceutical industries. The study of determining the melting point of organic substances is of particular relevance for the metrological support of the applied thermal analysis instruments and traceability to the base physical units. The purpose of the research was to test the possibility of using organic substances based on sodium acetate and sodium methanesulfonate as phase transition temperature standards for candidate materials to certified reference materials (CRMs) for the phase transition temperature traceable to the SI unit “temperature.” The procedure for measuring the phase transition temperature (melting point) was performed by differential scanning calorimetry using the thermal analyzer STA 449 F5 JUPITER from the State Primary Standard GET 173-2017. The determination of the CRM certified value was carried out in accordance with GOST ISO Guide 35-2015; the contributions to the uncertainty due to heterogeneity of the starting materials were evaluated; the short- and long-term stabilities of the materials were studied. Keywords Reference material · Thermal analysis · Phase transition temperature · Melting point · Anhydrous sodium acetate · Sodium methanesulfonate · Measurement procedure · Calibration
A. P. Shipitsyn (B) · A. M. Nepomiluev · A. E. Tyurnina UNIIM—Affiliated Branch of the D. I. Mendeleyev Institute for Metrology, Yekaterinburg, Russia e-mail: [email protected] A. M. Nepomiluev e-mail: [email protected] © D. I. Mendeleyev Institute for Metrology 2024 E. P. Sobina et al. (eds.), Reference Materials in Measurement and Technology, https://doi.org/10.1007/978-3-031-49200-6_23
355
356
A. P. Shipitsyn et al.
Abbreviations TA DSC FIF EUM CRM RTD
Thermal analysis Differential scanning calorimetry Federal information fund for ensuring the uniformity of measurements Certified reference material Resistance temperature detector
Introduction TA is a popular type of measurement in the pharmaceutical, chemical, and other industries [1]. In particular, one of the most effective TA methods is a DSC method [2]. In addition to its wide application for determining the temperature and specific melting enthalpy of organic substances, the DSC method is used to study polymers [3–5] and inorganic substances [6]. Melting point measuring instruments are used by research and testing laboratories to determine and control the melting, dropping, and softening points used in the development and production of a wide range of materials. The obtained values of thermophysical quantities are important for choosing the optimal temperature of technological processes, determining the best storage conditions for materials, their operating temperature during operation, as well as for testing cosmetic products, fats, and substances with a waxy consistency. The requirements for TA instruments are constantly increasing; this is related to their indispensability in solving most scientific, engineering, and manufacturing problems [7]. In particular, this applies to various types of phase transition temperature analyzers, including melting, boiling, and various intermediate states of substances and materials. The analysis of the data in the FIF EUM1 revealed that currently more than 10 types of analyzers of such companies as Mettler-Toledo GmbH, Bibby Scientific Limited, BUCHI Labortechnik AG, etc. are registered in the Russian Federation. The need to create certified reference materials for the phase transition temperature of organic substances is related to the fact that some types of analyzers (for example, reg. No. 59055-14 and reg. No. 67807-17 in the FIF EUM) with an error in the measurement range from 180 to 400 °C was not standardized due to the lack of relevant certified reference materials (GSO). Metrological support was provided by melting point reference materials based on benzophenone (melting point ~ 48 °C) and benzoic acid (melting point ~ 122 °C). Metrological support for other analyzers (for example, reg. No. 41280-14, reg. No. 71833-18)2 was carried out using the 1
Federal Information Fund for Ensuring the Uniformity of Measurements. Available via FIF EUM. https://fgis.gost.ru/fundmetrology/registry/19. Accessed 10 October 2022 (In Russ.). 2 FIF 59055-14 Instruments for measuring the melting point. Available via FIF EUM. https://fgis. gost.ru/fundmetrology/registry/4/items/372174. Accessed 10 October 2022 (In Russ.). FIF 67807-17 Instruments for measuring the melting point. Available via FIF EUM. https://fgis. gost.ru/fundmetrology/registry/4/items/381782. Accessed 10 October 2022 (In Russ.).
Certified Reference Materials for the Phase Transition Temperature …
357
CRM based on caffeine (melting point ~ 238 °C) in addition to benzophenone and benzoic acid, as well as by using a compact platinum resistance temperature detector (RTD). At the same time, metrological support using the CRM has a number of advantages compared to temperature measurement by comparison with the RTD (especially during calibration): ease of measurements, enhanced measurement rate, direct contact of the CRM with the measurement cell (the absence of temperature gradients associated with the placement of the RTD near the walls of the instrument cell). Thus, the study of determining the temperature and specific enthalpy of melting of organic substances is of particular relevance for the metrological support of MI for measuring higher temperatures and traceability to the base physical units. The purpose of the research is to test the use of organic substances based on anhydrous sodium acetate and sodium methanesulfonate as phase transition temperature standards for candidate materials to certified reference materials for the phase transition temperature traceable to the SI unit “temperature” (K (°C)).
Materials and Methods Reagents Anhydrous sodium acetate (C2 H3 O2 Na) and sodium methanesulfonate (CH3 NaO3 S) are a powdered substance with a mass fraction of the main component (98.0–98.5)%. Substances with first-order phase transition (melting) temperatures closest to the upper limit of the measurement range of measuring instruments were selected as candidate materials to CRMs.
Equipment The thermal analyzer STA 449 F5 JUPITER (NETZSCH, Germany) from the State Primary Standard of units of mass fraction, mass (molar) concentration of water in solid and liquid substances and materials GET 173-20173 implements the DSC method. The mass of the starting material was measured on a laboratory balance of special accuracy class I (Sartorius, Germany) with a weighing resolution of 10 µg and an 3
GET 173-2017 State primary standard of units of mass fraction, mass (molar) concentration of water in solid and liquid substances and materials: UNIIM—Affiliated Branch of the D. I. Mendeleyev Institute for Metrology. Available via FIF EUM. https://fgis.gost.ru/fundmetrology/ registry/12/items/397857. Accessed 10 October 2022 (In Russ.).
358
A. P. Shipitsyn et al.
Table 1 Measurement ranges, values for accuracy, correctness, repeatability, intralaboratory precision, combined standard and expanded uncertainty Measurement Repeatability, Intralaboratory Correctness, Accuracy, Combined range, °C °C precision, °C °C °C standard uncertainty, °C
Absolute expanded uncertainty, °C P = 0.95 and k =2
From 200 to 400 incl.
0.17
0.01
0.05
0.12
0.17
0.085
expanded uncertainty of 80 µg. The mass of the crucible and the weight of the crucible with a sample were obtained in ten parallel measurements. The sample mass was determined by the mass differences.
Research Methods and Procedure The DSC method is widely used to determine the temperature and specific enthalpy of melting of organic substances [8]. The heat-accumulating materials are being intensely researched [9]. In particular, other thermophysical characteristics of organic substances are being studied [12–14] based on such organic compounds as myristic, palmitic, and stearic acids [10], esters and fatty acids [11]. In addition, this method is supported by the fact that materials based on benzophenone (GSO 11070-20184 ) and benzoic acid (GSO 11071-20185 ) were characterized by the same method. Studies of CRMs were performed using the certified measurement procedure (MP) M.241.0036/RA.RU.311866/20226 ; the MP measurements are presented in Table 1. The impact of factors affecting the measurement accuracy has been minimized, namely: • the crucible: manufacturers of thermal analysis instruments recommend the use of Pt crucibles for organic measurements to avoid interaction of the test material with crucible material in accordance with ASTM E 967-08 [15]. Closed crucibles were used for more even heat distribution in the sample; 4
GSO 11070-2018 Reference materials benzophenone melting point type-approved (CO C13H10O). Available via FIF EUM. https://fgis.gost.ru/fundmetrology/registry/19/items/593689. Accessed 10 October 2022 (In Russ.). 5 GSO 11071-2018 Reference materials of the approved type of melting point of benzoic acid (CO C7 H6 O2 ). Available via FIF EUM. https://fgis.gost.ru/fundmetrology/registry/19/items/394949. Accessed 10 October 2022 (In Russ.). 6 M.241.0036/RA.RU.311866/2022 Method for measuring the phase transition temperatures of sodium methanesulfonate (CH3 NaO3 S) and anhydrous sodium acetate (C2 H3 O2 Na) by differential scanning calorimetry: UNIIM—Affiliated Branch of the D. I. Mendeleyev Institute for Metrology. Available via FIF EUM. https://fgis.gost.ru/fundmetrology/registry/16/items/1399257. Accessed 10 October 2022 (In Russ.).
Certified Reference Materials for the Phase Transition Temperature …
359
• the sample: good contact between the material and the bottom of the crucible is essential to increase the heat transfer and, therefore, the measurement accuracy. In this regard, flat-bottomed crucibles were used. The starting material was placed in the crucible so as to completely cover the bottom; then the compaction was carried out using special equipment, which is a common technique in sample preparation [14]. The mass of samples did not exceed 20 mg to reduce the “mass effect” and increase the signal-to-noise ratio > 10 [10, 12, 14] as specified in GOST R 57931-2017 [16]; • the atmosphere: it is necessary to use a gas with low thermal conductivity for precision measurements, therefore, measurements were carried out in N2 atmosphere with a purity of 99.99% at a flow rate of 40 ml/min; • the temperature calibration of MI: a thermal analyzer calibrated using GSO 231282/2316-82 CRMs for temperatures and phase-transition points (set SOTSF) was used. In particular, Ga, In, and Sn have accuracy indicators that correspond to working standards of the 1st category according to the second part of the State verification schedule for means measuring temperature (GOST 8.558-2009 [17]). This procedure is widely used by research organizations to calibrate instruments before precision measurements, in particular for In and Sn [12–14, 18], according to the recommendations of ASTM E 967-08; • the sensitivity of measuring instruments: a DSC/TG sample holder (not DTA/TG) with a sensitivity of 1.2 µV/mW was applied to increase the sensitivity; • the heating rate: in view of the fact that higher heating rates led to a shift in heat effects to higher temperatures, a heating mode at a rate of 1.0 °C/min was used during the study of CRMs. This value is indicated in the verification methods for MI (reg. No. 41280 and reg. No. 85498 in the FIF EUM7 ). An additional argument in favor of the selected rate was the fact that rates from 0.5 °C/min up to 2 °C/ min are used worldwide in the analysis of similar materials [14, 18–20]. Thus, it can be argued that the establishment of certified values at different rates increases the complexity both for instrument users during calibration and for organizations verifying such instruments.
Results and Discussion The experimental data in determining the certified values of CRMs are shown in Figs. 1 and 2. The thermograms presented in Figs. 1 and 2 were processed in accordance with the MP. The obtained data show that the standard deviation of the measurement results does not exceed 0.01 °C, which meets the requirements of the MP. 7
FIF 41280-14 Melting point analyzers. Available via FIF EUM. https://fgis.gost.ru/fundmetro logy/registry/4/items/351558. Accessed 10 October 2022 (In Russ.). FIF 85498-22 Melting point analyzers. Available via FIF EUM. https://fgis.gost.ru/fundmetro logy/registry/4/items/1399531. Accessed 10 October 2022 (In Russ.).
360
A. P. Shipitsyn et al.
Fig. 1 Thermogram of anhydrous sodium acetate
Fig. 2 Thermogram of sodium methanesulfonate
Taking into account the fact that many organic substances actively sublime at high temperatures [21], the mass loss of the studied materials was measured. The results for anhydrous sodium acetate are shown in Fig. 3. Based on the data presented on the thermogram (Fig. 3), the mass loss during 6 h of heating, 2.5 h of which the CRM was at a temperature above the melting point, changed by 5%, which is 0.66 mg. The melting temperature value changed within 0.03 °C, which indicates an insignificant effect of the mass loss on the certified value of the CRM and a low sublimation rate. The obtained metrological characteristics of the investigated batch of CRMs are presented in Table 2.
Certified Reference Materials for the Phase Transition Temperature …
361
Fig. 3 The mass loss of anhydrous sodium acetate
Table 2 Metrological characteristics of certified reference materials for the phase transition temperature (melting point) Certified characteristics of the phase transition temperature
Certified value*
Absolute error limits at P = 0.95
Absolute expanded uncertainty at P = 0.95 and k = 2
Melting point of anhydrous sodium acetate (C2 H3 O2 Na), °C
329.45
± 0.20
0.20
Melting point of sodium methanesulfonate (CH3 NaO3 S), °C
353.30
± 0.20
0.20
* The
metrological characteristics of CRMs are given for the heating mode at a rate of 1.0 °C/min
The range of values indicated in the type specification is from 328.35 to 330.35 °C for anhydrous sodium acetate, from 352.05 to 354.05 °C for sodium methanesulfonate, which is due to the difference in the mass fraction of the main component from batch to batch during the subsequent certification of materials as certified reference materials. The obtained certified values of the melting point of the CRM based on anhydrous sodium acetate are consistent within ± 1.4 °C with the reported reference values [22–24] as shown in Table 3. Data on the study of sodium methanesulfonate with a similar chemical composition are not available. Taking into account the results obtained for anhydrous sodium acetate, and the correctness of the selected method and experimental conditions, we believe that the obtained values are representative.
362
A. P. Shipitsyn et al.
Table 3 Comparison of the certified values of the CRM melting point of anhydrous sodium acetate with the reported reference values (the values are indicated in °C) The certified value of UNIIM—Affiliated Branch of the D. I. Mendeleyev Institute for Metrology
[18]
[19]
[20]
329.45
329.62
328.10
328.20
The traceability of the certified values of the phase transition temperature of anhydrous sodium acetate and sodium methanesulfonate is provided to the SI unit “temperature” reproduced by GET 34-20208 by using certified reference materials (GSO 2312-82/2316-82) in phase transition temperature measurements. The procedure described above can be applied for determining the thermophysical characteristics of similar substances, such as saccharin, vanillin, etc.
Conclusion The purpose of this work was to test the results of research on the use of organic substances based on anhydrous sodium acetate and sodium methanesulfonate as phase transition temperature standards for the development of certified reference materials for the phase transition temperature traceable to the SI unit “temperature.” In the course of experimental studies, the possibility of using the procedure for measuring the phase transition temperature (melting point) by differential scanning calorimetry using the thermal analyzer STA 449 F5 JUPITER from GET 173-2017 was proved. The procedure was performed in accordance with GOST ISO Guide 352015 [25]. The contributions to the uncertainty due to heterogeneity of the starting materials were evaluated; the short- and long-term stabilities of the materials were studied, and the certified values of CRMs were determined. The obtained metrological characteristics of the investigated batch of CRMs are as follows: the range of permissible certified characteristics of the melting point of the phase transition is (328.35–330.35) °C for anhydrous sodium acetate, (352.05– 354.05) °C for sodium methanesulfonate. It was shown that the certified values of the melting point of the developed CRMs are consistent within ± 1.4 °C with the reference values presented in IUPAC. The developed CRMs passed the metrological examination and were included in the Register of approved types of reference materials of the FIF EUM as a set of certified reference materials for the phase transition temperature (set of SS TPKR) GSO 11928-2022/GSO 11929-2022.9 8
GET 34-2020 State primary standard of temperature unit in the range from 0 to 3200 °C: D. I. Mendeleyev Institute for Metrology. Available via FIF EUM. https://fgis.gost.ru/fundmetrology/ registry/12/items/1385580. Accessed 10 October 2022 (In Russ.). 9 GSO 11928-2022/GSO 11929-2022 reference materials of phase transition temperatures (set of SS TPKR). Available via FIF EUM. https://fgis.gost.ru/fundmetrology/registry/19/items/1399806. Accessed 10 October 2022 (In Russ.).
Certified Reference Materials for the Phase Transition Temperature …
363
The theoretical significance of the obtained results lies in the proof of the possibility of applying differential scanning calorimetry for type approval tests to determine the thermophysical characteristics of organic substances based on anhydrous sodium acetate and sodium methanesulfonate, as well as similar substances, such as saccharin, vanillin, etc. The practical significance of the obtained results lies in the possibility of establishing and monitoring the stability of the calibration dependence of thermal analysis measuring instruments; certification of measurement procedures (methods) and accuracy control of the measurement results of the phase transition temperature of metals, metal salts, metal oxides, polymeric materials, organic and inorganic substances. Acknowledgements The research did not receive financial support in the form of a grant from any organization in the public, commercial or non-profit sectors. All measurements were performed using the equipment of the D. I. Mendeleyev Institute for Metrology. Author Contributions Shipitsyn A. P.—development of a methodology/procedure, implementation of a formal analysis, writing a draft version of the article, conducting research work; Nepomiluev A. M.—development of the research concept, conducting research work; Tyurnina A. E.—manuscript revision and editing. Conflict of Interest The article was prepared on the basis of a report presented at the V International Scientific Conference “Reference Materials in Measurement and Technology” (Yekaterinburg, September 13–16, 2022). The article was admitted for publication after the abstract was revised, the article was formalized, and the review procedure was carried out. The version in the Russian language is published in the journal “Measurement Standards. Reference Materials” 2023;19(1):17–27 (In Russ.). https://doi.org/10.20915/2077-1177-2023-191-17-27.
References 1. Feist M (2015) Thermal analysis: basics, applications, and benefit. ChemTexts 1:8. https://doi. org/10.1007/s40828-015-0008-y 2. Mehczel JD, Prime RB (2009) Thermal analysis of polymers: fundamentals and applications. Wiley, New Jersey, p 688 3. Kiseleva TY, Ivanenko IP, Kostenko OV, Yakuta EV, Ilyushin AS, Kovaleva SA et al (2021) Application of differential scanning calorimetry to study the resistance of uhmwpe-based composite materials to electron irradiation. Russ Acad Sci 95(5):678–685. https://doi.org/10. 31857/S0044453721050174 4. Zhorin VA, Kiselev MR (2021) Melting and crystallization of high-density polyethylene mixed with organic acids and acid–base indicators after plastic deformation at high pressures. Russ J Phys Chem A 95(7):1307–1312. https://doi.org/10.31857/S0044453721070311 5. Greengrass MA (2021) Thermal study on crystallisation and phase transitions of PA6 by DSC: technical report, p 31. Available via. https://www.researchgate.net/publication/335082996. Accessed 17 Sept 2022
364
A. P. Shipitsyn et al.
6. Gavrichev KS (2020) Precision calorimetry in the Kurnakov institute of general and inorganic chemistry of the Russian academy of sciences (IGIC RAS): brief review. Russ J Inorgan Chem 65(5.):609–612. https://doi.org/10.31857/S0044457X20050098 7. Nepomiluev AM, Kazantsev VV, Shipitsyn AP (2019) Development of reference materials for thermodynamic properties: metrological support of measurements in the field of thermal analysis and calorimetry in Russia. Meas Stand Ref Mater 15(3):15–22 (in Russian). https:// doi.org/10.20915/2077-1177-2019-15-3-15-22 8. Kahwaji S, White MA (2021) Organic phase change materials for thermal energy storage: influence of molecular structure on properties. Molecules 26(21):6635. https://doi.org/10.3390/ molecules26216635 9. Hafsaoui SL, Mahmoud R (2007) Solid-liquid equilibria of binary systems containing ntetracosane with naphthalene or dibenzofuran. J Therm Anal Calorim 88:565–570. https:// doi.org/10.1007/s10973-006-8084-2 10. Zeng JL, Cao Z, Yang DW, Xu F, Sun LX, Zhang L et al (2009) Phase diagram of palmitic acid-tetradecanol mixtures obtained by DSC experiments. J Therm Anal Calorim 95:501–505. https://doi.org/10.1007/s10973-008-9274-x 11. Rathgeber Ch, Hiebler S, Bayón R, Cabeza LF, Zsembinszki G, Englmair G (2020) Experimental devices to investigate the long-term stability of phase change materials under application conditions. Appl Sci 10:7968. https://doi.org/10.3390/app10227968 12. Yagofarov MI, Nagrimanov RN, Ziganshin MA, Solomonov BN (2018) New aspects of relationship between the enthalpies of fusion of aromatic compounds at the melting temperatures and the enthalpies of solution in benzene at 298.15 K. Part I. J Chem Thermodyn 116:152–158. https://doi.org/10.1016/J.JCT.2017.09.006 13. Bui LH, de Klerk A (2014) Thermal behavior of potassium C1–C12 n-alkanoates and its relevance to fischer–tropsch. J Chem Eng Data 59(2):400–411. https://doi.org/10.1021/je4 00874d 14. Kosova DA, Provotorov DI, Kuzovchikov SV, Uspenskaya IA (2020) Thermal analysis study of phase transformations of magnesium and calcium methanesulfonates. Russ J Inorgan Chem 65(5):752–757. https://doi.org/10.31857/S0044457X20050128 15. ASTM E 967-08 Standard test method for temperature calibration of differential scanning calorimeters and differential thermal analyzers 16. GOST R 57931-2017 (2017) Composites. Determination of melting and crystallization temperatures by thermal analysis. Standartinform, Moscow, p 14 (in Russian) 17. GOST 8.558-2009 (2019) State system for ensuring the uniformity of measurements. State verification schedule for means measuring temperature. Standartinform, Moscow, p 14 (in Russian) 18. Rathgeber Ch, Miró L, Cabeza LF, Hiebler S (2014) Measurement of enthalpy curves of phase change materials via DSC and T-history: when are both methods needed to estimate the behaviour of the bulk material in applications? Thermochim Acta 596:79–88. https://doi.org/ 10.1016/j.tca.2014.09.022 19. Pauvonic I, Mehrota AK (2000) Liquid–solid phase transformation of C16 H34 , C28 H58 and C41 H84 and their binary and ternary mixtures. Thermochim Acta 356:27–38. https://doi.org/ 10.1016/S0040-6031(00)00503-7 20. Barreneche C, Solé A, Miró L, Martorell I, Inés FA, Cabeza LF (2013) Study on differential scanning calorimetry analysis with two operation modes and organic and inorganic phase change material (PCM). Thermochim Acta 553:23–26. https://doi.org/10.1016/j.tca. 2012.11.027 21. Muravyev NV, Monogarov KA, Melnikov IN, Pivkina AN, Kiselev VG (2021) Learning to fly: thermochemistry of energetic materials by modified thermogravimetric analysis and highly accurate quantum chemical calculations. Phys Chem Chem Phys 23(29):15522–15542. https:// doi.org/10.1039/D1CP02201F
Certified Reference Materials for the Phase Transition Temperature …
365
22. Franzosini P, Ferloni P, Spinolo G, Schiraldi A (1988) Molten alkali metal alkanoates, vol 33. Pergamon Press, IUPAC 23. Franzosini P, Sanesi M (1980) Thermodynamic and transport properties of organic salts: IUPAC chemical data series. Elsevier Ltd, p 289. https://doi.org/10.1016/C2013-0-02976-3 24. Haynes WM (2014) CRC handbook of chemistry and physics, 95th ed., p 2704. https://doi. org/10.1201/b17118 25. GOST ISO Guide 35-2015 (2017) Reference materials. General and statistical principles for certification. Standartinform, Moscow, p 62 (in Russian)
Certified Reference Materials for the Phase Transition Temperature (Curie Temperature) Based on Alumel, Nickel, and Iron Silicide Artyom P. Shipitsyn , Andrei M. Nepomiluev , and Anastasiya E. Tyurnina
Abstract The requirements for thermal analysis instruments are increasing in terms of their metrological support with the development of scientific and technological progress in the field of metrological supervision and electronics industry. The study of determining the phase transition temperature, namely the Curie temperature, is of particular relevance for the metrological support of the applied thermal analysis instruments and traceability to the base physical units. The purpose of the research was to test the possibility of using materials based on alumel, nickel and iron silicide (trafoperm) as phase transition temperature standards for candidate materials to certified reference materials (CRMs) for the phase transition temperature traceable to the SI unit “temperature.” The procedure for measuring the phase transition temperature (Curie temperature—TC ) was performed by the thermomagnetometric method using the thermal analyzer STA 449 F5 JUPITER from the State Primary Standard GET 173-2017. The determination of the CRM certified value was carried out in accordance with GOST ISO Guide 35-2015; the contributions to the uncertainty due to heterogeneity of the starting materials were evaluated; the short- and long-term stabilities of the materials were studied. Keywords Reference material · Thermogravimetric analysis · Phase transition temperature · Curie temperature · Measurement procedure
A. P. Shipitsyn (B) · A. M. Nepomiluev · A. E. Tyurnina UNIIM—Affiliated Branch of the D. I. Mendeleyev Institute for Metrology, Yekaterinburg, Russia e-mail: [email protected] A. M. Nepomiluev e-mail: [email protected]
© D. I. Mendeleyev Institute for Metrology 2024 E. P. Sobina et al. (eds.), Reference Materials in Measurement and Technology, https://doi.org/10.1007/978-3-031-49200-6_24
367
368
A. P. Shipitsyn et al.
Abbreviations TA DSC TGA FIF EUM CRM TM
Thermal analysis Differential scanning calorimetry Thermo-gravimetric analysis Federal information fund for ensuring the uniformity of measurements Certified reference material Thermomagnetometry
Introduction Interest in the study of the thermophysical properties of substances and materials appeared already in the sixteenth century, and to date, numerous methods of thermal analysis (TA) remain an integral part of world metrology [1]. According to ASTM E 473-16 [2], thermogravimetric analysis (TGA) is a method where the mass of a substance is measured as a function of temperature or time, while the substance is subjected to a controlled temperature under a defined atmosphere. This method of analysis has found wide application in almost all areas of chemistry. Thermogravimetric analyzers or devices for simultaneous thermal analysis (STA) are used, which, in addition to the TGA method, implements differential scanning calorimetry (DSC). More than 20 types of analyzers of such companies as MettlerToledo GmbH, NETZSCH, Perkin Elmer, TA Instruments, are included in the FIF EUM.1 One of the types of the TGA method in determining the characteristics of substances and materials is thermomagnetometry (TM), where an increase or decrease in the mass of a sample is determined depending on the direction of the magnetic field gradient [3]. The reason for the change in the mass of the sample is a second-order phase transition, where the sample changes from the ferromagnetic state to the paramagnetic one. This transition is called the “Curie point” (Curie temperature). TM is mainly used to characterize ferromagnetic compounds, because they are key elements of most modern radio engineering, electronic, and computing devices. Lithium-titanium ferrites [4], lithium-zinc ferrites [5], nickel-zinc ferrites [6], magnetite [7], Heusler alloys [8], and other ferromagnetic compounds [9–11] are being studied. The relevance of thermal analysis, in particular, the development of reference materials for the phase transition temperature is confirmed by the European roadmap for thermophysical properties metrology [12]. In the Russian Federation, the main means of ensuring the uniformity of measurements of TGA and STA analyzers are reference materials (RMs) for the first-order phase transition temperature [13]. 1
Federal Information Fund for Ensuring the Uniformity of Measurements. Available via FIF EUM. https://fgis.gost.ru/fundmetrology/registry/19. Accessed 10 October 2022 (In Russ.).
Certified Reference Materials for the Phase Transition Temperature …
369
However, if these RMs are applicable for metrological support of STA (testing, verification, and calibration), then there are some difficulties for TGA devices. The main difficulty is related to the fact that the c-DTA method (calculated differential thermal analysis) is used to calibrate the instruments, which is not standardized, as opposed to the method based on the Curie temperature (second-order phase transition temperature) described in ASTM E 1582-00 [14]. Various groups of researchers have carried out and are carrying out work on the creation of CRMs for the method based on the Curie temperature [15]. As a result of the research work, a set of certified reference materials for the Curie temperature (CRM TC) was developed, which consists of three materials: alumel (NiMn3 Al, Tc ~ 163 °C), nickel (Ni, Tc ~ 352 °C), and trafoperm (SiFe, Tc ~ 751 °C).
Materials and Methods Reagents The starting material for the research was: • an alumel alloy (NiMn3 Al) with a chemical composition (Ni 94%, Mn 2.1%, Al 1.7%, Si 1.5%, Fe 0.3%, Mg 0.15%, Cu 0.1%, C 0.05%); • a metal (Ni) with a chemical composition (Ni 99.97%, Cu 0.003%, Mn 0.002%, C 0.005%, Si 0.002%, S 0.002%, Ti 0.001%, Mg 0.003%, Fe 0.01%); • a silicon iron alloy (SiFe) with a chemical composition (Fe 95%, Si 4.5%, Mn 0.02%, Cu 0.2%, C 0.07%, Cr 0.06%, P 0.03%, S 0.02%). The International Confederation for Thermal Analysis and Calorimetry (ICTAC) has recommended the use of a set of the following 5 materials as certified reference materials (CRMs) for metrological support of the temperature measurement range from 100 to 1,000 °C: permanorm 3 (Tc ~ 267 °C), nickel (Tc ~ 355 °C), mumetal (Tc ~ 386 °C), permanorm 5 (Tc ~ 458 °C), trafoperm (Tc ~ 751 °C) [16]. Subsequently, the measurement range was expanded (from 25 to 1,000 °C), and the list was adjusted: alumel (Tc ~ 153 °C), nickel (Tc ~ 358 °C), Ni0.83 Co0.17 alloy (Tc ~ 554 °C), Ni0.63 Co0.37 alloy (Tc ~ 746.4 °C), Ni0.37 Co0.63 alloy (Tc ~ 930.8 °C) [17]. Three materials (alumel, nickel, and trafoperm) were selected for research for the following reasons: • these materials can metrologically provide a temperature measurement range (from 25 to 770 °C) of existing TA devices (FIF EUM); • these materials have been studied and certified as CRMs in other countries; • the main source of temperature measurement error in TGA devices is the thermocouple error, which has a linear statistical characteristic. This allows using a smaller number of certified reference materials with characteristics located at the beginning, middle, and end of the specified measurement range, thereby saving time spent on verification/calibration of TA devices.
370
A. P. Shipitsyn et al.
Equipment The thermal analyzer STA 449 F5 JUPITER (NETZSCH, Germany) from the State Primary Standard of units of mass fraction, mass (molar) concentration of water in solid and liquid substances and materials GET 173-2017,2 which implements simultaneous thermal analysis (STA) that combines differential scanning calorimetry (DSC) and thermogravimetric analysis (TGA). The mass of the starting material was measured on a laboratory balances of special accuracy class I (Sartorius, Germany) with a weighing resolution of 10 µg and an expanded uncertainty of 80 µg. The mass of the crucible and the mass of the crucible with a sample were obtained in ten parallel measurements. The sample mass was determined by the mass differences.
Research Methods and Procedure Magnetometers [8, 10] or thermomagnetic analysis measuring instruments [18] are used to determine the Curie temperature. The main advantage of TM compared to other methods is the ability to measure the Curie temperature on a device that is calibrated and measures the melting point of materials that are fixed points of the International Temperature Scale (ITS-90), which increases the reliability of the measured values due to the same measurement conditions (the same temperature sensor, measurement rate, atmosphere). It should be noted that the TM method was used in the certification of materials as CRMs in other countries [15]. The wide application of the TM method in the characterization of the substances and materials mentioned in the Introduction also confirms the correctness of the selected method for the certification of reference materials for the Curie temperature. The method is sensitive and allows measuring the Curie temperature of materials containing magnetic ferrite phases with a mass fraction of more than 2% of the main component [4]. Some researchers process thermograms based on the peak of the derivative of the TG signal [5, 19], but the generally accepted and recommended in ASTM E 1582-00 is the assessment of the end point of the phase transition temperature. A schematic representation of the installation implementing the TM method is shown in Fig. 1.
2
GET 173-2017 State primary standard of units of mass fraction, mass (molar) concentration of water in solid and liquid substances and materials: UNIIM—Affiliated Branch of the D. I. Mendeleyev Institute for Metrology. Available via FIF EUM. https://fgis.gost.ru/fundmetrology/ registry/12/items/397857. Accessed 10 October 2022 (In Russ.).
Certified Reference Materials for the Phase Transition Temperature …
371
Fig. 1 The schematic representation of the installation implementing the TM method for determining the phase transition temperature (Curie temperature)
CRMs were studied using the certified measurement procedure M.221.0029/ RA.RU.311866/20213 (MP), the accuracies of which are presented in Table 1. The impact of factors affecting the measurement accuracy has been minimized, namely: • the crucible: manufacturers of thermal analysis instruments recommend the use of Al2 O3 crucibles for measurements of metals and their alloys to avoid interaction of the test material with crucible material as specified in ASTM E 967-08 [20]. Closed crucibles were used for more even heat distribution in the sample; • the sample: there are increased requirements for the samples under study to determine the first-order phase transition temperature (melting, crystallization), namely, the geometry of the sample (a good thermal contact between the sample and the crucible is important), the weight of the samples (it should not exceed 20 mg to reduce the influence of the “mass effect”). These requirements become irrelevant for determining the second-order phase transition due to the fact that only the magnetic properties of materials change. The weight of samples varied from 20 to 40 mg; 3
M.241.0036/RA.RU.311866/2022 Method for measuring the phase transition temperatures of sodium methanesulfonate (CH3 NaO3 S) and anhydrous sodium acetate (C2 H3 O2 Na) by differential scanning calorimetry: UNIIM—Affiliated Branch of the D. I. Mendeleyev Institute for Metrology. Available via FIF EUM. https://fgis.gost.ru/fundmetrology/registry/16/items/1399257. Accessed 10 October 2022 (In Russ.).
372
A. P. Shipitsyn et al.
Table 1 Measurement ranges, values for accuracy, correctness, repeatability, intralaboratory precision, combined standard and expanded uncertainty Measurement Repeatability, Intralaboratory Correctness, Accuracy, Combined ranges, °C °C precision, °C °C °C standard uncertainty, °C
Absolute expanded uncertainty, °C at P = 0.95 and k =2
From 28 to 200 incl.
0.01
0.05
0.06
0.11
0.055
0.11
From 200 to 400 incl.
0.01
0.05
0.12
0.17
0.085
0.17
From 400 to 700 incl.
0.02
0.07
0.26
0.33
0.165
0.33
From 700 to 1600 incl.
0.02
0.07
0.60
0.67
0.335
0.67
• the atmosphere: it is necessary to use a gas with low thermal conductivity for precision measurements, therefore, measurements were carried out in N2 atmosphere with a purity of 99.99% at a flow rate of 250 ml/min; • the temperature calibration of MI: a thermal analyzer was used that was calibrated using certified reference materials for temperatures and phase-transition points (set SOTSF) GSO 2312-82/2316-824 (in particular, In, Sn, Zn), and certified reference materials for temperature and specific enthalpy of phase transitions (set SOTSF-2) GSO 11890-2022/11896-20225 (in particular Al, Ag, Au), the accuracy indicators of which correspond to the working standards of the 1st category according to the second part of the State verification schedule for means measuring temperature (GOST 8.558-2009 [21]). This procedure is widely used by research organizations [7, 15, 22, 23] to calibrate instruments before precision measurements traceable to ITS-90 according to the recommendations of ASTM E 1582-00; • the sensitivity of MI: a DSC/TG sample holder (rather than DTA/TG) with a sensitivity of 1.2 µV/mW was used to increase the sensitivity; • the magnetic device: Ne–Fe–B magnets were used and placed on the device in such a way that the mass change was ~ 5% (ASTM E 1582-00 recommendation ≥ 2%); • the heating rate: in view of the fact that higher heating rates lead to a shift in heat effects to higher temperatures, a heating mode at a rate of 10 °C/min was used 4
GSO 2312-82/2316-82 Reference materials of the approved type of temperatures and heats of phase transitions (set SOTSF). Available via FIF EUM. https://fgis.gost.ru/fundmetrology/registry/ 19/items/393963. Accessed 10 October 2022 (In Russ.). 5 GSO 11890-2022/GSO 11896-2022 Reference materials of the approved type of temperature and specific enthalpy of phase transitions of metals and metal salts (set of CO SOTSF-2). Available via FIF EUM. https://fgis.gost.ru/fundmetrology/registry/19/items/1398408. Accessed 10 October 2022 (In Russ.).
Certified Reference Materials for the Phase Transition Temperature …
373
during the study of CRMs. An additional argument in favor of the selected rate was the fact that rates from 1.0 °C/min up to 20 °C/min are used worldwide in the analysis of materials [4, 7, 19]. At the same time, the rate of 10 °C/min is standardized in the verification methods for TA MI (FIF EUM). Chinese colleagues used a similar rate in the development of CRMs [15].
Results and Discussion The thermograms of the experiments in determining the certified values of CRMs are shown in Figs. 2, 3 and 4.
Fig. 2 Thermogram of nickel with a purity of 99.97%
Fig. 3 Thermogram of alumel
374
A. P. Shipitsyn et al.
Fig. 4 Thermogram of trafoperm
The thermograms were processed in accordance with the MP; one sample was used for each material. The obtained data show that the standard deviation of the measurement results does not exceed 0.02 °C, which meets the requirements of the MP. The obtained metrological characteristics of the investigated batch of CRMs are presented in Table 2. The range of values indicated in the type specification is from 160 to 170 °C for alumel, from 350 to 360 °C for nickel, from 745 to 755 °C for trafoperm, which is due to the difference in the mass fraction of the main component from batch to batch during the subsequent certification of materials as certified reference materials. The variation in temperature values is also determined by the heating rate, the atmosphere, and the type of crucibles; therefore, all conditions for certification of RMs are indicated in the CRM certificate. Particular attention should be paid to nickel, since the obtained certified value differs considerably from the values specified in other sources [15, 23]. The difference is mainly due to the purity of nickel: it was 99.99% in the above sources, and it was 99.97% in the study. In this regard, additional measurements of high-purity nickel with a mass fraction of the main substance of 99.99% (ES-1.3-176-029-2018-Ni) were performed. The measurement results are presented in Table 3, and thermograms are shown in Fig. 5. The processing was carried out by the TG signal. The thermograms presented in Fig. 5 are processed in accordance with the MP similarly to Figs. 2, 3 and 4. The obtained data show that the standard deviation of the measurement results does not exceed 0.02 °C, which indicates a good reproducibility of the measured values.
Certified Reference Materials for the Phase Transition Temperature …
375
Table 2 Metrological characteristics of certified reference materials for the phase transition temperature (Curie temperature) Certified characteristic
Certified value
Absolute error limits at P = 0.95
Absolute expanded uncertainty at P = 0.95 and k = 2
Phase transition temperature (Curie temperature of alumel), °C
163.00
± 0.30
0.30
Phase transition temperature (Curie temperature of nickel), °C
352.00
± 0.40
0.40
Phase transition temperature (Curie temperature trafoperm), °C
751.00
± 0.70
0.70
Note • the metrological characteristics of CRMs were obtained under the following conditions • heating rate—10.0 °C/min • furnace atmosphere—inert (nitrogen) • crucible material—Al2 O3 • chemical composition of CRMs—indicated in the CRM certificate • change in the mass of the sample when applying a magnetic field—5%
Table 3 The measurement results for nickel with a purity of 99.99%
Measurement No.
Measured value, °C
Average value, °C 358.32
1
358.301
2
358.342
3
358.304
The measurement conditions are similar to [15], namely: • the change in the mass of the sample when applying a magnetic field is ~ 5%; • the heating rate is 10 K/min; • the purity of the material is 99.99%. The results of Tc measurements by the DSC signal were additionally processed similarly to studies [23]. The measurement results are presented in Table 4, and thermograms are shown in Fig. 6. Nickel with a purity of 99.97% was selected as the material for testing. The approaches and methods for determining, as well as the characteristics of the developed CRMs, are consistent with other groups of researchers and reference values: • for nickel with a purity of 99.99%: the results obtained are consistent within ± 0.05 and ± 0.04 °C with the data of NIM (China) [15] and Université Paris-Sud
376
A. P. Shipitsyn et al.
Fig. 5 Termogram of nickel with a purity of 99.99% Table 4 The measurement results for nickel with a purity of 99.97% Measurement No.
Measured value, °C
Average value, °C
1
352.155
352.18
2
352.187
3
352.188
Fig. 6 Thermogram of nickel with a purity of 99.97%
Certified Reference Materials for the Phase Transition Temperature …
377
(France) [19], respectively, and within ± 0.1 °C with [17, 22]. The difference with the data given in [24] was within ± 1.1 °C, which is associated with different changes in the mass of the sample associated with application of a magnetic field and different masses of samples. • for trafoperm: the data are consistent within ± 1.5 °C [16]; • for alumel and nickel with a purity of 99.97%: data on the study of materials are not available. Taking into account the results obtained for other materials and the correctness of the selected method, as well as the experimental conditions, we believe that the obtained values are representative. The results obtained by processing the DSC signal (Fig. 6) are consistent with the certified values within ± 0.2 °C, which indicates the possibility of applying this method to determine the Curie temperature of various substances and materials. The traceability of the obtained certified values for the phase transition temperature is provided to the temperature unit (°C) reproduced by the State primary standard of temperature unit in the range from 0 to 3200 °C GET 34-2020,6 and provided through the use of reference materials of In, Sn, Zn, Al, Ag, and Au, which are the fixed points of the International Temperature Scale (ITS-90), when measuring the phase transition temperature. The procedure described above can be applied for determining the characteristics of other ferromagnetic compounds, as well as for certification of RMs based on them.
Conclusion The purpose of this work was to test the results of research on the use of materials based on alumel, nickel, and iron silicide (trafoperm) as phase transition temperature standards for the development of certified reference materials for the phase transition temperature (Curie temperature) traceable to the SI unit “temperature.” In the course of experimental studies, the possibility of using the procedure for measuring the phase transition temperature (Curie temperature) by thermomagnetometric and differential scanning calorimetry methods using the thermal analyzer STA 449 F5 JUPITER from GET 173-2017 was proved. The certified values of CRMs were established; the procedure was performed in accordance with GOST ISO Guide 35-2015 [25]; the contributions to the uncertainty due to heterogeneity of the starting materials were evaluated; short- and long-term stabilities were studied. Comparison of the certified values of the Curie temperature of the developed CRMs with the reference values of the Curie temperature showed that the certified characteristics of the CRMs are well consistent. The theoretical significance of the obtained results lies in the proof of the possibility of applying thermomagnetometric and differential scanning calorimetry 6
GET 34-2020 State primary standard of temperature unit in the range from 0 to 3200 °C: D. I. Mendeleyev Institute for Metrology. Available via FIF EUM. https://fgis.gost.ru/fundmetrology/ registry/12/items/1385580. Accessed 10 October 2022 (In Russ.).
378
A. P. Shipitsyn et al.
methods for the development of certified reference materials for the phase transition temperature (set SO TK) GSO 12005-2022/GSO 12007-2022.7 The practical significance of the obtained results expand the possibility of establishing and monitoring the stability of the calibration dependence of measuring instruments for thermogravimetric analysis, as well as to increase the precision of measurements of the Curie temperature of various substances and materials. Acknowledgements The research did not receive financial support in the form of a grant from any organization in the public, commercial or non-profit sectors. All measurements were performed using the equipment of the D.I. Mendeleyev Institute for Metrology. Contribution of the Authors Shipitsyn A. P.—development of methodology/procedure, implementation of a formal analysis, writing a draft version of the article, conducting research work, preparing/creating visual materials; Nepomiluev A. M.—research concept development, conducting research work, preparing/creating visual materials; Tyurnina A. E.—manuscript revision and editing. Conflict of Interest The article was prepared on the basis of a report presented at the V International Scientific Conference “Reference Materials in Measurement and Technology” (Yekaterinburg, September 13–16, 2022). The article was admitted for publication after the abstract was revised, the article was formalized, and the review procedure was carried out. The version in the Russian language is published in the journal “Measurement Standards. Reference Materials” 2023;19(2):35–46. (In Russ.). https://doi.org/10.20915/2077-1177-2023-192-35-46.
References 1. Hay B (2020) A brief history of the thermal properties metrology. Measurement 155:107556. https://doi.org/10.1016/j.measurement.2020.107556 2. ASTM E 473-16 (2019) Standard terminology relating to thermal analysis and rheology. https:// doi.org/10.1520/E0473-16 3. Gallagher PK (1997) Thermomagnetometry. J Therm Anal 49:33–44. https://doi.org/10.1007/ BF01987419 4. Lysenko EN, Nikolaev EV, Surzhikov AP, Nikolaeva SA (2020) Kinetic analysis of lithium– titanium ferrite formation from mechanically milled reagents. Mater Chem Phys 239:122055. https://doi.org/10.1016/j.matchemphys.2019.122055 5. Astafyev AL, Surzhikov AP, Lysenko EN (2016) Estimation of thermomagnetometry method sensitivity for magnetic phase determination. IOP Conf Ser Mater Sci Eng 110:012090. https:// doi.org/10.1088/1757-899X/110/1/012090 6. Astafyev A, Lysenko E, Surzhikov A, Nikolaev E, Vlasov V (2020) Thermomagnetometric analysis of nickel–zinc ferrites. J Therm Anal Calorim 142:1775–1781. https://doi.org/10.1007/ s10973-020-10182-3 7. Katasonov PA, Garifullin RA (2013) Thermal characterization of magnetite obtained by means of plasmaelectroytic syntesys. Lett Mater 3(4):322–325. https://doi.org/10.22226/2410-35352013-4-322-325 7
GSO 12005-2022/GSO 12007-2022 Reference materials phase transition temperatures (set SO TK). Available via FIF EUM. https://fgis.gost.ru/fundmetrology/registry/19/items/1403745. Accessed 10 October 2022 (In Russ.).
Certified Reference Materials for the Phase Transition Temperature …
379
8. Hasier J, Riolo MA, Nash P (2017) Curie temperature determination via thermogravimetric and continuous wavelet transformation analysis. EPJ Techniques Instrument 4:5. https://doi. org/10.1140/epjti/s40485-017-0040-y 9. Nash P, Meschel S, Gu Q (2020) Two decades of calorimetry and thermal analysis at the thermal processing technology centre at illinois institute of technology. Russ J Phys Chem A 94:2624–2639. https://doi.org/10.1134/S003602442013018X 10. Zhou Y, Nash P (2019) On the Curie temperature and Nishizawa horn in the Al–Co–Ni system. J Alloy Compd 779:566–576. https://doi.org/10.1016/j.jallcom.2018.11.103 11. Zhou Y, Nash P, Bessa SM et al (2017) Phase equilibria in the Al–Co–Ni alloy system. J Phase Equilib Diffus 38:630–645. https://doi.org/10.1007/s11669-017-0586-z 12. Filtz JR, Wu J, Stacey C, Hollandt J, Monte C, Hay B et al (2015) A European roadmap for thermophysical properties metrology. Int J Thermophys 36:516–528. https://doi.org/10.1007/ s10765-014-1807-x 13. Nepomiluev AM, Kazantsev VV, Shipitsyn AP (2019) Development of reference materials for thermodynamic properties: metrological support of measurements in the field of thermal analysisand calorimetry in Russia. Measure Stand Ref Mater 15(3):15–22 (in Russian). https:// doi.org/10.20915/2077-1177-2019-15-3-15-22 14. ASTM E 1582-00 (2017) Standard test method for temperature calibration of thermogravimetric analyzer. https://doi.org/10.1520/E1582-00 15. Wang T, Wang H, Wang F, Li J, Zhang Q, Huang X (2018) Certification of reference materials of alumel, nickel and iron for curie point. J Therm Anal Calorim 131:1979–1985. https://doi. org/10.1007/s10973-017-6618-4 16. ICTA Certified reference materials for thermogravimetry GM-761. NIST, Gaithersberg 17. Mehczel JD, Prime RB (2009) Thermal analysis of polymers: fundamentals and applications. Wiley, New Jersey, p 704 18. Antipin VS, Kuz’min MI, Pecherskii DM, Tsel’movich VA, Yazev SA (2014) The substance of the chelyabinsk meteorite: results of geochemical and thermomagnetic studies. Dokl Earth Sci 458(1):57–60. https://doi.org/10.7868/S0869565214250136 19. Gallagher PK, Zhong Zm, Charsley EL, Mikhail SA, Todoki M, Taniguahi K et al (1993) A study of the effect of purity on the use of nickel as a temperature standard for thermomagnetometry. J Therm Anal 40:1423–1430 (in Russian). https://doi.org/10.1007/BF02546906 20. ASTM E 967-08 (2018) Standard test method for temperature calibration of differential scanning calorimeters and differential thermal analyzers. https://doi.org/10.1520/E0967-18 21. GOST 8.558-2009 (2019) State system for ensuring the uniformity of measurements. State verification schedule for means measuring temperature. Standartinform, Moscow, 14 p (in Russian) 22. Gallagher PK, Blaine R, Charsley EL, Koga N, Ozao R, Sato H et al (2003) Magnetic temperature standards for TG. J Therm Anal Calorim 72:1109–1116. https://doi.org/10.1023/A:102 5032013135 23. Legendre B, Sghaier M (2011) Curie temperature of nickel. J Therm Anal Calorim 105:141– 143. https://doi.org/10.1007/s10973-011-1448-2 24. Lysenko E, Surzhikov A, Nikolaev E, Starý O (2023) Curie temperature control of magnetic materials using thermogravimetric measurements in magnetic field. In: Lysenko E, Rogachev A, Starý O (eds) Recent developments in the field of non-destructive testing, safety and materials science. ICMTNT 2021. Studies in systems, decision and control, 433, 195–203. https://doi. org/10.1007/978-3-030-99060-2_18 25. GOST ISO Guide 35-2015 (2017) Reference materials. General and statistical principles for certification. Standartinform, Moscow, 62 p (in Russian)
Reference Materials of Absorbed Dose: Expanding Dynamic Range and Improving Measurement Accuracy Vladimir P. Tenishev
Abstract Establishment and control of metrological characteristics of measurements of absorbed ionizing radiation doses in the range of 0.01 and 200 kGy by reference materials is an urgent task due to their wide application in various industries. The most convenient means of metrological support for transferring a unit of absorbed dose rate of intense photon, electron, and beta radiation to measuring instruments in radiation technologies are reference materials with established metrological traceability to the International System of Units (SI). In the present study, a method for expanding the dynamic range of measuring the absorbed dose of high-intensity ionizing radiation by radiochromic film dosimetry systems was considered and tested. The accuracy (uncertainty) of dose measurements was estimated depending on the initial optical density of the radiation-sensitive layer of the radiochromic composition. The possibility of expanding the dose characteristics and improving the metrological characteristics of the existing reference materials of absorbed dose (in water) for use as secondary standards (Measures) of the absorbed dose of ionizing radiation reproducing and (or) storing one or more points of the selected measurement scale of the absorbed dose with increased accuracy (uncertainty) of the measured values of the absorbed dose (in water) in an extended dynamic range was shown. Keywords Radiochromic film · Radiation-sensitive composition · Optical density · Spectrophotometer · Reference material · Absorbed dose · Multilayer combination of absorbed dose reference materials
Abbreviations IOD OD AD
Induced optical density Optical density Absorbed dose
V. P. Tenishev (B) All-Russian Scientific Research Institute of Physicotechnical and Radio Engineering Measurements (VNIIFTRI), Moscow Region, Russia e-mail: [email protected] © D. I. Mendeleyev Institute for Metrology 2024 E. P. Sobina et al. (eds.), Reference Materials in Measurement and Technology, https://doi.org/10.1007/978-3-031-49200-6_25
381
382
RDF RSC RSL SD RM
V. P. Tenishev
Radiochromic dye film Radiation-sensitive composition Radiation-sensitive layer Standard deviation Reference material
Introduction A reliable assessment of the absorbed dose measurements (in water) of ionizing radiation in reference materials in the range of 0.01 and 200 kGy in various radiationtechnological processes determines the quality of products, their safety, the efficiency of the radiation-technological installation, and the technical and economic indicators of the entire radiation process in general [1]. In the Russian Federation, including the countries of the Customs Union, the traceability of the uniformity of the AD measurements in radiation technologies is carried out based on GET 209-20141 [2]. According to the State verification schedule [3], the transfer of an absorbed dose rate unit of intense photon, electron, and beta radiation in radiation technologies to measuring instruments should be carried out using secondary standards (comparators) or working standards indicating the range, accuracy (uncertainty) of measurements, including the main methods of verification (calibration). Reference materials of AD based on a radiochromic dye film (RDF) with a layer of radiation-sensitive composition (RSC) [4–10] were approved as working standards and dose measuring instruments. An important characteristic of radiochromic film reference materials (RMs) is the absence of temperature dependence and insensitivity to ambient light during processing and measurements. According to the FIF EUM,2 no secondary absorbed dose measurement standard has been registered as of May 2022. Thus, the purpose of this study is to analyze the possibility of expanding the dose characteristics and improving the metrological characteristics of the existing reference materials of AD for using RMs as secondary standards (comparators) of AD of ionizing radiation reproducing and (or) storing one or more points of the selected scale of the AD measurements with increased accuracy (uncertainty) of the measured values of absorbed dose in the extended dynamic range.
1
GET 209-2014 State Primary Special Standard of the Unit of Absorbed Dose Rate of Intense Photon, Electronic and Beta Radiation for Radiation Technologies: Custodian Institute All-Russian Scientific Research Institute of Physical Technical and Radio Technical Measurements Available via FIF EUM. https://fgis.gost.ru/fundmetrology/registry/12/items/397897. Accessed 4 August 2022 (In Russ.). 2 Federal Information Fund for Ensuring the Uniformity of Measurements. Available via. https:// fgis.gost.ru/fundmetrology. Accessed 4 August 2022 (In Russ.).
Reference Materials of Absorbed Dose: Expanding Dynamic Range …
383
Theoretical Background In this work, we consider a methodology for creating comparators based on certified reference materials of absorbed dose SO PD(E)-1/10 [5] for the range (1–10) kGy. As a rule, a batch of films from one release prepared based on specifications [4] in accordance with the certificate of certified reference materials [5] contains samples with an optical density A in the range: A0i − 0.01 ≤ Ai ≤ A0i + 0.01,
(1)
where A0i is the average values of optical density (OD) (from 0.15 to 0.2) of the i-th batch of raw film. Then separate sub-batches (sets) are selected from different batches according to the value of the initial optical density Ak satisfying the condition: Ak0 − 0.001 ≤ Ak ≤ Ak0 + 0.001,
(2)
where Ak is the average optical density of a separate k-th sub-batches (k-th set). Thus, each new k-th sub-batch is completed with the values of the initial OD in the range defined by the formula (2). In other words, we will obtain sub-batches of films-blanks with initial OD values ten times narrowed than in the initial batch. It is easy to estimate that this procedure will select sub-batches of film samples that have a standard uncertainty u based on the initial OD that is significantly better than the standard uncertainty of a set of samples based on the initial film batch (not selected based on the OD). The proposed procedure will lead to the creation of a next generation of high-precision film reference materials of AD that significantly exceed the existing certified reference materials both in terms of dynamic range and accuracy characteristics. Such RMs can also be used as Measures for reproducing and (or) storing one selected value of the absorbed dose scale, as well as a set of Measures reproducing and (or) storing two or more points of the scale, for example, when calibrating the RM within the entire selected AD range.
Materials and Methods Preparation of Film Samples-Blanks The main idea of the proposed method for expanding the dynamic range and improving the measurement accuracy of film dosimeters is to select films with known OD values in a significantly narrower OD range than a very wide range of OD values of the initial batches of raw film from a set of blanks for RMs. The main objective is to minimize the source of measurement uncertainty in terms of the initial optical
384
V. P. Tenishev
Fig. 1 The design of films-blanks of reference materials of absorbed dose Fig. 2 Manufacture of a batch of blanks of reference materials of absorbed dose: 1 is a raw film roll; 2 is cut long (up to 2 m) strips ~ (10–12) mm wide; 3 is blanks of a reference material with a length of (30–35) mm; 4 is a batch of a reference material sealed in paper containers, 3–5 pieces per batch
density. Although this process significantly increases the time and effort for each case, but at the same time allows to achieve the desired objective. RMs of absorbed dose SO PD(E)-1/10 are made from a single-use polymeric film material “Colored radiation-sensitive film of the CRF type” manufactured according to specifications [8] with a radiation-sensitive layer (RSL) (copolymer with 4-diethylaminoazobenzene dye) with a thickness of ~ 28 μm applied on a polyethylene terephthalate support with a thickness of ~ 100 μm (Fig. 1). Then CRFs were cut into rectangular fragments (10–12) × (30–35) mm2 and hermetically packed (thermally sealed) in 3–6 pieces in a container made of ~ 50 μm thick paper (Fig. 2) laminated with polyethylene (LDPE) grade 15803-020 or 10803020. This paper was selected due to its weak susceptibility to ionizing radiation.
Selection of Films by the Value of the Initial Optical Density The first step was to determine the distribution of the real OD range of long films or a set of unirradiated samples-blanks by measuring the OD on a Specord-210 Plus spectrophotometer (Analitik Jena AG, Germany) (Fig. 3). The optical density of RMs of AD was measured on long strips 10–12 mm wide (see Fig. 2, position 2) randomly selected from a batch.
Reference Materials of Absorbed Dose: Expanding Dynamic Range …
385
Fig. 3 Optical density distribution of one batch of unirradiated films
As shown in the figure, the initial OD is distributed in the range from 0.150 to 0.164 over the area of the raw roll for a given batch of film. This figure corresponds to the one shown in Fig. 4 distribution function of the number of film samples-blanks depending on the optical density.
Fig. 4 Distribution of the number of samples-blanks by the optical density in a raw film batch
386
V. P. Tenishev
Thus, the OD (density and thickness of the RSL, respectively) is very inhomogeneous over the area of the raw film roll for the manufacture of RMs, which leads to a large inaccuracy (uncertainty) in the optical density value and, accordingly, a large inaccuracy in the AD measurement after irradiation of films in the ionizing radiation field. As can be seen from the measurement results of the initial OD of the films (Fig. 4), the maximum amount of film occurs for an OD of ~ 0.156 with an uneven decrease in the number of films with distance from the average value of the OD of the entire batch. Sets of five films with similar OD values within the OD values were collected from the obtained samples: Ak − 0.001 ≤ Ako ≤ Ak + 0.001,
(3)
where Ak was selected through a step of 0.001 in the range of optical densities 0.150–0.164 of the selected batch (see Fig. 3).
Irradiation Facilities of the State Standard GET 209-2014 with Radionuclide Sources Each set containing five identical RDF fragments packed in a sealed moistureproof paper container and selected in accordance with Fig. 5 was irradiated with doses in the range from 200 to 25,000 Gy in a cylindrical aluminum phantom with a height of 90 mm, diameter of 30 mm, and thickness of 1.8 mm at the laboratory 137 Cs-machine for microbiological and biochemical investigation LMB-γ-1 M (Russia) with a dose rate of 0.5 Gy/s and a laboratory 60 C0-machine for microbiological and radiationchemical investigation MPX-γ-100 (Russia) with a dose rate of 2.5 Gy/s. In these experiments, the phantom with films was at a distance of 40 mm in the center of capsules with IR sources arranged in the form of a cylindrical squirrel wheel (ø ~ 80 mm).
Means for Measuring Optical Density The optical density of films was measured in different modes of the Specord-210 Plus spectrophotometer in the carousel mode (OD of 15 samples was measured sequentially at one time). It has been experimentally established that the induced optical density (IOD) saturates at level 3 in the absorption measurement mode, and its spatial resolution is no worse than 1 mm (optical beam size is ~ 7 × 1 mm2 ). The maximum sensitivity of the selected samples of the RDF blanks, as for the initial one, is observed at a wavelength of 550 nm, at which the IOD was read. The IOD of
Reference Materials of Absorbed Dose: Expanding Dynamic Range …
387
Fig. 5 Selection of sets of five pieces of film samples from 15 blank samples with similar OD values. The inset shows estimates of the uncertainty u for each of the three sets of selected films
all sets of irradiated films was started ~ 5 min after the end of irradiation (the time spent on removing the samples from the irradiation chamber, delivering, and placing them in the spectrophotometer holder). Initially, we measured the OD spectral distribution irradiated with an absorbed dose of up to 10 kGy in order to establish the wavelength at which films show the maximum sensitivity (the highest sensitivity is in the range of 540–560 nm with a maximum at 550 nm). Then, the optical densities of the irradiated sets of films at values of 200, 250, 750, 1000 Gy and at 5, 15, 20, 25 kGy (in water) were measured at a fixed wavelength of 550 nm. The measurements were also carried out in the time scanning mode at fixed intervals in order to estimate the change in OD after irradiation (post-effect). The linearity of the optical density of film depending on the absorbed dose was estimated by a graphical method in the Excel program. Stability over time, the dependence of readings on the IR energy of film radiochromic systems will be published separately.
388
V. P. Tenishev
Results and Discussion Dependence of the Induced Optical Density of the Selected Sets of Films on the Absorbed Dose Figure 6 shows the experimental dependence induced with [11–13]. In the entire range of irradiated doses from 200 to 20 kGy, the IOD A value is mathematically described by a linear function: A = 0.908 · D , (R 2 = 0.998),
(4)
where D is the absorbed dose, R2 is the coefficient of linear determination (Fig. 6).
Fig. 6 Diagram of the dependence of the induced optical density of the selected sets of films on the absorbed dose D
Reference Materials of Absorbed Dose: Expanding Dynamic Range …
389
However, as follows from the data in the insets to Fig. 6, the OD dependence on the AD at low (200–800 Gy) and high (15 kGy and above) is non-linear. This behavior of the OD at low doses is associated with insufficiently efficient absorption of the RSL energy of ionizing radiation, and the non-linearity at high doses is apparently due to the saturation of the optical density of the RSL based on a copolymer with 4-diethylaminoazobenzene dye. This study compared the performance of the described method (with film sampling at initial ODs) of dosimetry with a conventional non-selective film dosimetry procedure with a wide range of initial ODs. Figure 7 shows the results of a comparison of the relative values of the IOD u/Aavg for different batches of films (with and without selection of sets according to the initial values of the OD of unirradiated films) in the entire range of absorbed doses studied.
Discussion and Conclusions In this research, we proposed a new method for expanding the dynamic range of OD measurements by radiochromic film dosimeters and improving their accuracy characteristics. Verification experiments showed that the range of measured doses from blanks for reference materials of absorbed dose SO PD(E)-1/10 (Fig. 7) for sets with selected samples of films with initial optical densities in the range A0 − 0.001 ≤ A ≤ A0 + 0.001 is from 200 Gy up to 20 kGy with a standard uncertainty of no
Fig. 7 Relative uncertainty (ui /Aangi ) of the arithmetic mean values of OD for six batches for each value of AD, where index i = 0, which corresponds to sets of films selected according to the initial OD, and indices i = 1–6 correspond to sets with unselected OD
390
V. P. Tenishev
worse than 0.8%, while sets of samples not selected according to OD with values in the range A0 − 0.01 ≤ A ≤ A0 + 0.01 exhibit a standard uncertainty of no better than 2% in the approved range of the AD (1–10) kGy. Thus, the method of sampling sets of films in a narrow OD interval, in contrast to sets of films in a wide OD range (without sampling), gives a significantly better result in estimating both the dynamic range and the standard uncertainty of the measured doses. The results indicate that: 1. Certified reference materials of absorbed dose SO PD(E)-1/10 can be used in a significantly wide range of absorbed doses from 200 to 25 kGy and with a standard measurement uncertainty up to 0.8%. 2. According to the State verification scheme [3], measuring instruments with a total relative standard deviation of the measurement results (0.8–2.5)%, including instability for the calibration interval, are allowed as secondary standards and ADR comparators. The research results showed that radiochromic film certified reference materials under certain conditions for selecting film sets can be used as secondary standards—ADR comparators. Acknowledgements The author expresses his gratitude to the team of the Laboratory of Technological Dosimetry of the All-Russian Scientific Research Institute of Physical-Technical and Radio-Technical Measurements (VNIIFTRI) for their help and support in conducting this research. All measurements were performed using the equipment of the All-Russian Scientific Research Institute of Physical-Technical and Radio-Technical Measurements. Conflict of Interest The article was prepared on the basis of a report presented at the V International Scientific Conference “Reference Materials in Measurement and Technology” (Yekaterinburg, September 13–16, 2022). The article was admitted for publication after the abstract was revised, the article was formalized and the review procedure was carried out. The version in the Russian language is published in the journal “Measurement Standards. Reference Materials” 2023;19(4):63–71. [in Russian]. https://doi.org/10.20915/2077-1177-2023-19-463-71.
References 1. Abdulov RA, Aleikin VV, Generalova VV, Gromov AA, Gurskii MN, Emel’ianenko IA et al (2015) Ensuring the uniformity of measurements in radiation technologies. Almanac Mod Metrol 2:198–206 (in Russian) 2. Aleykin VV, Generalova VV, Gromov AA, Gurskiy MN, Zhanzhora AP, Emel’yanenko IA et al (2015) National primary special standard for the unit of absorbed dose rate of intense photon, electron, and beta radiation for radiation technologies GET209-2014. Almanac Mod Metrol 5:54–74 (in Russian) 3. Order of the Federal Agency for Technical Regulation and Metrology “State verification scheme for instruments for measuring the absorbed dose rate of intense photon, electron and beta radiation for radiation technologies” dated 27.11.2018 No. Available via https://metrcons.ru/upl oad/iblock/24e/24efd22b2debc54b3cef5acd5871ffd3.pdf. Accessed 4 Aug 2022 (in Russian)
Reference Materials of Absorbed Dose: Expanding Dynamic Range …
391
4. TU 2379-026-13271746-2006 (2006) POR-type dyed radiation-sensitive film, 13 p 5. GSO 8916-2007 standard sample of the absorbed dose of photon and electron radiation (copolymer with 4-diethylaminoazobenzene dye) SO PD(E)-1/10. Available via FIF EUM https://fgis.gost.ru/fundmetrology/registry/19/items/391269. Accessed 4 Aug 2022 (in Russian) 6. Kovalenko OI, Tenishev VP (2020) Measuring instruments for monitoring the absorbed dose during radiation processing of food and agricultural products. In: Nuclear physics research and technologies in agriculture: collection of reports of the international scientific and practical conference, 16–18 Sept 2020, Obninsk, Russia, pp 335–337 (in Russian) 7. Gromov AA, Zhanzhora AP, Kovalenko OI (2021) Application of certified reference materials of absorbed dose for process validation of irradiation of medical supplies and food products. Measure Stand Ref Mater 17(4):23–32 (in Russian). https://doi.org/10.20915/2687-08862021-17-4-23-32 8. Tenishev VP, Emelyanenko IA (2020) Radiation-sensitive film compositions for measuring absorbed doses within the 100–1000 Gy range. In: Medvedevskikh S, Kremleva O, Vasil’eva I, Sobina E (eds) Reference materials in measurement and technology. RMMT 2018. Springer, Cham. https://doi.org/10.1007/978-3-030-32534-3_13 9. Tenishev VP (2020) Spectral, dosimetric, and metrological characteristics of radiochromic radiation-sensitive compositions. Measure Techn 8:59–65 (in Russian). https://doi.org/10. 32446/0368-1025it.2020-8-59-65 10. Tenishev VP (2022) Spectral and dosimetric properties of multilayer structures of radiochromic absorbed dose reference materials. J Phys Conf Ser 2192:012017. https://doi.org/10.1088/17426596/2192/1/012017 11. JCGM 100:2008. Evaluation of measurement data—guide to the expression of uncertainty in measurement. Available via https://www.bipm.org/documents/20126/2071204/JCGM_100_ 2008_E.pdf/cb0ef43f-baa5-11cf-3f85-4dcd86f77bd6. Accessed 4 Aug 2022 12. ISO/ASTM 51261:2013 (2013) Practice for calibration of routine dosimetry systems for radiation processing. ISO. Available via https://www.iso.org/standard/60211.html. Accessed 4 Aug 2022 13. ISO/ASTM 51707:2015 (2013) Guide for estimation of measurement uncertainty in dosimetry for radiation processing. ISO. Available via https://www.iso.org/standard/66730. html. Accessed 4 Aug 2022
Development of Measures for Metrological Support of Raman Spectroscopy Anna A. Yushina, Vladimir A. Aseev , and Alexander D. Levin
Abstract Raman spectroscopy is widely used in various industries and requires the use of special means for metrological support. In this study, prototype measures made from inorganic glasses activated with metal ions to excite fluorescence lines at specific wavelengths were developed for calibrating Raman spectrometers and microscopes on a scale of relative intensities with metrological traceability to SI base units. The study established the metrological characteristics of prototype measures, where the certified characteristic is the relative intensity of the reproduced fluorescence radiation. The maximum expanded uncertainty of measuring the relative fluorescence intensity at a coverage factor k = 2 is 9.4%, 5.2%, and 2.8% for prototype measures designed to reproduce the relative fluorescence intensity when excited at wavelengths of 532 nm, 633 nm, and 785 nm, respectively. By certifying the measures on the laser Raman confocal microscope Confotec NR 500, part of the GET 196-2015, metrological traceability can be established through the scale of relative intensities of the GET 86-2017 microscope, providing traceability to SI units of the “(light) energy flux” value. These findings have practical significance, since they allow the calibration characteristics of Raman microscopes and spectrometers to be established and monitored on a scale of relative intensities. Keywords Reference material · Raman spectroscopy · Relative intensity calibration · Metrological support · Measures · Fluorescence line
A. A. Yushina (B) · A. D. Levin All-Russian Scientific Research Institute for Optical and Physical Measurements (VNIIOFI), Moscow, Russia e-mail: [email protected] A. D. Levin e-mail: [email protected] V. A. Aseev National Research University of Information Technologies, Mechanics and Optics (ITMO), Saint Petersburg, Russia e-mail: [email protected] © D. I. Mendeleyev Institute for Metrology 2024 E. P. Sobina et al. (eds.), Reference Materials in Measurement and Technology, https://doi.org/10.1007/978-3-031-49200-6_26
393
394
A. A. Yushina et al.
Abbreviations GET 86-2017
GET 196-15
RM SI SRM
State Primary Standard of Units of Radiometric Quantities and Units of Spectroradiometric Quantities in the Range of Wavelengths from 0.2 to 25.0 µm State Primary Standard of Units of Mass (Molar) Fraction and Mass (Molar) Concentration of Components in Liquid and Solid Substances and Materials Based on Spectral Methods Reference material International System of Units Standard reference material
Introduction Raman spectroscopy is a rapidly developing technique for analyzing the chemical composition of samples of natural and artificial origin, including biological samples, by determining the vibrational modes of molecules. In recent years, the method has gained popularity due to the improvement of equipment, the development of compact and inexpensive devices, and the growing interest in the rapid determination of substances [1] in various fields, including biological and medical diagnostics [2–4], pharmaceuticals and the chemical industry [5–8], criminalistics and forensic examination [9, 10], and environmental and food safety [11–13]. It is important to note that Raman spectra obtained using different instruments may exhibit significant variations in the relative intensities of the peaks of the analyzed compounds (Fig. 1). This is mainly due to the specific design of the instruments. The recorded spectral intensities are influenced by the transmission functions of optical components, the diffraction efficiency of the grating, and the spectral sensitivity of the photodetector, with the contribution of each component varying for different spectrometers. Furthermore, variations in the instrument response, which affect the shape of the Raman spectra, can occur on the same instrument following the replacement of a component or maintenance work [14, 15]. The broad application of Raman spectroscopy necessitates obtaining precise and instrument-independent spectra. These criteria are crucial for identifying substances by comparing experimental spectra with reference spectra obtained on different instruments. Therefore, it is essential to use specialized metrological means, such as measures to calibrate Raman microscopes and spectrometers by the spectral shape, i.e., the relative spectral sensitivity. An example of such measures for calibrating Raman spectrometers and microscopes by the spectral shape are NIST SRM 2241-2246 (USA), based on glasses activated by various metal ions. These RMs are designed to correct the relative intensities of Raman spectra obtained using devices with laser excitation at the following wavelengths: 488, 514.5, 532, 633, 785, 830, and 1064 nm. The RMs are calibrated
Development of Measures for Metrological Support of Raman …
395
Fig. 1 Fluorescence spectra of NIST SRM 2241 reference material obtained on four Raman spectrometers with an excitation wavelength of 785 nm [17]
on a spectrometer traceable to a reference light source (radiometric standard). The advantage of using glass-based RMs (in comparison with measures based on liquids and polymeric materials) is their resistance to thermal, chemical, and photochemical effects, as well as their long shelf life. Until recently, the metrological support of Raman microscopes and spectrometers in the Russian Federation heavily relied on the NIST RMs mentioned earlier. However, due to the necessity of timely maintenance of industrial production lines and the limited availability of the required RMs, it is necessary to carry out active import substitution, along with the development of new systems for the calibration of spectrometers and Raman microscopes. Moreover, these systems must ensure the metrological traceability to the SI units of the “(light) energy flux.” In Russia, measuring means that reproduce optical characteristics of samples such as transmission coefficient, optical density, and fluorescence intensity are commonly referred to as “measures” rather than “RMs.” Therefore, the aim of this study was to develop prototype measures for calibrating Raman spectrometers and microscopes using a scale of relative intensities that are ensured by metrological traceability to the basic SI units of the “(light) energy flux.” The aims of this research are as follows: development of glasses with specific fluorescent properties; development of prototype measures for calibrating Raman spectrometers and microscopes on a relative intensity scale when excited at 532, 633, and 785 nm using these glasses; determination of the metrological characteristics of these systems; and substantiation of the metrological traceability of the system to SI units of “(light) energy flux.”
396
A. A. Yushina et al.
Materials and Methods Materials The prototype measures were developed using three types of special fluorescent glasses based on an oxide matrix activated by metal ions, which were developed at the National Research University ITMO [16]. The glasses were activated with manganese (Mn2 O3 , 1 wt%), bismuth (Bi2 O3 , 1 wt%), and chromium (Cr2 O3 , 0.02 wt%) metals. The synthesis of the glasses involved using the following systems: 42B2 O3 –27MgO– 18Al2 O3 –13CaO (mol%), 72.4P2 O5 –11.6ZnO–15.7Al2 O3 –0.3Bi2 O3 (mol%), and 20K2 O–Al2 O3 –60B2 O3 (mol%).
Apparatuses and Laboratory Ware The measurements were carried out using a high-precision, fully automated 3Dscanning Confotec NR 500 confocal Raman microscope (SOL Instruments, Belarus), which is included in the GET 196-20151 State primary standard of units of mass (molar) fraction and mass (molar) concentration of components in liquid and solid substances and materials based on spectral methods. The scale of relative intensities of the microscope is traceable to the GET 8620172 State primary standard of units of radiometric and spectroradiometric values in the wavelength range from 0.2 to 25.0 µm. In order to ensure this traceability, a radiation source based on a 64,250 HLX halogen lamp (OSRAM, Germany) was used as a comparator.
Glass Synthesis Glasses intended to reproduce the relative intensity of fluorescence when exposed to laser radiation at a wavelength of 532 nm were activated using manganese ions. Bismuth was selected as the activating metal for glasses intended to induce fluorescence under laser irradiation at 633 nm, while chromium ions were used to activate 1
GET 196-2015 State Primary Standard of Units of Mass (Molar) Fraction and Mass (Molar) Concentration of Components in Liquid and Solid Substances and Materials Based on Spectral Methods: All-Russian Research Institute for Optical and Physical Measurements. Available via FIF EUM. https://fgis.gost.ru/fundmetrology/registry/12/items/397882. Accessed 31 October 2022 (In Russ.). 2 GET 86-2017 State primary standard of units of radiometric and spectroradiometric values in the wavelength range from 0.2 to 25.0 µm: All-Russian Research Institute for Optical and Physical Measurements. Available via FIF EUM. https://fgis.gost.ru/fundmetrology/registry/12/items/ 397958. Accessed 31 October 2022 (In Russ.).
Development of Measures for Metrological Support of Raman …
397
Table 1 Technical characteristics of prototype measures for metrological support of Raman spectroscopy Parameter
Value Manganese-activated glasses
Characteristic excitation 532 wavelength, nm Cross section, mm
10 × 10
Bismuth-activated glasses
Chromium-activated glasses
633
785
10 × 10
10 × 10
Height, mm
2.71
2.07
2.77
Fluorescence quantum yield
34
12
14
glasses designed to reproduce the relative fluorescence intensity when excited at a wavelength of 785 nm. Manganese-activated glasses were synthesized using the 42B2 O3 –27MgO– 18Al2 O3 –13CaO (mol%) system. The synthesis was carried out in a platinum crucible with a platinum stirrer at 1300 °C for 1.5 h. The glass was subsequently cast onto a metal plate and annealed at 550 °C for 3 h. Bismuth-activated glasses were synthesized using the 72.4P2 O5 –11.6ZnO– 15.7Al2 O3 –0.3Bi2 O3 (mol%) system. The synthesis was carried out in a quartz crucible using a quartz stirrer at 1450 °C for 8 h. The glass was further cast onto a metal plate and annealed at 600 °C for 4 h. Chromium-activated glasses were synthesized in the system 20K2 O–Al2 O3 – 60B2 O3 (mol%) at chromium Cr2 O3 concentration of 0.02 wt%. The synthesis was carried out in a platinum crucible with a platinum stirrer at 1400 °C for 1.5 h. The melt was cast into a metal mold and annealed at 450 °C for 1 h. The prototypes of measures comprised glass plates with technical specifications listed in Table 1. The dimensions of the samples were determined by the intended use of the measures on devices with a scattering angle of 180°. The prototypes are shown in Fig. 2.
Determination of Metrological Characteristics and Estimation of Expanded Uncertainty The metrological characteristics of the prototype measures were determined using a laser microscope that conforms to the specifications outlined in GET 196-2015. The microscope scale of relative intensities is traceable to GET 86-2017. In order to ensure the traceability of the prototype measures to the basic SI units of “energy (light) flux,” a halogen incandescent lamp was used as a comparator. The operating modes and parameters of the microscope used to measure the fluorescence intensity of the prototype measures were carefully selected through
398
A. A. Yushina et al.
Fig. 2 Prototype measures for metrological support of Raman spectroscopy, where: 1— manganese-activated glasses; 2—bismuth-activated glasses; 3—chromium-activated glasses
experimental testing. The main criterion for selecting the parameters was to ensure that the microscope sensitivity range corresponded to the fluorescence intensity of the studied sample, with an optimal range exceeding the upper limit of the maximum fluorescence intensity by 20%. The main characteristics of the microscope operating modes and parameters are listed in Table 2. The metrological characteristics of the prototype measures were determined in accordance with GOST 8.009-84 as follows. The sample was placed on the stage of the microscope, and the operating modes and parameters of the microscope specified in Table 2 were set. Ten measurements were carried out under the repeatability of the dependence of the fluorescence intensity signals for the measure on the wavenumber [Fn_meas (ki ), instrument-depended units (i.d.u.)], where k i is the wavenumber, i is the order number of the wavenumber, n is the spectrum number measured under repeatability conditions. Table 2 Operating modes and parameters of the Raman microscope when measuring the intensity of fluorescence radiation of prototype measures for metrological support of Raman spectroscopy Parameter
Value
Diffraction grating, groove/mm
200
Mirror type
Ag
Detector type
CCD
Magnification of an objective lens of a Raman microscope
5
Aperture diaphragm, mm
100
Number of consecutive spectral measurements
10
Development of Measures for Metrological Support of Raman …
399
On the basis of the measurement results, the relative intensity of fluorescence emission with respect to the maximum within a given wavenumber range was calculated for each measured spectrum using the following formula: Fn_r el (ki ) =
Fn_meas (ki ) , Fn_max (ki )
(1)
where Fn_r el (ki ) is the relative intensity of Raman scattering with respect to the maximum; n is the spectrum number under repeatability conditions; i is the order number of wavenumber; k is the wavenumber, cm−1 ; Fn_meas (ki ) is the measured value of the Raman scattering intensity for the n-th measurement, i.d.u. The average relative fluorescence intensity of the sample at its excitation scattering wavelength was calculated using the formula: 1 ∑ · Fn_r el (ki ), F¯ r el (ki ) = N n=1 N
(2)
where F¯ r el (ki ) is the average relative intensity of fluorescence emission of the measure at the operating excitation wavelength, r.u.; N is the number of measured spectra under repeatability conditions (here N = 10); Fn_r el (ki ) is the relative intensity determined based on the results of the n-th measurement, calculated according to Eq. (1). The type A standard uncertainty uA (k i ) was estimated as the standard deviation (SD) of the mean value in the series of measurements using the formula: / ∑N
2 ¯ n=1 [Fn_r el (ki )− F r el (ki )]
u A (ki ) =
N (N −1)
F¯ r el (ki )
· 100.
(3)
The main source of type B uncertainty is the calibration inaccuracy of the scale for relative intensities, which is influenced by the uncertainty in measuring relative intensities using the microscope. This uncertainty was estimated during the calibration of the microscope, which ensures its traceability to the GET 86-2017 standard. In the development of the prototype measure, only this component was considered. Additional sources of type B uncertainty include the heterogeneity of the measure, instability in microscope calibration on relative intensity scale, and error in polynomial approximation of the relationship between fluorescence intensity and wavenumber. In subsequent preparations for type approval tests, the contribution of each of these factors to the type B uncertainty will be assessed. The type B standard uncertainty for the reproducibility of the relative fluorescence intensity by the measure was estimated by the formula: uB =
Ucon , 2
(4)
400
A. A. Yushina et al.
where U con is the expanded uncertainty of measuring relative intensities on the microscope determined through its calibration as part of the GET 196-15, which includes an estimation of the uncertainty of unit transfer from the radiometric standard of GET 86-2017 using the comparator, i.e., a halogen lamp-based radiation source mentioned above. The combined standard uncertainty of the reproducibility of the relative fluorescence emission intensity by measures was calculated by the formula: u C (ki ) =
/
u 2A (ki ) + u 2B (ki ),
(5)
where u A (ki ) is the type A standard uncertainty of the reproducibility of relative fluorescence intensity, u B (ki ) is the type B standard uncertainty of the reproducibility of the relative fluorescence intensity. The expanded uncertainty of measuring the relative intensity of Raman scattering with the coverage factor k = 2 was calculated by the formula: U P (ki ) = 2 · u C (ki ),
(6)
Results and Discussion Prototype measures were developed in order to provide metrological support for Raman spectroscopy, specifically to calibrate Raman spectrometers and microscopes on a relative intensity scale at specified excitation wavelengths within ranges of wavenumbers characterizing the shift in fluorescence emission frequency relative to the frequency of excitation emission. The range of wavenumbers for the measure intended to excite radiation at a wavelength of 532 nm (Sample 1) was 200–4000 cm−1 , for the measure intended to excite radiation at 633 nm (Sample 2), it was 200–3500 cm−1 , and for the measure intended to excite radiation at 785 nm (Sample 3), it was 200–3000 cm−1 . The metrological properties of the developed prototype measures comprise the relative fluorescence intensity and wavenumber-dependent values of the expanded uncertainty of the relative emission intensity, at a coverage factor of k = 2. The highest values of uncertainties are shown in Table 3. Figure 3 presents the fluorescence spectrum of prototype measure 1, normalized to unity and approximated by two 7th-order polynomials, with an approximation error of less than 3%. The fluorescence spectra of prototype measures 2 and 3 are shown in Figs. 4 and 5, respectively. The spectrum of prototype measure 2 was approximated using an 8th-order polynomial, while a 9th-order polynomial was used to approximate the spectrum of prototype measures 3. The dependence of the spectra of the developed prototype measures from laser irradiation power was evaluated. Figure 6a illustrates the fluorescence spectra of
Development of Measures for Metrological Support of Raman …
401
Table 3 Uncertainty characteristics of prototype measures for metrological support of Raman spectroscopy Characteristics of uncertainty
Value of uncertainty, % Sample 1 Manganese-activated glasses
Sample 2 Bismuth-activated glasses
Sample 3 Chromium-activated glasses
Type A uncertainty
≤ 4.5
≤ 1.1
≤ 0.2
Type B uncertainty
1.4
1.4
1.4
Combined standard uncertainty
≤ 4.7
≤ 2.6
≤ 1.4
Expanded uncertainty at k = 2
≤ 9.4
≤ 5.2
≤ 2.8
Fig. 3 Fluorescence spectrum of prototype measure 1 normalized to unity and approximated by 7th-order polynomials
prototype measure No. 1 at different laser powers, while Fig. 6b presents the same spectra normalized to a maximum. As shown, the spectra normalized to a maximum are almost identical, indicating that the shape of the spectra of the prototype measures is independent of the intensity of the laser radiation. Device-independent Raman spectra can be ensured by a spectral correction function, which is represented by the ratio of the certified spectrum of the measure (approximated as a function) to the spectrum measured on a particular instrument. This is shown in the following formula:
402
A. A. Yushina et al.
Fig. 4 Fluorescence spectrum of prototype measure 2 normalized to unity and approximated by 8th-order polynomials
Fig. 5 Fluorescence spectrum of prototype measure 3 normalized to unity and approximated by 9th-order polynomials
Development of Measures for Metrological Support of Raman …
403
Fig. 6 a Fluorescence spectra of the prototype measure No. 1 taken at different laser powers (mW), b fluorescence spectra of the prototype measure No. 1 taken at different laser powers (mW) and normalized to a maximum
Corr (Δν) =
Icer t.meas (Δν) , Im.meas (Δν)
(7)
where Corr (Δν) is the spectral correction function; Icer t.meas (Δν) is the certified spectrum of measure traceable to the state primary radiometric standard GET 862017; Im.meas (Δν) is the spectrum measured on a particular instrument.
404
A. A. Yushina et al.
By introducing a correction equal to the value of the spectral correction function, device-independent Raman spectra can be obtained in further work with the instrument, as shown in the formula: Icorr.sample (Δν) = Corr (Δν) · Imeas.sample (Δν),
(8)
where Imeas.sample (Δν) is the spectrum of a sample recorded on the instrument; Icorr.sample (Δν) is the corrected spectrum of a sample. The measures will be certified on the Confotec NR 500 laser Raman confocal microscope, introduced to the GET 196-15 standard. The traceability of the intensity scale of this microscope to GET 86-2017 will be ensured by using an emission source based on a halogen lamp as a comparator. In conclusion, the developed measures can satisfy the requirements for providing metrological support to Raman spectroscopy and can be used for calibrating Raman spectrometers and microscopes on a relative intensity scale, with laser excitation at 532, 633, and 785 nm in a wide range of wavenumbers.
Conclusion Prototype measures made of inorganic glasses based on an oxide matrix activated with different metal ions were developed to excite a broad fluorescence line when emitting at specific wavelengths: manganese ions for 532 nm, bismuth ions for 633 nm, and chromium ions for 785 nm. The metrological characteristics of the prototype measures were established, with the certified characteristic being the relative intensity of the reproducible fluorescence radiation. The maximum expanded measurement uncertainty of the relative fluorescence intensity at a coverage factor k = 2 for prototype measures designed to reproduce relative fluorescence intensity at 532 nm, 633 nm, and 785 nm amounted to 9.4%, 5.2%, and 2.8%, respectively. Certifying the measures on the Confotec NR 500 laser Raman confocal microscope, as part of the GET 196-2015 standard, can establish metrological traceability through the scale of relative intensities of the GET 86-2017 microscope, providing traceability to SI units of the “energy (light) flux” value. Therefore, the developed measures allows the traceability of Raman spectra to GET 196-2015 to be established using the spectral correction function. This expands the ability to establish and monitor the stability of calibration characteristics of Raman microscopes and spectrometers, i.e., calibration using the scale of relative intensities, which promotes obtaining accurate and device-independent Raman spectra. Acknowledgements The research was supported by Rosstandart of the Russian Federation as part of the improvement of the state standard base in the field of photonics.
Development of Measures for Metrological Support of Raman …
405
The authors express their gratitude to Sergey A. Tarelkin, Candidate of Physical and Mathematical Sciences, Senior Researcher of the All-Russian Scientific Research Institute for Optical and Physical Measurements (VNIIOFI), for help and assistance in organizing work with the microscope. The authors express their gratitude to Tatyana A. Goidina, Engineer of the laboratory of analytical spectroscopy and metrology of nanoparticles of the All-Russian Scientific Research Institute for Optical and Physical Measurements (VNIIOFI), for help in processing the experimental data. The development and synthesis of glasses was carried out by the National Research University of Information Technologies, Mechanics and Optics (ITMO). All measurements were carried out using the equipment of the All-Russian Scientific Research Institute for Optical and Physical Measurements (VNIIOFI). Author Contributions Yushina A. A.—research work, implementation of formal analysis, writing a draft version of the article; Aseev V. A.—provision of materials for research; Levin A. D.— development of the concept of research, implementation of formal analysis, control of research, creation of visual materials. Conflict of Interest The article was prepared on the basis of a report presented at the V International Scientific Conference “Reference Materials in Measurement and Technology” (Yekaterinburg, September 13–16, 2022). The article was admitted for publication after the abstract was revised, the article was formalized, and the review procedure was carried out. The version in the Russian language is published in the journal “Measurement Standards. Reference Materials” 2023;19(1):51–64 (In Russ). https://doi.org/10.20915/2077-1177-2023-191-51-64.
References 1. Das RS, Agrawal YK (2011) Raman spectroscopy: recent advancements, techniques, and applications. Vib Spectrosc 57(2):163–176. https://doi.org/10.1016/j.vibspec.2011.08.003 2. Moreira LM, JrL S, Santos FV, Lyon JP, Rocha R, Zângaro RA et al (2008) Raman spectroscopy: a powerful technique for biochemical analysis and diagnosis. Spectroscopy 22(1):1–19. https:// doi.org/10.3233/SPE-2008-0326 3. Rafalsky VV, Zyubin AYu, Moiseeva EM, Samusev IG (2020) Prospects for Raman spectroscopy in cardiology. Cardiovascular Therapy Prevent 19(1):70–77 (in Russian). https://doi. org/10.15829/1728-8800-2020-1-2394 4. Andryukov BG, Karpenko AA, Matosova EV, Lyapun IN (2019) Raman spectroscopy as a modern diagnostic technology for study and indication of infectious agents (review). Mod Technol Med 11(4):161–174 (in Russian) https://doi.org/10.17691/stm2019.11.4.19 5. Löbenberg R, Bou-Chacra NA (2020) Raman spectroscopy for quantitative analysis in the pharmaceutical industry. J Pharm Pharmaceut Sci 23:24–46. https://doi.org/10.18433/jpp s30649 6. Nagy B, Farkas A, Borbás E, Vass P, Nagy ZK, Marosi G (2019) Raman spectroscopy for process analytical technologies of pharmaceutical secondary manufacturing. AAPS PharmSciTech 20(1):1–16. https://doi.org/10.1208/s12249-018-1201-2 7. Hess C (2021) New advances in using Raman spectroscopy for the characterization of catalysts and catalytic reactions. Chem Soc Rev 50(5):3519–3564. https://doi.org/10.1039/D0CS01059F 8. Zheng T, Zhou Y, Feng E, Tian Y (2021) Surface-enhanced Raman scattering on 2D nanomaterials: recent developments and applications. Chin J Chem 39(3):745–756. https://doi.org/10. 1002/cjoc.202000453 9. Khandasammy SR, Fikiet MA, Mistek E, Ahmed Y, Halámková L, Bueno J et al (2018) Bloodstains, paintings, and drugs: Raman spectroscopy applications in forensic science. Forensic Chem 8:111–133. https://doi.org/10.1016/j.forc.2018.02.002
406
A. A. Yushina et al.
10. Fikiet MA, Khandasammy SR, Mistek E, Ahmed Y, Halámková L, Bueno J et al (2019) Forensics: evidence examination via Raman spectroscopy. Phys Sci Rev 4(2). https://doi.org/ 10.1515/psr-2017-0049 11. Germond A, Kumar V, Ichimura T, Moreau J, Furusawa C, Fujita H et al (2017) Raman spectroscopy as a tool for ecology and evolution. J R Soc Interface 14(131):20170174. https:// doi.org/10.1098/rsif.2017.0174 12. Lin Z, He L (2019) Recent advance in SERS techniques for food safety and quality analysis: a brief review. Curr Opin Food Sci 28:82–87. https://doi.org/10.1016/j.cofs.2019.10.001 13. Petersen M, Yu Z, Lu X (2021) Application of Raman spectroscopic methods in food safety: a review. Biosensors 11(6):187. https://doi.org/10.3390/bios11060187 14. Sadagov AY, Goidina TA, Aseev VA, Nikonorov NV, Fedorov YK, Chugunova MM, Levin AD (2020) Spectral standards based on glasses activated with rare-earth element ions for the calibration of fluorescence and Raman spectrometers. Opt Spectrosc 128(10):1658–1666. https://doi.org/10.1134/S0030400X20100215 15. Choquette SJ, Etz ES, Hurst WS, Blackburn DH, Leigh SD (2007) Relative intensity correction of Raman spectrometers: NIST SRMs 2241 through 2243 for 785 nm, 532 nm, and 488 nm/ 514.5 nm excitation. Appl Spectrosc 61(2):117–129. https://doi.org/10.1366/000370207779 947585 16. Babkina A, Valiev D, Zyryanova K, Osipova A, Aseev V, Kulpina E et al (2020) Luminescent properties of chromium-doped borate glass-ceramics for red radiation sources. Fiber Lasers Glass Photon Mater Appl II 11357:46–53. https://doi.org/10.1117/12.2555370 17. ASTM E2911-13 (2013) Standard guide for relative intensity correction of Raman spectrometers
Estimation of Uncertainty in Charpy Pendulum Impact Test Using the Reference Material Iuliia S. Chentsova, Vladimir V. Tolmachev, and Anastasia A. Zabelina
Abstract An urgent task for accredited testing laboratories is to estimate the uncertainty of test results. In Charpy pendulum impact test the sources of the main contributions from the measuring instrument to the uncertainty of the result are: the angle of rise and the angle of fall of the pendulum, force exerted by the pendulum, and the distance from the axis of rotation to the center of strike. The aim of the work is to describe the method for estimating the uncertainty of the results of Charpy pendulum impact test based on information about the calibration of the impact testing machine and traceability to the reference material of impact energy (absorbed energy) of steel grade 45 GSO 11934-2022. The uncertainty estimation method is based on the statistical model from ISO 21748-2017. Uncertainty estimation was carried out for a pendulum impact tester TE JBW-300 using GSO 11934-2022 type 11 samples according to GOST 9454-78 with a type V-notch concentrator at room temperature. The study found that the greatest contribution to the uncertainty of test results is made by a systematic error associated with traceability to CRM GSO 11934-2022 and a random component of measurements. Accounting of traceability to the CRM GSO 11934-2022 increases the estimate of the uncertainty of the result, but makes it possible to correctly compare the results of two different laboratories, which is of fundamental importance in arbitration tests. Keywords Mechanical properties · Impact bending · Impact energy · Metrological traceability · Reference material
I. S. Chentsova (B) · V. V. Tolmachev · A. A. Zabelina UNIIM—Affiliated Branch of the D. I. Mendeleyev Institute for Metrology, Yekaterinburg, Russia e-mail: [email protected] V. V. Tolmachev e-mail: [email protected] A. A. Zabelina e-mail: [email protected] © D. I. Mendeleyev Institute for Metrology 2024 E. P. Sobina et al. (eds.), Reference Materials in Measurement and Technology, https://doi.org/10.1007/978-3-031-49200-6_27
407
408
I. S. Chentsova et al.
Introduction Structural steel standards and material properties databases generally do not contain information on the uncertainties of the given impact strength values (impact energy, absorbed energy). Therefore, it is important to know the uncertainty of the result when deciding on the conformity of metal products based on the results of an impact bending test. Formulas for the uncertainty of the impact bending test result are given in [1, 2]. However, ISO 148-1-2016 [1] considers the uncertainty of the average result based on the results of testing five samples, and the interstate standard GOST 9454-78 [3] does not provide for processing the results and calculating the average value. It should be noted that when estimating the uncertainty in ISO 148-1-2016 [1], the uncertainty of the calibration of the pendulum impact tester is not taken into account, but only its error. The classical approach to estimating uncertainty according to GOST 34100.32017/ISO/IEC Guide 98-3:2008 [4] is based on estimating the uncertainty of the quantities included in the measurement equation. The measured values in the impact test are: the angle of rise and the angle of fall of the pendulum, force exerted by the pendulum, and the distance from the axis of rotation to the center of strike. A modern automated testing machine determines the required values and calculates the impact energy (absorbed energy) according to the underlying algorithm. The proposed method for estimating the uncertainty of the result of a single impact test includes accounting of the uncertainty of the quantities included in the measurement equation using the results of the pendulum testing machine calibration. The measurement equation additionally takes into account the contribution of traceability to the GSO (CRM) 11934-2022.1 The aim of the study is to describe the method for estimating the uncertainty of the results of Charpy pendulum impact test based on information about the testing machine calibration and traceability to the reference material of impact energy (absorbed energy) of steel grade 45 GSO 11934-2022.
Materials and Methods GSO 11934-2022 was obtained as a result of research and characterization of hotrolled square section steel according to GOST 2591-2006 [5] from steel grade 45 according to GOST 1050-2013 [6]. Characterization of rolled products in terms of Charpy impact strength testing (absorbed energy, impact energy) was carried out in accordance with the algorithms
1
GSO 11934-2022 Reference materials impact work (absorbed energy) steel grade 45. Available via FIF EUM. https://fgis.gost.ru/fundmetrology/registry/19/items/1400120. Accessed 4 August 2022 (In Russ.).
Estimation of Uncertainty in Charpy Pendulum Impact Test Using …
409
Table 1 Metrological characteristics of the reference material Certified characteristic
Certified value
Limits of the values of the absolute error at P = 0.95
Charpy impact strength testing (impact energy, absorbed energy) at temperature (23 ± 5) °C, J
25.90
± 1.60
and provisions of GOST 8.532-2002 [7] by an interlaboratory experiment. 16 laboratories with experience in studying the mechanical properties of steel were involved. Within 2 months, samples of the reference material were sent to each laboratory for testing in accordance with GOST 9454-78 [3]. The error characteristic of the interlaboratory certification was 1.01 J. The error due to the heterogeneity of the reference material was set to 0.70 J to calculate the limits of the values of the absolute error of the reference material during type approval tests. The values of the metrological characteristics of the reference material of the impact energy (absorbed energy) of steel grade 45, established as a result of testing batch No. 1, are shown in Table 1. The testing machine TE JBW-300 JINAN TESTING EQUIPMENT IE CORPORATION (China) is designed to measure the fracture energy of specimens during Charpy pendulum impact test with two-bearing. The operating principle of an testing machine is based on measuring the amount of energy spent on the fracture of a sample by a single impact. The amount of energy is defined as the difference between the values of the potential energy of the impact pendulum before impact and after the fracture of the sample. Elevation and angle of fall measurement readings are calculated by a signal measuring device with an optical-to-electrical transducer, which provides the calculation of the result using a special computer program and displays numerical values on a personal computer monitor with the possibility of further saving and printing the results. The testing machine TE JBW-300 was calibrated according to ISO 148-2-2016 [8] with traceability to the State primary standard of mass unit GET 3-2008,2 the State primary standard of the unit of length GET 2-2021,3 the State primary standard of the flat angle unit GET 22-2014.4 A modeling approach based on ISO 21748-2017 [9] was used to estimate measurement uncertainty. A mathematical model has been created, which is an equation that determines the quantitative relationship between the measured value and all the values on which it depends, including all components that contribute to the measurement uncertainty. The standard uncertainties of all individual uncertainty components have 2
GET 3-2008 State primary standard of mass unit (kilogram). Available via FIF EUM. https://fgis. gost.ru/fundmetrology/registry/12/items/1385582. Accessed 4 August 2022 (In Russ.). 3 GET 2-2021 State primary standard of the unit of length—meter. Available via FIF EUM. https:// fgis.gost.ru/fundmetrology/registry/12/items/1387037. Accessed 4 August 2022 (In Russ.). 4 GET 22-2014 State primary standard of the flat angle unit. Available via FIF EUM. https://fgis. gost.ru/fundmetrology/registry/12/items/397907. Accessed 4 August 2022 (In Russ.).
410
I. S. Chentsova et al.
been estimated. The standard deviations from repeated measurements are the standard uncertainties for the respective components (if a normal distribution can be assumed). The total standard uncertainty is calculated by applying the law of propagation of uncertainty which depends on the partial derivatives for each input value. The expanded uncertainty U is calculated (providing an interval from (y − U) to (y + U) for the measured value y). The coverage factor k = 2 is usually chosen for a normal distribution. The measurement result, together with its uncertainty, is presented in accordance with GOST 34100.3-2017/ISO/IEC Guide 98-3:2008 [4].
Results The statistical model on which the methods for estimating uncertainty are based is written as Eq. (1) ISO 21748-2017 [9]: K V = F L(cosβ − cosα) + ξG S O + g K V + e K V ,
(1)
where F L β α ξG S O gkv eK V
is the force exerted by the pendulum, N; is the distance from the axis of rotation to the center of strike (point of strike F), m; is the angle of fall of the pendulum, °; is the angle of rise of the pendulum, °; is the bias due to traceability; is the rounding of the measurement result; is the random component of measurement uncertainty under repeatability conditions.
Taking into account the model described by Eq. (1), the measurement uncertainty of K V was estimated using Eq. (2): ) ) ( ∂KV 2 2 ∂KV 2 2 u (K V ) = u (F) + u (L) ∂F ∂L ) ) ( ( ∂KV 2 2 ∂KV 2 2 u (β) + u (α) + ∂β ∂α (
2
+ u 2 (ξG S O ) + u 2 (g K V ) + u 2 (e K V )
(2)
where u 2 (F) u 2 (L)
is the uncertainty associated with the contribution due to the force exerted by the pendulum; is the uncertainty associated with the distance from the axis of rotation to the center of strike;
Estimation of Uncertainty in Charpy Pendulum Impact Test Using …
411
u 2 (β) u 2 (α) ( ) u 2 ξσ B
is the uncertainty associated with the angle of fall of the pendulum; is the uncertainty associated with the angle of rise of the pendulum; is the uncertainty caused by the uncertainty of the estimate obtained on the basis of measurements of a reference material with a certified value; u 2 (g B ) is the uncertainty due to the rounding of the measurement result; u 2 (e K V ) is a random component of measurement uncertainty of a reference material under repeatability conditions. In this example, the measurement error is calculated for a single sample made from the material under test. The measurement result of 105.5 J was obtained on the testing machine TE JBW-300, which was calibrated according to ISO 148-2-2016 [8]. Impact energy measurement result KV with expanded measurement uncertainty U(KV) K V = (105.5 ± 5.0) J.
Discussion By analyzing the uncertainty budget presented in Table 2, the two largest contributions to the combined standard uncertainty of the result can be distinguished: the uncertainty due to traceability to a certified reference material and the random component of measurements under repeatability conditions. The contribution due to the random component of measurements of a reference material under repeatability conditions describes the generally random effects occurring in the laboratory. Since the absolute value (0.6 J) of the random component of the measurement uncertainty of the reference material is comparable to the uncertainty of the reference material (0.8 J), it can be assumed that it is formed due to the heterogeneity of the reference material. The contribution due to the traceability of the reference material includes a systematic component associated with the implementation of the test procedure in the laboratory, for example, the V-trough concentrator, the coincidence of the length of the pendulum with the center of impact on the sample, etc. The contribution due to the uncertainty components associated with the values standardized for the impact tester and measured by the automated impact tester system is insignificant for the studied copy of the impact tester. It should be noted that the last conclusion is based on the calibration results of the impact tester according to the ISO 148-2-2016 method [8] and may be inaccurate for the tested impact testers.
Random component of u(e K V ) the measurement uncertainty of the reference material under repeatability conditions
Force exerted by the pendulum
Distance from the axis of rotation to the center of strike
Angle of fall of the pendulum
Angle of rise of the pendulum
Rounding of the measurement result
3
4
5
6
7
8
Δ(K V G S O ) 1.96
sK V √ t(P, f ) n
u(g K V ) =
u(g K V ) Lc √ 2 3
c(α) = F Lsinα c(α)u(α)
c(β) = −F Lsinβ c(β)u(β)
c(L) = K V /F c(L)u(L)
=
( K V G S O −K V 3
s K V t√ 0.6827.5 5
u 2 (K V G S O ) +
c(F) = K V /F c(F)u(F)
u(e K V ) =
u(ξ K V ) =
/
u(K V G S O ) =
Formula
u(α) c(α)
u(β) c(β)
u(L) c(L)
u(F) c(F)
Traceability to the reference material
2
u(ξ K V )
Certified value of the K V GSO reference material and u(K V G S O) its uncertainty (based on the reference material certificate)
1
Unit designation
Source of uncertainty
№.
Table 2 Measurement uncertainty budget calculated using pendulum impact tester calibration data
)2
(continued)
412 I. S. Chentsova et al.
U (K V ) = t0.95,νe f f · u(K V ) Example u(K V G S O ) =
Measured values: 27.4, 26.7, 28.3, 26.3, 25.0 J Average value K V = 26.74 J / 2 u(ξ K V ) = 0.8162 + (25.9−26.74) = 0.949 J 3
νe f f =
νe f f
U (K V )
Effective number of degrees of freedom
Expanded uncertainty
Used variables, parameters
K V G S O = 25.9 J Δ(K V G S O ) = 1.6 J—error value of the certified value of the reference material according to the certificate
K V —average value of measurements on the reference material
s K V —standard deviation of measurement results on the reference material t0.6827.5 − Student'scoe f f icient = 1.14 for n = 5
From the calibration certificate u(F) = 0.35N F = 217.82 N The result for the test material K V = 105.5 J
From the calibration certificate u(L) = 0.1 mm L = 0.741 m The result for the test material K V = 105.5 J
10
11
№.
1
2
3
4
5
1.14·1.2 √ 5
= 0.816 J
= 0.612 J
1.6 1.96
u(L) = 0.0001 m c(L) = 105.5/0.741 = 142 c(L)u(L) = 0.0001 ∗ 142 = 0.0142 J
c(F) = 105.5/217.82 = 0.484 c(F)u(F) = 0.484 ∗ 0.35 = 0.169 J
u(e K V ) =
s K V = 1.2 J
u 4 (K V )
u 4 (F) u 4 (L) u 4 (β) u 4 (α) u 4 (g K V ) u 4 (ξ K V ) u 4 (e K V ) ν(F) + ν(L) + ν(β) + ν(α) + ν (g K V ) + ν (ξ K V ) + ν (e K V )
(continued)
u(K V ) = √ c2 (F)u 2 (F) + c2 (L)u 2 (L) + c2 (β)u 2 (β) + c2 (α)u 2 (α) + u 2 (g K V ) + u 2 (ξ K V ) + u 2 (e K V )
u(K V )
Combined standard uncertainty
9
Formula
Unit designation
Source of uncertainty
№.
Table 2 (continued)
Estimation of Uncertainty in Charpy Pendulum Impact Test Using … 413
u(g K V ) =
Lc = 0.1 J
8
= 0.0289 J
U (K V ) = 1.17 · 4.30 = 5.03 J
t0.95,νe f f = 4.30
= 2.035
11
1.24 4 0.6124 0+0+0+ 0.996 1 + 4
νe f f =
ν(F) = ∞ ν(L) = ∞ ν(g K V ) = ∞ ν(ξ K V ) = 2 − 1 = 1 ν(e K V ) = 5 − 1 = 4
u(K √ V) = 0.1692 + 0.01422 + 0.1532 + 0.05492 + 0.02892 + 0.9492 + 0.6122 = 1.17 J
0.1 3.46
10
9
0.06° = 0.00105 rad c(α) = 217.82 · 0.741 · sin160◦ = 54.9 u(α) = 54.9 · 0.001 = 0.0549 J
From the calibration certificate u(α) = 0.06◦ L = 0.741 m F = 217.82 N For the impact tester α = 160◦
7
0.06° = 0.00105 rad c(β) = −217.82 · 0.741 · sin109◦ = −153 c(β)u(β) = 153 · 0.00105 = 0.153 J
From the calibration certificate u(β) = 0.06◦ L = 0.741 m F = 217.82 N For the test material K V = 105.5 J β = 109◦
6
Example
Used variables, parameters
№.
Table 2 (continued)
414 I. S. Chentsova et al.
Estimation of Uncertainty in Charpy Pendulum Impact Test Using …
415
Conclusion The uncertainty of the result of the impact test according to GOST 9454-78 [3] for the pendulum impact tester TE JBW-300 was estimated, taking into account the traceability to the GSO (CRM) 11934-2022. The proposed method for estimating the uncertainty of the impact test result can be used in the event that the calibration results of the pendulum impact tester according to ISO 148-2-2016 [8] are available. The main contributor to the uncertainty of the impact test result is the contribution due to the traceability to a certified reference material, which can be explained at least by the shape of the notch that the laboratory makes and the mismatch between the impact center of the pendulum and the location of the sample; these factors cannot be estimated by directly calibrating the impact tester. Acknowledgements The research did not receive financial support in the form of a grant from any organization in the public, commercial or non-profit sectors. Author Contributions Chentsova Iu. S.—implementation of a formal analysis, conducting research work; Tolmachev V. V.—development of the research concept, implementation of a formal analysis; Zabelina A. A.—conducting research work. Conflict of Interest The article was prepared on the basis of a report presented at the V International Scientific Conference “Reference Materials in Measurement and Technology” (Yekaterinburg, September 13–16, 2022). The article was admitted for publication after the abstract was revised, the article was formalized, and the review procedure was carried out. The version in the Russian language is published in the journal “Measurement Standards. Reference Materials” 2023;19(4):143–150. (In Russ.). https://doi.org/10.20915/2077-1177-2023-19-4143-150.
References 1. ISO 148-1-2016 Metallic materials—Charpy pendulum impact test—part 1: test method. Available via ISO. https://www.iso.org/standard/63802.html. Accessed 4 Aug 2022 (in Russian) 2. Czichos H, Saito T, Smith L (eds) (2011) Springer handbook of metrology and testing. Springer Berlin, Heidelberg, 1229 p. https://doi.org/10.1007/978-3-642-16641-9 3. GOST 9454-78 (2003) Metals. Method for testing the impact strength at low, room and high temperature. IPK Izdatelstvo standartov, Moscow, 13 p (in Russian) 4. GOST 34100.3-2017/ISO/IEC Guide 98-3:2008 (2018) Uncertainty of measurement. Part 3. Guide to the expression of uncertainty in measurement. Standartinform, Moscow, 104 p (in Russian) 5. GOST 2591-2006 (2009) Square hot-rolled steel bars. Dimensions. Standartinform, Moscow, 8 p (in Russian) 6. GOST 1050-2013 (2014) Metal products from nonalloyed structural quality and special steels. General specification. Standartinform, Moscow, 34 p (in Russian) 7. GOST 8.532-2002 (2003) State system for ensuring the uniformity of measurements. Certified reference materials of composition of substances and materials. Interlaboratory metrological certification. Content and order of works. IPK Izdatelstvo standartov, Moscow, 10 p (in Russian)
416
I. S. Chentsova et al.
8. ISO 148-2-2016 Metallic materials. Charpy pendulum impact test. Part 2: verification of testing machines. Available via ISO. https://www.iso.org/obp/ui#iso:std:iso:148:-2:ed-3:v1:en. Accessed 4 Aug 2022 (in Russian) 9. ISO 21748-2017 Guidance for the use of repeatability, reproducibility and trueness estimates in measurement uncertainty evaluation. Available via ISO. https://www.iso.org/standard/71615. html. Accessed 4 Aug 2022 (in Russian)
Mathematical Methods for Characterization of Reference Materials and Risks of False Solutions
New Algorithms for Estimating the Certified Characteristic of CRMs for Substances and Materials Using Interlaboratory Certification Petr M. Aronov , Egor P. Sobina , Pavel V. Migal , Olga N. Kremleva , Valeriya V. Studenok , Valeriy A. Firsanov, and Sergey V. Medvedevskikh
Abstract In this work, algorithms for specifying certified reference materials (CRMs) are developed based on the data modeling of interlaboratory experiments containing hidden uncertainties. These algorithms aid in estimating hidden uncertainties and, thus, in correcting the data and obtaining a consistent value of the certified characteristic. Using the Monte–Carlo method, the properties of hidden uncertainty estimates are studied. The proposed algorithms are compared with those conventionally used. Keywords Certified reference materials · CRMs · Interlaboratory experiment · Statistical model of interlaboratory experiments · Uncertainty of interlaboratory experiments results · Consistent value of CRMs characteristic · CRMs specification
Introduction Currently, interlaboratory experiments are widely used to determine the values of certified reference materials (CRMs). P. M. Aronov (B) · E. P. Sobina · P. V. Migal · O. N. Kremleva · V. V. Studenok · V. A. Firsanov UNIIM—Affiliated Branch of the D. I. Mendeleyev Institute for Metrology, Yekaterinburg, Russia e-mail: [email protected] E. P. Sobina e-mail: [email protected] P. V. Migal e-mail: [email protected] V. V. Studenok e-mail: [email protected] S. V. Medvedevskikh D. I. Mendeleyev Institute for Metrology, Saint Petersburg, Russia e-mail: [email protected] © D. I. Mendeleyev Institute for Metrology 2024 E. P. Sobina et al. (eds.), Reference Materials in Measurement and Technology, https://doi.org/10.1007/978-3-031-49200-6_28
419
420
P. M. Aronov et al.
The corresponding mathematical algorithms for evaluating the value of the CRMs characteristic are given in the GOST 8.532-2002 [1] and are based on the assumption that the experimental data obtained by various analytical methods from different laboratories represent a sample from one general totality and have a normal (even if contaminated) probability distribution. However, based on international comparisons of CRMs performed by national metrological institutes when assessing the reference value of the comparison, the need for considering the uncertainty of measurement results in a specific laboratory has been established [2]. A possible statistically significant influence of laboratory effects on the evaluation of the reference value has been established in association with a deviation from the normal distribution of random effects which can be described by the Laplace distribution, leading to hidden uncertainties or displacements in interlaboratory experiments (see the summary of such works [3]). This paper proposes a general statistical model presenting the measurement results of interlaboratory experiments as a set of representatives from different general populations. The data obtained from the laboratories is a set of the pairs {xi , u i }, i = 1, n, xi = x + Δi + ξi , i = 1, n,
(1)
where xi is the result of measurements in the ith laboratory, x is the true value of the measured value; Δi is an unknown bias of the result in the ith laboratory; ξi is a random error in the result of the ith laboratory, leading to a standard uncertainty ui of the type A (considered known), n is the number of laboratories participating in the interlaboratory experiment. Note that for the data model of Eq. (1), the squared standard uncertainty of the ith laboratory result has the form u 2 (xi ) = E(xi − x)2 = Δi2 + u i2 ,
(2)
that is, it contains a hidden part in the form of a squared bias. Due to the central limit theorem of the probability theory, random variables, as well as the measurement results obtained by processing repeated measurements (such as the artithmetic mean, sample median, etc.) have a distribution close to normal. If the laboratory data are consistent, that is, they satisfy the chi-squared test, then the optimal estimate (maximum likelihood estimate) is the weighted mean of the laboratory results with weights inversely proportional to their variances. However, hidden biases in the results of the majority of cases, which leads to hidden uncertainties, make the laboratory data inconsistent. Based on this model, the methods for estimating hidden uncertainties and biases of the results of interlaboratory experiments have been developed. Data correction algorithms have been created to make the data consistent and apply the optimal procedure for evaluating the value of the CRMs characteristic and their uncertainty.
New Algorithms for Estimating the Certified Characteristic of CRMs …
421
Description of Algorithms for Processing the Results of Interlaboratory Experiments The developed algorithms are based on the procedure for finding the largest consistent data subset [4, 5] submitted by laboratories, as well as the necessary for consistency correction of the data from the laboratories that were not included in this subset. This has required calculating the weighted average. x =
( n ∑
)−1 u i−2
n ∑
i=1
u i−2 xi ,
(3)
i=1
and conducting a data consistency test—checking the fulfillment of the condition n ∑ (xi − x )2
u i2
i=1
≤ χ 2 (P; n − 1),
(4)
where χ 2 (P; n − 1) the P-quantile of the chi-squared distribution with n − 1 degrees of freedom. If the condition (4) is met, then the data of all the laboratories are consistent, the estimate (3) is optimal and has a standard uncertainty u=
( n ∑
)− 21 u i−2
.
(5)
i=1
Otherwise, the numbering of laboratories is organized in such a way that (x1 − x )2 (x2 − x )2 (xn − x )2 ≤ ≤ · · · ≤ . u 2n u 21 u 22
(6)
The laboratory data with the number n is excluded and the values (3) and (4) are recalculated, now for n − 1 participants. The consistency condition (4) is checked for them. The process is repeated until for the remaining k participants, the consistency condition is finally met: k ∑ (xi − x k )2 i=1
u i2
≤ χ (P; k − 1), x k = 2
( k ∑ i=1
)−1 u i−2
k ∑
u i−2 xi .
(7)
i=1
Thus, the maximum consistent data subset is found. To reconcile the excluded data, the latter must be corrected. Consider the data of the last excluded participant with the number k + 1, for which the value of
422
P. M. Aronov et al.
(xk+1 − x k+1 )2 , u 2k+1
(8)
is too big for the chi-squared test to be performed. To include the data of this participant into the consistent subset, they need to be adjusted so that the value (8) decreases to the value at which the chi-squared test can be performed. This can be achieved in two ways: (1) by increasing the uncertainty of the data of the (k + 1)th participant, which leads to an increase in the denominator in (8); (2) by correcting the measurement result in the data of the (k + 1)th participant, leading to a decrease in the numerator in (8). Consider the first method. Build a function gk+1 (λ) =
k ∑ (xi − x k+1 (λ))2
u i2
i=1
+
(xk+1 − x k+1 (λ))2 , λ ≥ 0, u 2k+1 +λ
(9)
where x k+1 (λ) =
( k ∑ i=1
u i−2
+
(u 2k+1
−1
+ λ)
)−1 ( k ∑
) u i−2 xi
+
(u 2k+1
−1
+ λ) xk+1 . (10)
i=1
The function gk+1 (λ) monotonically decreases since (xk+1 − x k+1 (λ))2 dgk+1 (λ) =− < 0. dλ (u 2k+1 + λ)2
(11)
The lower limit of the function (9) values at λ → ∞ is defined by the left side of the inequality (7), and it does not exceed χ 2 (P; k − 1). Since χ 2 (P; k − 1) < χ 2 (P; 2 , at which k), there is a value λ = σk+1 2 gk+1 (σk+1 )=
k 2 2 ∑ (xi − x k+1 (σk+1 ))2 ))2 (xk+1 − x k+1 (σk+1 + ≤ χ 2 (P; k). (12) 2 2 2 u u + σ i k+1 k+1 i=1
This value can be found by sequentially calculating the values of the function gk+1 (λ) with some step along λ, starting with λ = 0. Thus, by increasing the standard uncertainty of the (k + 1)th participant of the interlaboratory experiment, a consistent subset of now k + 1 participants is obtained. Continuing this process, including by correcting the results of all new participants from the excluded data when building the largest consistent subset, we receive a consistent value of the CRMs characteristic
New Algorithms for Estimating the Certified Characteristic of CRMs …
2 x¯ n (σk+1 , ...σn2 )
=
( k ∑
u i−2
+
i=1
( k ∑
n ∑
423
)−1 (u i2
+
σi2 )−1
i=k+1
xi u i−2
+
i=1
n ∑
) xi (u i2
+
σi2 )−1
+
σi2 )−1
,
(13)
i=k+1
the squared standard uncertainty of which has the form
u
2
2 (x n (σk+1 , ...σn2 ))
=
( k ∑
u i−2
i=1
+
n ∑
)−1 (u i2
.
(14)
i=k+1
n The found parameter values {σi2 }i=k+1 in accordance with (2) are the estimates 2 of the values Δi , and they characterize the hidden standard uncertainties of the laboratories participating in the interlaboratory experiment.
Consider now the second algorithm for matching the data of the interlaboratory experiment by correcting the results of the participants who did not fall into the largest consistent subset. Write the correcting parametric family as xˆk+1 (μ) = xk+1 − μ · sign(xk+1 − x k ), μ ≥ 0,
(15)
as well as the function f k+1 (μ) =
k ∑ (xi − x k+1 (μ))2 (xˆk+1 (μ) − x k+1 (μ))2 + , u i2 u 2k+1 i=1
(16)
where x k+1 (μ) =
( k+1 ∑ i=1
u i−2
)−1 ( k ∑
) xi u i−2
+
xˆk+1 (μ)u −2 k+1
.
(17)
i=1
(μ) < 0 and the function (16) decrease monotonously at It can be shown that d fk+1 dμ 0 ≤ μ ≤ |x k |. | | |ˆ | There is a value μ = |Δ k+1 | at which
ˆ k+1 ) ≤ χ 2 (P; k). f k+1 (Δ
(18)
This value can be found by sequentially calculating the values of the function f k+1 (μ) with some step along μ, starting with μ = 0. Thus, correcting the result of the (k + 1)th participant of the interlaboratory experiment,
424
P. M. Aronov et al.
| | ˆ k+1 ||sign(xk+1 − x k ) = xk+1 − Δ ˆ k+1 , ˆ k+1 ) = xk+1 − ||Δ xˆk+1 (Δ
(19)
a consistent subset of now k + 1 participants is obtained. Continuing this process, as well as by adjusting the results of all the new participants from those excluded in the process of constructing the maximum consistent subset, one can obtain the consistent value of the certified characteristic; ˆ k+1 , ...Δ ˆ n) = x n (Δ
( n ∑ i=1
u i−2
)−1 ( k ∑
xi u i−2
n ∑
+
i=1
) ˆ i )u i−2 xˆi (Δ
,
(20)
i=k+1
the squared standard uncertainty of which has the form ˆ k+1 , ...Δ ˆ n )) = u (x n (Δ 2
( n ∑
)−1 u i−2
.
(21)
i=1 n ˆ i }i=k+1 The parameters {−Δ estimate the hidden displacements of the measurement results from the laboratories participating in the interlaboratory experiment in accordance with the measurement results model (1).
Results To study the properties of estimates of hidden uncertainties (the first algorithm, we name it “the weighted average with uncertainty correction”) and the hidden biases (the second algorithm, “the weighted average with the correction of results”), the Monte–Carlo experiment was set up. The laboratory data were modeled according to the model (1). xi = 10 + Δi + ξi , i = 1.15 where the biases were selected as Δi = ±0.1 · i, (the sign chosen randomly), and the random component of the margin of error was generated from a normal totality N(0, u) with zero mathematical expectation and standard deviation u = 0.5. The estimates values for the hidden uncertainties and hidden displacements for the results from the maximum consistent subset were assumed to be zero. The data generation was performed 260 times. As typical examples, the histograms of estimates for the first six laboratories are shown in Fig. 1: the left column—for the algorithm with the uncertainty correction, the right—for the algorithm with the results correction. The red vertical line indicates the true values (i.e., the values of the parameters set in the software when modeling the distributions by
New Algorithms for Estimating the Certified Characteristic of CRMs …
425
Fig. 1 Histograms of estimates of displacement modules for the first algorithm (left column) and displacements given the sign for the second algorithm (right column) (A1–A6, B1–B6—laboratory numbers; “No of obs”—number of results)
426
P. M. Aronov et al.
Table 1 The comparison of various estimates when processing the data from a model interlaboratory experiment Evaluation
RMSD* result
Arithmetic mean
0.41
Median
0.25
Weighted mean without data correction
0.36
Weighted mean with uncertainty correction
0.27
Weighted mean with results correction
0.23
* Root-mean-square
deviation
the Monte–Carlo method) of the displacement modules, for the first algorithm, and the displacements given the sign, for the second algorithm. As the Fig. 1 shows, there is a good correspondence of the estimate values to the specified hidden parameters at the conditions when their values are comparable in the magnitude to random errors. To compare the algorithms described above with the known estimation methods, another numerical experiment using the Monte–Carlo method was conducted. Laboratory data were modeled according to model (1). Hidden displacements and random margin errors were selected from the normal aggregates Δi ∼ N (0, σi ), ξi ∼ N (0, u i ), where σi and ui were randomly selected, the first—from the general totality with an exponential distribution density e(x) = exp(−x), x ≥ 0, the second—from the interval [0.1, 0.5]. The root-mean-square deviation was calculated for various estimates. The results are presented in Table 1. As Table 1 shows, the new weighted mean algorithm with laboratory results correction has the least margin error among the compared estimates. The developed algorithms were also tested on the real data. Figures 2 and 3 illustrate the work of algorithms in processing the results of interlaboratory experiments to measure the calorific value of coal. The blue indicates the maximum consistent subset of results, black—non–consistent results, green—adjusted uncertainties in Fig. 2 and the adjusted results in Fig. 3.
New Algorithms for Estimating the Certified Characteristic of CRMs …
427
Fig. 2 Interlaboratory experiment results coordination by means of uncertainty correction
Fig. 3 Interlaboratory experiment results coordination by means of results correction
Conclusion 1. The model proposed in this paper for describing the results of interlaboratory experiments in the form of a set of representatives from various general aggregates allows, when evaluating the CRMs value, to account for the possibility of hidden uncertainties (or displacements) due to the influence of the measurement results in this laboratory by means of characteristic features of the methods, techniques and measuring instruments, CRMs, technical means, and reagents used for measuring the value of the CRMs characteristic.
428
P. M. Aronov et al.
2. This model is more accurate compared to the traditional statistical model of interlaboratory experiments based on the assumption of statistical averaging of possible displacements of measurement results obtained in different laboratories using various methods, procedures, and measuring instruments. 3. It is shown that the hidden uncertainties (or displacements) of the measurement results of interlaboratory experiments must be identified and considered when assessing the uncertainty of the CRMs value. 4. The research conducted in this paper has confirmed the possibility of using the proposed algorithms for processing measurement information to correct the data of interlaboratory experiments. These algorithms can be effective in interlaboratory experiments for a small number of laboratories, as well as for high financial, material, and time costs required for conducting experiments. 5. The new algorithms proposed in the paper for estimating the value of the CRMs characteristics undoubtedly require further study, but the existing research already shows they deserve attention when revising GOST 8.532-2002 State system for ensuring the uniformity of measurements. Certified reference materials of composition of substances and materials. Interlaboratory metrological certification. Acknowledgements The research did not receive financial support in the form of a grant from any organization in the public, commercial or non-profit sectors. Contribution of the Authors Aronov P. M.—development and analysis of mathematical algorithms, conducting mathematical research, description of algorithms, text composing; Sobina E. P.—concept and initiation of research, methodological support, overall management of the work, analysis of results; Migal P. V.—methodological support, general management of work, analysis of results; Kremleva O. N.—participation in editing the article, provision of real experimental data in examples to assess the applicability of the proposed models and algorithms in metrological practice in the field of CRMs; Firsanov V. A.—programming of algorithms and numerical experiments; Medvedevskikh S. V.—participation in the research work in terms of statistical processing of the experimental data. Conflict of Interest The article was prepared on the basis of a report presented at the V International Scientific Conference “Reference Materials in Measurement and Technology” (Yekaterinburg, September 13–16, 2022). The article was admitted for publication after the abstract was revised, the article was formalized, and the review procedure was carried out. The authors Medvedevskikh S. V., Sobina E. P., Kremleva O. N. are editors of the book “Reference Materials in Measurement and Technology. RMMT 2022.” The version in the Russian language is published in the journal “Measurement Standards. Reference Materials” 2023;19(3):93–102. (In Russ.). https://doi.org/10.20915/2077-1177-202319-3-93-102.
References 1. GOST 8.532-2002 (2003) State system for ensuring the uniformity of measurements. Certified reference materials of composition of substances and materials. Interlaboratory metrological certification. Content and order of works. Izdatel’stvo standartov, Moscow, 12 p (in Russian)
New Algorithms for Estimating the Certified Characteristic of CRMs …
429
2. CCQM Guidance note: Estimation of consensus KCRV and associated Degrees of Equivalence.Version: 10. Available via BIPM. https://www.bipm.org/documents/20126/28430045/wor king-document-ID-5794/49d366bc-295f-18ca-c4d3-d68aa54077b5. Accessed 26 Aug 2022 3. Meija J, Possolo A (2022) Interlaboratory comparisons of chemical measurements: Quo Vadis? Accred Qual Assur. https://doi.org/10.1007/s00769-022-01505-y 4. Cox MG (2007) The evaluation of key comparison data: determining the largest consistent subset. Metrologia 44(3):187–200. https://doi.org/10.1088/0026-1394/44/3/005 5. Aronov PM (2020) Estimation of consensus value of interlaboratory measurement results accompanied by a minimum increase in associated uncertainty. In: Medvedevskikh SV, Kremleva ON, Vasil’eva IV, Sobina EP (eds) Reference materials in measurement and technology. RMMT 2018. Springer Nature Switzerland AG, pp 151–155. https://doi.org/10.1007/978-3-030-325343_15
On the Stability Assessment of Reference Materials Pavel V. Migal , Egor P. Sobina , Petr M. Aronov, Olga N. Kremleva , Valeriya V. Studenok , Valery A. Firsanov, and Sergey V. Medvedevskikh
Abstract As well as presenting comparative characteristics of domestic and international approaches to assessing the instability of reference materials, the paper describes proposed changes in R 50.2.031–2003. A proposed mathematical apparatus is based on an algorithm of actions for estimating the standard uncertainty from instability and the validity period of a reference material (RM). Approaches to estimating uncertainty from instability in cases of the absence or presence of a significant trend in a RM’s certified characteristic over time are considered. The minimum number of measurements necessary to study the stability of an RM is determined and justified. Smoothing of measurement results when assessing the stability of an RM is shown to lead to an overestimation of the period of validity. Keywords Reference material · CRM · Stability study · Isochronous measurements · Uncertainty of reference materials
Abbreviations RM SD
Reference material Standard deviation
P. V. Migal (B) · E. P. Sobina · P. M. Aronov · O. N. Kremleva · V. V. Studenok · V. A. Firsanov UNIIM—Affiliated Branch of the D. I. Mendeleyev Institute for Metrology, Yekaterinburg, Russia e-mail: [email protected] E. P. Sobina e-mail: [email protected] P. M. Aronov e-mail: [email protected] V. V. Studenok e-mail: [email protected] S. V. Medvedevskikh D. I. Mendeleyev Institute for Metrology, Saint Petersburg, Russia e-mail: [email protected] © D. I. Mendeleyev Institute for Metrology 2024 E. P. Sobina et al. (eds.), Reference Materials in Measurement and Technology, https://doi.org/10.1007/978-3-031-49200-6_29
431
432
X (τ ) a τ X0 X˜ n Xˆ (τn ) N S ΔT ˆT Δ τ┌ τˆ┌ S(ε) ( ) S Xˆ (τ ) t p,N −2 S(τ┌ ) u(τ┌ ) τv T0 , T1
P. V. Migal et al.
Dependence of the certified value on time Slope coefficient of linear equation X (τ ) Point in time of RM storage Certified value (at time τ0 X (τ0 ) = X 0 ) Result of determining the RM certified characteristic at the nth moment of time Predicted value according to the estimated parameters of the linear model ˆ Xˆ 0 ) (a, Number of measurement results obtained during the RM stability study (n = 0, 1, …, N − 1) Random component of the measurement error X˜ n Target RM instability error value Obtained RM instability error value Target RM expiration date value Obtained RM expiration date value Estimated SD of regression residuals Estimated SD regression line Two-sided Student’s coefficient for confidence probability p SD errors from instability Standard uncertainty from instability Moment of time at isochronous study Storage temperatures of rms under normal conditions and under artificial deterioration
Introduction Reference materials (RMs) generally represent a means of storing and transmitting a unit of physical quantity during verification and calibration of measuring instruments for the composition and properties of substances, i.e., they perform the functions of measurement standards. Obviously, in order to transfer a unit of a quantity stored by an RM, it is necessary to take into account the uncertainty of the value of this quantity. One of the sources of uncertainty of the certified value of the RM is its instability over time. In 2003, a recommendation was developed to evaluate the stability characteristics of RMs R 50.2.031–2003 [1]. Currently, some approaches described in R 50.2.031–2003 are not fully consistent with international practice, which is based on the application of approaches described in ISO Guide 35:2017 [2].
On the Stability Assessment of Reference Materials
433
Comparative Analysis The approaches described in R 50.2.031–2003 and ISO Guide 35 are based on an obvious assumption, which is that the certified value of the composition or a property of the RM may vary over time. Based on this statement, a linear model of such behavior is proposed, for example X (τ ) = X 0 + a · τ, τ ≥ 0,
(1)
where X 0 is the established certified value of the RM; a is the slope coefficient of the linear equation; τ is the time interval. To assess the characteristics of the error from instability for a certain period, N measurement results of the certified characteristic X˜ n (n = 0, 1, …, N − 1) are obtained at time points τ0 = 0, τ1 , . . . , τ N −1 . The main difference between the mathematical apparatus in R 50.2.031–2003 and ISO Guide 35:2017 is that the Russian recommendation assumes smoothing of measurement results. The smoothing coefficient, which depends on the ratio of the random component of the error of the measurement technique used to the limit ( )of the permissible error of the studied RM, can take values from 0.1 to 0.3 (α ΔS ∈ 0.1 . . . 0.3, ΔS ≤ 2). It is known that any smoothing, by reducing the random error, introduces a systematic error. The developers of R 50.2.031–2003 probably introduced such an approach to reduce the impact of emissions that may be present among the measurement results, as well as to reduce the impact of random error of the methodology on the evaluation of the shelf life of the RM. At the same time, the use of smoothing in some cases (for example, at a → 0) can lead to a significant overestimation of the period of validity. To illustrate this effect, the authors conducted a synthetic test with the following parameters: ΔS ≈ 1; N = 21; a → 0. The results of the validity period assessment are presented graphically in Fig. 1, where it can be seen that the confidence bounds of Eq. (1) exceed the target error from instability for a period of 27 months, while the calculation according to R 50.2.031–2003 leads to a validity period of more than 50 months.
Selecting the Number of Dimensions ISO Guide 35:2017 does not set out clear criteria for choosing the duration of RM studies or the required number of measurement results to assess the stability of an RM. This is in contrast to R 50.2.031–2003, where recommendations are given for the choice of N based on the ratio of the random component of the error of the measurement technique used to the limit of the permissible error of the studied RM. These recommendations are given in the form of a table without explaining the underlying rationale of the numerical value of N.
434
P. V. Migal et al.
Fig. 1 Graphical representation of the results of the validity period evaluation with the following parameters: ΔS ≈ 1; N = 21; a → 0
As a result of research aimed at updating R 50.2.031–2003, the present authors decided to mathematically substantiate the basic procedures of the experiment to study the stability of the RM. Thus, it is established: ( ) ) ( S 2 S N −1 2 ≤ 2, N > t p,N −2 · 1 + 3 · , · ΔT N +1 ΔT
(2)
where S is the random component of the error of the measurement technique; ΔT is the target RM instability error value; t p,N −2 is Student’s coefficient for the confidence level p. The meaning of the condition for N is that for a stable RM (a = 0), the instability detected due to the influence of random errors in the measurement technique with a probability of p will not exceed the target value. Essentially, meeting this condition ˆ T at least for a provides a confidence interval for regression (1) within the band ±Δ measurement period to detect instability, as well as to determine the validity period of the RM outside this period.
Estimation of Regression Parameters To obtain the described confidence interval, estimates of the parameters of the linear model (1) are found using the least squares method: ∑ N −1 ( aˆ =
n=0
) X˜ n − X (τn − τ )
∑ N −1 n=0
(τn − τ )2
,
(3)
On the Stability Assessment of Reference Materials
Xˆ 0 = X − aˆ · τ ,
435
(4)
∑ N −1 ∑ N −1 τn . where X = N1 n=0 X˜ n , τ = N1 n=1 And statistical estimates of standard deviations (SD) of measurement errors and the constructed dependence [3]: ┌ | | S(ε) = √ (
N −1 )2 1 ∑( ˜ X n − Xˆ (τn ) , N − 2 n=0
)
S Xˆ (τ ) = S(ε) ·
/
(τ − τ )2 1 + ∑ N −1 . 2 N n=0 (τn − τ )
(5)
(6)
It is obvious that the certified value of the RM for the duration of the entire validity period (τ┌ ) must be within the confidence interval taking into account the predicted value of the certified characteristic, i.e., the inequality must be fulfilled ( ) ( ) Xˆ (τ ) − t p,N −2 · S Xˆ (τ ) ≤ X (τ ) ≤ Xˆ (τ ) + t p,N −2 · S Xˆ (τ ) .
(7)
RM Stability Characteristics Based on the above, it is possible to evaluate the stability characteristics of the RM: (a) determine the error from instability based on the target expiration date according to the formula ( ) | | ˆ T (τ┌ ) = |aˆ | · τ┌ + t p,N −2 · S Xˆ (τ┌ ) , Δ
(8)
(b) determine the expiration date (τˆ┌ ) based on the target error from instability (ΔT ) relatively as the positive root of the quadratic equation τ┌ | | ˆ T − |aˆ | · τ┌ )2 (Δ (τ┌ − τ )2 1 + ∑ N −1 . = 2 N (t p,N −2 · S(ε))2 n=0 (τn − τ )
(9)
To illustrate the calculation, let us consider the modified example from R 50.2.031–2003 (Fig. 2), which presents results of measurements of the mass fraction of crude fat during half of the expected period of validity (24 months). Based on · )10−3 · τ + 8.1656 these measurement results, the dependence X (τ ) = −2.6923 ( is constructed along with the confidence limits t p,N −2 · S Xˆ (τ ) estimated at P = 0.95.
436
P. V. Migal et al.
Fig. 2 Example of an estimate of the period of validity and target error from RM instability according to the proposed algorithms
Table 1 shows the initial data and calculation results for the example described above. The values of the required parameters are rounded to 6 digits for the purpose of validating calculations using the algorithms proposed in the article. Figure 2 depicts the meaning of formula (8): this is the point at which inequality (7) ceases to be fulfilled; that is, the predicted certified value exceeds the target error from instability, taking into account the confidence boundaries of the regression line according to (6) [4]. This approach is justified when the error/uncertainty from instability makes a significant contribution to the accuracy of the certified value. In Table 1 Initial data and calculations Input data Period, month
Calculated parameters Result, %
Parameter
Value
0.00
8.20
SD of regression errors S(ε)
0.134408
1.00
8.34
Number of degrees of variance N − 2
10
2.00
7.97
Student’s coefficient t
2.23
3.00
8.29
Estimation of the SD regression line S(X)
0.212235
4.00
8.02
Target period of validity value τ┌
24
5.00
8.00
ˆ T (τ┌ ) Confidence limits of error from instability Δ
0.537505
6.00
8.18
Standard uncertainty from instability u(τ┌ )
0.213053
7.00
8.24
Permissible limits of error from instability ΔT
0.3
8.00
8.02
Obtained RM expiration date value τˆ┌
15.24669
9.00
8.28
10.00 11.00
8.07
( ) ˆ T τˆ┌ Confidence limits of error from instability Δ ( ) Standard uncertainty from instability u τˆ┌
0.118103
8.20
–
–
0.302870
On the Stability Assessment of Reference Materials
437
such cases, it is advisable to sacrifice the period of validity to ensure the specified accuracy. On the other hand, a long validity period may sometimes prevail over the accuracy of the certified value, in which case the error/uncertainty from instability will not affect the consumer properties of the RM. Then it will be possible to estimate the contribution to the accuracy of the certified value from instability using the formula (9).
Period of Stability Research Based on the analysis of the components of the instability error (see (8) and the previously described components), two main sources can be identified: • The first term at a → 0 also tends to zero; however, at the significance of a it can become the main source of error from instability, since, in this case, the change in the properties/composition of the material over time is obvious; • The second term is smaller with a greater the value of N and the research period, and a smaller value of S(ε), which characterizes the regression errors SD. Figures 1 and 2 show that the confidence interval has the lowest value in the middle of the research period; however, this value increases when predicting the expiration date. In this regard, it is possible to proceed as follows. The initial duration of the studies is chosen to be at least half of the expected validity period. After estimating the required number N, at least three measurements X are carried out. Based on the obtained results, preliminary estimates of the instability error are made either based on the target expiration date or on the expiration date based on the target instability error as described above. The measurements are repeated (preferably at regular intervals) until the instability error or the expiration date value meet the established requirements (for example, described in the technical specification for the development of the RM) or until further research becomes impractical (for example, instability of the RM material is detected, which will prohibit the use of this material for the target destination). Using this approach, it becomes possible to adjust the experimental plan at the early stages of research and more correctly evaluate the accuracy characteristics from the instability of the RM. Another important component of the duration of instability studies is the dependence of the rate of degradation of the RM on the magnitude of the external influencing factor. If there is such a dependence, then knowledge of this dependence can be used to validate research carried out under conditions of isochronous stability studies [5]. The duration of the study time with accelerated aging of the RM is determined based on the estimated validity period of the RM instance. If the factor of RM instability is the RM storage temperature, then the period of study of RM instability during accelerated aging is determined according to the Van’t Hoff rule using the
438
P. V. Migal et al.
formula τv =
τ┌ γ
T1 −T0 10
,
(10)
where τv is the period of study of RM instability during accelerated aging; τ┌ is the estimated validity period of RM at storage temperature; T0 , T1 is the storage temperature of the RM and storage temperature of RM during accelerated aging; γ is the reaction acceleration coefficient (assumed to be equal to 2 or estimated experimentally). When using accelerated aging in calculations, the values of τ1 , ..., τ N −1 must be normalized using the equation τn = τv,n · γ
T1 −T0 10
.
(11)
In order to estimate the coefficient γ based on the Van’t Hoff rule, it is necessary to determine the values τv and τ┌ . For this purpose, an experiment it carried out at different RM storage temperatures [6]. We select such a Tx that T0 ≤ Tx « T1 . Thus ( γ =
τv τx
) T 10−T 1
x
.
(12)
Since Tx can be equal to T0 , it is possible to combine classical and accelerated RM stability studies to estimate the acceleration coefficient. By analogy with the approach described above, an experiment is carried out to assess stability at Tx and T1 . The choice of the duration of studies τv at T1 is made according to the formula (10) where γ = 2. N measurement results are obtained at Tx and T1 during τv . The corresponding linear regression coefficients aˆ x and aˆ v are calculated by analogy with (3). The calculation of γ is carried out according to the formula ( γ =
aˆ v aˆ x
) T 10−T 1
x
.
(13)
It should be noted that aˆ x may be insignificant (for example, according to Student’s criterion) according to the results of the experiment. This may be caused by an insufficiently high value of Tx or a short duration of studies. In such a situation, it is advisable to increase the value of Tx or τv . The known value of the acceleration coefficient makes it possible to more correctly determine the RM stability characteristics, as well as helping to study of RM stability even faster during periodic release and monitoring the stability of subsequent batches of this RM or other analogous RMs. For example, in [7], a study of the stability of
On the Stability Assessment of Reference Materials
439
RM solutions of chemical elements was described in which the value γ = 3.2 was set to significantly reduce the duration of stability studies of similar RMs, as well as to develop an express method for assessing the stability of new RM batches of the same type.
Standard Uncertainty from Instability ˆ T (τ┌ )) into the correVarious options for converting the error from instability (Δ sponding standard uncertainty are possible depending on the properties of the constructed dependence of the certified value from time to time. For example, ISO Guide 35:2017 paragraphs 8.6, 8.7.4 describes a case when a significant trend of linear regression is observed; here, it is recommended to convert the trend into standard uncertainty and include, together with the uncertainty of the expected degradation, the uncertainty of the assigned value (for example, using a uniform distribution if a linear trend is observed). Although a mathematical apparatus for the described recommendations is not given in ISO Guide 35:2017, it is indicated that “the resulting uncertainty for a time-dependent certified value can be applied only to one side of the interval due to the fact that degradation tends to spread only in one direction, which leads to asymmetric uncertainties.” The authors do not deny the possibility of using various options for converting the error from instability to the corresponding standard uncertainty. Specific options should be based on the principles set out in the JCGM 100:2008 Manual on the Expression of Measurement Uncertainty [8]. However, assuming a uniform distribution of the magnitude associated with the trend of linear regression, the standard deviation of the error and the standard uncertainty from the instability of the RM can be calculated by the formula /( S(τ┌ ) = u(τ┌ ) =
aˆ · τ┌ √ 3
)2
( )2 + S Xˆ (τ┌ ) ,
(14)
where S(τ┌ ) is the standard deviation of error from instability; u(τ┌ ) is the standard uncertainty from instability.
Conclusion As a result of the work carried out on the revision of R 50.2.031–2003: • the approaches have been harmonized with international practice described in ISO Guide 35:2017; • algorithms for estimating the standard deviation and standard uncertainty from the instability of the certified RM characteristic are given;
440
P. V. Migal et al.
• technical inaccuracies in algorithms and examples have been eliminated; • new algorithms have been developed to adequately assess the RM period of validity; • a specific algorithm of actions for assessing the stability characteristics of the RM is provided; • criteria data for selecting the duration of RM studies or the required number of measurement results to assess the stability of an RM are given. Separately, it can be noted that the described algorithms can be used to study both the long-term and short-term stability of an RM [9]. Acknowledgements This study did not receive financial support in the form of a grant from any organization in the public, commercial or non-profit sector. Author Contributions Migal P. V.—definition of the idea and methodology of the article, literature analysis, experimental data processing, work with the text of the article; Sobina E. P.—concept and initiation of research, methodological support, general management of work, analysis of results; Aronov P. M.—analysis of mathematical algorithms, conducting mathematical research, description of algorithms; Kremleva O. N.—participation in the general editing of the article, methodological support of the research underlying the article; Studenok V. V.—editing the article, providing experimental data in examples to assess the applicability of the proposed models and algorithms in metrological practice in the field of reference materials; Firsanov V. A.—programming algorithms for processing experimental data for evaluation of the stability of standard samples; Medvedevskikh S. V.—participation in research work in terms of statistical processing of experimental data. Conflict of Interest The article was prepared on the basis of a report presented at the V International Scientific Conference “Reference Materials in Measurement and Technology” (Yekaterinburg, September 13–16, 2022). The article was admitted for publication after the abstract was revised, the article was formalized, and the review procedure was carried out. The authors Medvedevskikh S. V., Sobina E. P., Kremleva O. N. are editors of the book “Reference Materials in Measurement and Technology. RMMT 2022.” The version in the Russian language is published in the journal “Measurement Standards. Reference Materials” 2023;19(3):65–75. (In Russ.). https://doi.org/10.20915/2077-1177-2023-193-65-75.
Appendix 1: Determination of Inequality (2) ˆ T is assumed to be set. Then from The target value of the error from RM instability Δ the formulas (3), (5) and (7), the equality follows | | |aˆ | · τ┌ + t p,N −2 · S(ε) · as well as the inequality
/
(τ┌ − τ )2 1 ˆ T, + ∑ N −1 =Δ 2 N τ ) (τ − n n=0
(15)
On the Stability Assessment of Reference Materials
/ t p,N −2 · S(ε) ·
441
(τ┌ − τ )2 1 ˆ T. + ∑ N −1 ≤Δ 2 N n=0 (τn − τ )
(16)
Squaring both parts (16), we get 2 t p,N −2
) ( S 2 (ε) (τ N −1 − τ )2 ˆ 2T , ≤Δ · · 1+ N Sτ2
(17)
N −1 1 ∑ (τn − τ )2 . N n=0
(18)
where Sτ2 =
Given that the inequality τ┌ > τ N −1 is satisfied for the expiration date from (17), we obtain ) ( S 2 (ε) (τ N −1 − τ )2 2 ˆ 2T . 0.0059, then σˆ b2 = 0.0173 is obtained by formula (10) to estimate the heterogeneity variance. In this case, the SD due to material heterogeneity is indeed larger than the SD of the measurement precision. Thus, the algorithms provided in Table 1 Results of mass fraction measurements of potassium ions (%)
x i∗
RM sample number
Measurement result number 1
2
1
47.32
47.16
47.24
2
47.37
47.73
47.55
3
47.39
47.34
47.37
4
46.98
47.55
47.27
5
47.67
47.55
47.61
6
47.64
47.68
47.66
7
47.75
47.68
47.72
8
47.69
47.63
47.66
9
47.55
47.67
47.61
10
47.60
47.67
47.64
454
E. P. Sobina et al.
ISO Guide 35:2017 and GOST 8.531–2002 lead to the same estimates of the standard uncertainty from heterogeneity. Taking account of the minimum representative sample mass Δm = m = 1 g and formula (11), we obtain / u h = Sh =
0.0173 ·
1.0 = 0.1314 1.0
for the maximum standard deviation of heterogeneity in the sample. Example 2 The RM material is potassium chloride produced by flotation. The component being certified is potassium chloride (KCl). The certified characteristic is the mass fraction of potassium chloride, %. The number of selected RM samples is I = 10. The number of repeated measurements in the RM samples is J = 2. The mass of samples is m = 1 g. The measurement results are recorded in Table 2. In the example with the performed calculations, the final and intermediate numbers of calculations are intentionally written with 4 decimal places. In the same way as in Example 1, we calculate S2 Se2 = 0.1367, x ∗∗ = 95.5698, Sb2 = 0.0639, Sb2 − e = −0.0044, J / ( 2) 2 S 2 S = 0.0306. u e = e · J J I · (J − 1) S2
Thus, the Sb2 − Je value is negative and cannot be used to estimate the heterogeneity variance. Therefore, according to ISO Guide 35:2017, σˆ b2 = max(−0.0044, 0.0306) = 0.0306 Table 2 Results of mass fraction measurements of potassium chloride (%)
RM sample number
Measurement result number 1
2
x i∗
1
95.32
94.92
95.120
2
95.44
95.50
95.470
3
95.32
96.415
95.868
4
94.90
95.40
95.150
5
95.51
95.77
95.640
6
95.65
95.94
95.795
7
95.40
95.81
95.605
8
95.51
95.94
95.725
9
95.37
95.95
95.660
10
95.40
95.93
95.665
Algorithms for Evaluating the Homogeneity of Reference Materials …
455
u h = Sh = 0.1749%. Moreover, if the calculation is performed according to GOST 8.531–2002, then formula (12) ought to be used. In this case the standard uncertainty from heterogeneity will be u h = Sh = 0.1233%. This example demonstrates that the underestimation of the standard uncertainty from heterogeneity according to GOST 8.531–2002 was 1.4 times larger compared to the algorithms set forth in ISO Guide 35:2017. Let us now consider the ratio of standard uncertainty estimates based on ISO Guide S2 35:2017 (11) to those based on GOST 8.531–2002 when the difference Sb2 − Je is negative u h (I S O) = 3 · J −1/2 · K (I, J ) = u h (G O ST )
(
2 I · ( J − 1)
)1/4 (27)
The analysis of expression (27) indicates that this ratio depends only on the samples under study and the number of observations in them, i.e. on the scope of experimental research. The dependence K(I, J) is shown in Fig. 1. In general, it is obvious from this graph that in a small-volume experiment, the estimates of the standard uncertainty from heterogeneity according to GOST 8.531– 2002 will be underestimated. On the other hand, in a large-volume experiment, the reverse is true, and the estimates of the standard uncertainty from heterogeneity according to GOST 8.531–2002 will be overestimated. To definitively answer the question of what a large- and small-volume experiment is, we will employ the Monte Carlo method to numerically analyze several typical examples to compare the estimated uncertainty from heterogeneity according to ISO Guide 35:2017 and GOST 8.531–2002. Example 3 I = 10, J = 2, N = 104 , m = Δm = 1, μ(Sb) = 0.12–0.45; μ(Se) = 0.3; σ(Sb) = 0.015; σ(Se) = 0.015; the distribution is normal. Figure 2 shows the calculation results. As we have already shown in Example 2, the uncertainty from heterogeneity obtained according to GOST 8.531–2002 is understated by a factor of 1.4 in comparison with ISO Guide 35:2017. Example 4 I = 50, J = 2, N = 104 , m = Δm = 1, μ(Sb) = 0.12–0.45; μ(Se) = 0.3; σ(Sb) = 0.015; σ(Se) = 0.015. The calculation results in Fig. 3 indicate that the estimates of uncertainties from heterogeneity obtained in accordance with GOST 8.531–2002 and ISO Guide 35:2017 are similar. Example 5 I = 100, J = 2, N = 104 , m = Δm = 1, μ(Sb) = 0.12–0.45; μ(Se) = 0.3; σ(Sb) = 0.015; σ(Se) = 0.015. The calculation results presented in Fig. 4 indicate that
456
E. P. Sobina et al.
Fig. 1 Dependence of K(I, J) on the number of selected RM samples I and the number of repeated observations in them J
the estimates of uncertainty from heterogeneity obtained according to GOST 8.531– 2002 are overestimated in comparison with those obtained in accordance with ISO Guide 35:2017. Example 5 is more of a theoretical option since in practice in most cases experimental studies are performed in a much smaller volume, like in Example 3.
Let Us Consider a Typical Example When Evaluating the Heterogeneity of Monolithic Materials Example 6 The RM material is bronze. The component being certified is tin. The RM homogeneity was investigated by atomic emission spectroscopy. The measurement results are recorded in Table 3. In the example with the performed calculations, the final and intermediate numbers of calculations are intentionally written with a large number of decimal places.
Algorithms for Evaluating the Homogeneity of Reference Materials …
457
Fig. 2 Dependence of the standard uncertainty from heterogeneity on the ratio SSbe (I = 10, J = 2, N = 104 , m = Δm = 1, μ(Sb) = 0.12–0.45; μ(Se) = 0.3; σ(Sb) = 0.015; σ(Se) = 0.015; normal distribution)
Fig. 3 Dependence of the standard uncertainty from heterogeneity on the ratio SSbe (I = 50, J = 2, N = 104 , m = Δm = 1, μ(Sb) = 0.12–0.45; μ(Se) = 0.3; σ(Sb) = 0.015; σ(Se) = 0.015; normal distribution)
458
E. P. Sobina et al.
Fig. 4 Dependence of the standard uncertainty from heterogeneity on the ratio SSbe (I = 100, J = 2, N = 104 , m = Δm = 1, μ(Sb) = 0.12–0.45; μ(Se) = 0.3; σ(Sb) = 0.015; σ(Se) = 0.015; normal distribution)
Based on the column sums in Table 3, the values are calculated by formulae (15)–(25) xˆ = x ∗∗∗ = 4.4449, Se2 = 0.0115850, Sw2 = 0.03502950, Sb2 = 0.017910146. / ( 2) 2 2 S S 2 S Sw2 − e = 0.0029237, and also u e = e · N N N I · J (N − 1) / 0.01195850 2 · = 0.0011585 = 2 2 · 2(25 − 1) 2 Smic = 0.0029237.
Sb2 − (
S2 and also u w J
)
S2 = w · J
Sw2 = 0.000395396, J
/
/ 0.0350295 2 · = I · (J − 1) 2
2 = 0.00495392 25 · (2 − 1)
2 Smac = 0.00495392.
Sh =
/
2 2 Smic + Smac =
√
0.0029237 + 0.00495392 = 0.1849%,
9
8
7
6
5
4
3
4.68
4.43
2
4.56
1
4.38
4.59
2
2
4.25
1
1
4.79
4.42
2
2
3.99
1
4.12
4.13
1
4.19
2
4.40
2
1
4.21
4.22
2
4.29
1
1
4.21
2
2
4.06
1
1
4.26
4.3
4.71
4.52
4.59
4.28
4.53
4.35
4.47
4.07
4.54
4.29
4.68
4.26
4.3
4.04
4.10
4.06
Analytical surface Measurement number number 1 2
RM number
Measurement results
Table 3 Results of mass fraction measurements of tin (%)
4.345
4.340
4.695
4.540
4.590
4.265
4.660
4.235
4.445
4.030
4.335
4.240
4.540
4.240
4.255
4.165
4.155
4.060
x i j∗
4.3425
4.6175
4.4275
4.4475
4.2375
4.2875
4.39
4.21
4.1075
x i∗∗
0.000006250
0.000006250
0.006006250
0.006006250
0.026406250
0.026406250
0.045156250
0.045156250
0.043056250
0.043056250
0.002256250
0.002256250
0.022500000
0.022500000
0.002025000
0.002025000
0.002256250
0.002256250
wi2j Ʌ
2
0.010485760
0.029790760
0.000302760
0.000006760
0.043014760
0.024774760
0.003014010
0.055178010
0.113838760
bi
Ʌ
0.007225000
0.001600000
0.000225000
0.000400000
0.000000000
0.000225000
0.016900000
0.013225000
0.000625000
0.001600000
0.042025000
0.002500000
0.019600000
0.000400000
0.002025000
0.015625000
0.003025000
0.000000000
1
(continued)
0.007225000
0.020277760
0.000225000
0.000400000
0.000000000
0.000225000
0.016900000
0.013225000
0.000625000
0.001600000
0.042025000
0.002500000
0.019600000
0.000400000
0.002025000
0.015625000
0.003025000
0.000000000
2
Measurement number
eˆi2jn
Algorithms for Evaluating the Homogeneity of Reference Materials … 459
19
18
17
16
15
14
13
12
4.53
4.82
4.20
4.72
2
1
2
4.23
1
4.55
4.54
2
2
4.80
1
1
4.44
4.69
2
2
4.08
1
4.13
4.48
1
4.41
2
4.71
2
1
4.51
4.35
2
4.25
1
1
4.55
2
11
4.40
1
10
4.79
4.45
4.56
4.64
4.69
4.36
4.60
4.67
4.61
4.40
4.62
4.15
4.43
4.39
4.78
4.30
4.55
4.51
4.46
4.29
Analytical surface Measurement number number 1 2
RM number
Measurement results
Table 3 (continued)
4.755
4.325
4.690
4.595
4.610
4.295
4.570
4.735
4.525
4.265
4.655
4.115
4.455
4.400
4.745
4.325
4.530
4.380
4.505
4.345
x i j∗
4.54
4.6425
4.4525
4.6525
4.395
4.385
4.4275
4.535
4.455
4.425
x i∗∗
0.046225000
0.046225000
0.002256250
0.002256250
0.024806250
0.024806250
0.006806250
0.006806250
0.016900000
0.016900000
0.072900000
0.072900000
0.000756250
0.000756250
0.044100000
0.044100000
0.005625000
0.005625000
0.006400000
0.006400000
wi2j Ʌ
2
0.009044010
0.039045760
0.000057760
0.043097760
0.002490010
0.003588010
0.000302760
0.008118010
0.000102010
0.000396010
bi
Ʌ
0.001225000
0.015625000
0.016900000
0.002025000
0.006400000
0.004225000
0.000900000
0.004225000
0.007225000
0.018225000
0.001225000
0.001225000
0.000625000
0.000100000
0.001225000
0.000625000
0.000400000
0.016900000
0.002025000
0.003025000
1
(continued)
0.001225000
0.015625000
0.016900000
0.002025000
0.006400000
0.004225000
0.000900000
0.004225000
0.007225000
0.018225000
0.001225000
0.001225000
0.000625000
0.000100000
0.001225000
0.000625000
0.000400000
0.016900000
0.002025000
0.003025000
2
Measurement number
eˆi2jn
460 E. P. Sobina et al.
25
24
23
22
4.61
4.53
2
2
4.43
1
4.51
4.72
1
4.44
2
4.55
2
1
4.63
4.44
2
4.34
1
1
4.55
2
21
4.62
1
20
4.59
4.32
4.60
4.40
4.70
4.29
4.70
4.64
4.60
4.44
4.61
4.32
Analytical surface Measurement number number 1 2
RM number
Measurement results
Table 3 (continued)
4.600
4.415
4.565
4.415
4.710
4.365
4.625
4.540
4.615
4.390
4.580
4.470
x i j∗
4.5075
4.49
4.5375
4.5825
4.5025
4.525
x i∗∗
0.008556250
0.008556250
0.005625000
0.005625000
0.029756250
0.029756250
0.001806250
0.001806250
0.012656250
0.012656250
0.003025000
0.003025000
wi2j Ʌ
2
0.003918760
0.002034010
0.008574760
0.018933760
0.003317760
0.006416010
bi
Ʌ
0.000100000
0.009025000
0.001225000
0.000225000
0.000100000
0.005625000
0.005625000
0.010000000
0.000225000
0.002500000
0.000900000
0.022500000
1
0.000100000
0.009025000
0.001225000
0.000225000
0.000100000
0.005625000
0.005625000
0.010000000
0.000225000
0.002500000
0.000900000
0.022500000
2
Measurement number
eˆi2jn
Algorithms for Evaluating the Homogeneity of Reference Materials … 461
462
E. P. Sobina et al.
which is 4.16% of the mean value of the component being certified. When performing calculations in accordance with the current edition of GOST 8.531–2002, the standard uncertainty from heterogeneity for this example was 3.9%. Thus, since a sufficiently large number of measurements for monolithic materials are factored into this edition, the estimates of standard uncertainties evaluated according to the algorithm proposed in this article and in the current edition of GOST 8.531–2002 are almost the same.
Conclusion The article analyzed algorithms for evaluating standard uncertainty from heterogeneity in accordance with the interstate standard GOST 8.531–2002 and the international standard ISO Guide 35:2017. Based on these standards, we have developed new algorithms for estimating the homogeneity of dispersed and monolithic materials. These algorithms employ the analysis of variance (ANOVA) incorporated in both ISO Guide 35:2017 and GOST 8.531–2002. The main distinction between the developed algorithms and ISO Guide 35:2017 is the elaboration of specific algorithms suitable for calculation and automation. The major difference from GOST 8.531–2002 is the updated calculation of the standard uncertainty from heterogeneity when it is comparable to the type A evaluation of standard uncertainty. The other dissimilarities are the presence of data gaps and consideration of general cases when selecting an arbitrary number of RM samples and an arbitrary number of repeated measurements in each RM sample. The developed algorithms were tested on various real-world examples, including simulated data, and their applicability was proved. The research results demonstrate that the approach outlined in ISO Guide 35:2017 is a more effective way of evaluating standard uncertainty from heterogeneity. It is modernized and considers the minimum representative sample mass. Moreover, the algorithm is applicable to studying composition indicators as well as properties of solid and liquid substances and materials. Thus, to harmonize GOST 8.531–2002 and ISO Guide 35:2017, as well as to increase confidence in the results of determining RM metrological characteristics in Russia at the international level, the updated algorithms will be used to revise GOST 8.531–2002. Acknowledgements The research did not receive financial support in the form of a grant from any organization in the public, commercial or non-profit sector. Contribution of the authors Sobina E. P.—development of the idea and concept of the research, methodological support, general management of the work, analysis of the results; Aronov P. M.— development and analysis of mathematical algorithms, mathematical research, description of algorithms, work on the text; Migal P. V.—methodological support, general management of the work, analysis of results; Kremleva O. N., Studenok V. V.—editing of the article, providing experimental data for examples to assess the applicability of the proposed models and algorithms in metrological practice in the field of reference materials; Firsanov V. A.—programming of algorithms and numerical experiments; Medvedevskikh S. V.—participation in research work in terms of statistical processing of experimental data.
Algorithms for Evaluating the Homogeneity of Reference Materials …
463
Conflict of Interest The article was prepared on the basis of a report presented at the V International Scientific Conference “Reference Materials in Measurement and Technology” (Yekaterinburg, September 13–16, 2022). The article was admitted for publication after the abstract was revised, the article was formalized, and the review procedure was carried out. The authors Medvedevskikh S. V., Sobina E. P., Kremleva O. N. are editors of the book “Reference Materials in Measurement and Technology. RMMT 2022.” The version in the Russian language is published in the journal “Measurement Standards. Reference Materials” 2023;19(3):77–91. (In Russ.). https://doi.org/10.20915/2077-1177-2023-193-77-91.
References 1. Kazantsev VV, Medvedevskikh SV, Nalobin DP, Osintseva EV, Terentiev GI (2011) Development of inhomogeneity evaluation procedures in the production of certified reference materials of chemical composition and properties of nanomaterials. Ref Mater 1:29–43 (in Russian) 2. Kazantsev VV, Medvedevskikh SV, Nalobin DP, Osintseva EV, Terentiev GI (2011) Development of procedures for evaluation of inhomogeneity in the production of certified reference materials for composition and properties of nanomaterials. Ref Mater 2:37–48 (in Russian) 3. Kazantsev VV, Medvedevskikh SV, Nalobin DP, Terentiev GI (2011) Development of procedures for evaluation of inhomogeneity in the production of certified reference materials for chemical composition and properties of nanomaterials. Ref Mater 3:61–69 (in Russian) 4. Stupakova EV (2019) Measuring errors in the compositional reference materials of gold ore. Miner Min Eng (6):81–89 (in Russian). https://doi.org/10.21440/0536-1028-2019-6-81-89 5. Prokhorova IA (2017) Applied aspects of creation of a branch reference material of structure (agrochemical indicators) chernozem typical. Soil Sci Agrochem 2:66–76 (in Russian) 6. Vasil’eva IE, Shabanova EV, Zabanov YuA, Bus’ko AE (2015) The use of MAES in the study of reference standard materials of natural and man-made composition. Industrial laboratory. Diagnost Mater 81(1):22–29 (in Russian) 7. Linsinger TPJ, Pauwels J, van der Veen AMH, Schimmel H, Lamberty A (2001) Homogeneity and stability of reference materials. Accred Qual Assur 6:20–25. https://doi.org/10.1007/s00 7690000261 8. Ellison SLR, Botha A (2018) Principles for the assessment of homogeneity and stability in the new ISO Guide 35:2017. Accred Qual Assur 23:47–51. https://doi.org/10.1007/s00769-0171293-5 9. ISO Guide 35:2017 Reference materials—Guidance for characterization and assessment of homogeneity and stability. Available via ISO. https://www.iso.org/standard/60281.html 10. GOST 8.531–2002 (2008) State system for ensuring the uniformity of measurements. Reference materials of composition of solid and disperse materials. Ways of homogeneity assessment. Standartinform, Moscow, 14 p (in Russian)
A Comparative Analysis of OIML Documents and Russian Rules on the Use of Reference Materials Narine G. Oganyan
and Vladimir I. Dobrovolskiy
Abstract The article analyzes the compliance of Russian legal documents with the Recommendations of the International Organization of Legal Metrology regarding the use of reference materials in the fields covered by the state control and supervision. The problem of ensuring the quality of measurement results is relevant for each laboratory, performing measurements in any fields of activity. In addition to a reliable and proven measurement method, a decisive role in obtaining comparable results is played by reference materials. In order to ensure the traceability of measurements, a reference material must be certified. Certified reference materials are obligatory for the state metrological control and supervision of the quality and safety of food and pharmaceutical products, quality of measurements in clinical laboratories, environmental safety, etc. Considering the important role of reference materials in the process of ensuring the uniformity of measurements in analytical laboratories, this study can contribute to the promotion of ideas for improving the Russian legislative framework in the relevant area. Keywords Certified reference material · CRM production · CRM type approval · CRM expertise · State metrological control and supervision · Legal requirements
Abbreviations GSO OIML RF RM
Approved type of reference material International Organization of Legal Metrology Russian Federation Reference material
N. G. Oganyan (B) · V. I. Dobrovolskiy All-Russian Scientific Research Institute of Physicotechnical and Radio Engineering Measurements (VNIIFTRI), Moscow Region, Russia e-mail: [email protected] V. I. Dobrovolskiy e-mail: [email protected]
© D. I. Mendeleyev Institute for Metrology 2024 E. P. Sobina et al. (eds.), Reference Materials in Measurement and Technology, https://doi.org/10.1007/978-3-031-49200-6_31
465
466
CRM BIPM
N. G. Oganyan and V. I. Dobrovolskiy
Certified reference material International Bureau of Weights and Measures
Introduction A decision on the conformity of products to their quality requirements is primarily based on the sufficient accuracy of measurement results provided by analytical laboratories [1–3]. Therefore, every laboratory, regardless of the field of its activity, should be aware of the need to ensure the quality of its measurement results. Over the past decades, an agreement has been reached between experts from various countries on how the required quality of measurements can be achieved. The starting point undoubtedly involves the choice of a reliable and proven method. However, this cannot be considered a sufficient basis for comparing the results obtained in various laboratories. In order to ensure the comparability of the results, it is necessary to ensure the metrological traceability of these measurements [1, 4]. In analytical laboratories, a decisive role in this issue is played by references in the form of chemicals, which are called reference materials (RMs). RMs are used for the verification, calibration, and validation of methods, assessment of measurement uncertainties, and quality control. In addition, it should be kept in mind that a particular RM can be used only for one measurement purpose, for example, for calibration or product quality control [5]. According to the international metrological vocabularies JCGM 200:2012, ISO/ IEC Guide 99:2007, and RMG 29–2013 [6–8], a certified reference material (CRM) is a “reference material, accompanied by documentation issued by an authoritative body and providing one or more specified property values with associated uncertainties and traceabilities, using valid procedures”. According to the metrological vocabulary RMG 29–2013, operating within the Russian Federation (RF): “a certified reference material is a reference material, accompanied with the documentation issued by an authoritative body, which indicates one or more values of a certain property with the appropriate measurement accuracy characteristics (uncertainties) and traceability, which are established using reasonable procedures.” Therefore, the CRM definition is fully consistent with the foreign analogues. As can be seen from the RM and CRM definitions, in order to ensure the traceability of measurements, without which it is impossible to pass the accreditation procedure by any measuring laboratory for a compliance with the requirements of ISO/IEC17025:2017 [9, 10], laboratories need to use CRMs. It is obvious that laboratories have to use CRMs in such areas, as the quality and safety of food and pharmaceutical products, quality of measurements in clinical laboratories, environmental safety, etc., where ensuring the uniformity of measurements is regulated by the State in accordance with the requirements of the Federal Law of June 26, 2008 No. 102-FZ [11]. In addition, laboratory specialists should know and understand how to correctly select RMs for their measurements and that
A Comparative Analysis of OIML Documents and Russian Rules …
467
not all samples, offered on the market, are produced with the same quality level. It is important to ensure that any used CRM is developed and characterized in a technically sound manner. Generally, detailed information about homogeneity and stability studies, certification methods, as well as uncertainties and deviations in the declared RM values is available from a reliable producer and this information may be used to assess their reliability. As indicated above, a CRM must be accompanied with a certificate (or other identical document) that includes the evaluated uncertainty associated with the assigned value. The criteria for the competence of CRM producers, recognized at the interstate level, are determined by ISO 17034:20161 [12, 13]. It is clear that the practice of RM production and use differs from country to country. Therefore, it is extremely risky to leave this issue without appropriate state regulation. For this purpose, within the framework of the International Organization of Legal Metrology (OIML), the Document OIML D18 [14] was developed, formulating legal requirements for RMs, used in metrological activities in accordance with the national legislation. OIML D18 is based on the General principles regarding the use of RMs as measuring standards, which are provided in both ISO/REMCO and OIML publications. The document defines the minimum content of technical procedures that form the elements of the state metrological control and supervision applied to RMs. If necessary, procedures, depending on the specifics and practical experience in a particular country, may be changed and extended in national regulatory documents. As we have already defined, the traceability of measurements in the field covered by the state control and supervision should be ensured by using CRMs.
How to Determine Whether the RMs Used Are Within the Scope of State Control and Supervision In practice, this is often a difficult problem. According to OIML D18 [14], when considering whether the used RM is within the scope of state control and supervision or not, it is advisable to use the information specified in the CRM Certificate on the intended metrological use, such as: • using the CRM as a measuring standard for verification, calibration and testing of measuring instruments; • using the CRM to standardize measurement procedures and/or to determine their uncertainties while measuring; • using the CRM for calibration of measuring instruments in measurement procedures. Information on whether relevant measuring instruments or measurement procedures are in the field covered by the state metrological control and supervision or 1
Note: In the RF, GOST R ISO 17034-2021 [12] State Standard, forced in December 2021, has not yet commonly used by RM producers.
468
N. G. Oganyan and V. I. Dobrovolskiy
not may be used to determine whether this CRM is covered by the state metrological control and supervision. A useful guidance in resolving this issue may be a list of the fields covered by the state regulation, whose legal documents provide specific details. The Document OIML D 122 [16] may be a useful guidance. Thus, according to the international documents, in the RF, relevant legal documents determine both fields covered by the metrological control and supervision and a list of measurements related to these fields, according to which it is possible to determine whether the CRM is included in the legislative fields.
Necessary Criteria for the Compliance of a CRM with the Requirements The necessary conditions for the use of CRMs in the fields covered by the state metrological control and supervision are their compliance with the specified metrological, technical, and administrative requirements, established in the country. Three types of requirements developed on the basis of OIML D3 [17] recommended and adapted for CRMs are provided below. Metrological requirements include: • list of CRM metrological characteristics to be determined; • format of their presentation; • requirements for measuring instruments and methods used in determining the metrological characteristics of CRMs, requirements for the content of CRM certification programs and procedures, etc. Technical requirements include: • CRM product form; • list of accompanying technical documents for the initial and subsequent CRM production; • requirements for packing and marking of the CRM delivered to the user, etc. Administrative (legal) requirements for CRMs include: • list of metrological activities, where the CRM is intended to be used; • requirements for the type and format of documents accompanying the CRM, when delivered to the user; • if necessary, designation of types and methods to control CRM metrological characteristics in the process of its use; • details of the state registration in order to identify CRM or CRM batches, etc. 2
Note: In the RF, the fields covered by the state metrological control and supervision are laid in the Federal Law of June 26, 2008 No. 102-FZ [9], and the list of measurements related to the scope of the State Control for Measurement Uniformity Assurance are laid in the Government Decree dated November 16, 2020 No. 1847 [15].
A Comparative Analysis of OIML Documents and Russian Rules …
469
During the development of some CRMs, metrological, technical, and administrative requirements may be preliminary included in the project prepared at the initial stage of works. In addition, the requirements to CRMs, authorized for the use in the field of the state metrological control and supervision, may be set out in the relevant regulatory document on the legislative metrology or a state standard.3 It is evident that, similar to any measuring standard or instrument, CRMs, approved for the use in the fields covered by the state metrological control and supervision, are also subject to the state metrological control and supervision [14].
CRM Metrological Control The main purpose of metrological control is to ensure the compliance of CRMs with metrological, technical, and administrative (legal) requirements specified above. A reasonable question is “What should be taken into account for metrological control to make sure the compliance of a CRM with the legal requirements?” According to the relevant OIML provisions, the metrological control of measuring instruments normally includes the evaluation or testing of samples of a measuring instrument type and its approval, the verification (initial, periodic and other) or calibration of measuring instruments, the metrological supervision of the issue and use of measuring instruments and the conditions for their use, etc. In the case with CRM, all these operations are not always justified and may be limited [14] to the following operations, which can be represented schematically (Fig. 1): At the same time, it is advisable to indicate in the regulatory document of the National Service of Legal Metrology, which ways (form, content, and procedures) the metrological control of a CRM shall be implemented. According to the foregoing, type approval is one of the ways for the metrological control of used CRMs, in which the compliance of a CRM to legislative requirements is assessed (to make an examination). Before making a decision about the approval of the CRM type, it is necessary to make sure that the legal requirements are fully taken into account and reflected in the technical documentation of the CRM: • performance or target specification for the CRM production; • CRM certification program or procedure, CRM certificate model or another identical document; • documents, accompanying the CRM when delivered to the consumer, or other documents specified by administrative requirements. To conduct the expertise, it is also important to assess whether measuring instruments used to establish the certified CRM values are covered by the metrological control and whether the measuring standards used are higher in the traceability 3
Note: In the RF, on the basis of the Federal Law dated June 26, 2008 No. 102-FZ [9], only approved type of RMs are allowed to use in the field covered by the State metrological control and supervision.
470
N. G. Oganyan and V. I. Dobrovolskiy
Fig. 1 Set of operations on the CRM metrological control and supervision, according to the provisions of OIML
chain [18]. The expertise may be general or detailed, including introduction to the CRM preparing procedure and production supervision of the compliance with the requirements of technical documents. In the latter case, it is possible to confirm the competence of the CRM producer by the accreditation procedure in accordance with the requirements of ISO 17034:2016 [12], provided that the national authority has established this possibility.4 Based on the positive results of assessing the compliance of a CRM with the established requirements, the type of CRM is approved by the competent authority of the National Service of Legal Metrology. When approving the CRM type, rules for verification and certification of the necessary standards should be established. The type approval may be accompanied by both the issuance of a “CRM type approval certificate” and the authorization of the CRM producer to stamp a type approval mark on the accompanying CRM documents.5 The model of the certificate and/or mark 4
Note: In the RF, on the basis of the Order of the Ministry of Industry and Trade dated August 28, 2020 No. 2905 [19], in terms of a CRM compliance assessment, the test procedure of RM have been established, including the examination of documentation. 5 Note: In the RF, based on the Order of the Ministry of Industry and Trade dated February 03, 2015 No. 164 [20], the approved type of the CRM gets the status of the State Reference Material (SRM/GSO), is issued the “RM type approval Certificate,” the relevant information is included in the State Register of Approved Types of Reference Materials of the Federal Information Fund of Measurement Uniformity Assurance.
A Comparative Analysis of OIML Documents and Russian Rules …
471
are established by the authority that approves the CRM type. The validity of the type approval certificate may be limited with the possibility to extend. The extending is possible provided that during the validation period no new requirements to use the CRM in accordance with its purpose have been established (such restrictions may be the changes in the rules for calibration of measuring instruments or in the regulatory documents on test and control methods determining the use of the CRM). The use of CRMs may be metrologically controlled by the relevant authorized metrological bodies by means of periodic verification or certification. The subsequent batches of CRMs of approved type, which, in particular, are not subject to periodic inspection, may be metrology controlled through licensing, which usually includes periodic monitoring by the producer of CRM compliance with the technical documentation when producing new batches. When developing regulatory documents of the national legal metrology service, it is important to take into account the recommendations of ISO Guide 33:2015 [21] to establish administrative (legal) requirements and the recommendations of ISO Guide 30:2015, ISO Guide 31:2015, and ISO Guide 35:2015 [22–24], for metrological and technical requirements. It should be noted that all these Guides are translated into Russian and approved for the use in the Russian Federation [25–27]. In addition, the National Service of Legal Metrology should clearly define the conditions (the same or different) applicable to imported CRMs, as well as for their admission to use in the fields covered by the state metrological control and supervision.6 Thus, the conditions for admission to the use of domestic and imported CRMs in the fields covered by the state metrological control and supervision are clearly established in the Russian Federation. As might be expected, it is impossible to be limited only to the metrological control of CRMs used in the field of the state metrological control and supervision. Along with the metrological control described above, it is necessary to provide for the metrological supervision of compliance with the legislation requirements for the production and use of CRMs, which is entrusted to the metrological supervision bodies of the National Service of Legal Metrology. The content and procedure of the metrological supervision shall be specified in the relevant national regulatory document. Here, it is recommended to take into account the provisions of the International Document OIML D 97 [29].
6
Note: In the RF, on the basis of the Federal Law dated June 26, 2008 No. 102-FZ [9], in the field covered by the state technical regulation, regardless of the RM producing country, only approved type reference materials are allowed to be used. 7 Note: In the RF, the content and procedure for the metrological control/supervision is established in the Decree of the Government of the Russian Federation dated June 29, 2021 No. 1053 [28]. It should also be noted that the full information on legal documents, including related to use of RMs in the Russian Federation, may be find on the official website of the Federal Information Fund for Measurement Uniformity Assurance.
472
N. G. Oganyan and V. I. Dobrovolskiy
According to the document OIML D1 [30], us a rule, when detecting violations of the rules and misfits during the control of the market and production process by the metrological supervision, to take coercive action, fixed at the legislative level.8 In order to confirm the reliability of the obtained results, national legal metrology services, together with CRM manufacturers, are recommended to organize and/ or participate in international comparisons of CRMs used in areas covered by the scope of the state metrological control and supervision. National Services of Legal Metrology in the respective countries are encouraged to sign agreements on the mutual recognition of CRM type approval certificates for removing technical barriers. For example, the list of CRMs used in the field covered by the state metrological control and supervision, may include the corresponding CRMs from the database of the International Bureau of Weights and Measures (BIPM), in accordance with the Agreement CIPM MRA [31] on the mutual recognition of standards and calibration certificates, signed by national metrological institutes.9
Conclusion Thus, as shown by the conducted comparative analysis, the Russian legal framework regarding the use of reference materials in the fields covered by the state technical regulation was developed and approved in accordance with the OIML documents. Nevertheless, some issues remain to be finalized. 1. No clear procedure is available for rules and regulations on the confirmation of the CRM producer competence. The absence of the “RM competent producer” status leads to the absence of such an important RM term in the country as a CRM. That is, the producer is not authorized to issue the legitimate RM Certificate to assign to the RM the status of the CRM. At the bottom of this, an additional stage of testing for the purpose of the type approval by an authorized body arises. In fact, if the decision about type approval is positive, the RM is given the status of a GSO (State Reference Material), bypassing the status of a CRM, and entered in the Register of Approved Types of Reference Materials. This approach complicates and greatly increases the duration of RM type approval procedure for their admission to the scope of the state technical regulation. The development of rules and regulations on the confirmation of the RM producer competence will let the level of RM production and simplify the RM type approval procedure to raise in a couple of years. 8
Note: In the RF, the coercive actions have not been developed and are not laid legally in relation to violations and inconsistencies of the CRM with the data specified in the Type Approval Certificate. 9 Note: The Russian Federation regularly participates and conducts such international comparisons within the framework of the Agreements between the Interstate Council on Standardization, Metrology and Certification (ISC) of the Commonwealth of Independent States (CIS) and the Euro-Asian Cooperation of State Metrological Institutions regional metrological organization (COOMET). It should be noted that this area is in a constant process of development and improvement.
A Comparative Analysis of OIML Documents and Russian Rules …
473
2. Moreover, no coercive actions are applied to producers and suppliers of CRMs, established at the legislative level. It is suggested that, in the case of detecting a significant non-compliance of CCO/GSO with the established requirements, which is caused by the systematic negligence of the CRM producer/supplier, an extreme coercive action be applied as leverages on the CRM producer/suppliers. In addition, the “GSO” status should be disqualified and the CRM producer and/or supplier should receive the status of “unfair” or “incompetent”, with the inclusion of this information in the relevant state information database (for example, add a special column in the register of GSO approved types).
Conflict of Interest The article was prepared on the basis of a report presented at the V International Scientific Conference “Reference Materials in Measurement and Technology” (Yekaterinburg, September 13–16, 2022). The article was admitted for publication after the abstract was revised, the article was formalized, and the review procedure was carried out. The version in the Russian language is published in the journal “Measurement Standards. Reference Materials” 2023;19(4):151–159. (In Russ.). https://doi.org/10.20915/2077-1177-2023-19-4151-159.
References 1. JCGM 106:2012. Evaluation of measurement data—the role of measurement uncertainty in conformity assessment. Available via BIPM. https://www.bipm.org/documents/20126/207 1204/JCGM_106_2012_E.pdf/fe9537d2-e7d7-e146-5abb-2649c3450b25. Accessed 4 Aug 2022 2. Oganyan NG (2019) Measurement uncertainty and corresponding risk of false decisions. J Phys: Conf Ser 1420:012003. https://doi.org/10.1088/1742-6596/1420/1/012003 3. Kuselman I, Pennecchi FR, da Silva RJNB, Hibbert DB (2019) How many shades of grey are in conformity assessment due to measurement uncertainty? J Phys: Conf Ser 1420:012001. https://doi.org/10.1088/1742-6596/1420/1/012001 4. Oganyan NG (2021) Metrological traceability in the ILAC system. Prod Qual Control 11:15–18 (in Russian) 5. Barwick V (ed) (2016) Guide to quality in analytical chemistry an aid to accreditation. Available via EURACHEM. https://www.eurachem.org/images/stories/Guides/pdf/Eurachem_CITAC_ QAC_2016_EN.pdf. Accessed 4 Aug 2022 6. JCGM 200:2012 International vocabulary of metrology—Basic and general concepts and associated terms (VIM), 3rd edn. Available via BIPM. https://www.bipm.org/documents/20126/207 1204/JCGM_200_2012.pdf/f0e1ad45-d337-bbeb-53a6-15fe649d0ff1. Accessed 4 Aug 2022 7. ISO/IEC Guide 99:2007 International vocabulary of metrology—Basic and general concepts and associated terms (VIM). Available via ISO. https://www.iso.org/standard/45324.html. Accessed 4 Aug 2022 8. RMG 29-2013 (2014) State system for ensuring the uniformity of measurements. Metrology. Basic terms and definitions. Standartinform, Moscow, 83 p (in Russian) 9. ISO/IEC 17025:2017 (2017) General requirements for the competence of testing and calibration laboratories. Available via ISO. https://www.iso.org/ru/standard/66912.html. Accessed 4 Aug 2022 10. GOST ISO/IEC 17025-2019 (2021) General requirements for the competence of testing and calibration laboratories. Standartinform, Moscow, 28 p (in Russian)
474
N. G. Oganyan and V. I. Dobrovolskiy
11. Federal Law “On ensuring the uniformity of measurements” No. FZ-102 of 26.06.2008. Available via Official Internet portal of legal information. http://pravo.gov.ru/proxy/ips/?docbody=& firstDoc=1&lastDoc=1&nd=102122832. Accessed 8 Aug 2022 (in Russian) 12. ISO 17034:2016 General requirements for the competence of reference material producers. Available via ISO. https://www.iso.org/ru/standard/29357.html. Accessed 8 Aug 2022 13. GOST R ISO 17034-2021 (2021) General requirements for the competence of reference material producers. Standartinform, Moscow, 28 p (in Russian) 14. OIML D18 (2008) The use of certified reference materials in fields covered by metrological control exercised by national services of legal metrology. Basic principles. Available via OIML. https://www.oiml.org/en/files/pdf_d/d018-e08.pdf. Accessed 8 Aug 2022 15. Decree of the Government of the Russian Federation “On approval of the list of measurements related to the scope of state regulation of ensuring the uniformity of measurements” dated 16 November 2020 № 1847. Available via Official Internet portal of legal information. http://pub lication.pravo.gov.ru/document/0001202011230047. Accessed 8 Aug 2022 (in Russian) 16. OIML D12 (1986) Fields of use of measuring instruments subject to verification. Available via https://www.oiml.org/en/files/pdf_d/d012-e86.pdf. Accessed 8 Aug 2022 17. OIML D3 (1979) Legal qualification of measuring instruments. Available via OIML. https:// www.oiml.org/en/files/pdf_d/d003-e79.pdf. Accessed 8 Aug 2022 18. OIML D5 (1982) Principles for the establishment of hierarchy schemes for measuring instrument. Available via OIML. https://www.oiml.org/en/files/pdf_d/d005-e82.pdf. Accessed 8 Aug 2022 19. Order of the Ministry of Industry and Trade of the Russian Federation “On approval of the procedure for testing standard samples or measuring instruments for the purpose of type approval, the procedure for approving the type of standard samples or the type of measuring instruments, making changes to information about them, the procedure for issuing certificates of approval of the type of standard samples or type of measuring instruments, forms of certificates of approval of the type of reference materials or type of measuring instruments, requirements for approval marks of the type of reference materials or type of measuring instruments and the procedure for their application” of 28 August 2020 № 2905. Available via Official Internet portal of legal information. http://publication.pravo.gov.ru/document/0001202011230062. Accessed 8 Aug 2022 (in Russian) 20. Order of the Ministry of Industry and Trade of the Russian Federation “On approval of the form of certificates of approval of the type of standard samples or the type of measuring instruments” dated February 03 2015 №. 164. Available via Official Internet portal of legal information. http://publication.pravo.gov.ru/document/0001201504210020. Accessed 8 Aug 2022 (in Russian) 21. ISO Guide 33:2015 Reference materials—Good practice in using reference materials. Available via ISO. https://www.iso.org/standard/46212.html. Accessed 8 Aug 2022 22. ISO Guide 30:2015 Reference materials—Selected terms and definitions. Available via ISO. https://www.iso.org/standard/46209.html. Accessed 8 Aug 2022 23. ISO Guide 31:2015 Reference materials—Contents of certificates, labels and accompanying documentation. Available via ISO. https://www.iso.org/standard/52468.html. Accessed 8 Aug 2022 24. ISO Guide 35:2015 Reference materials—Guidance for characterization and assessment of homogeneity and stability. Available via ISO. https://www.iso.org/standard/60281.html. Accessed 8 Aug 2022 25. GOST ISO Guide 30-2019 (2019) Reference materials. Selected terms and definitions. Standartinform, Moscow, 10 p (in Russian) 26. GOST ISO Guide 31-2019 (2019) Reference materials. Contents of certificates, labels and accompanying documentation. Standartinform, Moscow, 10 p (in Russian) 27. GOST ISO Guide 35-2015 (2015) Reference materials. General and statistical principles for certification. Standartinform, Moscow, 10 p (in Russian)
A Comparative Analysis of OIML Documents and Russian Rules …
475
28. Decree of the Government of the Russian Federation “On approval of the Regulations on federal state metrological control (supervision) and on the invalidation of certain acts of the Government of the Russian Federation” dated 29 June 2021 №. 1053. Available via Official Internet portal of legal information. http://publication.pravo.gov.ru/document/000120210701 0093. Accessed 8 Aug 2022 (in Russian) 29. OIML D9 (2004) Principles of metrological supervision. Available via OIML. https://www. oiml.org/en/files/pdf_d/d009-e04.pdf. Accessed 8 Aug 2022 30. OIML D1 (2004) Elements for a law on metrology. Available via OIML. https://www.oiml. org/en/files/pdf_d/d001-e04.pdf. Accessed 8 Aug 2022 31. CIPM Mutual Recognition Arrangement (CIPM MRA). Available via BIPM. https://www. bipm.org/en/cipm-mra. Accessed 8 Aug 2022