Phase Transitions in Foods 9780125953405, 0-12-595340-2
Assembling recent research and theories, this book describes the phase and state transitions that affect technological p
257 16 17MB
English Pages 375 Year 1995
Front Cover......Page 1
Phase Transitions in Foods......Page 4
Copyright Page......Page 5
Contents......Page 8
Preface......Page 12
I. Introduction......Page 14
II. Thermodynamics......Page 15
III. Characterization of Phase Transitions......Page 22
References......Page 31
I. Introduction......Page 32
II. Crystallization and Melting......Page 33
III. The Physical State of Amorphous Materials......Page 39
IV. Molecular Mobility and Plasticization......Page 47
References......Page 60
I. Introduction......Page 62
II. Determination of the Physical State......Page 63
III. Physical Properties and Transition Temperatures......Page 73
References......Page 82
I. Introduction......Page 86
II. Properties of Water......Page 87
III. Water in Foods......Page 99
References......Page 116
I. Introduction......Page 122
II. Carbohydrates......Page 123
III. Proteins......Page 146
IV. Lipids......Page 155
References......Page 162
I. Introduction......Page 170
II. Prediction of Water Plasticization......Page 171
III. Mechanical Properties and Flow......Page 183
References......Page 201
I. Introduction......Page 206
II. Time-Dependent Properties of the Physical State......Page 207
III. Collapse Phenomena......Page 215
IV. Crystallization and Recrystallization......Page 223
References......Page 253
I. Introduction......Page 260
II. Stiffness......Page 261
III. Mechanical Properties and Crystallinity......Page 275
References......Page 280
I. Introduction......Page 284
II. Principles of Reaction Kinetics......Page 285
III. Kinetics in Amorphous Foods......Page 296
References......Page 321
I. Introduction......Page 326
II. Food Processing......Page 327
III. Food Formulation and Storage......Page 346
References......Page 358
Index......Page 362
Food Science and Technology......Page 374
Recommend Papers


![Phase transitions and collective phenomena [lecture notes ed.]](https://ebin.pub/img/200x200/phase-transitions-and-collective-phenomena-lecture-notesnbsped.jpg)

![Gibbs Measures and Phase Transitions [2nd ext. ed.]
9783110250329, 9783110250299](https://ebin.pub/img/200x200/gibbs-measures-and-phase-transitions-2nd-ext-ed-9783110250329-9783110250299.jpg)
![Phase Transitions and Self-Organization in Electronic and Molecular Networks [1 ed.]
030646568X, 9780306465680, 9780306471131](https://ebin.pub/img/200x200/phase-transitions-and-self-organization-in-electronic-and-molecular-networks-1nbsped-030646568x-9780306465680-9780306471131.jpg)
![Elements of Phase Transitions and Critical Phenomena (Oxford Graduate Texts) [1 ed.]
0199577226, 9780199577224](https://ebin.pub/img/200x200/elements-of-phase-transitions-and-critical-phenomena-oxford-graduate-texts-1nbsped-0199577226-9780199577224.jpg)

![Lectures on Phase Transitions and the Renormalization Group [1 ed.]
0367091372, 9780367091378](https://ebin.pub/img/200x200/lectures-on-phase-transitions-and-the-renormalization-group-1nbsped-0367091372-9780367091378.jpg)
File loading please wait...
Citation preview
PHASE TRANSITIONS IN FOODS
zyxw zyxwv
FOOD SCIENCE AND TECHNOLOGY International Series SERIES EDITOR Steve L. Taylor
University of Nebraska ADVISORY BOARD Daryl B. Lund
zyxwv
Rutgers, The State University of New Jersey Douglas Archer
Susan K. Harlander
FDA, Washington, D. C.
Land O'Lakes, Inc.
Jesse E Gregory, III
Barbara O. Schneeman
University of Florida
University of California, Davis
A complete list of the books in this series appears at the end of the volume.
PHASE TRANSITIONS IN FOODS Yrj6 H. Roos University of Helsinki Faculty of agriculture and Forestry
zy
Department of Food Chemistry and Technology Helsinki, Finland
ACADEMIC PRESS
zyxwv
San Diego New York Boston
London Sydney Tokyo Toronto
This book is printed on acid-free paper. ( ~
Copyright 9 1995 by ACADEMIC PRESS, INC. All Rights Reserved. No part of this publication may be reproduced or transmitted in any form or by any means, electronic or mechanical, including photocopy, recording, or any information storage and retrieval system, without permission in writing from the publisher. Academic Press, Inc. A Division of Harcourt Brace & Company 525 B Street, Suite 1900, San Diego, California 92101-4495
United Kingdom Edition published by
zyxw
Academic Press Limited 24-28 Oval Road, London NW1 7DX Library of Congress Cataloging-in-Publication Data Roos, Yrjo. Phase transitions in foods / by Yrjo Roos. p. cm. -- (Food science and technology international series) Includes bibliographical references and index. ISBN 0-12-595340-2 (acid-free) 1. Food--Composition. 2. Phase transformations (Statistical physics) I. Title. II. Series. TP372.5.R66 1995 664--dc20 95-5987 CIP PRINTED IN THE UNrrED STATES OF AMERICA 95 96 97 98 99 00 MM 9 8 7 6
5
4
3
2
1
To my beloved wife, Sari and our son, Johan Henrik
This Page Intentionally Left Blank
Contents
Preface
zyxwvuts zyxwv xi
1. Introduction to Phase Transitions
I. Introduction 1 II. Thermodynamics 2 A. Basic Terminology 2 B, First Law of Thermodynamics 4 C. Second Law of Thermodynamics 6 III. Characterization of Phase Transitions 9 A. Phase Diagrams 9 B. Gibbs Energy of Phases 11 C. Classification of Phase Transitions 13 D. Effects of Composition on Transition Temperatures 17 References 18
vH
viii
Phase Transitions in Foods
2. Physical State and Molecular Mobility
zyxwv
I. Introduction 19 II. CrystaUizationand Melting 20 A. Nucleation and Crystal Growth 20 III. The Physical State of Amorphous Materials 26 A. Mechanical Properties 26 B. Characterization of the Physical State 29 C. Glass Transition Theories 31 IV. Molecular Mobility and Plasticization 34 A. Mechanical Properties 35 B. Plasticization and Molecular Weight 39 C. Crystallization of Amorphous Compounds References 47
42
3. Methodology I. Introduction 49 II. Determination of the Physical State 50 A. Crystallinity 50 B. Molecular Mobility 53 III. Physical Properties and Transition Temperatures A. Volumetric Changes 60 B. Changes in Enthalpy 63 C. Mechanical and Dielectric Properties 66 References 69
60
4. Water and Phase Transitions I. Introduction 73 II. Properties of Water 74 A. Phase Behavior of Water 74 B. Water in Solutions 77 III. Water in Foods 86 A. Sorption Behavior 87 B. Water Plasticization 91 C. Ice Formation and Freeze-Concentration 97 References 103
zyxwv Contents
5. Food Componentsand Polymers
I. Introduction 109 II. Carbohydrates 110 A. Sugars 110 B. Starch 119 III. Proteins 133 A. Denaturation 134 B. Glass Transition 137 IV. Lipids 142 A. Polymorphic Forms 142 B. Melting of Fats and Oils 145 References 149
6. Prediction of the Physical State I. Introduction 157 II. Prediction of Water Plasticization 158 A. Plasticization Models 159 B. Effects of Composition 165 III. Mechanical Properties and Flow 170 A. Viscosity of Amorphous Foods 171 B. Viscoelastic Properties 179 References 188
7. 77me.DependentPhenomena I. Introduction 193 II. Time-Dependent Properties of the Physical State 194 A. Glass Formation 194 B. Relaxation Phenomena in Amorphous Foods 198 III. Collapse Phenomena 202 A. Stickiness and Caking 202 B. Collapse 206 IV. Crystallization and Recrystallization 210 A. Crystallization of Amorphous Sugars 210 B. Ice Formation and Recrystallization 224 C. Retrogradation of Starch 235 References 240
Ix
x
Phase Transitions in Foods
8. Mechanical Properties
zyxwvu
I. Introduction 247 II. Stiffness 248 A. Modulus Curves of Food Materials 248 B. Stiffness and Food Properties 253 III. Mechanical Properties and Crystallinity 262 A. Food Lipids 262 B. Crystallinity in Amorphous Foods 264 References 267
9. Reaction Kinetics I. Introduction 271 II. Principles of Reaction Kinetics 272 A. Reaction Order 272 B. Temperature Dependence 276 III. Kinetics in Amorphous Foods 283 A. Low-Moisture Foods 284 B. Frozen Foods 302 References 308
10. Food Processingand Storage I. Introduction 313 II. Food Processing 314 A. Dehydration and Agglomeration 314 B. Melt Processing and Extrusion 330 III. Food Formulation and Storage 333 A. Prediction of Stability 333 B. Food Formulation 336 References 345
Index 349
Preface
Temperature, time, and water content have enormous effects on the physical state and quality of food and biological materials. These materials are often metastable and they undergo phase and state transitions in various processes and during storage. Kinetics of various changes is related to these transitions and therefore to molecular mobility. Understanding phase and state transitions and the relationships between molecular mobility and stability is often the basis of proper control of food processing and storage conditions. Temperature and water content are variables that govern rates of both desired and detrimental changes in quality. This book describes phase and state transitions of food and biological materials and discusses their dependence on temperature, time, and water content. It was recognized quite early that changes in the physical state of lactose in dried milk and freeze-concentrated ice cream solids were responsible for loss of quality. However, the tremendous effects of phase and state transitions on food properties and quality were not realized and widely accepted until 1980's. Harry Levine and Louise Slade have been the pioneers in describing foods as metastable systems and the role of water as the ubiquitous plasticizer of food solids. Especially, the glass transition temperature of
z
Phase Transitions in Foods
zyxwvuts
amorphous biological materials has been admitted to be one of the main attributes in controlling shelf life of low-moisture and frozen foods. In addition to the description of phase transitions, such as crystallization and melting, this book considers the effects of glass transition on the timedependent changes in state and quality of food and biological materials. This book is intended to those interested in physical chemistry of food, pharmaceutical, and other biological materials. There have been no other books of similar type that summerize literature on phase and state transitions and their effects on mechanical and physicochemical properties. This book gives an introduction to thermodynamics and definitions of phase and state transitions. The relationships between the physical state and molecular mobility are discussed as well as the common methodology is introduced. The importance of properties of water and especially water plasticization are given particular attention. Transitions, such as protein denaturation, starch gelatinization, and those of lipids, are discussed with numerical values for transition temperatures. The glass transition is given the main emphasis and the contents of the book stress predictions of changes in the physical state, timedependent phenomena, and mechanical properties. Definition of reaction kinetics is included and the effect of diffusional limitations on quality changes is given particular attention. The book also discusses the role of phase and state transitions in food processing and storage. I hope that my view on phase transitions in foods will be found useful by teachers and students of food engineering and technology courses. The book has succeeded if it is also found by professionals in academia and industry in the areas of biological, food, and pharmaceutical sciences to be a valuable source of information on phase and state transitions. Various people have contributed to the contents of this book through discussions and helping me to understand the complexity of biological systems. In particular, I appreciate the time taken by Jorge Chirife, Marcus Karel, Theodore P. Labuza, Harry Levine, and Micha Peleg for reading the manuscript. I also wish to express my gratitude for their valuable comments and suggestions that were extremely helpful in the final revision of the contents. The help of the graduate students of the course "Water in Foods, Drugs and Biological Systems," FScN 5555 at the University of Minnesota taught by Professor Theodore P. Labuza, is also appreciated. The time needed for writing this book was taken from my family. I wish to thank Sari for her warm understanding and support.
CHAPTER I
Introduction to Phase Transitions
I.
Introduction
zyxwvutsr zyxw
Phase transitions are changes in the physical state of materials, which have significant effects on their physical properties. Chemically pure compounds such as water or many organic and inorganic compounds in foods have exact phase transition temperatures. There are three basic physical states, which are the solid, the liquid, and the gaseous states. The term transition refers to the change in the physical state that is caused by a change in temperature or pressure. Heating of solid foods is often used to observe temperatures at which changes in thermal or physical properties, e.g., in heat capacity, viscosity, or textural characteristics, occur. Water is one of the most important compounds in nature and also in foods. It may exist in all of the three basic states during food processing, storage, and consumption. The effect of water on the phase behavior of food solids is of utmost importance in determining processability, stability, and quality. Well-known examples include transformation of liquid water into ice (freezing) or water into vapor (evaporation). These transitions in phase are
2
Phase Transitionsin Foods
zyxwvut
the main physical phenomena that govern food preservation by freezing and dehydration. Engineering and sensory characteristics of food materials are often defined by the complicated combination of the physical state of component compounds. The main constituents of food solids are carbohydrates, proteins, water, and fat. These materials may exist in the liquid state and the solid crystalline or amorphous noncrystalline state. Many of the component compounds, e.g., sugars, fats, and water, when they are chemically pure, crystallize below their equilibrium melting temperature. Stability is an important criterion in food preservation. Materials in thermodynamic equilibrium are stable, i.e., they exist in the physical state that is determined by the pressure and temperature of the surroundings. However, most biological materials are composed of a number of compounds and they often exist in a thermodynamically nonequilibrium, amorphous state. Such materials exhibit many time-dependent changes that are not typical of pure compounds and they may significantly affect the shelf life of foods. The physical state of food solids is often extremely sensitive to water content, temperature, and time. This chapter introduces the basic terminology of thermodynamics and phase transitions, and describes the common thermodynamic principles that govern the physical state of foods.
II.
Thermodynamics
Thermodynamics describes the physical state of materials in terms of basic state variables. Thermodynamics gives and defines the basis for description and understanding of the physical state at equilibrium and various transitions, which may occur due to changes in the quantities of the state variables that define the equilibrium. General principles of thermodynamics, which are reported here according to Alberty (1983), can be found in most textbooks of physical chemistry.
A. Basic Terminology
zyxw
Thermodynamics describes relationships between various systems that are in equilibrium, i.e., no changes in the physical state of the systems are observed as a function of time. Such systems are often pure compounds at a given temperature and pressure. Thermodynamics may also be used to characterize differences in physical properties between various equilibrium states and the
1. Introduction to Phase Transitions
3
driving forces towards equilibrium. Thus, a change in temperature or pressure may introduce a driving force for a system to approach another equilibrium state. Biological materials and foods are often metastable systems and they exhibit time-dependent changes as they approach equilibrium. Temperature changes that occur over a phase transition temperature result in a change of phase. The basic quantitative concepts of thermodynamics are temperature, internal energy, and heat. These concepts are used to describe the physical state of thermodynamic systems. Obviously, the most important parameter that has to be taken into account in the definition of the physical state of any food is temperature. Thermodynamic systems can be separated from their surroundings with boundaries. Boundaries may allow the occurrence of heat transfer between the system and its surroundings, e.g., a food product may gain heat from its surroundings. However, boundaries of an isolated system prevent all interactions of the system with its surroundings and there can be no transfer of energy or matter between the system and its surroundings. Foods are seldom isolated systems, although the principle can be applied when insulators are used to avoid rapid cooling of hot foods or warming of cold drinks. A system may also be open or closed. An open system may have transfer of both energy and matter with the surroundings. A closed system may only have transfer of energy with surroundings. In food processing food systems may be open systems, e.g., they can be heated by steam infusion, which includes transfer of matter and energy from the surroundings to the food. Foods may also be closed systems, which is true when they are hermetically sealed in containers. Systems that are uniform in all properties are called homogeneous and those containing more than one phase are heterogeneous. When systems are at equilibrium they exist in definite states and their properties have definite values. The equilibrium state is defined by state variables, which are pressure, temperature, and volume. Two state variables, i.e., pressure and temperature or temperature and volume, can be used to define the physical state of pure materials. Thermodynamic quantities that are proportional to the amount of material are extensive functions of state. Such quantities include total energy, volume, number of moles, and mass, which depend on the amount of material in the system. Properties which are independent of the amount of material, e.g., pressure and temperature, are called intensive functions of state. The ratio of two extensive functions of state is always an intensive function of state. Intensive properties are also obtained if extensive properties are divided by the amount of material. At a thermodynamic equilibrium extensive functions of state and the intensive functions of state of each phase are constant. The state variables define the physical state of food materials. Especially temperature can be used to control their stability. However, phase transitions
zy
zy
4
Phase Transitionsin Foods
zyxwvut
in foods are complicated and their exact thermodynamic characterization may be difficult due to the number of component compounds, coexisting phases, and metastability.
zyxwvut
B. First Law of Thermodynamics
The physical state of thermodynamic systems can be related to the state variables. According to the zeroth law of thermodynamics the temperature of two or more systems at thermal equilibrium is the same. Equation (1.1), which defines the well known relationships between pressure, p, temperature, T, and volume, V, is called the equation of state. According to the gas law, which is based on the equation of state, the product, p V, of ideal gases follows the same function. Therefore, a change in p, T, or V results in a change of one or both of the other variables. The gas law, which is given in equation (1.2), where n is the number of moles, defines the gas constant, R. At the temperature of absolute zero (0 K, -273.16~ molecular mobility ceases and also the pressure approaches 0 Pa.
T =f(p,V)
(1.1)
pV = nRT
(1.2)
A process that occurs in a system that is thermally isolated from the surroundings, i.e., there is no heat exchange between the system and the environment, is called an adiabatic process. Such systems have a given amount of internal energy, U. A change in the state of the system requires work, W, on the environment that is equal to the change in the amount of internal energy, AU. The internal energy of a system may also be altered by heat exchange between the system and the environment. If no work on the environment is done AU is equal to the quantity of heat, q, exchanged. A change in the internal energy can be calculated with equation (1.3), which defines that heat absorbed by a system either increases the amount of internal energy or is used to do work on the environment. AU = q + W
(1.3)
The definition of internal energy can be used to derive the first law of thermodynamics. The first law of thermodynamics states that a thermodynamic system has a property of internal energy. The internal energy is a func-
1. Introduction to Phase Transitions
5
zyxwvuts
tion of state variables that can be changed due to energy exchange between the system and its surroundings. 1. Enthalpy
zy
Enthalpy, or heat content, is a thermodynamic quantity that is defined by the sum of internal energy and pressure-volume work which has been done on the system. It is obvious that most common processes occur at the atmospheric pressure and therefore also at a constant pressure. The pressurevolume work is defined by equation (1.4). Equation (1.4) states that the heat absorbed by a system becomes a function of state. The amount of heat absorbed at a constant pressure can then be obtained from equation (1.5), where the subscripts 1 and 2 refer to the initial and the final state, respectively. Equation (1.5) suggests that at a constant pressure a change in temperature involves the amount of heat that is defined by the difference in the sums of internal energy and pressure-volume work. W = -pAV
(1.4)
q = (U2 + p V 2) - (U 1 + p V 1)
(1.5)
Enthalpy, H, which is defined by equation (1.6), is also a function of state. The difference in enthalpy, AH, between two states that are referred to with the subscripts 1 and 2 is given by equation (1.7). It can be shown that the change in enthalpy at a constant pressure is equal to the change in the amount of heat, q, between the two states. H = U + pV
(1.6)
q = it/4 = H 2 - H 1
(1.7)
The heat absorbed or released in chemical reactions or due to phase transitions is studied in thermochemistry. A negative value for q shows that a process is exothermic and the system releases heat to the surroundings. In endothermic changes heat must flow from the surroundings to the system and q has a positive value. 2. Heat capacity The internal energy of a system with a constant mass is a function of pressure, temperature, and volume. If the volume of the system is constant, there
6
Phase Transitionsin Foods
zyxwvut zyx
is no pressure-volume work and a change in temperature results in a change in the amount of internal heat. The heat capacity at a constant volume, Cv, is defined by equation (1.8). Equation (1.8) shows that heat capacity at a constant volume is a measure of the change in the intemal heat that is caused by the change in temperature. Cv =
dU dT
(1.8)
Heat capacity is often determined at a constant pressure. At a constant pressure a change in temperature results also in a change in volume. The change in enthalpy involves the change in both internal energy and pressurevolume work. If the pressure of the system is constant, a change in temperature results in a change in enthalpy that is equal to the heat exchange between the system and its surroundings. Therefore, the heat capacity at a constant pressure is defined by equation (1.9). It should be noticed that the heat capacities at constant pressure and constant volume are not the same, but Cp > Cv since the change in enthalpy includes both the change in internal energy and the energy change due to pressure-volume work.
Cp =
dH dT
(1.9)
It has been found that the molar Cp and its enlargement with raising temperature often increases with increasing molecular complexity. However, the heat capacity in most foods is due to water. Most changes in state occur at a constant pressure and calorimetric experiments may be conducted to obtain changes in enthalpy as a function of temperature. The results can be used for the determination of Cp, which is an important property in food processing and engineering.
C. Second Law of Thermodynamics
Most natural processes are spontaneous and they occur to the direction of an equilibrium. The second law of thermodynamics provides criteria for predicting the probability of thermodynamic processes. It can be used to evaluate whether changes in the physical state occur spontaneously. The second law of thermodynamics includes basis for understanding spontaneous changes such as the well known fact that no heat is transferred from a colder system to a wanner system without the occurrence of other simultaneous changes in the
1. Introduction to Phase Transitions
7
zy
two systems or in the environment. It may also be shown that spontaneous changes involve changes in energy and the directions of the changes are defined by the second law of thermodynamics.
zyxw
1. Entropy
It is obvious that the total amount of energy within an isolated system is constant, but it may become unavailable in irreversible processes. The amount of unavailable energy within a system is known as entropy, S. Entropy is a function of state that is defined by equation (1.10). d S = dq
(1.10)
T Irreversible processes in isolated systems are spontaneous and they produce entropy. Energy in reversible processes of isolated systems cannot become unavailable and therefore the entropy within the system remains constant. All natural processes are irreversible and the entropy of natural systems increases as they are changed towards equilibrium. In various reversible processes such as first-order phase transitions, e.g., in melting and evaporation, the pressure of the system is constant. Since a first-order transition at a constant pressure includes no pressure-volume work and it occurs at a constant temperature, the latent heat of the transition is equal to the change in enthalpy. Therefore, the change in entropy, AS, can be related to enthalpy according to equation (1.11). AS =
AH
T
(1.11)
d U = TdS - p d V
(1.12)
dS = -V, d T T
(1.13)
C dS =
p dT T
(1.14)
Combination of the first and second laws of thermodynamics can be used to establish relationships between entropy, internal energy, pressure, temperature, and volume. The relationships as shown by equation (1.12) suggest that entropy is a function of internal energy and volume. Equation
8
Phase Transitionsin Foods
zyxwvut
(1.12) is an important thermodynamic equation that may be used to calculate entropy for various processes. It may be shown that an increase in temperature increases entropy. Equations (1.13) and (1.14) can be used to calculate changes in entropy that occur as a function of temperature at a constant volume or at a constant pressure, respectively. In addition to the zeroth, first, and second laws of thermodynamics the physical state of materials at absolute zero can be related to the state variables by definition of the third law of thermodynamics. The third law of thermodynamics is given by the statement that the entropy of each pure element or substance in a perfect crystalline form is zero at absolute zero (0 K). It is important to notice that the entropy of an amorphous solid or a supercooled liquid, or almost any food, may be considered to be higher than zero at absolute zero.
zyxwvut
2. Helmholtz free energy According to the second law of thermodynamics changes in an isolated system are spontaneous if dS > 0, and the system is in equilibrium if dS = O. The Helmholtz free energy, A, is a state function that defines the direction of changes in a closed system at a constant temperature and a constant volume. The Helmholtz free energy is defined by equation (1.15), which shows that the Helmholtz free energy is an extensive function of state that is defined by entropy, internal energy, and temperature. A =U-TS
(1.15)
The Helmholtz free energy of a closed system at a constant temperature and a constant volume can be shown to decrease for changes that occur spontaneously. Therefore, changes in closed systems may occur spontaneously if dA < 0, the systems are in equilibrium or the changes are reversible if dA = 0, and the changes are forced if dA > O. 3. Gibbs energy Gibbs energy, G, is analogous to the Helmholtz free energy for changes that occur in closed systems at a constant temperature and a constant pressure. Most changes in foods occur at the atmospheric pressure and therefore at a constant pressure. The Gibbs energy can be used to show whether changes occur spontaneously or if they are forced. The Gibbs energy is an extensive function of state that is defined by equation (1.16). Equation (1.16) shows that Gibbs energy is defined by entropy, internal energy, pressure-volume
1. Introduction to Phase Transitions
9
zyxw
work, and temperature. Since enthalpy at a constant pressure is equal to the sum of internal energy and pressure-volume work, the definition of Gibbs energy is also given by equation (1.17), which defines Gibbs energy to be a function of enthalpy, entropy, and temperature. G =U+pV-TS
(1.16)
(1.17)
G = H - TS
The Gibbs energy of a closed system at a constant temperature and a constant pressure can be shown to decrease for changes that occur spontaneously. Therefore, changes in closed systems are spontaneous if d G < O, the systems are in equilibrium or the changes are reversible if dG = 0, and the changes are forced if dG > O.
III.
Characterization
zy
of Phase Transitions
Phase transitions in foods are often a result of changes in composition or temperature during processing or storage. Knowledge of transition temperatures and of the thermodynamic quantities is particularly important in understanding such processes as evaporation, dehydration, and freezing. These processes are governed by the transition of water into the gaseous or crystalline state. Foods are complex materials that contain at least one component compound and water. The dependence of the physical state of various materials as a function of temperature can be characterized with phase diagrams. Changes that are observed at the transition temperatures can be used for the description of the effect of the transition on physical properties.
A. Phase Diagrams
A phase can be defined to be a physically and chemically homogenous state of a material that is clearly separated from other matter. A phase transition can be observed from a change in internal energy, U, volume,V, number of moles, n, or mass. The change in phase is a result of a change in temperature or pressure. An equilibrium, e.g., between ice and water, requires that the two phases have the same temperature and pressure. Also the chemical
10
Phase Transitionsin Foods
zyxwvuts Or)
E "13 tl) (') ..,,..
!11
u.I
I
o OO
I , ~
-o
I
Critical ~ / pressure Boiling temperature
I I
Liquid
I
Triple point
TEMPERATURE
I
I
~
--,. ~
c-
zyxw
I/
Critical temperature
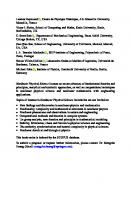
Figure 1.1 A schematic phase diagram showing the equilibrium curves between various physical states and their dependence on pressure and temperature.
potential, ~t, and Gibbs energy, G, of the material are the same in both phases. The basic three physical states of chemically pure substances are solid, liquid, and gaseous states. These states are equilibrium states and the change of one state to another state occurs at exact temperature and pressure conditions that are specific to each material. The relationships between the physical state, pressure, temperature, and volume can be shown in three-dimensional phase diagrams. Such diagrams show surfaces that indicate values for the state variables at equilibrium conditions. It can be shown that at most equilibrium situations two phases may coexist. The possible combinations of coexisting phases are solid and liquid, solid and gas, and liquid and gas. All three phases may coexist only at the triple point, which has exact temperature and pressure conditions that are specific for each material. Two-dimensional projections of the three-dimensional phase diagrams are often more useful in practical applications. As
1. Introduction to Phase Transitions
11
zy
shown in Figure 1.1 the two-dimensional phase diagrams show equilibrium lines for pressure and temperature for each phase. One of the most important of such two-dimensional phase diagrams for foods is that of water. Molecular organization of the liquid and gaseous phases are similar, but different from that of the highly ordered crystalline solid phase. The equilibrium curve between the liquid and gaseous states ends at the critical state. At the critical point the temperature and pressure of both phases become equal and the two phases can no longer be separated. Thus, the critical temperature is the highest temperature at which the liquid state may exist. The pressure at the critical point is called critical pressure and the corresponding volume is the critical volume. The critical conditions of carbon dioxide are important in supercritical extraction, which is often applied as a food processing method.
zyxw
B. Gibbs Energy of Phases
An equilibrium between various phases exists only when no driving force is present for the molecules to change phase. The driving force for a phase transition is the chemical potential, Ft, and the conditions that allow equilibrium can be defined by chemical potential, pressure, and temperature. It may be shown that at equilibrium the chemical potential is equal for all phases. However, if the chemical potentials between various phases differ a spontaneous change in the direction from high to low potential occurs. The stable phase is that with the lowest chemical potential. In a one-component system the molar Gibbs energy is equal to chemical potential. At equilibrium two or three phases of a single component may have the same molar Gibbs energy. Therefore, phases coexist at melting temperature, Tm, boiling temperature, Tb, and triple point. A schematic representation of the Gibbs energy of various phases as a function of temperature at a constant pressure is shown in Figure 1.2. Below Tm the solid phase has the lowest Gibbs energy, between Tm and Tb the lowest Gibbs energy is in the liquid phase, and above Tb the gaseous phase has the lowest Gibbs energy. It may be shown that the slopes of the lines are defined by equation (1.18).
3G) _ -S
zy
(1.18)
The slopes of the lines in Figure 1.2 are negative, since the entropies of each phase are positive, and follow the order Sg > Sl > Ss, where the subscripts g, l, and s refer to the gaseous, liquid, and solid states, respectively.
12
Phase Transitionsin Foods
z
m
T.
I I=
T,
TEMPERATURE
zyxwv I=~as
zyx
Figure 1.2 A schematic representation of Gibbs energy of phases for a pure compound as a function of temperature at a constant pressure. The Gibbs energy decreases with increasing temperature and is the same for two phases at the intercept of the lines, i.e., the Gibbs energy is the same for the solid and liquid states at the melting temperature, Tin, and for the liquid and gaseous states at the boiling temperature, Tb. At various temperatures the stable phase has the lowest Gibbs energy. An increase in pressure from Pl to P2 increases Gibbs energy and also Tm and Tb.
Therefore, the slopes of the lines differ and the decrease of Gibbs energy is steepest for the gaseous phase. At the intercepts of the lines the Gibbs energies are equal and the two phases may coexist. Between the intercepts the most stable phase has the lowest Gibbs energy. An increase in pressure increases Gibbs energy. The effect of pressure on the Gibbs energy at a constant temperature is defined by equation (1.19).
(1.19) T The volume in the gaseous state is significantly larger than the volume in the liquid or solid state. Therefore, as shown in Figure 1.2 an increase in pressure increases the boiling temperature and often also the melting temperature. However, pressure has a much larger effect on the boiling temperature than on the melting temperature due to the higher molar volume of the
1. Introduction to Phase Transitions
13
gaseous state. The effect of pressure on the boiling temperature is applied in several food processes, e.g., in dehydration, evaporation, and sterilization.
C. Classification of Phase Transitions
Classification of phase transitions is important in establishing criteria for defining general principles that govern various effects of phase transitions on material properties that are changed at the transition temperatures. Gibbs energy or chemical potential can be used in the classification of phase transitions. Such classification of phase transitions into first-order, second-order, and higher-order transitions was made by Ehrenfest (1933). The classification reported by Ehrenfest (1933) is based on observed discontinuities that occur in the state functions at the transition temperatures. 1. First-order transitions The classification of phase transitions is often based on changes in chemical potential or Gibbs energy (Wunderlich, 1981). At equilibrium the chemical potentials of two phases are equal. However, as was shown in Figure 1.2 a change in chemical potential or Gibbs energy at a transition temperature shifts the equilibrium state to that with the lower chemical potential and Gibbs energy. According to the classification of phase transitions by Ehrenfest (1933) the first derivative of chemical potential and Gibbs energy that were defined by equations (1.18) and (1.19) show discontinuity at the first-order transition temperature. Most phase transitions occur at a constant pressure. Equation (1.17) defined relationships between enthalpy, entropy, Gibbs energy, and temperature at a constant pressure. It is obvious that two phases with the same Gibbs energy at the same temperature, e.g., a solid and a liquid or a liquid and a gaseous phase, have different enthalpies and therefore different entropies. Moreover, it can be shown that if the two phases have different enthalpies, they also have different volumes. Therefore, changes in enthalpy, entropy, and volume are typical of first-order phase transitions. The common techniques used in the determination of phase transition temperatures such as calorimetry and dilatometry are based on the determination of the change in enthalpy or volume, respectively. Since Gibbs energy for the two phases at a first-order transition temperature is the same for both phases, the first derivative of Gibbs energy shows discontinuity at the transition temperature. Therefore, the quantities of H, S, and V show a step change at the transition
zy
14
Phase Transitionsin Foods
W _J
o > rr
o >.
zyxwvut
zyxwvutsrq Cp or Cv
J
ft.
OJ
z
U.I
H,S, o r V z~H
zyxwv
First-order transition
J temperature
1,..__ v
TEMPERATURE
Figure 1.3 Changes in thermodynamic quantities at a first-order phase transition. Gibbs energy, G, is the same for both phases at the transition temperature. Enthalpy, H, entropy, S, and volume, V, show a step change at the transition temperature. The heat capacity, Cp or Cv, has an infinite value at a first-order phase transition temperature.
temperature as shown in Figure 1.3. The heat capacity is obtained from the second derivative of the Gibbs energy and it has an infinite value at a firstorder transition temperature. Phase transitions that occur between the three basic physical states, i.e., between the solid, liquid, and gaseous states, are first-order transitions. These transitions include melting and crystallization, which occur between the solid and liquid states. Vaporization and condensation, which are transitions between the liquid and gaseous states, and sublimation and ablimation, which are phase changes between the solid and gaseous states without the presence of the liquid state, are also first-order transitions. 2. Second-order and higher-order transitions Second-order phase transitions according to the classification of Ehrenfest (1933) are those for which the second derivative of the chemical potential or Gibbs energy shows a discontinuous change at the transition temperature. At the second-order transition the thermodynamic quantities of enthalpy,
1. Introductionto Phase Transitions
15
L
G "7 i.iJ ._1
o>
n: 0 >.. r tr" i.IJ z
Cp
la.I
\
ACp Second-order transition
f
temperature
zyx
TEMPERATURE
zyx
Figure 1.4 Changes in thermodynamic quantities at a second-order phase transition. Enthalpy, H, entropy, S, Gibbs energy, G, and volume, V, of the two phases are the same at the transition temperature. The second derivatives of the Gibbs energy are discontinuous at the transition temperature, and therefore a step change is observed in heat capacity, Cp.
entropy, and volume of the two phases are the same at the transition temperature. Therefore, a second-order transition has no latent heat of the phase change, but there is a discontinuity in the heat capacity. The heat capacity is different in the two phases, but does not become infinite at the transition temperature, which occurs at the first-order transition temperature. The effects of a second-order transition on enthalpy, entropy, Gibbs energy, heat capacity, and volume are shown in Figure 1.4. The second derivatives of Gibbs energy are defined by equations (1.20), (1.21), and (1.22), where a is the thermal expansion coefficient and fl is compressibility.
a2G) -Cp 0'/'2
=
T
zy
(1.20)
Equation (1.20) suggests that at a constant pressure a second-order transition results in a discontinuity in heat capacity. Equations (1.21) and (1.22) show that there is a discontinuity in the thermal expansion coefficient and isothermal compressibility at a second-order phase transition. Therefore, ex-
16
Phase Transitionsin Foods
zyxwvu
zy
perimentally determined changes in heat capacity and thermal expansion can be used in locating second-order transition temperatures. 2G/=
(7 ) a20~
(1.21)
-v/3
(1.22)
Third-order and higher-order transitions are those for which the third or higher derivatives of the chemical potential or Gibbs energy become discontinuous at the transition temperature. At a third-order transition temperature both phases have the same heat capacity, but the change in heat capacity as a function of temperature in the two phases is different. The third- or higherorder transitions have not been reported for food materials. 3. Effects of pressure on transition temperatures An equilibrium between two phases of a one-component system requires that the chemical potential, pressure, and temperature are the same in both phases. A change in temperature at a constant pressure or a change of pressure at a constant temperature results in a nonequilibrium state and disappearance of one of the phases. However, if both pressure and temperature are changed, but the chemical potential of both phases are kept equal, the two phases may coexist. Such changes in pressure and temperature that maintain equilibrium between two phases can be obtained with the Clausius-Clapeyron equation, which is given in equation (1.23), where AHI is the latent heat of the transition and AV is the difference in volume between the two phases. dp = l ~ I l
dT
(1.23)
TAV
The Clausius-Clapeyron equation can be used to calculate the effect of pressure on the boiling temperature, e.g., on the boiling temperature of water, which is important in evaporation and dehydration. The equation may also be used to calculate the effect of pressure on the melting temperature. The Clausius-Clapeyron equation may be written into the form of equation (1.24), which can be used to obtain the latent heat of vaporization or sublimation. According to equation (1.24) a plot of In p against 1/T is linear. However, linearity is often valid only over a narrow temperature range, since
1. Introduction to Phase Transitions
17
zy
the properties of the vapor phase differ from those of a perfect gas and A n l changes with temperature. (1.24)
It should be noticed that an increase in pressure causes a decrease in the total volume, which may increase both first- and second-order transition temperatures. According to Sperling (1986) an increase in pressure may result in vitrification of amorphous materials during extrusion.
D. Effects of Composition on Transition Temperatures
The effects of composition on phase transition temperatures are important in defining various effects of food composition on observed phase transition temperatures and the physical state. The effect of composition on vapor pressure of water in foods is one of the most important examples that affect food behavior in both processing and storage. 1. Raoult's law Raoult's law defines the relationship between composition and vapor pressure of dilute solutions. A liquid and its vapor phase have the same temperature and pressure at equilibrium. The equilibrium between the two phases also requires that the chemical potentials of the two phases are equal. Raoult's law, which is given in equation (1.25), states that the vapor pressure of a liquid, p, in a mixture is a linear function of its mole fraction, x, in the liquid phase and the vapor pressure of the pure liquid, P0, at the same temperature. p = xPO
(1.25)
zy
Raoult's law is important in defining properties of water in food materials. Raoult's law can be applied to evaluate effects of food composition on the melting and boiling temperatures of water in foods. Several salts, however, may lower the vapor pressure of water in solutions more than is predicted by Raoult's law, which affects water activity, aw, of the salt solutions accordingly (Benmergui et al., 1979).
18
Phase Transitionsin Foods
zyxwvut
2. Henry's law Raoult's law applies to the depression of the vapor pressure of solvents in dilute solutions and therefore it is approached as the mole fraction of the solvent becomes unity. Henry's law is analogous to Raoult's law, but it defines the vapor pressure of the solute in a dilute solution. Therefore, as the mole fraction of a solute approaches zero its partial pressure is defined by Henry's law. Henry's law is given by equation (1.26), which states that the vapor pressure, p, is a linear function of the mole fraction of the solute, x, and a constant, K. p = Kx
zyxwvuts (1.26)
It should be noticed that Henry's law can also be applied to predict solubility of gases in liquids.
References
Alberty, R.A. 1983. Physical Chemistry. John Wiley & Sons, New York. Benmergui, E.A., Ferro Fontan, C. and Chirife, J. 1979. The prediction of water activity in aqueous solutions in connection with intermediate moisture foods. I. aw prediction in single aqueous electrolyte solutions. J. Food Technol. 14: 625-637. Ehrenfest, P. 1933. Proc. Acad. Sci., Amsterdam 36: 153. Cited in Wunderlich (1981). Sperling, L.H. 1986. Introduction to Physical Polymer Science. John Wiley & Sons, New York. Wunderlich, B. 1981. The basis of thermal analysis. In Thermal Characterization of Polymeric Materials, ed. E.A. Turi. Academic Press, New York, pp. 91-234.
,,,,,,
CHAPTER 2
Physical State and Molecular Mobility
I.
Introduction
zyxwvutsrq
The physical state of food materials is defined by the physical state of component compounds and their phase behavior. In foods the physical state and stability are related to both first- and second-order phase transitions and molecular mobility in various phases. The physical state and molecular mobility are affected by temperature and also by composition of food solids. Various solid foods have a low water content and their molecular mobility is also low. It is also known that amorphous polymers have a higher molecular mobility than crystalline polymers (Barker and Thomas, 1964), which probably applies also to molecular mobility in foods. Molecular mobility is often related to such phenomena as diffusion, viscosity, electrical conductivity, and glass transition. Food solids may be divided into lipids and water solubles that are composed mostly of carbohydrates and proteins. The physical state of lipids is often related to the transitions between various polymorphic forms and the liquid state. Carbohydrates and proteins may exist in the noncrystalline amor19
zy
20
Phase Transitionsin Foods
zyxwvut
phous state, in the crystalline state, or in solution. The physical state and phase transitions of the water solubles are significantly affected by water content. As the water content increases the molecular mobility of water solubles may also increase (Lillford, 1988), which results in a decreasing viscosity and probably also in lower stability. Liquid materials have fairly high molecular mobility, which decreases with decreasing temperature. Changes in the physical state of food materials include first-order phase transitions such as crystallization and melting, and the second-order phase change that occurs at the glass transition of an amorphous material. The amorphous state is typical of water-soluble food components at low water contents and in frozen foods (White and Cakebread, 1966; Levine and Slade, 1986; Slade and Levine, 1991). The emphasis of this chapter is on the basic relationships between the physical state and properties of food solids, and on the effects of temperature on dynamic phenomena.
II.
Crystallization and Melting
Crystallization and melting are first-order phase transitions that occur between the solid and liquid states. The latent heat released by crystallization is equal to the amount of heat required by melting at the same temperature. Crystallization may occur from a melt or from a solution. Crystallization from a melt may occur at temperatures below the equilibrium melting temperature, Tin, and from a solution due to supersaturation. In amorphous foods with low water contents crystallization of solids may occur from the melt at temperatures above the glass transition temperature, Tg, but below Tm or in frozen foods from the supersaturated solution formed due to freezeconcentration. Crystallization is often a three-step process that includes nucleation (formation of nuclei), propagation (crystal growth), and maturation (crystal perfection and/or continued growth) (Levine and Slade, 1990).
A. Nucleation and Crystal Growth
Numerous applications of crystallization technology exist in the food industry. Crystallization is an important phase transition of frozen foods and in the manufacturing of sugars, salts, and various fats and spreads. Several materials may also crystallize during food processing and storage.
zy
2. PhysicalState and Molecular Mobility
21
zy
Crystallization may be either a desired or a hazardous phenomenon depending on the product and its quality attributes. Examples include a wide range of processes and products from ice formation during freezing to sugar crystallization in confectionery or food powders to various recrystallization phenomena. 1. Nucleation Nucleation is the process that precedes crystallization and it involves the formation of the incipient crystalline phase. Nucleation results from the metastable state that occurs after supersaturation due to solvent removal or a decrease in temperature of a solution or a melt (Van Hook, 1961). Nucleation may be either homogeneous or heterogeneous. Heterogeneous nucleation is more likely to occur in foods due to the presence of impurities. Homogeneous and heterogeneous nucleation processes are considered to be primary nucleation mechanisms, i.e., crystalline centers of the crystallizing compounds are not present in the nucleating systems (Hartel and Shastry, 1991).
zy
a. Homogeneous Nucleation. Homogeneous nucleation occurs spontaneously, i.e., the molecules of the material arrange together and form the nuclei. Formation of a new phase requires energy due to its higher solubility or vapor pressure, which may cause its disappearance (Van Hook, 1961). The vapor pressure variation of small droplets is given by the Kelvin equation, which is given in equation (2.1), where p is vapor pressure of a droplet, p ~ is vapor pressure at a plane surface, tr is surface tension, v is molar volume, R is the gas constant, and r is the radius of the droplet. In p - 2 o r p~ rRT L 2crM ln~ = ~ L~, rpRT
(2.1)
(2.2)
The Kelvin equation is one of the most important equations in the quantitative theories of crystallization (Van Hook, 1961) and it can be written into the form of the Ostwald-Freundlich equation, which is given in equation (2.2), where L is solubility, L~ is the solubility over extended plane surfaces, i.e., the typical solubility of the material, M is molecular weight, p is density, and r is the radius of the nucleus (Van Hook, 1961; Brennan et al., 1990).
22
zyxwvut zyxwvut
Phase Transitionsin Foods
zyxwv
The quantifies of p / p ~ or L / L ~ in equations (2.1) and (2.2), respectively, are measures of the extent of supersaturation or supercooling, a. The critical radius, rc, for crystal formation can be obtained from equation (2.3). Equation (2.3) defines that spontaneous nucleation may occur when nuclei with a size of r > rc are formed. rc =
2tyM p R T In a
(2.3)
It has been observed that the rate of nucleation increases with an increase in supersaturation. The supersaturated state may result from a decrease of temperature, further removal of solvent at a constant temperature, or both. The rate of nucleation may be assumed to follow the Arrhenius-type temperature dependence according to equation (2.4), where v is the rate of nuclei formation, k is the frequency factor, and En is the minimum energy required for nucleus formation (Van Hook, 1961; Brennan et al., 1990).
v-
ke RT
(2.4)
Van Hook (1961) reported that the work required for the formation of a spherical nucleus with the critical size is one-third of the work that is required for the forming of its own surface. According to Van Hook (1961) the rate of nucleation is defined by equation (2.5). The rate of nucleation can be shown to have a dramatic increase above a critical value of supersaturation or supercooling as shown in Figure 2.1.
l 16zM2 ty3 1 V -- ke
3d2R3T3 In2 ct
zyxwvu (2.5)
As defined by the critical size of a nucleus the requirement for the occurrence of homogeneous nucleation is that molecules form clusters due to molecular collisions. The size of such clusters must become sufficiently large and exceed the energy barrier for nucleation (Hartel and Shastry, 1991). Homogeneous nucleation requires a fairly large extent of supercooling or supersaturation and its occurrence even in chemically pure materials is rare. Most crystallization processes are not homogeneous due to the presence of foreign surfaces and particles that are in contact with the material.
2. PhysicalState and Molecular Mobility
23
Z
o uJ ._1 C) Z LL.
o
uJ I-
1012 Pa s. Such viscosities are difficult to measure. Typical properties of glassy materials are brittleness and transparency. Their molecular motions are restricted to vibrations and short-range rotational motions (Sperling, 1986). Changes that occur in the glassy state are extremely slow and they are often referred to as physical aging. Glassy foods are often considered to be stable and the glassy state is of great importance to textural characteristics of crispy foods such as potato chips, cookies, and extruded snacks (Levine and Slade, 1986; Slade and Levine, 1991). 2. Glass transition temperature range Transformation of glassy materials into the viscous, supercooled, liquid state occurs over the glass transition temperature range. Glass transition results in
30
Phase Transitionsin Foods
zyxwvut
a dramatic drop of the modulus from about 109 to 106 Pa. The drop in modulus occurs over a temperature range of 10 to 30~ However, it is important to notice that over the glass transition temperature range, a few degrees change in temperature may have a significant effect on stiffness. The change in stiffness is particularly important to the structure and stability of amorphous food materials. There is also a dramatic change in molecular mobility within the glass transition temperature range. According to Sperling (1986) the Tg may also be defined to be the onset temperature of long-range, coordinated molecular motion, which does not occur below Tg due to the freezing of the molecules to the solid state at Tg.
zyxwvuts
3. Rubbery plateau region The glass transition temperature range of several polymers is followed by a temperature range over which the modulus remains constant. This temperature range is known as the rubbery plateau region at which polymers have an almost constant modulus of 2 x 10⁶ Pa and they show long-range rubber elasticity (Sperling, 1986). At temperatures within the rubbery plateau region elastomers can be stretched and they regain the original length when the force is released. The temperature range of the rubbery plateau is a function of molecular weight and it is affected by the linearity of the molecules. The width of the plateau of linear molecules increases with increasing molecular weight and they exhibit a slow drop in modulus. Cross-linking improves rubber elasticity. These factors may significantly affect also the physical properties of amorphous food components. The modulus also increases with increasing crystallinity (Sperling, 1986). It should be noticed that the existence of the rubbery plateau is not typical of inorganic amorphous materials or low molecular weight amorphous compounds such as sugars or water. 4. Rubbery flow region The rubbery plateau temperature region of polymers is followed by a rubbery flow region. Over the rubbery flow temperature range amorphous polymers may exhibit both rubber elasticity and flow depending on the experimental time scale (Sperling, 1986). Rubbery flow is a property of linear polymers. Cross-linked polymers remain in the rubbery plateau region until they decompose at high temperatures.
2. Physical State and Molecular Mobility
31
zy
5. Liquid flow region
zyxwvu
Liquid flow region follows the rubbery flow region as temperature is increased. At the liquid flow region synthetic polymers flow readily and they may behave like molasses (Sperling, 1986). The modulus of semicrystalline polymers depends on crystallinity. The amorphous portions of such materials go through the glass transition at Tg. However, the crystalline regions remain hard at temperatures Tg < T < Tm and a rapid drop in modulus is observed as the crystalline regions melt at Tm. Such behavior may occur in polymeric food components such as starch, which is composed of partially crystalline carbohydrate polymers (Slade and Levine, 1991). It should be noticed that the Tg of a number of synthetic polymers and also of food components occurs at about 100~ below Tm. Therefore, most amorphous materials approach the equilibrium liquid state at about Tg + 100~
C. Glass Transition Theories
The basic theories of the occurrence of glass transition are the free volume theory, the kinetic theory, and the thermodynamic theory. The free volume theory assumes that molecular motion depends on the presence of holes, vacancies, or voids that allow molecular movement. The holes between molecules provide the free volume that is needed for molecular rearrangement. The kinetic theory defines glass transition as the temperature at which the relaxation time for the segmental motion of polymer chains approaches that of the experimental time scale. The thermodynamic theory uses the concept of equilibrium and the thermodynamic requirements for a real secondorder transition. 1. Free volume theory The free volume theory is based on the change in volume expansion coefficient that occurs at the glass transition. It assumes that the fractional free volume, f, in the glassy state is constant and it increases above Tg according to equation (2.14), where fg is the fractional free volume at Tg and trfis the thermal expansion coefficient of free volume.
f - fg + a f ( T - T g )
(2.14)
The fractional free volume is defined by equation (2.15) and the specific free volume is given by equation (2.16), where v is macroscopic volume, vf
32
zyxwvut zyxwvut
Phase Transitionsin Foods
is specific free volume, and v0 is the volume occupied by molecules (Tant and Wilkes, 1981). f =
vf
(2.15)
V
Vf
-- V -- V 0
vf
=
(2.16) (2.17)
K + ( a R - a G )T
Fox and Flory (1950) suggested that the specific free volume of polystyrene with an infinite molecular weight above Tg followed equation (2.17), where K is a constant that is related to the free volume at 0 K, and aR and a G are volume expansion coefficients in the rubbery and glassy states,
slope aR ILl
slope a G
_.1
0>
_(2
1.1_
vf
S
0I.U
S S S
13.. O0
S
Supercooled liquid S~Glas To=O K
i"
s
Tg v
TEMPERATURE Figure 2.3 A schematic representation of the determination of free volume. The specific volume, v, in the glassy state, which has the value V0G at 0 K, is temperature-dependent as defined by the thermal expansion coefficient, aG. Thermal expansion above the glass transition temperature, T g , is defined by the thermal expansion coefficient, a R . The extrapolated specific volume of the supercooled liquid at 0 K is vOR. The specific free volume, vf, is given by the difference in the extrapolated specific volumes of the supercooled liquid and glassy states at 0 K. After Sperling (1986).
zy zyxwvut 2. PhysicalState and Molecular Mobility
33
respectively. Below Tg the temperature-volume relationship was found to be independent of molecular weight. The determination of specific free volume is shown in Figure 2.3. Reported values for specific free volume at Tg vary depending on polymer from about 1 to 13% (Sperling, 1986). Tant and Wilkes (1981) pointed out that the free volume theory has been useful in the description of transport properties such as viscosity and diffusivity in liquids. The free volume theory can also be used to relate viscoelastic motion to temperature and time and to explain thermal expansion at temperatures below and above the glass transition. The inadequacies of the free volume theory were discussed by Perez (1994). 2. Kinetic theory It has been recognized that experimentally determined glass transition temperatures depend on the experimental time scale. The kinetic theory of glass transition considers the time-dependent characteristics of the glass transition and the time-dependent molecular relaxations that take place over the glass transition temperature range. According to Sperling (1986) the kinetic theory assumes that matter may have holes with a molar volume, Vh, or it may exist in a no-hole situation with molar excess energy, eh. The activation energy for the disappearance of a hole is ej. The partition function of the holes is Qh and that in the activated state is Q-'. Removal of holes decreases volume. In the glassy state the number of holes and their spatial positions become frozen in and the molecules may not move to holes (Sperling, 1986). The equilibrium number of holes, Nh, is given by equation (2.18), where NO and v0 are the number of moles of repeating units and the molar volume per repeating unit, respectively. The relaxation time for the disappearance of holes, zh, is given by equation (2.19), where h and k are the Planck and Boltzmann constants, respectively.
Nh = NO (v 0 ] vh)e-eh/RT
"ch =
h Qh
- e ej kT Qr,
/RT
(2.18)
zy
(2.19)
The change in the number of holes that go through the glass transition yields the change in heat capacity, ACp. Thus, experimental determinations of ACp can be used to calculate eh. The value for vO/Vh may also be derived from experimental values for density and cohesive energy.
34
Phase Transitionsin Foods
zyxwvut
3. Thermodynamic theory All amorphous materials have a glass transition with properties typical of a second-order transition. The thermodynamic theory assumes that the glass transition attains a true equilibrium at an infinitely long experiment. The true Tg may be observed at a temperature that is about 50~ lower than that observed with common times of experiments (Sperling, 1986). The thermodynamic theory of the glass transition requires that a glassy phase with an entropy that is negligibly higher than that of the crystalline phase can be formed. 4. Other theories The free volume, kinetic, and thermodynamic theories are the most applied in the evaluation of the changes that are observed at the glass transition temperature. These theories have both advantages and disadvantages in relating viscoelastic properties, expansion coefficients, heat capacity, molecular mobility, composition, and a number of other properties of amorphous materials to Tg. Several other theories of glass transition have also been reported. The mode coupling theories use a generalized viscosity term that is expressed in terms of products of correlation functions, which introduce coupling effects between different modes of vibration (Perez, 1994). Other theories are based on the hierarchical correlated molecular motion and computer simulation of quasi-point defects in disordered condensed matter (Perez, 1994).
IV.
Molecular Mobility and Plasticization
Molecular mobility of amorphous compounds becomes apparent at the glass transition temperature. As the temperature increases above Tg the molecular mobility increases, which is observed from decreasing viscosity and increasing flow. In such cases temperature has a plasticizing effect on the material. However, plasticizers, which often have a lower molecular weight than the bulk material, may decrease the glass transition temperature and therefore cause plasticization. It is also well known that a diluent may cause a depression of both the melting temperature and glass transition temperature of a polymer. The extent of the depression of Tm and Tg depends on the amount of the diluent and its compatibility with the polymer. Food solids are often water soluble or miscible compounds. It is well known that food solids often become soft if the water content is increased. Thus, water can be considered
zy
2. Physical State and Molecular Mobility
zy zyx 35
as a plasticizer of food materials. Water has also been found to act as a Tg decreasing plasticizer especially in natural polymers such as cellulose and collagen, and to a lesser degree in synthetic polyamides (Batzer and Kreibich, 1981). The decrease of Tg becomes more pronounced with increasing Tg of the polymer at low water contents (Batzer and Kreibich, 1981).
A. Mechanical Properties
According to Sperling (1986) the molecular mobility in the rubbery and liquid states of polymers involves 10 to 50 carbon atoms, while the molecular mobility in the glassy state is restricted to vibrations, rotations, and motions by relatively short segments of the polymer chains. The molecular mobility increases dramatically at temperatures above Tg. Relaxation times of mechanical properties are related to molecular mobility, which is related to temperature. Relationships between temperature and relaxation times are used in the timetemperature superposition principle (Ferry, 1980). The time-temperature superposition principle applies to the mechanical properties of various amorphous materials including food components and food solids. 1. Relaxation times According to Williams et al. (1955) a single empirical function may be used to describe the temperature dependence of mechanical properties of amorphous polymers above their glass transition temperature. The ratio, aT, of relaxation times ~:and Zs of configurational rearrangements at a temperature, T, to that at a reference temperature, Ts, respectively, as defined by equation (2.20) reflects the temperature dependence of mobility.
zyxwvuts
a r = T~ Vrs
(2.20)
The temperature dependence of the relaxation times of mechanical properties are often predicted by the Williams-Landel-Ferry (WLF) equation.
a. The WLF Equation. Williams et al. (1955) used literature data for aT that were derived from measurements of dynamic mechanical, stress relaxation, and dielectric properties and viscosity to show that aT followed the empirical equation (2.21), where C1 and C2 are constants and Ts is a reference temperature. The only food component for which data were included was glucose. Williams et al. (1955) used viscosity data for glucose over a
36
Phase Transitionsin Foods
zyxwvu zyxwvu
wide temperature range above Tg. They found that plots of aT against T could be matched for a number of inorganic, organic, and synthetic glass-forming compounds using horizontal and vertical translations. The average T s - T g value was found to be 50 + 5~ and the constants C1 and C2 were 8.86 and 101.6, respectively. loga T =
- C 1(T
- T s) C2 + (T - T s)
(2.21)
Equation (2.21) is the original form of the well known WLF equation. Williams et al. (1955) suggested that the WLF equation was applicable over the temperature range from Tg to Tg + 100~ They pointed out that the use of Tg as the reference temperature instead of Ts was possible if the "universal" constant values were C1 = 17.44 and C2 = 51.6. However, the use of Ts at Tg + 50~ was considered to be more accurate. The free volume theory assumes that the temperature dependence of viscosity is related to free volume. Doolittle (1951) showed that viscosity was related to free volume according to equation (2.22), where A and B are constants, v0 is occupied volume, and v is specific free volume. In 7/= In A + B(v 0 / v)
(2.22)
Williams et al. (1955) were able to show that In aT is obtained also from equation (2.23), where fg is the fractional free volume at the glass transition temperature and a2 is the difference of the thermal expansion coefficient below and above Tg.
-f gl(T-Tg) lnaT=(fg)
(2.23)
Equation (2.23) has the form of the WLF equation. Therefore, it can be shown that the universal constants suggest that the values for a2 andfg are 4.8 x 10 -4 ~ and 0.025, respectively.
b. WLF Constants. Although Williams et al. (1955) found that the data for several glass forming inorganic, organic, and organic polymeric compounds followed the WLF model with the universal constants, their use has been criticized. The universal constants may be used only if sufficient data for
2. PhysicalState and MolecularMobility
37
zy
zy
calculating specific constants are unavailable. The WLF equation can be written also into the form of a straight line that is given by equation (2.24). 1 lna T
=
1
C2
-C 1
C I ( T - T s)
(2.24)
The relaxation times of mechanical properties at Tg are extremely long and the experimental determination of Vg is often impossible. However, the reference temperature, Ts, can be located at another temperature above Tg at which experimental data for 7:s are available. Equation (2.24) suggests that a plot of l/In aT against 1 / ( T - Ts) gives a straight line. It is obvious that the WLF constants can be derived from the slope and the intercept of the straight line. However, the constants C1 and C2 are dependent on the location of Ts and it is often practical to use the glass transition temperature as the reference temperature. A shift in the reference temperature requires that correct values for the constants at the other reference temperature are available. Corrected values for the constants can be derived with equations (2.25) and (2.26), where C'I and C'2 are the corrected values for the constants C1 and C2, respectively, at a temperature Ts = Ts - t5 (Ferry, 1980; Peleg, 1992). C' 1 =
ClC2
(2.25)
C2 - &
C ' 2 - C2 - S
zyxw (2.26)
Ferry (1980) pointed out that equation (2.26) suggests that the relationship given in equation (2.27) exists between C2 and temperature, where Too is a fixed temperature at which log aT becomes infinite. s-c2 - 7"00
(2.27)
The relationship given by equation (2.27) can be considered in the WLF equation, which may be rewritten into the form of equation (2.28). log a T - C'I (T - T' s )
(2.28)
T-Too
According to equation (2.28) a plot of log aT against ( T - T ' s ) / ( T - Too) is linear through the origin and it has the slope C'I. Ferry (1980) pointed out that Too is often at about Tg - 50~ However, computer programs may be used to fit experimental data to equation (2.28) and to derive a more appro-
38
Phase Transitionsin Foods
zyxwvut zyxwvu
priate Too, which may be used to obtain C'2 from equation (2.27). A shift of the reference temperature to T's = Tg allows prediction of the relaxation times at temperatures above Tg and a comparison of the universal constants with those derived from the experimental data (Peleg, 1992). 2. Viscosity
The glassy state is an isoviscous state with a viscosity of about 1012 Pa s (e.g., White and Cakebread, 1966; Sperling, 1986). Relaxation times of mechanical changes in the glassy state are extremely long, but as the temperature is increased to above the glass transition temperature dramatic decreases in the relaxation times of mechanical changes and in viscosity are observed. Viscosity is a time-dependent quantity that can be related to the relaxation times above glass transition (Sperling, 1986). The temperature dependence of the relaxation times and therefore viscosity above Tg is defined by equation (2.29), where ~:and r/, and ~:s and r/s, refer to relaxation time and viscosity at T and Ts, respectively. Thus, the WLF equation can be used to relate viscosity or any other temperature-dependent mechanical property at temperatures above Tg to a reference temperature, Ts, or to Tg according to equation (2.30).
In a T = ln(~s 3 = ln(~//~.rls)
(2.29)
In rl = -C1 (T - T s) qs C2 + (T - T s)
(2.30)
Other equations are also commonly used to predict temperature dependence of viscosity of supercooled liquids. These equations include the VogelTammann-Fulcher (VTF) equation (2.31) and the power-law equation (2.32), where A, D, and r are constants. .,., . . D T s / ( T - T s )
r/= ~tse
(2.31)
rI - A(T - Tg) r
(2.32)
Viscosity data above Tg may follow the VTF and power-law equations in addition to the WLF equation, but the free volume-based WLF theory has probably been the most applicable in predicting temperature-dependent mechanical properties of amorphous materials. However, the VTF and WLF
zy zyxwvut 2. Physical State and Molecular Mobility
39
equations are interconvertible and various D values correspond to various WLF constants. Angell et al. (1994) used the D value to classify liquids into fragile and strong liquids. The liquid relaxation behavior is observed from the D value. Strong liquids that resist thermal degradation have a large D value while those with small D are fragile liquids. Angell et al. (1994) also pointed out that strong liquids exhibit only small or undetectable changes in heat capacity at Tg, whereas fragile liquids show large changes in heat capacity at
Tg. 3. Dynamic mechanical properties Mechanical loss measurements can be used to probe the time scales of molecular motions in the region of the glass transition (Allen, 1993). The relaxation measurements apply an oscillating stress or strain and the response of the sample to the external force. The energy transformed to heat is that lost during the experiment. The measurements can be done isothermally to determine the loss factor as a function of frequency or by keeping the frequency constant to determine the response (damping) to the frequency as a function of temperature (Allen, 1993). The time and frequency dependence of viscoelastic functions reflects the response of the system to the duration of the experiments. The response is dependent on the time required for the slowest rearrangement of molecules, i.e., relaxation time. In a mechanical measurement a maximum energy loss is observed at the temperature where the average of molecular motions is equivalent to the applied frequency. In the glassy state the storage modulus, G', is 109-1011 Pa. At the glass transition temperature range G' drops to 103 to 105 Pa. At the rubbery plateau region G' shows only slight dependence on frequency, but the loss modulus, G", shows a minimum. In the glassy state G" is considerably smaller than G', since the response to external stress is very small. At the glass transition G' increases with frequency (Allen, 1993).
B. Plasticization and Molecular Weight
Plasticization and molecular weight affect both first-order and second-order transition temperatures. In amorphous materials plasticizers may be considered as compounds that increase the free volume and therefore depress the transition temperatures. Molecular weight can also be related to the free volume of homopolymers and to the plasticizing effect of diluents.
40
Phase Transitionsin Foods
zyxwvut
1. Melting temperature
zyx
Flory (1953) reported relationships between equilibrium melting temperature of a polymer and the amount of a diluent. The relationship between Tm and volume fraction of the diluent is defined by the Flory-Huggins equation. The Flory-Huggins equation is given in equation (2.33), where T ~ is the equilibrium melting temperature, Tm is melting temperature in the presence of the diluent, R is the gas constant, AHu is the latent heat of melting per repeating unit, Vu/V1 is the ratio of the molar volume of the repeating unit of the polymer and that of the diluent, Z1 is the polymer-diluent interaction parameter, and Vl is the volume fraction of the diluent.
1 Tm
1 _ R Vu ZlV2 ) T O - z S ~ u Vl ( v l -
(2.33)
A common assumption is that ~1 in equation (2.33) is zero. Thus, a plot of 1/Tm against Vl gives a straight line with intercept at 1/T 0. 2. Glass transition and molecular weight The molecular weight of polymers can be related to their free volume. Common synthetic polymers and a number of natural carbohydrate polymers and polymer mixtures, but not native proteins, have a distribution of molecular weights. Therefore, the molecular weight can be given as the number average molecular weight, Mn, or as the weight average molecular weight, Mw, and the ratio Mw/Mn can be used as a measure of the molecular weight distribution. The number average molecular weight is given by equation (2.34), where ni is the number of molecules with the molecular weight Mi. The weight average molecular weight is defined by equation (2.35).
M n = ~JiniMi ~i ni
(2.34)
Mw = s niM2 s
(2.35)
Fox and Flory (1950) prepared ten polystyrene fractions with molecular weights ranging from 2970 to 85,000. The glass transition temperature for each fraction was determined from volume-temperature curves that were obtained from dilatometric measurements. The Tg was found to increase rapidly
zy
zyxwvutsr 2. Physical State and Molecular Mobility
41
with increasing molecular weight up to 25,000 and then to level off for materials with higher molecular weights. Fox and Flory (1950) found that a plot of Tg against the reciprocal molecular weight gave a linear relationship. They concluded that the transition temperature increased with increasing molecular weight giving a linear relationship between the transition temperature and the reciprocal of the number average molecular weight. The Fox and Flory equation that is given in equation (2.36), where Tg(oO)is the limiting value of Tg at high molecular weight and K is a constant, has been shown to apply for a number of synthetic polymers and biopolymers, including starch hydrolysis products (maltodextrins) (Roos and Karel, 199 la). K
Tg = Tg(oO)- ~Mn
(2.36)
It is obvious that the addition of low molecular weight components to polymers or the decrease of the size of polymer molecules decreases their glass transition temperature. An increase in the size of polymer molecules that occurs in thermosetting results in an increase of Tg. 3. Glass transitions of mixtures The free volume of a liquid (plasticizer) with a low molecular weight such as water in foods is very large in comparison to that of a polymer at the same temperature and pressure (Levine and Slade, 1986; Slade and Levine, 1991). Knowledge of the effects of composition on the glass transition temperature is of significant importance in the evaluation of the technological properties of polymers. Couchman and Karasz (1978) suggested a thermodynamic theory, which related the glass transition temperature of binary blends of miscible polymers to composition. The Tg dependence of composition was suggested to follow equation (2.37), where Xl, Tgl, and ACpl and x2, Tg2, and ACp2 refer to the mole fraction, glass transition temperature, and change in heat capacity at glass transition of the components 1 and 2, respectively. It should be noticed that equation (2.37) was identical with the empirical Gordon and Taylor (1952) equation with a constant, k = ACp2/ACp1.
Tg = xlTgl + (ACpl ] ACp2)x2Tg2 x 1 + (ACpl ] ACp2)X2
(2.37)
The change in heat capacity that occurs over the glass transition temperature range is also dependent on composition. The ACp of sugars plasticized
42
Phase Transitionsin Foods
zyxwvut
by water have been found to increase linearly with increasing weight fraction of water (Roos and Karel, 1991b; Hatley and Mant, 1993).
C. Crystallization of Amorphous Compounds
Crystallization mechanisms of amorphous food components have not been well established. Obviously, the driving force for crystallization from the amorphous supercooled state is the degree of supercooling and the rates of nucleation and crystal growth may be assumed to follow those in supersaturated solutions. Crystallization behavior of amorphous food components may vary significantly depending on various factors, and in particular on the specific properties of the components and on the degree of polymerization. Polymers and sugars with a high value for the Tm/Tgratio tend to crystallize rapidly (Roos, 1993).
zyxw
1. Nucleation and crystal growth Low molecular weight amorphous food components may crystallize at temperatures higher than the glass transition temperature but below the melting temperature. Such compounds as amorphous sugars crystallize to the thermodynamically favorable form although the presence of other food components may delay crystallization. Crystallization behavior of amorphous food component polymers is more complicated and it may be assumed to correspond to that of synthetic polymers. According to Flory (1953) crystallization occurs in polymers that have a sufficiently ordered chain structure. Flory (1953) stated that polymer crystals may have regularity in three dimensions. The unit cells of the lattice may be considered to be composed of the repeating polymer units instead of single molecules. At the unit cell level the crystal structure is analogous to the crystal structure of monomeric compounds. However, the occurrence of complete crystallization of polymers is unlikely and the crystallites are usually embedded in a residual amorphous matrix (Flory, 1953). The structure of the crystallites may vary depending on the crystallization conditions. Nucleation and crystallization of polymers occur slowly in comparison with low molecular weight compounds. The slow crystallization is due to the restrictions of molecular motions that are required for molecular arrangements to form the crystalline structure. Flory (1953) pointed out that the extent of crystallization of polymers may depend on supercooling and more perfect crystallites are obtained when crystallization occurs at a temperature close to
2. Physical State and Molecular Mobility
43
zy
the melting temperature. However, the overall rate of crystallization increases with increasing supercooling (Sperling, 1986). Polymer crystallization has been studied with several methods, including microscopy. Microscopy may be used to follow the growth of the radius of spherulites at isothermal conditions (Sperling, 1986). The increase in radius often exhibits linearity when plotted against time. The linear growth rate is dependent on the crystallization temperature. Plots showing the linear rate as a function of temperature give information on the crystallization rate in relation to the glass transition and melting temperature. It may be shown that the rate increases with decreasing temperature below Tin, i.e., with increasing supercooling, until a peak occurs and the rate starts to decrease as shown in Figure 2.4. Such decrease of the rate of crystallization may be accounted for by decreasing diffusion and increasing viscosity. At temperatures close to the Tg the rate approaches zero as the material is transformed into the solid, glassy state (Sperling, 1986). Such behavior may be assumed to be also typical of biopolymers. Based on experimental crystallization studies
zyxw
zyxwvutsrq 9
-
0
Overall crystallization
9
9
0
~
0
o
o
iii I---
< rr
o
9
0 9
.0. o
'
/
~
_
0 o "~
0 9
. /
0
"0
0
9
.
\ o
o o 0
0
9
9
e
TEMPERATURE
Figure 2.4 Crystallization kinetics in amorphous or partially crystalline polymers. The rate of nucleation is high at temperatures close to the glass transition, Tg, due to the extensive supercooling, but kinetic restrictions decrease the rate of propagation. Propagation increases with increasing temperature due to increasing diffusion until the liquid state becomes the equilibrium slate above the melting temperature, Trn.The overall rate of crystallization exhibits a maximum between Tg and Tin. After Levine and Slade (1990).
44
Phase Transitionsin Foods
zyxwvut zyxwvu
of starch gels Marsh and Blanshard (1988) assumed that crystallization in starch shows a maximum between Tg and Tm. Crystallization kinetics of amorphous food component polymers was discussed in detail by Levine and Slade (1990). Crystallization of amorphous noncrystalline and partially crystalline materials occurs due to supercooling below the equilibrium melting temperature. Such crystallization may occur at temperatures above Tg but below Tm, which obviously applies also to the crystallization of low molecular weight amorphous food components such as sugars (Roos and Karel, 1990, 1992). A schematic representation of crystallization kinetics in partially crystalline polymers is shown in Figure 2.4. Nucleation and crystal growth cease at Tm due to the fact that the thermodynamic equilibrium shifts to the liquid state. At temperatures below Tg crystallization is unlikely due to the extremely high viscosity and slow diffusion. The rate of nucleation in the vicinity of Tm is slow and it increases rapidly with decreasing temperature below Tm until the temperature approaches Tg. At temperatures close to Tm crystal growth is rapid, but the increasing viscosity with decreasing temperature delays propagation, which becomes extremely slow in the vicinity of Tg (Levine and Slade, 1990). In agreement with the nucleation and crystal growth theories the number of nuclei formed at temperatures close to Tg is high, but propagation is slow due to diffusional limitations. 2. Crystallization kinetics Crystallization of amorphous compounds may significantly affect food quality and kinetics of other deteriorative changes. Such phenomena as sandiness in ice cream, caking and browning of milk powders, or starch retrogradation are often related to crystallization of amorphous carbohydrates. Knowledge of factors affecting crystallization can be applied both in controlled crystallization processes during food manufacturing and in shelf life predictions.
a = 1-
e -Vt
(2.38)
Crystallinity in amorphous materials is often produced as a function of time. A plot of crystallinity against time of crystallization has a sigmoid shape, showing that the rate at which crystallization occurs is initially slow, then it increases, and at the end of the process the rate is again reduced (Avrami, 1939). Crystallization kinetics are particularly important for evaluating time dependence of the change in phase that may occur in amorphous food components, e.g., sugars and starch. Crystallization kinetics
2. PhysicalState and MolecularMobility
45
zy
zyxw
are often modeled with the Avrami equation (Avrami, 1940). The Avrami equation is applied in modeling crystallization kinetics of amorphous polymers (Sperling, 1986). It may be shown that the extent of crystallization is related to the volume of the crystalline material, Vt, at time, t, according to equation (2.38), where a is crystallinity (Sperling, 1986). Crystallization may occur due to growth of nuclei that have been formed during cooling of the amorphous material to the crystallization temperature or due to nucleation and crystal growth at the crystallization temperature. The growth of spherical nuclei may proceed at a constant rate, g, and it can be shown that the volume increase of the crystalline material during a time period from t to t + dt is defined by equation (2.39), where N is the number of nuclei with radius, r, at time, t. d V t - 4 zrr2Ndr
(2.39)
t
V t - f 4 zcg2t2Ngdt
(2.40)
o
4
V t - ~ jrg3Nt 3
(2.41)
Considering that r = gt and integration of equation (2.39) result~ in equation (2.40) and the volume of the crystalline fraction at time t is given by equation (2.41). ff the assumption is that the rate of crystallization is defined by the formation of nuclei, which is followed by propagation of spheres that are nucleated at time ti, the volume of the crystalline fraction is defined by equation (2.42). Moreover, equation (2.42) assumes that nucleation occurs linearly with time and therefore the relationship N =/t applies provided that the rate of nucleation is 1 (Sperling, 1986). The volume fraction of the crystalline material is then obtained from equation (2.43). Equation (2.43) is obtained by integration of equation (2.42) and it may be used to evaluate the morphology of the crystals formed. d V t - 4 rcg 2 (t - t i )2 Itgdt
(2.42)
2 V t -~zcg31t 4
(2.43)
46
Phase Transitionsin Foods 1.0
0.8
10
~Z 0.6 .,--.. z .--I .--I
< i03 >. 0.4 rr o
0
-= -10
k = 2 x 10 -22
0.2 -20
0
50
6
8
100 TIME (h)
n=4
zyxwv 10 In t (s) 150
12
14
200
Figure 2.5 Avrami plot for a hypothetical crystallization process occurring in an amorphous material. The Avrami constants, n and k, can be derived from experimental data with linear regression as shown in the inset figure.
Equations (2.41) and (2.43) give the crystalline fraction as a function of time. Therefore, equation (2.38) can be rewritten into the form of equation (2.44), where k and n are constants. Equation (2.44) is equal to the Avrami equation (Avrami, 1940), which suggests that the increase of crystallinity as a function of time is described by a sigmoid curve in a plot of a against t similar to that shown in Figure 2.5. The Avrami equation can also be rewritten into the form of equation (2.45). Equation (2.45) suggests that a plot of ln[ln(1 - a ) ] against In t gives a straight line. The constants, n and k, correspond to the slope and intercept of the fine, respectively. Thus, the constants can be derived from experimental crystallization data as shown in the inset of Figure 2.5.
zyxwvuts
a
= 1 - e -lan
In[- In (1 - a ) ] - In k + n In t
(2.44) (2.45)
2. PhysicalState and MolecularMobility
47
The above derivation of the Avrami equation according to Sperling (1986) suggests that the value for n is 3 or 4. However, if crystallization is diffusion controlled other values may apply (Sperling, 1986). Typical values for n of polymers are within the range of 2 to 4.1 and the values for both k and n can be used in analyzing the crystallization mechanism of an amorphous polymer (Sperling, 1986). Sperling (1986) emphasized that the Avrami equation is valid only for low degrees of crystallinity and that the value for n may decrease with increasing crystallinity, which should be considered in applying the equation in modeling crystallization kinetics of amorphous food components and other biological materials.
References
zy
zyxwvut zyxwv
Allen, G. 1993. A history of the glassy state. Chpt. 1 in The Glassy State in Foods, ed. J.M.V. Blanshard and P.J. Lillford. Nottingham University Press, Loughborough, pp. 1-12. Angell, C.A., Bressel, R.D., Green, J.L., Kanno, H., Oguni, M. and Sare, E.J. 1994. Liquid fragility and the glass transition in water and aqueous solutions. J. Food Eng. 22: 115-142. Avrami, M. 1939. Kinetics of phase change. I. General theory. J. Chem. Phys. 7:11031112. Avrami, M. 1940. Kinetics of phase change. II. Transformation-time relations for random distribution of nuclei. J. Chem. Phys. 8: 212-224. Barker, R.E. and Thomas, C. R. 1964. Glass transition and ionic conductivity in cellulose acetate. J. Appl. Phys. 35: 87-94. Batzer, H. and Kreibich, U.T. 1981. Influence of water on thermal transitions in natural polymers and synthetic polyamides. Polym. Bull. 5: 585-590. Brennan, J.G., Butters, J.R., Cowell, N.D. and Lilly, A.E.V. 1990. Food Engineering Operations, 3rd ed. Elsevier, London. Couchman, P.R. and Karasz, F.E. 1978. A classical thermodynamic discussion of the effect of composition on glass transition temperatures. Macromolecules 11: 117-119. Doolittle, A.K. 1951. Studies in Newtonian flow. II. The dependence of the viscosity of liquids on free space. J. Appl. Phys. 22: 1471-1475. Elliott, S.R., Rao, C.N.R. and Thomas, J.M. 1986. The chemistry of the noncrystalline state. Angew. Chem. Int. Ed. Engl. 25:31-46. Ferry, J.D. 1980. Viscoelastic Properties of Polymers, 3rd ed. John Wiley & Sons, New York. Fox, T.G. and Flory, P.J. 1950. Second-order transition temperatures and related properties of polystyrene. I. Influence of molecular weight. J. Appl. Phys. 21:581-591. Flory, P.J. 1953. Principles of Polymer Chemistry. Cornell University Press, Ithaca, New York. Gordon, M. and Taylor, J.S. 1952. Ideal copolymers and the second-order transitions of synthetic rubbers. I. Non-crystalline copolymers. J. Appl. Chem. 2: 493-500.
48
Phase Transitionsin Foods
zyxwvut zyx
Hartel, R.W. and Shastry, A.V. 1991. Sugar crystallization in food products. Crit. Rev. Food Sci. Nutr. 30: 49-112. Hatley, R.H.M. and Mant, A. 1993. Determination of the unfrozen water content of maximally freeze-concentrated carbohydrate solutions. Int. J. Biol. Macromol. 15: 227-232. Levine, H. and Slade, L. 1986. A polymer physico-chemical approach to the study of commercial starch hydrolysis products (SHPs). Carbohydr. Polym. 6:213-244. Levine, H. and Slade, L. 1990. Influences of the glassy and rubbery states on the thermal, mechanical, and structural properties of doughs and baked products. Chpt. 5 in Dough Rheology and Baked Product Texture, ed. H. Faridi and J.M. Faubion. Van Nostrand Reinhold, New York, pp. 157-330. Lillford, P.J. 1988. The polymer/water relationship - its importance for food structure. Chpt. 6 in Food Structure - Its Creation and Evaluation, ed. J.M.V. Blanshard and J.R. Mitchell. Butterworths, London, pp. 75-92. Marsh, R.D.L. and Blanshard, J.M.V. 1988. The application of polymer crystal growth theory to the kinetics of formation of the fl-amylose polymorph in a 50% wheat-starch gel. Carbohydr. Polym. 9:301-317. Peleg, M. 1992. On the use of the WLF model in polymers and foods. Crit. Rev. Food Sci. Nutr. 32: 59-66. Perez, J. 1994. Theories of liquid-glass transition. J. Food Eng. 22:89-114. Roos, Y. 1993. Melting and glass transitions of low molecular weight carbohydrates. Carbohydr. Res. 238: 39-48. Roos, Y. and Karel, M. 1990. Differential scanning calorimetry study of phase transitions affecting the quality of dehydrated materials. Biotechnol. Prog. 6: 159-163. Roos, Y. and Karel, M. 1991a. Water and molecular weight effects on glass transitions in amorphous carbohydrates and carbohydrate solutions. J. Food Sci. 56: 1676-1681. Roos, Y. and Karel, M. 1991b. Nonequilibrium ice formation in carbohydrate solutions. Cryo-Lett. 12: 367-376. Roos, Y. and Karel, M. 1992. Crystallization of amorphous lactose. J. Food Sci. 57: 775777. Slade, L. and Levine, H. 1991. Beyond water activity: Recent advances based on an alternative approach to the assessment of food quality and safety. Crit. R ev. Food Sci. Nutr. 30:1 !5-360. Slade, L. and Levine, H. 1993. The glassy state phenomenon in food molecules. Chpt. 3 in The Glassy State in Foods, ed. J.M.V. Blanshard and P.J. Lillford. Nottingham University Press, Loughborough, pp. 35-101. Sperling, L.H. 1986. Introduction to Physical Polymer Science. John Wiley & Sons, New York. Tant, M.R. and Wilkes, G.L. 1981. An overview of the nonequilibrium behavior of polymer glasses. Polym. Eng. Sci. 21: 874-895. Van Hook, A. 1961. Crystallization. Theory and Practice. Reinhold, New York. White, G.W. and Cakebread, S.H. 1966. The glassy state in certain sugar-containing food products. J. Food Technol. 1: 73-82. Williams, M.L., Landel, R.F. and Ferry, J.D. 1955. The temperature dependence of relaxation mechanisms in amorphous polymers and other glass-forming liquids. J. Am. Chem. Soc. 77: 3701-3707.
CHAPTER 3
Methodology
I.
Introduction
zyxwvutsr
The physical states of food materials include crystalline and liquid states, and almost any combination of these two phases and volatile compounds. A food material may be a completely liquid or solid material, or it may contain a solid, crystalline phase and a liquid phase, which is typical of food fats. Most food solids are amorphous or partially crystalline materials. Native starch is an example of a partially crystalline material, which is composed of amorphous amylose and partially crystalline amylopectin. It is obvious that only food materials that are completely liquid or solid or composed of separate phases can exist in a thermodynamic equilibrium. A change in temperature of such materials may shift the equilibrium between the liquid and solid states. In amorphous food materials a change in temperature may result in glass transition. It is important to notice that changes between the amorphous and crystalline states may also occur as a function of time. Since food materials exist usually at a constant pressure, the most important
49
zy
50
Phase Transitionsin Foods
zyxwvut
parameters that affect their physical state, physicochemical properties, and transition temperatures are temperature, time, and water content. The physical state of food materials and transitions between various states can be determined with a number of methods that are commonly used to study the physical state and phase transitions of matter. The most important transitions that are related to food properties, quality, and stability occur between the solid and liquid states. These transitions include both the first-order crystallization and melting transitions and the second-order glass transition. Therefore, the methods used to study the physical state and physical properties and to detect both the first- and second-order transitions are discussed in this chapter.
II.
Determination of the Physical State
Most methods used in the characterization of the solid state are based on the detection of its structural properties such as the crystalline structure, which may be derived from X-ray diffraction studies. The amorphous states have no ordered structure and the physical state of amorphous materials is related to molecular mobility, which can be observed with such techniques as electron spin resonance (ESR) and nuclear magnetic resonance (NMR) spectroscopy.
A. Crystallinity
The crystalline state is the most ordered state of molecular arrangements. There are three fundamental laws of crystallinity, which reflect the wellorganized physical state of crystals. The fundamental laws are the law of constancy of interfacial angles, the law of rationality of indices, and the law of symmetry. The methods used to study crystallinity of various materials and polymers include microscopy, X-ray diffraction, electron diffraction, infrared absorption, and Raman spectra (Sperling, 1986). These methods and in particular microscopy and X-ray diffraction techniques have been used in observing crystallinity in food materials. 1. Microscopy Microscopic methods, i.e., optical microscopy and electron microscopy, are extremely useful in observing the physical state of food components such as
3. Methodology
51
zy
zyxw
starch and the microscopic structure of various food materials (Morris and Miles, 1994). Microscopic methods can also be used to study crystal morphology of food components and of ice in frozen foods. Microscopic methods are particularly useful in the observation of changes that may occur in crystal size and crystallinity in foods during storage.
a. Optical Microscopy. Several optical microscopic methods are available. They are based either on the observation of light transmission or reflection. Polarizing light microscopy uses light transmission and it can be used to observe crystallinity. A typical example is given by native starch granules that exhibit crystallinity under polarizing light microscopy, which disappears during gelatinization. Optical microscopes can also be used with a hot or cold stage that allows temperature control of the samples and examination of the temperature dependence of observed changes. Reflected light microscopy allows examination of surface properties of particles. A typical resolution limit of optical microscopy is about 1/2m. b. Electron Microscopy. Electron microscopy includes such techniques as conventional transmission electron microscopy (CTEM), high resolution electron microscopy (HREM), and scanning electron microscopy (SEM), which may be of either transmission or reflection design (Hermansson and Langton, 1994). The resolution limits of electron microscopy techniques vary from approximately 2/~ for HREM to about 100/~ for SEM. Reflection SEM is the main technique that has been used to observe the physical state and surface morphology of food materials and the microstructure of polymers. The SEM instruments use an electron beam that is scanned systematically over the material studied. The material emits X-rays and secondary electrons, which can be used to obtain information on chemical properties and to produce an image of the sample surface, respectively. SEM provides a valuable technique for the examination of surface properties and structure of a number of food materials. It has proved to be a particularly useful technique in the determination of the morphology of spraydried powders and changes in structure of other amorphous, low-moisture foods (Gejl-Hansen and Flink, 1977; Alexander and King, 1985). However, it should be noticed that amorphous food materials are extremely sensitive to humidity and temperature, and therefore special care must be taken in sample preparation and handling.
52
Phase Transitionsin Foods
zyxwvut
2. X-ray diffraction X-ray diffraction is probably the most important technique in observing properties of crystalline solid materials, polymers, and undoubtedly food materials. The technique has been traditionally used in observation and characterization of crystallinity and crystal structure of polymers (Sperling, 1986) but also of food materials such as starch (e.g., Zobel, 1988) and lipids (e.g., Chapman, 1965) and biopolymers (Clark, 1994). X-rays are electromagnetic radiation with a wavelength of about 1 ,~. They are produced when high energy particles such as electrons collide with matter. In X-ray diffraction studies X-rays are emitted from a radiation source to a sample of the material studied. The radiation is diffracted from the surfaces of the material. Such diffraction is analogous to the diffraction of light by an optical grating. According to Bragg's law the distance, d, between successive identical planes of atoms in a crystal is defined by equation (3.1), where X is the X-ray wavelength, 0 is the Bragg angle between the X-ray beam and the lattice planes, and n is any whole number. d =
n~,
(3.1)
2 sin 0
Bragg's law states that when reflected beams are in phase they interfere effectively. The basic principle of powder X-ray diffraction methods is shown in Figure 3.1. Diffraction of the X-rays occurs when the lattice planes are at the Bragg angle. Any set of lattice planes may then produce a surface of a cone that is formed by the diffracted radiation. The diffracted radiation can
X-ray source
Beam..__.._Ok. Sample
Figure 3.1 A schematic representation of the formation of a X-ray diffraction cone. Xrays are produced in a radiation source and they are transmitted to a powdered sample that has a random arrangementof crystals. Crystals that have planes oriented at the Bragg angle, 0, to the beam diffract the radiation effectively.The diffractedradiation can be detected using photographic film or a diffractometer.
3. Methodology
53
be detected using photographic film or a diffractometer. The X-ray diffraction pattern is produced on the film or the detected intensity of the diffracted radiation is plotted against 20. X-ray diffraction patterns are often considered as "fingerprints" of crystalline materials (West, 1987). X-ray diffraction patterns may also be used to obtain qualitative and quantitative information of the crystalline structure. In food applications X-ray diffraction patterns are extremely useful in the characterization of crystalline states and crystal structure in such materials as starch, amylose-lipid complexes, and sugars, and in the detection of crystallinity in partially amorphous food components. Obviously, amorphous food materials have no characteristic X-ray diffraction patterns. Electron and neutron diffraction methods are closely related to the X-ray methods. Electron diffraction can be used to study very small crystallites in polymers (Sperling, 1986). Instead of X-rays, the electron and neutron diffraction methods use electrons and neutrons as the radiation, respectively. Thus, the methods produce an electron or neutron diffraction pattern. A general description of the X-ray, electron, and neutron diffraction techniques can be found, e.g., in Willard et al. (1981), West (1987), and Clark (1994).
zy
zyxwvu
B. Molecular Mobility
Molecular mobility is significantly affected by temperature and phase transitions. Various spectroscopic methods are available for the examination of different types of molecular mobility. The methods apply the well known principle that materials may absorb or emit energy, which is often electromagnetic radiation. Some of the spectroscopic methods may also be used to evaluate crystallinity in polymers (Sperling, 1986). 1. Spectroscopic techniques Common spectroscopic techniques determine absorption or emission of electromagnetic radiation by the materials studied. The energy involved in such radiation can be related to its frequency, or wavelength. A plot showing the intensity of the absorbed or emitted radiation against the energy of the radiation gives the spectra that can be related to several types of mobility. Spectroscopic techniques use frequencies with the lower limit at the radiowave region up to the frequency range of X-ray radiation. The energy of electromagnetic radiation is given by equation (3.2).
54
Phase Transitionsin Foods
Nuclear spin transitions
Molecular rotations
Electron spin transitions NMR
zyxwvu
ESR MICROWAVE IR
I
f
Electronic transitions Molecular vibrations
I
I
I
3m
30mm 120~m
108
10l~ 2.5x10¹²
(Hz) E 4 x 10 -5 (kJ/mol)
VISIBLE UV
1.2 l.tm
2.5x10¹⁴
X-RAY
I
12 nm
I
0.1 nm
2.5x10¹⁶ 2.5x10¹⁸
zyxwvutsr 4 x 10 -3
1
102
104
10 6
Figure 3.2 Regions of electromagnetic spectrum that are used in spectroscopic techniques and the effects of radiation at various wavelengths, ~, frequencies,f, and energy, E, on mobility.
E = hf
(3.2)
Equation (3.2) states that the energy of electromagnetic radiation, E, is the product of the Planck's constant, h (6.6242 x 10 -34 J s), and frequency, f. The frequency of the radiation is related to the wavelength, X, and to the velocity of light, c (2.99776 x 10⁸ m/s), by c =fX. The effects of various frequencies on observed changes in matter are shown in Figure 3.2. It is obvious that at short wavelengths and high frequencies the radiation has a high energy, which may cause changes at the electronic level of atoms. The energy of the radiation decreases with decreasing frequency and increasing wavelength, resulting in various changes in vibrations, rotations, or transitions at the electronic, nuclear, or molecular level. Spectroscopic methods that have been used in the determination of molecular mobility in food materials include nuclear magnetic resonance (NMR) and electron spin resonance (ESR) spectroscopy. Infrared (IR) and Raman spectroscopy are frequently used in the determination of crystallinity and cross-linking in synthetic polymers (Sperling, 1986). According to West (1987) ultraviolet (UV) and visible (VIS) spectroscopy may be used to obtain information on the local structure of amorphous materials. Other spectroscopic techniques used to study glass transitions and their effects in food incredients and products have included Brillouin scattering, Fourier transform infrared (FTIR), phosphorescence, and Mossbauer spectroscopy (Slade and Levine, 1995).
3. Methodology
55
zy
2. Infrared and Raman spectroscopy IR and Raman spectra may be used to obtain information on crystallinity in food lipids (Chapman, 1965) and synthetic polymers (Sperling, 1986). However, their use in the analysis of crystallinity in other food materials has been limited. West (1987) pointed out that atoms in solids vibrate at frequencies of 1012 to 1013 Hz, which interfere with the electromagnetic radiation over the infrared range. The IR and Raman spectra are plots of intensity of IR absorption and scattering as a function of frequency or wavenumber, respectively. In infrared spectroscopy the frequency of the radiation is varied and the intensity of absorbed or transmitted radiation is determined. Raman spectroscopy uses monochromatic, preferably laser, light and its scatter by the sample material is determined. The scattered fight may be Rayleigh scatter that has the same energy and wavelength as the incident light or Raman scatter that has either longer or shorter wavelength than the incident light. The infrared spectra of semicrystalline polymers have "crystallizationsensitive bands" and the intensity of the bands may vary with the degree of crystallinity (Sperling, 1986). Polarized infrared spectra of oriented semicrystalline polymers give information about the molecular and crystal structure, while Raman spectroscopy may provide complementary information on S ~ S linkages in vulcanized rubber or conjugated linkages between carbon atoms (Sperling, 1986). Moreover, Raman spectroscopy may be used to study solid materials as well as liquids such as biopolymers that are solubilized in water, e.g., the technique can be used to obtain differences in disulfide linkages between solid biopolymers and those solubilized in water (Marshall, 1978). Raman spectroscopy has also been applied in the determination of crystallinity and rate of retrogradation in starch-water systems (Bulkin et al., 1987).
zyx
3. Nuclear magnetic resonance spectroscopy NMR involves the magnetic spin energy of atomic nuclei. Paramagnetic nuclei that have a nonzero nuclear spin such as 1H and 13C are influenced by an externally applied magnetic field at which they absorb radiation at the radiofrequency range of the electromagnetic spectra. Several variations of the technique such as pulsed NMR, pulsed field gradient NMR, cross-polarization magic angle spinning (CP MAS) NMR, and NMR imaging have been developed. A detailed description of the NMR spectroscopic techniques can be found in, e.g., Mehring (1983), Derome (1987), and Ernst et al. (1992).
56
Phase Transitionsin Foods
zyxwvut
NMR spectroscopy is used to measure absorption of radiofrequency energy by nuclear spins in the presence of an externally applied magnetic field. Nonzero spins as such are characterized by a magnetic field that is surrounding each nucleus and has a strength and direction, which are known as magnetic moment, ~. In the presence of an external magnetic field, H0, the nonzero spin nuclei become aligned or opposed with the field. The energy of the orientations are different and the nuclei aligned parallel to the field have a lower energy than those in the opposite position. The energy difference between the two states is defined by AE = 2P/-/0. The number of the nuclei at each energy state is dependent on the spin value of the nuclei. The spectra can be produced to show energy absorption against frequency of the electromagnetic radiation at fixed H0 or against H0 at fixed resonance frequency. In pulsed NMR a homogenous magnetic field is applied to the sample, which causes orientation of the nonzero spin nuclei. A pulse of electromagnetic radiation at the resonant frequency is applied at a correct angle to H0, which resuits in the alignment of all probed nuclei in a single direction. The pulse is defined in terms of the angle of magnetic rotation from H0. Discontinuation of the pulse allows the nuclei to relax in their original positions, which occurs through longitudinal or spin-lattice and transverse or spin-spin relaxation. Longitudinal relaxation is referred to with time constant, T1, which is a measure of energy exchange between nuclei and surrounding molecular environment and of the rate at which magnetization of the z vector component returns to the equilibrium state. Transverse relaxation time constant, T2, is related to the rate of decay of the magnetization in the xy plane and entropic processes of signal decay. The time constants may have the same value, but T2 is often less than T1 (Schmidt and Lai, 1991). Oscillation of magnetization of the nuclei in the xy plane results in an induced voltage in a receiver coil. A plot of voltage intensity of magnetization amplitude against time is called free induction decay (FID). The FID is related to the reciprocal of frequency and Fourier transformation can be used to obtain common NMR spectra showing the amplitude against frequency. NMR imaging uses the NMR spectroscopy to produce three-dimensional images of samples often by probing the 1H nuclei (Schmidt and Lai, 1991; McCarthy and McCarthy, 1994). NMR techniques are important in the determination of the physical state and molecular characteristics of almost any material, including polymers and food materials. Wide line NMR is one of the main techniques in the determination of solid fat contents in food lipids and it may be used to observe unfrozen water in frozen foods. The time constants are related to molecular mobility and physical state as shown in Figure 3.3. The main excellence of the NMR techniques is that they can differentiate motions of nuclei that are attached to or located near various chemical groups. In polymers the 1H NMR
zyxwvutsr
z 3. Methodology
I
I
t I I
I-. Z
t
IcO Z
0
r iii I-. Z
I I
0
X _.1 w
T2
liquid
zy
/zyxwvutsrqpo / I
Viscous
57
I I
Liquid
'Z/ t
I I
zyxwvutsrq I I I I I
I I I I I
I
I
1,...._ v
M O L E C U L A R MOBILITY OR T E M P E R A T U R E
Figure 3.3 Schematic representation of relationship between physical state, molecular mobility, and NMR relaxation time constants, T1 and T2. T1 shows a minimum for the most efficient relaxations that occur in the liquid state. The T2 has a limiting value for very slow relaxations in the solid state and it increases with increasing mobility above the limiting value. After Ablett et al. (1993).
line width has been shown to decrease within the glass transition temperature range (Sperling, 1986). The change in the NMR line width occurs due to the changes in mobility of the polymer molecules. At temperatures below Tg interactions between magnetic dipoles of different hydrogen nuclei are strong, which results in a broad signal. At temperatures above Tg the distribution of proton orientations becomes more random, which sharpens the NMR signal (Sperling, 1986). NMR was used by Abblett et al. (1993) to determine changes in molecular mobility, which occurred over the glass transition temperature range of food materials. The use of NMR techniques in the determination of molecular mobility and self-diffusion of molecules in various foods and food components in relation to water in foods was reviewed by Schmidt and Lai (1991). NMR and 13C solid state NMR as well as NMR imaging have proved to be promising and useful techniques in studies of crystallinity, molecular mobility, and physical state and phase transitions in foods (Ablett et al., 1993; Gidley et al., 1993; Willenbiicher et al., 1993; Kulik et al., 1994; McCarthy and McCarthy, 1994).
58
Phase Transitionsin Foods
zyxwvut
4. Electron spin resonance spectroscopy ESR spectroscopy is based on the absorption of electromagnetic radiation, which occurs in a magnetic field due to magnetic resonance of unpaired electrons such as those of spin-labeled radicals. As a spectroscopic technique ESR is closely related to NMR. However, the intensity of the electron magnetic resonance absorption is substantially higher than the absorption in NMR (Marshall, 1978). Moreover, the ESR spectra are usually shown as the first derivative of the absorption. The ESR technique may be used to observe mobility of probes incorporated in the material studied. Such probes are often nitroxide radicals and the ESR absorption of the unpaired electron of the probe can be detected. The nitroxide electron is magnetically anisotropic. It absorbs a different amount of energy when the N ~ O bond is aligned parallel than when the bond is perpendicular to the applied magnetic field (Marshall, 1978). Obviously, the ESR line shape changes due to the rotation of the radical. Therefore, the ESR line shape is sensitive to the rate of rotational reorientation of the spin-labeled nitroxide probes. The ESR line shape can be considered to be a result of the rates of reorientation of the spin-labeled probes. The difference in the energy between the two energy levels of the unpaired electrons is defined by equation (3.3), where g and 13are constants and H is the strength of the magnetic field. The g factor is a dimensionless constant and equal to 2.002319 for an unbound electron. The g factor is dependent on the chemical environment, but the value of the odd electron of organic compounds is often close to that of the free electron (Willard et al., 1981). AE = g~H
zyxwvu (3.3)
Absorption of energy by electrons occurs in an electromagnetic field when AE = hf, which allows reorientation of the electrons antiparallel to the magnetic field. Therefore, the absorption of energy in ESR as well as in NMR is a function of H. The first derivative of the absorbed energy is shown in ESR spectra at a fixed frequency as a function of magnetic field. Incorporation of stable spin-labeled probes into food matrices may be used to. study molecular mobility and the effect of the physical state on observed mobility. The information obtained reflects molecular mobility of the probe and the polarity of its environment (Simatos et al., 1981). The absorption lines are sharp and of equal height when molecular motion is fast, e.g., in liquid state with a correlation time, Zc, of less than 10 -11 s. In conventional ESR correlation times of 10-11 < ,t-c < 10-7 S can be determined. Saturation transfer ESR allows determination of slower motions of 10 -7 < Zc < 10 -3 s, which may occur in powders and solid materials (Le Meste et al., 1991). The sharp-
59
ness of the absorption lines decreases with decreasing mobility. Low mobility is characterized by broad ESR lines, which, however, remain at their original positions (Hemminga et al., 1993). Therefore, ESR can be used to observe changes in molecular mobility that occur at phase transition temperatures. In the solid state molecular mobility is low and the probes are highly immobilized. A change in phase due to melting of crystalline structure or due to glass transition increases the rotational freedom of the probes. Molecular mobility is related to viscosity and diffusion. It may be shown that molecular motions occur in three dimensions and the rotations observed with ESR can be related to rotational diffusion. The rotational diffusion coefficient can be derived from the ESR correlation time. The relationship between the correlation time and the rotational diffusion coefficient, Drot, i s given by equation (3.4).
1 6 ~c
Dr~ =
(3.4)
Molecular motions may be either translational or rotational. Both translational diffusion coefficients, Dtrans and D rot, a r e dependent on the friction coefficients, ftrans and frot, respectively. The relationships are given by equations (3.5) and (3.6), where k is the Boltzmann constant (k = R/N, 1.38048 x 10⁻²³ J/K, N = Avogadro's number), and T is absolute temperature.
kT Otran s
=
(3.5)
f trans
Dro t
kT =
~
(3.6)
f rot
The friction coefficients are functions of viscosity, 77. The friction coefficients for spherical molecules are given by equations (3.7) and (3.8), where r is the radius of the diffusing molecules. f trans =
6zqr
frot = 8zr/r3 ~:c =
VqC kT
zy
zyxwvut zyxwvu 3. Methodology
(3.7) (3.8) (3.9)
60
Phase Transitionsin Foods
zyxwvut zyxwvu
It is obvious that the ratio Dtrans/Drotis dependent on the size of the diffusing molecule. According to Le Meste et al. (1991) the above equations are applicable to macromolecules. When correlation times are defined in terms of viscosity and volume, V, for small diffusing molecules the relationships are defined by equation (3.9), where C is an additional coupling parameter. Molecular mobility and diffusion of reactants in food matrices are important in defining rates of various deteriorative changes. Le Meste et al. (1991) found that rotational mobilization of molecules as observed by ESR correlated with water activities that were assumed to allow sufficient solute mobility for chemical reactivity. It may also be expected that molecular mobilization temperatures that are observed by ESR correlate with phase transition temperatures. Le Meste et al. (1991) found that at low water contents the mobilization temperatures differed considerably from glass transition temperatures that were determined with differential scanning calorimetry (DSC). However, Bruni and Leopold (1991) used ESR to study glass transitions in soybean seeds. The temperature at which a change in Drot occurred was taken as Tg. Hemminga et al. (1993) observed a high correlation between the temperatures at which Vc of sucrose-water and maltodextrin-water mixtures decreased and the glass transition temperature. Some of the mixtures were studied in the freeze-concentrated state and it should be noticed that an increase in molecular mobility of freeze-concentrated solutions is probably affected by an increasing amount of unfrozen water above the transition temperature.
III.
Physical Properties and Transition Temperatures
Changes in physical state are observed from changes in the thermodynamic quantities, which can be measured with a number of techniques such as calorimetric techniques, dilatometry, and thermal analysis. The various spectroscopic methods are also applicable for the determination of transition temperatures. In addition to the changes in thermodynamic quantities and molecular mobility, phase transitions affect physicochemical properties including viscosity, viscoelastic properties, and dielectric properties.
A. Volumetric Changes
Phase transitions result in dimensional and volumetric changes that can be observed with such techniques as dilatometry and thermal mechanical analy-
3. Methodology
61
zy
sis (TMA). Dilatometry is used to measure the volume or length of a material as a function of temperature. TMA differs from dilatometry in that the measurement of length or volume is made under an applied tension or load (Wundeflich, 1990). 1. Changes at transition temperatures A change in phase at a constant pressure involves a change in volume. The change in volume in first-order transitions occurs at a constant temperature. In second-order transitions there is a change in the thermal expansion coefficient, a, at the transition temperature. The change in volume can be observed from dimensional changes or from a change in the thermal expansion coefficient that accompanies the phase transition. The thermal expansion coefficient defines a change in volume that is caused by a change in temperature according to equation (3.10).
I (OV~ a= F~,'--~j p
zyx
(3.10)
Volume in various phases and the effects of phase transitions on volume and thermal expansion are shown in Figure 3.4. The volume in the solid state is lowest for the crystalline material. A step change occurs at the first-order melting transition at Tm as the crystalline material is transformed into the liquid state. Therefore, the thermal expansion coefficient has an infinite value at Tin. The volume in the glassy state is higher than that of the crystalline state. A step change in a can be observed at Tg as the solid glass is transformed into the supercooled liquid state. It should be noticed that no change in a is observed at Tm as a supercooled liquid is heated to above Tm. 2. Dilatometry Dilatometry can be used to measure volume changes as a function of temperature. Dilatometry has been a common method in the determination of fat melting and solid fat content. The method can also be used to observe volume changes in polymers that occur due to glass transition (Sperling, 1986). Dilatometers are often made of glass and they consist of a capillary that is used for calibration and recording volume changes. The sample is placed in a bulb that is connected to a separate bulb, which contains a liquid such as mercury. The liquid is used to fill the instrument with sample. The apparatus is
62
Phase Transitionsin Foods
zyxwvut oo
J
s s
uJ
S
.~ .- "* "~s~.J
0>
~ ~
Liquid
~ liquid I I I
g
i
_O u_ u_
,s
.
J S
0. .._1
< "r" I-Z uJ
S
.~
i Superi cooled
I liquid Glass
I I I
/
zyxwvutsrq zyxwvu J
Liquid
S
S
o,a:
I SuperI
n
,a: o
i cooled i liquid
f2 and Tgl < Tg2 (1 and 2 refer to diluent and polymer, respectively). In foods the free volume of water is probably significantly higher than that of the amorphous solids. Water is also one of the lowest molecular weight plasticizers, with an extremely low Tg. The assumption that there is a linear additivity of the free volumes may be used in modeling plasticization and in particular the effect of composition on the Tg (Couchman, 1978; Ferry, 1980). Several food materials are partially
4. WaterandPhase Transitions
97
zy
zyxwv
crystalline and it should be noticed that water plasticization occurs only in the amorphous regions (Slade and Levine, 1991). In addition to water other low molecular weight food components may act as plasticizers within food solids. Buera et al. (1992) studied the effect of water and other plasticizers on the glass transition temperature of poly(vinylpyrrolidone) (PVP), which is often used as a model compound of biopolymers. A typical Tg increase of polymers with increasing molecular weight was observed. The Tg of PVP of various molecular weights decreased with increasing water content, but other compounds, including D-glucose, Dxylose, and L-lysine, which have been used as reactants in food models to study the rate of nonenzymatic browning (Karmas et al., 1992), were also found to plasticize PVP. It may be concluded that several compounds in foods may act as plasticizers and contribute to the physical state. The most important plasticizer, however, is water, which governs the workability and behavior of food materials in various processes and contributes to the shelf life of foods.
C. ice Formation and Freeze.Concentration
Freezing of water in foods below 0~ follows temperature depression and supercooling at temperatures below the initial, composition-dependent freezing temperature. Ice formation continues until the equilibrium amount of ice at the freezing temperature has been formed. The concomitant freeze-concentration increases viscosity of the remaining freeze-concentrated matrix that contains solutes and unfrozen water. Such freeze-concentrated materials may be considered to be composed of ice and solutes that are plasticized by the unfrozen water. 1. Equilibrium freezing Equilibrium ice formation may occur in solutions and in food materials below the initial melting temperature, provided that a driving force to the equilibrium state can be maintained without kinetic restrictions. Equilibrium freezing is typical of solutions which contain eutectic solutes, but it may proceed to some extent in supersaturated solutions.
a. Eutectic Solutions. Equilibrium ice formation may occur in solutions that show eutectic behavior. In such solutions the amount of ice formed below the equilibrium melting temperature is defined by the Tm curve that is
98
Phase Transitionsin Foods
Tm
zyxwvut ion
Saturated solution + precipitate
n-'< !--
olution 0
WEIGHT FRACTION OF SOLUTE
zyxwvuts
Figure 4.12 Ice formation in solutions below the freezing temperature of water.
shown in Figure 4.12. The maximum amount of ice is formed at the eutectic temperature, Te, i.e., all water freezes provided that the solute crystallizes into an anhydrous form. At higher temperatures the weight fraction of the solute in the freeze-concentrated unfrozen phase is obtained from the Tm curve. The amount of ice is the difference between the initial water content of the solution and the amount of water in the freeze-concentrated phase. According to Figure 4.12 a solution with an initial solute weight fraction, wi, being less than the solute weight fraction, WA, at temperature, TA, may become freeze-concentrated at TA. At TA an equilibrium amount of ice is formed and the weight fraction of the solute in the freeze-concentrated solute phase equals WA as defined by the point A on the Tm curve. Solutions with solute concentrations of We remain unfrozen at temperatures above Te and crystallize at temperatures below Te.
b. Supersaturated Solutions. Many food components, e.g., sugars, may become supersaturated in freeze-concentrated solutions. Supersaturation occurs also in foods, which contain complex mixtures of solutes. As shown in Figure 4.12 ice formation at temperatures above Te occurs only to the extent defined by the freezing temperature. However, at temperatures below Te if the solutes remain in the unfrozen solution ice formation may proceed according to the extended Tm curve. Such solutions contain ice and a supersatu-
4. Waterand Phase Transitions
99
zy
rated unfrozen phase. Foods with supersaturated solutes may show solute crystallization during frozen storage such as lactose crystallization in ice cream. 2. Nonequilibrium freezing Nonequilibrium ice formation is a typical phenomenon of rapidly cooled carbohydrate solutions and probably the most common form of ice formation in foods and other biological materials at low temperatures. One of the first studies reporting nonequilibrium freezing phenomena in frozen foods was that of Troy and Sharp (1930). They found that rapid freezing of ice cream caused concentration of lactose solution and at sufficiently low temperatures lactose crystallization was avoided. Rey (1960) used thermal analysis to study thermal behavior of frozen solutions. Various solutes, e.g., glycerol, in water were found to remain noncrystalline at low temperatures. Rey (1960) concluded that freeze-concentration and lowering of temperature increased viscosity of the unfrozen phase until the unfrozen, concentrated solution became a glass. He also pointed out that rapidly cooled materials can be rewarmed to a devitrification temperature to allow ice formation. The existence of dissolved lactose within a freeze-concentrated glass in ice cream was also suggested by White and Cakebread (1966). Luyet and Rasmussen (1968) found that glass transition temperatures of rapidly cooled solutions of glycerol, ethylene glycol, glucose, and sucrose increased with increasing solute concentration, but no eutectic freezing or melting was observed. They established phase diagrams that showed thermal transitions occurring in such solutions at low temperatures. The phase diagrams contained data on glass transition, devitrification (ice formation during warming of a frozen solution), and ice melting temperatures as a function of concentration. The glass transition temperatures of slowly frozen samples were higher than those of rapidly cooled samples and they occurred at an initial concentration-independent temperature (Rasmussen and Luyet, 1969). This transition was considered to be the glass transition of the freezeconcentrated solutes. Rasmussen and Luyet (1969) reported temperature values for two other initial concentration-independent transitions, which occurred above the glass transition and which were referred to as Tam (antemelting) and Tim (incipient melting). Several sugars form freeze-concentrated amorphous matrices (Bellows and King, 1973) and the transitions reported by Rasmussen and Luyet (1969) are typical of frozen biological and food materials (Simatos and Turc, 1975). Franks et al. (1977) referred
zyx
100
PhaseTransitionsin Foods
~~.. w
TA
< n~ w o. w l-
I r n T' .
zyx zyxwvutsr
Solution ~ A
.
.
.
II. . . .
/
Saturated solution+ precipitate
/
~_ Nonequilibriumiceformation--J g
0
wAc~eandglass1~C'g
rg
Glass "
WEIGHTFRACTIONOFSOLUTE
zyxwvu
Figure 4.13 Schematic representation of nonequilibrium ice formation in frozen solutions and foods. Ice formation above the melting temperature of ice in contact with the maximally freeze-concentratedsolution, T~n,proceeds to an equilibrium extent determined by the equilibrium melting temperature, Tin, curve. Solutions cooled rapidly to temperatures lower than the glass transition temperatureof the maximallyfreeze-concentratedsolute matrix, Tg, show nonequilibrium ice formation. The amount of ice formed is defined by the glass transition, Tg, curve, since ice formation ceases at temperatures below the Tg of the unfrozen solute matrix. Maximum ice formation, i.e., formation of an unfrozen solute phase with solute concentration equal to Cg ' occurs at Tg < T < T"m "
to the glass transition of freeze-concentrated solutes with the symbol Tg. Levine and Slade (1986) defined Tam and Tim to be the onset and completion, respectively, of a single thermal event that was referred to as the glass transition of the freeze-concentrated solute matrix surrounding the ice crystals in a maximally frozen solution, Tg. Roos and Karel (199 la) suggested that formation of such maximally frozen solutions with solute concentrations in t the unfrozen matrix equal to Cg, as shown in Figure 4.13, requires annealing slightly below the initial ice melting temperature within the maximally frozen solution. Indeed, such annealed solutions show a glass transition that corresponds to that reported by Rasmussen and Luyet (1969) and onset for ice melting at Tam. Roos and Karel (1991a) considered these transitions to be the glass transition of the maximally freeze-concentrated ? ? matrix, T g, and onset of ice melting, T m. A schematic description of ice formation in noneutectic solutions is shown in Figure 4.13. At temperatures above Tm the equilibrium amount of ice is formed. A solution that is cooled rapidly with no ice formation to a
zy zyxwvut 4. Water and Phase Transitions
101
temperature below Tg becomes a glass. The high viscosity of the glassy material does not allow sufficient molecular motion of water required for crystallization. At temperatures above Tg but below Tg a nonequilibrium amount of ice is formed as defined by the Tg curve, since ice formation ceases as the concentration of the freeze-concentrated solute matrix approaches that of a solution with Tg at the same temperature. Consequently the maximum amount of ice may form only at temperatures higher than Tg but lower than T m. It should be noticed that the glass transition occurs over a temperature range with a concomitant dramatic decrease of viscosity. The viscosity at the onset of glass transition indicated by T~ in Figure 4.13 is probably close to that of a glass (1012 Pa s). The viscosity above Tg may be assumed to decrease according to the WLF relationship (Levine and Slade, 1986). Luyet and Rasmussen (1967; Rasmussen and Luyet, 1969) observed that ice formation in rapidly cooled solutions occurred at about a constant temperature above Tg of the solution. They suggested that the viscosity limit for ice formation was 108 Pa s. Roos and Karel (199 l a) suggested that the viscosity of maximally freeze-concentrated sucrose solutions at T m was 107.4 Pa s. Therefore, T m occurs in the vicinity of Tg and the temperatures may by defined to be equal according to the interpretation of Levine and Slade (1986), as was also suggested by Ablett et al. (1992a, 1993). However, the definition of Tg to be the onset of the glass transition and locating Tm at the onset temperature of ice melting allows separation of the two phenomena from each other. Such definition also allows evaluation of time-dependent phenomena within the glass transition but below Tm, e.g., formation of the maximally freezeconcentrated solute matrix. Considering that ice melting occurs above T m is extremely important in the analysis of rates of various kinetic phenomena above T m (Kerr and Reid, 1994). P
P
P
t
p
3. State diagrams State diagrams are simplified phase diagrams that describe the concentration dependence of the glass transition temperature of solutes or food solids and relationships between ice formation and solute concentration at low temperatures. State diagrams are useful in the characterization of the physical state of food solids at various temperatures and water contents. Rasmussen and Luyet (1969) used phase diagrams to show the concentration-dependence of the thermal transitions of frozen solutions. Such phase diagrams, which were similar to the schematic phase diagram showing nonequilibrium ice formation in Figure 4.13 characterize rate-controlled phenomena. Therefore, Franks et al. (1977) stressed that the term state
102
PhaseTransitionsin Foods
Solution Tm mmm rr" CD
~/Supersaturated liquid state
~'~m
rg
Trn Partialfreeze-concentration
rr" mmm n
Maximum ice formation
imm !--
Glass Ice and glass
zyxw zyxwvutsr Glass
0
WEIGHT FRACTION OF SOLIDS
Lq
1
Figure 4.14 A schematic state diagram typical of food solids. Glass transition temperature, Tg, decreases with an increasing water content due to plasticization. Ice formation occurs in solutions with initial solute concentrations that are lower than the solute concentration in the maximally freeze-concentrated solute matrix, C"g," The maximally freeze-concentrated solute matrix has the onset of glass transition at Tg and ice melting occurs at temperatures above Tm.
should be used instead of phase due to the nonequilibrium nature of the physical state of freeze-concentrated biological materials. State diagrams have been used by Levine and Slade (1988c) to characterize effects of frozen storage temperature on food quality. According to Roos and Karel (19910 state diagrams are useful in characterization of physical properties and stability of food materials both in processing and storage. State diagrams have been established for a number of food components, e.g., sucrose (Blanshard and Franks, 1987), various sugars and starch (van den Berg, 1986; Roos and Karel, 1991e,f; Roos, 1993b), cereal proteins (de Graaf et al., 1993), and milk powders (Jouppila and Roos, 1994). A schematic state diagram typical of food components and foods is shown in Figure 4.14. The solute concentration of the maximally freeze-concentrated solute matrix may be obtained with various methods. Levine and Slade (1986) have suggested the determination of the latent heat of ice melting for 20% (w/w) solutions with DSC. The method allows calculation of the
zy zyxw
4. WaterandPhase Transitions
103
amount of ice in the sample based on the assumption that the latent heat of ice melting in the food is equal to that of pure water. Cgt is then obtained from the difference between total water content and the amount of ice in the sample, provided that no solute crystallization has occurred. The unfrozen water content may also be estimated by the determination of latent heat for ice melting in samples having various initial water contents. The latent heat of melting divided by the weight of solids is plotted against the initial water content and the straight line obtained is extrapolated to zero latent heat, which gives the amount of unfrozen water (Simatos et al., 1975; Blond, 1989; Roos, 1992). Ablett et al. (1992) showed that the true value of Cg may be obtained with DSC only when the temperature dependence of the latent heat of melting is considered together with a proper heat capacity correction for the samples. The most precise Cg values can be derived from state diagrams established with experimental Tg data for a number of solute concentrations (Roos and Karel, 1991a). The solute concentration of maximally freezeconcentrated solute matrices has been found to be about 80% (w/w) for most food components (Ablett et al., 1992; Roos, 1993b). State diagrams are important tools in establishing proper processing and storage conditions for dehydrated and frozen foods. They can be also applied in evaluating amounts of ice in biological materials at various temperatures, which is extremely important in cryopreservation. State diagrams can also be used to define proper freeze-drying conditions and to define proper processing and storage conditions for dehydrated foods.
References
Ablett, A., Izzard, M.J. and Lillford, P.J. 1992. Differential scanning calorimetric study of frozen sucrose and glycerol solutions. J. Chem. Soc., Faraday Trans. 88: 789-794. Ablett, S., Izzard, M.J., Lillford, P.J., Arvanitoyannis, I. and Blanshard, J.M.V. 1993. Calorimetric study of the glass transition occurring in fructose solutions. Carbohydr. Res. 246: 13-22. Angell, C.A. 1983. Supercooled water. Annu. Rev. Phys. Chem. 34: 593-630. Angell, C.A. and Tucker, J.C. 1980. Heat capacity changes in glass-forming aqueous solutions and the glass transition in vitreous water. J. Phys. Chem. 84: 268-272. Angell, C.A., Bressel, R.D., Green, J.L., Kanno, H., Oguni, M. and Sare, E.J. 1994. Liquid fragility and the glass transition in water and aqueous solutions. J. Food Eng. 22: 115-142. Bellows, R.J. and King, C.J. 1973. Product collapse during freeze drying of liquid foods. AIChE Symp. Ser. 69(132): 33-41.
Biliaderis, C.G. 1991. The structure and interactions of starch with food constituents. Can. J. Physiol. Pharmacol. 69: 60-78.
104
PhaseTransitions in Foods
zyxwvuts zy
Biliaderis, C.G., Page, C.M., Maurice, T.J. and Juliano, B.O. 1986. Thermal characterization of rice starches: A polymeric approach to phase transitions of granular starch. J. Agric. Food Chem. 34: 6-14. Blanshard, J.M.V. and Franks, F. 1987. Ice crystallization and its control in frozen-food systems. Chpt. 4 in Food Structure and Behaviour, ed. J.M.V. Blanshard and P. Lillford. Academic Press, London, pp. 51-65. Blond, G. 1989. Water-galactose system: Supplemented state diagram and unfrozen water. Cryo-Lett. 10: 299-308. Brunauer, S., Emmett, P.H. and Teller, E. 1938. Adsorption of gases in multimolecular layers. J. Am. Chem. Soc. 60:309-319. Buera, M.P., Levi, G. and Karel, M. 1992. Glass transition in poly(vinylpyrrolidone): Effect of molecular weight and diluents. Biotechnol. Prog. 8: 144-148. Chan, R.K., Pathmanathan, K. and Johari, G.P. 1986. Dielectric relaxations in the liquid and glassy states of glucose and its water mixtures. J. Phys. Chem. 90: 6358-6362. Chandrasekaran, S.K. and King, C.J. 1971. Solid-liquid phase equilibria in multicomponent aqueous sugar solutions. J. Food Sci. 36: 699-704. Chen, C.S. 1985. Thermodynamic analysis of the freezing and thawing of foods: Enthalpy and apparent specific heat. J. Food Sci. 50:1158-1162. Chirife, J. and Iglesias, H.A. 1978. Equations for fitting water sorption isotherms of foods: Part 1 - A review. J. Food Technol. 13: 159-174. Cocero, A.M. and Kokini, J.L. 1991. The study of the glass transition of glutenin using small amplitude oscillatory rheological measurements and differential scanning calorimetry. J. Rheol. 35: 257-270. Couchman, P.R. 1978. Compositional variation of glass-transition temperatures. 2. Application of the thermodynamic theory to compatible polymer blends. Macromolecules 11: 1156-1161. de Graaf, E.F., Madeka, H., Cocero, A.M. and Kokini, J.L. 1993. Determination of the effect of moisture on gliadin glass transition using mechanical spectrometry and differential scanning calorimetry. Biotechnol. Prog. 9: 210-213. Donovan, J.W. 1979. Phase transitions of the starch-water system. Biopolymers 18: 263275. Ellis, T.S. 1988. Moisture-induced plasticization of amorphous polyamides and their blends. J. Appl. Polym. Sci. 36:451-466. Fennema, O.R. 1973. Solid-liquid equilibria. Chpt. 3 in Low-Temperature Preservation of Foods and Living Matter, ed. O.R. Fennema, W.D. Powrie and E.H. Marth. Marcel Dekker, New York, pp. 101-149. Fennema, O.R. 1985. Water and ice. Chpt. 2 in Food Chemistry, ed. O.R. Fennema, 2nd ed. Marcel Dekker, New York, pp. 23-67. Ferry, J.D. 1980. Viscoelastic Properties of Polymers. 3rd ed. John Wiley & Sons, New York. Flory, P.J. 1953. Principles of Polymer Chemistry. Cornell University Press, Ithaca, N Y. Franks, F., Asquith, M.H., Hammond, C.C., Skaer, H.B. and Echlin, P. 1977. Polymeric cryoprotectants in the preservation of biological ultrastructure I. Low temperature states of aqueous solutions of hydrophilic polymers. J. Microsc. (Oxford) 110: 223-238. Greenspan, L. 1977. Humidity fixed points of binary saturated aqueous solutions. J. Res. Natl. Bur. Stand., Sect. A 81A: 89-96. Hallbrucker, A., Mayer, E., and Johari, G.P. 1989a. Glass-liquid transition and the enthalpy of devitrification of annealed vapor-deposited amorphous solid water. A comparison with hyperquenched glassy water. J. Phys. Chem. 93: 4986-4990.
4. WaterandPhase Transitions
105
Hallbrucker, A., Mayer, E. and Johari, G.P. 1989b. Glass transition in pressure-amorphized hexagonal ice. A comparison with amorphous forms made from the vapor and liquid. J. Phys. Chem. 93:7751-7752. Hartel, R.W. 1992. Evaporation and freeze concentration. Chpt. 8 in Handbook of Food Engineering, ed. D.R. Heldman and D.B. Lund. Marcel Dekker, New York, pp. 341392. Heldman, D. R. 1992. Food freezing. Chpt. 6 in Handbook of Food Engineering, ed. D.R. Heldman and D.B. Lund. Marcel Dekker, New York, pp. 277-315. Heldman, D.R. and Singh, R.P. 1981. Food Process Engineering. 2nd ed. AVI Publishing Co., Westport, CT. Hugot, E. 1986. Handbook of Cane Sugar Engineering, 3rd ed. Elsevier, Amsterdam. Iglesias, H.A. and Chirife, J. 1982. Handbook of Food Isotherms. Academic Press, New York. Jenniskens, P. and Blake, D.F. 1994. Structural transitions in amorphous water ice and astrophysical implications. Science 265: 753-756. Johari, G.P., Hallbrucker, A. and Mayer, E. 1987. The glass-liquid transition of hyperquenched water. Nature 330: 552-553. Johari, G.P., Hallbrucker, A. and Mayer, E. 1990. Calorimetric study of pressure-amorphized cubic ice. J. Phys. Chem. 94: 1212-1214. Jouppila, K. and Roos, Y.H. 1994. Glass transitions and crystallization in milk powders. J. Dairy Sci. 77: 2907-2915. Karmas, R., Buera, M.P. and Karel, M. 1992. Effect of glass transition on rates of nonenzymatic browning in food systems. J. Agric. Food Chem. 40: 873-879. Kerr, W.L. and Reid, D.S. 1994. Temperature dependence of the viscosity of sugar and maltodextrin solutions in coexistence with ice. Lebensm.-Wiss. u. -Technol. 27: 225231. Labuza, T.P. 1968. Sorption phenomena in foods. Food Technol. 22: 263-265, 268, 270, 272. Labuza, T.P. 1980. The effect of water activity on reaction kinetics of food deterioration. Food Technol. 34(4): 36-41, 59. Labuza, T.P., Tannenbaum, S.R. and Karel, M. 1970. Water content and stability of lowmoisture and intermediate-moisture foods. Food Technol. 24: 543-544, 546-548, 550. Labuza, T.P., Kaanane, A. and Chen, J.Y. 1985. Effect of temperature on the moisture sorption isotherms and water activity shift of two dehydrated foods. J. Food Sci. 50: 385-391. Laine, M.J.K. and Roos, Y. 1994. Water plasticization and recrystallization of starch in relation to glass transition. In Proceedings of the Poster Session, International Symposium on the Properties of Water, Practicum H, ed. A. Argaiz, A. L6pez-Malo, E. Palou and P. Corte. Universidad de las Am6ricas-Puebla, pp. 109-112. Larsen, B.L., Rasmussen, P. and Fredenslund, A. 1987. A modified UNIFAC group-contribution model for prediction of phase equilibria and heats of mixing. Ind. Eng. Chem. Res. 26: 2274-2286. Lelievre, J. 1976. Theory of gelatinization in a starch-water-solute system. Polymer 17: 854-858. Levine, H. and Slade, L. 1986. A polymer physico-chemical approach to the study of commercial starch hydrolysis products (SHPs). Carbohydr. Polym. 6: 213-244. Levine, H. and Slade, L. 1988a. Principles of "cryostabilization" technology from structure/property relationships of carbohydrate/water systems. Cryo-Lett. 9:21-63.
zy zy
106
PhaseTransitionsin Foods
zyxwvut zyxw
Levine, H. and Slade, L. 1988b. 'Collapse' phenomena - A unifying concept for interpreting the behaviour of low moisture foods. Chpt. 9 in Food Structure - Its Creation and Evaluation, ed. J.M.V. Blanshard and J.R. Mitchell. Butterworths, London, pp. 149-180. Levine, H. and Slade, L. 1988c. Thermomechanical properties of small-carbohydrate-glasses and 'rubbers.' J. Chem. Soc., Faraday Trans. 1, 84: 2619-2633. Luyet, B. and Rasmussen, D. 1967. Study by differential thermal analysis of the temperatures of instability in rapidly cooled solutions of polyvinylpyrrolidone. Biodynamica 10(209): 137-147. Luyet, B. and Rasmussen, D. 1968. Study by differential thermal analysis of the temperatures of instability of rapidly cooled solutions of glycerol, ethylene glycol, sucrose and glucose. Biodynamica 10(211): 167-191. Maurice, T.J., Slade, L., Sirett, R.R. and Page, C.M. 1985. Polysaccharide-water interactions - thermal behavior of rice starch. In Properties of Water in Foods, ed. D. Simatos and J.L. Multon. Martinus Nijhoff Publishers, Dordrecht, the Netherlands, pp. 211-227. Peleg, M. 1988. An empirical model for the description of moisture sorption curves. J. Food Sci. 53: 1216-1217, 1219. Peleg, M. 1993. Assessment of a semi-empirical four parameter general model for sigmoid moisture sorption isotherms. J. Food Process Eng. 16:21-37. Perry, R.H. and Green, D. 1984. Perry's Chemical Engineers' Handbook, 6th ed. McGrawHill, New York. Pham, Q.T. 1987. Calculation of bound water in frozen food. J. Food Sci. 52: 210-212. Pongsawatmanit, R. and Miyawaki, O. 1993. Measurement of temperature-dependent ice fraction in frozen foods. Biosci. Biotechnol. Biochem. 57: 1650-1654. Rasmussen, D. and Luyet, B. 1969. Complementary study of some nonequilibrium phase transitions in frozen solutions of glycerol, ethylene glycol, glucose and sucrose. Biodynamica 10(220): 319-331. Rasmussen, D.H. and MacKenzie, A.P. 1971. The glass transition in amorphous water. Application of the measurements to problems arising in cryobiology. J. Phys. Chem. 75: 967-973. Resnik, S.L. and Chirife, J. 1988. Proposed theoretical water activity values at various temperatures for selected solutions to be used as reference sources in the range of microbial growth. J. Food Prot. 51: 419-423. Rey, L.R. 1960. Thermal analysis of eutectics in freezing solutions. Ann. N.Y. Acad. Sci. 85:510-534. Roos, Y.H. 1992. Phase transitions and transformations in food systems. Chpt. 3 in Handbook of Food Engineering, ed. D.R. Heldman and D.B. Lund. Marcel Dekker, New York, pp. 145-197. Roos, Y. H. 1993a. Water activity and physical state effects on amorphous food stability. J. Food Process. Preserv. 16: 433-447. Roos, Y. 1993b. Melting and glass transitions of low molecular weight carbohydrates. Carbohydr. Res. 238: 39-48. Roos, Y. and Karel, M. 1991a. Amorphous state and delayed ice formation in sucrose solutions. Int. J. Food Sci. Technol. 26: 553-566. Roos, Y. and Karel, M. 1991b. Phase transitions of mixtures of amorphous polysacchatides and sugars. Biotechnol. Prog. 7: 49-53. Roos, Y. and Karel, M. 199 lc. Plasticizing effect of water on thermal behavior and crystallization of amorphous food models. J. Food Sci. 56: 38-43.
4. WaterandPhase Transitions
107
Roos, Y. and Karel, M. 1991d. Nonequilibrium ice formation in carbohydrate solutions. Cryo-Lett. 12: 367-376. Roos, Y. and Karel, M. 1991e. Water and molecular weight effects on glass transitions in amorphous carbohydrates and carbohydrate solutions. J. Food Sci. 56: 1676-1681. Roos, Y. and Karel, M. 1991f. Applying state diagrams to food processing and development. Food Technol. 45(12): 66, 68-71,107. Schwartzberg, H.G. 1976. Effective heat capacities for the freezing and thawing of food. J. Food Sci. 41: 152-156. Simatos, D. and Blond, G. 1993. Some aspects of the glass transition in frozen foods systems. Chpt. 19 in The Glassy State in Foods, ed. J.M.V. Blanshard and P.J. Lillford. Nottingham University Press, Loughborough, pp. 395-415. Simatos, D. and Turc, J.M. 1975. Fundamentals of freezing in biological systems. Chpt. 2 in Freeze Drying and Advanced Food Technology, ed. S.A. Goldblith, L. Rey and W.W. Rothmayr. Academic Press, New York, pp. 17-28. Simatos, D., Faure, M., Bonjour, E. and Couach, M. 1975. The physical state of water at low temperatures in plasma with different water contents as studied by differential thermal analysis and differential scanning calorimetry. Cryobiology 12: 202-208. Slade, L. and Levine, H. 1989. A food polymer science approach to selected aspects of starch gelatinization and retrogradation. In Frontiers in Carbohydrate Research - 1: Food Applications, ed. R.P. Millane, J.N. BeMiller and R. Chandrasekaran. Elsevier, London, pp. 215-270. Slade, L. and Levine, H. 1991. Beyond water activity: Recent advances based on an alternative approach to the assessment of food quality and safety. Crit. Rev. Food Sci. Nutr. 30:115-360. Sugisaki, M., Suga, H. and Seki, S. 1968. Calorimetric study of the glassy state. IV. Heat capacities of glassy water and cubic ice. Bull. Chem. Soc. Jpn. 41:2591-2599. Troy, H.C. and Sharp, P.F. 1930. ~ and/3 lactose in some milk products. J. Dairy Sci. 13: 140-157. van den Berg, C. 1981. Vapour sorption equilibria and other water-starch interactions; a physico-chemical approach. Ph.D thesis, Agricultural University Wageningen, the Netherlands. van den Berg, C. 1986. Water activity. In Concentration and Drying of Foods, ed. D. MacCarthy. Elsevier, Amsterdam, pp. 11-36. van den Berg, C. and Bruin, S. 1981. Water activity and its estimation in food systems: Theoretical aspects. In Water Activity: Influences on Food Quality, ed. L.B. Rockland and G.F. Stewart. Academic Press, New York, pp. 1-61. van den Berg, C., Kaper, F.S., Weldring, J.A.G. and Wolters, I. 1975. Water binding by potato starch. J. Food Technol. 10: 589-602. Weast, R.C. 1986. CRC Handbook of Chemistry and Physics, 67th ed. CRC Press, Boca Raton, FL. White, G.W. and Cakebread, S.H. 1966. The glassy state in certain sugar-containing food products. J. Food Technol. 1: 73-82. Whittam, M.A., Noel, T.R. and Ring, S.G. 1990. Melting behaviour of A- and B-type crystalline starch. Int. J. Biol. Macromol. 12: 359-362. Wolf, W., Spiess, W.E.L. and Jung, G. 1985. Standardisation of isotherm measurements (COST-project 90 and 90 bis). Properties of Water in Foods, ed. D. Simatos and J.L. Multon. Martinus Nijhoff Publishers, Dordrecht, the Netherlands, pp. 661-679. Young, F.E. and Jones, F.T. 1949. Sucrose hydrates. The sucrose-water phase diagram. J. Phys. Colloid Chem. 53: 1334-1350.
zy zy
zyxwvutsr
This Page Intentionally Left Blank
CHAPTER 5
Food Components and Polymers
I.
Introduction
zyxwvutsr
Phase transitions of food components are likely to alter the physical properties of food materials. Foods are complicated systems, but their physical state is usually governed by phase transitions of the main components, i.e., carbohydrates, lipids, proteins, and water. The phase transition behavior of food solids has similarities with that of synthetic polymers. However, in foods water is probably the most significant compound and diluent, which may significantly affect the physical state and properties of other component compounds. Various first- and second-order phase transitions in food materials may occur during a number of processes, storage, and distribution. Food materials that are rich in water obviously become solid at freezing temperatures. The physical state of oils and spreads at various temperatures is dependent on the location of melting temperatures, which is an extremely important quality attribute. The relationships between food properties and the physical state are complicated. The physical state of foods may be difficult to detect and it is 109
110
Phase Transitionsin Foods
zyxwvut
often extremely sensitive to temperature, time, and water. The main constituents of foods may exist in the liquid state or in the solid crystalline or amorphous noncrystalline state. Many of the component compounds, e.g., sugars, fats, and water, in their chemically pure form, crystallize below the equilibrium melting temperature. However, the large number of chemical compounds within food solids does not always allow the formation of such highly ordered equilibrium states. Phase transitions of food components, which often occur during various processes and storage, are emphasized in this chapter. Foods can seldom be considered as being equilibrium systems, which makes their phase behavior complicated and time-dependent.
II.
Carbohydrates
Carbohydrates are present in almost all foods. Phase transitions of low molecular weight sugars as well as those of carbohydrate polymers are extremely important to food properties. Chemically pure low molecular weight sugars may exist in the crystalline state, but the formation of equilibrium structures in foods is often restricted. However, carbohydrates may exist as crystalline compounds, semicrystalline compounds, partially crystalline compounds, or totally amorphous compounds. First-order phase transitions of carbohydrates in foods include melting and crystallization, and gelatinization of starch. Transitions between the nonequilibfium and equilibrium states are particularly important to the stability of carbohydrate foods with low water contents.
A. Sugars
The phase behavior of sugars is important in manufacturing of various sweet foods. Phase transitions of sugars in such foods may affect their behavior in the manufacturing processes and quality changes during storage. Numerous examples of sweet foods include candies, confectionery, bakery products, and almost all food materials that contain sugar. Phase transitions of sugars are also important in freezing processes and to frozen food stability. Moreover, phase transitions of sugars are related to their ability to act as cryoprotectants or cryopreservafives. The physical properties of sugars in the
5. FoodComponentsand Polymers
111
zy
frozen state are particularly important to the stability of ice cream and frozen desserts. 1. Melting and crystallization Melting and crystallization are opposite phenomena, which depend on several factors. Melting and crystallization temperatures of sugars are sensitive to water, which affects the crystallization and melting transition temperatures of sugars in most foods. Sugars may also crystallize as hydrates, which may show phase behavior significantly different from that of the anhydrides. In addition physicochemical properties of sugar anomers may differ. Melting of crystalline sugars occurs when they are heated to above their melting temperature, although some sugars may caramelize and brown concomitantly with the melting process. Caramelization occurs especially in sugars that have melting temperatures above 150~ Carbohydrates with melting temperatm'es well above 200~ tend to decompose before melting occurs. Such decomposition may be observed from thermogravimetric measurements or DSC curves that suggest chemical changes over the temperature range from 200 to 400~ (e.g., Pavlath and Gregorski, 1985). Sugars do not have exact melting temperatures and their melting proceeds over a temperature range. Therefore, literature values for melting temperatures of sugars may slightly differ. Melting temperatures, T m, and heats of fusion, AHf, for sugars are given in Table 5.1. The melting temperatures and heats of fusion may be determined with DSC. Melting endotherms of sugars occur over the melting temperature range and they are fairly broad. Integration of the melting endotherm can be used to obtain AHf. It is important to notice that both Tm and AHfmay slightly differ between sugar anomers. The melting temperatures and heats of fusion are significantly decreased by water in hydrates. Generally melting temperatures of sugars increase with increasing molecular weight in the order monosaccharides < disaccharides < oligosaccharides. Crystallization of sugars may occur at temperatures below their melting temperature. However, a sufficiently rapid cooling of a sugar melt results in the formation of amorphous sugar melts that solidify below the glass transition temperature. The presence of water may enhance crystallization of sugar melts and especially crystallization of sugars that form hydrates. Crystallization of sugars occurs usually from supersaturated solutions. According to Hartel and Shastry (1991) crystallization occurs only when supersaturation exceeds some critical value. Such behavior is related to the energy needed for the formation of critical nuclei and formation of the solid phase. The solubility of sugars in water increases with increasing temperature
zyxwv
112
Phase Transitionsin Foods
100 8O
60
zyxwvutsr
zyxwvut 9
.-"
9
.J
m 40 _J
0
20
-
9
9
,= == == ==~ ~
9
,
,
I
20
,
,
~
,
(~.L~G~. kO S e ~
I
,
,
,
~
I
,
,
,
I
40 60 80 TEMPERATURE (~
,
,
,
I
100
,
,
i20
Figure 5.1 Solubilities for common food component sugars as a function of temperature. Data from Pancoast and Junk (1980).
as shown in Figure 5.1 for common sugars. Most sugars are fairly soluble in water, but solubility may decrease in solutions that contain other sugars or compounds. One example is lactose, which exhibits decreased solubility in the presence of sucrose although sucrose solubility is not greatly affected by lactose (Nickerson and Moore, 1972; Nickerson and Patel, 1972; Hartel and Shastry, 1991). The solubility of sugars in alcohols has been found to be lower than in water and some sugars are totally insoluble in alcohols (Hartel and Shastry, 1991). 2. Glass transitions Glass transition temperatures of anhydrous sugars vary from the very low temperatures of alditols to those of mono-, di-, and oligosaccharides at higher temperatures. Glass transition temperatures of sugars govern the physical state of a wide range of foods. The noncrystalline state of sugars is typical of sugar candies, confectionery, and even ice cream, but manipulation of the physical state has been a skillful art rather than a science. The amorphous state of glucose and sucrose is fairly well characterized, but information on glass transition temperatures of several sugars and especially on transitions between the amorphous and crystalline states is scarce. All sugars exhibit significant water plasticization, which affects the
zy zyxwvuts 5. FoodComponentsand Polymers
113
T a b l e 5.1 Melting temperatures, T m, for various sugars and sugar alcohols with latent heat of fusion, AHf, determined with DSC.
Tm (~
Compound
Onset
Pentoses D-Arabinose
150
L-Arabinose
-
Peak
Other b
AHf (J/g)
160 155.5-156.5 -
238
159-160
D-Ribose
70
86
95
146
D-Xytose Hexoses D-Fructose
143
157
145
211
108
127
103-105
169
a-D-Fucose
133
145
-
186
D-Galactose
163
170
-
243
D-Glucose
143
158
146
179
a-D-Glucose x H 2 0 D-Mannose a-L-Rhamnose x H 2 0 L-Sorbose Disaccharides a-Lactose x H 2 0
86 120
134
132
86
99
92
191
153
163
165
245
137
-
-
201-202
a-Lactose
-
-
222.8
t-Lactose
-
-
253
162
169
-
-
-
160-165
Maltose x H 2 0
104
123
102-103
a-Melibiose x 0.5 H 2 0
138
-
-
Sucrose
173
190
185-186
-
-
214-216
a,a-Trehalose x 2 H 2 0 Oligosaccharides c
91
97
103
127
Raffinose x 5 H 2 0 Sugar alcohols
76
80
80
138
Lac tulosec Maltose
a, a-Trehalose
136 126 118
Maltitol
139
149
-
150
D-Mannitol c
163
167
168
251
D-Sorbitol
85
99
110-112
150
Xylitol
89
95
93-94
250
a Onset of melting endotherm; peak of melting endotherm b Weast (1986) c Y.H. Roos, unpublished data (1992) Source: Roos (1993)
114
PhaseTransitionsin Foods
zyxwvut
stability of a number of foods. White and Cakebread (1966) realized the importance of the glassy state of sugars to the stability of such food products as boiled sweets, freeze-dried foods, ice cream, and milk powders. Heating of crystalline sugars to above melting temperature followed by rapid cooling often results in the formation of a solid, transparent, glassy material, which was realized quite early (Parks and Thomas, 1934; Kauzmann, 1948). Parks and co-workers conducted a number of studies on the physical properties of glucose glasses and they were well aware of the time-dependent nature of the amorphous state (Parks and Reagh, 1937). The glass transition temperature of sugars generally depends on the molecular weight. Monosaccharides have lower Tg values than disaccharides, which have lower values than oligosaccharides (Slade and Levine, 1991, 1995; Roos, 1993) Several studies have reported transition temperatures for common sugars. The differences between the reported Tg values for the same sugars are probably due to residual water in samples, differences in sample handling techniques, and differences in techniques used to measure Tg. Most studies have used DSC, but the use of other techniques such as DMTA (Schenz et al., 1991; Maclnnes, 1993) and TMA (Maurice et al., 1991; Le Meste and Huang, 1992) has been reported. Chan et al. (1986) studied glass transition temperatures of glucose using dielectric and calorimetric techniques. The dielectric relaxation features of glucose and water-plasticized glucose were found to be remarkably similar to those of amorphous polymers. Tg may also be derived from data for spin-lattice relaxation times (Karger and Ltidemann, 1991). Observed glass transition temperatures for sugars are given in Table 5.2. The glass transition temperature of amorphous sugars is extremely sensitive to water. State diagrams are particularly useful in the characterization of the physical state of sugars and the water content dependence of transition temperatures. In addition state diagrams describe conditions needed for ice formation. The first phase diagrams that showed the glass transition dependence of water content for glucose and sucrose were established by Luyet and Rasmussen (1968). Other state diagrams have been reported for a number of sugars by various authors. These include those of sucrose (Blanshard and Franks, 1987; Hatley et al., 1991; Izzard et al., 1991; Roos and Karel, 1991a), galactose (Blond, 1989), fructose (Roos and Karel, 1991b; Ablett et al., 1993a), maltose (Roos and Karel, 1991d), and maltotriose (Ablett et al., 1993b). The state diagram for sucrose with experimental data for various temperature- and concentration-dependent properties is shown in Figure 5.2. State diagrams can be established with experi mental data for freezing temperature depression, maximum freeze-concentration, solubility, and water plasticization, i.e., concentration dependence of the Tg.
zyxwv
zy zyxwvu 5. FoodComponentsand Polymers
115
Table 5.2 Glass transition temperatures, Tg, change of heat capacity occurring over the glass transition, ACp, and the ratio of melting temperature, Tin, and Tg. Tg (~
ACp (J/g~
a
Onset Midpoint Other
Compound Pentoses Arabinose
Tm/Tge
I
II
I
II
-2
3
4c
0.66
0.80
1.56
-
Ribose
-20
- 13
-10 b -11 c
0.67
0.94
1.36
1.37
Xylose
6
14
9.5 b, 13c
0.66
0.95
1.49
1.51
5
10
100b 7 c
0.75
0.84
1.37
1.06
Fucose
26
31
Galactose
30
38
Hexoses Fructose
110
b
32 c
-
-
0.50
0.85
1.36
-
1.44
1.16
Glucose
31
36
31 b 38 c
0.63
0.88
1.37
1.42
Mannose
25
31
30 b 36 c 27 c
0.72 0.69
0.97 1.00
1.32 -
1.36 -
-
0.69
-
1.46
-
-
Rhamnose
-7
0
Sorbose
19
27
zy
Disaccharides Lactose
101
-
Lactulose f
79
88
O.45
-
-
-
Maltose
87
92
43b 95 c
0.61
0.79
-
1.27
Melibiose
85
91
95 c
0.58
0.65
-
-
62
67
52b 70 c
0.60
0.77
1.33
1.43
100
107
79b
0.55
-
-
1.35
70
77
Maltitol
39
44
-
0.56
-
1.32
-
Sorbitol
-9
-4
-2b
0.96
-
1.36
1.42
Xylitol
-29
-23 -18.5 b -19c
1.02
1.52
1.48
1.44
Sucrose Trehalose Oligosaccharides Raffinose f
0.45
Sugar alcohols
a Onset and midpoint of the glass transition temperature range b Slade and Levine (1991) c Orford et al. (1990) d I Roos (1993), II Orford et al. (1990) e I Roos (1993), II Slade and Levine (1991) f Y.H. Roos, unpublished data (1992) Source: Roos (1993)
T h e G o r d o n a n d T a y l o r e q u a t i o n h a s p r o v e d to b e a r e l i a b l e p r e d i c t o r o f g l a s s t r a n s i t i o n t e m p e r a t u r e s o f s u g a r s at v a r i o u s w a t e r c o n t e n t s . A p p l i c a t i o n of the e q u a t i o n requires that the a n h y d r o u s value
for
the
constant
k
are
known.
Tg ( T a b l e 5.1) a n d n u m e r i c a l o f t h e e x p e r i m e n t a l Tg
One
116
PhaseTransitionsinFoods 80 60 9
H Solution
40 . 20 O
I"
f
.
Tm
Supersaturated solution ~,,,O~1~1~ f.~~
v
0 , 60-70% (w/w) water]
Intermediate water content M1 M2
o..J
u_
Low water content [< 30-40% (w/w) water]
u.I "1-
~
\
o
\
121 Z U.I
zy zy
TEMPERATURE
zyx
Figure 5.6 A schematic representation of DSC thermograms typical of starch when heated with various amounts of water. Heating at high water contents over the gelatinization temperature range produces a single endotherm, M1. At intermediate water contents another endotherm, M2, is observed as a shoulder of the M1 endotherm or as a separate endotherm. At low water contents only M2 is obtained. The melting temperature, Tin, increases with increasing water content.
melting. Zobel et al. (1988) concluded that at a water content of 30% or higher starches were analogous to other natural and synthetic polymers in which the degree of the order of crystallinity and plasticizer interactions are m a j o r factors in the determination of the melting b e h a v i o r and other properties. The results of the study did not confirm occurrence of the increasing melting temperature of starch with less than 20% (w/w) water as
128
PhaseTransitionsin Foods
zyxwvut
was reported for potato starch by Donovan (1979). Cameron and Donald (1993a,b) used small-angle X-ray scattering to study the gelatinization of wheat starch. When excess water was available water was absorbed to the amorphous phase at temperatures below 55~ At higher temperatures the amorphous phase became saturated and a drop in the crystalline order became evident due to cooperative melting. At limiting water contents the loss of the crystalline order occurred at higher temperatures.
zyxw
c. Differential Scanning Calorimetry. DSC thermograms of starch with low and intermediate water contents often show multiple melting endotherms, which have been interpreted differently in a number of studies (Donovan, 1979; von Eberstein et al., 1980; Biliaderis et al., 1980, 1986a; Evans and Haisman, 1982; Maurice et al., 1985). Thermal transitions suggesting gelatinization and crystallite melting during heating of starch are shown in Figure 5.6. These transitions may produce two endotherms, M1 and M2, which reflect the water- and heat-induced disorganization of crystallites (e.g., Donovan, 1979; Biliaderis et al., 1986a; Biliaderis, 1991a). Transitions may also be observed at higher temperatures, which have been attributed to orderdisorder processes of amylose-lipid complexes (Biliaderis et al., 1986b; Biliaderis, 1991a,b). Biliaderis et al. (1986a) reported that rice starch-water mixtures containing more than 60% (w/w) water show a single, symmetrical melting endotherm that occurs over the gelatinization temperature range. At lower water contents the size of the melting endotherm decreased with decreasing water content and confirmed the results reported by Donovan (1979) for potato starch. Evans and Haisman (1982) suggested that the M 1 endotherm resulted from the melting of the least stable crystallites in accordance with the polymer melting theory of Flory (1953) and less water remained available for the melting of the remaining crystallites, thus increasing the melting temperature. Biliaderis et al. (1986a) proposed that the multiple melting endotherms resuited from crystalline melting and reorganization processes that occurred simultaneously during a dynamic DSC run. The theories of Donovan (1979) and Evans and Haisman (1982) postulated that melting of starch was a solvent-facilitated process and they did not take into account that starch as a semicrystalline polymer may also undergo reorganization during heating (Biliaderis et al., 1986a). Biliaderis et al. (1986a) studied gelatinization of rice starch with 50% (w/w) water using DSC at various heating rates. They assumed that at low heating rates, immediately after the onset of the M1 endotherm, molecular mobility increased and there was a greater opportunity for chain rearrangements. Therefore, the granular structure approached a new equilibrium and
zy zyxwvu 5. FoodComponentsand Polymers
129
Table 5.4 Gelatinization temperature range, Tgel, of various starches as determined with microscopy and DSC. The heats of gelatinization, AHgel, were obtained with DSC.
Starch
Amylose content (%)
Barley Corn
22
Crystallinity (%) -
Tgel (~
zMr-lgel (J/g)
51-60
13.8-20.5
23-28
40
62-76
52
15-22
67-86
28.0
1
40
63-80
16.7-20.1
Oat
23-24
33
52-64
9.2
Pea
29
-
62
12.5
Potato
19-23
28
58-71
17.6-18.8
Rice
17-21
38
68-82
13.0-16.3
-
37
69.5
-
27
34
49-70
10.0
High-amylose corn Waxy corn
Waxy rice Rye Sorghum Tapioca
25
37
68-78
-
17-18
38
63-80
15.1-16.7
Triticale
23-24
-
55-62
-
Wheat
23-26
36
52-66
9.7-12.0
Source: von Eberstein et al. (1980), Lineback (1986), Ring et al. (1988), and Zobel (1988a,b)
less crystallites melted at M 1, which resulted in melting at a higher temperature and the occurrence of the M2 shoulder. An increase in the heating rate decreased such annealing and apparently a higher amount of crystallites melted at M1. When the heating rate was 30~ only a single endotherm was obtained.
d. Effects of Water on Gelatinization and Melting. The need of water for complete gelatinization of starches has been well established. Evans and Haisman (1982) discussed the effect of water activity of starch on the gelatinization temperature. Their results on potato starch suggested that the water activity approached 1 at 0.54 g of water/g of dry starch. Both the initial and final gelatinization temperatures increased when less water was present. At water contents up to 2 g/g of dry starch the final gelatinization temperature decreased with increasing water content. The minimum water content for complete gelatinization is often about 60% (w/w) (Lund, 1984). Gelatinization temperatures for various starches are given in Table 5.4. Although gelatinization can be considered to be a solvent- and heatinduced melting of cystallites it involves kinetic limitations due to the nonequilibrium state of the native starch granules (Biliaderis, 1991a,b). The
130
PhaseTransitionsin Foods
zyxwvut
zyxwvuts
kinetic constraints include at least (1) diffusion of water into the granule; (2) melting of crystallites; and (3) swelling due to the hydration of the disordered polymer chains as was suggested by Marchant and Blanshard (1978). Maurice et al. (1984) suggested that the gelatinization endotherm obtained with DSC is affected by crystalline and amorphous transitions and that water as a plasticizer alters the thermal behavior of starch granules. Maurice et al. (1985) pointed out that a glass transition of the amorphous regions precedes the melting of crystallites and gelatinization is controlled by the molecular mobility in the amorphous phase surrounding crystallites. This theory was based on the fact that crystallite melting in partially crystalline synthetic polymers occurs above the glass transition of the amorphous regions. Experimental evidence of the glass transition followed by the melting endotherm was reported by Biliaderis et al. (1986a) for rice starch, which could not be confirmed by Liu and Lelievre (1991), who observed the Tg at much lower temperatures. However, the change in the heat capacity at such Tg measured with DSC for aqueous starch dispersions is often too small and detection of the Tg may be difficult (Biliaderis, 1991a,b). B iliaderis et al. (1986a) found that the minimum Tg of granular rice starch was constant at 68~ for water contents higher than 30% (w/w). They concluded that the minimum requirement for water to fully exert its plasticizing effect on the material was 30% (w/w). Therefore, higher water contents formed a separate solvent phase outside the granules. Levine and Slade (1990) have used the fringed-micelle model to describe the semicrystalline structure of starch and emphasized that for such materials a glass transition of the amorphous phase and melting of the crystalline phase may be observed.
e. Effects of Solutes. Sugars often increase the gelatinization temperature of starches and may or may not affect the heat of gelatinization. This has been considered to be due to (1) the ability of sugars to reduce water availability (Derby et al., 1975); (2) starch-sugar interactions that stabilize the amorphous regions (Lelievre, 1976; Spies and Hoseney, 1982; Hansen et al., 1989); and (3) the increase in free volume and antiplasticization effect of sucrose in comparison with pure water (Levine and Slade, 1990). Wootton and Bamunuarachchi (1980) used DSC to observe effects of sucrose and sodium chloride on the gelatinization behavior of wheat starch. Sucrose concentrations in the aqueous phase ranging from 0 to 45% (w/w) caused a decrease in the heat of gelatinization, AHgel, from 19.7 to 9.6 J/g. The onset of gelatinization temperature range (50~ was not affected by sucrose, but the peak temperature of the gelatinization endotherm increased with increasing sucrose concentration from 68 to 75~ Wootton and Bamunuarachchi (1980) reported that sodium chloride also decreased AHgel to 9.6 J/g when the concentration was 6% (w/w) in the aqueous phase.
zy zyxw
5. FoodComponentsand Polymers
131
Higher amounts of sodium chloride increased lkHgeland it was 13.8 J/g for starch gelatinized in a 30% (w/w) sodium chloride solution. The onset temperature of gelatinization increased with increasing sodium chloride concentration up to 9% and reached 68~ Higher sodium chloride concentrations decreased the onset temperature and it was 59~ for the 30% solution. The highest peak temperature (80~ was observed when the sodium chloride concentration was 21%. The ratio of starch and water was 1:2 in all experiments. Eliasson (1992) reported that the AHgel w a s not affected by sucrose, but at limited water contents the shoulder observed in DSC endotherms disappeared as sucrose increased the gelatinization temperature. Chungcharoen and Lund (1987) reported that sucrose and salt shifted the gelatinization temperature of rice starch to higher temperatures and decreased heat of gelatinization. They agreed with Maurice et al. (1985) and Biliaderis et al. (1986a) that granular starch consists of three phases, which are crystallites, a bulk amorphous phase consisting mainly of amylose, and intracrystalline amorphous regions consisting of dense branches of amylopectin. The results of these studies among others suggested that sucrose increased the weight-average molecular weight of the plasticizing solution, which increased the gelatinization temperature as was emphasized by Levine and Slade (1990). Results of NMR measurements have shown that mobility of starch increases during gelatinization (Lelievre and Mitchell, 1975). However, the mobility of water and its ability to act as a plasticizer have been observed to decrease in the presence of solutes such as sugars and salts (Chinachoti et al., 1991a). Sodium chloride at a 1 to 2% concentration may cause a much higher increase in the gelatinization temperature than sucrose, probably because of ionic interactions between sodium and the hydroxyl groups of starch (Chinachoti et al., 1991b). In addition to sugars and salts other food components may also affect the gelatinization behavior of starch. Evans and Haisman (1982) reported that sugar and other hydroxylated compounds increased the gelatinization temperature with increasing solute concentration, but the heat of gelatinization and the shape of the DSC endotherm were unchanged. They showed that each solute had a specific effect on the gelatinization temperature. A plot showing gelatinization temperature as a function of water activity had a different curve for each solute. However, when glycerol was used as solute the gelatinization temperature increased linearly with decreasing water activity. Other polymers, such as gluten in bread, may affect the gelatinization behavior of starch. Eliasson (1983) reported that gluten decreased the heat of gelatinization and increased the gelatinization temperature of wheat starch.
132
PhaseTransitionsin Foods
zyxwvut
4. Amylose-lipid complexes Amylose forms complexes with iodine, alcohols, and fatty acids. The ability of starch to bind iodine is commonly used as a measure of the amylose content of starch. Several baked products contain emulsifiers due to their ability to retard finning and retrogradation of starch. The exact mechanism of their function is unclear, but it is often related to the formation of the amylose-lipid complexes (Biliaderis, 199 la,b). Amylose-lipid complexes give a V-type X-ray diffraction pattern, which has been used in their chemical characterization. Kugimiya et al. (1980) used X-ray data to show that a DSC endotherm observed over the temperature range of 110 to 120~ was due to the melting of crystalline V-type amyloselipid complexes. As shown in Figure 5.7 DSC thermograms for starch containing lipids often show one endotherm at high water contents,
zyxw
High water content __1 1.1_ < uJ -r" ._1 nu.i "rl---
o
~ Intermediate water content
TEMPERATURE
_...._
~P'-
Figure 5.7 Thermal transitions observed with DSC during heating of starch in the presence of lipids. At intermediate water contents the endotherms M1 and M2 occur during gelatinization. The M3 and M4 transitions are due to melting of amylose-lipid complexes. An exotherm between the M3 and M4 transitions indicates recrystallization of the amyloselipid complex melted at M3. At high water contents two separate endotherms are obtained due to starch gelatinization and melting of the amylose-lipid complexes, respectively.
zy zyxwvuts 5. FoodComponentsand Polymers
133
which indicates cooperative melting, but two melting endotherms that are separated by an exotherm may occur at intermediate and low water contents (Biliaderis et al., 1985, 1986b). Biliaderis et al. (1985) assumed that the behavior was indicative of nonequilibrium melting of a metastable solid material. The first endotherm at a lower temperature was considered to appear due to melting of the original crystallites. The exotherm appeared to be probably due to recrystallization of the amylose-lipid complex and melting of the recrystallized material produced the higher temperature endotherm. Biliaderis et al. (1985) pointed out that water was essential to both the melting and crystallization phenomena. They assumed that water was needed for plasticization of the amorphous chain segments, which facilitated chain mobility and allowed melting at a lower temperature. Crystallization at high water contents produced metastable, less perfect crystalline complexes. It should be noticed that the formation of complexes is thermoreversible and DSC cooling curves show an exotherm, which indicates crystallization of the melted amylose-lipid complex during cooling (Biliaderis et al., 1985). The amylose-lipid complexes may form during gelatinization. Kugimiya and Donovan (1981) found that the heat of gelatinization of various starches was lower when gelatinization occurred with lipids. They suggested that the apparent heat of gelatinization was lower due to the concurrent exothermal crystallization of amylose-lipid complexes. The gelatinized materials showed only one melting endotherm when they were reheated in the DSC. Eliasson (1986) also found that the observed heat of gelatinization decreased in the presence of surface-active agents, probably due to the simultaneous release of heat from the formation of amylose-lipid complexes. Zobel et al. (1988) reported that the V-type structure in maize starch with 45 to 50% water showed development after annealing at 120 and 142~ After storage of 18 hrs at room temperature a well-formed V-type structure as well as B-type structure were evident in the X-ray diffraction pattern. The V-type structure was typical of the amylose-lipid complex. The B-type structure was reported to be due to crystallization of mainly amylopectin from the starch melt. Zobel et al. (1988) concluded that simultaneous crystallization and melting phenomenon may occur in starch-water systems.
III.
Proteins
Phase transitions of proteins affect the physical state and textural characteristics of various foods. The most important transition that occurs in proteins is denaturation. Native proteins denature when they are heated in the presence
134
PhaseTransitionsin Foods
zyxwvut
of water. Denaturation may be considered to be an irreversible phase transition that includes an endothermal heat of denaturation. Another important state transition of proteins is glass transition. Proteins are biopolymers that are plasticized by water (e.g., Yannas, 1972; Slade and Levine, 1995). In enzymes such as lysozyme water plasticization increases the flexibility of the enzyme structure. Bone and Pethig (1985) reported that the effect of plasticization of proteins at room temperature became significant with a water content of 20% (w/w), which corresponded to the water content at which enzyme activity begins. They reported similar plasticization for cytochrome-c, collagen, and elastin. Cereal proteins have also been shown to be waterplasticizible amorphous polymers (e.g., Slade and Levine, 1995).
A.
Denaturation
zyxwvu
Kauzmann (1959) defined protein denaturation to be a process or a sequence of processes in which the spatial arrangement of the polypeptide chain within the protein molecule is changed from that typical of the native protein to a more disordered arrangement. Foegeding (1988) defined the denaturation temperature, Td, to be the temperature at which the concentration of the native protein became equal to the concentration of the denatured protein. Most proteins denature at temperatures from 50 to 80~ Denaturation temperatures and heats of denaturation, AHd, are often obtained with DSC. Protein denaturation occurs over a temperature range that is specific for each protein and also dependent on other compounds and pH. The DSC thermogram for a single protein shows a fairly sharp endotherm at Td. The size and location of the endotherm may depend on pH, e.g., denaturation of lysozyme occurs at a lower temperature at pH 2 than at pH 4.5 (Privalov and Khechinashvili, 1974). The thermograms also show that the heat capacity of the native protein is lower than that of the denatured protein (Privalov and Khechinashvili, 1974). According to Privalov (1979) the heat of denaturation includes the heat of the conformational transition, the heat of ionization of the protein, and the heat of ionization of the buffer compound if denaturation occurs in a buffer solution. It should be noticed that the aggregation of protein molecules and breakup of hydrophobic interactions are exothermic processes that are associated with the total denaturation process (Amtfield and Murray, 1981). The protein fraction of food materials is often composed of several proteins, e.g., muscle proteins include myosin, sarcoplasmic proteins and collagen, and actin. Therefore, thermograms of a particular food material
zyx
5. FoodComponentsand Polymers
Muscle
O~
Myosin
Sarcoplasmic proteinsand __~ ~ ~ ' ~ c o l l a g e n ~
u..
u.al' :l".r._
Actin
135
~"
/
0
121 Z UJ
Ovalbumin I
50
I
I
60 70 TEMPERATURE (~
I
zyx
80
Figure 5.8 A schematic representation of DSC thermograms typical of muscle proteins and egg white. Both materials show three main endotherms due to the denaturation of the various protein fractions.
zyxwvuts
may exhibit several denaturation endotherms. Meat products show at least three separate endotherms. Egg white has three main endotherms, which are due to the denaturation of conalbumin, lysozyme, and ovalbumin fractions (Donovan et al., 1975). According to Donovan and Mapes (1976) ovalbumin is converted to S-ovalbumin during storage of eggs, which is observed from the higher-denaturation endotherm of the S-ovalbumin. A schematic representation of DSC thermograms typical of egg white and muscle proteins is given in Figure 5.8. Salts and sugars as well as other food components have been found to affect denaturation temperatures and heats of denaturation of food proteins (Arntfield et al., 1990). Extremely high and low pH values tend to decrease both Td and AHd. Denaturation behavior of proteins is also dependent on ionic strength, heating rate, and processing history of the protein. De Wit and Swinkels (1980) studied denaturation and denaturation kinetics of fl-lactoglobulin. The protein in a buffer solution at pH 6.7 showed a large endotherm between 60 and 90~ The denaturation temperature was
136
PhaseTransitionsin Foods
zyxwvut zyxwvu
Table 5.5 Denaturation temperatures, Td, and heats of denaturation, AH d, for proteins. Protein Ceral proteins Oat Wheat gluten Egg white proteins
Td (~
AHd (J/g) Reference
112 18.8 Arntfield and Murray (1981) 88.4 and 101.4 0.25 and 0.13 Eliasson and Hegg (1980) Donovan et al. (1975)
Conalbumin 61 Globulins 92.5 Lysozyme 75 Ovomucoid 79 Ovalbumin 84 Legume proteins Fababean 88 Field pea 86 Soybean 93 Muscle proteins Actin 83.5 Myofibrils 59.5 and 74.5 Myosin 55 Sarcoplasmic proteins 63, 67, and 75 Whey proteins ct-Lactalbumin 62 /3-Lactoglobulin 78 Immunoglobulin 72 Bovine serum albumin 64 Whey protein concentrate 62/78
15.2 11.8 28.2 21.9 15.2 Arntfield and Murray (1981) 18.4 15.6 14.6 Wright et al. (1977) 14.5 22.6 13.9 16.5 De Wit and Klarenbeek (1984) 17.8 16.9 13.9 12.2 11.5
dependent on the heating rate, but extrapolation of the data to zero heating rate gave a denaturation temperature of 70.5 + 0.5~ They concluded that 70~ is a critical temperature for fl-lactoglobulin. At higher temperatures aggregation and denaturation occurred. A kinetic analysis showed that the denaturation process followed first-order kinetics over the temperature range from 65 to 72~ with an apparent activation energy of 343 kJ/mol. Denaturation temperatures and heats of denaturation for various food proteins are given in Table 5.5. The thermal behavior of various proteins and the effect of pH, processing, and other compounds on denaturation behavior have been reviewed by Arntfield et al. (1990), Findlay and Barbut (1990), Barbut and Findlay (1990), and Ma and Harwalkar (1991).
zyxwvuts 5. FoodComponentsand Polymers
B. Glass Transition
137
Proteins in foods are water-plasticizable amorphous polymers. The amorphous state is particularly important to the structural properties of baked products. Levine and Slade (1990) have emphasized the thermosetting properties of gluten and also its role as a cryostabilizer in frozen bread dough. Levine and Slade (1990) have stated that a number of examples in the animal kingdom emphasize the importance of proteins, rather than polysaccharides, as structural biopolymers. They have pointed out that such materials as silk, wool, and hair contain crystallites of fibrous proteins that are embedded in a relatively amorphous protein matrix. The physical state of proteins is also important to the physicochemical properties of various protein films that may be used as edible coatings. 1. Physical state of proteins The physical state of proteins in accordance with other biopolymers is significantly affected by water. Information on the crystallinity in food proteins is almost nonexistent and only a few studies have reported changes in the physical state of amorphous proteins. A number of proteins are not water soluble, but they become plasticized by water in the amorphous state. Kakivaya and Hoeve (1975) reported that elastin showed glass transition behavior typical of amorphous polymers. They used DSC to study the change in the heat capacity of the protein as a function of water content. The anhydrous Tg approached temperatures above 200~ and it could not be determined due to possible decomposition of the protein. However, small increases in water content depressed the Tg and it was observed to decrease to below 20~ as the water content was higher than 20% (w/w). The depression of the Tg to below 20~ was also observed from changes in mechanical properties and electrical resistance. Kakivaya and Hoeve (1975) suggested that the water content-dependent state of elastin was responsible for the hardening of arteries. The finding of Bone and Pethig (1982) that water plasticization of lysozyme increases the vibrational freedom of the protein structure, which, perhaps, after sufficient plasticization results in enzyme activity is of great importance to food applications. Foods with low water contents may contain several natural enzymes, which become active due to water plasticization. Also the stability of dehydrated enzyme preparations may be due to their existence in the glassy state. Lillie and Gosline (1993) pointed out that the Tg of proteins especially at low water contents may occur over a wide temperature range. The main glassy proteins in foods are those present in various cereals and cereal foods.
zyxwvuts
zyxwvutsr zyxwvu
138
Phase Transitions in Foods
a. Cereal Proteins. One of the main important properties of cereal proteins is their ability to form polymer networks during baking. Schofield et al. (1983) showed that free sulfhydryl groups in glutenin were involved in rheological changes that occurred at temperatures between 55 and 75~ They postulated that glutenin proteins were unfolded on heating, which facilitated sulfhydryl/disulfide interchange between exposed groups. Similar phenomena occurred in gliadin proteins, which with glutenins belong to the low molecular weight (LMW) subunits of wheat gluten proteins (Shewry et al., 1986), after heating at 100~ Hoseney et al. (1986) reported glass transition temperatures for freeze-dried wheat gluten as a function of water content. Their results indicated that wheat gluten was similarly plasticized by water as elastin in the study of Kakivaya and Hoeve (1975). Slade et al. (1988) suggested that heating of gluten in the presence of water to above the glass transition temperature allows sufficient mobility, due to thermal and water plasticization, for the molecules to form a thermoset network via disulfide cross-linking. Such thermosetting, which is analogous to chemical curing and vulcanization of rubber, may occur only at temperatures above Tg (Levine and Slade, 1990). Thermosetting of gluten is beneficial and extremely
200 150
!
"| "
A Elastin (Kakivaya and Hoeve, 1975) II Wheat gluten (Hoseney et aL, 1986) 9 Glutenin (de Graaf et al., 1993) O Gliadin (de Graaf et aL, 1993)
,1
~" 100 o w tr"
D
rr"
w I1.
50
0
Predicted Tg for gluteni_n (de Graaf et aL, 1993)
w
-50 -100 -150 0
0.2 0.4 0.6 0.8 WEIGHT FRACTION OF SOLIDS
1.0
Figure 5.9 Glass transition temperatures, Tg, of elastin and cereal proteins. The Tg is depressed with decreasing solids concentration due to water plasticization. The Gordon and Taylor equation was used with constant k = 6.3 to predict the Tg curve for glutenin according to de Graaf et al. (1993).
5. FoodComponentsand Polymers
139
important to the quality and structure of baked bread, but deleterious to the quality of such products as sugar-snap cookies (Levine and Slade, 1993; Slade and Levine, 1994). Levine and Slade (1993) stated that the presence of sucrose with high-quality soft wheat flours prevents thermosetting of glutenins and a-gliadins. Therefore, the thermoplastic material may cool into the hard, glassy state. Wheat gluten proteins are divided into gliadin and glutenin fractions. Gliadin is composed of proteins that are solubilized in 70% ethanol-water solution, while the glutenin proteins remain insoluble. Glutenins are higher molecular weight, cross-linked, and elastic polymers. Cocero and Kokini (1991) studied the thermal and mechanical behaviors of the glutenin fraction using DSC and mechanical spectroscopy. The glass transition of glutenin and its depression due to water plasticization were observed from both measurements. The results suggested correlation between the endset temperature of the change in heat capacity determined with DSC and the temperature at the loss modulus, G", maximum. Cocero and Kokini (1991) reported softening of glutenin above Tg, but the storage modulus, G', did not decrease to the typical value of the rubbery region. Cocero and Kokini (1991) assumed that the high G' value above Tg was due to thermosetting of the protein via formation of the disulfide cross-linking as was suggested by Slade et al. (1988). In a subsequent study de Graaf et al. (1993) showed that the gliadin fraction of the gluten proteins was also a water-plasticizable material. However, the glass transition temperature of gliadin was lower than that of gluten at water contents below 8% as shown in Figure 5.9. The lower Tg would be expected due to the lower molecular weight of the gliadin proteins. Madeka and Kokini (1994) studied the mechanical behavior of gliadin at 25% (w/w) water content. A large increase in G' occurred above 70~ which was considered to reflect increasing elasticity due to formation of a cross-linked protein network structure. Cross-linking was also suggested by a significantly higher G' in comparison with G", which is typical of crosslinked polymers. A reduction of G' and a high value of G" were observed at 135~ which suggested softening of the structure in accordance with the finding of Attenburrow et al. (1992) that the Te, of gluten thermoset at 90~ was higher than the 7"8 of gluten thermoset at 150~ de Graaf et al. (1993) and Kokini et al. (1993) have applied the Gordon and Taylor equation to predict water plasticization of cereal proteins. The equation was proved to be useful in predicting water plasticization of both gliadin and glutenin as well as the water plasticization of zein, which is the hydrophobic protein in corn. Kalichevsky et al. (1992a,b, 1993) have studied effects of composition on the glass transition and water plasticization behavior of mixtures of proteins and sugars and proteins and lipids. Kalichevsky et al. (1992a) used DSC, pulsed NMR, and a three-point bend
zy
zyxwv
140
zyxwvu zyxwvut
PhaseTransitionsin Foods
test to observe the Tg of gluten and gluten-sugar mixtures. The results on the water plasticization of gluten agreed well with those reported by Hoseney et al. (1986). The anhydrous Tg was found to be 162~ which was higher than the 121.25 and 141.5~ reported for gliadin (de Graaf et al., 1993) and glutenin (Cocero, 1993), respectively. Fructose, glucose, and sucrose were found to have only little effect on the glass transition, when they were added at a gluten-sugar ratio of 10:1. At a higher fructose content of 2:1 some phase separation was evident, but the Tg of the gluten fraction was depressed by 20 to 40~ Kalichevsky et al. (1992a) reported that the Gordon and Taylor equation was applicable to predict water plasticization of gluten, but suggested the use of the Couchman and Karasz equation to predict the Tg of the three-component mixtures of gluten, sugar, and water. Kalichevsky et al. (1992a) estimated a ACp of 0.39 J/g~ for anhydrous gluten. However, the authors did not consider the possibility of applying the Gordon and Taylor equation to predict the Tg curves for binary mixtures of gluten-sugar solids and water. In addition to enzymes, elastin, and cereal proteins, glass transitions and water plasticization have been found to occur in milk proteins. Kalichevsky et al. (1993) used the Gordon and Taylor equation to fit the Tg data of casein and sodium caseinate at various water contents. The anhydrous Tg values for the materials were 144 and 130~ respectively. The depression of the Tg due to water plasticization was observed from Young's modulus, which was determined by a three-point bend test. Glucose and lactose in mixtures of 1:10 with casein had little effect on the Tg, although at water contents above 12% the transition was broader in comparison with casein alone. Casein was not found to become plasticized by fructose, glucose, and sucrose, which suggested incompatibility of casein and sugars, but high sugar contents decreased the Young's modulus substantially. A comparison of casein and sodium caseinate with other food polymers showed that they were less plasticized by water than such polymers as amylopectin and gluten. The low plasticization of these materials as food components by water was considered to be advantageous when they are added in foods to increase Tg and to reduce hygroscopicity.
b. State Diagrams. State diagrams similar to those of carbohydrates can be established for proteins. State diagrams of proteins may show the glass curve as a function of concentration with the Tg and Cg values for freezeconcentrated protein matrices. According to Slade et al. (1988) the Tg values of commercial vital wheat glutens are between -10 and-6.5~ Kokini et al. (1993) reported that the T 8 and C8 values for glutenin were found to be p
p
t
p
p
5. FoodComponentsand Polymers
141
softening
o v
LU rr"
Engtang~e0 rr" LU
13UJ t--
mg
zyxw zy zyxwvut T~
Ice and glass
C
w
WEIGHT FRACTION OF SOLIDS
Figure 5.10 A schematic state diagram for thermosetting cereal proteins showing various transition "zones" and their dependence on water content as suggestedby Kokini et al. (1993, 1994).
-12~ and 80%, respectively. Slade et al. (1988) found an unexpectedly large p variation between the Cg values of commercial vital wheat glutens between / 70.9 and 93.5%, but most materials studied had Tg between -8.5 and -6.5~ and C~ from about 71 to 77% (respective water contents, W~, were 40 to 30 g/100 g of solids). Although Tg data are available only for a few proteins, state diagrams showing various transition zones for thermosetting proteins have become important tools in the characterization of their physical state (Kokini et al., 1993, 1994; Madeka and Kokini, 1994). Cocero (1993) and Kokini et al. (1993, 1994) have established state diagrams for cereal proteins. The proteins included wheat glutenin, wheat gliadin, and zein. These proteins were found to become plasticized by water and show thermosetting behavior during heating. Other common properties of the proteins were that they became rubbers above Tg, showed entangled polymer flow at sufficient T - Tg, and exhibited softening of the thermoset structure at high temperatures. However, these properties were slightly different for each material depending on the water content. Most changes in the protein structure and rheological properties were derived from data obtained with mechanical spectroscopy using dynamic measurements at constant frequency or temperature. High-temperature data were obtained with
142
PhaseTransitionsin Foods
zyxwvut
zyxwvutsr
a pressure rheometer. A schematic state diagram with the various transition zones typical of thermosetting proteins is shown in Figure 5.10. Application of the gluten state diagram has been proved to be useful by Slade et al. (1988). Slade et al. (1988) reported that frozen bread dough that is yeast leavened before frozen storage can be cryostabilized with vital wheat gluten to ensure stability at -18~ for at least three months. The frozen product is baked directly from the frozen state. Phase behavior of amorphous proteins has not been thoroughly studied. It is obvious that further studies may provide additional information on their functional properties in foods. The cryostabilizing and thermosetting properties of proteins may provide new important applications for proteins, including their use as edible and biodegradable films. There is also an increasing interest in establishing relationships between water plasticization of enzymes and enzyme activity.
IV.
Lipids
Lipids together with carbohydrates and proteins are the main food solids. However, lipids as food components differ significantly from carbohydrates and proteins. Lipids are fairly insoluble in water and they exhibit phase transitions that are not significantly affected by the presence of water. The main phase transitions of lipids in foods that affect their behavior in processing, storage, and consumption are transitions between the solid and liquid states of fats and oils. Such transitions include crystallization into various polymorphic forms and effects of fat composition on food properties in various applications.
A. Polymorphic Forms
The physical state of food lipids is essential to the quality of fat spreads and confectionery products and to their utility and stability. Most triglycerides exist at least in three crystalline forms, a, fl', and t , that can be separated according to their X-ray diffraction patterns. Fatty acids and triglycerides are in most cases monotropic, i.e., polymorphic transformations occur only in one direction and transformation of the material from a stable form to a less stable form must occur through the liquid state. The crystallization of triglycerides from melt occurs after sufficient supercooling. Crystallization takes place first to the least stable a-form (Bailey, 1950). Crystallization to
5. FoodComponentsand Polymers
143
the other forms occurs in inverse order of their stability. Increasing the temperature slightly above the melting temperature of the a-form may allow melting and crystallization to the fl'-form. Similarly, the t-form may crystallize via melting of the fl'-form. The stability, melting temperature, and heat of fusion of the polymorphic forms increase in the order a > fl'> ft. According to Hoffmann (1989) crystallization of fats is a slow process that can be made faster with mixing and rapid cooling. The modem analytical methods applied in studies of the crystalline forms of lipids include DSC, IR spectroscopy, NMR, and X-ray diffraction. 1. Calorimetric studies DSC is one of the main techniques in the determination of phase transitions of edible fats and oils. It can be used to study the solidification behavior of lipids as well as melting and transitions between the various polymorphic forms. A DSC scan of solid triglycerides often shows an endotherm for the melting of the a-form followed by an exotherm. The exotherm results from the release of heat as the a-form recrystallizes into the fl'-form. Melting and recrystallization phenomena occur also at a higher temperature as the fl'form melts and recrystallizes to the t-form, and finally the t-form melts to the liquid state as shown in Figure 5.11. Various types of DSC curves obtained for lipids were reported by Hagemann (1988). The transitions are not always detected due to different kinetics of the experiment and the concomitant recrystallization and melting phenomena. The crystalline forms of fats are important in determining physical characteristics of food products. Garti (1988) stated that the stable a-forms in food applications often have too high melting temperatures, large crystals, and unpleasant texture and the preferred crystalline form in such products as butter and margarine is the fl'-form (Garti, 1988; Precht, 1988). In addition to butter and margarine cocoa butter is one of the most studied natural fats. Cocoa butter has six polymorphic forms that have been observed with DSC and X-ray techniques (Schlichter-Aronhime and Garti, 1988). Although DSC may be used to observe the formation of the various crystalline forms of fats and their melting behavior, concomitant melting and crystallization phenomena may cause difficulties in the interpretation of thermograms and determination of the latent heats involved in transformations. It should also be noticed that in food materials other thermal phenomena, e.g., melting of ice, may occur simultaneously with fat melting and crystallization phenomena.
zy
14 4
PhaseTransitionsin Foods
t
Crystallization to a-form
0...J
Crystallization to fl-form
LL I--UJ "1._!
4
cO m o
2 ,
0
I
0.2
,
0.4 O.6 0.8 WATER ACTIVITY
|
1.0
zyxw
Figure 6.7 Predicted viscosity for skim milk powder at 24~ A. Water sorption data was used to predict water content, m, with the GAB model. Tg was predicted with the Gordon and Taylor equation. The WLF equation with the "universal" constants was used to obtain viscosity as a function of m. Viscosity at temperatures above 24~ was assumed to be 1012 Pa s. B. The GAB relationship between water activity, aw, and m was applied to show the viscosity prediction as a function of aw. The decrease of viscosity occurs as the Tg is depressed to below ambient temperature at critical m and aw, which, for skim milk, were found to be 7.6 g/100 g of solids and 0.37, respectively (Jouppila and Roos, 1994a,b).
6. Prediction of the Physical State
179
zy
zyxwvuts
Water activity is often a more important indicator of food stability than water content. This applies especially to amorphous food storage, since small changes in storage relative humidity may have an extensive plasticization effect and cause loss of stability. The effect of water plasticization can be expressed in terms of aw. The effect of water on Tg may be first predicted with the Couchman and Karasz or the Gordon and Taylor equation. Prediction of the effect of aw on the Tg requires application of the sorption isotherm of the material. The sorption isotherm should be predicted by the GAB model or some other sorption model that has proved to fit experimental data. Both modeling of water plasticization and sorption properties should be done before predicting the effects of aw on viscosity of a particular low- or intermediate-moisture food. Figure 6.7 shows the WLF prediction of viscosity for skim milk powder as a function of water content and water activity. At low water contents the viscosity is that typical of the glassy state. An obvious decrease in viscosity occurs as the water content becomes sufficiently high to depress the Tg to below ambient temperature due to plasticization. The decrease of viscosity over a fairly narrow water content range is orders of magnitude, which resuits from the transformation of the solid material into the free-flowing liquid state. The depression of the viscosity with increasing aw is even more dramatic, which explains the high sensitivity of the physical state of a number of carbohydrate foods to storage relative humidity. Plasticization above the critical aw changes relaxation times of mechanical changes rapidly and results in quality changes, e.g., stickiness and loss of crispness.
B. Viscoelastic Properties
The physical state of food components govems mechanical properties of food materials. In fats and oils the relative amounts of liquid and solid materials can be used to characterize their response to a mechanical stress. In such materials the behavior is related to the first-order transition, which depends on temperature and on the polymorphic form. In amorphous foods, which will be discussed here, the physical state is related to the glass transition and changes in the viscoelastic behavior may be characterized in relation to the Tg. Relationships between the physical state and viscoelastic properties have been fairly well established for synthetic polymers (e.g., Ferry, 1980), but only a few studies have used the polymer science approach to predict the viscoelastic behavior of food materials (e.g., Slade and Levine, 1991; Kalichevsky et al., 1993c).
180
zyxwvut
zyxwvuts
PhaseTransitionsin Foods
1. Relaxation time and time-temperature superposition principle
Kalichevsky et al. (1993c) stated that dynamic mechanical techniques are used to characterize mol~ular motions and relaxation behavior of viscoelastic materials. They emphasized the utility of such techniques to study molecular motions which, in food materials, give rise to the glass transition and relaxations below Tg. Relaxations in viscoelastic materials occur by molecular motions, which are temperature-dependent. The relaxation time of a polymer is a measure of the time required by molecules to respond to an external stress at a constant temperature. One of the main peculiarities of the WLF equation is that it provides a logarithmic relationship between time and temperature, as was pointed out by Sperling (1986). A simple relationship between relaxation time, ~:, viscosity, 77, and modulus, E, as given in equation (6.14) can be defined for the Maxwell element, which is composed of a spring (modulus) and dashpot (viscosity) in series. r -r/ E
(6.14)
The relaxation time definition for the Maxwell element defines that the modulus decreases linearly with time, which is not valid for viscoelastic materials. The Kelvin element is a parallel combination of a spring and a dashpot. Its response to an external stress is defined by retardation time. The stress, cr, for the Kelvin element is defined by equation (6.15), which states that the stress is due to both the viscous and elastic components. dE
(6.15)
cr = 0 ~ +
zyxw
The stress of the elastic component is a linear function of strain, e, but the response of the viscous component depends on time. Under constant stress the strain is defined by equation (6.16), which may be written into the form of equation (6.17), where ~:is retardation time.
[1-e e
6. Prediction of the Physical State
181
f//TZ//////;
zy
e
E1
E2
712
713 Nonrecoverable ~
1 v
TIME
zy
Figure 6.8 The combined, four-element Maxwell and Kelvin element model of viscoelastic behavior. The predicted creep behavior of the model shows that after the initial strain due to component 1 the creep results from the Kelvin element and component 3. Relaxation of the stress at time t l, component 1 shows recovery followed by timedependent recovery of component 2 and partial recovery of component 3. After Sperling (1986).
Combination of the Maxwell and Kelvin elements provides the most simple model for viscoelastic behavior as shown in Figure 6.8. The strain of the combined, four-component model is defined by equations (6.18) and (6.19), where the subscripts 1, 2, and 3 refer to the components 1, 2, and 3 as defined in Figure 6.8. e = eI + e2 + e 3
t7
e = ~+ E1
t7 ( E2
1-
(6.18)
e _ t / v2 )
cr
+~t 1/3
(6.19)
The temperature dependence of relaxation times results from increasing molecular mobility with increasing temperature. The time-temperature superposition principle assumes that relaxation data obtained at one temperature can be shifted along the time axis to another temperature. Thus, a typical master curve of an amorphous material can be established at one temperature
182
PhaseTransitionsin Foods
zyxwvut
zyxw
based on data obtained at other temperatures (Ferry, 1980; Sperling, 1986). The master curve is established using a shift factor that may assume WLF temperature dependence of relaxation times above Tg. Ferry (1980) showed that the time-temperature superposition principle applies to storage modulus, loss modulus, and other modulus functions that are also used in the characterization of amorphous food materials (e.g., Cocero, 1993; Kalichevsky et al., 1993c). According to Ferry (1980) the modulus measured at frequency f at temperature T is equivalent to the modulus measured at frequencyfaT at a reference temperature, TO, where aT refers to the ratio of relaxation times at T and TO. The application of the time-temperature superposition principle based on the WLF temperature dependence of molecular relaxation processes in the characterization of the viscoelastic behavior of amorphous food materials has been emphasized by Levine and Slade (e.g., 1989; Slade and Levine, 1991). 2. Master curves of biological materials
Master curves are reported for only a few biopolymers (Nakamura and Tobolsky, 1967; Kalichevsky et al., 1993c) and data for food materials are scarce. However, master curves of polymers are useful in the description of the changes in physicochemical properties that occur in their amorphous state. A typical master curve of polymers is based on collecting modulus data at several temperatures, e.g., with the stress relaxation method, which measures the modulus as a function of time after deformation. Such measurement of the time dependence of modulus is equivalent to the measurement of modulus as a function of frequency at a constant temperature (Kalichevsky et al., 1993c). The modulus values obtained may then be shifted to another temperature, e.g., 25~ which predicts the modulus as a function of time or frequency at that temperature. A schematic representation of the change of modulus as a function of time at various temperatures is shown in Figure 6.9. Such curves can be used to predict time- and temperature-dependent behavior of amorphous, viscoelastic materials. The master curve of modulus of a viscoelastic, amorphous material shows the five regions of viscoelastic behavior. A typical master curve is shown in Figure 6.10. The master curve of modulus is useful in the interpretation of experimental data of various time-dependent changes of the physical properties of biopolymers and foods. It should also be noticed that various mechanical properties of food materials, when measured as a function of frequency, time, temperature, water content, or water activity, should produce a modulus curve that reflects the physical state. The modulus data may also
6. Prediction of the Physical State
183
zy
T1
.-.-I 2~ _.!
::0 121
0
C: m
o
log TIM E
~-"~'~
zyxw
Figure 6.9 A schematic representation of time and temperature dependence of modulus of amorphous materials. Relaxations in the glassy state at a low temperature, T1, are slow. An increasing temperature increases the rate of relaxation, i.e., the modulus decreases with time. The maximum relaxation rate is observed Within the glass transition temperature range at temperature T3. The rate decreases again when the "rubbery plateau" region is approached. At high temperatures or long times as shown for temperature T6 flow of the material may be observed.
be determined at various temperatures and transformed to a master curve using the superpositioning principle. Such curves could be used to show food behavior at one temperature, e.g., at food storage temperature, that would be directly applicable to predict mechanical properties in practical applications. Although sufficient data to establish relationships between moduli at various frequency, time, temperature, water content, and water activity conditions of food materials have not been reported, the mechanical behavior of gluten (Attenburrow et al., 1990), elastin (Lillie and Gosline, 1990, 1993), and cereal-based foods (Attenburrow and Davies, 1993) suggests that the superpositioning principle may apply. The loss and storage modulus data of cereal proteins obtained as a function of temperature were successfully used in the characterization of mechanical properties of cereal proteins by Cocero (1993) and Kokini et al. (1993, 1994). A typical value of Young's modulus of
184
PhaseTransitionsin Foods I I
Glass
~
~ .
,
.,
I I
i Leamery i region i
~~1
Rubbery plateau
0") :) _J :) El
I I I I I I I I I
I I I I I I I
or
I I
i rubbe~l
0
i
flow
I
13) 0
Tg
\:
zyx ~
I
i I I I I I I I
zyxwv
Elastic ~
ILiquid
~ ~ I f l o Iw I I
rm
I I
log FREQUENCY, log TIME, or TEMPERATURE (WATER CONTENT or WATER ACTIVITY)
Figure 6.10 A typical master curve of the modulus of amorphous materials showing the five regions of viscoelastic behavior. The master curve at constant temperature may be obtained by superpositioning of modulus data obtained at various temperatures as a function of frequency or time. For water-plasticized food materials the modulus curve may also be obtained at a constant temperature as a function of water content or water activity. A typical value for Young's modulus in the glassy state is 3 x 10⁹ Pa. Adapted from Levine and Slade (1990).
glassy polymers is 3 x 10⁹ Pa, which applies to a number of amorphous polymers (Sperling, 1986) and probably to amorphous foods. Some amorphous food components exist in a partially crystalline state, which shows different thermomechanical properties from the completely amorphous materials. According to Sperling (1986) the presence of crystalline regions in polymers decreases the depression of the modulus within the leathery region and extends the rubbery plateau region until liquid flow occurs above the melting temperature. Cross-linking of polymers extends the rubbery plateau region as shown in Figure 6.11. Both the behavior of partially crystalline polymers and cross-linking of polymers may affect the thermal behavior of wheat bread dough due to the presence of the partially crystalline starch fraction and the thermosetting protein fraction. However, the thermal behavior is also affected by gelatinization.
6. Prediction of the Physical State
185
Partially crystalline material
cO S) ._.1 E) a
0 o
Tg
zyxw
Cross-linking material
TEMPERATURE
Figure 6.11 A schematic representation of modulus curves typical of partially crystalline and cross-linking materials as a function of temperature in comparison with the modulus curve of completely amorphous, viscoelastic materials.
3. Effect of molecular weight Molecular weight is one of the main factors that affects the glass transition temperature of anhydrous food components. It may be assumed that food materials, although they are complicated mixtures of solids and water, are characterized by an "effective" molecular weight. Within the glass transition temperature range and the leathery region the effect of molecular weight on the viscoelastic properties of polymers is quite low (Ferry, 1980). The molecular weight and molecular weight distribution, however, have a strong influence on the viscoelastic behavior and the extent of the rubbery plateau region (Ferry, 1980; Sperling, 1986). The effect of molecular weight on viscoelastic properties of polymers can be observed from the modulus curve. However, it should be remembered that food solids represent a wide range of molecular weights and molecular weight distributions. The viscoelastic behavior of low molecular weight food solids, e.g., those of fruits and vegetables that are composed mostly of sugars, is probably significantly different from food solids that are composed of high molecular weight carbohydrates or proteins. The viscoelastic behavior of low molecular weight amorphous solids such as glucose was discussed by Ferry (1980). A comparison of the modulus curves between low and high
186
PhaseTransitionsin Foods
zyxwvuts
...1 23 121
0
Molecular Weight o
Tg
M1 \ TEMPERATURE
zyxw M2\
M
Figure 6.12 Effect of molecular weight on the rubbery plateau region of the modulus curve. The temperature range of the rubbery plateau region of amorphous polymers increases with increasing molecular weight. For low molecular weight compounds such as amorphous sugars the rubbery plateau region is almost nonexistent.
molecular weight amorphous materials is shown in Figure 6.12. Ferry (1980) pointed out that the viscoelastic properties of glucose can be, in large part, described with a single Maxwell element. The effect of molecular weight on viscoelastic behavior over the rubbery plateau region is an important factor in the determination of material properties as was discussed by Ferry (1980). Cocero (1993) used storage modulus data of glutenin at various water contents in the analysis of its thermosetting behavior. The analysis was based on the determination of the molecular weight between cross-links, MC, which revealed that MC decreased during thermosetting that occurred above Tg. Water as a plasticizer of food materials affects the effective molecular weight and the viscoelastic behavior. Kalichevsky et al. (1992b) studied the effect of water on the viscoelastic behavior of gluten. The decrease of storage modulus observed at glass transition was found to shift to lower temperatures with increasing water content due to plasticization and depression of the Tg. The modulus in the glassy state was almost constant, being about 109 Pa at all water contents, but its value with increasing water content was depressed at the rubbery plateau region. The transition at low water contents was also broader than at high water contents. The effect of water on the storage
6. Prediction of the Physical State
187
Water content ~_ o') z) _J E~
ml
m2
0 iii
(.9 < tr" 0 l.cO m
m3 m4
o
TEMPERATURE
zyxw zyx
Figure 6.13 A schematic representation of storage modulus of water-plasticizable biopolymers as a function of temperature. The glass transition temperature, Tg, decreases with increasing water content. The depression of the storage modulus above Tg increases with increasing water content, m (water content increases in the order m l > m2 > m3 > m4), and occurs more steeply with increasing m.
modulus is shown in Figure 6.13. Water has similar effects on the viscoelastic behavior of amylopectin-gluten mixtures (Kalichevsky and B lanshard, 1992) and on amylopectin (Kalichevsky et al., 1993a). It should be noticed that the drop in modulus as a function of water activity occurs fairly steeply as the Tg is depressed to below ambient temperature due to the tremendous depression of Tg with increasing aw. The effective molecular weight of foods can be a complicated result of the molecular weights and properties of component compounds, which may all affect the viscoelastic behavior of amorphous foods above Tg. The modulus of amylopectin and gluten has been found to be affected by simple sugars in addition to water. Addition of glucose to gluten or fructose to amylopectin may decrease the modulus at the rubbery plateau (Kalichevsky et al., 1992b, 1993a). The decrease in modulus increases with increasing sugar content. However, fairly few data are available on the effects of various food components on their viscoelastic properties.
188
zyxwvut zyx
PhaseTransitionsin Foods
References
Angell, C.A., Stell, R.C. and Sichina, W. 1982. Viscosity-temperature function for sorbitol from combined viscosity and differential scanning calorimetry studies. J. Phys. Chem. 86: 1540-1542. Attenburrow, G. and Davies, A.P. 1993. The mechanical properties of cereal based foods in and around the glassy state. Chpt. 16 in The Glassy State in Foods, ed. J.M.V. Blanshard and P.J. LiUford. Nottingham University Press, Loughborough, pp. 317-331. Attenburrow, G., Barnes, D.J., Davies, A.P. and Ingman, S.J. 1990. Rheological properties of wheat gluten. J. Cereal Sci. 12: 1-14. Bellows, R.J. and King, C.J. 1973. Product collapse during freeze drying of liquid foods. AIChE Symp. Ser. 69: 33-41. Chirife, J. and Iglesias, H.A. 1978. Equations for fitting water sorption isotherms of foods: Part 1 - A review. J. Food Technol. 13: 159-174. Cocero, A.M. 1993. The rheology and phase transitions of wheat glutenin. Ph.D. thesis, Rutgers - The State University of New Jersey, New Brunswick, NJ. Couchman, P.R. 1978. Compositional variation of glass-transition temperatures. 2. Application of the thermodynamic theory to compatible polymer blends. Macromolecules 11: 1156-1161. Couchman, P.R. and Karasz, F.E. 1978. A classical thermodynamic discussion of the effect of composition on glass-transition temperatures. Macromolecules 11:117-119. Downton, G.E., Flores-Luna, J.L. and King, C.J. 1982. Mechanism of stickiness in hygroscopic, amorphous powders. Ind. Eng. Chem. Fundam. 21:447-451. Ferry, J.D. 1980. Viscoelastic Properties of Polymers, 3rd ed. John Wiley & Sons, New York. Flory, P.J. 1953. Principles of Polymer Chemistry. CorneU University Press, Ithaca, NY. Fox, T.G. 1956. Influence of diluent and of copolymer composition on the glass temperature of a polymer system. Bull. Am. Phys. Soc. 1: 123. Gordon, M. and Taylor, J.S. 1952. Ideal copolymers and the second-order transitions of synthetic rubbers. I. Non-crystalline copolymers. J. Appl. Chem. 2: 493-500. Hancock, B.C. and Zografi, G. 1994. The relationship between the glass transition temperature and the water content of amorphous pharmaceutical solids. Pharm. Res. 11: 471-477. Hemminga, M.A., Roozen, M.J.G.W. and Walstra, P. 1993. Molecular motions and the glassy state. Chpt. 7 in The Glassy State in Foods, ed. J.M.V. Blanshard and P.J. Lillford. Nottingham University Press, Loughborough, pp. 157-187. Hoseney, R.C., Zeleznak, K. and Lai, C.S. 1986. Wheat gluten: A glassy polymer. Cereal Chem. 63: 285-286. Huang, V.T. 1993. Mathematical modeling on the glass transition curves of glassy polymers. Paper No. 911. Presented at the Annual Meeting of the Institute of Food Technologists, Chicago, July 10-14. Jouppila, K. and Roos, Y.H. 1994a. Water sorption and time-dependent phenomena of milk powders. J. Dairy Sci. 77: 1798-1808. Jouppila, K. and Roos, Y.H. 1994b. Glass transitions and crystallization in milk powders. J. Dairy Sci. 77: 2907-2915.
zy zyxwvuts 6. Prediction of the Physical State
189
Jouppila, K., Ahonen, T. and Roos, Y. 1995. Water adsorption and plasticization of amylopectin glasses. In Food Macromolecules and Colloids, ed. E. Dickinson, The Royal Society of Chemistry, London. In press. Kalichevsky, M.T. and Blanshard, J.M.V. 1992. A study of the effect of water on the glass transition of 1:1 mixtures of amylopectin, casein and gluten using DSC and DMTA. Carbohydr. Polym. 19:271-278. Kalichevsky, M.T. and Blanshard, J.M.V. 1993. The effect of fructose and water on the glass transition of amylopectin. Carbohydr. Polym. 20:107-113. Kalichevsky, M.T., Jaroszkiewicz, E.M., Ablett, S., Blanshard, J.M.V. and Lillford, P.J. 1992a. The glass transition of amylopectin measured by DSC, DMTA and NMR. Carbohydr. Polym. 18: 77-88. Kalichevsky, M.T., Jaroszldewicz, E.M. and Blanshard, J.M.V. 1992b. Glass transition of gluten. 1: Gluten and gluten-sugar mixtures. Int. J. Biol. Macromol. 14: 257-266. Kalichevsky, M.T., Jaroszkiewicz, E.M. and Blanshard, J.M.V. 1993a. A study of the glass transition of amylopectin-sugar mixtures. Polymer 34: 346-358. Kalichevsky, M.T., Blanshard, J.M.V. and Tokarczuk, P.F. 1993b. Effect of water content and sugars on the glass transition of casein and sodium caseinate. Int. J. Food Sci. Technol. 28: 139-151. Kalichevsky, M.T., Blanshard, J.M.V. and Marsh, R.D.L. 1993c. Applications of mechanical spectroscopy to the study of glassy biopolymers and related systems. Chpt. 6 in The Glassy State in Foods, ed. J.M.V. Blanshard and P.J. Lillford. Nottingham University Press, Loughborough, pp. 133-156. Karel, M. 1973. Recent research and development in the field of low-moisture and intermediate-moisture foods. CRC Crit. Rev. Food Technol. 3: 329-373. Karel, M., Buera, M.P. and Roos, Y. 1993. Effects of glass transitions on processing and storage. Chpt. 2 in The Glassy State in Foods, ed. J.M.V. Blanshard and P.J. Lillford. Nottingham University Press, Loughborough, pp. 13-34. Katz, E.E. and Labuza, T.P. 1981. Effect of water activity on the sensory crispness and mechanical deformation of snack food products. J. Food Sci. 46: 403-409. Kerr, W.L. and Reid, D.S. 1994. Temperature dependence of the viscosity of sugar and maltodextrin solutions in coexistence with ice. Lebensm.-Wiss. u. -Technol. 27:225-231. Kokini, J.L., Cocero, A.M., Madeka, H. and de Graaf, E. 1993. Order-disorder transitions and complexing reactions in cereal proteins and their effect on rheology. In Proceedings of International Symposium Advances in Structural and Heterogeneous Continua, Moscow, August 1993. In press. Kokini, J.L., Cocero, A.M., Madeka, H. and de Graaf, E. 1994. The development of state diagrams for cereal proteins. Trends Food Sci. Technol. 5: 281-288. Labuza, T.P., Tannenbaum, S.R. and Karel, M. 1970. Water content and stability of lowmoisture and intermediate-moisture foods. Food Technol. 24: 543-544, 546-548, 550. Laine, M.J.K. and Roos, Y. 1994. Water plasticization and recrystallization of starch in relation to glass transition. In Proceedings of the Poster Session, International Symposium on the Properties of Water, Practicum II, ed. A. Argaiz, A. L6pez-Malo, E. Palou and P. Corte. Universidad de las Am6ricas-Puebla, pp. 109-112. Le Meste, M. and Huang, V. 1992. Thermomechanical properties of frozen sucrose solutions. J. Food Sci. 57: 1230-1233. Levine, H. and Slade, L. 1986. A polymer physico-chemical approach to the study of commercial starch hydrolysis products (SHPs). Carbohydr. Polym. 6: 213-244.
190
PhaseTransitionsin Foods
zyxwvut zyxwv
Levine, H. and Slade, L. 1988. "Collapse" phenomena - A unifying concept for interpreting the behaviour of low moisture foods. Chpt. 9 in Food Structure - Its Creation and Evaluation," ed. J.M.V. Blanshard and J.R. Mitchell. Butterworths, London, pp. 149180. Levine, H. and Slade, L. 1989. A food polymer science approach to the practice of cryostabilization technology. Comments Agric. Food Chem. 1: 315-396. Levine, H. and Slade, L. 1990. Influences of the glassy and rubbery states on the thermal, mechanical, and structural properties of doughs and baked products. Chpt. 5 in Dough Rheology and Baked Product Texture, ed. H. Faridi and J.M. Faubion. AVI Publishing Co., New York, pp. 157-330. Lillie, M.A. and Gosline, J.M. 1990. The effects of hydration on the dynamic mechanical properties of elastin. Biopolymers 29:1147-1160. Lillie, M.A. and Gosline, J.M. 1993. The effects of swelling solvents on the glass transition in elastin and other proteins. Chpt. 14 in The Glassy State in Foods, ed. J.M.V. Blanshard and P.J. Lillford. Nottingham University Press, Loughborough, pp. 281-301. Lin, A.A., Kwei, T.K. and Reiser, A. 1989. On the physical meaning of the Kwei equation for the glass transition temperature of polymer blends. Macromolecules 22:4112-4119. Luyet, B. and Rasmussen, D. 1967. Study by differential thermal analysis of the temperatures of instability in rapidly cooled solutions of polyvinylpyrrolidone. Biodynamica 10(209): 137-147. MacFarlane, D.R. 1986. Devitrification in glass-forming aqueous solutions. Cryobiology 23: 230-244. Maclnnes, W.M. 1993. Dynamic mechanical thermal analysis of sucrose solutions. Chpt. 11 in The Glassy State in Foods, ed. J.M.V. Blanshard and P.J. Lillford. Nottingham University Press, Loughborough, pp. 223-248. Maurice, T.J., Asher, Y.J. and Thomson, S. 1991. Thermomechanical analysis of frozen aqueous systems. In Water Relationships in Foods, ed. H. Levine and L. Slade. Plenum Press, New York, pp. 215-223. Nakamura, S. and Tobolsky, A.V. 1967. Viscoelastic properties of plasticized amylose films. J. Appl. Polym. Sci. 11: 1372-1386. Nelson, K.A. and Labuza, T.P. 1994. Water activity and food polymer science: Implications of state on Arrhenius and WLF models in predicting shelf life. J. Food Eng. 22:271-289. Ollett, A.-L. and Parker, R. 1990. The viscosity of supercooled fructose and its glass transition temperature. J. Texture Stud. 21: 355-362. Orford, P.D., Parker, R., Ring, S.G. and Smith, A.C. 1989. Effect of water as a diluent on the glass transition behaviour of malto-oligosaccharides, amylose and amylopectin. Int. J. Biol. Macromol. 11:91-96. Parks, G.S. and Reagh, J.D. 1937. Studies on glass. XV. The viscosity and rigidity of glucose glass. J. Chem. Phys. 5: 364-367. Peleg, M. 1992. On the use of the WLF model in polymers and foods. Crit. Rev. Food Sci. Nutr. 32: 59-66. Rey, L.R. 1960. Thermal analysis of eutectics in freezing solutions. Ann. N.Y. Acad. Sci. 85:510-534. Roos, Y.H. 1987. Effect of moisture on the thermal behavior of strawberries studied using differential scanning calorimetry. J. Food Sci. 52: 146-149. Roos, Y.H. 1993. Water activity and physical state effects on amorphous food stability. J. Food Process. Preserv. 16: 433-447.
zy zyxwvut 6. Prediction of the Physical State
191
Roos, Y.H. 1994. Water activity and glass transition temperature. How do they complement and how do they differ. In ISOPOW Practicum H: Food Preservation by Moisture Control, ed. J. Welti-Chanes. Technomic Publishing Co., Lancaster, PA. In press. Roos, Y. and Karel, M. 1990. Differential scanning calorimetry study of phase transitions affecting the quality of dehydrated materials. Biotechnol. Prog. 6: 159-163. Roos, Y. and Karel, M. 1991a. Applying state diagrams to food processing and development. Food Technol. 45: 66, 68-71,107. Roos, Y. and Karel, M. 1991b. Water and molecular weight effects on glass transitions in amorphous carbohydrates and carbohydrate solutions. J. Food Sci. 56: 1676-1681. Roos, Y. and Karel, M. 199 lc. Amorphous state and delayed ice formation in sucrose solutions. Int. J. Food Sci. Technol. 26: 553-566. Roos, Y. and Karel, M. 1991d. Nonequilibrium ice formation in carbohydrate solutions. Cryo-Lett. 12: 367-376. Roos, Y. and Karel, M. 199 le. Phase transitions of mixtures of amorphous polysaccharides and sugars. Biotechnol. Prog. 7: 49-53. Roos, Y. and Karel, M. 199 If. Plasticizing effect of water on thermal behavior and crystallization of amorphous food models. J. Food Sci. 56: 38-43. Schenz, T.W., Israel, B. and Rosolen, M.A. 1991. Thermal analysis of water-containing systems. In Water Relationships in Foods, ed. H. Levine and L. Slade. Plenum Press, New York, pp. 199-214. Simatos, D. and Blond, G. 1993. Some aspects of the glass transition in frozen foods systems. Chpt. 19 in The Glassy State in Foods, ed. J.M.V. Blanshard and P.J. Lillford. Nottingham University Press, Loughborough, pp. 395-415. S imatos, D. and Karel, M. 1988. Characterization of the condition of water in foods physico-chemical aspects. In Food Preservation by Water Activity Control, ed. C.C. Seow. Elsevier, Amsterdam, pp. 1-41. Slade, L. and Levine, H. 1988. Structural stability of intermediate moisture foods - A new understanding? Chpt. 8 in Food Structure - Its Creation and Evaluation, ed. J.M.V. Blanshard and J.R. Mitchell. Butterworths, London, pp. 115-147. Slade, L. and Levine, H. 1991. Beyond water activity: Recent advances based on an altemafive approach to the assessment of food quality and safety. Crit. Rev. Food Sci. Nutr. 30:115-360. Slade, L. and Levine, H. 1995. Glass transitions and water-food structure interactions. Adv. Food Nutr. Res. 38. In press. Soesanto, T. and Williams, M.C. 1981. Volumetric interpretation of viscosity for concentrated and dilute sugar solutions. J. Phys. Chem. 85:3338-3341. Sperling, L.H. 1986. Introduction to Physical Polymer Science. John Wiley & Sons, New York. Sugisaki, M., Suga, H. and Seki, S. 1968. Calorimetric study of the glassy state. IV. Heat capacities of glassy water and cubic ice. Bull. Chem. Soc., Jpn. 41: 2591-2599. To, W.C. and Flink, J.M. 1978. 'Collapse,' a structural transition in freeze dried carbohydrates. II. Effect of solute composition. J. Food Technol. 13: 567-581. Tsourouflis, S., Flink, J.M. and Karel, M. 1976. Loss of structure in freeze-dried carbohydrates solutions: Effect of temperature, moisture content and composition. J. Sci. Food Agric. 27:509-519. van den Berg, C. and Bruin, S. 1981. Water activity and its estimation in food systems: Theoretical aspects. In Water Activity: Influences on Food Quality, ed. L.B. Rockland and G.F. Stewart. Academic Press, New York, pp. 1-61.
192
zyxwvut zyxwvutsr
PhaseTransitionsin Foods
van den Berg, C., Kaper, F.S., Weldring, J.A.G. and Wolters, I. 1975. Water binding by potato starch. J. Food Technol. 10: 589-602. White, G.W. and Cakebread, S.H. 1966. The glassy state in certain sugar-containing food products. J. Food Technol. 1: 73-82. Williams, M.L., Landel, R.F. and Ferry, J.D. 1955. The temperature dependence of relaxation mechanisms in amorphous polymers and other glass-forming liquids. J. Am. Chem. Soc. 77: 3701-3707. Zeleznak, K.J. and Hoseney, R.C. 1987. The glass transition in starch. Cereal Chem. 64: 121-124.
CHAPTER 7
Time-Dependent Phenomena
I.
Introduction
zyxwvutsrq
Food materials exist typically in a metastable, nonequilibrium state, which is subject to various time-dependent changes. The rate of these changes often depends on the physical state and therefore on temperature and water content. In foods having low water contents stability can be attained at normal storage conditions if the water content is kept below a critical value. Water contents above the critical value are known to increase deterioration, which is caused by changes in structure or by chemical changes that may result from an increase in enzymatic activity or nonenzymatic browning. The growth of microorganisms is also time-dependent, but microbiological deterioration is often governed by environmental factors such as temperature and pH rather than the physical state of food solids (Chirife and Buera, 1994). Relationships between water availability and food stability have been of great interest and the effect of water activity on deteriorative changes in foods has been well documented. Results of studies on the effect of phase transitions which accompany changes promoted by increasing water
194
PhaseTransitionsin Foods
zyxwvut
zyx
availability have improved understanding of the physical phenomena causing deterioration. The occurrence and time-dependent character of stickiness and caking have been shown to be related to viscosity (Downton et al., 1982; Wallack and King, 1988) and to be governed by the glass transition temperature (e.g., Levine and Slade, 1986; Roos and Karel, 1991a). Caking and lactose crystallization have also been well-known phenomena that occur in milk powders and are affected by water content and temperature (e.g., Warburton and Pixton, 1978; Saltmarch and Labuza, 1980; Jouppila and Roos, 1994a,b). Crystallization is a first-order phase transition that may occur during storage of a number of amorphous foods containing sugars, polysaccharides, and proteins. Crystallization during storage is often detrimental to food quality and it is the major cause of structural changes that occur in bread and other bakery products during storage. This chapter describes various aspects of time-dependent changes that are related to phase transitions and which may occur and govern quality changes during processing and storage of foods. Such foods include several lowmoisture foods, confectioneries, various cereal products, and frozen foods. In addition structural transitions during dehydration or agglomeration can be described as phase transitions-related phenomena.
II.
Time-Dependent Properties of the Physical State
The nonequilibrium state in foods is always subject to an existing driving force towards the equilibrium state. The amorphous state below the melting temperature, Tm, has a higher energy than the equilibrium, crystalline state. Above Tg the molecular mobility is sufficient to allow reorganization of the molecules. However, the time needed for crystallization may depend on temperature and diffusion, but also on material characteristics including molecular size. At temperatures below Tg molecular mobility is low and due to the high viscosity, diffusion of molecules is not sufficient for molecular rearrangements to crystalline structures. Time-dependent changes do occur also below Tg, which are often referred to as physical aging.
A. Glass Formation
Amorphous materials can be obtained by several techniques, which all provide a rapid change of the material from an equilibrium state to a nonequilib-
7. Time-DependentPhenomena
195
zy
zyxwvu
rium state without allowing time needed for the material to adjust to changes occurring in its surroundings and to maintain equilibrium. The common methods for producing amorphous materials include rapid cooling from melt to temperatures well below Tm or rapid removal of solvent. Cooling from melt requires that the process occurs with a rate that is faster than the rate of nucleation to avoid crystallization. Thus, molecules may remain in the supercooled, liquid, amorphous state that has a higher enthalpy and volume than the equilibrium, crystalline material at the same conditions. In solutions molecules exist in a random order. The solute molecules may become "frozen" in the solid, glassy state due to a sufficiently rapid removal of the solvent. Again such removal should occur at a rate that is higher than the rate of nucleation to avoid crystallization. Both cooling from melt and rapid removal of solvent are typical of food manufacturing processes. Food processes that result in amorphous or partially amorphous states in foods include baking, evaporation, extrusion, dehydration, and freezing. A typical feature of all these processes is that they produce a melt of mixtures of food solids and water at a high temperature followed by rapid cooling or removal of water, producing amorphous materials with low water contents. 1. Glass formation from melt Glass formation from melt is typical of hard sugar candies which are formed by rapid cooling of concentrated syrups. In such materials crystallization during cooling can be avoided by using sugar combinations that retard crystallization and allow formation of clear, transparent glasses. Extrusion is another process that produces a melt of component compounds and water at a high temperature followed by subsequent, rapid cooling to below Tg of the melt, which results in formation of stable, solid amorphous foods (e.g., Slade and Levine, 1991, 1995). The most important food solids, which form amorphous, solid structures from melt are carbohydrates and proteins. The melting temperature of the higher melting components can be depressed by the addition of lower melting components and water. The adjustment of a proper water content in any melt both in concentration processes and extrusion is essential for the formation of the glassy texture. Too high water contents during processing and, especially, after cooling may result in the formation of rubbery structures, which are difficult to dehydrate. Although lipids may affect the physical properties of amorphous foods they probably do not affect the physical state of the glass-forming solids (Kalichevsky et al., 1992; Jouppila and Roos, 1994a,b). The formation of amorphous structures in foods by various processes is shown in Figure 7.1.
196
PhaseTransitionsin Foods
zyxwvut
Figure 7.1 Formation of amorphous structures in food processing. Such processes as evaporation at high temperature and extrusion followedby rapid cooling produce amorphous structures from melt. Formation of amorphous foods by solvent removal occurs in dehydration processes and in freezing.
Various glassy states of the same material may be formed in cooling processes depending on the cooling rate. The physical state of the glass produced may be affected by the time-dependent characteristics of the "freezing" of molecules to the solid, glassy state. The complicated process of the formation of the glassy state of cookies and crackers by solubilization, evaporation, and cooling processes as described by Levine and Slade (1993) is a good example of glass formation in foods. The effect of cooling on the thermodynamic properties of amorphous synthetic polymers has been well established. Cooling rate affects the free volume of molecules within the amorphous matrix, as may be observed from various relaxations when rapidly cooled materials are heated to above Tg. The time-dependent nature of the glass formation may also be observed from changes in the physical state that result from annealing in the vicinity of the Tg. Food stability is often related to the location of the Tg in relation to storage temperature, but it should also be remembered that the glass transition itself is a time-dependent property of the amorphous state and that the relative rate of cooling from melt may contribute to the textural properties of rapidly cooled amorphous foods.
zyxwvu
7. Time-DependentPhenomena
197
zy
2. Glass formation by solvent removal
zyxw
Glass formation by the removal of solvent is probably the most common and natural process of food preservation. The solvent in foods is water that can be removed by dehydration or separated from food solids by freezing (Herrington, 1934). It is also well established that completely amorphous food materials can be produced by freeze-drying.
a. Dehydration. Dehydration of most foods results in the formation of at least partially amorphous materials. Such materials as fruits and vegetables are often dried in air without extensive crystallization of component sugars. The crystallization of such compounds is probably delayed by interactions of various molecules in the complicated mixtures of sugars and other compounds. DSC curves of dehydrated fruits and vegetables often show a glass transition (Roos, 1987; S~i and Sereno, 1994). The most rapid removal of solvent occurs in drum-drying and spray-drying. These processes probably produce quantitatively the highest amounts of amorphous food solids, e.g., most spray-dried food powders. The proper control of the amorphous state of lactose has been one of the key factors for maintaining stability of dehydrated milk products. As shown in Figure 7.1 dehydration is usually based on supplying sufficient amounts of heat to the material, which increases temperature and allows evaporation. The removal of water concentrates the food solids, which, at low water contents, enter the glassy state.
b. Freezing. Ice formation in food materials results in freeze-concentration of solutes. The extent of freeze-concentration is dependent on temperature according to the melting temperature depression of water caused by the solute phase. Eutectic crystallization of solutes in most foods is unlikely during normal freezing processes that cool the material to sufficiently low temperatures. As shown in Figure 7.1 the glass transition temperature of freeze-concentrated solutes is dependent on the extent of freeze-concentration (e.g., Levine and Slade, 1986, 1989; Roos and Karel, 1991c). Maximum freeze-concentration may occur at temperatures slightly below the onset temperature of ice melting, Tm, in the maximally freeze-concentrated material (Roos and Karel, 1991c). Glass transition of the maximally freezeconcentrated material is located at Tg(Levine and Slade, 1986). Foods that contain high amounts of low molecular weight sugars have low Tg values. Generally, the Tg increases with increasing molecular weight of the solute fraction (Levine and Slade, 1986, 1989; Roos and Karel, 1991d,e). t
P
198
zyxwvuts zyxwv
PhaseTransitionsin Foods
c. Freeze-Drying. The formation of amorphous materials in proper freeze-drying processes is based on the separation of water from solution by sufficiently rapid freeze-concentration to the maximally freeze-concentrated state. Thus, frozen materials to be freeze-dried should contain pure ice crystals within a maximally freeze-concentrated solute matrix that has glass transition at Tg (e.g., Franks, 1990). The solute fraction at temperatures below Tg remains in the solid, glassy state and supports its own weight, although the ice crystals are removed by sublimation. A successful freezedrying process produces materials that have Tg close to the Tg of the anhydrous solutes due to the removal of all ice and most of the plasticizing water. It should be noticed that any exposure of a freeze-drying material to temperatures above T m allows ice melting and plasticization of the freezeconcentrated solutes. The freeze-concentrated solute fraction at temperatures above T m cannot support its own weight, which results in collapse, reduced water removal, and poor product quality. p
p
B. Relaxation Phenomena in Amorphous Foods
Amorphous materials show various relaxation phenomena, depending on their physical state and the time allowed for the material to adjust to changes in temperature, pressure, or amount of a plasticizer. Relaxation phenomena are often observed within the glass transition temperature range when glassy materials are heated. However, it should be noticed that relaxation phenomena, which reflect the approach of the material towards equilibrium, occur also in the glassy state, but the relaxation times are orders of magnitude larger than above Tg. 1. Enthalpy relaxations Enthalpy relaxations of amorphous materials are frequently observed with DSC during heating of glassy materials to above the glass transition temperature. Enthalpy relaxations may be either endothermic or exothermic, depending on the thermal history of the material and the time scale of observation. Enthalpy, H, relaxations of amorphous materials can be described in terms of their heating and cooling rates. Similar relaxations can also be observed from changes in volume, V, and entropy, S, and they affect changes occurring in heat capacity, Cp, the thermal expansion coefficient, a, and compressibility, 13. During cooling of glass-forming materials from melt towards Tg, enthalpy, entropy, and volume decrease continuously with
7. Time-DependentPhenomena
zyxw
Enthalpy Entropy Volume
A
C I
I I
Compressibility Heat capacity Thermal expansion coefficient
D
I I I I I
Tg
199
I L....
iL..,...I B
A Tg
zyxw
zyxwvutsr TEMPERATURE
~-
Figure 7.2 Effect of cooling rate on the physical state of amorphous glasses and relaxation phenomena observed during heating to temperatures above the glass transition temperature, Tg. Fast cooling below Tg results in the formation of glasses with relatively high enthalpy, H, volume, V, and entropy, S. Slow cooling allows more time for molecular relaxations before freezing and lower enthalpy, entropy, and volume states are obtained. Heating of the glasses with various rates affects location of the Tg and the thermal properties show relaxations that result from differences in cooling and heating rates. After Weitz and Wunderlich (1974).
decreasing temperature. It is well known that large-scale molecular motions become extremely slow at Tg, the molecules "freeze," and the material cannot respond to further changes in temperature within the experimental time scale (e.g., Weitz and Wunderlich, 1974; Tant and Wilkes, 1981; Wunderlich, 1981) or as Perez (1994) pointed out molecular movements become prevented below Tg and the configurational modes are frozen abruptly. Thus, changes in H, V, and S occur more slowly below Tg than above Tg. The cooling rate affects the physical state of amorphous materials in terms of H,
200
PhaseTransitionsin Foods
zyxwvut zyxwvu
V, and S, which are observed from relaxation phenomena as the glass is heated to temperatures above Tg. The effects of heating and cooling rates on relaxation phenomena are shown in Figure 7.2. Rapid cooling of an amorphous material to below Tg freezes molecules into a physical state with a fairly high enthalpy, entropy, and large volume. Reheating of the material at the same rate changes the slope of the increase of the extensive properties of state, but no relaxations are observed (A). Thus, a step change in compressibility, heat capacity, and the thermal expansion coefficient is observed at Tg according to curve A. Similarly, slow cooling followed by slow heating gives no indication of relaxation phenomena, but the change in thermal properties and Tg are observed at a lower temperature (C). Slow heating of the fast-cooled material results in changes above the lower Tg (or theoretical Tg that would be equivalent to Tg observed at a heating rate of 0~ and decreases in enthalpy, entropy, and volume (B) are evident. These changes result from the longer time allowed for the molecules to relax above Tg than was allowed during the initial cooling over the same temperature range. The decrease of enthalpy indicates loss of heat, which is observed as an exotherm associated with the change in heat capacity occurring over the glass transition temperature range (B). An inverse relaxation phenomenon is observed when a slowly cooled material is heated rapidly over glass transition (D). The rapid heating does not allow sufficient time for the molecules to relax at the glass transition corresponding to the initial cooling rate and the physical state, and extra energy at a higher temperature is needed for the relaxation of molecules to the supercooled liquid-like state. Therefore, DSC scans of amorphous materials that have relaxed to a fairly low-volume glassy state produce an endotherm at Tg (D). The size of the endotherm may be considered to be a quantitative measure of the amount of heat needed for the relaxation process. It should be noticed that the amount of heat required for the relaxation at Tg cannot be higher than the heat of fusion of the same crystalline material would be at Tg, since the crystalline state has the lowest enthalpy at equilibrium and requires the exact amount of latent heat to be transferred to the liquid state. Enthalpy relaxations in amorphous materials may also result from physical aging that occurs in the glassy state (Struik, 1978). It has been observed that annealing below Tg, but at a sufficiently high temperature, increases the size of the relaxation endotherm observed by DSC. The size of the endotherm increases with increasing annealing time at a constant temperature. The size of the endotherm decreases if annealing temperature is decreased, suggesting that the relaxation time below Tg increases with decreasing temperature. Enthalpy relaxations of glassy food materials have not been studied systematically and no correlations between physical properties and the physical state of glassy foods are available. However, the relaxations observed
7. Time-DependentPhenomena
201
during heating of glassy materials may give information on the physical state. Noel et al. (1993) pointed out that the enthalpy relaxations are a feature that may give information on time-dependent changes in glass structure, which can be related to embrittlement in the glassy state. Indeed, physical aging in gelatinized starch during sub-Tg annealing has been found to cause embrittlement due to free volume relaxations (Shogren, 1992). 2. Structural relaxations It is obvious that the physical state of glassy materials affects their mechanical behavior. According to Tant and Wilkes (1981) glassy polymers become more brittle during physical aging. They pointed out that the decreasing free volume increases the time needed for the molecular response to stress. Some correlations between changes in mechanical properties and enthalpy relaxations of annealed materials have been reported (Tant and Wilkes, 1981). Structural relaxations may also be related to changes in mobility that can be observed from mechanical and dielectric relaxations (Noel et al., 1992; Kalichevsky et al., 1993). As was shown in Figure 7.2 the observed Tg depends on the experimental time scale. The transition temperatures as a function of heating rate have been determined for several polymers with DSC. The scanning rate dependence of the observed Tg can be used to obtain information on structural relaxation processes that occur in the vicinity of Tg (Noel et al., 1993). According to Noel et al. (1993) the time taken to go through glass transition at a scanning rate of 10~ is of the same order as the shear stress relaxation time. Noel et al. (1993) suggested the use of equation (7.1) to obtain the heat of activation, Qs, for structural relaxations using DSC.
dlnlql_ as
(7.1)
Equation (7.1) defines the relationship between observed glass transition temperature, Tg, and heating rate, q. Noel et al. (1993) pointed out that Qs, which may be obtained from the slope of a plot showing q against Tg, is comparable with the heat of activation obtained from viscosity data over the same temperature range. Thus, it may be concluded that the heating rate dependence of the observed Tg is a measure of changes in molecular mobility that occur within the Tg temperature range. The relationships between enthalpy relaxations and structural relaxations have not been applied in the characterization of physical properties of amorphous foods. One of the problems in applying such information to foods is
zy
202
PhaseTransitionsin Foods
zyxwvut
perhaps their porosity and its effect on physical properties in the macroscopic scale. However, information on structural relaxations that reflect the physical state of amorphous foods would probably be useful in evaluating the brittleness or cracking behavior of glassy foods and food components.
III.
Collapse Phenomena
Levine and Slade (1988a) considered collapse phenomena to include various time-dependent structural transformations, which may occur in amorphous foods and other biological materials at temperatures above the glass transition temperature. Such phenomena include or have an effect on (1) stickiness and caking of food powders; (2) plating of particles on amorphous granules; (3) crystallization in powders; (4) structural collapse of dehydrated structures; (5) loss and oxidation of encapsulated lipids and flavors; (6) enzymatic activity; (7) nonenzymatic browning; (8) graining of boiled sweets; (9) sugar bloom in chocolate; (10) ice recrystallization; and (11) solute crystallization during frozen storage (Levine and Slade, 1988a).
A. Stickiness and Caking
zyxwvu
Stickiness and caking are phenomena that may occur when amorphous food products are heated or exposed to high humidities. It has been realized that stickiness and caking are typical of amorphous food powders. Stickiness and caking may occur both during production of dried foods and during food storage. The difference between stickiness and caking is not always clearly defined, but it may be assumed that stickiness refers to the tendency of a material to adhere on a surface of similar or different type. Such adhesion may occur temporarily and it does not necessarily involve caking. Caking may be considered as a collapse phenomenon that occurs due to stickiness of particles that form permanent aggregates and harden into a mass, which results in loss of free-flowing properties of powders. 1. Stickiness Stickiness of food materials may occur and affect material behavior and quality during both production and storage. Stickiness is also an important factor in the production of granular materials with instant properties from fine pow-
7. Time-DependentPhenomena
203
ders with agglomeration techniques. The main cause of stickiness is plasticization of particle surfaces, which allows a sufficient decrease of surface viscosity for adhesion. Peleg (1977) divided powders into cohesive powders and noncohesive powders. Cohesive powders were considered to be those in which interparticle forces are active and may reduce flowability and cause stickiness and caking. Noncohesive powders, in accordance, have negligible interparticle forces and they are free flowing, although interparticle forces may result from an increase in water content or temperature. Downton et al. (1982) referred to the considerations of White and Cakebread (1966) and defined sugar-containing powders such as dehydrated fruit juices to be amorphous materials, which have an extremely high viscosity in the glassy state. They suggested that an increase in temperature or water content is the cause of the formation of an incipient liquid state of a lower viscosity at the particle surface, which results in stickiness. Downton et al. (1982) proposed that particles may stick together if sufficient liquid can flow to build strong enough bridges between the particles and that the driving force for the flow is surface tension. The relationship between viscosity and surface tension was considered to follow equation (7.2), where 77 is viscosity, k is a constant, 7 is surface tension, t is contact time, K is a constant, and d is the distance over which flow must
zy
zyxw
OCCUr.
1/=
kTt Kd
(7.2)
Equation (7.2) suggests that stickiness is a time-dependent property of amorphous powders. Since the viscosity in the glassy state is extremely high, the contact time must be very long for the occurrence of stickiness. The dramatic decrease of viscosity above Tg obviously reduces the contact time and causes stickiness that can be related to the time scale of observation. The Lazar et al. (1956) method for measuring stickiness was used by Downton et al. (1982). They estimated that the method detected stickiness which occurred after a contact time of 1 to 10 s. The estimated contact time predicted that a surface viscosity lower than 106 to 108 Pa s was sufficient to cause stickiness. The hypothesis was tested using an amorphous powder, which was composed of a mixture of fructose (12.5% of total solids) and sucrose (87.5% of total solids). Downton et al. (1982) determined viscosities and sticky points for the material at various water contents. The sticky point was found to decrease with increasing water content. The critical viscosity that caused stickiness was almost independent on water content, ranging from 0.3 x 10⁷ to 4.0 x 10⁷ Pa s, which agreed well with the predicted viscosity
204
PhaseTransitionsin Foods
Isoviscous state and sticky point
I.U re
I-< n-" I.IJ IX. w F--
zyxwvutsrqponm Tg
WATER CONTENT
zyxw ~~"
Figure 7.3 Relationships between glass transition temperature, Tg, water content, viscosity, and occurrence of stickiness in food powders. The Tg decreases with increasing water content due to plasticization. Stickiness occurs at an isoviscous state, which is located above Tg with a constant temperature difference, T- Tg. The free-flowing properties of amorphous powders are maintained at temperatures below the Tg curve. Stickiness may occur above Tg and instantly at the sticky point temperature.
range. Wallack and King (1988) reported that the critical viscosity range applied also to other amorphous powders, including coffee extract and a mixture of maltodextrin, sucrose, and fructose. Soesanto and Williams (1981) studied the viscosity of a fructose-sucrose mixture of composition equal to that used by Downton et al. (1982). Soesanto and Williams (1981) found that the viscosity followed the WLF temperature dependence above Tg. It may be assumed that stickiness, when determined using the method of Lazar et al. (1956), is observed to occur at an isoviscosity state that is a consequence of the Tg and therefore defined by a constant T - T g (Slade and Levine, 1991). Roos and Karel (1991a) used DSC for the determination of the Tg of the fructose-sucrose mixture as a function of water content. They found that stickiness occurred at about 20~ above the Tg and that the sticky point temperature corresponded with the endset of the glass transition temperature range. The relationship between temperature, stickiness, viscosity, and water content is shown in Figure 7.3. The WLF equation with the constants C1 = -17.44 and C2 = 51.6 predicts an
zy zyxw
7. Time-DependentPhenomena
205
isoviscosity state of 107 Pa s at about 20~ above Tg, which agrees with the experimental and predicted critical viscosity values of Downton et al. (1982). The main importance of the relationship between the sticky point and Tg is that the Tg of amorphous food powders can be used as a stability indicator. Thus, knowledge of the Tg and its dependence on water content can be used to evaluate causes of stickiness problems, especially in the production of spray-dried powders. 2. Caking Caking of sticky powders occurs when sufficient time is allowed for surface contact of sticky particles. According to Peleg (1977) liquid bridging is one of the main interparticle phenomena that cause caking in food powders. Factors that may cause liquid bridging are (1) water adsorption; (2) melting of component compounds (e.g., lipids); (3) chemical reactions that produce liquids (e.g., nonenzymatic browning); (4) excessive liquid ingredient; (5) water released due to crystallization of amorphous sugars; and (6) wetting
Figure 7.4 Mechanism of caking in amorphous food powders or by melting of solid food components. Plasticization, either thermal or by water, that depresses Tg at the particle surface to below ambient temperature decreases viscosity and allows liquid bridging between particles. Transitions between the solid, glassy state and the liquid-like plasticized state may occur after initial caking. In some cases melting phenomena at the particle surface, e.g., melting of lipids, may cause caking. After Peleg (1983).
206
PhaseTransitionsin Foods
zyxwvut
of the powder or equipment. Food powders were considered to have a high complexity of flow behavior due to hygroscopicity and time-dependent physicochemical changes. The most common caking mechanism in food powders is plasticization due to water adsorption and subsequent interparticle fusion (Peleg and Mannheim, 1977; Peleg, 1983). Caking of amorphous powders results from the change of the material from the glassy to the less viscous liquid-like state, which allows liquid flow and formation of interparticle liquid bridges. Peleg (1983) pointed out that "humidity caking" is the most common mechanism of caking in food powders. Humidity caking is a consequence of an increasing water content, plasticization, and depression of Tg to below ambient temperature (e.g., Slade and Levine, 1991). A modification of the schematic representation of the caking mechanism suggested by Peleg (1983) is shown in Figure 7.4. The caking mechanism was schematically described as a surface wetting process. However, the effect of temperature was also considered.
zyxwvu
B. Collapse
Collapse is used here to refer to liquid flow and subsequent loss of quality of food materials, which may occur during dehydration processes or due to a change in the physical state of dehydrated foods (e.g., Tsourouflis et al., 1976; Flink, 1983). Collapse as a physicochemical phenomenon can be defined as viscous flow that results from decreasing viscosity above glass transition. The loss of structure occurs since the material is unable to support its own weight. Such flow is time-dependent and it can be observed from reducing of the macroscopic volume towards that typical of the liquid state and concomitant loss of porosity.
1. Collapse and glass transition Collapse, similarly to stickiness and caking, can be related to viscosity and glass transition of amorphous foods. Collapse may be considered also as an extended caking phenomenon, i.e., loss of structure that results in liquefaction, which occurs within the experimental time scale. Tsourouflis et al. (1976) suggested that the loss of structure is related to a decrease in viscosity. They found that the decrease of viscosity allowing sufficient flow for collapse could be achieved by various combinations of water content and temperature. Tsourouflis et al. (1976) observed that collapse of freeze-dried materials occurred above a specific temperature within 45 min and more rapidly above the collapse temperature, T c. The definition of the
zy zyxwv 7. Time-DependentPhenomena
207
collapse temperature allowed its measurement for amorphous foods with various collapse properties. Tsourouflis et al. (1976) reported that the collapse temperatures were high at low water contents and they decreased with increasing water content. They concluded that sufficient flow for collapse was possible above a critical viscosity, which was a function of temperature and water content. Another factor that was important in defining the collapse behavior was molecular weight of the solids. Tsourouflis et al. (1976) noticed that the Tc of maltodextrins increased with increasing molecular weight. They also reported that the addition of high molecular weight polysaccharides to such products as orange juice increased the Tc of the dehydrated material. A comparison between the Tc values and sticky point temperatures reported by Brennan et al. (1971) showed that the Tc and sticky point were related to water content in a similar manner. The relationships between Tc and water content were confirmed in a comprehensive study of collapse in dehydrated materials by To and Flink (1978a,b,c). To and Flink (1978b) also found significant similarities between the collapse temperature and glass transition
250
-
0 M100 9 M150
o w 200
o
M2oo
/
,,/
r162 F-
< n- 150 W
D_ I11
w 100 CO D_
0 Z I.IJ
O
ILl or" ii
ICE CRYSTAL DIAMETER
zyxw
Figure 7.18 Effect of storage temperature and time on the size of ice crystals in frozen foods. Freezing occurs at a low temperature at time tO and produces small ice crystals. Freezing is followed by storage at a higher temperature, which allows recrystallization. The size of the ice crystals increases and the range of the crystal sizes increases with increasing storage time from t l to t2.
Blanshard, 1986; Blanshard and Franks, 1987; Buyong and Fennema, 1988). Levine and Slade (1986) suggested that recrystallization of ice in frozen foods, which often occurs above a critical storage temperature for recrystallization, is governed by glass transition. The cryostabilization technology emphasizes that the glass transition of the maximally freeze-concentrated solute, T~, governs ice recrystallization rates and that stability is maintained during storage below Tg (Levine and Slade, 1988a,b, 1989). The effect of Tg on the rate of ice recrystallization is supported by the fact that sugar-containing foods suffer from recrystallization at lower temperatur6s than those containing polysaccharides. Levine and Slade (1989) suggested that the temperature dependence of ice recrystallization follows the WLF relat tionship above Tg, which was supported by data on a WLF-type increase of sensory iciness in ice cream products and frozen novelties with increasing T t Tg. The improved cryostabilization and ice recrystallization-reducing effects of polysaccharides in frozen foods accounted for their Tg-elevating properties. Evaluation of kinetic data on ice recrystallization should consider the effect of ice melting above T m on the depression of Tg, increase of T- Tg, and the additional decrease in relaxation times in comparison to the decrease
zyxwvu
zy zyxw
7. Time-DependentPhenomena
233
p
caused by the lower temperature difference of T - Tg. The results of Blanshard et al. (1991) on diffusion of water in sucrose solutions showed that the diffusion coefficient decreased significantly with increasing sucrose concentration, but was not affected by the addition of an alginate stabilizer. This finding suggests that the rate of ice recrystallization in freeze-concentrated solutions may be related to the solute concentration and viscosity of the unfrozen matrix. The viscosity of the unfrozen matrix is probably increased by stabilizers, which decrease the rate of recrystallization. Goff et al. (1993) reported that polysaccharide stabilizers did not significantly affect the Tg of ice cream mixes. Indeed, it would be expected that fairly high amounts of polysaccharides would be needed to have a significant effect on the Tg or onset of ice melting of frozen sugar matrices, since both water and low molecular weight sugars are plasticizers for the added polysaccharide. Thus, the control of ice crystal growth in stabilized ice cream above Tg is a function of kinetic properties of the unfrozen solute matrix and the mobility of water within the unfrozen matrix (Goff, 1992; Goff et al., 1993). Donhowe and Hartel (1994a) studied the rate of ice formation in frozen desserts at constant and oscillating temperatures between -20 and -5~ They found that the rate of the increase in crystal size was temperature-dependent and followed the modified power-law equation (7.4), where L1,0 is the number-based mean crystal size, L0,0 is the number-based mean crystal size at time t = 0, n is the power-law exponent, ~u* is the recrystallization rate, and t is time. P
?
L1,0 = LO,o + ~*t 1/n
(7.4)
Donhowe and Hartel (1994b) fitted the Arrhenius and WLF equations to the temperature dependence of the recrystallization rate of ice cream. The temperature dependence of the rate constant of equation (7.4) followed the Arrhenius equation and gave apparent activation energies of 112 to 126 kJ/mol, which were reported to be high but to agree with those found in previous studies of ice recrystallization kinetics. The data followed also the WLF kinetics, although the differences in the unfrozen water contents between various storage temperatures were not considered. Hagiwara and Hartel (1994) found a linear relationship between ice recrystallization rates and freezing temperatures of ice cream that was made with various sweeteners. The rate of recystallization at -15.2, -9.4, and -6.3~ increased with increasing temperature and increased at each temperature with decreasing freezing temperature. An increase in the amount of unfrozen water increased the recrystallization rate, but stabilizers decreased the recrystallization rate. Hagiwara and Hartel (1994) reported that the rate of ice recrystallization in-
234
zyxwvut zyxwvut
PhaseTransitionsin Foods
p
creased with increasing T - Tg, but the decreased rate due to the use of stabilizers could not be explained by the glass transition theory. It may be concluded that rates of ice recrystallization in frozen foods are affected by composition. The Tg and Tm values indicate temperatures for changes in the physical state which control kinetic phenomena. The amount of unfrozen water above T m increases significantly with increasing temperature, which decreases viscosity and increases the rate of ice recrystallization. Therefore, the effective Tg that depends on the extent of freeze-concentration should be considered in kinetic studies of ice recrystallization instead of T~.
c. Control of Recrystallization. Ice crystallization during freezing and recrystallization during frozen storage are important factors that affect frozen food quality. Knowledge of the crystallization mechanisms and effects of temperature and time on the physical state can be used to control ice formation and recrystallization in frozen foods. Blanshard and Franks (1987) proposed four itemized strategies for the control of ice crystals in foods. These included (1) the inhibition of nucleation; (2) the control of nucleation; (3) the control of ice crystal growth; and (4) exploitation of the glassy state. According to B lanshard and Franks (1987) the nucleation of ice in food materials can be inhibited by addition of high amounts of osmotically active materials such as sugars. Then, the unfrozen state together with a low temperature reduces rates of chemical and physical changes, but the detrimental effects of freezing and freeze-concentration can be avoided. The control of nucleation is based on the fact that ice nucleation and crystal growth are both temperature-dependent phenomena. However, their optimum temperatures are different. Extensive nucleation at low freezing temperatures can be used to produce a large number of small ice crystals or less supercooling and nucleation at higher freezing temperatures can be used to produce large ice crystals. The control of ice crystal growth involves addition of compounds, which limit extensive ice crystal growth or ice recrystallization. The added micro- or macromolecular additives such as polysaccharides and proteins may modify diffusion at the ice crystal water interface and thereby control crystal growth. The control of ice nucleation, crystal growth, and ice recrystallization by exploitation of the glassy state is based on the rate-controlling effect of the Tg without added compounds. The above suggestions for the control of ice formation and ice recrystallization in food materials are used frequently to control the size of ice crystals and the extent of ice recrystallization in frozen foods. Glass transition of the freeze-concentrated solutes and unfrozen water content at temperatures of frozen storage are obviously the most important factors which can be used to control ice formation and ice recrystallization. The Tg and thereby unfrozen
zy zyxwvut 7. Time-DependentPhenomena
235
water content and kinetics in freeze-concentrated matrices can be modified by proper changes in food composition.
C. Retrogradation of Starch
Retrogradation refers to changes which occur in starch paste, gel, or starch-
containing foods on aging. Retrogradation of starch has been of great interest due to its possible role in staling of bread and other textural changes in cereal and other starch-based foods. Starch retrogradation is a temperature- and time-dependent phenomenon, which involves at least partial crystallization of starch components. It can be observed from (1) an increased resistance to hydrolysis by amylolytic enzymes; (2) decreased light transmission; (3) loss of the ability to form the blue complex with iodine; (4) decreased solubility in water; (5) decreased gel compliance or increased modulus of elasticity; and (6) increasing X-ray diffraction (Collison, 1968). It may also be theoretically related to crystallization phenomena, which occur in synthetic polymers (Flory, 1953). According to the definition of Atwell et al. (1988) starch retrogradation occurs when molecules comprising gelatinized starch begin to reassociate in an ordered structure, which, under favorable conditions, results in a crystalline order. 1. Starch and starch components Retrogradation of starch has been considered to be basically a crystallization process of gelatinized starch, which can be detected from a change in the appearance of a starch gel or paste, from changes in X-ray diffraction patterns, or from an increasing size of a melting endotherm in DSC scans with increasing storage time. Generally cereal starches retrograde more rapidly than tuber starches. Waxy starches, which contain high amounts of amylopectin, retrograde slowly in comparison with the rapid retrogradation of starches which contain high amounts of linear amylose molecules (Collison, 1968). The rate of retrogradation is also dependent on the ratio of amylopectin and amylose, and on the molecular weight of the starch components. It is generally agreed that crystallization of amylose occurs rapidly after cooling of gelatinized starch (Miles et al., 1984), while amylopectin crystallization is a considerably slower process (Miles et al., 1985). Based on the data on bread-staling kinetics reported by Comford et al. (1964), which suggested similarities between the temperature dependence of polymer crystallization and changes in the elastic modulus of bread crumb, Mclver et al. (1968) considered starch retrogradation to be a polymer crystal-
236
PhaseTransitionsin Foods
zyxwvut
zyxwvu
lization process. Therefore, they used the Avrami equation in fitting kinetic data on starch retrogradation. The increase in crystallinity in wheat starch gels was studied with DTA. Mclver et al. (1968) used the area of the endothermic peak, which appeared during heating over the gelatinization temperature range as a measure of crystallinity. The Avrami equation, which was written into the form of equation (7.5), where LSM0 is the initial heat of gelatinization, L~/f is the enthalpy change after crystallization to maximum extent, and A n t is the enthalpy change after time t, was fitted to the data on crystallinity as a function of time. ~
f - AH t
=e
_kt n
(7.5)
LS~f -- ZS~0
However, Mclver et al. (1968) used the DTA peak area in equation (7.5) instead of the AH values, which have been more applicable for results obtained with DSC in later studies (Fearn and Russell, 1982). Mclver et al. (1968) found that the DTA peak area of gelatinized wheat starch gels increased with increasing storage time. Data on the increase in crystallinity as determined from the change in the peak area with increasing storage time followed equation (7.5). The constant n at 21~ was found to be about 1, which suggested that the crystallization process was instantaneous and that the growth of the crystallites occurred in one dimension only. However, the use of the value obtained for n as an indicator of the crystal morphology of starch has been criticized (Fearn and Russell, 1982). Mclver et al. (1968) pointed out that gelatinized starch may contain ordered regions which form nuclei for crystal growth at the crystallization temperature. A subsequent study by Colwell et al. (1969) showed that the constant n of equation (7.5) was about unity at several crystallization temperatures between -1 and 43~ Colwell et al. (1969) found also that the temperature at the DTA peak maximum increased with increasing storage temperature. Based on the results of the extent of crystallization at several temperatures Colwell et al. (1969) concluded that the extent of retrogradation in starch gels above 21 ~ was less than was suggested by the results of Cornford et al. (1964) for firming of bread crumb. Russell (1987) found that the Avrami exponent, n, was less than unity for retrogradation of starch gels of various starches. The water content of the gels was 57% (w/w) and they were stored at 21~ The limiting enthalpies at maximum crystallization increased in the order amylomaize < wheat -- potato < waxy maize. The order was related to the amylopectin content of the starches and suggested that the increase of A n t with time was due to the amylopectin fraction. Russell (1987) found also that the rate constant, k, of
7. Time-DependentPhenomena
237
equation (7.5) was sensitive to the time of observation and especially to the number of data points at the beginning and at the end of retrogradation. However, rate constants of amylomaize, waxy maize, and potato starch gels were significantly higher than the rate constant of wheat starch gel, which suggested that retrogradation was faster in gels, which had a lower amylose content or contained no lipids. Russell (1987) concluded that DSC may be used to get information on the crystallization of the amylopectin fraction in starch gels, but the total crystallinity should be determined by X-ray diffraction measurements. The rate of starch retrogradation is dependent on water content. Zeleznak and Hoseney (1986) reported that retrogradation of gelatinized wheat starch with water contents between 20 and 80% (w/w) was slow at low and high water contents. An increase of melting enthalpy during storage at 25~ showed a maximum at water contents between 50 and 60% (w/w). Levine and Slade (e.g., 1990; Slade and Levine, 1989) have emphasized the use of the fringed-micelle model in the description of the partially crystalline structure of starch. The model is particularly useful in the description of the partially crystalline structure of starch gels, which contain amorphous regions and microcrystalline regions as junction zones between molecules (Slade and Levine, 1989). Slade and Levine (1989) considered retrogradation to be a nonequilibrium polymer crystallization process in completely amorphous starch-water melts, which proceeds with a rate that is determined by temperature and water content. The slow crystallization of amylopectin was referred to as a nucleation-limited growth process, which occurs above glass transition in a mobile, viscoelastic, fringed-micelle network. The crystallization mechanism is thermally reversible above melting temperature and applies to both amylose and amylopectin. The effect of Te, on the rate of crystallization in starch has not been experimentally verified, but the fact that retrogradation is faster at temperatures close to 0~ than at room temperature suggests that the rate approaches a maximum at a temperature between Te, and Tm according to polymer crystallization theories (Flory, 1953; Slade and Levine, 1989). The glass transition temperature which controls crystallization in 50% (w/w) starch gels is approximately at-75~ and the melting temperature may be assumed to be at 50 to 60~ It is probable that the rate of crystallization increases below Tm and reaches a maximum well above Te,. The above suggestion for the Te, and Tm values agrees fairly well with the observed higher crystallization rates at temperatures close to 0~ than at 25~ Obviously freeze-concentration below the freezing temperature reduces the rate of crystallization. Laine and Roos (1994) studied the effect of water content and T Te, on the extent of crystallization of gelatinized corn starch at fairly low water contents and high storage temperatures. Crystallization was found to occur
zy
zyxw
238
zyxwvu zyxwvutsr PhaseTransitionsin Foods
above Tg, but the extent of crystallization as determined from the limiting enthalpy value after 10 days with DSC increased as the T - T g increased from 20 to 75~ It is interesting to notice that the melting temperature of retrograded starch gels has also been observed to depend on storage temperature. These differences have been attributed to the perfection of the crystals formed (Slade and Levine, 1989), which may also explain the differences in melting enthalpies observed by Laine and Roos (1994). It may be concluded that starch retrogradation is a typical polymer crystallization process that occurs most likely to various extents depending on the amount of plasticizer and the temperature in relation to Tg and Tm. 2. Staling of bread
Studies on bread staling have often concluded that staling occurs due to changes in the starch fraction, which shows increasing crystallinity, which can be measured by X-ray diffraction (e.g., Cornford et al., 1964; Zobel, 1973). Comford et al. (1964) pointed out that the rate of the increase in starch crystallinity increases with decreasing temperature. The crystallization process in high-polymer systems was stated to be slow just below the melting temperature, to become faster with increasing supercooling, and then to decrease to zero at lower temperatures, where the molecular mobility is insufficient to allow crystallization. Basically, the principles found to affect time-dependent crystallization in starch gels apply also to starch retrogradation in bread. However, staling may be affected by other food components. The similarities between polymer crystallization and bread staling according to Cornford et al. (1964) suggested that the Avrami equation could be used in modeling the rate of bread staling. They considered the crumb modulus, E, to be a linear measure of the degree of crystallization and that the fraction of the uncrystallized material, 1 - a, was obtained from equation (7.6), where E0 and E f refer to the initial and final elastic modulus, respectively, and Et is the modulus at time t. Cornford et al. (1964) found that the elastic modulus had a limiting value that was used as Ef. 1 - ot - E f - E t
(7.6)
e -eo Ef - Et
el-e0
=e
_kt n
(7.7)
7. Time-DependentPhenomena
239
zyxwvu
Fresh bread ~~
Refreshened bread
< -!i.-. z U.I
Dough
zyxwv v
STORAGE TIME
Figure 7.19 Effect of baking, storage, and reheating on the enthalpy changes observed in bread. The initial enthalpy change occurs during baking due to crystallite melting in the starch fraction. After cooling of bread heat is released due to crystallization in starch. CrystaUites formed during retrogradation melt during reheating, which causes the appearance of an endotherm in DSC thermograms.
Cornford et al. (1964) gave the Avrami equation in the form of equation (7.7) and stated that equation (7.7) fitted to modulus data with n = 1. Therefore, a plot of log ( E f - E t ) against t gave a straight line and a time constant equal to 1/k was used in the characterization of the temperature dependence of the staling process. The time constant increased with increasing storage temperature, which showed that the rate of the change in modulus decreased with increasing storage temperature over the temperature range o f - 1 to 32~ Although the Avrami equation was found to fit to the data both on change in modulus and on the DTA peak area (Cornford et al., 1964; Mclver et al., 1968) the change in modulus was not necessarily a direct measure of crystallinity. Fearn and Russell (1982) stated that the modulus is a measure of a macroscopic property, while DSC measures a microscopic property of bread. The modulus contains contributions from various bread crumb components and the cell structure, which obviously are independent of crystallinity. It should also be pointed out that several studies have suggested that the value n < 1 in the Avrami equation applies for retrogradation of both starch gels and bread (Russell, 1987). In DSC studies of bread staling equation (7.5) may be
240
PhaseTransitionsin Foods
zyxwvut
fitted to kinetic data. The relationships between melting enthalpy change and storage time are shown schematically in Figure 7.19. Bread staling as primarily a consequence of time-dependent amylopectin crystallization is governed by glass transition, although it is also affected by composition (Kim and D'Appolonia, 1977; Kulp and Ponte, 1981). Therefore, accelerated staling can be achieved by allowing nucleation to occur at a low temperature followed by storage close to melting temperature, which increases the rate of crystal growth (Slade and Levine, 1989). Laine and Roos (1994) showed that crystallization in white bread occurred above Tg at low water contents. However, experimental data on the relationships between storage T - Tg, water content, and storage time for bread staling are scarce.
References
zyx zyxwvut zyxwvu
Ablett, S., Izzard, M.J. and Lillford, P.J. 1992. Differential scanning calorimetric study of frozen sucrose and glycerol solutions. J. Chem. Soc., Faraday Trans. 88: 789-794. Ablett, S., Izzard, M.J., Lillford, P.J., Arvanitoyannis, I. and Blanshard, J.M.V. 1993. Calorimetric study of the glass transition occurring in fructose solutions. Carbohydr. Res. 246: 13-22. Atwell, W.A., Hood, L.F., Lineback, D.R., Varriano-Marston, E. and Zobel, H.F. 1988. The terminology and methodology associated with basic starch phenomena. Cereal Foods Worm 33:306-311. Berlin, E., Anderson, A.B. and Pallansch, M.J. 1968a. Water vapor sorption properties of various dried milks and wheys. J. Dairy Sci. 51: 1339-1344. Berlin, E., Anderson, B.A. and Pallansch, M.J. 1968b. Comparison of water vapor sorption by milk powder components. J. Dairy Sci. 51:1912-1915. Berlin, E., Anderson, B.A. and Pallansch, M.J. 1970. Effect of temperature on water vapor sorption by dried milk powders. J. Dairy Sci. 53: 146-149. Blanshard, J.M.V. and Franks, F. 1987. Ice crystallization and its control in frozen-food systems. Chpt. 4 in Food Structure and Behaviour, ed. J.M.V. Blanshard and P. Lillford. Academic Press, Orlando, FL, pp. 51-65. Blanshard, J.M.V., Muhr, A.H. and Gough, A. 1991. Crystallization from concentrated sucrose solutions. In Water Relationships in Foods, ed. H. Levine and L. Slade. Plenum Press, New York, pp. 639-655. Brennan, J.G., Herrera, J. and Jowitt, R. 1971. A study of the factors affecting the spray drying of concentrated orange juice, on a laboratory scale. J. Food Technol. 6: 295-307. Buyong, N. and Fennema, O. 1988. Amount and size of ice crystals in frozen samples as influenced by hydrocolloids. J. Dairy Sci. 71: 2630-2639. Chang, Z.H. and Baust, J.G. 1990. Effects of sub-Tg isothermal annealing on the glass transition of D-sorbitol. Cryo-Lett. 11:251-256. Chang, Z.H. and Baust, J.G. 199 la. Physical aging of glassy state: DSC study of vitrified glycerol systems. Cryobiology 28: 87-95.
zy zyxwvu 7. Time-DependentPhenomena
241
Chang, Z.H. and Baust, J.G. 1991b. Physical aging of the glassy state: Sub-Tg ice nucleation in aqueous sorbitol systems. J. Non-Cryst. Solids 130: 198-203. Chirife, J. and Buera, M.P. 1994. Water activity, glass transition and microbial stability in concentrated/semimoist food systems. J. Food Sci. 59:921-927. Chuy, L.E. and Labuza, T.P. 1994. Caking and stickiness of dairy-based food powders as related to glass transition. J. Food Sci. 59: 43-46. Collison, R. 1968. Starch retrogradation. Chpt. 6 in Starch and Its Derivatives, ed. J.A. Radley, 4th ed. Chapman and Hall, London, pp. 194-202. Colwell, K.H., Axford, D.W.E., Chamberlain, N. and Elton, G.A.H. 1969. Effect of storage temperature on the ageing of concentrated wheat starch gels. J. Sci. Food Agric. 20: 550-555. Cornford, S.J., Axford, D.W.E. and Elton, G.A.H. 1964. The elastic modulus of bread crumb in linear compression in relation to staling. Cereal Chem. 41: 216-229. Donhowe, D.P. and Hartel, R.W. 1994a. Influence of temperature on ice recrystallization in fi'ozen desserts. I. Accelerated storage studies. Food Struct. In press. Donhowe, D.P. and Hartel, R.W. 1994b. Influence of temperature on ice recrystallization in frozen desserts. II. Bulk storage studies. Food Struct. In press. Downton, G.E., Flores-Luna, J.L. and King, C.J. 1982. Mechanism of stickiness in hygroscopic, amorphous powders. Ind. Eng. Chem. Fundam. 21:447-451. Fearn, T. and Russell, P.L. 1982. A kinetic study of bread staling by differential scanning calorimetry. The effect of loaf specific volume. J. Sci. Food Agric. 33: 537-548. Fennema, O.R. 1973a. Nature of the freezing process. Chpt. 4 in Low-Temperature Preservation of Foods and Living Matter, ed. O.R. Fennema, W.D. Powrie and E.H. Marth. Marcel Dekker, New York, pp. 150-239. Fennema, O.R. 1973b. Freeze-preservation of foods - technological aspects. Chpt. 11 in Low-Temperature Preservation of Foods and Living Matter, ed. O.R. Fennema, W.D. Powrie and E.H. Marth. Marcel Dekker, New York, pp. 504-550. Fennema, O.R. and Powrie, W.D. 1964. Fundamental of low-temperature food preservation. Adv. Food Res. 13: 219-347. Ferry, J.D. 1980. Viscoelastic Properties of Polymers, 3rd ed. John Wiley & Sons, New York. Flink, J.M. 1983. Structure and structure transitions in dried carbohydrate materials. Chpt. 17 in Physical Properties of Foods, ed. M. Peleg and E.B. Bagley. AVI Publishing Co. Westport, CT, pp. 473-521. Flory, P.J. 1953. Principles of Polymer Chemistry. Cornell University Press, Ithaca, NY. Franks, F. 1990. Freeze drying: From empiricism to predictability. Cryo-Lett. 11:93-110. Goff, H.D. 1992. Low-temperature stability and the glassy state in frozen foods. Food Res. lntl 25: 317-325. Goff, H.D., Caldwell, K.B., Stanley, D.W. and Maurice, T.J. 1993. The influence of polysaccharides on the glass transition in frozen sucrose solutions and ice cream. J. Dairy Sci. 76: 1268-1277. Hagiwara, T. and Hartel, R.W. 1994. Influence of storage temperature on ice recrystallization in ice cream. Paper No. 71C-3. Presented at the Annual Meeting of the Institute of Food Technologists, Atlanta, GA, June 25-29. Hartel, R.W. 1993. Controlling sugar crystallization in food products. Food Technol. 47(11): 99-104, 106-107. Heldman, D.R. and Singh, R.P. 1981. Food Process Engineering, 2nd ed. AVI Publishing Co., Westport, CT.
242
PhaseTransitionsin Foods
zyxwvut zyxwv
Herrington, B.L. 1934. Some physico-chemical properties of lactose. I. The spontaneous crystallization of supersaturated solutions of lactose. J. Dairy Sci. 17:501-518. Herrington, T.M. and Branfield, A.C. 1984a. Physico-chemical studies on sugar glasses. I. Rates of crystallization. J. Food Technol. 19: 409-425. Herrington, T.M. and Branfield, A.C. 1984b. Physico-chemical studies on sugar glasses. II. Glass transition temperature. J. Food Technol. 19: 427-435. Iglesias, H.A. and Chirife, J. 1978. Delayed crystallization of amorphous sucrose in humidified freeze dried model systems. J. Food Technol. 13: 137-144. Jouppila, K. and Roos, Y.H. 1994a. Water sorption and time-dependent phenomena of milk powders. J. Dairy Sci. 77: 1798-1808. Jouppila, K. and Roos, Y.H. 1994b. Glass transitions and crystallization in milk powders. J. Dairy Sci. 77: 2907-2915. Kalichevsky, M.T., Jaroszkiewicz, E.M. and Blanshard, J.M.V. 1992. Glass transition of gluten. 2: The effect of lipids and emulsifiers. Int. J. Biol. Macromol. 14: 267-273. Kalichevsky, M.T., Blanshard, J.M.V. and Marsh, R.D.L. 1993. Applications of mechanical spectroscopy to the study of glassy biopolymers and related systems. Chpt. 6 in The Glassy State in Foods, ed. J.M.V. Blanshard and P.J. Lillford. Nottingham University Press, Loughborough, pp. 133-156. Karel, M. 1973. Recent research and development in the field of low-moisture and intermediate-moisture foods. CRC Crit. Rev. Food Technol. 3: 329-373. Kim, S.K. and D'Appolonia, B.L. 1977. The role of wheat flour constituents in bread staling. Baker's Dig. 51(1): 38-44, 57. King, N. 1965. The physical structure of dried milk. Dairy Sci. Abstr. 27: 91-104. Kulp, K. and Ponte, J.G. 1981. Staling of white pan bread: Fundamental causes. CRC Crit. Rev. Food Sci. Nutr. 15: 1-48. Laine, M.J.K. and Roos, Y. 1994. Water plasticization and recrystallization of starch in relation to glass transition. In Proceedings of the Poster Session, International Symposium on the Properties of Water, Practicum H, ed. A. Argaiz, A. L6pez-Malo, E. Palou and P. Corte. Universidad de las Am6ricas-Puebla, pp. 109-112. Lazar, M.E., Brown, A.H., Smith, G.S., Wong, F.F. and Linquist, F.E. 1956. Experimental production of tomato powder by spray drying. Food Technol. 10: 129134. Levine, H. and Slade, L. 1986. A polymer physico-chemical approach to the study of commercial starch hydrolysis products (SHPs). Carbohydr. Polym. 6:213-244. Levine, H. and Slade, L. 1988a. 'Collapse' phenomena - A unifying concept for interpreting the behaviour of low moisture foods. Chpt. 9 in Food Structure - Its Creation and Evaluation, ed. J.M.V. Blanshard and J.R. Mitchell. Butterworths, London, pp. 149180. Levine, H. and Slade, L. 1988b. Principles of "cryostabilization" technology from structure/property relationships of carbohydrate/water systems - A review. Cryo-Lett. 9:2163. Levine, H. and Slade, L. 1989. A food polymer science approach to the practice of cryostabilization technology. Comments Agric. Food Chem. 1:315-396. Levine, H. and Slade, L. 1990. Influences of the glassy and rubbery states on the thermal, mechanical, and structural properties of doughs and baked products. Chpt. 5 in Dough Rheology and Baked Product Texture, ed. H. Faridi and J.M. Faubion. AVI Publishing Co., New York, pp. 157-330.
zy zyxw
7. Time-DependentPhenomena
243
Levine, H. and Slade, L. 1993. The glassy state in applications for the food industry, with an emphasis on cookie and cracker production. Chpt. 17 in The Glassy State in Foods, ed. J.M.V. Blanshard and P.J. Lillford. Nottingham University Press, Loughborough, pp. 333-373. Luyet, B. and Rasmussen, D. 1968. Study by differential thermal analysis of the temperatures of instability of rapidly cooled solutions of glycerol, ethylene glycol, sucrose and glucose. Biodynamica 10(211): 167-191. MacFarlane, D.R. 1986. Devitrification in glass-forming aqueous solutions. Cryobiology 23: 230-244. Makower, B. and Dye, W.B. 1956. Equilibrium moisture content and crystallization of amorphous sucrose and glucose. J. Agric. Food Chem. 4: 72-77. McCarthy, M.J. and McCarthy, K.L. 1994. Quantifying transport phenomena in food processing with nuclear magnetic resonance imaging. J. Sci. Food Agric. 65: 257-270. Mclver, R.G., Axford, D.W.E., Colwell, K.H. and Elton, G.A.H. 1968. Kinetic study of the retrogradation of gelatinized starch. J. Sci. Food Agric. 19: 560-564. McNulty, P.B. and Flynn, D.G. 1977. Force-deformation and texture profile behavior of aqueous sugar glasses. J. Texture Stud. 8:417-431. Miles, M.J., Morris, V.J. and Ring, S.G. 1984. Some recent observations on the retrogradation of amylose. Carbohydr. Polym. 4: 73-77. Miles, M.J., Morris, V.J., Orford, P.D. and Ring, S.G. 1985. The roles of amylose and amylopectin in the gelation and retrogradation of starch. Carbohyr. Res. 135: 271-281. Muhr, A.H. and Blanshard, J.M.V. 1986. Effect of polysaccharide stabilizers on the rate of growth of ice. J. Food Technol. 21:683-710. Nickerson, T.A. 1974. Lactose. Chpt. 6 in Fundamental of Dairy Chemistry, ed. B.H. Webb, A.H. Johnson and J.A. Alford, 2nd ed. AVI Publishing Co., Westport, CT, pp. 273-324. Nickerson, T.A. and Moore, E.E. 1972. Solubility interrelations of lactose and sucrose. J. Food Sci. 37: 60-61. Noel, T.R., Ring, S.G. and Whittam, M.A. 1992. Dielectric relaxations of small carbohydrate molecules in the liquid and glassy states. J. Phys. Chem. 96: 5662-5667. Noel, T.R., Ring, S.G. and Whittam, M.A. 1993. Relaxations in supercooled carbohydrate liquids. Chpt. 8, in The Glassy State in Foods, ed. J.M.V. Blanshard and P.J. Lillford. Nottingham University Press, Loughborough, pp. 173-187. Peleg, M. 1977. Flowability of food powders and methods for its evaluation. J. Food Process Eng. 1: 303-328. Peleg, M. 1983. Physical characteristics of food powders. Chpt. 10 in Physical Properties of Foods, ed. M. Peleg and E.B. Bagley. AVI Publishing Co., Westport, CT, pp. 293323. Peleg, M. 1992. On the use of the WLF model in polymers and foods. Crit. Rev. Food Sci. Nutr. 32: 59-66. Peleg, M. 1993. Mapping the stiffness-temperature-moisture relationship of solid biomaterials at and around their glass transition. Rheol. Acta 32: 575-580. Peleg, M. and Mannheim, C.H. 1977. The mechanism of caking of powdered onion. J. Food Process. Preserv. 1: 3-11. Perez, J. 1994. Theories of liquid-glass transition. J. Food Eng. 22:89-114. Roos, Y.H. 1987. Effect of moisture on the thermal behavior of strawberries studied using differential scanning calorimetry. J. Food Sci. 52: 146-149. Roos, Y.H. 1993a. Water activity and physical state effects on amorphous food stability. J. Food Process. Preserv. 16: 433-447.
244
PhaseTransitionsin Foods
zyxwvut zy
Roos, Y. 1993b. Melting and glass transitions of low molecular weight carbohydrates. Carbohydr. Res. 238: 39-48. Roos, Y. and Karel, M. 1990. Differential scanning calorimetry study of phase transitions affecting the quality of dehydrated materials. Biotechnol. Prog. 6: 159-163. Roos, Y. and Karel, M. 199 la. Plasticizing effect of water on thermal behavior and crystallization of amorphous food models. J. Food Sci. 56: 38-43. Roos, Y. and Karel, M. 1991b. Phase transitions of mixtures of amorphous polysaccharides and sugars. Biotechnol. Prog. 7: 49-53. Roos, Y. and Karel, M. 1991c. Amorphous state and delayed ice formation in sucrose solutions. Int. J. Food Sci. Technol. 26: 553-566. Roos, Y. and Karel, M. 199 l d. Nonequilibrium ice formation in carbohydrate solutions. Cryo-Lett. 12: 367-376. Roos, Y. and Karel, M. 1991e. Water and molecular weight effects on glass transitions in amorphous carbohydrates and carbohydrate solutions. J. Food Sci. 56: 1676-1681. Roos, Y. and Karel, M. 1992. Crystallization of amorphous lactose. J. Food Sci. 57: 775777. Russell, P.L. 1987. The ageing of gels from starches of different amylose/amylopectin content studied by differential scanning calorimetry. J. Cereal Sci. 6: 147-158. Sfi, M.M. and Sereno, A.M. 1994. Glass transitions and state diagrams for typical natural fluits and vegetables. Thermochim. Acta 246: 285-297. Saleki-Gerhardt, A. and Zografi, G. 1994. Nonisothermal and isothermal crystallization of sucrose from the amorphous state. Pharm. Res. 11:1166-1173. Saltmarch, M. and Labuza, T.P. 1980, Influence of relative humidity on the physicochemical state of lactose in spray-dried sweet whey powders. J. Food Sci. 45:1231-1236, 1242. San Jose, C., Asp, N.-G., Burvall, A. and Dahlquist, A. 1977. Water sorption in hydrolyzed dry milk. J. Dairy Sci. 60: 1539-1543. Shogren, R.L. 1992. Effect of moisture content on the melting and subsequent physical aging of cornstarch. Carbohydr. Polym. 19: 83-90. Simatos, D. and Blond, G. 1975. The porous structure of freeze dried products. Chpt. 24 in Freeze Drying and Advanced Food Technology, ed. S.A. Goldblith, L. Rey and W.W. Rothmayr. Academic Press, New York, pp. 401-412. Simatos, D. and Blond, G. 1991. DSC studies and stability of frozen foods. In Water Relationships in Foods, ed. H. Levine and L. Slade. Plenum Press, New York, pp. 139-155. Simatos, D. and Turc, J.M. 1975. Fundamentals of freezing in biological systems. Chpt. 2 in Freeze Drying and Advanced Food Technology, ed. S.A. Goldblith, L. Rey and W.W. Rothmayr. Academic Press, New York, pp. 17-28. Slade, L. and Levine, H. 1989. A food polymer science approach to selected aspects of starch gelatinization and retrogradation. In Frontiers in Carbohydrate Research - 1: Food Applications, ed. R.P. Millane, J.N. BeMiller and R. Chandrasekaran. Elsevier, London, pp. 215-270. Slade, L. and Levine, H. 1991. Beyond water activity: Recent advances based on an alternative approach to the assessment of food quality and safety. Crit. Rev. Food Sci. Nutr. 30:115-360.
Slade, L. and Levine, H. 1995. Glass transitions and water-food structure interactions. Adv. Food Nutr. R es. 38. In press. Soesanto, T. and Williams, M.C. 1981. Volumetric interpretation of viscosity for concentrated and dilute sugar solutions. J. Phys. Chem. 85:3338-3341.
zy zyxwvutsr 7. Time-DependentPhenomena
245
Struik, L.C.E. 1978. Physical Aging in Amorphous Polymers and Other Materials. Elsevier, Amsterdam. Supplee, G.C. 1926. Humidity equilibria of milk powders. J. Dairy Sci. 9:50-61. Tant, M.R. and Wilkes, G.L. 1981. An overview of the nonequilibrium behavior of polymer glasses. Polym. Eng. Sci. 21: 874-895. To, E.T. and Flink, J.M. 1978a. 'Collapse,' a structural transition in freeze dried carbohydrates. I. Evaluation of analytical methods. J. Food Technol. 13:551-565. To, E.T. and Flink, J.M. 1978b. 'Collapse,' a structural transition in freeze dried carbohydrates. II. Effect of solute composition. J. Food Technol. 13: 567-581. To, E.T. and Flink, J.M. 1978c. 'Collapse,' a structural transition in freeze dried carbohydrates. HI. Prerequisite of recrystallization. J. Food Technol. 13: 583-594. Troy, H.C. and Sharp, P.F. 1930. a and 13 lactose in some milk products. J. Dairy Sci. 13: 140-157. Tsourouflis, S., Flink, M. and Karel, M. 1976. Loss of structure in freeze-dried carbohydrates solutions: Effect of temperature, moisture content and composition. J. Sci. Food Agric. 27:509-519. Vuataz, G. 1988. Preservation of skim-milk powders: Role of water activity and temperature in lactose crystallization and lysine loss. In Food Preservation by Water Activity Control, ed. C.C. Seow. Elsevier, Amsterdam, pp. 73-101. Wallack, D.A. and King, C.J. 1988. Sticking and agglomeration of hygroscopic, amorphous carbohydrate and food powders. Biotechnol. Prog. 4:31-35. Warburton, S. and Pixton, S.W. 1978. The moisture relations of spray dried skimmed milk. J. Stored Prod. Res. 14: 143-158. Weitz, A. and Wunderlich, B. 1974. Thermal analysis and dilatometry of glasses formed under elevated pressure. J. Polym., Sci. Polym. Phys. Ed. 12:2473-2491. White, G.W. and Cakebread, S.H. 1966. The glassy state in certain sugar-containing food products. J. Food Technol. 1: 73-82. Wunderlich, B. 1981. The basis of thermal analysis. Chpt. 2, in Thermal Characterization of Polymeric Materials, ed. E.A. Turi. Academic Press, New York, pp. 91-234. Young, F.E., Jones, F.T. and Lewis, H.J. 1951. Prevention of the growth of sucrose hydrates in sucrose sirups. Food Res. 16: 20-29. Zeleznak, K.J. and Hoseney, R.C. 1986. The role of water in the retrogradation of wheat starch gels and bread crumb. Cereal Chem. 63:407-411. Zobel, H.F. 1973. A review of bread staling. Baker's Dig. 47(10): 52-61.
This Page Intentionally Left Blank
CHAPTER 8
Mechanical Properties
I.
Introduction
zyxwvutsr
Mechanical properties of foods are important to their behavior in processing, storage, distribution, and consumption. Information on various compositional factors on mechanical properties and their dependence on temperature and water content is needed for choosing proper equipment that is required, e.g., for transportation, mixing, and size reduction, as well as for the evaluation of the tolerance of mechanical stress during manufacturing. Food packaging is often used to protect foods from mechanical stress or transfer of water between the product and its environment. Mechanical properties affect also the perceived texture of foods during consumption. Several compositional and processing parameters affect mechanical properties of foods. The overall mechanical properties may be defined by cell structure which is typical of various vegetables and fruits or they may result from the physical state, flow properties, or porosity. However, the physical state of food solids is one of the most important factors that affect mechanical properties of low-moisture and frozen foods in which small changes in 247
248
PhaseTransitionsin Foods
zyxwvut
zyxwv
temperature or water content may significantly affect the physical state due to phase transitions. Therefore, the physical state may affect the overall quality of products starting from changes that may occur during processing, e.g., cookies (Levine and Slade, 1993; Slade et al., 1993), to the final stage of consumption, since the mechanical properties define product texture and sensory properties, e.g., perceived crispness (Katz and Labuza, 1981; Sauvageot and Blond, 1991). It should also be remembered that the mechanical properties of fatty foods are almost exclusively defined by the physical state and crystallinity of the lipid fraction. This chapter provides information on factors that affect mechanical properties of food materials. The relationships between mechanical properties and the physical state and phase transitions during food storage will be discussed with an emphasis on the effects of mechanical properties on food quality. The main emphasis is on those mechanical properties which are related to phase transitions occurring in the nonequilibrium state of nonfat food solids and their time-dependent characteristics.
II.
Stiffness
Stiffness is used here as a general term that refers to the response of food materials to an external stress. The various effects of melting and glass transitions on relaxation times of mechanical properties suggest that changes in stiffness are obvious and occur over such transition temperature ranges. Changes in stiffness may be observed from modulus curves which may describe changes in mechanical properties as a function of frequency, time, temperature, water activity, or water content. Water plasticization is often equal to thermal plasticization and therefore water at a constant temperature has an effect on mechanical properties similar to that caused by an increase in temperature at a constant water content. It is also well known that food materials give a modulus curve when a mechanical property is plotted against water content or water activity (Slade and Levine, 1993; Peleg, 1993, 1994a,b).
A. Modulus Curves of Food Materials
A number of studies of mechanical properties of foods have not related observed changes to phase transitions, although changes in mechanical properties have been observed to occur as a function of temperature, water activ-
8. Mechanical Properties
249
ity, and water content. The first studies which reported temperature, water content, and time dependence of mechanical properties of biological, foodrelated materials were those by Nakamura and Tobolsky (1967) on starch, the study by Hammerle and Mohsenin (1970) on corn endosperm, and the results on mechanical properties of collagen and gelatin as summarized by Yannas (1972). These studies suggested that temperature, diluent content, and time have an equal effect on the modulus, which can be superimposed with any of the variables. Hammerle and Mohsenin (1970) used the WLF relationship for the calculation of time-temperature and time-water content shift factors. In a later study the time-temperature and time-moisture content relationships of rice kernels were found to follow the general behavior of viscoelastic materials (Chattopadhyay et al., 1979).
zy
zyxwvu
1. Effect of water on mechanical properties Water in foods is the main plasticizer which may significantly affect mechanical properties during processing and storage. Changes in the mechanical properties as a function of water activity or water content can be described with modulus curves, which reflect the change in viscoelastic properties above glass transition. The viscoelastic behavior of cereals has been studied as a function of temperature and water content due to its importance to the rheological behavior of grains in milling. Hammerle and Mohsenin (1970) determined modulus data for corn endosperm as a function of time at several temperatures. The WLF method was used to determine shift factors for time-temperature superpositioning of the modulus data. They collected modulus data also as a function of water content and used the same method for time-moisture superpositioning. The data were superimposed using a time-temperature and time-moisture superpositioning principle to a single master curve at 25~ and 13% (w/w) water. Hammerle and Mohsenin (1970) did not report the Tg for corn endosperm, but the shape of the master curve as well as the effect of temperature and water content on the modulus suggested that the material was in the glassy state at low water contents. An increase in temperature or water content resulted in plasticization and changes in modulus, which were typical of viscoelastic amorphous polymers. Similar viscoelastic behavior has also been observed to occur in other cereal materials. Multon et al. (1981) reported data on elastic modulus for wheat grains as a function of water activity and water content. The modulus curves showed that water activity and water content had a significant effect on modulus, which decreased with increasing water activity or water content. No glass transitions were reported for the material, but Multon et al. (1981) concluded that a homogeneous and vitreous
250
PhaseTransitionsin Foods
zyxwvut
structure with high modulus was more difficult to grind and resulted in a larger particle size and a higher protein content of the flour. Both water and temperature plasticization decrease the modulus of biological materials in a similar manner and the modulus curves may be superimposed as was suggested by Hammerle and Moshenin (1970). The effect of water plasticization on the modulus of elastin was reported by Lillie and Gosline (1990). They concluded that modulus data obtained at various water contents and temperatures could be superimposed and that the WLF equation was applicable in predicting isoshift curves. Modulus data for wheat gluten as a function of water content were reported by Attenburrow et al. (1990). The modulus values indicated that the material was glassy at water contents below about 10% (w/w) and a rapid decrease of the modulus occurred at higher water contents as the material was transformed to the rubbery state due to plasticization. Attenburrow and Davies (1993) used ice cream wafers as a model system to examine the influence of water content on the mechanical properties of low-moisture foods. The effect of water on Young's modulus had the typical shape of a modulus curve. A schematic representation of the effect of water activity or water content on modulus is given in Figure 8.1. Additional evidence of the effects of water on the modulus of
zyxw
Glassy state
O9 _..! 121
0
e-
Liquid state
r
WATER ACTIVITY OR WATER CONTENT
Figure 8.1 Effect of water plasticization on the modulus of amorphous biopolymers and food materials. Water plasticization decreases the modulus as the glass transition is depressed to below ambient temperature.
zy zyxw 8. Mechanical Properties
251
food materials has been reported by Kalichevsky et al. (1992, 1993) and it is obvious that the decrease of modulus of amorphous food materials occurs due to plasticization. At a sufficiently high water content the material loses the glassy structure and becomes a viscoelastic liquid. The effect of water on the modulus of food solids is similar to the effect of plasticizers on mechanical properties of synthetic polymers at a constant temperature. 2. Mathematical analysis of stiffness
The effect of water on the modulus of food materials suggests that stiffness as a function of modulus is related to the physical state and plasticization of food solids. Foods with a glassy structure have a high modulus and viscosity and obviously their stiffnesses are high. A dramatic change in stiffness is observed when plasticization of a glassy material becomes sufficient to cause the transformation into the supercooled liquid state. A master curve of modulus may be obtained with superimposed data and used in the characterization of effects of temperature and water on the mechanical properties. However, characterization of the mechanical properties directly in terms of temperature or water is often more important in practical applications. Peleg (1993, 1994a,b) pointed out that mechanical changes in amorphous foods are characterized by a modulus curve showing downward concavity. The curve is obtained when the change in a mechanical property is plotted against temperature, water activity, or water content. Peleg (1993, 1994a,b) emphasized that the change could be observed in any mechanical property such as the extent of stickiness, caking, collapse, or modulus that could be generally referred to as stiffness. He analyzed parameters of mechanical properties and modulus data from various studies and found that the modulus curves of a glucose glass, proteins, wheat grains, other food materials, and synthetic polymers were of a shape that was similar as a function of temperature or water content. He suggested that a single equation could be used to model the stiffness data.
Y/Ys =
1 + exp
a'(W)
(8.1)
Equation (8.1), where Y is the stiffness parameter (e.g., modulus), Ys is the value of the stiffness parameter in a reference state (e.g., in the glassy state), Tc(W) is temperature that characterizes the transition region, and a'(W) is a constant that indicates the steepness of the stiffness curve [(W) refers to the constant water content], assumes that the change in stiffness occurs at a constant water content and it can be used to model data as a function of
252
zyxwvut
zyxwvuts zyxw
PhaseTransitionsin Foods
temperature. Equation (8.1) could be expressed also in the form of equation (8.2) with values for water content, W, water content that characterizes the transition region, Wc(T), and constant a"(T) [(T)refers to the constant temperature] which is applicable in modeling stiffness as a function of water content.
Y/Ys =
1 + exp
a"(T)
(8.2)
Stiffness as a function of water activity, aw, is given by equation (8.3), where awc(T) is the water activity that characterizes the transition region and a"(T) is a constant [(T)refers to the constant temperature].
Y/Ys -
/{ Eawawc'l) 1 + exp
a"(T)
(8.3)
Peleg (1994a) stressed that equations (8.1.), (8.2), or (8.3) are probably more applicable for modeling stiffness than the WLF model, since information on the changes in mechanical properties of foods is needed over the Tg range. The WLF model assumes a steady state below Tg and a dramatic decrease of viscosity above Tg. Peleg (1994a) pointed out that the proposed stiffness model allowed a moderate drop in the magnitudes of mechanical properties at the onset of the transition, which is typical of observed changes in stiffness instead of the sudden dramatic decrease in relaxation times suggested by the WLF model. However, it should be noticed that the WLF model is extremely useful if modulus data are superimposed in the form of the master curve. The model proposed by Peleg (1993) is also limited to the quantification of observed data with no reference to the viscoelastic properties or time-dependent behavior of stiffness (Wollny and Peleg, 1994). Equations (8.1), (8.2), and (8.3) can be combined into the form of equation (8.4), where X refers to aw, T, or W and Xc to awc(T), Tc(W), or Wc(T), respectively. (8.4)
Equation (8.4) can be rewritten into the form of equation (8.5). Equation (8.5) may also be written into the form of equation (8.6), which suggests that a plot showing In [(Ys/Y)- 1] against X gives a straight line. Thus, the constant a(X) can be obtained from the slope of the line and Xc gives the
zy zyx
8. Mechanical Properties
253
zyx
value for X, which corresponds to the decrease of stiffness by 50%. Stiffness data can also be analyzed in terms of relative stiffness, Y/Ys, which normalizes experimental stiffness data to values between 0 and 1.
) XXc
In
- 1 = a(-X-)
In
- 1 =
)
Xc
(8.5)
1
a(X) + a(X-----sX
(8.6)
The reference value, Xc, is useful in establishing criteria for storage conditions of amorphous foods, since it is a manifestation of a change in mechanical properties caused by the glass transition. Equation (8.6) provides a convenient means for modeling stiffness data for practical applications that require knowledge and predictability of changes in mechanical properties in terms of temperature, water content, or water activity. In addition to the twodimensional analysis of temperature and water content dependence of stiffness it can be represented in three-dimensional surfaces (Peleg, 1993, 1994b), which describe the combined effects of water and temperature on stiffness in a single plot. It may be concluded that mathematical characterization of stiffness is important in evaluating the e]~fect of temperature and water content on the mechanical properties of food materials. Modeling experimental data on stiffness at a constant water content or at a constant temperature may be successful without numerical values for the reference temperature or glass transition temperature, but combined modeling of effects of both temperature and water on stiffness requires the use of the reference temperature, which may be the Tg,. However, knowledge of the relationships between temperature and water content is often sufficient for locating critical values for temperature and water content above which mechanical properties are dramatically changed due to glass transition and the change in the physical state into the rubbery state.
B. Stiffness and Food Properties
Mechanical properties of food powders, cereal foods, snack foods, candies, etc., are important in defining various quality parameters, including freeflowing properties of powders, stickiness, and perceived texture. Modeling of mechanical properties or stiffness as a function of temperature and water content provides a valuable tool for estimating changes, which may occur
2 54
PhaseTransitionsin Foods
zyxwvut
during a probable shelf life or exposures to abusing environmental conditions. 1. Mechanical properties of food powders Food powders are often produced by rapid dehydration and they contain amorphous carbohydrates and proteins, which become plasticized by water. Changes in mechanical properties may be caused by depression of the glass transition to below storage temperature, which results in dramatic changes in flow properties and loss of acceptable quality. Such changes may be related to the viscous flow of amorphous compounds in the rubbery state and it is often assumed that product quality can be maintained in the glassy state. The effects of water content on the mechanical properties are well known. Hygroscopic food powders become sticky, decrease in volume, and lose their free-flowing properties above a critical water content or water activity. The mechanical properties of food powders have been related to glass transition of the powder in a few studies. Aguilera et al. (1993) studied the effect of water activity on the collapse of powders of fish protein hydrolysates. They defined collapse as the deformation of a fixed powder volume, which occurred due to gravitational forces. The deformation of the material with various water activities was determined from the change in volume after a fixed storage time. The curve that showed the extent of collapse as a function of water activity had the typical shape of a modulus curve, which suggested that no collapse occurred at low water activities. Above a critical water activity the change in the extent of collapse was dramatic over a fairly narrow aw range between about 0.3 and 0.5 aw. At higher water activities collapse became almost instant and independent of aw. Aguilera et al. (1993) assumed that the WLF equation was applicable to predict viscosity for the occurrence of the observed collapse at T - T g = 35.8~ The estimated viscosity for collapse was 105 to 107 Pa s. Glass transition of amorphous food powders is the main cause of changes in mechanical properties during storage. The results of Aguilera et al. (1993) suggested that the free-flowing properties of hygroscopic food powders were lost even by short exposures of such powders to high humidities. Such changes in mechanical properties during storage can be avoided or reduced by establishing and applying critical values for temperature and water content.
zyxwv
2. Diffusivity Diffusivity in low-moisture foods is significantly affected by water content. The diffusivity in food solids has been found to be low at low water contents
8. Mechanical Properties
255
and to decrease above some critical water content. Diffusivity can be related to the physical state of food solids, but it is also dependent on temperature and a number of other factors, especially on the physical structure and particularly on the porosity of the food material (Karel and Saguy, 1991). Fish (1958) reported diffusivity values for water in starch gels as a function of temperature and water content. The diffusion coefficient increased with increasing temperature and equation (8.7), where D is the diffusion coefficient, DO is the frequency factor for diffusion, ED is the activation energy of diffusion, and R is the gas constant, could be fitted to its temperature dependence.
zy
zyxw
ED D = Doe RT
(8.7)
Although the diffusivity data reported by Fish (1958) followed the Arrhenius-type temperature dependence they found that the activation energy for diffusion increased significantly with decreasing water content. Fish (1958) reported that the diffusion characteristics of water were normal when the water content was higher than 15 g/100 g of solids. At lower water contents the diffusion coefficient decreased more than expected with decreasing water content. Fish (1958) pointed out that similar behavior had been reported for a wide variety of natural and synthetic macromolecules. Karathanos et al. (1990) and Marousis et al. (1991) reported diffusion coefficients for water in various starch matrices as a function of water content at relatively high temperatures. The results for gelatinized starch indicated that diffusivity was significantly decreased at water contents below 15 g/100 g of solids, in agreement with the results of Fish (1958). Diffusion in other starch matrices, including pressed, pressed granular, granular, and expanded extrudate, was higher due to the differences in the macroscopic structure. However, diffusion in the expanded extrudate seemed to decrease at low water contents. Marousis et al. (1991) concluded that the diffusion behavior of water was related to physical or physicochemical changes in stored foods. The results of these studies suggest that glass transition, as shown in Figure 8.2, may cause the observed changes in diffusivity, which is obvious from the shape of the curve, showing diffusion as a function of water content. Diffusion is affected by temperature as shown in Figure 8.2. Equation (8.7) defines the typical temperature dependence of the diffusion coefficient. However, glass transitions seem to have additional effects on the temperature dependence of diffusion. Glass transition in polymers has been found to cause a change in the activation energy of diffusion, which is often higher
256
Phase Transitions in Foods
zyxwvutsrq 10 -10
Marousis et al. (1991 60oC ~
03
~-- 10-11 E . = .
>_ 10-12 2~ u_
Fish (1958) ,, 25oC ~. 1oC
121 -13 m10
> I--0 u.I
u_ 10-14 uJ
I I I I I I I I I I I I I I I
I I I I I I I I I I I I I I I I I
I I I I I I I I I I I I I I I I I
Tg
10 -15
0
10 20 30 WATER CONTENT (g/100 g of solids)
40
zyx
Figure 8.2 Diffusivity of water in gelatinized starch at 1, 25, and 60~ as a function of water content. The water content, which depresses the glass transition temperature, Tg, to below the experimental temperature is shown with an arrow for each set of data. The Tg was predicted with the Gordon and Taylor equation according to Roos and Karel (1991). The data for diffusivity are from the studies indicated.
above Tg than below Tg (Hopfenberg and Stannett, 1973). Such behavior has also been found to occur in starch (Arvanitoyannis et al., 1994). Therefore, Arrhenius plots that show In D against 1/T may have two linear regions, which are separated by a step change indicating that ED reaches a maximum value in the vicinity of the glass transition temperature (Vrentas and Duda, 1978). The effect of glass transition on the temperature dependence of diffusion coefficients is shown schematically in Figure 8.3. In polymers the differences between diffusion below and above Tg have been proposed to result from the ability of the penetrant molecules to create "holes" during sorption and diffusion of the molecules between such holes (Hopfenberg and Stannett, 1973). The effect of water plasticization on diffusivity, as was shown in Figure 8.2 for starch, has a typical behavior of polymer-solvent systems (Vrentas et al., 1982). Vrentas et al. (1982) reported that the amount of free volume available for molecular transport near the Tg is relatively small. The addition of solvent or an increase in temperature causes a substantial increase in free volume, which allows an enhanced molecular transfer within the polymer matrix.
8. MechanicalProperties
257
t"
I
lIT
zyxwv zy
Figure 8.3 A schematic representation of the effect of the glass transition temperature, Tg, on diffusivity, D. The diffusivity below Tg and above Tg may follow the Arrhenius-
type temperature dependence. However, a step change in the vicinity of Tg may be observed and the activation energy for diffusion is higher above Tg than below Tg.
The change in diffusion, which occurs due to the change in polymer structure and results in anomalous diffusion effects, has been characterized with a diffusion Deborah number, De, (Vrentas and Duda, 1978; Peppas and Brannon-Peppas, 1994). The diffusion Deborah number is given by equation (8.8), where 7r is a characteristic relaxation time for the material and tD is a characteristic diffusion time of the system.
De = - tD
(8.8)
A small Deborah number suggests that the relaxation time is much smaller than the diffusion time. Therefore, structural changes occur during the diffusion process, but the rates of the structural changes are much faster than diffusion and the diffusion process follows Fickian diffusion. A large Deborah number describes a diffusion process in which diffusion is considerably faster than structural changes and the process also follows Fickian diffusion. However, Deborah numbers on the order of 1 indicate that molecular relaxations and diffusion occur in comparable time scales and the changes in molecular structure may cause deviation from Fickian diffusion. Diffusion with a large Deborah number occurs below Tg and diffusion with a small
258
PhaseTransitionsin Foods
zyxwvut zyxw
Deborah number is likely to be observed well above Tg. Food materials which are plasticized by water may have a large Deborah number at low water contents. Water adsorption or an increase in temperature results in plasticization, which increases mobility, and a change in diffusivity may be observed as the ratio of relaxation time and diffusion time approaches unity due to glass transition (Peppas and Brannon-Peppas, 1994). Diffusivity is probably one of the most important properties of several compounds in food materials. Diffusivity is affected by changes in stiffness and also in crystallinity. As shown above, it is obvious that diffusion of water as well as other compounds is retarded in glassy foods. Diffusivity is also affected by changes in stiffness above glass transition. The effective diffusion coefficient may be assumed to increase above Tg, but it should also be noticed that the changes in the macroscopic structure, e.g., due to stickiness, caking, collapse, and crystallization of amorphous components, may significantly affect diffusion. It is well known that diffusion in collapsed matrices is retarded in comparison with porous noncollapsed materials. The effects of phase transitions on diffusion are of considerable importance in the evaluation of the effects of the physical state on rates of deteriorative reactions, retention of volatiles in dehydration, and kinetics of quality changes in low-moisture and frozen foods. 3. Encapsulation
Amorphous food solids may encapsulate compounds which are not miscible with other food solids. Compounds that may become encapsulated in solids which are miscible with water include various nonpolar compounds such as lipids, e.g., oils and fats, volatile compounds, and flavors. Encapsulation is common in dehydration processes and extrusion due to the rapid removal of solvent water and formation of the amorphous matrix. Flink and Karel (1972) studied loss of encapsulated tert-butanol and 2propanol from freeze-dried maltose after rehumidification at various relative humidities. As shown in Figure 8.4 the loss occurred above a critical relative humidity and it was accompanied with structural transitions. The curve for loss of the volatiles has the typical shape of a modulus curve and it also followed equation (8.6). Based on the results of Flink and Karel (1972) and several other studies on flavor retention in dehydrated foods it is obvious that the loss of the encapsulated compounds occurs as the food matrix is transformed from the glassy state into the rubbery state. Chirife et al. (1973) studied the effect of exposure time and relative humidity on the retention of npropanol in freeze-dried PVP. The results showed that the loss increased
8. Mechanical Properties
259
zy
zyxwvutsrqponm 3.5
Tg
~O'~3 . 0
-
O
o li ~ 2.5 , I--Z
Tert-butan01
w 2.0
.
I-Z
2-pr0pan01
O o 1.5
.
U.I
--J_ ~,, 1.0
.
0 > 0.51:
of 0
I
I
20
I
I
I
I
I
40 60 RELATIVE HUMIDITY (%)
I
I
zyxw
80
100
Figure 8.4 Loss of volatiles from freeze-dried maltose as a function of storage relative
humidity. The volatiles are retained encapsulated in the amorphous, glassy sugar matrix at relative humidities which maintain the glass transition temperature, Tg, above storage temperature. Loss of the encapsulated volatiles occurs as the relative humidity is sufficient to depress the Tg to below ambient temperature due to collapse and possible crystallization.
with increasing water activity in accordance with the results of Flink and Karel (1972). Chirife and Karel (1974) studied also the effect of temperature on 1-propanol retention in freeze-dried maltose. They found that 1-propanol was retained at 82~ but loss occurred at 100~ during an exposure of 24 hrs. Roos and Karel (1991) determined the Tg of dry maltose with DSC to be 87~ This value supports the conclusion that volatiles are likely to be retained in amorphous matrices below Tg, and structural changes including the time-dependent crystallization above Tg may cause the loss of encapsulated compounds and flavors in dehydrated foods. Encapsulated compounds may become lost from amorphous carbohydrate matrices due to the crystallization of the encapsulating compound, e.g., lactose (Flink and Karel, 1972). To and Flink (1978) studied oxidation of encapsulated linoleic acid. The lipid was encapsulated by freeze-drying oil-inwater emulsions containing various encapsulating carbohydrates. After freeze-drying the dried materials were washed with hexane to remove the nonencapsulated fat. Powders with various compositions and collapse temperatures were exposed to different temperatures and oxidation of the fat was
260
zyxwvut
zyxwvut
PhaseTransitionsin Foods
followed as a function of time. Release and oxidation of the lipid occurred as carbohydrates in the encapsulating matrix crystallized. Similar results were reported by Shimada et al. (1991), who studied oxidation of methyl linoleate which was encapsulated in an amorphous lactose matrix. Exceeding the matrix Tg due to an increase in either temperature or water content resulted in time-dependent crystallization and release of the oil. Thus, oxidation of the oil proceeded with a rate that was obviously correlated with the rate of lactose crystallization. It should also be noticed that several food matrices which contain encapsulated lipids and flavors do not exhibit rapid crystallization of component compounds. However, collapse above Tg cannot be avoided due to the viscous flow above Tg. The results of Labrousse et al. (1992) on the effect of collapse on oxidation of an encapsulated lipid showed that encapsulated compounds may be lost due to crystallization, but in noncrystallizing matrices such compounds may be partially lost and also become reencapsulated during collapse. 4. Crispness
A number of instrumental (Andersson et al., 1973; Bruns and Bourne, 1975), acoustic (Vickers and Bourne, 1976; Vickers, 1981), and sensory methods have been used to evaluate crispness of food materials. Bruns and Bourne (1975) found that crisp foods have a characteristic force-deformation curve which can be identified by a linear slope of the initial portion of the curve. Such curves can be obtained with a three-point snap test. The best correlations of sensory and instrumental data are often obtained by using both acoustic and force-deformation measurements (Vickers, 1988). It should also be noticed that Young's modulus has a high correlation with perceived crispness (Vickers and Christensen, 1980). In various studies crispness of low-moisture foods has been related to water content or relative humidity and water plasticization of structure (Quast and Karel, 1972; Zabik et al., 1979; Katz and Labuza, 1981; Sauvageot and Blond, 1991). Katz and Labuza (1981) suggested that crispy snack foods have a critical water content, where the addition of water enables mobility of macromolecules and the consumer perceives the resultant loss of crispness. They found that the initial slope of the force-deformation curve was almost constant at low water contents. Katz and Labuza (1981) assumed that at low water activities the water content was insufficient to affect mechanical properties. Above a critical water content a significant decrease of the initial slope occurred, and the products lost their crispness and became texturally unacceptable. The steady state water activity at which crispness is lost is
& MechanicalProperties 1.o
=
.
6
Perceived crispness as I - describedby equation (8.3)
0.8
261
Crispy texture
~0
~
Loss of hess
--
0.6 > ~
T2 > T3, increases with increasing water content and the observed browning rate increases with increasing T - Tg. The T - Tg increases with increasing aw. The observed browning rate increases with increasing aw and also with increasing temperature, T1 > T2 > T3. Browning may occur also below Tg.
zy zyx
9. ReactionKinetics
293
reaction had a different rate constant not only due to the lower T g and therefore higher T - Tg but also due to the higher water content and therefore different concentration of the reactants. It would be expected that the true rate constant of the browning reaction is affected by both water content and temperature. A material with a high water content has a low Tg and browning may occur at a relatively low temperature. However, the true rate constant decreases with decreasing temperature, which also decreases the observed rate constant. A schematic representation of observed relationships between browning rate, temperature, and water content is shown in Figure 9.7. It may be concluded that browning data should be obtained as a function of temperature and also as a function of water content at constant temperatures, which allows evaluation of the various effects which temperature and water content may have on the physical state and observed browning rate. Determination of optical density is a convenient method to follow the extent of nonenzymatic browning in model systems. The method involves extraction of reaction products with an ethanol-water solution and determination of optical density at 280 or 420 nm. Optical density at 280 nm is a
Supercooled liquid state T > Tg
~
.
~
Glass transition
temperature nge
~
Tg
zyxw Glassy state T