On the Measurement of Social Phenomena: A Methodological Approach (SpringerBriefs in Political Science) 3030775356, 9783030775353
This book explores the analysis of social phenomena, using a multidisciplinary approach while addressing statistical, ec
143 26 2MB
English Pages 116 [105] Year 2021
Preface
Acknowledgements
Contents
About the Author
List of Figures
List of Tables
List of Boxes
1 Introduction
2 A Three-Step Procedure
2.1 Classification of Social Phenomena
2.1.1 Classification of Threats to Journalists
2.2 Metrics of Social Phenomena
2.2.1 Measures of Threats to Journalists
2.3 Measurement of Social Phenomena
2.3.1 Measuring Threats to Journalists
2.4 Shadow Parts of Social Phenomena
2.4.1 The Shadow Part of Threats to Journalists
3 Covariant Dimensions
3.1 Selection
3.1.1 Selection of Covariant Dimensions of Journalistic Activity
3.2 Indicators
3.2.1 Indicators of Journalistic Activity
3.3 Relationships
3.3.1 Concepts of Relationship
3.3.2 Study Design
3.3.3 Model Selection
3.3.4 Threats to Journalists
4 Integrating
4.1 Integrating Knowledge
4.2 Integrating Data
4.2.1 Integrating Data for the Analysis of the News Market
Selected References
Recommend Papers


![Cognitive Security: A System-Scientific Approach (SpringerBriefs in Computer Science) [1st ed. 2023]
9783031307096, 9783031307089, 3031307089](https://ebin.pub/img/200x200/cognitive-security-a-system-scientific-approach-springerbriefs-in-computer-science-1st-ed-2023-9783031307096-9783031307089-3031307089.jpg)


![A Pragmatic Perspective of Measurement (SpringerBriefs in Psychology) [1st ed. 2021]
3030740242, 9783030740245](https://ebin.pub/img/200x200/a-pragmatic-perspective-of-measurement-springerbriefs-in-psychology-1st-ed-2021-3030740242-9783030740245.jpg)

- Author / Uploaded
- Marco Delmastro
File loading please wait...
Citation preview
SPRINGER BRIEFS IN POLITIC AL SCIENCE
Marco Delmastro
On the Measurement of Social Phenomena A Methodological Approach
SpringerBriefs in Political Science
More information about this series at http://www.springer.com/series/8871
Marco Delmastro
On the Measurement of Social Phenomena A Methodological Approach
Marco Delmastro Italian Communications Authority (AGCOM) Rome, Italy
ISSN 2191-5466 ISSN 2191-5474 (electronic) SpringerBriefs in Political Science ISBN 978-3-030-77535-3 ISBN 978-3-030-77536-0 (eBook) https://doi.org/10.1007/978-3-030-77536-0 © The Author(s), under exclusive license to Springer Nature Switzerland AG 2021 This work is subject to copyright. All rights are solely and exclusively licensed by the Publisher, whether the whole or part of the material is concerned, specifically the rights of translation, reprinting, reuse of illustrations, recitation, broadcasting, reproduction on microfilms or in any other physical way, and transmission or information storage and retrieval, electronic adaptation, computer software, or by similar or dissimilar methodology now known or hereafter developed. The use of general descriptive names, registered names, trademarks, service marks, etc. in this publication does not imply, even in the absence of a specific statement, that such names are exempt from the relevant protective laws and regulations and therefore free for general use. The publisher, the authors and the editors are safe to assume that the advice and information in this book are believed to be true and accurate at the date of publication. Neither the publisher nor the authors or the editors give a warranty, expressed or implied, with respect to the material contained herein or for any errors or omissions that may have been made. The publisher remains neutral with regard to jurisdictional claims in published maps and institutional affiliations. This Springer imprint is published by the registered company Springer Nature Switzerland AG The registered company address is: Gewerbestrasse 11, 6330 Cham, Switzerland
Writing books gives me a great sense of freedom, because you’re not tied to the boundaries in which a song necessarily moves Achille Lauro
For Lulù, Milli, and Cippa
Preface
This book is written during the period of isolation that forced us to stay at home and to reflect on various aspects of our lives. I have reasoned on some elements that have characterised my scientific research and work over more than twenty years. It is perhaps for this reason that I stood to reflect on some methodological and ethical issues of applied science. These days it is so palpable to see how important the data are, how their analysis is key to orientating our daily actions, and that, often, behind each of them, there is an event, a story, there are feelings, that we have the duty to analyse with care and diligence. I chose the threats to journalists as one the “fil rouge” of my reasoning because it represents a crucial social issue, especially in Italy, where some events, such as the murder of journalist Giancarlo Siani, have marked an entire city (Naples) and, more generally, an entire country. Public and private violence episodes are difficult to study rigorously, and therefore represent the best test case for a digression of applied methodology. On the one hand, there is the temptation to put too much in the analysis, to the point of distorting the results to corroborate our ideological beliefs (or prejudices). This is known as “research bias”, i.e., a process where the scientists performing the research influence the results, to portray a certain outcome. Of course, this problem is very much present in science, especially in the social sciences, where issues with an ethical dimension are very often addressed. In addition, applied sciences are undergoing a period of great ferment and revolution in methods and tools. This is due to many factors, in large part to the emergence of the use of the so-called “big data”: an unprecedented volume of data and information from different sources and in various formats now provide insights into many individual and social dimensions that previously could not be examined. In this case, the research bias is often embodied in a widespread reluctance to change, which has always distinguished scientific evolution, according to a leapfrog pattern described by Thomas Kuhn. On the other hand, social scientists run the opposite risk of putting too little, because if they focus only on technical issues, they will inevitably move away from the phenomenon under study, for mere intellectual speculation, or even worse, for a few more scientific publications. ix
x
Preface
Over the years, I believe I have been the victim of both “temptations”, and I fear I am in good company, given the rising lack of trust in scientific research and the paradoxical proliferation, in an era of scientific drive, of conspiracy and unscientific theories. Research implies a very difficult balance between care of data, respect for the stories behind them and ideological and research biases which, even in absolute good faith, direct the analyses. The use of non-robust contagion data today seems to me to be disgraceful. Uncertain classifications, inaccurate measurement systems, and yet this piece of information is provided and disseminated every day throughout the world. Important individual and collective decisions are made upon them, and political, national and international, disputes arise. My feeling is that we are in too much of a hurry to find solutions, especially solutions that reflect our prior beliefs, so that we remain in the riverbed of what we already know. But often life surprises us with new situations, different points of view and elements that we cannot fully understand. To admit it would be a first step to sweep away conspiracy explanations; to open ourselves to different points of view, a stimulus to build more solid and socially shared scientific explanations. The reflections that follow do not contain revolutionary points of view or new theories, they are wide-ranging considerations aimed at identifying a “modus operandi” that could be useful to deal rigorously with the analysis of social phenomena. Enjoy the reading! Rome, Italy
Marco Delmastro
Acknowledgements
I am grateful to several people for their help with this book and more generally for discussing with me general issues of applied science. First, I am indebted to all colleagues of the Department of Economics and Statistics of Agcom. In particular, Otello Ardovino, Emanuele Brugnoli, Alessia Leonardi and Gennaro Ragucci have improved with their corrections and suggestions this book beyond measure. Similarly, suggestions from Fabiana Zollo were invaluable. I also want to thank Jacopo Arpetti, Elisa Colorito, Stefano D’Alfonso, Raffaella Della Morte, Donatella Di Lieto, Ilaria Fevola, Aldo Fontanarosa, Adriana Lotti, Francesco Marrazzo, Sara Mastrovita, Rocco Mazza, Giuseppe Mennella, Gianmarco Pondrano, Attilio Scaglione, and Alberto Spampinato, for suggestions and support on some contents of the book. For the part concerning the analysis of threats to journalists, I thank the following institutions: FNSI (Federazione Nazionale della Stampa), INPGI (Istituto Nazionale di Previdenza dei Giornalisti Italiani), ISTAT (Istituto Nazionale di Statistica), Ordine dei Giornalisti, Ossigeno per l’Informazione, USGF (Unione Sindacale Giornalisti Freelance) and USIGRAI (Unione Sindacale Giornalisti Rai). Special thanks are due to Mimma Iorio and Federico Polidoro. The book also benefited from discussions on specific topics with Stefano Castriota, Massimo G. Colombo, Mario Morcellini, Domenico Piccolo, Antonio Scala, Rosaria Simone, Sergio Splendore, Mirco Tonin, and Giorgia Zamariola. I am very grateful to Niko Chtouris and the team of SpringerNature for their patience and support. This book is dedicated to Keith Cowling, for sharing with me his passion, ethics, and knowledge of social sciences many years ago when I was just a young Ph.D. student, lost before science.
xi
Contents
1 Introduction . . . . . . . . . . . . . . . . . . . . . . . . . . . . . . . . . . . . . . . . . . . . . . . . . . . .
1
2 A Three-Step Procedure . . . . . . . . . . . . . . . . . . . . . . . . . . . . . . . . . . . . . . . . . 2.1 Classification of Social Phenomena . . . . . . . . . . . . . . . . . . . . . . . . . . . . 2.1.1 Classification of Threats to Journalists . . . . . . . . . . . . . . . . . . . 2.2 Metrics of Social Phenomena . . . . . . . . . . . . . . . . . . . . . . . . . . . . . . . . . 2.2.1 Measures of Threats to Journalists . . . . . . . . . . . . . . . . . . . . . . . 2.3 Measurement of Social Phenomena . . . . . . . . . . . . . . . . . . . . . . . . . . . . 2.3.1 Measuring Threats to Journalists . . . . . . . . . . . . . . . . . . . . . . . . 2.4 Shadow Parts of Social Phenomena . . . . . . . . . . . . . . . . . . . . . . . . . . . . 2.4.1 The Shadow Part of Threats to Journalists . . . . . . . . . . . . . . . .
5 6 11 12 19 20 28 32 35
3 Covariant Dimensions . . . . . . . . . . . . . . . . . . . . . . . . . . . . . . . . . . . . . . . . . . . 3.1 Selection . . . . . . . . . . . . . . . . . . . . . . . . . . . . . . . . . . . . . . . . . . . . . . . . . . . 3.1.1 Selection of Covariant Dimensions of Journalistic Activity . . . . . . . . . . . . . . . . . . . . . . . . . . . . . . . . . . . . . . . . . . . . . 3.2 Indicators . . . . . . . . . . . . . . . . . . . . . . . . . . . . . . . . . . . . . . . . . . . . . . . . . . 3.2.1 Indicators of Journalistic Activity . . . . . . . . . . . . . . . . . . . . . . . 3.3 Relationships . . . . . . . . . . . . . . . . . . . . . . . . . . . . . . . . . . . . . . . . . . . . . . . 3.3.1 Concepts of Relationship . . . . . . . . . . . . . . . . . . . . . . . . . . . . . . . 3.3.2 Study Design . . . . . . . . . . . . . . . . . . . . . . . . . . . . . . . . . . . . . . . . . 3.3.3 Model Selection . . . . . . . . . . . . . . . . . . . . . . . . . . . . . . . . . . . . . . 3.3.4 Threats to Journalists . . . . . . . . . . . . . . . . . . . . . . . . . . . . . . . . . .
37 38 42 46 49 55 56 57 59 59
4 Integrating . . . . . . . . . . . . . . . . . . . . . . . . . . . . . . . . . . . . . . . . . . . . . . . . . . . . . 4.1 Integrating Knowledge . . . . . . . . . . . . . . . . . . . . . . . . . . . . . . . . . . . . . . . 4.2 Integrating Data . . . . . . . . . . . . . . . . . . . . . . . . . . . . . . . . . . . . . . . . . . . . . 4.2.1 Integrating Data for the Analysis of the News Market . . . . . .
67 68 75 75
Selected References . . . . . . . . . . . . . . . . . . . . . . . . . . . . . . . . . . . . . . . . . . . . . . . . . 89
xiii
About the Author
Marco Delmastro is the Managing Director of the Department of Economics & Statistics at AGCOM (the Italian regulator for the communications services). Before, he worked in Agcom as the President’s Economic Advisor. Before joining Agcom, he was economist at the Italian Competition Authority (AGCM), and case handler of antitrust cases in the communications sector. He spent few years at Politecnico di Milano as a Senior Research Fellow and at the University of Pavia as a Research Fellow. He received both a Master degree in Economics at Collegio Carlo Alberto (Turin) and a Doctoral degree in Economics at the University of Pavia. He also holds a Ph.D. in Economics at the University of Warwick (UK). He is author of numerous scientific publications on topics that cover industrial economics, competition and regulation, sociology, computational psychology and behavioural sciences. With Professor Massimo Colombo he is co-author of “The Economics of Organizational Design”, published by Palgrave Macmillan. More recently, he has published (joint with Prof. Antonio Nicita) a book on “Big Data”, edited by Il Mulino. For these research achievements, he has obtained national scientific qualifications as a Full Professor in Economics, Political Economy, and Applied Economics.
xv
List of Figures
Fig. 2.1 Fig. 2.2 Fig. 2.3 Fig. 3.1 Fig. 3.2 Fig. 3.3 Fig. 3.4 Fig. 3.5
Fig. 3.6
Fig. 4.1 Fig. 4.2 Fig. 4.3 Fig. 4.4 Fig. 4.5 Fig. 4.6 Fig. 4.7 Fig. 4.8 Fig. 4.9
Trend of threats to journalists in Italy . . . . . . . . . . . . . . . . . . . . . . . . Detection of acts of private violence: methodological issues . . . . . . Distribution of journalists who have suffered traditional threats by various categories . . . . . . . . . . . . . . . . . . . . . . . . . . . . . . . . . . . . . . CUB analysis of motivational items . . . . . . . . . . . . . . . . . . . . . . . . . . Distribution of DCI (dangerousness composite indicator) . . . . . . . . Distribution of PCI (proximity composite indicator) . . . . . . . . . . . . Distribution of MCI (motivations composite indicator) . . . . . . . . . . Probability (P(x)) of a journalist suffering at least one threat of any kind as a function of composite indices (x = DCI, PCI, MCI, Mafia Crime Index) . . . . . . . . . . . . . . . . . . . . . . . . . . . . . . . . . . Probability (P(x)) that a threatened journalist reduces or withdraws the information coverage of a topic (“chilling effect”) by gender and territorial context (mafia crime territorial index) . . . . . . . . . . . . . . . . . . . . . . . . . . . . . . . . . . . . . . . . . . Relationship between Covid-19 and depression in Italy . . . . . . . . . . Relationship between depression and compliance to Covid-19 norms . . . . . . . . . . . . . . . . . . . . . . . . . . . . . . . . . . . . . . . . . . . . . . . . . . Covid-19 as a syndemic . . . . . . . . . . . . . . . . . . . . . . . . . . . . . . . . . . . Daily coverage of local newspapers of mafias (2016–2019) . . . . . . Monthly coverage of local newspapers of mafias (2016–2019) . . . . Territorial coverage of local newspapers of mafias (2016–2019) . . Benchmark analysis and efficient level of news coverage of mafias . . . . . . . . . . . . . . . . . . . . . . . . . . . . . . . . . . . . . . . . . . . . . . . Estimated relationship between mafia crimes and news coverage . . . . . . . . . . . . . . . . . . . . . . . . . . . . . . . . . . . . . . . . . . . . . . . . Model of newspapers’ consumption: two-stage model . . . . . . . . . . .
31 35 36 52 54 55 55
62
65 69 73 74 79 79 80 82 84 85
xvii
List of Tables
Table 2.1 Table 2.2 Table 2.3 Table 2.4 Table 2.5 Table 3.1 Table 3.2 Table 4.1 Table 4.2 Table 4.3 Table 4.4
Classification of threats against journalists . . . . . . . . . . . . . . . . . . . Measures of threats to journalists (timeframe: 12 months) . . . . . . Sources of socio-economic Big Data . . . . . . . . . . . . . . . . . . . . . . . Socio-demo characteristics: reference population vs. sample . . . . Summary statistics of measures of threats to journalists . . . . . . . . Threats to journalists: probit models . . . . . . . . . . . . . . . . . . . . . . . . Chilling effect: probit two-step models . . . . . . . . . . . . . . . . . . . . . . A description of the COVID-19 syndemic in Italy . . . . . . . . . . . . . News coverage of local newspapers of mafias (2016–2019) . . . . . “Local vs. National”: differences in news coverage on mafias (2016–2019) . . . . . . . . . . . . . . . . . . . . . . . . . . . . . . . . . . . . . . . . . . . Newspaper choice: Hechkman two-step model . . . . . . . . . . . . . . .
12 19 23 30 30 60 63 75 78 82 87
xix
List of Boxes
Box 2.1 Box 2.2 Box 2.3 Box 2.4 Box 2.5 Box 2.6 Box 2.7 Box 2.8 Box 3.1 Box 3.2 Box 3.3 Box 4.1
Issues in the classification of Covid-19 cases . . . . . . . . . . . . . . . . . . Issues in the classification of mis- and disinformation . . . . . . . . . . . Psychometrics: the mood and feelings questionnaire (MFQ) . . . . . Metrics of fake news . . . . . . . . . . . . . . . . . . . . . . . . . . . . . . . . . . . . . . Measurement of the disinformation phenomenon . . . . . . . . . . . . . . Measurement of depressive symptoms . . . . . . . . . . . . . . . . . . . . . . . COVID-19: measuring the shadow part . . . . . . . . . . . . . . . . . . . . . . Measuring the size of the shadow economy . . . . . . . . . . . . . . . . . . . Covariant dimensions of profitability: the organizational structure . . . . . . . . . . . . . . . . . . . . . . . . . . . . . . . . . . . . . . . . . . . . . . . . Covariant dimensions of individual choice: rationality vs. emotions . . . . . . . . . . . . . . . . . . . . . . . . . . . . . . . . . . . . . . . . . . . . . . . Indicators of the organizational structure: allocation of decision-making . . . . . . . . . . . . . . . . . . . . . . . . . . . . . . . . . . . . . . . Covid-19 and disinformation . . . . . . . . . . . . . . . . . . . . . . . . . . . . . . .
8 10 13 16 21 24 33 34 38 40 48 70
xxi
Chapter 1
Introduction
We live in a world crowded with data and numbers. Every day we make decisions based on data and measures that encapsulate them. We take our temperature, we calculate the distance from home to a place we want to go, we check the statistics of our favorite sport teams, we read the dosage of the ingredients of a recipe. Likewise, governments make decisions based on indicators such as the gross domestic product, the unemployment rate, investments in research and development, the poverty index. In recent years, a new massive wave of big data from online human behavior (i.e., the digital footprint) is being used by companies, researchers and institutions for a wide variety of purposes, some good, some not so good. This data is employed to generate metrics that are used to cluster individuals into categories, predict their interests and anticipate behaviors, assess social interactions, even forecast weather conditions or provide estimates of influenza activity. In addition, the outbreak of COVID-19 has made essential indicators such as the number of confirmed cases, death and fatality rate, even the “Rt value”, based on which governments around the world have taken health, social and economic policies, and citizens have been forced to make many sacrifices, even at the cost of having some fundamental freedoms severely restricted. In short, public policies, daily choices of citizens, the strategies of companies and institutions are increasingly “data-driven”. In this context, knowing the methods that are used to compute the measures that shape our lives is not only of interest to researchers but also of fundamental importance to citizens and society as a whole. In this book, we show how the operational classification of concepts like unemployment or poverty is susceptible to focusing public policies on some aspects while neglecting others, with profound effects on economic and social actions supporting different social categories. For instance, the emphasis on the gross domestic product as a measure of a country’s wealth conceals a precise political approach which, although it has been frequently disputed by some researchers, has never been the subject of a real public debate. © The Author(s), under exclusive license to Springer Nature Switzerland AG 2021 M. Delmastro, On the Measurement of Social Phenomena, SpringerBriefs in Political Science, https://doi.org/10.1007/978-3-030-77536-0_1
1
2
1 Introduction
The same applies to many commercial policies of companies when they assume a personal and public value. In recent years, the burgeoning economic and social role of online platforms (such as search engines, social networks, and e-commerce websites) has led to demand for greater transparency about the algorithms and metrics that govern aspects such as user profiling, personalization of services, and recommendations of searches and news information. Methodologies for measuring social phenomena is not just a problem for experts. Understanding the rationale and limits of measurement, discussing the most appropriate indicators according to the objectives that society sets for itself, are all issues that are too often neglected, because deemed to be technical, but which are of fundamental value for our democracies. Greater discussion and transparency on the indicators governing the policies of governments and companies, on their operational classifications, on how they are measured and then used, requires a holistic approach to the theory of measurement of social phenomena. Unfortunately, this theory is dispersed among many scientific fields and lacks overall coordination and overview. Philosophy discusses the general criteria of several fundamental aspects of measurement, ranging from the classification of phenomena, the feasibility of measuring them, up to the methodological approach itself. Furthermore, the relationship between different phenomena (i.e., association versus causation) is a central aspect of the philosophy of science. Statistics offers many of the tools for the effective measurement of phenomena and the estimation of relationships between them, ranging from sampling theory to inferential statistics and econometrics. In the last few decades, computer science has also become essential for measuring social phenomena because it enables the gathering, processing and analysis of huge volumes of data from various sources (e.g., social networks, e-commerce websites, geolocation) and of various formats (e.g., text, video, images) concerning everyday individual and social life, by using methodologies ranging from network science models to those of natural language processing. Finally, all sciences have developed specific procedures for measuring indicators in their various fields of interest: in social sciences, in fields such as economics (e.g., unemployment rate, poverty index, income inequality), psychology (e.g., psychometric indicators), and sociology (e.g., life satisfaction, crime rate). This impetuous evolution of measures and indicators, which has been further strengthened in recent years by the increasing availability of data, has developed in the scientific community within fragmented and sometimes not sufficiently sound approaches. The aim of the book is therefore to shed light on some essential methodological steps. The book builds up in such a way as to provide the reader with an integrated and original interpretative compass, hinting at the most important technical aspects and referring to the relevant literature for further in-depth study. In Chap. 2 we discuss a three-step procedure for measuring social phenomena. The procedure consists of three consecutive steps that address: (i) the definition and classification of social phenomena, which are often vague and abstract concepts in need of operationalization; (ii) the definition of measures of phenomena as defined
1 Introduction
3
in the first step; (iii) the actual measurement procedures. The various steps must be discussed not only to assess their scientific robustness but also to understand the perimeter and limits of the final measurement of the underlying concepts. For example, it is widespread in the social sciences the existence of a shadow part of social phenomena, even very significant, which is often not recorded by official statistics (e.g., the shadow economy). Any scientific reflection and political strategy based on indicators must take due account of how much the available indicators explain the overall phenomenon, and how much is not covered by them. This is only possible when the various steps of the measurement procedure have been duly addressed and clarified. Social phenomena cannot be analyzed in isolation but are multifaceted and multidimensional. In Chap. 3, therefore, we first address the issues related to the selection of dimensions to be taken into account in the analysis, and the identification of procedures that can be used to analyze multifaceted phenomena using composite indicators. Once these steps have been clarified, we come to the fundamental question of what kind of relationship exists between the different dimensions. This is not only a statistical question but also a more general philosophical dilemma that is rooted in Descartes, and rationalism, on the one hand, and in Hume, and empiricism, on the other. Different scientific approaches (e.g., rationalism versus empiricism) have strongly shaped the evolution of knowledge in fundamental fields of social science such as decision theory. In the case of relations between phenomena, the debate spans from simple associations to cause-effect (i.e., causation) relations. The emergence of big data analysis has not only provided the social scientist with a multitude of data on (large parts of) the population and a wide range of domains but has also imposed associative relationships. It is both a statistical problem of estimating the relationships between a huge number of variables, and the recognition that the social system is complex and it hardly fits into a simple causal model in which a few variables are considered in isolation. This observation leads to a further aspect that is one of the leitmotifs of the book: the presence of research, and consequently, policy biases. For a long time, decision theory avoided dealing with the evidence (the first and maybe still most famous being Allais’ paradox in 1953) which showed that the underlying rationalist axiomatic structure did not fit with the way individuals make their own decisions. Decades of cognitive theory in psychology and neuroscience have confirmed this fact, which was already evident at the time of Hume. The discussion has shifted over the years from descriptive to normative aspects, trying to use the rationalist approach in terms of optimal decision-making. However, cognitive science has shown that the non-rationality of human behavior must also be taken into account from a normative point of view (see, for instance, the nudge theory). This is to say that modern science needs what the Italian economist and sociologist Vilfredo Pareto, famous for his theory of welfare, recognized at the beginning of the twentieth century as the future of decision theory, namely the integration of knowledge (in his case the foundation of economics by psychology). In Chap. 4, we, therefore, address the problem of integration in the measurement of social phenomena. Data integration has been an essential part of applied
4
1 Introduction
science for some years now. Even though in many scientific fields there is still a considerable amount of reluctance due to the inertial evolution of knowledge and the challenge of leaving established tools and embracing new ones, a growing part of applied research combines traditional methodologies and data with new tools and information. However, this process will only be achieved when knowledge is fully integrated, and the current compartmentalization of knowledge and scientific organization is replaced by a new one. The specialization of knowledge has brought great scientific benefits. However, the time has come to define new models that combine specialization, which remains necessary, with forms of increasing and comprehensive integration.
Chapter 2
A Three-Step Procedure
Social research is often focused on complex technical aspects. However, the applied study of social phenomena raises several preliminary methodological issues which, if not effectively addressed, risk undermining the quality of the whole analysis. These questions, on the contrary, are rarely addressed by researchers and are generally taken for granted, referring at most to the relevant scientific literature. Since, each study tends to address these issues differently even within the same line of research, reference to the relevant literature is insufficient if not misleading. In this chapter we provide illustrative examples to show that failure to address these methodological steps is susceptible to produce severe research pitfalls (see for example cases illustrated in the boxes). Moreover, we use a rather intricate social phenomenon (i.e., threats to journalists) to exemplify how these issues can be addressed and how different approaches lead to very different results. The overall recommendation is that any applied analysis of social phenomena should contain, in the beginning, a clearcut outline of how these issues are addressed in the research. Briefly, this preliminary methodological process, that we call here the “three-step procedure”, can be summarized in the following, successive and concatenated three operational steps.1
Firstly, inaccurate or imprecise definitions and classifications of social phenomena risk either excluding important aspects from the analysis or including misleading elements. Consequently, the exact definition of the perimeter under analysis is crucial 1
Sometimes these steps are called: (i) characterization (or ontology); (ii) representation; and (iii) procedures. See Cartwright and Bradburn (2016) and National Research Council (2011). © The Author(s), under exclusive license to Springer Nature Switzerland AG 2021 M. Delmastro, On the Measurement of Social Phenomena, SpringerBriefs in Political Science, https://doi.org/10.1007/978-3-030-77536-0_2
5
6
2 A Three-Step Procedure
for the understanding of the phenomena under observation (see Sect. 2.1). Moreover, the definition must necessarily be both operational and dynamic, i.e., it should contain the operational classification of the phenomenon and it should possibly change over time, according to the evolution of the economic, normative, social, and/or technological factors. Once the phenomenon has been classified, it must be correctly measured (Sect. 2.2). This means that a system of metrics through which quantitatively evaluate the different dimensions must be defined in advance. In this sense, metrics must give rise to numerical values that can be bivariate (0/1, in the case of TRUE/FALSE logical values), natural, integers, or real numbers, or that can be ordered according to a categorical scale (for instance, on an x-item scale to evaluate the frequency of an event: e.g., “never”, “sometimes”, “once a week”, “several times a week”, “every day”). After the identification of the metric system, the actual measurement should be carried out through an appropriate measurement methodology (Sect. 2.3).2 This stage, that is usually the one discussed in the “method section” of a scientific paper, should tackle multiple problems that may arise in the measurement process. In social science, these are mainly statistical, but they may also involve more general problem of analysis, such as the presence of a shadow component of the phenomenon under investigation (Sect. 2.3.1). In this chapter, we discuss the three methodological steps in a rather informal and non-technical way, suggesting more technical references, providing illustrative examples of important social phenomena (presented in the boxes) and taking the threats to journalists as a case study that serves as a fil rouge throughout the chapter (and the book).
2.1 Classification of Social Phenomena Classification is the essential first step in science. (Szostak 2004)
Special attention should be paid to the initial process of definition and operational classification of the phenomenon, which is often much more complex than it may seem at first sight. This step directs all the subsequent analyses and must therefore follow an accurate methodology that should be clearly presented to the reader.3 Sometimes classifications may be taken as self-evident. However, important cases, such as those summarized in the following boxes, show that most of the time they are not. How exactly do we define the disinformation phenomenon? What do we mean by Covid-19 cases? 2
It is worth noticing that measurement is often associated with both the definition of the metric system and the procedures aimed at measuring aspects of the empirical world. 3 “The history of science teaches the importance of classification, both as a phase of individual mastery, and as an aid to the further progress of comprehension” (Hayes, E. 1911).
2.1 Classification of Social Phenomena
7
In social science, many phenomena (such as poverty, race, social exclusion) can be described by concepts that are fuzzy and multifaceted and for which the boundaries are not clear (i.e., “Ballung concepts”): “the use of concepts for different purposes, often leads to changes in characterization, representation and/or procedures that disrupt the possibility of common metrics”.4 This is often true for the most widely analysed and discussed concepts in economic and social literature. Take the case of unemployment. When we consider unemployment, we are thinking of a very broad and multifaceted concept. However, its operational definition is “the unemployed comprise all persons above a specified age who during the reference period were: without work, that is, were not in paid employment or self-employment during the reference period; currently available for work, that is, were available for paid employment or self-employment during the reference period; and seeking work, that is, had taken specific steps in a specified recent period to seek paid employment or self-employment” (OECD, Glossary of Statistical Terms). Note that this definition, for example, leaves out all persons who have stopped actively looking for a job. This limitation could be very relevant, especially in contexts of endemic labour shortages. Therefore, by moving from the broad theoretical concept of unemployment to its operational definition, we would limit the analysis to specific conditions. This methodological choice inevitably directs the result and must therefore be discussed in advance in all its implications. To make this definition an operational classification we need to identify the age beyond which we consider individuals (most of the time this age is set at 15) and the reference period. This additional step further specifies and delimits the concept of unemployment to be measured. So, we have started from a very broad concept of unemployment and we have ended up with a measurement of a specific part of it. When we associate the concept with its operational metric, we must remember how it was defined and classified in order to identify possible fallacies of the whole subsequent measurement process.5 This is particularly important because unemployment, like many other social phenomena (e.g., misinformation, the spread of Covid-19), is a social phenomenon which receives great public attention and upon whose metrics important political decisions are made.
4
See Cartwright and Runhardt (2014). The term Ballung concept is borrowed by the authors from Otto Neurath; see Jordi, C. (2021). 5 “These should be the best of times for working people. After all, the unemployment rate is just 3.7 percent, near its lowest level in almost 50 years. If that were our only guide, then we might conclude that virtually every adult in the United States who wants to work is either doing so or is diligently looking for a job. The problem is that the unemployment rate, which is publicly updated by the Labor Department on the first Friday of every month, is an insufficient statistic, despite all the attention it gets. Sure, it tabulates the number of men and women who are actively job-hunting. But it leaves out the growing numbers who have stopped actively looking” (Louis Uchitelle, Unemployment Is Low, but That’s Only Part of the Story, New York Times, July 11, 2019).
8
2 A Three-Step Procedure
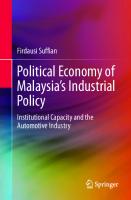
In Box 2.1, we show how different national classifications of Covid-19 cases and deaths may be one of the reasons behind the observed geographical variability. Box 2.1 Issues in the classification of Covid-19 cases The World Health Organization defines Covid-19 cases and deaths as follows Confirmed case: A person with laboratory confirmation of COVID-19 infection, irrespective of clinical signs and symptoms; Death due to COVID19: a death resulting from a clinically compatible illness in a probable or confirmed COVID-19 case, unless there is a clear alternative cause of death that cannot be related to COVID-19 disease (e.g., trauma). There should be no period of complete recovery between the illness and death (WHO, Public health surveillance for COVID-19). As shown in the figure below, in March 2020 there were significant differences between countries in the death rate from COVID-19. These differences have been the subject of lively debate, with potential drivers such as age distribution, history of previous illnesses and the level of smog in the atmosphere being highlighted. Obviously, these factors may have significantly influenced COVID-19 death rates, but there are also differences in the operational classifications adopted by each country. These differences are due to the fact that the WHO’s definition inevitably leaves a certain degree of discretion in the actual process of classifying the phenomenon. The latter should be considered before benchmarking data.
Source STATISTA As the figure shows, Italy, in March 2020, was by far the country with the highest death rate. However, Prof. Walter Ricciardi, the Italian representative to the WHO, mentioned in an interview that «The way in which we code deaths in our country is very generous in the sense that all the people who die in hospitals with the coronavirus are deemed to be dying of the coronavirus». Krys Johnson, epidemiologist at Temple University College of Public Health,
2.1 Classification of Social Phenomena
9
suspects if different classifications and measurement systems were taken into account «the true fatality rate in Italy is closer to the global fatality rate of 3.4» (see Rachael Rettner, “Why Deaths from Coronavirus Are So High in Italy”, Scientific American, March 10, 2020). The representation of a social phenomenon, through its definition and classification, must be appropriate to the central features taken to characterize it. It is important to ensure that the final items measure the concept originally intended. This step is both a process and an end result. Here are a few basic rules of the classification process. Bailey (1994) can profitably be followed (see also Szostak 2004). First, classification may be defined as the ordering of entities into groups or classes based on their similarity. The aim is to minimize within-group variance, while maximizing between-group variance. In other words, when we arrange a set of entities of a phenomenon into categories, we want that each group is as different as possible from all other categories, but each category is internally as homogeneous as possible. This process can be done following a theoretical ordering (based on knowledge of the phenomenon), or statistically (e.g., through cluster analysis). In any case, “one basic secret to successful classification, then, is the ability to ascertain the key or fundamental characteristics on which the classification is to be based […] In all of these diverse cases, prior knowledge and theoretical guidance are required in order to make the right decisions” (Bailey, 1994). Second, the defined categories must be both exhaustive and mutually exclusive. This means that if N events have to be classified (e.g., type of threats to journalists, see Sect. 2.1.1), there must be an appropriate category (i.e., exhaustivity) and only one for each, with no event being in two different categories (i.e., mutual exclusivity). In other words, the classification of the N events into categories must aim to cover all the events, and each event must be included in one and only category. However, as we have seen in the case of unemployment, this is not always the case. In many cases, classification is not exhaustive, and this implies that there is a part of the phenomenon that is not detected by the subsequent measurement step. This is the case of important parts of social phenomena that remain hidden from official statistics (see par. 2.4). Nowadays, automatic clustering is widespread (e.g., K-Means clustering, hierarchical clustering),6 especially in data mining. However, this process, if not governed by an appropriate knowledge of the phenomenon, may lead to inconsistent (as well as ethically questionable) results. Moreover, data clustering does not imply classification of social phenomena, and this aspect is often absent in data mining analyses, to the extent that the “end of the theory” has been suggested.7
6
See Allahyari et al. (2017). See Anderson, C. (2008). The End of Theory: The Data Deluge Makes the Scientific Method Obsolete, Wired Magazine, 16. For a discussion, see, among others, Mazzocchi, F. (2015). Could Big Data Be the End of Theory in Science? EMBO Reports, 16, 1250–1255, and Coveny, P., et al.
7
10
2 A Three-Step Procedure
Box 2.2 Issues in the classification of mis- and disinformation Information disorder is one of the hot topics of social sciences: from media economics to sociology of communication, from politics to data science, from cognitive psychology to political economy. In recent years, there has been an astonishing number of articles on the subject that have been published in the major journals in these fields (Science, Nature, PNAS, Journal of Economic Perspectives, Cognition, etc.). However, as brilliantly argued by Wardle and Derakhshan (2017) «One depressing aspect of the past few months is that, while it has resulted in an astonishing number of reports, books, conferences and events, it has produced little other than funding opportunities for research and the development of tools. One key reason for this stagnation, we argue, is an absence of definitional rigour, which has resulted in a failure to recognize the diversity of mis- and disinformation, whether of form, motivation or dissemination».8 I would add that it is not only a problem of definitional rigor, epitomized by the term “fake news” that is used indistinctly to indicate a wide range of concepts,9 but also of operational classification once this phenomenon has to be analyzed empirically. In this respect, disinformation starts from a process of ex-post verification10 of factual information by independent (third party) and trusted fact checkers/debunkers. It can be either “objective” (i.e., directed at verifying single news items) or “subjective” (i.e., directed at verifying news sources). Clearly, the analysis of information disorder substantially differs depending on the choice of the operational classification.
(2016). Big Data Need Big Theory Too, Philosophical Transactions of the Royal Society A, 374: 20160153. 8 “Misinformation” is when false information is shared, but no harm is meant; “disinformation” is when false information is knowingly shared to cause harm; “malinformation” is when genuine information is shared to cause harm, often by moving information designed to stay private into the public sphere. See, Wardle & Derakhshan (2017). Information Disorder: Toward an Interdisciplinary Framework for Research and Policy Making, Council of Europe Report, DGI 09, p. 5. 9 News coming from sources which have not been professionally and adequately verified; satirical news that, out of context, may be perceived as real by citizens; news coming from sources fueling conspiracy or plotting theories; news coming from sources specialized in gossips or rumors and pseudoscience, characterized by unverified current events or scientific breakthroughs; hate news coming from sources promoting racism, misogyny, homophobia and other forms of discrimination; (entirely or partially) correct news with sensationalist titling for click-baiting purposes; news coming from sources providing biased information to support determined opinions and political orientations. 10 Internal fact-checking instead is verification done in-house by the publisher.
2.1 Classification of Social Phenomena
11
2.1.1 Classification of Threats to Journalists In this essay, we present a case study to indicate how some methodological concepts can be operationalized. We have chosen a social phenomenon that embodies many of the major issues that social science practitioners may experience in their research work. Harassment and intimidation of journalists is indeed a social phenomenon in which: (i) there are no official statistics (if not very incomplete); (ii) international data are difficult to compare (except for the most violent acts such as killings); (iii) the perimeter of the universe of reference needs to be defined; (iv) there is a very significant hidden/shadow component that could mislead the analysis itself (see Sects. 2.3.1 and 2.4.1). In addition, the phenomenon has far-reaching social implications that go well beyond its realm and affect the overall news production and the fight against pathological social phenomena such as organized crime and administrative and political corruption (see Chaps. 3 and 4). While the definition of the phenomenon is quite straightforward (i.e., any act or action aimed at intimidating journalists in their profession) the operational classification is more complex. In this respect, we develop a classification based on national and international NGOs monitoring systems (e.g., Ossigeno per l’Informazione, Reporters Sans Frontier) which have been investigating intimidations of journalists for years. This categorization has been adopted at international level and used in monitoring projects under the aegis of the European Commission and the Council of Europe.11 The classification has been then integrated with some cases identified at international level,12 with particular reference to online intimidation,13 in order to detect also new forms of threats through the web, thus having a picture of the phenomenon as exhaustive and updated as possible. In addition, the classification was validated by journalists and experts in the field,14 shared with international institutions (i.e., UNESCO) and discussed at international meetings.15 A schematic illustration of the operational classification of threats to journalists is summarized in Table 2.1. The classification distinguishes two basic categories (i.e., direct threats and indirect threats) and four second-level categories16 : (1) traditional threats (i.e., killings, 11
Council of Europe (2019). Democracy at Risk: Threats and Attacks Against Media Freedom in Europe, Annual Report by the Partner Organisations to the Council of Europe Platform to Promote the Protection of Journalism and Safety of Journalists. 12 Reporters Sans Frontieres (2019). World Press Freedom Index 2019: A Cycle of Fear, 2019. 13 ECPMF (European Centre for Press and Media Freedom) (2020). Mapping Media Freedom. 14 Raffaella Della Morte, Ilaria Fevola, Aldo Fontanarosa, Adriana Lotti, Francesco Marrazzo, Giuseppe Mennella, Alberto Spampinato, Sergio Splendore are gratefully acknowledged. 15 See World Press Freedom Day, Rome, May 8, 2018. 16 Risks and threats to journalists themselves come in many forms; Wahl-Jorgensen, et al. (2016). The Future of Journalism, Journalism Studies, 17, 801–807.
12
2 A Three-Step Procedure
Table 2.1 Classification of threats against journalists Categories
Second level
Third level
Direct threats
Traditional
Aggression (killings, violent actions, shots, …) Warning (verbal warning, threatening letter, death threats, …) Damage to personal property
Web
Diffusion of false personal information Offence Sexual offence Threats of violence (including sexual violence)
Indirect threats
Legal actions
Reckless lawsuit
Obstacle to information
Impeding access to documents and data
warnings, assaults, damage to personal property); (2) intimidation on the internet (i.e., web offences and threats, digital diffusion of false information); (3) legal actions (i.e., reckless complaints); (4) obstacles to the acquisition of information and documents. The first two can be referred to as “direct threats”, while the latter can be called “indirect threats”. The full range of these actions defines the whole perimeter of the types of threats to journalists (exhaustivity), including physical and virtual intimidation, concrete actions and legal acts, direct acts and indirect obstacles. Moreover, the classification fulfils the criterion of exclusivity since each event is assigned to only one category. It should also be noted that some analyses carried out on a worldwide basis report the number of journalists killed (or any direct action intended to endanger the physical safety of journalists).17 In these latter cases, the classification of threats is limited only to the extreme cases, leaving aside all other forms of threats (i.e., it does not meet the criterion of exhaustiveness). It is self-evident that such a methodological approach, even if necessary in some countries, due to the infeasibility of a different, and finer, monitoring system, is not much informative, excessively delimiting the perimeter of the phenomenon under study (to a small subset of direct threats), and limiting, in the last instance, the scope of the analysis, both from a dynamic and comparative points of view.
2.2 Metrics of Social Phenomena The increasing availability of individual data has livened up the debate on metrics in recent years (for a discussion see, for example, Bohrnstedt 2010 and National Research Council 2011). The emergence of big data has led to what has been called a process of “datafication”, i.e., “the process by which subjects, objects, and practices 17
See, for example, INSI (International News Safety Institute) (2019). Killing the Messenger.
2.2 Metrics of Social Phenomena
13
are transformed into digital data” (Schintler et al. 2021). This process has amplified the need to create new methods for robust social metrics (so called smart metrology). To this aim, the set of traditional methods used for measuring social phenomena has been extended by the increasing employment of metrics from heterogeneous fields, such as cognitive psychology (see Box 1.3), neuroscience18 and data science19 (see Van Bavel et al. 2020, for a methodological proposal of a broad behavioral approach to study the reaction of society to Covid-19 epidemic and related policies). Box 2.3 Psychometrics: the mood and feelings questionnaire (MFQ) Measurability in psychology traces back at least to Gustav Fechner (1860) (in his Elements of Psychophysics), in which he illustrated methods of measuring intensities of feelings. Since then, psychophysicists have been working extensively on methods for measuring feelings and mood. One of the most relevant is the Mood and Feeling Questionnaire (in two forms: long and short)20 which includes 33 (13 in the short version) items indicating how much individuals have felt mentally distressed during the previous two weeks (e.g., “I felt miserable or unhappy”, “I didn’t enjoy anything at all”, “I found it hard to think properly or concentrate”). The items include general statements related to mood and feelings and might indicate the presence of clinically relevant disorders such as depression and anxiety. The answers are given on a three-point Likert scale where respondents are asked to decide if the statements are “true”, “sometimes true”, or “not true”. The measurement scale is thus ordinal as in most cases in psychometrics. Scoring of the MFQ is obtained by summing together the point values of responses for each item (i.e., additivity). The response choices and their designated point values are as follows: “not true” = 0 points, “sometimes true” = 1 point, “true” = 2 points.
18
In cognitive neuroscience, metrics such as the firing rate of the neuron (i.e., the number of spikes per time) and related graphical and statistical methods (e.g., a Raster plots, a histogram which shows action potentials as a function of time) are widespread (see, M. Gazzaniga et al. (2018). Cognitive Neuroscience: The Biology of the Mind, Norton). 19 Social science has recently been revolutionized and revitalized by the use of data science applied to social phenomena; in this vein, see Cappella (2017) for communication studies; Cox et al. (2018) for statistics, Edelmann et. al (2020) for computational social science; Halford and Savage (2017) for sociology, Varian (2014) for economics. 20 See Angold, A., Costello, J., Van Kämmen, W., & Stouthamer-Loeber, M. (1996). Development of a Short Questionnaire for Use in Epidemiological Studies of Depression in Children and Adolescents: Factor Composition and Structure Across Development, International Journal of Methods in Psychiatric Research, 5, 251–262.
14
2 A Three-Step Procedure
Clinical studies have shown that higher scores on the MFQ indicate more severe depressive symptoms (i.e., validation21 ). The range of scores on the MFQ varies from 0 to 66 (26). A score of 27 (12) or higher may indicate the presence of clinically relevant depressive symptoms in the respondent.22 MFQ has been also recently used to measure the emotional impact of COVID-19 on the population.23 The MFQ has a number of important (psychometric and implementation) features: internal consistency, test–retest reliability, validity, sensitivity to change. It is therefore impossible to review in a few pages (and even probably in a whole book) the growing range of literature on measurement. Here, it is important to sum up some background considerations.24 First, since social science concepts are large in number and fuzzy (see above “Ballung concepts”) “researchers have not yet discovered how to define the kind of fundamental quantities in the social sciences that exist in the physical sciences” (National Research Council 2011, Ch. 2). Indeed, compared to physical metrics, social metrics generally present a lower degree of objectivity and standardization and are characterized by a higher variety. They are based on a large spectrum of methodologies and techniques and include socio-demographic attributes (e.g., age, gender, marital status), economic characteristics (e.g., income, wealth, unemployment, poverty), up to psychological traits (e.g., intelligence, mood, depression).25 This realm has been investigated deeply by the so-called “measurement theory” (or mathematical theories of measurement) that in particular explores the study of measurement scales. Numerical scales can be of various types: (i) nominal (i.e., in which the dimensions of a phenomenon are assigned to classes without a specific order; e.g., gender); (ii) ordinal (i.e., dimensions are ordered but with no underlying algebraic structure; e.g., education); (iii) interval (i.e., equal intervals between objects represent equal differences, but not ratios; e.g., temperature) and (iv) ratio (i.e., ratio scales where zero 21
Turner, N., Joinson, C., Peters, T. J., Wiles, N., & Lewis, G. (2014). Validity of the Short Mood and Feelings Questionnaire in Late Adolescence, Psychological Assessment, 26, 752–762. 22 Thabrew, H., Stasiak, K., Bavin, L. M., Frampton, C., & Merry, S. (2018). Validation of the Mood and Feelings Questionnaire (MFQ) and Short Mood and Feelings Questionnaire (SMFQ) in New Zealand Help-Seeking Adolescents, International Journal of Methods in Psychiatric Research, 27, 1–9. 23 Delmastro, M., & Zamariola, G. (2020). Depressive Symptoms in Response to COVID-19 and Lockdown: A Cross-Sectional Study on the Italian Population, Scientific Reports, 10, 22457. 24 The study of measurement is massive and embraces scientific domains ranging from the epistemology of science to data science (it also involves statistics, mathematics and all the hard and social sciences in whose field the various measures are developed). Tal (2020) presents a pleasant and accurate review from which the interested reader may start. See also Mari (2005) for issues related to the epistemological foundation of measurement. 25 These aspects (in particular, the variety of concepts and methodologies employed in social sciences) are further analyzed in the next chapter where composite indicators will be developed.
2.2 Metrics of Social Phenomena
15
is meaningful; when they have a natural unit, such as those representing probabilities; they are called absolute scales).26 In this regard, the development of measures can be seen as a process of assigning numbers to represent the qualities of the phenomenon under investigation (Campbell 1957). One lesson we can learn is that empirically significant aspects of a measurement scale are those that mirror relevant relations among the events of a phenomenon being measured. The issue is how to express the events that characterize a phenomenon into a numerical scale, i.e., how to create a mapping that associates real world events with numerical structures, so that this association respects the structure of the events that make up the phenomenon and at the same time the numerical scale is characterized by nice properties (such as additivity). In this context, any measurement process that satisfies the conditions of additivity is called “fundamental”. To do this, ordering and concatenation are sufficient for the construction of an additive measure of a dimension of the phenomenon (e.g., length, duration, weight, electrical resistance). Other measurement procedures can be indirect, because derived from relations to other fundamentally measurable dimensions (e.g., temperature, density). However, this cannot be the case for a vast array of social phenomena, in which only ordering is feasible, so that additivity cannot be fully achieved. The debate on measurement procedures has thus developed, especially by virtue of the development and diffusion of psychometric metrics (see Box 2.3), to the point of including procedures based on ordinal scales (i.e., which do not satisfy, even indirectly, the criteria of additivity). From one side, Stevens (1951) has defined measurement simply as the “assignment of numerals to objects or events according to rules”. In this case, “measurement scales should be regarded as arbitrary formal schemas and adopted in accordance with their usefulness for describing empirical data […] Such assignment of numbers to sensations counts as measurement because it is consistent and non-random, because it is based on the matching operations performed by experimental subjects, and because it captures regularities in the experimental results […] these conditions are together sufficient to justify the use of a ratio scale for measuring sensations, despite the fact that sensations cannot be separated into component parts, or laid end to end like measuring sticks” (Tal 2020).27
26
A useful suggestion is to try to avoid relative measurement: in particular, percentile ranks, standard deviations, and shares of variance (National Research Council 2011). 27 This position may be referred to as “operationalism”, roughly meaning that (social) concepts (especially Ballung concepts) have empirical meaning only if and when they are defined by measurement operations. This position has encountered a number of critiques such as that operational definitions are very specific and do not exhaust meaning, the ambiguities surrounding the notion of operation, the overly restrictive operational criterion of meaningfulness, and the fact that operational definitions are not required for all useful concepts (see Chang 2009). This position is opposed to “realism” where measurement is a mere approximation of a “true value” that is independent by procedural operations. This process is aimed at gaining insights about real properties rather than
16
2 A Three-Step Procedure
Box 2.4 Metrics of fake news As explained in Box 1.2, the term fake news is very loose (a Ballung concept again). In order to make it operational, we drew up a list of all the online news considered to be false after an assessment carried out by Italian fact checkers (i.e., Butac, Facta, NewsGuard, Open, Pagella Politica). The database contains 350 fake news (period 2016–2018), belonging to one of the following news categories: current affairs, politics, foreign affairs, showbiz, and science. We then associated each news item with the day of publication, imposing t 0 (i.e., the date on which the event it is occurred) equal to zero. The figure shows the time distribution of the number of occurrences of the news among news outlets: the distribution is very skewed to the right (at t 0 ) and then quickly decreases to zero within a few days.
We then extracted a random sample of 350 articles from a database of all Italian online news sources (in the same period) to follow the same category distribution. We developed two metrics of news duration: the “average duration time”, i.e., the average distance between the first and the last day on which a news item records at least one occurrence; the “average presence in the news”, i.e., the average number of days, even if not consecutive, on which a news item records at least one occurrence. If we compare the two metrics of news duration, we notice that a fake news lasts, on average, a much shorter period of time: 6 days (compared to 30 days for real news), with an actual time of permanence of 3 days (20 days).
assigning values to objects. In this context, concepts such as measurement error and accuracy gain significance.
2.2 Metrics of Social Phenomena
17
Metrics of news: real news vs. fake news Average duration time (days)
Average presence in the news (days)
News
30
20
Fake news
6
3
On the other side, Krantz et al. (1971) have moved away from the fundamental theory of measurement by proposing the Representational Theory of Measurement (RTM) which remains the most prominent mathematical theory to date.28 RTM defines measurement as the construction of mappings from empirical relational structures into numerical relational structures. An empirical relational structure consists of a set of empirical objects along with certain qualitative relations among them (e.g., ordering, concatenation), while a numerical relational structure consists of a set of numbers (e.g., real numbers) and specific mathematical relations among them (e.g., “equal to or bigger than”, addition). RTM is a formal and axiomatic generalization of the old concepts of the measurement theory which relaxes some conditions (e.g., concatenation), developing new broader concepts such as the “additive conjoint measurement”, that can be used to quantify attributes where it is not possible to combine the levels of the attributes using concatenation. However, even RTM has been met with a share of criticism, since it advances an abstract conception of measurement that is not connected to empirical work as closely as it should be (Heilmann 2015). Moreover, even if RTM rejects the idea that additive scales are adequate only when concatenation operations are available, this has not entirely solved the dispute with psychometrists (on this issue see, among others, Vessonen 2017). A related issue regards the (flow of the causal) relationship between measures and phenomena. Usually, we identify structural relationships among latent, unobserved phenomena by statistically relating covariation between the latent constructs and the observed measures of the latent constructs. In this case, if variation in an indicator M is associated with variation in a latent phenomenon X, then exogenous interventions that change X can be detected in the measure M. In other words, we measure unobserved phenomena throughout a “reflective” measurement, with a causality flow from
28
RTM goes into great detail in clarifying the assumptions underlying the construction of different types of measurement scales. Each type of scale is associated with a set of assumptions about the qualitative relations obtaining among objects represented on that type of scale. From these assumptions, or axioms, the authors of RTM derive the representational adequacy of each scale type, as well as the family of permissible transformations making that type of scale unique. In this way, RTM provides a conceptual link between the empirical basis of measurement and the typology of scales.
18
2 A Three-Step Procedure
the latent phenomenon (X) to the measure (M). This is so for many psychological metrics.29 In economics and sociological contexts, it is often the other way round: “This is sometimes called a “formative” as opposed to a “reflective” model of index construction. Examples include an index of socioeconomic status, consisting of education, income, and occupation, and the consumer price index, which is based on a market basket of goods and services. The construct is in fact determined by or defined by the indicators that go into it. Typically, the indicators are simply unit-weighted, but in some cases they are weighted on the basis of theory, differential utilities, or other preferences (e.g., relative importance based on a community survey)” (National Research Council 2011). The difference between the two types of measurement lies in the nature of the phenomena: i.e., in a reflective model, the latent construct exists independent of the measures, while in a formative model, the latent construct is dependent upon operationalist instrumentalist interpretation by the researcher30 ; as said, in the direction of causality (from the phenomenon to the measure for reflexive model and the other way round for constructive model); and in the characteristics of measures: “In a reflective model, change in the latent variable must precede variation in the indicator(s). Thus, the indicators all share a common theme and are interchangeable. This indicator interchangeability enables researchers to measure the construct by sampling a few relevant indicators underlying the domain of the construct […] Inclusion or exclusion of one or more indicators from the domain does not materially alter the content validity of the construct. However, the situation is different in the case of formative models. Since the indicators define the construct, the domain of the construct is sensitive to the number and types of indicators representing the construct. Hence, adding or removing an indicator can change the conceptual domain of the construct” (Coltman et al. 2008). Finally, the two approaches need different systems of (statistical) validation. For instance, within the reflexive framework, a numerical scale of measurement can be employed, under the conditions of internal and external consistency. The numerical scale of a phenomenon (e.g., depression) can be developed provided it is validated by an internal consistency analysis (e.g., using measures such Cronbach’s “α”) and a process of external verification with respect the latent construct (i.e., analyses that prove that the numerical scale is a good representation of the phenomenon investigated through, for instance, a Rach model; e.g., in the case of depression, clinical studies have shown that the MFQ robustly represents the pathology, and on the basis of these specific cut-offs of the index have also been defined, also broken down by age and gender, see Box 2.3).
29
“a test is valid for measuring an attribute if and only if a) the attribute exists, and b) variations in the attribute causally produce variations in the outcomes of the measurement procedure” (D. Borsboom 2005). 30 This difference mimics the distinction between realist and operationalist/conventionalist views (see above).
2.2 Metrics of Social Phenomena
19
To conclude, in social sciences, measures are developed either in contexts in which a direct isomorphic or homomorphic mapping between phenomena and measurement scales can be defined, or thorough a model-based approach. In this latter case, the construction of measures can follow a reflexive or formative approach.
2.2.1 Measures of Threats to Journalists After having defined and classified the phenomenon of threats to journalists (see par. 2.1.1), the different possible events can be measured along two dimensions (see Table 2.2). First, events (i.e., threats) may or may not occur (i.e., “occurrence”). A measure, therefore, could be of a logical ordinal nature (Yes/No) and can be summarized through a binary variable (0/1), which assumes a value equal to 1 when the event occurs and is 0 in the opposite case. In addition, it is possible to quantify the Table 2.2 Measures of threats to journalists (timeframe: 12 months)
Category
Measure #1
Measure #2
Occurrence
Frequency
Total threats
At least one (0/1)
–
Traditional
At least one (0/1)
–
Aggression
Yes/No (0/1)
Number (0, 1, 2, 3, …)
Warning
Yes/No (0/1)
Number (0, 1, 2, 3, …)
Damage to personal property
Yes/No (0/1)
Number (0, 1, 2, 3, …)
Web
At least one (0/1)
–
Diffusion of false personal information
Yes/No (0/1)
Categorical (0-“never”, …, 4-“every day”)
Offence
Yes/No (0/1)
Categorical (0-“never”, …, 4-“every day”)
Sexual offence
Yes/No (0/1)
Categorical (0-“never”, …, 4-“every day”)
Threats of violence
Yes/No (0/1)
Categorical (0-“never”, …, 4-“every day”)
Legal actions
Yes/No (0/1)
–
Obstacle to information
Yes/No (0/1)
Number (0, 1, 2, 3, …)
20
2 A Three-Step Procedure
“frequency” of the event. The intimidations have been measured along two scales according to their type: “traditional threats” and “legal actions” according to the number of occurrences (i.e., numerical scale), while web threats, potentially very frequent, along an ordinal (categorical Likert 5-point) scale: “never” (0), “sometimes” (1), “once a week” (2), “several times a week” (3), “every day” (4). In the case of threats to journalists, occurrences and frequencies are measured over a 12-month period. To sum up, after having classified the phenomenon of threats, we construct simple and clearcut measures to quantify it numerically (i.e., mapping). The numerical scale is ordinal and, for some of them, additive. The measurement approach is reflexive.
2.3 Measurement of Social Phenomena Once the perimeter of the phenomenon and the metrics be used to measure it have been defined, it is necessary to proceed to the measurement step, i.e., the one in which procedures for gathering data for measurement purposes are established and data are collected. Note that this step is sometimes called “procedures” (or, more generally, “method”) to differentiate it from the definition of measurement system and scales. However, I prefer to call it measurement because it is only at this point that the previous steps are accomplished, and the measurement of social phenomena takes place. While the measurement methodology (and the related problems to be addressed) is very complex,31 the main issues are rather simple. When we aim to measure social phenomena, we must first identify a reference population to be analysed. This can be the whole population, a part of it (e.g., children or the elderly), some particular professional categories (e.g., journalists), social groups (e.g., party members), nations (all or only some of them, e.g., OECD member countries), enterprises (all or only some of them, e.g., selected by turnover or by industry through sectoral classifications such as NACE), institutions (e.g., antitrust authorities), etc. Then we must determine the procedures to use for gathering the information we needed to calculate the metrics we have previously identified. Data can be collected from external sources (open or at least accessible to the researcher) and/or through direct measurement procedures, such as surveys and experiments. Data on citizens may come from sources such as census, surveys, experiments, and more recently data from the internet and related digital services (e.g., social media, e-commerce, web navigation), while business data come from sources such as balance sheets, professional databases, surveys.
31
As for the definition of metrics, there is a huge literature especially of a statistical nature on methods for measuring social phenomena, to which we refer (you find some references in the bibliography at the end of the book).
2.3 Measurement of Social Phenomena
21
Each of these external data sources (e.g., census, professional databases, social data) or direct data gathering procedures (e.g., surveys, experiments) is associated with a possible target of the reference population. The census includes (almost) the whole population, while a survey or an experiment may be carried out only on a part of it. Therefore, the choice of measurement procedure affects which part of the reference population can be analysed: from the whole to a (small) subset of it. Box 2.5 Measurement of the disinformation phenomenon To measure the disinformation phenomenon, we consider two metrics: (i) the overall proportion of disinformation over the total online news production; (ii) the overall audience reached daily by sources of fake news (i.e., subjective approach, see Box 1.4). We proceeded as follows. We identified, from independent fact-checkers (i.e., Butac, Facta, NewsGuard, Open, Pagella Politica), a list of all detected disinformation sources that varies over time and includes both websites and social networking pages. It should be noted that sources of disinformation are generally fragmented and open and close very frequently. For this reason, secondly, we calculated the overall production of online news articles and their reach of all sources of online disinformation net of duplication. Finally, the % of disinformation production has been calculated over the total news online information (i.e., 37,654,333 news documents from April 2016 to May 2020), while audience reach has been estimated based on both site and in-app consumption. The procedures to measure the production of news documents (both fake and real), are based on a database of 2,019 Italian online news outlets, which represents the universe of all national online news sources. The active reach of both news and false news outlets has been calculated on the basis of AudiWeb data, a web analytics organization that provides data on the use of Italian websites based on a combination of panel-based and server-side measurement. So, we can assess that, in four years (2016–2020), the average proportion of disinformation over the total online news production has been equal to 5.9%. This value is rising and varies substantially according to the political cycle (Fig. a).
22
2 A Three-Step Procedure
a): Production of disinformation (%)
b): Consumption of disinformation (%)
Note (a) % of online disinformation as a percentage of all online news production in Italy (2016–2019); (b) active reach of online news and disinformation sources in Italy (2019–2020) As to news consumption (Fig. b), the overall audience of disinformation sites is lower than that of news outlets. However, this value is significant (ranging from 20 to 30% of all active users) and growing. During the first lockdown period, the audience of disinformation sources reached its peak: almost 14 million individuals (i.e., 31.1% of active users) have visited disinformation websites and social network pages. The Internet has become a basic means for generating and a major source for collecting socio-economic data. In Table 2.3 new internet sources of data are listed. Despite the profusion of massive data linked to new internet sources, it is still very rare to have information on the whole reference population, especially when this latter is large.32 Instead, a subgroup of subjects is identified and analysed to represent the reference population. We call this group “sample”. Methods for drawing a sample representing the whole reference population are dealt with by inferential statistics. Two important concepts apply to a sample: randomness and representativeness. Because getting a random sample is very complex, randomness is difficult to achieve. Even if one manages to draw a random sample (e.g., in surveys and experiments), 32
For example, in an analysis of the effect of regulation on addressing market failures in the agrifood sector, Castriota and Delmastro (2015) gathered detailed dynamic information (over more than 30 years) on all Italian wine denominations of origin from official databases. In this case they had data on the entire reference population.
2.3 Measurement of Social Phenomena
23
Table 2.3 Sources of socio-economic Big Data User’s purpose
Description
Information search
The user aims to find Search engines, Google Trends information about a topic of his interest. Data is actively generated
Examples of sources
Transactions
The user interacts with an individual and/or machine to achieve an agreement in which the user demands and obtains a product or service in exchange for a financial or non-financial compensation
• Financial transactions
Event in which the user makes a E-banking, e-commerce, urban payment to obtain a product or sensors service
• Non-financial transactions Event in which the user E-government, e-recruiting provides the counterpart with required information to obtain a product/service Information diffusion
The user aims to spread Corporate websites, apps, Wiki information or knowledge. This pages includes marketing purposes, in order to establish a public image of the user or the agent he represents. Data is actively generated
Social interaction
The user wants to share Social Networking Sites, information, opinions and ideas opinion platforms, blogs with other users. Data is actively generated
Non-deliberate
The user does not pursue to generate data with action, but data are generated by the use of some means. Data is passively generated
• Usage
The simple fact of using any device generates data related to how, when and where an action has been done
Web cookies, Internet Protocol, Sensors for self-tracking
• Location
The use of mobile phones generates data particularly related to the position of the user
GPS, GSM, Call Detail Records, Bluetooth, WiFi Points (continued)
24
2 A Three-Step Procedure
Table 2.3 (continued) User’s purpose
Description
• Personal
Personal data (e.g. age, gender) Forms, profiles, type of is generated consciously (e.g. searches or purchases filling a form to complete a purchase) or unconsciously (e.g. data about the type of information we look for) as a consequence of using any device/tool to achieve a purpose
Examples of sources
Source D. Blazquez and J. Domenech (2018)
many subjects who have been selected may not respond and must be replaced, in a cascade process that inevitably moves the final sample away from the random one. This issue is more acute when information is personal (such as those about political preferences) or confidential (for companies, institutions), and sample subjects either avoid answering or provide misleading information. Furthermore, to draw a random sample we need to do this from the reference population, so we must have basic information about the latter (e.g., from census data).33 And this is not the case in many instances. The representativeness of a sample is often associated with the sample’s distribution with respect to a number of control variables (e.g., age, gender, socio-economic status and location where individuals live). However, even if the sample may mimic the universe with respect to the control variables, this is not sufficient to represent it with respect to the aspects that are under investigation. For example, even if there is a similar percentage of married individuals in the sample as in the reference population, it is by no means certain that, in the absence of sample randomness, the married individuals in the sample can represent those in the reference population. This phenomenon is called “sample selection bias”. Box 2.6 Measurement of depressive symptoms As illustrated in Box 1.3, the use of psychometric methods is widespread in the analysis of psychological symptoms. In particular, the MFQ has been developed and used to detect depressive symptoms and anxiety disorders. To this end, Delmastro and Zamariola (2020) explored the effects of COVID19 on mental health. We administered the SMFQ (the short version of MFQ) to a random and representative sample of the Italian population. The study was conducted right after the first lockdown phase, in June 2020, to collect
33
In social studies, the response rate is sometimes requested (with minimum thresholds, usually 20–25%, considered as necessary). However, this information is uninformative, if not completely meaningless, if one does not know how the initial sample was drawn.
2.3 Measurement of Social Phenomena
25
the immediate reactions of the Italian population to the emergency. The final sample was composed of 6,692 Italian individuals, representative of the Italian population in terms of age, gender, and geographical area. More specifically, the sample design and the stratification were based on the following variables: (i) age; (ii) gender, (iii) geographical breakdown, and (iv) education. As a preliminary remark regarding internal consistency, it should be noted that Cronbach’s alpha—i.e., a measure of the reliability of the questionnaire—is equal to 0.91 for the overall sample, which is well above the threshold of acceptance (i.e., 0.70; see Cortina 1993). The first step was to measure the distribution of the SMFQ score among Italian population, just after the lockdown period (see Figure). As we would expect, the total distribution of SMFQ score is asymmetric and skewed to the right (also by skewness tests), with mean of 5.2. It presents a mode near 0, and a slight bump around 12. If we define a cut-off at 12 that may indicate the presence of depressive symptoms in the respondent (see again Box 1.3), then, in June 2020, 14.4% of the Italian population lied above this threshold.
Distribution of SMFQ Scores on Italian population
Source Delmastro and Zamariola (2020) Although sampling can in practice lead to multiple errors in the analysis of the reference universe, applied research does not have many alternatives, except as mentioned in the case where data on the universe were available (see Box 2.5). In this context, the advent of big data has completely changed the framework: “Yet sampling comes with a cost that has long been acknowledged but shunted aside. It loses detail. In some cases, there is no other way but to sample. In many areas, however, a shift is taking place from collecting some data to gathering as much
26
2 A Three-Step Procedure
as possible, and if feasible, getting everything: N = all” (Mayer-Schonberger and Cukier 2013). However, the use of big data has not solved the problem. Take the case of electoral forecasts which is very illustrative for our purposes. There is already a huge literature using social media data to predict citizens’ electoral choices (see Bovet et al. 2018). This has stemmed both from the low-cost availability of social data, which provide insights into many aspects of people’s political ideology, and from disaffection with traditional election polls that have evidenced major predictive errors in key elections (e.g., Brexit 2016 US Political Elections). However, the use of social data has greatly improved the knowledge about many aspects of human thinking, including ideological and political thinking (even providing massive tools to influence it34 ), rather than providing robust electoral predictions. The reasons behind this outcome offers useful information on applied social science methodology. First, n (i.e., the size of the sample) is always lower than N (i.e., the size of the reference population). Big data is never the whole. But the perception of having a huge number of data often overshadows the fact that the sample, although very large, may not be representative of the population (sample selection bias never dies!): “The conclusion from this experiment is the need for continuous monitoring of demographic distribution between the Twitter users, and careful adjustment of the predicted results” (Grˇcar et al. 2017). In other words, the data available are limited because they concern that part of the population that uses, and is active on, specific social media (e.g., Twitter, which is widely used for these analyses because it is easier for researchers to get access to data35 ). The problem is not only that of having a biased sample of the reference universe, which can be adjusted on a demographic basis, but more importantly that the sample is by no means random. On the contrary, it is clear that those who use social media, such as Twitter, are self-selected, especially with regard to ideological and political issues. Can we predict the political behavior of those who are not on Twitter (or any other social network) from those who actively use it? Probably not. Not only because there is a demographic bias between Twitter users and the voting population, but also because, all things being equal (e.g., age, gender, location), Twitter active users behave differently from the rest of the population (e.g., they are more engaged). There is another issue that also gains relevance from an epistemological point of views. Social media data often provide insights into some important aspects of human thinking, but not directly into the behavior under analysis. It is rare that we gather voting intentions and behavior from browsing data on a social networking 34
In a recent report eMarketer shows that worldwide 57% of major research buyers/suppliers make use of nonconscious online market research techniques such as eye tracking (38%), behavioral economic models (32%), facial analysis (24%), applied neuroscience (20%), biometric response (16%) (see eMarketer, Biometric Marketing 2019: Revolutionary Personalization Tool or Targeting Gone Awry?, October 2019). 35 Note however that in October 2020, Twitter was the third largest social platform in the US with a 14% share (source: StatCounter).
2.3 Measurement of Social Phenomena
27
site, except for that (small) part of users that is more ideologically committed. This problem is even more acute in contexts where the political offer is highly fragmented and/or where there is high voter volatility (as has been the case in Europe in recent years). The underlying issue is that the data we have available on social networks (or more generally through big data) are often different from what we would like. The effect on social science is the risk of it being driven by the data available, both in the objectives of the research and in the methods by which we measure phenomena (i.e., classifications, metrics and measurement methodology).36 In short, while the approach to social science with traditional methodologies (e.g., surveys, experiments) has some significant methodological shortcomings in the phase of measuring phenomena but leaves the decision on the structure of the study to the researcher, the use of big data has often resulted in a subordination of the research to data. And we are back to the end of theory (see above). This is not to say that data from non-traditional internet sources are not fundamental to the new social science,37 but that they must nevertheless be traced back to a robust methodological structure in which the three steps we have described in this chapter are addressed. We are therefore back to the starting point. Either we get (directly or indirectly) information on the entire reference population, or the problems of randomness and representativeness of the sample remain to be addressed and discussed. There are, of course, statistical, and procedural techniques to deal with these issues (e.g., a sample can be incentivised) but it is fair to recognise that none of them completely solves the problem. A related aspect concerns the veracity of the information we have available. After all, a subject may respond untruthfully to the information we ask for (not only an individual, but also a company, an institution or even a government), just as many of the behaviours subjects have on the internet may not accurately represent what they want to express or do in real life.38 Again, there are statistic and procedural techniques to deal with these issues (e.g., there are methods to calibrate questionnaires and to assess consistency of responses), but once again they do not fully solve the underlying problem. In sum, when analysing social phenomena, the aim is to describe a reference population. Either we have information on the whole universe, or we examine a representative sample of the universe. In practice, however, drawing a representative random sample of the reference population is very complicated and this process must be often regarded more as a goal than something feasible. This is especially 36
Companies offering digital services (such as search, social, e-commerce) are well aware of this fact, so much so that many of them have developed partnerships with companies that hold traditional data, such as credit cards and traditional marketing companies. 37 For instance, text data (see Gentzkow et al. 2019) is key to analyse many social phenomena (see Chap. 4). 38 Note that the veracity of data is usually inversely proportional to the amount of data acquired. This is a standard result in big data analysis, but it is often neglected. Traditional structured data exhibit a much higher degree of veracity.
28
2 A Three-Step Procedure
so if there is no detailed information about the reference population from which to draw the sample, or if the latter is not large enough so that the process of replacing non-respondents becomes difficult or biased. The increasing availability of a massive amount of digital data may suggest that we can get information on the whole population, but this is often not (yet) the case. Sample randomisation procedures based on digital data do not solve the problem as the source data often concern a biased subset of the reference population. Furthermore, data integration with traditional information (through ex-post weighting procedures) can improve predictive performance but does not entirely solve the problem since the subset analysed may (and very often does) behave differently from the rest of the population (which lies outside the scope of the data). Finally, behaviours observed in all measurement procedures (surveys, experiments, digital data, etc.) can be distorted because they may not faithfully reflect the behaviour of subjects in real life. There are complex statistical and operational procedures for dealing with these issues, but it is fair to admit that none of them completely succeeds. Measurement, therefore, remains an area where practice and knowledge of the phenomenon remain essential and where, in addition to statistical and operational techniques, a case-by-case analysis is required. The next sections illustrate the challenges of measuring a specific case (i.e., threats to journalists) and the practical procedures put in place to address them.
2.3.1 Measuring Threats to Journalists As there are no reliable data sources on threats to journalists (see also Sect. 2.4), we proceeded to carry out an ad-hoc survey. The survey conducted in autumn 2018 involved a large sample of Italian journalists: 1,872 individuals, equal to 6.2% of the reference population (i.e., Italian working journalists, that we estimated at 30,194 from data of the National Institute for Italian Journalists’ Social Security, INPGI).39 The sample is not random. When analysing a population as specific as that of journalists, it is impossible to find an open access census register from which to draw a random and stratified sample.40 This is a typical case in social science research. So, we employed aggregate socio-demographic statistics (in terms of age, gender, location and income) from INPGI to calculate ex-post sampling weights.41 39
I gratefully acknowledge INPGI, and in particular Mimma Iorio, for providing aggregate information and data on the distribution of journalists in Italy (by gender, age, professional status, region, and income). 40 In Italy, the only registry from which a representative sample of active journalists can be drawn is that of INPGI but for privacy policy reasons it is not accessible, if not for more aggregate kind of information (see previous note). 41 The weighting procedure was carried out in collaboration with the Italian National Institute of Statistics—ISTAT (Federico Polidoro is gratefully acknowledged). This procedure resulted in an estimation method stemming from the resolution of a constrained minimum problem that falls within a general class of estimators known as constrained weighting estimators. The weight to be given to the sample unit is obtained by means of a complex procedure that: (i) corrects the distorting effect
2.3 Measurement of Social Phenomena
29
The size, both in absolute numbers (i.e., almost 2,000 individuals) and as a proportion of the reference universe (i.e., 6.2%), as well as the sample weighting process makes the available data statistically robust, or at least as robust as possible. A computer-assisted survey information collection (CASIC) method was used to gather information. Italian journalists were contacted by email and their participation was also encouraged by all relevant associations in Italy (i.e., FNSI, Ordine dei Giornalisti, USGF and USIGRAI which are gratefully acknowledged). This process led to the most widespread analysis of journalism ever conducted worldwide on a single country.42 The questionnaire covered all aspects of the journalistic profession. This allowed to address multifaceted traits of a multidimensional phenomenon (see Chap. 3), and to further mitigate self-selection with regard to the phenomenon under investigation (i.e., threats to journalists). The part of the questionnaire regarding threats has been formulated according to the classification illustrated in paragraph 2.1.1 (see Table 2.1). The method is self-reporting that is the only one that enables to analyse the shadow part of this phenomenon, which in turn represents a significant component of all acts of violence and not only (see next section). Table 2.4 presents the distribution of the universe of all Italian journalists and sample journalists by gender, age, and Italian working macro-region. Although the sample is not random, it represents, both in absolute value and in terms of the distribution of socio-economic characteristics, a fairly faithful representation of the reference universe. Moreover, the applied operational procedures (e.g., wide-ranging survey, mobilisation of all components of the profession—both employees and freelancers) mitigated the problem of self-selection.
2.3.1.1
Summary Statistics
In 2018 (see Table 2.5), slightly less than a quarter of all Italian journalists (23.6%) suffered some form of intimidation (at least one threat among all types considered, see Table 2.1). Traditional threats represent the most widespread form of intimidation (14.1%), immediately followed by online threats (13.8%). More limited, at least in quantitative terms, is the incidence of legal complaints (10.1%) and actions aimed at hindering information (7.8%). Among the traditional threats, verbal warnings are the most widespread (10.9%) and physical aggression the uncommon ones (1.4%). Similarly, insults are prevalent on the web (13.4%), while those of a sexual nature (2.4%), as will be illustrated later on, affect only a specific group of journalists (i.e., younger women, see Chap. 3). In addition to the size of the phenomenon, Table 1.5 also provides information about the frequency of threats to journalists. As can be inferred from both the of the total non-response due to the inability to interview some journalists; (ii) takes into account the knowledge of known totals of important auxiliary variables (i.e., age, gender, income and Italian macro-area of work) available from INPGI. 42 See Agcom, Observatory on Journalism, November 2020.
30 Table 2.4 Socio-demo characteristics: reference population vs. sample
2 A Three-Step Procedure Socio-demo characteristics
Italian journalist Universe (%)
Sample (%)
Gender Female
42
40
Male (and other)
58
60
Age