Molecular Medicine: How Science Works 3031271327, 9783031271328
130 72 198MB
English Pages [708]
Preface
Contents
Abbreviations
1 The Human Genome and Its Variations
1.1 Migration of Homo Sapiens and the Diversity of Human Populations
1.2 Genetic Variants of the Human Genome
1.3 Measuring Human Genetic Variations
Additional Reading
2 Gene Expression and Chromatin
2.1 Central Dogma of Molecular Biology
2.2 Nucleosomes: Central Units of Chromatin
2.3 Chromatin Structure and Epigenetics
2.4 Epigenetics Enables Gene Expression
2.5 Gene Regulation in the Context of Nuclear Architecture
Additional Reading
3 Basal Transcriptional Machinery
3.1 Core Promoter
3.2 TATA Box and Other Core Promoter Elements
3.3 Genome-Wide Core Promoter Identification
3.4 TFIID and MED as Paradigms of Multiprotein Complexes
Additional Reading
4 Transcription Factors and Signal Transduction
4.1 Site-Specific Transcription Factors and Their Domains
4.2 Classification of Transcription Factors
4.3 Activation of Transcription Factors
4.4 Inflammatory Signaling via NFκB
4.5 Sensing Cellular Stress via P53
Additional Reading
5 A Key Transcription Factor Family: Nuclear Receptors
5.1 The Nuclear Receptor Superfamily
5.2 Molecular Interactions of Nuclear Receptors
5.3 Nuclear Receptors as Nutrient Sensors
5.4 Integration of Lipid Metabolism by PPARs, LXRs and FXR
5.5 Coordination of the Immune Response by VDR
Additional Reading
6 DNA Methylation
6.1 Cytosines and Their Methylation
6.2 The DNA Methylome
6.3 CTCF and Genetic Imprinting
6.4 DNA Methylation and Disease
Additional Reading
7 Histone Modifications
7.1 Histones and Their Modifications
7.2 Genome-Wide Interpretation of the Histone Code
7.3 Chromatin Modifiers
7.4 Gene Regulation via Chromatin Modifiers
Additional Reading
8 Chromatin Remodeling and Organization
8.1 Nucleosome Positioning at Promoters
8.2 Chromatin Remodeling
8.3 Organization of Chromatin in the Nucleus
Additional Reading
9 Regulatory Impact of Non-coding RNA
9.1 Non-Coding RNAs
9.2 miRNAs and Their Regulatory Potential
9.3 Long ncRNAs
9.4 Enhancer RNAs
Additional Reading
10 Genome-Wide Principles of Gene Regulation
10.1 Gene Regulation in the Context of Big Biology
10.2 Epigenetic Methods
10.3 Integrating Epigenome-Wide Datasets
10.4 Genome-Wide Understanding of Epigenetics
Additional Reading
11 Epigenetics in Development
11.1 Epigenetic Changes During Early Human Development
11.2 The Epigenetic Landscape
11.3 Epigenetic Dynamics During Differentiation
11.4 Epigenetics of Blood Cell Differentiation
11.5 Neuronal Development: The Role of Epigenetics
11.6 Epigenetic Basis of Memory
Additional Reading
12 Epigenetics and Aging
12.1 Transgenerational Epigenetic Inheritance
12.2 Population Epigenetics
12.3 Epigenetics of Aging
12.4 Epigenetics of the Circadian Clock
Additional Reading
13 Epigenetics and Disease
13.1 Epigenetic Reprograming in Cancer
13.2 Epigenetic Basis of Neurological Diseases
13.3 Epigenetic Therapy of Diseases
Additional Reading
14 Cells and Tissues of the Immune System
14.1 Global Burden of Infectious Diseases
14.2 Innate and Adaptive Immunity
14.3 Hematopoiesis
14.4 Primary and Secondary Structures of the Immune System
Additional Reading
15 Innate Immunity and Inflammation
15.1 Receptors for PAMPs and DAMPs
15.2 Myeloid and Lymphoid Cells of Innate Immunity
15.3 Role of Epigenetics in Immune Responses
15.4 Mechanisms of Phagocytosis and Inflammation
Additional Reading
16 Adaptive Immunity and Antigen Receptor Diversity
16.1 Classes and Responses of Adaptive Immune Cells
16.2 Lymphocyte Maturation
16.3 Mechanisms of Antigen Receptor Diversity
Additional Reading
17 B Cell Immunity: BCRs, Antibodies and Their Effector Functions
17.1 Structure and Diversity of Antibodies and BCRs
17.2 BCR Signaling
17.3 Humoral Adaptive Immune Response
Additional Reading
18 Antigen-Presenting Cells and MHCs
18.1 Antigen-Presenting Cells
18.2 MHC Proteins and the HLA Locus
18.3 MHC Pathways
Additional Reading
19 T Cell Immunity: TCRs and Their Effector Functions
19.1 TCR Signaling
19.2 T Cell Effector Functions
19.3 TH Cells
19.4 Cytotoxic T Cells
Additional Reading
20 Immunity to Bacterial Pathogens and the Microbiome
20.1 Principles of Immune Responses to Infections
20.2 Immune Responses to Bacteria
20.3 Emerging Microbial Pathogens
20.4 Immunity to the Microbiome
Additional Reading
21 Immunity to Viral Pathogens and the Virome
21.1 Principles of Immune Responses to Viruses
21.2 Chronic Virus Infections and Emerging Viral Pathogens
21.3 Influenza
21.4 COVID-19
Additional Reading
22 Tolerance and Transplantation Immunology
22.1 Central and Peripheral Tolerance
22.2 Graft Rejection
22.3 Immunosuppression
Additional Reading
23 Immunological Hypersensitivities: Allergy and Autoimmunity
23.1 Classification of Hypersensitivities
23.2 Immunity of Allergies
23.3 Type 2 and 3 Hypersensitivities
23.4 T Cell-Mediated Autoimmunity
23.5 The Equilibrium Model of Immunity
Additional Reading
24 Introduction to Cancer
24.1 The Global Burden of Cancer
24.2 Categorization and Diagnosis of Tumors
24.3 Crucial Transitions in Cancer
24.4 Causes of Cancer
24.5 Cancer Prevention
Additional Reading
25 Oncogenes, Signal Transduction and the Hallmarks of Cancer
25.1 Cellular Transformation
25.2 Activating Oncogenes in Signal Transduction Pathways
25.3 Oncogenic Translocations and Amplifications
25.4 The Hallmarks of Cancer Concept
Additional Reading
26 Tumor Suppressor Genes and Cell Fate Control
26.1 p53—A Master Example Tumor Suppressor
26.2 Tumor Suppressors and Oncogenes in Cell Cycle Control
26.3 Tumor Suppressor Inhibition and Cancer Onset
Additional Reading
27 Multistep Tumorigenesis and Genome Instability
27.1 Characteristics of Tumor Growth
27.2 Multistep Tumorigenesis
27.3 Genome Instability
27.4 Cancer Driver Mutations and Genes
Additional Reading
28 Cancer Genomics
28.1 Human Genetic Variation and Cancer Susceptibility
28.2 The Cancer Genome
28.3 Cancer Genome Projects
Additional Reading
29 Cancer Epigenomics
29.1 Epigenetic Mechanisms of Cancer
29.2 DNA Methylation and Cancer
29.3 Chromatin Changes and Cancer
Additional Reading
30 Aging and Cancer
30.1 Central Role of Aging During Chronic Diseases
30.2 The Hallmarks of Aging
30.3 Telomeres and Replicative Immortality
Additional Reading
31 Tumor Microenvironment
31.1 The Impact of the Wound Healing Program for Cancer
31.2 Cell Types of the Tumor Microenvironment
31.3 Inducing Angiogenesis
31.4 Tumor-Promoting Inflammation
31.5 Deregulating Cellular Energetics
Additional Reading
32 Metastasis and Cachexia
32.1 The Metastatic Cascade
32.2 Epithelial-Mesenchymal Transition
32.3 Metastatic Colonization
32.4 Cachexia
Additional Reading
33 Cancer Immunology
33.1 Outline of Cancer Immunity
33.2 Recognition of Cancer Antigens
33.3 Monoclonal Antibodies in Cancer Immunotherapy
33.4 Immune Cell Therapies
Additional Reading
34 Architecture of Cancer Therapies
34.1 Classical Cancer Treatments
34.2 Targeted Therapies
34.3 Precision Oncology
Additional Reading
35 Nutrition and Common Diseases
35.1 Evolution of Human Nutrition
35.2 Principles of Metabolism
35.3 Dietary Molecules and Their Sensing
35.4 Nutrition and Metabolic Diseases
35.5 Impact of Physical Activity
Additional Reading
36 Interference of the Human Genome with Nutrients
36.1 Human Genetic Adaptions
36.2 Genetic Adaption to Dietary Changes
36.3 Regulatory SNPs and Quantitative Traits
36.4 Definition of Nutrigenomics
36.5 Personal Omics Profiles
Additional Reading
37 Nutritional Epigenetics, Signaling and Aging
37.1 Intermediary Metabolism and Epigenetic Signaling
37.2 Aging and Conserved Nutrient-Sensing Pathways
37.3 Neuroendocrine Regulation of Aging
37.4 Principles of Insulin Signaling
37.5 Central Role of FOXO Transcription Factors
37.6 Calorie Restriction from Yeast to Mammals
37.7 Cellular Energy Status Sensing by SIRTs and AMPK
Additional Reading
38 Chronic Inflammation and Metabolic Stress
38.1 Acute and Chronic Inflammation
38.2 Reverse Cholesterol Transport and Inflammation
38.3 Sensing Metabolic Stress via the ER
Additional Reading
39 Obesity
39.1 Definition of Obesity
39.2 Adipogenesis
39.3 Inflammation in Adipose Tissue
39.4 Energy Homeostasis and Hormonal Regulation of Food Uptake
39.5 Genetics of Obesity
Additional Reading
40 Insulin Resistance and Diabetes
40.1 Glucose Homeostasis
40.2 Insulin Resistance in Skeletal Muscle and Liver
40.3 β Cell Failure
40.4 Definition of Diabetes
40.5 Failure of Glucose Homeostasis in T2D and Its Treatment
40.6 Genetics and Epigenetics of T2D
Additional Reading
41 Heart Disease and the Metabolic Syndrome
41.1 Hypertension
41.2 Mechanisms of Atherosclerosis
41.3 Lipoproteins and Dyslipidemias
41.4 Whole Body’s Perspective of the Metabolic Syndrome
41.5 Metabolic Syndrome in Key Metabolic Organs
41.6 Genetics and Epigenetics of the Metabolic Syndrome
Additional Reading
42 Epigenetics, Inflammation and Disease
42.1 Genetics, Epigenetics and Environment
42.2 Central Relation of Epigenetics and Immunity
Additional Reading
Glossary
Recommend Papers

![How It Works
The Science of Memory [5 ed.]](https://ebin.pub/img/200x200/how-it-works-the-science-of-memory-5nbsped.jpg)


![Cancer Biology: How Science Works [1 ed.]
303075698X, 9783030756987](https://ebin.pub/img/200x200/cancer-biology-how-science-works-1nbsped-303075698x-9783030756987.jpg)


- Author / Uploaded
- Carsten Carlberg
- Eunike Velleuer
- Ferdinand Molnar
File loading please wait...
Citation preview
Carsten Carlberg · Eunike Velleuer · Ferdinand Molnár
Molecular Medicine How Science Works
Molecular Medicine
Carsten Carlberg · Eunike Velleuer · Ferdinand Molnár
Molecular Medicine How Science Works
Carsten Carlberg Institute of Animal Reproduction and Food Research Polish Academy of Sciences in Olsztyn Olsztyn, Poland
Eunike Velleuer Helios Clinic Centre for Child and Adolescent Health Krefeld, Germany
Institute of Biomedicine University of Eastern Finland Kuopio, Poland Ferdinand Molnár School of Sciences and Humanities Nazarbayev University Astana, Kazakhstan
ISBN 978-3-031-27132-8 ISBN 978-3-031-27133-5 (eBook) https://doi.org/10.1007/978-3-031-27133-5 © The Editor(s) (if applicable) and The Author(s), under exclusive license to Springer Nature Switzerland AG 2023 This work is subject to copyright. All rights are solely and exclusively licensed by the Publisher, whether the whole or part of the material is concerned, specifically the rights of translation, reprinting, reuse of illustrations, recitation, broadcasting, reproduction on microfilms or in any other physical way, and transmission or information storage and retrieval, electronic adaptation, computer software, or by similar or dissimilar methodology now known or hereafter developed. The use of general descriptive names, registered names, trademarks, service marks, etc. in this publication does not imply, even in the absence of a specific statement, that such names are exempt from the relevant protective laws and regulations and therefore free for general use. The publisher, the authors, and the editors are safe to assume that the advice and information in this book are believed to be true and accurate at the date of publication. Neither the publisher nor the authors or the editors give a warranty, expressed or implied, with respect to the material contained herein or for any errors or omissions that may have been made. The publisher remains neutral with regard to jurisdictional claims in published maps and institutional affiliations. This Springer imprint is published by the registered company Springer Nature Switzerland AG The registered company address is: Gewerbestrasse 11, 6330 Cham, Switzerland
Preface
The fascinating area of molecular medicine provides a description of health and disease on a molecular and cellular level. We should try to understand ourselves in detail as well as in a global setting. Basic biology explains cellular mechanisms, such as growth, differentiation and cell death, which make life as a whole possible. Every (human) organism represents a complex interplay between hundreds of different cell types forming distinctive tissues and organs with specialized tasks. These processes need to be highly orchestrated especially during embryogenesis and later on in maintaining homeostasis of the adult body. Studying the cellular and molecular basis of these mechanisms is one of the most fascinating areas but also a great challenge. Nevertheless, research made the biggest steps in elucidating biological processes via studying malfunctions of normal mechanisms leading to different diseases. We will start this book with the understanding of gene regulation and epigenetics, i.e., the interplay of transcription factors and chromatin. DNA is wrapped around complexes of histone proteins that help to fit the genome into a cell nucleus with a diameter of less than 10 μm. This protein-DNA complex is referred to as chromatin. The most important function of chromatin is to keep in a cell- and tissuespecific manner some 90% of our genome inaccessible to transcription factors and polymerases. In other words, chromatin acts as a gatekeeper for undesired gene activation. The differentiation of embryonal stem (ES) cells into specialized cell types happens during embryogenesis within the first weeks of the life of a fetus. Moreover, in every moment of an adult’s life stem cells in the bone marrow, the skin and the intestine are growing and differentiating into specialized cells that replace cell loss, such as of our immune system or of our body’s outer and inner surface. The underlying mechanism of all these differentiation processes is epigenetic programing of chromatin structure, i.e., a change of the so-called epigenetic landscape. Each of the 400 tissues and cell types forming our body uses a different subset of the 20,000 protein-coding genes of our genome. Thus, each of us has only one genome but at least 400 different epigenomes. Epigenetics prevents that, e.g., a kidney cell
v
vi
Preface
changes overnight into a neuron or vice versa. In this way, epigenetics provides terminally differentiated cells with permanent memory about their identity. These first examples indicate that epigenetics affects diverse aspects in health and disease. This book will discuss the central importance of epigenetics during embryogenesis and cellular differentiation as well as in the process of aging and the risk for the development of cancer. Moreover, the role of the epigenome as a molecular storage of cellular events, not only in the brain but also in metabolic organs and in the immune system, will be described. In this context, epigenetic effects on neurodegenerative diseases as well as autism, metabolic diseases, such as type 2 diabetes (T2D) and disorders based on an overactive immune system, such as sepsis, allergy and autoimmunity, will be discussed. Our immune system is composed of biological structures like the lymphatic system and bone marrow, cell types like leukocytes as well as proteins like antibodies and complement proteins. The perfect balance of these components protects us against infectious diseases and cancer. In this book, we will present principles of molecular immunology, in order to understand the collective and coordinated response of these cells and proteins to substances that are foreign to our body. The main purpose of this immune response is the fight against microbes, such as viruses, bacteria, fungi and parasites. However, the example of allergic reactions, which nowadays are getting continuously more common, demonstrates that also non-microbial molecules can induce a strong reaction of our immune system. Moreover, incorrect reactions of the immune system can lead to autoimmune diseases. Thus, immune responses can cause tissue injuries that may harm our body more than the effects of pathogenic microbes. We will present in this book that epigenetics and immunity serve as fundaments, in order to understand many processes in human biology, ranging from embryogenesis to homeostasis and aging, and relate them to each other. In this context, we will cover the molecular basis of most common diseases, such as cancer, the different aspects of the metabolic syndrome as well as immune disorders. We will outline that most non-communicable human diseases have a genetic (= inherited) as well as an epigenetic component. For example, cancer is typically considered as a disease of our genome caused by the accumulation of DNA point mutations as well as translocations, deletions and amplifications of larger genomic regions. However, tumorigenesis also comes along with abnormalities in cellular identity, a changed immune response, different responsiveness to internal and external stimuli and major changes in the transcriptome, all of which are based on changes of our epigenome. In fact, most types of cancer carry mutations both in the genome and epigenome. Many common diseases, such as T2D, can be explained to less than 20% via a genetic predisposition. We cannot change the genes that we are born with but we can take care of the remaining 80% being primarily based on our epigenome. Therefore, there is a high level of individual responsibility for staying healthy. For this reason, not only biologists and biochemists should be aware of this topic, but all students of biomedical disciplines will benefit from being introduced into the concepts of molecular medicine. This will provide them with a good basis for their specialized disciplines of modern life science research and the care for patients.
Preface
vii
The book is subdivided into 42 chapters that are linked to a series of lecture courses in “Molecular Medicine and Genetics”, “Molecular Immunology”, “Cancer Biology” and “Nutrigenomics” that are given by one of us (C. Carlberg) in different forms since 2002 at the University of Eastern Finland in Kuopio. This book represents an updated version and fusion of the textbooks Mechanisms of Gene Regulation: How Science Works (ISBN 978-3-030-52321-3), Human Epigenetics: How Science Works (ISBN 978-3-030-22907-8). Molecular Immunology: How Science Works (ISBN 978-3031-04024-5), Cancer Biology: How Science Works (ISBN 978-3-030-75699-4) and Nutrigenomics: How Science Works (ISBN 978-3-030-36948-4). By combining basic understanding of cellular mechanism with clinical examples, the authors hope to make this textbook a personal experience. A glossary in the appendix will explain the major specialist’s terms. We hope that readers will enjoy this rather visual book and get as enthusiastic about molecular medicine as the authors are. Olsztyn, Poland Düsseldorf, Germany Astana, Kazakhstan December 2022
Carsten Carlberg Eunike Velleuer Ferdinand Molnár
Contents
1
The Human Genome and Its Variations . . . . . . . . . . . . . . . . . . . . . . . . . 1.1 Migration of Homo Sapiens and the Diversity of Human Populations . . . . . . . . . . . . . . . . . . . . . . . . . . . . . . . . . . . . . . . . . . . . . . 1.2 Genetic Variants of the Human Genome . . . . . . . . . . . . . . . . . . . . . 1.3 Measuring Human Genetic Variations . . . . . . . . . . . . . . . . . . . . . . . Additional Reading . . . . . . . . . . . . . . . . . . . . . . . . . . . . . . . . . . . . . . . . . . . . .
1 1 4 7 12
2
Gene Expression and Chromatin . . . . . . . . . . . . . . . . . . . . . . . . . . . . . . . 2.1 Central Dogma of Molecular Biology . . . . . . . . . . . . . . . . . . . . . . . 2.2 Nucleosomes: Central Units of Chromatin . . . . . . . . . . . . . . . . . . . 2.3 Chromatin Structure and Epigenetics . . . . . . . . . . . . . . . . . . . . . . . . 2.4 Epigenetics Enables Gene Expression . . . . . . . . . . . . . . . . . . . . . . . 2.5 Gene Regulation in the Context of Nuclear Architecture . . . . . . . Additional Reading . . . . . . . . . . . . . . . . . . . . . . . . . . . . . . . . . . . . . . . . . . . . .
13 13 17 20 22 25 28
3
Basal Transcriptional Machinery . . . . . . . . . . . . . . . . . . . . . . . . . . . . . . . 3.1 Core Promoter . . . . . . . . . . . . . . . . . . . . . . . . . . . . . . . . . . . . . . . . . . . 3.2 TATA Box and Other Core Promoter Elements . . . . . . . . . . . . . . . 3.3 Genome-Wide Core Promoter Identification . . . . . . . . . . . . . . . . . . 3.4 TFIID and MED as Paradigms of Multiprotein Complexes . . . . . Additional Reading . . . . . . . . . . . . . . . . . . . . . . . . . . . . . . . . . . . . . . . . . . . . .
29 29 32 34 37 45
4
Transcription Factors and Signal Transduction . . . . . . . . . . . . . . . . . . 4.1 Site-Specific Transcription Factors and Their Domains . . . . . . . . 4.2 Classification of Transcription Factors . . . . . . . . . . . . . . . . . . . . . . . 4.3 Activation of Transcription Factors . . . . . . . . . . . . . . . . . . . . . . . . . 4.4 Inflammatory Signaling via NFκB . . . . . . . . . . . . . . . . . . . . . . . . . . 4.5 Sensing Cellular Stress via P53 . . . . . . . . . . . . . . . . . . . . . . . . . . . . . Additional Reading . . . . . . . . . . . . . . . . . . . . . . . . . . . . . . . . . . . . . . . . . . . . .
47 47 53 56 59 63 66
ix
x
Contents
5
A Key Transcription Factor Family: Nuclear Receptors . . . . . . . . . . . 5.1 The Nuclear Receptor Superfamily . . . . . . . . . . . . . . . . . . . . . . . . . 5.2 Molecular Interactions of Nuclear Receptors . . . . . . . . . . . . . . . . . 5.3 Nuclear Receptors as Nutrient Sensors . . . . . . . . . . . . . . . . . . . . . . 5.4 Integration of Lipid Metabolism by PPARs, LXRs and FXR . . . . 5.5 Coordination of the Immune Response by VDR . . . . . . . . . . . . . . Additional Reading . . . . . . . . . . . . . . . . . . . . . . . . . . . . . . . . . . . . . . . . . . . . .
67 67 70 76 78 82 85
6
DNA Methylation . . . . . . . . . . . . . . . . . . . . . . . . . . . . . . . . . . . . . . . . . . . . . 6.1 Cytosines and Their Methylation . . . . . . . . . . . . . . . . . . . . . . . . . . . 6.2 The DNA Methylome . . . . . . . . . . . . . . . . . . . . . . . . . . . . . . . . . . . . . 6.3 CTCF and Genetic Imprinting . . . . . . . . . . . . . . . . . . . . . . . . . . . . . . 6.4 DNA Methylation and Disease . . . . . . . . . . . . . . . . . . . . . . . . . . . . . Additional Reading . . . . . . . . . . . . . . . . . . . . . . . . . . . . . . . . . . . . . . . . . . . . .
87 87 90 93 97 99
7
Histone Modifications . . . . . . . . . . . . . . . . . . . . . . . . . . . . . . . . . . . . . . . . . 7.1 Histones and Their Modifications . . . . . . . . . . . . . . . . . . . . . . . . . . . 7.2 Genome-Wide Interpretation of the Histone Code . . . . . . . . . . . . . 7.3 Chromatin Modifiers . . . . . . . . . . . . . . . . . . . . . . . . . . . . . . . . . . . . . . 7.4 Gene Regulation via Chromatin Modifiers . . . . . . . . . . . . . . . . . . . Additional Reading . . . . . . . . . . . . . . . . . . . . . . . . . . . . . . . . . . . . . . . . . . . . .
101 101 103 109 111 114
8
Chromatin Remodeling and Organization . . . . . . . . . . . . . . . . . . . . . . . 8.1 Nucleosome Positioning at Promoters . . . . . . . . . . . . . . . . . . . . . . . 8.2 Chromatin Remodeling . . . . . . . . . . . . . . . . . . . . . . . . . . . . . . . . . . . 8.3 Organization of Chromatin in the Nucleus . . . . . . . . . . . . . . . . . . . Additional Reading . . . . . . . . . . . . . . . . . . . . . . . . . . . . . . . . . . . . . . . . . . . . .
117 117 119 121 128
9
Regulatory Impact of Non-coding RNA . . . . . . . . . . . . . . . . . . . . . . . . . 9.1 Non-Coding RNAs . . . . . . . . . . . . . . . . . . . . . . . . . . . . . . . . . . . . . . . 9.2 miRNAs and Their Regulatory Potential . . . . . . . . . . . . . . . . . . . . . 9.3 Long ncRNAs . . . . . . . . . . . . . . . . . . . . . . . . . . . . . . . . . . . . . . . . . . . 9.4 Enhancer RNAs . . . . . . . . . . . . . . . . . . . . . . . . . . . . . . . . . . . . . . . . . . Additional Reading . . . . . . . . . . . . . . . . . . . . . . . . . . . . . . . . . . . . . . . . . . . . .
131 131 133 138 142 144
10 Genome-Wide Principles of Gene Regulation . . . . . . . . . . . . . . . . . . . . 10.1 Gene Regulation in the Context of Big Biology . . . . . . . . . . . . . . . 10.2 Epigenetic Methods . . . . . . . . . . . . . . . . . . . . . . . . . . . . . . . . . . . . . . 10.3 Integrating Epigenome-Wide Datasets . . . . . . . . . . . . . . . . . . . . . . . 10.4 Genome-Wide Understanding of Epigenetics . . . . . . . . . . . . . . . . . Additional Reading . . . . . . . . . . . . . . . . . . . . . . . . . . . . . . . . . . . . . . . . . . . . .
145 145 148 153 154 159
11 Epigenetics in Development . . . . . . . . . . . . . . . . . . . . . . . . . . . . . . . . . . . . 11.1 Epigenetic Changes During Early Human Development . . . . . . . . 11.2 The Epigenetic Landscape . . . . . . . . . . . . . . . . . . . . . . . . . . . . . . . . . 11.3 Epigenetic Dynamics During Differentiation . . . . . . . . . . . . . . . . . 11.4 Epigenetics of Blood Cell Differentiation . . . . . . . . . . . . . . . . . . . . 11.5 Neuronal Development: The Role of Epigenetics . . . . . . . . . . . . . .
161 161 164 169 171 173
Contents
xi
11.6 Epigenetic Basis of Memory . . . . . . . . . . . . . . . . . . . . . . . . . . . . . . . 177 Additional Reading . . . . . . . . . . . . . . . . . . . . . . . . . . . . . . . . . . . . . . . . . . . . . 179 12 Epigenetics and Aging . . . . . . . . . . . . . . . . . . . . . . . . . . . . . . . . . . . . . . . . . 12.1 Transgenerational Epigenetic Inheritance . . . . . . . . . . . . . . . . . . . . 12.2 Population Epigenetics . . . . . . . . . . . . . . . . . . . . . . . . . . . . . . . . . . . . 12.3 Epigenetics of Aging . . . . . . . . . . . . . . . . . . . . . . . . . . . . . . . . . . . . . 12.4 Epigenetics of the Circadian Clock . . . . . . . . . . . . . . . . . . . . . . . . . . Additional Reading . . . . . . . . . . . . . . . . . . . . . . . . . . . . . . . . . . . . . . . . . . . . .
181 181 185 187 191 195
13 Epigenetics and Disease . . . . . . . . . . . . . . . . . . . . . . . . . . . . . . . . . . . . . . . . 13.1 Epigenetic Reprograming in Cancer . . . . . . . . . . . . . . . . . . . . . . . . . 13.2 Epigenetic Basis of Neurological Diseases . . . . . . . . . . . . . . . . . . . 13.3 Epigenetic Therapy of Diseases . . . . . . . . . . . . . . . . . . . . . . . . . . . . Additional Reading . . . . . . . . . . . . . . . . . . . . . . . . . . . . . . . . . . . . . . . . . . . . .
197 197 202 206 210
14 Cells and Tissues of the Immune System . . . . . . . . . . . . . . . . . . . . . . . . . 14.1 Global Burden of Infectious Diseases . . . . . . . . . . . . . . . . . . . . . . . 14.2 Innate and Adaptive Immunity . . . . . . . . . . . . . . . . . . . . . . . . . . . . . 14.3 Hematopoiesis . . . . . . . . . . . . . . . . . . . . . . . . . . . . . . . . . . . . . . . . . . . 14.4 Primary and Secondary Structures of the Immune System . . . . . . Additional Reading . . . . . . . . . . . . . . . . . . . . . . . . . . . . . . . . . . . . . . . . . . . . .
211 211 213 218 221 227
15 Innate Immunity and Inflammation . . . . . . . . . . . . . . . . . . . . . . . . . . . . . 15.1 Receptors for PAMPs and DAMPs . . . . . . . . . . . . . . . . . . . . . . . . . . 15.2 Myeloid and Lymphoid Cells of Innate Immunity . . . . . . . . . . . . . 15.3 Role of Epigenetics in Immune Responses . . . . . . . . . . . . . . . . . . . 15.4 Mechanisms of Phagocytosis and Inflammation . . . . . . . . . . . . . . . Additional Reading . . . . . . . . . . . . . . . . . . . . . . . . . . . . . . . . . . . . . . . . . . . . .
229 229 232 239 243 251
16 Adaptive Immunity and Antigen Receptor Diversity . . . . . . . . . . . . . . 16.1 Classes and Responses of Adaptive Immune Cells . . . . . . . . . . . . 16.2 Lymphocyte Maturation . . . . . . . . . . . . . . . . . . . . . . . . . . . . . . . . . . . 16.3 Mechanisms of Antigen Receptor Diversity . . . . . . . . . . . . . . . . . . Additional Reading . . . . . . . . . . . . . . . . . . . . . . . . . . . . . . . . . . . . . . . . . . . . .
253 253 260 262 269
17 B Cell Immunity: BCRs, Antibodies and Their Effector Functions . . . . . . . . . . . . . . . . . . . . . . . . . . . . . . . . . . . . . . . . . . . . . . . . . . . . . 17.1 Structure and Diversity of Antibodies and BCRs . . . . . . . . . . . . . . 17.2 BCR Signaling . . . . . . . . . . . . . . . . . . . . . . . . . . . . . . . . . . . . . . . . . . . 17.3 Humoral Adaptive Immune Response . . . . . . . . . . . . . . . . . . . . . . . Additional Reading . . . . . . . . . . . . . . . . . . . . . . . . . . . . . . . . . . . . . . . . . . . . .
271 271 277 279 287
18 Antigen-Presenting Cells and MHCs . . . . . . . . . . . . . . . . . . . . . . . . . . . . 18.1 Antigen-Presenting Cells . . . . . . . . . . . . . . . . . . . . . . . . . . . . . . . . . . 18.2 MHC Proteins and the HLA Locus . . . . . . . . . . . . . . . . . . . . . . . . . . 18.3 MHC Pathways . . . . . . . . . . . . . . . . . . . . . . . . . . . . . . . . . . . . . . . . . . Additional Reading . . . . . . . . . . . . . . . . . . . . . . . . . . . . . . . . . . . . . . . . . . . . .
289 289 292 296 300
xii
Contents
19 T Cell Immunity: TCRs and Their Effector Functions . . . . . . . . . . . . 19.1 TCR Signaling . . . . . . . . . . . . . . . . . . . . . . . . . . . . . . . . . . . . . . . . . . . 19.2 T Cell Effector Functions . . . . . . . . . . . . . . . . . . . . . . . . . . . . . . . . . . 19.3 TH Cells . . . . . . . . . . . . . . . . . . . . . . . . . . . . . . . . . . . . . . . . . . . . . . . . 19.4 Cytotoxic T Cells . . . . . . . . . . . . . . . . . . . . . . . . . . . . . . . . . . . . . . . . Additional Reading . . . . . . . . . . . . . . . . . . . . . . . . . . . . . . . . . . . . . . . . . . . . .
301 301 305 309 315 319
20 Immunity to Bacterial Pathogens and the Microbiome . . . . . . . . . . . . 20.1 Principles of Immune Responses to Infections . . . . . . . . . . . . . . . . 20.2 Immune Responses to Bacteria . . . . . . . . . . . . . . . . . . . . . . . . . . . . . 20.3 Emerging Microbial Pathogens . . . . . . . . . . . . . . . . . . . . . . . . . . . . . 20.4 Immunity to the Microbiome . . . . . . . . . . . . . . . . . . . . . . . . . . . . . . . Additional Reading . . . . . . . . . . . . . . . . . . . . . . . . . . . . . . . . . . . . . . . . . . . . .
321 321 326 333 337 344
21 Immunity to Viral Pathogens and the Virome . . . . . . . . . . . . . . . . . . . . 21.1 Principles of Immune Responses to Viruses . . . . . . . . . . . . . . . . . . 21.2 Chronic Virus Infections and Emerging Viral Pathogens . . . . . . . 21.3 Influenza . . . . . . . . . . . . . . . . . . . . . . . . . . . . . . . . . . . . . . . . . . . . . . . . 21.4 COVID-19 . . . . . . . . . . . . . . . . . . . . . . . . . . . . . . . . . . . . . . . . . . . . . . Additional Reading . . . . . . . . . . . . . . . . . . . . . . . . . . . . . . . . . . . . . . . . . . . . .
345 345 349 356 359 364
22 Tolerance and Transplantation Immunology . . . . . . . . . . . . . . . . . . . . . 22.1 Central and Peripheral Tolerance . . . . . . . . . . . . . . . . . . . . . . . . . . . 22.2 Graft Rejection . . . . . . . . . . . . . . . . . . . . . . . . . . . . . . . . . . . . . . . . . . 22.3 Immunosuppression . . . . . . . . . . . . . . . . . . . . . . . . . . . . . . . . . . . . . . Additional Reading . . . . . . . . . . . . . . . . . . . . . . . . . . . . . . . . . . . . . . . . . . . . .
365 365 369 377 380
23 Immunological Hypersensitivities: Allergy and Autoimmunity . . . . . 23.1 Classification of Hypersensitivities . . . . . . . . . . . . . . . . . . . . . . . . . . 23.2 Immunity of Allergies . . . . . . . . . . . . . . . . . . . . . . . . . . . . . . . . . . . . 23.3 Type 2 and 3 Hypersensitivities . . . . . . . . . . . . . . . . . . . . . . . . . . . . 23.4 T Cell-Mediated Autoimmunity . . . . . . . . . . . . . . . . . . . . . . . . . . . . 23.5 The Equilibrium Model of Immunity . . . . . . . . . . . . . . . . . . . . . . . . Additional Reading . . . . . . . . . . . . . . . . . . . . . . . . . . . . . . . . . . . . . . . . . . . . .
381 381 384 394 397 403 406
24 Introduction to Cancer . . . . . . . . . . . . . . . . . . . . . . . . . . . . . . . . . . . . . . . . 24.1 The Global Burden of Cancer . . . . . . . . . . . . . . . . . . . . . . . . . . . . . . 24.2 Categorization and Diagnosis of Tumors . . . . . . . . . . . . . . . . . . . . . 24.3 Crucial Transitions in Cancer . . . . . . . . . . . . . . . . . . . . . . . . . . . . . . 24.4 Causes of Cancer . . . . . . . . . . . . . . . . . . . . . . . . . . . . . . . . . . . . . . . . . 24.5 Cancer Prevention . . . . . . . . . . . . . . . . . . . . . . . . . . . . . . . . . . . . . . . . Additional Reading . . . . . . . . . . . . . . . . . . . . . . . . . . . . . . . . . . . . . . . . . . . . .
407 407 411 414 415 417 421
25 Oncogenes, Signal Transduction and the Hallmarks of Cancer . . . . . 25.1 Cellular Transformation . . . . . . . . . . . . . . . . . . . . . . . . . . . . . . . . . . . 25.2 Activating Oncogenes in Signal Transduction Pathways . . . . . . . . 25.3 Oncogenic Translocations and Amplifications . . . . . . . . . . . . . . . .
423 423 425 429
Contents
xiii
25.4 The Hallmarks of Cancer Concept . . . . . . . . . . . . . . . . . . . . . . . . . . 431 Additional Reading . . . . . . . . . . . . . . . . . . . . . . . . . . . . . . . . . . . . . . . . . . . . . 433 26 Tumor Suppressor Genes and Cell Fate Control . . . . . . . . . . . . . . . . . . 26.1 p53—A Master Example Tumor Suppressor . . . . . . . . . . . . . . . . . . 26.2 Tumor Suppressors and Oncogenes in Cell Cycle Control . . . . . . 26.3 Tumor Suppressor Inhibition and Cancer Onset . . . . . . . . . . . . . . . Additional Reading . . . . . . . . . . . . . . . . . . . . . . . . . . . . . . . . . . . . . . . . . . . . .
435 435 437 439 443
27 Multistep Tumorigenesis and Genome Instability . . . . . . . . . . . . . . . . . 27.1 Characteristics of Tumor Growth . . . . . . . . . . . . . . . . . . . . . . . . . . . 27.2 Multistep Tumorigenesis . . . . . . . . . . . . . . . . . . . . . . . . . . . . . . . . . . 27.3 Genome Instability . . . . . . . . . . . . . . . . . . . . . . . . . . . . . . . . . . . . . . . 27.4 Cancer Driver Mutations and Genes . . . . . . . . . . . . . . . . . . . . . . . . . Additional Reading . . . . . . . . . . . . . . . . . . . . . . . . . . . . . . . . . . . . . . . . . . . . .
445 445 448 451 454 457
28 Cancer Genomics . . . . . . . . . . . . . . . . . . . . . . . . . . . . . . . . . . . . . . . . . . . . . 28.1 Human Genetic Variation and Cancer Susceptibility . . . . . . . . . . . 28.2 The Cancer Genome . . . . . . . . . . . . . . . . . . . . . . . . . . . . . . . . . . . . . . 28.3 Cancer Genome Projects . . . . . . . . . . . . . . . . . . . . . . . . . . . . . . . . . . Additional Reading . . . . . . . . . . . . . . . . . . . . . . . . . . . . . . . . . . . . . . . . . . . . .
459 459 461 462 468
29 Cancer Epigenomics . . . . . . . . . . . . . . . . . . . . . . . . . . . . . . . . . . . . . . . . . . . 29.1 Epigenetic Mechanisms of Cancer . . . . . . . . . . . . . . . . . . . . . . . . . . 29.2 DNA Methylation and Cancer . . . . . . . . . . . . . . . . . . . . . . . . . . . . . . 29.3 Chromatin Changes and Cancer . . . . . . . . . . . . . . . . . . . . . . . . . . . . Additional Reading . . . . . . . . . . . . . . . . . . . . . . . . . . . . . . . . . . . . . . . . . . . . .
469 469 472 475 478
30 Aging and Cancer . . . . . . . . . . . . . . . . . . . . . . . . . . . . . . . . . . . . . . . . . . . . . 30.1 Central Role of Aging During Chronic Diseases . . . . . . . . . . . . . . 30.2 The Hallmarks of Aging . . . . . . . . . . . . . . . . . . . . . . . . . . . . . . . . . . . 30.3 Telomeres and Replicative Immortality . . . . . . . . . . . . . . . . . . . . . . Additional Reading . . . . . . . . . . . . . . . . . . . . . . . . . . . . . . . . . . . . . . . . . . . . .
479 479 482 485 488
31 Tumor Microenvironment . . . . . . . . . . . . . . . . . . . . . . . . . . . . . . . . . . . . . . 31.1 The Impact of the Wound Healing Program for Cancer . . . . . . . . 31.2 Cell Types of the Tumor Microenvironment . . . . . . . . . . . . . . . . . . 31.3 Inducing Angiogenesis . . . . . . . . . . . . . . . . . . . . . . . . . . . . . . . . . . . . 31.4 Tumor-Promoting Inflammation . . . . . . . . . . . . . . . . . . . . . . . . . . . . 31.5 Deregulating Cellular Energetics . . . . . . . . . . . . . . . . . . . . . . . . . . . Additional Reading . . . . . . . . . . . . . . . . . . . . . . . . . . . . . . . . . . . . . . . . . . . . .
489 489 492 496 498 499 502
32 Metastasis and Cachexia . . . . . . . . . . . . . . . . . . . . . . . . . . . . . . . . . . . . . . . 32.1 The Metastatic Cascade . . . . . . . . . . . . . . . . . . . . . . . . . . . . . . . . . . . 32.2 Epithelial-Mesenchymal Transition . . . . . . . . . . . . . . . . . . . . . . . . . 32.3 Metastatic Colonization . . . . . . . . . . . . . . . . . . . . . . . . . . . . . . . . . . . 32.4 Cachexia . . . . . . . . . . . . . . . . . . . . . . . . . . . . . . . . . . . . . . . . . . . . . . . . Additional Reading . . . . . . . . . . . . . . . . . . . . . . . . . . . . . . . . . . . . . . . . . . . . .
505 505 508 511 513 518
xiv
Contents
33 Cancer Immunology . . . . . . . . . . . . . . . . . . . . . . . . . . . . . . . . . . . . . . . . . . . 33.1 Outline of Cancer Immunity . . . . . . . . . . . . . . . . . . . . . . . . . . . . . . . 33.2 Recognition of Cancer Antigens . . . . . . . . . . . . . . . . . . . . . . . . . . . . 33.3 Monoclonal Antibodies in Cancer Immunotherapy . . . . . . . . . . . . 33.4 Immune Cell Therapies . . . . . . . . . . . . . . . . . . . . . . . . . . . . . . . . . . . Additional Reading . . . . . . . . . . . . . . . . . . . . . . . . . . . . . . . . . . . . . . . . . . . . .
519 519 525 527 531 534
34 Architecture of Cancer Therapies . . . . . . . . . . . . . . . . . . . . . . . . . . . . . . . 34.1 Classical Cancer Treatments . . . . . . . . . . . . . . . . . . . . . . . . . . . . . . . 34.2 Targeted Therapies . . . . . . . . . . . . . . . . . . . . . . . . . . . . . . . . . . . . . . . 34.3 Precision Oncology . . . . . . . . . . . . . . . . . . . . . . . . . . . . . . . . . . . . . . . Additional Reading . . . . . . . . . . . . . . . . . . . . . . . . . . . . . . . . . . . . . . . . . . . . .
535 535 539 543 547
35 Nutrition and Common Diseases . . . . . . . . . . . . . . . . . . . . . . . . . . . . . . . . 35.1 Evolution of Human Nutrition . . . . . . . . . . . . . . . . . . . . . . . . . . . . . . 35.2 Principles of Metabolism . . . . . . . . . . . . . . . . . . . . . . . . . . . . . . . . . . 35.3 Dietary Molecules and Their Sensing . . . . . . . . . . . . . . . . . . . . . . . 35.4 Nutrition and Metabolic Diseases . . . . . . . . . . . . . . . . . . . . . . . . . . . 35.5 Impact of Physical Activity . . . . . . . . . . . . . . . . . . . . . . . . . . . . . . . . Additional Reading . . . . . . . . . . . . . . . . . . . . . . . . . . . . . . . . . . . . . . . . . . . . .
549 549 552 554 559 561 563
36 Interference of the Human Genome with Nutrients . . . . . . . . . . . . . . . 36.1 Human Genetic Adaptions . . . . . . . . . . . . . . . . . . . . . . . . . . . . . . . . . 36.2 Genetic Adaption to Dietary Changes . . . . . . . . . . . . . . . . . . . . . . . 36.3 Regulatory SNPs and Quantitative Traits . . . . . . . . . . . . . . . . . . . . . 36.4 Definition of Nutrigenomics . . . . . . . . . . . . . . . . . . . . . . . . . . . . . . . 36.5 Personal Omics Profiles . . . . . . . . . . . . . . . . . . . . . . . . . . . . . . . . . . . Additional Reading . . . . . . . . . . . . . . . . . . . . . . . . . . . . . . . . . . . . . . . . . . . . .
565 565 567 569 571 575 578
37 Nutritional Epigenetics, Signaling and Aging . . . . . . . . . . . . . . . . . . . . 37.1 Intermediary Metabolism and Epigenetic Signaling . . . . . . . . . . . 37.2 Aging and Conserved Nutrient-Sensing Pathways . . . . . . . . . . . . . 37.3 Neuroendocrine Regulation of Aging . . . . . . . . . . . . . . . . . . . . . . . . 37.4 Principles of Insulin Signaling . . . . . . . . . . . . . . . . . . . . . . . . . . . . . 37.5 Central Role of FOXO Transcription Factors . . . . . . . . . . . . . . . . . 37.6 Calorie Restriction from Yeast to Mammals . . . . . . . . . . . . . . . . . . 37.7 Cellular Energy Status Sensing by SIRTs and AMPK . . . . . . . . . . Additional Reading . . . . . . . . . . . . . . . . . . . . . . . . . . . . . . . . . . . . . . . . . . . . .
579 579 584 587 588 591 594 596 600
38 Chronic Inflammation and Metabolic Stress . . . . . . . . . . . . . . . . . . . . . 38.1 Acute and Chronic Inflammation . . . . . . . . . . . . . . . . . . . . . . . . . . . 38.2 Reverse Cholesterol Transport and Inflammation . . . . . . . . . . . . . . 38.3 Sensing Metabolic Stress via the ER . . . . . . . . . . . . . . . . . . . . . . . . Additional Reading . . . . . . . . . . . . . . . . . . . . . . . . . . . . . . . . . . . . . . . . . . . . .
603 603 608 610 613
Contents
xv
39 Obesity . . . . . . . . . . . . . . . . . . . . . . . . . . . . . . . . . . . . . . . . . . . . . . . . . . . . . . . 39.1 Definition of Obesity . . . . . . . . . . . . . . . . . . . . . . . . . . . . . . . . . . . . . 39.2 Adipogenesis . . . . . . . . . . . . . . . . . . . . . . . . . . . . . . . . . . . . . . . . . . . . 39.3 Inflammation in Adipose Tissue . . . . . . . . . . . . . . . . . . . . . . . . . . . . 39.4 Energy Homeostasis and Hormonal Regulation of Food Uptake . . . . . . . . . . . . . . . . . . . . . . . . . . . . . . . . . . . . . . . . . . . . . . . . . . 39.5 Genetics of Obesity . . . . . . . . . . . . . . . . . . . . . . . . . . . . . . . . . . . . . . . Additional Reading . . . . . . . . . . . . . . . . . . . . . . . . . . . . . . . . . . . . . . . . . . . . .
615 615 617 622
40 Insulin Resistance and Diabetes . . . . . . . . . . . . . . . . . . . . . . . . . . . . . . . . 40.1 Glucose Homeostasis . . . . . . . . . . . . . . . . . . . . . . . . . . . . . . . . . . . . . 40.2 Insulin Resistance in Skeletal Muscle and Liver . . . . . . . . . . . . . . . 40.3 β Cell Failure . . . . . . . . . . . . . . . . . . . . . . . . . . . . . . . . . . . . . . . . . . . . 40.4 Definition of Diabetes . . . . . . . . . . . . . . . . . . . . . . . . . . . . . . . . . . . . . 40.5 Failure of Glucose Homeostasis in T2D and Its Treatment . . . . . . 40.6 Genetics and Epigenetics of T2D . . . . . . . . . . . . . . . . . . . . . . . . . . . Additional Reading . . . . . . . . . . . . . . . . . . . . . . . . . . . . . . . . . . . . . . . . . . . . .
633 634 637 639 642 644 648 651
41 Heart Disease and the Metabolic Syndrome . . . . . . . . . . . . . . . . . . . . . . 41.1 Hypertension . . . . . . . . . . . . . . . . . . . . . . . . . . . . . . . . . . . . . . . . . . . . 41.2 Mechanisms of Atherosclerosis . . . . . . . . . . . . . . . . . . . . . . . . . . . . . 41.3 Lipoproteins and Dyslipidemias . . . . . . . . . . . . . . . . . . . . . . . . . . . . 41.4 Whole Body’s Perspective of the Metabolic Syndrome . . . . . . . . . 41.5 Metabolic Syndrome in Key Metabolic Organs . . . . . . . . . . . . . . . 41.6 Genetics and Epigenetics of the Metabolic Syndrome . . . . . . . . . . Additional Reading . . . . . . . . . . . . . . . . . . . . . . . . . . . . . . . . . . . . . . . . . . . . .
653 653 655 658 662 667 671 673
42 Epigenetics, Inflammation and Disease . . . . . . . . . . . . . . . . . . . . . . . . . . 42.1 Genetics, Epigenetics and Environment . . . . . . . . . . . . . . . . . . . . . . 42.2 Central Relation of Epigenetics and Immunity . . . . . . . . . . . . . . . . Additional Reading . . . . . . . . . . . . . . . . . . . . . . . . . . . . . . . . . . . . . . . . . . . . .
675 675 679 681
625 629 631
Glossary . . . . . . . . . . . . . . . . . . . . . . . . . . . . . . . . . . . . . . . . . . . . . . . . . . . . . . . . . . 683
Abbreviations
1,25(OH)2 D3 25(OH)D3 3C 3D 4C 5C 5caC 5fC 5hmC 5hmU 5mC A ABC ABL ABL1 AC ACAT1 ACC ACE2 ACL ACTL6A ACTR ADAMTS ADCC ADCP ADH ADP ADRB3 AGO2 AGRP AID AIDS
1,25-dihydroxyvitamin D3 25-hydroxyvitamin D3 Chromosome conformation capture Three dimensional Circularized chromosome conformation capture Chromosome conformation capture carbon copy 5-carboxylcytosine 5-formylcytosine 5-hydroxymethylcytosine 5-hydroxyuracil 5-methylcytosine Adenine ATP-binding cassette Abetalipoproteinemia ABL proto-oncogene 1, non-receptor tyrosine kinase Adenylate cyclase Acetyl-CoA acetyltransferase 1 Acetyl-CoA carboxylase Angiotensin-converting enzyme 2 ATP citrate lyase Actin like 6A Actin-related protein ADAM metallopeptidase with thrombospondin motif Antibody-dependent cellular cytotoxicity Antibody-dependent cellular phagocytosis Alcohol dehydrogenase Adenosine diphosphate Adrenoceptor β3 Argonaute RISC catalytic component 2 Agouti-related peptide Activation-induced deaminase Acquired immune deficiency syndrome xvii
xviii
AIRE AKT ALK ALL ALOX5 ALOX15 AML AMPK AMY ANGPTL2 AP1 APAF1 APC APEH APO APOBEC APPL APR APS1 AR ARC ARID ARL4C ARNTL ASC ASH1L ASIP ASNS ATAC-seq ATF ATM ATP ATR ATRX BAAT BAK BAT BAX BCL2 BCL2L1 BCR BDNF BER BET
Abbreviations
Autoimmune regulator AKT murine thymoma viral oncogene homolog Anaplastic lymphoma kinase Acute lymphoid leukemia Arachidonate 5-lipoxygenase Arachidonate 15-lipoxygenase Acute myeloid leukemia Adenosine monophosphate-activated protein kinase Amylase Angiopoietin-like protein 2 Activator protein 1 (JUN-FOS heterodimer) Apoptotic peptidase activating factor 1 APC regulator of WNT signaling pathway N-acylaminoacyl-peptide hydrolase Apolipoprotein Apolipoprotein B mRNA editing catalytic subunit Adaptor protein, phosphotyrosine interacting with PH domain and leucine zipper 1 Acute protein response Autoimmune polyglandular syndrome type 1 Androgen receptor Arcuate nucleus AT-rich interaction domain ADP-ribosylation factor-like Aryl hydrocarbon receptor nuclear translocator-like Apoptosis-associated speck-like protein containing a CARD ASH1 like histone-lysine methyltransferase Agouti signaling protein Asparagine synthetase (glutamine-hydrolyzing) Assay for transposase-accessible chromatin using sequencing Activating transcription factor ATM serine/threonine kinase Adenosine triphosphate ATR serine/threonine kinase ATRX chromatin remodeler Bile acid-CoA-amino acid N-acetyltransferase BCL2 antagonist/killer 1 Brown adipose tissue BCL2 associated X, apoptosis regulator BCL2 apoptosis regulator BCL2 like B cell receptor Brain-derived neurotrophic factor Base excision repair Bromodomain and extraterminal
Abbreviations
BHLH BID BLK BLNK BMI BMI1 BMP BPTF BRAF BRCA1 BRD BRE BRIP1 BTK C C1QBP CAD CAGE CAMKK CAMP CAR CASP CBFB CBIF CBL CBX CCK CCL CCN CCR CD CD40LG CDC CDC42 CDH CDK CDKAL1 CDKN CDP CDR CDS CDT1 CDX2 CEBP CEL
xix
Basic helix-loop-helix BH3 interacting domain death agonist BLK proto-oncogene, SRC family tyrosine kinase B cell linker Body mass index BMI1 proto-oncogene, Polycomb ring finger Bone morphogenetic protein Bromodomain PHD finger transcription factor B-Raf proto-oncogene, serine/threonine kinase BRCA1 DNA repair associated Bromodomain containing TFIIB binding element BRCA1 interacting protein C-terminal helicase 1 Bruton tyrosine kinase Cytosine Complement C1q binding protein Carbamoyl-phosphate synthetase Cap analysis of gene expression Ca2+ /calmodulin-dependent protein kinase kinase Cathelicidin Chimeric antigen receptor Caspase Corebinding factor subunit β Cobalamin binding intrinsic factor CBL proto-oncogene, E3 ubiquitin protein ligase Chromobox Cholecystokinin Chemokine C-C motif ligand Cyclin C-C chemokine receptor Cluster of differentiation CD40 ligand Complement-dependent cytotoxicity Cell-division cycle 42 Cadherin Cyclin-dependent kinase CDK5 regulatory subunit associated protein 1-like 1 Cyclin-dependent kinase inhibitor Common DC progenitor Complementarity-determining region Cytoplasmatic DNA sensor Chromatin licensing and DNA replication factor 1 Caudal type homeobox 2 CCAAT enhancer binding protein Carboxyl ester lipase
xx
CETP CETPD CFB CHD CHEK CHGA ChIA-PET ChIP ChIP-seq CIMP CIN CIS CLEC12A CLL CLOCK CLP CML CMP CMV CNOT7 CNS CNV CORO2A COVID-19 CpG CPT1A CR CREB1 CREB3L3 CREBBP CRP CRTC2 CRY1 CSF CSNK2A1 CT CTCF CTLA4 CTNNB1 CTNS CVD CXCL CXCR CXXC1
Abbreviations
Cholesterol ester transfer protein CETP deficiency Complement factor B Chromodomain helicase DNA binding Checkpoint kinase 2 Chromogranin A Chromatin interaction analysis by paired-end tag sequencing Chromatin immunoprecipitation Chromatin immunoprecipitation sequencing CpG island methylator phenotype Cervical intraepithelial neoplasia Carcinoma in situ C-type lectin domain family 12 member A Chronic lymphoid leukemia Clock circadian regulator Common lymphoid progenitor Chronic myeloid leukemia Common myeloid progenitor Cytomegalovirus CCR4-NOT transcription complex subunit 7 Central nervous system Copy number variation Coronin 2A Coronavirus disease 2019 CpG dinucleotide Carnitine palmitoyltransferase 1A Complement receptor cAMP response element-binding protein cAMP responsive element-binding protein 3-like 3 CREB-binding protein, also called KAT3A C-reactive protein CREB-regulated transcription coactivator 2 Cryptochrome circadian clock 1 Colony stimulating factor Casein kinase 2 α 1 Computed tomography CCCTC binding factor Cytotoxic T lymphocyte associated protein 4 Catenin β1 Cystinosin, lysosomal cystine transporter Cardiovascular disease Chemokine C-X-C motif ligand C-X-C motif chemokine receptor CXXC finger protein 1
Abbreviations
CYP D DACH1 DAF DAG DALY DAMP DANT1 DAXX DBD DBL DC DCIS DCT DDR DEF DGCR8 DKK1 DLBCL DNase-seq DNMT DOHaD DOT1L DPE DR DVL E% EBV EDAR EED EGF EGFL EGFR EGIR EHMT EIF EIF2AK3 ELK1 EMA EMT ENCODE ENPP1 EP300 eQTL ER
xxi
Cytochrome P450 Diversity Dachshund family transcription factor 1 Abnormal dauer formation Diacylglycerol Disability-adjusted life-year Damage-associated molecular pattern DXZ4 associated non-coding transcript 1, proximal Death domain associated protein DNA-binding domain Dysbetalipoproteinemia Dendritic cell Ductal carcinoma in situ Dopachrome tautomerase DNA damage response Defensin DiGeorge syndrome critical region gene 8 Dickkopf WNT signaling pathway inhibitor 1 Diffuse large B cell lymphoma DNase I hypersensitivity followed by sequencing DNA methyltransferase Developmental origins of health and disease DOT1 like histone-lysine methyltransferase Downstream promoter element Direct repeat Disheveled segment polarity protein Percent of total energy Epstein-Barr virus Ectodysplasin A receptor Embryonic ectoderm development Epidermal growth factor EGF-like Epidermal growth factor receptor European Group for the study of Insulin Resistance Euchromatic histone-lysine N-methyltransferase Eukaryotic translation initiation factor Eukaryotic translation initiation factor 2-α kinase 3 ETS transcription factor ELK1 European Medicines Agency Epithelial-mesenchymal transition Encyclopedia of DNA elements Ectonucleotide pyrophosphatase/phosphodiesterase 1 E1A-binding protein p300, also called KAT3B Expression quantitative trait locus Endoplasmatic reticulum
xxii
ERBB2 ERCC ERN1 eRNA ES ESR EV EZH FABP6 FACS FAD FAIRE FANTOM FAP FAS FASLG FASN FBXO32 Fc FCH FcR FDA FFA FGF FGFR4 FH FHC FHTG FISH FKBP FLT FMR1 FOS FOX FPR1 FTO FXN FXR FYN G G6PC GAB1 GART GAS5 GATA
Abbreviations
Erb-B2 receptor tyrosine kinase 2, also called HER2 ERCC excision repair, TFIIH core complex helicase subunit Endoplasmic reticulum to nucleus signaling 1 Enhancer RNA Embryonic stem Estrogen receptor Extracellular vesicle Enhancer of zeste homolog Ileal fatty acid-binding protein Fluorescence-activated cell sorting Flavin adenine dinucleotide Formaldehyde-assisted isolation of regulatory elements Functional annotation of the mammalian genome Familial adenomatous polyposis FAS cell surface death receptor FAS ligand Fatty acid synthase F-box protein 32 Fragment crystallizable Familial combined hyperlipidemia Fc receptor US Food and Drug Administration Free fatty acid Fibroblast growth factor FGF receptor 4 Familial hypercholesterolemia Familial hyperchylomicronemia Familial hypertriglyceridemia Fluorescence in situ hybridization FK506-binding protein FMS-related receptor tyrosine kinase Fragile X mental retardation 1 FOS proto-oncogene, AP1 transcription factor subunit Forkhead box Formyl peptide receptor 1 Fat mass and obesity associated Frataxin Farnesoid X receptor, also called NR1H5 FYN proto-oncogene, SRC family tyrosine kinase Guanine Glucose-6-phosphatase GRB2-associated binder 1 Phosphoribosylglycinamide formyltransferase Growth arrest specific 5 GATA-binding protein
Abbreviations
GC GCK GDF GDP GH1 GIS1 GLI GLP1 GLS GLUT GMP GPAT GPR GR GRB GSH GSK3 GSV GTEx GTF GTP GVHD GWAS GYS HAT HBL HBV HDAC HDL HDM HGF HGPS HHEX Hi-C HIF1 HIF1A HIV HK2 HLA HLD HLP HMGA1 HMGCR HNF HNRNPU
xxiii
Gas chromatography Glucokinase Growth differentiation factor Guanosine diphosphate Growth hormone 1 GLG1-2 suppressor GLI family zinc finger Glucagon-like peptide 1 Glutaminase Glucose transporter Granulocyte-monocyte progenitor Glycerol phosphate acyl transferase G protein-coupled receptor Glucocorticoid receptor Growth factor receptor-bound protein Glutathione Glycogen synthase kinase 3 GLUT4-containing storage vesicles Genotype tissue expression General transcription factor Guanosine triphosphate Graft-versus-host disease Genome-wide association study Glycogen synthase Histone acetyltransferase Hypobetalipoproteinemia Hepatitis B virus Histone deacetylase High-density lipoprotein Histone demethylase Hepatocyte growth factor Hutchinson-Gilford progeria syndrome Hematopoietically expressed homeobox High-throughput chromosome capture Hypoxia-inducible factor 1 Hypoxia-inducible factor 1 subunit α Human immunodeficiency virus Hexokinase 2 Human leukocyte antigen Hepatic lipase deficiency Hyperlipoproteinemia High mobility group AT-hook 1 3-hydroxy-3-methylglutaryl-CoA reductase Hepatocyte nuclear factor Heterogeneous nuclear ribonucleoprotein U
xxiv
HOTAIR HOTTIP HOX HP1 HPT HPV HR HSC HSF1 HSP HSV HTG HTT IAP IBD ICA ICGC ICR ID2 IDF IDH IDO1 IDOL Ig IGF IGF2BP2 IGH IHEC IKBK IKK IKZF1 IL IL1RN IL2RA IL3RA IL6R ILC IMCL indel INF INO80 INPP5D Inr INS INSR
Abbreviations
HOX transcript antisense RNA HOXA transcript at the distal tip Homeobox Heterochromatin protein 1, official name CBX5 Hypothalamic-pituitary-thyroid Human papilloma virus Homologous recombination Hematopoietic stem cell Heat shock transcription factor 1 Heat shock protein Herpes simplex virus Hypertriglycerolemia Huntingtin Intracisternal A particle Inflammatory bowel disease MIntercellular adhesion molecule International Cancer Genome Consortium Imprint control region Inhibitor of DNA-binding 2 International Diabetes Federation Isocitrate dehydrogenase Indoleamine 2,3-dioxygenase 1 Inducible degrader of LDLR Immunoglobin Insulin-like growth factor Insulin-like growth factor 2 mRNA-binding protein 2 Immunoglobulin heavy locus International human epigenome consortium Inhibitor of kappa light polypeptide gene enhancer in B cells, kinase IκB kinase IKAROS family zinc finger 1 Interleukin IL1 receptor antagonist Interleukin 2 receptor subunit α Interleukin 3 receptor subunit α IL6 receptor Innate lymphoid cell Intramyocellular lipid Insertion-deletion Interferon INO80 complex subunit Inositol polyphosphate-5-phosphatase D Initiator Insulin Insulin receptor
Abbreviations
IP3 iPOP iPS IRE1 IRF IRS IRX ISWI ITAM ITGB2 ITIM IκB J JAK JUN KAT KATP Kb KCNJ11 KCNQ1 KDM KDR KIF11 KIR KIT KITLG KLF KLRK1 KMT LAD LBD LBR LCAT LCATD LCK LCR LCT LDHA LDL LDLR LDLRAP1 LEP LEPR LIN28A LINE
xxv
Inositol trisphosphate Integrative personal omics profiling Induced pluripotent stem Inositol-requiring enzyme Interferon regulatory factor Insulin receptor substrate Iroquois homeobox Imitation SWI Immunoreceptor tyrosine-based activation motif Integrin subunit β2 Immunoreceptor tyrosine-based inhibition motif Inhibitor of NFκB Joining Janus kinase JUN proto-oncogene, AP1 transcription factor subunit Lysine acetyltransferase ATP-sensitive K+ Kilo base pairs (1000 base pairs) Potassium inwardly rectifying channel, subfamily J, member 11 Potassium voltage-gated channel subfamily Q, member 1 Lysine demethylase Kinase insert domain receptor, also called VEGFR2 Kinesin family member 11 Killer cell immunoglobulin like receptor KIT proto-oncogene, receptor tyrosine kinase KIT ligand Krüppel-like factor Killer cell lectin like receptor K1 Lysine methyltransferase Lamin-associated domain Ligand-binding domain Lamin B receptor Lecithin cholesterol acyltransferase LCAT deficiency LCK proto-oncogene, SRC family tyrosine kinase Locus control region Lactase Lactate dehydrogenase A Low-density lipoprotein LDL receptor LDLR accessory protein 1 Leptin Leptin receptor LIN-28 homolog A Long interspersed element
xxvi
LIPC LIPE LIPG LOCK LPCAT3 LPL LPS LRH-1 LRP1 LSD1 LT LTA4H LTC4 LTR LXR LYN MAF MAF MAIT MALAT1 MAN2A1 MAP2K MAPK MAX Mb MBD MBP MC1R MC4R M-CFU mCH MCM6 MDM2 MDP MDSC MECP2 MED MeDIP-seq MEIS1 MEN1 MEP MERS-CoV MET MGMT MHC
Abbreviations
Hepatic lipase Hormone sensitive lipase Endothelial lipase Large organized chromatin K9-modification Lysophospholipid acyltransferase 3 Lipoprotein lipase Lipopolysaccharide Liver receptor homolog 1, also called NR5A2 LDLR-related protein 1 Lysine specific demethylase 1, also called KDM1A Lymphotoxin Leukotriene A4 hydrolase Leukotriene C4 Long terminal repeat Liver X receptor, also called NR1H3 and NR1H2 LYN proto-oncogene, SRC family tyrosine kinase MAF BZIP transcription factor Minor allele frequency Mucosa-associated invariant T Metastasis associated lung adenocarcinoma transcript 1 Mannosidase α, class 2A, member 1 Mitogen-activated protein kinase kinase Mitogen-activated protein kinase MYC associated factor X Mega base pairs (1,000,000 base pairs) Methyl-DNA-binding domain Major basic protein Melanocortin 1 receptor Melanocortin 4 receptor Myeloid stem cells Non-CpG methylation Minichromosome maintenance type 6 MDM2 proto-oncogene, E3 ubiquitin protein ligase Macrophage and DC progenitor Myeloid-derived suppressor cell Methyl-CpG-binding protein 2 Mediator complex Methylated DNA immunoprecipitation sequencing Meis homeobox 1 Menin 1 Megakaryocyte-erythrocyte progenitor Middle East respiratory syndrome coronavirus Mesenchymal-epithelial transition O-6-methylguanine-DNA methyltransferase Major histocompatibility complex
Abbreviations
MHL MIC miRNA MIS-C MLH1 mmHg MMP MMR MNAT1 MNT MODY MPO MPP MR MRI mRNA MS MS MS MSI MSN MSR1 MSS MTA MTHFR MTNR1B MTTP MUFA MYC MYF5 MYO5A MYOD1 NAD NADPH NAFLD NAMPT NANOG NASH NCEH1 NCEP NCOA NCOR ncRNA NELFE
xxvii
Mixed hyperlipidemia MHC class I polypeptide-related sequence Micro-RNA Multisystem inflammatory syndrome in children MutL homolog 1 Millimeters of mercury Matrix metalloproteinase Mismatch repair MNAT1 component of CDK activating kinase MAX network transcriptional repressor Maturity onset diabetes of the young Myeloperoxidase Multipotent progenitor Mineralocorticoid receptor Magnetic resonance imaging Messenger RNA Mass spectrometry Multiple sclerosis Myeloid sarcoma Microsatellite instability Multicopy suppressor of SNF1 mutation Macrophage scavenger receptor 1 Microsatellite stable Metastasis associated 1 Methylenetetrahydrofolate reductase Melatonin receptor 1B Microsomal triglyceride transfer protein Monounsaturated MYC proto-oncogene, BHLH transcription factor Myogenic factor 5 Myosin VA Myoblast determination protein 1 Nicotinamide adenine dinucleotide Nicotinamide adenine dinucleotide phosphate Non-alcoholic fatty liver disease Nicotinamide mononucleotide phosphoribosyltransferase, also called visfatin Nanog homeobox Non-alcoholic steatohepatitis Neutral cholesterol ester hydrolase 1 National Cholesterol Education Program Nuclear receptor coactivator Nuclear receptor corepressor Non-coding RNA Negative elongation factor complex member E
xxviii
NEMO NER NET NEUROD1 NEUROG3 NFAT NFκB NGS NHEJ NICD NIK NK NKT NLR NLRP NLS NO NOR1 NOS NOTCH NPC1L1 NPM1 NPY NR NSCLC NSD nt NTS OCA2 OCT4 OGTT ORL1 PABPC1 PAF PALB2 PALS1 PAMP PAX PBMC PC PCAWG PCK PCR PCSK PDCD1
Abbreviations
NFκB essential modulator, also called IKBKG Nucleotide excision repair Neutrophil extracellular trap Neuronal differentiation 1 Neurogenin 3 Nuclear factor activated T cells Nuclear factor kappa B Next-generation sequencing Non-homologous end-joining NOTCH intracellular domain NFκB inducing kinase Natural killer Natural killer T NOD-like receptor NLR protein Nuclear localization sequence Nitric oxide Neuron-derived orphan receptor 1, also called NR4A3 Nitric oxide synthase NOTCH receptor Niemann-Pick C1-like protein 1 Nucleophosmin 1 Neuropeptide Y Nuclear receptor Non-small-cell lung cancer Nuclear receptor-binding SET domain protein Nucleotide Nucleus tractor solitaries OCA2 melanosomal transmembrane protein Octamer-binding transcription factor 4, also called POU5F1 Oral glucose tolerance test Oxidized low-density lipoprotein receptor 1 Poly(A)-binding protein cytoplasmic 1 Platelet-activating factor Partner and localizer of BRCA2 Protein associated with LIN7 1, MAGUK p55 family member Pathogen-associated molecular pattern Paired box Peripheral blood mononuclear cell Pyruvate carboxylase PanCancer Analysis of Whole Genomes Phosphoenolpyruvate carboxykinase Polymerase chain reaction POMC proprotein convertase subtilisin/kexin Programmed cell death 1, also called PD1
Abbreviations
xxix
PDCD1LG2 PDGF PDGFRA PDH PDPK PDX1 PER1 PET PFKFB2 PG PGC PGR PI3K PICS PIK3CA PIN PIP3 PLA2 PLAU PLCγ PLTP PMAIP1 PML PNPLA Pol II POMC POU1F1 PPAR PPARGC1 PPAT PPIA PPP2 PRC pre-miRNA pri-miRNA PRK PRKDC PRMT5 PROP1 PRR PTCH P-TEFb PTEN PTGS2 PTHrP
Programmed cell death 1 ligand 2, also called PDL2 Platelet-derived growth factor Platelet-derived growth factor receptor α Pyruvate dehydrogenase 3-phosphoinositide dependent protein kinase 1 Pancreatic and duodenal homeobox 1 Period circadian clock 1 Positron emission tomography 6-phosphofructo-2-kinase/fructose-2,6-biphosphatase 2 Prostaglandin Primordial germ cell Progesterone receptor Phosphatidylinositol-4,5-bisphosphate 3-kinase PTEN loss-induced cellular senescence Phosphatidylinositol-4,5-bisphosphate 3-kinase catalytic subunit α Prostatic intraepithelial neoplasia Phosphatidylinositol-3,4,5-triphosphate Phospholipase A2 Plasminogen activator, urokinase Phospholipase Cγ Phospholipid transfer protein Phorbol-12-myristate-13-acetate-induced protein 1 PML nuclear body scaffold Patatin-like phospholipase domain containing RNA polymerase II Proopiomelanocortin POU class 1 homeobox 1 Peroxisome proliferator-activated receptor PPARγ, coactivator 1 Phosphoribosyl pyrophosphate amidotransferase Peptidylprolyl isomerase A Protein phosphatase 2 Polycomb repressive complex Precursor miRNA Primary miRNA Protein kinase Protein kinase, DNA-activated, catalytic subunit Protein arginine methyltransferase 5 PROP paired-like homeobox 1 Pattern-recognition receptor Patched receptor Positive transcription elongation factor Phosphatase and tensin homolog Prostaglandin-endoperoxide synthase 2, also known as COX2 Parathyroid hormone-related protein
xxx
PTPN PUFA PXR RA RAC RAF1 RAG RAPTOR RAR RAS RB1 RBBP4 RBP4 RBPJ RCOR RE REL REST REV-ERB RHOQ RIG1 RISC RLR RNAi RNA-seq ROR ROS RPS6K RRM2 rRNA RSV RTK RUNX1 RUVBL RXR S6K SAH SAM SAP SARS-CoV 2 SCAP SCARB1 SCD SCFA
Abbreviations
Protein tyrosine phosphatase, non-receptor type Polyunsaturated fatty acid Pregnane X receptor, also called NR1I2 Retinoic acid RAC family small GTPase 1 RAF1 proto-oncogene, serine/threonine kinase Recombination activating gene Regulatory associated protein of TOR Retinoic acid receptor Rat sarcoma RB transcriptional corepressor 1 RB-binding protein 4, chromatin remodeling factor Retinol-binding protein 4 Recombination signal-binding protein for immunoglobulin kappa J region L REST corepressor Response element REL proto-oncogene, NFκB subunit RE1-silencing transcription factor Reverse-Erb, official gene symbol NR1D1 Ras homolog family, member Q Retinoic acid-inducible gene 1 RNA-induced silencing complex RIG-like receptor RNA interference RNA sequencing RAR-related orphan receptor Reactive oxygen species Ribosomal protein S6 kinase Ribonucleotide reductase regulatory subunit M2 Ribosomal RNA Rous sarcoma virus Receptor tyrosine kinase Runt-related transcription factor 1 RuvB like AAA ATPase Retinoid X receptor S6 kinase S-adenosylhomocysteine S-adenosyl-L-methionine Serum amyloid P-component Severe acute respiratory syndrome coronavirus 2 SREBF chaperone Scavenger receptor class B member 1 Stearoyl-CoA desaturase Short-chain fatty acid
Abbreviations
xxxi
scFv SCID SCN SCNN1 SERPINE1 SETD2 SETDB1 SF1 SFA SFRP5 SH2 SHARP SHC SHMT SHP2 SI SIM1 SIN3A SINE siRNA SIRT SITO SLAMF7 SLC SLCO SLE SMAD SMARC
Single-chain variable fragment Severe combined immunodeficiency disease Suprachiasmatic nucleus Sodium channel, non-voltage-gated 1 Serpin peptidase inhibitor, clade E, also called PAI-1 SET domain containing 2 SET domain bifurcated histone-lysine methyltransferase 1 Steroidogenic factor 1 Saturated fatty acids Frizzled-related protein 5 SRC homology 2 SMRT/HDAC1-associated repressor protein SRC homology 2 domain containing Serine hydroxymethyltransferase SH2-domain-containing tyrosine phosphatase 2 Sucrase-isomaltase Single-minded family BHLH transcription factor 1 SIN3 transcription regulator family member A Short interspersed element Small interfering RNA Sirtuin Sitosterolemia SLAM family member 7 Solute carrier family Organic anion transporter Systemic lupus erythematosus SMA- and MAD-related protein SWI/SNF-related matrix-associated actin-dependent regulators of chromatin Snail family transcriptional repressor Soluble NSF attachment protein receptor Small nucleolar RNA Single nucleotide polymorphism Small nuclear RNA Sympathetic nervous system Single nucleotide variant Suppressor of cytokine signaling Sorbin and SH3 domain containing 1 Sortilin 1 SOS RAS/RAC guanine nucleotide exchange factor 1 SRY-box 2 Specificity protein 1 Spleen focus forming virus proviral integration oncogene, also called PU.1 SRC proto-oncogene, non-receptor tyrosine kinase
SNAI SNARE snoRNA SNP snRNA SNS SNV SOCS SORBS1 SORT1 SOS1 SOX2 SP1 SPI1 SRC
xxxii
SREBF1 SRF STAB1 STAT SULT2A1 SUV39H SV40 SWI/SNF SYK T T1D T2D T3 TAD TAF TAL1 TAM TAN TAP TAPBP TAS1R2 TATA box TBC1D TBL1X TBL1XR1 TBP TBX21 TCA TCF3 TCF7L2 TCGA TCR TD TDG TdT TERC TERT TET TF TFAM TFBS TGFBR TGFβ1 TH THBS1
Abbreviations
Sterol regulatory element-binding transcription factor 1 Serum response factor Stabilin Signal transducer and activator of transcription Sulfotransferase family 2A, member 1 Suppressor of variegation 3-9 homolog Simian virus 40 Switching/sucrose non-fermenting Spleen associated tyrosine kinase Thymine Type 1 diabetes Type 2 diabetes Triiodothyronine Topologically associated domain TBP-associated factor TAL BHLH transcription factor 1, erythroid differentiation factor Tumor-associated macrophage Tumor-associated neutrophil Transporter, ATP-binding cassette subfamily B member TAP-binding protein, also called tapasin Taste receptor, type 1, member 2 TATWADR consensus binding site of TBP TBC1 domain family, member 1 Transducin β-like 1 X-linked TBL1X receptor 1 TATA box-binding protein T-box transcription factor 21 Tricarboxylic acid Transcription factor 3 Transcription factor 7-like 2 The Cancer Genome Atlas T cell receptor Tangier disease Thymine-DNA glycosylase Terminal deoxynucleotidyl transferase Telomerase RNA component Telomerase reverse transcriptase Ten-eleven translocation Transcription factor Transcription factor A, mitochondrial Transcription factor binding site TGFβ receptor Transforming growth factor β1 T helper Thrombospondin 1
Abbreviations
THR THRSP TIL Tis TLF TLR TMPRSS2 TNF TNFR TNFRSF TNFSF TOR(C) TP53 TRAF2 TRBP TREG TRIM tRNA TSC2 TSH TSLP TSS TWIST1 TYR U UBR1 UBTF UCP UGDH UGT2B4 UHRF1 UICC UNC5B UTR UV V VDR VEGF VHL VLDL VNN VZV WAT WHO WHR
xxxiii
Thyroid hormone receptor Thyroid hormone responsive Tumor infiltrating lymphocyte Carcinoma in situ TBP-like factor Toll-like receptor Transmembrane serine protease 2 Tumor necrosis factor TNF receptor TNF receptor superfamily member TNF superfamily member Target of rapamycin (complex) Tumor protein p53 TNF receptor-associated factor 2 Transactivation-response RNA-binding protein Regulatory T Tripartite-motif-containing protein Transfer RNA Tuberous sclerosis 2 Thyroid stimulating hormone Thymic stromal lymphopoietin Transcription start site Twist family BHLH transcription factor 1 Tyrosinase Uracil Ubiquitin protein ligase E3 component n-recognin 1 Upstream binding transcription factor Uncoupling protein UDP-glucose 6-dehydrogenase UDP glucuronosyltransferase 2 family, polypeptide B4 Ubiquitin-like plant homeodomain and RING finger domain 1 Union for International Cancer Control Unc-5 homolog B Untranslated region Ultraviolet Variable Vitamin D receptor Vascular endothelial growth factor Von Hippel-Lindau tumor suppressor Very low-density lipoprotein Vanin 1 Varicella-zoster virus White adipose tissue World Health Organization Waist-to-hip ratio
xxxiv
WNT WRN XBP1 XCI Xist X-SCID YWHA YY1 ZAP70 ZBTB33 ZEB α-MSH β-OHB
Abbreviations
Wingless-type MMTV integration site family member Werner syndrome RecQ like helicase X-box-binding protein 1 X chromosome inactivation X-inactive specific transcript X-linked severe combined immunodeficiency disease Tyrosine 3-monooxygenase/tryptophan 5-monooxygenase YY1 transcription factor Zeta chain of T cell receptor-associated protein kinase 70 Zinc finger and BTB domain containing 33 Zinc finger E-box-binding homeobox α-melanocyte-stimulating hormone β-hydroxybutyrate
Chapter 1
The Human Genome and Its Variations
Abstract In this chapter, we will briefly describe the genetic adaption of anatomically modern humans due to migration from Africa to new geographic and climatic environments in Asia and Europe. This led not only to obvious differences in skin color among the populations, but also in different resistance to diseases and diversity in dietary intake. The genetic basis of the variation of human populations and individuals has recently been studied and catalogued by large consortia, such as the 1000 Genomes project. Genome-wide genotyping and whole genome sequencing allows the study and analysis of complex diseases, such as T2D and cardiovascular disease (CVD), on the basis of dozens to hundreds of genetic variants, such as single nucleotide variants (SNVs) and copy number variations (CNVs). Keywords Homo sapiens · Evolution · Human migrations · Human populations · SNVs · CNVs · Haplotype blocks · GWAS · NGS · HapMap project · 1000 Genomes project
1.1 Migration of Homo Sapiens and the Diversity of Human Populations Approximately 200–300,000 years ago anatomically modern humans developed in East Africa. The main characteristic of Homo sapiens is a superior locomotive ability that is essential for encountering predators and food procurement. Some 50–75,000 years ago, reasonable numbers of these modern humans started to migrate to Asia and Europe and replaced there through interbreeding already prevalent archaic (i.e., nowadays extinct) human species, such as the Neanderthals (Fig. 1.1). Due to their new environments our ancestors were exposed to a number of divergent selective pressures, such as thermoregulation in colder climates, tolerance to hypoxia (i.e., oxygen supply deprivation) at high altitude and light skin pigmentation in regions with lower levels of ultraviolet (UV)-B radiation (Sect. 36.1). After spreading to different continents, many human populations became geographically isolated, so that new gene variations could not be spread anymore to all members of our species. Since in the past distant human populations were less likely © The Author(s), under exclusive license to Springer Nature Switzerland AG 2023 C. Carlberg et al., Molecular Medicine, https://doi.org/10.1007/978-3-031-27133-5_1
1
2
1 The Human Genome and Its Variations
12-20,000 50-75,000 42,000
65-70,000 130-200,000
48,000
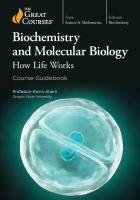
Fig. 1.1 Migrations of Homo sapiens. The spread of anatomically modern humans from East Africa over the rest of the continent was followed by an expansion from the same area to Asia, probably by both a southern and northern route some 50–75,000 years ago. Oceania, Europe and the Americas were settled from Asia in that order. The migration patterns are primarily based on analyses of changes in mitochondrial DNA
to exchange migrants, they cluster genetically in relation to their geographic distance from each other. Thus, human genetic variation diverted geographically, when individuals accumulated further mutations during the past 50,000 years. However, since anatomically modern humans lived in Africa already for some 300,000 years, populations on this continent are more diverse than in the rest of the world. There are obvious phenotypic differences of human populations concerning skin color, body height and facial features, but there are no absolute genetic differences between them. For example, there is no single nucleotide difference that can distinguish Africans from Eurasians. In contrast, population differences are based on thousands of gene loci. This implies that a property (often referred to as a “trait”), such as skin color (Sect. 36.1), can change rather rapidly, when the allele (gene variant) frequencies shift at the respective loci contributing to the trait (Box 1.1). Some 500 years ago, when navigation over the oceans became possible, voluntary and involuntary (slaves) migration started, which caused significant population admixtures in particular in the Americas but also in other continents. Before that time there had been at least two major events of admixture in Europe: some 9,000 years ago early farmers from Anatolia interfered with indigenous European hunters and gatherers and then some 5,000 years ago Yamnaya pastoralists from the Eurasian steppe migrated to Europe. Thus, the phenotype of present-day Europeans as well as European decent individuals is largely the product of this Bronze Age collision of these three ancestral tribes.
1.1 Migration of Homo Sapiens and the Diversity of Human Populations
3
Box 1.1: Natural Selection in Evolution Positive natural selection, i.e., the force that drives the increase in prevalence of advantageous traits, has played a central role in human evolution. Individuals with advantages (referred to as “adaptive traits”) tend to be more successful in reproduction, i.e., they contribute with more offspring to the following generation than others. Due to inheritance from one generation to the other, the selection process increases the prevalence of the respective adaptive trait. Under persistent selection pressure such adaptive traits, step by step, may become universal to the population. Factors fostering selection (i.e., evolutionary pressures) include limits on resources, such as food, or threats, such as pathogens. However, adaptive traits not always become prevalent within a population. Gene frequency alteration in a population can also happen via a genetic drift of genes that are not under selection (Sect. 12.1). In this context, even a deleterious allele may become universal to the members of a population, e.g., under the influence of a weak selection or in small populations. Hundreds of complex phenotypic traits determine how an individual looks and behaves as well as his/her risks to develop non-communicable diseases. Furthermore, each complex trait is based on dozens to hundreds of gene variants and environmental influences, i.e., for understanding the molecular basis of a trait its genetic architecture needs to be uncovered, which is based on: • • • •
the number of variants that influence a heritable phenotype their relative magnitude concerning different traits the population frequency of the respective variants their interactions with each other and the environment.
Whole genome sequencing has indicated that every individual carries, on average, 4–5 million genetic variants (Sect. 1.3) covering about 12 million base pairs (Mb) of sequence (0.3% of all). Most of these genetic variants are neutral, i.e., they do not contribute to phenotypic differences or disease risk and achieved simply by chance significant frequencies within respective human populations. During evolution of Homo sapiens up to 10% of all protein-coding genes, i.e., some 2000 genes, may have been affected by positive natural selection. In particular, the immune system, the digestive tract and the skin (including hair, sweat glands and sensory organs) had been susceptible to positive selection (Sect. 36.1). This is due to the fact that these organ systems are more likely in contact with the environment than other parts of our body. For example, variants of the innate and adaptive immune system (Chaps. 14–23), such as genes encoding for membrane immune receptors, had been under special positive selection by pathogenic microbes. An interesting example is the CCR5 (C–C chemokine receptor 5) receptor on T cells, which is essential for the entry of the human immunodeficiency virus (HIV) 1 specifically to
4
1 The Human Genome and Its Variations
this cell type. Importantly, a 32 base pair deletion in the CCR5 gene, which significantly affects the functionality of the encoded protein, protects its carriers from HIV-1 infection. This mutation is currently under positive selection in populations, such as in South Africa, where HIV-1 infections occur on larger scale. Other examples of positive selections are alleles that were introduced into modern humans already longer times ago through interbreeding with archaic human species. A variant of the SLC16A11 (solute carrier family 16 member 11) gene, which encodes for a lipid transporter in the endoplasmatic reticulum (ER), reached high frequencies, e.g., in native Americans. Initially, this allele allowed better survival at conditions of low food availability but nowadays, at conditions of high fat Western diet (Box 1.2), it is associated with increased T2D risk (Sect. 40.6).
Box 1.2: Western Diet A dietary pattern that characterized by high intakes of pre-packaged foods, refined grains, red meat, processed meat, high-sugar drinks, sweets, fried foods, butter and other high-fat dairy products is referred to as “Western diet”. It was distributed by US American fast-food and supermarket chains to Europe and has arrived in nearly all countries and human populations. It also involves the higher consumption of eggs, potatoes, corn (and high-fructose corn syrup) and low intakes of fruits, vegetables, whole grains, pasture-raised animal products, fish, nuts and seeds. In contrast to Mediterranean and Nordic diet (Box 35.1), Western diet significantly increases the risk of obesity, T2D and CVD (Sect. 35.1).
1.2 Genetic Variants of the Human Genome The reference haploid sequence of the human genome (Box 1.3) was released in 2001 by the first “Big Biology” project (Sect. 10.1), the Human Genome project. SNVs are variants of the sequence of this reference genome where exactly one nucleotide (A, T, G or C) is altered (Fig. 1.2). In contrast, structural variants of the genome mostly affect more than one nucleotide. These can be insertion-deletion (indel) variants, where in most cases only a few bases are added or removed, respectively, but there are also indels of up to 80 kilo base pair (kb) in length. Indels that are not multiples of 3 base pairs in length and are located within protein coding regions result in frameshift mutations, i.e., from the position of the mutation onwards the whole amino acid sequence of the encoded protein is changed. Furthermore, CNVs consist of deletions or insertions of DNA stretches in one genome compared to another. These variants can be heterozygous or homozygous. A predominant class of insertions is that of
1.2 Genetic Variants of the Human Genome
5
Deletion (homozygous) SNP (heterozygous) Reference genome GACTGAGGCA Target genome GACTGGGGCA GACTGAGGCA
Indel (homozygous) AGGCTATG AGG--ATG AGG--ATG
De novo insertion (heterozygous) Reference genome GCTGCATG---------GATGC Target genome GCTGCATGATC---GATGATGC GCTGCATG---------GATGC
Phased SNPs Reference genome TAGCTGTAGC Target genome TAGCTGTAGC TAGCTCTAGC
Reference genome GCAGCTGACAA...GTTGCATG Target genome GCAGCTGA---------GCATG GCAGCTGA---------GCATG
CTGATAGCT CTGATTGCT CTGATAGCT
Inversion (heterozygous) Reference genome ACTTGACTGCAAATCGTCAGTC Target genome ACTTGACTACGATTTGCCAGTC ACTTGACTGCAAATCGTCAGTC
Fig. 1.2 Types of variations present in human genome sequences. The haploid reference genome is indicated at the top of each variant example, while the individual’s diploid genome is shown below. The genetic variants can be either heterozygous or homozygous. The process of statistical estimation of haplotypes is referred to as “phasing”, i.e., in phased SNVs their order within a haplotype is determined
ancient transposons. These DNA stretches persist in the genome as short interspersed elements (SINEs, e.g., Alu elements) and long interspersed nuclear elements (LINEs).
Box 1.3: The Human Genome The human genome is the complete sequence of the anatomically modern human and was obtained by the Human Genome project (www.genome.gov/ 10001772) via whole genome sequencing. This reference sequence represents the assembly of the genomes of a few young healthy male donors. With the exception of germ cells, i.e., female oocytes and male sperm, each human cell contains a diploid genome formed by 2 × 3.05 billion base pairs (Gb) that is distributed on 2 × 22 autosomal chromosomes and two X chromosomes for females and a XY chromosome set for males. In addition, every mitochondrion contains 16.6 kb mitochondrial DNA. The haploid human genome contains some 20,000 protein-coding genes and about the same number of non-coding RNA (ncRNA) genes (Chap. 9). The protein-coding sequence covers less than 2% of our genome, i.e., the 98% of the genome is non-coding and primarily has regulatory function.
6
1 The Human Genome and Its Variations
More than 50% of the sequence of our genome is formed by repetitive DNA (often also referred to as “junk DNA”), which is sorted into the following categories (by order of frequency): • LINEs (500–8000 base pairs)
20.71%
• SINEs (100–300 base pairs)
12.79%
• Retrotransposons, such as long terminal repeats (LTRs) (200–5000 base pairs)
8.85%
• Minisatellite and microsatellite (2–100 base pairs)
4.93%
• Satellites (200–2000 base pairs)
2.54%
LINEs and SINEs are identical or nearly identical DNA sequences that are separated by large numbers of nucleotides, i.e., the repeats are spread throughout the whole genome. LTRs are characterized by sequences that are found at each end of retrotransposons. DNA transposons are full-length autonomous elements that encode for a transposase, i.e., an enzyme that transposes DNA from one to another position in the genome (also known as “jumping DNA”). The different types of human genetic variants are referred to as common (or polymorphisms), when they have a minor allele frequency (MAF) of at least 1% within the studied population, or as rare, when they have a MAF of less than 1%. SNVs (in case of common variants also referred to single nucleotide polymorphisms (SNPs)) represent the most frequent class of genetic variations among individuals and approximately 7 million SNVs show a MAF of more than 5% (www.ncbi.nlm. nih.gov/SNP). The 1000 Genomes project (Sect. 1.3) and other large whole genome sequencing projects indicated that in addition there is a huge number of rare and novel SNVs. Nevertheless, the majority of variants of any given individual are common in the whole population. Therefore, the average difference in nucleotide sequence of a pair of unrelated humans lies in the order of only 1 in 1000, i.e., SNVs contribute to some 0.1% to the variation of our genomes. This proportion is low compared with other species and confirms the recent origin of Homo sapiens from a small founding population. The impact of SNVs on the coding sequence of our genome is well established. Synonymous mutations do not alter the encoded protein, while non-synonymous mutations cause a change in the amino acid sequence (missense) or introduce a premature stop codon (nonsense). In average, a typical human genome contains some 150 SNVs resulting in protein truncation, 10,000 SNVs changing amino acids and 500,000 SNVs affecting transcription factor binding sites (TFBSs) (Sect. 1.3). Interestingly, each individual is heterozygous for 50–100 genetic variants that can cause inherited disorders in homozygous offspring, including different types of cancer or cancer predisposition syndromes. This provides a large demand and challenge for genetic counseling based on whole genome sequencing. Moreover,
1.3 Measuring Human Genetic Variations
7
gene-environment interactions provided by lifestyle factors, such as the personal choice of food, will create an additional level of complexity. Indels as well as CNVs in exonic sequences can result in either non-frameshift or frameshift mutations. Moreover, CNVs in intronic sequences may lead to alternative splicing. Some 60,000 unique CNVs are known and some of them are quite common in human populations (Sect. 1.3). In every individual structural variants cover between 9 and 25 Mb of sequence, i.e., 0.3–0.8% of the whole genome. However, the vast majority of SNVs and CNVs are located in regulatory and not in coding regions of genes, i.e., the phenotypic consequences of most genetic variants are rather based on an epigenetic or gene regulatory processes than on a change in protein function.
1.3 Measuring Human Genetic Variations Mendelian disorders, such as Cystic Fibrosis or Huntington’s disease, are monogenetic, i.e., in these cases a single SNV can explain the occurrence of the rare disease. However, common diseases like T2D, CVDs or cancer have a multigenic basis and were investigated by genome-wide association studies (GWASs). These studies employ an agnostic approach in the search for unknown disease variants, i.e., hundreds of thousands of SNPs were tested for association with a disease in large cohorts of patients versus healthy controls. With an average SNP density of 1 in 1000 nucleotides these studies require the testing of millions of SNPs per individual and hundreds to thousands of individuals. For this purpose, large-scale studies, such as the Human Genome Diversity project and the HapMap project, had been launched. They used high-throughput SNP genotyping technologies, such as arrays with up to a million SNPs. HapMap started in 2002 with 270 samples from the three major human populations, which originated from Africa (Yoruba individuals from Nigeria), Asia (Han Chinese and Japanese) and Europe. GWASs with 2000–5000 individuals confidently identified common variants with effect sizes, referred to as odds ratios (ORs), of 1.5 or greater, i.e., a 50% increased risk for the tested disease. Larger sample sizes were achieved by pooling several GWASs through meta-analyses. For example, sample sizes of at least 60,000 individuals provide sufficient power to identify the majority of variants with ORs of 1.1, i.e., a 10% increased risk. Disease- and trait-associated genomic loci can be found in the database GWAS Catalog (www.ebi.ac.uk/gwas). Monogenetic forms of diseases or traits have high ORs (Fig. 1.3, left). Moreover, there is a large number of common variants with a small to modest OR that have a dominant role in common complex diseases and traits (Fig. 1.3, right). For example, the trait “body height” is dependent on at least 180 gene loci, i.e., it is a paradigm of a complex/polygenic trait. In Europe, this trait has changed significantly (in average by 10 additional centimeters) within the last few generations under the environmental trigger of improved quality and quantity of nutrition.
8
1 The Human Genome and Its Variations
3.0
1.5
Modest Intermediate
High
50.0
Low
1.1
Few examples of
Rare alleles causing Mendelian disease
common variants common disease Low-frequency variants with
Common variant implicated in common disease by GWAS
Rare variant of very hard to identify by genetic means Very rare
Rare 0.001
Low 0.005
Common 0.05
Allele frequency
Fig. 1.3 Identifying genetic variants by risk allele frequency. The strength of a genetic effect is indicated by ORs. Most emphasis and interest lies in identifying associations with characteristics shown within the diagonal box. Whole genome sequencing of large numbers of individuals identifies far more low frequency SNPs with intermediate ORs (center)
The genetic approach of linkage analysis was used in the past, in order to identify genes responsible for monogenetic disorders. However, these rare diseases represent only a relatively small fraction of all disorders. In contrast, most human diseases have a complex origin, i.e., they involve many gene loci. Moreover, for most diseases and traits a larger number of SNVs are described, which show high linkage disequilibrium to variants on stretches of 10–100 kb genomic DNA. These so-called haplotype blocks are inherited from generation to generation, i.e., they are not interrupted by meiotic recombination events (Fig. 1.4). In contrast, the borders of haplotype blocks represent recombination events that had happened many generations ago in our ancestors. Interestingly, gene conversion during meiosis is some 100-times more frequent than point mutations and therefore a more efficient mechanism of evolution. This is one of the major consequences of sexual reproduction. Since African populations have existed far longer than European and Asian populations, their haplotype blocks are shorter, i.e., the blocks had more time to decay because of the accumulation of recombination events in a higher number of generations. In contrast, all non-African individuals derived from a small population of eastern African origin (Sect. 1.1), i.e., they went through a demographical bottleneck that is clearly visible in the limited diversity of their genomes.
1.3 Measuring Human Genetic Variations
9
Descendant chromosomes
Genetic variant A Recombinantion through many generations
A
A
Ancestral chromosomes
Fig. 1.4 The origin of haplotypes. Two plain ancestral example chromosomes get scrambled through meiotic recombination over many generations, in order to yield different descendant chromosomes. For example, after 30,000 years a typical chromosome will have undergone more than one crossover per 100 kb. In the case of a genetic variant (marked by an A) on one ancestral chromosome the risk of a particular disease increases. Thus, the two individuals (red) in the current generation who inherited that region of the ancestral chromosome will be at increased risk. Within the haplotype block that carries the disease-causing variant there are many SNPs that can be used to identify the location of the variant
Despite some notable successes in revealing numerous novel SNPs and genomic loci associated with complex phenotypes, in average not much more than 10% of the heritability of most complex, polygenic traits and diseases have been explained by common variants. When exclusively SNV analysis is performed, the missing or unsolved heritability does not allow assigning an individual with any reliable estimation about his/her risk for a particular disease. The only wellknown exceptions are age-related macular degeneration and type 1 diabetes (T1D), for which the combinations of common and rare variants can provide a quantifiable risk profile. For comparison, the heritability of only 20% of coronary heart disease cases is explained by in total 80 genetic loci (Sect. 41.3), 20% of T2D by some 100 loci (Sect. 40.6), 20% of inherited breast cancer by some 150 loci (Sect. 28.1), 33% of inherited prostate cancer by some 100 loci and 30% of Alzheimer’s disease by some 20 loci. Some of the missing heritability may be explained by rare variants with high ORs, which are poorly captured by standard GWASs. In addition, environmental exposures, including those experienced as fetus, affect the epigenome and may explain large parts of the missing heritability (Sect. 12.2). Important technological advances in high-throughput sequencing have led to a rapid decrease in the costs of DNA sequencing. As a result, whole genome sequencing became an affordable tool in understanding the genomic basis of health and disease. At present, already huge amounts of data have been obtained from whole genomes of both healthy and diseased individuals. This information has not only helped in
10
1 The Human Genome and Its Variations
disease stratification and in the identification of their molecular mechanisms, but also is transforming the perspective of future health care from disease diagnosis and treatment to personalized health monitoring and preventive medicine (Sect. 36.5). Whole genome sequencing results in the identification of the complete set of genetic variants of a given individual (Fig. 1.5). As a natural extension of the HapMap project, the 1000 Genomes project was initiated in 2008 with the aim to sequence the genomes of at least 1,000 individuals from different populations around the world. HapMap populations were included in the project (Table 1.1) and in total 2504 genomes from 26 populations covering four continents were investigated. High depth-of-coverage sequencing of coding regions (exomes) was combined with moderate depth of-coverage sequencing of the remaining 98% of the genome. In total, the project describes 88 million genome variants, of which 84.7 million are SNVs, 3.6 million short indels and 60,000 CNVs. A typical human genome carries 200,000 variants, most of which are common and only 20% are rare (MAF < 0.5%). Individuals from African ancestry populations show most variant sites confirming the human origin from Africa (Sect. 1.1).
Sequencing of the genomes of various primate species H. sapiens
between tissues
between individuals
P. troglodytes
Epigenomics e.g., Roadmap Epigenomics H. neanderthalensis
G. gorilla
Human Genome project
Immunogenomics Cancer genomics e.g., TCGA Metagenomics
1000 Genomes project
Deciphering cellular mechanisms
Genome state me3
DNA binding
Ac Ac
DNA methylation Me
mRNA-degradation
me3
Me
Ac
Hist
Looping Genome folding
mRNA Transcription ncRNA RNA folding
Genome replication
RNA-binding protein
RNA splicing
RNA life cycle
Protein
RNA export
Poly(A)
Translation
Fig. 1.5 Roadmap of sequencing science. The Human Genome project (Box 1.3) created a reference genome. Nowadays, also the genomes of all other primate species are known including some extinct human species (top left). Whole genome sequencing of several thousand individuals was performed in large consortia, such as the 1000 Genomes project (top center). Moreover, the genetic and epigenetic differences between tissues and cell types of the same individual were collected in cancer genomics and epigenomics projects, such as The Cancer Genome Atlas (TCGA) and Roadmap Epigenomics (top right). The application of different NGS methods allows integrating many different processes within the cell (bottom)
1.3 Measuring Human Genetic Variations
11
Table 1.1 Populations of the 1000 Genomes project. Human populations that were included in the 1000 Genomes project are listed. The numbers of individuals that were investigated deepcoverage sequencing (i.e., some 50 unique reads) of 2504 individuals are indicated. Individuals across 26 populations were sequenced. These populations were classified into 5 major continental groups (red): East Asia (EAS), Europe (EUR), Africa (AFR), America (AMR) and South Asia (SAS). Original HapMap populations are highlighted in bold Full population name
Code
Number of individuals
Han Chinese in Beijing, China
CHB
103
South Han Chinese
CHS
105
Chinese Dai in Xishuangbanna, China
EAS
CDX
93
JPT
104
Kinh in Ho Chi Minh City, Vietnam
KHV
99
Utah residents (CEPH) with Northern and Western European ancestry
CEU
99
TSI
107
GBR
91
Japanese in Tokyo, Japan
Toscani in Italy British in England and Scotland
EUR
Finnish in Finland
FIN
99
Iberian Populations in Spain
IBS
107
YRI
108
Yoruba in Ibadan, Nigeria Luhya in Webuye, Kenya
AFR
LWK
99
GWD
113
Mende in Sierra Leone
MSL
85
African Ancestry in Southwest US
ASW
61
Esan in Nigeria
ESN
99
African Caribbean in Barbados
ACB
96
Gambian in Western Division, Mandinka
Mexican Ancestry in Los Angeles, CA, USA
AMR
Colombian in Medellin, Colombia
MXL
64
CLM
94
Peruvian in Lima, Peru
PEL
85
Puerto Rican in Puerto Rico
PUR
104
Bengal in Bangladesh
BRB
86
Gujarati Indians in Houston, TX, USA
GIH
103
Indian Telugu in the UK Sri Lankan Tamil in the UK Punjabi in Lahore, Pakistan
SAS
ITU
102
STU
102
PJL
96
TOTAL
2504
Data of the 1000 Genomes project are publicly available and are central to human genetics, in order to understand population genetic variation. Moreover, the data serve as a global reference for ancestry and admixture of individuals and populations. For example, they define control allele frequencies for both human genetics studies and medical genetics, where the identification of rare and novel variants is central for clinical diagnoses. The most recent set of 1000 Genome project data include another benchmark, which is whole genome sequences of more than 600 family trios, i.e., father, mother and child. This further increases the accuracy of SNV calling, in particular in noncoding regions of the genome. This drastically increased the number of indel variants.
12
1 The Human Genome and Its Variations
(Clinical) Conclusion: Fundamental to nearly all aspects of molecular medicine is some knowledge about our genome and its variations. This is basis for understanding our origin as well as individual-specific disease risks. However, the genetic contribution to the traits describing our body and its risk for diseases is average less than 20%.
Additional Reading Claussnitzer, M., Cho, J. H., Collins, R., Cox, N. J., Dermitzakis, E. T., Hurles, M. E., Kathiresan, S., Kenny, E. E., Lindgren, C. M., MacArthur, D. G., et al. (2020). A brief history of human disease genetics. Nature, 577, 179–189. Genomes Project, C., Auton, A., Brooks, L.D., Durbin, R. M., Garrison, E. P., Kang, H. M., Korbel, J. O., Marchini, J. L., McCarthy, S., McVean, G. A., et al. (2015). A global reference for human genetic variation. Nature, 526, 68–74. Lovell, J. T., & Grimwood, J. (2022). The first complete human genome. Nature, 606, 468–469. Reich, D. (2018). Who we are and how we got here: Ancient DNA and the new science of the human past. Oxford University Press (ISBN 978-0-19-882125-0). Tam, V., Patel, N., Turcotte, M., Bosse, Y., Pare, G., & Meyre, D. (2019). Benefits and limitations of genome-wide association studies. Nature Reviews Genetics, 20, 467–484. Timpson, N. J., Greenwood, C. M. T., Soranzo, N., Lawson, D. J., & Richards, J. B. (2018). Genetic architecture: The shape of the genetic contribution to human traits and disease. Nature Reviews Genetics, 19, 110–124.
Chapter 2
Gene Expression and Chromatin
Abstract In this chapter, principles of gene expression are discussed. An essential condition that a gene can be expressed, i.e., transcribed into RNA, is that its regulatory regions, such as transcription start sites (TSSs) and enhancers, are located within euchromatin. Chromatin is the physical representation of epigenetics. In a tissue- and cell type-specific fashion the majority of the genome is in heterochromatin and only approximately half of all genes are expressed, i.e., transcribed. The wrapping of genomic DNA around nucleosomes and the posttranslational modification of histones determine the density of chromatin packing. Tissue- and signal-specific gene expression is the central mechanism to control the general properties of a cell and its response to environmental perturbations. Large protein complexes that are formed by transcription factors, polymerases and other nuclear non-histone proteins organize the 3-dimensional (3D) architecture of the chromatin into functional units being used for most efficiently coordinated gene expression. Keywords Central dogma of molecular biology · Euchromatin · Heterochromatin · Epigenetics · Histone proteins · Nucleosome · Chromatin architecture · Promoter · Enhancer · Gene expression · TADs · Chromatin architecture
2.1 Central Dogma of Molecular Biology The “central dogma of molecular biology” indicates a clear direction in the flow of information from DNA to RNA to protein (Fig. 2.1). This means that besides a few exceptions, such as reverse transcription of the RNA genome of retroviruses, genomic DNA stores the building plan of all organisms. Accordingly, genes are defined as those regions of genomic DNA that can be transcribed into RNA. The initial step of gene expression is the transcription of the genomic DNA of the gene body (i.e., the DNA sequence between the TSS and the transcription termination site) into messenger RNA (mRNA), which after splicing and transport from the nucleus to the cytoplasma is translated into protein (Fig. 2.1). Proteins are the “workers” within a cell and basically mediate all functions therein, such as © The Author(s), under exclusive license to Springer Nature Switzerland AG 2023 C. Carlberg et al., Molecular Medicine, https://doi.org/10.1007/978-3-031-27133-5_2
13
14
2 Gene Expression and Chromatin
Cellular membrane
Cytoplasma
mRNA translation (iv)
Growing polypeptide chain
Ribosome Cap
Poly(A) mRNA Small ribosomal subunit
nuclear pore
Ready protein
mRNA transport (iii)
Protein post-translational
1
Cap
mRNA
mRNA processing (ii) (capping, splicing, polyadenylation)
AUG
UAA
[START]
[STOP]
2
5’ UTR
3
4
CDS AUG
activity control (v)
5
Poly(A)
1
2
1
2
Transcription (i)
3
[STOP]
4
ATG
Nucleus
TSS
3
5
TAA
[START]
Genomic DNA
P
UAA
[START]
Pre-mRNA
P
3’ UTR
[STOP]
4
5
Poly(A) site
Nuclear envelope
Fig. 2.1 Flow of information from DNA to RNA. The TSS of a gene is the first nucleotide that is transcribed into mRNA, i.e., the TSS defines the “start” of a gene body but has no defined sequence. In analogy, the “end” of a gene body is the position where Pol II dissociates from the genomic DNA template. The gene body is entirely transcribed into single-stranded pre-mRNA, which is composed of exons (numbered green and brown cylinders) and intervening introns (i). The introns are removed by splicing and the 5, - and 3, -end of the mRNA molecule are protected against digestion by exonucleases via a nucleotide cap and the addition of hundreds of adenines (polyadenylation (poly(A)), respectively (ii). Mature mRNA is then exported by an active, i.e., ATP (adenosine triphosphate) consuming, process from the nucleus through nuclear pores to the cytoplasma (iii). Small ribosome subunits scan the mRNA molecule from its 5, -end for the first available AUG (the “start codon”), assemble then with large subunits and perform protein translation process until they reach the sequence UAA, UAG or UGA (the “stop codons”) (iv). The mRNA sequences upstream of the start codon and downstream of the stop codon are not translated and referred to as 5, - and 3, -UTRs. The resulting polypeptide chains fold into proteins, most of which are further posttranslationally modified, in order to reach their full functional profile (v). The central dogma of molecular biology indicates that the flow of information from DNA to RNA to protein has one clear direction. Please note that for simplicity in this and in all following figures the nuclear envelope is drawn as single lipid bilayer and not as a double lipid bilayer. A = adenine, C = cytosine, G = guanine, T = thymine (occurs only in DNA), U = uracil (occurs only in RNA)
signal transduction (Box 2.1), catalysis and control of metabolic reactions, molecule transport and many more. In addition, proteins contribute to the structure and stability of cells and intracellular matrices. Gene expression patterns are cell-specific, but can also drastically change after exposure to intra- and extracellular signals and in response to pathological conditions, such as microbe infection or cancer. Thus, gene
2.1 Central Dogma of Molecular Biology
15
expression determines the phenotype, function and developmental state of cell types and tissues.
Box 2.1: Signal Transduction Cascades The cascades of signal transduction pathways have a common structure and typically start with an extracellular ligand binding to its cognate membrane receptor, which then at its cytoplasmatic part interacts with adaptor proteins and activates them. This activation status is mostly transferred to a cascade of protein kinases that eventually either stimulate a transcription factor or a chromatin modifying enzyme in the nucleus or other key enzymes located in the cytoplasma. This often orchestrates gene expression changes that result in functional alterations of the concerned cell. In this way, extracellular (and in part also intracellular) signals are perceived by dozens of signal transduction pathways. The latter form networks of cellular circuits that represent key lines of intracellular communication, i.e., mechanisms by which a cell integrates and transduces intra- and extracellular signals from their source, e.g., the extracellular environment, into an action of the cell, such as to move, excite granules, grow, differentiate or keep homeostasis, i.e., of its fate. Some of these pathways do not involve gene expression changes. Since proteins encoded by genes regulating cell fate, cell survival and genome maintenance often interact with each other, their respective pathways overlap, i.e., their classification may not be as distinct as indicated. Transcription is carried out by RNA polymerase enzymes that catalyze the DNAdependent synthesis of RNA. In the traditional definition of genes, only the transcription of mRNA is meant, i.e., the RNA template used for protein translation. However, nowadays many other forms of transcribed RNA, such as ribosomal rRNA (rRNA), transfer RNA (tRNA), micro RNA (miRNA) and long ncRNA, are known that serve for other functions than carrying the information for the amino acid sequence of a protein (Chap. 9). There are three types of DNA-dependent RNA polymerases, I, II and III, that are responsible for the synthesis of different types of RNA. RNA polymerase I exclusively transcribes the genes of the three rRNAs, 5.8S, 18S and 28S. These rRNAs are structural components of ribosomes and represent more than 80% of the RNA content of a cell. RNA polymerase III is specialized on the synthesis of small RNA molecules, such as 5S rRNA, all tRNAs and a number of other small nuclear RNAs (snRNAs), such as U6 snRNA used in splicing. Thus, both RNA polymerase I and III are producing RNA molecules that are needed for the basic function of a cell. The genes encoding for these RNAs therefore belong to the group of ubiquitously expressed genes, which are often called “housekeeping genes”. Such genes are regulated in a rather straightforward fashion using a limited number of transcription factors, in order to support a constant activity of these two types of RNA polymerases.
16
2 Gene Expression and Chromatin
In contrast, RNA polymerase II (Pol II) transcribes all 20,000 protein-coding genes and most ncRNAs (Chap. 9). In contrast to RNA polymerase I and III target genes, most of these Pol II-transcribed genes are tightly regulated and are responsive to intraand extracellular signals. There are many mechanisms how the activity of Pol II can be regulated by some 1,600 different human transcription factors (Chap. 4) and other nuclear proteins, such as cofactors and chromatin modifying enzymes (chromatin modifiers, Sect. 7.3). The TSS of a gene is the first nucleotide that is transcribed into mRNA, i.e., it defines the 5, -end (the “start”) of a gene (Fig. 2.1). In analogy, the 3, -end of a gene is the position where RNA polymerases dissociate from the genomic DNA template. For a given gene the TSS is the reference point and any sequence in front of the TSS is referred to as “upstream”, while “downstream” means after the TSS (in the main direction of transcription). The sequences between genes are referred to as intergenic regions that can range from several hundred to million base pairs. In total, these intergenic regions represent some 85% of the sequence of the human genome (Box 1.3), i.e., only 15% of the genome are transcribed into pre-mRNA (Table 2.1). In eukaryotic organisms genes are organized into exons and introns. Already while the process of transcription is ongoing, a second process, referred to as splicing, digests the pre-mRNA at the exon–intron borders and ligates only the exons, in order to form mature mRNA molecules. Since introns are in average some 10-times longer than exons, mature mRNAs are far shorter than their respective pre-mRNAs. Speaking in numbers, the 20,000 human protein-coding genes have an average pre-mRNA length of more than 16,000 nucleotides, while the average human protein is composed of 460 amino acids, for which only 1380 nucleotides of mature mRNA are needed. In additional processing steps, called capping and polyadenylation, the 5, - and , 3 -end of the mRNA molecules are protected against the action of exonucleases, i.e., the stability of mRNA increases (Fig. 2.1). In this form the mRNA molecules are transported by an active, i.e., ATP consuming, transport process through nuclear pores into the cytoplasm. In the cytoplasma the small subunits of ribosomes are scanning the Table 2.1 The human genome in numbers. The size, number or genes and transcripts of the latest version of the human genome (hg38) are indicated. Pseudogenes are regions of the genome that contain defective copies of genes
Number of chromosomes
22 + X + Y
Genome size (nt)
3,054,815,472
Number of genes Number of transcripts
58,037 203,835
Number of protein-coding genes
19,901
Number of protein-coding transcripts
80,087
Number of long ncRNA transcripts
15,779
Number of pseudogenes
14,723
Number of small RNAs
7258
Number of miRNAs
2588
Number of tRNAs
631
2.2 Nucleosomes: Central Units of Chromatin
17
mRNAs from their 5, -end for the first available AUG start codon, assemble then with the large subunit of the ribosome, start the protein translation process and progress with it until they reach one of three possible stop codons (UAA, UAG or UGA). The mRNA sequence upstream of the start codon and downstream of the stop codon are not translated and referred to as 5, - and 3, -untranslated regions (UTRs). This means that only a minor proportion of a gene’s sequence (some 5–10%, representing less than 2% of the human genome) are finally used for coding proteins. During the different steps of transcription, various protein complexes are deposited along the mRNA forming a mature messenger ribonucleoprotein that is subsequently exported to the cytoplasm. These steps were traditionally thought to occur independently, but there is extensive coupling between them, including the recruitment of both splicing and export factors during transcription, as well as interdependence between polyadenylation and export. The first step (transcription) in the flow of information from genomic DNA to a functional protein is the most controlled and regulated one. This seems to be logical, as it is most economic and safe to tightly control the first step of a regulatory process than a later step. However, this does not imply that the later steps are not controlled at all. Mechanisms that stop gene expression, such as in situations, in which the initial stimulus for the activation of a gene has disappeared, are as important as activation mechanisms. In this context, ncRNAs play an important regulatory role (Chap. 9).
2.2 Nucleosomes: Central Units of Chromatin Due to its phosphate backbone, at physiologic pH genomic DNA is negatively charged. The electrostatic repulsion between adjacent DNA regions makes it impossible to fold the long DNA molecules (46 to 249 Mb) of individual chromosomes into the limited space of the nucleus. This problem is solved by combining genomic DNA with histone proteins forming nucleosome complexes. The general feature of the four core histones H2A, H2B, H3 and H4 is their small size of some 11–15 kD and their disproportional high content of the of the positively charged amino acids lysine (K) and arginine (R), in particular at their amino-termini (Table 2.2). Nucleosomes are the subunits of chromatin and in every cell of our body our diploid genome is covered by approximately 30 millions of these complexes. Two copies each of H2A, H2B, H3 and H4, the so-called histone octamer, and 147 base pairs genomic DNA, which is wrapped nearly twice around the octamer, form the nucleosome (Fig. 2.2). The bending of genomic DNA is primarily enabled through the attraction between the positively charged histone tails and the negatively charged DNA backbone. In addition, at some genomic regions, the bending is supported by the natural curvature of DNA that is achieved by AA/TT dinucleotides repeating every 10 base pairs and a high CG content. Together with the linker histone H1 the nucleosome forms the so-called chromatosome. Each nucleosome is connected with the
18
2 Gene Expression and Chromatin
Table 2.2 Types and properties of human histones. Histone H1 binds to linker DNA, while histones each a pair of H2A, H2B, H3 and H4 form the nucleosome core Histone
Molecular weight [kDa]
Number of amino acids
Content of basic amino acids
H1
22.1
223
29.5
1.3
H2A
14.0
129
10.9
9.3
H2B
13.8
125
16.0
6.4
H3
15.3
135
9.6
13.3
H4
11.2
102
10.8
13.7
Lys [%]
Arg [%]
following one via linker DNA (20–80 base pairs). This forms a repetitive unit approximately every 200 base pairs of genomic DNA. The regular positioning of nucleosomes has the effect that the position of a given nucleosome determines the location of its neighbors. However, through the investment of ATP, i.e., of energy, chromatin remodeling protein complexes are able modulate the position and composition of nucleosomes (Sect. 8.1). The phosphate backbone of 200 base pairs genomic DNA carries 400 negative charges, which are in part neutralized by the approximately 220 positively charged lysine and arginine residues of the histone octamer. However, higher order folding of
H1 H4 molecule 2
H3
molecule 2
molecule 1
molecule 1
H2A molecule 1
molecule 2
H1
H2B
Nucleosome
molecule 2
Chromatosome molecule 1
Fig. 2.2 The nucleosome. This space-filling surface representation of a nucleosome contains two copies each of the four core histone proteins H2A (green), H2B (orange), H3 (red) and H4 (blue) and 147 base pairs of genomic DNA (gray) being wrapped 1.8-times around the histone core. In complex with the linker histone H1 (brown) the nucleosome is referred to as chromatosome
2.2 Nucleosomes: Central Units of Chromatin
19
chromatin requires the neutralization of the remaining 180 negative charges by the positively charged linker histone H1 and further positively charged nuclear proteins associating with chromatin. Nucleosomes are the regularly repeating units of chromatin, but they can vary from one genomic region to the other by different posttranslational modifications of the amino acid residues of their histones (Sect. 7.1) and the introduction of histone variants (Box 2.2). Genomic locus-specific histone modifications are reversible and an important component of the epigenetic memory affecting transcription factor binding and differential gene expression (Sect. 7.2). Thus, nucleosomes do not only pack the DNA and are therefore not simply barriers that block access to genomic DNA but serve as dynamic platforms linking and integrating many biological processes, such as transcription and replication.
Box 2.2: Histone Variants The core histones H2A, H2B, H3 and H4 represent the majority of histone proteins. In addition, there are eight variants of H2A (H2A.X, H2A.Z.1, H2A.Z.2.1, H2A.Z.2.2, H2A.B, macroH2A1.1, macroH2A1.2 and macroH2A2), two variants of H2B (H2BFWT and TSH2B) and six variants of H3 (H3.3, histone H3-like centromere protein A (CENPA), H3.1 T, H3.5, H3.X and H3.Y), while humans have no variants of H4. Core histones are assembled into nucleosomes behind the replication fork to package newly synthesized genomic DNA. By contrast, the incorporation of histone variants into chromatin is independent of DNA synthesis and occurs throughout the cell cycle. Interestingly, core histones have no introns, i.e., they have no splice variants while most of the genes for the histone variants do have introns and thus alternative splice variants. Histone variants are often subjected to the same modifications as core histones, but there are also variant-specific modifications on residues that differ from their canonical counterparts. Accordingly, histone variants also directly influence the structure of nucleosomes. For example, H2A.Bbd lacks acidic amino acids at its carboxy terminus, as a consequence of which only 118–130 base pairs (versus 147 base pairs) of genomic DNA are wrapped around the respective histone octamer. This leads to the formation of less compact and more accessible chromatin, which facilitates gene expression. The same nucleosome may contain multiple histone variants. There are homotypic nucleosomes, which carry two copies of the same histone and heterotypic nucleosomes, which contain a core histone and a variant histone or two different histone variants. This allows for greater variability in nucleosome formation, stability and structure. For example, nucleosomes that contain H2A.Z and H3.3 are less stable than core nucleosomes and are often found at nucleosome-depleted regions of active promoters, enhancers and insulators (Sect. 8.1). These labile H2A.Z/H3.3-containing nucleosomes serve as “place holders” and prevent the formation of stable nucleosomes around regulatory
20
2 Gene Expression and Chromatin
genomic regions. They can be easily displaced by transcription factors and other nuclear proteins that are not able to bind genomic DNA in the presence of a nucleosome composed of core histones. Thus, variable composition of nucleosomes can directly influence gene expression.
2.3 Chromatin Structure and Epigenetics Most of us probably had the first contact with epigenetics, when we were looking at chromosomes, either directly through a microscope or in a textbook. Chromosomes are formed of chromatin, which packs our genome, i.e., the 16 to 85 mm long DNA molecules of each chromosome, into the nucleus of a cell with a diameter of only 6–10 µm. However, chromosomes are only visible during a special phase of the cell cycle, referred to as the metaphase of mitosis. During mitosis the prime importance is that the genome is divided equally to the two daughter cells. Therefore, within the metaphase 2 × 46 DNA molecules need to be in highest compaction, referred to as chromosomes. At that time all genes are temporally switched off for approximately 1 h, i.e., mitosis represents the most extreme case of epigenetic regulation of our genome. More than 99% of the approximately 30 trillion (3 × 10¹³ ) cells of our body are terminally differentiated, i.e., they do not divide anymore and are in the interphase. In this phase, within the nucleus only lighter and darker areas can be distinguished, which represent loosely packed euchromatin and tightly packed heterochromatin, respectively (Fig. 2.3). In the “beads-on-a-string” model of euchromatin (Fig. 2.3, bottom right), nucleosomes are regularly positioned every 200 bp leaving 50 base pair-sized gaps of freely accessible genomic DNA between them. Euchromatin becomes condensed only during mitosis and has a higher gene density than heterochromatin. Genes can only be transcribed into RNA, i.e., they get expressed, when they are located within euchromatin. While the euchromatin fiber has a diameter of 11 nm, more compacted heterochromatin forms a 30 nm fiber (Fig. 2.3, bottom left) or even higher order structures of 100 nm in diameter. For comparison, the diameter of a chromosome is even 700 nm. The phenomena of gene imprinting (Sect. 6.3) and X chromosome inactivation (XCI) (Sect. 9.3) were the first indications that identical genetic material (from individual genes to whole chromosomes) can be in the same nucleus in an “on” as well as in an “off” state. Thus, genes can either be actively expressed, i.e., their information is copied into RNA, or they are inactive, i.e., not expressed. In analogy to the term “epigenesis” (i.e., morphogenesis and development of an organism) the word “epigenetics” was created for describing changes in the phenotype that are not based changes in the genotype. This definition was extended to “epigenetics is the study
2.3 Chromatin Structure and Epigenetics
21
Nucleolus
Nucleus
Nucleosome
50 bp
DNA
Heterochromatin
Euchromatin
Fig. 2.3 Eu- and heterochromatin. An electron microscopic picture of a nucleus during interphase is shown. The darker areas, located mostly in the periphery of the nucleus, represent constitutive heterochromatin (inactive), whereas the lighter areas in the center are euchromatin (active). The nucleolus is a nuclear substructure, where rRNA genes are transcribed. A schematic drawing (bottom) monitors dense nucleosome packing in heterochromatin (left, also referred to as closed chromatin) and loose nucleosome arrangement in euchromatin (right, open chromatin)
of changes in gene function that are mitotically and/or meiotically heritable and that do not entail change in DNA sequence”. Epigenetic changes are functionally relevant when they result in changes in mRNA levels and initiate the production of proteins. Such gene expression patterns may stay persistent throughout the following cell divisions for the remainder of the cell’s life. Interestingly, they can even last for multiple generations (Sect. 12.1). This implies that epigenetics can inherit the information which genes are expressed in which cells.
22
2 Gene Expression and Chromatin
2.4 Epigenetics Enables Gene Expression Chromatin acts as a filter for the access of DNA-binding proteins to functional elements of our genome, such as TSS regions (Sect. 3.1) and enhancers. Genes can only be transcribed into mRNA, when their TSSs are accessible to the basal transcriptional machinery containing Pol II. However, even with given DNA access, mRNA transcription is often weak in the absence of stimulatory transcription factors. Therefore, the second condition for efficient gene expression is that enhancer regions in relative vicinity to the TSS are not buried in heterochromatin and can be recognized by transcription factors. Thus, in order to activate and transcribe a gene, the chromatin at both TSS and enhancer regions, which control the gene’s activity, needs to be accessible. This implies that, in most cases, gene activation requires the transition from heterochromatin to euchromatin. Enhancers are genomic regions that contain binding sites for sequence-specific transcription factors, which recruit co-activator and chromatin modifying proteins (Sect. 7.3) to the respective genomic loci. Thus, enhancers function via the cooperative binding of multiple types of proteins. Since this often happens in less than one nucleosome length, nucleosome eviction is not essential for enhancer function (Sect. 8.1). Enhancer activity is determined by epigenome stages, which can be described by histone markers of accessible chromatin, such as H3K4me1 and H3K27ac (Sect. 7.2). When enhancers are close (± 100 base pair) to the TSS, they are also often referred to as promoters. Thus, there is no functional difference between enhancers and promoters besides their distance relative to the TSS of the gene that they are regulating. Enhancers that regulate the activity of a given gene need to be located within the same topologically associated domain (TAD) (Sect. 2.5). Since TADs have an average size of 1 Mb, this limits the maximal linear distance between an enhancer and the TSS(s) that it regulates (Fig. 2.4, top). Complexes of the proteins cohesin and CCCTC-binding factor (CTCF) mediate these DNA looping events. These 3D structural arrangements bring transcription factors that bind to enhancers into close vicinity of TSS regions. In this way, transcription factors, which bind to distant enhancers, can contact and activate the basal transcriptional machinery via intermediary complexes, such as the Mediator (MED) complex (Sect. 3.4). The looping mechanism also implies that enhancer regions are as likely upstream as downstream of TSS regions and may have tissue-specific usage and effects for transcription. For example, in tissue A enhancer A is used for activation, whereas in tissue B it mediates repression (Fig. 2.4, center and bottom). Results of the Encyclopedia of DNA elements (ENCODE) project (Sect. 10.1) demonstrated that basically all regulatory proteins have a Gaussian-type distribution pattern in relation to TSS regions, i.e., the probability to find an active TFBS symmetrically declines both up and downstream of the TSS. Thus, the classical definition of a promoter as a sequence being located only upstream of the TSS is outdated. The structure and organization of chromatin can be interpreted as a number of superimposed epigenetic layers that lead either to open euchromatin and active gene
2.4 Epigenetics Enables Gene Expression
23
TSS TF TF
Pol II TF
Gene X
TF
TF
Enhancer B
Enhancer A
eX
Gen
Tissue A
Pol II CTCF TF
Cohesin Enhancer A Enhancer B
Tissue B
TF
Gene
Enhancer A
Pol II
CTCF Cohesin
X
TF TF
TF
Enhancer B
Histones modified at N-terminal tails Activating TFs
Repressive TF
H3K27ac
H3K4me1
H3K27me3
H3K4me3
Fig. 2.4 Enhancer function. Enhancers are stretches of genomic DNA that contain binding sites for one or multiple transcription factors (TFs) stimulating the activity of the basal transcriptional machinery (Pol II and associated proteins) bound to the TSS of a gene. Enhancers are located both upstream and downstream of their target genes in linear distances of up to 1 Mb (top). Transcription factor-bound, active enhancers are brought into proximity of TSSs by DNA looping, which is mediated by a complex of cohesin, CTCF and other proteins. Active TSS regions and enhancers show depletion of nucleosomes while nucleosomes flanking active enhancers have specific histone modifications, such as H3K27ac and H3K4me1 (center, tissue A). In contrast, inactive enhancers are silenced by a number of mechanisms, such as repressing Polycomb proteins binding to H3K27me3 marks or by binding of repressive transcription factors (bottom, tissue B)
expression (“on”, Fig. 2.5, right) or to closed heterochromatin and no gene expression (“off”, Fig. 2.5, left): • The core of chromatin is genomic DNA that can be modified at cytosines, in particular at CG dinucleotides (CpGs, Sect. 6.1). Therefore, the first epigenetic layer is
24
2 Gene Expression and Chromatin
Active
Repressed Me
Me
Me
Me
Me
Me
Me
Me
LEVEL 1 DNA methylation LEVEL 2 Nucleosomes H3K9me3 me3
LEVEL 3
H3K27me3 me3
me3
Me
me3
H3K4me3
H3K36me3
Me
Me
and variants
me3
Me
me3
me3
me3
TSS LEVEL 4 Compactation DNA-binding proteins
Pol II TF me3
me3
TF
Lamina
Pol II Nuclear pore
TF Transcription factory
LEVEL 5 Nuclear organization
Nuclear envelope
Fig. 2.5 Epigenetic layers of chromatin organization. There are at least five different layers of chromatin organization that are associated with inactive (“off”, left) or active (“on”, right) transcription
• • • •
the DNA methylation status where hypermethylation stimulates the formation of heterochromatin. The packing of nucleosomes represents level 2 where more dense arrangements indicate heterochromatin. Histone modifications (Sect. 7.1) at specific positions are level 3 and mark for either active chromatin (mainly acetylated) or inactive chromatin (mainly methylated). The resulting accessibility of genomic DNA for the binding of transcription factors is considered as level 4. Finally, the complex formation and relative position of the chromatin, such as active transcription factories (Sect. 8.4) in the center of the nucleus and inactive chromatin in lamin-associated domains (LADs) attached to the nucleoskeleton at the nuclear periphery, represent level 5 (Sect. 2.5).
2.5 Gene Regulation in the Context of Nuclear Architecture
25
Importantly, also during the interphase, 90% of the genomic DNA of terminally differentiated cells is not accessible to transcription factors. Thus, heterochromatin is the default state of chromatin.
2.5 Gene Regulation in the Context of Nuclear Architecture The probability that two regions of a chromosome contact each other by chance via DNA looping rapidly decreases with the increase of their linear distance. However, when the contact between the two regions is stabilized, e.g., by associated proteins, then architectural and regulatory loops are forming (Fig. 2.6). Most architectural loops are identical to TADs (also sometimes referred to as insulated neighborhoods), since they are anchored by CTCF-CTCF homodimers in complex with cohesin and carry at least one gene. Thus, TADs are the units of chromosomal organization and segregate our genome into at least 2,000 domains containing coregulated genes. Often TAD boundaries are identical with insulators (Sect. 6.3) and are bound by CTCF. Thus, insulators are stretches of genomic DNA that separate functionally distinct regions of the genome from each other. Accordingly, neighboring TADs can differ significantly in their histone modification pattern, such as one TAD being in heterochromatic state containing silent genes and the other TAD being in euchromatin carrying transcriptionally active genes. TADs are separated by boundaries for self-interacting chromatin and thus organize regulatory landscapes, i.e., they define the genomic regions, in which enhancers can interact with TSS regions of their target gene(s). The linear size of TADs is in the range of 100 kb to 5 Mb (median: 1 Mb) and TADs contain 1–10 genes (median: 3 genes). Accordingly, most TADs contain a number of genes that may be regulated by the same set of enhancers, such as often observed for gene clusters. Regulatory loops are formed between enhancers and TSS regions that are located within the same TAD, i.e., they are smaller than TADs (Fig. 2.6). The formation of regulatory loops relies on the binding of transcription factors to the enhancer regions and its functional result is the stimulation of gene expression (Fig. 2.4). The inner surface of the nuclear envelope is coated with nuclear lamina, which is a complex of lamins and a number of additional proteins (Fig. 2.7). Lamins maintain the shape and mechanical properties of the nucleus and serve as attachment points for LADs. LAD-lamin interactions form a nucleoskeleton, i.e., they serve as a structural backbone for the organization of interphase chromosomes. LADs vary in size from 0.1–10 Mb, cover up to 40% of our genome and are primarily formed by heterochromatin. LADs have a low gene density, but in total they still contain thousands of genes, most of which are not expressed. Accordingly, the nuclear periphery is enriched for heterochromatin, whereas euchromatin is found more likely in the center of the nucleus (Fig. 2.3). This suggests that the location of a gene within the nucleus is a functionally important epigenetic parameter. The clustering of heterochromatin at the nuclear periphery creates silencing foci, so-called Polycomb bodies. These are complexes of members of the Polycomb
26
2 Gene Expression and Chromatin
Nucleus
Regulatory loop
TAD TAD
Architectural loop CTCF
Boundary
TAD Chromosome
TAD
TAD
TAD
TAD
CTCF
TAD
TAD 1 Mb
Fig. 2.6 Organization of chromosomes into TADs. Our genome is subdivided into a few thousand TADs defining genomic regions in which most genes have their specific regulatory elements, such as promoters and enhancers. TADs are architectural loops of chromatin that are insulated from each other by anchor regions binding complexes of CTCF and cohesin. Within TADs smaller regulatory loops between enhancers and promoters are formed
family, such as the components of Polycomb repressive complex (PRC) 1 and 2 (Sect. 7.3). PRCs act as transcriptional repressors that are essential for maintaining tissue-specific gene expression programs, i.e., they ensure the long-term repression of specific target genes. The position of chromatin and genes is not fixed, as there are dynamic changes in the contacts between the nucleoskeleton and genomic DNA involving single genes or small gene clusters. These changes are most pronounced during development. Of all human cell types, embryonic stem (ES) cells have the most accessible genome, i.e., the chromatin of these cells is largely open. During the differentiation process, cells change their chromatin structure and larger compaction of their genome occurs (Sect. 11.3). Thus, embryonic development proceeds from a single cell with dispersed chromatin to differentiated cells with nuclei that show compact chromatin domains being located in the periphery (Sect. 11.1). Accordingly, the physical relocation of a gene from the nuclear periphery to the center would unlock it to be expressed in a future developmental stage. Another level of chromatin architecture in the interphase nucleus is the location of whole chromosomes in separate chromosome territories, which are separated by an interchromosomal compartment (Sect. 8.4). Chromosomes fold in their territories in such a way that active and inactive TADs are found in distinct nuclear compartments. Active regions are preferentially located in the nuclear interior, whereas inactive TADs accumulate at the periphery. In addition, TADs that are heavily bound by
2.5 Gene Regulation in the Context of Nuclear Architecture
27
Active regulatory loop
Lamina-associated heterochromatin
me3
me3
Co-activation, remodeling and Mediator complex
me3
Promoter Pol II
Me Me
me3
me3 me3 me3
Me
Me
3 me
Me
Enhancer
Topologically associated domain
CTCF
H3K27me3
me3
PRC2 complex me3
me3
HP1
me3
Nucleus
Polycomb-repressed chromatin
Fig. 2.7 Chromatin architecture. Mediated by structural proteins, chromatin forms a 3D architecture the nucleus (center left). Heterochromatin is composed of stably repressed, inaccessible genomic elements and is located closer to the nuclear lamina (top left). Two CTCF proteins bound at adjacent chromatin boundaries form a complex with cohesin and other mediator proteins (center right). In this way, regulatory genomic regions, such as enhancers and promoters, which are separated by a genomic distance, can get into physical contact within DNA loops (top right). TADs distinguish such genomic regions with active enhancers from chromatin tracts that are silenced by PRCs (bottom right)
tissue-specific transcription factors are in different neighborhoods than those interacting with repressive PRCs (Fig. 2.7, right). To some extent, chromosome territories intermingle, which could explain interchromosomal interactions. Nevertheless, interactions between loci on the same chromosome are much more frequent than contacts between different chromosomes. Since the volumes of chromosome territories depend on the linear density of active genes on each chromosome, chromatin with higher transcriptional activity occupies larger volumes in the nucleus than silent chromatin.
28
2 Gene Expression and Chromatin
(Clinical) Conclusion: An overview of the impact of chromatin on gene expression is essential, in order to obtain an understanding of the molecular basis of epigenetics. This insight is important for realizing the role of epigenetics in nearly all processes of our life, many of which are discussed in the following chapters.
Additional Reading Buccitelli, C., & Selbach, M. (2020). mRNAs, proteins and the emerging principles of gene expression control. Nature Reviews Genetics, 21, 630–644. Buchwalter, A., Kaneshiro, J. M., & Hetzer, M. W. (2019). Coaching from the sidelines: The nuclear periphery in genome regulation. Nature Reviews Genetics, 20, 39–50. Buschbeck, M., & Hake, S. B. (2017). Variants of core histones and their roles in cell fate decisions, development and cancer. Nature Reviews Molecular Cell Biology, 18, 299–314. Klemm, S. L., Shipony, Z., & Greenleaf, W. J. (2019). Chromatin accessibility and the regulatory epigenome. Nature Reviews Genetics, 20, 207–220. Michael, A. K., & Thoma, N. H. (2021). Reading the chromatinized genome. Cell, 184, 3599–3611. Schoenfelder, S., & Fraser, P. (2019). Long-range enhancer-promoter contacts in gene expression control. Nature Reviews Genetics, 20, 437–455. Stricker, S. H., Köferle, A., & Beck, S. (2017). From profiles to function in epigenomics. Nature Reviews Genetics, 18, 51–66. Talbert, P. B., & Henikoff, S. (2017). Histone variants on the move: Substrates for chromatin dynamics. Nature Reviews Molecular Cell Biology, 18, 115–126. van Steensel, B., & Furlong, E. E. M. (2019). The role of transcription in shaping the spatial organization of the genome. Nature Reviews Molecular Cell Biology, 20, 327–337. Zhou, K., Gaullier, G., & Luger, K. (2019). Nucleosome structure and dynamics are coming of age. Nature Structural & Molecular Biology, 26, 3–13.
Chapter 3
Basal Transcriptional Machinery
Abstract In this chapter, we will discuss the impact of TSS regions, which are also known as core promoters. This is a prerequisite for understanding how transcription by Pol II is controlled. Pol II is the core of the basal transcriptional machinery that contains a large number of general transcription factors (GTFs), such as the TATA box-binding protein (TBP), many of which are summarized as the transcription factor (TF) IID complex. The TATA box is the prototype of a site-specific TFBS determining the position of Pol II on the TSS. However, genome-wide analysis showed that the majority of human genes use alternative binding sites for GTFs. Diversity and complexity of the transcriptome are based on that most genes have multiple TSS regions and that the TSS of many genes is not a single defined nucleotide. The basal transcriptional machinery interacts via another multiprotein complex of coactivators, termed the MED complex, with a large variation of transcription factors. In parallel, the MED complex coordinates the action of coactivators and corepressors, some of which are chromatin modifiers. Keywords RNA polymerase II · TBP · GTFs · TATA box · Core promoter · TSS · Basal transcriptional machinery · TFIID · Sequence logo · TFBS · MED complex
3.1 Core Promoter Most protein-coding genes show a tissue- and signal-specific expression pattern that is mediated by a large set of some 3200 site-specific transcription factors (encoded by approximately 1600 genes, Chap. 4). These transcription factors bind to enhancers, most of which are located in some distance to the TSS region(s) of the gene that they are regulating (Fig. 2.4). Distal binding transcription factors recruit in a precisely orchestrated way a large set of coactivator proteins, in order to have an effect on the transcriptional activity of their target gene. They take advantage of the fact that genomic DNA can loop effectively into any desired direction. In this way, any transcription factor can contact the basal transcriptional machinery binding on a TSS.
© The Author(s), under exclusive license to Springer Nature Switzerland AG 2023 C. Carlberg et al., Molecular Medicine, https://doi.org/10.1007/978-3-031-27133-5_3
29
30
3 Basal Transcriptional Machinery
The core promoter is the genomic region ± 50 base pairs of a TSS. This stretch of genomic DNA contains all essential elements, in order to allow the assembly of the basal transcriptional machinery (also called preinitiation complex). This process places the catalytic site of Pol II on a suitable position of the genome and defines in this way the TSS. The activity of the basal transcriptional machinery is modulated by proximal and distal activator and repressor proteins via the MED complex (Sect. 3.4). In humans, more than 50 different proteins bind to the core promoter and form the components of the basal transcriptional machinery (Table 3.1). These include the 12 subunits of Pol II and other multiprotein complexes, such as TFIID. The most studied element of the core promoter is the TATA box, which is the binding site for the GTF TBP. When TBP has found an accessible core promoter, i.e., when this genomic region is sufficiently depleted from nucleosomes (Sect. 8.1), it associates with some 20 different TBP-associated factors (TAFs), 13 of which are forming the 1300 kD complex TFIID. Each RNA polymerase type has its own set of TAFs, i.e., Pol II is interacting with TAFIIs. Interestingly, TAFIIs are also found in chromatin remodeling complexes (Sect. 8.2). The significant homology between TAFIIs and histones suggests that TFIID may mimic nucleosome function. In fact, genomic DNA can be wrapped around TFIID similar to as it is wrapped around a nucleosome, so that the latter can be displaced while genomic DNA is stabilized during transcription complex assembly. TFIID modifies then the surrounding chromatin via the histone acetyltransferase (HAT) activity of TAF1. With TBP in its core, TFIID is the main GTF that directly binds to DNA. Therefore, DNA-bound TFIID is the landmark for the core promoter and the sign for other GTFs, such as TFIIA, B, E, F and H and Pol II to assemble in an ordered fashion at this genomic locus (Fig. 3.2). In contrast to some bacteriophage RNA polymerases, Pol II itself is not able to recognize any specific DNA-binding sequence. Thus, the TSS is determined solely by steric constrains of the position of Pol II in relation to that of TFIID. The multisubunit enzyme Pol II depends on a large number of additional proteins, in order to initiate, elongate and terminate transcription. Transcription initiation begins with the formation of the basal transcriptional machinery complex. Isomerization of this closed promoter complex to an open complex involves separation of the DNA strands, since the RNA synthesizing activity of Pol II needs partially single-stranded DNA as a template. DNA opening is mediated by the DNA translocase ERCC3 (ERCC excision repair 3, TFIIH core complex helicase subunit), which is a subunit of TFIIH and binds DNA downstream of Pol II. ERCC3 hydrolyses ATP to unwind DNA and propel it into the active center of the polymerase. TFIIE then binds and stabilizes the melted DNA. TFIIH has a dual role as it participates both in transcription and in nucleotide excision repair (NER) (Sect. 29.3). In addition to its helicase subunit, TFIIH also contains the kinase subunit CDK7 (cyclin-dependent kinase 7), which phosphorylates the carboxy-terminal domain of Pol II. This phosphorylation step is necessary to dissociate Pol II from the GTFs. The transcribing Pol II complex is initially unstable and abortive initiation can create a number of short RNAs, such as enhancer RNAs (eRNAs) (Sect. 9.4). Nevertheless, from a critical length of the mRNA molecule on, initiation factors are released from the Pol II complex and a stable elongation complex is formed.
3.1 Core Promoter
31
Table 3.1 Components of the basal transcriptional machinery. MNAT1 = MNAT1 component of CDK activating kinase, POLR2 = RNA polymerase II General transcription factor TFII#
Subunit
Function/activity
D
TBP + TAFs
DNA binding to TATA box (core promoter), co-activation phosphorylation, ubiquitination and HAT activity
A
GTF2A1, GTF2A2
TBP-DNA stabilization, co-activation
B
GTF2B
TBP-DNA stabilization, Pol II and TFIIF recruitment TSS targeting
F
GTF2F1, GTF2F2
Pol II interaction and recruitment to promoter cooperation with TFIIB in TSS targeting recruitment of TFIIE and H enhances Pol II transcription start and elongation
E
GTF2E1, GTF2E2
Facilitation of the Pol II initiation-competency helping in promoter clearance recruitment of TFIIH
H
GTF2H1, GTF2H2, GTF2H3, GTF2H4, GTF2H5, MNAT1, CCNH, CDK7, ERCC2, ERCC3
Helping in promoter clearance and transcriptional initiation ATPase, helicase and E3 ubiquitin ligase activity transcription-coupled nucleotide excision repair phosphorylating Pol II C-terminal repeat domain (CTD)
Pol II
POLR2A-M
Initiation, elongation and termination of transcription recruitment of mRNA capping proteins recruitment of transcription-coupled splicing and 3’ end processing factors CTD phosphorylation, glycosylation and ubiquitination
32
3 Basal Transcriptional Machinery
3.2 TATA Box and Other Core Promoter Elements The TATA box is a prototype of binding motifs of site-specific transcription factors. The first nucleotide of a TATA box is located approximately 30 base pairs upstream of the TSS of a gene (Fig. 3.3a). The name TATA is a short form of its consensus sequence TATAWADR (Fig. 3.3b, for nucleotide abbreviations see Table 3.2) and it is specifically recognized by a homodimer of the transcription factor TBP (Fig. 3.3c). Consensus sequences have been used in the past to represent the properties of known TFBSs. The binding sites are aligned below each other and a consensus nucleotide letter (Table 3.2) is assigned, in order to indicate the nucleotide composition in each column. Although consensus sequences represent a TFBS better than a single sequence, they do not accurately reflect the quantitative characteristics of this protein-DNA interaction. Thus, sequence logos (Fig. 3.3b) are more appropriate, since they are based on position frequency and position weight matrices (Box 3.1). Moreover, they allow a fast intuitive visual assessment of the characteristics of a TFBS (Table 4.2). Box 3.1: Sequence Logos and de novo Motif Analysis In order to reflect more accurately the characteristics at each position of a TFBS, a position frequency matrix is created that describes the number of nucleotides observed at each position. This frequency matrix is often converted to a position weight matrix, where normalized frequency values are indicated in a log-scale (this
Table 3.2 The nucleotide code. The following abbreviations for nucleotides are internationally used
Base
Meaning
Origin of designation
A
A
Adenine
B
G or T or C
not—A
C
C
Cytosine
D
G or A or T
not—C
G
G
Guanine
H
A or C or T
not—G
K
G or T
Keto
M
A or C
aMino
N
G or A or T or C
aNy
R
G or A
puRine
Y
T or C
pYrimidine
S
G or C
Strong interaction
T
T
Thymine
V
G or C or A
not—T (not—U)
W
A or T
Weak interaction
3.2 TATA Box and Other Core Promoter Elements
33
makes computational analysis more efficient). Targets of a given transcription factor can be predicted by screening genomic DNA locally or genome-wide for regions, in which the local sequence fits with the position weight matrix. However, this approach does not address any redundancy in recognition by related transcription factors, the accessibility of the sequence within chromatin structure or contributions of other transcription factors binding up or downstream. For any DNA sequence, a quantitative score can be calculated by summing up the values for each nucleotide of the binding motif. These scores are roughly proportional to binding energies. In sequence logos (Fig. 3.3b) the scale of each nucleotide is based on the relative abundance of the nucleotide at the respective position and the relative importance of the position for the overall transcription factor binding. Therefore, sequence logos are better suited and more intuitively understood representations of TFBSs than position weight matrices. Comparing a large number of protein binding sequences, such as determined from ChIP-seq (chromatin immunoprecipitation sequencing) data via de novo motif finding, allows the most reliable description of a TFBS (Sect. 10.1). Moreover, the same method can also reveal the presence of binding sites for additional transcription factors, thereby suggesting combinatorial transcription factor complexes. The crystal structures of the DNA-binding domains (DBDs) of TBP (Fig. 3.3c) and of its complexes with TFIIA and TFIIA (Fig. 3.4a) demonstrate that TFIIA and TFIIB contact both genomic DNA and TBP. This increases the stability of the TBP-DNA complex. Moreover, these structures show that the DNA is dramatically bent and unwound. TAFIIs in conjunction with TFIIA induce conformational changes in the complex leading to wrapping of the core promoter around TFIID. Core promoters are often nucleosome-depleted at the actual TSS region, i.e., in contrast to TFBSs at other genomic regions, such as enhancers, TSS regions represent the most accessible form of genomic DNA (Sect. 8.1). There are different types of general TFBSs within TSS regions. In analogy to prokaryotes, it was initially assumed that every core promoter contains a TATA box sequence. However, in fact only 10–20% of mammalian core promoters carry a functional TATA box. Therefore, alternative binding sites for GTFs have to take over the role of the TATA box. The initiator (Inr) element is functionally analogous to the TATA box as it is directing the formation of the basal transcriptional machinery, determining the location of the TSS and mediating the action of upstream activator proteins. The consensus sequence of Inr is YYANWYY and it directly overlaps with the TSS. The Inr element is bound by a complex of TAF1 and TAF2 and then recruits the other subunits of TFIID (Fig. 3.4b). After the stable binding of TFIID to the core promoter, the remaining steps of the formation of a functional basal transcriptional machinery and transcription initiation follow a similar mechanism than for TATA box-containing promoters.
34
3 Basal Transcriptional Machinery
The downstream promoter element (DPE) bears the consensus sequence RGWYV and is located approximately 30 bp downstream of the TSS. The DPE is found in TATA box-lacking core promoters and often acts in conjunction with the Inr element to direct specific initiation of transcription (Fig. 3.4b). In contrast, the TFIIB recognition element (BRE) binds TFIIB, has the consensus sequence SSRCGCC and is often found upstream of the TATA box (Fig. 3.4c). Members of a class of core promoters being often found with housekeeping genes lack both TATA and Inr elements but instead contain several transcription initiation sites, have a high CG content and multiple binding sites for the ubiquitously expressed mammalian transcription factor SP1 (specificity protein 1) (Fig. 3.4d). SP1 directs the formation of the basal transcriptional machinery to a region 40–100 base pairs downstream of its binding sites involving TAF1, TAF2 and TAF4. Sequence elements of core promoters are commonly conserved across orthologous genes, but the complete set of mammalian promoters is too diverse to allow reliable prediction of TSS regions without reference to the experimental data (Chap. 10). For example, one of the main characteristics of human TSS regions is that approximately 60% of them are situated in proximity to CpG islands (Sect. 6.1).
3.3 Genome-Wide Core Promoter Identification The availability of whole genome sequences of humans and other species led to the development of new high-throughput methods, some of which are targeted toward locating the 5’-ends of mRNAs or active TSSs (Sect. 10.2). Next-generation sequencing (NGS) methods, such as RNA sequencing (RNA-seq, Box 3.2), indicate on a genome-wide level relative mRNA expression. The DBTSS database (http:// dbtss.hgc.jp) describes the exact position of experimentally validated TSS regions for a number of species. It integrates RNA-seq data and ChIP-seq data of histone modifications as well as the binding of Pol II and several transcription factors. This also includes public data, such as from the ENCODE project (Sect. 10.1). Interestingly, many of the newly identified TSS regions are not associated with a protein-coding gene but lead to the production of ncRNAs (Chap. 9). The FANTOM (functional annotation of the mammalian genome) 5 project (Sect. 10.1) systematically used the method CAGE (cap analysis of gene expression, Box 3.2) with samples from nearly 1000 primary human tissues and cell lines and identified some 185,000 TSS regions throughout the human genome. Many of these clusters are core promoters. Box 3.2: Transcriptome Profiling Methods RNA-seq is nowadays the standard method for transcriptome profiling and uses NGS technologies. In this method a population of RNA molecules, such as total RNA or a poly(A)+ mRNA subset, is converted into a library of cDNA fragments. The library is then sequenced in a high-throughput approach (Sect. 10.2). This provides
3.3 Genome-Wide Core Promoter Identification
35
short sequence tags (comparable to those produced in ChIP-seq, Fig. 10.3) from either one end (referred to as “single-end” sequencing) or both ends (named “pair-end” sequencing). RNA-seq allows a more precise measurement of transcript levels than previously used methods, such as microarrays, that are based on nucleic acid hybridization. The method CAGE is a special version of RNAseq that focuses on the 5, -end of the RNA population of a biological sample. In this technique small fragments from the 5’-ends of capped mRNA transcripts are extracted, reverse-transcribed to DNA, polymerase chain reaction (PCR) amplified and sequenced. This method was extensive used by the FANTOM5 project (Sect. 10.1). For example, ChIP-seq analyses identified Pol II bound to the TSS regions of active genes. Pol II is recruited to these TSS regions depending on the studied gene and differentiation status of the cell. This implies that the recruitment and mRNA transcript elongation by Pol II is regulated differently at different genes. Furthermore, Pol II is also associated with enhancer elements, which supports the model presented in Fig. 3.1 that distal binding transcription factors are connected via protein–protein interactions with the basal transcriptional machinery. Further genome-wide studies indicated also for a number of histone modification and DNA methylation marks a correlation to active TSS regions. Genome-wide approaches also demonstrated that most human core promoters lack a distinct TSS to be located at one specific nucleotide position, but they consist of an array of closely located TSSs that have a median spread of some 70 base pairs. This distinguishes “broad” core promoters from “sharp” ones. However, the various individual TSSs within a broad promoter are located within the same nucleosome-depleted region (Sect. 8.1). Variant hybrids between these two core promoter types also exist. Interestingly, sharp core promoters more likely contain TATA boxes, while broad promoters often are close to CpG islands (Sect. 6.1). Moreover, sharp promoters are used preferentially for tissue-specific expression, whereas broad promoters are often associated with housekeeping genes. The use of multiple TSSs over an extended genomic region in genes with broad core promoters requires that the respective genes exclude ATG translation start codons close to the TSS. Accordingly, more than 80% of human genes have a long 5’-UTR. Furthermore, this implies that the TFIID complex binds relatively non-specifically to these broad core promoters. A third type of core promoters are those of key developmental transcription factors involved in patterning and morphogenesis. These resemble housekeeping gene core promoters, but are distinctly bivalently marked with both H3K4me3 and H3K27me3 (Sect. 7.2), which primes them for activation in the correct cell lineage and for silencing in all other cells. These poised promoters are associated with long individual or multiple CpG islands (Sect. 6.2). Importantly, in humans most protein-coding genes have more than one TSS region. These alternative core promoters are generally used in different contexts or
36
3 Basal Transcriptional Machinery
a
Proximal enhancer
Distal enhancers
Core promoter TATA
TSS
b transcription factors, e.g., CEBPA
Remodeling complex
Mediator complex
Co-activator complex Pol II
TSS
transcription factors, e.g., nuclear receptors
Basal transcriptional maschinery
TBP
Fig. 3.1 Components of transcriptional regulation. In a linear schematic picture of the regulatory region of a gene (a), the core promoter (TSS region), proximal TFBSs (proximal enhancers) and distal enhancers are distinguished. For simplicity only elements upstream of the TSS are indicated, but besides the TATA box these TFBSs are also found downstream of the TSS. A more realistic DNA looping model (b), in which also transcription factors, coactivators, other chromatin modifying proteins and Pol II are shown, suggests that all protein-bound TFBSs are connected via several multiprotein complexes, such as the coactivator complex, the remodeling complex, the MED complex and the basal transcriptional machinery. Different complexes are distinguished here, because they can be separately purified or assembled in vitro, but it is likely that they all together form a large super-complex, also called the transcription factory (Sect. 8.4)
tissues, in order to produce distinct protein products. In many cases, the different TSS regions generate alternative 5, -exons that sometimes contain alternative translation start codons often splicing into a common second exon. Moreover, the same gene locus can carry both sharp and broad core promoters. The use of alternative core promoters substantially contributes to the complexity of the human transcriptome and proteome.
3.4 TFIID and MED as Paradigms of Multiprotein Complexes
+TFIID (TBP+TAFs)
37
TAFs TBP
TAFs TBP +TFIIB
B
TATA +Pol II +TFIIF
H TAFs TBP
TAFs TBP
F B Pol II
+TFIIE +TFIIH
E F B Pol II
TSS
Fig. 3.2 Assembly of the basal transcriptional machinery. The TATA box of a core promoter (TSS region) is specifically bound by TBP that forms together with TAF proteins the multiprotein complex TFIID. In an ordered fashion further GTFs, such as TFIIB, F, E and H, as well as Pol II are recruited to the DNA-bound TFIID complex. Within this basal transcriptional machinery, the catalytic site of Pol II is in a defined distance of the TATA box, i.e., the binding of TBP determines the start of transcription
3.4 TFIID and MED as Paradigms of Multiprotein Complexes The schematic drawings of the different protein complexes on TSS regions (Fig. 3.4) focus only on the key proteins and are not in scale. For a better illustration of a multiprotein complex, we display TFIID in two different ways. In the schematic drawing shown in Fig. 3.5a all subunits of TFIID (TBP and TAFs 1–13, Table 3.3) are shown in correct stoichiometry and are scaled according to their relative molecular mass. This illustrates the size of the complex in relation to the core promoter and demonstrates that the different subunits can simultaneously contact different binding sites, such as a TATA box, an Inr element or a DPE site that spread over more than 50 base pairs in distance. Furthermore, the figure suggests that irrespective of the exact composition of binding sites within a given TSS region, the same large protein complex can be formed. Nevertheless, all protein complexes involved in transcriptional regulation have a dynamic structure, i.e., the different subunits assemble and dissociate, so that the detailed composition of the complex varies over time. The degree of this variance may depend on the binding sites found in the respective core promoter and may influence its interaction with other protein complexes. Figure 3.5b and c provide an even more realistic view on the TFIID complex. Crystal structure data of individual TFIID subunits were combined with an electron
38
3 Basal Transcriptional Machinery
a -100
-75
-50
-30
GGGCGG
CCAAT
GGGCGG
TATA
+1
TSS
Bits
b 4 3 2 1 0
1
2
Consensus
c
3
4
5
6
7
8
9 10 11 12
T A T A W A D R
TBP DBD (core domain)
DNA
Front view
Top view
Side view (left)
Side view (right)
Fig. 3.3 TATA box in complex with TBP. The TATA box is found some 30 base pairs upstream of the TSS of a subset of human genes and is specifically recognized by TBP (a). Other possible proximal TFBSs are CG-rich motifs being recognized by the transcription factor SP1 or CCAAT boxes bound by the transcription factors of the CEBP (CCAAT enhancer binding protein) family. All these elements belong to the core promoter (TSS region). The TATA box is the prototype of a TFBS. It can be represented either by a consensus sequence or more accurately by a sequence logo (b). Two nearly identical DBDs (blue and green) of TBP are shown in a Connolly surface model (c, top) in complex with DNA (gray) or as a ribbon model (c, bottom) in the absence of DNA
microscopic density map of the whole complex. The complex shown is from yeast, but the high evolutionary conservation of GTFs suggests that also the human TFIID complex has a comparable structure. The surface of this large multiprotein complex has a number of contact points for DNA (TBP, TAF1 and TAF4) that were already indicated in the schematic pictures of Fig. 3.4. In addition, the complex provides numerous interfaces for the interaction with other proteins, such as other GTFs, Pol II and members of the MED complex. Hundreds of coactivator proteins are involved in the transfer of information from activated transcription factors, which bind to distal enhancers, to the basal transcriptional machinery. However, only a limited number of these coactivators directly interact with components of the basal transcriptional machinery, some of which are the subunits of the MED complex. Specific protein–protein interactions occur both between individual subunits of the MED complex and site-specific transcription factors as well as between the MED complex and Pol II. This suggests that gene regulatory signals are processed through the MED complex. Since the MED complex senses a multitude of different signals, it integrates them and consecutively delivers a properly calibrated output to the basal transcriptional machinery.
3.4 TFIID and MED as Paradigms of Multiprotein Complexes
a
39
b TAF2
TFIIB TFIIA
TBP
TAF6 TAF1
TATA
TAF9
TSS Inr TSS
DPE
TBP
c TFIIA
TLF
TFIIB
?
BRE
TFIIB TFIIA
DNA
TBP
d TAF4
TFIIA
TFIIB DNA
TSS
SP1
CG-rich
TAF2 TAF1
TSS
Fig. 3.4 Different protein complexes on TSS regions. Core promoters that contain a TATA box are bound by TBP in complex with TFIIA and TFIIB (a). The complex is shown as a schematic drawing (top), as a Connolly surface model (center) or as a ribbon model (bottom). The unwound DNA is visible best in the ribbon model. On TATA-lacking core promoters the Inr element is used alone or in combination with DPE to attract TAF1 and TAF2 (to Inr) and TAF4 and TAF9 (to DPE) (b). Alternatively, TBP-like factor (TLF) can form a complex with TFIIA and TFIIB on a BRE element (c) or SP1 binding to a CG-rich sequence directs complex assembly of TAF1, TAF2 and TAF4 (d)
Most of the 26 subunits of the core MED complex are evolutionarily conserved from yeast to humans (Table 3.4). Based on their position within the complex the proteins belong to the head, middle, tail and kinase module (Fig. 3.6). The relatively stable core structure of the MED complex is formed by the modules head, middle and tail, while the components of the kinase module, CDK8, cyclin C (CCNC), MED12 and MED13, associate reversibly with the complex. Under these conditions MED26 dissociates, i.e., the active MED complex has 29 subunits and mediates then via recruitment of the super-elongation complex the activation of Pol II. The head and middle modules of the MED complex are involved in interactions with the basal transcriptional machinery, whereas all module subunits interact with various transcription factors. Since the kinase module interacts with Pol II, in its absence the MED complex rather exerts a repressive function on gene transcription.
40
3 Basal Transcriptional Machinery
a
TAF10 TAF12 TAF11 TAF13
TAF4 TAF8
TAF7
TAF3 TAF5
Taf3
Taf6 Taf12
TAF5
C
TAF1
Taf10
TAF9 TAF6
Taf4
TAF9 TAF2 TAF6 Inr
TBP TATA
TAF9
TAF4
TAF12
Taf7
Taf5
Taf11
DPE
b
Taf1 Taf9
TAF4
TAF12
c
TBP + Taf1
Taf13
Taf10 Taf8
Taf2
TAF11
Taf6 Taf5 Taf9
TAF6 TAF1 double bromodomain module (H. sapiens)
LTA4H-like domain TAF2 (H. sapiens)
Histone-like fold TAF6-TAF9 interface (D. melanogaster)
TBP (H. sapiens)
TAF13 Histone-like fold TAF4-TAF12 interface (H. sapiens)
N-term of Taf5 (S. cerevisiae)
Taf12
Taf4
Histone-like fold TAF11-TAF13 interface (H. sapiens)
WD40 domain of Taf5 (S. cerevisiae)
Taf14 domain (S. cerevisiae)
TAF4 region I (H. sapiens)
TAF3 PH(M. musculus)
Fig. 3.5 TFIIB as a paradigm of a multiprotein complex. Schematic representation of the multiprotein complex TFIID, where the size of the different subunits is relative to their molecular mass (a). Crystallized domains and folds of TAFs from different species (b). With the exception of the histone fold domains, there is the same fold in TAF10-TAF8 and TAF10-TAF3 interacting surfaces. The leukotriene A4 hydrolase (LTA4H)-like domain that is homologous to TAF2 is based on human M1 aminopeptidase (PDB identifier 3B7S) and the characteristic WD40 propeller domain found in TAF5 is based on the carboxy-terminal domain of Tup1, which is a transcriptional corepressor in yeast (PDB identifier 1ERJ). Subunits of the yeast TFIID complex (c). The known 3D structures of yeast Taf domains or their homology models are roughly positioned according to the available data on protein–protein interactions into an electron density map obtained from electron microscopic images. Tafs containing histone folds are displayed in blue. TBP is complexed with the TAND domain of Taf1
The subunits of the MED complex show preference for different transcription factor classes. For example, MED1 is the major interaction partner of nuclear receptors, such as thyroid hormone receptor (THR) (Sect. 5.1), but members of this transcription factor superfamily can also bind to MED14. Moreover, MED1 interacts also with other transcription factors, such as GATA-binding protein 1 (GATA1). MED23 is the main sensor for mitogen-activated protein kinase (MAPK) signaling by interacting with the transcription factor ELK1 (ETS transcription factor ELK1) and in parallel one of the end points of signal transduction initiated by insulin. MED15 interacts with the cholesterol-sensing transcription factor SREBF1 (sterol regulatory element-binding transcription factor 1) and therefore belongs to the master regulators of lipid homeostasis (Sect. 35.3). The tumor suppressor and transcription factor
3.4 TFIID and MED as Paradigms of Multiprotein Complexes
41
Table 3.3 The subunits of human TFIID General nomenclature
Requirement for the functional complex
Human nomenclature
Function, activity or structural similarity
TBP
No
TBP
DNA binding to TATA box
TAF1
Yes
TAFII250
HAT
TAF2
Yes
TAFII150
Cell cycle (G1/S arrest)
TAF3*
Yes
TAFII140
Cell cycle (G2/M arrest)
TAF4*
?
TAFII130/135
?
TAF4B*
?
TAFII105
B-cell specific presence
TAF5
Yes
TAFII100
Cell cycle (G2/M arrest)
TAF5L
?
PAF65B
?
TAF6*
Yes
TAFII80
Histone H4 similarity
TAF6L
?
PAF65B
?
TAF7
Yes
TAFII55
?
TAF7L
?
TAF2Q
?
TAF8*
?
TAFII43
?
TAF9*
Yes
TAFII31/32
Histone H3 similarity
TAF9B
?
TAFII31L
?
TAF10*
Yes
TAFII30
Cell cycle (G1/S arrest)
TAF11*
Yes
TAFII28
Histone H3 similarity
TAF12*
Yes
TAFII20/15
Histone H2B similarity
TAF13*
Yes
TAFII18
Histone H4 similarity
TAF15
?
TAFII68
?
*
TAFs with histone-like fold
tumor protein p53 (encoded by the gene TP53) and the viral activator protein VP16 both interact with MED17. The protein p53 also contacts MED1 and VP16 binds MED25. In addition, developmental and neuronal pathways interact with subunits of the kinase module. Taken together, the MED complex is a signal-sorting center that is involved in the regulation of the transcription of nearly all human genes and in parallel mediates the transactivation effects of most transcription factors. The MED complex can also directly coordinate between changes in chromatin activity stages of enhancer regions and the basal transcriptional machinery. However, in the case of nuclear receptors, MED1 and coactivators with HAT activity compete for the same interaction surface on the transcription factor (Sect. 5.2). Under these
No
MED5/24 No No
No No
MED16
MED23
No Yes
No
MED15
TAIL
No
MED3/27 Yes
Yes Yes
MED14
Yes
No
No
No
MED31
Yes
Yes
Yes
Yes
Yes
No
No
Yes
MED2/29
Yes Yes
MED10
Yes
MED9
MED21
Yes Yes
MED4
MED7
MIDDLE -TAIL
No
HEAD-MIDDLE
MIDDLE
MED19
MED1 No
Yes
MED22
Yes
Yes
No No
MED18
MED20
Yes
Yes
MED17
Yes Yes
Yes Yes
Yes
Yes
MED8
HEAD
MED11
MED6
Table 3.4 The subunits of the human MED complex
TRAP150(//DRIP130/CRSP3/CRSP130/hSur2
THRAP5/TRAP95/DRIP92/p96b
ARC105/PCQAP/TIG-1
TRAP100/THRAP4/DRIP100/CRSP100/KIAA0130
TRAP37/CRSP8/CRSP34
hIntersex (IXL)
(continued)
CXORF4/EXLM1/RGR1/TRAP170/DRIP150/CRSP2/CRSP150/p110
hSoh1
hSrb7/p21/SURB7
hMed10/hNut2
FLJ10193/hMed25
hMed7/DRIP34/CRSP9/CRSP33/p36
HSPC126/TRAP36/DRIP36/p34
RB18A/CRSP200/CRSP1/PBP/TRIP2/TRAP220/DRIP230/DRIP205
LCMR1/DT2P1G7
SURFEIT 5 (SURF5)
hTRFP/p28a
P28B
CRSP6/CRSP77/ TRAP80/DRIP80/p78
HSPC296
mMed8/ARC32
hMed6/p32/DRIP33
42 3 Basal Transcriptional Machinery
No
No
MED26 No
No
MED30
No No
No
MED28
UNASSIGNED
No
MED25 No
No No
No No
CDK8
CCNC
No
No No
KINASE
MED12
MED13
Table 3.4 (continued) TNRC11/HOPA/KIAA0192/TRAP230/DRIP240
TH RAP6/TRAP25
Fksg20/EG1/hMagicin
ARC70/CRSP7/CRSP70
PTOV2/ARC92/ACID1/p78
hSrb11/CycC
K35/hSrb10/CDK8
THRAP1 /TRAP240/DRIP250
3.4 TFIID and MED as Paradigms of Multiprotein Complexes 43
MED13
MED2 (MED29)
MED3 (MED27)
MED 28 MED1
MED16 MED9
Middle
VP16
Nuclear receptors, p53 E1A, SREBF1
MED15 (Hs)
MED15
MED22
MED11
MED25 (Hs)
MED20 MED18
MED8
MED17
6
MED19
MED4 MED 31
MED26 MED MED25 30
MED5
MED23
MED10 MED7
MED14 MED21 MED
VP16, p53, HSF
MED7 (Sc)
MED31 (Sc)
MED22 (Sc)
MED22
MED20 (Sc)
HEAD module (Sc)
MED11
MED6
MED8
MED8 (Sc)
MED18 (Sc)
Head
MED11 (Sc)
MED17
MED18
MED20
Fig. 3.6 The MED complex. The schematic structure of the human MED complex is displayed. The relative position of the subunits in the modules kinase (orange), tail (blue), middle (brown and green) and head (red) is based on the displayed cocrystal structures
Tail
Kinase
CDK8
MED7 (Sc)
CCNC (Hs) MED21 (Sc) REST, NANOG, Nuclear receptors CTNNB1 CCNC MED12 ELK1, IRF7
CDK8 (Hs)
44 3 Basal Transcriptional Machinery
Additional Reading
45
conditions, sequential coactivator exchange is more likely to occur. The role of the MED complex in coupling chromatin remodeling and the formation of the basal transcriptional machinery is further fine-tuned by other gene- and tissue-specific coactivators, such as PPARGC1A (proliferator-activated receptor γ, coactivator 1A, Sect. 39.1). (Clinical) Conclusion: The core promoter (TSS) is the most essential region of a gene. Throughout the whole genome on every TSS region the same type of basal transcriptional machinery assembles. The TSS region not only marks the 5’-end of a gene, but its accessibility within chromatin and the activity of Pol II on this region determines if and how much a gene is expressed.
Additional Reading Cramer, P. (2019). Organization and regulation of gene transcription. Nature, 573, 45–54. Haberle, V., & Stark, A. (2018). Eukaryotic core promoters and the functional basis of transcription initiation. Nature Reviews Molecular Cell Biology, 19, 621–637. Soutourina, J. (2018). Transcription regulation by the Mediator complex. Nature Reviews Molecular Cell Biology, 19, 262–274.
Chapter 4
Transcription Factors and Signal Transduction
Abstract In this chapter, we will present transcription factors as the key controllers of gene expression. The activities of these proteins critically influence how a cell functions and responds to environmental perturbations. The most characteristic domain of a transcription factor is its DBD, but the proteins also contain domains for homo- and heterodimerization and for contacts with cofactors and other nuclear proteins. The structural and functional understanding of site-specific transcription factors provides insight how they link to signal transduction and the sensing of intra and extracellular lipophilic molecules via nuclear receptors. Thus, a central characteristic of life, the response to molecules of the extracellular environment, is mediated by signal transduction cascades that mostly start with an extracellular signaling molecule and end with an activated transcription factor, i.e., with a change in gene expression. These principles will be explained at the example of inflammatory responses and the sensing of cellular damage. Keywords DBD · Zinc finger · Helix-turn-helix · Homeodomain · Leucine zipper · Homodimer · Heterodimer · TFBS · Signal transduction · NFκB · Inflammation · p53 · Cellular stress
4.1 Site-Specific Transcription Factors and Their Domains The binding of GTFs, such as TFIID, to TSS regions usually results in low transcriptional activity, i.e., on its own the basal transcriptional machinery does not initiate any substantial mRNA production. In contrast, gene transcription significantly increases when site-specific transcription factors contact their specific DNA binding sequences within enhancers, which are located proximal or distal to the gene’s TSS(s). When both TSS and enhancer are within open, accessible chromatin, the activity of site-specific transcription factors is critical in determining, whether and to what extent a given gene is expressed. Moreover, transcription can also be downregulated by transcription factors with repressive function. The latter interfere with the function and binding capacity of activating transcription factors and thus
© The Author(s), under exclusive license to Springer Nature Switzerland AG 2023 C. Carlberg et al., Molecular Medicine, https://doi.org/10.1007/978-3-031-27133-5_4
47
48
4 Transcription Factors and Signal Transduction
prevent the recruitment of the basal transcriptional machinery or recruit chromatin modifiers that create repressive chromatin structures. In the past, site-specific transcription factors were distinguished into those binding close to TSS regions and others being preferentially associated with distal enhancer or insulator regions. However, genome-wide analyses of TFBSs via ChIP-seq and similar methods (Sect. 10.1) indicate that this distinction is not appropriate. Binding sites of basically all site-specific transcription factors are found in any distance from TSS regions and DNA looping mechanisms allow them to come into close contact with the basal transcriptional machinery, i.e., the linear distance between the TSS and the enhancer is not critical (Fig. 2.1). Nevertheless, the likelihood of a sequencespecific transcription factor to be involved in the control of the transcription of a given gene symmetrically decreases with its distance from the TSS. However, members of the E2F family of site-specific transcription factors are mostly found in core promoter regions, i.e., their binding pattern resembles that of components of the basal transcriptional machinery. A typical transcription factor is composed of multiple domains that allow the functions: • • • •
contacting sequence-specifically DNA dimerizing with other transcription factors being activated via ligands or signal transduction pathways contacting via cofactors and the MED complex the basal transcriptional machinery.
For most transcription factors the DBD and the transactivation domain can be clearly distinguished, while dimerization activity is often attributed to both types of domains. DBDs interact specifically with genomic DNA by recognizing base-specific surface features on the DNA molecule. Hydrogen-bond donor and acceptor groups exposed to the major groove of the DNA are the chemical groups that differ among the four bases (A, T/U, C and G) and permit discrimination between them. Most of the protein-DNA contacts that mediate sequence-specific binding of transcription factors are hydrogen bonds. An exception is the non-polar surface close to the C5 position of pyrimidines, where thymine can be distinguished from cytosine by its bulky methyl group. Protein-DNA contacts are also possible in the minor groove of the DNA, but the hydrogen-bonding patterns mostly do not allow base-specific contacts. Therefore, the dimension of the major groove limits the number of bases that are contacted by the DBD of a site-specific transcription factor to six, i.e., the DNA recognition sequence of a single transcription factor normally is in maximum a hexameric motif. Furthermore, DBDs are rather small protein domains with an average size of 60–90 amino acids. However, only a few of these residues are used to interact with bases in the major groove of the DNA. These amino acids are often stably protruding from the protein surface and show positive (lysine (K) and arginine (R)) or negative (asparagine (N), glutamine (Q) and glutamic acid (E)) charge. Nevertheless, each
4.1 Site-Specific Transcription Factors and Their Domains
49
base pair can be recognized in multiple ways by a transcription factor, i.e., there is no simple amino acid-to-base code. The most common classification of transcription factors is based on the structure of their DBDs (Box 4.1). The major types of DBDs are: • Zinc finger (Fig. 4.1a): A typical zinc finger consists of about 30 amino acid residues, four of which (either four cysteines (Cys4 ) or two cysteines and two histidines (Cys2 His2 )) coordinate a single zinc ion that stabilizes the 3D structure of the small motif. Since the interaction of a single zinc finger with DNA is weak, transcription factors have multiple zinc fingers that cooperatively contact DNA with a significantly enhanced affinity (see the example of CTCF in Sect. 6.3). The precise manner, in which zinc finger proteins bind to DNA, varies a lot and not all zinc fingers contain amino acids that recognize DNA in a sequence-specific way. Moreover, zinc fingers can also serve as RNA-binding motifs. • Helix-turn-helix (Fig. 4.1b): This motif is formed by about 20 amino acids in two short α-helical segments, each 7–9 amino acid residues long that are separated by a β-turn. In order to form a stable structure, the two α-helices have to be supported by other helices of the DBD. One of the two α-helices, the recognition helix, protrudes from the DBD surface, so that it fits into the major groove of the DNA and makes there sequence-specific contacts. • Homeodomain (Fig. 4.1c): This form of a DBD is a subtype of helix-turn-helix motifs. Its name derives from the regulation homeotic genes, such as those of the homeobox (HOX) family, that are critical for body pattern formation during development.
a
b 2
c
Helix-turn-helix
His2)
Homeodomain factors lix
Top view
he
rn tu
α-helix
helix
Zinc atom
helix
β-sheet
helix
turn
Front view
EGR1 (1AAY)
MYB (1H8A)
POU1F1 (1AU7)
Fig. 4.1 Three main classes of DBDs. Representatives of the three main DBD classes, zinc finger (a), helix-turn-helix (b) and homeodomain (c), are displayed in two different orientations. Please note that homeodomains are a subgroup of helix-turn-helix motifs
50
4 Transcription Factors and Signal Transduction
Box 4.1: Secondary Protein Structures The most common secondary protein structures are α-helices and β-sheets. Tight β-turns and loose, flexible loops link α-helices and β-sheets. In contrast, random coil is not a true secondary structure, but it is formed when regular secondary structures are absent. Amino acids have an individual preference to form the one or other secondary structure. Methionine, alanine, leucine, glutamate and lysine are often found in α-helices, while the bulky aromatic side chains of tryptophan, tyrosine and phenylalanine or the branched side chains of isoleucine, valine and threonine prefer to be part of β-strands. Proline and glycine often serve as helix breakers, since they disrupt the regularity of the backbone of α-helices. This classification is useful in uncovering how transcription factors recognize specific DNA sequences and also provides insights into their evolutionary histories. The three DBD classes account for a large part of all human transcription factors. The superfamily of Cys2 His2 -type zinc finger proteins has 675 members and is probably so large, because this structural motif is rather insensitive against mutations happening during evolution. Moreover, zinc finger DBDs can be linked in a sequential manner, in order to extend its capacity to recognize a larger diversity of DNA-binding sites. Moreover, there are some 90 helix-turn-helix transcription factors and some 250 homeodomain transcription factors, for which the DBD provides clues to their function. Furthermore, transcription factors can be distinguished via the domains that they use for protein–protein interactions, such as: • Leucine zipper (Fig. 4.2a): This motif is formed by a pair of amphipathic αhelices carrying a series of hydrophobic amino acid residues on one side that provide with their hydrophobic surfaces the contact between two helices of the dimer. Very often leucine residues occur at every 7th position (please note that the helical repeat of an α-helix is 3.5 amino acids), forming a straight line along the hydrophobic surface. Leucine zipper proteins often have a separate DBD with a high concentration of positively charged amino acids (lysine and arginine) that interact with the negatively charged DNA backbone. • Basic helix-loop-helix (BHLH) (Fig. 4.2b): A conserved region of about 50 amino acid residues is important for both DNA binding and protein dimerization. Two short amphipathic α-helices are linked to a loop of variable length, the helix-loop-helix. DNA binding is mediated by a neighboring short amino acid sequence that is rich in positively charged residues. • β-scaffold factors with minor groove contacts (Fig. 4.2c): Some transcription factors, such as TBP, distort the DNA at their binding site by inserting amino acid side chains between the base pair, partially unwinding the helix and kinking it. The distortion is accomplished through a great amount of surface contact between the protein and the DNA. The transcription factors bind to the negatively charged DNA backbone through positively charged lysine and arginine residues. In case
4.1 Site-Specific Transcription Factors and Their Domains
a
Leucine zipper
b
Basic helix-turn-helix
51
c
β Top view
Leucine zipper domain
Location of Leu side chains
helix
β-sheets
Side view
loop
helix
α-helix
Front view
AP1 (1FOS)
MYOD1 (1MDY)
TBP (1NVP)
Fig. 4.2 Three main classes of protein–protein interaction modes of transcription factors. The DNA interaction of transcription factors is often directed by their mode of dimerization. Representatives of the three main groups, leucine zipper (a), helix-loop-helix (b) and β-scaffold factors with minor groove contacts (c), are displayed in two different orientations
of TBP, the sharp bend in the DNA is produced through projection of four bulky phenylalanine residues into the minor groove. Site-specific transcription factors have been related to a number of human diseases. At present, more than 150 transcription factors are known to be directly responsible for some 300 diseases, but far more transcription factor-disease associations will be identified. Many oncogenes, such as MYC (MYC proto-oncogene, BHLH transcription factor), FOS (FOS proto-oncogene, AP1 transcription factor subunit) or JUN (JUN proto-oncogene, AP1 transcription factor subunit), or tumor suppressor genes, such as TP53, code for transcription factors. Importantly, one third of human developmental disorders are attributed to dysfunctional transcription factor genes and proteins. Furthermore, alterations in the activity and regulatory specificity of transcription factors majorly contribute to the phenotypic diversity of humans. There are approximately 1600 human genes encoding for transcription factors, i.e., some 8% of all protein-coding genes. A classification of transcription factors based on their shared DBDs is provided in Table 4.1. A subset of all transcription factors, such as nuclear factor κB (NFκB) (Sect. 4.4), p53 (Sect. 4.5), JUN/FOS and the nuclear receptors estrogen receptor (ESR) 1 and 2 as well as androgen receptor (AR) (Sect. 5.1), have been most intensively studied. For example, there are more publications on p53, ESR1 and FOS than on the sum of all other transcription factors.
52
4 Transcription Factors and Signal Transduction
Table 4.1 Classification of human transcription factors. This classification is based on information of the database TRANSFAC (www.edgar-wingender.de/huTF_classification.html) #
Superclasses
Classes
I
Basic domains
Basic leucine zipper factors (bZIP) Basic helix-loop-helix factors (bHLH) Basic helix-span-helix factors (bHSH)
II
Zinc-coordinating DBDs
Nuclear receptors with C4 zinc fingers Other C4 zinc finger-type factors C2H2 zinc finger factors C6 zinc cluster factors DM-type intertwined zinc finger factors CXXC zinc finger factors C2HC zinc finger factors C3H zinc finger factors C2CH THAP-type zinc finger factors
III
Helix-turn-helix domains
Homeodomain factors Paired box factors Fork head/winged helix factors Heat shock factors Tryptophan cluster factors TEA domain factors ARID domain factors
IV
Other all-α-helix DBDs
High-mobility group (HMG) domain factors Heterodimeric CCAAT-binding factors
V
α-helix exposed by β-structures
MADS box factors E2-related factors SAND domain factors
VI
Immunoglobulin fold
Rel homology region (RHR) factors STAT domain factors p53 domain factors Runt domain factors T-box factors NDT80 domain factors Grainyhead domain factors
VII
β-Hairpin exposed to an a/b-scaffold
SMAD/NF-1 DNA-binding domain factors GCM domain factors
VIII
β-Sheet binding to DNA
TATA-binding proteins A.T hook factors
IX
β-Barrel DBDs
Cold-shock domain factors
X
Not yet defined DBDs
AXUD/CSRNP domain factors NonO domain factors Leucine-rich repeat flightless-interacting proteins NFX1-type putative zinc finger factors GTF2I domain factors CG-1 domain factors Uncharacterized
4.2 Classification of Transcription Factors
53
Bioinformatic methods for the identification of critical genomic elements, such as TFBSs, are significantly improving in quality when they are “trained” by experimental data. In the past, in vitro approaches, such as gelshift or reporter gene assays, were used to define TFBSs being necessary for both basal transcriptional activity in TSS regions and for cell type-specific, hormonal or environmental transcriptional responses via enhancer regions. However, nowadays most data on transcription factors and their binding sites are obtained by genome-wide approaches, such as ChIP-seq (Sect. 10.2). For example, the de novo motif analysis of sequences below ChIP-seq peak summits provides far more reliable data on the specificity of the DNA recognition of a transcription factor than previous position weight matrix analysis based on DNA sequence comparison (Box 4.2). Therefore, the results of Big Biology projects, such as ENCODE, FANTOM5 or Roadmap Epigenomics, are very important for the systematic analysis of transcription factor binding, locations of histone modifications and other genome-wide features of gene regulation (Sect. 10.1). Box 4.2: Bioinformatic Identification of TFBSs The large size of the human genome (3.05 Gb) and the huge number of site-specific human transcription factor genes (some 1600) can only be handled by the use of bioinformatic methods. Most binding site screening studies take the assumption that transcription factors recognize in vivo the same binding motifs as those identified by in vitro studies. Table 4.2 lists the sequence logos of a number of other important transcription factors. However, any in silico screening tends to overpredict binding sites by a factor of up to 1000 (called the futility theorem). In fact, the vast majority of the predicted binding sites will not be used in vivo although the transcription factor would bind to them in vitro, i.e., in most genomic regions containing a transcription factor consensus binding motif the respective site may not be accessible due to tight chromatin packing. Moreover, DNA methylation of a crucial cytosine within the binding motif can change the affinity for the transcription factor (Sect. 6.3).
4.2 Classification of Transcription Factors The approximately 3200 human transcription factors (encoded by some 1600 genes) can be classified into the following classes (Fig. 4.3): • Constitutively active transcription factors. These transcription factors can be subdivided into two main groups. • Ubiquitous transcription factors. These are a smaller group of site-specific transcription factors that are always located in the nucleus, such as SP1, CEBPs and nuclear factor 1 (NF1). These proteins are primarily involved in the regulation
54
4 Transcription Factors and Signal Transduction
Table 4.2 Sequence logos of key TFBSs
SP1
bits
2
1
1
2
3
4
5 6 7 position
1
2
3
4 5 position
8
9
10
CEBP
bits
2
1
6
7
8
5 6 7 position
8
9
10
8
9
10
9
10
AP1
bits
2
1
1
2
3
4 5 position
1
2
1
2
1
2
3
1
2
3
1
2
3
6
7
NFκB
bits
2
1
3
4
CREB
bits
2
1
3
4 5 6 position
7
8
MYOD
bits
2
1
4
5 6 7 position
POU1F1
bits
2
1
4 5 position
6
7
8
5 6 7 position
8
PPARγRXRα
1
4
2
bits
ERG1
bits
2
1
1
2
3
4
1
2
3
4
5
6
7
8
9
10 11 12 position
13
14
15
16
17
18
19
20
RXRαVDR
bits
2
1
5
6
7
8 9 position
10
11
12
13
14
15
of housekeeping genes, such as structural proteins like actin or metabolic enzymes like glyceraldehyde phosphate dehydrogenase. • Cell type-specific transcription factors. The process of development is critically dependent on sequential waves of cell type-specific transcription factor genes. These are the genes for developmental transcription factors, such as the members of the HOX gene cluster and the helix-loop-helix protein MYOD1 (myoblast determination protein 1) that is central in muscle differentiation. The expression of these transcription factors is mostly limited in time, such as during embryogenesis, but they do not need any additional signals to be active. However, their activity is
4.2 Classification of Transcription Factors
55
a. UBIQUITOUS FACTORS SP1, CEBPs, NF1 I. CONSTITUTIVE (always active) b. CELL TYPE/ DEVELOPMENT SPECIFIC MYOD, GATAs, HNFs, POUs, HOXs
a. ENDOCRINE NUCLEAR RECEPTORS GR, ESRs, PGR, THRs, RARs, VDR
II. REGULATORY (MODULATED VIA SIGNAL) (possible modulation)
b. SENSING INTERNAL SIGNALS PPARs, LXRs, SREBFs, p53 c. NUCLEAR LOCALIZATION ETSs, CREBs, SRF, AP1 CELL MEMBRANE RECEPTOR-ACTIVATED d. LATENT CYTOPLASM FACTORS STATs, SMADs, NFκB, NOTCHs
Fig. 4.3 Functional classification of positive-acting transcription factors. Most transcription factors can be classified by the way of their activation
•
•
•
•
often regulated by posttranslational modifications, such as phosphorylations. The expression of an individual developmental transcription factor is not necessarily tissue-specific, but the combinatorial distribution of multiple of such proteins contributes to cell type determination and differentiation. Signal-dependent transcription factors. These transcription factors (or their precursors) are inactive (or minimally active) until the cell is exposed to an appropriate intra- or extracellular signal. They can be subdivided into four main groups. Endocrine nuclear receptors. Some members of this transcription factor superfamily (Sect. 5.1) can get activated by small lipophilic endocrine ligands, such as cortisol, the steroid hormones estrogen, progesterone and testosterone, the vitamin A and vitamin D derivatives all-trans retinoic acid (RA) and 1α,25dihydroxyvitamin D3 (1,25(OH)2 D3 ), respectively, and the thyroid hormone triiodothyronine (T3 ). Some of these endocrine nuclear receptors settle down on genomic DNA even before they bind their ligand. Transcription factors activated by internal signals. These transcription factors are activated by intracellular signaling molecules. In case of SREBF1 internal sterol concentrations regulate the proteolysis of a membrane protein precursor of SREBF1. Also adopted orphan nuclear receptors, such as peroxisome proliferatoractivated receptor (PPAR) and liver X receptor (LXR) and the sensor for DNA damage, p53, belong to this group. Constitutive transcription factors activated by serine phosphorylation. When small hydrophilic signaling molecules, such as epinephrine, or peptide hormones
56
4 Transcription Factors and Signal Transduction
bind to their respective G-protein coupled receptor (GPR) proteins, intracellular second messengers, such as cAMP, diacylglycerol (DAG) and Ca2+ , trigger serine kinase cascades and phosphorylation of transcription factors. Similarly, the activation of receptor tyrosine kinases (RTKs) by smaller proteins, such as growth factors and cytokines, or the peptide insulin finally also leads to serine kinase cascades and transcription factor activation. Target transcription factors of these pathways are, e.g., ETS family members, JUN and FOS forming the dimeric transcription factor activator protein (AP1), cAMP response element-binding protein (CREB1) and serum response factor (SRF). Also well-known kinases, such as the cAMP-dependent protein kinase (PRK) A and MAPK, take place in the signaling process. • Latent cytoplasmic factors. Characteristic for these types of transcription factors is that they are initially located in the cytoplasma in an inactive form until they get activated by signaling transduction pathways originating from membrane receptors. The activated transcription factor can then translocate to the nucleus. Latent cytoplasmic transcription factors, such as SMADs (Sma- and Mad-related proteins), STAT (signal transducer and activator of transcription), NFκB and NOTCH (Notch receptor). Like for most other proteins involved in signal transduction, also transcription factors are not highly expressed. The effect of a single transcription factor molecule is amplified by creating many mRNA copies of its target genes, i.e., there is no need for a high number of them per cell. Moreover, the low expression level for transcription factor genes allows an easier triggering of a regulatory event by altering transcription factor concentrations or activity. Nevertheless, the number of transcription factors range from approximately 100 molecules per cell for a highly specific proteins regulating only a few target genes up to more than 100,000 per cell for ubiquitous factors being involved in the control of most genes, such as SP1.
4.3 Activation of Transcription Factors The activation of membrane receptors by hydrophilic signaling molecules leads either to the stimulation of a kinase signaling pathway resulting in the phosphorylation of target transcription factors, such as CREB1, AP1, ETS and others (Fig. 4.4, left), or in the activation of latent transcription factors (Fig. 4.4, right). Transcription factors are called latent, when they are activated through their translocation from the cytoplasma to the nucleus. Latent transcription factors are involved in a number of critical signal transduction pathways, the most important of which are: • SMAD pathway. The family of transforming growth factor β (TGFβ) contains about 30 structurally related growth and differentiation factors that include TGFβs, activins, nodal and bone morphogenetic proteins (BMPs). TGFβ family members activate cells via a complex of two types of serine-threonine kinase membrane
4.3 Activation of Transcription Factors
57
Signaling molecule or event
Cellular membrane
Cytoplasma
Membrane receptor Kinase Direct activation of latent TFs
Latent TF NFAT, NFκB, NOTCHs SMADs, STATs
Activation by kinase signaling cascade P P
CREB family members, AP1, ETSs
P P
Target gene
TSS
Nucleus
Target gene
TSS
Fig. 4.4 Activation of transcription factors by membrane receptor signaling pathways. There are two major pathways, how activated membrane receptors can activate transcription factors. Either they stimulate kinase signaling cascades that result in phosphorylation of various resident nuclear transcription factors in the nucleus (left), or they induce the translocation of latent transcription factor from the cytoplasma to the nucleus (right)
receptors. Ligand binding to this complex induces phosphorylation and activation of type I receptors by type II receptors that leads to the activation of SMAD transcription factors and their translocation to the nucleus. BMPs phosphorylate the effector SMADs SMAD1, SMAD5, SMAD8 and SMAD9, while SMAD2 and SMAD3 are phosphorylated in response to activin and nodal. SMAD4 and SMAD10 are cofactors of the effector SMADs, while SMAD6 and SMAD7 block SMAD4 binding, i.e., they are negative regulators. SMADs form heterodimeric complexes with partner transcription factors, in which the partner primarily mediates the DNA contact and the SMADs the transactivation. The specificity of SMADs in response to different ligands is related to the selection for their heterodimeric partner proteins. • STAT pathway. Some 20 different cytokines activate via their membrane receptors Janus kinases (JAKs) that phosphorylate the ligand-bound receptor and the associated STAT transcription factor at tyrosines. Phosphorylated STATs translocate into the nucleus and bind as dimers to their genomic binding sites. There are seven different STATs forming a number of homo- and heterodimeric complexes that differ in the cytokine mediating their activation. STATs can also be activated by RTKs, like epidermal growth factor receptor (EGFR), by non-RTKs, such
58
•
•
•
•
•
4 Transcription Factors and Signal Transduction
as SRC (SRC proto-oncogene, non-receptor tyrosine kinase) and ABL1 (ABL proto-oncogene 1, non-receptor tyrosine kinase) as well as through GPRs. NFκB pathway. The five members of the NFκB transcription factor family are activated by a variety of extracellular products, most of which are related to inflammation, such as tumor necrosis factor (TNF), interleukin (IL) 1β, growth factors, infections by bacteria and viruses, oxidative stress and a number of synthetic compounds. More details about this pathway will be provided in Sect. 4.4. Hedgehog pathway. Hedgehog is a lipid-anchored cell surface ligand that binds to the patched receptor (PTCH), relieving PTCH-mediated inhibition of the GPR Smoothened. Smoothened signaling leads to activation of the transcription factor GLI family zinc finger (GLI). The PTCH gene is also a target of GLI, forming a negative feedback loop. Wingless-type (WNT) pathway. The more than 30 members of the WNT (wingless-type MMTV integration site family member) family act as ligands to receptors of the Frizzled family. The first intracellular step in WNT signaling is a phosphorylation of the protein dishevelled segment polarity protein (DVL) through GPR activation induced by WNT-Frizzled interaction that inhibits the kinase glycogen synthase kinase 3 (GSK3). GSK3 controls a proteolytic cascade that prevents nuclear accumulation of the cofactor protein CTNNB1 (catenin β1). When WNT binds Frizzled, activated DVL blocks the GSK3 phosphorylation and subsequent the proteolysis of CTNNB1. Cytoplasmic CTNNB1 levels rise, the protein enters the nucleus, where it participates in gene activation via binding to the transcription factor TCF7L2 (transcription factor 7-like 2, also named TCF4). NOTCH pathway. The NOTCH signaling pathway is essential for proper embryonic development. The four NOTCH proteins are single-pass receptors that are activated by the Delta, Delta-like and Jagged ligands. Interaction with these ligands leads to proteolytic cleavage of NOTCH so that the NOTCH intracellular domain (NICD) is liberated from the cellular membrane. NICD translocates to the nucleus, where it forms a heterodimer with the helix-loop-helix transcription factor RBPJ (recombination signal-binding protein for immunoglobulin kappa J region L). Through interaction with NICD, RBPJ changes its interacting cofactors from a corepressor-histone deacetylase (HDAC) complex to a coactivator-HAT complex that then leads to the activation of NOTCH target genes. Nuclear factor activated T cells (NFAT) pathway. The family of NFAT transcription factors shows homology with those of the NFκB family, but their members are differently regulated. Cytoplasmic NFAT is heavily phosphorylated in resting immune cells, but activation of the T cell receptor (TCR) results in fluctuations of the internal concentrations of the second messenger Ca2+ in a cyclical fashion. Ca2+ activates the phosphatase calcineurin, resulting in dephosphorylation of NFAT and the accumulation of the transcription factor in the nucleus. NFAT is a rather weak DNA-binding protein that in most cases needs the support of other transcription factors, such as AP1.
4.4 Inflammatory Signaling via NFκB
59
4.4 Inflammatory Signaling via NFκB The five members of the NFκB family, REL (REL proto-oncogene, NFκB subunit) A (also called p65), RELB, REL, NFκB1 (also called p50) and NFκB2 (also called p52) are defined by the amino-terminal REL-homology domain that mediates DNA binding and homo- and heterodimerization (Fig. 4.5). The proteins p50 and p52 are obtained from their respective precursors p105 and p100. RELA, RELB and REL contain a carboxy-terminal transactivation domain. The dimeric NFκB complexes are retained in the cytoplasma by proteins called inhibitors of NFκB (IκBs). The three principal IκBs, IκBα, IκBβ and IκBγ, mask the conserved nuclear localization sequence (NLS) of the NFκB family members. For the activation and translocation of NFκB different types of IκB kinases (IKKs) phosphorylate IκBs that leads to their degradation. In contrast, p50 and p52 homodimers often evade regulation by IκBs. They are found constitutively in the nucleus and interact there with the IκB family member BCL3 that acts as a coactivator. NFκB target genes control numerous cellular processes, ranging from apoptosis, adhesion, proliferation, innate immune responses including inflammation, stress responses to tissue remodeling. However, in most cases the respective genes not only responsive to NFκB, but are also targets to a number of other transcription factors and signal transduction pathways. Thus, the outcome of NFκB activation depends very much on the cellular context. The most frequently observed way of NFκB activation is the classical pathway that is induced in response to inflammatory stimuli, such as the cytokines TNF and IL1β, or exposure to bacteria-specific molecules, such as lipopolysaccharide (LPS) (Fig. 4.5, left). In this pathway IκBα is rapidly phosphorylated, ubiquitinated and degraded at the proteasome. IκB phosphorylation is due to IKK-complex activation that consists of the catalytic subunits IKK1 and 2 and the regulatory subunit of NEMO (NFκB essential modifier). The key step in NFκB signaling is the activation of NEMO. Interestingly, NEMO often locates in the nucleus, where it “senses” via sumoylation and phosphorylation genotoxic stress and translocates then to the cytoplasm, where it activates NFκB. In contrast, some stimuli for NFκB activation, such as CD40LG (cluster of differentiation 40 ligand) and LT (lymphotoxin) A, activate the alternative pathway (Fig. 4.5, right). This pathway is characterized by the activation of IKK1 by the NFκB inducing kinase (NIK) leading to the formation of p52 from p100. p52-RELB heterodimers have a higher affinity for distinct NFκBbinding sites and regulate a distinct subset of NFκB target genes. Once a dimeric NFκB complex is bound to its target sequences in the nucleus, the posttranslational modification of its subunits, such as phosphorylation of RelA, defines its interaction with either coactivators or corepressors. This then leads to either target gene activation or repression. Macrophages are the central mediators of the inflammatory response as they sense via Toll-like receptors (TLRs) the presence of pathogen-associated patterns, such as LPS and other molecules of specific microbial origin. The transcription factor program in response to LPS provides insight into the transcriptional control of inflammation. As a result of the activation of many different transcription factors, the
60
4 Transcription Factors and Signal Transduction
Classical pathway
Alternative pathway
Bacterial and viral proteins Antigen-receptor interaction
Hypoxia Hydrogen-peroxide stimulation
TNFSF13B, CD40LG, LTA
TNF, IL1β
P
NEMO
P Ub
Ub
IκBα
Ub
Ub Ub
Ub
Ub
Ub
P
P
p50
IKKα IKKα
RELB 26S Proteasome
NEMO P P IKKα IKKβ
NIK
P P
Ub
Ub
IKKα IKKβ
Cellular membrane
p100 P
P
P
P
IKKα IKKα
p65 P P
IκBα Ub Ub
P
p50
RELB
p65
P
p100 P
P
p50
Nucleus
p52 RELB
p65
Cytoplasma
Fig. 4.5 Pathways leading to the activation of NFκB. The induction of the classical NFκB activating pathway by TNF, IL1β and many other immune-related stimuli is mostly mediated by IKK activation. This results in the phosphorylation (P) of IκBα, its ubiquitynation (Ub) and subsequent proteosomal degradation. Release of the NFκB complex allows the p50-p65 heterodimer to translocate to the nucleus. Genotoxic stress can cause IKK-dependent activation of NFκB. The alternative pathway represents the activation of IκBα by NIK, followed by phosphorylation of the p100 NFκB subunit by IKK1. This causes processing of p100 to p52 in the proteosome and leads to the activation of p52-RelB heterodimers targeting distinct genomic NFκB-binding sites. TNFSF13B, TNF superfamily member 13B
transcriptome of macrophages significantly changes within the first hours after LPS stimulation. Three classes of transcription factors are the primary mediators of this transcriptional response (Fig. 4.6): • In class I are constitutively expressed transcription factors that are activated by signal-dependent posttranslational modifications, such as NFκB, interferon regulatory factors (IRFs) and CREB1 mediating the primary response to LPS. Positive feed-forward mechanisms via the production of TNF are crucial for autocrine signaling and induction of a second wave of sustained NFκB activation. • Class II contains approximately 50 transcription factors that are synthesized de novo after LPS stimulation, such as CEBPδ and activating transcription factor 3 (ATF3). These transcription factors induce subsequent gene expression waves over a prolonged period of time, since their regulation is often subjected to positive feedback control being mostly following transcriptional auto-regulation.
4.4 Inflammatory Signaling via NFκB
61
LPS
TLR4
Cellular membrane
ATF3
Cytoplasma
CLASS II
CEBPδ
Secondary TFs IRF NFκB CLASS I Primary TFs Secondary target genes
Primary target TF genes
CEBPβ 2. Secondary response (2-8 h) Primary target genes
1. Primary response (0.5-2 h) Nucleus
CLASS III
SPI1 RUNX1
IRF8 Macrophagespecific genes
3. Chromatin remodeling
Fig. 4.6 Primary and secondary LPS-responding genes are regulated by three classes of transcription factors. Class I contains transcription factors that are activated directly by TLR signaling, such as NFκB and IRF proteins. Class II transcription factors, such as CEBPδ and ATF3, have class III transcription factors, such as SPI1, CEBPδ, RUNX1 and IRF8, as their targets. The latter category is not a direct target of LPS but induced during macrophage differentiation
• The expression of class III transcription factors is induced during macrophage differentiation, such as SPI1 (spleen focus forming virus proviral integration oncogene, also called PU.1), CEBPβ, RUNX1 (runt-related transcription factor 1) and IRF8. Their combinatorial expression determines the detailed phenotype of the macrophages. The class III transcription factors activate constitutively expressed genes, remodel chromatin structure at genomic loci of inducible genes and silence genes that are critical for alternative cell stages. The transcription factors of these three classes do not function independently, but act coordinately in the control of LPS-induced transcriptional response of macrophages. A transcriptional network that consists of transcription factors NFκB, the repressor ATF3 and the pioneer transcription factor CEBPδ mediates the sustained expression of several inflammatory genes. This also illustrates how NFκB is able to play a major role in the specific regulation of inflammatory gene expression. Furthermore, the latter critically depends on cofactor proteins. For example, corepressor complexes contain HDACs and other proteins with activities for inhibiting
62
4 Transcription Factors and Signal Transduction
gene expression. The stimulus-dependent dissociation of these proteins from regulatory genomic regions of inflammatory genes is known as de-repression. Furthermore, many nuclear receptors, such as glucocorticoid receptor (GR), LXR, vitamin D receptor (VDR) and PPARs, have an antiinflammatory profile that is mediated largely via the inhibition of NFκB and AP1 activation. Most mechanisms of the repression of NFκB involve direct interactions between NFκB and nuclear receptor proteins. This leads to blocking of NFκB proteins, so that they do not activate their target genes (Fig. 4.7). The interaction of nuclear receptors with NFκB target genes can have also a number of other effects, such as the recruitment of HDACs or the inhibition of Pol II phosphorylation. However, there are also indirect mechanisms, such as induction of NFKBIA gene expression and competition for coactivators, such as EP300 (E1A-binding protein p300, also called KAT3B) and CREB-binding protein (CREBBP, also called KAT3A) (Sect. 7.2). Interestingly, a number of these mechanisms are not specific for the interaction of NFκB with nuclear receptors, but apply as well for the interference with p53 or JUN kinase signaling.
a
c
b
IκBα
RELA
EP300
Ligand NFκB1
RELA
EP300 IRF3
IRF3
NFκB target
IκBα
IRF target
NFκB RE
NR RE
d
IRF RE
e
f
IRF3 P-TEFb
HDAC2 ac
RELA
RELA NFκB1
P
NFκB target NFκB RE
NFκB1
RELA
NFκB target
NFκB RE
NFκB target NFκB RE
Pol II
Fig. 4.7 Crosstalk between the NFκB and nuclear receptor signaling. Nuclear receptors repress the NFκB pathway via multiple mechanisms. Some pathways of nuclear receptor-mediated repression are indirect and involve either induction of NFKBIA expression (a) or competition for coactivator proteins, such as CREBBP and EP300 (b). However, most mechanisms involve the direct interaction of the nuclear receptor with NFκB and are referred to as trans-repression. Direct interaction with nuclear receptors can result in blocking of NFκB. This inhibits the IRF3-dependent regulatory region that uses the NFκB subunit RELA as a coactivator (c). Conversely, interaction of nuclear receptors with RELA prevents IRF3 from acting as a coactivator at some NFκB-regulated genomic regions (d). RELA-dependent recruitment of nuclear receptors to regulatory regions can lead to transcriptional repression by other mechanisms, such as inhibition of Pol II phosphorylation (P) by the positive transcription elongation factor (P-TEFb) (e) or recruitment of HDACs (f). NR = nuclear receptor, RE = response element
4.5 Sensing Cellular Stress via P53
63
4.5 Sensing Cellular Stress via P53 The main sensor of cellular stress, such as DNA damage, is the transcription factor p53. The TP53 gene encodes for the p53 protein. The gene is a tumor suppressor gene (Sect. 26.1), because its damage leads to severely reduced protection against cancer. The p53 protein is named by its apparent molecular weight and in humans is composed of 393 amino acids that are subdivided into seven domains (Fig. 4.8A): • • • • • •
amino-terminal transactivation domain 1 (residues 1–42) transactivation domain 2 (residues 43–63) proline-rich domain important for the apoptotic activity (residues 64–92) central DBD containing a zinc finger (residues 102–292) NLS (residues 316–325), oligomerization domain (residues 307–355) carboxy-terminal domain important for downregulation of DNA binding (residues 356–393).
p53 is a unique transcription factor, since it binds as a tetramer to two copies of the consensus sequence RRRCWWGYYYYYYYYYYYY with 10 intervening nucleotides (Fig. 4.8b and c). A large set of different proteins are involved in the p53 pathway (Fig. 4.9). Many cellular forms of stress, such as hypoxia, telomere shortening, mitotic spindle damage, unfolded proteins, heat or cold shock, nutritional deprivation as well as improper ribosomal biogenesis, can induce the p53 pathway. Some of these signals can lead to cancer. The different stress signals are detected by various proteins that mediate the information about cellular damage via posttranslational modifications of the p53 protein or its negative regulator MDM2 (MDM2 proto-oncogene, E3 ubiquitin protein ligase). MDM2 blocks the transcriptional activity of p53 by a direct contact and leads to the degradation of the protein. Following a stress signal, MDM2 polyubiquitinates itself resulting in its degradation. This increases p53’s half-life from minutes to hours. Depending on the interaction with other signal transduction pathways, the activation of p53 can lead either to cell-cycle arrest (Sect. 26.2), senescence (Box 30.1) or apoptosis (Sect. 19.4). The cell-cycle arrest permits cellular repair, reverse of damage and cell survival, while the two other processes lead to cellular death. p53 mediates activation as well as repression of its target genes, mostly via direct sequence-specific binding of p53 to their regulatory genomic regions. Through direct protein–protein contacts p53 interacts with GTFs, such as TBP, TAF6 and TAF9, as well as with HATs, such as CREBBP, EP300 and KAT2B (Sect. 7.2), or via the repressor protein SIN3A (SIN3 transcription regulator family member A) with HDACs. Moreover, some of these protein–protein inter-
64
4 Transcription Factors and Signal Transduction
a
NLS 42 63 92
1 I
II
III
SH3 Transactivation Pro-rich
b
393
292 325 355 IV DBD
V
VI
VII
Oligomerization Regulatory
DBD
Transactivation
Transactivation
Oligomerization domain
Transactivation Transactivation
DBD
c
DNA
Fig. 4.8 Structure of p53. The principal structure of the human p53 protein with its seven subdomains is schematically depicted (a). Model of the p53 tetramer (b). The two different shades of gray refer to interacting p53 homodimers. The model is based on the folded, stable human oligomerization domain (1OLG, highlighted by a gray circle), the p53 DBD (2AC0) and the X. laevis transactivation domain (1YCQ). The disordered domains are represented by lines connecting the domains. DNA-bound p53 tetramer (c)
4.5 Sensing Cellular Stress via P53
Hypoxia
65
UV radiation
Oncogenic activation
Chemotherapy
Cellular membrane
Cytoplasma Ub
External signals
Ub Ub Ub
Ub Ub
ATR P
E2F1
P
ATM
26S Proteasome
P
P
CDKN2A
P
CDKN2A MDM2
P
CSNK2A1
PRKDC
P
Degraded p53
P
p53 targets
MDM2 MDM2
Nucleus
Apoptosis
Cell cycle arrest
Senescence
DNA repair
Fig. 4.9 The p53 pathway. Cells undergo stress that activates signal mediator proteins leading to phosphorylation of p53 or inhibition of p53 ubiquitynation by MDM2. The half-life of p53 increases in the following from minutes to hours. The p53 tetramer recognizes its genomic binding sites controlling p53 target genes, one of which is MDM2. The tumor suppression function of p53 is mediated by genes controlling DNA repair, apoptosis, senescence and cell-cycle arrest. ATM = ATM serine/threonine kinase, ATR = ATR serine/threonine kinase, CDKN2A = cyclin-dependent kinase inhibitor 2A, CSNK2A1 = casein kinase 2α 1, PRKDC = protein kinase, DNA-activated, catalytic subunit
actions involve other transcriptions factors, such as SP1, CEBPα and AP1 that are then squelched, i.e., inactivated. p53 gets excessively posttranslationally modified via phosphorylation, methylation and acetylation. This alters the stability of the protein and thus its DNA-binding affinity. (Clinical) Conclusion: Transcription factors bind sequence-specifically to genomic DNA and are often the endpoints of signal transduction cascades. In this way, intra- and extracellular signals to cells are translated to activities of enhancer regions and in changes of gene expression. Therefore, in health and disease transcription factors play a key role in most physiological processes, such as inflammation, differentiation and cancer.
66
4 Transcription Factors and Signal Transduction
Additional Reading Lambert, S. A., Jolma, A., Campitelli, L. F., Das, P. K., Yin, Y., Albu, M., Chen, X., Taipale, J., Hughes, T. R., & Weirauch, M. T. (2018). The human transcription factors. Cell, 172, 650–665. Marazzi, I., Greenbaum, B. D., Low, D. H. P., & Guccione, E. (2018). Chromatin dependencies in cancer and inflammation. Nature Reviews Molecular Cell Biology, 19, 245–261. Stadhouders, R., Filion, G. J., & Graf, T. (2019). Transcription factors and 3D genome conformation in cell-fate decisions. Nature, 569, 345–354.
Chapter 5
A Key Transcription Factor Family: Nuclear Receptors
Abstract In this chapter, a highly interesting family of ligand-inducible transcription factors, referred to as nuclear receptors, will be presented. Nuclear receptors serve since some 30 years as paradigms for many functional and structural aspects of transcription factors, such as the interaction with coactivator and corepressor proteins. Many of the 48 human members of the largest family of transcription factors in metazoans have the unique property to be specifically activated by small lipophilic ligands in the size of cholesterol (approximately 400 Da). Some of these ligands are known as endocrine hormones, such as estradiol and testosterone, while others are metabolites of dietary compounds, such as fatty acids and cholesterol. Both types of lipids are of large physiological impact in health and disease, such as metabolic control and the modulation of immunity. This made nuclear receptors especially attractive for both basic and applied research. Keywords Nuclear receptor · Superfamily · DNA binding · Res · Dimerization · Ligand-binding domain · Ligand-binding pocket · Transactivation · Repression · Coactivator · Corepressor · Physiological function · Metabolic control · Immunity · Nutrient sensor
5.1 The Nuclear Receptor Superfamily Many signals to which a cell is exposed to, such as growth factors, cytokines and other hydrophilic signaling molecules, cannot pass the cellular membrane. Therefore, these signaling molecules need to interact with a membrane receptor, in order to stimulate a signal transduction cascade that eventually leads to the activation of a transcription factor. In contrast, lipophilic signaling molecules, such as steroid hormones, have more straightforward signal transduction pathways, since these compounds can pass cellular membranes and bind directly to a transcription factor that is often already located in the nucleus (Fig. 5.1). Therefore, these transcription factors are called nuclear receptors. Some nuclear receptors, such as GR or AR, wait in the cytoplasma for the arrival of their specific ligands, while most other nuclear receptors reside already in the © The Author(s), under exclusive license to Springer Nature Switzerland AG 2023 C. Carlberg et al., Molecular Medicine, https://doi.org/10.1007/978-3-031-27133-5_5
67
68
5 A Key Transcription Factor Family: Nuclear Receptors
Extracellular ligands
Growth factors, peptide hormones, cytokines
Intracellular ligand Metabolized or de novo synthesized in the cell
Membrane receptor NR dimer
Cytoplasma
HSP Ribosome Signal transduction pathways
NR-HSP complex NR partner receptor
Cellular membrane
Protein mRNA
Nuclear pore
Changed cellular function
Post-translational e.g. phosphorylation
Co-factors mRNA
P
Co-factors
Pol II
Pol II
Genomic DNA NUCLEUS Nucleus
RE
Nuclear envelope
TATA TSS Primary target gene
Fig. 5.1 Principles of nuclear receptor signaling. Nuclear receptors (NRs) reside either in the cytoplasma (e.g., AR and GR) in a complex with chaperone proteins, such as HSP, or are already located in the nucleus (like most nuclear receptors), when they are activated through the binding of their specific lipophilic ligand. The ligand is either of extracellular origin and has passed the cellular membrane or is a metabolite that was synthesized inside of the cell. Cytoplasmic nuclear receptors dissociate then from their chaperones and translocate to the nucleus, where they bind to their genomic binding sites also called responsive elements (REs) in the vicinity of their target genes. Ligand-activated nuclear receptors interact with cofactors that build a bridge to the basal transcriptional machinery with Pol II in its core. This leads then to changes in the mRNA and protein expression of these target genes
nucleus and get activated there (Fig. 5.1). Nuclear receptors locating in the cytoplasm, yet in the absence of their specific ligand, are complexed with chaperones, such as heat shock proteins (HSPs). The dissociation of these chaperones after ligand binding allows the translocation of the transcription factors into the nucleus. Nuclear receptors bind as homo- or heterodimers to their specific genomic binding sides, often referred to as REs, in enhancer regions being located within the same TAD as the TSS regions of their primary target genes. Ligand-activated nuclear receptors preferentially interact with coactivator proteins that then together with proteins of the MED complex build a protein bridge to the basal transcriptional machinery (Sect. 3.4). This transactivation process leads to expression changes in the respective primary nuclear receptor target genes and eventually into changes of cellular functions. The straightforward signal transduction process of nuclear receptors can interfere with other signaling pathways that start at membrane receptors. This often
5.1 The Nuclear Receptor Superfamily
69
results in the posttranslational modification of nuclear receptors or their coactivators, i.e., nuclear receptors are directly or indirectly also sensitive to membrane signaling pathways. The members of the nuclear receptor superfamily are defined by their very conserved DBD. In humans there are 48 protein-coding genes for nuclear receptors, 12 of which belong to the subfamily of endocrine receptors (Fig. 5.2). These nuclear receptors have been identified, when one was looking for receptors of the already well-characterized hormones, such as the steroids testosterone, estradiol, progesterone, cortisol and aldosterone, the vitamin derivatives all-trans RA, 1,25(OH)2 D3 and the thyroid hormone T3 . All these lipophilic hormones circulate in the serum at low nanomolar concentrations and, accordingly, their specific nuclear receptors bind them with Kd -values in the same nanomolar range. Interestingly, testosterone, progesterone, cortisol, aldosterone and 1,25(OH)2 D3 have each only one specific receptor, estrogens and T3 have two receptor isoforms (α and β) and for all-trans RA there are even three receptor subtypes (α, β and γ). When the 36 remaining members of the nuclear receptor superfamily were cloned, they were termed “orphans”, because instantly their ligand was not known. For some of these orphan nuclear receptors natural or xenobiotic compounds have been identified as ligands and the receptors were termed “adopted orphans”. Interestingly, the
Human nuclear receptors
Endocrine receptors
AR (NR3C4) MR (NR3C2) RARγ (NR1B3)
ESR1 (NR3A1) PGR (NR3C3) THRα (NR1A1)
ESR2 (NR3A2) RARα (NR1B1) THRβ (NR1A2)
GR (NR3C1) RARβ (NR1B2) VDR (NR1I1)
Adopted orphan receptors
CAR (NR1I3) FXR (NR1H4) LXRα (NR1H3) PPARα (NR1C1) REV-ERBα (NR1D1) RORγ (NR1F3) SF1 (NR5A1)
ERRα (NR3B1) HNFα (NR2A1) LXRβ (NR1H2) PPARδ (NR1C2) REV-ERBβ (NR1D2) RXRα (NR2B1) TR2 (NR2C1)
ERRβ (NR3B2) HNFγ (NR2A2) NGFI-B (NR4A1) PPARγ (NR1C3) RORα (NR1F1) RXRβ (NR2B2) TR4 (NR2C2)
ERRγ (NR3B3) LRH-1 (NR5A2) NURR1 (NR4A2) PXR (NR1I2) RORβ (NR1F2) RXRγ (NR2B3)
Orphan receptors
COUP-TF1 (NR2F1) GCNF (NR6A1) TLX (NR2E2)
COUP-TF2 (NR2F2) NOR1 (NR4A3)
DAX1 (NR0B1) PNR (NR2E3)
EAR2 (NR2F6) SHP (NR0B2)
Fig. 5.2 The nuclear receptor superfamily. The 48 human members of the nuclear receptor superfamily are divided into three classes based on their nature and affinity for their ligand. The members of the family are defined by a highly conserved DBD. Please note that the receptors DAX and SHP lack a DBD
70
5 A Key Transcription Factor Family: Nuclear Receptors
natural ligands of adopted orphan receptors are all dietary lipids and their derivatives, such as bile acids for the farnesoid X receptor (FXR), oxysterols for LXRs, fatty acids for PPARs and 9-cis RA for retinoid X receptors (RXRs). Also for these receptors the Kd -values for their ligands were found to be in the same concentration range as the circulating concentrations, which, however, are in part in the low millimolar range. Thus, some nuclear receptors represent true sensors for micro- and macronutrients. In contrast, other nuclear receptors, such as HNF (hepatocyte nuclear factor) 4α and 4γ, LRH-1 (liver receptor homolog-1), REV-ERB (Reverse-Erb) α and β, ROR (RAR-related orphan receptor) α, β and γ as well as SF1 (steroidogenic factor 1), bind nutrient derivatives like fatty acids, phospholipids, heme and sterols, but this interaction is constitutive and does not represent any sensing process. Simple eukaryotes, such as fungi, do not have genes encoding for nuclear receptors. It is assumed that the first nuclear receptors were orphans developing in metazoans as environmental sensors for nutritional compounds and toxins. In contrast, endocrine receptors are a rather recent evolutionary development. In this way, the three classes of the nuclear receptor superfamily (Fig. 5.2) represent the different stages of the family’s evolutionary development. This implies that true orphan receptors have a too small ligand-binding pocket to harbor a ligand. Thus, they function like regular transcription factors and are activated by posttranslational modifications.
5.2 Molecular Interactions of Nuclear Receptors Nuclear receptors show three principal types of molecular interactions that are protein-DNA, protein-protein and protein-ligand (Fig. 5.3). These interactions are mediated by two major domains, a DBD and a ligand-binding domain (LBD) comprising transactivation function. The DBD is formed by 66–70 highly conserved amino acids that form two Cys4 -type zinc fingers (Sect. 4.1). In contrast, the LBD is built by a structurally conserved 3-layer sandwich composed of 11–13 α-helices that are arranged around an internal cavity, the ligand-binding pocket. The DBD and the LBD are connected by a non-conserved hinge region. In addition, all nuclear receptors contain a low conserved amino-terminal domain of very variable length (20–450 amino acids) that may serve for posttranslational modifications in ligand-independent activation pathways and for direct association with partner proteins. Only a few members of the nuclear receptor superfamily, such LRH-1 and RORs, have already as a monomer sufficient affinity for DNA. Therefore, most nuclear receptors have to interact with a partner receptor, in order to bind DNA. The dimerization partner is often the same type of receptor (e.g., in the case of all steroid receptors), so that the resulting complex is a homodimer. However, for 14 members of the nuclear receptor superfamily (RARs, THRs, VDR, FXR, LXRs, PPARs, constitutive androstane receptor (CAR) and pregnane X receptor (PXR), Fig. 5.2) the preferential coreceptor is RXR, i.e., they form heterodimers. Consecutively, nuclear
5.2 Molecular Interactions of Nuclear Receptors
71
Receptor dimerization Ligand-binding domain (LBD)
Position of Helix 12
Ligand binding
Co-factor binding (transactivation) DNA-binding domain (DBD) DNA binding
Response element (RE)
Fig. 5.3 Different molecular interactions of a nuclear receptor. Nuclear receptors are performing three types of molecular interactions. With their DBD they specifically contact DNA, with the inner surface of their LBD, the ligand-binding pocket, they bind their specific ligand and with the outer surface of their LBD they interact with partner nuclear receptors and cofactor proteins. DBD-DBD interactions direct the specificity of nuclear receptor dimers for their distinct REs. Ligand binding induces a conformational change within the LBD primarily affecting the most carboxy-terminal α-helix, helix 12. In this changed conformation the LBD has a significantly higher affinity for coactivator proteins. This ligand-induced protein-protein interaction is the core transactivation mechanism of nuclear receptors
receptors REs are two copies of the hexameric motif AGGTCA oriented as direct repeats (DRs), everted repeats or inverted repeats (Box 5.1). Box 5.1: DNA Specificity of Nuclear Receptors The DBD of nuclear receptors contains 66–70 highly conserved amino acids being composed of two zinc-finger loops and a pair of α-helices (Fig. 5.4). One of these helices mediates sequence-specific recognition of the sequence AGGTCA via typical major groove contacts. Due to the high sequence conservation of the DBD within the nuclear receptor superfamily, individual receptor specificity and RE diversity is generated by the distance and relative orientation of the two AGGTCA sites. Homodimeric steroid receptor complexes prefer inverted repeats with 0 or 3 base pairs spacing, while for RXR heterodimer complexes the preferred orientation of the hexameric sequence motif is a head-to-tail DR arrangements
72
5 A Key Transcription Factor Family: Nuclear Receptors
PPAR-RXR
a
RXR-VDR
b
PPAR
RXR
c
RXR-THR THR
VDR
RXR
Side view
RXR
Front view
Fig. 5.4 Binding of RXR heterodimers to DR-type REs. Heterodimeric DBD complexes of RXR with PPAR on a DR1-type RE (a), with VDR on a DR3-type RE (b) and with THR on a DR4-type RE (c) are displayed in two different orientations
with 1–5 intervening base pairs (DR1–DR5). The pattern of RE selectivity is based on the spacing of DRs and is referred to as the “1-to-5 rule”. According to this rule, heterodimers of PPAR-RXR prefer DR1-type, VDR-RXR DR3-type, THR-RXR DR4-type and RAR-RXR DR5-type REs. In these heterodimeric complexes RXR binds to the 5’-motif on all DR-type REs besides DR1. The correct recognition of REs is directed by steric constrains of the interacting DBDs of RXR and its heterodimeric partners. Here the helical repeat of the DNA, 10.5 base pairs/turn, has to be taken into account. In DR3- and DR1-type REs the DBDs are considerably tiled against each other (Fig. 5.4a and b), while in DR4- and DR5-type REs the DBDs of RXR and THR or RAR, respectively, are positioned to the same side of the DNA (Fig. 5.4c). In contrast, the nuclear receptors for steroids, such as GR, AR, mineralocorticoid receptor (MR) and progesterone receptor (PGR), form homodimers on two copies of AGAACA motifs in an inverted repeat orientation. The here described example of dimerizing nuclear receptors and the specific structure of their REs can be transferred to other transcription factors, i.e., it is a general principle that most transcription factors act as dimers. Monomeric transcription factor DBDs often recognize within the major groove of the DNA 3–6 base pairs in a sequence-specific way. Depending on the interaction of the DBDs of the dimerizing transcription factors, the individual binding motifs may be spaced by up to 5 base pairs. This explains why the identified length of TFBSs is 6–17 base pairs. In cases,
5.2 Molecular Interactions of Nuclear Receptors
73
where a transcription factor has multiple DBDs, such as CTCF (Sect. 6.3), or forms even tetrameric complexes, such as p53 (Sect. 4.5), these binding sites can even be longer. The comparison of the crystal structures of the LBDs of the orphan receptor NOR1 (neuron-derived orphan receptor 1), the endocrine receptor VDR and the adopted orphan receptor PXR makes the structural conservation of this domain clearly visible (Fig. 5.5a). The lower part of each LBDs is more flexible than the top part and leaves space for an internal cavity, the ligand-binding pocket, of variant volume. Orphan nuclear receptors, such as NOR1 (Fig. 5.5a, left), lack this open space and thus are not able to bind any ligand, i.e., they are true orphans. The ligandbinding pocket of endocrine nuclear receptors, such as VDR (Fig. 5.5a, central), has a moderate volume of 300–700 Å3 . For comparison, the volume of nuclear receptor ligands is in the order of 250–400 Å3 (Fig. 5.5b) that roughly corresponds to their molecular weight of 260–600 Da (Fig. 5.5c). They fill the ligand-binding pockets of endocrine nuclear receptors by 60-80%. This explains why most of the 12 endocrine nuclear receptors bind specifically only one natural ligand and this with high affinity. In contrast, adopted orphan nuclear receptors, such as PXR (Fig. 5.5a, right), have a far larger ligand-binding pocket of a volume of up to 1400 Å3 . Since the ligands of adopted orphan nuclear receptors are not larger than those of endocrine receptors, they fill the ligand-binding pocket only to 25–50%. For this reason adopted orphan nuclear receptors associate with their ligands with far lower affinity than endocrine receptors and often bind a larger variety of ligands. However, typical ligands of adopted orphan nuclear receptors are intermediates or end-points of lipid metabolism pathways. Some of them, such as fatty acids and cholesterol, have steady state concentrations in the micro- to millimolar range. Therefore, there was no need of their respective nuclear receptors to evolve a more specific ligand-binding pocket. The binding of a specific ligand to amino acids within the ligand-binding pocket of a nuclear receptor results in a number of positional changes of α-helices of the LBD that affect also its outer surface. In case of endocrine nuclear receptors such conformational changes are visible via a reorientation of helix 12 (red in Fig. 5.6a). Like a mouse-trap the helix flips its position after ligand binding. However, in the absence of a ligand, corepressor proteins efficiently associate with the LBD, but in its changed position helix 12 prevents this interaction and favors a contact with coactivator proteins. In this way, ligand binding changes the profile of interacting partner proteins and consequently also the function of the LBD. Figure 5.6b illustrates a 3-step transactivation process that is valid for nuclear receptors residing in the nucleus. In the absence of a ligand or in the presence of an antagonist, the DNA-bound dimeric nuclear receptor complex interacts with corepressor proteins, such as NCOR (nuclear receptor corepressor) 1 or 2. The nuclear receptor is connected via these corepressors with a multiprotein complex that contains chromatin modifiers, such as HDACs. The action of these nuclear enzymes leads to local chromatin condensation, i.e., the nuclear receptor target genes do not get transcribed. The binding of an agonistic ligand to the nuclear receptor LBD leads to the dissociation of corepressor proteins and in turn to the association of coactivators, such as members of the nuclear receptor coactivator (NCOA) family. These
74
5 A Key Transcription Factor Family: Nuclear Receptors
a
Adopted orphan receptors 700-1400 Å3 PXR
c
0 30 0 40 0 50 0 60 0 70 0
20
10 0
Molecular weight (g/mol)
0 70
0
0
50
60
0
0
30
40
0 10
0
Estradiol Progesterone Testosterone Cortisol Aldosterone Ecdysone 1,25(OH)2D3 Thyroid hormone All-trans RA 9-cis RA Prostaglandin J2
0
van der Waals volume (Å3) 20
b
Endocrine receptors 300-700 Å3 VDR
0
True orphan receptors 0 Å3 NOR1
Estradiol Progesterone Testosterone Cortisol Aldosterone Ecdysone 1,25(OH)2D3 Thyroid hormone All-trans RA 9-cis RA Prostaglandin J2
Fig. 5.5 The volume of ligand-binding pockets of nuclear receptors and their ligands. On the first view the LBDs of the true orphan receptor NOR1 (left), the endocrine receptor VDR (center) and the adopted orphan receptor PXR (right) appear very similar (a). However, NOR1 has no ligand-binding pocket, while that of adopted orphan receptors in average has the double size compared to endocrine receptors. This explains the variability of adopted orphan in ligand affinities. For comparison, the volume (b) and the molecular weight (c) of important nuclear receptor ligands are indicated. The vertical red lines mark the average
coactivator proteins are connected with multiprotein complexes that are composed of chromatin modifiers, such as HATs, leading to local chromatin decondensation. This process is also called de-repression. Furthermore, the local opening of chromatin is an essential but not a sufficient condition for the initiation of gene transcription. In the last step, coactivator proteins with HAT activity are replaced by components of the MED complex building a bridge to the basal transcriptional machinery that has assembled on the TSS region of the target gene (Sect. 3.4). This then leads to the activation of Pol II and gene transcription, i.e., the production of respective mRNA
5.2 Molecular Interactions of Nuclear Receptors
75
b
a
Co-repression complex HDAC3 TBL1XR1 TBL1X
NCOR2 (CoR)
KIF11 KDM4A ZBTB33 CORO2A NCOR1/2
REPRESSION
INACTIVE
absence of ligand or presence of an antagonist Helix 12
RE
Derepression
TATA
primary target gene
Co-activation complex Chromatin remodeling
LBD
KAT5 KAT2A KAT2B SWI/SNF EP300 KMTs complex complex NCOAs CARM1
INITIATION
LIMITED ACTIVATION
presence of an agonist Ac
Me
Me
Me Ac
RE
NCOA1 (CoA) Deactivation
Helix 12
TATA
Ac
primary target gene
Mediator and pre-initiation complex General transcription TFIIF factors MED1/Mediator TFIIJ complex TAFs
ACTIVATION
TFIIA TFIIB
TFIIE TFIIH
Pol II Ac
LBD
Me
Ac
Ac
TBP
Me
Me
Me Ac
Ac
RE
TATA
Ac
ACTIVE
Me
Ac
primary target gene
Fig. 5.6 Interaction of nuclear receptors with cofactors. A solvent excluded surface (Connolly surface) representation of a nuclear receptor LBD in the absence (top) and presence (bottom) of a ligand (a). The ligand-induced conformational change primarily affects helix 12 (red) that is the most carboxy-terminal α-helix of the LBD. In the absence of ligand helix 12 is in a position that allows a corepressor protein (represented by the receptor interaction domain of NCOR2, green) to interact with the LBD, while in the presence of ligand only the binding of a coactivator protein (receptor interaction domain of NCOA1, orange) is possible. The 3-step transactivation process of nuclear receptors is shown in context of a target gene (b). In the absence of a ligand the DNA-bound dimeric nuclear receptor complex is connected via corepressor proteins with a multiprotein complex with chromatin modifying activity that leads to local condensation of chromatin and repression of the target gene (top). Following the binding of an agonistic ligand the LBD of nuclear receptors is dissociating from corepressors and associating with coactivators that connect with a multiprotein complex having chromatin decondensation activity (center). The ligand-activated nuclear receptor is changing to another type of coactivator being a subunit of the MED complex (bottom). In this way, the basal transcriptional machinery and Pol II are activated and finally mRNA transcription starts. CORO2A = coronin 2A, KIF11 = kinesin family member 11, TBL1X = transducin β-like 1 X-linked, TBL1XR1 = TBL1X receptor 1, ZBTB33 = zinc finger and BTB domain containing 33
molecules. Taking all tissues and cell types together, nuclear receptors can have more than 1000 target genes (Box 5.2). Box 5.2: Genome-Wide Nuclear Receptor Analysis Different NGS methods, such as ChIP-seq, which were intensively used by the ENCODE
76
5 A Key Transcription Factor Family: Nuclear Receptors
project (Sect. 10.1), have also been applied for the genome-wide analysis of the action of nuclear receptors. The total sum of binding sites for an individual nuclear receptor, referred to as its cistrome, collectively for multiple tissues can exceed 20,000 loci. Moreover, transcriptome-wide methods, such as RNA-seq, identified in the sum of all tissues more than 1,000 primary target genes for most nuclear receptors or their specific ligands. Not all of these binding sites and target genes are equally important, but their huge numbers indicate that nuclear receptors and their ligands are involved in the control of more physiological processes than formerly assumed. On many, if not on all of their genomic binding sites nuclear receptors colocate with other transcription factors, such as SPI1, FOXA1 or NFκB, that either work as pioneer factors (Sect. 8.2) to open the local chromatin structure or to interact with other signal transduction pathways, of which these proteins are the end points (Sect. 4.3). In addition, nuclear receptors do not directly contact DNA on all of their genomic binding sites but can sometimes act as cofactors to other DNA-binding transcription factors (Sect. 10.3). Although nuclear receptor signaling is per se independent from other signaling pathways that start at the cellular membrane, there are many occasions for an interference of both signal processes. Like any other cellular protein, nuclear receptors and their cofactors can be posttranslationally modified by phosphorylation, acetylation, methylation and ubiquitynation (Sect. 7.1). The origins of these modifications are classical signal transduction pathways starting at cellular membrane. For example, members of the NCOA family are extensively posttranslationally modified.
5.3 Nuclear Receptors as Nutrient Sensors Nuclear receptors and their ligands play an important role in the maintenance of homeostasis of the body that represents “health”. The evolutionary oldest and likely still the most important role of nuclear receptors is the regulation of metabolism. There is an interrelationship of lipid metabolism (supplemented by micro- and macronutrients taken up by diet), metabolites and their converting enzymes, such as cytochrome P450s (CYPs), transporters and key representatives of the nuclear receptor superfamily. There are many examples (RAR, CAR, PXR, PPAR, VDR, LXR and FXR, differently color-coded in Fig. 5.7), where a metabolite activates a nuclear receptor, which in turn regulates the expression of the enzyme or transporter handling the metabolite. Nuclear receptor-controlled CYP enzymes have also a central role in ligand inactivation and clearance. These triangle regulatory circuits are found at several critical positions in lipid metabolism pathways and allow a fine-tuned control on metabolite concentrations and thus nuclear receptor activity. This suggests that dietary metabolites are ancestral precursors of
5.3 Nuclear Receptors as Nutrient Sensors
77
ESR Flavonoids
PXR Vitamin E and K Flavonoids
all-trans RA
RAR
RXR
Micronutrients
Xenobiotics
CYP26
CAR
PXR
ABCA1, G1, G5, G8 CYP3A CYP2B
LXR
Diet CYP4A
Macronutrients
PPAR
ABCB4, D2, D4
CYP3A CYP2B
Fatty Acids
1,25(OH) D
VDR
7-Dehydrocholesterol
Cholesterol
CYP24A1
Cholesterol
Steroids
SHR
CYP7A1
Bile acids
Lanosterol
CYP27B1
Steroid hormone NRs
Acetyl-CoA Isoprenoids
ABCB1, C2, C3
Oxysterols
PXR
VDR
CYP3A4
FXR
CYP7A1 CYP8B1 ABCB11
De novo synthesis
Fig. 5.7 Triangle regulatory circuits of nuclear receptors, their ligands and metabolite handling enzymes and transporters. The interrelationship between micro- and macronutrient metabolism involves enzymes, transporters and nuclear receptors. Only a selected number of metabolites and proteins are shown. There are many examples of triangle relationships (differently color-coded), in which the metabolite regulates its nuclear receptor, the receptor the expression of the metabolite converting enzyme and the enzyme the metabolite levels
endocrine signaling molecules, such as steroid hormones. In turn this emphasizes a nutrigenomics principle that diet is not only a supply for energy but has also important signaling function (Sect. 36.4). An immediate implication that followed from understanding the function of nuclear receptors is their potential as therapeutic targets. In fact, nuclear receptor targeting drugs are widely used and commercially successful. For example, bexarotene and alitretinoin (RXRs), fibrates (PPARα) and thiazolidinediones (PPARγ) are already approved drugs for treating cancer, hyperlipidemia and T2D, respectively. The nuclear receptor ESR1 belongs to the top 3 of the most studied transcription factors, mainly because of its role in the estrogen-dependent growth of breast cancer cells (Sect. 27.4). Other nuclear receptor ligands, such as the physiologically active vitamin A and vitamin D metabolites all-trans RA and 1,25(OH)2 D3 as well as their synthetic analogs, are known for their role in inducing cellular differentiation, e.g., of monocytes and peripheral nerval cells. This emphasizes the role of nuclear receptors in the control of cellular growth and differentiation. Moreover, synthetic GR agonists are very effective in the treatment of local and systemic inflammations and also other nuclear receptors, such as PPARs, LXRs and VDR, have an antiinflammatory potential. This supports the concept that nuclear receptors also play an important role in the control of the immune system (Sect. 5.5). Moreover, FXR and LXR agonists are in development for treating non-alcoholic fatty liver disease (NAFLD) and preventing atherosclerosis (Sect. 5.4). However,
78
5 A Key Transcription Factor Family: Nuclear Receptors
natural nuclear receptor ligands that are taken up by healthy diet may avoid drug treatment.
5.4 Integration of Lipid Metabolism by PPARs, LXRs and FXR The different steps in handling fatty acids, such as their resorption in the intestine, metabolism in the liver, oxidation in active tissues and collection of their excess for long-term storage in adipose tissue, is coordinated by the three members of the PPAR family (Fig. 5.2). PPARs are activated by various fatty acids and their derivatives, such as polyunsaturated fatty acids (PUFAs), eicosanoids and oxidized phospholipids. Each PPAR subtype has unique functions, which is based on its distinct tissue distribution. PPARα is expressed predominantly in the liver, heart and kidney. PPARδ is ubiquitously expressed but has most important functions in skeletal muscle (Sect. 35.5), liver and heart. PPARγ is highly expressed in adipose tissue and acts there both as a master regulator of adipogenesis (Sect. 39.2) and a potent modulator of lipid metabolism and insulin sensitivity (Sect. 40.2). Due to alternative splicing and differential promoter usage, there are two PPARγ isoforms, of which PPARγ1 is expressed in many tissues, while the expression of PPARγ2 is restricted to adipose tissue. During fasting or starvation, PPARα is the primary regulator of the adaptive response in the liver (Fig. 5.8a). This receptor senses the reversed flux of fatty acids and activates a gene network to oxidize fatty acids, in order to generate energy in liver and muscle and to convert fatty acids into a usable energy source, such as ketone bodies during starvation. PPARα is also the molecular target of fibrates, which are widely used drugs that reduce serum triglyceride levels through increased fatty acid β-oxidation. In addition, PPARα stimulates the production and secretion of fibroblast growth factor (FGF) 21. The hepatokine acts as a stress signal to other tissues, in order to adapt to an energy-deprived state in case of fasting. After a meal, PPARα and PPARδ are sensing increasing fatty acid efflux from the liver and start to manage lipid metabolism via the promotion of fatty acid β-oxidation and ATP production in mitochondria of skeletal muscles and the heart. Thus, fatty acids stimulate their own breakdown. PPARα, PPARδ and PPARγ interfere with the transcription factors NFκB and AP1 in macrophages, endothelial cells, epithelial cells and other tissues, causing the attenuation of proinflammatory signaling by decreasing the expression of proinflammatory cytokines, chemokines and cell adhesion molecules (Fig. 5.8b). For example, PPARα and PPARδ neutralize the p65 subunit of NFκB and inhibit in this way the expression of NFκB-controlled cytokines, such as TNF, IL1β and IL6. Thus, PPARs are involved in the control of inflammation (Sect. 4.4). PPARδ decreases serum triglyceride levels, prevents high-fat diet-induced obesity and increases insulin sensitivity through the regulation of genes encoding fatty acid
5.4 Integration of Lipid Metabolism by PPARs, LXRs and FXR
a
79
b Acetyl-CoA
β/δ
α
ATP
α Acetyl-CoA
Fatty acids ATP
Fatty acids
α β/δ γ
α
β/δ
α γ2
Acetyl-CoA
Triacylglycerols Fatty acids
Adipogenesis
α Insulin sensitivity
β/δ
Macrophages and other cells
β/δ
α
NFκB AP1
TNF, IL6, CCL2 and VCAM
ATP
c
Osteoblast activity
α β/δ
Fatty acids
Glucose
γ β/δ
Terminal
Osteoclast activity
Fig. 5.8 Physiological roles of PPARs. PPARα regulates the expression of enzymes that lead to the mobilization of stored fatty acids in adipose tissue and of fatty acid catabolizing enzymes in the liver, heart and kidney (a). PPARδ (also called PPARβ in rodents) is expressed at high levels in the intestine where it mediates the induction of terminal differentiation of epithelium. Activating PPARδ or PPARγ can increase insulin sensitivity. PPARδ regulates the expression of fatty acid catabolizing enzymes in skeletal muscle where released fatty acids are oxidized to generate ATP. PPARγ promotes the differentiation of adipocytes. PPARα, PPARδ and PPARγ can interfere with the transcription factors NFκB and AP1 causing the attenuation of proinflammatory signaling (b). All tree PPAR subtypes also act in bone (c)
metabolizing enzymes in skeletal muscle and genes encoding for lipogenic proteins in the liver. Moreover, PPARδ increases serum HDL (high-density lipoprotein)cholesterol levels via stimulating the expression of the reverse cholesterol transporter ABC (ATP-binding cassette) A1 and APO (apolipoprotein) A1, which are specific for cholesterol efflux (Sect. 41.2). Moreover, the activation of PPARα and PPARδ promotes osteoblast activity in bone, whereas the activation of PPARγ leads to osteoclast stimulation (Fig. 5.8c). In adipose tissue, PPARγ controls glucose uptake via regulating the expression of the SLC2A4 gene (encoding for the glucose transporter GLUT4). Furthermore, PPARγ together with FGF1 mediates adipose tissue remodeling for maintaining metabolic homeostasis during famine. Since high concentrations of circulating fatty acids can cause insulin resistance (Sect. 40.2), enhanced uptake of fatty acids in
80
5 A Key Transcription Factor Family: Nuclear Receptors
adipose tissue, the stimulation of the secretion of adiponectin and the inhibition of resistin production via PPARγ improve the condition of the disease. Thus, activating PPARs by specific synthetic ligands (glitazones) can inhibit obesityrelated insulin resistance. However, the increased uptake of fatty acids as well as the enhanced adipogenic capacity in white adipose tissue (WAT) after PPARγ activation is responsible for thiazolidinedione-associated weight gain. Moreover, the thiazolidinedione rosiglitazone was found to increase the risk of heart failure, myocardial infarction and CVD, leading to restricted access in the United States and a market withdrawal in Europe. Nevertheless, the activation PPARγ via its natural ligands, such as PUFAs taken up by healthy diet, may be sufficient. LXRs and FXR are sensors for the cholesterol derivatives oxysterols and bile acids, respectively. These nuclear receptors do not only regulate cholesterol and bile acid metabolism but also have a central role in the integration of sterol, fatty acid and glucose metabolism. LXRα is expressed in tissues with a high metabolic activity, such as liver, WAT and macrophages, whereas LXRβ is found ubiquitously. LXRs, similarly to PPARs, have a large hydrophobic ligand-binding pocket that can bind to a variety of different ligands, such as the oxysterols 24(S)-hydroxycholesterol, 25-hydroxycholesterol, 22(R)-hydroxycholesterol and 24(S),25-epoxycholesterol, at their physiological concentrations. FXR is expressed mainly in the liver, intestine, kidney and adrenal glands. Bile acids, such as chenodeoxycholic acid and cholic acid, are endogenous FXR ligands, but the molecules can also activate the nuclear receptors PXR, CAR and VDR. LXR is known best for its ability to promote reverse cholesterol transport (Sects. 38.2 and 40.2), i.e., cholesterol delivery from the periphery to the liver for excretion (Fig. 5.9, see also Figs. 37.3 and 41.3). This clinically very important process involves the transfer of cholesterol to APOA1 and pre-β HDLs via the transporter protein ABCA1, which is encoded by one of the most prominent LXR target genes. Further important LXR targets are ABCG1 and ABCA1 that promote cholesterol efflux from macrophages and the intracellular trafficking protein ARL4C (ADP-ribosylation factor-like 4C) that facilitates cholesterol delivery to the cellular membrane. LXR also downregulates the gene encoding for the low-density lipoprotein (LDL) receptor (LDLR) and upregulates the IDOL (inducible degrader of LDLR) gene. Thus, activation of LXR attenuates LDL uptake by macrophages counteracting the pathogenesis of atherosclerosis (Sect. 41.2). In the liver, LXR induces the expression of a cluster of apolipoprotein genes including APOE, APOC1, APOC2 and APOC4, which are involved in lipid transport (Sect. 41.3) and catabolism. LXR also upregulates genes encoding for lipid remodeling proteins, such as PLTP (phospholipid transfer protein), CETP (cholesterol ester transfer protein) and LPL (lipoprotein lipase) (Fig. 5.9). Furthermore, LXR induces the expression of several genes that mediate the elongation and the desaturation of fatty acids, which leads to synthesis of long-chain PUFAs, such as ω-3 fatty acids. This increase in long-chain PUFAs results in decreased expression of NFκB target genes via epigenetic silencing of their regulatory regions. Long-chain PUFAs also function as substrates for the enzymes that synthesize eicosanoids and other specialized inflammation-resolving lipid mediators, such as resolvins and protectins
5.4 Integration of Lipid Metabolism by PPARs, LXRs and FXR
81
Liver WAT
Lipogenesis Conversion to bile acids CYP7A1
SREBF1 FASN ACC SCD1
VLDL
Cholesterol
Fatty acid oxidation
LPL
Fatty acids
Triacylglycerols
APOE
Mitochondria (β-oxidation)
APOD THRSP
Bile acids
VLDL GLUT4
Glucose uptake
HDL
APOAI
Pre-β HDL
ABCA1
Reverse cholesterol transport
ABCG1 ARL7
Absorption
ABCG5 ABCG8
Cholesterol
IDOL LDL Macrophage (peripheral tissue)
LDLR
Intestine
Fig. 5.9 Effects of LXR on metabolism. LXR has effects on multiple metabolic pathways. In macrophages, LXR induces the expression of the genes IDOL, ARL7 and ABCG1. In the liver, LXR promotes fatty acid synthesis via induction of the transcription factor SREBF1 and its target genes FASN, ACC and SCD1. Triglyceride-rich very low-density lipoproteins (VLDLs) in the liver serve as transporters for lipids to peripheral tissues, including adipose tissue, where the action of LPL liberates fatty acids from VLDLs. In adipose tissue, LXR regulates the expression of APOD and THRSP and promotes fatty acid β-oxidation and glucose uptake via induction of SLC2A4. Finally, in the intestine, LXR inhibits cholesterol absorption by inducing the expression of the ABCG5-ABCG8 complex
(Sect. 38.1). Furthermore, LXR induces the gene for the enzyme LPCAT3 (lysophospholipid acyltransferase 3) mediating the synthesis of phospholipids containing long-chain PUFAs. Thus, LXR activation decreases ER stress and inflammatory responses (Sect. 38.3). A major function of LXR in the liver is the promotion of de novo biosynthesis of fatty acids through the stimulation of the transcription factor SREBF1 and the enzymes FASN (fatty acid synthase), ACC (acetyl-CoA carboxylase) and SCD1 (steroyl-CoA desaturase 1). Some of these fatty acids are esterified with cholesterol, in order to avoid toxic levels of free cholesterol. In the intestine, LXR induces the expression of genes encoding the transporters ABCG5 and ABCG8 that mediate the apical efflux of cholesterol from enterocytes. In adipose tissue, LXR also affects glucose metabolism via the stimulation of GLUT4 expression. In this tissue, LXR regulates the expression of lipid-binding and metabolic proteins, such as APOD and THRSP (thyroid hormone responsive) and increases fatty acid β-oxidation.
82
5 A Key Transcription Factor Family: Nuclear Receptors
FXR often acts in a complementary or reciprocal way to LXR in the control of lipid metabolism. Since high bile acid concentrations are toxic to cells, a central function for FXR is to control these levels. Bile acids are cholesterol derivatives that facilitate the efficient digestion and absorption of lipids and lipid-soluble vitamins after a meal, but they represent also the major way to eliminate cholesterol from the body. Nevertheless, most bile acids are recycled via enterohepatic circulation, i.e., they pass from the intestine back to the liver. FXR controls this bile acid flux via modulating their synthesis, modification, absorption and uptake. In the liver, FXR inhibits bile acid synthesis by repressing the expression of the genes CYP7A1 and CYP8B1. FXR stimulates the secretion of FGF19 from the intestine, which then activates FGFR4 (FGF receptor 4) in the liver and in this way provides a complementary mechanism for the feedback inhibition of bile acid synthesis. In the gall bladder, FXR upregulates the expression of the enzymes SLC27A7 (bile acid-CoA synthase) and BAAT (bile acid-CoA-amino acid N-acetyltransferase), which catalyze the conjugation of bile acid with the amino acids taurine or glycine and that of the bile salt export pumps ABCB11 and ABCB4. In the intestine, FXR inhibits the absorption of bile salts via the downregulation of the apical sodiumdependent bile salt transporter SLC10A2 and promotes the movement of bile salts from the apical to the basolateral membrane of enterocytes via the upregulation of the FABP6 (ileal fatty acid-binding protein) gene. FXR limits hepatic bile salt levels by the downregulation of the bile acid transporters solute carrier organic anion transporters (SLCOs) A1 and A2. Furthermore, in order to protect the liver from toxicity, FXR induces the expression of the enzymes CYP3A4 and CYP3A11, which hydroxylate bile acids, as well as SULT2A1 (sulfotransferase family 2A, member 1) and UGT2B4 (UDP glucuronosyltransferase 2 family, polypeptide B4), which sulphate and glucuronidate bile acids, respectively. In addition, in the liver FXR reduces lipogenesis via the repression of the SREBF1 and FASN gene expression, i.e., the receptor decreases triglyceride levels. Finally, FXR also influences hepatic carbohydrate metabolism and inhibits gluconeogenesis via the downregulation of G6PC (glucose-6-phosphatase) and PCK (phosphoenolpyruvate carboxykinase) 2. Thus, FXR is an important regulator of lipid metabolism.
5.5 Coordination of the Immune Response by VDR The immune system is composed by a multitude of highly specialized cells that are all created by a differentiation process of blood cells, referred to as hematopoiesis (Sects. 11.4 and 14.3). In general, cellular differentiation is controlled by epigenetic mechanisms, in which a number of developmental transcription factors play a key role (Sect. 11.3). Cells of the immune system have a rapid turnover and are therefore able to show a maximal adaptive response to environmental changes. Lipid sensing and signaling via nuclear receptors has an important role in the differentiation and subtype specification of immune cells, such as T cells, macrophages and dendritic cells (DC). Importantly, these cells are very mobile and are found in a
5.5 Coordination of the Immune Response by VDR
83
wide range of subtypes nearly everywhere in our body. This also applies to metabolic tissues and disease scenarios, such as obesity (Sect. 39.1). Thus, macrophages and DCs as well as their precursors, monocytes, coordinate metabolic, inflammatory and general stress-response pathways via changes of their transcriptome profile and respective subtype specification. Nuclear receptors, such as VDR, RAR, LXR and PPAR, have central functions in sensing these endogenous and exogenous stimuli as well as in adapting the respective gene expression profiles of immune cells. As a representative of all micro- and macronutrient-sensing nuclear receptors, in the following we will focus on VDR and its ligand 1,25(OH)2 D3 . Vitamin D3 and its most abundant metabolite, 25-hydroxyvitamin D3 (25(OH)D3 ), either derive from diet, such as fatty fish, or from endogenous production of vitamin D3 in response to ultraviolet (UV)-B exposure of the skin. Since vitamin D3 and its metabolites can be stored in adipose tissue, there are rather seasonal than daily variations in the vitamin D status of our body. Worldwide more than one billion people are vitamin D deficient, i.e., their 25(OH)D3 serum levels are below 50 nM. Bone malformations, such as rickets and osteomalacia, are extreme examples of the effects of vitamin D deficiency. Since vitamin D is involved in a broad range of physiological processes, it can increase the risk for various diseases and the susceptibility for infectious diseases, such as tuberculosis (Sect. 20.3) and COVID-19 (coronavirus disease 2019, Sect. 21.4). Moreover, living at higher latitudes, i.e., in geographic regions of significant seasonal variations of UV-B exposure, increases the risk of the autoimmune diseases T1D, multiple sclerosis (MS) and Crohn’s disease (Sect. 23.4). VDR is expressed in all important cell types of the immune system, i.e., these cells are sensitive to changes in 25(OH)D3 serum levels. Importantly, macrophages and DCs express the enzyme CYP27B1 that converts 25(OH)D3 into the VDR ligand 1,25(OH)2 D3 , i.e., in these cells, vitamin D can act autocrine or paracrine (Fig. 5.10). Interestingly, while CYP27B1 expression in the kidneys is negatively regulated by a number of signals, such as Ca2+ , parathyroid hormone, phosphate and 1,25(OH)2 D3 , antigen-presenting cells do not respond to these inhibitory signals but rather further upregulate CYP27B1 expression after stimulation with cytokines and TLR ligands. TLRs and other pattern-recognition receptors (PRRs, Sect. 15.1) detect pathogens on the surface of macrophages and initiate an immune response, e.g., against the intracellular bacterium M. tuberculosis (Sect. 20.3). In macrophages, the TLR-triggered increased expression of VDR target genes encoding for antimicrobial peptides, such as CAMP (cathelicidin) and DEFB4 (defensin, β4A), efficiently kill intracellular M. tuberculosis (Fig. 5.10). This vitamin D-dependent antimicrobial mechanism can explain, why sun or artificial UV–B exposure are efficient in the supportive treatment of tuberculosis. Vitamin D deficiency is associated with more aggressive tuberculosis, some variations of the VDR gene increase the susceptibility to M. tuberculosis infection. Furthermore, humans with dark skin living distant from the equator have an increased susceptibility to tuberculosis infection. Vitamin D-induced cytokine production of T cells and monocytes modulate CAMP expression. Thus, the availability of the micronutrient vitamin D is essential for an appropriate response to infections. Like many other nuclear receptors, VDR can antagonize, via trans-repression of transcription factors, such as NFAT, AP1
84
5 A Key Transcription Factor Family: Nuclear Receptors
SKIN
7-Dehydro cholesterol
Dietary intake Vitamin D2 and D3
Vitamin D3
Antigen presentation / T-cell function
Antibacterial activity Liver
VDR
1α,25-dihydroxy vitamin D3
CYP27B1
Paracrine
Autocrine
25-hydroxy vitamin D3
CYP27B1
VDR Monocyte/ macrophage
DC
TH
CYP27B1 Autocrine 25-hydroxy Autocrine vitamin D3
DC
VDR
Au to c
TH
cr
in
e
Kidney do
Neutrophil
En
CYP27B1 VDR
Epithelial cell trophoblast decidua
rin
e
?
CYP27B1 VDR
CAMP DEFB4
Endocrine
1α,25-dihydroxy vitamin D3
Endocrine
VDR
TH
Fig. 5.10 Innate and adaptive immune responses to vitamin D. Macrophages and DCs express the vitamin D-activating enzyme CYP27B1 and VDR can then utilize 25(OH)D3 for autocrine and paracrine responses via localized conversion to active 1,25(OH)2 D3 . In monocytes and macrophages, this promotes the response to infection via the antibacterial peptides CAMP and DEFB4. 1,25(OH)2 D3 inhibits DC maturation and modulates T helper (TH ) cell function. Intracrine immune effects of 25(OH)D3 may also occur in CYP27B1/VDR-expressing epithelial cells. In contrast, most other cells, such as TH cells and neutrophils, depend on the circulating levels of 1,25(OH)2 D3 that are synthesized by the kidneys, i.e., they are endocrine targets of 1,25(OH)2 D3
and NFκB, the inflammatory response of immune cells. The resulting decreased expression of cytokines, such as IL2 and IL12, demonstrates the antiinflammatory potential of vitamin D metabolites. Interestingly, VDR is a key transcription factor in the differentiation of myeloid progenitors into monocytes and macrophages (Sect. 20.1). In contrast, in DCs vitamin D inhibits differentiation, maturation and immuno-stimulatory capacity via the repression of the genes encoding for the different variants of major histocompatibility complex (MHC) (Sect. 18.3) and its costimulatory molecules CD40, CD80, CD86 and the upregulation of inhibitory molecules, such as CCL22 (chemokine C-C motif ligand 22) and IL10. This tolerogenic (i.e., immune tolerance inducing) phenotype of DCs is associated with the induction of regulatory T (TREG ) cells (Fig. 5.10) (Sect. 22.1).
Additional Reading
85
(Clinical) Conclusion: Nuclear receptors represent a very important superfamily of transcription factors that mediate the gene regulatory effects of steroid hormones (estrogen, testosterone, progesterone and cortisol), vitamins (vitamin A and vitamin D) as well as macronutrients and their derivatives (PUFAs, oxysterols and bile acids) with their target genes. In this way, nuclear receptors have key roles in a large number of physiological processes, such as reproduction, differentiation, immunity and metabolism.
Additional Reading Challet, E. (2019). The circadian regulation of food intake. Nature Reviews Endocrinology, 15, 393–405. Dhiman, V. K., Bolt, M. J., & White, K. P. (2018). Nuclear receptors in cancer—Uncovering new and evolving roles through genomic analysis. Nature Reviews Genetics, 19, 160–174. Greco, C. M., & Sassone-Corsi, P. (2019). Circadian blueprint of metabolic pathways in the brain. Nature Reviews Neuroscience, 20, 71–82. Reinke, H., & Asher, G. (2019). Crosstalk between metabolism and circadian clocks. Nature Reviews Molecular Cell Biology, 20, 227–241.
Chapter 6
DNA Methylation
Abstract In this chapter, the best-understood epigenetic mark, cytosine methylation of genomic DNA, will be introduced. DNA methylation is performed by DNA methyltransferases (DNMTs) and primarily result in 5-methylcytosine (5mC) within CpGs. It is a prominent epigenetic mechanisms, which has an impact on genome stability, gene expression and development. In most cases, DNA methylation leads to the formation of heterochromatin and subsequent gene silencing. Coordinated DNA methylation and its recognition via methylation-sensitive DNA-binding proteins have a large impact on health, such as genetic imprinting, i.e., the expression of a gene in a parent-of-origin-specific manner. In contrast, aberrant DNA methylation is a wellestablished marker of diseases, such as cancer. This can lead to the inactivation of tumor suppressor genes, a disturbance in genomic imprinting and genomic instabilities through reduced heterochromatin formation on repetitive sequences. In addition, we will learn about the main function of the transcription factor CTCF which mediates intra- and interchromosomal contacts. In this way, CTCF stabilizes 3D complexes of chromatin loops. CTCF-mediated loops at some 100 developmentally regulated loci provide a mechanistic explanation of genomic imprinting in health. Keywords DNA methylation · CpG islands · DNMTs · TET proteins · 5mC modifications · Gene silencing · Insulator · CTCF · Genetic imprinting · Imprinting disorders · Hypermethylation in cancer
6.1 Cytosines and Their Methylation The identity of each of the at least 400 human tissues and cell types is based on their respective unique gene expression patterns, which in turn are determined by differences in their epigenomes. For the proper function of tissues, it is essential that cells memorize their respective epigenetic status and pass it to daughter cells when they are proliferating. The main mechanism for this long-term epigenetic memory is the methylation of genomic DNA, in order to yield 5mC preferentially within CpGs. Since CpGs are the only dinucleotides that can be symmetrically methylated, they are
© The Author(s), under exclusive license to Springer Nature Switzerland AG 2023 C. Carlberg et al., Molecular Medicine, https://doi.org/10.1007/978-3-031-27133-5_6
87
88
6 DNA Methylation
the exclusive methylation marks that remain after DNA replication on both daughter strands. The average CG base pair percentage of the human genome is 42% (Fig. 6.1). In principle, each cytosine can shift into 5mC, but those of CpGs are functionally most important, in particular, if they occur in clusters. However, less than 10% of all CpGs are found in genomic regions of at least 200 base pairs in length with a CG density of more than 55%. These regions are referred to as CpG islands. The human genome contains approximately 28,000 CpG islands. Interestingly, many of the 20,000 protein-coding genes have a CpG island close to their TSS. In fact, genes are distinguished into those with and without CpG islands in the vicinity of their promoters (Sect. 3.3). Interestingly, actively transcribed gene bodies carry both 5mC and 5-hydroxymethylcytosine (5hmC) marks, whereas active promoters are unmethylated. Most of CpGs remain methylated during development, but CpG islands located close to the TSS regions of housekeeping or developmentally regulated genes have a very low methylation status. Interestingly, a C to T transition at the location of CpG islands is one of the most frequent mutations found in human diseases (Sect. 27.2). This implies that DNA methylation reduces the efficiency of DNA repair resulting in the accumulation of mutations at these sites.
12000 12000
Number of 20 kb windows
9000
6000
3000
0 20
25
30
35
CpG is lands
40
45 GC c 50 onte nt [% ]
55
60
65
Fig. 6.1 CG content of the human genome. Due to subsequent passive deamination of genomic DNA, the average CG base pair content in the human genome is not 50% but only 42% (red line). CpG islands (red) have a CG percentage of 55%, i.e., only a minority of CpGs belong to CpG islands
6.1 Cytosines and Their Methylation
89
Cytosine methylation does not only occur at CpGs, but also at CpH dinucleotides (H = A, C or T). Non-CpG methylation (mCH) occurs in all human tissues, but is most common in long-lived cell types, such as stem cells and neurons. This type of methylation contributes to memory function and is negatively correlated with gene activity (Sect. 11.5). Proteins that specifically bind methylated DNA, such as MECP2 (methyl-CpG-binding protein 2), do not only interact with methylated CpG sites but also with CpH loci. MECP2 belongs to the family of intrinsically disordered proteins, which are characterized by a low level of secondary structure. This makes MECP2 well suited to interact with a large variety of different types of macromolecules, such as other proteins, DNA and RNA. Central to the primary structure the MECP2 protein is its DBD that includes a MBD, but also contains several other structures, such as AT hook motifs. DNMTs are chromatin modifiers that catalyze in an one-step reaction the transfer of a methyl group from S-adenosyl-L-methionine (SAM) to cytosines of genomic DNA. Since the DNA methylation pattern of somatic cells represents an epigenetic program of global repression of the genome and specific settings of imprinted genes (Sect. 6.3), it is important to maintain the DNA methylome during replication. This is the main responsibility of DNMT1 in collaboration with its partner UHRF1 (ubiquitin-like plant homeodomain and RING finger domain 1) that preferentially recognizes hemi-methylated CpGs. In contrast, in the absence of functional DNMT1/UHRF1 complex, successive cycles of DNA replication lead to passive loss of 5mC, such as the global erasure of 5mC in the maternal genome during pre-implantation (Sect. 11.1). In particular, during the development of primordial germ cells (PGC) in embryogenesis, genomic DNA is widely demethylated. This creates pluripotent states in early embryos and erases most of the parental-originspecific imprints in developing PGCs. With the exception of imprinted genomic regions (Sect. 6.3), DNMT3A and DNMT3B perform de novo DNA methylation during early embryogenesis, i.e., together with DNMT1 they act as writers of DNA methylation (Fig. 6.2, left). Active demethylation of genomic DNA is a multistep process that involves the methylcytosine dioxygenase enzymes TET (ten-eleven translocation) 1–3, which convert 5mC to 5hmC (Fig. 6.2). 5hmC is found in most cell-types but only in levels of 1–5% compared to 5mC rates. However, adult neurons are an exception, since their 5hmC level is 15–40% of that of 5mC. In two further oxidation steps, TETs convert 5hmC into 5-formylcytosine (5fC) and to 5-carboxylcytosine (5caC). 5fC and 5caC are significantly less prevalent (0.06–0.6% and 0.01% of 5mC rates, respectively) than 5hmC, i.e., TETs tend to preferentially halt at the 5hmC stage. Oxidized cytosines are deaminated to 5-hydroxyuracil (5hmU) so that they create a 5hmU:G mismatch, which is recognized and removed by the enzyme TDG (thymineDNA glycosylase) (Fig. 6.2, top). The abasic site is then repaired by the base excision repair (BER) machinery (Sect. 27.3), i.e., by a regular DNA repair process, and results in the overall demethylation of the respective cytosine. Thus, the oxidative modification of 5mC via the TET/TDG pathway allows a dynamic regulation of DNA methylation patterns.
90
6 DNA Methylation
Active oxidation TET 1/2/3
Active oxidation TET 1/2/3 O
NH2 N N
O NH2 N O
CXXC1 KMT2A/2D KDM2A/B TET1/3
5fC
DNA
O
NH2 N
OH N
5caC
O
DNA
OH
5hmC
NH2
N N
DNA
NH2
N
O N
Passive or active TDG
DNA
Cytosine
N
O
DNA
Passive
Cytosine
Passive loss
De novo methylation DNMT3A/B/L
NH2 N O
MBD1/2/4 MECP2
CH3
5mC N
Active oxidation TET1/2/3
DNA NH2 N O
CH3
5mC N
Replicative maintenance DNMT1
Fig. 6.2 Writing, erasing and reading cytosine methylations. DNMT1, as well as DNMT3A and DNMT3B, catalyze the methylation of cytosines at position 5, i.e., they act as “writer”-type chromatin modifiers (left). The dioxygenase enzymes TET1, TET2 and TET3 oxidize 5mC to 5hmC and further to 5fC and 5caC. This leads via the action of the DNA glycosylase TDG to the loss of DNA methylation, i.e., both types of enzymes function as “erasers” (center). Different sets of proteins either specifically recognize unmethylated cytosines or 5mC, i.e., they are “readers” (right)
DNA-binding proteins that specifically recognize either unmethylated or methylated genomic DNA (Fig. 6.2, right), such as CXXC1 (CXXC finger protein 1), MBDs (methyl-CpG-binding domain proteins) or MECP2 (Sect. 13.3), then read the information stored in DNA methylation patterns and translate them into biological actions.
6.2 The DNA Methylome Maps of genome-wide DNA methylation, histone modifications, patterns of chromatin accessibility, transcription factor binding as well as RNA expression from multiple tissues are provided by the Big Biology projects, such as ENCODE and Roadmap Epigenomics (Sect. 10.1). A master example of the epigenome is the DNA methylome, i.e., the genome-wide map of 5mC patterns and its oxidized modifications. Global DNA methylation methods measure cytosine methylation
6.2 The DNA Methylome
91
at base resolution over the whole human genome. These are either affinity-based methods, such as methylated DNA immunoprecipitation sequencing (MeDIP-seq), or base-resolution mapping methods, such as bisulfite sequencing (Sect. 10.2). Despite an overall consistency in tissue-specific DNA methylomes between human individuals, variations in these patterns exist from person to person. This applies to each of the approximately 400 different human tissues and cell types of each human individual. Although unrelated human individuals already differ among each other in approximately 4–5 million SNPs out of the 3.05 Gb of their haploid genome, i.e., in some 0.15% of their genomic sequence (Sect. 1.2), the potential number of variations in their epigenome is far larger. In response to cellular perturbations by diet, microbe encounter, cellular stress or other environmental influences epigenomes vary a lot over time. Thus, individuals vary far more on the level of their epigenomes than on the level of their genomes (Fig. 6.3). This suggests that phenotypic differences between individuals (as well as their predisposition for diseases) are rather based on the epigenome than on the genome (Sect. 12.1). DNA methylation is often associated with transcriptional silencing of repetitive DNA, such as SINEs, LINEs and LTRs (Box 1.3), and genes that are not needed in a specific cell type. LINEs and LTRs carry strong promoters that must be constitutively silenced via placing them into constitutive heterochromatin in order to prevent
G
Me Me Me Me Me Me
A
Me Me
Me Me Me
Me Me Me Me
Me Me Me
Me Me Me Me
A
Me
Me
Me Me Me Me
A
T
Individual 1
G
Me Me Me Me Me Me
Me Me
Me Me
G
Me
A
Me
T
Me Me Me Me
Me Me Me
G
Me
Me
Me
Me
Me
T
T
Tissue Brain
Me Me Me
Me
C Individual 2
Adrenal gland
Me Me
Me Me Me Me
Me
T
Me Me Me Me
Me Me Me
C
Me
T
Heart
Me Me Me Me
T
Me
C
Me
T
Me Me Me Me
Me Me Me
Me Me Me Me
Me
Me Me
Intestine
T
Me Me
Me
T
Me
C
Me
Me Me
Me Me
T
Me
Me
Me Me
Me
T
Fig. 6.3 Individuals show epigenetic heterogeneity. Tissue- and cell type-specific DNA methylations are displayed by clusters of methylated CpGs (Sect. 6.1) that vary from tissue to tissue of the same individual. Filled circles illustrate methylated CpGs and lack of a circle unmethylated CpGs. SNPs are monitored by the corresponding base
92
6 DNA Methylation
their activity (Fig. 6.4a). Therefore, these genomic regions are generally hypermethylated. The silencing of the repetitive DNA happens primarily during early embryogenesis (Sect. 11.1), while in adult tissues de novo silencing is initiated by the proteins MECP2, MBD1, MBD3 and MBD4. The latter proteins bind symmetrically methylated CpGs, but they have no sequence specificity. Thus, MBD proteins are not classical transcription factors but act as readers (Fig. 6.2, right) and adaptors for the recruitment of chromatin modifiers, such as HDACs and KMTs (lysine methyltransferases), to methylated genomic DNA. The DNA methylome is bimodal, i.e., it occurs in two major modes. These are a low methylation level at CpG-rich promoters and binding sites for methylationsensitive transcription factors, such as CTCF (Sect. 6.3), while the remaining CpGs are by default methylated. Methylated genomic DNA is transcriptionally repressed, i.e., in most cases there is an inverse correlation between DNA methylation of regulatory genomic regions, such as promoters and enhancers, and the expression of the genes that they are controlling. However, at their gene bodies, highly expressed genes
Healthy cells
a
Diseased cells
Methylated repetitive sequence
Unmethylated repetitive sequence Transposition Recombination Genome instability
Me
Me
Me Me Me
Me Me
Me
Me Me Me
Me
Me
Me
Repetitive sequence
b
Repetitive sequence
Methylated gene body
Unmethylated gene body
Pol II TF
TF
c
Pol II
Pol II
Pol II
E1
Me
Me
E2
Me
Me
E3
Pol II
Me
Unmethylated CpG island
TF
Pol II
E2
E3
TF
E1
E4
TF TF
E4
Methylated CpG island DNMT
Pol II
MBD
Pol II TF
TF
E1
Me MMe eMe Me MeMe Me Me MMe e MeMe MeMeMe Me MeMe MMe eMeMe MeMeMe Me MeMeMeMe Me
E2
E1
E3
Unmethylated site
Me
E2
E3
Methylated site
Fig. 6.4 DNA methylation in different regions of the genome. Scenarios of DNA methylation of healthy cells (left) or diseased cells (right) are displayed. Repetitive sequences within our genome are normally hypermethylated in order to prevent translocations, gene disruptions and general chromosomal instability through the reactivation of retrotransposons a. This pattern is altered in disease. Methylation of the transcribed region of a gene facilitates transcription (traffic lights) by the prevention of transcription initiations b. Gene body tends to get demethylated in disease so that transcription may be initiated at several incorrect sites. CpG islands close to TSS regions are normally unmethylated c. This allows transcription, while hypermethylation causes transcriptional inactivation
6.3 CTCF and Genetic Imprinting
93
show high levels of DNA methylation, i.e., some methylated CpGs downstream of TSS regions positively correlate with gene expression (Fig. 6.4b). Genes driven by CpG-rich promoters are silenced when methylated (Fig. 6.4c), while genes without CpG islands close to their TSS regions are regulated by other mechanisms than DNA methylation, such as transcription factors binding to enhancers. In general, DNA methylation and histone modifications have different roles in gene silencing. While most DNA methylation loci represent very stable silencing marks that are seldom reversed, histone modifications mostly lead to labile and reversible transcriptional repression. For example, genes for pluripotency transcription factors in embryogenesis, such as OCT4 (octamer-binding transcription factor 4, also called POU5F1) and NANOG (nanog homeobox), need to be permanently inactivated in later developmental stages, in order to prevent possible tumorigenesis. This happens via H3K9 methylation at unmethylated CpGs on TSS regions of these genes, the attraction of HP1 (heterochromatin protein 1), de novo DNA methylation via DNMT3A and DNMT3B and finally transcriptional silencing for the rest of the life of the individual. In contrast, when in differentiated cells these pluripotency genes are silenced only by histone modification, these cells can be rather easily converted to iPS (induced pluripotent stem) cells (Sect. 11.2). Nevertheless, the methylation status of some 20% of all CpGs within the human genome is dynamically modified. Differential DNA methylation is established by de novo methylation combined with active demethylation of CpG islands. During early embryogenesis, i.e., in the pre-implantation phase, most CpGs are unmethylated (Sect. 11.1). After implantation DNMT3A and DNMT3B de novo methylate those CpGs that had not been packed with H3K4me3-marked nucleosomes. In contrast, H3K4me3-marked CpGs on TSS regions of CpG-rich promoters stay unmethylated. Methylation and demethylation of CpGs modulate the DNA-binding affinity of transcription factors, i.e., DNA methylation is a signal being differentially recognized by specific protein domains. Interestingly, a third of the 1600 human transcription factors are positively affected by methylation of their DNA binding sites, half of all do not bind DNA when it is unmethylated and only a fourth of all are negatively influenced by DNA methylation. A well-known example of the latter is CTCF in the context of genomic imprinting (Sect. 6.3). Thus, there are different forms of gene silencing ranging from flexible repressor-based mechanisms to a highly stable inactive state being maintained by DNA methylation.
6.3 CTCF and Genetic Imprinting Insulators are genomic loci that separate genes located in one chromatin region from promiscuous regulation by transcription factors binding to enhancers of neighboring chromatin regions. The methylation-sensitive transcription factor CTCF is the main protein binding to insulator regions. In complex with other proteins, such as cohesin, CTCF mediates the formation of architectural loops, such as TADs, as well as of regulatory loops (Fig. 2.6). In addition to the prevention of cross-border enhancer
94
6 DNA Methylation
activity, insulators can act as boundary elements that inhibit spreading of heterochromatin from silenced genomic regions to transcriptionally active parts of the genome. This means that these boundary elements “insulate” closed from open chromatin, i.e., inactive from active genes. Thus, CTCF-bound insulators are epigenetic structures that are important for both specific gene regulation as well as chromatin architecture. The transcription factor CTCF has a DBD formed by eleven zinc fingers (Fig. 6.5a). The combinatorial use of these zinc fingers creates a conformation that allows CTCF to recognize not only a large variety of DNA sequences but also numerous coregulatory proteins. However, the central 4–5 zinc fingers of CTCF bind to a consensus core sequence of some 12 base pairs in length. This unique structural feature provides CTCF with a versatile role in genome regulation, such as binding to a large variety of insulator regions. This can result in enhancer activity blocking, inhibition of heterochromatin spreading and interand intrachromosomal organization. CTCF is ubiquitously expressed in basically all human tissues, but the levels of its expression and nuclear distribution vary in a cell type- and species-specific manner (Fig. 6.5b). The protein is evolutionarily very conserved both in its protein structure as well as in its DNA-binding pattern (Fig. 6.5c). Genome-wide, there are approximately 30,000 CTCF-binding sites, some 15% of which are involved in the formation of TADs and only a few hundred control imprinting. All CTCF-binding sites are sensitive to methylation, i.e., CTCF binding to methylated sites is drastically reduced. DNA is very flexible in forming any type of loops. Nucleosomes, around which the genomic DNA is wrapped some 2-times per 200 base pairs, show the smallest scale of DNA looping. The next level is represented by loops between enhancer regions and TSS regions of several kb in size that bring transcription factors and the basal transcriptional machinery into close vicinity. A further level of DNA looping in the scale of several hundred kb is mediated by CTCF and organizes the genome in a few thousand TADs (Sect. 2.4). These domains are conserved between cell types and species indicating that this organization is an evolutionary feature. Additionally, the boundaries of these domains are enriched for CTCF, but also with other factors, such as housekeeping genes and proteins found at active promoters and gene bodies. This suggests that topological domains are generated, in part, by transcriptional activity. Thus, the interactions of CTCF and its partner protein cohesin together with lamins of the nucleoskeleton are important for the position of genes within subnuclear compartments (Fig. 6.6). Higher-order chromatin structures, such as DNA loops that are stabilized by CTCF binding, represent another form of epigenetic memory, which can be modulated by DNA methylation. Interestingly, only a small subset of unmethylated CTCF-binding sites keep CTCF proteins bound throughout the cell cycle, in order to protect these sites against de novo methylation. Thus, only those higher-order chromatin structures that are mediated by unmethylated CTCF sites can be inherited through mitosis, i.e., CTCF-mediated chromatin structures represent a heritable component of phenotype-specific epigenetic programs.
6.3 CTCF and Genetic Imprinting
95
LTPEMILSM APNGD PA AT D
OH
E AQ
-CO
EE
EPQPV TPAPPPA KKRRGRPPG
EPEP EP AVE I
EE
GR
T
K T FQCELC
RK G
NE
EQ
DR M
KE P D
GNMKPPKPTKIKKKG V K AEKVV E G L LSEVN
KC
VIAR KS
FH
R YCD
H C PHCD T
KC
ARFT QS G E CY ICH
Q
CD
HC
PHK
CS YASRDT F Q CSL
SVEV CDYA
P FK
S VT
C HL C
R
PH K
TVT
DM
A
F
CPDC
AF R
RRS
C577
RTNQP
SH3 motif
AE P D L D D S EN
S Y TC P PPQEDPSW K VG A NGEVETLEQ GEL
M
R S K K E DS S D
VV
AG NC P D D
CS
R
R399 M
A E PA E G E
D
V YDFEE
Q
AVDDTQIITLQV TLLQMKTE VMEGT VAPEAEA VN
A RH
TK
RK
Q LDP
H573 Zn
C560
K AIENIIVEV DQNTG IIQVE PTA NQ KQ
NGGE
KSKR
ME
C557
11
V C S Zn
GE
N
N587
TFT RRNT GK
G VE
KKTKKTKKSKLRY T EEGKD V D V S PPA Q
D QK PDY
NF V DP
YI
C442
C409
Zn
Zn
R
R515
MA
H425
S
PA A F
Zn
H460
10
DK
H
YA
Y462
Zn
H541 LL QKQ FR
DMH
Zn
C
Y
C412
HT D E
CR YA KP
C DQ
RY FK
KN E
K
9
TGE
G
H455
Zn
HM ER KR
KF
C528 H546
C525
8
TH
1
H430
C439
Zn
IMH
NLDRHMK S
R
PY
P
YA ER
AV
KRF K
Zn
Zn
H EK
7
Q KSH
T HT
T
TL
2
G
SS
H SVEELQG AYENEVSKEGLAESEPM I C
GQEEDAC DVN HLPQNQTDGGE V VQ
MV M
VQVPVPV QL T VP EL VAT T
F IK GK ERK T YQ RRRE G
MEEQPINIG
Zn
Zn
DL
LIQH
HT YK
SE T
VQ
RR
6
EQ
3
LLRNH LN
Zn
R TGE
GELVRH
EAIVE E AV
-
H2N
MEGD
SH
R
THSG E K
HI R KR
4
RH M
5
GVHL R KQHS
TM
YKLK
SKL
H KHTEN A V KM I L Q
a
P L PEG F
c
b
half site 1
33,977
H. sapiens
60%
M. mulatta
38% 24,279
20,652
5,178 32%
half site 2
M. musculus
34% R. norvegicus
58% 21,425
36,157
C. familiaris
M. domestica
Fig. 6.5 The genome regulator CTCF. CTCF is an unusual transcription factor containing 11 DNA-interacting zinc finger domains a. Venn diagram of interspecies conservation of CTCF sites b. Canonical CTCF motifs obtained by de novo motif discovery c
The DNA-methylation sensitive binding of CTCF to imprinting control regions (ICRs) provides a mechanistic explanation of the epigenetic process of genomic imprinting. ICRs represent a special subset of insulators that control the monoallelic expression of the more than 100 maternally and paternally controlled genes in humans (www.geneimprint.com/site/genes-by-species.Homo+sapiens). Most imprinted genes occur in clusters, a master example of which is the chromosome 11p15 region that contains the protein-coding genes IGF2 (insulin-like growth factor 2), KCNQ1 (potassium voltage-gated channel subfamily Q member 1) and CDKN1C as well as the ncRNA genes H19 and KCNQ1OT1 (Fig. 6.7, top). This imprinted genomic locus contains two ICRs and is regulated by enhancers downstream of the H19 gene. In maternally controlled alleles, ICR1 is unmethylated and
96
6 DNA Methylation
a
Nuclear pore
Cohesin CTCFCTCF
SINE element
A
Nuclear envelope
A
tRNA gene
Mediator
b C Nucleolus Boundary protein
B ad hoc subdomain
c
Nucleus
+ + + + +
CTCFCTCF
CTCFCTCF
+
CTCFCTCF
+ + + + + +
CTCFCTCF
- - - - -
Fig. 6.6 Topological domains in the genome. Two chromosomes (green and blue lines) and their respective chromosome territories (green and blue areas) are shown. Proteins of the chromatin boundary (red circles), such as CTCF and cohesin, divide the genome into distinct domains. This topological organization implies interactions within and between chromosomes and between chromatin and the lamina of the nucleus. Different examples of CTCF-mediated looping are shown, such as regulatory loops a, architectural loops and their subdomains b and different configurations CTCF-mediated loops separating active genes (green), inactive genes (red), euchromatin (+) and heterochromatin (−) from each other c
binds CTCF, while ICR2 is methylated and not bound (Fig. 6.7, center). During postimplantation development CTCF binding is essential in order to maintain the hypomethylated state of ICR1 and to protect it from de novo methylation in oocytes. CTCF blocks the long-range communication of the enhancers with the TSS region of the IGF2 gene but allows the initiation of H19 transcription. This results in the expression of H19, KCNQ1 and CDKN1C as well as in the repression of IGF2 and KCNQOT1 transcription. In contrast, in paternally controlled alleles, ICR1 is methylated and does not bind CTCF, while ICR2 is unmethylated (Fig. 6.7, bottom). This reverses the expression pattern so that IGF2 and KCNQOT1 are produced but not H19, KCNQ1 and CDKN1C. The physiological consequence of this imprinting is that in maternally controlled cells growth and cell cycle are limited, while paternally controlled cells are primed for maximal growth.
6.3 CTCF and Genetic Imprinting
H19
ICR1
97
KCNQ1
IGF2
KCNQ1OT1
ICR2
CDKN1
ICR2
CDKN1C
Enhancer elements
CTCF
Maternal allele
H19 Enhancer elements
ICR1
KCNQ1
IGF2
KCNQ1OT1
Me MeMe
Insulator
DNA methylation Me Me Me
Paternal allele
H19 Enhancer elements
ICR1
KCNQ1
IGF2
KCNQ1OT1
ICR2
CDKN1C
Insulator DNA methylation Suppressor RNA
Me
Paternally or
Maternally expressed genes
Me
Paternal or
Maternal DNA methylation
Fig. 6.7 Control mechanisms of the 11p15 imprinted cluster. General structure of the 11p15 cluster (top) and of scenarios of maternally (center) and paternally (bottom) controlled alleles. IGF2 encodes for a growth factor, H19 for a long ncRNA limiting body weight, KCNQ1 for a potassium channel, KCNQ1OT1 for an antisense transcript of KCNQ1 that interacts with various chromatin components and CDKN1C for a cell cycle inhibitor
Another well studied example of imprinting is the inactivation of one X chromosome in female cells. The inactive X chromosome is observed as Barr body in female interphase cells. The epigenetic process behind XCI is the long ncRNA Xist (X inactive specific transcript) (Sect. 9.3), which is exclusively expressed from the X inactivation center of the inactive X chromosome. The action of Xist represents a special form of imprinting that affects a whole chromosome. Imprinted genes have also an important role in adaptation to feeding, social behavior and metabolism, i.e., postnatal processes that are very responsive to environmental influences. In this way, genomic imprinting is an epigenetic mechanism regulating gene dosage. Imprinting may have evolved in response to intra- and extracellular signals, in order to modulate the expression levels of these genes as required by various conditions.
98
6 DNA Methylation
6.4 DNA Methylation and Disease The approximately 100 imprinted genes in human have important roles during development. Accordingly, changes in their expression and function can lead to imprinting disorders. For example, the Silver-Russell syndrome, a disease leading to undergrowth and asymmetry and the Beckwith-Wiedemann syndrome, a disease leading to overgrowth, are based on epigenetic errors in the 11p15 locus (Fig. 6.7). Individuals with the Beckwith-Wiedemann syndrome have a 1000-times increased chance of getting kidney tumors (mostly Wilms’ tumors, however, in only 7% of those affected by the syndrome) and embryonal tumors that arise from fetal cells and persist after birth, i.e., epigenetic changes precede and increase the risk of cancer rather than arise after tumor formation. Most of the patients with Beckwith-Wiedemann syndrome lost the methylation at ICR2, resulting in the expression of the KCNQ1OT1 ncRNA on both alleles (biallelic) and aberrant repression of CDKN1C, i.e., in reduced cell cycle repression. Other Beckwith-Wiedemann syndrome patients show overexpression of IGF2 caused by deletions in ICR1 on the maternal allele and disrupted CTCF binding leading to biallelic IGF2 expression and loss of H19 expression. Many individuals with Silver-Russell syndrome have an opposite epigenetic phenotype, where ICR1 is unmethylated, resulting in biallelic H19 expression and loss of IGF2 expression. While imprinting disorders are very rare, perturbations in the DNA methylome are observed in the most cases of cancer (Sect. 29.2). Well-known examples are the hypermethylation of the CpG-rich promoters of tumor suppressor genes (Chap. 26), such as TP53 and RB1 (RB transcriptional corepressor 1) leading to their transcriptional silencing. Thus, DNA methylation leads to the silencing of genes that are essential for the inhibition of tumorigenesis progression. Moreover, in about 25% of adult cases of acute myeloid leukemia (AML) the DNMT3A gene is mutated, which disturbs the methylome and makes the regulatory landscape of pre-leukemic blood stem cells more vulnerable for additional mutations. Similarly, mutations in the genes of other chromatin modifiers can enhance the phenotype of cancer-driven mutations in transcription factor genes or their genomic binding sites. Therefore, epigenetic alterations belong to the hallmarks of cancer (Chap. 29). Interestingly, the first approved epigenetic drug, decitabine (5-aza,2, -deoxy-cytidine), is used for the therapy of leukemia and other forms of blood cancer, in which hematopoietic progenitor cells do not maturate (Sect. 13.3). Aberrant DNA methylation is not only a well-established marker of cancer and disturbed genomic imprinting, but it also can lead to general instabilities of the genome through reduced heterochromatin formation on repetitive sequences (Fig. 6.4a, right). DNA methylation profiles, e.g., of white blood cells that can be obtained from test persons with minimal invasion, may serve as biomarkers for evaluating the individual risk of cancer and a number of other diseases, such as T2D. Moreover, the DNA methylome indicates the progress of aging showing significant interindividual differences. Although biomarkers often do not explain the causality of a disease, they can monitor the disease state and may suggest
Additional Reading
99
appropriate therapy. Thus, epigenomic profiles, such as DNA methylation patterns, in combination with genetic predisposition and environmental exposure may be prognostic for personal risk of disease onset. (Clinical) Conclusion: DNA methylation is the clinically best understood and one of the first identified epigenetic mark. In health, tissue-specific DNA methylation patterns are essential for keeping terminally differentiated cells in their status. In contrast, aberrant DNA methylation is a key marker for many diseases, such as cancer, imprinting disorders and premature aging syndromes.
Additional Reading Lappalainen, T., & Greally, J. M. (2017). Associating cellular epigenetic models with human phenotypes. Nature Reviews Genetics, 18, 441–451. Luo, C., Hajkova, P., & Ecker, J. R. (2018). Dynamic DNA methylation: In the right place at the right time. Science, 361, 1336–1340. Monk, D., Mackay, D. J. G., Eggermann, T., Maher, E. R., & Riccio, A. (2019). Genomic imprinting disorders: Lessons on how genome, epigenome and environment interact. Nature Reviews Genetics, 20, 235–248. Stricker, S. H., Koferle, A., & Beck, S. (2017). From profiles to function in epigenomics. Nature Reviews Genetics, 18, 51–66. Wu, X., & Zhang, Y. (2017). TET-mediated active DNA demethylation: Mechanism, function and beyond. Nature Reviews Genetics, 18, 517–534.
Chapter 7
Histone Modifications
Abstract In this chapter, we will present posttranslational modifications as a general mechanism for instructing proteins about their function. Moreover, they allow proteins to “memorize” their encounters, such as contacts with other proteins. Histone proteins are the key examples of this protein communication system. In particular, lysine acetylations and methylations of histone tails have a large functional impact. Genome-wide profiling of the large set of posttranscriptional histone modifications provides the basis of the histone code. This code leads to the understanding, how the epigenome directs transcriptional regulation and stores information. Histone modifying enzymes, such as HATs, HDACs, KMT and lysine demethylases (KDMs), either add or remove posttranslational modifications to histone proteins and in this way change the functional profile of the epigenome. Keywords Posttranslational histone modification · Genome-wide profiling · Histone code · Chromatin modifiers · HATs · HDACs · KMTs · KDMs · Writers · Erasers · Readers
7.1 Histones and Their Modifications Posttranslational modifications of histones are frequent and important epigenetic signals that control many biological processes, such as cellular differentiation in the context of development (Chap. 11). Acetylations and methylations of lysines at histone tails are understood best and may be the most important epigenetic marks affecting histones. However, there are also a number of other acylations, such as formylation, propionylation, malonylation, crotonylation, butyrylation, succinylation, glutarylation and myristoylation, the functional impact of which is far less understood. In addition, there are phosphorylations at tyrosines, serines, histidines and threonines, ADP ribosylations at lysines and glutamates, citrullinations of arginines, hydroxylations of tyrosines, glycations of serines and threonines as well as sumoylations and ubiquitinations of lysines. Covalent modifications of histone proteins alter the physio-chemical properties of the nucleosome and are recognized by specific proteins, referred to as “readers” © The Author(s), under exclusive license to Springer Nature Switzerland AG 2023 C. Carlberg et al., Molecular Medicine, https://doi.org/10.1007/978-3-031-27133-5_7
101
102
7 Histone Modifications
(compare also DNA methylation readers, Sect. 6.2). Basically, all covalent histone modifications are reversible via the action of specific enzymes. In general, chromatin acetylation is associated with transcriptional activation and controlled by two classes of antagonizing chromatin modifiers, HATs and HDACs. When a HAT adds an acetyl group to the amino group in the side chain of a lysine, the positive charge of this amino acid is neutralized (Fig. 7.1). In reverse, an HDAC can remove the acetyl group and restore the positive charge of the lysine residue. Thus, chromatin modifiers determine through the addition or removal of a rather small acetyl group the charge of the nucleosome core, which has major impact on the attraction between nucleosomes and the density of chromatin packing. In analogy, for histone methylation at lysines there are two classes of enzymes with opposite functions, KMTs and KDMs. Since histone methylation can be a repressive as well as an active marker, the exact position in the histone tail and its degree of methylation (mono-, di- or trimethylation) is critical. Lysine (K) is the most frequently modified amino acid in proteins, since it can accommodate a number of different modifications, such as several types of acylations and methylation and reactions with ubiquitin and ubiquitin-like modifiers. These modifications occur in a mutually exclusive manner, so that specific lysine residues, such as H3K27, can serve as hubs for the integration of different signaling pathways
a
Histone fold-domain
c
Acetyl group
HAT
N-terminal tail
b
+
14
9 A R
Acetyl-CoA
K
T
HDAC
A
K T
K 4
S
R Q
T A
G
P
R
18 K
G
A
L
Q
T K
23
A
A R
Lysine
Acetate
Acetyl-Lysine
Fig. 7.1 Histone acetylation. Acetylation is shown as an example of a posttranslational modification of histone proteins. A Connolly surface model with secondary structures of histone H3 (a) is displayed in combination with a zoom into its amino-terminal tail. The positively charged amino acids lysine (K) and arginine (R) are indicated in blue (b). The activity of HATs removes the positive charge, while HDACs can reverse this process (c)
7.2 Genome-Wide Interpretation of the Histone Code
a
Trimethyl-lysine
Lysine
OOC
Charge retained
103
Acetyl-lysine OOC
OOC NH2
NH2
KMT
NH2
HAT N
H3N
H3C N CH3 CH3
H
O
Charge lost
DNA
b
R42 T118
Histone 3 K56
K122 K64
K79
K91
Histone 4
Fig. 7.2 Nucleosome stability through histone modifications. Unmodified lysine residues are positively charged and can form a salt bridge with negatively charged genomic DNA (both at physiological pH). The acetylation of lysines by HATs introduces a bulkier side chain and in parallel removes the positive charge (a, right). This decreases the affinity between DNA and the nucleosome and may destabilize the latter. The methylation of lysines by KMTs does not change the charge but, dependent on the number of added methyl groups, introduces various degrees of bulkiness. Crystal structures of the nucleosome are shown with highlighted key amino acids (b)
(Fig. 7.2). Methylation is a special type of posttranslational modification. Since a single methyl group is small, it contributes only in a minor way to the steric properties of amino acids. Moreover, the methylation of lysines and arginines does not affect the charge of these residues, i.e., also in their methylated form they are positively charged. Lysines can be methylated up to 3-times and arginines up to 2-times, respectively. Histone methylations are more stable modifications than phosphorylations or acetylations, i.e., their turnover is lower and they mark more stable epigenetic states.
7.2 Genome-Wide Interpretation of the Histone Code Maps of genome-wide histone modifications with patterns of chromatin accessibility, transcription factor binding as well as RNA expression from multiple tissues are
104
7 Histone Modifications
provided by the ENCODE project (www.encodeproject.org) and the Roadmap Epigenomics project (www.roadmapepigenomics.org) and coordinated by IHEC (International Human Epigenome Consortium, http://ihec-epigenomes.org) (Sect. 10.1). The integrated data identified novel relationships between histone modifications and related chromatin structures. Reversible posttranslational modifications, such as phosphorylation, acetylation and methylation, of key amino acid residues, such as lysine and arginine, within proteins are the major mechanisms of communication and information storage in the control of signaling networks in cells. This means that many proteins “remember” their functional tasks via their specific pattern of posttranslational modifications. Master examples of such information-processing circuits via posttranslational modifications are the nucleosome-forming core histones H2A, H2B, H3 and H4 as well as the linker histone H1 (Fig. 7.3). The tails and globular domains of these histone proteins provide over 130 amino acid residues for posttranslational modifications, the information content of which is summarized as the histone code (Box 7.1). The theoretical number of possible combinations of signals forming the histone code is very large. In analogy to the alphabets of human languages, the histone code is very rich in “letters” that may be combined to a large number of “words” with different meanings (Table 7.1). Thus, histone modifications represent a text rich in information about the local chromatin status. This more fine-grained distinction suggests that the epigenome has far more differential functions than “on” and “off”, such as accessible and non-accessible chromatin. Box 7.1: The Histone Code Model The model suggests that histone modifications modulate the structure of the nucleosome. This provides a platform for the recruitment of chromatin modifiers that specifically recognize the respective histone modifications (readers). Moreover, multiple histone modifications act in a combinatorial fashion to specify distinct chromatin states. This allows a large number of posttranslational histone modifications to generate a very specific chromatin structure. This determines a specific expression level for each class of genes. The integration of histone modification maps with patterns of chromatin accessibility, transcription factor binding as well as RNA expression from multiple tissues identified novel relationships between histone modifications and related chromatin structures. This leads to the development of new hypotheses regarding the regulatory functions of chromatin features that are all part of the histone code model (Table 7.1). Some important elements of the model are: • Acetylation and deacetylation of histone tails represent major regulatory mechanisms during gene activation and repression. Actively transcribed regions of the genome tend to be hyperacetylated, whereas inactive regions are hypoacetylated. However, histone hyperacetylation has been
7.2 Genome-Wide Interpretation of the Histone Code
Me Ac Me Bu Ac Ac Me Cr Me Cr Ph Cit Ph Hib Ph Cit Hib GlcPh
H3
+
H3N-
Me Ac Bu Hib Su Ubq
+
H3N-
Me Ac Pr Bu Cr Hib Su Fo
Ac Pr Bu Cr Hib
20
H2A
20
Pr Bu Hib
Me
+
H3N-
30
Ph Glc
Ar
Me Ac Bu Cr Hib Su Fo Ph
36
Ph
40
Ph OH
43
46
Me Cr Hib Fo Ubq
Me
50
Me Ac Ac Hib Ubq Ac Su Me Ar Ubq
Me Ac Bu Cr Hib Su Fo Ac Ubq Ph
Me Ac Hib Me Fo
Me
Ph
Ph
Me Ac Bu Cr Hib Su Fo Ubq
55
58
62
78
Ac Bu
60 65
Ac Cr Hib Su Fo Ubq
Me
OH
70
20
Me Cr Hib Su Fo Ph Ar Ph Ubq Glc OH
Me Ac Me Bu Ac Cr Bu Hib Cr Ac Ac Ubq Hib Hib
Me Ac Me Ac Bu Ac Ac Bu Cr Bu Bu Cr Hib Ph Cr Cr
30
Me
Me Ac Hib Su Fo
40
Ac Pr Bu Cr Hib
79
Ph
Me Ac Bu Hib Su Fo Ubq Ph
43 48
84
Me Ac Hib Hib
Me
Ph
Me Ac Hib Ph Ubq Ph Ph
51 58
60 70
76
Me Ac Hib OH Su Me Ph Ph Ph Me
10
20
Me Ac Fo
Ph Ar Ph +
H3N-
25
29
38
Me Me Ac Me Ac Hib Hib Hib
42
Me Ac Cr Hib Su Fo Ac Ubq Ph
46
52
57 64
Me
Ac Hib Su Fo Ubq
Ph
75
80
Me Ac Hib Su Fo
Me Ac Hib Ac Ubq Cit Ph
Me Ac Cr Hib Su Fo Ubq
90
Ph OH
Ac Hib Fo Ubq
Hib Fo
93
-COO –
135
Su Ph Fo OH Ubq Me
90
Me
H4
-COO –
99
Me Ac Pr Bu Cr Hib Su Fo Ubq
Me Ac Cr Me Hib Pr Cr Ph Fo Cr Me Glc Ubq Ubq Ph Ph Ubq Ac Ac
Me
87
91
95
100 102 117
Me Ac Cr Hib Ac Ma Hib Su Su Fo Fo Ph Ubq Ph Ubq
Me Ac Cr Hib Su Fo Ubq
98 100 107 109 114
120
Me Ac Cr Hib Su Fo Ubq
Me Ac Su Ph Ubq
Ac Cr Hib Su Fo
Me Ac Cr Hib Su Fo Ubq
-COO –
129
Ac
MPEPAKSA…PKKGSKKAVTKAQKKD…RKRSRKESYS…YKVLK…TGISSK…S…SEASRLAHYNKRSTITSRE…VRL…AKH…GTKAVTKY…K 7
Me
87 106 108 114 116 121 123 127
Me Ac Pr Me Bu Ac Cr Pr Hib Bu Su Hib Fo Su Ph Ubq Me Fo
Ph
Me
65
MSGRGKQGGKARAKAKTRSSRAGLQFPVGRVHRLLRKGNYAERV…PVYL…LTA…ARDNKKT…IRNDE…KLLGKVTI…PKKTESHHKAKGK 10
H1
Me Ac Pr Cr Hib Su Ma Fo Ubq Ph
MSGRGKGGKGLGKGGAKRHRKVLRDNIQGITKPAIRR…VKRISGLIYEETRGVLKV…VIRDAVTYTEHAKRK…VVYALKRQGRTLYGFGG
Ac Me Bu Ph Cit Hib
H3N-
Glc
30
Me Ac Pr Bu Hib Su Fo Ubq
Me Ac Pr Bu Cr Hib Me Me Me Ar Cit Ph Cit Ac Me
10
+
Me Ac Me Hib Ac Ubq Ar Me Ph Me
MARTKQTARKSTGGKAPRKQLATKAARKSAPATGGVKKPHRYRPGTV…QKST…IRKL…FKTDLRFQSS…DTN…AKR…PKD…ARRIRGERA 10
Me Ac Pr Bu Me Cr Ph Cit Hib
Me Ac Me Pr Ac Bu Bu Cr Cr Hib Hib Su Su Fo Me Ubq Ac Ac Ubq Cit Ar Ph
Me Ac Bu Cr Hib Me Fo Cit Ubq
105
H2B
-COO –
125
Me Hib Ubq
Ac
Hib Hib Ubq Me Su
MSETA…EKA…KKKAAKKA…RKASG…VSE…TKA…ASKERSG…LKKA…GYDVEKN…IKLGLKS…SKG…TKG…GSFKLNKKAASGEAKPKVKK… 4
15
Me Ubq Hib
17
20
Hib
27
Fo Ubq
32
Me Ph Hib
36
39 41
Cr Fo Hib Ubq
44 46
Ph
49
Me Ac Cr Hib Me Ubq Ac
55
Ph
61
Me
64 69
129 134
140 144
148 157
160 163
170
173 185
79
85
88 90 95
97 102
110
120
Ac Hib
…TKPKK…AKKPKKA…ATPKK…AKKP…ATVTKKVAKSP…AKSAAK…K 125
75
-COO –
190 212
Fig. 7.3 Posttranslational modifications of histone proteins. All presently known posttranslational modifications of the nucleosome forming core histones H2A, H2B, H3 and H4 and the linker histone H1 are indicated. Amino acids that can be modified (K, lysine, R, arginine, S, serine, T, threonine, Y, tyrosine, H, histidine, E, glutamate) are highlighted, most of them can carry different modifications, but they do not occur in parallel. Me = methylation (K, R), Ac = acetylation (K, S, T), Pr = propionylation (K), B = butyrylation (K), Cr = crotonylation (K), Hib = 2-hydroxyisobutyrylation (K), Ma = malonylation (K), Su = succinylation (K), Fo = formylation (K), Ub = ubiquitination (K), Cit = citrullination (R), P = ,phoshorylation (S, T, Y, H), OH = hydroxylation (Y), Glc = glycation (S, T), Ar = ADP-ribosylation (K, E)
associated with histone deposition during replication and repair. Importantly, in case of histone acetylation more the overall degree of acetylation rather than any specific residue is critical. • In contrast to acetylation, there is a clear functional distinction between histone methylation marks, both concerning the exact histone residues as well as their degree of modification, such as mono-, di- or trimethylation. For example, H3K9me3 and H4K20me3 are enriched near boundaries of large heterochromatic domains, while H3K9me1 and H4K20me1 are found primarily in active genes. • H3K4me3 is detected specifically at active promoters, while H3K27me3 is correlated with gene repression over larger genomic regions. Both modifications are usually located in different chromatin domains, but they co-exist in a subset of genomic regions that are termed bivalent domains. These regions seem to have crucial roles, e.g., in ES cell differentiation
106
7 Histone Modifications
Table 7.1 The histone code. The non-exclusive list of the relation of posttranslational modifications and their functional impact are summarized as the histone code model Histone
Epi-mark
Most conserved co-marks
Putative function
Biological inference
H2
A.Z
H3K4me2/3
Poised promoter
Negatively associated with gene activation in ES cells and during their differentiation
BK5me1 H3
Active enhancer
K4me1
K27me3, K4me2 Poised enhancer
K4me2
K4me3
Active or poised regulatory regions
K4me3
K4me2
Active or poised regulatory regions
K9me1
Active genes and enhancers
K9me3
Active or poised regulatory regions
Negatively correlated with sequence conservation
K27ac
K4me1/2/3
Active enhancer (me1/me2) or promoter (me2/me3)
H3K27ac marks promoters as well
K27me3
K4me1/2/3
Poised enhancer (me1/me2) or bivalent promoter (me2/me3)
Poised enhancers regulate as many genes as bivalent promoters do
K27me1 K36me3
H4
Poised enhancers regulate as many genes as bivalent promoters do
Active enhancer K27ac, K4me1
Active enhancer
K36me1
Active enhancer
K20me1
Active genes
K20me3
Active or poised regulatory regions
Cm
Repressed region
Most of the features are confirmed by genome-wide analysis
Not correlated with H3K27me3, may be a neglected mark of active enhancers
Cm either only mildly influences gene regulation or influences it in a way that is independent from histone modifications
7.2 Genome-Wide Interpretation of the Histone Code
107
(Sect. 11.3), by providing the potential for both transcriptional activation and repression. Moreover, their dysregulation can cause different types of diseases. • H3K36me3 marks in gene bodies correlate with levels of gene transcription, since KMTs deposit this mark when interacting with elongating Pol II, i.e., expressed exons have a strong enrichment for this histone mark. • Histone modification profiles allow the identification of distal enhancer regions, as they show relative H3K4me1 enrichment and H3K4me3 depletion. Interestingly, chromatin patterns at enhancer regions seem to be far more variable and cell specific than those at core promoter or insulator regions. Enhancer regions also show enrichment not only for H3K27 acetylation, but also for H2BK5me1, H3K4me2, H3K9me1, H3K27me1 and H3K36me1, suggesting the redundancy of these histone marks. Each of the modifications is detected at a rate of only 20–40% of all potential enhancers, i.e., none of them is associated with all enhancer regions. • Early replicating genes are marked by H3K4me1, 2 & 3, H3K36me3, H4K20me1 as well as H3K9 and H3K27 acetylation. In contrast, late replicating genes often correlate with the marks H3K9me2 and H3K9me3. Moreover, boundaries between replicating zones show a pattern of histone signature modification, such as H3K4me1, 2 & 3, H3K27ac and H3K36me3. This suggests that histone modifications serve as boundary elements, comparable to insulators that block spreading of late-replicating heterochromatin. Posttranslational modifications of histones either directly affect chromatin density and accessibility or serve as binding sites for effector proteins, such as chromatin modifying (Sect. 7.3) or remodeling complexes (Sect. 8.2). This ultimately modulates the initiation and elongation of transcription, i.e., histone modifications have an impact on the transcriptome (Fig. 7.4). In addition, histone marks are able to store information. Multiple histone modifications act in a combined way to generate a very specific chromatin structure that determines a specific expression level for each class of genes (Sect. 7.4). For some common histone marks, correlations between their presence and the activity of different genomic elements are well established, such as H3K9me3 and H3K27me3 at inactive or poised promoters (Fig. 7.4d), H3K27ac and H3K4me3 on active enhancers and promoters as well as H3K36me3 in transcribed gene bodies, respectively (Table 7.1). Poised genes, promoters and enhancers are found within facultative heterochromatin, i.e., the respective genomic regions are in a waiting position for activating signals. The integration of epigenome-wide datasets allows the identification of novel relationships between histone modifications and related chromatin structures. Chromatin states, as marked by histone modifications, characterize genomic elements, such as
108
7 Histone Modifications
a
Chromatin as accessibility barrier TF TF
TF
Open or accessible
TF TF
TF Closed
b
c
Active enhancer Ac
Active promoter 3 me
Ac
TFTF TF
TF Core promoter
e
Closed or poised enhancer me3
me3
Ac
Pol II
Enhancer
d
3 me
TSS
Ac
me3
me3
Primed enhancer
me3
TF
Enhancer
f
Latent enhancer Ac
Stimulus
Ac
TF Enhancer
DNA-binding proteins: TFs, CTCF, repressors and polymerases
TFs
me3
Ac
me3
H3K27me3
H3K4me3
H3K27ac H3K4me1
Fig. 7.4 Chromatin accessibility and histone marks. Chromatin restricts the access of transcription factors, Pol II and other nuclear proteins to the genome (a). Enhancers are often marked by H3K27ac and H3K4me1 modifications (b), while H3K27ac and H3K4me3 mark active promoters (c). Closed enhancers are termed poised when they carry both active histone marks (e.g., H3K4me1) as well as repressive marks (e.g., H3K27me3) (d). Enhancers are considered primed when they are pre-marked by H3K4me1 (e), while they are termed latent when they do not show any specific histone mark, but can become accessible through a stimulus (mostly an extracellular signal activating a signal transduction cascade) so that flanking nucleosomes acquire H3K4me1 and H3K27ac marks (f)
enhancers, promoters, insulators and gene bodies (Fig. 7.5). Thus, chromatin represents a cell type-specific filter of genomic sequence information that determines, based on the histone code, which genes are transcribed into RNA. Histone modification profiles allow the identification of distal enhancer regions, as they show relative H3K4me1 enrichment and H3K4me3 depletion. However, chromatin patterns at enhancer regions are variable, as they show enrichment not only for H3K27ac, but
7.3 Chromatin Modifiers
109 Active genes
Repressed genes
Pol II
Chromatin state RNA
Topologically associated domains (TADs)
Gene expression
Pol II
TF TF
Protein
Nucleosome position and chromatin accessibility me3
me3
Me
Me
me3
me3
ac
Me Me Me Me
Me
Development CpG DNA methylation
Heterochromatin
Gene body
TF
Promoter
Insulator
TF
Enhancer
Gene body
DNA
Promoter
Genome
Pol II
TF
Enhancer
TF
CTCF Cohesin ATAC-seq EP300 H3K27ac H3K4me1 H3K4me2 H3K4me3 H3K9ac Pol II H3K36me3 H3K27me3 H2AK119ubq H3K9me3 H4K20me3 DNAme
Fig. 7.5 Impact of the epigenome on gene expression. Chromatin acts as a filter for the genome concerning gene expression and, in this way, determines cell identity (bottom left). Epigenomic regulation happens at various scales of chromatin states (center), such as topological organization, chromatin accessibility, histone modifications and DNA methylation. Key histone modifications and binding of nuclear proteins that are characteristic for these chromatin states are indicated and distinguished between active and repressed genes (right). CTCF and cohesion are involved in chromatin organization, the HAT EP300 (also called KAT3B) marks enhancers and both Pol II and H3K36me3 indicate actively transcribed genes. For protein binding or histone modification lighter shades mark a lower or variable degree of modifications, while for DNA methylation it indicates that the genomic region can be regulated by methylation
also for H2BK5me1, H3K4me2, H3K9me1, H3K27me1 and H3K36me1, suggesting the redundancy of these histone marks (Box 7.1).
7.3 Chromatin Modifiers An average human cell has only some 100,000 open loci within its chromatin, i.e., more than 90% of the genome is buried in heterochromatin and therefore not accessible to transcription factors and Pol II. However, many of these accessible chromatin regions are not static as they are dynamically controlled by chromatin modifying and remodeling proteins (Fig. 7.6). These enzymes catalyze the methylation of genomic DNA (Sect. 6.1), the posttranslational modification of histone proteins (Sect. 7.1) or the positioning of nucleosomes (Sect. 8.1). Our genome expresses in a tissue-specific fashion hundreds of these chromatin modifiers and remodelers that recognize (read), add (write) and remove (erase) chromatin marks. Writer-type enzymes, such as HATs, KMTs and DNMTs, add acetyl or methyl groups to histone proteins or cytosines of genomic DNA, respectively. In contrast, eraser-type
110
7 Histone Modifications
Me
Me M
e
Open chromatin Me
Chromosome
Genomic DNA
Histone me3
Me Me
me3
5-methyl cytosine
Ac
Me
me3
me3
Me
me 3
Nucleosome Closed chromatin KMTs
KDMs Me
Me me3
Me
me3
Me
Ac Me
Me Me
Me
DNMTs
domain proteins
TETs Ac
MBD proteins
Bromo-, Chromo-, Tudor-, PWWP-
Ac
Writer Reader
HDACs
HATs
Eraser
Fig. 7.6 Central role of chromatin. Covalent modifications of histones and genomic DNA, such as methylations, control the accessibility of chromatin to transcription factors and other regulatory proteins (top). These chromatin marks are introduced by writers, interpreted by readers and can be removed by erasers (bottom). The interplay between these nuclear proteins is essential for controlling gene expression
enzymes, such as HDACs, KDMs and TETs, reverse these reactions and eliminate the respective marks. DNA methylation-specific reader-type proteins, such as MBD proteins and CTCF, were already discussed in Sect. 6.3. These proteins bind DNA depending on its methylation status. Moreover, also components of the chromatin remodeling complexes are able to read chromatin marks (Sect. 8.2). Acetyltransferases, which specifically acetylate lysines are termed KATs, are found in the nucleus and the cytoplasm. KATs that have histone proteins as substrates are mostly termed HATs. Cytoplasmic HATs acetylate histones H3 and H4 posttranslationally, which is important for being deposited onto chromatin during DNA replication and repair. KATs/HATs use acetyl-CoA as an essential cofactor to donate an acetyl group to the target lysine residue, but they can also use different acyl-CoAs as substrates for histone lysine acylation. The human genome encodes for 22 HATs, of which 11 are KATs. CREBBP (KAT3A) and EP300 (KAT3B) do not only acetylate histones, but also modify GTFs, such as TFIIE, signal-dependent transcription factors, such as p53, and architectural proteins, such as HMGA1 (high mobility group AT-hook 1). KATs are found at genomic regions that show high levels of histone acetylation, Pol II binding and gene expression. For example, KAT3A and KAT3B associate both with enhancer and TSS regions, whereas the binding of KAT2B (PCAF), KAT5
7.3 Chromatin Modifiers
111
(TIP60) and KAT8 (MYST1) is enriched in TSS and transcribed regions of active genes. In this context, KAT3A and KAT3B interact with the activation domains of numerous activated transcription factors, such as ligand-activated nuclear receptors or phosphorylated p53. The human genome also encodes for 18 members of the HDAC family taking care on the acetylation status of chromatin. The Zn2+ -dependent HDACs 1–11 act predominately in the nucleus and the cytoplasm, while nicotinamide adenine dinucleotide (NAD)+ -dependent sirtuins (SIRTs) 1–7 are found in addition also in mitochondria (Sect. 37.7). There are 66 human genes encoding KMTs and 20 for KDMs. Both types of enzymes use both histone and non-histone proteins as substrates, i.e., these enzymes control the methylation status of chromatin and other proteins. KDMs are either flavin adenine dinucleotide (FAD)-dependent monoamine oxidases or Fe(II) and α-ketoglutarate-dependent dioxygenases, i.e., like SIRTs they sense via these metabolites the energy status of cells (Sect. 37.1). The effects of chromatin modifiers, such as HATs and HDACs, are primarily local and may cover only a few nucleosomes up and downstream of the starting point of their action. The same applies to KMTs and chromatin remodeling enzymes, such as the SWI/SNF (switching/sucrose non-fermenting) complex (Sect. 8.2). In case there is more HAT activity, chromatin is locally acetylated, the attraction between nucleosomes and genomic DNA decreases and the latter gets accessible for activating transcription factors, GTFs and Pol II. In this euchromatin state chromatin remodeling enzymes fine-tune the position of the nucleosomes, in order to obtain full accessibility of the respective binding sites. In the opposite case, when HDACs are more active, acetyl groups get removed and the packing of chromatin locally increases. KMTs then methylate the same or neighboring amino acid residues in the histone tails that attract heterochromatin proteins, such as HP1, and further stabilize the local heterochromatin state. Specific histone marks are specifically recognized (read) by a large number of chromatin modifiers via a small set of common recognition domains (Fig. 7.7). Repressive proteins of the Polycomb family use chromatin-organization modifier domains (chromodomains) in order to interact with methylated chromatin. Some 10 different HATs have a plant homeodomain (PHD) finger, which is a specific reading motif for H3K4me2 and H3K4me3 marks. There are even 46 human proteins (HATs, HAT-associated proteins, KMTs, helicases, ATP-dependent chromatin remodeling proteins, transcriptional coactivators and nuclear scaffolding proteins) that carry a bromodomain in order to recognize acetylated lysines. Chromodomains are far more specific for a given chromatin modification than bromodomain proteins, i.e., chromodomain-containing nuclear proteins recognize their genomic targets with far higher accuracy. In addition, a smaller set of proteins use a YEATS domain for sensing acetylated and crotonylated lysines. Finally, proteins with a Tudor domain recognize methylated lysines and arginines.
112
7 Histone Modifications
me3
ac
Chromodomain (Polycomb) me3
K12 PDBID: 2DVQ
K27
H3K27me3
PDBID: 1PDQ
H3 K9
Bromodomain (BRD2) H4
Chromodomain (CBX5)
PDBID: 1KNE
H3
Ac H3/4Kac H3K9me3
H3
H3
H3K4me3
H3K4me3 me3
me3
Chromodomain (CHD1) K4 PDBID: 2F6J
K4 PDBID: 2B2W
Fig. 7.7 Histone reading proteins. There are three major types of domains, such as chromodomains, PHD fingers and bromodomains, by which histone modifications are recognized (read). While chromodomains and PHD fingers bind to specific histone methylations, bromodomains are rather unspecific and recognize all forms of acetylated histones. BPTF = bromodomain PHD finger transcription factor, BRD2 = bromodomain containing 2, CBX5 = chromobox 5, also called HP1
7.4 Gene Regulation via Chromatin Modifiers Cells are constantly exposed to a multitude of signals, such as the extracellular matrix, cytokines, peptide hormones and other active compounds, the majority of which are transmitted by receptors at the membrane. These extracellular signals induce via membrane proteins intracellular signal transduction cascades. These pathways often terminate at nuclear proteins, such as transcription factors, chromatin modifying and remodeling enzymes, i.e., they modulate the epigenome and transcriptome. Most of the signals vary over time and usually have an “on” or “off” character, but the resulting changes in the transcriptome rather resemble a waveform (Fig. 7.8, left). For example, a signal can either directly activate chromatin modifiers, which then write or erase histone marks, or act indirectly via the activation of chromatin remodelers that alter the nucleosome composition. In this way, chromatin-associated proteins act as signal converters and integrators. Since the methylation of histones has a longer half-life than its acetylation or phosphorylation, signals can be stored within the epigenomic landscape for shorter and longer time periods. Accordingly, the histone methylome is suited for a long-term
7.4 Gene Regulation via Chromatin Modifiers
113
Signal 3
Reader binding to modified sites
Signal 2
Signal 1 Writer or eraser
Remodeling enzyme Reader binding to adjacent sites
me3
Ac
P
Enzyme
Signal integration and interpretation Recruitment of a multivalent protein or complex recognition Enzyme
Transcriptional output of varying amplitude
Fig. 7.8 Signal storage and interpretation via chromatin modifiers and readers. Signals deriving from various, mostly membrane-based signal transduction cascades are integrated on chromatin through modifications at histone tails. Multiple inputs occurring over time can be stored. These inputs can affect chromatin directly or are transmitted via chromatin modifiers, such as the writers HATs and KMTs, as well as the erasers HDACs and KDMs and chromatin-remodeling proteins (left). There are a number of mechanisms how this dynamic epigenetic landscape is constantly interpreted by reader proteins, such as changing the ability of a reader protein to recognize a neighboring mark, recruiting enzymes that modify additional sites and creating a combinatorial display for recognition in various binding events (right). The net result of the signal integration can be observed as transcriptional output, i.e., as a change of the transcriptome (bottom left)
epigenetic memory. Histone modifications act in combination with DNA methylation and transcription factor activity (Fig. 7.8, right), which increases the diversity of their outputs. Some of the information stored in the histone modification pattern can even be maintained throughout DNA replication, i.e., a part of the histone marks can be inherited. Genome-wide histone modification maps correspond to different genomic features, such as promoters, enhancers and gene bodies, or activation states, such as actively transcribed, poised or silenced and often exist in combinations. The three main modes for the activity of genes are distinguished: • Active genes are expressed genes that are associated with histone acetylation, H3K4me1, 2 & 3 marks and H2A.Z occurrence in their TSS regions as well as
114
7 Histone Modifications
a number of different marks (H2BK5me1, H3K9me1, H3K27me1, H3K36me3, H3K79me1, 2 & 3 and H4K20me1) in their gene bodies. Highest levels of both HATs and HDACs are found associated within these genes. Their presence correlates positively with mRNA expression and Pol II levels. The antagonizing activities of the chromatin modifiers are the basis for precise fine-tuning of gene expression via the homeostasis of active chromatin loci and apply both for TSS and enhancer regions. Thus, active genes are found in euchromatin. • Poised genes are not expressed and do not associate with significant histone acetylation, but they show H3K4 methylation marks and occurrence of the histone variant H2A.Z. As long these genes wait for their activation, only low level of HATs or HDACs are associated with them, they are found in facultative heterochromatin. A cycle of transient acetylation and deacetylation keeps these genes primed but inactive and maintains their promoter regions in a poised state waiting for future activation via external signals. • Silent genes either carry H3K27me3 marks together with Polycomb proteins or do not have at all any known chromatin marker. At these genes neither HATs nor HDACs are found and they are located within heterochromatin. Taken together, chromatin modifiers maintain the epigenome and in this way control gene expression. Thus, these nuclear enzymes have central importance during embryogenesis as well as in cell fate decisions in health and disease. (Clinical) Conclusion: There more than 130 ways to posttranslationally modify histone proteins. This tremendous capacity to store information represents the second column of the epigenome. Histone acetylations are primarily used for short storage of epigenetic information, such as transient changes in gene expression. In contrast, signals based on histone methylation last longer and interfere with long-term epigenetic memory stored on the level DNA methylation.
Additional Reading Atlasi, Y., & Stunnenberg, H. G. (2017). The interplay of epigenetic marks during stem cell differentiation and development. Nature Reviews Genetics, 18, 643–658. Blackledge, N. P., & Klose, R. J. (2021). The molecular principles of gene regulation by Polycomb repressive complexes. Nature Reviews Molecular Cell Biology, 22, 815–833. Janssen, S. M., & Lorincz, M. C. (2022). Interplay between chromatin marks in development and disease. Nature Reviews Genetics, 23, 137–153. Li, X., Egervari, G., Wang, Y., Berger, S. L., & Lu, Z. (2018). Regulation of chromatin and gene expression by metabolic enzymes and metabolites. Nature Reviews Molecular Cell Biology, 19, 563–578.
Additional Reading
115
Martire, S., & Banaszynski, L. A. (2020). The roles of histone variants in fine-tuning chromatin organization and function. Nature Reviews Molecular Cell Biology, 21, 522–541. Morgan, M. A. J., & Shilatifard, A. (2020). Reevaluating the roles of histone-modifying enzymes and their associated chromatin modifications in transcriptional regulation. Nature Genetics, 52, 1271–1281. Sabari, B. R., Zhang, D., Allis, C. D., & Zhao, Y. (2017). Metabolic regulation of gene expression through histone acylations. Nature Reviews Molecular Cell Biology, 18, 90–101. Sheikh, B. N., & Akhtar, A. (2019). The many lives of KATs—Detectors, integrators and modulators of the cellular environment. Nature Reviews Genetics, 20, 7–23.
Chapter 8
Chromatin Remodeling and Organization
Abstract In this chapter, we will learn that nucleosome positioning around TSS regions has an important role on coordinated gene activation of promoter regions. In this context, we will discuss that chromatin modification and remodeling machineries allow the transition from a repressed state to an active state. Chromatin remodeling factors are multiprotein complexes that use the energy of ATP hydrolysis, in order to remodel or remove nucleosomes regulating the exposure of genomic DNA to transcription factors. Global changes in gene expression correlate with spatial chromatin reorganizations that play a significant role during development. Thus, transcriptionally active genes are involved in the process that directs the architecture of the nucleus in differentiated tissues and cell types. In the interchromatin compartment of the nucleus there are subnuclear structures, such as transcription factories, that contain high concentrations of Pol II. Transcription factories function as an attractor for commonly regulated genes with shared nuclear positions. This suggests that the transcriptional status of a gene is based on the position in the sphere of the nucleus. Keywords Nucleosome positioning · Chromatin remodeling · ATP-dependent remodeling complex · Transcriptional dynamics · 3D chromatin organization · Chromosome territory · Transcription factory
8.1 Nucleosome Positioning at Promoters Constitutively active genes like housekeeping genes have open chromatin at the genomic regions containing their critical TFBSs (Fig. 8.1a). Although there is always a dynamic competition between nucleosomes and transcription factors at regulatory regions, housekeeping genes use mechanisms that favor the binding of transcription factors over that of nucleosomes, such as the recruitment of appropriate chromatin modifiers (Sect. 7.3). Thus, constitutively active genes typically have a nucleosomedepleted region upstream of their TSS, within which key TFBSs reside. Experimentally these regions are often detected as DNase hypersensitivity regions and were traditionally considered to be nucleosome-free. However, in reality there is a gradient of depletion, so that the term “nucleosome-depleted region” is more appropriate. © The Author(s), under exclusive license to Springer Nature Switzerland AG 2023 C. Carlberg et al., Molecular Medicine, https://doi.org/10.1007/978-3-031-27133-5_8
117
118
8 Chromatin Remodeling and Organization
a
-1 nucleosome
+1 nucleosome
TF TSS
TFBS Positioned
Poly (dA:dT) often TATA -less
Strongly “Statistically” positioned positioned
b TF STEP 1 Regulated TF binding
TF T
TFBS
TFBS
TSS
TFBS
STEP 2 Chromatin remodeling and additional TF binding
TF
TFBS
TF
TFBS
TF
TFBS
T TSS TATA-containing variable placement
Fig. 8.1 Properties of open and closed promoters. A common feature of constitutively active genes is an open TSS region, i.e., a depleted proximal nucleosome neighboring to the TSS (a). In contrast, a common feature of highly regulated genes is to have in their repressed state a closed core promoter, i.e., a nucleosome next to the TSS (not shown). On covered promoters, nucleosome positioning sequences of varying strength and locations help to define nucleosome positions and promoter architecture (b)
8.2 Chromatin Remodeling
119
Robust transcriptional activity, such as of housekeeping genes, requires nucleosome depletion, whereas transcriptional regulation of other genes involves nucleosomes repositioning (Fig. 8.1b). Genome-wide studies indicated that often a 200 base pairs nucleosome-depleted region upstream from the TSS is flanked on either side by well-positioned nucleosomes. The +1 nucleosome plays a central role in determining the activity of Pol II. At active genes the +1 nucleosome is found approximately 40 base pairs downstream of the TSS, while at inactive genes the nucleosome it is only 10 base pairs downstream. A common finding from Pol II ChIP-seq studies is a clear enrichment of Pol II at TSS regions compared with the gene body. Thus, Pol II is frequently stalled at the +1 nucleosome. This stalling is also referred to as “poising” (Sect. 3.3), when transcription is blocked until a signal for activation or release is received, or as “pausing”, when Pol II is slowed down immediately downstream of the TSS. Therefore, the +1 nucleosome either physically blocks the progression of Pol II or regulates the presence and/or activity of proteins that support Pol II to overcome the stalling. For example, the +1 nucleosome shows high levels of H3K4me3 that is bound by the TAF3 subunit of the basal transcriptional machinery. Even though the H3K4me3 mark is generally associated with active promoters, it is also present on promoters with non-elongating Pol II. Thus, H3K4me3 is not exclusively a marker for active promoters but represents also poised TSS regions. For some genes, such as those being important during embryogenesis, poising is a strategy for rapidly starting transcription in response to a stimulus (Sect. 11.3). However, for genes with broad core promoters poising or other kind of stalling may only reflect open chromatin. Moreover, the least efficient phase in transcription is early elongation, so that accumulation of Pol II not much downstream of the TSS can also be a kinetic effect. Nevertheless, in poised genes elongation is actively regulated, in order to release Pol II for achieving transcriptional bursts, i.e., rapid increases of transcribed mRNA. Genes with active Pol II show phasing of nucleosomes within their coding region, i.e., their accurate positioning in relation to the +1 nucleosome. This region serves as a boundary for positioning nucleosomes after Pol II pauses. For example, the positioning of nucleosomes at exons can function as “speed bumps” that enhance splicing by slowing down Pol II. The increased Pol II occupancy at the gene bodies then provides time to recruit the splicing machinery during transcription and results in improved recognition of splicing signals.
8.2 Chromatin Remodeling A cell’s phenotype depends on its gene expression pattern, which basically is influenced how genomic DNA is packed into chromatin. Nucleosomes often block the access of transcription factors to their genomic binding loci, since the packing of genomic DNA around histone octamers hides one side of the DNA. Within a stretch of 200 base pairs of genomic DNA 147 base pairs contacting a histone octamer, i.e., some 75% are not easily accessible to regular transcription factors. Binding sites that are located close to the center of these 147 base pairs are generally inaccessible to
120
8 Chromatin Remodeling and Organization
transcription factors. Sites closer to the edge of the nucleosome-covered sequence are a bit better reachable, but only within the 50 base pairs between two neighboring nucleosomes genomic DNA is fully accessible. This is sufficient space for the binding of transcription factors (Chap. 3). Thus, in some cases only minor shifts in the position of the nucleosomes are necessary in order to get TFBSs accessible, whereas in other cases a whole nucleosome needs to be depleted. Since nucleosomes have a rather strong electrostatic attraction for genomic DNA, the catalysis of the sliding, removal or exchange of individual subunits, or even the eviction of whole nucleosomes has to dissolve all histone-DNA contacts and requires the investment of energy in the form of ATP. Thus, chromatin remodelers are multiprotein complexes that use the energy of ATP hydrolysis in order to affect nucleosomes in at least four ways (Fig. 8.2). These are: • the movement (sliding) of the histone octamer to a new position within the same chromatin region
Sliding
Ejection Ejected octamer
H2A.Z
Exchanged H2A dimer
Selective dimer exchange
Selective dimer removal
H2A-H2B dimer removal
Fig. 8.2 Mobility and stability of nucleosomes. Chromatin remodelers enable access to genomic DNA through sliding, ejection, H2A-H2B dimer removal or selective dimer exchange from nucleosomes. ATP-dependent remodeling complexes as well as thermal motion influence the mobility of nucleosomes. The stability of nucleosomes is affected by its detailed octamer composition and the pattern of histone modifications. For example, the incorporation of histone variants into nucleosomes alters the interactions with histone and non-histone proteins
8.3 Organization of Chromatin in the Nucleus
121
• the complete displacement (ejection) of the histone octamer, e.g., from TSS regions of heavily expressed genes • the exchange of regular histones by their variant forms, such as H2A by H2A.Z (Box 2.2) • the removal of H2A-H2B dimers from the histone octamer. ATP-dependent remodeling is crucial for both the assembly of chromatin structures and their dissolution. About 30 human genes encode for subunits of four different chromatin remodeling complexes (Fig. 8.3). Although these different complexes share common properties, they are also specialized for particular tasks. The ATPases in the core of the chromatin remodeling complexes are genetically non-redundant, but they all increase nucleosome mobility with different efficiencies and outcomes. The investment of energy for this process is necessary, since both sliding and ejection of nucleosome from genomic DNA has to dissolve all histoneDNA contacts requiring approximately 12–14 kcal/mol. The remodeling processes involve the dissociation of genomic DNA at the edge of the nucleosome and form a DNA bulge on the histone octamer surface. The DNA loop then propagates across the surface of the nucleosome in a wave-like manner, resulting in the repositioning of DNA without changes in the total number of histone-DNA contacts. Remodeling complexes contain proteins with bromodomains, chromodomains and PHD domains that can read histone marks (Sect. 7.3). For example, ISWI remodelers use a PHD domain for targeting H3K4me3 marked histones, in CHD remodelers chromodomains bind to methylated histones, in SWI/SNF remodelers a bromodomain is used for recognizing acetylated histone H3, while INO80 remodelers employ a bromodomain for binding to acetylated H4. The action of the SWI/SNF complex is mostly associated with transcriptional activation. Interestingly, the activity of many chromatin remodelers is affected by the presence of histone variants that they themselves introduce into the chromatin, i.e., they control each other’s action through the exchange of histones (Fig. 8.4). The histone variants MacroH2A and H2A.Bbd reduce the efficiency of the SWI/SNF complex, whereas H2A.Z stimulates remodeling by ISWI complexes. The INO80 complex removes H2A.Z from inappropriate locations. In general, H2A.Z resides at open TSS regions and positively regulates gene transcription. The unique aminoterminal tail of this histone variant becomes acetylated when a gene is active.
8.3 Organization of Chromatin in the Nucleus Within the interphase nucleus the position of a gene, such as being located in the center or at the borders, is important for its expression. This leads to the question, whether the nuclear location is an independent and functionally important epigenetic parameter or whether it is only the consequence of the action of transcription factors in context with chromatin. Since each tissue is characterized by its own selection of active and inactive genes, different cell types can be distinguished by individual
122
8 Chromatin Remodeling and Organization
SWI/SNF family
ATPase
SMARCA4/2 SMARCD 1/2/3 SMARCC1 SMARCC2
HSA
DExx
HELICc
BROMO
ISWI family BPTF DExx
SANT
HELICc
SLICE
SMARCA5
CHD family
HDAC1
MBD3
CHD3
MTA 1/2/3
HDAC2
RBBP4
DExx
HELICc
Chromo domain
INO80 family RUVBL1/2 ACTL6A
HSA
INO80
DExx
HELICc
ACTR5/8
Fig. 8.3 Chromatin remodeling complexes. Chromatin remodelers are divided into four main families on the basis of the sequence and structure of the ATPase subunit: SWI/SNF, ISWI, CHD and INO80 complexes. Most of these names derive from the nomenclature in yeast, where these complexes were first discovered and characterized. Remodeling complexes contain proteins with bromodomains and chromodomains that can read histone marks. Some histone modifications promote ATP-dependent chromatin remodeling by creating binding sites for remodelers. For example, acetylation of nucleosomes promotes the recruitment of SWI/SNF remodelers through their acetyl group binding bromodomain and increases remodeling efficiency. In contrast, the activities of ISWI and CHD complexes are inhibited by histone acetylation. In general, ISWI complexes remodel nucleosomes that lack acetylation, such as at H4K16, i.e., their activity is focused on transcriptionally inactive regions. Furthermore, CHD complexes contain HDACs 1 and 2, i.e., they also have HDAC activity. ACTL6A = actin like 6A, ACTR = actin related protein, MTA = metastasis associated, RBBP4 = RB binding protein 4, chromatin remodeling factor, RUVBL = RuvB like AAA ATPase, SMARC = SWI/SNF related, matrix associated, actin dependent regulator of chromatin
patterns of active and inactive chromatin regions. The clustering of heterochromatin marked by H3K27me3 at the nuclear periphery creates silencing foci, referred
8.3 Organization of Chromatin in the Nucleus
Nucleosome assembly
123
Chromatin access
Nucleosome editing
DNA Deposition of H3–H4 tetramers or H2A–H2B dimers
ATP
INO80
Chromatin alteration
SWI/SNF ADP
Repositioning
ATP
Histone exchange
ADP
OR Random deposition
Irregular spacing Nucleosome ejection
ATP
ISWI CHD
Nucleosome maturation, assembly and spacing ADP
Installation or removal of histone variants
OR Histone dimer eviction
Regular spacing
Fig. 8.4 Function of human chromatin remodeling enzyme complexes. ISWI and CHD remodelers are involved in the deposition of histones, the maturation of nucleosomes and their spacing (left). SWI/SNF remodelers alter chromatin by repositioning nucleosomes, ejecting octamers or evicting histone dimers (center). INO80 remodelers change nucleosome composition by exchanging core and variant histones, such as installing H2A.Z variants (right). ISWI complexes create nucleosome arrays of uniform spacing by sliding the nucleosomes until the linker DNA reaches the same fixed distance. In contrast, SWI/SNF complexes disorganize the nucleosome position that makes TFBSs accessible. Most chromatin remodeling complexes can eject nucleosomes, but ISWI complexes lack this activity
to as Polycomb bodies (Fig. 8.5). These are complexes of members of the Polycomb family, such as the components of PRC1 and PRC2. PRCs act as transcriptional repressors that are essential for maintaining tissue-specific gene expression programs, i.e., they ensure the long-term repression of specific target genes. The nuclear lamina also binds and silences large regions of heterochromatin organized in LADs (identical to lamin-associated TADs), i.e., interactions of genomic regions with lamin proteins are central in reducing gene expression. Thus, in association with the nuclear periphery silenced genes and gene-poor chromosome territories are found. However, the position of chromatin and with that the position of genes, is not fixed but there are dynamic changes in the contacts between the nucleoskeleton and genomic DNA involving single genes or small gene clusters. These changes are most pronounced during development. For example, ES cells possess dispersed chromatin with limited compaction. However, during differentiation the cells show changes in their chromatin structure that include larger compaction of genomic domains. In the same way, embryonic development proceeds from a single cell with dispersed chromatin to differentiated cells with nuclei that show compact chromatin domains being located in the periphery. This indicates that the physical
124
8 Chromatin Remodeling and Organization
Cellular membrane Transcription factory Repressive Polycomb bodies
Nuclear lamina Nuclear envelope Nuclear pore
Cytoplasma
H3K4me1, H3K4me2, H3K4me3, H3K36me3, H4K20me1 H3K4me3, H3K36me3, H4K20me1, H2BK5me1 H3K9me2, H3K9me3 H3K9me2, H3K9me3 H3K27me3
Nucleus
Fig. 8.5 Chromatin modification signatures associate with relative position features in the nucleus. Histone modifications correlate with the position within the nucleus: chromatin modifications that are generally associated with active transcription (green nucleosomes) are often found in the center of the nucleus, whereas chromatin with generally repressive modifications (orange nucleosomes) is associated with the nucleoskeleton. Regions with active modifications (blue nucleosomes) may participate in transcription factories (purple Pol II in the center). Blocks of histone H3K27me3 (dark red nucleosomes) may be components of Polycomb bodies (yellow)
relocation of a gene from the nuclear periphery to the center unlocks it to be expressed in a future developmental stage. Although chromosomes are microscopically not visible in an interphase nucleus, they occupy specific chromosome territories. This represents another level of chromatin architecture. In their territories, chromosomes fold so that active and inactive TADs are found in distinct nuclear compartments. Active regions are preferentially located in the nuclear interior, whereas inactive TADs accumulate at the periphery. In addition, TADs that are heavily bound by tissue-specific transcription factors are in different neighborhoods than those interacting with repressive PRCs. To some extent, chromosome territories intermingle, which could explain interchromosomal interactions. Nevertheless, interactions between loci on the same chromosome are much more frequent than contacts between different chromosomes. Since the volumes of chromosome territories depend on the linear density of active genes on each chromosome, chromatin with higher transcriptional activity occupies larger volumes in the nucleus than silent chromatin. The two main experimental approaches for studying 3D genome organization are FISH (fluorescence in situ hybridization) and 3C (chromosome conformation
8.3 Organization of Chromatin in the Nucleus
125
capture)-based methods (Sect. 10.2). FISH is a molecular cytogenetic method using fluorescent oligonucleotides that detect genomic regions with a high degree of sequence complementarity. FISH is often used for the diagnostic of genetic diseases, but is also applied for defining spatial–temporal patterns of gene expression within cells and tissues. Moreover, FISH live-cell imaging provided dynamic views of chromatin domains, while 5C (chromosome conformation capture carbon copy), Hi-C (high-throughput chromosome capture) and ChIA-PET (chromatin interaction analysis by paired-end tag sequencing) mapped the whole genome in kb resolution for chromatin loops, such as TADs/LADs. The latter methods are performed with large cell populations and thus provide a probabilistic view of chromosome folding and nuclear organization. In contrast, in FISH multiple individual cells are analyzed, i.e., both methods are complementary to each other and may be used for cross-wise validation. However, there is significant cell-to-cell and time-dependent variation in chromatin folding, so that the spatial distance between two genomic loci can show a rather wide distribution. 3C-based methods detect only events in cells, in which two loci are in close proximity, while FISH can determine the spatial distance between the loci in any cell. Thus, both methods investigate different subpopulations of cells and may lead to apparent inconsistencies. The 4D Nucleome project (https:// commonfund.nih.gov/4Dnucleome/index) aims to overcome this problem via developing and employing a range of genomic, imaging and modeling methods to study 3D genome organization. Box 8.1: 3C-Based Methods 3C is a method that can identify loops of genomic DNA being mediated by long-range protein–protein interactions. These loops may represent a connection between a transcription factor binding to an enhancer region and the basal transcriptional machinery assembled on a TSS region. The 3C method involves cross-linking of segments of genomic DNA to proteins and of proteins with each other (like in ChIP, Sect. 10.2), restriction digestion of the cross-linked DNA, in order to separate non-crosslinked DNA from the cross-linked chromatin, intramolecular ligation of neighboring, previously cross-linked DNA fragments with the corresponding junctions, reverse cross-linking resulting in linear DNA fragment with a central restriction site corresponding to the site of ligation and quantitative PCR using primers and Taqman probes against the site of ligation to measure quantitatively the fragment of interest. The frequency with which two restriction fragments become ligated indicates how often they interact in the nucleus. In genome-wide versions of the 3C method, such as circularized chromosome conformation capture (4C), 5C and Hi-C, the 3C protocol is combined with high-throughput genomic methods, which is greatly enhancing the power of discovery. Moreover, ChIA-PET incorporates a ChIP step into the 3C protocol and enriches interactions between genomic regions that are bound by specific proteins.
126
8 Chromatin Remodeling and Organization
Global analyses of chromatin contacts in human cells, such as performed by Hi-C, indicate that individual TADs are separated by each other by boundary regions that are enriched both for enhancer markers, such as H3K4me1, and signs for repression, such as H3K9me3 (Fig. 8.6). Often TAD boundaries are identical with insulators and bind CTCF, i.e., they separate functionally distinct regions of the genome from each other (Sect. 6.3). In this way, CTCF is not only involved in smaller-scale DNA looping resulting in enhancer-promoter contacts, but also in larger-scale loop formation. Thus, TADs are the units of chromosomal organization and segregate the human genome into at least 2000 domains containing coregulated genes. Based on higher resolution Hi-C maps the number of TADs may be 5-times larger and their average size is accordingly lower. The interchromosomal space located between chromosome territories contains a variety of nuclear substructures that are referred to as “speckles”, “foci”, “spots” and “bodies”. The composition and number of these substructures depends on the cell type. The master example for this spatial organization is the activity of RNA polymerase I in the nucleolus, in which ribosomal genes are concentrated. RNA polymerase I and its associated partner proteins are found in 200–500 nm diameter complexes in centers within the nucleolus that are termed “factories”. In these factories rRNA transcripts move across the surface and extrude nascent transcripts into the surrounding component of the nucleolus. Interestingly, actively transcribing Pol II is also distributed non-uniformly within interchromosomal spaces and is concentrated in transcription factories (Fig. 8.7). These dynamic foci of Pol II, transcription factors, coactivators and chromatin modifiers, in particular at super-enhancers, are also referred as hubs, clusters or condensates. The number of transcription factories/condensates per nucleus varies from a few hundreds to several thousands and differs between cell types and their differentiation state. The size of these factories ranges between 45 and 100 nm in diameter as determined by electron microscopy. They include, based on the number of nascent RNA transcripts, up to eight Pol II molecules. The model of Pol II being immobilized at preassembled transcription factories implies the idea that gene loci move to the RNA polymerase being already present in a factory rather than the whole transcriptional machinery would be recruited to the chromatin template and moved along it. This may happen by a controlled and directed motion of chromatin fibers and may promote the assembly of transcription factories. Accordingly, during transcriptional elongation distinct genes are brought into close vicinity and pulled through the relatively immobile Pol II complexes. The spatial nuclear organization may not be absolutely essential for transcription, but it clearly enhances its efficiency. Gene transcription requires the assembly of large complexes, such as chromatin remodelers, chromatin modifiers, the MED complex and the basal transcriptional machinery and involve many distinct protein– protein and protein-DNA interactions. Therefore, the efficiency of transcription is clearly enhanced, when some of these protein complexes are already concentrated in specific parts of the nuclear space. Moreover, recycling of Pol II back to TSS regions of highly expressed genes can be facilitated, if Pol II cannot easily diffuse away
chr3
Interchromosomal
chr2
chr4
H3K27me3 H3K36me3 41Mb
TAD
50 kb resolution
chr2
79 Mb
CTCF
H3K27me3 H3K36me3 65.5 Mb
TAD
Cohesin
10 kb resolution
chr2
73.2 Mb
TF
TF
Cohesin
CTCF
TF
Architectural loop
ter
Pol II
Mediator complex Pro mo
TF
Enhancer
Cohesin Pol II
CTCF
chr2
Pol II
Gene loop
71.86 Mb
TF TF
Polycomb
Polycomb-mediated
5 kb resolution Enhancer-promoter
H3K27me3 H3K36me3 CTCF motif CTCF 71.4 Mb
Fig. 8.6 Hierarchy of chromatin architecture. Hi-C data of four levels of resolution (top) are schematically interpreted (bottom) as interchromosomal interactions between intermingled chromosome territories (left), TADs with interdomain interaction (center left), TADs (center right) and enhancer-promoter loops (right). Within Hi-C maps, chromatin loops and TADs are typically recognizable as neighboring triangles. These indicate that regions within the same TAD interact with each other more often than with regions of neighboring TADs. The distinction into TADs correlates with many features of the linear genome, such as patterns of histone modifications or gene expression as well as association with nuclear lamina
chr1
8.3 Organization of Chromatin in the Nucleus 127
128
8 Chromatin Remodeling and Organization
Gene transcript Inactive gene 3’ Enhancer intergenic transcript Inactive gene
Boundary element Pol II
Boundary element
3’ Enhancer elements
Enhancer elements
Pol II Intergenic transcript Pol II
Chromatin loop emerges Anti-sense intergenic transcript Birectional ncRNA (intergenic promoter)
Pol II
Potentiated gene with distal 3’ enhancer elements
Fig. 8.7 Model of a transcription factory. Genes extend out of their chromosome territories, both in cis and in trans, in order to access a shared transcription factory. DNA binding factors are indicated by colored circles
from the template. Thus, the transcription factory model is important for understanding the regulation of initiation and elongation of transcription, the genomic organization of genes, the coregulation of genes and possible instabilities of the genome. (Clinical) Conclusion: The 3D organization of chromatin represents the third equally important level of the epigenome. Thus, the position of a gene within the nucleus is of central importance for its activity.
Additional Reading Bhat, P., Honson, D., & Guttman, M. (2021). Nuclear compartmentalization as a mechanism of quantitative control of gene expression. Nature Reviews Molecular Cell Biology, 22, 653–670. Clapier, C. R., Iwasa, J., Cairns, B. R., & Peterson, C. L. (2017). Mechanisms of action and regulation of ATP-dependent chromatin-remodeling complexes. Nature Reviews Molecular Cell Biology, 18, 407–422.
Additional Reading
129
Finn, E. H., & Misteli, T. (2019). Molecular basis and biological function of variability in spatial genome organization. Science, 365, eaaw9498. Furlong, E. E. M., & Levine, M. (2018). Developmental enhancers and chromosome topology. Science, 361, 1341–1345. Haws, S. A., Simandi, Z., Barnett, R. J., & Phillips-Cremins, J. E. (2022). 3D genome, on repeat: Higher-order folding principles of the heterochromatinized repetitive genome. Cell, 185, 2690– 2707. Kempfer, R., & Pombo, A. (2020). Methods for mapping 3D chromosome architecture. Nature Reviews Genetics, 21, 207–226. Lakadamyali, M., & Cosma, M. P. (2020). Visualizing the genome in high resolution challenges our textbook understanding. Nature methods, 17, 371–379. Misteli, T. (2020). The self-organizing genome: Principles of genome architecture and function. Cell, 183, 28–45. Rowley, M. J., & Corces, V. G. (2018). Organizational principles of 3D genome architecture. Nature Reviews Genetics, 19, 789–800.
Chapter 9
Regulatory Impact of Non-coding RNA
Abstract In this chapter, we will present that RNA molecules are more than just messengers between genes and proteins. The human genome is extensively transcribed also outside protein coding regions giving rise to tens of thousands of ncRNAs. Not all of these transcripts are functional, however, many ncRNAs have regulatory specificity, i.e., some of them function similarly to proteins. For example, miRNAs are small ncRNAs that regulate posttranscriptionally the expression of several thousand genes. They share many similarities together with transcription factors and therefore are useful for different regulatory processes. The most effective targets of miRNAs are members of signal transduction cascades, such as receptors, kinases and transcription factors. Long ncRNAs have a number of mechanisms available to regulate biological processes, such as the initiation of the imprinting process XCI via Xist. A special variant of long ncRNAs are eRNAs that are produced bidirectionally at enhancer regions, when the latter interact with promoter regions. Keywords Hidden transcriptome · Long ncRNA · miRNA · eRNA · XCI · Xist · Heterochromatin · Transcription factor
9.1 Non-Coding RNAs From the evolutionary perspective, ncRNAs are an ancient version of proteins, i.e., they existed even before the occurrence of proteins and have functions similar to enzymes and structural proteins. The transcriptome-wide detection of RNA molecules, initially via DNA tiling arrays, such as oligonucleotide-based microarrays and then by NGS methods, such as RNA-seq (Box 3.2), provided the surprising result that the proportion of the human genome being transcribed is far larger than formerly expected. For protein-coding genes new splicing variants and additional exons and TSS regions were discovered, but also additional ncRNA molecules were found within, close to or in larger distance to protein-coding genes. These RNA molecules are either independent transcripts with own TSS regions or are processed parts of larger RNA precursors, such as spliced introns of pre-RNAs. The additional
© The Author(s), under exclusive license to Springer Nature Switzerland AG 2023 C. Carlberg et al., Molecular Medicine, https://doi.org/10.1007/978-3-031-27133-5_9
131
132
9 Regulatory Impact of Non-coding RNA
transcripts were found both in sense and in antisense orientation in relation to proteincoding genes. Some of the transcripts are remainders of the long evolution of the human genome, such as pseudogenes and integrated retrovirus genomes. Some of the functions of this “hidden transcriptome” are not fully understood. Therefore, the present model of understanding gene regulation is still dominated by proteins. From the nearly 200,000 known human RNA transcripts (Table 2.1) the majority (60%) are ncRNAs, while less than 2% are precursors to miRNAs. In addition, 12.5% are long ncRNAs that map to intergenic and intronic regions. Moreover, another 7% of the annotated transcripts are ncRNA originating from pseudogenes, i.e., genes that have lost their original functional abilities. However, some pseudogenes regulate gene expression by acting as decoys for miRNAs. Regular proteins open reading frames, i.e., the genetic codes determines where protein translation starts and ends. In contrast, there is no comparable genetic code for ncRNA genes, i.e., their function is hard to identify by computational methods alone. Many short ncRNAs derive from long ncRNAs (Table 9.1). The roles of ncRNA genes are quite diverse, including gene regulation, such as by miRNAs, RNA processing in splicing like by small nucleolar RNAs (snoRNAs) and protein synthesis like by tRNAs and rRNAs. Moreover, also full-length long ncRNAs themselves can have a biological role, such as controlling chromatin accessibility. For example, the RNA product of the Xist gene initiates XCI (Sect. 9.3). Many ncRNAs are transcribed from intergenic regions around genes, such as enhancers and promoters and therefore called eRNAs (Sect. 9.4). Thus, the gene regulatory Table 9.1 The complexity of ncRNAs. The number, size and function of short and long ncRNAs is indicated. nt = nucleotides Short ncRNA
No
Length (nt)
Functions
miRNA
>2500
>100
Precursors to short regulatory RNAs (21–23 nt)
snoRNA
>1500
>1000
Precursors to shorter RNAs (60–300 nt) that help to chemically modify other RNAs
snRNA
>2000
>1000
Precursors to shorter RNAs (150 nt) that assist in RNA splicing
piRNA
~100
Unknown
Precursors to short (25–33 nt) RNAs that repress retro-transposition of repeat elements
tRNA
~600
>100
Precursors to short transfer RNAs (73–93 nt)
>5000
100–1000
Mostly unknown, but some are involved in gene regulation through RNA interference Unknown
Long ncRNAs Antisense ncRNA Enhancer ncRNA
>2000
>1000
Intergenic ncRNA
>6000
100–10,000 Mostly unknown, but some are involved in gene regulation
Pseudogene ncRNA >10,000
100–10,000 Mostly unknown, but some are involved in regulation of miRNA
9.2 miRNAs and Their Regulatory Potential
133
potential of ncRNAs, in particular of miRNAs, is similar to that of transcription factors (Sect. 9.2).
9.2 miRNAs and Their Regulatory Potential The stability of mRNA molecules is regulated by miRNAs for the time span that they are needed as templates for translation. Accordingly, microRNAs have sequences, which are complementary to the 3, -UTR of their target mRNAs. Mature miRNAs are typically only 22 nucleotides long, but the length of their primary transcripts can be hundreds to thousands of nucleotides (Fig. 9.1). In the canonical pathway of miRNA biogenesis precursor RNAs are transcribed by Pol II from intergenic or intronic genomic loci. In contrast, in the non-canonical miRNA pathway, miRNAs are transcribed directly as endogenous short, hairpin RNAs or derive from mirtrons, i.e., through splicing from introns that can refold into hairpins. In both cases the primary miRNA (pri-miRNA) transcripts contain hairpin structures. These are recognized and processed by a complex of the proteins Drosha (a RNase III-type endonuclease) and DGCR8 (DiGeorge syndrome critical region gene 8). The complex generates a 70 nucleotides stem-loop structure, referred to as precursor miRNA (pre-miRNA), that is actively exported from the nucleus to the cytoplasm. There the complex of the proteins Dicer (another RNase III-type endonuclease) and TRBP (transactivation-response RNA binding protein) recognizes the pre-miRNA. Dicer cleaves this precursor and generates in this way the 22 base pairs of the mature miRNA duplex. Only one strand of this double-stranded miRNA binds to the protein AGO2 (Argonaute RISC catalytic component 2) of the RNA-induced silencing complex (RISC). Nucleotides 2 to 8 of the mature miRNA are referred to as “seed sequence”, which is complementary to sequences in the 3, -UTR of mRNAs. This RNA-RNA hybrid is by recognized by the RISC complex, which inhibits target mRNA expression via its degradation. This involves the removal of the polyA tail via increasing the activity of deadenylases and blocking the initiation or elongation step of protein translation. The copy number of an individual miRNA is in average approximately 500 molecules per cell, which is higher than the average expression of individual mRNAs. However, miRNA species differ in their concentration over a dynamic range of 4 or more orders of magnitude. For example, there are cell type-restricted miRNAs with more than 10,000 copies per cell. The human genome encodes for more than 2500 different miRNAs. The database miRBase provides information on the location and sequence of the mature miRNA sequence and also determines the miRNA nomenclature (Box 9.1).
134
9 Regulatory Impact of Non-coding RNA
Passenger strand degradation
Cytoplasma
-
and e str guidbinding 451 NA- mRNA iR m ased b
miRISC GW182
AGO2 PABPC1 CNOT7 AAAAAA CCR4
Dicer TRBP
AGO2
pre-miRNA
pre-miRNA-451
miRNA/miRNA* duplex
Translational repression and/or deadenylation
AGO2
(A)n
ac-pre-miRNA Endonucleolytic cleavage and mRNA degradation
Exportin 5
Nuclear envelope
pre-miRNA Drosha
Processing
Splicing
E1
DGCR8
pri-miRNA Pol II Canonical processing
Nucleus
E1 E2 AAAA Mature RNA Cap E2 Spliceosome
E1
E2
Pol II Mirtrons
Fig. 9.1 Biogenesis of miRNA. A special feature of miRNA genes is the folding of their primary RNA transcripts (pri-miRNAs) into hairpin structures that the miRNA biogenesis machinery specifically recognizes and processes. miRNAs are encoded either by individual genes with their own TSS regions or as miRNA gene clusters that are transcribed as a single pri-miRNA. In addition, intron regions of protein-coding genes sometimes contain miRNA genes. The Drosha-DGCR8 protein complex recognizes the hairpin regions of pri-miRNAs and processes them through cleavage at the double-stranded stem region. These pre-miRNAs are exported from the nucleus to the cytoplasm, where the Dicer complex recognizes and processes them into 22 base pairs double-stranded mature miRNAs. Through binding one strand of the mature miRNA the AGO2-containing RISC complex specifically recognizes target mRNAs by partial base-pairing. This then blocks the translation of the mRNA target and leads to its degradation. CNOT7 = CCR4-NOT transcription complex subunit 7, PABPC1 = poly(A) binding protein cytoplasmic 1
Box 9.1: miRNA Nomenclature The numbering of miRNA genes is simply sequential. The names/identifiers in the database miRBase (www.mirbase.org) and in the literature are given in the hsa-mir-121 form, where the first three letters signify the organism, as in this case “hsa” for homo sapiens. Then, the mature miRNA is designated as “miR-121” (with capital R) in the database and in much of the literature, whilst “mir-121” (with small form r) refers to the miRNA gene and also to the predicted stem-loop portion of the primary transcript. Distinct precursor sequences and genomic loci that express identical mature sequences get names of the form hsa-mir-121-1 or hsa-mir-121-2, respectively. Lettered suffixes denote closely related mature sequences, e.g.,
9.2 miRNAs and Their Regulatory Potential
135
hsa-miR-121a and hsa-miR-121b (with capital R), are expressed from the precursors hsa-mir-121a and hsa-mir-121b (with small r), respectively. In general, every ncRNA has the intrinsic capacity to regulate in cis, since it can function while remaining connected to its own locus. In contrast, an mRNA molecule can only act in trans, i.e., it needs to dissociate from its origin, be exported to the cytoplasma and gets there translated. However, a given miRNA can regulate hundreds of mRNAs, i.e., most of its action is in trans. As a result, miRNAs have substantial effects on gene expression networks. However, the degree of target gene downregulation imposed by a given miRNA often is only of modest quantity. Although basically all genes can act as miRNA targets, only a subset of the interactions of miRNAs with mRNAs effectively modulates biological responses. The ideal targets of miRNAs are mRNA encoding for components of signal transduction cascades, such as receptors, kinases and transcription factors. Example 9.1 Target gene expression is often exclusively activated through an intraor extracellular signal and actively repressed in its absence. For this “default repression” miRNAs can act as mediators. For example, during DNA damage, a kinase cascade activates the transcription factor p53, leading to cell cycle arrest, senescence or even apoptosis (Sect. 4.5). In the default state, ubiquitin-mediated degradation inhibits p53. The miRNA miR-125b is essential to complete p53 repression and loss of miR-125b causes p53-dependent apoptosis (Fig. 9.2a). Interestingly, miR125b belongs to the DNA damage network, as it is downregulated after genotoxic treatments. Thus, miR-125b establishes a robust DNA damage response (DDR) through a raise in the threshold for p53 activation. Example 9.2 The transcription factors of the SMAD family are the nuclear targets of the TGFβ signal transduction cascade (Sect. 4.3). In addition, SMAD mRNAs are also targets of miRNAs (Fig. 9.2b). For example, the miR-23b cluster targets SMAD3, SMAD4 and SMAD5 in developing liver, which results in the inhibition of the antiproliferative response via TGFβ and the increase of hepatocyte proliferation. This demonstrates how a simultaneous attack on a joint set of targets by miRNAs of the same cluster can amplify the biological effect, even if each individual miRNA has only a weak effect. Example 9.3 SMAD proteins stimulate via the association with the Drosha complex a rapid increase of miR-21 expression. Consequently, contractile cell differentiation within vascular smooth muscle is mediated by miR-21 (Fig. 9.2c). In addition, p53 also stimulates the Drosha complex that promotes the conversion of many miRNAs to pre-miRNAs. The control of the biogenesis of a limited set of miRNAs by transcription factors, such as SMAD and p53, emerges then from the recognition of specific Drosha-pri-miRNA complexes. Signaling pathways are especially relevant in human diseases, in particular in cancer. Important contributions to the understanding of miRNA function in signal
136
9 Regulatory Impact of Non-coding RNA
c
b
a
TGFβ
No DNA damage
Pol II PolI I
miR-125b Cytoplasm
miR-23b
p53
DNA damage AAAAA
BMP/TGFβ
DGCR8 Target gene
R-SMAD
SMAD 3,4,5
No apoptosis
Liver proliferation
p53
Drosha TGFβ
DNA damage
DNA damage miR-21
Cytoplasm
miR-125b
p53
Target gene
Apoptosis
miR-23b
SMAD 3,4,5
Nucleus
Cytoplasm
Vascular smooth
Fig. 9.2 miRNAs in modulating signal transduction cascades. The involvement of miR-125b in the DDR exemplifies how a miRNA can operate as the primary mediator of default repression (a). In normal cells (top panel), miR-125b targets control remaining p53 activity, in order to avoid apoptosis. Genotoxic effects (bottom panel) active p53 and repress miR-125b that results in the induction of apoptosis. The miR-23b cluster targets SMAD3, SMAD4 and SMAD5 and thereby inhibits the antiproliferative response mediated by TGFβ (b). When a single miRNA cluster targets several proteins of the same signal transduction cascade, these proteins can amplify their effect. The transcription factors SMAD and p53 bind to the Drosha complex and promote the maturation of many miRNAs to pre-miRNA (c). The control of the biogenesis of a limited set of miRNAs by transcription factors may emerge from the recognition of specific Drosha-pri-miRNA complexes
transduction arise from the consistent dysregulation of miRNAs in various types of human diseases, in particular in cancer. Since miRNAs are well preserved in body fluids, such as blood serum, liquor or urine and can be quantified more accurately than proteins, they may serve as biomarkers for diverse molecular diagnostic applications. Accordingly, miRNA profiling became an important method in diverse areas of biology and medicine. The regulatory potential of miRNAs resembles on many levels to that of transcription factors. Both families of regulatory molecules have a comparable number (some 1600 transcription factor genes versus approximately 2500 miRNA genes) and share a common regulatory logic (Fig. 9.3). Groups of both transcription factors and miRNAs are combinatorial expressed and characterize individual cell types. While transcription factors recognize with their DBDs their specific binding sites within promoter and enhancer regions, the seed sequences of miRNAs bind 3, -UTR sequences on their target mRNAs. Transcription factors can bind to millions
9.2 miRNAs and Their Regulatory Potential
137
of different locations within the whole human genome, but the very most of them are hidden by chromatin. In contrast, miRNAs have far less different targets within less than 1 kb of the 3, -UTR of the pool of expressed mRNAs. The accessibility of these miRNA recognition sites is controlled by members of the large family of RNA binding proteins and by secondary structures of the mRNA target. Nevertheless, also miRNAs control hundreds of target genes. Most, if not all, genes of the human genome are controlled by a combination of several transcription factors (Chap. 4). Thus, miRNAs provide an additional layer of regulatory complexity and act in most cases as fine-tuners of the action of transcription factors. Transcription factors can both activate and repress their primary targets, while miRNAs regulate gene expression mostly through repression. Nevertheless, repression is an important mechanism that shapes gene regulation in a cell-specific fashion. Events of transcriptional activation via ubiquitously
miRNAs
Transcription factors Abundance
~1,600
~2,500 Cell type 3
Cell type 3
Cell-type (alone & combinatorial) Cell type 1
Cell type 1
Cell type 2
Target gene
Regulatory
Target gene
mRNA
mRNA Pol II
Cell type 2
Pol II
Target gene
Target gene
Feedback
or
or
Network motifs Target
Target Feed-forward
Fig. 9.3 Shared principles of transcription factor and miRNA action. The shared features of transcription factors and miRNAs include abundance (both families of gene regulatory factors contain 1600–2500 members), cell type specificity (both type of regulators act either alone or in combination in a cell type specific fashion), regulatory effects (both can either activate or repress gene expression) and involvement in regulatory networks, i.e., both use of positive and negative feedback loops
138
9 Regulatory Impact of Non-coding RNA
expressed transcription factors can gain specificity through the action of cell typespecific repressors, such as miRNAs. The repressive mode of miRNAs therefore fits well with the general importance of gene repression. Because miRNAs control the expression of many transcription factors and in turn the cell type-specific expression profiles of miRNAs are largely under the control of transcription factors, miRNAs and transcription factors are linked to each other in regulatory networks. This means that basically every transcription factorcontrolled process has also contribution from miRNAs and vice versa. The activity of transcription factors is prominently regulated via posttranslational events, such as phosphorylation, processing or localization. Similarly, miRNAs can be modified by RNA editing. Moreover, proteins being involved in miRNA biogenesis and function, such as Drosha, Dicer and RISC, are subjected to posttranslational modifications. There are also some significant differences between miRNAs and transcription factors: • The knockdown of transcription factor genes has more pronounced phenotypic effects than the deletion of miRNAs. This may be explained by the redundancy between closely related miRNA family members. Moreover, this indicates that miRNAs control more specific aspects of the terminal differentiation of individual cell types, while transcription factors are more important in earlier steps of development. • The action of miRNAs can be compartmentalized within a cell, in order to rapidly alter local gene expression. For example, in neurons miRNA can control gene expression specifically in synapses. A comparable process is not possible with the action of transcription factors. The speed of evolutionary changes of miRNAs is faster than that of transcription factors. Only a few new transcription factor families have arisen during vertebrate evolution, while there is continuous emergence of new miRNA families. This suggests that the increase of complexity in body organization and organs is rather due to miRNA regulation than based on transcription factor action.
9.3 Long ncRNAs When ncRNAs are longer than 200 nucleotides, they are called long ncRNA. These ncRNAs are heterogeneous in their biogenesis, abundance and stability as well as they differ in the mechanism of action. Some long ncRNA have a clear function, such as in regulation of gene expression, while others, such as eRNAs, may be primarily side products non-precise of Pol II transcription (Sect. 9.4). Despite their rather recent discovery, ncRNAs are probably evolutionary older than proteins, i.e., in early cells they mediated most of the regulatory actions, many of which were taken over later by proteins. Long ncRNAs carry out their cellular functions by interacting with proteins to form macromolecular complexes. The complex formation is enabled via elements within ncRNAs, such as short sequence motifs
9.3 Long ncRNAs
139
or larger secondary or tertiary structures, that interact specifically with a large set of molecular structures in proteins, RNA and DNA. This allows a large variety of functions, such as the ability to: • scaffold and recruit multiple regulatory proteins • localize to specific targets on genomic DNA • utilize and shape the 3D structure of the nucleus. A well-known example of an RNA scaffold is the telomerase RNA component (TERC) that assembles the telomerase complex. A number of chromatin modifying and remodeling proteins, such as PRC components, KMT1C, KDM1A, DNMT1 and the SWI/SNF complex, interact with nuclear long ncRNAs. These RNA–protein interactions. • recruit chromatin regulatory complexes to specific genomic sites, in order to regulate gene expression • competitively or allosterically modulate the function of nuclear proteins • combine and coordinate the functions of independent protein complexes (Fig. 9.4). A master example of how ncRNAs contribute to chromatin organization is the long ncRNA Xist, which is the key initiator of XCI in female cells carrying two X chromosomes (Sect. 7.3). Xist recruits a series of regulatory complexes at different stages of the XCI process and maintains X chromosome-wide transcriptional silencing (Fig. 9.5). In female ES cells both X chromosomes are actively transcribed and carry markers of active chromatin, such as H3K4me1, H3ac and H4ac. However, in the blastula stage of approximately 100 cells during early embryonic development (Sect. 11.1), XCI is initiated in one of the two X chromosomes by inducing Xist expression that gradually spreads over the whole chromosome. Through the interaction with the splicing factor HNRNPU (heterogeneous nuclear ribonucleoprotein U) Xist recruits via its A-repeat region SHARP (SMRT/HDAC1-associated repressor protein), i.e., SHARP is an RNA-binding protein. HDAC3 is recruited via the corepressor protein NCOR2, which leads to demethylation of H3K4 and ejection of Pol II. In addition, Xist recruits the complexes PRC1 and PRC2 that deposit H2AK119ub and H3K27me3 marks, respectively. Moreover, the KMT SETDB1 (SET domain bifurcated histone lysine methyltransferase 1) adds repressive H3K9me2 and H3K9me3 marks. In differentiated cells, XCI is maintained by DNA methylation via DNMTs and the incorporation of the histone variant macroH2A (Box 2.2). In this phase, the repressive marks are sufficient for maintaining silencing of the X chromosome and Xist is dispensable. During XCI the chromatin of the X chromosome undergoes major structural changes (Fig. 9.6). Before the expression of Xist both X chromosomes are transcriptionally active, not strongly associated with the nuclear lamina and structurally organized similar to autosomes, i.e., they are subdivided into more than hundred TADs. However, once Xist is expressed by one allele, it spreads across the X chromosome and interacts with LBR (lamin B receptor), which relocates the chromosome to the nuclear lamina. In this context, active genes are sequestered into the Xist compartment and silenced. Moreover, most of the TADs on the X chromosome are
140
9 Regulatory Impact of Non-coding RNA
Avidity of polymerization
RNA valency
Combine functions of multiple proteins
Decoy
+
Module 1
Flexible linkers
RNA domains
Protein components
1. Sequence motif
Chromatin regulation
-AUGGC-
long ncRNA 2. Secondary structure
DNA- or chromatinbinding proteins Transcriptional machinery Splicing factors
Module 2 +
or
Localize to DNA
Allosteric modulation (of RNA or protein)
Fig. 9.4 Principles of long ncRNA action. Long ncRNA molecules have various regions for the molecular interaction with distinct protein complexes. These interactions have functions, such as combining the functions of multiple proteins, localizing long ncRNAs to genomic DNA, modifying the structure of long ncRNAs or proteins, inhibiting protein function as decoys and providing a multifunctional platform, in order to increase the avidity of protein interactions or to promote RNA–protein complex polymerization (RNA valency)
lost and two large mega-domains are formed, which have a boundary at the DANT1 (DXZ4 associated non-coding transcript 1, proximal) locus that associates with the nucleolus. Other long ncRNAs, such as HOTAIR (HOX transcript antisense RNA), direct some KDMs, such as KDM1A within the RCOR (REST corepressor) complex (Sect. 13.2), to their chromatin target sites. RCOR is a large protein complex that also contains HDACs and contributes to transcriptional repression. Long ncRNAs often act as decoys that prevent the access of transcription factors to their genomic DNA binding sites. For example, upon growth factor shortage the long ncRNA GAS5 (growth arrest specific 5) is induced. A hairpin sequence motif of GAS5 contains resembles the consensus binding site of the nuclear receptor GR. Thus, upon “shortage” conditions, GAS5 is induced and acts as a decoy, in order to release GR from its genomic binding sites preventing the expression of its target genes.
Ac
Ac
Ac
Gene
Acetylation
HNRNPU
Ac
Ac
Pol II
HDAC3
Xa
ne
Ge
– H4ac and H3K9ac (HDACs) – H3K4me1/2/3 – RNA polymerase II
Ac
Xist
A
SHARP NCOR2
Initiation of XCI
Xist
hnRNPK
? me3 me3
Ge
ne
PRC2 H3K27me3
HDAC3
+ H2AK119ub1 (PRC1) + H3K27me3 (PRC2) + H3K9me2/3
B
?
?
Me
me3
Me
me3
Me
me3
Me
me3
Me
me3
DNMT
me3
+ DNA methylation (DNMT) + macroH2A
Maintenance of XCI
SHARP NCOR2
Xi
Ge
ne
Fig. 9.5 Mechanisms of Xist-induced gene silencing. In ES cells both X chromosomes are actively transcribed (Xa) and are marked by H3K4me1, H3ac and H4ac. XCI starts early in embryonic development, when Xist expression is initiated on one of the two X chromosomes and gradually spreads across the whole inactive X chromosome (Xi). Xist binds to chromatin through interactions with HNRNPU and recruits SHARP, in order to promote histone deacetylation via HDAC3, demethylation of H3K4 and ejection of Pol II. Furthermore, Xist recruits PRC1 and PRC2 complexes, which deposit H2AK119ub and H3K27me3 marks, respectively. Moreover, the KMT SETDB1 places repressive H3K9me2 and H3K9me3 marks. XCI is maintained in differentiated cells via DNMT-mediated DNA methylation and the incorporation of the histone variant macroH2A
Xa
Xa
9.3 Long ncRNAs 141
142
9 Regulatory Impact of Non-coding RNA
a Xa
Xa
Xist
Xa
Superloop
Nucleolus pre-Xi
Xa
? Xi
Active genes
Xist Xist gene
LBR
b
Xa
chrX
TAD
Xi
TAD DANT1
Megadomains
TAD TAD
Fig. 9.6 XCI changes the architecture of the X chromosome. During XCI the X chromosome undergoes major structural changes, such as association with nuclear lamina and silencing active genes by sequestering them into the Xist compartment (a). The heatmap diagram depicts contact frequency between genomic sites on the X chromosome (b)
The abundance of long ncRNAs in cells is related to their function. Lowabundance long ncRNAs, such as HOTTIP (HOXA transcript at the distal tip), that in average has less than 1 copy per cell only regulate genes in their close proximity. Moderate expression levels, such as 50–100 copies per cell, enable Xist to spread across the entire X chromosome but it does not affect other chromosomes. In contrast, the highly abundant (approximately 3000 copies per cell) long ncRNA MALAT1 (metastasis associated lung adenocarcinoma transcript 1) diffuses throughout the whole nucleus and affects many loci. Genome-wide mapping of MALAT1 binding loci indicates that it associates with all actively transcribed genes in a dynamic and transcription-dependent manner.
9.4 Enhancer RNAs Long ncRNAs were found first in connection with repressive chromatin-modifying complexes, but they also associate with active chromatin states. Genome-wide
9.4 Enhancer RNAs
143
patterns of histone modifications and enhancer binding proteins suggest that long ncRNAs are involved also in gene activation. In addition to its role to interact with TSS regions, Pol II was also found on active enhancer regions. This interaction results in a bidirectional transcription of eRNAs. The FANTOM5 consortium used CAGE technology (Box 3.2) and identified at approximately 44,000 regions within the human genome, which are proven not to contain a TSS, the production of eRNAs (Sect. 10.1). Unlike mRNAs, eRNAs are not polyadenylated, generally short and non-coding and transcribed bidirectionally. Moreover, eRNA levels correlated with mRNA synthesis from nearby genes. Importantly, eRNA transcription requires the presence of a TSS region as primary sites of the genomic attachment (Fig. 9.7). Transcription of eRNAs may contribute to the maintenance of open chromatin at enhancer regions, but can also be a side product of chromatin configuration or looping. Moreover, eRNAs could even be an evolutionary source of new genes. Since variations in enhancers may be pre-stages in a number of human disorders, modulating their function emerges as novel targeted strategies for preventing and treating these diseases. RNA interference (RNAi) was established as a powerful tool (Box 9.2) for analyzing the function of individual genes. In contrast, the manipulation of enhancer function was considered previously experimentally far more demanding.
me
K4
me
K4
Enhan cer eRNA
CREB1 CREBBP
me me
CREBBP
g in el ex d l o m p Re com
Pol II
Mediator complex
Co-activator complex me me
me
me
K4
K4
CREB1
mRNA Pol II
ter Core promo
Fig. 9.7 Synthesis of eRNAs as a result of promoter-enhancer interactions. After activation transcription factors and Pol II bind to enhancers and eRNA is synthesized. Simultaneously, Pol II and other components of the basal transcriptional machinery bind to the TSS region and initiate mRNA transcription
144
9 Regulatory Impact of Non-coding RNA
However, for the regulation of target genes, for which eRNAs are necessary, RNAi of eRNAs could be used to inhibit enhancer function. This offers an alternative approach for targeted disruption of gene expression. Box 9.2: RNAi Small interfering RNAs (siRNAs) are synthetic doublestranded RNA molecules of the size of mature miRNAs (~22 nucleotides). They are transfected into target cells and, like miRNAs, one siRNA strand binds to the RISC complex, thus causing “interference”. RNAi are a valuable research tool, both in cell culture and in living organisms, where siRNAs interfere with the action of endogenous mRNAs and selectively and robustly induce suppression of specific genes of interest. RNAi has been used for large-scale screens that systematically knocked down each gene in a cell or organism. This helps to identify the components necessary for a particular cellular process. Thus, RNAi is a widespread tool in biotechnology and medicine.
(Clinical) Conclusion: The large number of long and short ncRNAs provide a significant regulatory potential that relates to that of chromatin modifiers and transcription factors, respectively. Accordingly, ncRNA play a role in many physiological processes ranging from signal transduction to imprinting.
Additional Reading Gil, N., & Ulitsky, I. (2020). Regulation of gene expression by cis-acting long non-coding RNAs. Nature Reviews Genetics, 21, 102–117. Li, X., & Fu, X. D. (2019). Chromatin-associated RNAs as facilitators of functional genomic interactions. Nature Reviews Genetics, 20, 503–519. Nair, L., Chung, H., & Basu, U. (2020). Regulation of long non-coding RNAs and genome dynamics by the RNA surveillance machinery. Nature Reviews Molecular Cell Biology, 21, 123–136. Statello, L., Guo, C. J., Chen, L. L., & Huarte, M. (2021). Gene regulation by long non-coding RNAs and its biological functions. Nature Reviews Molecular Cell Biology, 22, 96–118.
Chapter 10
Genome-Wide Principles of Gene Regulation
Abstract In this chapter, we will discuss about new principles of genome-wide gene regulation as obtained through data from Big Biology projects like ENCODE, Roadmap Epigenomics and FANTOM5. In this context, we will discuss epigenetic NGS methods used for the genome-wide assessment of accessible chromatin, histone modifications, transcription factor binding and 3D chromatin structure. The integration of these new data types provides further insight on the mechanistic and the human genome’s functional landscape. In this way, we will obtain a genome-wide understanding of epigenetics. Keywords Big biology projects · ENCODE · Roadmap epigenomics · FANTOM5 · NGS methods · ChIP-seq · Data integration · Epigenomics
10.1 Gene Regulation in the Context of Big Biology With a delay of some 20 years, molecular biologists followed the example of physicists and realized that some of their research aims can only be reached by international collaborations of dozens to hundreds of research teams and institutions in so-called Big Biology projects (Fig. 10.1). The Human Genome project, which was launched in 1990 and completed in 2001 (Box 1.3), was the first example of a Big Biology project and has significantly changed the way of thinking in the bioscience community. The HapMap project (http://hapmap.ncbi.nlm.nih.gov) was one of the first follow-ups benefitting from advancing genotyping technologies (Sect. 1.3). In parallel, improved NGS methods allowed personal genome sequencing of both normal and cancer genomes. This made large-scale genome sequencing studies possible, such as in the projects 1000 Genomes (www.1000genomes.org) (Sect. 1.3) and TCGA (www.can cer.gov/about-nci/organization/ccg/research/structural-genomics/tcga) (Sect. 28.3). The first Big Biology projects in the field of epigenomics and transcriptomics were ENCODE (www.encodeproject.org) and FANTOM5 (http://fantom.gsc.riken.jp). The ENCODE project systematically mapped regions of transcription, transcription factor association, chromatin structure and histone modification. However, the
© The Author(s), under exclusive license to Springer Nature Switzerland AG 2023 C. Carlberg et al., Molecular Medicine, https://doi.org/10.1007/978-3-031-27133-5_10
145
Features
100-1,000 kb
1-100 kb ~150 bp
Chromatin accessibility (FAIRE-seq, ATAC-seq)
30 variants 130 PTM sites
1
2
3N
NH 2 4
BLUEPRINT to DNA and associated proteins. >100 cellular epigenomes mapped from healthy individuals and leukemia patients.
O N H Cytosine
6
5
mRNA
Genotype tissue expression (GTEx) used RNA-seq to monitor mRNA expression of 54 tissues from nearly 1000 healthy individuals.
FANTOM5 applied the method CAGE, in order to map TSSs and enhancers via 5’regions of transcribed RNA. Data for major mouse and human organs, 750 primary tissues and 250 cell lines.
DNA modifications (5mC, 5hmC, 5fC, 5caC)
Histone modifications and variants
that alter how accessible genes are for activation from 127 primary tissue and cell types.
Marks
1 bp
Fig. 10.1 Epigenetic big biology projects. Outline of the type of datasets collected by different big biology projects with an epigenetic focus. More details are provided in the text. bp = base pair, PTM = posttranslational modification
TAD
Scales
Roadmap Epigenomics cataloged
Chromatin domains Chromatin interactions (TADs, LADs) (3C, Hi-C)
wide gene expression.
ENCODE used primarily ChIP-seq on some 150 human cell types to identify transcription factor binding and histone
1 bp - 10 kb
146 10 Genome-Wide Principles of Gene Regulation
10.1 Gene Regulation in the Context of Big Biology
147
project focused initially on some 150 human cell lines rather than on primary cells. The FANTOM5 project used the method CAGE (Box 3.2), in order to map the 5’-end of de novo synthesized RNA at promoter and enhancer regions in some 750 primary tissues and 250 cell lines. Similarly, the GTEx (Genotype-Tissue Expression) project (https://gtexportal.org/home) measured mRNA expression from 54 non-diseased tissues from nearly 1000 individuals. The ENCODE follow-up project Roadmap Epigenomics (www.roadmapepigenomics.org) provided human epigenome references from 111 primary human tissues and cell types. In addition, the BLUEPRINT project (www.blueprint-epigenome.eu) focused on the epigenomes of human hematopoietic cells. Finally, IHEC (http://ihec-epigenomes.org) became the umbrella organization, under which international epigenome efforts are jointly coordinated. The key achievements of IHEC have been the introduction and implementation of quality standards for harmonizing epigenomic data collection, management and analysis. For example, based on IHEC standards each reference epigenome needs to be composed of at least nine profiles and assays, but typically reference epigenomes are composed of 20–50 genome-wide profiles and represent a multidimensional data matrix. Epigenome profiling leads to maps of DNA methylation, histone marks, DNA accessibility and DNA looping that can be visualized with an appropriate web browser, such as the UCSC Genome Browser (Box 10.1). Although visualization can be highly illustrative and may induce hypotheses, epigenome maps are descriptive, i.e., primarily they are used for annotation. For example, enhancers, promoters and other genomic features have characteristic epigenomic signatures, such as H3K4me1 marks for enhancers and H3K4me3 marks for promoters (Sect. 7.2), on the basis of which they can be identified within epigenome maps. Box 10.1: Visualizing Epigenomic Data A typical way of visualizing epigenomic data, such as those from the ENCODE project, is to display a selected subset of them in a browser like the UCSC Genome Browser (http://genome. ucsc.edu/ENCODE). Datasets can be inspected without downloading them by creating a dynamic UCSC Genome Browser track hub that can be visualized on a local mirror of the UCSC Browser. Other visualization tools supporting the track hub format, such as Ensembl (www.ensembl.org), can also be used. For every given genomic position, a graphical display provides an intuitively understandable description of chromatin features, such as histone acetylation and methylation, that can be read in combination with experimentally proven information about transcription factor binding, as obtained from ChIP-seq experiments.
148
10 Genome-Wide Principles of Gene Regulation
10.2 Epigenetic Methods The rapid maturation of NGS technologies after finishing the Human Genome project led to the exponential development of methods for nearly all aspects of cellular processes, i.e., sequencing allows their detailed and comprehensive analysis. In these methods millions of DNA fragments are sequenced that origin either directly from genomic DNA (whole genome sequencing and bisulfide sequencing), the whole transcriptome (RNA-seq (Box 3.2) and related techniques) or subsets of these that origin from filtering for the interaction with transcription factors or accessible chromatin (ChIP-seq and related methods). In general, NGS methods have the advantage that they provide, in an unbiased and comprehensive fashion, information on the entire epigenome and genome. Thus, global epigenomic profiling allows hypothesis-free exploration of new observations and correlations, i.e., conclusions drawn from a few isolated genomic regions might be extended to other parts of the genome. The key epigenomic methods determine DNA methylation, transcription factor binding and histone modification, accessible chromatin and 3D chromatin architecture. The biochemical cores of these methods are: • different chemical susceptibility of nucleotides, such as bisulfite treatment of genomic DNA, in order to distinguish between C and 5mC • affinity of specific antibodies for chromatin-associated proteins, such as transcription factors, modified histones and chromatin modifiers • endonuclease-susceptibility of genomic DNA within open chromatin compared to inert closed chromatin • physical separation of protein-associated genomic DNA (of fragmented closed chromatin) in an organic phase from free DNA (of accessible chromatin) in the aqueous phase • proximity ligation of genomic DNA fragments that via looping got into close physical contact. The DNA methylome, i.e., a genome-wide map of 5mC patterns and its oxidized modifications (Sect. 6.2), is an essential component of the epigenome. Many datasets of different human tissues and cell types are already publicly available via the IHEC consortium (Sect. 10.1). Global DNA methylation methods are either affinity-based methods, such as methylated DNA immunoprecipitation sequencing (MeDIP-seq), or base-resolution mapping methods, such as bisulfite sequencing (Fig. 10.2). Both types of methods consistently identify genomic regions, in which cytosines are frequently modified. Affinity-based assays use an antibody that enriches methylated fragments from sonicated genomic DNA. The resolution of these assays is highly dependent on the DNA fragment size and CpG density, i.e., they are more qualitative than quantitative. In contrast, bisulfite sequencing directly determines the methylation state of each cytosine of the whole genome. In this chemical conversion method, sodium bisulfite treatment of genomic DNA chemically converts unmethylated cytosines to uracils. Through PCR amplification all unmethylated cytosines
10.2 Epigenetic Methods
149
become thymidines, i.e., the remaining cytosines correspond to 5mC. Whole genome sequencing provides then single base resolution of the methylation pattern. Interestingly, bisulfite sequencing is one of the first epigenomic methods being successfully applied on the single-cell level (Box 10.2). Since 5mC and 5hmC, but not 5fC or 5caC, are resistant to bisulfite conversion, they cannot be distinguished from each other, i.e., antibody enrichment or more advance chemical conversion methods need to be applied. Box 10.2: Single-cell Analyses In the past, epigenome methods were performed with larger numbers of cells. However, cell populations are known to be heterogenous, the respective results only represent the average chromatin state for thousands or even millions of cells. Recent technological advances allowed executing genome-wide analyses on single cells. For example, singlecell RNA-seq showed substantial heterogeneity of cell types in various tissues and identified novel cell populations. The single-cell technology has been extended to the genome and DNA methylome. Bisulfite sequencing of single cells indicates substantial variations in DNA methylation patterns across otherwise homologous cells residing in the same tissues. Recently, single-cell ATACseq (assay for transposase-accessible chromatin using sequencing) was developed, which allows single-cell analyses of chromatin accessibility. In general, single-cell epigenomics will provide insights into the combinatorial nature of chromatin, such as which combinations of epigenetic marks and structures are possible and what mechanisms control them. The method ChIP-seq maps the genome-wide binding pattern of chromatinassociated proteins, such as transcription factors and chromatin modifiers, including posttranslationally modified histones, via immunoprecipitation of crosslinked protein-DNA complexes from fragmented chromatin with an antibody that is specific for the protein of interest (Fig. 10.3). Genomic DNA fragments, referred to as “tags”, within these complexes are purified from the enriched pool and sequenced by applying massive parallel sequencing. The tags are then aligned to the reference genome. Assemblies of the tags are referred to as “peaks” and indicate genomic regions where the protein of interest was binding at the moment of cross-linking. ChIP-seq of histone modifications tends to produce broader peaks, i.e., more diffuse regions of enrichment, than transcription factors that bind sequence-specifically and create sharper peak profiles. Although ChIP-seq is a mature method, it is restricted by the need for large amounts of starting material (1–20 million cells), limited resolution and the dependence on the quality of the applied antibodies. A new variation of ChIP-seq, ChIPmentation, takes advantage of a library preparation using the Tn5 transposase (“tagmentation”) as in ATAC-seq. The sequencing library is prepared using fragmented and immunoprecipitated chromatin instead of the standard purified, i.e., protein-free, immunoprecipitated genomic DNA. This tagmentation step reduces
150
10 Genome-Wide Principles of Gene Regulation
Sample
CpG 5mCpG 5hmCpG
Sonication
DNA fragmentation Add linkers
HO
O S
O- Na+
Sodium bisulfite treatment
Enrich
Antibody U
C
U
C U
C U
Sequence and analyze
Fig. 10.2 Analysis of DNA methylation. Genome-wide 5mC and its oxidative derivative 5hmC are measured by conversion- and enrichment-based methods followed by sequencing. Bisulfite conversion allows quantification of 5mC but does not distinguish 5mC from 5hmC, while antibody enrichment enables qualitative measurement of 5mC and 5hmC. Bisulfite-converted or -enriched genomic DNA is purified, subjected to library construction and clonally sequenced. Finally, the sequencing reads are aligned to the reference genome
10.2 Epigenetic Methods
151
IN SILICO DATA PROCESSING FLOW (PART 2)
EXPERIMENTAL FLOW (PART 1)
Tags from a
Biological material e.g., cell lines, tissue
ChIP sample
Tags from a control sample or background model
Crosslinking Fragmentation of chromatin by sonication
antibodies and immunoprecipitation
compared to control ChIP
ChIP-seq
- Proteolysis - Quantitative real-time PCR
- Proteolysis - Adapter ligation, library preparation and sequencing
Fluorescence
C C TT G T A G T C G A T G T C A T G A 10
Example of the experimentally generated peak
20
Gene 0
5
10
15
20
25
30
35
40
TF binding 100 bp +/of the peak summit
Cycles
Fig. 10.3 ChIP-seq and its analysis. Short chromatin fragments are prepared from cells in which nuclear proteins are covalently attached to genomic DNA by short-term formaldehyde cross-linking. After chromatin fragmentation, immobilized antibodies against a protein of interest, such as a transcription factor (TF) or a histone mark, are used to immunoprecipitate the chromatin fragments associated with the respective protein (left). All genomic fragments are subjected to massive parallel sequencing, e.g., by the use of an Illumina Genome Analyzer. Typically, sequencing runs provide tens of millions of sequencing tags (small arrows) that are uniquely aligned to the reference genome (right). Clusters of these tags form peaks that represent transcription factor binding loci when they show significantly higher binding than the control sample. One has to take into account that regular ChIP-seq assays measure averaged protein binding events based on chromatin templates being obtained from millions of cells, i.e., a weak ChIP-seq peak may represent strong binding that is only observed in a small subset of cells
the number of cells needed in the experiments by a factor of 10–100. Finally, singlecell approaches (Box 10.2) allow even more powerful analyses of chromatin states and their associated gene regulatory networks. In the past, the main assays for genome-wide mapping of open chromatin were DNase-seq (DNase I hypersensitivity followed by sequencing) and FAIREseq (formaldehyde-assisted identification of regulatory elements followed by sequencing). The experimental principle of the DNase-seq method is a limited digestion of chromatin with the endonuclease DNase I that releases nucleosome-depleted fragments of genomic DNA. In contrast, FAIRE-seq takes advantage of the fact that genomic DNA within open chromatin regions is particularly sensitive to shearing by sonication. Chromatin is isolated from formaldehyde cross-linked DNA, sonicated and subjected to a phenol–chloroform extraction. Protein-free genomic DNA
152
10 Genome-Wide Principles of Gene Regulation
can be isolated from the aqueous phase, while protein-bound DNA remains in the organic phase. However, the present state-of-the-art method for mapping chromatin accessibility is ATAC-seq, which uses the Tn5 transposase for sequencing library preparation. Like in ChIPmentation, the use of tagmentation largely reduces the number of cells needed per experiment. For assessing the 3D organization of chromatin, 3C-based methods (Box 10.3) are used that combine protein cross-linking and proximity ligation of DNA, in order to detect long-range chromatin interactions. These methods quantify the interaction frequency between genomic loci that are close to each other in 3D but may be separated by thousands of bases in the linear genome. This identifies loops of genomic DNA, e.g., between promoter and enhancer regions. The genome-wide version of 3C, 5C, Hi-C and ChIA-PET map the whole genome in kb resolution for chromatin loops, such as TADs/LADs. The latter methods are performed with large cell populations and thus provide a probabilistic view of chromosome folding and nuclear organization. Box 10.3: 3C-Based Methods 3C is a method that can identify loops of genomic DNA being mediated by long-range protein–protein interactions. These loops may represent a connection between a transcription factor binding to an enhancer region and the basal transcriptional machinery assembled on a TSS region. The 3C method involves: • cross-linking of segments of genomic DNA to proteins and of proteins with each other like in ChIP (Fig. 10.3) • restriction digestion of the cross-linked DNA, in order to separate non-crosslinked DNA from the cross-linked chromatin • intramolecular ligation of neighboring, previously cross-linked DNA fragments with the corresponding junctions • reverse cross-linking resulting in linear DNA fragment with a central restriction site corresponding to the site of ligation • quantitative PCR using primers and Taqman probes against the site of ligation to measure quantitatively the fragment of interest. The frequency with which two restriction fragments become ligated indicates how often they interact in the nucleus. In genome-wide versions of the 3C method, such as circularized chromosome conformation capture (4C), 5C and Hi-C, the 3C protocol is combined with high-throughput genomic methods, which is greatly enhancing the power of discovery. Moreover, ChIA-PET incorporates a ChIP step into the 3C protocol and enriches interactions between genomic regions that are bound by specific proteins.
10.3 Integrating Epigenome-Wide Datasets
153
10.3 Integrating Epigenome-Wide Datasets Individual research teams as well as large consortia, such as the ENCODE project and the Roadmap Epigenomics project, have already produced thousands of epigenome maps from hundreds of human tissues and cell types. The integration of these data, e.g., transcription factor binding and characteristic histone modifications, allows the prediction of enhancer and promoter regions as well as monitoring their activity and many additional functional aspects of the epigenome. In later sections of this book, we will discuss further applications of these projects including the identification and characterization of regulatory SNPs (Sect. 36.3) and the integrative personal omics profiling (iPOP) of individuals (Sect. 36.5). There are a variety of approaches to integrate epigenomics data within or across omics layers, such as correlation or co-mapping. When the datasets, which are to be compared, have a common driver, or if one regulates the other, correlations or associations should be observed. In most cases, more than two datasets, which often derive from different omics layers, are integrated (often referred to as modeled) in gene regulatory networks. Thus, in order to infer function from epigenomics data, they need to be integrated within the same layer (Fig. 10.4), such as histone marks with DNA accessibility, or across layers, such as transcription factor binding with mRNA expression as obtained by the GTEx project or DNA methylation with genetic variation described in the GWAS catalog. The ENCODE project used up 100 human cell lines as representatives for the large variety of human tissues. Comparison between data for the same chromatin markers, such as H3K27ac as well as accessible chromatin measured by DNaseseq or FAIRE-seq, in different cellular models indicated that a number of them are conserved between different tissues. This allows to use some chromatin features from the ENCODE project as supplemental information for projects that were performed with other cellular models than those being selected for the ENCODE project. For example, regions of histone H3 and H4 acetylation and H3K4 mono-, di- and trimethylation coincide to 81–94% with accessible chromatin. Moreover, active genomic regions generally correspond to high levels of RNA transcription and histone H3 acetylation as well as to low levels of H3K27 trimethylation, while repressed regions show low H3ac and RNA levels and high H3K27me3 signal. An illustrative example for efficient epigenome integration is the mapping of enhancer modules (describes as accessible genomic regions determined by DNaseseq) over the 111 reference epigenomes of Roadmap Epigenomics (Fig. 10.5). It shows that a limited set of enhancer modules are active in nearly all tissues and cell types, while the majority of the enhancers are specific to same lineage, such as stem cells or mature blood cells. This demonstrates that the activity of enhancer modules can be used to monitor the similarity and relationship of cell types, including common functions and phenotypes. For the interpretation of human genetic variation and disease this is very useful, as the enrichment of respective traits is strongest for enhancer-associated marks.
154
10 Genome-Wide Principles of Gene Regulation
Imputation of missing data Aggregation
DNA modifications Histone modifications Histone variants Nucleosome occupancy RNA modifications and ncRNAs Chromatin interactions Chromatin domains
Additional information (such as TSS annotation, TF binding or RNA-seq) Samples fr rent tissues, cell types or experimental conditions Chromatin states
Fig. 10.4 Multidimensional integration of epigenome profiles. Epigenome data integration is achieved through imputation of missing data via profiles from the same and/or closely related samples and addition of non-epigenomic data, such as transcriptomic data (e.g., gene expression levels and TSS use). This allows the aggregation and segmentation of the datasets into a number of different chromatin states
Disease- and trait-associated genetic variants are often show tissue-specific enrichment for enriched in epigenomic marks. This demonstrates the central role of epigenome-wide information for understanding gene regulation as well as embryogenesis (Sect. 11.1) and cellular differentiation (Sect. 11.3). Moreover, the broad coverage of epigenomic annotations improves the understanding of common diseases, such as cancer, Alzheimer disease, autoimmune diseases and diabetes, beyond the level of protein-coding genes. Data integration reduces the list of affected epigenomic regions to a subset with inferred function. Many thousand epigenomes from hundreds of human tissues and cell types (IHEC data portal, http://epigenomesportal.ca/ihec) already significantly improved insight into epigenomics. However, much more remains to be investigated, such as better characterizations of epigenome variations in human populations and in patients, in order to fully appreciate the potential of epigenomics in human health and disease.
10.4 Genome-Wide Understanding of Epigenetics Pure in silico screening for consensus sequences of TFBSs, which are typically 6– 17 base pairs in length, has only rather low information content, since it largely
10.4 Genome-Wide Understanding of Epigenetics
155
226 enhancer modules IMR90 ES cell iPSC
Blood and T cell
B cell and HSCs Mesench. Myosatell. Epithelial Neurosph. Thymus Brain
111 reference epigenomes
Enhancer activity across 111 complete epigenomes
ES-derived
Adipose Muscle Heart Smooth muscle Digestive tissue
Other
Fig. 10.5 Mapping enhancer modules. Regulatory modules, such as enhancers, can be identified based on activity-based clustering of 2.3 million accessible genomic regions across 111 reference epigenomes (horizontal lines). Vertical lines separate 226 enhancer modules. Data were taken from the Roadmap Epigenomics project (Nature 518, 317–330)
over-represents the sites used in vivo. This provides the chromatin structure with a critical role in determining, whether a suitable TFBSs is accessible. Numerous ChIP-seq studies indicated that the number of genomic binding sites vary greatly between transcription factors. Moreover, the number of direct target genes is far lower than those of binding events, since only a subset of the sequences below the summits of the ChIP-seq peaks contain binding sites for the selected transcription factors. Thus, the understanding of the action and function of transcription factor has to be adapted to these new genome-wide insights. For example, ChIP-seq indicated that in erythroblasts the transcription factor GATA1 has over 15,000 binding sites, while for TAL1 (TAL BHLH transcription factor 1, erythroid differentiation factor) only 3000–6000 binding sites were identified. Most of the TAL1 binding sites colocate with GATA1 sites, i.e., GATA1 acts as a pioneer factor for TAL1. In contrast, ChIP-seq on the transcription factor MYOD1 in skeletal muscle cells identified some 30,000–60,000 binding sites. MYOD1 is the most important transcription factor in muscle cells, as it controls via a feedforward circuit the temporal expression pattern of genes important for skeletal muscle differentiation. Interestingly, both TAL1 and MYOD1 heterodimerize with an E-box protein and the respective heterodimers recognize the same binding site. Therefore,
156
10 Genome-Wide Principles of Gene Regulation
the tenfold difference in amount of experimentally proven binding events cannot be related to a difference in their DNA binding sites. However, the accessibility of these binding sites may be significantly different between erythroblasts and myocytes. MYOD1 can initiate chromatin opening at otherwise inaccessible sites, i.e., it can bind independently of other factors, whereas TAL1 requires GATA1 or other proteins, in order to get access to its binding sites. Thus, the difference in the number of genomic binding events of MYOD1 and TAL1 reflects their ability to act as a pioneer factor or as a following factor, respectively. Accordingly, the actions of MYOD1 are rather independent from other transcription factors, while TAL1 needs the help of other proteins. Accessible chromatin and TSS regions both reflect genomic regions that are intensively used for gene regulation, in particular, when they overlap. In combination with data on RNA transcripts that are now typically obtained by genome-wide approaches, ENCODE data provide substantial experimental evidence for the different promoter types used for human genes. For example, TSS regions close to CpG islands display a broader distribution of histone modification than those not being colocated with CGrich sequences (Sect. 3.3). Importantly, distal regulatory regions show characteristic patterns of histone modification being clearly different from TSS regions that show high H3K4me1 levels combined with lower levels of H3K4me3 and H3ac. Moreover, many proteins with high occupancy at TSS regions, such as the transcription factors E2F4 and YY1 (YY1 transcription factor), are seldomly found at enhancer regions, whereas other transcription factors, such as MYC or CTCF, are enriched at both TSS and enhancer regions. Moreover, some transcription factors, such as JUND and ESR1, show considerable cell type-specific binding. Such differential behavior of sequence-specific transcription factors points to biological differences between enhancer and TSS regions. TFBSs that occur outside of genomic regions directly involved in gene regulation may be non-functional or random. Many of these experimentally validated TFBSs are only of low-affinity and may contribute to gene expression only at low levels that, however, is sufficient enough to allow evolutionary conservation. Alternatively, accessible genomic DNA may serve as a low-affinity reservoir for transcription factors that are not directly regulating gene transcription in vicinity to their binding site. For example, in mouse ES cells there are approximately 3700 binding sites for the pluripotency transcription factor OCT4, 4500 for SRY-box 2 (SOX2) and 10,000 for NANOG. However, only a few genomic regions were bound simultaneously by all three embryonal transcription factors (Sect. 11.2), i.e., functionally effective sites may only be achieved by cooperative binding. This can be achieved either by direct interaction between the transcription factors or by indirect interaction through cofactors. Some transcription factors are recruited by a common motif to their genomic binding sites, while others use a number of different recruitment mechanisms. For example, de novo motif analysis after ChIP-seq indicated that some transcription factors, such as p63 and STAT1, show high enrichment for a specific motif, while E2F family members seem not to require a specific DNA sequence for their binding in vivo. The lack of a consensus motif can be explained by binding of the transcription
10.4 Genome-Wide Understanding of Epigenetics
157
factor to a distal site with the consensus motif and looping to the proximal site via the MED complex or other cofactors (Fig. 10.6a), “piggyback” binding to a second transcription factor that contacts DNA directly (Fig. 10.6b), the use of a different dimerization partner that results in significantly different DNA binding specificity (Fig. 10.6c) or the stabilization via interaction with chromatin factors (Fig. 10.6d). Thus, the more protein–protein interactions are involved in the complex formation, the more difficult it is to use a pure bioinformatic approach for the identification of TFBSs. In most cases first the histone marks of a genomic region are changed before transcription factors are binding. Therefore, specific chromatin modifications, such as H3K4me1 for enhancer regions, may enhance transcription factor recruitment while others prevent it, i.e., certain transcription factors may have an affinity for a specific histone modification (Fig. 10.6d). In order to understand how a gene is expressed in its chromosomal environment, one should ideally be able to identify all TFBSs that are required for its regulation under all physiological conditions. The bioinformatic method of comparative genomics is based on the fundamental assumption that sequence similarity
a
Direct interaction with DNA looping
Piggyback interaction
b
(Interaction without DNA)
X binding site
X X TF1 TF1 TF1 binding site
TF1 binding site
c
Proximal binding (DNA-anchored direct interaction)
d
(Epigenomic marker-mediated interaction)
Co-activator X
X binding site
TF1
TF1 binding site
ac
ac
X
ac
ac
TF1 binding site
Fig. 10.6 Alternative binding modes of transcription factors. ChIP-seq results on the genomic binding sites of the uncharacterized transcription factor X can be explained via looping a, piggyback interaction with a partner transcription factor (TF1) b, proximal binding c or chromatin marker fixation of coactivator proteins d
158
10 Genome-Wide Principles of Gene Regulation
between orthologous sequences of different species results from selective pressure during evolution (Box 10.4). Comparative genomics with the goal to identify functional TFBSs is called phylogenetic footprinting. For example, a genome-wide comparison of TSS regions and their surrounding sequence between the mammalian species human, mouse, rat and dog suggests that the substitution rate at each site is lowest within the 50 base pairs upstream of the TSS, i.e., within the classical core promoter and increases linearly further upstream. Interestingly, TATA box-containing sharp promoters evolve more slowly than CpG island-containing broad promoters (Sect. 3.3). This suggests that the more constrained architecture of the TATA box containing sharp promoters is needed to ensure efficient transcription initiation, so that any change in the sequence is likely to have significant consequences on the function of the respective TSS region. Box 10.4: Orthologous Genes and Sequence Alignment Genes are called orthologous with each other, when they originate from the same ancestral gene and are diverged by a speciation event. Phylogenetic footprinting assumes that orthologous genes are under common evolutionary constraints. At every particular position the genes are either analyzed for substitutions compared to neutral base exchange rates based on a multisequence alignments or alternatively the presence and frequency of intraspecies polymorphisms is determined. Both approaches are independent of any specific function that the analyzed sequence may confer. Duplication and/or deletion of genes during evolution complicates the determination of orthologs. Suitable sequences are aligned, in order to identify segments of similarity. Once the alignments are defined, the data interpretation is assisted by tools, such as the VISTA browser (pipeline.lbl.gov). The latter creates graphs of nucleotide identity over a sliding window along a pairwise alignment. Such a graphical display helps in the visualization of the alignment results, but for the analysis of long sequences additional computational analysis of the conservation patterns is needed. In general, regulatory genomic regions, such as promoters, enhancers and insulators, are composed of TFBSs that should show a high level of interspecies conservation. However, not all TFBSs are equally well conserved, as some were just recently recruited in evolution and therefore may be species-specific. Moreover, not all conserved non-coding sequences are proven regulatory regions. A search for regulatory elements is most efficient when it incorporates a comparison between different species and includes data about open chromatin and histone modifications, i.e., on the epigenome. (Clinical) Conclusion: Big Biology projects, such as ENCODE, FANTOM5 and others, provide huge amounts of epigenome and transcriptome datasets
Additional Reading
159
from many human tissues and cell types. These data are the basis for a genomewide understanding of gene regulation.
Additional Reading Andersson, R., & Sandelin, A. (2020). Determinants of enhancer and promoter activities of regulatory elements. Nature Reviews Genetics, 21, 71–87. Andersson, R., Gebhard, C., Miguel-Escalada, I., Hoof, I., Bornholdt, J., Boyd, M., Chen, Y., Zhao, X., Schmidl, C., Suzuki, T., et al. (2014). An atlas of active enhancers across human cell types and tissues. Nature, 507, 455–461. Encode-Project-Consortium. (2012). An integrated encyclopedia of DNA elements in the human genome. Nature, 489, 57–74. Fantom-Consortium, Hoen, P. A., Forrest, A. R., Kawaji, H., Rehli, M., Baillie, J. K., de Hoon, M. J., Haberle, V., Lassmann, T., & Kulakovskiy, I. V., et al. (2014). A promoter-level mammalian expression atlas. Nature, 507, 462–470. Gasperini, M., Tome, J. M., & Shendure, J. (2020). Towards a comprehensive catalogue of validated and target-linked human enhancers. Nature Reviews Genetics, 21, 292–310. Haniffa, M., Taylor, D., Linnarsson, S., Aronow, B. J., Bader, G. D., Barker, R. A., Camara, P. G., Camp, J. G., Chedotal, A., Copp, A., et al. (2021). A roadmap for the human developmental cell atlas. Nature, 597, 196–205. Jerkovic, I., & Cavalli, G. (2021). Understanding 3D genome organization by multidisciplinary methods. Nature Reviews Molecular Cell Biology, 22, 511–528. Klemm, S. L., Shipony, Z., & Greenleaf, W. J. (2019). Chromatin accessibility and the regulatory epigenome. Nature Reviews Genetics, 20, 207–220. Lappalainen, T., Scott, A. J., Brandt, M., & Hall, I. M. (2019). Genomic analysis in the age of human genome sequencing. Cell, 177, 70–84. Minnoye, L., Marinov, G. K., Krausgruber, T., Pan, L., Marand, A. P., Secchia, S., Greenleaf, W. J., Furlong, E. E. M., Zhao, K., & Schmitz, R. J., et al. (2021). Chromatin accessibility profiling methods. Nature Reviews Methods Primers, 1. Moshitch-Moshkovitz, S., Dominissini, D., & Rechavi, G. (2022). The epitranscriptome toolbox. Cell, 185, 764–776. Roadmap Epigenomics Consortium, Kundaje, A., Meuleman, W., Ernst, J., Bilenky, M., Yen, A., Heravi-Moussavi, A., Kheradpour, P., Zhang, Z., & Wang, J., et al. (2015). Integrative analysis of 111 reference human epigenomes. Nature, 518, 317–330. Wang, Y., Zhao, Y., Bollas, A., Wang, Y., & Au, K. F. (2021). Nanopore sequencing technology, bioinformatics and applications. Nature Biotechnology, 39, 1348–1365.
Chapter 11
Epigenetics in Development
Abstract In this chapter, we will present that early embryonic development is very vulnerable to environmental influences. Therefore, from all phases of our life, embryogenesis is the period, where epigenetics has the largest impact. Epigenetics directs the programing of PGCs, induced pluripotency as well as the function of adult stem cells in tissue homeostasis. These master examples demonstrate the impact of epigenetics on the organization of our body in health and disease. Epigenetic regulation is also critical for the normal development and functioning of our brain. Dynamic DNA and histone methylation as well as their demethylation at specific gene loci play a fundamental role in learning, memory formation and behavioral plasticity. Thus, the epigenome of neurons allows a molecular explanation for long-term memories. Keywords Embryogenesis · ES cells · Cell lineage commitment · PGCs · Cellular reprograming · Induced pluripotency · Master transcription factors · Gene regulatory networks · Adult stem cells · Hematopoiesis · Neuronal development · DNA methylation · mCH methylation · MECP2
11.1 Epigenetic Changes During Early Human Development Our body is composed of some 30 trillion (3. 1013 ) cells forming more than 400 different tissues and cell types. Embryonic development is a tightly regulated process that produces from an identical genome this high diversity of human cell types. In each cell, chromatin serves as a specific filter of genomic information and determines which genes are expressed and which not, i.e., cellular diversity is based rather on epigenomics than on genomics. Thus, the differentiation program of embryogenesis is a perfect system for observing the coordination of cell lineage commitment and cell identity specification. Embryogenesis requires the coordination between an increase in cellular mass and the phenotypic diversification of the expanding cell populations. This is under the control of gene regulatory networks in the context of significant changes in the epigenetic landscape (Sect. 11.2).
© The Author(s), under exclusive license to Springer Nature Switzerland AG 2023 C. Carlberg et al., Molecular Medicine, https://doi.org/10.1007/978-3-031-27133-5_11
161
162
11 Epigenetics in Development
In the process of conception, the two types of haploid gametes, oocyte and sperm, fuse and form the diploid zygote (Fig. 11.1). A series of cleavage divisions of the zygote creates the totipotent 16-cell morula stage. A few days after conception cells on the outer part of the morula bind tightly together forming a cavity inside. At the blastocyst stage (50–150 cells) a first differentiation occurs. The outer cells (trophoblasts) are the precursors to extraembryonic cytotrophoblasts that form chorionic villi and syncytiotrophoblasts, which ingress into the uterus, i.e., these cells form the placenta and other extraembryonic tissues. Even before the blastocyst becomes implanted into the uterine wall, its inner cells, the so-called inner cell mass, begin to differentiate into two layers, the epiblast and the hypoblast. The epiblast gives rise to some extraembryonic tissues as well as to all the cells of the later stage embryo and fetus. In contrast, the hypoblast is exclusively devoted to making extraembryonic tissues including the placenta and the yolk sac. Some of the embryonic epiblast cells form PGCs. These cells are the founders of the germ line and provide a link between different generations of an individual’s family. During the gastrulation phase the other cells of the embryonic epiblast turn into the three germ layers ectoderm, mesoderm and endoderm that are the precursors of all somatic tissues. The cells of these germ layers are only multipotent, i.e., they cannot differentiate to every other tissue. For example, in a series of sequential differentiation steps, ectoderm cells can form epidermis, neural tissue and neural crest, but not kidney (mesoderm-derived) or liver cells (endoderm-derived). Before conception the CpG methylation rate of the haploid genomes of sperm and oocyte is 90 and 40%, respectively (Fig. 11.2, left). The nucleus of sperm is 10times more condensed than that of somatic cells and most histones are replaced by protamines, which are small, arginine-rich nuclear proteins that allow denser packaging of DNA. As a consequence, the genome of sperm is transcriptionally silent, while in the oocyte many genes are active. After conception, at the zygote stage,
Embryonic tissues Primordial germ cells Embryonic epiblast (primitive ectoderm)
Zygote
Embryonic ectoderm
Epiblast Primitive streak
Morula
Amniotic ectoderm
Inner cell mass
Blastocyst
Hypoblast (visceral endoderm)
Outer cells
Trophoblast
Cytotrophoblast
Extraembryonic endoderm
Embryonic endoderm Embryonic mesoderm
Yolk sac
Extraembryonic mesoderm
Syncytiotrophoblast
Extraembryonic tissues
Fig. 11.1 A road map of early human development. Details are provided in the text. The dashed line indicates a possible dual origin of the extraembryonic mesoderm
11.1 Epigenetic Changes During Early Human Development
163
the two haploid parental genomes initially remain separate in their rather different state of chromatin organization. Then both genomes get extensively demethylated, but the paternal genome much faster than the maternal genome (Fig. 11.2, left). In parallel, the protamines within the paternal chromatin get exchanged back to canonical histones. In the following cell divisions, preceding the blastocyst stage, there is passive demethylation in both parental genomes, until the methylation patterns are reestablished in a lineage-specific manner. In addition, in the paternal epigenome, there is rapid increase in 5hmC and 5fC/5caC, which is a sign of TET-mediated 5mC oxidation (Sect. 6.1). This process accelerates the demethylation of the paternal epigenome. Importantly, there is no complete demethylation of the epigenome and some 5% of the 5mC marks remain active, possibly via protection by methyl-binding proteins, such as MBD proteins (Fig. 11.2, right). This process serves as the basis for transgenerational epigenetic inheritance (Sect. 12.1).
PGC
CpG methylation (%)
100
PGC
80
Sperm
Wk2 Zygote
60 40
Soma
Sperm
Oocyte
PGC Migratory PGC
Single copy and repeat escapees
Oocyte
Gonadal PGC
20 0
Blastocyst (inner cell mass)
Wk5 Wk7
Wk9
Chromatin reorganization X-reactivation Demethylation of imprints and PGC gene promoters Preimplantation Postimplantation
Adult
Fig. 11.2 Epigenetic reprograming during embryogenesis. DNA methylation is the most stable epigenetic modification and often mediates permanent gene silencing, during embryogenesis as well as in the adult. Accordingly, there is a hierarchy of events where DNA methylation marks are typically added or removed after changes in histone modifications, i.e., they mostly occur at the end of the differentiation process. Therefore, in this graph the percentage of CpG methylation is indicated as representative marker of epigenome changes. Two waves of global demethylation occur during embryogenesis: the first in the pre-implantation phase (week (wk) 1) affecting all cells of the embryo and the other applies only to PGCs during the phase of their specification reaching a minimum of some 5% CpG methylation at wk 7–9. Some single copy genomic regions and a number of repeat loci remain methylated and are candidates for transgenerational epigenetic inheritance (Sect. 12.1). Dotted lines indicate the methylation dynamics. Genome-wide de novo DNA methylation takes place after implantation. In PGCs a second wave of de novo DNA methylation happens as early as after wk 9 in males, however, as late as after birth in females. Importantly, most CpG-rich promoters remain unmethylated at all stages of embryogenesis, i.e., they are not concerned by these waves of methylation and demethylation
164
11 Epigenetics in Development
Genome-wide epigenetic reprograming during pre-implantation development resets the zygotic epigenome for naïve pluripotency. This process is far more pronounced in PGCs than in other cells of the embryo in order to erase imprints and most other epigenetic memories (Fig. 11.2). Since DNA methylation is an important epigenetic silencer that modulates gene expression and maintains genome stability (Sect. 6.1), the transient loss of DNA methylation in PGCs bears the risk of causing activation of retrotransposons, proliferation defects and even cell death. Therefore, genome-wide reorganization of repressive histone modifications via pluripotency transcription factors safeguards genome integrity in this phase of embryogenesis. In early embryogenesis the maternal and paternal epigenomes also differ significantly concerning their histone modification patterns. The global pattern of histone marks within the maternal epigenome resembles that of somatic cells, while the paternal epigenome, due to the protamine-histone exchange process, is hyperacetylated, rapidly incorporates histone variant H3.3 and is devoid of H3K9me3 and H3K27me3 markers of constitutive heterochromatin. On the paternal epigenome the first monomethylation occurs at H3K4, H3K9, H3K27 and H4K20. Furthermore, at these positions, different KMTs perform di- and trimethylation. This takes place also on the maternal epigenome, directly after conception, where features of heterochromatin, such as H4K20me3 and H3K64me3 marks, are actively removed, while H3K9me3 marks are lost passively. The initial methylation asymmetry in the paternal and maternal epigenome becomes largely equalized in the course of subsequent development. However, certain genomic regions, such ICRs, stay asymmetric between both alleles, not only on the level of DNA methylation but also concerning histone modifications, such as H3K27me3. This is the basis for genomic imprinting, i.e., for paternal- and maternal-specific gene expression (Sect. 6.3). During preimplantation development the absence of typical heterochromatin parallels with in general more open chromatin. This keeps the chromatin widely accessible and is necessary for epigenetic reprograming, when gamete-specific modifications are removed and new marks are re-established. During the course of further development, such as the blastocyst level, cells of the inner cell mass (forming the embryo) show higher levels of DNA methylation and H3K27 methylation, as well as lower levels of histone H2A and/or H4 phosphorylation than cells of the trophectoderm (forming the placenta). This epigenomic asymmetry is a sign of differentiation of the respective cell types and regulates lineage allocation in the early embryo. Accordingly, precise and robust gene regulation via the control of access and activity of promoter and enhancer regions is essential.
11.2 The Epigenetic Landscape The epigenetic landscape is a very illustrative model for understanding the underlying molecular mechanisms of cell fate decisions during development. Cellular differentiation happens along lineages and is under natural conditions an irreversible forwardmoving process. It results in highly specialized, terminally differentiated cell types.
11.2 The Epigenetic Landscape
165
In this model, cellular differentiation may be compared to a system of valleys of a mountain range, where a cell (often represented by a ball, Fig. 11.3), e.g., an ES cell, begins at the top and follows existing paths driven by gravitational force. The latter analogy should express that the path of differentiation has a clear direction. This directs the cell into one of several possible fates represented as valleys that get narrower in the trajectory toward terminally differentiated cell types (Fig. 11.3, bottom). Along the downhill path, cell fate decisions need to be taken at bifurcation points. These decisions often depend on the expression of lineage-determining transcription factors. Once a cell has taken a decision, it is restricted in its subsequent decisions by the route it has taken. The developmental potential of stem cells on top of the hill correlates with high entropy (i.e., the potential to take a multitude of cellular stages), which declines during differentiation toward well-defined cell types (Fig. 11.3, left). In contrast, when embryonal pluripotency transcription factors (Sect. 11.2), such as OCT4 or NANOG, are reactivated in terminally differentiated cells, entropy can increase again and a cell may move uphill in the landscape (Fig. 11.3, center). This happens often during tumorigenesis, when (epi)mutations activate transcription factors or other nuclear proteins, such as chromatin modifiers, the activity of which results in gene expression heterogeneity (Sect. 29.1). The latter discontinues the cell fate choice and the transformed cells reach a state of higher entropy, in which they again proliferate and self-renew, i.e., they are de-differentiated compared with their normal counterparts (Fig. 11.3, right). The epigenetic landscape model is also used to illustrate the phenotypic plasticity of cells during the creation of iPS cells (Box 11.1).
Stem cells Normal development/
rentiated states
Fig. 11.3 Phenotypic plasticity during cellular reprograming and neoplasia. Waddington’s landscape model can be used for the illustration of phenotypic plasticity of cells during normal development (left), the creation of iPS cells, i.e., in cellular reprograming (center), as well as during the induction of neoplasias, i.e., in tumorigenesis (right)
166
11 Epigenetics in Development
Taken together, the epigenetic landscape is an attractive, intuitively understandable model how the static information provided by the genome is translated dynamically into tissues and cell types.
Box 11.1: Potency of Human Cells The potency of a cell is its ability to differentiate into other cells. Totipotent cells can form all the cell types in a body including extraembryonic placental cells. Only within the first 6–8 cell divisions after conception embryonic cells are totipotent. Pluripotent cells, such as ES cells, can give rise to all cell types forming our body. Multipotent cells, such as adult stem cells, can develop into more than one cell type but are more limited than pluripotent cells. In contrast, terminally differentiated cells, like more than 99% of those in our body, are unipotent. However, via the overexpression of pluripotency transcription factors unipotent cells can be induced to get pluripotent, i.e., they transform into iPS cells. Stem cells have the property of both self-renewal, i.e., the ability to run through numerous cell cycles while staying undifferentiated and the capacity to differentiate into specialized cell types. Thus, stem cells need to be either totipotent or pluripotent (Box 11.1). ES cells are found only in the inner cell mass of blastocysts (Fig. 11.2), while many adult tissues contain multipotent stem cells that are able to self-renew and to differentiate into various tissue-specific cell types. Thus, adult stem cells are crucial for tissue homeostasis and regeneration. For example, hematopoietic stem cells (HSCs) (Sect. 11.4) differentiate into myeloid and lymphoid progenitors that give rise to all cell types of the blood and are responsible for the constant renewal of the tissue. The timing of the expression of master transcription factors plays a key role in this differentiation processes. Moreover, most developmental genes are regulated by multiple enhancers having both overlapping as well as distinct spatiotemporal activities. Key lineage-specific genes are associated with dense cluster(s) of highly active enhancers, often referred to as super-enhancers that show stepwise binding of lineage-determining master transcription factors. Thus, in the process of development from early embryo toward terminally differentiated cells, the epigenome at promoter and enhancer regions changes significantly. Genome-wide analysis demonstrated that histone marks distinguish ES cells from terminally differentiated cells and pluripotency genes from lineage-specific genes. In ES cells (Fig. 11.4, top), enhancer regions of both pluripotency genes are enriched with H3K4me1 and H3K27ac marks. These genes are actively transcribed, because also their TSS regions are marked with H3K4me3 and their gene bodies show H3K36me3 modifications. In contrast, the enhancers of lineage-commitment genes carry H3K4me1 marks and repressive H3K27me3 instead of H3K27ac marks, which keeps the genes in a poised state, even if their TSS regions carry H3K4me3 marks. Thus, enhancers and promoters of poised genes comprise both activating and
11.2 The Epigenetic Landscape
167
repressing histone marks, i.e., they are examples of bivalent chromatin states from which they either get fully activated or repressed. After differentiation toward a specific lineage, such as neurons (Fig. 11.4, bottom), only lineage-specific genes are marked by H3K27ac at both enhancer and promoter regions as well as by H3K4me1 at their enhancers. Then Pol II pausing is released and mRNA transcription continues. Genes of other lineages lose marks at their enhancers and obtain repressive H3K27me3 marks at their TSS regions. Moreover, pluripotency genes attain H3K9me3 marks and DNA methylation at their promoter regions in order to keep them stably silenced for the rest of the life. During the differentiation process, heterochromatin regions are marked by H3K9me2 and H3K9me3 modifications, HP1 binding and DNA methylation are expanded so that chromatin becomes more condensed. In repressed genes as well as in intergenic regions H3K27me3 marks also increase. In contrast, during cell lineage commitment, KDMs remove H3K27me3 marks from specific promoter-associated CpGs, in order to make the respective genes transcriptionally permissive. This also includes depletion of nucleosomes from TSS regions via chromatin remodelers (Sect. 8.2). Some 20 years ago, the technique of cellular reprograming of terminally differentiated cells into induced pluripotency, i.e., the creation of so-called iPS cells (Sect. 6.2),
ES cells K27ac/K4me1 Ac
Active transcription
Ac
Enhancer
Histone 3 K4me3
K36me3
K4me1
Promoter
Pol II
Pluripotency genes
Enhancer K4me1 K27me3
Pol II pausing
Enhancer
Promoter K4me3
Pol II Neural genes
Me
Me
Promoter
Me
K4me3
Me
K27me3
K9me3
Intergenic
K27me3 K36me3
K27me3
K27me3
Pol II Other lineage genes
Neur Neural cells
Ac
Intergenic
K27ac
Cytosine methylation Me
rentiation K9me2/me3
K9me2
Stable silencing
Heterochromatin
K9me2
K27me3 K4me3
Pol II pausing
K9me2/me3
Unmethylated 5-methyl
Chromatin associated proteins EP300
Enhancer
Promoter Me Me Me
K27ac/K4me1 Ac
Me
K4me3
Pluripotency genes K36me3
HP1
Heterochromatin Me Me
Me
Me
Me Me
K27me3
Ac
Transcription
Enhancer
Promoter
Repression
Enhancer
Promoter
Pol II Neural genes
K27me3
Me
Intergenic K27me3
Other lineage genes
Intergenic
Fig. 11.4 Chromatin states of ES cells in comparison to lineage-specific cells. The chromatin stages at enhancers, promoters, gene bodies and intergenic heterochromatin regions of pluripotent genes, neuronal genes and other lineage genes are compared between ES cells (top) and, as an example, neural cells (bottom)
168
11 Epigenetics in Development
was invented. The method uses the ectopic expression (i.e., the abnormally high expression) of the pluripotency transcription factors OCT4, SOX2, KLF4 and MYC in order to reprogram the somatic epigenome and to induce a stable pluripotent state, similar to that of an ES cell. OCT4, SOX2 and KLF4 (Krüppel-like factor 4) cooperatively suppress lineage-specific genes and activate pluripotency genes (Fig. 11.4), while MYC overexpression stimulates cell proliferation, induces a metabolic switch from an oxidative to a glycolytic state and mediates pause release and promoter reloading of Pol II. Nevertheless, the induction of pluripotency is very inefficient and only 0.1–3% of a cell population get fully reprogramed, i.e., there seems to be a number of epigenetic barriers that stabilize the identity of somatic cells and prevent their aberrant transdifferentiation. However, cellular reprograming has the potential to regenerate diseased organs and also provides further insight into the principles of epigenetic control of cellular differentiation. During normal development from stem cells via progenitor cells to terminally differentiated cells, there is a gradual placement of repressive epigenetic marks, such as DNA methylation and histone methylation combined with more restricted accessibility of genomic DNA. Therefore, the overexpression of pluripotency transcription factors results in prominent changes of the epigenetic stage of somatic cells establishing that of pluripotent cells. In view of the epigenetic landscape model, cellular reprograming means to roll back the ball/cell to the top of the hill via changes of the epigenome. Moreover, balls/cells may move only a part of the way up the hill and roll back down passing a different “valley”, a discrete number of troughs or even travel from one valley to another without going back uphill. This process is termed transdifferentiation and ends up in a different type of terminally differentiated cell. The first targets of reprograming transcription factors in somatic cells are accessible genomic regions with H3K4me2 and H3K4me3 marks. The following targets are genomic regions with H3K4me1 marks being in a poised state (Sect. 7.2). Reprograming transcription factors act as pioneer transcription factors, i.e., as transcription factors that bind genomic DNA even in the presence of nucleosomes. In contrast, regular transcription factors are not able to nucleosome-covered genomic DNA. Pioneer factors then recruit other transcription factors and chromatin modifiers. Also, bivalent genes with active H3K4me3 marks and repressive H3K27me3 marks belong to this category, but they need to be changed from an active state in somatic cells to a poised state typical for pluripotent cells. The most difficult targets for pluripotency transcription factors are heterochromatin regions with repressive H3K9me3 marks. These regions need extensive multistep chromatin remodeling in order to get transcriptionally activated. Surprisingly, DNA methylation does not play any essential role in cellular reprograming. In contrast, DNA demethylation of pluripotency genes, by either active or passive mechanisms, is crucial for effective reprograming.
11.3 Epigenetic Dynamics During Differentiation
169
11.3 Epigenetic Dynamics During Differentiation Differentiating cells share accessible chromatin regions with the ES cell they are derived from, but the similarity in the epigenetic landscape (Sect. 11.2) decreases when cells mature. After commitment to a specific lineage, the cellular repertoire expands for accessible regulatory regions that contain motifs for transcription factors being specific to that lineage, whereas it clearly decreases for TFBS of other lineages. Thus, the epigenetic landscape of terminally differentiated cells is constrained by the walls of valleys, the height of which are determined by a gene regulatory network. This network is formed by appropriate levels of DNA methylation and histone modifications as well as by a proper 3D architecture. In this way, cells are prevented from switching states (Fig. 11.5, left). However, in response to relevant intra- and extracellular signals, the epigenome also allows cell state transitions. When chromatin homeostasis is disturbed, e.g., by epimutations, cells do not respond appropriately to these signals. Overly restrictive chromatin networks create epigenetic barriers that prevent all types of cell state transitions (Fig. 11.5, center). In contrast, excessively permissive chromatin networks have very low barriers and allow multiple types of cell state transitions (Fig. 11.5, right). For example, deviations from the norm contribute to tumorigenesis (Sect. 27.2). Changes in cell identity are reflected by alterations in the usage of the enhancer and promoter regions. Many of the regulatory regions that are active in early embryogenesis lose their activity in later phases of development. This is compensated through the activity of TSS regions and poised enhancers, some of which turn into super-enhancers. Changes in enhancer usage require a chromatin topology that allows a new set of enhancers to interact with their target promoters. In parallel, heterochromatin foci become more condensed and more abundant in differentiated cells than in undifferentiated cells. While in ES cells H3K27me3 marks show only focal distributions, in differentiated cells they largely expand over silent genes and intergenic regions. This results in silencing of pluripotency genes, activating lineage-specific genes and repressing of lineage-inappropriate genes. On the mechanistic level (Fig. 11.5, top) the scenarios of normal, restrictive and permissive chromatin can be explained, e.g., by the actions of a KMT for repressive H3K27me3 marks, such as EZH2 (enhancer of zeste homolog 2, also called KMT6A) and a KMT for activating H3K4me3 marks, such as KMT2A. EZH2 is the catalytic core of the repressive PRC2 complex and KMT2A belongs to the so-called Trithorax complex. In normal cells, both KMTs and their histone marks are in balance resulting in bivalent, poised constitutive heterochromatin at TSS regions. This means that their respective target genes are transcribed only in response to appropriate stimuli. In restricted cells, EZH2 may have a gain-of-function epimutation, such as often observed in several forms of lymphoma, resulting in far higher levels of repressive H3K27me3 marks, stable heterochromatin and no gene transcription. In this state, cells may be blocked in differentiation and continue to grow with a high proliferation rate. In contrast, in permissive cells a demethylase, such as KDM6A, inhibits the action of EZH2 and removes H3K27me3 marks. KDMs are often upregulated under
170
11 Epigenetics in Development
Restrictive
Normal
Permissive
Energy state diagram
OFF
ON
OFF
K27
K27
K4 me me me
me me me
mechanism
EZH2
K4
K27
KMT2A
KMT2A
EZH2
EZH2
Bivalent “poised” promoter Responsive to signaling cues Cell state change accompanied by epigenetic state changes
Cell state transitions
K4 me me me
me me me
EZH2 gain-of-function mutation, stable repression Cell unable to leave proliferative epistate
Epigenetic insult raises chromatin barrier
KMT2A KDM6A
KDM upregulation spurious activation
Plasticity allows bidirectional transition
Epigenetic lesion lowers chromatin barrier
Fig. 11.5 Chromatin structure, cellular identity and cell state transitions. In normal cells (left) networks of chromatin proteins stabilize the states of cells but also mediate the response to intra and extracellular stimuli and occasionally allow cell state transitions. However, cells in which the chromatin network is perturbed do not respond appropriately. In restrictive chromatin (center) epigenetic barriers prevent cell state transitions, while in overly permissive chromatin (right) these barriers are lowered and allow easy transition to other cell states. The scenarios are illustrated via an example of the underlying molecular mechanisms (top) or as cell state transitions (bottom). Blue nuclei represent normal cells, while red nuclei indicate cancer cells
stress conditions. In net effect, this leads to the dominance of H3K4me3 marks and to the activation of gene expression, such as of oncogenes, even in the absence of specific stimuli. In the cell state transition diagram (Fig. 11.5, bottom) the barrier between the cell states is either of medium height in normal cells, very high in restricted cells or low in permissive cells. In the homeostasis of adult tissues, dividing and differentiating resident stem cells replace damaged or dying cells when necessary. For example, human epidermis heavily relies on correct stem cell function, both in homeostasis and after wounding. In the epidermis, stem cell pools reside exclusively in the basal layer and proliferation occurs only there. The basal layer continuously replenishes the whole tissue with fresh cells that migrate and differentiate through the different epidermal layers. During this epidermal differentiation process, the state of chromatin changes dynamically. For example, genome-wide levels of H3K27me3 marks decrease during differentiation, in particular at TSS regions of epidermal differentiation
11.4 Epigenetics of Blood Cell Differentiation
171
genes. This parallels with decreased binding of PRC2 and increased binding of the H3K27me3 demethylase KDM6B. Moreover, in epidermal differentiation the genome-wide histone acetylation level is decreased and terminally differentiated skin cells show higher expression of HDAC1 and HDAC2. Finally, also genome-wide DNA methylation levels decrease during epidermal differentiation.
11.4 Epigenetics of Blood Cell Differentiation Hematopoiesis is the process of lifelong regeneration of blood cells. Every day HSCs give rise to some 1011 cells, i.e., over our lifespan the bone marrow produces far more cells than any other tissues of our body. This highly dynamic developmental process includes the self-renewal of multipotent HSCs as well as their differentiation in a hierarchical cascade. Hematopoiesis leads to 11 major lineages of mature blood cells including some 100 phenotypically distinct cell subtypes (Fig. 11.6a). Most of these cells belong to the immune system (Sect. 14.3). HSCs differentiate into immature progenitor cells, such as multipotent progenitors (MPPs), which then give rise to the progenitors of the myeloid or lymphoid lineages, called common myeloid progenitors (CMPs) and common lymphoid progenitors (CLPs), respectively. CMPs further differentiate into megakaryocyte-erythrocyte progenitors (MEPs) and granulocytemonocyte progenitors (GMPs). The cells of myeloid lineage include erythrocytes, platelets and cells of the innate immune system, such as neutrophils, eosinophils and monocytes (which can further differentiate into DCs or macrophages). On the other side, the lymphoid lineage produces the main cells of the adaptive immune system, B and T cells. Erythrocytes are also referred to as to red blood cells, whereas myeloid and lymphoid cells are summarized as leukocytes or white blood cells. A number of extrinsic and intrinsic factors, such as growth factor-stimulated signal transduction pathways, transcription factors and chromatin modifiers, regulate the equilibrium between self-renewal and differentiation of HSCs. In contrast, a disruption or misregulation of this process can lead to hematological disorders, such as leukemia, lymphoma and myeloma (Sect. 24.2). In these diseases the excessive production of white blood cells in the bone marrow significantly raises their levels in blood circulation. Moreover, a disruption in any stage of hematopoiesis affects the production and function of blood cells and may have severe consequences, such as the inability to fight against infections or the risk of uncontrolled bleeding. During hematopoiesis the genome-wide DNA methylation pattern of differentiating blood cells changes dynamically and is very locus specific, i.e., at some genomic regions there is a rise in methylation, while it decreases at other regions (Fig. 11.6b, left). The latter correlates with the upregulation of cell-specific genes and their encoded proteins, such as the tyrosine kinase LCK (LCK proto-oncogene, SRC family tyrosine kinase) in T cells, the cofactor POU2AF1 in B cells and the chemokine receptor CXCR2 (C-X-C motif chemokine receptor 2) in neutrophils. In general, the commitment to a specific cell lineage increases the level of DNA methylation, since a larger set of genes is not anymore needed in these terminally differentiated cells, such
172
11 Epigenetics in Development
b
Commitment
Multipotency
EHMT1, EHMT2
HSC
CDKN2A
TET2, DNMT3A, DNMT3B
PRC1
PRC2
EED
Proliferation
Self-renewal
BMI1
e.g., LCK in T cells POU2AF1 in B cells CXCR2 in neutrophils
DNMT1
Expression of chromatin modifiers
EZH2
DNA methylation level
CBX7
PRC1 BMI1, CBX7
rentiation genes
PRC2 SUZ12 and EED EZH1 or EZH2
Trithorax group KMT2A, KMT2E, MEN1 and ASH1L
Lineage-specific genes
a
MPP EZH1, EZH2, DNMT1, TET2
CLP
BMI1
GMP
T cell
B cell
CBX8
MEP
Multipotency genes
CMP
NK cell Erythrocyte Platelets Macrophage Granulocyte My
rentiation
L
rentiation
e.g., MEIS1
e.g., DACH1 in CLPs
Fig. 11.6 Epigenetics of hematopoiesis. Key chromatin modifiers of HSC self-renewal and their differentiation during hematopoiesis are indicated (a). During hematopoietic lineage commitment DNA methylation levels change dynamically (b, left). The expression of key epigenetic regulators alters during hematopoiesis (b, right). More details are provided in the text
as the transcription factor MEIS1 (meis homeobox 1), which maintains the undifferentiated state, or the myeloid-specific transcription factor DACH1 (dachshund family transcription factor 1) in lymphoid cells. Interestingly, the myeloid lineage is the default outcome of hematopoiesis, since its differentiation requires less correction by increased DNA methylation than that of the lymphoid lineage. Thus, hematopoietic cells can be easily segregated based on their DNA methylation profile, i.e., their DNA methylome. Parallel to alterations in the DNA methylation pattern, also key chromatin modifiers are changing their expression during hematopoiesis. For example, the expression of most members of the Polycomb family changes during HSC differentiation (Fig. 11.6b, right). The PRC1 components CBX7 and BMI1 (BMI1 protooncogene, Polycomb ring finger), which are responsible for the recognition and monoubiquitination of H2AK119 (Sect. 6.3), are highly expressed in HSCs but are downregulated during lineage commitment. In contrast, the CBX7 competitor CBX8 is upregulated. The PRC2 component EED (embryonic ectoderm development) does not change during hematopoiesis, while the H3K27-specific KMT EZH2 is downregulated. Similarly, members of the Trithorax group family, such as KMT2A, KMT2E, ASH1L (ASH1 like histone lysine methyltransferase) and MEN1 (menin 1),
11.5 Neuronal Development: The Role of Epigenetics
173
contribute to hematopoiesis. Furthermore, the KMTs EHMT1 and EHMT2 deposit repressive H3K9me2 marks to the epigenome of HSCs (Fig. 11.6a). Accordingly, a misregulation of the genes encoding for these chromatin modifiers can result in hematopoietic failure, such as HSC cell cycle arrest, premature differentiation, apoptosis and defective self-renewal and finally leads to hematological malignancies. In addition to chromatin modifiers, some master transcription factors, such as CEBPα, SPI1 and GATA2, have a key role in hematopoiesis. They act as pioneer transcription factors that directly bind nucleosomal DNA to prime enhancers for activation. These transcription factors then recruit chromatin remodeling and modifier complexes, which in turn facilitate removal and posttranslational modification of nucleosomes at these genomic regions. For example, in myeloid progenitors the sustained expression of CEBPα generates macrophages, whereas under sustained expression of GATA2 mast cells are created. However, when initially CEBPα and afterward GATA2 are expressed, eosinophils are produced, while the reversed order leads to basophils. Furthermore, CEBPα interacts with the DNA demethylating enzyme TET2, so that its target genes get demethylated during hematopoiesis. The activity of TET2 may be the key mechanism why myeloid cells are closer to HSCs than lymphoid cells. This fits with the observation that TET2 is mutated in several myeloid malignancies. Moreover, TET2 could link environmental conditions, such as nutrient availability (Sect. 37.1), to myeloid differentiation, since the metabolite 2-hydroxyglutarate inhibits TET2 activity and leads to DNA hypermethylation. Taken together, hematopoiesis is an important process ensuring key function of our body by constantly providing new cells needed for oxygen transport (erythrocytes), blood coagulation after injuries (platelets) and immunity (leukocytes). Transcription factors and chromatin modifiers work together in creating appropriate epigenetic profiles on the level of DNA methylation and histone modifications, which determine the respective functions of the more than 100 different cell types of the hematopoietic system.
11.5 Neuronal Development: The Role of Epigenetics The frontal cortex region of our brain plays a key role in behavior and cognition and requires a coordinated interaction of neuronal and non-neuronal cells, such as supporting glial cells. The highly controlled process of neuronal development and maturation creates the physical structure of our brain. It starts during embryogenesis and continues until the third decade of our life. In parallel, after birth there is first a burst of synaptogenesis and then a pruning of unused synapses during adolescence. This is the cellular basis for experience-dependent plasticity and learning in children and young adults. Its disruption can lead to behavioral alterations and neuropsychiatric disorders. Like other developmental programs of our body (Sect. 11.1), also neuronal development is controlled by precise epigenetic patterns, such as DNA methylation and histone modifications. Thus, in principle neuroepigenetics is based on the same mechanisms as all other of our tissues and cell types.
174
11 Epigenetics in Development
In general, epigenome-wide studies focus on 5mC marks at CpGs (mCG, red in Fig. 11.7a). However, like ES cells, neurons have the special property to carry significant levels of mCH marks (H = A, C or T, Sect. 6.1), some 70% of which are mCA marks. While mCH marks are hardly detectable in fetal brain, they increase during early postnatal development to a maximum of 1.5% of all CH dinucleotides at the end of adolescence (blue in Fig. 11.7a). mCH levels rise most rapidly during the primary phase of synaptogenesis, i.e., within the first two years after birth and correlate with the increase in synapse density (green in Fig. 11.7a). The widespread methylome reconfiguration, such as mCH, occurs in neurons, but not in glial cells, during fetal to young adult development and becomes the dominant form of methylation in our neuronal epigenome. Thus, genome-wide DNA methylation patterns significantly change during brain development and maturation, they are the basis for neuronal plasticity. The frontal cortex develops postnatally in response to various inputs from the environment. Dependent on sensory input this leads to neuronal-specific DNA methylation and causes changes in gene expression and synaptic development. The chromatin modifier DNMT3A sets these mCH marks in particular at CA dinucleotides. Interestingly, although the average methylation percentage at CH is clearly lower than at CG, but CpGs are more rare, in the adult brain mCH marks are by number even more abundant than mCG marks. Thus, in the maturing brain mCA is a major epigenetic mark repressing gene expression. In general, mCA marks serve as a docking platform for methyl-binding proteins, e.g., at the genomic region of the gene BDNF (brain-derived neurotrophic factor). The
a 16 yr
25 yr
mCG/CG
55 yr
80
mCH/CH 64 yr
2 yr
1.2
12 yr
60
% mCG/CG
b 1.6
Amount
40
0.8 synapses
Childhood
35 d
0.4
20 Adult
Adolescent
Fetal
mC hmC
synaptic density
% mCH/CH
5 yr
0
0 0
birth
10,000
Age (days post conception)
20,000
Birth
Adult Synaptic development and maturation
Fig. 11.7 Changes of the neuronal methylome during brain development and maturation. The levels of mCH (a) and 5hmC (b) accumulate in neurons of the human frontal cortex after birth, which coincides with active synapse development (indicated as synaptic density per 100 mm3 ) and maturation (a). Please note that mCH marks cause gene silencing, while 5hmC marks are found at active genes. Data are based on Lister et al. (Science 2013, 341:1,237,905)
11.5 Neuronal Development: The Role of Epigenetics
175
methyl-CpG-binding transcription factor MECP2 acts as a reader of DNA methylation marks (Fig. 6.2) and also recognizes with high affinity mCA marks. Therefore, genes that acquire mCA enrichment during neurodevelopment recruit MECP2 and are repressed in their transcriptional initiation and elongation. This regulatory process mediates distinct functions in the brains of adult versus that of newborns. Accordingly, the number of mCA marks at gene bodies is more predictive for the level of gene silencing than that of mCG marks at promoters or any measure of chromatin accessibility. Moreover, the impact of mCH marks is further highlighted by the observation that between individuals mCH marks are more conserved than mCG marks. Interestingly, different regions of the brain, such as frontal cortex, hippocampus and cerebellum, show significant age-dependent increase of 5hmC, i.e., of the oxidized forms of 5mC (Fig. 11.7b). This increase is specific to neurons, which in adults have far higher 5hmC levels than any other human tissue of cell type. TET enzymes mediate the 5mC oxidation and active DNA demethylation in neurons. Based on mouse knockout studies, TET1 is most important for neurogenesis and synaptic plasticity. Thus, 5mC oxidation and possibly DNA demethylation are central epigenetic mechanisms of brain development and maturation. Like mCA also 5hmC marks recruit MECP2 and other methyl-binding proteins, but in this case the abundance of these transcription factors mostly positively correlates with gene expression. This fits with the observation that the MECP2 mutation R133C, which occurs in some forms of the autistic spectrum disorder Rett syndrome (Sect. 13.2), specifically disrupts the ability of the protein to bind to 5hmC and results in target gene silencing. Thus, enrichment of 5hmC and depletion of 5mC both increase transcriptional activity and chromatin accessibility (Fig. 11.8). This also suggests that 5mC oxidation may be the key epigenetic mechanism in controlling gene expression in the context of synaptic plasticity. This is important for learning and memory. The latter involves effects on long-term potentiation, excitability and activity-dependent synaptic scaling of neurons. Thus, via controlling the activity of genes encoding for ion channels, receptors and trafficking mechanisms, the epigenome has the capacity to both sense extracellular signals reaching neurons and to control their output. MECP2 interacts with a wide range of proteins, such as heterochromatin protein HP1, the corepressor NCOR1 and the HAT CREBBP. The half-life of MECP2 is only 4 h, since the protein gets rapidly ubiquitinated. The transcription factor is ubiquitously expressed in basically all human tissues and cell types, but it shows highest expression in the brain, in particular in neurons. This explains why MECP2 is critical for the development of the brain (Sect. 11.5). In neuronal chromatin MECP2 is a very abundant protein appearing in average at every second nucleosome (Fig. 11.9). MECP2 and the linker histone H1 (Sect. 2.1) compete for binding to the nucleosome. When MECP2 levels rise during the neuronal development, the protein replaces histone H1. This causes the reduction of the chromatin repeat length, i.e., the distance from the center of a nucleosome to the center of its neighbor, from 200 base pairs to 165 base pairs (Fig. 11.9). Thus, MECP2 increases the density of chromatin packaging. In this configuration, MECP2 is part of tightly folded heterochromatin
176
11 Epigenetics in Development
mRNA MECP2
Me Me Me
Me
Me Me Me
Me
Me
Neural genes
Me
Me
MECP2
MECP2
Me
Enhancer
Me
Me
Me
Me
Enhancer
Me Me
Me
Neural genes
DNA methylation
Me
non-CpG methylation 5mCpG 5hmCpG
MECP2 mRNA
Me
?
?
Me
Me
Neural genes
Me
Enhancer
MECP2
MECP2
Me
Me
Enhancer
Me
Me Me
Me
Me Me
Me
Me
Neural genes
Fig. 11.8 The neuronal methylome during brain development. 5hmC marks label enhancers in the fetal brain (top) that will become demethylated and active in the adult brain (bottom). The DNA-binding pattern of methyl-DNA-binding proteins, which have different affinity for 5hmC and 5mC, can change. This affects the neuronal transcriptome
structures suggesting that the protein would function mainly as a transcriptional repressor. Nevertheless, there are a number of MECP2 interaction partners that stimulate gene expression. This indicates that MECP2 rather is a transcriptional regulator that, depending on its interaction partners, binds to genomic regions of activated or repressed genes. Furthermore, MECP2 has opposite roles when binding to promoter regions or gene bodies. DNA methylation at TSS regions recruits MECP2 in complex with corepressor proteins and HDACs and results in transcriptional repression. In contrast, the DNA of gene bodies of transcribed genes is methylated and recruits MECP2 binding, which in turn prevents the binding of the repressive histone variant H2A.Z (Box 2.2). Thus, the genomic location of MECP2 binding is of critical importance of its function.
11.6 Epigenetic Basis of Memory
177
MECP2 H1 Repeat length bp
200 bp 200
Liver
MECP2
Astrocyte H1
180
Me
Neuron Neuron
mC
160
0
7 Days
14 MECP2 MBD
Histone H1 WHD
hm/mCpG [A/T] ≥4
AAATT
165 bp
Me
Me
Me
Astrocyte 165 bp
Me
Me
Me
Fig. 11.9 MECP2 binding to chromatin of neurons and astrocytes. Astrocytes have lower MECP2 levels than neurons resulting in a regular chromatin repeat length of 200 base pairs compared to 165 base pairs for neurons. In neurons, MECP2 is evenly distributed throughout the chromatin, binds to sites of methylated DNA and replaces the linker histone H1, which decreases the repeat length. Changes of chromatin repeat length during development (in days, observed in a mouse model) before and after birth are indicated for astrocytes, neurons and as a reference liver tissue. A higher proportion of MECP2 in relation to histone H1 results in a shorter repeat length (insert top left)
11.6 Epigenetic Basis of Memory The acquisition of new information is defined as learning, while the ability to retain information for later reconstruction is memory. Memories provide the basis for our behavior, since they allow us to reliably navigate throughout our life and to interact with our (social) environment. For the consolidation of new information into memory, distinct gene expression profiles are activated in our neurons, which are based on changes of our epigenome. In contrast, impairments in learning and memory can have devastating consequences for an individual’s ability to function independently in society. In addition, the persistence of undesirable memories, such as those of trauma (e.g., war veterans) or violence (e.g., child abuse), can contribute to mental illness leading to social inhibition. Thus, (social) intelligence is based on our neuronal epigenome. The epigenomic status of a tissue or a cell type depends on an effective interplay between environment and chromatin. In principle, any perturbation of cellular homeostasis can result via epigenetic changes in long-lasting effects of the phenotype, in particular when the perturbed cells are self-renewing stem cells or long-lived, terminally differentiated cells, such as neurons or memory T cells. These perturbations result in the activation of signal transduction pathways that often reach the
178
11 Epigenetics in Development
nucleus. Within the nucleus activated transcription factors communicate with chromatin modifiers and remodelers and in this way create changes in epigenetic signatures, such as histone modifications, DNA methylation and 3D chromatin architecture. Some of these epigenetic changes are very transient (lasting from minutes to hours), while others can stay far longer (days, months or even years). Accordingly, the epigenome serves as a storage facility of cellular perturbations of the past. Speaking in numbers: each diploid cell contains approximately 30 million nucleosomes with more than 130 different possibilities for posttranslational modifications (Sect. 7.1). With the approximately four billion (130 × 30 million) “letters” within the histone code of a single cell, it can store via histone modifications a tremendous amount of data. The epigenome is able to memorize lifestyle events in basically every tissue or cell type. Thus, not only neurons store the memory of an individual (Sect. 11.5), but also the immune system memorizes encounters, e.g., with microbes (Sect. 15.4) and metabolic organs, such as skeletal muscle, fat and liver, remember lifestyle choices on diet and physical activity. In contrast, a disruption of the epigenetic memory can lead to the onset of cancer (Sect. 29.3). Memories of our childhood start from an age of approximately three years, i.e., they last for many decades. DNA is the only molecule in our body that has a comparable half-life, i.e., only our genome can be the molecular basis for a long-term memory. Since memories do not change the sequences of our genome, our neuronal epigenome remains as the exclusive device for information storage. In previous chapters we used multiple times the term “epigenetic memory” (Sects. 2.2, 6.1, 6.3 and 7.4) and often meant the long-term stability of cell identities via preserved gene expression states and robust gene regulatory networks. For example, the actions of chromatin modifiers and remodelers within Polycomb and Trithorax complexes result in hundreds of genomic regions in long-term, mitotically heritable memory of silent and active gene expression states. Key proteins of these complexes are KMTs and KDMs, such as EZH2, KMT2A, KDM5C and KDM6B, while HATs and HDACs are missing. This reiterates the principle that short-term “day-to-day” responses of the epigenome are primarily mediated by non-inherited changes in the histone acetylation level, while long-term decisions, e.g., concerning cellular differentiation, are stored in form of histone methylation marks. DNA methylation not only silences gene expression but in addition also serves as an essential mediator of memory acquisition and storage. Neurons do not divide and get as old as we get, i.e., their epigenome is the most likely location for our long-term memory. The knockout of the genes Dnmt1 and/or Dnmt3a in mice demonstrated a loss of long-term potentiation and consecutively deficits in learning and memory. This indicates that without active DNA methylation, information storage processes do not work. Moreover, rather than being a first responder to extracellular signals, DNA methylation acts as a consolidator of previously established memory acquisition via histone acetylation and methylation. In summary, each of the approximately 100 billion (1011 ) neurons within our brain have a tremendous data storage capability, since each of it contains some 700 million cytosine that may be methylated and some 30 million nucleosomes comprised of
Additional Reading
179
240 million histone proteins that can be posttranslationally modified in more than 100 individual ways. (Clinical) Conclusion: It is undisputable that epigenetics has most impact during early embryogenesis. However, epigenetic landscapes that are created within daily differentiation processes in the bone marrow, skin and intestine are essential for stabilizing the functional identity of terminally differentiated cells. Furthermore, epigenetic changes are also the molecular basis for memorizing life-long experiences, such as in neurons but also in most other cell types.
Additional Reading Hekselman, I., & Yeger-Lotem, E. (2020). Mechanisms of tissue and cell-type specificity in heritable traits and diseases. Nature Reviews Genetics, 21, 137–150. Li, M., & Belmonte, J. C. (2017). Ground rules of the pluripotency gene regulatory network. Nature Reviews Genetics, 18, 180–191. Wang, Y., Zhao, Y., Bollas, A., Wang, Y., & Au, K. F. (2021). Nanopore sequencing technology, bioinformatics and applications. Nature Biotechnology, 39, 1348–1365. Yadav, T., Quivy, J. P., & Almouzni, G. (2018). Chromatin plasticity: A versatile landscape that underlies cell fate and identity. Science, 361, 1332–1336.
Chapter 12
Epigenetics and Aging
Abstract In this chapter, we will discuss that the epigenome has a memory function in both somatic and germ cells. The latter is the basis for transgenerational inheritance. The master example of the transgenerational epigenetic inheritance concept is the agouti mouse model. However, also different types of human cohorts as well as “natural experiments” allow studying the impact of epigenetics on a population level. The progressive decline in the function of cells, tissues and organs associated with aging is affected by both genetic and epigenetic factors, i.e., there are characteristic epigenome-wide changes during aging acting as epigenetic clocks over years and decades. In contrast, epigenetic circadian clocks in the brain as well as in peripheral tissues coordinate a large set of physiological functions over a day. Keywords Epigenetic memory · Epigenetic drift · Transgenerational epigenetic inheritance · Human cohorts · Natural experiments · Aging · Epigenetic clock · Circadian clock
12.1 Transgenerational Epigenetic Inheritance The epigenome is able to preserve the results of cellular perturbations by environmental factors in form of changes in DNA methylation, histone modifications and 3D organization of chromatin. Thus, the epigenome has memory functions (Sect. 11.6). Changes in epigenomic patterns, such as DNA methylation maps, are called epigenetic drifts. They primarily describe the lifelong information recording (“experience”) of somatic cell types and tissues, but may also be inherited to daughter cells, when the cells are proliferating. In case of germ cells, epigenetic drifts may be, at least in part, even transferred to the next generation (Sect. 11.1). This leads to the concept of transgenerational epigenetic inheritance, which suggests that the lifestyle of the parent and grandparent generation, such as daily habits in food intake or physical activity, may affect their offspring. The master example of the transgenerational epigenetic inheritance concept is the agouti mouse model. This transgenic mouse carries the retrotransposon IAP (intracisternal A particle) within the regulatory region of the gene Asip (agouti signaling © The Author(s), under exclusive license to Springer Nature Switzerland AG 2023 C. Carlberg et al., Molecular Medicine, https://doi.org/10.1007/978-3-031-27133-5_12
181
182
12 Epigenetics and Aging
protein) (Fig. 12.1). This creates a dominant allele of the Asip gene (termed Avy ), the expression of which is depending on the methylation level of IAP, i.e., on its epigenetic status. Since the methylation of the IAP retrotransposon happens stochastically, Avy behaves as a so-called metastable epiallele. The Asip gene encodes for a paracrine signaling peptide hormone that stimulates hair follicle melanocytes to synthesize yellow pheomelanin pigments instead of black/brown eumelanin pigments. Interestingly, the peptide hormone is involved also in the neuronal coordination of appetite. Thus, yellow coat Avy mice become obese and hyperinsulinemic. Heterozygous Avy /a mice vary in their coat colors from yellow via mottled to wild-type dark coat color. When the IAP retrotransposon is methylated, the synthesis of the yellow pigment is downregulated and a dark coat color appears. In contrast, unmethylated IAP allows ubiquitous Asip gene expression leading to both yellow coat color and obesity. When Avy /a mice inherit the Avy allele maternally, Asip gene expression and coat color correlate with the maternal phenotype. Interestingly, the mottled phenotype indicates that IAP methylation is mosaic, i.e., the Asip gene is not expressed in all cells. This suggests that the methylation pattern of the IAP retrotransposon is established early in development and the coat color provides an easy phenotypic readout of the epigenetic status of IAP throughout life. This makes the Avy Asip mouse an ideal in vivo model for the investigation of a mechanistic link between environmental stimuli, such as nutrition and epigenetic states of the genome. The agouti mouse model was used for the following experiment: two weeks before mating with male Avy /a mice, female wild-type a/a mice were either supplemented or not with methyl donors, such as folate, vitamin B12 and betaine (Fig. 12.1). The supplementation was continued during pregnancy and lactation. While the F1 generation of non-supplemented mothers displayed the expected number of yellow color phenotypes, the offspring of supplemented mothers shifted toward a brown coat color phenotype. This suggests that maternal methyl donor supplementation leads to increased Avy methylation in the offspring. Furthermore, this means that an environmentally induced epigenetic drift in the mothers was inherited to their children. The inheritance of an epigenetic programing to the next generation indicates that at least metastable epialleles, such as IAP, are able to resist the global demethylation of the genome before pre-implantation (Sect. 11.1). Interestingly, when Avy mice were fed with a soy polyphenol diet causing changes in their DNA methylation patterns, their offspring were protected against obesity and diabetes across multiple generations. In another mouse model, maternal undernutrition leads to low birth weight and glucose intolerance in male and female F1 offspring. Exposure to suboptimal nutrition during fetal development in utero leads to changes in the germ cell DNA methylome of male offspring, even when these males were nourished normally after weaning. These phenotypic differences are transmitted through the paternal line to the F2 offspring. More than 100 regions in the F1 sperm genome from maternally undernourished male offspring were found to be hypomethylated compared to controls. This indicates that PGCs from nutritionally restricted fetuses did not completely remethylate their DNA. Taken together, the different rodent models indicate that epigenetic memory can be passed from one generation to another by inheriting the same indexing of chromatin marks. From
12.1 Transgenerational Epigenetic Inheritance
a
Non-supplemented during pregnancy
183
Supplemented during pregnancy
Parents a/a
Avy/a
Avy/a
a/a
b
c me
IAP
me me
Asip
me
Asip IAP
Fig. 12.1 Maternal dietary supplementation affects the phenotype and epigenome of Avy /a offspring. The diets of female wild-type a/a mice are either not supplemented (left) or supplemented with methyl-donating compounds (right), such as folate, choline, vitamin B12 and betaine, for 2 weeks before mating with male Avy /a mice and ongoing during pregnancy and lactation (a). The coat color of offspring that are born to non-supplemented mothers is predominantly yellow, whereas it is mainly brown in the offspring from mothers that were supplemented with methyldonating substances (b). About half of the offspring does not contain an Avy allele and is therefore black (a/a, not shown here). Molecular explanation of DNA methylation and Asip gene expression: maternal hypermethylation after dietary supplementation shifts the average coat-color distribution of the offspring to brown by causing the IAP retrotransposon upstream of the Asip gene to be more methylated on average than in offspring that are born to mothers fed a non-supplemented diet (c). White circles indicate unmethylated CpGs and yellow circles are methylated CpGs
the different types of chromatin marks, DNA methylation seems to be designed in particular for a long-term cellular memory, while short-term “day-to-day” responses of the epigenome are primarily mediated by non-inherited changes in the histone acetylation level. Histone methylation levels are in between both extremes. The mouse models impose the question whether the concept of an epigenetic memory and inheritance is also valid for humans. There are no comparable natural human mutants and for ethical reasons human embryonal feeding experiments are not possible. However, there are natural experiments, where the exposure to severe environmental conditions was not under experimental control. For example, in the Dutch Hunger Winter occurring in the Netherlands during the winter of 1944/45
184
12 Epigenetics and Aging
in particular fetuses of their starving mothers were exposed in utero to an extreme undernutrition. This malnutrition led to impaired growth of the fetuses. The resulting low birth weight favors a thrifty phenotype that is epigenetically programed to use nutritional energy efficiently (Fig. 12.2). Thus, the children were prepared for a future environment with low resources during adult life. Even many decades after birth the in utero undernourished individuals showed subtle (99% of all genes mutated in affect, the growth of cancer cancer cells, i.e., not a driver
Epigenetic classification Epigenetic modifier
A gene that modifies the methylation of DNA, histone modification or 3D chromatin structure
TET2, DNMT3A, ARID2, BRD4, EZH2, NSD1
Epigenetic mediator
A gene regulated by an epigenetic modifier that gives advantages to cancer cells
OCT4, NANOG, SOX2, KLF4
Epigenetic modulator
A gene that activates or represses the epigenetic machineries
IDH1, CTCF
• Epigenetic modifiers are proteins that directly modify the epigenome through DNA methylation, histone modification or structural changes of chromatin, i.e., they are chromatin modifiers and remodelers. For example, childhood cancers are often based only on a small number of genetic mutations, but these often occur in genes that encode for chromatin modifiers. Interestingly, the biallelic loss of the gene SMARCB1 (the product of which is involved in chromatin remodeling) in pediatric rhabdoid tumors as well as in lung cancer and Burkitt’s lymphoma, was a first indication that the disruption of epigenetic control can serve as a driver for cancer. • Epigenetic mediators are targets of epigenetic modification, i.e., they are downstream of epigenetic modifiers. For example, due to the overactivity of an epigenetic modifier, such as a chromatin modifier of the HAT family, genes encoding for pluripotency transcription factors, such as NANOG, SOX2 or OCT4, get activated in a somatic cell. Thus, in this situation the pluripotency transcription factors are epigenetic mediators and may transform a terminally differentiated cell back to a pluripotency stage. In this way, the cell forms a cancer stem cell and initiates the tumorigenesis process. • Epigenetic modulators are gene products that are located upstream of epigenetic modifiers and mediators in signal transduction pathways. Epigenetic modulators
202
13 Epigenetics and Disease
influence the activity or localization of epigenetic modifiers in order to destabilize differentiation-specific epigenetic states. They represent a bridge between environment and epigenome. Inflammatory responses mediated by the transcription factor NFκB are an example of an epigenetic modulator. They trigger an epigenetic switch to a positive feedback loop with the cytokine IL6 and the transcription factor STAT3 in the transformation of mammary epithelia. Thus, the actions of epigenetic modulators are often the first steps in tumorigenesis resulting in changing epigenome patterns.
13.2 Epigenetic Basis of Neurological Diseases Chromatin modifiers play central roles in cognitive disorders (Table 13.2). At least seven proteins are known to be mutated in X chromosome-linked intellectual disabilities. These proteins, such as MECP2, are either methyl-binding proteins or methylmodifying enzymes. During brain development neurons acquire epigenetic marks, such as 5mC (at CG and CH) and 5hmC, that stabilize the neuronal phenotype over our lifespan. Although neurodevelopmental disorders are generally thought to be irreversible, the plastic nature of the dynamic part of the neural epigenome via 5hmC and demethylation has major implications for a possible epigenetic reprograming in the context of these diseases (Sect. 13.3). In fact, some neuroleptics are pan-HDAC inhibitors like valproic acid. The disruption of the MECP2 gene leads to a special form of autism, referred to as Rett syndrome. More than 95% of all cases of the Rett syndrome can be explained by mutations within the MECP2 gene, i.e., this special form of autism is largely a monogenetic disease. This means that the mechanistic understanding of the Rett syndrome is based on dysfunctional MECP2 proteins in neurons. In addition, also functional alternations of MECP2 in astrocytes and in microglia affect the disease phenotype, although MECP2 is much lower expressed in these cell types. Individuals with Rett syndrome are heterozygous for a mutation in the MECP2 allele. Since the MECP2 gene is located on the X chromosome, the disease is mostly embryonal lethal for males and almost exclusively females are affected with an incidence of approximately 1 in 10,000 persons. The syndrome mostly occurs through de novo mutations in the paternal germline. Affected females have an apparent normal early postnatal development, which may be due to the fact that during brain maturation mCH levels gradually increase (Sect. 11.5). However, between the age of 6–18 months the syndrome develops, such as that the individuals lose the ability to retain communication function and motor skills. Moreover, physical growth becomes retarded and microcephaly establishes. Thus, Rett syndrome is the first human neuronal disease, for which a significant impact of epigenetics could be demonstrated and it serves as a master example for the impact of neuroepigenetics on disease.
13.2 Epigenetic Basis of Neurological Diseases
203
Table 13.2 Epigenetic mechanisms of neurological disorders. Neuronal disorders and functions that are affected by epigenetics are listed, such as mutations or overexpression of MECP2, aberrant DNA methylation and/or histone modifications Function or disorder
Mechanism(s) implicated
Rett syndrome
MECP2 mutations
Autism spectrum disorders
MECP2 overexpression/increased dosage, aberrant DNA methylation
Alzheimer’s disease
MECP2 decrease, histone modifications, aberrant DNA methylation
Parkinson’s disease
Loss of MECP2
Huntington’s disease
MECP2 dysregulation
Fragile X syndrome
Aberrant DNA methylation
Rubinstein-Taybi syndrome
HAT deficiency
Friedreich’s ataxia
Reduced histone acetylation
Angelman syndrome
Genomic imprinting (DNA methylation)
Addiction and reward behavior MECP2 decrease, histone modifications, DNA methylation, miRNAs Post-traumatic stress disorder
Histone modifications, DNA methylation
Depression and/or suicide
DNA methylation
Schizophrenia
Increased MECP2 binding, histone methylation, aberrant DNA methylation
Epilepsy
MECP2 up-regulation, histone modifications, aberrant DNA methylation
The example of the Rett syndrome leads to the question, whether epigenetics plays also a role in complex multigenic disorders of the nervous system, such as neurodegenerative diseases. MECP2 is involved in controlling the secretion of the neurotransmitters GABA, dopamine and serotonin from respective neurons and affects the number of synapses of glutamatergic neurons. This is, at least in part, mediated by the interaction of MECP2 with the growth factor BDNF, which acts as a modulator on glutamatergic and GABAergic synapses. Thus, the tightly regulated expression of MECP2 is critical for neuronal homeostasis. Since both too high as well as too low MECP2 protein levels trigger opposite effects in synaptic transmission, dysregulation of MECP2 protein expression contributes to many neuro-pathological disorders, such as Alzheimer’s disease, Huntington’s diseases, schizophrenia and epilepsy (Table 13.2). In parallel, aberrant DNA methylation has been observed in some autistic spectrum disorders, Alzheimer’s disease, epilepsy and schizophrenia. In general, epigenetic mechanisms may be particularly relevant to complex diseases with low genetic penetrance that use epigenetic mechanisms of development and learned behavior, such as drug addiction, posttraumatic stress disorder, epilepsy and schizophrenia. Histone acetylation is the best-understood epigenetic modification. Several neurodegenerative diseases involve disruptions in the HAT/HDAC balance, i.e.,
204
13 Epigenetics and Disease
patients with these disorders have abnormal histone acetylation levels (Fig. 13.3). A master example is the Rubinstein-Taybi syndrome, which is characterized by short stature, mental retardation, moderate to severe learning difficulties, distinctive facial features as well as broad thumbs and big toes. The Rubinstein-Taybi syndrome is a monogenetic disease that is based on mutations of the CREBBP gene, which encodes for a HAT. The resulting low histone acetylation levels may be counterbalanced by the inhibition of HDACs, i.e., HDAC inhibitors are a therapeutic option for patients with the syndrome (Sect. 13.3). Another example of a monogenetic neurodegenerative disease is Friedreich’s ataxia, which results from the degeneration of nervous tissue in the spinal cord, in particular in sensory neurons that are essential for directing muscle movement
Fragile X Syndrome Ac
Rubinstein–Taybi syndrome
Ac
CREBBP
Rett sydrome
HDAC
FMR1
CpG Ac
EP300
HDAC1
MECP2
CREBBP
Huntington’s disease
HTT
HDAC2
Transcriptional dysregulation
HDAC8
Friedreich’s ataxia
Ac
FXN PPARGC1A Pol II Apoptotic and stress genes
Nucleus
Polyglutamine nuclear inclusions
Niemann–Pick type C disease
Cytoplasm Mitochondrion
Parkinson’s disease
Polyglutamine aggregates
Neuron
Proteasome UPS
Lysosome
MS, ischemia and stroke
Abnormal cholesterol storage in lysosomes
α−Synuclein aggregates
Alzheimer’s disease
β-Amyloid
Activation of
Glia cell
Pol II
Fig. 13.3 Role of histone acetylation in neurodegenerative diseases. The level of histone acetylation depends on the balance of HATs and HDACs and is related to several neurodegenerative diseases. For example, decreased acetylation activity of the HAT CREBBP is associated with the Rubinstein-Taybi syndrome and polyglutamine diseases, such as Huntington’s disease. The transcriptional silencing of the FXN gene in Friedreich’s ataxia or of the FMR1 gene in fragile X syndrome can be released by HDAC inhibition. Other examples of neuronal disorders are schematically depicted and their possible treatment by HDAC inhibitors is indicated
13.2 Epigenetic Basis of Neurological Diseases
205
of arms and legs. In this disorder the expansion of a triplet repeat region within an intron of the gene FXN (frataxin) leads to the loss of H3ac and H4ac marks and gain of H3K9me3 marks, heterochromatin formation and finally transcriptional silencing of the gene (Fig. 13.3). In a mouse model of this disease, HDAC inhibitors increased H3 and H4 acetylation and corrected the FXN expression deficiency. Similarly, mental retardation associated with the fragile X syndrome is caused by a CGG-triplet repeat expansion in the 5, -UTR of the gene FMR1 (fragile X mental retardation 1), which leads to extensive DNA methylation at CpGs close to the gene’s TSS and gene silencing (Fig. 13.3). Also in this case, a treatment with HDAC inhibitors resulted in reactivation of FMR1 expression. In particular SIRT1 inhibitors were able to increase acetylation and decrease methylation of histones at the FMR1 gene locus. Finally, Huntington’s disease is based on polyglutamine repeats in the 5, -coding region of the gene HTT (huntingtin) causing progressive motor and cognitive decline. The disease involves perturbations in many aspects of neuronal homeostasis, such as abnormal histone acetylation and chromatin remodeling as well as aberrant interactions of the HTT protein, e.g., affecting the function of the gene PPARGC1A (Fig. 13.3). In different animal models of Huntington’s disease HDAC inhibitors showed a neuroprotective effect. Neurodegenerative diseases have different underlying causes and pathophysiology, but they all involve impaired cognition, neuronal death and the dysregulation of the transcription factor REST (RE1-silencing transcription factor). REST is a repressing transcription factor that has an effect on both acetylation and methylation levels of histones. It is widely expressed throughout embryogenesis, but at the end of neuronal differentiation it gets downregulated in order to acquire the neuronal phenotype. The transcription factor serves as the DNA-binding platform of a large protein complex containing the corepressors RCOR1 (Sect. 9.3), HDAC1 and 2, MECP2, the KMT EHMT2 and the KDM LSD1 (KDM1A). In addition, the REST complex can also recruit the DNA methylation machinery. This leads to deacetylation and methylation of local nucleosomes at position H3K9 and demethylation at H3K4me2 marks. Thus, the local chromatin at TSS regions of REST target genes gets very effectively silenced. In total there may be up to 2000 primary REST target genes within our genome. However, the set of active REST targets is cell type- and context-dependent and varies with developmental and disease stage. Probably, different epigenetic landscapes in various brain regions and disease states largely influence the selection of REST for a subset of its target genes. Since most cases of Alzheimer’s disease are sporadic and develop over time, there is a significant contribution of environmental factors to the onset of this neurodegenerative disorder. While in neurons of the prefrontal cortex and the hippocampus of the healthy aging brain REST silences genes involved in apoptosis and oxidative stress, this is lost in patients with mild or severe cognitive impairment and Alzheimer’s disease. With the occurrence of misfolded proteins that are characteristic for the onset of Alzheimer’s disease, such as Aβ and tau, the rate of autophagy (Box 35.3) increases. Under these conditions autophagosomes engulf not only Aβ and tau complexes but also REST, which results in depletion of the transcription
206
13 Epigenetics and Disease
factor from the nucleus. The loss of REST results in an increase in expression of previously repressed genes being involved in oxidative stress and neuronal death. Thus, REST deprivation increases the loss of neurons in the respective brain regions and promotes the progression of Alzheimer’s disease. Taken together, neuroepigenetics provides alternative and/or additional mechanistic explanations for the onset of neurodevelopmental and neurodegenerative diseases. Thus, neuroepigenetics has the potential to guide the design of novel therapeutic strategies for improving the harmful consequence of cognitive deficits and neurodegeneration.
13.3 Epigenetic Therapy of Diseases Most epigenomic modifications are reversible, which implies significant therapeutic potential. Therefore, epigenomics is one of the most innovative research areas in modern biology and biomedicine, where the molecular hallmarks of epigenetic control can be used as targets for medical interventions and treatments (Fig. 13.4). The promises of epidrugs increased the number of compounds that are in preclinical or clinical trials. Basically, all molecules designed for epigenetic cancer therapy are inhibitors of enzymes affected by gain-of-function mutations. In addition to writers and erasers, now also chromatin modifiers of the reader class, such as chromatin-remodeling proteins with bromodomain or methyl-binding proteins, are addressed. Oncology is currently the main focus of clinical epigenetics, but the large number of clinical trials or preclinical studies in other medical areas indicates that clinical epigenetics expands far beyond cancer. During aging, histone acetylation and methylation of many genomic regions changes, most likely because SIRTs can promote gene silencing and longevity. Similarly, the epigenome of cancer cells is also reprogramed during the transformation process from normal cells. The mapping of active and repressed chromatin regions in cancer cells allows more accurate prognosis and even may facilitate therapy. For example, HDAC inhibitors reactivate the transcription of tumor suppressor genes, such as CDKN1A, by increasing histone acetylation, but they also mediate the acetylation of non-histone proteins, such as p53 and stabilize their activity. In this way, they have a wide impact on cancer cells and can induce apoptosis, cell cycle arrest and many other anticancer actions. Currently, five HDAC inhibitors vorinostat, romidepsin, belinostat, panobinosta and valproic acid are approved for treatment of different types cancer such as for leukemia, T cell lymphomas and multiple myeloma. Valproic acid, which primarily used for the treatment of epilepsy, is thereby redefined for the treatment of childhood cancers. As many other HDAC inhibitors are currently under testing in clinical trials, it is expected that more HDAC inhibitors will be developed for the treatment of solid tumors, in particular for brain cancers. In addition, numerous psychiatric disorders, such as anxiety and depression, can be treated with HDAC inhibitors (Sect. 13.2). Interestingly, these small-molecule inhibitors also
13.3 Epigenetic Therapy of Diseases
207
KMTi HDACi
Histone mimetics • Infection • Pathogens
• Stem cell reprograming • Drug-tolerant cancer cells
Histones
α-Ketoglutarate
Mobile RNAs
• Cancer • Inflammation
• Epigenetic inheritance ncRNAs
Metabolites
SAM Acetyl-CoA NAD/NADH
Co-factors
Chromatin readers
iBET
• Cancer • Inflammation
• Metabolism • Circadian rhythms
HDACi DNMTi • Behavior • Learning HDACi KMTi
• T cell activation
Me
Me
Me
Me Me Me
Histone modifying enzymes
• Complex human disorders • Cancer HDACi DNMTi SIRTi
Remodeler variants
• Cancer • DNA repair DNA methylation
• Immune activation • Tumor suppression DNMTi
PARPi
Higher order structures
• Cancer • Chromosome stability
HDACi KDMi
Fig. 13.4 Prognostic and therapeutic potential of epigenomics. Examples for the impact of epigenomics in normal development and in disease are indicated. The circles each represent key epigenomic mechanisms and the mainly associated nuclear proteins. Dysregulated epigenomics may be reversed by pharmacological intervention with small-molecule inhibitors, such as HDAC inhibitors (HDACi), DNMT inhibitors (DNMTi), SIRT inhibitors (SIRTi), metabolic cofactors, such as SAM and α-ketoglutarate, KMT inhibitors (KMTi), BET inhibitors (iBET), poly(ADP-ribose) polymerase inhibitors (PARPi) and KDM inhibitors (KDMi)
enhance the efficacy of immunotherapeutic agents, such as a blockage of the interaction between the surface inhibitory receptor PDCD1 (programmed cell death 1, also called PD1) on cytotoxic T cells and CD274 (CD274 molecule, also called PDL1) on cancer cells (Fig. 13.5). At present, immunotherapy is the most promising therapy of cancer (Sect. 33.3), since it takes advantage of the general immune surveillance function of cytotoxic T cells. In these cells a PDCD1-induced signal transduction cascade would inhibit their activation, which is prevented via blocking of PDCD1. This socalled immune checkpoint blockage can boost the antitumor immune response of the host, when the cytotoxic T cells start again their growth and effector function. DNMT inhibitors are either nucleoside analogs that after incorporation into the DNA covalently trap DNMTs or non-nucleoside analogs that directly bind to the catalytic region of DNMTs. These molecules prevent DNA methylation leading to reduced promoter hypermethylation and re-expression of silenced tumor suppressor genes. The two nucleoside analogs azacitidine and decitabine have already been approved more than 30 years ago. Both compounds induce the expression of genes encoding for MHCs or tumor antigens (Sect. 33.2). This increases the visibility of the cancer cell to cytotoxic T cells and their subsequent elimination. In addition,
208
13 Epigenetics and Disease
Type I interferons
Blockade of PD1-CD274 interaction
‘Viral mimicry’
Anti-CTLA4
BET inhibitors
Cancer cell DNMT inhibitors
CTLA4 CD274
HDAC inhibitors
CD40
EZH2 inhibitors
Cytotoxic T cell
PDCD1 CD154 Activation
Tumor antigens Antigen processing
MHC class I
TCR
Tumor infiltration
Proliferation MICA MICB
Chemokines Interleukins Interferons
HDAC inhibitors
KLRK1 Regulatory T cell Tumor infiltration Activation HDAC inhibitors
DNMT HDAC inhibitors inhibitors Natural killer cell
Macrophage
Fig. 13.5 Inhibitors of chromatin modifiers in immunotherapy. Epigenetic inhibitors also may play an important role in immuno-oncology. HDAC inhibitors also modulate the expression of MHC proteins, costimulatory CD40 molecules and tumor antigens. Moreover, they affect the antigen-processing machinery and change in chemokine expression in both cancer and immune cells. Furthermore, they suppress TH cells and induce of the NK cell receptor ligands MICA and MICB. Inhibitors of the PRC2 component EZH2 increase the expression of chemokines CXCL9 and CXCL10 attracting T cells and improving tumor clearance. BET = bromodomain and extraterminal, CXCL = chemokine C-X-C motif ligand, CTLA4 = cytotoxic T-lymphocyte associated protein 4, KLRK1 = killer cell lectin like receptor K1, MIC = MHC class I polypeptide-related sequence
decitabine increases the sensitivity of cancer cells to growth inhibition by type 1 interferons (INFs). This results in a “viral mimicry”, in which DNA demethylation activates the transcription of endogenous retroviral elements in the cancer cells leading to a double-stranded RNA-mediated immune response. The combination with an epigenetic mediator, such as chromatin modifier inhibitors, gives immune checkpoint blockage of T cells a wider approach for treating both cancer and chronic infections. For example, Hodgkin’s lymphoma patients, who received a DNMT inhibitor before a treatment with immune checkpoint inhibitors showed a higher rate of complete remission in their cancer.
13.3 Epigenetic Therapy of Diseases
209
The contribution of altered epigenetic states to the phenotype of cancer cells suggests that epigenetic cancer therapies have a clinical impact. For example, genes encoding for epigenetic modifiers, such as KMTs and KDMs (Fig. 13.6), are frequent drivers in a larger range of cancer types. Since histone methylation marks have a far more selective function than histone acetylation marks, KMT and KDM inhibitors promise to be more specific and may be less toxic than HDAC inhibitors or even DNMT inhibitors. Several KMT inhibitors have been developed and the H3K27KMT EZH2 inhibitor tazemetostat has already been approved for the treatment of epithelioid sarcoma and follicular lymphoma. Since EZH2 is the catalytic core of the PRC2 complex that also recruits DNMTs, EZH2 inhibitors may link both epigenetic repression mechanisms. Moreover, the inhibition of EZH2 results in reduced levels of H3K27me3 marks, upregulation of silenced genes and inhibition of the growth of cancer cells with EZH2 gain-of-function mutations or overexpression. KDMs use FAD, α-ketoglutarate or Fe(II) as cofactors and offer in this way a number of options for their inhibition. However, the catalytic domain of most KDMs is structurally highly conserved, which is a challenge for the design of specific KDM inhibitors.
• BAY-598 • LLY-507
• MM-401 • MIV-6R
SMYD2
KMT2
me1 p53 (K370)
me2
Chaetocin
SUV39H1 SUV39H2
A-366 BIX-01294 UNC0638 UNC0642 UNC0224 E72
EHMT2
me3
K4
NH2
• • • • • •
• • • • • • • •
GSK126 Tazemetostat CPI-1205 GSK343 CPI-169 EI1 UNC1999 SAH-EZH2
EZH2
me2
• EPZ-5676 • EPZ-4777 • SGC0946
NSD1 NSD2
DOT1L
me3
me2
K36
K27
K9 me3
me3
Inhibitors in development
me3
me2
me2
K76
COOH
me3 KMT
KDM5A KDM5B
KDM1A
KDM6A KDM6B
KDM4A KDM4B
KDM mono-, di- or trimethylation
• CPI-455 • EPT-103182
• • • • •
GSK2879552 ORY-1001 Tranylcypromine GSK354 INCB059872
GSK-J4
NSC636819
Fig. 13.6 Targeting KMT and KDM mutations. Inhibitors of KMTs (red) and KDMs (blue) are indicated that affect histone 3 lysines K4, K9, K27, K36 and K79 (dark blue). KMT inhibitors bind either within the SAM pocket, within the substrate pocket or at allosteric sites of the KMT protein. Respective inhibitors of DOT1L and EZH2 are already in clinical trials. Chaetocin is a non-selective inhibitor of KMTs, such as SUV39H (suppressor of variegation 3–9 homolog) 1 and SUV39H2. KDM1A is a FAD-dependent KDM, which can be inhibited by molecules blocking its cofactor binding site. The KDM1A inhibitors tranylcypromine, GSK2879552, INCB059872 and ORY-1001 are in clinical trials. Most KDMs carry a catalytic domain, which can be inhibited by iron-chelating molecules
210
13 Epigenetics and Disease
Finally, modulators of chromatin modifiers are not only effective in the therapy of different forms of cancer, but also in the prevention of malignant tumor formation. Interestingly, a number of natural, food-derived compounds, such as epicatechin from green tea, resveratrol from grapes or curcumin from curcuma, are known to modulate the activity of chromatin modifiers. Thus, ingredients of healthy diet have the potential to prevent cancer by keeping the activity of chromatin modifiers under control. Targeting histone acetylation via the application of HDAC inhibitors is not only an option the therapy of cancer. Moreover, these compounds may also provide benefit for the treatment of complex neuronal diseases, such as Alzheimer’s disease and Parkinson’s disease as well as depression, schizophrenia, drug addiction and anxiety disorders (Sect. 13.2). For example, in mouse models the HDAC inhibitor sodium butyrate showed antidepressant effects. Moreover, HDAC inhibitor-treated animals showed induced sprouting of dendrites, an increased number of synapses, reestablished learning behavior and access to long-term memories. This suggests a possible wide application for HDAC inhibitors in the therapy of cognitive disorders. For example, valproic acid is approved as mood stabilizer and antiepileptic. HDAC inhibitors also widely affect gene expression in the immune system and showed to be effective in the treatment of inflammation and neuronal apoptosis. Furthermore, animal models of ischemia-induced brain infarction indicated that HDAC inhibitors have antiinflammatory and neuroprotective effects and can be used for the treatment of stroke. (Clinical) Conclusion: Aberrant epigenetic changes play a key role in many diseases that can be as divergent as cancer and neurodevelopment disorders, such as autism. Interestingly, inhibitors of chromatin modifying enzymes have a promising therapeutic potential in these diseases. For example, epilepsy and leukemia are treated with the same type of compounds.
Additional Reading Campbell, R. R., & Wood, M. A. (2019). How the epigenome integrates information and reshapes the synapse. Nature Reviews Neuroscience, 20, 133–147. Hwang, J. Y., Aromolaran, K. A., & Zukin, R. S. (2017). The emerging field of epigenetics in neurodegeneration and neuroprotection. Nature Reviews Neuroscience, 18, 347–361. Lister, R., Mukamel, E.A., Nery, J.R., Urich, M., Puddifoot, C.A., Johnson, N.D., Lucero, J., Huang, Y., Dwork, A.J., Schultz, M.D., Yu, M., Tonti-Filippini, J., Heyn, H., Hu, S., Wu, J. C., Rao, A., Stiller, M., He, C., Haghighi, F. G., et al. (2013). Global epigenomic reconfiguration during mammalian brain development. Science, 341, 1237905. Rauch, A., & Mandrup, S. (2021). Transcriptional networks controlling stromal cell differentiation. Nature Reviews Molecular Cell Biology, 22, 465–482. Sales, V. M., Ferguson-Smith, A. C., & Patti, M. E. (2017). Epigenetic mechanisms of transmission of metabolic disease across generations. Cell Metabolism, 25, 559–571.
Chapter 14
Cells and Tissues of the Immune System
Abstract This chapter, will provide a first overview on the cells and tissues forming the immune system. We will discuss the general role of immunity in detecting and neutralizing pathogens, in order to reduce the global burden of infectious diseases. In human history of the last thousands of years pathogenic microbes have caused numerous severe pandemics, of which that of SARS-CoV-2 (severe acute respiratory syndrome coronavirus 2) is the most recent one. We will distinguish the features and cell types of innate and adaptive immunity and describe their response over time after contact with an antigen. Basically, all cell types of the immune system are created by the process of hematopoiesis, perturbation of which can lead to significant disruption of immune cell production. Finally, we will describe the primary and secondary structures of the immune system, such as bone marrow, thymus, lymph nodes and spleen and the migration of immune cells between them. Keywords Pathogenic microbes · Infectious diseases · Pandemics · Innate immunity · Adaptive immunity · Specificity · Memory · Hematopoiesis · Bone marrow · Lymph nodes · T cell migration
14.1 Global Burden of Infectious Diseases The immune system is meant to protect us against pathogenic microbes, such as extra and intracellular bacteria, viruses, fungi and parasites like protozoa and worms (helminths) (Table 14.1). The effector mechanisms of immunity should eliminate the pathogens and create a memory of their encounter (Sect. 16.3). In this way, individuals become “immune”, i.e., they are protected against future infections with the microbe. Immune cells and individuals that have not been in contact with a given microbe are considered as “naïve”. The immune system should protect us from a large variety of life-threatening infectious diseases. Nevertheless, human history is full of devasting pandemics (Table 14.2), the first of which were caused by bacteria, such as Yersinia pestis and Mycobacterium tuberculosis (Sect. 20.3) and the more recent by viruses like influenza A virus (Sect. 21.3), Ebola virus, HIV-1 and SARS-CoV-2 (Sect. 21.4), © The Author(s), under exclusive license to Springer Nature Switzerland AG 2023 C. Carlberg et al., Molecular Medicine, https://doi.org/10.1007/978-3-031-27133-5_14
211
212 Table 14.1 The immune system protects against pathogens. List of examples of four types of pathogenic microbes (and diseases caused by them), against which the immune system is protecting us
14 Cells and Tissues of the Immune System Type of pathogen
Examples
Diseases
Bacteria
Extracellular
Salmonella enteritides Streptococcus pneumoniae Clostridium tetani
Food poisoning Pneumonia Tetanus
Intracellular
Mycobacterium tuberculosis Mycobacterium leprae
Tuberculosis Leprosy
Viruses
HIV-1 Influenza SARS-CoV2
AIDS Influenza COVID-19
Fungi
Candida albicans
Systemic candidiasis
Protozoa
Plasmodium falciparum Trypanosoma brucei
Malaria Sleeping sickness
Helminths
Schistosoma mansoni
Schistosomiasis
Parasites
which originated from animals. Thus taken together, in the past infectious disease were worldwide the most common causes of death. Advanced knowledge in hygiene and medicine within the recent 150 years, such as the identification of microbes, disinfection, quarantine, vaccination and the use of antibiotics, significantly reduced the burden of infectious diseases. Nevertheless, in the year 2017 worldwide still 7.3 million people (i.e., 12.8% of all) died from infectious diseases, such as tuberculosis, acquired immune deficiency syndrome (AIDS), malaria, meningitis or hepatitis, as well as from general microbe-related disorders like lower respiratory infections (including influenza) and diarrheal diseases (Fig. 14.1, top). For comparison, more than 73% of deaths worldwide relate to noncommunicable disorders, such as CVD (Chap. 40) and cancer (Chap. 24). During the past decades the understanding of immunology significantly advanced by describing additional distinct roles of the immune system controlling the homeostasis of our body, such as tissue development and maintenance. This implies that mal-functions of the immune system have a large impact also for non-communicable diseases, such as cancer, metabolic and neonatal disorders. In industrialized countries, such as in Finland, in 2017 less than 1000 of 53,722 deaths (i.e., less than 2%) were due to an infectious disease, but there was a similar percentage of deaths related to diseases associated with problems of the immune system (Fig. 14.1, bottom). However, in the year 2021 the COVID-19 pandemic (Sect. 21.4), i.e., a disease that in 2017 did not exist, had 3.02 million victims worldwide and 1077 in Finland. The numbers for 2021 are even larger
14.2 Innate and Adaptive Immunity
213
Table 14.2 Major pandemics in human history. Newly emerging infectious diseases were threatening humans since hunter-gatherers settled into villages and domesticated animals. The number of victims before 1900 are estimates Year
Name
Deaths
Comments
430 BC
“Plague of Athens”
100,000
First documented pandemic
541
Justinian plague (Yersinia pestis)
30–50 million
Killed half of world population
around 1340
“Black death” (Yersinia pestis)
50 million
Killed a quarter of world population
around 1500
“Tuberculosis” Many millions Since 60,000 years with humans; pandemic in middle ages (Mycobacterium tuberculosis)
around 1520
“Hueyzahuati” (Variola major)
3.5 million
Pandemic in Central America brought by Europeans
1918
“Spanish flu” (Influenza virus)
50 million
Pandemic in the whole world, killed 2% of population
1976–2000 Ebola (Ebolavirus)
>15,000
Many regional epidemics in Africa
Since 1981 AIDS (HIV-1)
37 millions
Ongoing pandemic with most victims in Africa
Since 2019 COVID-19 (SARS-CoV2)
>6 million
Ongoing pandemic with victims all over the world
than for 2020 (1.81 million/561), although the largest ever worldwide vaccination campaign had been started. Thus, understanding and appreciating the function of the immune system is more important than ever.
14.2 Innate and Adaptive Immunity The immune system of humans and other mammals uses a remarkably effective set of tools for fighting against pathogenic microbes. The core of these mechanisms is the detection of a wide variety of molecules, known as antigens. The exact site of a complex antigen, such as a protein, that is recognized by antigen receptors is called determinant or epitope. Epitopes are often found on the surface of microbes or malignant cells and one major role of the immune system is to distinguish them from epitopes of own healthy tissues (self-antigen). The immune system is subdivided into innate and adaptive immunity. The innate immune system is evolutionary older (Box 14.1) and provides a first line defense against invading pathogens, since it responds within a few hours to the presence of antigens or injured cells (Chap. 15). Innate immune cells, such as macrophages, are stimulated when a limited set of PRRs recognize molecules common to groups of microbes or expressed by damaged host cells. In contrast, the adaptive immune system reaches its full activity just a week after first contact with an antigen
214
14 Cells and Tissues of the Immune System
Cardiovascular diseases Cancers Respiratory diseases Lower respiratory infections Dementia Digestive diseases Neonatal disorders Diarrheal diseases Diabetes Liver diseases Road injuries Kidney disease Tuberculosis HIV/AIDS Suicide Malaria Homicide Parkinson disease Drowning Meningitis Protein-energy malnutrition Maternal disorders Alcohol use disorders Drug use disorders Hepatitis Fire Poisonings Heat (hot and cold exposure) Terrorism Natural disasters
Cardiovascular diseases Cancers Dementia Digestive diseases Respiratory diseases Liver diseases Suicide Lower respiratory infections Parkinson disease Alcohol use disorders Kidney disease Diabetes Road injuries Drug use disorders Drowning Heat (hot and cold exposure) Homicide Fire Tuberculosis Diarrheal diseases Neonatal disorders Meningitis Poisonings HIV/AIDS Protein-energy malnutrition Hepatitis Maternal disorders Terrorism Malaria Natural disasters
17.79 million 9.56 million 3.91 million 2.56 million 2.51 million 2.38 million 1.78 million 1.57 million 1.37 million 1.32 million 1.24 million 1.23 million 1.18 million 954,492 793,823 619,827 405,346 340,639 295,210 288,021 269,997 231,771 193,639 184,934 166,613 129,720 126,391 120,632 72,371 53,350 26,445 9,603
For comparsion: in 2021 3.02 million deaths due to COVID-19
World: Number of deaths
21,359 13,089 8,546 2,416 1,784 1,178 868 713 682 598 569 390 289 289 116 104 87 73 57 48 46 19 18 12 6 4 2 2 2 0 0 0
For comparsion: in 2021 1,077 deaths due to COVID-19
Finland: Number of deaths
Fig. 14.1 Leading causes of death. In the year 2017 about 7.3 million (12.8%) of 57 million annual deaths worldwide (top) are the direct result of infectious diseases (red), while at least another 15 million deaths (26.7%) are related to a mal-functional immune system (orange). The percentages for infectious diseases are in an industrialized country, such as Finland (bottom), with less than 2% significantly lower, while the percentage of diseases associated with immune system dysfunctions (27.7%) are even slightly higher. For comparison, the victims of COVID-19 of the year 2021 are indicated. Data are based on https://ourworldindata.org/causes-of-death
(Chap. 16). The adaptive immune system has far higher specificity and diversity in antigen recognition than the innate immune system (Table 14.3). However, immune functions are not unique to hematopoietic cells, since also a number of other cell types forming the epithelium, endothelium and connective tissue display barrier functions and are therefore contribute to the basic mechanisms of pathogen defense (type 4 immune response, Sect. 23.5).
14.2 Innate and Adaptive Immunity
215
Table 14.3 Comparing innate and adaptive immunity Features
Innate immunity
Adaptive immunity
Specificity
For molecules recognized by pattern recognition receptors
B and T cell clones, each with a BCR or TCR specific for a different antigen
Diversity
Limited by the number of different Very large, since there are millions pattern recognition receptors of B and T cell clones (approximately 100)
Memory
Limited to trained immunity
Yes, based on memory B and T cells
Barrier functions
Skin, mucosal epithelia, secreted anti-microbial peptides
Lymphocytes in epithelia, antibodies secreted in body fluids
Humoral component Complement proteins Cellular component
Antibodies
Phagocytes (neutrophils and B and T cells macrophages), dendritic cells, NK cells, mast cells, ICLs
Box 14.1: Evolution of the Immune System Mechanisms for defending the host against microbes are present in all multicellular organisms. The phylogenetically oldest mechanisms of host defense are those of innate immunity, which are present even in plants and insects. The innate immune system co-evolved with microbes and recognizes microbial molecules that are essential for their survival. For example, TLRs, which are already found in insects, are highly conserved membrane receptors that start a signal transduction cascade ending up with the activation of the transcription factor NFκB (Sect. 4.4). In fact, most of the mechanisms of innate immunity appeared when the first multicellular organisms evolved some 750 million years ago. Approximately 500 million years ago, jawless fish, such as lampreys and hagfish, developed an immune system containing lymphocytelike cells that may function like lymphocytes in more advanced species and even respond to immunization. The antigen receptors on these cells were proteins with limited variability that were capable of recognizing many antigens but were distinct from the highly variable antibodies and TCRs that appeared later in evolution. The more specialized defense mechanisms that constitute adaptive immunity are found in vertebrates only. Most of the components of the adaptive immune system, including lymphocytes with highly diverse antigen receptors, antibodies and specialized lymphoid tissues, evolved coordinately within a short time in jawed vertebrates (e.g., sharks) approximately 360 million years ago. In humans (and other mammals) the immune system has shaped to primarily respond efficiently to acute infections in young people, in order to assure their survival during the reproductive and child-caring age. This includes fighting against microbes but also the control of tissue repair, wound healing, elimination of dead and cancer cells and the formation of
216
14 Cells and Tissues of the Immune System
the healthy gut microbiota. However, beyond the reproductive age there is lack of major evolutionary pressure and the genetic traits selected to ensure fitness in early-life may lead to immunophenotypes with a high rate of chronic inflammation (Sect. 37.1). Accordingly, advanced longevity is a recent phenomenon occurring under optimized conditions of civilization. The innate immune system is composed of (Fig. 14.2, left): • physical and chemical barriers, such as epithelia cells and the antimicrobial molecules that they secrete • phagocytic cells, such as neutrophils and macrophages, monocytes DCs, mast cells, natural killer (NK) cells and innate lymphoid cells (ILCs) (Chap. 15)
Adaptive immunity
Innate immunity Microbe
Epithelial barriers
Antibodies
Naïve B cell Phagocytes (macrophages + neutrophils) Dendritic cells
Mast cells NK cells and ILCs
Naïve T cell
Complement proteins
0
6 Hours
12
1
4 Days
7
Time after infection
Fig. 14.2 Innate and adaptive immunity. Protective immunity against microbes is mediated by the early reactions of the innate immune system as well as the later responses of the adaptive immune system. Innate immunity is used for the initial defense against infections, while responses of adaptive immunity need up to 7 days to develop to full potency. Key cell types are shown. More details are provided in the text
14.2 Innate and Adaptive Immunity
217
• proteins of the blood, such as proteins of the complement system and inflammatory molecules. Some innate immune cells, such as macrophages, DCs and mast cells, are tissue resident and perform surveillance for possible invading microbes. In contrast, other cells of innate immunity, such as monocytes, NK cells and ILCs, are recruited from the bloodstream to those tissues that send out signals of disturbance, such as during infections, damage and emerging inflammation (Chap. 15). Lymphocytes are the cellular component of the adaptive immune system and are distinguished into B and T cells (Fig. 14.2, right). Both types of cells express on their surface highly specific antigen receptors, B cell receptors (BCRs) and TCRs, respectively. In contrast to innate immune cells that use PPRs with limited specificity for pathogen-associated molecular patterns (PAMPs), i.e., microbe-associated molecules, such as LPS (Sect. 15.1), the antigen recognition domains of BCRs and TCRs can adapt millions of different structures that are able to bind basically any molecule existing in nature. T cells respond via their TCR only to small peptides presented on MHC proteins on the surface of antigen-presenting cells, i.e., the T cell response is restricted to proteins. In contrast, B cells are more flexible and bind to any antigen molecule in solution or being presented by other cells. Thus, not only proteins, but also polysaccharides, lipids and small molecules are able to induce antibody responses. The total population of lymphocytes of an individual is composed of different clones of B and T cells, each of which have a different BCR or TCR on the surface (Sect. 16.3). In this way, the immune system of an individual can recognize 10– 1000 million distinct structures that may act as antigenic determinants, i.e., the adaptive immune system has a very high diversity. This is essential for the defense of an individual against the large number of potential pathogens that he or she is exposed to during lifespan. When the large sets of some 10 million different naïve B and T cells are exposed to a previously unknown antigen, this molecule is bound effectively only by a very few lymphocytes. These cells are then activated and proliferate, in order to generate thousands of identical progenies with the same specificity, i.e., a cell clone. This process is referred to as clonal expansion. B cell effector cells are so-called plasma cells that secrete their BCR in form of antibodies, i.e., antibodies are a soluble form of BCRs with identical specificity (Sect. 17.1). Antibodies are also often referred to as immunoglobulins (Igs), since they represent the immunity-conferring portion of the globulin fraction of the serum. Antibodies are the mediators of humoral immunity of the adaptive immune system (Sect. 16.1). Their main function is to neutralize microbes by covering their surface and to promote their elimination by cellular (phagocytes) and humoral (complement system) responses of the innate immune system (Sect. 17.3). The adaptive immune system has a memory function for antigen contact and is capable to respond stronger and faster to repeated exposures with an identical antigen (Fig. 14.3). This second boosted immune response is based on long-lived memory
218
14 Cells and Tissues of the Immune System
Antigen X + antigen Y
Antigen X
Plasma cells
Serum antibody titer
Secondary anti-X response
Plasma cells
Memory B cells
Plasma cells Memory B cells
Primary anti-X response
Primary anti-Y response
Memory B cells
Naïve B cells
Weeks
2
4
6
8
10
Time after infection
Fig. 14.3 Specificity, memory and self-limitation of B cells. Schematic illustration of the specificity of B cells producing different antibodies to antigens X and Y. Immunologic memory implies that a second exposure to antigen X results in a faster and stronger response in terms of secreted antibodies specific to antigen X than the primary response. Self-limitation means that a few weeks after each boost of response both the titer of specific antibodies as well as the amount of specific plasma B cells decreases. However, after each response the number of long-lived memory B cells increases. The same principles apply to the response of T cells
B cells and represents the mechanistic basis of vaccinations. Similar principles apply also to T cells. Cells of the innate immune system can also be trained by epigenetic changes. The latter prepares macrophages for a stronger response to a possible re-exposure with PAMPs but does not represent traditional immunologic memory (Table 14.3).
14.3 Hematopoiesis Cells of the immune system have a rapid turnover and are therefore able to show a maximal adaptive response to environmental changes. In an adult, all circulating
14.3 Hematopoiesis
219
blood cells, including immune cells, are produced in the bone marrow by a process termed hematopoiesis (Fig. 14.4). Exceptions are tissue-resident macrophages, which origin from fetal liver and colonized the organs during embryogenesis. Examples for such tissue-resident macrophages are microglial cells in the CNS (central nervous system), Kupffer cells in the liver or alveolar macrophages in the lungs. Hematopoiesis is the process of the lifelong regeneration of our blood cells. Long-lived, self-renewing HSCs divide either into daughter stem cells or into progenitor cells for the more than 100 phenotypically distinct cell types in 11 major lineages, most of which belong to the immune system (Sect. 11.4). HSCs differentiate into immature progenitor cells, such as MPPs, which then give rise to the progenitors of the myeloid or lymphoid lineages, called CMPs and CLPs, respectively. Thus, the first distinction of the hematopoietic cascade is the differentiation into either the myeloid line or the lymphoid line. In further differentiation steps of the myeloid line there is progressive commitment to erythrocytes (red blood cells essential for oxygen transport), megakaryocytes creating platelets (needed for blood coagulation after injuries), mast cells, basophils, eosinophils, neutrophils and monocytes (which can further differentiate into DCs or macrophages). With the exception of erythrocytes and megakaryocytes these myeloid cells belong to the innate immune system. Differentiation of the lymphoid line results in B and T cells of the adaptive immune system as well as NK cells and ILCs of the innate immune system. Due to the turnover of cells and the persistent hematopoiesis most cells of the immune system are replaced every few days to weeks. Every day HSCs give rise to some 3 × 10¹¹ cells (most of which are erythrocytes and neutrophils), i.e., over our lifespan the bone marrow produces far more cells than any other tissues of our body. Most of the different end-products of hematopoiesis leave the bone marrow as mature cells, while T cells (Sect. 16.2) and mast cells (Sect. 23.2) terminate their differentiation in the thymus and in epithelial tissue, respectively. The decisions for the differentiation in different lineages are driven by epigenetic changes, such as in chromatin accessibility and by the expression of lineagedetermining pioneer transcription factors (Sect. 11.4). A number of extrinsic and intrinsic factors, such as growth factor-stimulated signal transduction cascades, transcription factors and chromatin modifiers, regulate the equilibrium between selfrenewal and differentiation of HSCs. Thus, chromatin modifiers and transcription factors work together in creating appropriate epigenetic profiles on the level of DNA methylation and histone modifications, which determine the respective functions of the different cell types of the hematopoietic system. Epigenetic regulation is fundamental for the differentiation of immune cells but also for their adaptive response to several environmental challenges, such as microbe infections. These epigenetic processes are also the basis for trained immunity representing a memory function of the innate immune system. In general, epigenetic profiling of immune cells is an important tool for a molecular description of health and diseases being as different as allergy (Sect. 23.2) and cancer (Chap. 24). In homeostasis, the highly differentiated cell types representing the end points of the hematopoietic tree are produced in proportion to the needs, i.e., the turnover of the cell types. In contrast, a disruption or misregulation of this hematopoietic
220
14 Cells and Tissues of the Immune System
T cell Pro-T cell
Pre-T cell
B cell Pro-B cell Common lymphoid progenitor
Pre-B cell
ILCs Pro-ILC
NK cell Pro-NK cell
Dendritic cell
HSC
Multipotent progenitor
CFU-M
Monoblast
Monocyte
Macrophage
Eosinophil CFU-eo
Eo myelocyte
Neutrophil CFU-G
Neutro myelocyte
Basophil Early progenitor with myeloid potential
CFU-b
Baso myelocyte
Mast cell CFU-Mc
Erythrocyte CFU-E
Erythroblast
Platelets CFU-Mg
Megakaryoblast
Fig. 14.4 The hierarchy of hematopoiesis. The scheme illustrates the hematopoietic tree of the development of the major lineages of blood and immune cells
14.4 Primary and Secondary Structures of the Immune System
221
Table 14.4 Normal blood cell counts. Humans have in average 5 L of blood, i.e., there are approximately 35 billion (109 ) leukocytes only in the blood (more are found in the lymphatic system) Cell type
Mean count per μl
Normal range
Erythrocytes (red blood cells)
4,000,000
3,500,000–4,500,000
Leukocytes (white blood cells)
7400
4500–11,000
Neutrophils
4400
40–60% of leukocytes
Lymphocytes
2500
20–40% of leukocytes
Monocytes
300
2–8% of leukocytes
Eosinophils
200
1–4% of leukocytes
40
30
Memory B cells 0
3
10
>30
Days after antigen exposure Feature
Primary antibody response
Secondary antibody response
Magnitude
Smaller
Larger
Antibody isotype
Usually IgM > IgG
Relative increase in IgG and, at certain situations, in IgA or IgE
Antibody variable Induced by
All immunogenes
Only protein antigens
Fig. 17.6 Primary and secondary immune responses of B cells. The primary and secondary response of B cell differs in strength, main antibody isotype and antigen affinity. Most secondary responses are T cell-dependent, so that the antigen needs to be a protein. More details are provided in the text
vaccines are called conjugate vaccines and are particularly effective in infants and young children, who less likely make strong T cell-independent responses to polysaccharides than adults. Interestingly, a polysaccharide vaccine like against Pneumococcus can induce long-term protective immunity.
17.3 Humoral Adaptive Immune Response
283
FcRs and complement proteins mediate the effector function of antibodies only, when they bind to adjacent molecules. Thus, a microbe can stimulate a humoral adaptive immune response, only when it is recognized by at least two antibody molecules. This is an important condition, since it prevents that circulating free antibodies trigger any effector responses, which would be inappropriate and dangerous. Humoral responses of the adaptive immune system are initiated primarily in secondary lymphoid organs, such as lymph nodes and the spleen. Antigens reach the lymph nodes from tissues via the lymph, while the spleen is exposed to antigens circulating in the blood. B cells recognize an antigen in its intact native conformation, while for the contact with T cells a linear peptide derived from it needs to be presented on MHC II proteins on antigen-presenting cells, such as DCs and macrophages (Fig. 17.7). Importantly, B cells are also able to internalize protein antigens and can present them in form of a peptide on their MHC II proteins to TH cells. Follicular B cells and TH cells are located in different zones of lymph nodes, i.e., they get independently activated by the same antigen. Please note that the likelihood that two given B or T cell clones are specific for the same antigen is 1:100,000– 1:1,000,000. B and T cells activated in their respective zones follow a chemokine gradient and migrate toward each other. They meet at the edges of the follicles and test via the contact of the MHC II protein on the B cell and the TCR on the T cell, whether they share specificity for the same antigen. In fact, it is likely that the conformational epitope of the antigen that is recognized by the BCR is not identical to the linear peptide, for which the TCR is specific. The B cell may even present multiple linear peptides to different T cells. Nevertheless, this T cell-dependent extrafollicular primary antibody response will result in the production of antibody with specificity to the conformational epitope. In contrast, marginal zone B cells in the spleen and B-1 cells in mucosal tissues preferentially recognize multivalent antigens and start a T cell-independent response. Both types of responses result in plasma cells that produce IgMs with relatively low antigen-binding affinity. Moreover, the produced plasma cells of the primary response are rather short-lived and do not move to distant sites, such as the bone marrow, i.e., they stay in the secondary lymphoid tissues. The interaction between activated B and TH cells takes place not only at the interface of two follicles, but also at germinal centers of follicles, where some of the activated B and TH cells (referred to as follicular TH cells) migrate (Fig. 17.7). Germinal centers are substructures within follicles that form 4–7 days after the initiation a T cell-dependent B cell activation. Importantly, the cells of a germinal center derive from one or only a few B cell clones. Germinal centers are distinguished into light and dark zones. Light zones contain follicular TH cells and follicular DCs, which are absent from dark zones. Follicular DCs are specialized stromal cells that are highly efficient at capturing and displaying antibody- and/or complement-coated antigens. For this purpose, the DCs have cytoplasmatic processes that form a meshwork around which a germinal center is formed. Dark zones of germinal centers are areas of densely packed B cells that proliferate with an extremely high rate of every 6–12 h and undergo somatic hypermutation (Box 17.3). The progenies of the proliferating B cells move to the light zones, where they are selected for increased
284
17 B Cell Immunity: BCRs, Antibodies and Their Effector Functions
Protein antigen T cell epitope
B cell zone (primary follicle) B cell epitope
T cell zone
Dendritic cells
B cell T cell
Initial T-B interaction
Extrafollicular focus Short-lived plasma cells
Extrafollicular TH cell
Germinal center Follicular TH cell
Follicular dendritic cell
Fig. 17.7 T cell-dependent immune responses of B cells. In different zones of the lymph node naïve B cells and TH cells are activated by the same protein antigen (but maybe by a different epitope). Then both cell types move toward each other and have physical contact at the interface of the B and T cell zones. The B cells proliferate, may perform isotype switching and differentiate to short-lived plasma cells. Some T cells develop into follicular TH cells and form together with activated B cells a germinal center, in which affinity maturation, further isotype switching and the generation or memory B cells and long-lived plasma cells happens
17.3 Humoral Adaptive Immune Response
285
antigen affinity by contacts with follicular DCs. Thus, follicular TH cells and follicular DCs stimulate the genetic diversification of B cells via the expression of surface receptors, such as FcRs and CRs. Due to effective elimination of antigen, its concentration in the germinal centers decreases over time and the BCRs need to increase their antigen affinity, in order to assure the survival of their B cell clone. Therefore, multiple rounds of mutations in the dark zone and selection in the light zone result in affinity maturation. Positively selected B cells differentiate into long-lived plasma cells or memory B cells, both of which leave the germinal center. Most of these cells migrate to the bone marrow, which 2–3 weeks after the antigen encounter becomes the major antibody producing site. These long-lived plasma cells may continue to secrete antibodies for decades, even if the antigen is no longer present. This provides immediate protection in case the antigen is encountered later. Thus, about half of the antibodies circulating in the blood of an adult represent antigen encounters of the past. Box 17.3: Somatic Hypermutation and Affinity Maturation The repeated or prolonged exposure of B cells with the antigen that they are specific for is a sign that the B cell response needs to be improved. This is achieved by the expression of the enzyme AID that converts at the tetranucleotide AGCT (which is found preferentially within the rearranged V(D)J exon) C into U. After replication the U is either converted to T or excised by DNA repair mechanisms. Thus, this genomic region experiences a specific mutation rate of 1 in 1000 base pairs per cell division, which is far higher as for any other gene. This somatic hypermutation results in B cell clones whose BCRs show a wide variety in affinity for the antigen that initiated the B cell response. In the light zone of germinal centers these B cell clones get in contact with follicular DCs and follicular TH cells presenting the antigen. A strong interaction indicates a high affinity BCR and leads to survival of the B cells, while a weak interaction initiates the elimination of the respective B cells. In this way, B cell clones with high antigen-binding affinity of their BCRs become dominant. This selection procedure, referred to as affinity maturation, may be repeated multiple times until it results in a B cell with a significantly improved antigen affinity. While in primary immune responses the KD value of the BCRantigen interaction is in the range of 1–100 nM, it increases in secondary responses to 0.01 nM. Even when the pathogenic microbe is eliminated, longlived plasma cells and memory B cells survive for years. When the host is reinfected after years memory T cells activate the memory B cells, which then rapidly multiply and produce (after differentiation to plasma cells) antibodies with improved antigen binding affinity. Activated TH cells, such as follicular TH cells in the light zone of the germinal center, express the surface protein CD40LG, the receptor of which, CD40, is found on the surface of B cells (Fig. 17.8). The CD40LG-CD40 interaction stimulates
286
17 B Cell Immunity: BCRs, Antibodies and Their Effector Functions
within the B cells a signal transduction cascade, which results in the activation of the transcription factors NFκB and AP1 (Sect. 17.2). This stimulates the proliferation of the B cells and increases the production and secretion of antibodies. Moreover, this activates the enzyme activation-induced cytidine deaminase (AID), which is required for affinity maturation and isotype switching. In T cell-dependent B cell responses, some of the B cells undergo heavy chain isotype switching from μ/δ to γ, α or ε. In principle, isotype switching can already happen during the primary response of B cells, i.e., at extrafollicular sites, but it occurs most efficiently during the secondary response within germinal centers. Isotype switching is regulated by cytokines that are produced by TH cells (Fig. 17.8). The choice to which isotype the heavy chain is changed depends on the class of microbe, to which the T cells had been exposed to as well as on the tissue-specific needs. The encounter of helminthic parasites leads to the production of IL4 and stimulates the secretion IgEs (Sect. 23.2), while in mucosal tissues under the influence of the
IgM+ B cell
Follicular TH cell
Activated B cell
CD40LG
?
CD40
IL4
Mucosal tissues; cytokines (e.g., TGFβ)
Isotype switching
IgM
Complement activation Principal functions
IgG subclasses (IgG1, IgG3)
IgE, IgG4
IgA
Opsonization and phagocytosis; complement activation; neonatal immunity (placental transfer)
Immunity against helminths; mast cell degranulation (immediate hypersensitivity)
Mucosal immunity (transport of IgA through epithelia)
Fig. 17.8 Mechanisms of heavy chain isotype switching. After triggering by TH cells, activated B cells either produce (i) IgM when they are not exposed to any other signal, (ii) IgG1 and IgG3 after presently unknow signal contact, (iii) IgE and IgG4 in response to IL4 exposure or (iv) IgA after stimulation with a wide range of cytokines including TGFβ1
Additional Reading
287
cytokine TGFβ1 IgAs are released. Isotype switching requires somatic recombination between the V(D)J exon of the heavy gene locus, which had been formed during B cell maturation (Sect. 16.3) and the respective C region of the desired isotype. Without recombination, B cells produce IgMs, once they have differentiated into plasma cells, i.e., they stick with the expression of the constant Ig domains of the μ type. Nucleotide sequences within introns between the J and C regions allow the recombination, in the way of which the intervening DNA segments for unused constant regions are deleted. Isotype switching demonstrates the remarkable plasticity of the response of B cells, which are able to generate antibodies with distinct effector functions, so that they can fight most effectively against various types of microbes (Chaps. 20 and 21). Both somatic hypermutation as well as the somatic recombination during isotype switching bear the risk of DNA breaks that allow the chromosomal translocation of oncogenes into the active locus of the heavy chain gene. Therefore, B cell tumors, referred to as lymphomas, often develop from germinal centers. Moreover, there is the risk that the reactions within a germinal center creates self-reactive B cell clones that may cause antibody-mediated autoimmune diseases (Sect. 23.3). (Clinical) Conclusion: Antibodies are the key proteins of the humoral response of the adaptive immune system. Most vaccinations aim on the production of microbe-specific antibodies. However, overreactive and/or mal-directed antibodies can create type I-III hypersensitivities.
Additional Reading Cyster, J. G., & Allen, C. D. C. (2019). B cell responses: Cell interaction dynamics and decisions. Cell, 177, 524–540. Laidlaw, B. J., & Cyster, J. G. (2021). Transcriptional regulation of memory B cell differentiation. Nature Reviews Immunology, 21, 209–220.
Chapter 18
Antigen-Presenting Cells and MHCs
Abstract In this chapter, we will discuss the principles of antigen presentation. We will learn that the major purpose of antigen-presenting cells, such as DCs, macrophages and B cells, is to display peptide antigens to T cells. These peptides are derived from extracellular microbes and are presented via MHC II protein to CD4+ T cells (TH cells), which are found with highest concentration at secondary lymphoid organs, such as lymph nodes. In contrast, antigen peptides that origin from intracellular microbes or damaged cellular proteins are displayed by all kind of body cells on MHC I proteins to CD8+ T cells (cytotoxic T cells). Thus, we will understand that MHC proteins are central in segregating antigens that are produced inside of regular cells, such as viral proteins, from those that internalized from outside, such as proteins from extracellular bacteria. Keywords Antigen-presenting cells · DCs · T cells · MHC I · MHC II · Antigen peptides · CD4 · CD8
18.1 Antigen-Presenting Cells Naïve B and T cells are concentrated in secondary lymphoid organs, such as lymph nodes, where the chance that an antigen is specifically recognized is significantly higher than the probability to be found by a lymphocyte in circulation (please remind that the chance that a B or T cell clone is specific for a given antigen is 1:100,000– 1:1,000,000). Thus, keeping the lymphocytes at a limited number of sites and organizing the transport of antigen to these locations is more efficient than the patrol of B and T cells throughout the body. Antigens that are recognized by the BCR of B cells are often free circulating in the body and reach either lymph nodes via the lymph or the spleen via the blood stream (Sect. 17.1). The latter antigens reach the spleen either directly from tissues or via the thoracic duct from the lymph and blood. T cells are specialized to MHC protein-bound peptide antigens, since only these can be recognized by their TCR. Accordingly, the major function of antigenpresenting cells is to capture antigens from their site of entry, which are often © The Author(s), under exclusive license to Springer Nature Switzerland AG 2023 C. Carlberg et al., Molecular Medicine, https://doi.org/10.1007/978-3-031-27133-5_18
289
290
18 Antigen-Presenting Cells and MHCs
epithelium-lined surfaces like the skin and to transport them to lymph nodes for presentation to naïve CD4+ T cells. In addition, antigens are also concentrated in other secondary lymphoid organs, such as Peyer’s patches and tonsils, which are located in mucosal tissues of the ileum (the final and longest segment of the small intestine) and the pharynx (the throat behind the mouth and nasal cavity), respectively. The term “antigen-presenting cell” is specifically applied for those cells that express MHC II proteins, display foreign antigens and bind to CD4+ T cells, such as DCs (Box 18.1), macrophages and B cells (Fig. 18.1). In addition, endothelial and some epithelial cells are able to express MHC II proteins and may present antigens to T cells. For example, in the thymus epithelial cells present peptides via MHC I and MHC II proteins as a central part of the selection process of maturing T cells (Sect. 16.3). In contrast, all nucleated cells (i.e., all body cells besides erythrocytes) express MHC I proteins, display self-antigens and are recognized by CD8+ T cells but are not considered as classical antigen-presenting cells. Naïve CD4+ T cells are activated most effectively by DCs (Fig. 18.1, top), while MHC II protein expressing macrophages (Fig. 18.1, center) and B cells (Fig. 18.1, bottom) communicate preferentially with effector CD4+ T cells, i.e., with different types of TH cells. The antigen presentation results either in: • the clonal expansion and differentiation of the activated T cells into effector cells (Sect. 19.1) • the activation of the macrophages, in order to terminate the phagocytosis process (Sect. 15.4) • the stimulation of the B cells to differentiate into antibody-producing plasma cells (Sect. 17.3).
Box 18.1: DCs DCs derive from the myeloid lineage of hematopoiesis (Sect. 14.3), i.e., they belong to the innate immune system. In tissues, monocytes can differentiate into DCs, which then mediate together with neutrophiles and macrophages the inflammatory response (Sect. 15.4). Moreover, in utero (i.e., before birth), DCs develop from embryonic precursors in the yolk sac or fetal liver and take up residence in the epithelial layer of the skin. Immature DCs phagocytose microbes and turn into mature antigen-presenting cells using MHC proteins. These mature cells activate both naïve CD4+ and CD8+ T cells as well as memory CD4+ T cells. DCs are the most efficient antigen-presenting cells for initiating a response of naïve CD4+ T cells, because they: • are positioned strategically at common sites of microbe entry as well as in tissues that are often colonized by microbes • have due to long membranous projections (looking like dendrites on neurons) a very large surface-to-volume ratio allowing them to efficiently sampling pathogens, such as viruses and bacteria, from their surrounding • express membrane receptors capturing microbes and responding to them
18.1 Antigen-Presenting Cells
Antigen uptake Dendritic cell
291
Antigen presentation
Response
Costimulator (e.g., CD80) CD28
Naïve T cell activation: clonal expansion
T cells Naïve T cell
T cells
Macrophage
T cell
Killed microbe
activation: activation of macrophages (cell-mediated immunity)
B cell
T cell
Antibody
activation: B cell activation and antibody production (humoral immunity)
Fig. 18.1 Antigen-presenting cells. CD4+ T cells recognize antigen-carrying MHC II proteins on the surface of DCs (top), macrophages (center) and B cells (bottom). This results either in clonal expansion and differentiation of T cells, stimulation of the macrophages to finish the phagocytosis process or the differentiation of B cell into antibody-producing plasma cells. More details are provided in the text
• migrate via the lymphatics from the sites of microbe capture into the T cell zones of lymph nodes • express after maturation increased amounts of MHC proteins, costimulators and cytokines. In addition to the display of peptide antigens to T cells, antigen-presenting cells contribute further stimuli inducing the full responses of T cells. These second signals are provided either by membrane-bound proteins (Sect. 6.1) or cytokines that are secreted by antigen-presenting cells. These costimulators are in particular important
292
18 Antigen-Presenting Cells and MHCs
for the activation of naïve T cells. DCs and macrophages express PRRs, such as TLRs, which detect the presence of microbes. Therefore, microbes but not non-microbial antigens are able to enhance the function of antigen-presenting cells by stimulating the expression of MHC II proteins and costimulatory proteins improve the antigen presentation. Moreover, the production of cytokines is boosted, which increases the efficiency of the interaction with T cells. Typical entry sites of foreign antigens, such as microbes, are the skin as well as the epithelia of the respiratory and gastrointestinal tract. DCs are located close to these epithelia, in order to optimize their chance in capturing antigens. These tissue-resident DCs express on their surface a number of different PRRs, such as Ctype lectin receptors, that are able to bind microbes (Sect. 15.4). Captured microbes are internalized by endocytosis and digested in lysosomes. The resulting microbial peptides are loaded on MHC II proteins (Sect. 18.3). In parallel, the activated DCs (also called mature DCs) detach from the epithelial tissues and express the chemokine receptor CCR7. The latter allows the DCs to follow a gradient of the chemokines CCL19 and CCL21 that are produced in lymphatic vessels and lymph nodes. This guides the migration of DCs toward the T cell zones of the closest lymph node. Numerous lymphatic capillaries in these epithelia drain lymph toward regional lymph nodes and transport free antigens as well as DCs with MHC II protein-bound antigen peptides to the secondary lymphoid organs, in order to concentrate the antigens there. During their 12–24 h migration, activated DCs increase their MHC II protein expression, i.e., they differentiate into potent antigen-presenting cells. Naïve T cells also express CCR7 chemokine receptors, which directs them to the T cell zones of the lymph nodes. This maximizes the chance that they get in contact with antigenpresenting cells. Moreover, the T cells express CD40LG, which interacts with its receptor CD40 on the surface of DCs and macrophages (Sect. 17.3). In addition, T cells secrete cytokines, such as IFNγ, that activate their specific receptors on the surface of antigen-presenting cells.
18.2 MHC Proteins and the HLA Locus MHC proteins are surface receptors that are able to bind and present peptides, which are recognized by TCRs of T cells. While MHC I proteins are expressed on all nucleated cells, MHC II proteins are found only on antigen-presenting cells (Sect. 18.1). MHC I proteins are formed of a large (44–47 kD) α chain and a small (12 kD) β chain, which is referred to as β2-microglobulin (Fig. 18.2, left). In contrast, MHC II proteins are composed of about equally sized α and β chains (29–34 kD) (Fig. 18.2, right). Nevertheless, the 3D structure of both types of proteins is comparable, the most important part of which is the peptide-binding cleft. In MHC I proteins, the binding cleft is tighter (since it is formed only by the α chain) and can accommodate only a smaller peptide (8–11 amino acids) that origins from the degradation of globular cytoplasmatic proteins within the proteasome (Sect. 18.3). In contrast, in MHC II proteins, both the α and β chain contribute to the binding cleft, which is
18.2 MHC Proteins and the HLA Locus
293
open to both ends. This leaves space for a larger peptide (10–30 amino acids, but the optimal size is 12–16 residues) that results from digestion of microbial proteins in lysosomes. Both types of MHC proteins can bind a large variety of peptides, i.e., in contrast to TCRs they are not restricted to a specific antigen. Peptides are bound non-covalently to MHC proteins, but they have a very slow off-rate. Halflives of peptide-MHC complexes range from hours to many days assuring that the peptides are displayed long enough for a recognition by TCRs. Moreover, the peptide contributes to the stable interaction of the α and β chain of MHC proteins. In this way, only peptide-loaden MHC proteins are stably expressed on the cell surface. Thus, MHC proteins are trimeric complexes of an α chain, a β chain and a peptide that are only functional in this constellation. Both types of MHC proteins contain similar but not identical Ig domains (Sect. 17.1), which are specifically recognized by the coreceptors CD4 and CD8, respectively, which are expressed on T cells (Sect. 18.3). The expression of either CD4 or CD8 proteins is the main distinction between TH cells and cytotoxic T cells. CD8+ T cells contact MHC I protein bearing normal body cells, while TH cells interact only with MHC II protein carrying antigen-presenting cells. Thus, CD4+ T cells are MHC II restricted and CD8+ T cells are MHC I restricted. MHC I and MHC II proteins are encoded by the HLA (human leukocyte antigen) gene cluster (Fig. 18.3), which is a genomic region in chromosome 6 that shows higher interindividual variations than any other region of the human genome. Thus, MHC proteins are highly polymorphic, i.e., they show a large number of variant amino acids in particular in adjacent to their peptide-binding cleft. This polymorphic protein domain is the contact point for the CDRs within the variable domain of TCRs (Sect. 19.1). At present (October 2022) more than 24,000 alleles of HLA class I genes (the major genes HLA-A, HLA-B and HLA-C as well as the minor genes HLA-E, HLA-F and HLA-G) and nearly 14,600 alleles of HLA class II genes (HLADRA, HLA-DRB1-9, HLA-DQA1, HLA-DQA2, HLA-DQB1, HLA-DQB2, HLADOA, HLA-DOB, HLA-DPA1, HLA-DPB1, HLA-DPB2, HLA-DMA, HLA-DMB) are known (http://hla.alleles.org). Furthermore, the HLA gene locus also contains class III genes, which do not encode for MHC proteins but for other important immune-related proteins, such as the cytokines TNF, LTA and LTB, the complement proteins C2, C4A, C4B and CFB (complement factor B) and MICB. Since HLA genes are expressed from both copies of the genome, there are a large number of different MHC proteins available for antigen display. Nevertheless, most individuals use only eight HLA class II genes. Importantly, TCRs not only contact the peptide carried by the MHC proteins but also the proteins themselves. Therefore, T cell recognize the MHC proteins of a different person as foreign and initiate an immune response. This is the molecular basis of graft rejection after organ transplantation (Sect. 22.2). Moreover, MHC proteins do not only display foreign peptides but even a far larger number of self-peptides, i.e., fragments of regular proteins from the same individual. However, in most cases T cells are carefully selected by mechanisms of central tolerance (Sect. 22.1) during their maturation in the thymus (Sect. 16.3) not to recognized these self-peptides. A failure of self-tolerance can lead to autoimmune diseases (Sect. 23.4).
294
18 Antigen-Presenting Cells and MHCs
MHC II protein
MHC I protein
Peptide-binding cleft
α2
α1 N
β1
α1 NN
N β2
α3
β2
α2
C
Transmembrane region ^^
C
C
C
Ig domain
Fig. 18.2 Structure of MHC I and MHC II proteins. MHC proteins are membrane-anchored proteins that have a peptide-binding cleft. MHC I proteins are formed by a large polymorphic α subunit containing the peptide-binding cleft and a small non-polymorphic β2-microglobulin subunit (left). In contrast, MHC II proteins are composed by two equally sized polymorphic α and β chains, both of which contribute to the peptide-binding cleft and are integrated to the membrane (right). In both types of proteins, the α and β chains are non-covalently linked
The variant MHC II protein subtypes differ in their preference for antigenic peptides. For example, if an individual shows a strong allergic reaction against a pollen protein, the person is likely to carry a class II HLA gene allele, the protein product of which efficiently binds an immunodominant peptide (Box 18.2) derived from the respective antigenic protein. This HLA allele may be inherited and explains why children show the same type of allergies as their mother or father. Furthermore, genetic predisposition for certain antigenic peptides can also be the reason why other antigens are not recognized at all and a person is non-responsive to a vaccine.
18.2 MHC Proteins and the HLA Locus
295
Proteasome TAP2 TAP1 DOB DP DM DQ B2 B1 A1 DOA A B B2 A2 B1 A1
TAPBP
DR B1-B9
A
Class II region 0
200
400
600
CFB C4B C4A C2
800
1000
TNF LTA LTB MICB
Class III region 1000
1200
1400
1600
1800
2000
HLA-E
MICA HLA-B HLA-C Class I region 2000
2200
2400
2600
HLA-A
2800
3000
HLA-G HLA-F
Class I region 3000
3200
3400
3600
3800
4000
Fig. 18.3 The HLA gene cluster. Schematic representation of the about 4 Mb of the genomic region of the cluster of the HLA genes on human chromosome 6. The location of selected genes is indicated, which encode for MHC I proteins (class I), MHC II proteins (class II) and other immune-related proteins (class III), such as C4A, C4B, CFB, C2, LTB, TNF, LTA and MICB
Box 18.2: Immunodominant Peptides Complex antigenic proteins need to be digested into short linear peptides, in order to be presented via MHC proteins to T cells. In most cases only a few of the large number of possible peptides turn out to be effective activators of T cells. These immunodominant epitopes or determinants represent only a minor part of the whole antigen. Knowing the structural basis of this immunodominance is very important for the prediction of the most effective peptides. Thus, knowing the amino acid sequence of an antigenic protein, e.g., a viral spike protein, as well as its 3D structure, is essential for the design of an effective vaccine. Cytokines that are secreted by both innate and adaptive immune cells upregulate the expression of MHC proteins. A rising number of MHC I and MHC II proteins promotes the display of antigen peptides and increases the response of cytotoxic T
296
18 Antigen-Presenting Cells and MHCs
cells and TH cells, respectively, boosting the adaptive immune response. For example, many viruses induce an early innate immune response leading to the production of IFNα and IFNβ (Sect. 21.1), which increase HLA class I gene expression. Accordingly, there is a larger number of MHC I proteins that present peptides derived from viral proteins produced and degraded in the cytoplasma of infected cells. In contrast, the expression of HLA class II genes in antigen-presenting cells, such as DCs (Sect. 18.1), is stimulated by IFNγ, which is initially secreted by NK cells and later by effector T cells. This is one of several mechanisms, how the innate immune system stimulates the adaptive immune system. A further mechanism is the stimulation of HLA class II genes in response to signaling of microbe-activated TLRs.
18.3 MHC Pathways MHC proteins can bind only peptides. There are two different mechanisms how antigen proteins are digested and the resulting peptides are loaded on MHC proteins. These antigen processing pathways distinguish primarily between proteins that are located and lysed within the cytoplasma, i.e., being of intracellular origin and proteins that are taken up by endocytosis, i.e., being of extracellular origin and degraded in lysosomes (Box 18.3). The pathways assure that peptides from intracellular proteins are loaded on MHC I proteins and presented to CD8+ T cells, while peptides from extracellular proteins end up on MHC II proteins that are displayed to CD4+ cells. Since both types of T cells have after clonal expansion and differentiation significantly different effector functions (Sects. 19.3 and 19.4), this distinction is essential for a proper function of the adaptive immune system (Fig. 18.4). Box 18.3: Protein Degradation All proteins of a cells are synthesized at ribosomes that are located in the cytoplasma or attached to the ER. The synthesis of proteins and in particular their folding into correct 3D structures has a reasonable failure rate (approximately 20%). These mal-formed proteins are rapidly degraded in the proteasome to smaller peptides and single amino acids. In addition, even correctly folded proteins have a limited half-life and, based on their ubiquitination status, are degraded through the same process hours, days or weeks after their synthesis. Proteins that are degraded by the proteasome are either regular cellular proteins and result in the production of self-peptides or they origin from microbes that are able to reach the cytoplasma, such as viral proteins (Sect. 21.1) and extracellular bacteria injecting proteins into the cytoplasma (Sect. 20.3). Moreover, some cytoplasmatic peptides may represent microbial proteins that were internalized by phagocytosis (Sect. 15.3) but escaped the phagosomes into the cytoplasma, such as observed with the bacterium Listeria monocytogenes. The proteasome is a large multiprotein
18.3 MHC Pathways
297
Nucleus
Exocytic vesicle
Viral infection
CD8 ERAP TAP1/2
Viral protein translation
Peptides TAPBP
Synthesized viral protein
Proteasome
β2m Golgi Class I MHC α chain
Chaperone Ubiquitination
Normal body cell
Protein antigen
ER
Antigen presenting cell Lysosome
CD4
Clip HLA-DM
Endocytic vesicle
Endosome Invariant chain
α Chaperone
Exocytic vesicle
β
ER
Class II MHC
Golgi
Fig. 18.4 The pathways of MHC I and MHC II proteins. In the MHC I pathway (top), cytoplasmatic proteins are digested by proteasomes and resulting peptides are transported into the ER, where they bind to MHC I proteins. In the MHC II pathway (bottom), proteins from extracellular sources are taken up by endocytosis and degraded within lysosomes. The resulting peptides stay enclosed by vesicles, which fuse with vesicles derived from the ER that contain MHC II proteins. Further details are provided in the text
298
18 Antigen-Presenting Cells and MHCs
enzyme complex located in the cytoplasma and nucleus. In contrast, proteins that that are taken up from extracellular sources via endocytosis first locate in endosomes and traffic then to lysosomes. The latter are specialized organelles, which contain proteases like cathepsins that degrade the ingested proteins to larger peptides and single amino acids. Thus, the location of a protein is important for the site of its degradation. Accordingly, peptides that are lysed by the proteasome represent cytoplasmatic proteins, while peptides produced in lysosomes serve as markers of extracellular proteins. Therefore, it is important that cytoplasmatic peptides are loaded only on MHC I proteins, while peptides of extracellular origin bind to MHC II proteins. In both antigen processing pathways, the peptides are loaded to respective MHC proteins before they are expressed on the cell surface. Like all other membrane bound proteins, both types of MHC proteins are synthesized at the membrane of the ER. The ER membrane contains the transport proteins TAP1 (transporter 1, ATP binding cassette subfamily B member) and TAP2 that together pump in an ATPdependent process cytoplasmatic peptides into the lumen of the ER (Fig. 18.4, top). In this way, self-peptides as well as antigenic peptides are available in the ER lumen. This is important, since heterodimeric MHC protein complexes are only stable in the presence of a peptide in their binding cleft (Sect. 18.2). Moreover, TAPBP (TAP binding protein, also called tapasin) links TAP1-TAP2 heterodimers specifically with freshly assembling MHC I proteins. Interestingly, the genes encoding for TAP1, TAP2 and TAPBP are also located within the HLA gene cluster (Fig. 18.3). MHC I proteins that are stabilized by peptide binding dissociate from TAPBP, move from the ER to the Golgi complex and are transported by exocytic vesicles to the cell surface. There they may be recognized by TCRs of cytotoxic T cells, which via their coreceptor CD8 verify that they are communicating with MHC I proteins. Peptides loaded on MHC II proteins derive from extracellular proteins that are taken up by either endocytosis, pinocytosis or phagocytosis or they result from autophagy (Box 35.3) of the cell’s own protein located in membranes or vesicles (Fig. 18.4, bottom). All these proteins are targeted to lysosomes (Box 18.3), where they are digested. Thus, the resulting peptides derive from antigens that bind to receptors on the cell surface and are then internalized. After synthesis of MHC II proteins in the ER their peptide binding cleft is filled by a subdomain of a protein called invariant chain. This assures that peptides of cytoplasmatic origin are not loaded to MHC II proteins. The invariant chain protein directs the MHC II proteins via the Golgi complex to late endosomes and lysosomes containing the peptides of extracellular antigenic origin. Then the invariant chain protein is digested by lysosomal proteases, dissociates from the MHC II proteins and is replaced by the peptides. This exchange process is facilitated by the non-polymorphic HLA-DM protein, which in parallel selects for peptides binding with high affinity. Furthermore, proteases fit the peptides to the size of the MHC II protein’s binding cleft by trimming overhanging ends. The peptide-stabilized MHC II proteins are then delivered to cell surface. There
18.3 MHC Pathways
Antigen capture Infected cells and viral antigens picked up by host antigenpresenting cells Virus infected cell
MHC I
299
Crosspresentation TH cell
T cell response Viral antigen enters cytosol
MHC II
Viral Dendritic cell antigen Co-stimulation
Cytotoxic T cell
Fig. 18.5 Cross-presentation of antigens to cytotoxic T cells. Virus-infected cells can be phagocyted by DCs. Instead of presenting peptides derived from antigenic proteins only via the MHC II pathway to TH cells, the DCs allow some antigenic proteins to escape to the cytoplasma. There they enter the MHC I pathway and are presented to cytotoxic T cells
they can be recognized by TCRs of T cells, which prove via their coreceptor CD4 the identity of MHC II proteins. Interestingly, some DCs are able to take up via phagocytosis both virus-infected and tumor cells (Fig. 18.5). As usual, the antigenic proteins of these cells are digested in lysosomes to peptides, i.e., they follow the MHC II pathway. However, some of the antigenic proteins escape the phagosome and are transported to the cytoplasma, where they enter the MHC I pathway, i.e., they are digested by the proteasome and their resulting peptides are presented via MHC I proteins to cytotoxic T cells. Due to this cross-presentation DCs can inform both TH cells and cytotoxic T cells about the presence of virus infection (Chap. 21) or tumor burden (Chap. 33). Thus, instead of exclusively relying on the recognition of virus-infected cells and tumors by cytotoxic T cells, the additional activation of TH cells stimulates the production of antibodies by B cells and enhances the phagocytic capacity of macrophages (Sect. 19.3). In this way, both type of T cells get more effectively involved in the fight against infections and cancer. (Clinical) Conclusion: The immunological synapse, i.e., the specific interaction of TCRs with peptide-loaden MHC I and MHC II proteins, is the central element for understanding apparently diverse immune mechanisms, such as the fight against microbes, graft rejection and autoimmune responses.
300
18 Antigen-Presenting Cells and MHCs
Additional Reading Petersdorf, E. W., & O’Huigin, C. (2019). The MHC in the era of next-generation sequencing: Implications for bridging structure with function. Human Immunology, 80, 67–78. Trowsdale, J., & Knight, J. C. (2013). Major histocompatibility complex genomics and human disease. Annual Review of Genomics and Human Genetics, 14, 301–323. Wieczorek, M., Abualrous, E. T., Sticht, J., Alvaro-Benito, M., Stolzenberg, S., Noe, F., & Freund, C. (2017). Major histocompatibility complex (MHC) class I and MHC class II proteins: Conformational plasticity in antigen presentation. Frontiers in Immunology, 8, 292.
Chapter 19
T Cell Immunity: TCRs and Their Effector Functions
Abstract In this chapter, we will present that T cells constitute up to 30% of all circulating leukocytes and are a major component of the adaptive immune system. In this context, we will describe that T cell immunity is, like B cell immunity, highly specific to antigens. The TCR is the specific antigen receptor of T cells and recognizes exclusively peptides displayed on MHC proteins. Modulated by the activity of accessory proteins, antigen-bound TCR initiates a signal transduction cascade that activates the same set of transcription factors as BCR signaling. Activation of TCR signaling results in the expansion of the respective T cell clone and the transformation to effector cells that contribute to the neutralization of microbes. We will learn that based on different type of antigen and signal exposure, CD4+ T cells differentiate into TH 1, TH 2 and TH 17 cells. The different TH cells diverge in their functional profile of coordinating other cells of the immune system in their fight against microbes. Finally, we will understand that cytotoxic T cells directly attack viral-infected host cells and can kill them by inducing apoptosis. Keywords TCR structure · Accessory proteins · TCR signaling · Clonal expansion · T cell effector function · TH cell subtypes · Cytotoxic T cells · Apoptosis pathways
19.1 TCR Signaling The TCR is the specific antigen receptor of T cells, which resembles the antigenbinding fragment of the Y-shaped BCR. Typically, TCR is a heterodimer of two equally structured and sized α and β chains, each of which is formed of two Ig domains (Fig. 19.1). However, in more rare γδ T cells the TCR is formed by γ and δ chains (Box 19.1). In analogy to the variable domain of BCRs (Sect. 17.1) the Nterminal Ig domain of both chains of the TCR is highly variable. The diversity of the variable Ig domains is based on the same mechanism of somatic recombination as for the analogous domains of the heavy and light chain of BCRs (Sect. 16.3.3, Fig. 16.8b). Moreover, like in the BCR the variable domain contains three hypervariable CDRs that like protruding fingers act as the T cell-specific antigen-binding interface of the © The Author(s), under exclusive license to Springer Nature Switzerland AG 2023 C. Carlberg et al., Molecular Medicine, https://doi.org/10.1007/978-3-031-27133-5_19
301
302
19 T Cell Immunity: TCRs and Their Effector Functions
Antigenbinding site
Vα
Vβ
CDRs
N N
bond
β chain
α chain
Carbohydrate groups Ig domain
Cα
Cβ
Transmembrane region
C
C T cell
Fig. 19.1 Schematic structure of the TCR. A typical TCR is formed by an α and a β chain, each of which is composed of two Ig domains and carries a C-terminal transmembrane domain (bottom). The N-terminal Ig domains of both chains (Vα and Vβ) are highly variable, in particular the three protruding hypervariable CDRs forming the peptide-MHC protein binding site
TCR (Fig. 19.1). However, in contrast to the BCR, which is able to recognize any macromolecular structure as a possible antigen, the antigen-binding interface of the TCR interacts only with peptide-bound MHC proteins (Sect. 18.3), i.e., the TCR is peptide-restricted. Box 19.1: γδ T Cells and Other Specialized T Cells There are smaller populations of T cells with distinct features and specialized functions in host defense that are different from CD4+ and CD8+ T cells, such as γδ T cells (50% of T cells in this tissue), where they form a barrier to intestinal bacteria that may have entered the blood. NKT cells resemble NK cells of the innate immune system (Sect. 15.2). Specialized T cells are involved in the surveillance against stressed body cells, which are infected or damaged. In addition, the specialized T cells secrete cytokines that modulate the activity of other cells of the adaptive immune system. The antigen receptors of γδ T cells, MAIT cells and NKT cells have limited diversity, so that the cells recognize a lower number of different antigens (despite a high potential of diversity, Sect. 16.3) that are not displayed by MHC proteins. In contrast to αβ T cells, some γδ T cells recognize small phosphorylated molecules, alkyl amines or lipids of microbial origin, i.e., they are not peptide-restricted. The constant Ig domain of each to the two TCR chains has at its C-terminal end a short hinge region, which covalently connects the α and β chain by a disulfide bond. The transmembrane region embeds each TCR chain into the plasma membrane, so that only 5–12 amino acids face the cytoplasma. The latter are too few to form an interaction domain with cytoplasmatic proteins. However, the transmembrane region contains positively charged lysine and arginine residues that enable a tight contact with negatively charged aspartic acid residue of the transmembrane region of the proteins CD3 and ζ. In analogy of the proteins Igα and Igβ in BCR signaling (Sect. 17.2), CD3 and ζ proteins carry each an ITAM domain, which transduces TCR activation to a signal transduction cascade in the cytoplasma. The whole TCR complex is formed of the two TCR chains, four copies of CD3 and a dimeric ζ protein that contacts together with the coreceptors CD4 or CD8 peptide-bound MHC II or MHC I proteins on the surface of antigen-presenting cells or normal body cells, respectively (Fig. 19.2). This immune synapse (also referred to as supramolecular activation cluster) connects TH cells with an antigen-presenting cells as well as cytotoxic T cells with normal body cells (Sect. 18.3). The coreceptors CD4 and CD8 are critical for the decision with what types of antigen-carrying cells a T cell is interacting with. Like in other signaling cascades of innate and adaptive immune cells, such as NK cells (Sect. 15.2) and B cells (Sect. 16.2), the effects of the core signal receiving receptor, the TCR, are modulated by activating and inhibiting coreceptors of the CD28 family (Fig. 19.2). CD28 itself is a typical T cell coreceptor that is stimulated when it interacts with either CD80 or CD86 proteins on the surface of antigenpresenting cells. CD28 is expressed on T cells when their activation is needed, such as in response to microbial products and innate immune reactions. Moreover, resting antigen-presenting cells express only low levels of CD80 and CD86 preventing an accidental activation of naïve T cells. The activation of CD28 boosts TCR signaling
304
19 T Cell Immunity: TCRs and Their Effector Functions
Receptors of CD4+ T helper cell Signal transduction Antigen recognition
Receptors of MHC II expressing antigen-presenting cells CD80/CD86
CD28 CD4 TCR
MHC II ITAM
CD3 ζ Signal transduction CD80/CD86
CTLA4 ITIM PDCD1
Adhesion
ITGB2
CD274/ PDCD1LG2 ICAM1
Fig. 19.2 The immune synapse and its accessory proteins. The immune synapse is formed by the TCR, CD3 and ζ proteins, the coreceptors CD4 or CD8 and peptide-bound MHC II or MHC I proteins. In addition, TH cells and cytotoxic T cells have a large number of common accessory proteins on their surface, such as CD28, CTLA4 and PDCD1 binding CD80, CD86 and PDCDLG2 as well as the integrin ITGB2 (integrin subunit β2) binding ICAM1
via recruiting the kinase PI3K that activates its downstream kinase AKT (Akt murine thymoma viral oncogene homolog) as well as the Ca2+ signaling trigger PLCγ2 (Sect. 17.2). Moreover, CD28 contributes to the activation of the transcription factor NFκB via the small G protein RAC and the kinase MAPK. This leads to increased survival, proliferation and differentiation of antigen-specific T cells. Thus, CD28CD80/CD86 activation is an essential second signal for boosting the activation of naïve T cells (Sect. 16.1). In contrast, effector or memory T cells are less dependent on CD28 costimulator activation. Another CD28 family member, CTLA4, binds CD80 and CD86 proteins even stronger than CD28, but this interaction has inhibitory effects on TCR signaling. Thus, the expression of CTLA4 inhibits the initial activation of T cells in lymph nodes (Sect. 17.3). Similarly, the binding of PDCD1 on T cells with CD274 and PDCD1LG2 (programmed cell death 1 ligand 2, also called PDL2) on non-T cells leads to the inhibition of TCR signaling in effector cells (Sect. 19.2). While the activation of T cells is critical, in order to fight efficiently against pathogens, in certain situations it
19.2 T Cell Effector Functions
305
is also important to downregulate the immune response. Thus, CTLA4 and PDCD1 are expressed on T cells, in order to prevent overboarding responses of the adaptive immune system. This contributes to immune tolerance (Sect. 22.1). The blocking of CTLA4 and PDCD1 by commercially produced monoclonal antibodies is a promising tool in the immunotherapy of cancer (Sect. 33.3). However, the therapy compromise self-tolerance and may cause autoimmune responses of the patients (Sect. 23.4). Since T and B cells origin from the same cell lineage, they do not only apply the same mechanisms for obtaining the high diversity of their antigen receptors (Sect. 16.3), but also the signal transduction cascades downstream of BCR and TCR (Sect. 17.2) are very comparable (Fig. 19.3). The coreceptors CD4 and CD8 are at their cytoplasmatic region associated with the SRC kinase LCK. They confirm via a specific contact with MHC II and MHC I proteins, respectively, the correct formation of the immune synapse of TH cells and cytotoxic T cells. Under these conditions LCK gets in close contact with the in total 10 ITAMs of CD3 and ζ. Thus, the longer and stronger the TCR is activated by antigen, the more ITAMs get phosphorylated by LCK. This induces the recruitment and activation of the tyrosine kinase ZAP70 (zeta chain of T cell receptor associated protein kinase 70). ZAP70 belongs to the same family of tyrosine kinases as SYK, which is used in BCR signaling (Sect. 17.2), and has analogous function. Therefore, basically all further downstream signaling steps of TCR and BCR signaling are identical. In brief, with BLNK, GRB2, SOS1 and BTK further adaptor proteins and kinases get activated that induce via: • the second messenger DAG and the kinase PRKC the transcription factor NFκB • PLCγ2 and increased cytoplasmatic Ca2+ levels activating through calmodulin the kinase calcineurin the transcription factor NFAT • the small G proteins RAS and RAC and the MAPK cascade the transcription factor AP1. The three potent transcription factors NFκB, NFAT and AP1 synergistically activate enhancers regulating key immune genes, such as IL2 (Fig. 19.3) as well as others encoding for cytokine receptors and T cell effector proteins. Thus, TCR activation results in the activation of genes critical for the regulation of survival, proliferation and differentiation of T cells.
19.2 T Cell Effector Functions After the exposure with antigen, T cells undergo the same principles of clonal expansion as already described for B cells (Sect. 17.3). Accordingly, microbe-specific naïve CD4+ and CD8+ T cells get activated via the contact of their TCR with peptides presented on MHC II and MHC I proteins, respectively. Millions of naïve T cells with individual TCRs, which are continuously produced in the thymus (Sect. 17.3), circulate through our body. They move from one secondary lymphatic organ (mostly
306
19 T Cell Immunity: TCRs and Their Effector Functions
Dephosphorylation of cytoplasmatic NFAT
Phosphorylation, release and degradation of IκB
MAP kinase, SAP kinase pathway
DAG GTP RAS
P PP
PRKC
GTP RAC
PLC G2
P
IκB p50 p65 Inactive NFκB
IκB
P
p50 p65
Ca2+
P
Ca2+ Calmodulin
Inactive NFAT
Calcineurin
RAF1
Active NFAT p50 p65
MAP2K1
Active NFκB
FOS JUN
p50 p65 NFκB
NFAT
IL2
AP1
Fig. 19.3 TCR cell signaling. Signaling cascades that origin at the TCR end with the transcription factors NFκB, NFAT and AP1 converge on the enhancers of genes like IL2. More details are provided in the text. MAP2K1 = mitogen-activated protein kinase kinase 1
lymph nodes) to another and meet there a large number of DCs presenting different antigens (Sect. 14.4). In most cases, one DC is presenting a number of different peptides originating from the same antigenic protein (Sect. 18.3). When a resting naïve T cell recognizes a peptide-MHC complex, for which it shows high specificity, an immune synapse is formed and TCR signaling is initiated (Sect. 19.1). Please note that the chance that a given T cell is specific for an antigen is 1:100,000 to 1:1,000,000. The strength of the interaction and T cell activation largely depends on costimulatory proteins of the CD28 family. The initiated signal transduction cascade causes significant changes in the epigenome and transcriptome of the T cell. This results in the consecutive expression of cytokines, cytokine receptors and other surface molecules,
19.2 T Cell Effector Functions
307
such as IL2, CD69, IL2RA (interleukin 2 receptor subunit α, also called CD25) and CD40LG. This initiates clonal expansion of the respective T cell, i.e., in a massive proliferation resulting within a week in up to 5,000 (CD4+ ) to even 50,000 (CD8+ ) identical copies of the initial T cell, which all showing identical antigen specificity (Fig. 19.4). Importantly, other T cells that are not specific to the given antigen do not proliferate at all. Thus, within a week from a small number of antigen-specific T cells large counts of effector cells with specificity for the same antigen are generated. In parallel to their clonal expansion, the T cells become larger and differentiate into different types of effector TH cells when carrying a CD4 coreceptor (Sect. 19.3) or into cytotoxic T cells when being CD8+ (Sect. 19.4). Both types of effector T cells mediate cellular immunity. Most of these cells leave the secondary lymphoid organs and migrating via the blood stream to the sites of infection. At these extravascular sites, the microbe-specific T cells are retained by adhesive and chemotactic interactions and contribute to the elimination of the microbes (Sect. 20.2). Furthermore, CD4+ T cells that differentiate into follicular TH cells stay in the lymph nodes, translocate in
Clonal expansion 10
Contraction (homeostasis)
10
CD8+ T cells
10
Memory Infection days
CD4+ T cells 7
14
200
Time after infection
Fig. 19.4 Dynamics of microbe-specific T cell numbers. Within the first week after onset of an infection microbe-specific CD4+ and CD8+ T cells undergo clonal expansion and differentiate into effector TH cells and cytotoxic T cells, respectively. After elimination of the microbe the T cell numbers contract due to apoptosis of most of the effector T cells and only long-lived microbe-specific CD4+ and CD8+ memory T cells remain
308
19 T Cell Immunity: TCRs and Their Effector Functions
there to lymphoid follicles and stimulate B cells to produce high-affinity antibodies of different isotypes (Sect. 17.3). Humoral immunity only reacts on extracellular microbes that can be recognized by antibodies, while cellular immunity is able to respond to intracellular microbes. TH cells of types 1 and 17 (Sect. 19.3) both recognize macrophages presenting peptides derived from ingested microbes on MHC II proteins. However, they produce different sets of cytokines that either activate macrophages in finishing the phagocytosis or stimulate neutrophiles to mediate inflammation (Fig. 19.5a). TH cells do not directly eliminate microbes but stimulate other cells to do so. Thus, the major effector function of TH cells is the production of cytokines, in order to coordinate the function of other immune cells. In contrast, cytolytic T cells directly interact with their targets (Sect. 19.4). The latter are regular body cells that are microbe-infected and present peptides derived from microbial proteins on MHC I proteins (Fig. 19.5b). This results in killing of the infected cells via the induction of apoptosis to them, i.e., the cells are dying by an orderly process of programmed cell death. Thus, the effector function of both types of T cells contribute with high efficiency to the elimination of microbes throughout the whole body. Moreover, T cells can differentiate into TREG cells
a
Phagocytes with ingested microbes in vesicles CD4+ T cells (TH1 cells)
CD4+ T cells (TH17 cells)
b
Infected cell with microbes or antigens in cytoplasm CD8+ T cells (cytolytic T cells)
Cytokine secretion
Macrophage activation => killing of ingested microbes
killing of microbes
Killing of infected cell
Fig. 19.5 Contribution of T cells to the fight against infections. TH 1 and TH 17 cells respond to macrophages having ingested intracellular bacteria (a). They produce cytokines stimulating either macrophages or neutrophiles to eliminate the microbe. Cytolytic T cells recognize virus-infected body cells and induce apoptosis to them (b)
19.3 TH Cells
309
that are involved in immune tolerance and inhibit overboarding responses of effector CD4+ and CD8+ T cells, e.g., by the production of IL10 and IL35 (Sect. 22.1). This reduces tissue destruction and immunopathology. However, TREG cells are not considered as effector cells. The effector phase is followed by a contraction phase, in which the T cell responses decline after the microbes are eliminated. Most of the effector T cells undergo apoptosis after their task is finished, because due to the disappearance of the antigens they lack a survival stimulus. In this way, the immune system returns to homeostasis. However, some microbe-specific memory T cells survive for years or even lifetime. This is based on the increased expression of antiapoptotic proteins, such as BCL2 (BCL2 apoptosis regulator) and BCL2L1 (BCL2 like 1). Furthermore, memory cells are able to self-renew, i.e., they are slowly proliferating. With aging, the percentage of memory T cells in the total number of T cells increases (Sect. 16.1). After an infection the number of antigen-specific memory T cells is 10- to 100-fold higher than that of the initial naïve T cells. Interestingly, the epigenome of memory T cells is at regions of key immune genes, such as those encoding for cytokines, in a more responsive poised state. Since immunity is systemic, memory cells migrate to basically every site in the body. Therefore, a second exposure with the same antigen will lead to a stronger and more rapid response, so that the host often does not get aware of the recurrent infection. The success of a vaccination is largely based on this memory effect (Sect. 15.3).
19.3 TH Cells The general function of TH cells is to support (“help”) other cells of the immune system, such as the maturation of B cells into antibody producing plasma cells (Sect. 17.3) or the activation of macrophages (Sect. 19.2). TH cells are characterized by the expression of the glycoprotein CD4 on their surface, which restricts their direct communication to antigen-presenting cells, such as DCs, that display peptide-loaden MHC II protein on their surface (Sect. 18.3). Depending of the type of microbe that antigen-presenting cells have encountered, they produce different types of cytokines. In this way, the production of a TH subtype is induced, that combats the respective type of microbe most efficiently, i.e., environmental factors shape the differentiation of the T cells. For example, intracellular bacteria, such as Listeria and mycobacteria, parasites, such as Leishmania, as well as some viruses lead to the production of the cytokines IFNγ (Box 15.5), IL12, IL18 and type I IFNs by cells of the innate immune system, such as DCs, macrophages and NK cells. All these signals induce a differentiation of CD4+ T cells into TH 1 cells and cause a so-called type 1 immune response (Sect. 23.5). In turn, IL4 is produced after a contact with helminthic parasites and the naïve T cells differentiate into TH 2 cells, which is the core of the type 2 immune response. Signal transduction pathways, which react to stimuli from antigen-presenting cells, induce different epigenetic programming of the differentiating TH cells, such
310
19 T Cell Immunity: TCRs and Their Effector Functions
Table 19.1 Major subsets of TH cells T cell type
Major produced cytokines
Principal target cells
Major immune reactions
Role in host defense
Impact in disease
TH 1
IFNγ, IL2
Macrophages
Activation of macrophages
Intracellular microbes
Autoimmune diseases, chronic inflammation
TH 2
IL4, IL5, IL13
Eosinophiles
Activation of eosinophiles and mast cells
Helminths
Allergy
TH 17
IL17, IL22 Neutrophiles
Recruitment and activation of neutrophils
Extracellular bacteria and fungi
Autoimmune diseases, inflammation
Follicular TH cells
IL21
Stimulation of antibody production
Extracellular microbes
Autoimmune diseases
B cells
Naive CD4+ T cells differentiate into different subsets of effector cells, which are distinguished by the major cytokines that they are producing, the types of cells they are primarily interacting, the immune reactions that they are modulating, their general role in host defense and their impact in disease
as specific epigenetic changes in DNA methylation and histone modification at enhancer and promoter regions (Sect. 15.3). Moreover, TH subtype-specific transcription factors, such as TBX21, STAT1 and STAT4 (TH 1), GATA3 and STAT6 (TH 2) as well as RORγ and STAT3 (TH 17), are activated. This results in specific gene expression patterns. The changes in the epigenome and transcriptome are inherited in the progeny of proliferating cells, so that all members of the T cell clone become committed to the same pattern. This guides the differentiation of the T effector cells into TH 1, TH 2 and TH 17 subtypes, i.e., the developing cells become more and more committed to a specific cytokine expression profile (Table 19.1). This is the production of: • • • •
INFγ (Box 19.5) and IL2 by TH 1 cells IL4 (Box 19.2), IL5 and IL13 by TH 2 cells IL17 (Box 19.3) and IL22 by TH 17 cells IL21 by follicular TH cells.
In turn, the respective cytokine patterns amplify the TH cell subtype differentiation. For example, IFNγ promotes TH 1 cell differentiation and inhibits the development of TH 2 and TH 17 cells. This increases the polarization of the subtypes, so that different T cell populations accumulate. Most extreme polarization occurs in the context of chronic infections, which are characterized by prolonged immune stimulation (Sect. 21.2). However, as already discussed in the context of M1- and M2-type macrophages (Sect. 15.4), the three types of TH cells should be understood as extremes of a continuum of multiple intermediate cell states. The multitude
19.3 TH Cells
311
of environmental signals that affect the activation pattern of these T effector cells and impose specific epigenetic programming. This results in many different expression patterns of cytokines and other immune-related genes. Box 19.2: IL4 This is the master cytokine of TH 2 cells, since it acts both as an inducer and effector of this TH cell subset. The latter are the stimulation of intestinal peristalsis and the recruitment of eosinophiles. IL4 is structurally and functionally similar to IL13. Together, both cytokines activate the alternative pathway of M2-type macrophages and suppress the IFNγ-mediated classical pathway of M1-type macrophages. In addition, IL4 produced by follicular TH cells stimulates B cell to perform antibody isotype switching from IgM to IgE and IgG4 (Sect. 17.3).
Box 19.3: IL17 This cytokine forms a class of six IL17 subtypes (A-F) and does not resemble other cytokines. The main family member is IL17A, which is secreted by TH 17 cells as well as by some innate immune cells, such as ILC3s. IL17 connects cellular adaptive immune responses with acute inflammatory actions of neutrophiles, i.e., IL17 is a proinflammatory cytokine. Inflammation is more severe and prolonged, when TH 17 cells are involved, as with innate immunity alone. The cytokine expression patterns explain most of the different functional profiles of the cell populations, i.e., their impact in health and disease. TH cell-dependent inflammation evolved as a mechanism of antimicrobial defense. However, the activation of macrophages and neutrophiles by TH 1 and TH 17 cells, respectively, can lead to tissue injury. This collateral damage is called delayed-type hypersensitivity and causes much of the pathology associated with certain types of infection and chronic immunologic diseases (Chaps. 20, 21 and 23). Therefore, TH 1 and TH 17 cells are often associated with inflammatory autoimmune diseases (Sect. 23.4), while TH 2 have a key role in allergic reactions mediated by eosinophiles (Sect. 23.2) (Table 19.1). TH 1, TH 2 and TH 17 cells differ in the expression of chemokine receptors and adhesion molecules. TH 1 cells have high levels of CXCR3 and CCR5 as well as of selectin E and selectin P, which attracts them to sites of prominent inflammation mediated by cells of the innate immune system. In contrast, the receptors CCR3, CCR4 and CCR8 are found preferentially in TH 2 cells and guide them to sites of infections by helminths in mucosal tissues. Finally, the chemokine CCL20 leads CCR6-expressing TH 17 cells to sites of bacterial and fungal infections, in particular in mucosal tissues of the gastrointestinal tract. TH 17 cell development depends on
312
19 T Cell Immunity: TCRs and Their Effector Functions
the gut microbiome and therefore this TH subset is involved in the development of pathologic intestinal inflammation (Sect. 20.4). The main function of TH 1 cells is to stimulate macrophages to destroy ingested microbes (Fig. 19.6, left). TH 1 cells communicate with macrophages both via CD40LG-CD40 interactions and by IFNγ secretion. This microbe destroying pathway is referred to as “classical” and mediated by M1-type macrophages (Sect. 15.3). In contrast, TH 2 cells activate the “alternative” pathway, which is performed by M2-type macrophages and results in tissue repair. Activation of CD40 on the surface of macrophages induces a signal transduction cascade that results in the activation of the transcription factors NFκB and AP1 and the induction of their target genes, such as NOS2. This leads to the production of NO, proteolytic enzymes and ROS within lysosomes. The latter compounds kill ingested microbes when phagosomes fuse with lysosomes. Furthermore, activated macrophages secrete cytokines like TNF and IL1β, which recruit other leukocytes and initiate inflammation. Furthermore, TH 1 cells also secrete large quantities of IL2, which enhances the proliferation and survival of cytotoxic T cells (Sect. 19.4). TH 17 cells are primarily involved in the recruitment of neutrophils to sites of infection by extracellular bacteria and fungi (Fig. 19.6, right). Neutrophiles are potent phagocytes (Sect. 15.3) that destroy the microbes, which is mostly linked to inflammation. Accordingly, proinflammatory cytokines produced in response to the presence of bacteria and fungi, such as IL6, IL1β and IL23, stimulate the differentiation of CD4+ T cells into TH 17 cells. Interestingly, the antiinflammatory cytokine TGFβ supports this process. In contrast, the key TH 1 and TH 2 cytokines, IFNγ and IL4, respectively, suppress TH 17 differentiation. IL17 is the main cytokine secreted by TH 17 cells (Box 19.3) and determined the name of this TH subset, which mediates the type 3 immune response (Sect. 23.5). In gastrointestinal mucosa, IL17 stimulates leukocytes and tissue cells to produce chemokines and the proinflammatory cytokines TNF, IL1β and IL6. These signaling molecules recruit and activate neutrophiles. IL22 is another cytokine produced by TH 17 cells, the main function of which is to maintain the integrity of epithelial tissues, in particular in the skin and the intestine, by promoting their barrier function stimulating repair reactions and inducing the production of antimicrobial peptides. In contrast to other TH cell subsets, TH 2 cells do not mediate their actions via the recruitment of phagocytes. This is mainly due to the fact that the natural targets of TH 2 cells, helminthic parasites, are too large to be phagocytosed. Therefore, the main mediators of the TH 2 response, eosinophiles and mast cells, run a different strategy in combating helminths (Fig. 19.7). They secrete a number of aggressive chemicals, ranging from vasoactive amines, such as histamine, to lipid mediators, such as leukotrienes (LCTs) and PGs, as well as cytokines (Sect. 23.2). The differentiation of TH 2 cells is majorly controlled by the cytokine IL4 (Box 19.2). In turn, IL4 is together with IL5 and IL13, the major cytokine produced by TH 2 cells. These three cytokines mediate the effector functions of TH 2 cells, which are: • stimulating peristalsis in the intestine (IL4 and IL13) • provoking the alternative pathway (M2) of macrophage activation (IL4 and IL13)
19.3 TH Cells
313
Bacteria Bacteria
Antigenpresenting cells Naïve CD4+ T cell
Naïve T cell Fungi Proliferation and Antigenpresenting cells
TH17 cells TH1 cell
IL17 Leukocytes and tissue cells
Macrophage
IL22
Tissue cells
IFNγ
Chemokines, TNF, IL1, IL6, CSFs
Antimicrobial peptides Classical macrophage activation (enhanced microbial killing)
neutrophil response
Increased barrier function
Fig. 19.6 Functions of TH 1 and TH 17 cells. When TH 1 cells interact with macrophages presenting antigenic peptides, for which they are specific, they secrete IFNγ (left). The cytokine stimulates the classical macrophage pathway (M1), in which the cells increase their phagocytosis and kill the ingested microbes. In contrast, TH 17 cells produce either IL17, which recruits neutrophils as well as other leukocytes and increases production of antimicrobial peptides, or IL22, which promotes epithelial barrier functions (right). More details are provided in the text
• increasing the secretion of mucus from of epithelial cells airways and intestine (IL13) • activating mature eosinophils by stimulating their proliferation, differentiation and recruitment (IL5).
314
19 T Cell Immunity: TCRs and Their Effector Functions
Naïve CD4+ T cell
Helminths or protein antigens Antigenpresenting cell
B cells
Proliferation and
Follicular TH cells
TH2 cells IL4, IL13
M2-type macrophage
IL4
Eosinophil IgG4 IgE
IL4, IL13
IL5
Antibody production
Alternative macrophage activation (tissue repair)
Helminth
Mast cell degranulation
Intestinal mucus secretion and peristalsis
Eosinophil activation
Fig. 19.7 Functions of TH 2 cells. IL4 secreted by follicular TH cells stimulates B cells to produce IgE-type antibodies that bind to FcεRIs on mast cells. Moreover, IL4 produced by TH 2 cells enhances together with IL13 immunity at mucosal barriers and induces the alternative macrophage pathway, which leads to tissue repair. In addition, TH 2 cells secrete IL5 that activates eosinophiles to fight against helminths. More details are provided in the text
These mechanisms block the entry and mediate the expulsion of microbes from epithelial surfaces (called barrier immunity), kill helminths and terminate inflammation combined with the initiation of tissue repair. Importantly, IL4 produced by follicular TH cells stimulates antibody isotype switching in B cell, so that they secrete IgEs that are specific to helminths. These IgEs bind to FcεRIs on the surface of eosinophiles and mast cells, so that these cells of the innate immune system recognize helminths with high specificity and combat them by releasing their granule contents. IgEs use these mechanisms also in the context of allergic reactions (Sect. 23.2).
19.4 Cytotoxic T Cells
315
19.4 Cytotoxic T Cells Cytotoxic T cells are distinguished from TH cells (Sect. 19.3) by the expression of the coreceptor CD8 instead of CD4. This allows them to bind with their TCR peptideloaden MHC I proteins on the surface of all nucleated body cells. Cytotoxic T cells recognize most efficiently viral antigens presented by MHC I proteins on the surface of specialized DCs expressing the membrane glycoprotein thrombomodulin. The latter cells are not typically infected by viruses themselves, but induced via crosspresentation of proteins of virus-infected cells, which they have ingested. Thus, DCs are able to present antigens from all types of viral proteins (Sect. 18.3). Moreover, TH cells push the responses of cytotoxic T cells to latent viral infections (Sect. 21.1), organ transplants (Sect. 22.2) and tumors (Sect. 33.2), all of which are not well recognized by the innate immune system, via further activation of antigen-presenting cells. Many viruses infect body cells, such as liver cells by HBV (hepatitis B virus), that lack an effective system of phagosomes and lysosomes being able to destroy the viruses (Sect. 21.2). Moreover, when intracellular microbes, such as the bacteria Mycobacterium tuberculosis or Listeria monocytogenes (Sect. 20.3), manage to escape the vesicles, by which they were taken up, and reach the cytoplasma of their target cells, there is no other chance than killing the infected cells. Therefore, the main function of cytotoxic T cells is the induction of apoptosis to microbe-infected target cells. Thus, the killing of the infected body cells is the only possibility to eliminate intracellular microbes without spreading them. After the specific recognition of virus-infected cells, cytotoxic T cells use two different mechanisms to induce apoptosis in their target cells (Fig. 19.8). In this way, cytotoxic T cells resemble NK cells of the innate immune system (Sect. 15.2). Similar principles apply to the surveillance for transformed cells, which are recognized by cytotoxic T cells via the display of tumor antigens on MHC I proteins (Sect. 33.2). However, cytotoxic T cells play also key roles in the acute rejection of transplanted organs (Sect. 22.2) and in the destruction of host tissues in autoimmune diseases (Sect. 23.4). The clonal expansion of CD8+ T cells has the remarkable rate of 50,000 for the multiplication of antigen-specific cells (Fig. 19.4). This creates a sufficiently large pool of cells that recognize and destroy the source of the antigen throughout the whole body. During the approximately 7 days of massive proliferation the cells turn into effector cytotoxic T cells that have acquired the tools for destroying the virusinfected cells. The differentiation of cytotoxic T cells is promoted by the cytokines IL2, IL12 and type I IFNs leading via signal transduction cascades and the activation of the transcription factors TBX21 and eomesodermin to specific changes of the epigenome of cells. In this process the cytotoxic T cells develop a large number of granules, which are modified lysosomes containing proteins like perforin and granzymes. Moreover, cytotoxic T cells express a number of cytokines, the most important of which is IFNγ (Box 15.5). This cytokine activates macrophages to remove fragments of apoptotic cells without inducing inflammation.
316
19 T Cell Immunity: TCRs and Their Effector Functions
a
Perforin/granzyme-mediated cell killing Target cell
CD8+ T cell
Endosome
Perforin Perforin induces uptake of granzymes into target cell endosomes their release into the cytosol activating caspases
Granzymes
Cytolytic T cell releases granule contents into immune synapse
b
Apoptosis of target cell
FAS/FASLG-mediated cell killing Target cell
CD8+ T cell
FASLG FAS FASLG on cytolytic T cell interacts with FAS on target cell
Fig. 19.8 Function of cytotoxic T cells. Granule exocytosis releases complexes of perforin and granzymes from cytotoxic T cells, which have specifically recognized their target cells (a). Perforin allows granzymes to enter the cytoplasma of the target cells, where they induce apoptosis. An alternative mechanism of inducing apoptosis is the contact between the protein FASLG, which after the recognition of infected cells is expressed on the surface of cytotoxic T cells, with FAS on target cells (b). More details are provided in the text
19.4 Cytotoxic T Cells
317
Cytotoxic T cells kill target cells that express the same MHC I protein-bound peptide that triggered their proliferation and differentiation. This process needs to be highly specific, in order not to harm neighboring non-infected cells. Therefore, perforin and granzymes are not freely diffusing to the target cells but are delivered in granules via the cleft of the immune synapse formed by TCR, CD8 and peptideloaden MHC I proteins as well as by adhesion molecules forming a stabilizing ring around the synapse (Sect. 19.1). The granules are transported by microtubules toward the synapse and taken up by target cells via endocytosis (Fig. 19.8a). Perforin is homologous to the complement protein C9 (Sect. 20.2) and makes the endosomal membrane permeable. This allows granzymes to reach the cytoplasma of target cells. Granzyme B, the most important member of the granzyme family, is a serine protease that cleaves proteins after aspartate residues and activates in this way CASPs, such as CASP3, as well as BID (BH3 interacting domain death agonist). The latter protein belongs to the BCL2 family, members of which are the main regulators of this mitochondrial (intrinsic) pathway of apoptosis (Fig. 19.9). Some members of the BCL2 family are proapoptotic, while others are antiapoptotic. They act as sensors of cellular stress and can be activated by growth factor deprivation, noxious stimuli, DNA damage or receptor-mediated signal transduction pathways. The main stress sensor in lymphocytes is BCL2L11, which activates the proapoptotic proteins BAX (BCL2 associated X, apoptosis regulator) and BAK (BCL2 antagonist/killer 1) that increase the permeability of the outer mitochondrial membrane. This leads to the leakage of cytochrome C and other mitochondrial proteins into the cytoplasma and activates CASP9. In the following, further downstream CASPs induce fragmentation of genomic DNA and apoptotic cell death. When cells undergo apoptosis, fragments of their nucleus and cytoplasma form membrane-bound apoptotic bodies that are recognized by receptors on phagocytes. In the process efferocytosis neutrophiles and macrophages rapidly engulf and eliminate apoptotic bodies without causing an inflammatory response. In case of apoptosis induced by cytotoxic T cells, the delivery of cytotoxic proteins to the target cells takes only minutes. Thus, the cytotoxic T cells have to be attached only for a short time, while in the following 2–6 h cell death by apoptosis occurs to the target cells. This is the principal pathway, how cytotoxic T cells kill their target cells. In addition, cytotoxic T cells use a pathway that is independent of the release of granules (Fig. 19.8b). This extrinsic apoptosis pathway is mediated by the membrane protein FASLG (Fas ligand) that interacts with FAS (Fas protein) on the surface of their target cells (Fig. 19.9). FAS belongs to the death receptor family, the activation of which initiates the activity of a series of proteolytic enzymes, including CASP8. The directed induction of apoptosis does not harm the cytotoxic T cells themselves, so that they can move on to their next target cells. Apoptosis of virus-infected cells ends with the phagocytosis (Sect. 15.3) of their cell fragments, i.e., with the proteolytic digestion of all cellular ingredients (Fig. 19.9). In this way, also the viruses are destroyed and the reservoir of infection is eradicated.
318
19 T Cell Immunity: TCRs and Their Effector Functions
Cell injury:
Mitochondrial (intrinsic) pathway
factors, survival signals - DNA damage - protein misfolding
(BAX, BAK)
BH3-only proteins
DNA and nuclear fragmentation
Regulators (BCL2, BCL2L11) Initiator caspases: CASP9 Endonuclease activation
Cytochrome C and other proapoptotic proteins
Death receptor (extrinsic) pathway FAS Initiator caspases: Executioner CASP8 caspases
FASLG TNF
TNFR Receptor-ligand interactions: - FAS-FASLG - TNFR-TNF
Apoptotic body
Macrophage
Fig. 19.9 Apoptosis pathways. Apoptosis can be induced by the intrinsic pathway, which leads the release of cytochrome C from mitochondria and the extrinsic pathway that is initiated by liganded death receptors on the cell surface. Both pathways lead to the fragmentation of the cells and the phagocytosis of apoptotic bodies. More details are provided in the text
(Clinical) Conclusion: T cell subtypes show a clearly different functional profile. Cytotoxic T cells eliminate aberrant body cells, such as virus infected cells or cancer cells, by the induction of apoptosis, while TREG cells inhibit overboarding immune reactions. The different forms of TH cells are extremes
Additional Reading
319
of a spectrum of responses to intracellular viruses and bacteria (TH 1 cells), large extracellular microbes, such as helminths (TH 2), and small extracellular microbes (TH 17).
Additional Reading Gaud, G., Lesourne, R., & Love, P. E. (2018). Regulatory mechanisms in T cell receptor signalling. Nature Reviews Immunology, 18, 485–497. Gieseck, R. L., Wilson, M. S., & Wynn, T. A. (2018). Type 2 immunity in tissue repair and fibrosis. Nature Reviews Immunology, 18, 62–76. Henning, A. N., Roychoudhuri, R., & Restifo, N. P. (2018). Epigenetic control of CD8+ T cell differentiation. Nature Reviews Immunology, 18, 340–356. Mayassi, T., Barreiro, L. B., Rossjohn, J., & Jabri, B. (2021). A multilayered immune system through the lens of unconventional T cells. Nature, 595, 501–510. Spolski, R., Li, P., & Leonard, W. J. (2018). Biology and regulation of IL-2: From molecular mechanisms to human therapy. Nature Reviews Immunology, 18, 648–659.
Chapter 20
Immunity to Bacterial Pathogens and the Microbiome
Abstract In this chapter, we will learn that the major physiological function of the immune system is the protection of our body against microbe infections. First, we will summarize the principles of immune responses to control infections with all kinds of microbes. Then we will focus on the effector functions of humoral and cellmediated innate and adaptive immunity against bacterial infections. Furthermore, we will discuss that an overreaction of the immune system to the presence of bacteria can lead to life-threatening sepsis. In addition, we will present emerging bacterial pathogens and discuss at the example of tuberculosis a more than 70,000 yearlong interaction of Homo sapiens with Mycobacterium tuberculosis. Finally, we will explain the impact of the interaction of our immune system with the gut microbiome in the context of health and disease. Keywords Host–pathogen interactions · Bacterial pathogens · Complement system · Sepsis · Tuberculosis · Microbiome · Dysbiosis
20.1 Principles of Immune Responses to Infections Infectious diseases have two major components, the pathogenic microbe and the immune system of the host, both of which are modulated by environmental conditions (Fig. 20.1). The nature and outcome of the microbe-host interaction, such as: • entry of the microbe via mucous membranes of the respiratory, gastrointestinal and genitourinary tract or the skin (e.g., via wounds, Sect. 31.1) • invasion and colonization of host tissues by the microbes • the ability of the microbes to evade host immunity (Box 20.1) • the amount of injury or impairment caused to host tissue by the microbes. Determines, whether the host stays healthy or gets ill. Thus: • the host may be either resistant against an infection with a given microbe or susceptible to it • the host’s immune system may be either very responsive or deficient © The Author(s), under exclusive license to Springer Nature Switzerland AG 2023 C. Carlberg et al., Molecular Medicine, https://doi.org/10.1007/978-3-031-27133-5_20
321
322
20 Immunity to Bacterial Pathogens and the Microbiome
Environment Pathogen
Host
Host response Replication and rewiring
Disease
Resistance Acquired immunity Tolerance Non-virulence
Health
Susceptibility Pathogenicity Virulence
Fig. 20.1 Host and pathogen are interdependent. Host and pathogen have a very complex relationship that determines, whether the individual stays healthy or gets ill. Moreover, the environment plays a central role on the effects of the microbe on the host as well as on the resulting effector functions of the host’s immune system on the pathogen. More details are provided in the text
• the host may be either tolerant against the microbe or the latter has high pathogenicity (Box 20.2) • the microbe may be either virulent or not (Box 20.2).
Box 20.1: Principles of Immune Evasion by Microbes The virulence (Box 20.2) of a microbe critically depends on its ability to resist mechanisms of innate immunity. For example, bacteria with polysaccharide-rich capsules are difficult to eliminate by phagocytosis, since sialic acid residues in the bacterial capsules inhibit the activation of the alternative complement pathway (Sect. 20.2). A common instrument how microbes evade adaptive immune responses via neutralizing antibodies is the variation of their surface antigens due to rapid changes of their genome. Similarly, also the structure
20.1 Principles of Immune Responses to Infections
323
of surface carbohydrates can be varied due to changes in the expression of glycosidases. Intracellular microbes use other mechanisms to evade immune destruction, such as the inhibition phagolysosome fusion, an escape to the cytoplasma or scavenging aggressive chemicals produced by lysosomes. In general, immune evasive microbes tend to cause chronic infections, such as tuberculosis (Sect. 20.3) or Herpes viruses (Sect. 21.2), that are difficult to eliminate and last over years or decades. Such microbes survive in a quiescent latent state in their host cells, but become active when the host becomes immune-compromised.
Box 20.2: Pathogenicity and Virulence Pathogenicity describes the ability of a pathogenic microbe to cause a disease within a host, while virulence is the degree of pathogenicity. The virulence of a microbe is often expressed by lethal dose 50 (LD50 ), i.e., the number of microbes that are required to kill 50% of infected hosts, while ID50 is the infectious dose, i.e., the microbe load that makes 50% of all hosts ill. Both rates are average numbers and there are large interindividual differences. Nevertheless, the lower LD50 or ID50 of a microbe are, the more virulent is the pathogen. The likelihood that an infection causes a disease primarily depends on the microbe count and the resistance of the host. Many features of microbes determine their virulence and a multitude of mechanisms contribute to the pathogenesis of infectious diseases. For example, the susceptibility of the host is affected by gender, fatigue, preexisting illness, age, nutritional status, lifestyle, emotional disturbance as well as by weather and climate. Microbes aim to optimize the interaction with their host, in order to create a local environment that allows maximal replication rates either inside or outside of host cells. For example, pathogenic extracellular bacteria grow in the blood, in connective tissues and in spaces between tissues. They cause disease either by the induction of inflammation, i.e., tissue injury at the local site of infection, or by the presentation or release of toxins, i.e., everywhere in the body. Gram-negative bacteria carry endotoxins, such as LPS, on their surface that act as PAMPs (Sect. 15.1) and stimulate cytokine production by innate and adaptive immune cells. Furthermore, secreted exotoxins, such as in the bacterial diseases diphtheria, tetanus, cholera and anthrax, reduce protein synthesis, affect salt-water transport, inhibit neuromuscular transmission or disturb signaling pathways, respectively, in various host tissues. Special types of toxins are superantigens (Box 20.3) that can cause a systemic inflammatory response syndrome.
324
20 Immunity to Bacterial Pathogens and the Microbiome
Box 20.3: Superantigens Some bacterial strains, such as Staphylococcus aureus, produce toxins that are able to act as superantigens. These proteins activate various different T cell clones (5–20% of all compared to 0.01% in case of regular antigens), because they are not processed to peptides by antigenpresenting cells but displayed as intact proteins on the surface of macrophages. Superantigens are able to bind to the TCR of TH cells as well as to MHC II proteins, i.e., they cross-link, e.g., TH 1 cells and macrophages. This leads to a massive increase in the number of activated T cells and in the levels of the cytokines produced by them and other immune cells. In particular, high levels of TNF, IL1β and IL6 cause a cytokine storm that may lead to systemic toxicity, a sepsis-like systemic inflammatory response syndrome (Sect. 20.2) and even death. Genetic polymorphisms of class II HLA genes (Sect. 18.2) contribute the susceptibility to superantigens. The presence of pathogenic microbes induces a number of effector mechanisms of innate and adaptive immune system of the host. This provides many distinct and specialized ways to respond to microbes and eliminate them (Sect. 20.2). In contrast, the survival and pathogenicity of microbes is critically dependent on their ability to evade or resist these different effector mechanisms. Moreover, a too strong response of the immune system may cause collateral damage to the host, such as tissue damage and impairment. Ideally, there is a balance between activating signals to eliminate the pathogenic microbe and inhibitory signals that avoid tissue pathology, i.e., the immune system should respond in an appropriate magnitude. However, illness is caused often rather by the immune response than by direct actions of the microbe. The principles of the responses of the innate and adaptive immune system to microbe infection have already been described in Sect. 14.2. In a typical infection (Fig. 20.2), the effector functions of innate immune cells, such as neutrophils, macrophages, NK cells and ILCs, slow down the growth of pathogenic microbes but are mostly not able to completely eradicate them. Since the clonal expansion of microbe-specific B and T cells takes about a week, the innate immune system has to control the infection for this period until adaptive immunity takes over. Some pathogenic microbes even developed resistance against effector functions of innate immunity (Box 20.1), so that survival critically depends on adaptive immunity. The highly specific effector functions of B and T cells as well as the large numbers of cells and antibodies then enable the complete elimination of the microbes. When this task is completed, most of the effector cells undergo apoptosis, but a lower number of microbe-specific long-lived memory cells survive and provide the body with immunity against a recurrent infection with the same microbe. Although immune or vaccinated individuals have the same infection risk as non-vaccinated persons, the invasion of microbes is mostly asymptomatic in the former and resolves without developing illness. In these cases, memory B and T cells rapidly respond and within
20.1 Principles of Immune Responses to Infections
Number of organisms
Innate immune response
325
Adaptive immune memory
Infection established
Infection ended
Microbe entry
Time course of infection
Fig. 20.2 Innate and adaptive immunity together control a typical infection. A plot of microbe number over time indicates that early responses to pathogenic microbes are mediated by cells of the innate immune system. These slow down the growth of the microbes but often do not eradicate them. In case of a first contact with the microbe, it takes approximately one week until microbespecific clones of T and B effector cells have grown to sufficient numbers that are able to eliminate the microbe. Some of the T and B cells survive as long-lived memory cells and enable more rapid responses in case of a repeated infection with the same microbe
1–3 days efficient effector mechanisms are available that eradicate the microbes before they are able to grow to a substantial number. The above described outcome of a typical infection focused on the microbe number over time. An infected person is considered ill, when he or she has developed symptoms, such as fever, in response to the presence of the microbes or diarrhea to the toxins produced by them. Therefore, illness occurs mostly some days after first contact with the microbe. In addition, the symptoms of the disease are often primarily a consequence of the immune response. Therefore, the health status can be reduced for a while after the microbes have been eliminated. In this time frame the immune system returns to homeostasis and contributes to the repair of injured tissues. An alternative representation of microbe infections is a plot of health status over microbe number (Fig. 20.3). This allows to define not only the effects of pathogenic microbes in reducing the health status of an individual but also to characterize symbiotic interactions of microbes with the host that may improve well-being. In this scheme a typical acute infection, such as measles or gastritis, is represented by curve 1: first the microbes grow without affecting the health status, then the disease symptoms start, i.e., health status decreases, the immune system reduces the microbe
326
20 Immunity to Bacterial Pathogens and the Microbiome
number, while initially health further declines until in the recovery phase the original health status is fully reconstituted. In contrast, curve 2 describes an infection that results in a permanent disability, i.e., a reduced heath status, such as damage caused by meningitis or encephalitis. In case of an unstable disability, such as in context of the autoimmune diseases rheumatic fever or reactive arthritis, the end point may be an inflammatory stage that causes further tissue damage (curve 3). Nonresolving, persistent infections like herpes (Sect. 21.2) or tuberculosis (Sect. 20.3) are represented by curve 4 indicating a variant status of remaining health. Thus, the pathogenicity of a microbe critically depends on its ability to evade or resist the effector mechanisms of immunity (Box 20.1). In extreme, the immune system is not able to control the microbe number sufficiently (curve 5) or not at all (curve 6), so that health declines until the death of the patient. In the latter cases, often the microbes do not kill the host directly but the overboarding reactions of the host’s immune system cause so much damage that the person dies. This will be further discussed in context of sepsis (Sect. 20.2). Moreover, inherited and acquired defects of the immune system, such as AIDS following an insufficiently treated HIV-1 infection or the long-term immunosuppression after organ transplantation (Sect. 22.3), increase the susceptibility for infections. Curves 7–9 (Fig. 20.3) describe mutualistic microbe-host interactions that are symmetric to the curves 1, 2 and 4, respectively. Curve 7 displays the short-term transient colonization of the intestinal track with beneficial microbes, such as a probiotic bacterial strain. In contrast, curve 8 reflects the infection with a microbe, such as a live vaccine, that is eventually cleared but leads via gained immunity to an improved health status of the host. Finally, curve 9 represents a long-term interaction with a mutualist, such as a beneficial component of the gut microbiome (Sect. 20.4).
20.2 Immune Responses to Bacteria Most pathogenic bacteria grow in extracellular spaces of the host (Sect. 20.1), but some species, such as Mycobacterium tuberculosis, survive inside of macrophages and are referred to as intracellular bacteria (Sect. 20.3). Both innate and adaptive immunity have developed distinct mechanisms to fight against extra- and intracellular pathogenic bacteria. The main instruments of the innate immune system against extracellular bacteria are: • the rapid recruitment of neutrophils and macrophages to the site of infection by cytokines and chemokines secreted by tissue-resident macrophages (Box 15.4) and DCs. This is part of the inflammatory response (Sect. 15.4) • the activation of phagocytosis in neutrophils and macrophages, in order to ingest and kill the bacteria (Sect. 15.4) • the activation of the complement system that makes microbes detectable by phagocytes, supports the inflammatory response and leads to the lysis of microbes (Box 20.4).
20.2 Immune Responses to Bacteria
327
8 9
Mutualists
Health
7
1
Pathogens
2 3 4
5
6
Microbe number
Fig. 20.3 Comparing the routes of infections with pathogens and mutualists. A plot of health status over microbe number compares six scenarios of infections with pathogenic microbes with three schemes of infections with mutualists. More details are provided in the text
Box 20.4: The Complement System The humoral response of the innate immune system is primarily mediated by some 50 different complement proteins (primarily produced by the liver) that circulate in the blood, lymph and extracellular fluids. Once activated, these proteins interact with each other in a highly regulated fashion, in order to opsonize microbes, promote the recruitment of phagocytes (Sect. 15.4) or directly eliminate microbes (see below). The three pathways to activate complement proteins are (Fig. 20.4): • the classical pathway that uses antibodies of adaptive humoral immunity, in order to specifically recognize microbes. The large multimeric complement protein C1 binds with its C1q subunit to the Fc regions of antigen-bound IgG3 and IgM antibodies. This starts proteolysis of complement proteins C2 and C4, their fragments C2a and C4b form the serine protease C3 convertase
328
20 Immunity to Bacterial Pathogens and the Microbiome
Initiation of complement activation
Early steps
Late steps
functions
Classical pathway C5
C3
C3
C5 C5
C3
Membrane attack complex
C3b is deposited on microbe Alternative pathway
b C3
C3b Lectin pathway Lectin
C3
b
C5
b C5b
C5b C9
C5a C3b
C3b C3a C3a:
C3b: Opsonization and phagocytosis
C5a:
C5b-9: Lysis of microbe
Mannose binding lectin
Fig. 20.4 Principles of complement activation. The complement system can be activated by the classical, alternative or lectin pathway, all of which lead to the proteolysis of C3 protein into C3a and C3b. The latter binds to the surface of microbes and initiates the proteolysis of C5 into C5a (causing inflammation) and C5b (initiating the polymerization of C9 to the membrane attack complex). More details are provided in the text
that splits the most abundant but inactive complement protein C3 into the active fragments C3a and C3b. • the alternative pathway that functions without the involvement of antibodies is activated when complement protein C3 is hydrolyzed spontaneously on the surface of microbe to C3b. This pathway distinguishes host cells from microbes, because the latter do not express complement regulatory proteins like CD35, CD46 CD55 or CD59. • the lectin pathway that is based on the mannose-binding protein lectin that specifically identifies mannose on the surface of microbes. The three pathways are redundant to each other, since they all result in the activation of the C3 convertase. The C3b fragment binds covalently to microbe
20.2 Immune Responses to Bacteria
329
surfaces or to antibodies binding microbes. In this way, within minutes millions of C3b molecules attach to microbes, so that they become “visible” to phagocytes expressing receptors for C3b. In the following, the enzyme C5 convertase is activated, which cleaves complement protein C5 into C5a and C5b. The fragments C3a and C5a both stimulate inflammation. In parallel, a cascade of the proteins C5b, C6, C7, C8 and C9 lead to the formation of the membrane attack complex on the surface of microbes. The complex forms a transmembrane channel, which causes osmotic lysis in particular to gram-negative bacteria. Importantly, host cells are not harmed by the complement system, since they carry on their surface sialic acid residues that inhibit complement activation. The same strategy is used by some pathogenic microbes, in order evade the activation of the alternative or lectin pathway. However, these bacterial pathogens can be still detected by the classical complement pathway. The adaptive immune system reacts to the presence of extracellular bacteria primarily via its humoral response (Sect. 17.3). Proteins or carbohydrates on the surface of bacteria as well as secreted exotoxin proteins are recognized by naïve B cells, which then proliferate and differentiate to plasma cells that produce massive amounts of highly specific antibodies (Fig. 20.5A). These antibodies either: • neutralize bacteria or their toxins by completely covering their surface. Most of the neutralizing antibodies have due to affinity maturation high affinity for their targets (Sect. 17.3). Neutralizing IgGs are found primarily in the blood, while IgAs act in the lumen of mucosal organs and represent a major defense line against recurrent infections: the aggregation of pathogenic microbes with IgAs reduces their infectivity, traps them in mucus and facilitates their clearance by peristalsis. • opsonize bacteria, i.e., mark them for destruction by antibody-dependent cellular phagocytosis (ADCP). This process significantly enhances the efficiency of microbe destruction by neutrophils and macrophages and depends on the expression of different types of FcRs on their surface, such as FcγRI (CD64, high affinity binding of IgG1 and IgG3), FcγRII (CD32, low affinity binding of IgG1 and IgG3) and FcγRIII (CD16). • activate complement-dependent cytotoxicity (CDC), i.e., phagocytosis of C3bcoated bacteria, the induction of inflammation and the lysis of the microbes. When protein antigens of extracellular bacteria are displayed by MHC II proteins of antigen-presenting cells, TH cells are activated to produce cytokines and express surface proteins (Sect. 19.3). TH 17 cell secrete IL17, TNF and other proinflammatory cytokines and stimulate inflammation by recruiting neutrophils and monocytes. TH 1 cells produce INFγ and support phagocytic and microbicidal activities of macrophages and neutrophils, while follicular TH cell stimulate antibody production (Fig. 20.5B).
330
20 Immunity to Bacterial Pathogens and the Microbiome
a Neutralization
Opsonization and FcR-mediated phagocytosis
Antibody Bacteria
B cell
Phagocytosis of C3b-coated bacteria
TH cells (for protein antigens)
Complement activation
Lysis of microbes
b
Bacteria
TH17
IL17, TNF, other cytokines
IFNγ TH1
Various cytokines Follicular TH
Macrophage activation => phagocytosis and bacterial killing Antibody response
Fig. 20.5 Adaptive immune responses to extracellular bacteria. The adaptive immune system responds to extracellular bacteria and their toxins via antibody production (a) and the activation of TH 1, TH 17 and follicular TH cells (b). More details are provided in the text
Pathogenic intracellular bacteria, such as Mycobacterium tuberculosis (Sect. 20.3) differ from extracellular bacteria by their property to resist phagocytosis, i.e., they are ingested but survive and even replicate within macrophages. In this way, intracellular bacteria cannot be recognized by complement proteins and antibodies, i.e., they are located in a niche that is “invisible” to humoral responses of innate and adaptive immunity. Therefore, mechanisms of cell-mediated immunity need to activate phagocytosis within the infected macrophages via INFγ secretion by NK cells and ILC1s of the innate immune system (Sect. 2.5). Similarly, TH 1 cells of the adaptive immune system reach the same effect by a direct CD40LG-CD40 contact and the
20.2 Immune Responses to Bacteria
331
production of INFγ (Sect. 19.2). Moreover, other cytokines, such as TNF, are important stimuli of efficient phagocytosis. When intracellular bacteria, such as Listeria, manage to escape the phagosome and reach the cytoplasma of the macrophages, there is no other option than inducing their apoptosis by cytotoxic T cells (Sect. 19.4). During a bacterial infection the host mostly feels weak and/or ill, because the response of his/her immune systems uses a substantial amount of the daily energy for immune cell production in the bone marrow and elevating the body temperature. The local inflammatory response, which is primarily the eradication reaction of neutrophils and macrophages, not only reduces the number of microbes but also causes tissue injury (Sect. 15.4). This is followed by a repair phase, in which inflammation is resolved and tissues are repaired, so that the immune system can return to homeostasis (Fig. 20.6, top). However, when pathogenic microbes manage to evade the effector mechanisms of the immune system, often higher amounts of proinflammatory cytokines like TNF, IL1β, IL12 and IL18 are produced. This induces the secretion of acute-phase proteins from the liver. In this way, the immune system fails in returning to homeostasis but develops a whole body (systemic) response to the infection. Thus, a severe local or systemic infection with bacteria or fungi (Box 20.5) can lead to sepsis (Sect. 15.4). The latter is a highly heterogenous systemic inflammatory response syndrome, the common characteristic of which is an unbalanced host response to infection. Early clinical symptoms of sepsis are elevated body temperature (>38 ºC), heart rate (>90 beats/min), respiratory rate (>20 breaths/min) and leukocyte count (>12,000/μl). In the context of sepsis abnormalities in tissue blood perfusion, coagulation, metabolism and organ function are found (Fig. 20.6, bottom). These can lead to a septic shock, which is a collapse of blood circulation combined with systemic intravascular coagulation. The mortality rate of sepsis was extreme in the past, e.g., due to surgeries or giving birth under non-sterile conditions, but is even todays 20%. Box 20.5: Immune Response to Infections with Fungi Fungi can live outside of host cell or survive in macrophages as described for extra and intracellular bacteria, respectively. Accordingly, similar mechanisms of innate and adaptive immunity apply for the defense against fungi. The innate immune system primarily uses the complement system, e.g., in the fight against Candida reaching the blood stream, for opsonization and destruction by phagocytes, in particular by neutrophiles. TH 17 cells of the adaptive immune system are critical for the defense against extracellular fungi, since they recruit neutrophils for phagocytosis. In contrast, TH 1 cells (often in cooperation with cytotoxic T cells) are used for the fight against intracellular fungi by either inducing effective phagocytosis or killing the infected macrophages. Some infections with fungi are endemic and are caused by species that are present in the environment and whose spores enter humans. Other fungal infections are opportunistic, i.e., in the healthy individual they cause no or only mild disease but break out in
332
20 Immunity to Bacterial Pathogens and the Microbiome
Immune suppression +
Protective immunity Local repair mechanisms: • Inhibition and resolu-
matory mechanisms
• Tissue repair • Return to homeostasis
PAMPs
TLRs
Homeostasis
CD8+ T cells: • Apoptosis • Exhaustion • Cytotoxic function
Neutrophils: Antigen-presenting • Apoptosis cells: • Immature cells with de- • Reprogramming of creased antimicrobial macrophages to M2 functions phenotype • Reduced HLA-DR exLymph node: pression • Apoptosis of B cells and follicular dendritic cells Others: • Expansion of regulatory T cell and MDSC populations RLRs
NLRs
Protective immunity Localized innate immune response:
matory response
CD4 T cells: • Apoptosis • Exhaustion • TH2 cell polarization
matory mediators • Leukocyte recruitment • Complement activation • Coagulation activation
Leukocytes and parenchymal cells: matory mediators • Cell injury with release of DAMPs
Endothelium: matory mediators • Adhesive and procoagulant properties • Barrier function
Platelets:
Others: • Coagulation activation matory mediators (microvascular throm• Activation of neutrophils bosis) and the endothelium • Complement activation • Microvascular thrombi
Fig. 20.6 Normal and excessive responses of the immune system to bacterial infection. In the normal, balanced response of the innate immune system to infection with extracellular bacteria, there is a local inflammatory response, such as cytokine and chemokine release, phagocyte recruitment as well as activation of the complement and coagulation system, at the site of infection leads to the elimination of the pathogens (top). This is followed by a return to homeostasis, where inflammation is resolved and tissues are repaired. In contrast, during some infections the immune response becomes unbalanced and can develop a life-threatening sepsis (bottom). This is characterized by excessive inflammation combined with immune suppression. More details are provided in the text
20.3 Emerging Microbial Pathogens
333
persons with compromised immunity, such as a deficiency in neutrophils or after taking immunosuppressive drugs (Sect. 22.3). On the cellular level sepsis is associated with excessive inflammation that systemically activates complement proteins as well as the coagulation system. This disrupts the integrity of the endothelial barrier and causes leakage of intravascular proteins and plasma into the extravascular space. Moreover, this leads to microvascular thrombosis and hemorrhage (i.e., bleeding) due to the consumption of clotting factors and platelets. Accordingly, the main reason for early mortality in sepsis is a cardiovascular collapse and multiple organ dysfunction. In contrast, sepsis also leads to immunosuppression via apoptosis of T and B cells as well as of DCs, T cell exhaustion, increase of TREG cells and myeloid-derived suppressor cells (MDSCs) populations and decreased expression of HLA-DR genes in antigen-presenting cells. Thus, during sepsis the immune system turns into two opposite directions, the relative extent of which varies between individuals. Furthermore, the immune response is disturbed by the release of DAMPs that activate PRRs on innate immune cells (Sect. 15.1), i.e., sepsis is associated with a strong activation of innate immunity.
20.3 Emerging Microbial Pathogens Some 30,000 years ago humans begun to domesticate different animal species, such as dogs, cattle, sheep, pigs and chicken and some 12,000 years ago they started agriculture (Fig. 20.7). Until then, humans lived in smaller groups, i.e., the risk of getting infected or spreading an infection was low. However, microbe infections became far more likely, when humans had close contacts with domesticated animal species as well as with rodents or wild birds and lived at higher densities in villages and cities. At latest from that time on pathogenic microbes belong to the strongest evolutionary drivers of our species. However, evolutionary adaption, e.g., developing resistance against a pathogen based on the selection of advantageous genetic variations, takes many generations. When more than 2000 years ago transcontinental trade connected Europe with Asia and Africa and in particular when 500 years ago the Americans were colonized by Europeans, previously isolated human populations came in contact with each other. For example, Europeans had the chance to adapt to smallpox (Variola major) infections, while the bacterial pathogen was completely unknown to the Native American population. In consequence, millions of the latter died following the rediscovery of the Americas in 1492 by Columbus. Thus, pathogenic microbes have the highest risk to kill human hosts, when there is no time for a genetic adaptation. This had been the case 1918 with influenza (Sect. 21.3) and todays with SARS-CoV-2 (Sect. 21.4). Moreover, high population densities and intensive contact between basically all human populations, as caused by massive global trade and pleasure travel, i.e., globalization, further increase the risk. Since viral pathogens are in
334
20 Immunity to Bacterial Pathogens and the Microbiome
Malaria Tuberculosis Smallpox Leprosy Cholera
~ 200,000 years ago
~ 100,000 - 50,000 years ago
12,000 years ago
AIDS
COVID-19
2,200 500 Today years ago years ago
Modern hu- Migrations Migrations Early agriculture Silk road links out (neolithic demo- Africa, Europe mans emerge within of Africa graphic transition in Africa Africa and Asia
European colonization of Am- Globalization erica begins
Fig. 20.7 Emerging microbial pathogens during human history. A time line of key events in the history of Homo sapiens of the past 200,000 years relates to the estimate time period when the listed major infectious diseases emerged
average far more contagious and reassort their genomes more rapidly than bacteria, in the past 100 years primarily viral infectious diseases, such as influenza, AIDS and COVID-19, were the cause of major pandemics (Table 14.2). Pandemics develop in particular when herd immunity of the population did not yet establish. Microbes that cause human diseases must have existed in a different environment or species before they infected us. The oldest known infectious disease of humans, malaria, is caused by unicellular Plasmodium parasites (Box 20.6) and needs mosquitoes as an intermediate host, i.e., malaria-infected persons are not infectious to other humans. In humans, Plasmodium lives preferentially inside of erythrocytes and hepatocytes. Malaria exists only in regions with a warm climate, such as in tropical Africa, Asia and America, where mosquitoes of the genera Culex and Anopheles are found. Since both the parasite and its vector are rapidly evolving, there is still no effective vaccination against malaria. The co-evolution of humans and Plasmodium parasites made malaria a chronic infectious disease but does not kill adult hosts that have a potent immune system. Nevertheless, annually hundreds of thousand young children, who have not finished the development of their immune system (Box 16.1), die from malaria. Moreover, in adults, chronic infectious disease, such as malaria, tuberculosis and leprosy, as well as parasitic worms (Sect. 23.2) impair fertility, growth, cognitive development and nutrition. Box 20.6: Immunity Against Parasites Parasites are unicellular protozoa, multicellular worms (helminths) and ectoparasites, such as ticks and mites. Parasites enter our body mostly via bites from their intermediate hosts, such as insects or snails. Parasitic infections are often chronic, since the response of the innate immune system to them is rather weak and the parasites usually evade or resist effector functions of the adaptive immune system. For example, protozoa often survive inside macrophages and do not get destroyed by phagocytosis, while helminths can become resistant against the attack with microbicidal
20.3 Emerging Microbial Pathogens
335
molecules secreted by eosinophiles. Intracellular protozoa can be eliminated by cell-mediated immunity via TH 1 cells (type 1 immune response), while the TH 2 response is the major mechanism in the fight against helminths (type 2 immune response, Sect. 23.2). The master example for a host–pathogen co-evolution is tuberculosis, which is caused by Mycobacterium tuberculosis infections. This started some 70,000 years ago in East Africa and spread around the world by human migration. Only some 10% of infected individuals develop an active disease, i.e., the intracellular bacterium has adapted well not to harm its host too much. As we will discuss in more detail in context of the virome (Sect. 21.2), this is an important precondition for a chronic infectious disease. Nevertheless, due its widespread distribution the yearly death toll of tuberculosis is more than a million individuals (Fig. 1.1), most of which are immunocompromised, e.g., by HIV-1 infection, old age or other impairments. Then tuberculosis causes chronic cough, fever, sustained weight loss, wasting and coughing up blood or blood-stained mucus. In the past, a typical treatment of tuberculosis was the exposure with UV-B, which increases the endogenous production of vitamin D3 (Sect. 5.5). It had been estimated that in human history no other pathogen killed more persons than Mycobacterium tuberculosis (more than a billion individuals). Moreover, at present some 2 billion people are hosts for the intracellular bacterium, i.e., more than ever. The success of Mycobacterium tuberculosis in its adaption to the human body is related to the fact that it lacks classical bacterial virulence factors, such as capsules for avoiding phagocytosis, exotoxins to poison the host, pili for adherence to host cells or flagella for motility. Mycobacterium tuberculosis behaves different to commensal pathogens that may be found in human mucosa. The latter got in contact with humans far later than Mycobacteria and cause diseases, such as pneumonia or diphtheria, with questionable benefit for the microbe’s evolutionary survival. Mycobacterium tuberculosis carries on its surface the masking lipid phthiocerol dimycocerosate that hides PAMPs, so that the bacterium is not detected by microbicidal macrophages. In parallel, a recruiting surface lipid, phenolic glycolipid, induces via the chemokine CCL2 the recruitment of permissive macrophages. Permissive macrophage are cells that ingest the bacteria but are unable to eliminate them by phagocytosis, because the fusion of phagosomes with lysosomes is disabled and the bacteria break out into the cytoplasma. Mycobacterium tuberculosis does not compete with other pathogens for a niche in the upper airways but uses permissive macrophages, in order to circumvent host defenses and to reach the lower airways (Fig. 20.8). In the lower parts of the lung, the infected macrophages recruit further macrophages that get also infected, i.e., an inflammatory response is initiated. In this aggregate of macrophages, called granuloma, the membranes of the infected cells form tight contacts like epithelial cells. Thus, granulomas are niches, in which Mycobacterium tuberculosis survives and replicates, as long the adaptive immune response via TH 1 cells secreting IFNγ
336
20 Immunity to Bacterial Pathogens and the Microbiome
(Sect. 19.3) is not effective enough to initiate the completion of phagocytosis within the infected macrophages.
Macrophage with engulfed M. tuberculosis
a d
The transmission cycle
b
c
Granuloma
Fig. 20.8 Transmission cycle of tuberculosis. An infection with Mycobacterium tuberculosis is initiated by fine aerosol droplets containing 1–3 bacteria, which are coughed up by an individual with active disease and inhaled by a new host (a). The bacteria use the strategy to recruit and enter permissive macrophages, which transport them to the lower airways (b). There a granuloma is formed through the recruitment of further macrophages and other immune cells to the original infected macrophages (c). In this way, the bacterium can replicate and spread to additional host cells. However, the granuloma reduces bacterial growth in response to T cells of the adaptive immune system. When the infected macrophages in the granuloma undergo necrosis and form a necrotic core (d), bacterial growth is pushed and the disease is activated. Then the next host may be infected by a cough, propelling bacteria into the air (a)
20.4 Immunity to the Microbiome
337
Granuloma can occur at different sites of the body also with other intracellular bacteria, such as Mycobacterium leprae causing leprosy. The inflammatory reaction of the host at the granuloma localizes the bacteria and aims to prevent their spread. Nevertheless, granuloma often cause severe functional impairment via necrosis and fibrosis of the infected tissues. Mycobacterium tuberculosis can survive for years in granuloma and in this latency phase the host is clinically asymptomatic and not contagious. However, when due to overload with bacteria or when the individuum gets immunosuppressed, infected macrophages die by apoptosis or necrosis, some of the bacteria are liberated and start to replicate while new macrophages are recruited to the granuloma and get infected. Patients with this active form of tuberculosis carry a number of granuloma with necrotic cores, around which cells of the innate and adaptive immune system are aggregated. When these granuloma break down, they release bacteria into the lungs and the patient coughs out small aerosol droplets containing only one to three bacteria each. The hydrophobic surface of the bacteria is responsible for this infection strategy, which is more effective than a smaller number of larger droplets each carrying thousands of bacteria. When the small droplets are inhaled by other persons, a new infection cycle starts. Mycobacterium leprae survives in Schwann cells of the peripheral nervous system. Therefore, leprosy leads to the damage of nerves and the patients do not feel pain, so that repeated unnoticed wounds cause the loss of parts of their extremities. Until 500 years ago leprosy was endemic in Europe and today still is a major public health burden in India, China and Southern America. Both Mycobacteria strains originate from non-pathogenic Mycobacteria of soil dwellers like amoeba that found in humans a new habitat. In this way, both types of intracellular bacteria clearly differ from most extracellular pathogenic bacteria, such as Yersinia pestis causing plaque, that do not use the human body as permanent host. The regular hosts of Yersinia pestis are rodents and the bacteria enter only by chance those humans that have been bitten by fleas originating from infected rats. In this zoonotic transfer, the human disease plague can be considered as an “accident” of nature, since it does not contribute to the long-term survival of the pathogenic bacteria. Similar principles apply to COVID-19, since the natural host of SARS-CoV-2 are bats and the zoonosis just happened in 2019 (Sect. 21.4).
20.4 Immunity to the Microbiome The symbiosis of prokaryotes and multicellular eukaryotes was and still is an important driver of evolution. Like any other multicellular species also humans carry a microbiome (Box 20.7). This is defined as the community of mostly commensals (i.e., microbes that use food supplied by the internal or external environment of their host) and mutualists (Sect. 20.1) occupying niches of our body and interacting with basically all organs. In contrast to bacterial infections, which represent the transient overgrowth of one specific pathogenic species, such as Variola major (Sect. 20.3), the microbiome functions as an ecological system formed by
338
20 Immunity to Bacterial Pathogens and the Microbiome
a multitude of interacting microbe species that permanently occupy our body and generally contribute to its well-being. The microbiome also comprises small protozoa, archaea, fungi and algae, but we will focus in this section primarily on bacteria. Moreover, the viral microbiome, referred to as virome, will be discussed in Sect. 21.2. Box 20.7: Evolution of the Human Microbiome Bacterial lineages inhabit the gut of humans and their ancestors since millions of years. Therefore, regular gut bacteria are far better adapted to their host then any pathogenic bacteria, such as Mycobacterium tuberculosis (Sect. 20.3). The rapid changes in diet and environment that happened since the onset of industrial revolution some 200 years ago provided a pressure on the genome of humans and those of the bacterial species forming their microbiome. The far shorter generation time of the microbes gave them an advantage in evolutionary adaption. This may be the basis for the significant interindividual differences in the gut microbiome that largely depend on dietary habits, gender, age, residency and disease status. Interestingly, the stomach of humans is far more acidic (pH 1.5) than that of most other species. This has an impact on its microbiome as well as on that of the intestine. Bacteria are found throughout our body but mainly on external and internal surfaces of the gastrointestinal tract, the skin and the oral cavity. The total number of bacteria is in the order of 4 × 10¹³ (Table 20.1) and their total mass is about 200 g. This is very comparable to the 3 × 10¹³ cells forming an adult human body, 83% of which are red blood cells. However, the amount of bacteria in the gastrointestinal track depends on the fasting and feeding state, i.e., it responds dynamically to our eating habits and biorhythm. Due to a low pH in the upper part of the gastrointestinal track, the concentration of bacteria in the stomach, duodenum and jejunum is only 103 –104 /ml, while in the ileum (i.e., the lower part of the small intestine) and in particular in the colon the number of microbes is far higher. Thus, by number and mass most of the human microbiome is localized within the colon. In healthy individuals, proteobacteria, such as Enterobacteria, Lactobacillales and Erysipelotrichales, are found in the nutrient-rich small intestine. In contrast, most nutrients have been resorbed when the diet reaches the colon and only indigestible fibers remain, which are used by Bacteroidetes and Clostridia as energy source. All these gut bacteria live in symbiosis with their human host, since they extract energy from indigestible carbohydrates and produce vitamins, such as vitamin B12 and folate, for the synthesis of which humans lack specialized enzymes. The gut microbiome majorly influences the epigenetic and transcriptional programing of innate immune cells, such as ILCs (Fig. 20.9). The communication of the microbiome and innate immunity works primarily via metabolites, such as tryptophan derivatives and the SCFAs (short chain fatty acids) butyrate, propionate and acetate, which are bacterial fermentation products of fibers. The microbes stimulate
20.4 Immunity to the Microbiome
339
Table 20.1 The human microbiome in numbers Location
Concentration of bacteria
Organ volume or size
Total number of bacteria (x 1012 )
Large intestine (colon)
1011 /ml
400 ml
40
Teeth
1011 /ml
< 10 ml
1
Skin
< 1011 /m2
1.8 m2
0.18
Lower small intestine (ileum)
108 /ml
400 ml
0.1
Saliva
109 /ml
< 100 ml
0.1
Stomach
103 –104 /ml
250–900 ml
0.00000025–0.000009
Upper small intestine (duodenum and jejunum
103 –104 /ml
400 ml
0.0000004–0.000004
via PRRs on the surface of innate immune cells (Sect. 15.1) the NLRP6-associated inflammasome, which leads to the secretion of antimicrobial peptides that control the composition of the microbiome. Moreover, healthy microbiota collaborate with host epithelial cells to maintain the intestinal wall via upregulation of mucus production. In addition, local B cells are stimulated to produce and secrete IgAs into the lumen of the gut. In addition, macrophages are primed for possible inflammatory responses by upregulating IL1B gene expression. In addition, microbe-stimulated DCs activate ILCs via the cytokine IL23, which through IL22 and serum amyloid A proteins induce the differentiation of T cells into TH 17 cells. Furthermore, the microbes influence the balance between TH 1 and TH 2 cells and affect in this way the types of immune response (Sect. 23.5). Interestingly, bacteria species, such as Bacteroides fragilis, can induce via the secretion of SCFAs the development of TREG cells (Sect. 22.1). This has major impact on the tolerance of the host against the presence of a large number of bacteria in the gut and at other sites of the body. Thus, the microbiome influences both innate and adaptive immune cells and majorly contributes to the homeostasis of the immune system. The microbiome plays an important role in the maturation and “education” of immune cells. For example, during vaginal delivery Lactobacillales and Prevotella species of the mother are transferred to the newborn and breast feeding is adding the lineages Bifidobacteria, Staphylococcus and Enterococcus (Fig. 20.10). The introduction of solid food further increases the diversity and functional capacity of the gut microbiome. This gradual transition to a functionally more mature microbiome happens in the same phase of the life (first 3 years), in which the immune system shows rapid development (Box 16.1), i.e., the microbiome appears to be involved in the training of the immune system. Later, sexual maturation during puberty leads to the development of gender-specific microbiomes. In parallel, the microbiome composition shifts from aerobic and facultative anaerobic bacteria to a larger number of anaerobic microbes, such as Bacteroidetes and Firmicutes. Finally, adults have developed a stable core microbiome, which, however, shows large interindividual
340
20 Immunity to Bacterial Pathogens and the Microbiome
Intestinal lumen B. fragilis polysaccharide A
Microbiota
SCFAs
Mucus layer
Intestinal epithelial cell
Laminar propria
IL22 Serum amyloid A
IgA CD4+ T cell
Dendritic cell
IL23
ILC3 Plasma cell IL17
Tregcell
IL10
TH17 cell
Fig. 20.9 The microbiome modulates both innate and adaptive immune cells. SCFAs produced by the microbiome mediate the development of TREG cells. In addition, the microbiota stimulate the production of IgAs by B cells. More details are provided in the text
variations in its composition. Nevertheless, the microbiome of healthy adults is rather similar in its functionality. This allows flexibility in the response to challenges provided by infectious diseases as well as by non-infectious disorders. Importantly, the maturation of the microbiome parallels with the development of host organs, such as the intestine but also of the CNS (Box 20.8). During aging the microbiome changes again by shifting to the genera Bacteroides, Alistipes and Parabacteroides. Moreover, in older persons the interindividual variability further increases compared to young adults, reflecting different lifelong habits (Box 20.9). Thus, the gut microbiome significantly contributes to the development and homeostasis of our body. Box 20.8: The Gut-Brain-Microbiome Axis The rather large distance between the gut and the brain does not immediately suggest that both organs are intensively communicating with each other. The vagus nerve, which runs
20.4 Immunity to the Microbiome
Postnatal
Prenatal
In utero “Sterility” hypothesis Presence of microbes? • Semen • Placenta • Umbilical cord blood • Meconium • Low diversity Proteobacteria
341
First 1,000 days
Neonatal period
Early-stage maturation
Vertical transmission • Antibiotic resistance genes
First 2-3 years • Introduction to solid food
Vaginal delivery “Resembles” vaginal microbiome Lactobacillus Prevotella C-section delivery “Resembles” skin microbiome Staphylococcus Corynebacterium Propionibacterium Breast milk Lactobacillus
Microbiome richness
Adulthood
Puberty Sexual maturation mones microbial populations • Establishment of male and female
Resistome • Acquisition of antibiotic resistance genes
Microbiome stability • “Core microbiome” Richness Complexity Flexibility vs. resilience to dietary changes Pregnancy Placenta development Proteobacteria Actinobacteria
trimesters
on physiology?
Staphylococcus Enterococcus Formular milk Alterations in early
colonizers?
Intestinal length Microbial diversity and number Aerobes Anaerobes Host organ maturation
Fig. 20.10 The gut microbiome changes from neonates to adults. Infants start with a relatively simply composed microbiome, but due to nutrition, lifestyle, hormonal changes, immunity and a gut-brain crosstalk the complexity of the microbiome increases by maturation. More details are provided in the text
from the brainstem to the gut controls the digestive process, while peptide hormones secreted by the gut and sensed in the brain influence perception and behavior. Moreover, the gut microbiome interacts with the CNS, so that mental health and neurological development may both shape and be shaped by these bacteria. For example, in the irritable bowel syndrome physical effects, such as constipation and diarrhea, often come along with psychiatric problems, such as anxiety and posttraumatic stress. Digestive discomfort and psychiatric
342
20 Immunity to Bacterial Pathogens and the Microbiome
symptoms are far stronger with a perturbed microbiome than in persons with a healthy microbiome containing probiotic bacteria. The microbiome seems to influence the production of neurotransmitters, such as serotonin, 95% of which is produced in the gut. Changes in the microbiota impede the function of the intestine and alter its signaling to the brain leading to an amplification of the stress response, e.g., against an infection or a food allergen.
Box 20.9: The Aging Immune System Within the aging process, the immune system is remodeled and often declines. This starts as early as after puberty, when the thymus regresses and less naïve T cells are produced (Box 15.3). Moreover, with age the basal inflammatory response increases (inflammaging), i.e., there is significantly more low-grade chronic inflammation (Sect. 15.4). This immune senescence increases not only the risk of acute bacterial and viral infections (Sect. 21.1) but also their mortality rates, such as observed with influenza (Sect. 21.3) and COVID-19 (Sect. 21.4). In parallel, the efficiency of vaccines decreases with age, while latent viruses, such as varicella-zoster virus, are more easily reactivated (Sect. 21.2). Furthermore, a failing immune system is not possible to keep sufficient self-tolerance (Sect. 22.1), which substantially increases the risk for autoimmune diseases (Sect. 23.4). In addition, in the aged immune system the homeostatic equilibrium between the microbiome and the host is disturbed. The reduced bacterial diversity in the microbiome of the elderly may lead to overgrowth of Clostridium difficile, which causes diarrhea. Furthermore, the risk for inflammation-related, non-infectious disorders, such as cancer, CVD, stroke and Alzheimer’s disease, significantly raises, when the immune system is less functional. Since commensal and pathogenic bacteria require similar conditions for their growth in the intestine, they compete with each other for the same niche. For example, commensal bacteria produce antimicrobial peptides and SCFAs that inhibit the growth of other bacterial strains including pathogens, i.e., the presence of regular components of the gut microbiome prevents the colonization with pathogenic microbes. However, pathogens have also developed strategies to overcome colonization resistance of commensals. They counteract to the competition for nutrients by focusing on alternative carbon sources, such as galactose, hexuronates, mannose and ribose, or by using common resources, such as iron, more efficiently. In addition, pathogens often get a growth advantage over commensal bacteria, when through the expression of endotoxins they induce inflammation to the intestine of the host (Sect. 20.1). A treatment of the host with antibiotics, in order to fight against pathogenic bacteria, does also disrupt the commensal microbial community. For example,
20.4 Immunity to the Microbiome
Diet / Fluid intake
Exercise
Bowel movement
343
Infection or Hygiene tion
• Stress • Autism • MS
Genetics
Healthy microbiota
Dysbiosis
Brain
Xenobiotics
Lung
Liver
Adipose tissue
Intestine
Systemic disease
• Asthma
• NAFLD • NASH
• Obesity • Metabolic syndrome
• IBD • Celiac disease
• T1D • Atherosclerosis • Rheumatoid arthritis
Fig. 20.11 Dysbiosis and the risk for disease development. Dysbiosis is influenced by many factors, such as inflammation, infection, diet (which in turn has major impact on bowl movement), amount of exercise, xenobiotics, hygiene and genetic predisposition. Dysbiotic microbiota affect via their metabolites and toxins a large range or intestinal and non-intestinal diseases. NASH = non-alcoholic steatohepatitis
healthy microbiota of the species Bifidobacterium are replaced by the species Ruminococcus. This dysbiosis reduces the ability of healthy microbiota to prevent a future colonization by pathogens and may allow the over proportional growth of indigenous pathobionts, such as Clostridium difficile, i.e., of potentially pathological microbes that under normal circumstances live as a non-harming symbionts. This can cause infectious diarrhea, severe intestinal inflammation and in worst case a septic shock (Sect. 20.2). Dysbiotic microbiota affect the immune system of the host through modulation of inflammasome signaling via metabolites secreted by microbes, disturbing TLR signaling and degrading secreted IgAs. Dysbiosis often gets persistent, i.e., the gut microbiome may not shift to its healthy state. Then it is associated with inflammatory diseases of the intestine, such as the inflammatory bowel diseases (IBDs) Crohn’s disease and ulcerative colitis (Sect. 23.4), as well as of other organs, such as T2D, asthma, obesity, autism and rheumatoid arthritis (Fig. 20.11) (Box 20.10). Thus, a healthy gut microbiome has a large impact on human health.
344
20 Immunity to Bacterial Pathogens and the Microbiome
Box 20.10: Dysbiosis and Diseases Susceptibility Many common disorders, such as different elements of the metabolic syndrome, cancer and Alzheimer’s disease, are associated with chronic inflammation. The latter is often modulated by the microbiome, in particular when it has developed dysbiosis. For example, in obesity the low-grade inflammation of adipose tissue is based on its recruitment of inflammatory cells, which had been primed by signals of the microbiome. Similarly, macrophages involved in tumor-associated inflammation may have received their first signals from microbial metabolites and toxins. This affects in particular colon cancer but applies also to cancers in other organs. Importantly, also diseases of the CNS, such as autism spectrum disorders, are affected by the microbiome, when it is in dysbiosis. Thus, the individual’s microbiome in its healthy state as well as in dysbiosis is an important predictor for diseases susceptibility.
(Clinical) Conclusion: The effector mechanisms of the immune system against microbe infections are often so strong that they cause more collateral damage to the host than the microbe itself. The more recent the first encounter with a pathogenic microbe is, the stronger the reaction of the immune system. In contrast, mutualistic bacteria of the microbiome are tolerated by the immune system and mostly have a beneficial effect on the latter.
Additional Reading Cadena, A. M., Fortune, S. M., & Flynn, J. L. (2017). Heterogeneity in tuberculosis. Nature Reviews Immunology, 17, 691–702. Eckhardt, M., Hultquist, J. F., Kaake, R. M., Huttenhain, R., & Krogan, N. J. (2020). A systems approach to infectious disease. Nature Reviews Genetics, 21, 339–354. Hall, A. B., Tolonen, A. C., & Xavier, R. J. (2017). Human genetic variation and the gut microbiome in disease. Nature Reviews Genetics, 18, 690–699. Kundu, P., Blacher, E., Elinav, E., & Pettersson, S. (2017). Our gut microbiome: The evolving inner self. Cell, 171, 1481–1493. Levy, M., Kolodziejczyk, A. A., Thaiss, C. A., & Elinav, E. (2017). Dysbiosis and the immune system. Nature Reviews Immunology, 17, 219–232. van der Poll, T., van de Veerdonk, F. L., Scicluna, B. P., & Netea, M. G. (2017). The immunopathology of sepsis and potential therapeutic targets. Nature Reviews Immunology, 17, 407–420.
Chapter 21
Immunity to Viral Pathogens and the Virome
Abstract In this chapter, we will focus on virus infections and understand how our immune system is combating them. First, we will discuss the principles of the effector functions of innate and adaptive immunity against acute virus infections. Then we will shift to chronic virus infections and realize that each of us carries an individual virome. The latter is formed by dozens of different virus types, many of which are not harming us when we are healthy but may get a problem in an immunocompromised status the context of common diseases. Furthermore, we will learn how microbes can be transferred from different animals to humans and will use influenza virus and SARS-CoV-2 as master examples. Finally, we will elaborate the impact of vaccination against influenza and COVID-19. Keywords Virus infection · Effector mechanism · Chronic virus infection · Virome · Influenza · SARS-CoV-2 · COVID-19 · Vaccination
21.1 Principles of Immune Responses to Viruses Since more than 100 years the majority of newly emerging and reemerging infectious diseases are caused by viruses. More than 200 different virus species are known to infect humans. For their effective replication, viruses often take control on protein synthesis within their host cells. This harms the function of the infected cells and may lead to their lysis when new viral particles are released. In addition, virus infection can stimulate inflammatory responses that cause tissue damage. Viruses can be categorized by the presence or absence of a lipid bilayer cover as enveloped or non-enveloped as well as by the material of their genome as RNA or DNA viruses. Examples of enveloped RNA viruses are Zika virus (Box 21.1), influenza A virus (Sect. 21.3) and SARS-CoV-2 (Sect. 21.4), while poliovirus is a non-enveloped RNA virus. Moreover, vaccinia virus and herpes simplex virus (HSV) are enveloped DNA viruses, whereas adenovirus is a non-enveloped DNA virus. In contrast to other microbes, viruses need a host in order to replicate, i.e., the key point in the life cycle of every virus is, how it enters a host cell. Viruses typically enter cells by receptor-mediated endocytosis, for which they have to bind with sufficiently high © The Author(s), under exclusive license to Springer Nature Switzerland AG 2023 C. Carlberg et al., Molecular Medicine, https://doi.org/10.1007/978-3-031-27133-5_21
345
346
21 Immunity to Viral Pathogens and the Virome
affinity to one or more receptors on the surface of their host cell. For example, HIV-1 binds to the receptor CD4 and therefore has a tropism for TH cells, but also needs the chemokine receptor CCR5 for entering a cell (Box 21.2). Furthermore, influenza A virus uses sialic acid covered receptors on respiratory epithelial cells (Sect. 21.3), while SARS-CoV-2 binds to the receptor angiotensin-converting enzyme 2 (ACE2) on lung alveolar epithelial cells (Sect. 21.4). Box 21.1: Zika Virus Zika is an enveloped RNA virus of the flavivirus family, which is spread by daytime-active mosquitoes. The virus is known since decades, but until 2015 it never caused a human epidemic. However, when a mutation led to a single amino acid change in the external viral glycoprotein, the virus suddenly spread pandemically around the tropical belt. It infected millions of individuals and is able to spread from a pregnant woman to her baby. This can result in microcephaly, severe brain malformations and other birth defects.
Box 21.2: HIV-1 and AIDS The retrovirus HIV-1 started to spread worldwide in the human population since the 1980s and has since then killed more than 37 million individuals. HIV-1 infects and destroys preferentially CD4+ TH cells immune cells and leads in this way to a failure of the immune system, referred to as AIDS. This allows other (chronic) infections, such as tuberculosis, to break out. Less than 100 years ago HIV-1 originated from zoonotic transmission of simian immunodeficiency viruses from African primate species, such as chimpanzees. Interestingly, homozygotic carriers of a 32 base pair-deletion in the CCR5 gene cannot be infected by HIV-1. The infection with a virus means for the immune system the sudden appearance of a new structure, to which the effector functions of innate and adaptive immunity has to respond. The main mechanisms of the innate immune system are the production of type I IFNs (Box 21.3) and the induction of apoptosis to virusinfected cells by NK cells (Fig. 21.1a). INFs are produced by cells that sense via TLR3, TLR7, TLR8 or TLR9 in their endosomes the presence of viral RNA or DNA (Sect. 15.1). In parallel, also cytoplasmatic PRRs of the RLR family recognize nucleic acids of viruses that managed to escape into the cytoplasma (Fig. 15.1). In both cases signal transduction pathways are initiated and converge in the activation of the transcription factors IRF1, IRF3 and IRF7, which together regulate 300– 1,000 genes. Major target genes encode for type I IFNs, which inhibit the replication of viral genomes via the activation of proteins of the restriction factor family. Moreover, other target genes booster NK cells as well as the adaptive immune system. An immune evasive mechanism of viruses is the downregulation of MHC I proteins or the
21.1 Principles of Immune Responses to Viruses
347
prevention of peptide antigen presentation on these receptors (Sect. 18.3) (Box 21.4). Therefore, the cells are not recognized by cytotoxic T cells but preferentially killed by NK cells that act independent of MHC proteins and use PRRs, such as KIRs, FcγRIIIA and C-type lectin receptors. Box 21.3: Type I INFs The main function of this cytokine family (composed of 13 variants of IFNα and IFNβ) is to mediate the early responses of the innate immune system against viral infections. Accordingly, the strongest stimulus for the production of type I INFs are viral RNA or DNA genomes, which are detected by PRRs in endosomes and the cytoplasma of virus-infected cells. Since the receptor for type I INFs is found on all nucleated cells, the cytokines are able to inform in a paracrine fashion all neighboring non-infected cells about the presence of viruses, so that they can switch into an antiviral state. Moreover, INFs cause the sequestration of lymphocytes in lymph nodes, increase the cytotoxicity of NK cells and cytotoxic T cells, promote the differentiation TH 1 cells and upregulate MHC I protein expression.
Box 21.4: Immune Evasion by Viruses The genome of RNA viruses, such as influenza viruses, flaviviruses, enteroviruses and coronaviruses, is rapidly evolving, since the viruses do not use any error correction or repair mechanism during the replication of their genome. This leads to frequent changes in the amino acid sequence and structure of viral surface proteins. Since the latter are most commonly serve as antigens, the viruses are no longer targets of immune responses, in particular by those that are mediated by antibodies. Point mutations and other minor changes in the viral genome lead to an antigenic drift, e.g., in rhinoviruses that cause the common cold as well as in HIV-1. In contrast, reassortments of whole segments of the viral genomes cause an antigenic shift, e.g., in the case of the influenza A virus (Sect. 21.3). Another viral immune evasion mechanism is the inhibition of the production of type I INFs by host cells, as it commonly occurs by all types of coronaviruses (Sect. 21.4). Furthermore, some viruses inhibit the presentation of peptides from cytoplasmatic proteins on MHC I proteins, which reduces the recognition of virus-infected cells by cytotoxic T cells. In addition, some viruses, such as EBV (Epstein-Barr virus), produce mimics of cytokines or chemokines, so that their receptors are antagonistically blocked and respective immune cells are not activated. The main effector function of the adaptive immune system against viruses are antibodies that neutralize the virus by binding to its envelop or capsid (Sect. 16.1). In this way, extracellular viruses are blocked to bind surface receptors and cannot enter
348
21 Immunity to Viral Pathogens and the Virome
a
Innate immune response
Adaptive immune memory
Type I IFNs
B cell
Antibodies Protection against infection
Neutralization
Antiviral state Cytotoxic T cells
NK cell
Infected cell
Infected cell
Magnitude of response/infection
b
Eradication of established infection
Killing of infected cell
Killing of infected cell NK cells
cytotoxic T cells
Type I IFNs
Antibodies
Virus titer
2
4
6
8
10
12
Days after viral infection
Fig. 21.1 The response of the innate and adaptive immune system against virus infections. The innate and adaptive immune system use different mechanisms to prevent and eradicate virus infections (a). Time course of main effector functions of innate and adaptive immunity after infection with a virus (b) More details are provided by the text
21.2 Chronic Virus Infections and Emerging Viral Pathogens
349
host cells. High affinity antibodies that are the result of affinity maturation of B cells in germinal centers (Sect. 17.3) are most suited for effective neutralization of viruses. Moreover, for the protection of viral infections of the mucosa-covered respiratory or intestinal tract, IgAs are most potent. Thus, vaccinations against viral diseases aim to induce the production of IgAs. However, when antiviral antibodies are captured by FcRs on the surface of macrophages and other cells of the innate immune system, the entry of the virus may even be facilitated. This antibody-mediated enhancement can increase lung inflammation, e.g., in the context of an infection with SARS-CoV-2 (Sect. 21.4). When viruses are intracellular, killing of virus-infected cells by cytotoxic T cells is the only possibility to eliminate the microbes. Therefore, the main function of cytotoxic T cells is the surveillance of the body for possible virus-infected cells (Sect. 19.4). However, virus-infected cells can only be detected and eliminated by cytotoxic T cells, when peptides originating from viral proteins are presented by MHC I proteins. The typical time course of a viral infection starts with the production of type I INFs, which peak already 2 days after onset of infection and is followed by NK cell proliferation with a maximum at days 3–4 (Fig. 21.1b). However, in most cases the virus titer does not decline before virus-specific cytotoxic T cells achieve highest counts after day 7 and virus-specific antibodies reach their maximal titer at days 9– 10. When the virus is eliminated, the immune system returns to homeostasis and only a few hundred virus-specific memory B and T cells remain. However, sometimes the immune system does not manage to eliminate all viruses. This leads to a chronic viral infection, i.e., the persistence of the viral antigens (Sect. 21.2). After the initial typical response, the immune system may either return to homeostasis “accepting” the presence of the viral antigen on a constant, rather high level or it stays permanently alert and the viral titers are fluctuating in waves, e.g., due to an antigenic drift as observed with influenza virus infections (Sect. 21.3). Another possibility is that the viral antigen titer increases very slowly, so that there is no or only very weak response of the immune system. An important parameter in these scenarios is how the antigen titers change over time. This does not only apply to viral infections, but also to other immune responses, such as in chronic autoimmune diseases like systemic lupus erythematosus (SLE) and MS (Sects. 23.3 and 23.4).
21.2 Chronic Virus Infections and Emerging Viral Pathogens Viruses that were emerging rather recently in the human population, such as influenza virus (Sect. 21.3) and SARS-CoV-2 (Sect. 21.4), had no time to adopt to us as a host. They cause in some individuals severe illness or may even kill them, while in the majority of the infected persons they are cleared within 1–2 weeks by effector functions of the immune system. The viruses did not establish a stable relationship with their new host and can only survive when they manage to jump over to a new
350
21 Immunity to Viral Pathogens and the Virome
host before the first host either dies or has eliminated them. In contrast, nearly 9% of our genome is composed of retrovirus sequences (Box 1.3) i.e., in the past many viruses managed to persist in our ancestors. Moreover, some viruses, such as the eight human herpesviruses, have a common ancestor in birds, reptiles and mammals, indicating joined co-evolution of these viruses and their hosts. When during an acute viral infection, the effector functions of the immune system are insufficient and/or immune evasive mechanisms of the virus are very potent, the infection cannot be resolved. In extreme case, this may have devastating consequences and the host may die. However, often the viruses just hide in niches, such as neurons, hematopoietic cells or stem cells. Then effector functions of the immune system and the actions of the virus get into an equilibrium, so that the infection becomes chronic (Fig. 21.2). The continuous presence of viral antigens during chronic infections sometimes leads to T cell exhaustion and/or anergy (Box 21.5). Thus, in chronic infections the immune system adjusts to the presence of the virus and its effects, such as causing a chronic inflammation. In this case, excessive damage of infected cells and tissues is prevented and viral replication is restricted to an acceptable level. However, the equilibrium between the actions of the host immune system and the virus is meta-stable and can become dangerous but also benign or even symbiotic. Chronic viruses form our virome, which is part of the microbiome (Sect. 20.4). Thus, in a similar way as the gut microbiome trains the immune system, also the virome interacts with innate and adaptive immunity. Box 21.5: T Cell Exhaustion The progressive loss of effector function of cytotoxic T cells during chronic viral infections is referred as exhaustion. The term “exhaustion” implies that first a normal T cell response developed but it then declined. In contrast, in tolerance anergic T cells fail to develop effector function (Sect. 22.1). Exhaustion may have developed, in order to limit collateral tissue damage due to persistent T cell activity. For example, exhaustion of cytotoxic T cells is due to the persistence of their antigen and based on changes in their epigenome and transcriptome. These changes result in the overexpression of inhibitory receptors, such as PDCD1, altered expression of transcription factors, changes in signal transduction and downregulation of key metabolic genes, so that the T cells are unable to clear their antigen. Blocking PDCD1 by a monoclonal antibody (Sect. 33.3) reverses the exhaustion. Antigens stimulate the clonal expansion of naïve cytotoxic T cells, i.e., the growth of antigen-recognizing T cell subsets. This is followed by cellular differentiation, which activates a network of effector genes, such as those encoding for cytokines, via the demethylation of their genomic regions. The resulting effector T cells are able to eliminate directly and indirectly antigen-presenting cell. Anergy is an epigenetically induced dysfunctional state of T cells that often occurs during prolonged exposure to an antigen, such as in cancer and in chronic infections. This results in de novo DNA methylation of effector genes and their inactivation, i.e., exhausted
21.2 Chronic Virus Infections and Emerging Viral Pathogens
Viral strategies • Rapid replication • Immune evasion and subversion • Immune privilege • Tissue damage • Viral adaptation (genetic, mutation)
351
Immune strategies Acute infection • Entry • Primary replication • Spread • Secondary replication • Tissue damage • Shedding
• Innate immunity • Antigen presentation • Cytokines • Clonal expansion of lymphocytes mechanisms • Regulatory cell interactions
Decision point
Recovery
Chronic infection
• Clearance of damaged cells • Elimination of virus • Re-establish immune system • Re-establish homeostasis
Immune strategies cells • T cell memory • B cell memory • Remodeling lymphoid tissues
• Continuous/intermittend antigen • Tissue damage • Altered immune system • Altered homeostasis
Viral strategies • Continuous replication • Latency
regulation • Mutation • Immunoprivilege
• Dampen responses • Chronic activation • Immunopathology • Lymphocyte function/dysfunction • Repertoire contraction
Fig. 21.2 Acute versus chronic viral infection. An acute viral infection represents nonequilibrium phase of competition between the strategies of the virus and the host immune response. When the host dominates the infection, it is either cleared and the host recovers or it may become chronic. In the latter case the virus may get latent or a metastable equilibrium between viral and host strategies is established. More details are provided in the text
352
21 Immunity to Viral Pathogens and the Virome
T cells show no further immune response. The methylation of the effector genes can be blocked and may be reversed by the application of a demethylating agent, such as decitabine (Sect. 13.2). The majority of us is permanently infected by more than 10 types of chronic viruses. Most of these are DNA viruses, such as HSV, cytomegalovirus (CMV), EBV and varicella-zoster virus (VZV) (Table 21.1). In addition, anelloviruses and adenoassociated viruses infect most humans by the end of their childhood and respective integrated viral sequences are found in the genome of many individuals. In these infections the viral genome persists in host cells but the productive replicative cycle is not lytic but latent, i.e., no infectious virus is produced. Latent viruses are most successful in long-lived cells, such as HSV and VZV in neurons, CMV in HSCs as well as HIV-1 and EBV in memory T and B cells. In many cases these latent viruses do not produce any obvious symptoms. However, the viruses can become activated and replicate, in particular, when the immune system is weakened, e.g., when an individual is immunocompromised. The strategy of latent viruses is comparable to that of Mycobacterium tuberculosis, which at present survives in some 2 billion individuals, while it causes only in some 10% of them an active disease (Sect. 20.3). The human metagenome does not only comprise the human genome but also the genomes of all eukaryotic (parasites), bacterial and viral species that form our microbiome. The different components of the microbiome influence each other while Table 21.1 Chronic human virus infections. Viruses that affect at least 50% of human populations are listed Virus type
Infection rate (%) in human populations
Major sites of persistence
Chronic disease in normal individuals
Endogenous retroviruses
100
All cells
Unknown
Anelloviruses
90–100
Many tissues
Unknown
Human herpesviruses 6 and 7
> 90
Lymphocytes
Unknown
VZV
> 90
Sensory ganglia neurons, lymphocytes
Herpes zoster
CMV
80–90
Myelomonocytic cells
Rare
EBV
80–90
Pharyngeal epithelial cells, B cells
Burkitt’s lymphoma, non-Hodgkin’s lymphoma
Polyomaviruses BK and JC
72–98
Kidneys
Unknown
Adeno-associated virus
60–90
Many tissues
Unknown
HSV-1
50–70
Sensory ganglia neurons
Cold sores, encephalitis, keratitis
Adenovirus
Upto 80
Adenoids, tonsils, lymphocytes
Unknown
21.2 Chronic Virus Infections and Emerging Viral Pathogens
353
they interact with their host in health as well as in disease (Fig. 21.3). As individuals differ in their gut microbiome (Sect. 20.4), they also have their personal virome. Therefore, each of us is experiencing an individual training of the immune system by all components of the metagenome. This extends the one-microbe-onedisease paradigm to a multimicrobe-based understanding of diseases and explains the different immunophenotypes (Box 21.6) of individuals. For example, dysbiosis of the bacterial arm of the microbiome, which is caused by the widespread use of antibiotics, significantly increased the rate of autoimmune diseases (Sect. 23.4), while the presence of helminths provides resistance against them. This observation also relates to the increase of allergies in developed countries, which have high antibiotic use and absence of helminths and is summarized as the hygiene concept (Sect. 23.2). Thus, the competence to respond to immune challenges, as provided by microbe infections but also by non-transferable disorders, such as cancer, diabetes and Alzheimer’s disease, is largely dependent on the status of our metagenome. Since chronic CMV infections affect the immune senescence of T cells, even aging is affected by the individual’s immunophenotype.
Latent herpesvirus confers resistance to bacterial infections
Bacteria
Pat ho g
Viruses
Susceptibility Microbiome
s en viral infections
on
s
Antibiotics Dysbiosis reshape linked to community obesity, asthma
Disease
li Vira
nf e
ct
i
Virulence
Parasitic infections
Symbiosis
Helminths confer resistance to autoimmune diseases
Eukaryotes
Fig. 21.3 The metagenome in health and disease. This scheme displays the complex interaction of eukaryotic, bacterial and viral components of the microbiome with their human host in health and disease. More details are provided in the text
354
21 Immunity to Viral Pathogens and the Virome
Box 21.6: Immunophenotype The immunophenotype of an individual is represented by the different types and relative number of immune cells in circulation. Immune cells are traditionally described by more than 370 different proteins expressed on their surface, which are part of the CD categorization (Box 15.5). This can be determined by FACS and related techniques on cell suspensions as well as on fresh or fixed tissue. The immunophenotype is used for describing the general competence of the immune system as well as for diagnosis and prognosis of immune related diseases, such as autoimmune diseases (Chap. 23) and cancer (Chap. 24). Individuals vary in their immunophenotype due to variations in the genome and different environmental exposure. There are thousands of known variants, most of which have only a minor contribution to the immunophenotype, but together they may explain 50% of the individual’s immune response and risk for immunological diseases. The other half is due to age (Box 16.2, see also inflammaging (Sect. 38.1)), gender, environmental exposure, diet and microbiome (Sect. 20.4). All species carry their own type of metagenome, to which they are adapted. When two different species get into close contact, there is the chance that they infect each other with their viruses or other microbes. A microbe that is well adapted, i.e., symptom-less, to one species may cause severe illness in another species that had not experienced this microbe before. The recent transfer of SARS-CoV-2 from bats to humans at the wet market in Wuhan (China) is a master example of this concept (Sect. 21.4). In general, zoonotic transmission between other species and humans can be distinguished in five different stages (Fig. 21.4). Stage 1 represents probably the majority of all microbes, which are specific to one non-human species and have not yet been transferred to humans. This stage unfortunately provides a large repertoire of possibilities for future zoonotic transmissions to humans. Microbes of stage 2, such as those causing anthrax (Bacillus anthracis) or rabies (rabies virus), can infect humans that eat meat from infected animals or get bitten by them. However, the microbes cannot be transferred from one infected individual to another person. In stage 3 pathogenic microbes from animals, such as Marburg and Ebola virus (Box 21.7), manage a few cycles of transmissions between humans but do not establish themselves over longer time in a human population, i.e., they cause only to short outbreaks. Stage 4 depicts animal diseases, such as avian influenza (Sect. 21.3), yellow fewer and dengue fever from mosquitoes, that often perform zoonotic transmission to humans and other animal species, such as farm poultry and pigs in case of influenza. The microbes are stable for many infection cycles between humans and can lead to larger outbreaks. Finally, stage 5 describes infectious diseases, such as measles, mumps and syphilis, that spread between humans without the involvement of other species. However, they still origin from animals but their zoonotic transmission was long time ago.
21.2 Chronic Virus Infections and Emerging Viral Pathogens
355
Stage
Transmission to humans
Stage 5: exlusive human agent
Only from humans
Stage 4: long outbreak
From animals or (many cycles) humans
Stage 3: limited outbreak
From animals or (few cycles) humans
Stage 2: primary infection
Only from animals
Stage 1: exlusive animal agent
None
Rabies virus
Ebola virus Dengue virus
HIV1
Fig. 21.4 Stages of zoonotic transmission of animal pathogens to humans. Details are provided in the text
Box 21.7: Ebola Virus Ebola virus is a member of the filovirus family of enveloped RNA viruses, to which also Marburg virus belongs. Filoviruses are occasionally transmitted by zoonosis from fruit bats to humans and other mammals. Human pathogenic filoviruses appeared so far only in equatorial Africa, i.e., outbreaks are restricted to local regions in this part of the world. A clinical hallmark of filovirus infections is a hemorrhagic fever, i.e., bleeding internally and externally due to decreased blood clotting. In average 50% of the infected persons die within a few days to weeks after infection, i.e., Ebola is a very deadly disease. Ebola virus is transmitted via virus-contaminated bodily secretions, i.e., person touching contaminated fluids or surfaces in nursing care, burial services etc. are frequently infected.
356
21 Immunity to Viral Pathogens and the Virome
21.3 Influenza Every year one billion individuals are infected by seasonal influenza, which results in 3–5 million cases of severe illness and 300,000–500,000 deaths worldwide. Like in many other infectious diseases, morbidity and mortality of influenza infection is significantly increased in older age. Accordingly, 90% of the influenza deaths are elderly (>65 years of age), probably because they have a drastically decreased thymic output (Sect. 16.1). The recurrence of the epidemic is based on the efficient transmission of the virus between humans via respiratory droplets, direct contact and contaminated surfaces. Outbreaks of influenza occur in the winter months, when transmission is favored by low temperatures and humidity. The symptoms of influenza range from milder effects on the upper respiratory tract, such as sore throat, fever, cough, running nose, headache, muscle pain and fatigue to lethal pneumonia due to high levels of viral replication in the lower respiratory tract in combination with a cytokine storm or secondary bacterial infections. Moreover, there can also be complications of the heart, CNS and other organs. Influenza viruses belong to the family of orthomyxoviruses of enveloped RNA viruses. The genome of influenza viruses A and B is formed by eight segments of single-stranded RNA, which allows a rapid antigenic drift and shift of the virus (Box 21.4). For the major glycoproteins on the viral envelop, hemagglutinin and neuraminidase, 18 and 11 subtypes are known in various species. They are the major determinants for the different strains of the influenza A virus (Fig. 21.5). For example, the “Spanish flu” (Box 21.8) of 1918 was based on the strain H1N1. The following pandemics of the years 1957, 1968 and 2009 were caused by the strains H2N2, H3N2 and H1N1, respectively. Importantly, the H1N1 variant caused between 1919 and begin of the 1950s several epidemics until it was replaced by the strain H2N2. Moreover, highly pathogenic (60% fatality rate) H5N1 infections occurred during the past decades, but only occasional human-to-human transmissions were observed, which prevented the outbreak of pandemics. The influenza B strains circulates in humans since at least 80 years but has no animal reservoir as well as strains C and D that do not cause major disease in humans. Box 21.8. Spanish Flu The influenza A virus strain H1N1 pandemic of the years 1918 to 1920 was with 50 million deaths (translating to 200 million victims in the present world population) the largest ever (Table 14.2). Although influenza A viruses circulate in human populations since at least 2,000 years, this pandemic was particularly lethal even to the young population, because: • the hemagglutinin protein was unusually cytopathic and immunopathogenic compared to previous strains • coinfections with pneumopathogenic bacteria caused fatal bacterial bronchopneumonia.
21.3 Influenza
357
8 genome segments, most important encoded proteins: Hemagglutinin (HA) (18 subtypes, H1 - H18) Neuramidase (NA) (11 subtypes, N1 - N11) Nomenclature: Animal/place/no/year HA
NA
M1 matrix protein
NEP nuclear export protein
Examples: A/Fujian/411/92 (H3N2) A/Hong Kong/156/97 (H5N1)
M2 ion channel
H1N1 H3N2 H1N1
? 1918
H2N2 1957
H1N1 1968
1977
2009
Fig. 21.5 Influenza virus. The genome of influenza A virus is composed of eight ribonucleoprotein complexes that encode for RNA polymerase subunits, the glycoproteins hemagglutinin (HA) and neuraminidase (NA), the viral nucleoprotein (NP), the matrix protein M1, the membrane protein M2, the nonstructural protein NS1 and the nuclear export protein (NEP) (left). The 18 variants of HA and the 11 variants of NA determine the “flu alphabet” of influenza virus strains (right). A time line describes the main virus strains causing pandemics and seasonal outbreaks of the disease (bottom)
The pandemic had three major waves: the first wave in spring 1918 (fatality rate 0.5%), autumn 1918 (fatality rate 2.5%) and winter 1918/19 (fatality rate 1%). Of note, the pandemic was called “Spanish flu”, because newspapers in neutral Spain were the first to report about the disease, while most other affected countries participated in World War I and did not allow their press to spread the news. Thus, the pandemic did not originate from Spain but was probably imported to the US by guest works from China and then spread by hundreds to thousands of US American soldiers that had been shipped to the battlefields in Europe.
358
21 Immunity to Viral Pathogens and the Virome
Influenza viruses enter the human body via oral and nasal cavities and settle on the epithelial mucosa of the respiratory tract. When the virus successfully passes the mucosa, it spreads both to epithelial cells, where the virus is effectively replicating and immune cells, such as macrophages and DCs. The hemagglutinin protein binds to sialic acid on the surface of host cells and induces the fusion of the viral envelop with the cellular membrane. In contrast, the neuraminidase protein allows new virions to leave infected cells by releasing the hemagglutinin-sialic acid contact and facilitating movement through the mucus. The innate immune system detects influenza virus RNA in infected cells via PRRs, such as TLR8, RLR and NLRP3 and initiates the type I INF response of macrophages, DCs and cells of the lung. This induces the antiviral state to neighboring cells and tissues (Sect. 21.1). However, proinflammatory cytokines cause local inflammation in the lung and induce systemic effects, such as fever and anorexia. Moreover, chemokines recruit neutrophils, monocytes (differentiating to macrophages) and NK cells to the airways, which leads to clearance of infected cells by phagocytosis and the induction of apoptosis. Despite these effector functions of innate immune cells, the virus may spread, so that only the adaptive immune system can lead to virus clearance. The homotrimeric hemagglutinin protein complex is the major target of adaptive immune responses, which are mediated by specific antibodies and cytotoxic T cells. The antibody response to influenza infection is robust and often lasts for the rest of the life. However, the antigenic drift of the virus, in particular of the head domain of the hemagglutinin protein, may change the antigen so much that a new immune response needs to be initiated. Since the genome of influenza viruses is segmented, an interchange between two strains, which have infected the same cell, can lead to new assortments, i.e., to an antigenic shift (Fig. 21.6). For example, pigs that are infected at the same time with influenza from chicken and humans (e.g., on a farm, where all three species live in close vicinity), a new strain can be generated that may be more virulent at least for one of the three species. For example, the influenza pandemic of 2009 was caused by a new H1N1 strain that reassorted in pigs (“swine flu”). The zoonotic origin of influenza A viruses has been wild birds, in particular migratory ducks and geese. The transmission to other species, such as marine mammals, domestic ducks and further poultry, may be primarily via contaminated water. Also, other species, such as pigs, horses, dogs, cats and finally humans, can be infected via aerosols as well as contaminated surfaces and water. Due to the rapid antigenic shift and drift of influenza viruses, the formulation of vaccines needs to be adapted every six months. The effectiveness of the vaccines varies from year to year. At present, the most common vaccine is a mixture of each two strains of influenza A and B, e.g., the influenza A strains H1N1 and H3N2 as well as the influenza B strains Victoria and Yamagata. Influenza virus vaccines are traditionally produced in embryonated chicken eggs, i.e., live viruses are grown and then chemically inactivated, e.g., by alkylating chemicals, ether or detergents. For an increased yield in virus production, the currently circulating influenza strains are assorted with a highly growing strain (A/Puerto Rico). However, current influenza vaccines do not induce neutralizing antibodies that recognize multiple virus strains, so that antibody-mediated protection is mostly short-lived. In addition, antiviral drugs,
21.4 COVID-19
359
• Water treatment • Biosecurity • Indoor raising
• Stamping out • Decontamination • Movement restrictions • Compensation • Quarantine • Zoning
• Vaccination • Market hygiene • Live market closure
Marine mammals Pigs
?
Wild birds
Domestic ducks
Poultry Humans
Bats Horses
Dogs Transmission via water and contaminated surfaces
Cats
Transmission via aerosols, water and contaminated surfaces
Fig. 21.6 Spreading of influenza A virus between species. Details are provided in the text. Dashed lines represent transmission that bypasses a domestic duck intermediate
such as amantadine and rimantadine targeting the M2 ion channel of the virus or oseltamivir inhibiting the enzymatic activity of the neuraminidase, are used for the prevention and treatment of patients, who are at high risk or severely ill.
21.4 COVID-19 The coronavirus strains HCoV-NL63, HCoV-229E, HCoV-OC43 and HCoV-HKU1 are endemic in humans since a few hundred years. They typically infect the upper
360
21 Immunity to Viral Pathogens and the Virome
respiratory tract and cause in most cases only mild symptoms, such as a common cold. However, since coronaviruses are neurotrophic, in rare cases also encephalitis is observed. Moreover, different types of coronaviruses are found in bats and are able to infect camels, birds, cats, horses, mink, pigs, rabbits, pangolins and other animals. Thus, there is a large variety of species from which zoonotic transmission of coronaviruses to humans can happen. From this animal reservoir, zoonotic transmission of SARS-CoV happened in 2003 probably from civet cat and Middle East respiratory syndrome coronavirus (MERS-CoV) in 2012 from the camel. In this line, SARS-CoV-2 is the youngest member of zoonotic microbes that not only managed its transmission from bats but immediately learned to spread between humans. All three recent coronavirus strains replicate also in the lower respiratory track, where they cause pneumonia that can be fatal. Most likely SARS-CoV-2 will not be the last example of a zoonotic transmission of coronaviruses, i.e., probably sooner than later SARS-CoV-3 will be observed in humans. Since the majority of persons that had been infected with SARS-CoV-2 have no or only mild symptoms, the virus was quickly spreading to basically all countries of the world, which todays are intensively connected by global travel and trade. This was the start of the COVID-19 pandemic that very quickly outnumbered the victims of the SARS-CoV outbreak and the H1N1 swine flu pandemic in 2009 (Sect. 21.3). Coronaviruses are enveloped, single-stranded RNA viruses. The genome of SARS-CoV-2 has a size of 30 kb and encodes for a RNA-dependent RNA polymerase, proteases and structural proteins forming the nucleocapsid as well as the trimeric spike glycoprotein, the envelop protein and the matrix glycoprotein that are all integrated in the envelop. The spike protein binds to ACE2 proteins on the surface of epithelial cells of the upper and lower respiratory track, such as airway epithelial cells, alveolar epithelial cells, vascular endothelial cells and macrophages in the lung. The enzyme TMPRSS2 (transmembrane serine protease 2) on the host membrane cleaves the spike protein and facilitates the entry of the virus into the cells (Fig. 21.7, top left). After replication, multiple copies of the virus are released from infected cells, which then undergo pyroptosis, i.e., an highly inflammatory form of programmed cell death that often occurs with cytopathic viruses (Sect. 15.4). This leads to the release of DAMPs, such as ATP and nucleic acids and triggers in neighboring epithelial cells, endothelial cells and alveolar macrophages the production of proinflammatory cytokines and chemokines, such as IL6, CXCL10, CCL2, CCL3 and CCL4 (Fig. 21.7, top right). Monocytes, macrophages and T cells are attracted to the site of infection and a proinflammatory feedback loop is established. In persons with an overreactive immune system this attracts further immune cells to the lungs and leads to the overproduction of proinflammatory cytokines, such as IL1β, IL6, IL12 and TNF, which cause damage to the lung infrastructure (Fig. 21.7, bottom left). The resulting cytokine storm affects other organs and can lead to their damage and failure. Furthermore, antibody-dependent enhancement by non-neutralizing antibodies intensifies organ damage. Thus, the severity of COVID-19 is rather based on the strong response of the immune system than on any direct effect of the virus. In contrast, in persons with a normal responding immune system (i.e., 80–90% of all infected
21.4 COVID-19
361
ASC oligomer
Airway Viral RNA ACE2
Host DNA IL1
ATP
Epithelial cell Release of virus
TMPRSS2
Virus maturation Virus replication Viral proteins Secretes
Secretes Pyroptosis
Alveolar macrophage
IL6 CCL3 CCL4
CCL2
Positive feedback
CXCL10 IFNγ
T cell Monocyte Macrophage
Endothelial layer
Leakage caused by vascular permeability Alveolar macrophages clear up neutralized virus
Neutralizing antibody binds and inactivates virus
Cytokine storm
No virus release Alveolar macrophages recognize and phagocytose apoptotic cell
CD8+ T cell recognizes and eliminates infected cells
Non-neutralizing antibody may cause antibodydependent enhancement of infection
Dysfunctional immune response: phages and T cells • Systemic cytokine storm • Pulmonary edema and pneumonia
CD4+
Healthy immune response: • Infected cells rapidly cleared • Virus inactivated by neutralizing antibodies
damage
Fig. 21.7 Chronology of SARS-CoV-2 infection. The first two step are virus infection (top left) and inflammation caused by lysed cells (top right). In pre-diseased patients (bottom left) inflammation worsens and leads to a cytokine storm, which causes organ damage and possible failure. In contrast, in individuals with an healthy immune system (bottom right) the inflammation attracts virus-specific cytotoxic T cells, which eliminates virus-infected cells before they can spread the virus
362
21 Immunity to Viral Pathogens and the Virome
individuals) the initial inflammation attracts virus-specific cytotoxic T cells and the infected cells are eliminated before the virus is able to spread (Fig. 21.7, bottom right). Furthermore, neutralizing antibodies block viral infection and alveolar macrophages recognize and clear neutralized viruses as well as apoptotic cells by phagocytosis. This leads to clearance of the virus and only minimal damage to the lung, i.e., in recovery. SARS-CoV-2 spreads primarily via respiratory droplets and contaminated surfaces (Fig. 21.8). The incubation period is 4–5 days before symptoms like cough, fever and fatigue occur. Individuals with only mild symptoms of COVID-19 have a robust type I INF response (Sect. 21.1) as well as virus-specific TH 1 cells and cytotoxic T cells, which results in the rapid clearance of the virus. Children in vast majority have only a mild form of COVID-19, but in rare cases they may present 1–2 months after the infection the multisystem inflammatory syndrome in children (MIS-C), which seems to be an autoimmune disease with over boarding immune reactions. In elderly patients and others that are pre-diseased with cancer, CVD or respiratory disorders, a SARS-CoV-2 infection may worsen 5–10 days after symptom onset and complications occur, such as hypoxia, respiratory failure, acute respiratory distress syndrome and septic shock. In these severe cases of COVID-19, the initial antiviral response of the innate immune system is delayed, which is an immune evasive mechanism of SARS-CoV-2. Then proinflammatory cytokines are secreted, neutrophiles and monocytes move into the lung and initiate there a cytokine storm. The adaptive immune system lacks its initial priming and the viral burden gets very high. This leads to increased vascular permeability and causes respiratory failure, which is the main reason for the fatal cases of COVID-19. In some persons a chronic form of COVID-19 develops, referred to as “long-COVID-19”, showing a mild or severe form depending on the severity of the original disease. The symptoms of long COVID-19 are fatigue, reduced lung capacity and inability to fully exercise or work. The global effort in vaccination against SARS-CoV-2 aims to bring the COVID19 pandemic under control. However, it can be expected that similar to different influenza A virus strains (Sect. 21.3) SARS-CoV-2 will stay endemic with humans. New variants of SARS-CoV-2 (Box 21.9) may emerge both by antigenic drift, i.e., by point mutations of the viral genome, as well as by antigenic shift due assortment with coronaviruses from other species. This may make yearly vaccinations necessary, at least of the endangered part of the population. Box 21.9: SARS-CoV-2 Variants In contrast to stable RNA viruses, such as measles and polioviruses, that exhibit antigenic stability and unchanging serotypes over periods of many years, within less than 2 years SARS-CoV-2 showed already a number of variants. They are characterized by their transmissibility, disease severity and ability to evade humoral immunity. For example, the Alpha and Delta variants of SARS-CoV-2 show increased transmissibility and greater disease severity, while the Beta, Gamma and in particular the Omicron variant display increased transmissibility, since they evade humoral
21.4 COVID-19
363
Transmission
Symptoms Fever, ~ 90% (44% at time of diagnosis) Dry cough, ~ 70% Fatigue, ~ 40% Sputum production, ~ 30%
Transmission
• Distance >2 m • Handwashing • Desinfection • Mask for mouth and nose
Disease severity
Incubation
Shortness of breath, ~ 20% Muscle and joint pain, ~ 15% Sore throat, ~ 14% Headache, ~ 14% Chills, ~ 10% Nausea/Vomiting, ~ 5% Nasal congestion, ~ 5%
depending on age, genomic variations and underlying diseases
Diarrhea, ~ 4% Anosmia
Symptomatic infection
Resolution
Severe Asymptomatic
Fever, cough
Acute respiratory distress syndrome, sepsis, organ failure
Critical Recovery or death
Milde Moderate Viral response Host immune response
Time
Fig. 21.8 Transmission and clinical course of SARS-CoV-2 infections. The virus is spread primarily via aerosols and contaminated surfaces. Patients exhibit fever and dry cough. In addition, they may have difficulty in breathing, muscle and/or joint pain, headache/dizziness, diarrhea, nausea and the coughing up of blood. Severe cases of COVID-19 cases progress to acute respiratory distress syndrome. More details are provided in the text
immunity and cause reinfections. For example, the point mutation D614G in the spike protein increased infectivity. Therefore, it cannot be expected that vaccination against SARS-CoV-2 will last for the rest of the individual’s life, as it is the case for vaccines of measles and polio. The most potent vaccines against SARS-CoV-2 are based on mRNA encoding for viral proteins. Importantly, mRNA vaccines can be rapidly developed, since mutations of emerging virus variants can easily be introduced into the RNA template. Moreover, there is no need to produce and purify larger amounts of protein antigens. The mRNA is encapsulated in lipid nanoparticles that facilitate uptake by cells, such as DCs and also function as adjuvants.
364
21 Immunity to Viral Pathogens and the Virome
In addition to the protection of the individual one other goal of vaccination is to generate herd immunity, i.e., a protection of the whole population. When enough persons in a population are vaccinated and in parallel the vaccination also prevents the infection, the transmission of the pathogenic microbe can be interrupted. However, for highly transmissible pathogens, such as measles and COVID-19, the vaccination rate must be more than 90%. (Clinical) Conclusion: In the past 100–200 years viral infection, often with new emerging viruses, such as SARS-CoV-2, caused major pandemics. It is very likely that this trend will continue and soon further pandemics break out with viruses that jump over from other species to humans. Interestingly, our evolutionary ancestors had been already millions of years ago in contact with viruses, many of which integrated copies of their genome into our genome. Moreover, most of us are permanently infected with a set of some 10 viruses, which at healthy conditions do not cause any symptoms.
Additional Reading Bartleson, J. M., Radenkovic, D., Covarrubias, A. J., Furman, D., Winer, D. A., & Verdin, E. (2021). SARS-CoV-2, COVID-19 and the aging immune system. Nature Aging, 1, 769–782. Castells, M. C., & Phillips, E. J. (2021). Maintaining safety with SARS-CoV-2 vaccines. New England Journal of Medicine, 384, 643–649. Fajgenbaum, D. C., & June, C. H. (2020). Cytokine storm. New England Journal of Medicine, 383, 2255–2273. Krammer, F., Smith, G. J. D., Fouchier, R. A. M., Peiris, M., Kedzierska, K., Doherty, P. C., Palese, P., Shaw, M. L., Treanor, J., Webster, R. G., et al. (2018). Influenza. Nat Rev Dis Primers, 4, 3. Lee, S., Channappanavar, R., & Kanneganti, T. D. (2020). Coronaviruses: Innate immunity, inflammasome activation, inflammatory cell death and cytokines. Trends in Immunology, 41, 1083–1099. Morens, D. M., & Fauci, A. S. (2020). Emerging pandemic diseases: How we got to COVID-19. Cell, 182, 1077–1092. Pulendran, B., & Davis, M. M. (2020). The science and medicine of human immunology. Science, 369. Schultze, J. L., & Aschenbrenner, A. C. (2021). COVID-19 and the human innate immune system. Cell, 184, 1671–1692. Sette, A., & Crotty, S. (2021). Adaptive immunity to SARS-CoV-2 and COVID-19. Cell, 184, 861–880.
Chapter 22
Tolerance and Transplantation Immunology
Abstract In this chapter, we will first discuss about the impact and mechanisms of immunological tolerance, which is differentiated into central and peripheral tolerance. Failure of tolerance is a main contributor to autoimmune and allergic disease. One major mechanism of peripheral tolerance is the action of TREG cells that suppress other self-reactive lymphocytes. Then we will discuss the molecular and cellular basis of transplantation immunology and distinguish between hyperacute, acute and chronic reactions of the host’s immune system against a graft obtained from a different person. Finally, we will explain the molecular mechanisms of immunosuppressive drugs, which are used for the prevention of graft rejections and will discuss their side effects. Keywords Central tolerance · Peripheral tolerance · TREG cells · Transplant rejection · Immunosuppressive drugs · Antiinflammatory drugs
22.1 Central and Peripheral Tolerance Adaptive immunity relies on that mature naïve B and T cells that leave their generative organs, bone marrow and thymus (Sect. 16.2), recognize a wide variety of foreign, i.e., non-self, antigens (also called immunogens), but do not react with their effector mechanisms to the own (self) antigens of the individual. Since the generation of antigen receptors follows random processes of recombination, assembly and editing of respective gene segments (Sect. 16.3), also BCRs and TCRs are created that show high affinity for the individual’s own cells. When such self-reactive B and T cells would reach the periphery, they may cause autoimmune diseases. This is prevented by mechanisms of immunological tolerance. The non-reactivity to self is referred to as tolerance and distinguished into central and peripheral tolerance. Central tolerance (Fig. 22.1, left) happens in the bone marrow and thymus, where immature B and T cells are exposed to self-antigens (also called tolerogens), in order to test the functionality and affinity of their BCRs and TCRs, respectively. However, central tolerance is only effective to 60–70% of self-reactive T cells. Therefore, there is in addition peripheral tolerance (Fig. 22.1, right) taking place in secondary lymphoid © The Author(s), under exclusive license to Springer Nature Switzerland AG 2023 C. Carlberg et al., Molecular Medicine, https://doi.org/10.1007/978-3-031-27133-5_22
365
366
22 Tolerance and Transplantation Immunology
organs, such as the spleen, lymph nodes and mucosal lymphoid tissues. Importantly, whether an antigen acts as an immunogen or a tolerogen, depends on whether it is recognized during lymphocyte maturation in the bone marrow and thymus or in the periphery with or without support of cells of innate immunity (Box 22.1). Box 22.1: Immunogenicity Versus Tolerogenicity The immunogenicity or tolerogenicity of a protein antigen, e.g., for the efficient production of polyclonal antibodies after a vaccination, depends on a number of parameters. Short-lived antigens favor an immune response, while their persistence over longer time leads to tolerance, as it is the case with the antigens of commensal bacteria of the microbiome. Furthermore, subcutaneous application of an antigen like a vaccine is more efficient as its uptake in the mucosa or intravenous injection. Vaccines are often applied in combination with an adjuvant,
Central tolerance
Peripheral tolerance
Generative lymphoid organs (thymus, bone marrow)
Peripheral tissues
Recognition of self antigen
Lymphoid precursors Immature lymphocytes
Development of regulatory T cells (CD4+ T cells only)
Recognition of self antigen
Suppression
Mature lymphocytes
Apoptosis (deletion)
Change in antigen receptors (editing in B cells)
Apoptosis (deletion)
Anergy
Fig. 22.1 Central and peripheral tolerance. Central tolerance (left) is a control mechanism taking place in primary lymphoid organs. Immature B cells in the bone marrow as well as immature T cells in the thymus are selected not to recognize self-antigens. In case of high affinity antigen recognition, the respective lymphocytes are either eliminated by apoptosis, the specificity of their antigen receptor is changed (in case of B cells) or their differentiation to TREG cells is induced (in case of CD4+ T cells). In peripheral tolerance (right) self-reactive mature lymphocytes that escaped central tolerance may either sent to anergy, deleted by apoptosis or suppressed by TREG cells
22.1 Central and Peripheral Tolerance
367
such as aluminum salts, paraffin oils or dead bacteria, in order to increase the immunogenicity, while in their absence costimulators are missing and a tolerogenic response is favored. Finally, the presentation of an antigen, such as a self-antigen, via activated DCs carrying a high amount of costimulators is very immunogenic, while inactive antigen-presenting cells have far lower levels of costimulators and rather cause a tolerogenic response. In the thymus, specialized DCs present via MHC I and MHC II proteins a set of ubiquitous, widely disseminated self-peptides that either are expressed in the thymus or brought there via the blood to immature CD8+ and CD4+ T cells. In contrast, immunogens normally do not reach immune generative organs. Moreover, self-peptides deriving from tissue-specific proteins, such as insulin being produced exclusively by β cells of the pancreas, are often not presented to immature lymphocytes. This increases the risk that B and T cells with high affinity for tissue-restricted self-antigens escape the control mechanisms of central tolerance. Furthermore, medullary thymic epithelial cells test the reactivity of immature T cells to MHC proteins. These cells express the transcription factor AIRE (autoimmune regulator) that has the unusual property to induce the expression of thousands of proteins that are normally tissue-restricted, so that peptides derived from these proteins can be displayed to maturating T cells. Importantly, mutations of the AIRE gene lead to the multiorgan autoimmune disease APS1 (autoimmune polyglandular syndrome type 1). When T cells show via their TCR high affinity for either the presented selfpeptides or MHC proteins, they are eliminated by the induction of the mitochondrial pathway of apoptosis (Sect. 19.4). This process is referred to as deletion or negative selection (Fig. 22.1, left). In net effect only 1% of all cells survive the process of T cell maturation and are allowed to circulate in the periphery. Self-reactive B cells with strong affinity for self-antigens are also eliminated by apoptosis, while cells with a BCR of intermediate affinity for self-antigen may go into a state of anergy (Box 22.4). In anergy the signal transduction within the respective B and T cells is working suboptimal, e.g., due to: • • • •
a block of antigen receptor signaling the lack of active costimulatory receptors no involvement of innate immune cells the presentation of inhibitory receptors, such as CTLA4 and PDCD1 (Sect. 19.1).
Thus, the cells become unresponsive to self-antigens, i.e., they do not develop effector mechanisms after antigen contact but neither get killed. Alternatively, selfreactive BCRs may get edited by recombination of the gene encoding for the light chain (Sect. 16.3) and get tested again for self-reactivity. BCR editing is a common process and applied to 25–50% of all mature B cells released into the periphery. Also in peripheral tolerance (Fig. 22.1, right) self-reactive lymphocytes are either eliminated by apoptosis or anergy is induced to them. This is in particular important
368
22 Tolerance and Transplantation Immunology
for B and T cells that recognize tissue-specific self-antigens that were not presented during central tolerance. In central tolerance, some self-reactive CD4+ T cells differentiate into TREG cells (Fig. 22.2). This involves the expression of the transcription factor FOX (forkhead box) P3 and antiapoptotic survival signals. Moreover, the cytokines IL2 and TGFβ are important for the generation, survival and function of the cells. TREG cells act not only in lymphoid organs but throughout the whole body. They have a central role in the prevention of autoimmune diseases (Chap. 23) via the active suppression of adaptive immune responses either by inhibiting DCs in activating T cells or through direct suppression of T cell activation. One mechanism of action is the expression of inhibitory receptors, such as CTLA4 and PDCD1, which due to their higher affinity to CD80 and CD86 molecules on the surface of antigen-presenting cells outcompete costimulatory receptors, such as CD28, on self-reactive T cells. While TREG cells inhibit via CTLA4 primarily the initial activation of T cells in secondary lymphoid organs, they terminate through PDCD1 the response of cytotoxic T cells in peripheral tissues. Furthermore, TREG cells produce the immunosuppressive cytokines TGFβ and IL10 (Box 22.2). Moreover, TREG cells suppress B cell activation and inhibit the proliferation and differentiation of NK cells. Importantly, TREG cells also prevent strong immune responses to the microbiome (Sect. 20.4) as well as of pregnant females to their fetus. Box 22.2: Immunosuppressive Cytokines TGFβ and IL10 are important immunosuppressive cytokines that are produced by many different cell types including TREG cells. There are three different genes encoding for TGFβ1, TGFβ2 and TGFβ3, but in immune cells, such as TREG cells and macrophages, TGFβ1 is dominant. The cytokine suppresses the activation of inflammatory M1-type macrophages, neutrophiles and endothelial cells, but promotes the production of tissue regenerative M2-type macrophages (Sect. 15.4). In this way, TGFβ1 acts antiinflammatory. Moreover, the cytokine stimulates the generation of TH 17 cells and TREG cells but inhibits TH 1 and TH 2 development (Sect. 19.3). Moreover, TGFβ1 is critical for antibody isotype switching to IgAs (Sect. 16.3). The cytokine IL10 is produced by macrophages, DCs, TREG cells, TH 1 cells and TH 2 cells and acts as a negative feedback regulator of activated macrophages and DCs. In these cells, IL10 inhibits the production of the proinflammatory cytokine IL12 and reduces IFNγ secretion. The latter has a general suppressive effect on innate and adaptive immunity. Moreover, IL10 inhibits in macrophages and DCs the expression of MHC II proteins and costimulatory molecules. This causes the inhibition of T cell activation. The impact of epigenetic changes in the context of regulatory T cell proliferation is demonstrated at the example of the FOXP3 gene (Fig. 22.3). In this case, the transcription factors REL (Sect. 4.4), CBFB (corebinding factor subunit β) and
22.2 Graft Rejection
369
Thymus
Lymph node
Regulatory T cells
FOXP3 FOXP3 Recognition of antigen in peripheral tissues
Recognition of self antigen in thymus
Inhibition of T cell responses
Inhibition of other cells
NK cell
Dendritic cell Naïve T cell
B cell
Fig. 22.2 Generation and function of TREG cells. TREG cells primarily develop in the thymus (and sometimes also in peripheral lymphoid organs) due to the overexpression of the transcription factor FOXP3. In peripheral tissues, TREG cells suppress the effector functions of other self-reactive lymphocytes
RUNX1 both bind enhancers downstream of the FOXP3 TSS region and stimulate FOXP3 mRNA expression. The binding of the transcription factors to the enhancers leads to their rapid demethylation allowing FOXP3 protein binding for stable auto-regulation. Thus, transcription factor-mediated local demethylation of an enhancer region creates epigenomic memory that stabilizes T cell lineage progression over multiple cell divisions.
22.2 Graft Rejection During the last 50 years the transplantation of cells, tissues or whole organs (collectively referred to as grafts) from one individual (the donor) to a different person (the host) became medical routine. This includes also the transfer of blood cells or plasma, referred to as transfusion. Worldwide millions of people have benefited from this man-made procedure of replacing blood cells, HSCs (Box 22.3), kidneys, livers,
370
22 Tolerance and Transplantation Immunology
Promoter
Enhancer 1
Enhancer 2
TSS
Low
Heterochromatin
TSS me3
Ac
Ac
Ac
Treg cell differentiation
Me
Me
Heterochromatin
Heterochromatin
me3
Ac
Me
REL
Me Me
Me
Me
Me
Me Me
Me
Me Me
Me
Me Me
TSS me3
me3
me3
me3
Ac
Ac
Ac
Me
Heterochromatin
Ac
Me
REL
Me Me Me
Expression level
me3 me3
Me
Me
Me Me
CBFB
RUNX1
TSS me3
Ac
Me
me3
Ac
me3
Ac
Me
me3
Ac
Me
REL
Me Me
Me
Me
High Me Me
CBFB
RUNX1 FOXP3
Fig. 22.3 Epigenetic memory of transcriptional activity. During differentiation of regulatory T cells, the FOXP3 gene must show a stable and strong expression. A homodimer of the transcription factor REL binds to a downstream enhancer and stimulates FOXP3 mRNA expression and demethylation of the promoter region. FOXP3 gene expression is stabilized through the binding of the transcription factors CBFB and RUNX1 to a more proximal enhancer. The latter induces local demethylation and permits binding of the transcription factor FOXP3. Thus, in an auto-regulatory fashion FOXP3 ensures constitutive activity of the promoter of its own gene. The demethylation of enhancer and promoter regions represents epigenetic memory
22.2 Graft Rejection
371
hearts and other organs. The technical aspects of graft transplantation surgeries are well under control, but the responses of the host’s immune system against the graft are still a major issue limiting the success of the transplantation. Box 22.3: HSC Transplantation The transplantation of HSCs, often also called bone marrow transplantation, is used to treat defects in hematopoietic cell lineages, such as X-SCID (X-linked severe combined immunodeficiency disease), β-thalassemia major and sickle cell disease, as well as blood cancers like leukemias. Moreover, in the past years, HSC transplantation became also a very effective treatment option for some inherited metabolic diseases like mucopolysaccharidosis. This treatment is only an option for severe cases, where patients totally lack specific enzymes. By replacing the HSC pool of the patient, the amount of enzymes produced in the new blood cells is sufficient to compensate the lacking enzyme activity. During HSC transplantation, first the host’s own HSCs are destroyed by chemotherapy, immunotherapy or irradiation and then they are replaced by HSCs from a healthy donor. Thus, the host obtains a new immune system. A serve complication of HSC transplantation can be GVHD (graft-versus-host disease), which is based on donor’s mature T cells that recognize alloantigens of the host, such as minor histocompatibility antigens. Acute GVHD is characterized by the death of epithelial cells in skin, liver and gastrointestinal tract, which can be fatal when it occurs extensively in the first 100 days after HSC transplantation. In contrast, chronic GVHD causes fibrosis and atrophy of one or multiple organs but no cell death and may lead to complete dysfunction of the affected organ. In order to prevent possible GVHD, immunosuppressive drugs (Sect. 22.3) are given for prophylaxis. For ethical and practical reasons, the principles of graft rejection have been studied primarily in mice. In general, mice, rats, chicken, fruit flies and other animal species are often used as model organisms in immunology (Box 22.4). Members of inbred mice strains are genetically identically to each other, i.e., they carry the same genomic variants also in their HLA gene locus (Sect. 18.2). The principles of transplantation immunology are demonstrated at the example of acceptance or rejection of skin grafts in comparison of two different mice strains and their crossed F1 generation: • a transplantation between two genetically identical (i.e., syngeneic (Box 22.5)) individuals (inbred mice or monozygotic humans) does not cause any graft rejection (Fig. 22.4a) • a transplantation between two genetically different (i.e., allogeneic) individuals causes after 10–14 days an inflammatory reaction referred to as graft rejection, i.e., the transplanted skin undergoes necrosis and falls off (Fig. 22.4b) • a transplantation from a homozygous individual to an individual that is heterozygous (in mice from the parent strain to the F1 generation of a breed of two different strains) does not cause any graft rejection (Fig. 22.4c)
372
22 Tolerance and Transplantation Immunology
Donor
a
Host
Graft rejection
Skin graft
Syngeneic graft is not rejected
b Strain B (MHCb)
Fully allogeneic graft is rejected
c /b
Strain B (MHCb)
)
Graft from inbred parental strain is not rejected by F1 hybrid
d /b
)
Graft from F1 hybrid is rejected by inbred parental strain
Fig. 22.4 Genetic principles of graft rejection. The inbred mouse strains A and B differ in the variants of their HLA genes encoding for MHC proteins. Syngeneic grafts are not rejected (a), while allografts are always rejected (b). Grafts from homozygous A or B mice are not rejected by A/B heterozygous mice (c), but grafts from A/B heterozygous mice are rejected by homozygous A or B mice (d)
• a transplantation from an heterozygous individual to a homozygous person (in mice from F1 generation of a breed of two different strains to the parent strain) causes a graft rejection after 10–14 days (Fig. 22.4d).
Box 22.4: Model Organisms in Immunology Many fundamental findings in immunology were obtained in model organisms. For example:
22.2 Graft Rejection
373
• the clonal selection theory was validated in rats • the role of the thymus in generating T cells was found in mice • B and T cells as organizing principles of adaptive immunity were discovered in chickens • the role of PRRs, such as TLRs, in innate immunity was described first in mice and fruit flies • the impact of DCs as central coordinators of immune responses was observed first in mice. However, humans diverted from the closest of these model organisms, the rodents, some 100 million years ago. This questions, whether all observations made in rodents can be transferred 1:1 to humans. This is of particular importance for the testing of therapeutics, such as monoclonal antibodies (Sect. 33.3). Therefore, it is important to verify findings from model organisms in a human setting. In fact, first experiments in immunology, such as the vaccination trials by Jenner in 1796, had been done in humans.
Box 22.5: Transplantation Vocabulary When a graft is transplanted within the same individual, e.g., in case of replacement of burned skin, it is referred to as autologous graft. The transplantation between genetically identical individuals, such as between monozygotic twins or within inbred strains, is called syngeneic graft. The term allogeneic graft (or allograft) applies, when donor and host are genetically different and xenogeneic graft (or xenograft) is used, when donor and host are from different species. Accordingly, foreign molecules in grafts are called alloantigens and xenoantigens. Furthermore, lymphocytes and antibodies reacting with them are referred to as alloreactive and xenoreactive. The onset of a graft rejection takes 10–14 days, which indicates that the process is mediated by adaptive immunity that needs time for clonal expansion after the first contact with the foreign tissue. However, the repeated exposure of an individual with a graft from the same donor leads to a more rapid reaction, i.e., in transplantation immunology there is a memory effect that is very comparable to repeated infections with the same type of microbe. In contrast, the reaction to the exposure with a graft from a different donor again takes 10–14 days, i.e., there is immunological specificity as observed with infectious diseases (Chaps. 20 and 21). Importantly, rapid response to a graft can also be obtained, when lymphocytes from a pre-exposed individual were transferred before transplantation to the naïve host. The term “major histocompatibility complex” already indicates that MHC proteins being expressed in grafts are the major alloantigens responsible for rejection reactions. MHC proteins present self-peptides, i.e., alloantigens, of the donor to T cells
374
22 Tolerance and Transplantation Immunology
of the host (Fig. 22.5a). Moreover, since the HLA gene locus, which encodes for the different MHC proteins, is highly polymorphic (Sect. 18.2), MHC proteins of the donor are also recognized as alloantigens (Fig. 22.5b). Often the host’s T cells recognize both the self-peptide and the MHC proteins of the donor as alloantigens (Fig. 22.5c). Other proteins that differ between donor and host may act as additional alloantigens, but compared with MHC proteins their contribution is minor. Therefore, they are called minor histocompatibility antigens. Allogeneic MHC proteins of the donor are presented either directly or indirectly to T cells of the host. The direct alloantigen presentation happens within lymph nodes of the host that are located close to the graft (Fig. 22.6a). Tissue-resident DCs of the donor, which were transplanted together with the organ, move to these lymph nodes. There they interact via their MHC I and MHC II proteins with TCRs of host’s CD8+ and CD4+ T cells, which then proliferate and differentiate to TH cells and cytotoxic T cells, respectively. Thus, antigen-presenting cells of the host are not involved in this process. The cytotoxic T cells are further stimulated by cytokines, which were secreted by TH cells and initiate apoptosis to parenchymal cells of the graft, i.e., the cells of the graft are killed by a direct mechanism. This reaction is very strong, since a significant number of the host’s T cells (1–10% of all) recognize the MHC
a
b
Foreign peptide Self MHC
c
Donor peptide Donor MHC
Donor peptide Donor MHC
Donor Host
Fig. 22.5 Peptide-laden MHC proteins as alloantigens. Alloantigens of the direct recognition of MHC peptide complexes by the TCR of a host’s T cell are either the self-peptide of the donor via host’s own MHC protein (a), the MHC protein of the donor (b) or both (c)
22.2 Graft Rejection
375
proteins of the donor. MHC proteins are very immunodominant, because they bind in each cell thousands of different self-peptides, i.e., they offer thousands of different epitopes to be recognized by T cells. For comparison, during a virus infection only 1 of 105 –106 T cells are specifically recognize peptides originating from the microbe. Many of the host’s responding T cells are memory cells that react faster and stronger than naïve T cells. These memory T cells derive from previous exposure with foreign environmental or microbial proteins and cross-react with allogeneic MHC proteins. During indirect alloantigen recognition DCs of the host migrate to the graft and take up membrane fragments of donor’s cells including MHC proteins (Fig. 22.6b). The host’s DCs then move back to lymph nodes and present via their MHC II proteins peptides originating from the donor’s MHC proteins to host’s CD4+ T cells. Since the donor’s MHC proteins have a different amino acid sequence and structure than the host’s MHC proteins their processed peptides activate CD4+ T cell clones of the host. After proliferation and differentiation these TH cells stimulate host’s B cells to produce antibodies specific for donor’s MHC proteins as well as host’s macrophages to secrete proinflammatory cytokines. In this way, the cells of the graft are injured through antibody-triggered activation of neutrophils, macrophages and NK cells as well as of complement proteins that result in a strong inflammatory response. Since endothelial cells express MHC proteins, alloantibody-mediated damage concerns in particular the graft’s vasculature. The indirect alloantigen recognition and the following effector reactions resemble those of proteins originating from microbes. Thus, the immune response to man-made transplantations is based on established mechanisms used for the fight against microbes. Based on histopathology, graft rejections are classified as hyperacute, acute and chronic. Hyperacute rejections can happen within minutes to hours after surgery and manifest by thrombotic occlusion of the graft’s vasculature. This reaction is based on preexisting IgM-type antibodies that circulate in the host. The alloreactive antibodies bind to endothelial cells of the graft and activate via complement proteins platelets that aggregate to form an intravascular thrombus, which harms the graft by ischemia. Acute rejections start a few days to weeks after transplantation and are mediated by alloreactive T cells and antibodies that cause injury to the parenchyma and vasculature of the graft. The mechanisms behind acute rejections are primarily those of the direct alloantigen recognition pathway (Fig. 22.6a), i.e., cytotoxic T cells kill parenchymal and endothelial cells of the graft and TH 1 cells initiate via secretion of cytokines, such as IFNγ and TNF, an inflammatory response. In addition, alloantibodies that are created via the indirect alloantigen recognition pathway (Fig. 22.6b) cause endothelial injury and intravascular thrombosis of the graft. Finally, chronic rejections develop during months or years after transplantation and result in arterial occlusions due to the stimulation proliferation of intimal smooth muscle cells by IFNγ and other cytokines. This results in reduced blood flow to the graft parenchyma, which over time is replaced by non-functional fibrous tissue. In part this interstitial fibrosis is a repair response to parenchymal cell damage. A major strategy to reduce the immunogenicity of a graft is to selected donors that have minimal genetic differences, in particular concerning their MHC proteins. Before a transplantation, by HLA typing the alleles of HLA genes (primarily that
376
22 Tolerance and Transplantation Immunology
a Direct alloantigen recognition Alloreactive CD8+ T cell Donor dendritic cell
Cytokines
Alloreactive CD4+ T cell T cells recognize donor MHC and bound peptides on DC from graft
b
Cytotoxic T cell recognizes donor MHC on graft tissue cell
Direct killing of graft cells
Indirect alloantigen recognition + T cell recognizes donor MHC peptide bound to host MHC on host B cell
Self MHC Allogeneic Host’s antigenMHC presenting cell
antibodies
Host B cell
Alloreactive CD4+ T cell
Host dendritic cells takes up and processes donor MHC molecules
CD4+ T cell regonizes donor MHC peptide bound to host MHC on host dendritic cells
+ T cell recognizes donor MHC peptide bound to host MHC on host marcophage in graft
Antibody-mediated injury to graft cells
cytokines
injury to graft
Fig. 22.6 Direct and indirect alloantigen recognition. Direct alloantigen recognition involves DCs of the donor, which interact with MHC I and MHC II proteins of the host’s cytotoxic T cells and TH cells (a). The cytotoxic T cells then recognize and directly kill MHC I protein carrying cells of the graft. Indirect alloantigen recognition happens when host’s DCs take up MHC proteins of the donor, process them and present the resulting peptides on their own MHC II proteins (b). This activates TH cells that stimulate B cells to produce MHC specific antibodies and macrophages to secrete proinflammatory cytokines. The cells of the graft are then harmed by ADCP (Sect. 20.2) and complement protein recruitment as well as by inflammatory reactions
22.3 Immunosuppression
377
of the highly polymorphic HLA-A, HLA-B and HLA-DR genes) are determined by PCR, targeted sequencing or gene expression analysis for both the donor and the host. The less mismatches in HLA alleles are found, the lower is the risk of an acute graft rejection. Moreover, in order to avoid hyperacute graft rejections, hosts are routinely screened for the presence of preformed antibodies that may have been produced due to previous pregnancies, transfusions or transplantations. Blood transfusion is one of the oldest and most common form of transplantation, which is primarily used to replace blood lost by hemorrhage. For a successful transfusion the blood groups of donor and host need to be compatible. Blood group antigens differ in the carbohydrates that are added by specific glycosyltransferases to glycoproteins on the surface of erythrocytes. The 0 allele gene product has no enzymatic activity, while in the A allele N-acetylgalactosamine and in the B allele N-acetylglucosamine is added (Fig. 22.7). In AB heterozygotes both types of carbohydrates are added. Individuals, who do not express a particular blood group antigen, produce natural IgM antibodies against that antigen, e.g., persons of blood group A have antibodies against blood group B. Accordingly, AB individuals can tolerate transfusions from all potential donors, while 0 individuals can tolerate transfusions only from 0 donors but can provide blood to all possible hosts. In case of a contact of blood from two different blood groups, antibody binding to erythrocytes activates complement proteins and life-threatening immediate hemolytic reactions are initiated causing kidney failure, a cytokine storm and excessive bleeding. In order to prevent such reactions, during routine blood typing erythrocytes of a given individual are mixed with standardized sera containing anti-A or anti-B antibodies. Agglutination is observed, when the person expresses respective blood group antigens.
22.3 Immunosuppression Allograft hosts that have a functional immune system are expected to show graft rejection reactions. Therefore, in addition to select a donor that is identical to the host in most HLA alleles, immunosuppressive drugs are routinely applied as a prophylaxis. Thus, the host’s immune system is substantially weakened over a prolonged period, in order to prevent graft rejection. This treatment carries substantial risks of serious side effects, since in long-term the drug treatment rather results in immune dysfunction than in desired tolerance against the graft. Since T cells are the main mediators of graft rejection (Sect. 22.2) as well as the key cell types to be affected for obtaining immunological tolerance (Sect. 22.1), a modulation of their reaction and function is the first target of immunosuppressive drugs. The molecular understanding of T cell signaling indicates that the transcription factors NFκB, NFAT and AP1 may be prime targets for immunosuppressive drugs. However, NFκB and in particular AP1 have key functions in a large variety of cell types suggesting that their functional modulation by drugs will result in substantial side effects. Therefore, the lymphocyte-specific transcription factor NFAT is the preferential target. Since cytoplasmatic NFAT is activated by the
378
22 Tolerance and Transplantation Immunology
Group A
Group B
Type A
Type B
Anti-B
Anti-A
Group AB
Group 0
Type AB
Type 0
Red blood cell type Anti-A and anti-B
Antibodies present
None
A antigen
B antigen
A and B antigen None
Antigens present
N-Acetylgalactosamine
N-Acetylglucosamine
Fucose
Galactose
Fig. 22.7 AB0 blood groups. The antigens of blood groups A, B and 0 are indicated carbohydrates on the surface of erythrocytes added by specific glycosyltransferases. The blood group of an individual indicates against which antigen they are tolerant and to which they produce natural antibodies that react with other blood group antigens
Ca2+ - and calmodulin-dependent serine/threonine protein phosphatase calcineurin, the enzyme is a promising target for T cell-specific immunosuppressive drugs. The natural product cyclosporin (a peptide isolated from fungi) was introduced some 40 years ago in transplantation medicine and since then significantly reduced the risk for graft rejections. Cyclosporin binds with high affinity to the cytoplasmatic protein PPIA (peptidylprolyl isomerase A, also called cyclophilin) that inhibits the enzymatic activity of calcineurin (Fig. 22.8). In this way, the translocation of NFAT to the nucleus is prevented and the induction of its major target gene IL2 is majorly reduced. Due to the key role of IL2 in the proliferation and differentiation of T cells, the functionality of alloreactive TH cells and cytotoxic T cells is significantly reduced. Tacrolimus (FK506) is also a natural product that binds to peptidylprolyl isomerases of the FKBP (FK506 binding protein) family. It also inhibits calcineurin, i.e., it acts very comparable to cyclosporin but has better efficacy and safety. Another natural immunosuppressive drug is rapamycin, which like FK506 binds to FKBPs but functions via the inhibition of the cytoplasmatic serine/threonine protein kinase TOR. TOR is critical for the translation of proteins that promote cell survival and proliferation, i.e., rapamycin inhibits T cell proliferation (Fig. 22.8). Since TOR
22.3 Immunosuppression
379
Antigen-presenting cell Anti-TCR (OCT3, thymoglobulin)
CD80
MHC II IL2
Anti-IL2R
IL2 CTLA4-Ig
TCR
IL2RA
CD28
Cyclosporin Tacrolimus
Rapamycin
TOR
Calcineurin
Azathioprine Mycophenolate
Co-stimulation IL2 production
T cell
Proliferation
Fig. 22.8 Common immunosuppressive drugs. Different categories of immunosuppressive drugs and their molecular targets are schematically indicated. More details are provided in the text
is widely expressed, rapamycin affects also other tissues and cell types, but compared to activated T cells all other cells are growing slowly or not at all. A few signal transduction pathways, such as those of TCR/CD3, CD28 and IL2RA (CD25), promote the proliferation of T cells and act via TOR. Thus, inhibitors of these membranereceptor based pathways, such as specific monoclonal antibodies (Sect. 33.3), act as immunosuppressive drugs. Furthermore, metabolic toxins, such as azathioprine and mycophenolates, inhibit the proliferation of immature and mature lymphocytes. These antimetabolites inhibit key metabolic pathways, such as the de novo synthesis of guanine nucleotides by mycophenolates. Antiinflammatory drugs, in particular glucocorticoids, are often used to reduce the inflammatory reaction associated with reactions of the immune system to allografts (Sect. 22.2). Glucocorticoids act as ligands of the nuclear receptor GR (Sect. 5.1) and inhibit in macrophages the expression of proinflammatory cytokines, such as TNF and IL1β, and the production of
380
22 Tolerance and Transplantation Immunology
inflammatory mediators, such as PGs, ROS and NO. In this way, the damage to the graft is reduced due to lower numbers of recruited phagocytes causing inflammation. Immunosuppressive and antiinflammatory therapy largely prevents acute graft rejection. However, immunosuppressive drugs are far less effective in the prevention of chronic graft rejections. Since immunosuppression reduces the function not only of alloreactive T cells but of all TH cells and cytotoxic T cells, the risk of the graft host for infections and neoplasia substantially increases (Sect. 33.1). For example, latent viruses, such as CMV, HSV, VZV and EBV (Sect. 21.2), are often reactivated due to immunosuppression, so that antiviral prophylaxis is recommended. Moreover, the risk for a number of opportunistic infections, e.g., with fungi, is significantly increased. In addition, immunosuppressive drugs can act toxically to non-immune cells, which limits their application. Thus, new generations of more specific and less toxic drugs need to be developed. The final goal of a posttransplantation therapy is the development of tolerance of the host’s immune system against the graft. This would not only reduce the risk of side effects of immunosuppressive drugs but also avoids chronic graft rejections. This may be achieved by a blockade of costimulation via specific monoclonal antibodies or through adoptive therapy (Sect. 33.4) with donor-specific TREG cells cultured ex vivo. (Clinical) Conclusion: Immunological tolerance is a natural mechanism ensuring that the daily production of new B and T cells does not result in surviving self-reactive cells. However, failure of tolerance mechanisms is often the cause for allergies and autoimmune disorders. The same mechanisms are the basis for graft rejection of man-made organ transplantation. Therefore, either host and donor should have a maximal match in HLA alleles and/or immune suppressive drugs need to be applied for the rest of the life of the patient.
Additional Reading Bluestone, J. A., & Anderson, M. (2020). Tolerance in the age of immunotherapy. New England Journal of Medicine, 383, 1156–1166. ElTanbouly, M. A., & Noelle, R. J. (2021). Rethinking peripheral T cell tolerance: Checkpoints across a T cell’s journey. Nature Reviews Immunology, 21, 257–267. Loupy, A., & Lefaucheur, C. (2018). Antibody-mediated rejection of solid-organ allografts. New England Journal of Medicine, 379, 1150–1160. Yang, J. Y., & Sarwal, M. M. (2017). Transplant genetics and genomics. Nature Reviews Genetics, 18, 309–326. Zeiser, R., & Blazar, B. R. (2017). Pathophysiology of chronic graft-versus-host disease and therapeutic targets. New England Journal of Medicine, 377, 2565–2579.
Chapter 23
Immunological Hypersensitivities: Allergy and Autoimmunity
Abstract In this chapter, we will discuss about different types of hypersensitivities of the immune system, which are either mediated primarily by IgEs and TH 2 cells (type I), IgGs and IgMs (type II), immune complexes (type III) and T cells (type IV). While type I hypersensitivity causes different forms of allergy, the basis for distinct autoimmune diseases are type II–IV hypersensitivities. The underlying mechanisms for all hypersensitivities, is the failure of mechanisms responsible for maintaining self-tolerance in B cells, T cells or both. We will outline the effector mechanisms, responsible for tissue injury and disease in the context of these hypersensitivities, which are based on genetic susceptibility and environmental triggers, such as infections. Organ-specific autoimmune diseases, such as T1D and MS are distinguished from those that are systemic, such as rheumatoid arthritis and SLE. We will summarize these principles in the equilibrium model of immunity. Keywords Immunological hypersensitivities · Allergy · IgEs · Autoimmune diseases · SLE · MS · Rheumatoid arthritis · T1D · Genetic susceptibility · Equilibrium model of immunity
23.1 Classification of Hypersensitivities The effector mechanisms of immunity are very important for the efficient elimination of pathogenic microbes without creating major injuries to host tissues (Chaps. 20 and 21). Moreover, the immune system has an essential role in the development and maintenance of tissues, such as wound healing after a trauma (Sect. 31.1). For the latter reason, many common disorders, such as atherosclerosis, T2D, Alzheimer’s disease and cancer, are associated with inflammation that is initially meant for supporting the regeneration of disturbed tissues but often gets chronic and causes more harm than benefit, such as the support of tumor growth (Sect. 33.1). The main role of immune cells is to keep an individuum in homeostasis by dynamically responding to any kind of disturbance. For example, the ability of CD4+ T cells to differentiate into either TH 1, TH 2, TH 17 and TREG cells and to perform specific effector responses depending on which type of microbe has © The Author(s), under exclusive license to Springer Nature Switzerland AG 2023 C. Carlberg et al., Molecular Medicine, https://doi.org/10.1007/978-3-031-27133-5_23
381
382
23 Immunological Hypersensitivities: Allergy and Autoimmunity
Emergine immune “accommodation” archetypes Regulate commensal symbiosis Treg / TH17 cells, dendritic cells
Assist tissue development
Manage tissue metabolism
Heal wounds
Manage tissue repair
Control chronic infection
T cells, macrophages
Treg cells macrophages
Neutrophils, macrophages
Treg cells, TH17 cells, ILCs
Myeloid cells, exhausted T cells
Active non-destructive immune responses
Tolerance
Destruction
Immune inactivity
Immune elimination of host cells
Classical spectrum of immune reactivity
Fig. 23.1 Continuum of immune responses. The indicated varieties of immune responses act in a continuum between tolerance and host cell destruction. When one or several of these varieties are dysregulated or dysfunctional, they contribute to immune-related diseases
invaded the body (Sect. 19.3), demonstrates why this part of immunity is referred to as adaptive. Moreover, also the variation of the relative numbers of cell types of the innate immune system indicates adaptive responses. This is exemplified by macrophages that respond, depending on the physiological situation, as M1-type producing proinflammatory cytokines or as M2-type secreting antiinflammatory cytokines (Sect. 15.4). Thus, a functional immune system should provide an optimal response in the continuum between tolerance and inactivity at one end and their overreactions that may create a cytokine storm, a septic shock or the destruction functional cells of the host at the other end (Fig. 23.1). The responses of innate and adaptive immune cells are in most cases interdependent. This has the advantage that a possible disturbance of the system can be internally corrected, but bears also the risk that a major dysregulation can cause a cascade of multiple dysfunctions. Therefore, there are a number of situations, such as insufficient control of immune cells, their targeting toward incorrect tissues and cell types, the modulation of their response by the microbiome (Sect. 20.4) or the cell’s inappropriate reaction to usually harmless antigens of the environment, that result in significant tissue injuries and cause so-called hypersensitivity diseases. Based on the type of immune response and the resulting effector mechanisms causing the diseases, they are classified into four different types (Table 23.1). Immediate hypersensitivities (type I) involve IgEs that are specific for environmental antigens, such as grass pollen. Todays, these diseases are very common and grouped under the term allergies (Sect. 23.2). Allergies are mediated by IL4, IL5 and IL13 producing TH 2 cells (Sect. 19.3), the natural role of which is the defense against helminths. In
23.1 Classification of Hypersensitivities
383
Table 23.1 Different types of hypersensitivities Type of hypersensitivity
Main mediators
Mechanisms of tissue injury
I
IgEs, TH cells
Mast cells, eosinophils and their mediators
II
IgMs, IgGs
Opsonization and phagocytosis of cells
III
Immune complexes involving IgMs and IgGs
Complement- and FcR-mediated recruitment and activation of leukocytes
IV
CD4+ (TH 1 and TH 17 cells), CD8+ (cytotoxic T cells)
Cytokine-mediated inflammation and macrophage activation; direct target cell killing
contrast, type II hypersensitivities involve IgGs and IgMs that specifically recognize self-antigens on the surface of cells or at the extracellular matrix (Sect. 23.3). In the resulting humoral adaptive immune response (Sect. 17.3) the antigens are either neutralized or opsonized. In the response to the latter process, complement proteins are activated, phagocytes are recruited and inflammation is induced. Also type III hypersensitivities engage IgGs and IgMs but these are parts of larger antigen complexes that circulate in the blood (Sect. 23.3). This leads to a systemic response that involves inflammation, thrombosis and blood vessel injury. Finally, type IV hypersensitivities are mediated by both TH 1 and TH 17 cells as well as cytotoxic T cells that secrete cytokines and induce inflammation or directly kill target cells (Sect. 23.4). Types II-IV hypersensitivities cause different forms of autoimmune diseases, major examples of which are listed in Box 23.1. Thus, hypersensitivities are predominantly based either on self-reactive antibodies or on self-reactive T cells. However, in many diseases these humoral and cell-mediated responses act together. Box 23.1: Major Autoimmune Diseases In contrast to microbial antigens, self-antigens are persistent, i.e., there is no chance to eliminate them. For this reason, autoimmune diseases tend to be chronic. In addition, due to amplification mechanisms, such perpetuating the immune response through additional tissue injury, the diseases are often progressive. There are in total some 80 distinct autoimmune diseases that affect with a prevalence of 5–9% the population of industrialized countries. The most common autoimmune disease is psoriasis (2–3%), which causes skin redness, thickening and scales. It is based on abnormal keratinocyte proliferation in the dermis and epidermis. The main autoimmune disease of the CNS is MS (0.1%), is characterized by visual loss, numbness, tingling, paresis and spasticity and caused by destruction of myelin. Autoimmune diseases of endocrine organs are T1D (0.4%) affecting β cells of the pancreas as well as Graves’ disease (0.5%) and Hashimoto’s
384
23 Immunological Hypersensitivities: Allergy and Autoimmunity
disease (0.1%) of the thyroid gland. T1D is based on destruction of insulin producing β cells. Graves’ disease is a hyperthyroidism that leads to anxiety, irritability, hand tremors, weight loss, enlarged thyroid gland, bulging eyes and palpitations, which is due to autoantibodies against the thyrotropin receptor on thyroid cells leading to increased synthesis of thyroid hormone T3 . In contrast, Hashimoto’s disease comes with fatigue, sensitivity to cold, puffy face, constipation, pale and dry skin and is based on fibrosis and atrophy of thyrocytes causing decreased synthesis of T3 . Autoimmune diseases of the gastrointestinal tract are Crohn’s disease (0.2–0.3%), ulcerative colitis (0.2–0.4%) and celiac disease (0.7%). Common to these diseases is diarrhea, abdominal pain and discomfort, bloody and loose stools, fever and fatigue, which are due to transmural inflammation, mucosal inflammation, flattening of villi and elongation of crypts. The main autoimmune disease of joints is rheumatoid arthritis (0.5– 1%) that leads to joint swelling, morning stiffness and tenderness based on synovial hyperplasia damaging cartilage and bone. Myasthenia gravis has no high prevalence (0.02%), but it is still the main autoimmune disease of muscles, which leads to muscle weakness, dropping of upper eyelid and double vision. The disease is based on autoantibodies that block acetylcholine receptors in postsynaptic muscle membranes. The mechanisms of tissue injury in hypersensitivity diseases are the same as those that are used to eliminate infectious pathogens. These processes are primarily mediated by phagocytes, mast cells, T cells and antibodies as well as by mediators of inflammation. However, in contrast of pathogenic microbes the stimuli for abnormal immune responses in the context of hypersensitivity diseases, such as self-antigens, commensal microbes and environmental antigens can often not be eliminated. For this reason, hypersensitivity diseases, such as allergies (Sect. 23.2) and autoimmune diseases (Sect. 23.4), are mostly chronic and progressive.
23.2 Immunity of Allergies Non-microbial environmental antigens, referred to as allergens (Box 23.2), are detected during their first contact by the BCR of B cells (Fig. 23.2). These B cells act as antigen-presenting cells that display via MHC II proteins allergen-derived peptides to CD4+ T cells, which differentiate then to TH 2 cells (Sect. 19.3). Like ILC2s (Sect. 15.2) TH 2 cells produce primarily the cytokines IL4, IL5 and IL13. IL4 induces isotype switching of the allergen-specific B cells toward the production of IgEs (Sect. 17.3). The constant domains of the allergen-specific IgEs are captured with high affinity by FcεRIs (Kd = 0.1 nM) on the surface of mast cells in tissues and eosinophiles in the circulation, i.e., the cells are sensitized. In this way, both cell types of the innate immune system gain high affinity and specificity to allergens.
23.2 Immunity of Allergies
385
Immediate hypersensitivity reaction (minutes after repeat exposure to allergen) Activation of TH2 cells and stimulation of IgE class switching in B cells
Production of IgE
Binding of IgE to FcεRI on mast cells
Repeated exposure to allergen
Vasoactive amines, lipid mediators
Activation of mast cell: release of mediators
IgE
FcεRI B cell
TH2 cell
Allergen First exposure to allergen
IgE secreting B cell
Mediators
Mast cell
Late phase reaction (2 - 4 hours after repeat exposure to allergen)
Cytokines
Fig. 23.2 Immediate hypersensitivity reactions. Immediate hypersensitivity is initiated by an allergen that stimulates TH 2 cell response and the production of allergen-specific IgEs. Mast cells and eosinophiles (not shown) bind via FcεRIs these IgEs and obtain in the way high specificity for the allergen. After re-exposure to the allergen, the cells release within minutes molecules, such as vasoactive amines and lipid mediators, that cause pathologic reactions. In addition, within 2–4 h cytokines are released, genes of which are expressed as the result of signal transduction induced by the activation of FcεRIs
After repeated exposure to the allergen, mast cells and eosinophiles rapidly release molecules, such as vasoactive amines and lipid mediators, that promote increased vascular permeability, vasodilation as well as bronchial and visceral smooth muscle contraction. Thus, allergic reactions occur only in individuals that had been previously sensitized to the allergen. These reactions are called immediate hypersensitivity and have their origin in the clearance of helminths (Box 23.3). Therefore, they belong to the most powerful responses of the immune system. In parallel to the very rapid hypersensitivity, in a so-called late-phase reaction (2–4 h after the exposure to the allergen), the secretion of cytokines causes acute inflammation that leads to the accumulation of eosinophils and neutrophils. This reaction lasts less than 24 h and is primarily mediated by TH 2 cells. Box 23.2: Allergens Most allergens are common environmental proteins derived from animals or plants, such as animal dander, house dust mites or
386
23 Immunological Hypersensitivities: Allergy and Autoimmunity
pollen. A master example of a natural allergen explaining dust allergy is the cysteine protease peptidase 1, which is found in the feces of mites, i.e., small insects living in house dust. This enzyme destroys the integrity of the tight junctions between epithelial cells and gains in this way access to subepithelial mast cells and eosinophils. Thus, peptide fragments of peptidase 1 can be presented to T cells, the enzyme itself gets easily access to mast cells, the globular protein is rather stable and soluble and the rather low molecular weight allows diffusion of the allergen. In addition, also chemicals that bind and modify self-proteins, such as drugs, can act as self-proteins. The key example of a drug causing allergy is that of the antibiotic drug penicillin. Penicillins can act as haptens that bind covalently to lysines of serum proteins and cell surface proteins, i.e., penicillins structurally modify proteins so that they are recognized as foreign by the immune system. Interestingly, penicillins can lead to allergies (type I hypersensitivities) targeting erythrocytes, leukocytes and platelets with clinical symptoms like hives, bronchospasm, hypotension and anaphylaxis (Box 23.5) but also can cause type II and type III hypersensitivities (Sect. 23.3).
Box 23.3: Clearance of Helminths Helminthic parasites are too large to be eliminated by phagocytosis and are rather resistant against microbicidal products of neutrophils and macrophages. Therefore, the immune system uses primarily antibodies, eosinophils and mast cells to kill and expulse the worms. Major basic protein (MBP) is a cationic protein that is stored in granules within eosinophiles. When the cells recognize via FcεRIs IgEs that cover the surface of helminths, they secrete MBP and other aggressive molecules that are toxic to the worms. Moreover, the IgEs also initiate the degranulation of mast cells, which induces bronchoconstriction as well as increased intestinal motility, so that the worms are expulsed from the lung and intestine, respectively. The most common forms of allergy are atopic dermatitis, hay fever (also called allergic rhinitis) and asthma (Box 23.4). Depending on the affected tissues, allergies result in skin rashes, itchy eyes, sinus and nasal congestion, inflamed conjunctiva, bronchial constriction abdominal pain and diarrhea (Table 23.2). In the extreme case of an anaphylactic shock (Box 23.5), mast cell-derived molecules restrict airways up to asphyxia and produce a collapse of the cardiovascular system, which can be fatal. Allergies normally occur at sites where commonly mast cells are found, such as connective tissues and under epithelial barriers. Allergic individuals have significantly higher levels of IgEs compared with non-allergic persons, i.e., the amount of circulating IgEs is one biomarker of allergy. Individuals often have different types of allergies starting with atopic dermatitis in childhood, developing into allergic rhinitis and later bronchial asthma. Thus, these forms of allergy are closely related,
23.2 Immunity of Allergies
387
Table 23.2 IgE-mediated forms of allergy Syndrome
Common allergens
Route of entry
Response
Comment
Contact dermatitis
Animal hair, insect bites, allergy testing
Through skin
Local increase in blood flow and vascular permeability
Milder symptoms
Allergic rhinitis
Pollen, dust mite feces
Inhalation
Edema of nasal mucosa, irritation of nasal mucosa
Milder symptoms
Asthma
Dander (cat), pollen, dust mite feces
Inhalation
Bronchial constriction, increased mucus production, airway inflammation
Therapy should start at least in this stage
Food allergy
Tree nuts, peanuts, shellfish, milk, eggs, fish
Oral
Vomiting, diarrhea, Everyone should itching, uticaria, be aware of anaphylaxis his/her risk
Systemic anaphylaxis
Drugs, serum, venoms, peanuts
Intravenous (directly or following oral absorption into the blood)
Edema, increased vascular permeability, tracheal occlusion, circulatory collapse, death
Life threatening!
since they are based on similar mechanisms, such as a local accumulation of mast cells and TH 2 cells. Box 23.4: Asthma Asthma is the pulmonary form of immediate hypersensitivity and associated with recurrent reversible airflow obstruction, increased production of thick mucus and bronchial smooth muscle cell hyperresponsiveness. Respiratory viral and bacterial infections are often a predisposing factor in the development of asthma. Moreover, asthma co-exists with chronic obstructive pulmonary disease, e.g., caused by life-long smoking. However, some 70% of asthma patients have increased IgE levels, i.e., their response is primarily due to allergy. Asthma is associated with chronic inflammation of the lungs, which is due to the late-phase reaction of the allergic response, which leads to the recruitment of eosinophils and basophils. These cells secrete mediators like LCT4 that constrict airway smooth muscle. Inhaled corticosteroids that block the production of inflammatory cytokines are used as therapy (Sect. 22.3). Furthermore, bronchial smooth muscle cell relaxation is achieved by inhaling β2-adrenergic agonists.
388
23 Immunological Hypersensitivities: Allergy and Autoimmunity
Box 23.5: Systemic Anaphylaxis Anaphylaxis is an allergic reaction due to the systemic presence of an allergen that reached the blood stream via an injection like by an insect sting or resorption by intestinal mucosa. This immediate hypersensitivity reaction is associated with edema in many tissues and a decrease in blood pressure due to vasodilation and vascular leak. Anaphylaxis is caused by drugs like penicillins (Box 23.2) but also by specific proteins in peanuts, tree nuts, fish, shellfish, milk, eggs and bee venom. The significant decrease in blood pressure is called anaphylactic shock and can lead to death. Anaphylaxis occurs within seconds to an hour after exposure to an allergen. It is treated by epinephrine injection, which reverses the bronchoconstrictive and vasodilatory effects of mediators secreted by mast cells and improves the cardiac output. Epigenome-wide profiling of immune cell subsets can help to identify the epigenomic basis of allergic diseases, such as asthma. For example, when comparing healthy controls with asthmatic patients, a marker for active and poised enhancers, H3K4me2, is significantly increased in TH 2 cells of patients. Asthma is a master example of a disease in which environmental exposure with natural and synthetic compounds causes dynamic changes of the epigenome. In general, immune systemrelated diseases, such as inflammation and autoimmune diseases, are clinically heterogeneous, but all develop from the interplay of genetic susceptibility and environmental and/or lifestyle choices, i.e., the balance between genetics and epigenetics (Sect. 42.1). Thus, epigenetic profiling of cell subsets for various epigenetic markers, such as accessible chromatin, DNA methylation, histone modifications, transcription factor binding and chromatin modifier association, is an important tool for a molecular understanding of the diseases and can provide hints for a possible therapy, e.g., by small-molecule inhibitors of chromatin modifiers (Sect. 13.2). Most of its existence, homo sapiens was (and in part still is) populated by helminths, such as hookworms. These parasites are far larger than other types of microbes, such as bacteria and therefore require a different form of immune response. The central event of type 2 immune response is the direct and indirect activation of TH 2 cells (Fig. 23.3). This is often initiated by epithelial barrier injury, in the context of which damaged epithelial cells secrete the cytokines IL25, IL33 and TSLP (Sect. 15.5). These cytokines activate local DCs, which have taken up allergens passing the epithelium but also other antigens derived by damaged cells, parasites and bacteria, to move to a neighboring lymph node and to present there the processed allergen protein as peptides to naïve CD4+ T cells. In parallel, the same cytokines induce in local mast cells, basophils and ILC2s the early production of the cytokines IL4, IL5 and IL13. This set of cytokines triggers primed CD4+ T cells to differentiate into TH 2 cells with specificity to different types of presented antigens. Moreover, platelets at the site of injury secrete the protein DKK1 (Dickkopf WNT signaling pathway inhibitor 1) that also contributes to the development of TH 2 cells. The TH 2 cells then move to the tissue site of allergen exposure, secrete themselves IL4, IL5 and
23.2 Immunity of Allergies
389
Allergens
Parasites Mucus
Tuft cell Basophil
Platelets Damaged tissue
Mast cell
ILC2
Dendritic cell IL4, IL5 IL13
IL25, IL33, Translocated TSLP bacteria
Naïve CD4+ T cell
Eosinophil
blast DKK1
IL4, IL5, IL13
TH2
Fig. 23.3 Initiation of type 2 immune response. The central event in the initiation of type 2 immune response is the development of TH 2 cells. More details are provided in the text
IL13 and activate a number of cell types in their environment, such as macrophages, eosinophils, epithelial cell and myofibroblasts. This leads to inflammation, eosinophil recruitment and activation, intestinal mucus production and peristalsis as well as to fibrosis (Sect. 19.3). Mast cells, basophils and eosinophils are cells of the innate immune system that all derive from bone marrow. The cells have similar properties but also differ functionally in significant ways (Table 23.3). Under the influence of KITLG (KIT ligand) mast cells mature and found in tissues throughout the body, in particular in connective and mucosal tissues. In contrast, eosinophils and basophils are found in circulation but can be recruited under influences of IL3 and IL5, respectively, to tissue sites of allergen exposure. Mast cells survive up to months, i.e., far longer than basophils and eosinophils (days). Furthermore, mast cells and basophils express high levels of FcεRIs and their granules contain similar molecules, such as histamine, heparin, chondroitin sulfate and proteases. In contrast, eosinophils express lower amounts of FcεRIs and their granules release MBP, eosinophil cationic protein, peroxidases, hydrolases and lysophospholipase.
390
23 Immunological Hypersensitivities: Allergy and Autoimmunity
Table 23.3 Properties of mast cells, basophils and eosinophils Characteristic
Mast cells
Basophils
Eosinophils
Major site of maturation
Bone marrow precursors mature in connective tissue and mucosal tissues
Bone marrow
Bone marrow
Location of cells
Connective tissue and mucosal tissues
Blood (0.5% of blood leukocytes), recruited into tissues
Blood (2% of blood leukocytes), recruited into tissues
Life span
Weeks to months
Days
Days to weeks
Major growth and differentiation factors
KITLG, IL3
IL3
IL5
FcεRI expression
High
High
Low
Major granule contents Histamine, heparin, chondroitin sulfate, proteases
Histamine, chondroitin MBP, eosinophil sulfate, proteases cationic protein, peroxidases, hydrolases, lysophospholipase
The binding of cross-linked IgEs to FcεRIs activates at its cytoplasmatic carboxyterminus an ITAM (Fig. 23.4). This initiates a signal transduction cascade that involves binding of the tyrosine kinases SYK and LYN to the ITAMs of FcεRIs, the activation of PLCγ2, which catalyzes phosphatidylinositol bisphosphate breakdown to yield IP3 (inositol trisphosphate) and DAG, which in turn increases Ca2+ levels and PRKC activity. PRKC phosphorylates the myosin light chain protein, which promotes SNARE (soluble NSF attachment protein receptor) complex formation and fusion of granules with the membrane, so that their content is released to the environment of the mast cell. Furthermore, Ca2+ and MAPKs together activate the enzyme PLA2 (phospholipase A2) that hydrolyzes membrane phospholipids to release arachidonic acid, which is converted by the enzymes cyclooxygenase or lipoxygenase into different lipid mediators. Finally, the expression of the cytokine genes IL4, IL5, IL6, IL13 and TNF is regulated by the same signal transduction pathway as in B and T cells (Sects. 17.2 and 19.1) involving the transcription factors NFAT, NFκB and AP1. The effector functions of mast cells, basophils and eosinophils on their surrounding tissues and cell types are mediated by soluble molecules being spread from the activated cells (Fig. 23.5). Some of these mediators, such as biogenic amines like histamine and enzymes like tryptase, can be secreted very rapidly, i.e., within minutes, since they are preformed and stored in granules that after activation of the cell fuse with the membrane and release their content. In contrast, other mediators, such as lipids and cytokines, need first to be synthesized. While the formation of lipids is fast (i.e., takes only minutes), since it requires only a number of enzymatic reactions, the production of cytokine proteins need in total 2–4 h, as in this process gene activation, transcription and translation are involved.
23.2 Immunity of Allergies
391
FcRI FcRγ FcR1β
FYN
LYN
P P P SYK
P P
P
DAG
P P P
P PLCγ2 GRB2 P
GAB2 PI3K
Myosin light chain phosphorylation, granule movement
RAS/MAP kinases
Arachidonic acid
PRKC
P IP3 P P
S
SO
PLA
PIP2 P P
Ca2+ FOS JUN
Target genes
AP1
Nucleus
SNARE complex formation, membrane fusion
Granule
PGD , LTC Cytokines Secretion
Mast cell plasma membrane Exocytosis
PGD , LTE Lipid mediators
TNF, others Cytokines
Histamine Granule contents
Fig. 23.4 Signal transduction in mast cells. When cross-linked allergen-bound IgEs are recognized by FcεRIs, signal transduction via the protein tyrosine kinases SYK and LYN is initiated that via the pathways of MAPK and PLCγ2 activate cytokine gene expression. In parallel, Ca2+ and MAPK activate PLA2 that initiates the synthesis of lipid mediators and SNAREs that mediate degranulation. More details are provided in the text
392
23 Immunological Hypersensitivities: Allergy and Autoimmunity
Vasodilation
Vasoactive amines (e.g., histamine)
Vascular leak
Bronchoconstriction Lipid mediators (e.g., PAF, PGD , LTC ) Intestinal hypermobility
Cytokines (e.g., TNF) Lipid mediators (e.g., PAF, PGD , LTC ) Enzymes (e.g., eosinophil peroxidase)
Tissue damage
Cationic granule proteins (e.g., MBP, eosinophil cationic protein)
Killing of parasites and host cells
Enzymes (e.g., eosinophil peroxidase)
Tissue damage
Fig. 23.5 Mediators of immediate hypersensitivity. Mast cells and basophils act via vasoactive amines and lipids on blood vessels, airways and the gastrointestinal track, cause via cytokines and lipids inflammation and via enzymes tissue damage. Eosinophils use cationic granule proteins for killing parasites and cause via enzymes tissue damage. More details are provided in the text
The vasoactive amine histamine is released from granules of activated mast cells and binds to specific receptors on blood vessel and smooth muscle cells. Histamine causes the contraction of the endothelial cells, which leads to increased vascular permeability and leakage of plasma into the tissues. Moreover, the molecule acts as vascular smooth muscle cell relaxant causing vasodilation and produces the wheal-and-flare response of immediate hypersensitivity (Box 23.6). Nevertheless, the actions of histamine are only short-term, since it is rapidly removed by specific transporters from the extracellular milieu. The rapid de novo synthesis and
23.2 Immunity of Allergies
393
release of lipid mediators affects blood vessels, bronchial smooth muscle and leukocytes, i.e., they act as vasodilators, bronchoconstrictors or inducers of inflammation. Most of the lipids are derived from the polyunsaturated fatty acid arachidonic acid, which is metabolized by cyclooxygenases to PGD2 or by lipoxygenases to LTC4. Moreover, on the basis of membrane mast cells and basophils synthesize PAF (platelet-activating factor), which causes bronchoconstriction, retraction of endothelial cells and relaxation of vascular smooth muscle. Granules also contain preformed enzymes, such as neutral serine protease tryptase that cleaves and activates collagenase causing tissue damage as well as chymase that degrades epidermal basement membranes and stimulates mucus secretion. Moreover, the granules of mast cells and basophils contain proteoglycans like heparin and chondroitin sulfate that control via the binding of histamine the kinetics of immediate hypersensitivity reactions. Mast cells produce cytokines, such as TNF, IL1β, IL3, IL4, IL5, IL6, IL9, IL13, CCL3, CCL4 and CSF2 (colony-stimulating factor 2), that contribute to the late-phase reaction of allergic inflammation. Eosinophils are recruited to late-phase reaction sites and release upon activation cationic granule proteins, such as MBP and eosinophil cationic protein, that damage the envelop of helminths, bacterial cell walls as well as cells in normal tissues. Furthermore, the granules of eosinophils contain an eosinophil peroxidase that produces hypochlorous or hypobromous acid are toxic to helminths, protozoa as well as host cells. Moreover, eosinophils also release lipid mediators and cytokines. Box 23.6: Wheal-and-Flare Reaction A simple test of an individual for possible allergic reactions is the wheal-and-flare reaction. It involves the intradermal injection of one or multiple allergens. Individuals who have previously encountered the one or other of these allergens will have mast cells residing in the dermis that are loaded with IgEs specific for them. Then the injection site will first become red as a result of locally dilated blood vessels and then rapidly swells due to leakage of plasma from the venules. The swelling is called a wheal and may get an extension of several centimeters. In the following, blood vessels at the margins of the wheal dilate and become engorged with red blood cells, which produces a red rim referred to as flare. The full reaction normally appears within 5–10 min and disappears within 1 h. It demonstrates immediate hypersensitivity and depends on IgEs and mast cells discharging histamine. Since mast cells in the skin produce only lower amounts of lipid mediators the wheal-and-flare response subsides rapidly. During recent centuries increased hygiene as well as cooking of meals substantially decreased the exposure helminths, while the ability of IgE- and TH 2 cellmediated response persisted. This seems to be the main reason why today’s 30% of the population of industrialized countries have allergies and this prevalence is further increasing. Thus, the exposure to microbes in the training phase of the immune system during childhood seems to be critical not to develop allergies. This is
394
23 Immunological Hypersensitivities: Allergy and Autoimmunity
the basis of the so-called hygiene hypothesis suggesting that early-life exposure to environmental and commensal microbes allows a better maturation of the immune system including sufficient amounts of TREG cells. This may reduce the frequency and intensity of type 2 immune responses later in life. Nevertheless, it is not fully understood, why proteins from common environmental sources, such as dust mites and pollen, cause a type 2 immune response and not a type 1 or type 3 response like against intra and extracellular microbes, respectively, which involves the activation of macrophages, DCs, TH 1 or TH 17 cells (Sect. 23.5). An important difference is the repeated exposure that are an essential condition for initiating the type 2 immune response. Another important factor is the genetic susceptibility to allergies, i.e., relatives of persons with allergy also have more likely immediate hypersensitivities. The genetic risk for allergies is based on complex gene-environment interactions, i.e., changes in the environmental exposure with microbes and/or chemicals (including drugs and air pollution) are so rapid that they are not counterbalanced by genetic adaptations. One cluster of genes, variations of which show a significantly increased risk for allergies, is in chromosome 5 and contains the cytokine genes IL4, IL5, IL9 and IL13. In addition, genetic variations of the IL33 gene are strongly associated with asthma. All these cytokines majorly contribute to the type 2 immune response.
23.3 Type 2 and 3 Hypersensitivities Autoimmune diseases that are primarily mediated by antibodies are mediated either by antibodies that bind to particular cell types (type 2 hypersensitivity) or by antigen–antibody complexes in the circulation that attach to vessel walls (type 3 hypersensitivity). Diseases that are based on type 2 hypersensitivity are mostly organ-specific, since the respective autoantibodies (mainly IgMs and IgGs) have a specific target. The three major effector mechanisms that antibodies use against pathogens (Sect. 20.2) do apply also to antibody-mediated diseases: • Opsonization and phagocytosis (Fig. 23.6a): Autoantibodies that bind surface molecules of circulating cells can opsonize them, which either recruits phagocytes, such as neutrophils, directly by FcRs or indirectly via the activation of proteins of the complement system and receptors for C3b. In both cases the cells are eliminated by phagocytosis. This mechanism of cell destruction is observed in autoimmune hemolytic anemia and autoimmune thrombocytopenia, in which autoantibodies against erythrocytes or platelets, respectively, circulate in respective patients. Complement proteins can also directly kill the cells via the membrane attack complex, as observed in hemolysis after transfusion of inappropriate blood groups (Sect. 22.2). • Inflammation (Fig. 23.6b): Autoantibodies that recognize tissues, basement membranes and extracellular matrix activate complement proteins, breakdown products of which recruit macrophages and neutrophils. These leukocytes bind
23.3 Type 2 and 3 Hypersensitivities
a
395
Opsonization and phagocytosis
C1
Phagocytosis of whole cell
Complement activation C3b receptor
C3b
FcR
Antigen
b Complement activation
Antigen
c
Leukocyte activation
Complement by-products (C5a, C3a)
Abnormal physiologic responses without cell / tissue injury Nerve ending Antibody against TSH receptor
Acetylcholine (ACh) TSH receptor
Thyroid epithelial cell
Antibody against ACh receptor ACh receptor
Thyroid hormones
Antibody stimulates receptor without hormone
Antibody inhibits binding of neurotransmitter to receptor
Fig. 23.6 Type 2 hypersensitivities. Antibody-mediated diseases act either via opsonization and phagocytosis (a), complement- and FcR-mediated inflammation (b) or abnormal physiologic responses (c). More details are provided in the text
via FcRs the autoantibodies or by CRs the tissue-bound complement proteins and cause local inflammation and tissue injury. Glomerulonephritis is an example of such an antibody-mediated autoimmune disease.
396
23 Immunological Hypersensitivities: Allergy and Autoimmunity
• Abnormal cellular functions (Fig. 23.6c): Autoantibodies that specifically recognize either membrane-bound hormone receptors or neurotransmitter receptors interfere with the normal function of these receptors. For example, in Graves’ disease (Fig. 23.6c, left) autoantibodies against the receptor of the peptide hormone TSH (thyroid stimulating hormone) activate the receptors even in the absence of TSH, which causes hyperthyroidis, i.e., too high T3 release. In myasthenia gravis (Fig. 23.6c, right), autoantibodies against the receptor of the neurotransmitter acetylcholine block the activation of muscle cells, i.e., the muscles are paralyzed. Furthermore, autoantibodies against the protein CBIF (cobalamin binding intrinsic factor), which is essential for vitamin B12 absorption, cause pernicious anemia. Moreover, type 2 hypersensitivity can occur due to: • a so-called innocent bystander damage in connection to an immune response to a foreign antigen • a foreign antigen that binds to host tissue like drug hypersensitivity reactions • a molecular mimicry where microbial antigens have a similar molecular structure as host tissue. For example, rheumatic fever is caused by an antibody against Streptococcus pyogenes, which also recognizes heart, joint and brain tissue. Type 3 hypersensitivities, i.e., autoimmune diseases caused by immune complexes, often affect multiple tissues and organs, since the target of the antibodies are circulating protein complexes, so that disease symptoms like vasculitis occur at multiple sites of immune complex deposition. However, capillaries in renal glomeruli and synovia are the most common sites of immune complex deposition, since plasma is ultrafiltered there, i.e., kidneys are often targets of immune complexmediated diseases. Most normal immune responses produce immune complexes, but only when they are produced in excessive amounts and not efficiently cleared by phagocytosis, they may cause disease. Small immune complexes more likely escape phagocytosis. Moreover, when immune complexes contain cationic antigens, they bind more efficiently anionic components of blood vessels and tissues, which increases the risk to produce severe and long-lasting tissue injury. In addition, the deposition of immune complexes activates leukocytes and mast cells to secrete cytokines and vasoactive mediators, which causes more immune complex deposition in vessel walls. The immune complexes contain either self-antigens or foreign antigens that are specifically recognized by antibodies. Examples of respective diseases are: • Serum sickness: Animals, such as rabbits, sheep or horses, are often exposed to large doses of a foreign protein antigen, in order to produce polyclonal antibodies. The antibodies bind to the circulating antigen and form immune complexes, some of which are deposited in the walls of blood vessels. At these sites, neutrophils recognize via FcRs the immune complexes and cause local inflammation. This damages endothelial cells, lining the vessels, and promotes thrombus formation, i.e., the blood flow to tissues and organs is impaired so that they may undergo
23.4 T Cell-Mediated Autoimmunity
397
necrosis. This man-made serum disease of animals is a master example of an immune complex-mediated disease. In human, the clinical symptoms of acute serum sickness are arthritis and nephritis as well as skin rashes, which occur only for shorter time until lesions heal (or the antigen is injected again to animals). • SLE (Fig. 23.7): In this chronic systemic autoimmune disease immune complexes of nuclear antigens, such as DNA, histones and ribonucleoproteins and antibodies against these protein deposit in small arteries and capillaries throughout the body and are responsible for glomerulonephritis, arthritis and vasculitis. The disease affects 10-times more likely females than males. Like in other autoimmune diseases, genetic and environmental factors contribute to the breakdown of tolerance of self-reactive B and T cells in SLE. Key risk genes are HLA-DR2 and HLA-DR3 as well as genes encoding for complement proteins C1 C2 and C4.
23.4 T Cell-Mediated Autoimmunity Type IV hypersensitivity describes autoimmune diseases that are caused primarily by the reaction of T cells against host tissue. This tissue injury is either mediated by TH 1 cells and/or TH 17 cells, which via the secretion of cytokines stimulate macrophages and neutrophils to initiate an inflammatory reaction like fighting against microbes (Fig. 23.8a), or by cytotoxic T cells, which directly target tissues like eliminating virus-infected or tumor cells (Fig. 23.8b). Although inflammation is a defense mechanism of innate immune cells (Sect. 15.4), it becomes more severe and chronic when T cells are involved. For example, this is used in the fight of T cells against intracellular bacteria, such as Mycobacterium tuberculosis (Sect. 20.3), where a strong T cell and macrophage response results in granulomatous inflammation and fibrosis. The intensive tissue destruction in the lungs caused by T cells is more severe than the effects of the bacteria themselves. TH 1 cells secrete IFNγ that activates macrophages and TH 17 cells produce IL17 for the recruitment of neutrophils. Aggressive molecules, such as lysosomal enzymes and ROS, which are secreted by activated macrophages and neutrophils, then cause tissue injury. The damage is extended and becomes chronic through the recruitment of additional immune cells to the lesions via cytokine secretion by the phagocytes. These inflammatory reactions, which are also referred to as delayed-type hypersensitivity (because in contrast to immediate hypersensitivity (Sect. 23.2) it occurs 24–48 h after antigen challenge) are the mechanistic basis of autoimmune diseases, such as rheumatoid arthritis, MS, T1D and psoriasis (Box 23.1). Cytotoxic T cells contribute to the tissue injury in these diseases, e.g., in T1D, where specifically insulin producing β cells in pancreatic islets are destroyed. In the context of SLE (Sect. 23.3), we already started to discuss the interference of environmental and genetic factors for the onset of autoimmune diseases. Infectious diseases are an important environmental trigger for autoimmunity (Fig. 23.9). The adaptive immune system has developed with central and peripheral tolerance (Sect. 22.1) protection mechanisms to avoid harm to the host by self-reactive B and T cells. This includes the elimination of these cells by the induction of apoptosis, their
398
23 Immunological Hypersensitivities: Allergy and Autoimmunity
External triggers (e.g., UV radiation)
Susceptibility genes
Apoptosis
Defective clearance of apoptotic bodies
Increased burden of nuclear antigens
Anti-nuclear antibody, antigen-antibody complexes
Endocytosis of antigen-antibody complexes TLR engagement of nuclear antigen in endosomes
Stimulation of B cells and dendritic cells
Type I IFNs
Persistent high-level anti-nuclear IgG antibody production
Fig. 23.7 SLE: an example for type 3 hypersensitivity diseases. The onset of SLE is explained by the interference of susceptibility genes with environmental triggers, such as UV radiation, leading to apoptosis of cells and the persistence of nuclear antigens. The inadequate clearance of the nuclear antigens results in an antibody response against them, which is amplified by the activation of DCs and B cells with TLRs that recognize DNA and RNA (TLR9 and TLR7, respectively)
23.4 T Cell-Mediated Autoimmunity
399
a Cytokines
Tissue injury Neutrophil enzymes, ROS
CD4+ T cell Tissue antigenpresenting cell
Normal tissue
b
T cell-mediated cytotoxicity Cell killing and tissue injury Cytotoxic T cells
Fig. 23.8 T cell-mediated autoimmune diseases. Type 4 hypersensitivity reactions, CD4+ T cells (and sometimes CD8+ cells) respond to tissue antigens by secreting cytokines that stimulate inflammation and activate phagocytes, which leads to tissue injury (a). In some diseases, cytotoxic T cells directly kill tissue cells
downregulation by TREG cells and the induction of functional anergy (Fig. 23.9a). The latter is achieved primarily by preventing the presentation of costimulatory proteins within the immune synapse, so that the self-reactive lymphocyte is not sufficiently activated that it may cause harm. However, when antigen-presenting cells that display self-peptides to self-reactive lymphocytes experience the infection with an unrelated microbe, they express costimulatory proteins like CD80 or CD86. Although these costimulators are meant in response to the microbe infection, they also active self-reactive lymphocytes, which then cause autoimmunity (Fig. 23.9b). It may be that even commensal microbes (Sect. 20.4) have effects on the development of autoimmune diseases. Interestingly, there is the possibility that peptides deriving from a microbial antigen resemble self-peptides. Due to this molecular mimicry, self-reactive T cells will be fully activated both by the presentation of the microbial peptide on MHC proteins as well as by the presence of costimulatory proteins (Fig. 23.9c). The observation that some 50% monozygotic twins but only 5% of dizygotic twins develop both T1D indicates that autoimmune diseases have a strong genetic component. However, most autoimmune diseases are based on the variations of multiple genes, each of which contributing only to a few percent of the disease
400
23 Immunological Hypersensitivities: Allergy and Autoimmunity
a
“Resting” tissue dendritic cell
Self-tolerance
Self antigen T cell
Selftolerance
b CD80 CD28
Activation of antigenpresenting cell
Autoimmunity
Expression of co-stimulators on dendritic cell
Self-reactive T cell
Self antigen
Self tissue
c Autoimmunity
Microbial peptide Self-reactive T cell that recognizes microbial peptide Activation of T cells
Molecular mimicry
Self antigen
Peptide
Microbial protein
Self protein
Self tissue
Fig. 23.9 Infections and the onset of autoimmunity. Peripheral tolerance mechanisms, like the lack of costimulatory molecules on antigen-presenting cells, inactivate mature self-reactive T cells by inducing their anergy (a). However, when additional stimuli, such as microbe infections, induce the expression of costimulatory molecules, the self-reactive T cells are activated and harm host tissue (b). When by chance microbial proteins result in the same peptides as self-proteins, this molecular mimicry can activate self-reactive T cells and cause autoimmunity (c)
risk. Some genomic risk loci, such as the HLA gene cluster, are shared between many autoimmune disorders, since they encode for proteins that mediate general mechanisms of immune regulation and self-tolerance. For example, the HLA locus contribute in some autoimmune disease to some 50% of the genetic risk. An extreme example is that of the inflammatory and autoimmune disease ankylosing spondylitis affecting vertebral joints, where carriers of the HLA allele B27 (encoding for MHC I)
23.4 T Cell-Mediated Autoimmunity
401
have a 100-time higher risk than non-carriers. In contrast, other loci are diseasespecific, such as the INS (insulin) gene and may primarily affect organ-specific proteins that yield self-antigens. The major T cell-mediated autoimmune diseases are: • Psoriasis: is a chronic IL17-mediated inflammatory disease that primarily involves the skin, but sometimes also affects joints. Possible self-antigens are the antimicrobial protein CAMP and a keratin. The IL23R gene, which is critical for TH 17 development, has the most significant association with the disease and further promotes the inflammatory response. • Rheumatoid arthritis: is an inflammatory disease affecting small and large joints of arms and legs. The synovitis leads to the destruction of cartilage, ligaments and tendons of the joints involving cytokines produced by TH 1 and TH 17 cells. However, since activated B cells and plasma cells are often present in the synovia of affected joints, also self-reactive antibodies contribute to the disease. Some of these are specific for citrullinated proteins, i.e., proteins that in the inflammatory environment have arginine residues converted to citrulline. This protein modification leads new self-peptides, which had not been negative selected by central tolerance. Genetic susceptibility to rheumatoid arthritis is linked to the HLA-DR4 allele, encoding for MHC II protein presenting these neoantigens. • MS: is the most common neurologic disease of young adults, in which TH 1 and TH 17 cells react against the protein myelin basic protein. This results in inflammation that via macrophages destroys the myelin insulation of nerves leading to abnormalities in nerve conduction (Fig. 23.10). The clinical symptoms of the disease are weakness, paralysis and ocular symptoms. The HLA allele DRB1 ∗ 1501 shows the strongest linkage to the disease, but more than 100 risk SNVs are known. For example, HLA-DR15 allows myelin basic protein peptide-specific T cells to escape negative selection in the thymus. • T1D: is a metabolic disease resulting from inflammation mediated by TH 1 cells reactive to insulin and cytotoxic T cells destroying the INS-producing β cells. Continuous insulin replacement therapy is needed, otherwise it leads to microvascular obstruction causing damage to the retina, renal glomeruli and peripheral nerves. The HLA alleles DR3 and DR4 are the strongest genetic risk factors for T1D. • IBD: is a heterogeneous group of disorders, like Crohn’s disease and ulcerative colitis, that are associated with chronic remitting inflammation in the small or large intestine as a result of abnormal responses of TH 1 and TH 17 cells to the gut microbiome due to insufficient suppression by TREG cells. • Celiac disease: is an inflammatory disease of the intestinal mucosa that leads to atrophy of villi, malabsorption and nutritional deficiencies. It is caused by the responses of TH 1 and TH 17 cells against the protein gliadin of the gluten group that is present in wheat and other grains and cytotoxic T cells that kill epithelial cells of the intestine. The gut microbiome contributes to the disease, which is treated
402
23 Immunological Hypersensitivities: Allergy and Autoimmunity
EBV and mononucleosis Other viruses Risk genes Low vitamin D level Temperate latitude Fibrinogen Toxins Trauma Smoking Obesity Early adulthood Female gender
Demyelination
Axonal loss
Low
High
Few spinal cord lesions, Good endogenous repair Preserved axons and synapses Early treatment Younger age
Many spinal cord lesions Poor endogenous repair Mitochondrial dysfunction Extensive axon and synapse loss Delay in treatment Older age
Chance of progression
Fig. 23.10 MS. The T cell-mediated autoimmune disease MS is a complex disorder, the onset of which is triggered by a combination of genetic and environmental factors (top). MS is associated with inflammatory, demyelinating lesions with heterogeneous axonal loss (center). The different features of the lesions and their consequences can be salutary or deleterious and modify the risk of disease progression (bottom)
by avoidance of dietary gluten. The risk for celiac disease is strongly associated with the HLA alleles DQ2 and DQ8. The therapy of these diseases is discussed in Box 23.7.
23.5 The Equilibrium Model of Immunity
403
Box 23.7: Treatment of Autoimmune Diseases A general therapy for autoimmune diseases are antiinflammatory drugs (Sect. 22.3), such as corticosteroids and non-steroidal compounds, that reduce the expression of cytokine genes and other mediators of inflammation. A more specific approach is the use of specific antagonists of cytokines like TNF, which are beneficial against rheumatoid arthritis, Crohn’s disease and psoriasis. In addition, monoclonal antibodies (Sect. 33.3) directed against the IL6 receptor are effective against arthritis and others are approved against TH 2 cytokines for the treatment of allergies. Moreover, monoclonal antibodies are used to treat inflammatory diseases by the depletion of different types of lymphocytes. For example, the depletion of B cells by an anti-CD20 antibody (rituximab) is efficient in the treatment of rheumatoid arthritis and MS. In addition, tolerance-inducing therapies are in development, where the specific antigens of organ-specific autoimmune diseases like myelin basic protein and insulin in case of MS and T1D, respectively, are used to inhibit possible self-reactive lymphocytes. In general, a serious side effect of blocking different functions of the immune system is that the patient has higher susceptibility to infectious disease or reduced cancer surveillance. Inappropriate activation of the immune system can lead to a number of diseases, such as the allergic reactions of the respiratory tract in asthma or the autoimmune disease MS. Immune responses often vary in the balance of proinflammatory and antiinflammatory cytokines, i.e., in the amount of possible collateral tissue damage. Thus, gene expression patterns and the underlying epigenetic programing of immune cells are key factors in immune-mediated diseases. Accordingly, individuals with autoimmune and/or inflammatory diseases have a clearly different epigenetic profile than healthy controls. For example, altered DNA methylation patterns of immune cells occur in multiple immune-mediated diseases, such as MS, SLE or Crohn’s disease. Patients with MS, in comparison to healthy individuals, show lower levels of 5hmC marks in their immune cells due to low expression of the demethylase TET2. In contrast, SLE patients often have elevated 5hmC levels due to increased expression of TET2 and TET3 in TH cells. This parallels with low global H3 and H4 acetylation and high H3K9 methylation levels in these cells.
23.5 The Equilibrium Model of Immunity Immune responses often represent equilibria between antagonizing cells and molecules, such as activating and inhibitory coreceptors of the immune synapse (Sect. 19.1), pro- and antiinflammatory cytokines (Sect. 22.1) or M1- and M2-type macrophages (Sect. 15.4). Moreover, the interaction of immune cells and antibodies at the intestinal mucosa with symbiotic members of the gut microbiome (Sect. 20.4)
404
23 Immunological Hypersensitivities: Allergy and Autoimmunity
a Type 3 response
Type 2 response
Large extracellular microbes
IL25, IL33, TSLP
IL1β, IL23 IL4, IL5, IL13
Type 1 response IL12
Smaller extracellular microbes
IL17, IL22 TGFβ
INFγ
Exclusion of microbes
Intracellular viruses and bacteria as well as cancer cells
b
ILC1
TH1
ILC2
ILC3
Macrophage M1-type
NK
CTL
TH2
TH17
Macrophage M2-type
Health
1
2
Type 4 response
3
Autoimmunity
4
1
2
3
Dendritic cell
Allergy
4
1
2
3
4
Type of response
Fig. 23.11 The equilibrium model of immunity. The model assumes that the immune system relies on a dynamic equilibrium between four types of competing and mutually inhibitory immune responses (a). Accordingly, in health the four types of immune responses are in an equilibrium (b, left), while in autoimmunity type 3 immune response is prominent (b, center) and in allergy type 2 immune response (b, right)
is a master example of constant actions and reactions, which are in an equilibrium. In addition, in a healthy immune system, effector T cells are in an equilibrium with TREG cells (Sect. 22.1) involving numerous activating and inhibitory cytokines and surface proteins produced by both cell types. Finally, different types of effector T cells, such as TH 1, TH 2 and TH 17 inhibit each other in their action (Sect. 19.3). Based on these and other observation, the equilibrium model of immunity is proposed as an approach to summarize all major immune responses in health and disease. The model is based on the assumption that the immune system of a healthy person is constantly active, in order to reach a dynamic equilibrium, i.e., a balance between four types of immune responses (Fig. 23.11a). These are: • Type 1 immune responses against viruses (Sect. 21.1) and intracellular bacteria (Sect. 21.3) as well as against tumors (Chap. 33). This response is triggered by
23.5 The Equilibrium Model of Immunity
405
DCs and macrophages producing IL12, activates first NK cells and ILC1s as well as later TH 1 cells and cytotoxic T cells. The main effector molecules are IFNγ, perforin and ROS. • Type 2 immune responses against large extracellular microbes, such as helminths (Sect. 21.2). These responses are pushed by IL25, IL33 and TSLP leading first to the activation of ILC2s and then to the development of TH 2 cells. The key effectors are IL4, IL5 and IL13 as well as M2-type macrophages for tissue repair. • Type 3 immune responses against smaller extracellular microbes, such as bacteria and fungi (Sect. 20.1). This response is initiated by IL1β and IL23 that are secreted by DCs and macrophages and activates ILC3s and TH 17 cells. Effector functions are the production of IL17 and IL22, the secretion of antimicrobial peptides and the recruitment of neutrophils. • Type 4 immune response blocks microbes before they reach sensitive tissues. This response is started by the secretion of TGFβ1 and primarily mediated by secretory IgA in the intestinal lumen as well as in tears, saliva, sweat and other secretions. Other effectors are mucus and antimicrobial peptides. The equilibrium depends on the immunophenotype (Sect. 20.2) of the individual and his/her exposure to microbes of the environment. An individual gets ill, when the system gets in a disequilibrium and returns to health, when again homeostasis, i.e., an equilibrium, is reached (Fig. 23.11b, left). The activation of one type of immune response inhibits the other types, i.e., the responses are competing with each other. With help of the equilibrium model complex immune phenomena, such as autoimmunity, allergy and tolerance, may be better understood: • Through the production of IFN type 1 immune responses are involved in SLE and T1D, type 2 immune responses drive allergy and fibrosis via IL4, IL5 and IL13, while type 3 immune responses mediate through IL17 autoimmune inflammatory diseases, such as rheumatoid arthritis and MS (Fig. 23.11b, center). • The hygiene concept (Sect. 23.2) suggests that via better hygiene, vaccines and antibiotics the exposure to pathogenic as well as commensal microbes is reduced, i.e., there are less type 1 and 3 immune responses. The immune system reacts to this change by allowing type 2 immune responses to get dominant, which may cause allergies (Fig. 23.11b, right). • The loss of type 3 immune response by dysbiosis of the microbiome after excessive use of antibiotics (Sect. 20.4) increases the risk for autoimmune diseases like SLE and T1D that are mediated by type 1 immune responses. • The immune system uses type 1 immune responses via cytotoxic T cells to fight against cancers (Sect. 33.1), while tumor cells often try to counterbalance this by inducing a type 3 immune responses, e.g., through the activation of neutrophils that inhibit the activation of tumor-specific cytotoxic T cells. • Instead of understanding immune tolerance (Sect. 22.1) as a mechanism to avoid inflammatory pathology, it may rather reflect the inhibition of one type of immune response by another type.
406
23 Immunological Hypersensitivities: Allergy and Autoimmunity
(Clinical) Conclusion: The different types of hypersensitivities of the immune system are the basis of a number of autoimmune disorders that affect some 10% of the world population. Immune hypersensitivities are based on insufficient training of immune cells and failures of the immune tolerance system. Types I-III of immune hypersensitivities are caused primarily by a failure in antibody producing B cells, while classical autoimmune diseases (type IV) are more a problem of T cells.
Additional Reading Bach, J. F. (2018). The hygiene hypothesis in autoimmunity: The role of pathogens and commensals. Nature Reviews Immunology, 18, 105–120. Baecher-Allan, C., Kaskow, B. J., & Weiner, H. L. (2018). Multiple sclerosis: Mechanisms and immunotherapy. Neuron, 97, 742–768. Chang, J. T. (2020). Pathophysiology of inflammatory bowel diseases. New England Journal of Medicine, 383, 2652–2664. Dendrou, C. A., Petersen, J., Rossjohn, J., & Fugger, L. (2018). HLA variation and disease. Nature Reviews Immunology, 18, 325–339. Eberl, G. (2016). Immunity by equilibrium. Nature Reviews Immunology, 16, 524–532. Lambrecht, B. N., & Hammad, H. (2017). The immunology of the allergy epidemic and the hygiene hypothesis. Nature Immunology, 18, 1076–1083. Renz, H., & Skevaki, C. (2021). Early life microbial exposures and allergy risks: Opportunities for prevention. Nature Reviews Immunology, 21, 177–191.
Chapter 24
Introduction to Cancer
Abstract In this chapter, cancer is discussed as the second leading cause of death that globally kills nearly 10 million people every year. In this context, we will have to realize, that one in two of us will be diagnosed with cancer at some point of his/her life. Malignant tumors can arise from different tissues and organs, thus there are many different types of cancer. In all of them the normal control of cell division is lost, so that an individual cell multiplies inappropriately forming a primary malignant tumor. The cancer cells may eventually spread through the body and form potentially deadly metastases. The most promising strategy for reducing both, the number of cancer cases as well as their mortality, are preventive interventions like eliminating exposure to carcinogens, such as tobacco smoke. Keywords Non-communicable diseases · Mortality rates · Cancer driver genes · Tumorigenesis · Cancer prevention
24.1 The Global Burden of Cancer Non-communicable diseases contribute to more than 73% of deaths worldwide and even to a higher percentage in industrialized countries. In contrast, infectious (communicable), maternal, neonatal and nutritional diseases account only for less than 19% of worldwide deaths and injuries for 8%. In 2017 worldwide 17.8 million persons were dying from CVD, while neoplasms killed 9.6 million humans representing 17.1% of worldwide deaths (Fig. 14.1, top). For comparison, in an industrialized country, such as Finland, the rate of cancer death was even 24.4% (Fig. 14.1, bottom). In the past, cancer was seldomly the cause of death, since the average human life expectancy was far shorter and people died from other causes than cancer. However, medical care significantly changed during the last 100 years leading to drastic improvements in life expectancy. Unfortunately, this caused an increase in the overall burden of cancer and accordingly to a far higher number of cancer cases. The leading type of lethal cancer was lung and broncheal cancer with 1.9 million yearly victims followed by colorectum cancer (0.9 million deaths). Importantly, both © The Author(s), under exclusive license to Springer Nature Switzerland AG 2023 C. Carlberg et al., Molecular Medicine, https://doi.org/10.1007/978-3-031-27133-5_24
407
408
24 Introduction to Cancer
groups of cancer are to 70–90% preventable (Sect. 24.5). Accordingly, smoking, obesity and unhealthy diet belong to the major risk factors for death, both worldwide and in Finland (Fig. 24.1). Importantly, tobacco smoking is the single most important cancer-related lifestyle factor, stopping of which would have the largest benefit, not only on the rate of cancer, but it also would significantly reduce the risk of cardiovascular, lung and kidney diseases.
High blood pressure Smoking High blood sugar Air pollution (outdoor & indoor) Obesity Outdoor air pollution Diet high in sodium Diet low in whole grains Alcohol use Diet low in fruits Diet low in nuts and seeds Indoor air pollution Diet low in vegetables Diet low in seafood ω-3 fatty acids Low physical activity Unsafe water source Secondhand smoke Low birth weight Child wasting Unsafe sex Poor sanitation No access to handwashing facility Drug use Diet low in legumes Low bone mineral density Child stunting Diet low in calcium Non-exclusive breastfeeding Diet high in red meat Discontinued breastfeeding
High blood pressure High blood sugar Obesity Smoking Diet low in whole grains Diet low in nuts and seeds Alcohol use Diet low in vegetables Diet high in sodium Low physical activity Diet low in fruits Diet low in seafood ω-3 fatty acids Diet low in legumes Air pollution (outdoor & indoor) Outdoor air pollution Drug use Low bone mineral density Secondhand smoke Diet low in calcium Unsafe sex Diet high in red meat Low birth weight Indoor air pollution No access to handwashing facility Child wasting Unsafe water source Poor sanitation Non-exclusive breastfeeding Child stunting Discontinued breastfeeding
10.44 million 7.1 million 6.53 million 4.9 million 4.72 million 3.41 million 3.2 million 3.07 million 2.84 million 2.42 million 2.06 million 1.64 million 1.46 million 1.44 million 1.26 million 1.23 million 1.22 million 1.1 million 1.08 million 1.03 million 873,408 774,241 707,248 585,348 534,767 327,314 232,777 220,678 184,760 160,983 59,882 28,595 24,833 10,012
World: Risk factors for death
12,136 8,901 6,022 5,639 2,900 2,577 2,332 1,930 1,896 1,882 1,875 1,505 1,161 1,130 1,127 1,118 659 613 325 136 118 32 31 18 5 4 1 25. In 90–95% of all cases, hypertension results from a complex interaction of genes and environmental factors. GWAS identified more than 30 common SNPs with small effects on blood pressure. In addition, there are some rare genetic variants with large effects, which converge on a
1
Vision 2 problem
Blood pressure category
Systolic mm Hg Diastolic mm Hg (upper level) (lower level)
Normal
less than 120
and less than 80
Pre-hypertension
120-139
or 80-89
Hypertension, stage 1
140-159
or 90-99
Hypertension, stage 2
160 or higher
or 100 or higher
Hypertensive crisis
higher than 180
or higher than 110
Blood vessel damage
3
Stroke
Heart attack
5
4
Kidney failure
Fig. 41.1 Hypertension and its complications. Systolic blood pressure indicates how much pressure blood is exerting against the artery walls while the heart is pumping blood. The diastolic blood pressure measures the pressure while the heart is resting between beats. The ranges for normal blood pressure, pre-hypertension, hypertension (stages I and II) and hypertensive crisis are defined. Hypertension increases the risk of ischemic heart disease, strokes, peripheral vascular disease and other CVDs, including heart failure, aortic aneurysms, diffuse atherosclerosis and pulmonary embolism. It is also a risk factor for cognitive impairment and dementia as well as for chronic kidney disease. Other complications include hypertensive retinopathy and hypertensive nephropathy
41.2 Mechanisms of Atherosclerosis
655
common pathway that alters blood pressure by changing the net renal salt balance. This emphasizes salt homeostasis in the kidney as a key risk factor for hypertension. Since humans originated from a notoriously salt-poor environment of sub-Saharan Africa (Sect. 1.1), gene variants that promoted salt and water retention provided a strong adaptive advantage. Nowadays, our body’s biochemistry is still not fully adapted to the rather high salt load of our diet. Therefore, after a salty meal increased salt reabsorption in the kidneys requires water reabsorption, in order to maintain plasma sodium concentration at 140 mM. This results in an increased intravascular volume boosting venous blood return to the heart. Thus, dietary factors significantly reduce blood pressure: reduced dietary salt intake as well as increased consumption of fruits and low fat food, exercise, weight loss and reduced alcohol intake (Sect. 35.4).
41.2 Mechanisms of Atherosclerosis The endothelium is a single layer of endothelial cells that covers blood vessels and serves as a barrier between the circulating blood and subendothelial tissues. In atherosclerosis, cholesterol deposition below the endothelium causes a macrophagedominated inflammatory response in large and medium arteries. Atherosclerotic plaques tend to accumulate at the inner curvatures and branch points of arteries, i.e., at positions where laminar flow is either disturbed or insufficient, in order to maintain the normal, quiescent state of the endothelium. Some atherosclerotic lesions can develop already in the first years of life and 95% of humans by the age of 40 have some type of lesion. However, in most cases clinical manifestations do not occur before the age of 50–60 years. A first sign of lesion formation is the accumulation of cholesterol within the arterial wall, referred to as fatty streaks. This is initiated by LDLs, which are cholesterol-rich, APOB-containing lipoproteins (Sect. 41.3). When LDLs are modified by oxidation, enzymatic and non-enzymatic cleavage and/or aggregation, they become proinflammatory and stimulate endothelial cells to produce chemokines, such as CCL5 and CXCL1, glycosaminoglycans and selectin P for the recruitment of monocytes. Hypercholesterolemia (Sect. 41.3) and cholesterol accumulation in HSCs promote the overproduction of monocytes and their increased adherences to endothelial cells (Fig. 41.2). The monocytes then move into the space below the endothelial cells, referred to as “intima”, where they differentiate into macrophages. These macrophages ingest normal and modified lipoproteins, such as oxidized LDL, which at the onset of the inflammatory response is a beneficial clearance. In addition to hypercholesterolemia, also immunological and mechanical injuries, as well as bacterial and viral infections, contribute to the pathogenesis of atherosclerosis via the recruitment of macrophages. When the inflammation turns chronic, the macrophages transform into cholesterol-laden foam cells (Box 41.1). These foam cells persist in plaques, i.e., they have lost their ability to migrate and cannot resolve inflammation.
656
41 Heart Disease and the Metabolic Syndrome
Cross-section of artery Progressing plaque
Lumen
Regressing plaque Collagen
Necrotic core Circulating monocytes
Adhesion
Chemokine gradient
Reverse transmigration Migration
Apoptosis
Proliferation ER stress
Netrin 1 Semaphorin 3E Cadherins
Macrophage
CD36
ABCA1 UNC5B
CCR7 Macrophage emigration
Lipid unloading Intima
Foam cell
Oxidized LDL
Native MSR1 LDL
Chemostasis
Media
Fig. 41.2 Monocyte recruitment and accumulation in plaques. Hyperlipidemia increases the number of monocyte subsets that are recruited to atherosclerotic plaques. Different chemokinechemokine receptor pairs and endothelial adhesion molecules mediate the infiltration of the monocytes into the intima. There, the monocytes differentiate into macrophages or DCs and interact with atherogenic lipoproteins. Macrophages take up native and oxidized LDLs via macropinocytosis or scavenger receptors, such as MSR1 (macrophage scavenger receptor 1) and CD36, resulting in the formation of foam cells (Box 41.1). Imbalances in the lipid metabolism of macrophages within the progressing plaque can lead to the retention of the cells and subsequently to chronic inflammation. Retention molecules, such as netrin 1 and its receptor UNC5B (unc-5 homolog B), semaphorin 3E and cadherins, are expressed by lipid-laden macrophages and promote their chemostasis. Lipid unloading via ABCA1 and cholesterol efflux can reverse foam cell accumulation. In parallel, in myeloid-derived cells the chemokine receptor CCR7 is upregulated and the expression of retention factors is decreased
Box 41.1: Foam Cells One of the earliest pathogenic events in the nascent atherosclerotic plaque is lipoprotein uptake by monocyte-derived macrophages. This results in the development of foam cells (Fig. 41.3). Increased oxidative stress in the artery wall promotes modifications of LDLs, which are primarily oxidations that are recognized by macrophages via scavenger receptors, such as MSR1, CD36 and ORL1 (oxidized low density lipoprotein receptor 1). These receptors internalize the lipoproteins and cholesteryl esters of the lipoproteins are hydrolyzed to free cholesterol and fatty acids. Importantly, the scavenger receptors are not downregulated by cholesterol via a negative-feedback mechanism, such as in the case of LDLR. Moreover, via macropinocytosis and phagocytosis of aggregated LDLs, macrophages can internalize native LDLs and VLDLs as well as oxidized lipoproteins.
41.2 Mechanisms of Atherosclerosis
657
The internalized lipoproteins and their associated lipids are digested in the lysosome releasing free cholesterol. The free cholesterol is transported to the ER, where it is re-esterified by the enzyme ACAT1 (acetyl-CoA acetyltransferase 1) providing the “foam” in foam cells. Enrichment of ER membranes with free cholesterol can result in defective cholesterol esterification by ACAT1 in macrophages, promoting the accumulation of free cholesterol. Lipophagy represents the delivery of lipid droplets to lysosomes for efflux, while lipolysis by NCEH1 (neutral cholesterol ester hydrolase 1) mobilizes these lipids. The nuclear receptor LXR is activated by the accumulation of cellular cholesterol (Sect. 5.4) and upregulates the expression of the transporter proteins ABCA1 and ABCG1 leading the reverse cholesterol transport (Sect. 37.2). These proteins mediate the transfer of free cholesterol to lipid-poor APOA1, in order to form nascent HDLs or mature HDLs, in which free cholesterol is esterified and stored in the core of the particle. Cholesterol crystal formation in the lysosome is stimulated by excessive free cholesterol accumulation and activates the NLRP3 inflammasome (Sect. 37.1), promotes ER stress and leads to apoptosis. Moreover, lipid rafts that are enriched in sphingomyelin form a complex with free cholesterol and promote TLR4 signaling. This leads to the activation of NFκB and the production of proinflammatory cytokines and chemokines. Many different cell types, such as endothelial cells, monocytes, DCs, lymphocytes, eosinophils, mast cells and smooth muscle cells, contribute to the process of atherosclerotic plaque formation, but foam cells are central to the pathophysiology of the disease. The TLR-dependent activation of these monocyte-derived cells polarizes them to M1-type macrophages (Sect. 37.1) that secrete pro-atherosclerotic cytokines, such as IL6 and IL12, matrix-degrading proteases as well as ROS, such as NO radicals. The plaque macrophages are subject to both retention and emigration signals and a misbalance of these processes contributes to the net accumulation of plaque macrophages. Dysregulation of lipid metabolism in foam cells contributes to ER stress ultimately resulting in apoptotic cell death. Since defective lipid metabolism pathways, such as cholesterol esterification and efflux, impair efficient clearance of apoptotic cells, this results in necrosis and in the release of cellular components and lipids that form the necrotic core. Chronic inflammation stimulates the migration of smooth muscle cells into the intima region, where they transform into fibroblasts that proliferate and produce larger amounts of extracellular matrix. This leads to the formation of fibrous atherosclerotic plaques. Due to the calcification of the plaques, the artery wall becomes rigid, i.e., sclerotic and fragile. Most humans have small atherosclerotic lesions that do not compromise blood flow. However, when the lesions grow and inward arterial remodeling, they gradually narrow the diameter of the blood vessels and the blood flow is decreased (referred to as stenosis). When this stenosis applies to more than 80% of the coronary arteries, the heart muscle becomes ischemic,
658
41 Heart Disease and the Metabolic Syndrome
Lipoprotein uptake
ORL1
LDL
Oxidized LDL
MSR1
VLDL
CD36
Macropinocytosis Phagocytosis of aggregated LDLs
Oxidized LDL
SCARB1 Lysosomal dysfunction Endosome
Lipid-poor APOAI
NLRP3 CD36 activation
TLR4-6
Cholesterol crystal
Acid lipolysis
signaling TLR4
ABCA1 ER
Nascent HDL
Free cholesterol
ABCG1 Mature HDL
Cholesterol-rich lipid rafts
Lysosome
Autophagosome
Lipolysis
NFκB
LXR–RXR
NCEH1 Cytokines and chemokines
Nucleus ACAT1
Lipophagy
ER stress
Lipid droplets Phagophore
Macrophage
Apoptosis
Fig. 41.3 Lipoprotein uptake and efflux in macrophages. Details are provided in the text
especially when a high cardiac workload increases oxygen demand. Finally, the originally stable lesion changes into an unstable vulnerable plaque that can easily rupture the endothelium leading to the formation of intravascular blood clots that can cause myocardial infarction or, in the case of damage of brain supplying arteries, in cerebral stroke.
41.3 Lipoproteins and Dyslipidemias Cholesterol is essential for membrane structure and fluidity and is a precursor to steroid hormones, vitamin D3 , oxysterols and bile acids that are ligands of nuclear receptors (Sect. 5.2). Only a small amount of circulating cholesterol originates from nutrition, while approximately 80% derive from endogenous synthesis. Cholesterol levels are tightly regulated by the coordinated actions of the transcription factors SREBF1 (Sect. 35.3) and LXR (Sect. 5.4). At low cholesterol levels, SREBF1 activates genes that are involved in endogenous cholesterol production and cholesterol uptake, such as LDLR. Since already low concentrations of free
41.3 Lipoproteins and Dyslipidemias
659
cholesterol can be toxic, cholesterol is mostly esterified with fatty acids. Cholesterol and cholesteryl esters are insoluble in plasma, which requires their transport in spheroidal macromolecules, referred to as lipoproteins. These lipoproteins have a hydrophobic core formed by phospholipids, fat-soluble antioxidants, vitamins and cholesteryl esters and a hydrophilic coat that contains free cholesterol, phospholipids and apolipoproteins. There are four main types of lipoproteins: chylomicrons, VLDLs, LDLs and HDLs, which are differentiated based on their density and size (Box 41.2). The density of lipoproteins depends on the abundance of apolipoproteins. Chylomicrons and VLDLs are important for triglyceride transport and delivering fatty acids to peripheral tissues, while LDLs deposit cholesterol in peripheral tissues. Increased levels of cholesterol-rich LDLs are associated with elevated risk of CVDs. LDLs carry preferentially APOB and can deliver cholesterol to artery walls leading to the formation of atherosclerotic plaques (Sect. 41.2). HDLs have a high amount of APOA1 and mediate the reverse cholesterol transport to the liver (Sect. 37.2). Thus, in contrast to LDLs, high levels of HDLs are associated with reduced risk for CVD. The ratio of APOB to APOA1 is the strongest predictor of coronary heart disease risk, but the ratio of total cholesterol to HDL-cholesterol is equally predictive to this trait. For example, an increase of total cholesterol of 5.2 to 6.2 mM is associated with a threefold elevated risk of death from heart attack, while a HDL-cholesterol level lower than 0.9 mM is the most common lipid disturbance of patients below the age of 60. Box 41.2: Lipoproteins The composition of the four types of lipoproteins is listed. Chylomicrons: With 50–200 nm diameter they represent the largest lipoproteins and show low density (< 1.006 g/ml). They are composed of approximately 85% triglycerides, 9% phospholipids, 4% cholesterol and 2% protein, such as APOB48. VLDLs: Very low density (0.95–1.006 g/ml) lipoproteins of 30–70 nm diameter containing approximately 50% triglycerides, 20% cholesterol, 20% phospholipids and 10% protein, such as APOB100. LDLs: Low density (1.016–1.063 g/ml) lipoproteins of 20–25 nm diameter that are composed of approximately 45% cholesterol, 20% phospholipids, 10% triglycerides and 25% protein, such as APOB. HDLs: High density (1.063–1.210 g/ml) lipoproteins with a diameter of 8– 11 nm that are formed of approximately 40–55% protein, such as APOA1, 25% phospholipids, 15% cholesterol and 5% triglycerides. The main lipids in lipoproteins are free and esterified cholesterol and triglycerides (Fig. 41.4a). In triglyceride metabolism, hydrolyzed dietary fats enter intestinal
660
41 Heart Disease and the Metabolic Syndrome
cells via fatty acid transporters. Through a vesicular pathway, MTTP (microsomal triglycerole transfer protein) packs reconstituted triglycerides with cholesteryl esters and APOB48 into chylomicrons. Chylomicrons also contain the apolipoproteins APOA5, APOC2 and APOC3. In adipocytes, the enzyme DGAT1 (diacylglycerol Oacyltransferase 1) resynthesizes triglycerides that had been hydrolyzed by PNPLA2 and LIPE (hormone sensitive lipase). Chylomicron remnants are taken up by hepatic LDLR or LRP1 (LDLR-related protein 1). In liver cells, triglycerides are packaged with cholesterol and APOB100 into VLDLs. The triglycerides in VLDLs are hydrolyzed releasing fatty acids and VLDL remnants that are hydrolyzed by LIPC yielding LDLs. Sterols in the intestinal lumen enter intestinal cells via the transporter NPC1L1 (Niemann-Pick C1-like protein 1) and some are re-secreted by ABCG5 and ABCG8. In intestinal cells, dietary cholesterol is packaged with triglycerides into chylomicrons. In hepatocytes, cholesterol is recycled or synthesized de novo by a pathway, in which HMGCR is rate limiting. LDLs transport cholesterol from the liver to the periphery, where they are endocytosed. In HDL-cholesterol metabolism, APOA1 in HDLs mediates reverse cholesterol transport by interacting with ABCA1 and ABCG1 transporters on non-hepatic cells. LCAT esterifies cholesterol for the use in HDL-cholesterol, which is remodeled by CETP and LIPG (endothelial lipase), in order to enter hepatocytes. In contrast to most other chronic inflammatory diseases, there is the potential to remove the inflammatory stimulus in atherosclerosis. Lowering of plasma LDL levels by drugs, such as statins that target HMGCR can prevent subendothelial retention of lipoproteins and thereby decrease inflammatory atherosclerotic disease. The enzyme PCSK9 binds to LDLR and induces its degradation, which reduces the metabolism of LDL-cholesterol and can lead to hypercholesterolemia (Fig. 41.4a). The inverse correlation between HDL levels (causing increased triglyceride levels) and the risk of coronary heart disease is due to the importance of HDL-cholesterol in reverse cholesterol transport from the periphery to the liver (Sect. 37.2). The association between HDL-cholesterol and coronary heart disease is complex, since HDLs contain a variety of proteins that are implicated in a number of biological pathways, such as oxidation, inflammation, hemostasis and innate immunity. This heterogeneity in the biological function of HDLs suggests that the measurement of HDL-cholesterol levels alone is insufficient for reflecting the role of HDLs in atherosclerosis. Levels of certain plasma lipids and lipoproteins are key risk factors for CVD. Some 10% of the hypercholesterolemia cases have a monogenic basis, such as heterozygous familial hypercholesterolemia, familial defective APOB and autosomal dominant hypercholesterolemia that is based on a gain of function of the PCSK9 gene (Fig. 41.4b). In contrast, different homozygous loss-of-function mutations in the genes APOB or PCSK9 cause homozygous hypobetalipoproteinemia (HBL), in which almost no LDL-cholesterol is present. Homozygous mutations in MTTP cause a similar disease called abetalipoproteinemia (ABL). Rare monogenic disorders, such as Tangier disease (TD), affect HDL levels and are based on homozygous mutations in the ABCA1 gene or deficiencies in the genes APOA1, LCAT, CETP or LIPC. Moreover, there are also rare monogenic disorders causing severe hypertriglycerolemia
41.3 Lipoproteins and Dyslipidemias
a
661
SCARB1
Liver
A1 HMGCR
AP
A1
LR
TG
LD
B100
LIPG A5 B48
Free cholesterol
C3
LRP1 C2
LIPC
HL
VLDL
VLDL
CETP LCAT
IDL
B100 LIPC CMR
NPC1L1
X PCSK9
ABCA1 ABCG1
A1 HDL
FA Bloodstream
B48 FA
ABCG5/ G8
b
LDL
LDL
B100
APLDLR
Intestine
Peripheral cell
X PCSK9
PIPE MTTP
FA
Intestinal cell FA transporter
0
1
DGAT1 PNPLA2 TG Adipocyte
10
FHC HLP1 FH HLP2A FCH HLP2B DBL HLP3 FHTG HLP4 MHL HLP5 ABL HBL TD LCATD HLD CETPD SITO Total cholesterol Triglyceride LDL cholesterol HDL cholesterol IDL present Fasting chylomicronemia Elevated plant sterols Coronary heart disease Stroke Peripheral vacular disease Pancreatitis Eruptive xanthomata Palmar xanthomata Plantar xanthomata Tendon xanthomata Xanthelasma Corneal abnormalities Retinal abnormalities Peripheral neuropathy Ataxia Myopathy Coagulopathy Red blood cell abnormality Night blindness Fatty liver Splenomegaly Enlarged tonsils Renal abnormalities LPL APOC2 LDLR APOB PCSK9 LDLRAP1 MTTP ABCA1 LCAT LIPC CETP ABCG5/G8 APOE APOA5
Common SNPs
Rare mutations
Molecular
Clinical
Biochemical
Fig. 41.4 Lipid metabolism and description of selected dyslipidemias. Details of lipid metabolism are described in the text (a). Dyslipidemias and their defining features are listed in rows and columns, respectively (b). The color intensity indicates for biochemical traits and for susceptibility to coronary heart disease, stroke and peripheral vascular disease (white: no difference from normal, red: a fold-increase above normal, blue: a fold-decrease below normal), for qualitative clinical features (white: absence of feature, i.e., normal state, red: presence of the feature), for rare mutations (white: no role, red: a major etiologic role for the gene, pink: a minor etiologic role) and for common polymorphisms (white: no role, gradations of red: risk associated with the genotype). CETPD = CETP deficiency, FCH = familial combined hyperlipidemia, FH = familial hypercholesterolemia, FHC = familial hyperchylomicronemia, FHTG = familial hypertriglyceridemia, HBL = hypobetalipoproteinemia, HLD = hepatic lipase deficiency, HLP = hyperlipoproteinemia, LCATD = LCAT deficiency, MHL = mixed hyperlipidemia, SITO = sitosterolemia
662
41 Heart Disease and the Metabolic Syndrome
(HTG) that are due to homozygous loss-of-function mutations of the genes LPL, APOC2 and APOA5. Like in the case of monogenetic forms of obesity (Sect. 39.5) and T2D (Sect. 40.4), the identification of the genes causing monogenic dyslipoproteinemias significantly increased the understanding of the disease. For example, plasma LDL-cholesterol levels depend crucially on LDLR function, which in turn requires proper binding of APOB, the presence of LDLRAP1 (LDLR accessory protein 1) and intracellular LDLR degradation by PCSK9. The majority of hypercholesterolemia cases is based on common variants in genes, such as APOE, LDLR, APOB, PCSK9 and HMGCR for LDL-cholesterol and CETP, LIPC, LPL, ABCA1, LIPG and LCAT for HDLcholesterol, that display low ORs or epigenetic programming. The genetic variants were identified either by SNP arrays or by targeted resequencing (Fig. 41.5). For example, an excess of mutations in the NPC1L1 gene causes low intestinal sterol absorption or heterozygous mutations in the LIPG gene lead to high HDL levels. The variations in lipoprotein levels that are based on common genetic variants are often too small to be meaningful in the clinical practice. However, these insights have a high value in basic research for the identification of novel pathways. Moreover, (epi)genetic profiling of individuals for metabolic diseases, such as dyslipidemias, allows a genetic risk stratification far earlier than the onset of the metabolic syndrome (Sect. 41.4). Such personalized medicine approaches will provide for the respective individuals longer and more effective periods of lifestyle changes. Since diet is a key determinant of lipoprotein levels, early dietary interventions are the most efficient and most economic strategies for CVD prevention. Furthermore, the results of biochemical assays, such as measurements of lipoprotein serum levels, should be integrated from multiple time points of the patient’s lifetime.
41.4 Whole Body’s Perspective of the Metabolic Syndrome Nowadays the metabolic syndrome is a very common aging-related condition that occurs primarily as a result of overweight and obesity caused by a sedentary lifestyle, i.e., physical inactivity and the consumption of diet containing excess of calories (Sect. 39.4). The syndrome is composed of different factors that either alone or in combination significantly increase the risk of T2D and CVDs. Most of these risk factors have been discussed in the previous chapters, such as visceral obesity (Sect. 39.1), ectopic lipid overload (Sect. 40.2), insulin resistance (Sect. 40.2), β cell failure (Sect. 40.3), hypertension (Sect. 41.1) and dyslipidemias with high plasma concentrations of triglycerides and low concentrations of HDL-cholesterol (Sect. 41.3) (Fig. 41.6). The dramatic worldwide increase in obesity and the parallel rise in life expectancy, i.e., the increased number of elderlies around the world, make the metabolic syndrome a major global health problem. Historically, the concept of “syndrome X” was used to describe the metabolic syndrome in the end of 1980s as a condition with increased risk of T2D and CVD
663
Trait frequency
41.4 Whole Body’s Perspective of the Metabolic Syndrome
Increasing plasma concentration of lipid or lipoprotein
Rare (ho) MTTP APOB PCSK9
Rare (he)
ABCA1 MTTP APOA1 PSCK9 LCAT
LDL HDL Cholesterol
TG
Common
Rare (he)
ABCA1 APOB APOE CETP APOA5 APOA1 PSCK9 LDLR ABCA1 LPL LCAT ANGPTL3 PCSK9 LIPC GCKR TRIB1 APOC3 FADS2,3 LIPG APOB LPL CHREBP HMGCR GALNT2 GALNT2 SORT1 PLTP ANGPTL3 LDL HDL TG CILP2 MVK DOCK7 Cholesterol WWOX FADS1,2,3 LIPC APOB CILP2 APOA5 LPL GCKR TRIB1 CHREBP GALNT2 ANGPTL3
APOB PCSK9
LDL
HDL
APOB PCSK9 LDLR
CETP LIPC LIPG
LDL HDL Cholesterol
Rare (ho) LPL APOC2 APOA5
APOB CETP PCSK9 LIPC LDLR LDLRAP1
LPL APOC2 APOA5 LMF1 GPIHBP1
LDL HDL Cholesterol
TG
TG
TAG
Cholesterol
Fig. 41.5 Genetic variants affecting plasma lipoprotein distribution. The frequency of the traits LDL-cholesterol, HDL-cholesterol and triglyceride levels (y axis) is plotted over plasma concentrations (x axis). The bottom and top fifth percentiles of the distribution are indicated by shaded areas. The genes (no shading: by classical genetic or biochemical methods, orange: by re-sequencing, blue: by GWAS) that determine lipoprotein concentrations in specific segments of the distribution are shown below the respective graphs. The extremes of the distribution represent homozygotic (ho) monogenic disorders, the less extremes heterozygous (he) mutations and the center common variants. The green shading indicates small to moderate effect sizes associated with severe HTG
caused by insulin resistance in metabolic tissues. Since then, the National Cholesterol Education Program (NCEP), the WHO, the European Group for the study of Insulin Resistance (EGIR) and the International Diabetes Federation (IDF) used slightly different thresholds to define the metabolic syndrome based on rate of obesity, hyperglycemia, dyslipidemias and hypertension (Table 41.1). While the NCEP definition does not require any defined parameter, the WHO proposes that an evidence of insulin resistance, such as impaired glucose tolerance, impaired fasting glucose or T2D, is essential. In contrast, the EGIR emphasizes hyperinsulinemia as main criterium, while for the IDF central obesity is essential. At present, the definitions of NCEP and IDF are most widely used.
664
41 Heart Disease and the Metabolic Syndrome
Changes in lifestyle
Caloric excess
Primary factors underlying the syndrome
Physical inactivity
Visceral adiposity
Insulin resistance
Plasma lipids
HDL reduced
Ectopic lipid overload
Hypertension
TG elevated
Atherosclerosis
β cell failure
Cardiac dysfunction
T2D
Microvascular disease Myocardial infarction
HEART FAILURE
Fig. 41.6 Interactions of metabolic syndrome traits. Changes in lifestyle, such as increased consumption of high-caloric diets combined with reduced physical activity, play important roles in the worldwide dramatic increase in the metabolic syndrome. Visceral obesity, ectopic lipid overload, dyslipidemias and insulin resistance are the primary factors underlying the syndrome. These factors cause inflammation, hypertension and β cell failure. Individuals with the metabolic syndrome are therefore at increased risk for the development of atherosclerosis, T2D, microvascular diseases, myocardial infarction and finally heart failure
Our body has integrated mechanisms to become either catabolic, when energy demands cannot be met by food intake, or anabolic, when calorie supply exceeds energy demands. The key regulator of these mechanisms is insulin, which is secreted by β cells in the pancreas after a meal and promotes carbohydrate resorption, energy utilization (via glycolysis), storage of carbohydrates (as glycogen), storage of fat (as triglycerides) and synthesis of fat from carbohydrates (via activating de novo lipogenesis) in key metabolic tissues. In parallel, insulin inhibits lipolysis, i.e., the release of energy from triglycerides and the synthesis of glucose (via gluconeogenesis) after a meal. Thus, the actions of insulin create an integrated set of signals that represent the nutrient availability and the energy demands of our body. In turn, a disturbance in insulin actions, such as obesity-triggered insulin resistance in one or multiple metabolic organs, such as skeletal muscle, liver and WAT, often serves as the onset of the metabolic syndrome (Fig. 41.7). These conditions can lead to organ-specific consequences, such as β cell failure and NAFLD, but also to systemic effects, such as glucotoxicity, lipotoxicity and low-grade inflammation. All
Any of the 5 below
Waist circumference: Males > 101.6 cm Females > 88.9 cm
Fasting glucose > 5.6 mM
Triacylglycerols > 1.7 mM
HDL: Males < 1.0 mM Females < 1.25 mM
> 130 mm Hg systolic or > 85 mm Hg diastolic
Criteria
Obesity
Hypergly-cemia
Dyslipid-emia I
Dyslipid-emia II
Hyper-tension
Other criteria
None
Absolutely required
NCEP (2005)
Table 41.1 Definitions of the metabolic syndrome WHO (1998)
Microalbuminuria
> 140/90 mm Hg
Triacylglycerols > 1.7 mM or HDL < 0.9 mM
Insulin resistance
Waist/hip ratio: Males > 0.90 Females > 0.85 or BMI > 30 kg/cm2
Insulin resistance or T2D plus 2 of 5 below
Insulin resistance
EGIR (1999)
> 140/90 mm Hg
Triacylglycerols > 2.0 mM or HDL < 1.0 mM
Insulin resistance
Waist circumference: Males > 94 cm Females > 80 cm
Hyperinsulin-emia plus 2 of the 4 below
Hyperinsulin-emia
IDF (2005)
> 130 mm Hg systolic or > 85 mm Hg diastolic
HDL: Males < 1.0 mM Females < 1.25 mM
Triacylglycerols > 1.7 mM
Fasting glucose > 5.6 mM
Central obesity
Obesity plus 2 of the 4 below
Central obesity
41.4 Whole Body’s Perspective of the Metabolic Syndrome 665
666
41 Heart Disease and the Metabolic Syndrome
these conditions are key factors of the metabolic syndrome and accelerate the risk of diabetes, heart disease and their complications.
FOOD INTAKE >> ENERGY NEEDS
FOOD INTAKE = ENERGY NEEDS CVD HOMEOSTASIS
OBESITY Meal size Weight
Lipotoxicity
METABOLIC SYNDROME Brain
Liver
SYSTEMIC CHRONIC INFLAMMATION
FA
LIPOLYSIS
Impaired regulation
HPT
NAFLD Gut hormones
FA metabolically active organs
Insulin
WAT
Pancreas
Insulin resistance
LONG-TERM ISLET EXHAUSTION
Insulin resistance Glucose uptake
Glucotoxicity
Intestine
Insulin
T2D
Hepatic glucose
Complications
VLDL secretion
Skeletal muscle Glucose in circulation
Blindness
Kidney disease
Nerve Non-healing damage skin ulcers
TG
Fig. 41.7 Whole body’s view on the metabolic syndrome. Under normal conditions, energy intake and utilization are perfectly balanced with our body’s energy needs (left). Intestine, pancreas and brain sense food after a meal and send signals to muscle, liver, fat and back to the brain, in order to maintain metabolic homeostasis via the coordination of uptake and storage of nutrients and energy production. The metabolic syndrome often starts with obesity, triggering a state of systemic low-grade inflammation that affects various major organs involved in metabolic homeostasis (right). The brain’s ability to regulate meal size or frequency is impaired leading to weight gain and further organ dysfunction. The autonomic nervous system and the hypothalamic-pituitary-thyroid (HPT) axis are disrupted causing a change in the release of gut hormones. Insulin resistance is a further important trigger of the metabolic syndrome. In the pancreas, the islets expand to release more insulin (hyperinsulinemia) in an attempt to overcome insulin resistance of muscle, liver and WAT. However, over time the islets become exhausted and little or no insulin is produced, so that T2D occurs. Insulin resistance in the muscle leads to excessive glucose uptake in the liver that is primarily converted to fatty acids often causing NAFLD. Moreover, in the liver, glucotoxicity and insulin resistance result in inefficient downregulation of hepatic glucose production leading to further increase of circulating glucose levels. The fat excess in the liver can be released into the circulation as VLDLs leading to elevated serum triglyceride levels. Insulin resistance of adipose tissue increases its lipolytic activity, thus also releasing excess fatty acids. All together these lipid sources result in lipotoxicity that further contributes to organ dysfunction and disease, especially CVD. Lipotoxicity and glucotoxicity worsen T2D and lead to numerous complications, such as kidney disease, blindness, nerve damage and non-healing skin ulcers
41.5 Metabolic Syndrome in Key Metabolic Organs
667
41.5 Metabolic Syndrome in Key Metabolic Organs Systemic effects of the metabolic syndrome influence the metabolism in key metabolic organs, such as liver, muscle, pancreas and WAT. Hepatic insulin resistance causes elevated activity of the key gluconeogenesis enzymes G6PC and PCK and increased glycogenolysis, both leading to increased glucose output from the liver (Fig. 41.8a). In parallel, the expression of enzymes that regulate glycogen synthesis and glycolysis, such as GCK and pyruvate kinase, is reduced, driving GLUT2 to transport glucose out of hepatocytes. All these alterations in the glucose metabolism pathways accelerate systemic glucotoxicity. In addition, a decreased insulin sensitivity in the liver increases the uptake of FFAs and the formation of triglycerides. These are loaded to VLDLs for transport in the circulation and thus cause dyslipidemia. The increase of glucose levels in the liver increases lipogenesis via the activity of SREBF1 and FASN, which are both not impaired by insulin resistance. This accumulation of lipids in liver can cause NAFLD. Hepatic insulin resistance also contributes to hyperlipidemia through the downregulation of LDLR (Sect. 41.3). In this way, liver insulin resistance causes decreased clearance of LDLs and VLDLs, leading to increased LDL and VLDL levels in the circulation, respectively. Skeletal muscle is the main tissue for glucose storage and utilization. After a meal approximately 80% of the glucose load of the blood is taken up by the muscle. Insulin resistance in muscles leads to reduced insulin-stimulated GLUT4-mediated glucose transport into the myocytes (Fig. 41.8b). Decreased glucose uptake reduces the levels of glucose-6-phosphate to be used for glycogen synthesis and glycolysis. This increases the glucose concentration in the bloodstream and causes systemic glucotoxicity. Like the liver, systemic lipotoxicity also overloads the muscle with FFAs. These lipids are taken up and stored in form of triglycerides in intramuscular lipid droplets. In the early stages of insulin resistance, β cells increase the production and secretion of insulin, in order to maintain glucose tolerance (Fig. 41.9a). Since under these conditions insulin is less potent in suppressing hepatic glucose production, the liver becomes insulin resistant. When insulin resistance progresses, β cells lose their ability to compensate for decrease insulin response via an increase of insulin release. This finally results in reduced circulating insulin concentrations and often comes along with increased glucagon levels. This shift in the glucagon-insulin ratio leads to a further rise in hepatic gluconeogenesis and advanced hyperglycemia occurs. Systemic glucotoxicity and lipotoxicity, i.e., constant exposure of β cells to elevated levels of glucose and lipids, both increase glucose metabolism in β cells and cause metabolic stress leading to the unfolding protein response of the ER in these cells. In response to ER stress, hypoxic stress and proinflammatory cytokines, the β cells fail to proliferate and undergo uncontrolled autophagy or even apoptosis. This leads to β cell dysfunction and ultimately their death. In obesity, the storage capacity of adipocytes is often exceeded causing cellular dysfunctions, such as increased formation of ceramides, ER stress and hypoxia leading to reduced metabolic control and cell death. An increase in number and size of
668
41 Heart Disease and the Metabolic Syndrome
a
OBESITY
Skeletal muscle
Pancreas Circulating immune cells
Leptin Adiponectin
Glucose disposal
Insulin resistance
Insulin
LIPOLYSIS
Plasma Insulin
WAT
Ectopic lipids
Resident liver macrophage
Cytokines Chemokines
Cholesterol gallstone formation
Re-routing
FA
Hepatic insulin resistance
Glucose VLDL secretion
Abnormalities in bile acid production
FA
Brain GLUCONEOGENESIS
LIPOLYSIS
NAFLD
Cortisol LIPOGENESIS
Dyslipidemia
FA
Adrenal gland
VLDL
KETOGENESIS
Energy for other organs
Liver
b
Atherosclerosis CVD
WAT Leptin Adiponectin
Insulin
Pancreas
LIPOLYSIS
Cytokines Chemokines
TG Plasma Insulin
Postprandial hyper-insulinemia
Liver DE NOVO LIPOGENESIS
INFLAMMATION
FA DAGs Ceramides Insulin resistance in skeletal muscle
Glucose uptake
INCOMPLETE β-OXIDATION Acylcarnitines
Skeletal muscle
Glycogen
GLYCOGEN SYNTHESIS Branched-chain amino acids, ROS
Intramuscular lipid droplets
41.5 Metabolic Syndrome in Key Metabolic Organs
669
◄Fig. 41.8 Metabolic syndrome in the liver and skeletal muscle. Early stages of the metabolic syndrome are associated with insulin resistance causing a decreased glucose disposal in skeletal muscle. Obesity also alters the secretion pattern of adipokines, such as increased levels of leptin and decreased adiponectin concentrations. Together this leads to a re-routing of glucose and lipids (as a consequence of increased lipolysis from adipose tissue) to the liver (a). As intracellular lipid levels in the liver rise, along with the increased plasma insulin, hepatic insulin signaling rapidly deteriorates and this impairment turns the liver into a “co-conspirator” in the further progression of the metabolic syndrome and its complications. Hepatic insulin resistance leads to increased hepatic glucose production. Further hormones can contribute to decreased insulin sensitivity of the liver. For example, cortisol increases glucose production, promotes lipolysis and increases lipid deposition. Insulin resistance increases the secretion of VLDLs from the liver and causes dyslipidemia. Excessive hepatic secretion of VLDLs plays an important role in promoting atherosclerosis and CVDs. Insulin resistance also increases intrahepatic fat accumulation finally causing to NAFLD. Activation of inflammatory pathways occurs both systemically, as a result of cytokines released from circulating immune cells and locally through resident liver macrophages. This further accelerates lipid accumulation and storage. Liver insulin resistance also causes abnormalities in bile acid production and increases the risk for cholesterol gallstone formation. Insulin resistance in skeletal muscle causes reduced insulin-stimulated glucose uptake and therefore less glucose is available for insulin-stimulated glycogen synthesis (b). Overload of lipids increases the level of intramyocellular lipids in the form of DAG and ceramides as well as increases in acyl-carnitines (due to incomplete mitochondrial fatty acid β-oxidation). Proinflammatory adipokines, branched-chain amino acids and ROS further contribute to this defect in insulin signaling. Insulin resistance in skeletal muscle promotes postprandial hyperinsulinemia and diversion of ingested carbohydrates away from storage as glycogen in skeletal muscle to liver where they are converted to triglycerides through increased hepatic de novo lipogenesis
adipocytes also influences the secretion of adipokines. In addition, adipocytes attract monocytes into WAT that become M1-type macrophages, secreting proinflammatory cytokines, together with adipokines leading to low-grade systemic inflammation. All this contributes to insulin resistance in WAT causing a reduced insulin-stimulated import of glucose via GLUT4 (Fig. 41.9b). Moreover, lipolysis is increased due to the impaired inhibition of LIPE activity leading to an increase in FFA release from adipocytes. The ability of insulin to stimulate the re-esterification of FFAs is also impaired and consecutively systemic lipotoxicity occurs. The metabolic and inflammatory response of metabolic tissues, such as WAT, integrates the actions of the innate immune system, i.e., primarily of the monocytederived macrophages, with those of adipocytes (Fig. 41.9b). This integrated action of two or more different tissues has developed during evolution. Responses of the immune system to pathogen invasions use substantial amounts of energy for new protein synthesis and rapid growth of cells. Thus, under these conditions it makes sense that metabolic organs are insulin insensitive, i.e., that they use less energy from circulating glucose and lipids during limited time periods. For this reason, inflammatory mediators control energy metabolism so that pathogens are defended most efficiently, e.g., through the ability to shift rapidly from glucose oxidation to lipid oxidation. With a similar protective attempt lipids can trigger insulin resistance, in order to preserve glucose for glucose-dependent organs, such as the CNS and erythrocytes.
670
41 Heart Disease and the Metabolic Syndrome
a OBESITY
β cell death AMYLOID DEPOSITION Pancreatic islet hypertrophy
β cell expansion
Insulin β cell
OXIDATIVE STRESS ER STRESS
Insulin resistance
INFLAMMATION β cell proliferation and survival
Metabolic syndrome Changes in signaling Peptide secretion
Intestine
Osteocalcin
FA Circulation
Insulin
Glucose
Leptin Adiponectin
Glucose uptake Glycolysis Glycogenesis Lipogenesis Protein synthesis Bone
WAT
Skeletal muscle
Liver
b TREG Excess energy
INFLAMMATION
M1-type macrophage
NECROSIS Cellular hypertrophy and hyperplasia
Cytokines Chemokines
APOPTOSIS
Dead adipocyte TLR4
Adipocytes LOCAL HYPOXIA TNFR Impaired β3-adrenergic stimulation
OXIDATIVE STRESS ER STRESS
Adipocytes
Leptin Adiponectin
Brain
Cortisol
Adrenal gland
IL6
Insulin sensitivity
Glucose uptake LIPOGENESIS
FA
41.6 Genetics and Epigenetics of the Metabolic Syndrome
671
◄Fig. 41.9 Metabolic syndrome in the pancreas and adipose tissue. Obesity promotes the development of insulin resistance leading to compensatory increases in insulin release from β cells (a). Chronic overproduction of insulin leads to β cell expansion, i.e., pancreatic islet hypertrophy. As insulin resistance progresses, the effects of insulin on target tissues diminish, thereby leading to impairments in glucose uptake, glycolysis, glycogenesis, lipogenesis and protein synthesis. This leads to hyperglycemia and elevated FFA levels in the circulation that negatively affect β cell proliferation and survival. This results in a vicious cycle that further reduces β cell function. In the setting of the metabolic syndrome, many tissues show alterations in hormone levels that directly impact β cell function. The intestine changes the secretion of signaling peptides, the bone secretes less osteocalcin and WAT secretes more leptin but less adiponectin. These hormonal changes together with oxidative stress, ER stress, inflammation and intracellular amyloid deposition cause β cell death. In the presence of excess energy supply WAT expands as a result of cellular hypertrophy and hyperplasia (b). These enlarged adipocytes become dysregulated through an increased rate of local necrosis, apoptosis and proinflammatory responses. Dead adipocytes attract macrophages that are conventionally skewed toward an M1-like proinflammatory profile. Under obese conditions there is also a reduction of TREG cells. This causes an increase in the local proinflammatory environment that can ultimately spill over to systemic increases in proinflammatory cytokines. The rapid tissue expansion during obesity leads to local hypoxia and the activation of ER stress response causing a reduced release of insulin-sensitizing adipokines, such as adiponectin. Moreover, increased levels of cortisol and the activation of TLRs and other proinflammatory cytokine receptors, such as TNFR and IL6 receptors, further reduce insulin sensitivity. This leads to reduced rates of triglyceride synthesis, increasing levels of FFAs and a decrease in insulin-mediated glucose uptake. In contrast, the impaired β3-adrenergic response downstream of SNS activity leads to reduced metabolic flexibility, since FFAs cannot be appropriately activated in response to β3-adrenergic stimulation
41.6 Genetics and Epigenetics of the Metabolic Syndrome GWAS analysis for central factors of the metabolic syndrome, such as BMI, T2D and dyslipidemia, have identified for each of these traits highly statistically significant associations with 40 to 100 genetic variants (Sects. 39.5, 40.6 and 41.3). The key genes of these lists, such as LPL, APOE, MC4R, FTO and TCF7L2 (Table 41.2), are also the central determinants for the genetic risk for the metabolic syndrome. However, the dilemma with all these common SNPs remains that their individual ORs are clearly below 2, i.e., they contribute considerably less than 100% increased risk for the disease. This implies that the common SNPs can explain only a small fraction of the cases of the metabolic syndrome. This suggests that socio-environmental factors and epigenetic mechanisms rather than variations of the core genome play a role in the obesity epidemic and its associated metabolic abnormalities. Integrative genomic approaches can combine large-scale genome- and transcriptome-wide data, in order to construct gene networks that underlie metabolic traits, such as plasma lipoproteins levels. For example, plasma HDL-cholesterol levels were linked to variants in the regulatory region of the vanin 1 (VNN1) gene using RNA expression profiles in lymphocytes. This type of analysis indicates that metabolic traits are the products of molecular networks being modulated by sets of complex genetic loci and environmental factors. This re-emphasizes that the genetic predisposition for a metabolic disease, such as atherosclerosis, is comprised of multiple common genetic variants that each have a small to moderate effect on
672
41 Heart Disease and the Metabolic Syndrome
Table 41.2 Central genes in the development of metabolic syndrome Gene locus Gene function LPL
Hydrolyzes triacylglycerols
Disease context Affected parameter Cardiovascular
HDL concentration
APOE
Removing lipoproteins from circulation Cardiovascular
HDL concentration
MC4R
Membrane receptor on neurons binding Obesity α-MSH
Waist circumference
FTO
Function mediated by IRX3 and IRX5
Obesity
Waist circumference
TCF7L2
Transcription factor in β cells
T2D
Glucose concentration
the trait, either alone or in combination with modifier genes or environmental factors. There are more and more epidemiological and clinical evidences that the DOHaD concept (Sects. 12.1 and 40.6), i.e., a prenatal epigenetic programming in utero, may be the key cause for the metabolic syndrome. So far, there is no comprehensive analysis of the epigenome of persons suffering from the metabolic syndrome, i.e., no concrete genomic regions of elevated risks have been identified. However, it can be assumed that due to the complexity of insulin signaling and its interference with multiple pathways (Sect. 37.4) a high number of regions will be affected in an individual-specific way. Nevertheless, since epigenetic modifications respond dynamically to environmental conditions, there is potential for intervention and reversibility. Healthy dietary patterns, such as Mediterranean or Nordic diet (Box 35.1), lower the risk of the metabolic syndrome. Studies understanding the molecular mechanism of diet on epigenetic programming in the prenatal, postnatal and adult phases of life are of major importance, in order to understand how diet can prevent the metabolic syndrome. Thus, cleverly designed dietary intervention studies and observational studies will investigate the impact of individual nutrients, such as vitamin D3 or PUFAs, within a healthy dietary pattern, in order to improve the conditions of the metabolic syndrome. In these studies, a larger number of epigenome-, transcriptome-, proteome- and metabolome-wide data will need to be integrated. (Clinical) Conclusion: Up to 90% of elderly people develop the metabolic syndrome although this collection of diseases, such as obesity, hypertension, T2D and dyslipidemias is largely preventable. The metabolic syndrome is a whole body’s disease and affects many organs including the immune system. In most people the metabolic syndrome leads to fatal CVD, i.e., the metabolic syndrome is the major reason for death.
Additional Reading
673
Additional Reading Barroso, I., & McCarthy, M. I. (2019). The genetic basis of metabolic disease. Cell, 177, 146–161. Drummond, G. R., Vinh, A., Guzik, T. J., & Sobey, C. G. (2019). Immune mechanisms of hypertension. Nature Reviews Immunology, 19, 517–532. Hunter, P. M., & Hegele, R. A. (2017). Functional foods and dietary supplements for the management of dyslipidaemia. Nature Reviews Endocrinology, 13, 278–288.
Chapter 42
Epigenetics, Inflammation and Disease
Abstract In this chapter, we will emphasize the main message of this book: diseases are largely preventable by an appropriate lifestyle. We will elaborate the relation of phenotypes, genetic predisposition, epigenetic programming and lifestyle decisions of dietary choices and physical activity. A central mechanism linking most common diseases is chronic inflammation that is often cause by metabolic stress. Keywords Genomics · Epigenomics · Prenatal epigenetic programming · T2D · Obesity · Metabolic syndrome · Healthy aging · Inflammation · Metabolism · Lifestyle · Cancer
42.1 Genetics, Epigenetics and Environment Until some 20 years ago, it was a general expectation that the knowledge of the complete human genome would provide a detailed understanding of our health and disease. In the post-genome times since the first publication of our genome, we obtained a significantly different mindset than in the pre-genomic times: instead of focusing on individual genes and proteins, we are now supposed to think on the level of whole genomes, transcriptomes and proteomes. Accordingly, after completing the sequence of the human genome in 2001 (Box 1.3) “genomics” became the first omics discipline focusing on the study of entire genomes in contrast to “genetics” that investigates individual genes. Genomics turned out to be the more appropriate approach for the description and study of genetic variants, such as SNPs contributing to complex diseases like cancer, T2D or Alzheimer’s. Specific expression of genes is shaping the phenotype of cells and tissues (Chap. 2). The regulation of gene expression, i.e., their up- and downregulation, is the fundamental aspect of nearly all processes in physiology, both in health and in disease. These processes are in part very dynamic and respond to divergent daily challenges, such as incoming diet, altered cells or infections. The tremendous technological push by NGS methods, which are all based on the knowledge of the reference human genome (Sect. 10.2), allow us to have an unbiased view on changes in gene expression in the context of every biological process that we are interested in. © The Author(s), under exclusive license to Springer Nature Switzerland AG 2023 C. Carlberg et al., Molecular Medicine, https://doi.org/10.1007/978-3-031-27133-5_42
675
676
42 Epigenetics, Inflammation and Disease
Accordingly, in the past 20 years it has been very popular to add the suffix “omics” to a molecular term in order to express that a set of molecules is investigated on a comprehensive and/or global level. Epigenomics can be considered as the “second dimension” of genomics, as it is the global, comprehensive view of processes that modulate gene expression patterns in a cell independent from the genome sequence. These patterns are primarily DNA methylation states (Sect. 6.2) and covalent modification of histone proteins (Sect. 7.2) that organize the architecture of the nucleus, restrict or facilitate transcription factor access to genomic DNA and preserve an epigenetic memory of past gene regulatory activities. Epigenetics plays an extremely important role in the first weeks of life (Sect. 11.1) and intrauterine exposures of the fetus, such as under- and overnutrition, have huge impact on the risk for obesity, T2D and the metabolic syndrome (Fig. 42.1). Epigenetic programming happens not only during the prenatal phase, but occurs also in the postnatal and adult phases of life. For example, T2D patients maintaining intense glucose control remain at increased risk of macrovascular complications and organ damage even years after the initial diagnosis. This “glycemic memory” is an epigenetic effect, i.e., histone methylation changes within human aortic endothelial cells in response to increased glucose exposure. Individuals that carry an epigenome, which during their anthropologic development was programed by suboptimal nutrition in utero, despite normal postnatal nutrition, transgenerationally transmit a predisposition for obesity (Fig. 42.1). It is not clear how many generations epigenetic marks can be inherited, but it is obvious that epigenetic inheritance is not comparably persistent as genetic inheritance (Sect. 12.1). Within more or less one generation (between 1981 and 2014) the worldwide prevalence for both obesity and T2D doubled. Thus, populations that made a transition from famine to food surplus just within 1–2 generations are under significantly higher risk for obesity, T2D and the metabolic syndrome, than those that were improving their nutritional conditions over many generations. For example, Polynesians show an overproportionally high prevalence for T2D. One possible explanation is that their ancestors experienced a number of challenges, such as cold stress and starvation. This happened a few hundred years ago during long open-ocean travels over the Pacific, which may have let only the initially most obese members of the group survive. These ancestors may have been evolutionary selected for energetic efficiency, referred to as thrifty metabolism. Accordingly, present-day Polynesians have inherited an increased T2D susceptibility, because their ancestors went through an evolutionary bottleneck. In contrast, populations, which did not experience long periods of starvation in the past centuries, such as the Europeans, have a lower prevalence for T2D. Similar explanation may apply to other indigenous populations, such as the Pima Indian tribe in Arizona who had adapted to life of deprivation in the desert. When exposed to Western diet both Polynesians and Pima Indians get far more likely obese than Europeans. Thus, populations who are born and live in countries that had particularly rapid changes in urbanization and economic development have an increased risk of the different features of the metabolic syndrome.
42.1 Genetics, Epigenetics and Environment
677
a
Prenatal and early infant life
Adult life
(Fetal/early infant malnutrition)
(Good or overnutrition)
Maternal malnutrition during pregnancy Fetal (or other maternal/ malnutrition placental abnormalities)
Decreased growth of fetus/infant Decreased islet function and impaired β cell growth
Obesity
Age
Decreased adult β cell function
In utero hormonal and metabolic adaptations to maternal malnutrition
T2D and metabolic syndrome
Newborn
Childhood
Adult
Normal
Normal
Normal
Normal
Undernutrition
Intrauterine growth restriction
Enhanced survival and catch up growth
Macrosomic/ increased body fat
Normal/increased food availability High fat/calorie diet
Overnutrition
Obese
Macrosomic/ increased body fat
Normal/increased food availability High fat/calorie diet
Obese
Obese
Second generation
Maternal
First generation
b
Fig. 42.1 Transgenerational view on T2D and obesity. T2D and the metabolic syndrome can be the outcome of maternal–fetal malnutrition, such as poor maternal diet, low maternal fat stores or reduced transfer of nutrients because of placental abnormalities (a). The fetus adapts to this environment by being nutritionally thrifty, resulting in decreased fetal growth, islet function and β cell mass and other hormonal and metabolic adaptations. A transition to overnutrition later in adult life exposes the impaired islet function to increased metabolic stress, which is further enhanced by obesity and age, so that T2D results. Non-obese mothers usually give birth to non-obese children, which develop into adults with a normal metabolic profile and a normal body fat content (b). However, undernutrition combined with improved neonatal survival, formula feeding and exposure to a Western postnatal diet increases the incidence of prematurity and intrauterine growth restriction. This results in increased obesity of the offspring and higher risk for developing the metabolic syndrome, when prenatally exposed to Western diet. Some obese mothers may give birth to newborns with increased body fat, as a result of consumption of a high-fat diet. All these processes contribute to a shift of the population toward an obese phenotype. This also includes that second-generation obese women have an increased risk to give birth to infants with increased body fat content and a further increased risk to develop obesity and the metabolic syndrome
678
42 Epigenetics, Inflammation and Disease
The description of epigenome-wide modifications in normal and diseased tissues has significantly progressed (Chap. 13). Although the efforts in epigenetic research have mainly focused on cancer (Chap. 29), new insights were also obtained for other diseases, such as neurological and autoimmune disorders. In addition, also the personal epigenetic profile of healthy human individuals is of major importance, e.g., for the early detection of the onset of diseases, such as cancer (Sect. 24.5) or T2D (Sect. 36.5), as well as to enable healthy aging (Sect. 30.1). DNA methylation, histone modification and 3D chromatin structure form an epigenetic landscape determining the terminal differentiation of the cells forming our body (Sect. 11.2). Moreover, epigenetics has also a dynamic aspect, where the activation of intracellular signal transduction cascades via extracellular signals, such as cytokines, peptide hormones and growth factors, results in the activation of transcription factors and chromatin modifying enzymes. Probably the most dominant external signal that we are exposed to is our diet (Sect. 36.1). Many dietary compounds, such as unsaturated fatty acids, directly activate transcription factors or cause changes in the levels of metabolites, such as α-ketoglutarate, which modulate the activity of chromatin modifying enzymes. The actions of these nuclear proteins cause local changes of the epigenome, which enable and modulate the transcription of specific target genes of the different signals affecting a cell. Most of these changes are transient but some may leave permanent marks on the epigenome. In this way, our epigenome can memorize environmental events, such what and how much we have eaten, whether we had been in contact with microbes or whether we had been stressed in any other way. The dynamic component of epigenome implies that some epigenetic programing events are reversible. For example, if an unhealthy lifestyle paired with food excess and physical inactivity over many years causes epigenetic programing of metabolic tissues that results in insulin resistance, this process may be reversed by significant lifestyle changes leading to a reprograming of the dynamic component of the epigenome. This reprograming of our epigenome can have significant consequences for our health, i.e., as long no irreversible tissue damage has happened, we may have it in our own hands to reverse a disease condition. Thus, not only our mental memory, such as memories of our childhood, is a learning process that is based on epigenetic programing of neurons (Sect. 11.5), but each cell of our body has an epigenetic memory recording the perturbations that the cell had been exposed to. Figure 42.2 provides a summary of genetic and epigenetic effects throughout the life from “womp to tomp”. The genetic composition of all cells of our body is determined at the moment of conception and will stay like this, in case we do not get cancer. Thus, we cannot change the genetic contribution to our life, but fortunately, in very most cases the contribution of our genome to the risk for diseases is far lower than expected. Although GWAS and whole genome sequencing data have indicated for basically all common diseases a clear genetic predisposition, all identified risk SNPs explain in total less than 20% of the genetic risk for common diseases and other traits describing the functions and properties of our body. Some of the missing heritability may be explained by rare variants with high ORs (Sect. 1.2).
42.2 Central Relation of Epigenetics and Immunity
Stochastic events
Intra-uterine environment
679
Environmental Random exposures epimutation
Genetic variations Development Epigenetic patterns establishment (e.g. Epigenetic transgenerational inheritance (incomplete erasure of parenteral marks and epimutations in germ cells)
Life-long remodeling (variable)
Stable
Epigenome
Phenotype: e.g., adaption, chronic diseases
Phenotype = Genome + Epigenome + Environment (ancestal, past, current)
Fig. 42.2 The molecular story of life: Genome, epigenome and environment. Details are provided in the text
However, most of our individual disease risk is modulated by environmental triggers, which are majorly influenced by our lifestyle decisions. Thus, environmental exposures, including those that we are experiencing as fetus, affect the epigenome and may explain large parts of the missing heritability (Sect. 12.2). This insight can be summarized in the formula: Phenotype = genetic + epigenetic + environment (Fig. 42.2). This conclusion implies that we have it to a large extent in our own hands to stay healthy and to avoid getting major common diseases.
42.2 Central Relation of Epigenetics and Immunity The communication between the cells of our body is mediated primarily via extracellular signals, such as peptide hormone, cytokines or growth factors. This results in the activation of intracellular signal transduction cascades that often have transcription factors and chromatin modifying enzymes as end points (Chaps. 4 and 7). The actions of these nuclear proteins cause local changes of the epigenome, which enable and modulate the transcription of specific target genes of the different signals affecting a cell (Fig. 42.3, center). As already summarized in Sect. 42.1, the response of the epigenome and transcriptome depends on: • the genetic predisposition of the individual • lifestyle decisions like dietary choices and amount of physical activity
680
42 Epigenetics, Inflammation and Disease
Cancer
Genetic predisposition
Neurodegenerative diseases
Changes of epigenome and transcriptome
Epigenomic programming of immune system
Metabolism
Lifestyle decisions
Allergy Autoimmunity
Obesity Insulin resistance T2D Atherosclerosis
Fig. 42.3 Immune-mediated pathologies as key driver processes of diseases in various target organs. Inflammation and cellular metabolism are closely linked via coordinated changes in the epigenome and transcriptome of target tissues and cell types. More details are provided in the text
• epigenetic programming in particular of immune cells, such as monocytes and macrophages. In this way, the different aspects of cellular metabolism of dietary molecules, such as: • the levels of metabolites representing energy metabolism that regulate the activity of different chromatin modifiers (Sect. 37.1) • accumulated nutritional molecules like cholesterol crystals acting as DAMPs (Sect. 15.1). Immune reactions in general and inflammation in particular are related to cellular metabolism. The proliferation of immune cells as well as their action in defense and tissue repair both require high levels of energy metabolism. In turn, metabolic stress, which is often caused by lipid overload in the blood and in adipose tissue, stimulates chronic inflammation (Chap. 38). This is the central causal mechanism behind many lifestyle-related diseases, such as obesity (Sect. 39.1), insulin resistance (Sect. 40.2), T2D (Sect. 40.2) and atherosclerosis (Sect. 41.2), all of which are contributing to the metabolic syndrome (Sect. 41.4). Moreover, also neurodegenerative diseases,
Additional Reading
681
such as Alzheimer’s disease, most types of cancer, allergy, autoimmune diseases and inflammatory bowel diseases, such as Crohn’s disease and ulcerative colitis, are closely linked to inflammation (Fig. 42.3). The fact that the immune system uses the same mechanisms in its fight against viruses (Chap. 21) than in the battle against thousands of transformed cancer cells arising every day in each of us (Chap. 33), is another confirmation of the key role of immunity in basically all aspects of health. Moreover, the surveillance of the immune system for cancer cells is only one of multiple environmental influences on the process of tumorigenesis (Chap. 27). We control many of these proand anticancer effects of the environment by lifestyle decisions, such as retaining from smoking, selecting healthy food and being physically active. Thus, cancer preventive interventions are the most effective way to fight against cancer. (Clinical) Conclusion: When we reflect on (molecular) medicine, first disease come into our mind, for which we aim to find mechanisms of their treatment. However, it is time for a change of mindset, where disease prevention has first priority. We should shift from molecular studies of defects, disorders and syndrome to investigations on maintenance of our health.
Additional Reading Green, E. D., Gunter, C., Biesecker, L. G., Di Francesco, V., Easter, C. L., Feingold, E. A., Felsenfeld, A. L., Kaufman, D. J., Ostrander, E. A., Pavan, W. J., et al. (2020). Strategic vision for improving human health at the forefront of genomics. Nature, 586(7831), 683–692.
Glossary
Acute inflammation is a short-term immunological process occurring in response to tissue injury or microbe infection usually appearing within minutes or hours. It is characterized by pain, redness, swelling and heat. Acute rejection is an episode of sudden deterioration in allograft function as a result of either antibody-mediated rejection or T cell-mediated rejection, which result from different molecular processes. Adaptive introgression represents movement of genetic material from the genome of one species into the genome of another through repeated interbreeding. Adaptive therapy is the application of cancer treatment in a manner that quickly responds to changes in the disease rather than following a fixed protocol, with the goal of managing the cancer and maintaining a limited tumor burden, rather than attempting to totally eliminate the disease. Adenoma is a benign tumor composed of epithelial cells. Adipogenesis the process whereby fibroblast-like progenitor cells restrict their fate to the adipogenic lineage, accumulate nutrients and become triglyceride-filled mature adipocytes. Adipokines are cytokines secreted by adipose tissue. Adiponectin is a peptide hormone produced in adipose tissue that is involved in regulating glucose levels as well as fatty acid breakdown. Adjuvant therapy is a therapy that is given in addition to the primary or initial therapy to maximize its effectiveness, such as chemotherapy after surgery. Admixture is interbreeding between previously isolated populations. Affinity maturation is a process by which B cells in germinal centers increase their affinity for antigen during an immune response. Allogeneic is term that describes tissues that are of distinct genetic origins and thus often immunologically incompatible. Allorecognition is the ability of a graft hosts to recognize allogeneic tissue as distinct from its own. Amplification is a genetic alteration producing a large number of copies of a small segment (less than a few Mb) of the genome. © The Editor(s) (if applicable) and The Author(s), under exclusive license to Springer Nature Switzerland AG 2023 C. Carlberg et al., Molecular Medicine, https://doi.org/10.1007/978-3-031-27133-5
683
684
Glossary
Anabolism is the building-up aspect of metabolism, in which a set of metabolic pathways construct molecules from smaller units by the use of energy. Anaphylaxis is a severe and potentially life-threatening reaction to an allergen. Anatomically modern humans individuals classified as Homo sapiens on the basis of a set of morphological characteristics that distinguish them from other, now extinct, archaic humans. According to the fossil record they emerged approximately 300,000 years ago. Anergy is a tolerance mechanism of T cells, in which after an antigen encounter cells are inactivated via epigenomic reprograming. Angiogenesis is the process of forming vascular conduits, including veins, arteries and lymphatics. Antigenic drift is a process by which circulating virus genomes are constantly changing. This allows the virus to cause annual epidemics. Antigens are parts of the pathogen, such as proteins or polysaccharides, that are recognized by the immune system and can be used to induce an immune response by vaccination. Assay for transposase accessible chromatin using sequencing (ATAC-seq) is a method similar to DNase I hypersensitivity and FAIRE-seq mapping, which is used to identify active regulatory sites characterized by lower density of nucleosomes. ATAC-seq uses the Tn5 transposase, which can insert sequencing adaptor sequences only into regions free of nucleosomes. Atherosclerosis is a disease in which the inside of an artery narrows due to the buildup of plaques. It can result in coronary heart disease, stroke, peripheral artery disease or kidney problems, depending on which arteries are affected. Atherosclerotic plaques are the underlying entities of atherosclerotic diseases. Autistic spectrum disorders is a group of neurodevelopmental diseases characterized by deficits in social and communicative interaction and stereotypic behaviors. Autophagy is a mechanism for degrading cellular proteins and recycling their products as sources of nutrients during times of stress. Basal transcriptional machinery (also called preinitiation complex) is composed of a large number of GTFs (many of which are summarized as the TFIID complex) located at the TSS and using Pol II as its core. The basal transcriptional machinery is connected with activating and repressing cell- and site-specific transcription factors binding to enhancer regions via another multiprotein complex of coactivators termed the MED complex. Beckwith-Wiedemann syndrome is a predominantly maternally transmitted disorder, involving fetal and postnatal overgrowth and a predisposition to embryonic tumors. The disease locus includes several imprinted genes, including IGF2, H19 and KCNQ1 and loss of imprinting at IGF2 is seen in ~ 20% of cases. Benign tumor is an abnormal proliferation of cells driven by at least one mutation in an oncogene or tumor suppressor gene. These cells are not invasive (i.e., they cannot penetrate the basement membrane lining them), which distinguishes them from malignant cells.
Glossary
685
Bioactive compound is a type of chemical found in small amounts in plants and certain foods, such as fruits, vegetables, nuts, oils and whole grains promoting good health. Bisulfite sequencing is a method to study 5mC DNA methylation. Native DNA is exposed to sodium bisulfite, as a result of which non-methylated cytosines undergo deamination and are converted to uracils (which are read as thymines), whereas methylated cytosines remain unconverted. Sequencing libraries are generated from the converted template and they allow the study of methylation at single-base resolution. Bivalent chromatin is composed of chromatin regions that harbor active and repressive histone modifications. Bivalent chromatin domains mark genes that are expressed at low levels only but are poised for activation upon an intra or extracellular signal. Blastocysts are early stage embryos that have undergone the first cell lineage specification, which results in two primary cell types: cells of the inner cell mass and trophoblasts. Broad promoter is, in contrast to a sharp promoter, typical of ubiquitously expressed genes, has a more dispersed pattern of transcriptional initiation and does not contain a TATA box. Bromodomain is a protein module of ~ 110 amino acids that mediates interaction with acetylated lysines and is often found in HATs and ATP-dependent chromatin remodeling proteins. Brown adipose tissue (BAT) is highly specialized adipose tissue, the main function of which is to produce heat (thermogenesis). Cachexia is a complex syndrome associated causing ongoing muscle loss that is not entirely reversed with nutritional supplementation. Calorie restriction is a dietary regimen that reduces calorie intake daily without incurring malnutrition or a reduction in essential nutrients. Cancer stem cells are cancer cells that possess characteristics associated with normal stem cells, such as the ability to give rise to all cell types found in a particular cancer sample. Cancer is a group of diseases involving abnormal cell growth with the potential to invade or spread to other parts of the body. Carcinoma is a type of malignant tumor composed of epithelial cells. Cardiovascular disease (CVD) is a class of diseases that involve the heart or blood vessels, such as coronary heart disease, stroke, heart failure and more. Catabolism is the set of metabolic pathways breaking down molecules into smaller units that are either oxidized to release energy or used in anabolic reactions. Cellular reprograming is the conversion of a differentiated cell to an embryonic state. Central tolerance is the mechanisms by which T cells and B cells are rendered non-reactive to an antigen (typically a self-antigen) in primary lymphoid organs. CG dinucleotides (CpGs) are the only dinucleotides that can be methylated symmetrically, i.e., DNA methylation can be inherited only via CpGs to both daughter cells. The “p” indicates the phosphate linking the two nucleosides.
686
Glossary
Chemokines is a group of small cytokine-like proteins that induce directed chemotaxis to responsive neighboring cells, i.e., they act as chemoattractant cytokines. Chemotherapy is a type of cancer treatment that uses one or more anticancer drugs. Chromatin conformation capture (3C) is a method for studying chromosomal 3D structure by proximity ligation. The assay relies on cross-linking chromatin with a fixing agent (usually formaldehyde), digestion of the DNA with a restriction enzyme and ligation of the fixed chromatin. In the resulting chimeric DNA template, regions that were close spatially are now closed linearly. Chromatin immunoprecipitation followed by sequencing (ChIP-seq) is a method for genome-wide mapping of the distribution of histone modifications and chromatin associated proteins, such as transcription factors, that relies on immunoprecipitation with antibodies to modified histones or other chromatin proteins. The enriched DNA is sequenced to create genome-wide profiles. Chromatin modifier is an enzyme either recognizing (reading) chromatin (i.e., posttranslationally modified histones or methylated genomic DNA), adding (writing) marks or removing (erasing) them. Chromatin is the molecular substance of chromosomes being a complex of genomic DNA and histone proteins. Chromatosome is the result of histone H1 binding to a nucleosome. It contains 166 base pairs of DNA, 147 of which wrapped around the histone core of the nucleosome. Chromodomain is a modular methyl-binding domain of 40–50 amino acids that is commonly found in chromatin remodeling proteins. Chromosome territories are nuclear volumes that are occupied by each specific chromosome within the interphase nucleus. Chronic inflammation represents long-term inflammation lasting for prolonged periods of several months to years. Chronic inflammation plays a central role in most common non-communicable diseases, such as cancer, T2D, asthma and Alzheimer’s. Circadian clock is a biochemical oscillator that cycles with a stable phase and is synchronized with solar time. Cis regulatory elements are stretches of genomic DNA, e.g., TFBSs in enhancers, that regulate a target gene by a mechanism that depends on their residing on the same TAD, i.e., mostly not more than 1 MB in distance. Cistrome is the set of cis regulatory elements of a trans-acting factor on a genomewide scale, i.e., in most cases the complete set of experimentally verified binding sites, e.g., by ChIP-seq, of a transcription factor. Clonal mutation is a mutation that exists in the vast majority of the neoplastic cells within a malignant tumor. Coactivator is a nuclear protein that binds to an activator (mostly a transcription factor), in order to increase the rate of transcription of a gene. Most coactivators cannot bind DNA but some chromatin-modifying enzymatic activity. Corepressor is a nuclear protein that like a coactivator binds to a transcription factor, but results in its repression, so that the rate of gene expression decreases. There
Glossary
687
are different mechanisms of repression and often corepressors and coactivators compete for the same binding sites. Some corepressors have chromatin modifying enzymatic activity. Comparative genomics a subdiscipline of genomics, in which DNA sequence, genes, gene order, regulatory sequences and other genomic structural landmarks of different organisms are compared, in order to understand basic biological similarities and differences as well as evolutionary relationships between species. Complement system is a component of the innate immune system that can be activated by antigen-bound antibodies. Constitutive heterochromatin is a subtype of heterochromatin that is present at the highly repetitive DNA sequences found at the centromeres and telomeres of chromosomes, where it hinders transposable elements from becoming activated and thereby ensures genome stability and integrity. CpG island is a genomic region of at least 200 base pairs showing a CG percentage of higher than 55%. However, typically CpG islands are 300–3,000 base pairs long. CTCF is a transcription factor with an 11-zinc finger DBD that is involved in many cellular processes, such as transcriptional regulation, insulator activity and regulation of chromatin architecture. Cytokines is a group of small proteins (~5–20 kDa) that are important in cell signaling involved in autocrine, paracrine and endocrine signaling as immunomodulating agents. Damage-associated molecular patterns (DAMPs) are also known as alarmins, are molecules often released by stressed cells undergoing necrosis that act as endogenous danger signals to promote and exacerbate inflammatory responses. Examples of non-protein DAMPs include cholesterol crystals and saturated fatty acids. DAMPs are associated with many inflammatory diseases, including arthritis, atherosclerosis, Crohn’s disease and cancer. Developmental Origins of Health and Disease (DOHaD) is an approach to investigate the role of prenatal and perinatal exposure to environmental factors, such as undernutrition, in determining the development of human diseases in adulthood. Diploid is an organism or cell with a double set of chromosomes, so that each position is represented by two genes or alleles. DNA methylation is the covalent addition of a methyl group to the C5 position of cytosine. DNA methyltransferases (DNMTs) are a family of enzymes catalyzing the transfer of a methyl group to cytosines of genomic DNA. Driver gene mutation is a mutation that directly or indirectly confers a selective growth advantage to the cell in which it occurs. Driver gene is a gene that contains driver gene mutations or is expressed aberrantly in a fashion that confers a selective growth advantage. Dysbiosis is compositional and functional alteration of the gut microbiome. Dyslipidemia is an abnormal amount of lipids, such as triglycerides, cholesterol and/or fat phospholipids, in the blood.
688
Glossary
Ectoderm is the outermost layer of the three embryonic germ layers that gives rise to the epidermis, like skin, hair and eyes and the nervous system. Embryogenesis is also called embryonic development, i.e., the process by which the embryo forms and develops. In mammals, the term is use exclusively to the early stages of prenatal development, whereas the terms fetus and fetal development describe later stages. Embryonic stem (ES) cell is a pluripotent stem cell that is derived from the inner cell mass of the early embryo. Pluripotent cells are capable of generating virtually all cell types of the organism. Endoderm is the innermost layer of the three embryonic germ layers that gives rise to the epithelia of the digestive and respiratory systems, such as liver, pancreas and lungs. Enhancer RNAs (eRNAs) are a class of short (