Language Program Vitality in the United States: From Surviving to Thriving in Higher Education (Educational Linguistics, 63) 3031436539, 9783031436536
The perception of a permanent enrollment crisis in US postsecondary foreign language education has shaped our profession
138 109 7MB
English Pages 399 [374] Year 2023
Acknowledgements
Contents
Contributors
About the Editors
Starting Your Path from Surviving to Thriving Language Programs
1 Introduction
2 Overall Volume Structure
3 Theme 1: Setting the Scene
4 Theme 2: Student Voices
5 Theme 3: Solutions to Thrive
5.1 Planned and Imagined Initiatives
5.2 Adjustments to Curriculum/Tried Initiatives
5.3 Recruitment
5.4 Credentials
6 Conclusion
References
Part I: Setting the Scene
MLA Language Enrollment Trends
References
Beyond the Crisis: Tools for Analyzing Historical Enrollments in Languages Other Than English
1 What Happened in General: On the ``Crisis´´, and More
1.1 Breaking Down Absolute Numbers: A Realm of Inequality
2 The Dynamics of Emerging Languages
2.1 Overview
2.2 Differences by Institution Type
2.3 Regionalization
2.4 Regionalization and Immigration Trends
3 Conclusion
References
The Increasing Diversity of World Language Study in the United States, 1958-2016
1 Introduction
2 Core Languages
3 Emerging Languages
4 Other Languages
References
World Language Enrollment at Community Colleges in the United States Between 1960 and 2010
1 Introduction
2 A Brief History of Community Colleges in the U.S.
2.1 Foundation of Community Colleges in the U.S.
2.2 Expansion of Community Colleges in the 1960s and Accessibility to College Education
2.3 Undergraduate Enrollment and World Language Enrollment
2.4 Accessibility to College Education for Students of Color and Immigrant-Origin Students
3 Student Linguistic Diversity in the WL Classroom at Community Colleges
4 What Can We Learn from Analyzing World Language Enrollment at Community Colleges?
5 Conclusion
References
Part II: Student Voices
Amplifying Student Voices: US. Undergraduate Student Perspectives on Expanding Access and Increasing the Relevance of Courses ...
1 Introduction
2 About the Study
2.1 Participants
2.2 Study Questionnaire
2.3 Data Collection
2.4 Qualitative Data Analysis
3 Results and Discussion
3.1 Reasons for Not Taking LOTE Courses
3.1.1 I Need to Prioritize My Major or Other Degree Requirements Over LOTE Study
3.1.2 Not Enough Room in My Schedule
3.2 Expanding Access to LOTE Courses
3.2.1 Access Theme 1: Offer More Class Time Options
3.2.2 Access Theme 2: Offer Online or Partially Online Courses
3.2.3 Access Theme 3: Schedule Fewer Weekly Class Meetings
3.2.4 Access Theme 4: Make LOTE Study Count Toward Major or Certificate
3.2.5 Access Theme 5: Offer Lower- or Variable-Credit Courses
3.3 Increasing the Relevance of LOTE Courses for U.S. Undergraduates
3.3.1 Relevance Theme 1: Focus More on Contemporary Culture
3.3.2 Relevance Theme 2: Link LOTE Courses to My Academic Major or Professional Goals
3.3.3 Relevance Theme 3: Focus More on Everyday Language, Especially in Speaking
3.3.4 Relevance as Personalization
4 Conclusion
References
Understanding Student (A)motivation Towards Learning a Language: Students´ Perspectives on Continued Language Study
1 Introduction
2 The Site
3 Methodology
4 Results and Discussion
4.1 Knowledge of SLA
4.2 Understanding the Importance of L2 Acquisition
4.3 Prior Experience with L2 Learning
4.4 Roadblocks to L2 Learning
5 Realizations and Ideas for Improvement
References
Why Doesn´t Everyone Take a World Language Class? University Students´ Perspectives on World Language Learning
1 Introduction
2 Background
3 Methods
3.1 Research Questions
3.2 Participants
3.3 Tasks
3.4 Analysis
3.5 Hypotheses
4 Results
4.1 K-12 WL Experiences and Opinions
4.2 Overall Knowledge of Benefits of Language Learning
5 Discussion
6 Conclusion
7 Considerations
References
Motivational Factors Affecting Language Student Enrollment and Retention in Higher Education
1 Background and Motivation for the Current Study
2 Literature Review
3 Aims of the Study
4 Method
4.1 Participants
4.2 Instrument, Data Collection and Analysis
5 Results
5.1 Comparisons of Student Groups
5.2 Method of Recruitment to Their Language of Study
6 Discussion
7 Limitations and Future Directions
8 Conclusion and Implications
Appendix The Questionnaire Items
References
Preparing for the Future: What Do High School Students Think About Language Learning?
1 Introduction
2 Background
2.1 Secondary Students´ Perceptions of Language Learning in English-Dominant Countries
2.2 University Students´ Perceptions of Language Learning in the USA
3 The Current Study
3.1 Study Context and Question Prompts
3.2 Participants
3.3 Method
4 Results
5 Discussion
6 Limitations
7 Conclusions and Recommendations
7.1 Recommendation 1: Find a Balance Between Vocational and Humanistic Applications of Language
7.2 Recommendation 2: Ensure that Students Have Opportunities to Personally Connect with Language and Culture
References
University Students´ Beliefs About the Language Requirement: Policy as Articulated and as Perceived
1 Literature Review
2 Methodology
3 Findings
3.1 Policy-as-Articulated: LAU´s Description of the Language Requirement
Excerpt 1: GEP Requirement Descriptions
Excerpt 2: GEP Language Requirement Description
Excerpt 3: MCL Website Description of Language Study
Excerpt 4: MCL Website Description of GEP Language Requirement
3.2 Policy-as-Perceived: Students´ Perspectives Toward the Language Requirement
3.2.1 Language
3.2.2 Language Learners
3.2.3 Language Learning
3.2.4 Language Requirement
4 Conclusion and Implications
References
Leveraging Student Surveys to Promote Recruitment and Retention
1 Introduction
2 Surveys as Recruitment Tools
3 Surveys as Retention Tools
4 Practical Considerations
Appendix 1
General Information Questions
Recruiting Students Into Language Classes
Recruiting Language Students Into Major/Minor
Retaining Language Students
References
Portuguese Language Program Evaluation
References
Part III: Solutions to Thrive: Planned and Imagined Initiatives
Uniting On All Levels
1 Introduction
2 Expanding the Footprint of Languages Through Identity
3 Expanding the Footprint of Languages Through Adjacent Programming
3.1 Events
3.2 Campus Partners
4 Expanding the Footprint of Languages by Building Community
4.1 Orientation
4.2 Increased Language Offerings
4.3 Access
4.4 Student Employment
4.5 Maintaining the Community
4.6 Recognizing Student Effort
5 Logistics of Expanding the Footprint of Languages
6 Conclusion
References
It Takes a Village: A Planned Initiative Toward Language Program Revitalization
1 Introduction
2 Pillar I: Preparing Students for a Life of Success, Meaning, and Positive Impact
3 Pillar 2: Becoming a Place of Belonging for and Emotional Growth for All
4 Pillar 3: Enriching and Positively Impacting Oklahoma, the Nation, and the World Through Research and Creative Activity
5 Conclusion
References
Professional Content-Based Courses for Novice Language Learning
1 Introduction
2 In Favor of Content-Based Courses
3 Example in Practice
4 Conclusion
Appendix A
Student Learning Outcomes
References
Community-Engagement as an Innovative Way to Revitalize Language Programs
1 Community-Engagement as an Innovative Way to Revitalize Language Programs
References
Part IV: Solutions to Thrive: Adjustments to Curriculum/Tried Initiatives
Expanding Access Through Online Asynchronous Language Courses
References
A Multilanguage Seminar for the Twenty-First Century: Rethinking Self-Instruction for the Least Commonly Taught Languages
1 Introduction
2 Enrollment Data
3 Sample Semester Plan
4 Assessment
5 Student Experiences
6 Advice for Creating a Multilanguage Seminar
7 Conclusion: Addressing Potential Concerns
References
Leveraging Language for Specific Purposes as a Motivating Factor for World Language Study
1 Introduction
2 Literature Review
3 Institutional Overview
4 LSP Through Curricula
5 LSP Through Extracurricular and Co-curricular Opportunities
6 LSP Through Immersion Opportunities Abroad
7 Conclusion
References
Contributing Factors and Achievable Solutions to the World Language Enrollment Downturn: A Midwestern Case Study
1 Program Challenges
2 Program Redesign and Results
Reference
A Revamped Major: Reimagining the Role of Languages at a Business University
1 Introduction
2 Institutional Context
3 An Attempt to Build a Multidisciplinary Major
4 The Revamp: Lessons Learned
5 Conclusion
References
Staying Afloat: Attracting Hebrew Language Students with Collaboration and the Use of Content Based Instruction
1 Issues Encountered
1.1 An Outdated Textbook
1.2 Non-communicative Approach
1.3 The ``Sage on the Stage´´ Phenomenon
1.4 Resistance to Professional Development
1.5 Everyone for Themselves
2 Making Changes
2.1 New Methodologies Versus Traditional Instruction
2.2 Empowering Instructors with Training
2.3 Flipping the Classroom
2.4 Empowering Students with Content-Based Instruction
2.5 Current and Relevant Online Israeli Culture
2.6 Adjusting Curricula Based on Student Interests
2.7 Use of Authentic Materials
3 Challenges in Implementation
4 Outcomes
References
Innovative Strategies for Stabilizing Enrollment in Korean as a Foreign Language (KFL) Education
1 Introduction
2 Innovative Strategies for Stabilizing Enrollment
2.1 Creating Degree Programs
2.2 Securing Teaching Staff
2.3 Enlarging Community Involvement
2.4 Reconfiguring the Curriculum Along Innovative Pedagogical Approaches
3 Conclusion
References
Trial, Error, and Success: Recruitment and Retention Initiatives in a Small German Program
1 The German Program at Elon University
2 Learner Motivation Study
3 Community, Curriculum, and Career
3.1 Curriculum
3.2 Career
3.3 Community
4 Enrollment Data 2017-2022
5 Where Do We Go from Here
6 Recommendations for Program Development
References
Centers of Change: Forming Administrative Structures to Support Language Study
1 Reimagining a Language Laboratory and Its Director
2 The Language Council and Language Advocacy
3 Changing the University Curriculum
4 Preparing to Implement a New Language Requirement
5 Looking Beyond Proficiency
6 Conclusion
References
Language as a Bridge to Other Disciplines
1 Introduction
2 Institutional Context
3 Structuring the Program
4 Conclusion
References
Language Programs at Rochester Institute of Technology: A Successful Recent Initiative (2018-Present)
1 The Setting: Language & Culture at a STEM-Focused Institution
2 The Challenge: Responding to Institutional Change
3 Surviving to Thriving: An Applied Approach
4 Conclusions and Recommendations
References
Part V: Solutions to Thrive: Recruitment
The Seal of Biliteracy as a Recruitment Opportunity
1 Introduction
2 Context and Design of the Recruitment Initiative
3 Preliminary Results
4 Conclusions and Next Steps
References
The Language Placement Brief: Showcasing Language Learning Opportunities
References
Internationalize Your Major: Embracing the Supportive Role of Language Study
1 Background
2 Evidence of Success
3 Next Steps
Part VI: Solutions to Thrive: Credentials
Changing the Narrative Around Language Study
References
Retaining Students with Shared Courses and Meaningful Credentials
1 Introduction
2 Instructional Approach
3 Assessment: ePortfolios and Avant STAMP 4S
References
The Language Certificate: Encouraging Foreign Language Proficiency for All University Students
1 Rationale
2 Language Certificate Requirements
2.1 Language
2.2 Civilization/Culture
2.3 Literature
2.4 Proficiency Assessments
3 Proposing the Language Certificate Program
3.1 Language Certificate Program Proposal-Example
3.1.1 Background
3.1.2 Eligibility and Qualifications
3.1.3 The Process
4 Initial Implementation of the Language Certificate
5 Unexpected Benefits
6 + Humanities Initiative
7 Cost of the Language Certificate
8 Current Status
9 BYU Language Certificate Program-Annual Report Example
10 Conclusion
References
Global Honors: Responding to Twenty-First Century Language Learners´ Real-World Goals
References
You Have Reached the End: Now the Work Begins
1 Takeaways
1.1 Takeaway #1: It´s Not All Doom and Gloom
1.2 Takeaway #2: Consider Focusing on High Impact Practices
1.3 Takeaway #3: Professionalizing Enrollment Work
2 Okay, You Read This Book. Now What?
2.1 What´s Missing in This Volume and in the Field?
2.2 What Could You Do Next? A Call to Action
2.3 You Need an Intentional Framework
References
Recommend Papers
![Higher Education in the United States: The Economic Problems [Reprint 2014 ed.]
9780674423305, 9780674423299](https://ebin.pub/img/200x200/higher-education-in-the-united-states-the-economic-problems-reprint-2014nbsped-9780674423305-9780674423299.jpg)


- Author / Uploaded
- Emily Heidrich Uebel (editor)
- Felix A. Kronenberg (editor)
- Scott Sterling (editor)
File loading please wait...
Citation preview
Educational Linguistics
Emily Heidrich Uebel Felix A. Kronenberg Scott Sterling Editors
Language Program Vitality in the United States From Surviving to Thriving in Higher Education
Educational Linguistics Volume 63
Series Editor Francis M. Hult, University of Maryland, Baltimore County (UMBC), Baltimore, Maryland, USA Editorial Board Members Marilda C. Cavalcanti, Universidade Estadual de Campinas, Campinas, Brazil Jasone Cenoz, University of the Basque Country, Leioa, Spain Angela Creese, University of Stirling, Stirling, UK Ingrid Gogolin, University of Hamburg, Hamburg, Germany Christine Hélot, Université de Strasbourg, Strasbourg, France Hilary Janks, University of the Witwatersrand, Johannesburg, South Africa Claire Kramsch, University of California, Berkeley, USA Constant Leung, King’s College London, London, UK Angel Lin, Simon Fraser University, Burnaby, Canada Alastair Pennycook, University of Technology, Sydney, Australia
Educational Linguistics is dedicated to innovative studies of language use and language learning. The series is based on the idea that there is a need for studies that break barriers. Accordingly, it provides a space for research that crosses traditional disciplinary, theoretical, and/or methodological boundaries in ways that advance knowledge about language (in) education. The series focuses on critical and contextualized work that offers alternatives to current approaches as well as practical, substantive ways forward. Contributions explore the dynamic and multi-layered nature of theory-practice relationships, creative applications of linguistic and symbolic resources, individual and societal considerations, and diverse social spaces related to language learning. The series publishes in-depth studies of educational innovation in contexts throughout the world: issues of linguistic equity and diversity; educational language policy; revalorization of indigenous languages; socially responsible (additional) language teaching; language assessment; first- and additional language literacy; language teacher education; language development and socialization in non-traditional settings; the integration of language across academic subjects; language and technology; and other relevant topics. The Educational Linguistics series invites authors to contact the general editor with suggestions and/or proposals for new monographs or edited volumes. For more information, please contact the Editor: Marianna Georgouli, Van Godewijckstraat 30, 3300 AA Dordrecht, The Netherlands. All proposals and manuscripts submitted to the Series will undergo at least two rounds of external peer review. This series is indexed in Scopus and the Norwegian Register for Scientific Journals, Series and Publishers (NSD).
Emily Heidrich Uebel • Felix A. Kronenberg Scott Sterling Editors
Language Program Vitality in the United States From Surviving to Thriving in Higher Education
Editors Emily Heidrich Uebel Michigan State University East Lansing, MI, USA
Felix A. Kronenberg Michigan State University East Lansing, MI, USA
Scott Sterling Indiana State University Terre Haute, IN, USA
ISSN 1572-0292 ISSN 2215-1656 (electronic) Educational Linguistics ISBN 978-3-031-43653-6 ISBN 978-3-031-43654-3 (eBook) https://doi.org/10.1007/978-3-031-43654-3 © The Editor(s) (if applicable) and The Author(s), under exclusive license to Springer Nature Switzerland AG 2023 This work is subject to copyright. All rights are solely and exclusively licensed by the Publisher, whether the whole or part of the material is concerned, specifically the rights of translation, reprinting, reuse of illustrations, recitation, broadcasting, reproduction on microfilms or in any other physical way, and transmission or information storage and retrieval, electronic adaptation, computer software, or by similar or dissimilar methodology now known or hereafter developed. The use of general descriptive names, registered names, trademarks, service marks, etc. in this publication does not imply, even in the absence of a specific statement, that such names are exempt from the relevant protective laws and regulations and therefore free for general use. The publisher, the authors, and the editors are safe to assume that the advice and information in this book are believed to be true and accurate at the date of publication. Neither the publisher nor the authors or the editors give a warranty, expressed or implied, with respect to the material contained herein or for any errors or omissions that may have been made. The publisher remains neutral with regard to jurisdictional claims in published maps and institutional affiliations. This Springer imprint is published by the registered company Springer Nature Switzerland AG The registered company address is: Gewerbestrasse 11, 6330 Cham, Switzerland Paper in this product is recyclable.
To my husband, Matthew, a constant source of support for everything I do. – Emily To my family, colleagues, and mentors, who make this all possible. – Felix To my family, for your endless support and encouragement. – Scott
Acknowledgements
This volume came out of the work of a 2021 colloquium at the American Association of Applied Linguistics (AAAL). We would like to thank all of the presenters and authors of those presentations, which helped inspire and guide the development of this volume. The members of that colloquium were Dianna Murphy (first organizer), Felix A. Kronenberg (second organizer), Emily Heidrich Uebel, Koen Van Gorp, Jana Martin, Kristin Dalby, Melanie D’Amico, and Scott Sterling. We would like to thank Lizz Huntley for her assistance with some editorial tasks and close reading of the chapters. Her extra set of eyes has been invaluable in the preparation of this volume. We also would like to acknowledge the support and resources that were made possible by the Center for Language Teaching Advancement (CeLTA) in the College of Arts and Letters at Michigan State University as well as the Less Commonly Taught and Indigenous Languages Partnership, funded by the Andrew W. Mellon Foundation.
vii
Contents
Starting Your Path from Surviving to Thriving Language Programs . . . Emily Heidrich Uebel, Felix A. Kronenberg, and Scott Sterling Part I
1
Setting the Scene
MLA Language Enrollment Trends . . . . . . . . . . . . . . . . . . . . . . . . . . . . Natalia Lusin
9
Beyond the Crisis: Tools for Analyzing Historical Enrollments in Languages Other Than English . . . . . . . . . . . . . . . . . . . . . . . . . . . . . Lidia Tripiccione
19
The Increasing Diversity of World Language Study in the United States, 1958–2016 . . . . . . . . . . . . . . . . . . . . . . . . . . . . . . . Fedor Karmanov
33
World Language Enrollment at Community Colleges in the United States Between 1960 and 2010 . . . . . . . . . . . . . . . . . . . . . . Tomonori Nagano
41
Part II
Student Voices
Amplifying Student Voices: US. Undergraduate Student Perspectives on Expanding Access and Increasing the Relevance of Courses in Languages Other Than English . . . . . . . . . . . . . . . . . . . . . Dianna Murphy and Jana Martin Understanding Student (A)motivation Towards Learning a Language: Students’ Perspectives on Continued Language Study . . . . . . . . . . . . . . Melanie L. D’Amico and Scott Sterling
59
77
ix
x
Contents
Why Doesn’t Everyone Take a World Language Class? University Students’ Perspectives on World Language Learning . . . . . . Bret Linford
93
Motivational Factors Affecting Language Student Enrollment and Retention in Higher Education . . . . . . . . . . . . . . . . . . . . . . . . . . . . 109 Sibel Crum and Piibi-Kai Kivik Preparing for the Future: What Do High School Students Think About Language Learning? . . . . . . . . . . . . . . . . . . . . . . . . . . . . . 127 Russell Simonsen University Students’ Beliefs About the Language Requirement: Policy as Articulated and as Perceived . . . . . . . . . . . . . . . . . . . . . . . . . . 141 Carlo Cinaglia Leveraging Student Surveys to Promote Recruitment and Retention . . . 159 LeAnne L. Spino Portuguese Language Program Evaluation . . . . . . . . . . . . . . . . . . . . . . . 167 Bruna Sommer-Farias and Ana M. Carvalho Part III
Solutions to Thrive: Planned and Imagined Initiatives
Uniting On All Levels . . . . . . . . . . . . . . . . . . . . . . . . . . . . . . . . . . . . . . . 173 Jane Sokolosky It Takes a Village: A Planned Initiative Toward Language Program Revitalization . . . . . . . . . . . . . . . . . . . . . . . . . . . . . . . . . . . . . . . . . . . . . 185 Rebecca S. Borden and Daniel M. Anderson Professional Content-Based Courses for Novice Language Learning . . . 191 Joseph Fees Community-Engagement as an Innovative Way to Revitalize Language Programs . . . . . . . . . . . . . . . . . . . . . . . . . . . . . . . . . . . . . . . . 199 Sandie Blaise Part IV
Solutions to Thrive: Adjustments to Curriculum/Tried Initiatives
Expanding Access Through Online Asynchronous Language Courses . . . . . . . . . . . . . . . . . . . . . . . . . . . . . . . . . . . . . . . . . 205 Justin Court, Karolina May-Chu, Jason Williamson, and Jonathan Wipplinger A Multilanguage Seminar for the Twenty-First Century: Rethinking Self-Instruction for the Least Commonly Taught Languages . . . . . . . . . . . . . . . . . . . . . . . . . . . . . . . . . . . . . . . . . 209 Katrina Daly Thompson and Adeola Agoke
Contents
xi
Leveraging Language for Specific Purposes as a Motivating Factor for World Language Study . . . . . . . . . . . . . . . . . . . . . . . . . . . . . 221 Zachary F. Miller, John D. Benjamin, Carlotta Chenoweth, and Sherry A. Maggin Contributing Factors and Achievable Solutions to the World Language Enrollment Downturn: A Midwestern Case Study . . . . . . . . . 233 Elizabeth Langley A Revamped Major: Reimagining the Role of Languages at a Business University . . . . . . . . . . . . . . . . . . . . . . . . . . . . . . . . . . . . . 237 Christian Rubio Staying Afloat: Attracting Hebrew Language Students with Collaboration and the Use of Content Based Instruction . . . . . . . . 241 Adi Raz Innovative Strategies for Stabilizing Enrollment in Korean as a Foreign Language (KFL) Education . . . . . . . . . . . . . . . . . . . . . . . . 251 Young-mee Yu Cho and Hee Chung Chun Trial, Error, and Success: Recruitment and Retention Initiatives in a Small German Program . . . . . . . . . . . . . . . . . . . . . . . . . . . . . . . . . . 267 Kristin Lange and Scott Windham Centers of Change: Forming Administrative Structures to Support Language Study . . . . . . . . . . . . . . . . . . . . . . . . . . . . . . . . . . 285 G. Cory Duclos and Yukari Hirata Language as a Bridge to Other Disciplines . . . . . . . . . . . . . . . . . . . . . . . 301 Deborah S. Reisinger Language Programs at Rochester Institute of Technology: A Successful Recent Initiative (2018-Present) . . . . . . . . . . . . . . . . . . . . . 307 Sara Armengot Part V
Solutions to Thrive: Recruitment
The Seal of Biliteracy as a Recruitment Opportunity . . . . . . . . . . . . . . . 315 Janet Eckerson and Christopher Jacobs The Language Placement Brief: Showcasing Language Learning Opportunities . . . . . . . . . . . . . . . . . . . . . . . . . . . . . . . . . . . . . . . . . . . . . 321 Sherry A. Maggin, John C. Baskerville, John D. Benjamin, and John M. Pendergast Internationalize Your Major: Embracing the Supportive Role of Language Study . . . . . . . . . . . . . . . . . . . . . . . . . . . . . . . . . . . . . 325 Laura C. Edwards and Juliet Lynd
xii
Part VI
Contents
Solutions to Thrive: Credentials
Changing the Narrative Around Language Study . . . . . . . . . . . . . . . . . . 331 Rebecca J. Ulland Retaining Students with Shared Courses and Meaningful Credentials . . . . . . . . . . . . . . . . . . . . . . . . . . . . . . . . . . . . . . . . . . . . . . . 337 Lauren Rosen, Kaishan Kong, and Hongying Xu The Language Certificate: Encouraging Foreign Language Proficiency for All University Students . . . . . . . . . . . . . . . . . . . . . . . . . . 341 Troy L. Cox, Matthew P. Wilcox, and Ray T. Clifford Global Honors: Responding to Twenty-First Century Language Learners’ Real-World Goals . . . . . . . . . . . . . . . . . . . . . . . . . 359 Catherine Baumann, Ahmet Dursun, and Lidwina van den Hout You Have Reached the End: Now the Work Begins . . . . . . . . . . . . . . . . 371 Emily Heidrich Uebel, Felix A. Kronenberg, and Scott Sterling
Contributors
Adeola Agoke University of Wisconsin, Madison, WI, USA Daniel M. Anderson University of Oklahoma, Norman, OK, USA Sara Armengot Rochester Institute of Technology, Rochester, NY, USA John C. Baskerville United States Military Academy, West Point, NY, USA Catherine Baumann University of Chicago, Chicago, IL, USA John D. Benjamin United States Military Academy, West Point, NY, USA Sandie Blaise Princeton University, Princeton, NJ, USA Rebecca S. Borden University of Oklahoma, Norman, OK, USA Ana M. Carvalho University of Arizona, Tucson, AZ, USA Carlotta Chenoweth United States Military Academy, West Point, NY, USA Young-mee Yu Cho The Rutgers, The State University of New Jersey, New Brunswick, NJ, USA Hee Chung Chun The Rutgers, The State University of New Jersey, New Brunswick, NJ, USA Carlo Cinaglia Michigan State University, Lansing, MI, USA Ray T. Clifford Brigham Young University, Provo, UT, USA Justin Court University of Wisconsin-Milwaukee, Milwaukee, WI, USA Troy L. Cox Brigham Young University, Provo, UT, USA Sibel Crum Indiana University, Bloomington, IN, USA Melanie L. D’Amico Indiana State University, Terre Haute, IN, USA G. Cory Duclos Colgate University, Hamilton, NY, USA xiii
xiv
Contributors
Ahmet Dursun University of Chicago, Chicago, IL, USA Janet Eckerson University of Nebraska, Kearney, NE, USA Laura C. Edwards Illinois State University, Normal, IL, USA Joseph Fees Delaware State University, Dover, DE, USA Yukari Hirata Colgate University, Hamilton, NY, USA Lidwina van den Hout University of Chicago, Chicago, IL, USA Christopher Jacobs University of Nebraska, Kearney, NE, USA Fedor Karmanov Princeton University, Princeton, NJ, USA Piibi-Kai Kivik Indiana University, Bloomington, IN, USA Kaishan Kong University of Wisconsin, Eau Claire, WI, USA Felix A. Kronenberg Michigan State University, East Lansing, MI, USA Kristin Lange Elon University, Elon, NC, USA Elizabeth Langley Fort Hays State University, Hays, KS, USA Bret Linford Grand Valley State University, Allendale, MI, USA Natalia Lusin Modern Language Association, New York City, NY, USA Juliet Lynd Illinois State University, Normal, IL, USA Sherry A. Maggin United States Military Academy, West Point, NY, USA Jana Martin University of Wisconsin, Madison, WI, USA Karolina May-Chu University of Wisconsin-Milwaukee, Milwaukee, WI, USA Zachary F. Miller United States Military Academy, West Point, NY, USA Dianna Murphy University of Wisconsin, Madison, WI, USA Tomonori Nagano LaGuardia Community College, the City University of New York, New York, NY, USA John M. Pendergast United States Military Academy, West Point, NY, USA Adi Raz University of Michigan, Ann Arbor, MI, USA Deborah S. Reisinger Duke University, Durham, NC, USA Lauren Rosen University of Wisconsin, Madison, WI, USA Christian Rubio Bentley University, Waltham, MA, USA Russell Simonsen Miami University, Oxford, OH, USA Jane Sokolosky Brown University, Providence, RI, USA
Contributors
xv
Bruna Sommer-Farias Michigan State University, East Lansing, MI, USA LeAnne L. Spino University of Rhode Island, Kingston, RI, USA Scott Sterling Indiana State University, Terre Haute, IN, USA Katrina Daly Thompson University of Wisconsin, Madison, WI, USA Lidia Tripiccione Princeton University, Princeton, NJ, USA Emily Heidrich Uebel Michigan State University, East Lansing, MI, USA Rebecca J. Ulland Northern Michigan University, Marquette, MI, USA Matthew P. Wilcox Brigham Young University, Provo, UT, USA Jason Williamson University of Wisconsin-Milwaukee, Milwaukee, WI, USA Scott Windham Elon University, Elon, NC, USA Jonathan Wipplinger University of Wisconsin-Milwaukee, Milwaukee, WI, USA Hongying Xu University of Wisconsin, La Crosse, WI, USA
About the Editors
Emily Heidrich Uebel (Ph.D., University of Wisconsin‐Madison) is an Academic Specialist at the Center for Language Teaching Advancement (CeLTA) and the Associate Executive Director of the National Less Commonly Taught Languages Resource Center (NLRC) at Michigan State University. Her research interests include foreign language proficiency, educational technology and online instruction, curriculum design, LCTL education, and education abroad topics. More information can be found on her website: https://emilyheidrichuebel.com/ Felix A. Kronenberg is the Director of the Center for Language Teaching Advancement (CeLTA), Director of the National Less Commonly Taught Languages Resource Center (NLRC), and an Associate Professor of German in the Department of Linguistics, Languages, and Cultures at Michigan State University. His research interests include physical, virtual, and hybrid language learning spaces, educational technology, curriculum design, and program administration. More information can be found on his website: http://www.felixkronenberg.com/ Scott Sterling (Ph.D., Michigan State University) is an Associate Professor of linguistics and TESL at Indiana State University. His research includes metaresearch, research ethics, and second language acquisition. More information can be found on his website: https://www.scott-sterling.com/
xvii
Starting Your Path from Surviving to Thriving Language Programs Emily Heidrich Uebel
, Felix A. Kronenberg
, and Scott Sterling
Abstract Are language programs in the United States really in crisis? While there have been numerous articles about declines in world language enrollment and departments, we know that such concerns are not new. If this is, indeed, an old conversation, what does this edited volume add to it? Why now? This volume formalizes and focuses efforts and research on program vitality and enrollments, which has been relegated to scattered initiatives and informal discussions. This chapter gives an overview to the volume and its three overarching themes: (1) Setting the Scene, (2) Student Voices, and (3) “Solutions to Thrive,” which feature innovative ways to increase language program vitality. Keywords Enrollment · Language students · Recruitment · Credentials · Curriculum change
1 Introduction Are language programs in the United States really in crisis? There have been plentiful articles about declines in world language enrollment and departments (e.g., Johnson, 2019), but we know that such concerns are not new; Whitcomb (1972) emphasized the need to “halt the downward trend” in enrollments over 50 years ago (p. 11). If this is, indeed, an old conversation, what does this edited volume add to it? Why now? It is an understatement to say that the years between 2018 and 2023 were years of extreme uncertainty, which prompted a great many changes – or at the very least some intense discussion of changes – in society and in education. This period also
E. Heidrich Uebel (✉) · F. A. Kronenberg Michigan State University, East Lansing, MI, USA e-mail: [email protected]; [email protected] S. Sterling Indiana State University, Terre Haute, IN, USA e-mail: [email protected] © The Author(s), under exclusive license to Springer Nature Switzerland AG 2023 E. Heidrich Uebel et al. (eds.), Language Program Vitality in the United States, Educational Linguistics 63, https://doi.org/10.1007/978-3-031-43654-3_1
1
2
E. Heidrich Uebel et al.
saw a growing concern about the rapid increase in costs of education. With tuition growth of well over 130% over the past 20 years at all types of universities (Kerr & Wood, 2022), “the value of college, once taken for granted by most people, has steadily intensified as a point of debate” (Busteed, 2019). As Harrison (2017) noted, many employers nowadays expect their recent hires to be able to “add value immediately.” A focus on the value of degree led to many language programs and departments feeling a need to justify language study. In 2018 and 2019, respectively, the preliminary and final reports on world language enrollment from the Modern Language Association (MLA) were published, which showed marked declines in the majority of surveyed languages. It was during this time that a number of universities undertook studies to better understand the landscape of why students were (or were not) studying languages (e.g., Murphy et al., 2022; Van Gorp et al., forthcoming; and several chapters in this volume) and to experiment with innovative solutions to increase their program’s vitality. Starting in the spring of 2020, the COVID-19 pandemic forced institutions to experiment with a variety of technologies in order to facilitate emergency remote instruction, which differs from intentionally designed online courses. Although many programs are still learning how to harness the full power of designed online instruction, the experience of the virtual classroom during emergency remote instruction changed the course of many institutions’ offerings. There is a new openness and sense of experimentation in the academy, meaning that the time is ripe for language programs to innovate.
2 Overall Volume Structure Language Program Vitality in the United States: From Surviving to Thriving in Higher Education provides viewpoints and data from all levels of the academy (institutional, departmental, program, and course level) and is aimed at world language and second language studies scholars, language educators, and language program administrators. It is aimed at a wide variety of language scholars from diverse disciplines including literature, language, linguistics, cultural studies, language teaching/education, and general humanities. The data provided in this book can serve as a launching point for discussions and as inspiration for innovation. The co-editing team designed this volume to highlight a combination of research, theory, and praxis; readers will not only gain theoretical knowledge, but they will also be able to take away actionable items that can be implemented in their programs and departments. This volume has three overarching themes: (1) “Setting the Scene,” (2) “Student Voices,” and (3) “Solutions to Thrive,” which features innovative ways to increase language program vitality.
Starting Your Path from Surviving to Thriving Language Programs
3
3 Theme 1: Setting the Scene The volume begins by “Setting the Scene” (Sect. 1), with contributions from authors analyzing Modern Language Association language enrollment data. First, Lusin provides an update to the ongoing MLA enrollment survey along with a discussion of how it connects to previous versions of the survey. The two subsequent chapters focus on historical enrollment trends and provide a nuanced look at the data. Tripiccione analyzes undergraduate enrollments trends from 1974 to 2016 and argues for adapting our absolute view of these data. Karmanov dives into enrollment data to show how diversity in language study in the USA has increased, even amidst a decline in several European languages. To round out this section from a different perspective, Nagano then explores the historical language enrollment data with a focus on community colleges.
4 Theme 2: Student Voices In “Student Voices” (Sect. 2), authors call attention to student perspectives and voices regarding world language education, including qualitative and quantitative data from both large-scale studies and smaller case-studies. In this section, authors identify barriers to language study and motivational factors in the language classroom. It highlights student views on core issues affecting enrollment such as the language requirement, whether to continue studying their chosen language, as well as their prior experiences with learning languages. The first cluster of chapters examine students’ reasons to choose to enroll in language. Murphy and Martin present findings from a large-scale study of undergraduate students to examine why students are (not) studying languages other than English and how to increase the relevance of language courses. D’Amico and Sterling investigate reasons for not enrolling in language courses at a medium-sized, midwestern university in a qualitative study. Linford investigates factors that promote/demote students’ decisions to enroll in university world language courses. Crum and Kivik investigate the motivation of LCTL students and how they compare to those enrolled in a commonly taught language (Spanish). Simonsen provides a perspective from a different population by analyzing high school students’ opinions of the importance of language learning and provides implications for university language programs. Cinaglia examines one university’s articulation of the language requirement as well as the perspectives of undergraduate students toward their language learning experiences. The final two chapters in this section examine how programs have used or can use surveys to examine their own student population, as well as how such examinations can impact recruitment and retention. Spino provides examples of using inexpensive survey designs to engage and attract students into language programs. Sommer-Farias and Carvalho examined student analytics and surveys in their program and highlight how the results impacted their curriculum, recruitment, and departmental accountability.
4
E. Heidrich Uebel et al.
5 Theme 3: Solutions to Thrive The remainder of the volume are parts of the theme “Solutions to Thrive,” which includes innovative ways to increase language program vitality. There are four topics within “Solutions to Thrive” (Parts 3–6 of the book), each featuring a variety of initiatives and strategies implemented in institutions of varying size and location across the United States.
5.1
Planned and Imagined Initiatives
The first topic in “Solutions to Thrive” is “Planned and Imagined Initiatives,” which explores ideas that are either planned and not yet executed or ideas that have been tested on a smaller scale. Sokolosky reminds us that language learning is not an isolated activity that takes place only in a language department and that there are many ways to unite and excite students about learning a language. Borden and Anderson propose a planned interdisciplinary and collaborative initiative based on their institution’s strategic plan to boost both recruitment and retention in enrollment. Fees hypothesizes that programs can increase enrollment through contentbased courses for professional purposes at the elementary level and highlights an example of how one institution has implemented a beginning Medical Spanish course. Blaise discusses a plan to harness the power of community-based programs to provide innovative ways for students to develop language and cultural skills while making a social impact.
5.2
Adjustments to Curriculum/Tried Initiatives
The “Solutions to Thrive” theme continues with the documentation of initiatives that have been implemented on course, programmatic, or institutional levels. Court, May-Chu, Williamson, and Wipplinger describe the development and implementation of fully online, elementary German language courses to reach audiences beyond their face-to-face courses. Thompson and Agoke provide a unique option for expanding offerings in less commonly taught languages through a structured, autonomous language learning approach that guides students in setting and working toward their language learning goals. Three chapters highlight Language for Specific Purposes (LSP) and how it is woven into their programs. Miller, Benjamin, Chenoweth, and Maggin focus on how LSP can be used to motivate and retain students. Langley features a case study of a mid-size regional institution and its structural, programmatic, and cultural challenges to language study, including its program redesign and results. Rubio discusses the complete overhaul of the language major offered at a business-focused institution.
Starting Your Path from Surviving to Thriving Language Programs
5
Three chapters focus on programmatic changes in both commonly and less commonly taught languages such as Hebrew, Korean, and German. Raz focuses on a programmatic change through a “pedagogical and methodological overhaul” of the Hebrew program and the impact of such changes. Cho and Chun highlight strategies such as professional development, increasing community involvement, and adding a major and certificate program to stabilize enrollment in a Korean program. Lange and Windham highlight several initiatives focused on community, curriculum, and career that stemmed from a survey of German students about their motivation to study German. Duclos and Hirata begin the institutional-level focus by discussing ongoing efforts to effectively implement a newly approved language requirement and to change institutional perceptions of language study as an integral part of the institutional core curriculum. Reisinger features the Cultures and Languages Across the Curriculum program and how it has increased opportunities for students to deeply engage with language across a variety of topics. Armengot concludes the subsection on tried initiatives by highlighting the development of a new degree option at the Rochester Institute of Technology.
5.3
Recruitment
Even though recruitment has been a secondary theme of several other chapters, the chapters contained within the recruitment subsection specifically highlight ways to encourage language study and attract students. Eckerson and Jacobs implemented a recruitment strategy targeted at incentivizing language study through the Seal of Biliteracy. Maggin, Baskerville, Benjamin, and Pendergast discuss a language orientation event which allows programs to promote their languages and empowers students to make informed choices about their course of language study. Edwards and Lynd describe a university-wide initiative called Internationalize Your Major that focused on creating personalized 4-year plans of study.
5.4
Credentials
Credentialing, including minors and certificates, have long been a way to augment the traditional college degree or demonstrate competency in areas of specialization. However, the way that programs and universities currently use credentials is constantly changing. These chapters feature a variety of ways that universities can consider recognizing skills and competencies, and also give their students the necessary understanding to communicate this with future employers. Ulland introduces a certificate in Workplace Intercultural Competency as a means of helping students connect language learning with twenty-first century job demands. Rosen, Kong, and Xu discuss a course sharing program and its pedagogical innovations and
6
E. Heidrich Uebel et al.
structures, including regular assessments and the ability to receive badges. Cox, Wilcox, and Clifford examine one university’s experience in encouraging lifelong language development through the adoption of a Language Certificate program. Baumann, Dursun, and van den Hout reflect on the development of the Global Honors academic distinction at the University of Chicago.
6 Conclusion This collection of chapters will, we hope, be an informative and energizing reading experience. The contributions can be read in any order. We encourage readers to take small ideas, whole chapters, or the global themes and takeaways from the volume as a whole (as highlighted in Chapter “You Have Reached the End: Now the Work Begins”) to discuss with their colleagues and adapt to their own contexts. If you use information from book, we also encourage you to find ways to document, measure, and share your experiences (positive or negative) and grow a community of practice for supporting language programs. Who knows, maybe your experience will be highlighted in a second edition of this volume?
References Busteed, B. (2019, September 3). The convincing and confusing value of college explained. Forbes. https://www.forbes.com/sites/brandonbusteed/2019/09/03/the-convincing-and-confusingvalue-of-college-explained/?sh=2810f80d372d Gallagher, S. (2019, September 20). How the value of educational credentials is and Isn’t changing. Harvard Business Review. https://hbr.org/2019/09/how-the-value-of-educational-credentials-isand-isnt-changing Harrison, D. F. (2017). The role of higher education in the changing world of work. Educause Review, 52(6), 8–9. Johnson, S. (2019, January 22). Colleges lose a ‘stunning’ 651 foreign-language programs in 3 years. The Chronicle of Higher Education. https://www.chronicle.com/article/colleges-losea-stunning-651-foreign-language-programs-in-3-years/ Kerr, E., & Wood, S. (2022, September 13). A look at college tuition growth over 20 years. U.S. News & World Report. https://www.usnews.com/education/best-colleges/paying-forcollege/articles/see-20-years-of-tuition-growth-at-national-universities Murphy, D., Sarac, M., & Sedivy, S. (2022). Why U.S. undergraduate students are (not) studying languages other than English. Second Language Research and Practice, 3(1), 1–33. Van Gorp, K., Heidrich Uebel, E., Kronenberg, F., & Murphy, D. (forthcoming). How important is studying languages for undergraduate students and why (not) study languages? Whitcomb, R. O. (1972). The enrollment crisis: Exploiting our untapped markets. Bulletin of the Association of Departments of Foreign Languages, 4(2), 11–14. https://doi.org/10.1632/adfl.4. 2.11
Part I
Setting the Scene
MLA Language Enrollment Trends Natalia Lusin
Abstract This chapter examines various trends in the Modern Language Association (MLA) language enrollment census over the long span of its existence, from the first census in 1958 to the current ongoing 2021 census. It first describes how the census is conducted, then analyzes enrollment results over time, with particular emphasis on the most recent censuses. Enrollments are analyzed by language as well as by institution level (2-year and 4-year). Trends in less commonly taught languages are discussed. The decline in enrollments in the 2013 census, the 2016 census, and the 2020 sample survey, as well as the projected decline in the 2021 census are analyzed. A comparison is done of the decline in overall student enrollments at colleges and universities and the decline in language enrollments. Keywords Modern Language Association · MLA · Language enrollment census · Language enrollments · Colleges and universities In an early Modern Language Association (MLA) language enrollment graph, the legend had a category for enrollment increase, but not for decrease. This omission shows how vibrant the development of language study was in the late 1950s and 1960s. But times have changed. The Modern Language Association has conducted 26 censuses of enrollments in languages other than English since 1958.1 Enrollments are gathered from colleges
1
From 1958 through 2009, the MLA conducted its censuses with the support of the United States Department of Education. In 2013, the census was partially funded by the National Endowment for the Humanities and the National Security Education Program, and in 2016 it was partially funded by the National Endowment for the Humanities. The 2020 sample survey was partially funded by the National Endowment for the Humanities and the Mellon Foundation, and the 2021 census was partially funded by the Mellon Foundation and the United States Department of Education. We thank the grantors for their grants and for their support of our work. Any views, findings, conclusions, or recommendations expressed in this article do not necessarily reflect those of the grantors. N. Lusin (✉) Modern Language Association, New York City, NY, USA e-mail: [email protected] © The Author(s), under exclusive license to Springer Nature Switzerland AG 2023 E. Heidrich Uebel et al. (eds.), Language Program Vitality in the United States, Educational Linguistics 63, https://doi.org/10.1007/978-3-031-43654-3_2
9
10
N. Lusin
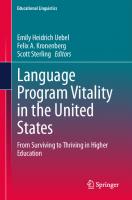
and universities in the USA, and currently over 2600 institutions are in our database. MLA enrollment census results are recognized as the standard in the field for measuring language interest in higher education in the United States. We ask that institutions report all for-credit enrollments in all language courses and in all courses in which teaching or reading is primarily in a language other than English. We also ask that institutions report first and second year undergraduate courses, third and fourth year undergraduate courses, and graduate courses separately. Students enrolled in more than one course, even in the same language, are counted in the enrollments for each course. In the post-Sputnik era, government funding and attention to languages led to robust growth in language enrollments that can be seen through the 1970 census (see Fig. 1). In the 1970s and continuing through the 1980 census, language enrollments suffered a downturn that is widely attributed to the elimination or weakening of language requirements at many colleges and universities in the USA. An uneven recovery followed, with a significant decline in 1995. Enrollments were just over one million through the 1990s, but the first decade of the twenty-first century saw tremendous growth in enrollments, from 1,395,807 in 2002 to 1,673,566 in 2009, the all-time peak in language enrollments. The 2013 and 2016 censuses showed the first declines in language enrollments since 1995 (Looney & Lusin, 2019). The start of the downward trend began with a 6.7% drop in enrollments in fall 2013 and was followed by a 9.1% drop in fall 2016. The 2016 loss in enrollments was the second largest decline in the history of the census up to this point (the largest one, 12.6%, was in 1972). Some possible reasons for the change in fortune will be discussed later. Note: The dashed line indicates the period of time in which enrollments did not include Latin and Ancient Greek; the 1965 census was the first to include Latin and Ancient Greek. Number of institutions reporting in 2016: 2,547.
1,673,566
1,575,838 1,395,807 1,124,021 1,034,651 821,271 612,626
1,153,239
1,185,465
1,003,173 934,305 1,007,709 965,187 946,310 924,337
1,561,176 1,418,584
1,186,632
1,138,772
656,607
537,927 433,639
1958 1959 1960 1961 1963 1965 1968 1970 1972 1974 1977 1980 1983 1986 1990 1995 1998 2002 2006 2009 2013 2016
Fig. 1 Fall language enrollments by year
MLA Language Enrollment Trends
11
Two-year institutions suffered greater declines than 4-year institutions. In the early years of the census, enrollments at 2-year institutions grew faster than they did at 4-year institutions, but then the growth slowed and eventually reversed itself. Between fall 2013 and fall 2016, enrollments declined by 7.3% at 4-year institutions while declining by 15.8% at 2-year institutions. The less commonly taught languages (LCTLs), which for the purpose of this study are defined as all languages not included in the top 15, remained flat in 2016, with aggregated enrollments of 34,747 in 2016 (compared with 34,746 in 2013). In the face of widespread declines in enrollments in 2016, the stability of LCTL enrollments is an achievement, especially since many are taught in vulnerable circumstances: the programs may be very small, and the courses may be taught by adjuncts, whose employment is precarious. Because of the COVID pandemic, the MLA postponed the full language enrollment census planned for fall 2020 to fall 2021. But we decided to do a sample survey in fall 2020, to take a snapshot of language enrollments at that very difficult time. Our sample was created by circumstances and availability. It consisted of those institutions that list their enrollments online and as a result have enrollments that can be gathered relatively easily and quickly. We used an “apples to apples” comparison of 2016 and 2020 enrollments: we included only those institutions for which we gathered enrollments in both 2016 and 2020. There were 1308 institutions in the snapshot, which equals approximately 50% of the institutions in the full MLA language enrollment census. Enrollments for 2016 came to 912,829 in the sample, and enrollments for 2020 came to 772,150. Of the total, 431 institutions were 2-year schools, and 877 were 4-year. Almost 18% of the enrollments were for 2-year schools.2 The results from the 2020 sample survey show devastating losses for many languages. As Table 1 shows, German declined by 32.2%, while Arabic, Chinese, French, Italian, Latin, and Russian lost between 21 and 27% of enrollments. Spanish, Portuguese, and Modern Hebrew had relatively lower percentage losses, but they were still significant. Even Japanese, which was doing well in recent censuses, lost 7.8%. Three languages, American Sign Language, Biblical Hebrew, and Korean, showed gains in enrollments, with Korean increasing by 25.4%. The aggregated LCTLs did very well, with an increase of 12.4%. Hawai’ian, one of the largest LCTLs, increased by 24.1% and surpassed Biblical Hebrew, the fifteenth most commonly taught language. If Hawai’ian moves into the most commonly taught
2
Our fall 2020 sample was fairly representative of the census as a whole. Four-year institutions were slightly overrepresented: 68.0% of the institutions in the 2016 census were four-year institutions, while 69.3% of the institutions in the 2020 snapshot were four-year institutions. Public institutions were overrepresented (54.9 to 64.5%). Very small institutions (those with less than 1000 students) were underrepresented (15.5 to 6.7%). Institutions granting an Associate’s degree were underrepresented (25.5 to 23.0%) while doctoral granting institutions were overrepresented (31.3 to 37.0%). HBCUs were overrepresented (3.3 to 4.4%) and Tribal colleges were underrepresented (1.2 to 0.3%).
12
N. Lusin
Table 1 Fall language enrollment sample, 2016–2020. (Languages in order of percentage change) Language GERMAN ARABIC (ALL) ITALIAN RUSSIAN FRENCH LATIN CHINESE PORTUGUESE SPANISH HEBREW, MODERN JAPANESE GREEK, ANCIENT (ALL) AMERICAN SIGN LANGUAGE (ASL) HEBREW, BIBLICAL (ALL) KOREAN Total LCTLS
2016 55,785 20,876 34,549 13,740 115,032 16,476 33,561 6288 464,966 2639 46,936 5640 65,595 1828 9033 912,829 20,827
2020 37,819 15,167 26,116 10,434 89,321 12,955 26,528 5105 394,170 2329 43,268 5468 68,590 2017 11,323 772,150 23,419
# Change -17,966 -5709 -8433 -3306 -25,711 -3521 -7033 -1183 -70,796 -310 -3668 -172 2995 189 2290 -140,679 2592
% Change -32.2 -27.3 -24.4 -24.1 -22.4 -21.4 -21.0 -18.8 -15.2 -11.7 -7.8 -3.0 4.6 10.3 25.4 -15.4 12.4
(Include languages also included in Arabic (All), Greek, Ancient (All), Hebrew, Biblical (All)
category when the final results for fall 2021 are calculated, it will become the first Indigenous language to do so.3 The differential between 2-year and 4-year institutions was not as great as it was in 2016: 2-year institutions declined by 17.2% and 4-year institutions declined by 15.0%. But the relative closeness was a result of greater losses at 4-year institutions, not improvement at 2-year institutions. Enrollments declined for courses at all levels, introductory, advanced, and graduate, but graduate enrollments were particularly hard hit. Introductory courses declined by 15.4%, advanced by 13.8%, and graduate by 34.0%. At this writing, the 2021 enrollment census is still in the data gathering phase.4 The 2021 results presented below are therefore preliminary, and are based on the responses that have been entered into the MLA’s interface by this point—there are 1245 responding institutions entered, just under half of the total number of
3
Throughout this report, various forms of Ancient Greek, Arabic, and Biblical Hebrew (such as Koine Greek, Moroccan Arabic, and Classical Hebrew) are included in the categories of Ancient Greek, Arabic, and Biblical Hebrew. The aggregated languages are labeled Arabic (All), Greek, Ancient (All), and Hebrew, Biblical (All). 4 We are grateful to the MLA researchers on the 2021 census, Natalia Sokolova, Terri Peterson, Christine Sulewski, and Rizwana Zafer, who applied their considerable research abilities, organizational skills, and diplomatic talents to the complex tasks of collecting and organizing the enrollment data and following up with nonresponding institutions. We are also grateful to all the researchers who worked on all earlier censuses. Our thanks also to Judy Strassberg, MLA Senior Data Analyst, who provided much-needed technical expertise.
MLA Language Enrollment Trends
13
institutions in the database. The data have been checked but not thoroughly cleaned. The final report on the 2021 census is expected to be published in fall 2023 and will be available on the MLA enrollment page.5 Enrollments for this partial group of 2021 respondents are 775,438. Out of this group, 276 institutions are 2-year, 935 are 4-year, and 34 are currently unspecified. Over 13% of the enrollments are for 2-year schools. What results can we expect for the 2021 census? To answer that question, we must first put the 2021 census into the context of the most recent censuses. Table 2 shows enrollments for the past two decades for the 15 most commonly taught languages and for the aggregated LCTLs. Figure 2 shows the percentage change between successive censuses; highlighted cells indicate increases in percentages. The highlighting tells the story: between 1998 and 2009, declines in enrollments were a rarity, after 2009, they were the norm. The last column in Fig. 2 shows the estimated change in percentage in enrollments from 2016 to 2021. The estimates were calculated by taking those institutions for which enrollments were available in the interface for both 2016 and 2021 for a given language. Since these enrollment Table 2 Fall language enrollments. (Languages in descending order of 2016 enrollments) Languages SPANISH FRENCH AMERICAN SIGN LANGUAGE (ASL) GERMAN JAPANESE ITALIAN CHINESE ARABIC (ALL) LATIN RUSSIAN KOREAN GREEK, ANCIENT (ALL) PORTUGUESE HEBREW, BIBLICAL (ALL) HEBREW, MODERN LCTLS Total
5
1998 649,245 199,064 11,420
2002 745,215 201,985 60,781
2006 822,148 206,019 79,744
2009 861,015 215,244 92,068
2013 789,888 197,679 109,567
2016 712,962 175,710 107,059
89,013 43,141 49,287 28,456 5505 26,145 23,791 4479 16,381
91,100 52,238 63,899 34,153 10,584 29,841 23,921 5211 20,376
94,146 65,410 78,176 51,382 24,010 32,164 24,784 7146 22,842
95,613 72,357 80,322 59,876 35,228 32,446 26,740 8449 21,515
86,782 66,771 70,982 61,084 33,526 27,209 21,979 12,256 16,961
80,594 68,810 56,743 53,069 31,554 24,810 20,353 13,936 13,264
6926 9099
8385 14,183
10,310 14,137
11,273 13,764
12,407 12,596
9827 9570
6734
8619
9620
8307
6743
5576
17,946 1,186,632
25,316 1,395,807
33,800 1,575,838
39,349 1,673,566
34,746 1,561,176
34,747 1,418,584
MLA Language Enrollments reports can be found at: https://www.mla.org/Resources/Research/ Surveys-Reports-and-Other-Documents/Teaching-Enrollments-and-Programs/Enrollments-in-Lan guages-Other-Than-English-in-United-States-Institutions-of-Higher-Education
14
Languages SPANISH FRENCH AMERICAN SIGN LANGUAGE (ASL) GERMAN JAPANESE ITALIAN CHINESE ARABIC (ALL) LATIN RUSSIAN KOREAN GREEK, ANCIENT (ALL) PORTUGUESE HEBREW, BIBLICAL (ALL) HEBREW, MODERN LCTLS Total
N. Lusin
19982002 14.8 1.5
Percentage change between: 2002200620092006 2009 2013 10.3 4.7 -8.3 2.0 4.5 -8.2
20132016 -9.7 -11.1
ESTIMATED Percentage change: 2016-2021 -14 -18
432.2 2.3 21.1 29.6 20.0 92.3 14.1 0.5 16.3
31.2 3.3 25.2 22.3 50.4 126.9 7.8 3.6 37.1
15.5 1.6 10.6 2.7 16.5 46.7 0.9 7.9 18.2
19.0 -9.2 -7.7 -11.6 2.0 -4.8 -16.1 -17.8 45.1
-2.3 -7.1 3.1 -20.1 -13.1 -5.9 -8.8 -7.4 13.7
-5 -27 2 -16 -10 -20 -16 -2 31
24.4 21.1
12.1 23.0
-5.8 9.3
-21.2 10.1
-21.8 -20.8
-6 -17
55.9
-0.3
-2.6
-8.5
-24.0
12
28.0 41.1 17.6
11.6 33.5 12.9
-13.6 16.4 6.2
-18.8 -11.7 -6.7
-17.3 0.0 -9.1
-13 -2 -12
Fig. 2 Percentage change in fall language enrollments
totals are far from complete, we expect that these percentages will change when the final calculations are done. Because the estimates are rough, they have been rounded. With that caveat in mind, we can say that the partial results from 2021 show that we should anticipate declines in most of the commonly taught languages. German again appears to be hit hardest, with a 27% anticipated decline. Arabic, which had been showing enormous increases from 1998 through 2009, could decline by approximately 20%. The drop for French, Portuguese, Italian, and Latin will most likely be in the 16–18% range. Spanish, which in the 1990s rose to take more than 50% of all enrollments in the census, faces a 14% anticipated decline. Modern Hebrew, with a possible 13% decline, and Biblical Hebrew, with a possible 12% increase, are moving in opposite directions. The average drop for all languages is estimated at 12%, and several languages, although declining, appear to have done better than that: Chinese (-10%), Ancient Greek (-6%), and American Sign Language (-5%). Both Chinese and ASL had been growing vigorously, and had increases in their enrollments in 2013, when most of the commonly taught languages dropped in enrollments. The decline for Russian and the LCTLs is anticipated to be small, at 2%. Russian appears to be stabilizing after a considerable drop between 2009 and 2016. The LCTLs, after showing impressive growth through 2009, while not growing now, are relatively stable in the face of a general decline.
MLA Language Enrollment Trends
15
Three commonly taught languages, Korean, Japanese, and Biblical Hebrew, are anticipated to have gains in enrollments in 2021. The increases for Korean have been uninterrupted since 1974, when it had 87 enrollments. Japanese enrollments have dropped only three times since the first census: in 1995, 1998, and 2013. Biblical Hebrew has followed a more uneven trajectory, but its history is harder to track because in earlier census years it was sometimes grouped with Modern Hebrew. Among the LCTLs with the highest enrollments, Hawai’ian and Vietnamese are anticipated to increase in the fall 2021 results, and Swahili/Kiswahili is expected to decline. Most of the commonly taught languages recovered some ground between 2020 and 2021, but because the 2020 enrollments are a sample, they are generally not included in the tables and graphs that show trends over time in the censuses. So that uptick is not visible, and the trend between 2016 and 2021 is unfortunately downward. Both the 2020 sample and the 2021 census are compared to 2016 throughout this article. As a result, the declines reported for 2020 and 2021 should not be seen as cumulative. The decline in enrollments by institution level is anticipated to be somewhat better than in the 2020 sample, where it was 17.2% for 2-year institutions and 15.0% for 4-year institutions. Two-year institutions are anticipated to decline by approximately 15% for 2021, and 4-year institutions by approximately 12%. Enrollments are expected to decline for courses at all levels, introductory, advanced, and graduate, but graduate enrollments are again, as in 2020, expected to decline the most, although not as severely as in 2020. Introductory courses are anticipated to decline by 13%, advanced by 10%, and graduate by 15%. Note that the numbers in the tables and figure in this article show slightly different enrollments than those given in the enrollment reports. This is because of revisions in the numbers that we have made after the reports were published. The revisions are small and trends are unaffected. The enrollment decline started well before the pandemic, but did the pandemic exacerbate the enrollment decline? Certainly, the pandemic has had a serious effect on language teaching for a number of reasons. The transition to remote learning was sudden and difficult. In classes that were held in person, students had to socially distance, which required a smaller number of students or larger classrooms. In addition, language study requires observing how the mouth forms particular sounds, and masks hinder that important part of language study. And finally, many study abroad programs were suspended, and study abroad enrollments are counted in the census. A great deal has been written about the recent decline in overall student enrollments, especially during the pandemic, at colleges and universities in the USA. To what extent can the decline in language enrollments in the latest censuses and sample survey be attributed to this drop? After all, if there are fewer students overall, then the pool of potential language students is smaller. But the overall student decline explains the language enrollment decline only in part. As mentioned earlier, we count the number of enrollments, not students, and students who enroll in more than one language class per semester will be counted
16
N. Lusin
Table 3 Percentage change in total number of students and in language enrollment census
2006 2009 2013 2016 2021
Total number of students 16,688,279 18,578,440 18,718,238 18,664,796 17,465,147
% change in total number of students
% change in language enrollment census
11.3 0.8 -0.3 -6.4
6.2 -6.7 -9.1 -12
more than once. It should therefore be noted that the number of students in colleges and universities and enrollments in language courses are not equivalent groupings. Nonetheless, the percentage change over time in both categories does give us an indication of trends. We analyzed data from the National Center for Education Statistics (National Center for Education Statistics [NCES], 2021) and the National Student Clearinghouse (National Student Clearinghouse [NSC], 2021)6 to determine the overall student decline in enrollments between censuses and between the 2016 census and the 2020 snapshot. Note that year-to-year declines were not what we looked at, but rather census-to-census declines. We excluded for-profit institutions from our calculations, since for-profits are not included in the census. Because of these parameters, our percentages do not match the widely publicized numbers cited in the press with regard to the recent decline in student enrollments. For the sake of simplicity we included only the censuses in Table 3. But because of the severity of the language enrollment drop between the 2016 census and the 2020 sample survey, we looked at the change in student enrollments in that time span. We calculated that there was a 3.7% overall drop in students enrolled at colleges and universities between fall 2016 and fall 2020, while the decline in language enrollments in the 2020 sample survey was 15.4%. Between 2016 and 2021, the number of students overall declined 6.4%, and the number of language enrollments in the 2021 census is expected to decline by 12%. In 2013 and 2016, when student enrollments were relatively flat, language enrollments declined by 6.7% in 2013 and by 9.1% in 2016. So language enrollment declines outpace overall student enrollment declines, and as a result overall student enrollment declines cannot explain language enrollment declines. A detailed exploration of the reasons for the large decline in enrollments over three consecutive censuses is well worth doing, but is beyond the scope of this chapter. It may be that we are suffering a correction after the tremendous enrollment growth of the 2000s and are returning to the level of enrollments that we had in the
The figures for 2006–2020 are derived from data in the Digest of Education Statistics, 2021, National Center for Education Statistics, Table 303.10; the figures for 2021 are derived from data in both the Digest and Current Term Enrollment Estimates, Fall 2021, National Student Clearinghouse, Table 1. https://nces.ed.gov/programs/digest/2021menu_tables.asp and https:// nscresearchcenter.org/wp-content/uploads/CTEE_Report_Fall_2021.pdf 6
MLA Language Enrollment Trends
17
1990s. Or it may be that the common, and misguided, theme that language study will not lead to a job, so often repeated in the popular press, is a significant factor. The focus of interest for language specialists is necessarily on the decline in enrollments in the most recent censuses. But when we look at the larger picture it is obvious that language enrollments are constantly in flux. In 1958, the year of the first MLA enrollment census, French, German, and Spanish were the undisputed three top languages, with French in the first position. In that same census, Korean had only 26 enrollments. But Korean is now among the top 15 languages, and continues to grow, completely unaffected by the overall decline in enrollments since 2009. Other languages have also gained prominence. For a long time, American Sign Language was not considered a full-fledged language, and was reported to us for the first time only in 1990. It is now listed as the third most studied language in the USA. It is often said that the increasing enrollments in Korean among college students can be attributed to the popularity of K-pop, and that the increase in Japanese is connected to the popularity of manga and anime. Not every language is lucky enough to have popular boy bands, but fortunately students study languages for many reasons. We have seen recent increases in a number of less commonly taught languages, among them Hawai’ian, Vietnamese, Farsi/Persian, and Hindi/Urdu. The rise in enrollments in these and other languages shows that the cliched phrase, “students aren’t interested in languages” simply isn’t true. The question to ask is, “which language will be the next one to gain prominence?”
References Looney, D., & Lusin, N. (2019). Enrollments in languages other than English in United States institutions of higher education, summer 2016 and fall 2016: Final report. Modern Language Association. https://www.mla.org/content/download/110154/2406932/2016-EnrollmentsFinal-Report.pdf National Center for Education Statistics. (2021). Overview: Fall 2021 enrollment estimates. From https://nces.ed.gov/programs/digest/2021menu_tables.asp National Student Clearinghouse. (2021). Current term enrollment estimates, Fall 2021. From https://nscresearchcenter.org/wp-content/uploads/CTEE_Report_Fall_2021.pdf
Beyond the Crisis: Tools for Analyzing Historical Enrollments in Languages Other Than English Lidia Tripiccione
Abstract This short chapter analyzes fall undergraduate enrollments in languages other than English in postsecondary institutions from 1974 to 2016 on the basis of the MLA Historical Enrollment Database 1958–2016 and data from the National Center for Education Statistics. The main contention is that the distribution of these enrollments has historically been unequal from a variety of perspectives and that, for this reason, specific assessment tools looking at data beyond absolute trends must be devised to anchor the analysis to diverse contexts. The analysis will start with a general overview of enrollment trends and will then introduce different parameters, such as geographical location, enrollment size by institution, and institution type to contextualize and better understand absolute findings. The analysis will end with a focus on less commonly taught languages. The chapter hopes to stimulate further analysis in the field and to contribute to a discussion on the current state of affairs in the sphere of languages other than English beyond the often-repeated narrative of crisis. Keywords Languages other than English · Enrollments · Quantitative analysis · Postsecondary education
1 What Happened in General: On the “Crisis”, and More A narrative of “crisis” has long steeped the discussion on languages other than English in the United States at all levels of the education system. It gained traction especially in the last decade, amidst waning enrollments and fears for a time when studying languages could become obsolete. Drawing from the MLA Historical Enrollment Database 1958–2016 and from National Center for Education Statistics data, this short chapter analyzes fall undergraduate enrollments in languages other than English from 1974 to 2016, and
L. Tripiccione (✉) Princeton University, Princeton, NJ, USA e-mail: [email protected] © The Author(s), under exclusive license to Springer Nature Switzerland AG 2023 E. Heidrich Uebel et al. (eds.), Language Program Vitality in the United States, Educational Linguistics 63, https://doi.org/10.1007/978-3-031-43654-3_3
19
20
L. Tripiccione
displays a series of easily repeatable operations on the data to meaningfully assess and contextualize it.1 The chapter contributes to the overall discussion on the state of language teaching in postsecondary education by showing that, when it comes to the analysis of key quantifiable parameters like enrollments, we are well-equipped to push beyond the narrative of crisis. To start, a general overview of enrollment trends is in order. In absolute terms, between 1974 and 2016, after a slight decrease between 1974 and 1980, enrollments increased steadily. In 1995, enrollments declined visibly if compared to 1990, but this setback was short-lived, as numbers started rising rapidly in the following decade and reached their highest point ever recorded in 2009. Between 2009 and 2016, enrollments declined sharply. If the contention that the field is going through a critical period was popular before (Simon, 1980a, b; Swaffar, 2003; Wiley, 2007), news of plummeting enrollments after 2009 immediately sparked numerous concerned discussions (Berman, 2012; Kaye, 2017; Johnson, 2019).2 Most of these arguments draw either on absolute numbers or on percentage variation, and speak only of the most widely taught languages, like Spanish, French, German, Japanese, etc. While addressing the current situation in the field is crucial, we need more specific parameters to move past this first layer of discussion and take a deep dive into the data, following the example of recent MLA reports (Looney & Lusin, 2019, 2021) (Fig. 1).
Enrollments
1600000
1400000
1200000
1000000
1974
1980
1986
1990
1995
2002
2009
2013
2016
Year Fig. 1 Enrollments in languages other than English in selected years
In what follows, the term “enrollment” should be interpreted as “fall undergraduate enrollment in languages other than English”, unless differently specified. This work was conducted as part of a Princeton GradFUTURES fellowship at the MLA. I would like to thank Natalia Lusin for supervising the work and James Van Wyck for organizing the fellowship. 2 The MLA historical enrollment database stores data from 1958, but because before 1974 they did not distinguish between undergraduate and graduate enrollments, this analysis begins with this distinction. For reasons of readability and space, the plots do not display data from all years available in the dataset between 1974 and 2006. 1
Beyond the Crisis: Tools for Analyzing Historical Enrollments in. . .
21
Absolute numbers might not afford the best perspective: after all, enrollments in languages other than English are dependent on overall university enrollments, and an increase in the latter might inflate the former even as relative parameters are decreasing. A metric such as the share of enrollments in languages other than English per each 100 overall enrollments provides a more objective understanding of the situation. This analysis is achievable by merging MLA and NCES data (Modern Language Association, n.d; Digest for Education Statistics, 1990 and 2016).3 This ratio plummeted between 1974 and 1980, grew in the 1980s, temporarily diminished between 1990 and 1995, shot up in the 1990s (with a brief setback in 1995), peaked in 2006 at 9.2 enrollments in languages other than English per 100 enrollments, and then started rapidly declining (Fig. 2). Looney and Lusin (2019) performed the same operation without distinction between graduate and undergraduate enrollments, thus capturing a wider chronological span. The figures recorded by those authors and here are very much comparable, so the present analysis can be confidently expanded by drawing on their report.4 If figures were highest in the 1960s, when languages other than English accounted for over 13 enrollments for every 100 overall enrollments, numbers started decreasing quickly in the 1970s, hit their lowest in 1980 (7.3), and then shot up in the 1990s and early 2000s (with a brief setback in 1995) before plummeting again after 2006.
Ratio
9.0
8.5
8.0
7.5 1974
1980
1986
1990
1995
2002
2006
2013
2016
Year Fig. 2 Enrollments in languages other than English every 100 undergraduate enrollments
3
Table 303.70 of the 2016 Digest of Education Statistics reports data on total undergraduate fall enrollments at postsecondary institutions in the USA for selected years. As table 303.70 has no data for the years 1974 and 1977, I also drew from Table 157 of the 1990 Digest. Following MLA reports, enrollments in “for profit” institutions have not been counted, as these have been historically excluded from the MLA census. 4 This is expected, as graduate enrollments are much less numerous than undergraduate enrollments.
L. Tripiccione
Number of Languages
22
200
150
100 1974
1980
1986
1990
1995
2002
2009
2013
2016
Year Fig. 3 Number of languages offered in selected years
Another indicative parameter that can be initially measured in absolute terms is the diversity of linguistic offerings. More languages are being taught now than at any other point recorded in the database, and linguistic diversity seems to have been only marginally affected after 2009 (Fig. 3). These preliminary remarks point to a complex situation: whereas absolute numbers reflect an almost constant increase from the 1970s to 2009, relative figures like the share of language enrollments for every 100 overall enrollments tell a slightly different story, one where a decade-long downward trend turned around in the 1980s, shot up in the late 1990s, and plummeted again after 2006. What seems evident, however, is that a positive period, from the 1980s to 2006/2009, where numbers grew in both relative and absolute terms, and when linguistic diversity expanded, was followed by a critical period. However, this “crisis” is not a historical unicum, as relative figures had dropped similarly in the 1970s before increasing again in the 1980s.
1.1
Breaking Down Absolute Numbers: A Realm of Inequality
Relativizing the notion of “crisis” through a broad historical analysis, however, is not enough. The reason why enrollment trends should never be considered only in absolute terms is that languages other than English in postsecondary education in the USA are a realm where “inequality” rules. Most languages, no matter what year we take into consideration between 1974 and 2016, will have an enrollment of less than 100. Few languages will reach 200 enrollments, and enrollments in all languages that historically commanded the analysts’ attention (Spanish, Italian, French, Japanese, etc.) are significantly higher than the others. The absolute trend in Fig. 1 does not
Beyond the Crisis: Tools for Analyzing Historical Enrollments in. . . French
Spanish
23
All languages
Enrollment
1600000 1200000 800000 400000 1974 1980 1983 1986 1990 1995 2002 2009 2013 2016
Year Fig. 4 Comparison of enrollments in Spanish, French, and enrollments in all languages in selected years
perfectly coincide with Spanish’s trend, but it is influenced by it to a significant degree, as enrollments in Spanish are disproportionately higher than those in other languages, even widely taught ones like French (Fig. 4). Further, one needs to ask whether the enrollments are equally distributed among institutions, or whether, much like for income distribution, a small subset of the survey participants gobbles up a disproportionate share of the output. Here, institutions are divided into 5 incremental macro-categories (very small, small, medium, big, and top 5%) based on their yearly enrollments for all languages other than English. These categories are based on percentiles. Very small institutions make up the lowest 25th percentile, meaning that schools falling into this category in a given year reported enrollments lower than 75% of institutions for that year. The small category comprises institutions between the 25th percentile and the 50th percentile, while the medium institutions are between the 50th and the 75th percentile. Because more granularity was needed at the higher levels, I assigned the category “big” to the institutions whose enrollment fell between the 75th percentile and the 95th, while the remaining institutions make up the top 5%, which includes schools with enrollments higher than 95% of institutions. Accordingly, the very small, small, and medium schools will each account for 25% of the total number of institutions each year, big institutions represent 20% of the total, with the top 5% completing the picture. As it turns out, differences at the level of enrollment size are astounding. At any given time, big and top 5% institutions (accounting for a mere 25% of total institutions) have recorded the lion’s share of all enrollments. The bottom 25% (the very small schools) are numerically insignificant.5 Enrollments went slightly down in 1977 and 1980 only because top 5% institutions reported losses. Similarly, big institutions and the top 5% were the sole culprits for the 1995 dip, with the latter
5
For this reason, and to make the plots readable, very small institutions are not represented in the graphs.
24
L. Tripiccione
small
medium
big
top5%
Enrollment
600000
400000
200000
0 1990
1995
2002
2009
2013
2016
Year Fig. 5 Breakdown of enrollments by institution size in selected years
visibly losing more than the former. The other categories remained stable until the 1990s and then visibly increased. The late 1980s and early 1990s reshuffled the cards a bit, with big institutes gaining and then decidedly surpassing the top 5%. The inequality in enrollment distribution was somewhat mitigated in the 1990s, where medium institutions gained enrollment at a faster rate than the two upper categories. After 2009, contrary to 1995, no category was spared losses: while the three bottom categories held out better than the two main ones in 2013, they fared worse in 2016. (Fig. 5) 6 Analogously, diversity of language has not been equally propelled by all groups. The top 5% and the big institutions have been leading the way, even though all groups expanded their offerings between 1995 and 2009. Notably, the diversification of language offering has been less negatively affected after 2009 than other parameters. Indeed, big institutions continued to expand beyond 2013 (Fig. 6). What must also be said is that institutions with the biggest enrollments are usually four—year colleges. Only a very small part of big institutions in any given year are 2-year colleges, which are even more rarely found among the top 5%. In general, overall enrollments at 4-year colleges dwarf their 2-year counterpart, so that absolute numbers will reflect only what happens at 4-year colleges while obscuring trends and significant phenomena at the 2-year level. Geographical location is another big factor affecting the distribution of enrollments. By dividing the institutions into 8 geographical macro areas (New England, Mid East, Great Lakes, Plains, Southeast, Southwest, Rocky Mountains, Far West) we observe that the Far West, Southeast, and Mid East have historically accounted
6
In 2013, the top 5% lost the most (-9%), followed by the big (-5%), the medium, the very small, and the small (these last one losing only 2%). In 2016, the very small lost 11%, the medium 10%, the small 9.6%, the big 9.5%, and the top 5% around 7%.
Beyond the Crisis: Tools for Analyzing Historical Enrollments in. . .
Number of Languages
small
medium
big
25
top5%
150 100 50 0 1995
2002
2009
2013
2016
Years Fig. 6 Languages offered by institution size in selected years
for most of the enrollments in any given year, whereas the Rocky Mountains and the Plains have limited enrollments.7 Further, not all regions were equally affected by “crises”: enrollments in the Southeast and in the Southwest did not decrease from 1990 to 1995, enrollments in the Plains remained stable, and those in the Rocky Mountains actually increased. More importantly, the downward trend after 2009 was so steep because the second most populous region, the Far West, was the most affected, losing a whopping 9 and 11% of enrollments in 2013 and 2016 respectively. Other regions, like the Southeast and the Southwest were much less negatively impacted (Fig. 7).8 Geographical distinctions are of capital importance for 2-year schools, where enrollments in the Far West are vastly more numerous than enrollments in other regions. The Mid East, which is second in terms of enrollments at the 2-year level, recorded enrollments which are only a half of those in the Far West in 2016, and the gap used to be wider (Fig. 8). To summarize, while absolute trends are a good starting point to orient one’s analysis, one also needs to consider that they reflect only what happens at the level of the most widely taught languages at a small minority of institutions – mostly 4-year schools – disproportionately concentrated in some geographical areas. Enrollments have historically been unequally distributed from different parameters: geographical location, college type, and enrollment size by institution are all easily quantifiable parameters that need to be considered when studying general or language-based trends if we want to capture the historical progression in as much detail as possible.
7
The macro area analysis is achievable by merging MLA and NCES data. More specifically, the NCES variable “OBEREG” provides the following geographical breakdown: New England (CT ME MA NH RI VT), Mid East (DE DC MD NJ NY PA), Great Lakes (IL IN MI OH WI), Plains (IA KS MN MO NE ND SC), Southeast (AL AR FL GA KY LA MS NC SC TN VA WV), Southwest (AZ NM OK TX), Rocky Mountains (CO ID MT UT WY), Far West (AK CA HI NV OR WA). 8 The Southeast lost 1% in 2013 and 4% in 2016, whereas the Southwest lost around 5% both years.
26
L. Tripiccione Far West
Plains
Rocky Mountains
Southeast
Enrollment
300000
200000
100000
1974
1980
1986
1990
1995
2002
2009
2013
2016
Year Fig. 7 Enrollments in selected geographical macro areas for selected years Far West
Mid East
Plains
Enrollment
150000
100000
50000
0 1974
1980
1986
1990
1995
2002
2009
2013
2016
Year Fig. 8 Comparison of enrollments at community colleges in the Far West and in other regions
In what follows, the analysis will concentrate on several less commonly taught languages.
2 The Dynamics of Emerging Languages Researchers must make a conscious choice about the languages they will analyze. Historically, many studies have focused on a limited set of languages, usually selecting the most widespread ones, such as Spanish, French, German, Italian, Chinese, Japanese, etc. Since the 1970s, languages like these could count on a solid infrastructure and on a widespread presence across 4-year colleges and 2-year institutions, and across geographical areas.
Beyond the Crisis: Tools for Analyzing Historical Enrollments in. . .
27
Other languages have not enjoyed the same attention, even if some of them increased their enrollments dramatically since the 1970s and especially in the 1990s. To achieve a representative list of languages that displayed a strong upward trend, but which are not among the most widely taught in the United States, I first computed, for each year, the top 15 nationwide fastest-growing languages by percentage increase.9 I then selected those languages that appeared with the highest frequency while not being amongst those that consistently ranked in the top 15 by enrollment between 1974 and 2016.10 Here, these languages will be called “emerging”: • • • • • • • • • • • • •
American Sign Language. Cherokee Dakota and Lakota11 Farsi/Persian Filipino/Pilipino/Tagalog Hawai’ian Hindi and Urdu12 Hmong Korean Navajo Ojibwa/Ojibway/Ojibwe and Chippewa13 Swahili/Kiswahili Vietnamese
2.1
Overview
Looking at raw numbers, enrollments in ASL have increased at an unparalleled rate, going from 0 in the 1980s to more than 100,000 in 2016. In part, this spectacular growth is due to the fact that ASL was excluded from MLA surveys until 1990. Secondly, the quality of the data recorded might have changed and improved over time, so that the actual growth of ASL might have been much less pronounced than it
9
I have restricted this operation to languages that have a nationwide enrollment of at least 100, otherwise, I would have mostly recorded fluctuations in the enrollment of very small languages. 10 Languages always appearing in the top 15 most widely taught (1974–2016) are: Ancient Greek, Arabic, Chinese, French, German, Hebrew, Italian, Japanese, Latin Portuguese, Spanish, Russian. 11 I summed enrollments for the labels Dakota, Dakota/Lakota, and Lakota. Before 2009, most enrollments in these languages were listed under Dakota/Lakota. From 2009, the differentiation started, even if the label Dakota/Lakota was not abandoned. A degree of confusion in labeling LCTLs, so I had to repeat the same operation for other languages as well (see footnote 10 and 11). 12 This is the sum of Hindi, Urdu, and Hindi/Urdu. 13 This is the sum of Ojibwa/Ojibway/Ojibwe and Chippewa.
28
L. Tripiccione
seems at first glance. Still, as of 2016, ASL undoubtedly commanded a significant portion of yearly enrollments in the dataset. Other than ASL, Korean has been the fastest-growing emergent language. In 2016, Korean was bigger than Portuguese (respectively, approx. 13,000 enrollments vs 9500), whereas all other emerging languages still have relatively small enrollments, with the biggest of them hardly topping 3000 in 2016. Unfortunately, except for Korean and ASL, many emerging languages suffered greatly after 2009 or 2013, especially Hindi/Urdu, Swahili/Kiswahili, Hawai’ian, and Dakota and Lakota.
2.2
Differences by Institution Type
Contextualization is key for the study of emergent languages, as they provide yet another example of the uneven distribution of enrollments. First, the enrollment expansion for these languages was propelled in great part by 4-year institutions. At 2-year schools, enrollments in emerging languages are mostly concentrated in the Far West – which is unsurprising given what was said before – and most regions have very low or even non-existent enrollments in these languages. There are, however, some notable exceptions. Nationwide American Sign Language’s enrollments were higher in 4-year schools than in 2-year schools in 2016 (respectively 58,000 and 47,000) but the reverse had been true before that. Vietnamese also had significantly higher nationwide enrollments at 2-year institutions than at the 4-year level up until 2009 (1465 vs 1231), however, after that, it plummeted at community colleges, recording a mere 820 enrollments in 2016. Ojibwa/Ojibway/Ojibwe and Chippewa’s tale is the opposite of Vietnamese’s. After 2009, enrollments at 4-year colleges collapsed, while 2-year schools were able to grow after some losses in 2013. Hence, in 2016, the two college types were numerically almost equivalent. The concentration of enrollments in emerging languages at 4-year institutions, coupled with the fact that 4-year schools and community colleges’ enrollments were often affected in very different degrees after 2009, reiterates the need for a high level of granularity in the analysis.
2.3
Regionalization
The second salient feature that an analysis of emergent languages reveals is their “regionalization”. Without distinction between 4-year and 2-year, the bulk of enrollments for most emerging languages will be found in one single macro-region. Only ASL is by now very well represented in all regions both at the 4-year and at the 2-year level, and even Korean has achieved this status only at the 4-year level, where
Beyond the Crisis: Tools for Analyzing Historical Enrollments in. . . All other regions
29
Far West
1250
Enrollment
1000 750 500 250 0 1980
1990
1995
2002
2009
2013
2016
Year Fig. 9 Community college enrollments in Korean in the Far West vs all other regions
it has displayed a strong, constantly upwards trend since the late 1980s in some regions and since the late 1990s in others. By contrast, the great majority of Korean enrollments at community colleges are concentrated in the Far West. Many other regions simply do not have significant numbers (Fig. 9). At 4-year institutions, Swahili is strongest in the Great Lakes, followed by the Southeast and the Mid East. The highest enrollments by far of Farsi/Persian are concentrated in the Far West, while Vietnamese is taught almost exclusively there and in the Southwest. For 2-year colleges, the Far West’s primacy in the teaching of Vietnamese is basically complete. Hindi/Urdu -probably the least regionalized among emerging languages other than ASL and Korean – is strong in New England, Mid East, Southwest, Southeast, and Far West at the 4-year level. Pilipino/Filipino/Tagalog is also highly regionalized both at the 4-year and at the community college level, being present almost exclusively in the Far West. Hmong, a “new entry” present in the database only since 1990, is represented in the Far West and in the Great Lakes at both 4-year and 2-year schools. Aramaic is almost solely present in the Mid East and almost exclusively in 4-year colleges. Like Vietnamese, Filipino enrollments at 2-year colleges plummeted after 2009. On the plus side, both these languages fared much better in 4-year institutions, where Filipino showed a strong upward trend. Indigenous languages are also mostly present in the regions where the tribes reside, and all of them but Cherokee are taught both at 4-year colleges and community colleges. Almost all enrollments in Hawai’ian are in the Far West, Dakota and Lakota are almost exclusively taught in the Great Lakes at 4-year institutions, while Cherokee and Navajo are taught in the Southwest. Ojibwa/Ojibway/Ojibwe and Chippewa have enrollments in the region of the Great Lakes and the Plains.
30
2.4
L. Tripiccione
Regionalization and Immigration Trends
Research has been carried out on the relationship between world language curricula and immigration (Diaz, 2021). While the question cannot be touched in depth here, the data strongly suggest that some emerging languages are taught primarily in the region(s) of the USA where the presence of immigrants speaking those languages is strongest. According to data from 2015–2019 from the Migration Policy Institute, an independent think-tank based in Washington DC, 39% of Vietnamese foreign-born lived in California, 13% of them lived in Texas, 4% in Washington State and Florida (Harjanto & Batalova, 2021). California also hosted almost half of the Filipino born community in 2006, with later data confirming California’s primacy (Gallardo & Batalova, 2020). Considering Vietnamese and Filipino/Pilipino/Tagalog’s high level of regionalization, it seems reasonable to hypothesize that immigration from these countries contributed to changes in university curricula. Iranian foreign born are also concentrated in California according to data from 2015–2019 (Lai & Batalova, 2021). However, Farsi/Persian, while predominant in the Far West, does not show the same level of Far West exclusivity as Vietnamese and Filipino, signaling that different dynamics are at play for different languages. To summarize, between 1990 and 2009 “emerging languages” showed strong upward trends. However, except for ASL, and, in part, Korean, most of these languages have yet to achieve a widespread presence across geographical regions and college types, as their growth was propelled mostly by 4-year schools in selected regions. Further, we can preliminarily observe a correlation between immigration and upward enrollment trends for some languages. These observations, which would be impossible to make based on absolute trends, are simply crucial to analyze emerging languages.
3 Conclusion In this short chapter, I have tried to make the case that an analysis of enrollments in languages other than English must specify a variety of parameters. Enrollments are simply too unevenly distributed for absolute numbers to be of much use in an in-depth analysis. If we want to counter the “crisis” that languages other than English are facing, our assessment of the situation must understand the specificities of the diverse contexts that make up postsecondary education in the USA. The simple operations displayed here can easily be repeated to deepen the analysis in various ways: for instance, by grouping languages in macro-areas (East Europe, Central Asia, East Asia, etc.), we can map closely their historical progression, understand in which regions and at which levels they have been strongest, and when and where they have faced a critical
Beyond the Crisis: Tools for Analyzing Historical Enrollments in. . .
31
situation. If a language is taught only at a handful of institutions, then we can attain an even greater level of granularity and observe the trend institution by institution. To conclude, access to excellent data and to excellent historical reports should empower us to push beyond a narrative of crisis to tailor our response to concrete contexts.
References Berman, R. (2012). Responding to the crisis. ADE Bulletin, 152, 17–24. https://doi.org/10.1632/ ade.152.17 Diaz, C. (2021). Foreign language curricula and the influence of immigrant-origins groups. Socius, 7. https://doi.org/10.1177/23780231211065270 Digest of Education Statistics. (1990). National center for education statistics. https://nces.ed.gov/ pubs91/91660.pdf Digest of Education Statistics. (2016). National center for education statistics. https://nces.ed.gov/ programs/digest/2016menu_tables.asp Gallardo, L. H., & Batalova, J. (2020). Filipino immigrants in the United States. Migration Policy Institute. https://www.migrationpolicy.org/article/filipino-immigrants-united-states Harjanto, L., & Batalova, J. (2021). Vietnamese immigrants in the United States. Migration Policy Institute. https://www.migrationpolicy.org/article/vietnamese-immigrants-united-states Johnson, S. (2019, January 22). Colleges lose a ‘stunning’ 651 foreign-language programs in 3 years. The Chronicle of Higher Education. https://www.chronicle.com/article/colleges-losea-stunning-651-foreign-language-programs-in-3-years/ Kaye, N. (2017, January 1). A crisis of language. Roosevelt Institute. https://www. cornellrooseveltinstitute.org/edu/a-crisis-of-language Lai, T., & Batalova, J. (2021). Immigrants from Iran in the United States. https://www. migrationpolicy.org/article/iranian-immigrants-united-states-2021 Looney, D., & Lusin, N. (2019). Enrollments in languages other than English in United States institutions of higher education, Summer 2016 and Fall 2016: Final report. Modern Language Association. https://www.mla.org/content/download/110154/2406932/2016-EnrollmentsFinal-Report.pdf Looney, D., & Lusin, N. (2021). Enrollments in languages other than English in United States institutions of higher education, Summer 2016 and Fall 2016: Report on two-year institutions. Modern Language Association. https://www.mla.org/content/download/147768/file/2016-Com munity-Colleges-Enrollment-Report-Revised.pdf Modern Language Association. Language enrollment database, 1958–2016. (n.d.). https://apps. mla.org/flsurvey_search Simon, P. (1980a). The tongue-tied American: Confronting the foreign language crisis. The Crossroad’s Publishing Company. Simon, P. (1980b). The US crisis in foreign languages. The Annals of the American Academy of Political and Social Science, 449, 31–44. https://doi.org/10.1177/000271628044900104 Swaffar, J. (2003). Foreign languages: A discipline in crisis. ADFL Bulletin, 35, 20–24. https://doi. org/10.1632/adfl.35.1.20 Wiley, T. (2007). The foreign language “crisis” in the United States: Are heritage and community languages the remedy? Critical Inquiry in Language Studies, 4, 79–205. https://doi.org/10. 1080/15427580701389631
The Increasing Diversity of World Language Study in the United States, 1958–2016 Fedor Karmanov
Abstract While the total decline in language enrollments in the United States has been well-documented, long-term changes in interest in specific languages remains understudied. The following report considers the shape of postwar world language interest in the United States, with a particular focus on the rise and fall of individual world languages during this period. This chapter puts forward two findings. (1) The data confirm the slow decline of several core European languages (aside from Spanish), which began in 1968 when the study of these languages peaked. (2) The data also show that there has been a steady and consistent growth in enrollments in non-European languages, notably a cluster of East and South Asian, African, and Native American languages. These findings suggest that the coming decades may see a significant shift in enrollments away from the languages of the Global North towards the study of the languages and cultures of the Global South. Keywords World languages · Less-commonly taught languages · Humanities crisis
1 Introduction Between 1958 and 2016, the Modern Language Association (MLA) has collected and catalogued the language enrollment data for most U.S. higher education institutions: a total of around 23,290,842 course enrollments, spanning across 354 unique languages. While the rise and fall in total enrollments has been well-documented in the general Enrollment Reports published by the MLA, long-term trends in unique language enrollments remain understudied. The following report considers the long durée of postwar world language study in the United States, with a particular focus on the rise and fall of individual world languages during this period.
F. Karmanov (✉) Princeton University, Princeton, NJ, USA e-mail: [email protected] © The Author(s), under exclusive license to Springer Nature Switzerland AG 2023 E. Heidrich Uebel et al. (eds.), Language Program Vitality in the United States, Educational Linguistics 63, https://doi.org/10.1007/978-3-031-43654-3_4
33
34
F. Karmanov
This chapter puts forward two findings. (1) The data show the decline of several core European languages (aside from Spanish), which began in 1968 when the study of these languages peaked. (2) The data also show that there has been a steady growth in enrollments in non-European languages, notably a cluster of East and South Asian, African, and Native American languages. These findings suggest that the coming decades may see a significant shift in enrollments away from the languages of the Global North towards the study of the languages and cultures of the Global South. The following report is broken up into three sections, roughly divided by the first top-6 enrolled languages, known as the “core” group, the next 8-highest enrolled languages, the “emerging” group, and then the rest of the language enrollments, known here as the “other” group. The core languages —French, German, Russian, Italian, Latin, and Spanish —are represented by the largest portion of the stacked area graph in Fig. 1, and account for most of the total enrollments in language study in the U.S. across this period. The “emerging” languages are represented by the second-largest portion of the graph above: Japanese, American Sign Language (ASL), Chinese (Mandarin and Cantonese), Ancient Greek, Hebrew, Arabic, Portuguese, and Korean, which have been growing steadily since the 1980s. Finally, we will consider the total growth of “long tail” of the less commonly taught languages, represented by the smallest area, making some inferences about rising interest in less commonly taught languages (LCTLs) in the United States.
Fig. 1 Total enrollments, by core, emerging, and other groups, https://rpubs.com/fed-ka/coreemerg-other
The Increasing Diversity of World Language Study in the United States,. . .
35
2 Core Languages From 1958 and until 1968, the enrollments of six languages — French, Spanish, German, Italian, Russian, and Latin — completely dominated almost all world language study in the United States. The largest of these six was French, which in 1968 had swelled to 386,694 total enrollments. Beginning with the 1970 census, French and German, the two most-enrolled core languages up until that point, began to decline, experiencing three more major drops in 1975, 1995, and 2013. The latter, which follows the 2009 recession, affected almost all world language enrollments surveyed by the MLA. As of 2016, enrollments in French are less than half of what they were in 1968. Latin, included in the core languages group due to its popularity in 1965, when it was the fourth most-enrolled languages, declined significantly by 1990, remaining relatively stable until 2009 (Figs. 2 and 3). Two core languages have bucked these larger trends. Italian has grown slowly over the course of this period, peaking in enrollments in 2009. Russian, which had a peak in 1968, peaked to its highest enrollments in 1990, before declining again to half of its enrollments in the 1990s. Spanish, on the other hand, has grown exponentially throughout this timeframe, usurping French as the most taught world language in the United States in 1970 when it began to mirror enrollments more accurately in secondary schools across the United States (Brod, 1972). Spanish would continue to grow through the 1980s, 1990s, and early 2000s, reaching its
Fig. 2 Core languages, excluding Spanish, https://rpubs.com/fed-ka/core-no-spanish
36
F. Karmanov
Fig. 3 Core languages, small multiples, including Spanish, https://rpubs.com/fed-ka/core-sm
highest peak in 2009 with 861,029 enrollments. As of 1995, most language study in the United States is composed of enrollments in Spanish (Looney & Lusin, 2019) (Fig. 3).
3 Emerging Languages The enrollment trends of the next eight most enrolled-in languages join Spanish in their precipitous rise over the course of the second half of the twentieth century (Fig. 4). As a cluster, the emerging languages category has consistently experienced strong growth since 1970, almost tripling in size between 1998 (115,792) and 2009 (302,149). Enrollments in East Asian languages, such as Chinese, Japanese, and Korean not only increased steadily until 2009, but experienced a much smaller relative decline than many of the core languages — Japanese and Korean, for instance, experienced almost no decline between 2009 and 2016, among the few languages to do so. Arabic, which was relatively stable through the 1980s and 1990s, spiked in the early 2000s, experiencing a negligible drop in 2009. Portuguese, a language with very little presence in the 1960s, has tripled in size over the course of the postwar period, peaking in 2009 and remaining strong in 2016. Another highgrowth language in this category is American Sign Language (ASL), which was added to the world language census in 1990, and which is outpacing most of the
The Increasing Diversity of World Language Study in the United States,. . .
37
Fig. 4 All emerging languages, https://rpubs.com/fed-ka/emerging-total
Fig. 5 Total courses offered over time by course, emerging, and other groups
other emerging languages in enrollments by a significant degree. Overall, many of these languages have done well to resist the “crises” that are so prevalent in the core group (Fig. 5).
38
F. Karmanov
4 Other Languages While the top-14 languages — in both “core” and “emerging” categories — encompass over 90% of the total enrollments, the remaining 10% of enrollments in just about 339 languages of the MLA surveys nevertheless provide us with a set of valuable trends that can tell us a bit about the future of language study in the United States. As we can see from Fig. 6, the number of courses offered in both the “emerging” and the “other” categories has been steadily increasing, while courses offered in the “core” group have been steadily decreasing. Looking at these languages in aggregate tells an important story regarding the importance that non-European languages have had to play in the last two decades of undergraduate enrollment. This same trend is visible if we look at total enrollments across the top-22 languages in the “other” category. Noticeable growth occurs in a variety of emerging languages from the Global South: Aramaic, Armenian, Farsi/Persian, Filipino, Hindi, Swahili, Turkish, and Vietnamese. Substantial and steady growth is also seen in the indigenous languages of the Americas and Pacific Islands: Ojibwe, Navajo, and Hawai’ian have all experienced sizable increases in the 1980s and 1990s. Other languages in this group have either remained stable or declined, many of them European or Eastern European languages. Czech, Polish, and Dutch have largely remained a similar size during this survey. Norwegian and Swedish, on the other hand, have declined significantly in total enrollments since 1968. For a more detailed look at the individual patterns and trends of these languages, see the chart here: https://rpubs.com/fed-ka/945732. Nevertheless, seeing all “other” languages in aggregate, as we see in Fig. 7, suggests that there is an increase in both the number of different languages available for study and the total enrollments in those languages in the United States. In 1968,
Fig. 6 Total courses offered by year, https://rpubs.com/fed-ka/total-enrolls
The Increasing Diversity of World Language Study in the United States,. . .
39
Fig. 7 All less commonly taught languages, stacked area graph, https://rpubs.com/fed-ka/all-lctl
the languages in this “long tail” accounted for under 5211 total enrollments — by 2009, that number was close to 24,056 total enrollments. By looking at the “other languages” category in more detail, we can see that it is undoubtedly true that the diversity in language study in the USA has increased significantly over the course of the twentieth century and will likely continue to increase over the course of the twenty-first century.
References Brod, R. I. (1972). Survey of foreign language course registrations and student contact hours in institutions of higher education, Fall 1970 and Summer 1971. Modern Language Association of America. https://files.eric.ed.gov/fulltext/ED129066.pdf Looney, D., & Lusin, N. (2019). Enrollments in languages other than English in United States institutions of higher education, Summer 2016 and Fall 2016: Final report. Modern Language Association. https://www.mla.org/content/download/110154/2406932/2016-EnrollmentsFinal-Report.pdf
World Language Enrollment at Community Colleges in the United States Between 1960 and 2010 Tomonori Nagano
Abstract This chapter explores world language (WL) enrollment at community colleges between the 1960s and the 2010s. Like 4-year institutions, community colleges experienced a major increase in WL enrollment up to 2009, but the WL enrollment at community colleges started to experience continuing declines to the present day. A major factor in the growth of WL enrollment until the 2010s was the increase in total undergraduate enrollment at community colleges, which was primarily triggered by higher participation rates of non-traditional students such as students of color, students from working-class backgrounds, and students with an immigrant origin. The chapter presents data for WL enrollment trends at community colleges and introduces the results of the Students and Instructors of Languages at Community Colleges Survey (Nagano et al., 2017), which has examined changes in the demographics of students taking WL classes at community college, highlighting the rich and diverse linguistic experiences that students bring into classrooms. Keywords Community colleges · World language enrollment · SILCC survey
1 Introduction This section explores the world language (WL) enrollment at community colleges,1 which collectively accounted for nearly 40% of the total undergraduate enrollment in the U.S. at its peak in 2010 (de Brey et al., 2022). Many students at community colleges come from underprivileged populations, including children of immigrants,
1
Community colleges in this section generally refer to only public and private not-for-profit 2-year institutions granting associate degrees. Private for-profit 2-year institutions, which include many of the vocational and technical institutions, are not included because they have a different development history and educational mission from those of public and nonprofit 2-year institutions.
T. Nagano (✉) LaGuardia Community College, the City University of New York, New York, NY, USA e-mail: [email protected] © The Author(s), under exclusive license to Springer Nature Switzerland AG 2023 E. Heidrich Uebel et al. (eds.), Language Program Vitality in the United States, Educational Linguistics 63, https://doi.org/10.1007/978-3-031-43654-3_5
41
42
T. Nagano
students of color, and students from minorities and working-class families (Cohen et al., 2013; Levin & Kater, 2012; Teranishi et al., 2011). Despite the sheer number of students that community colleges serve and their unique role in providing equitable access to higher education in the U.S., only a few studies have systematically examined the WL enrollment at community colleges.2 In this manuscript, trends of WL enrollment at community colleges between 1960 and 2020 will be reviewed with multiple sources of data points including the MLA Enrollment data (Looney & Lusin, 2021). According to the MLA Enrollment data (Looney & Lusin, 2021; Chapter “MLA Language Enrollment Trends” of this volume), WL enrollment at both 4-year institutions and 2-year institutions had substantial growth in the last half century. The WL enrollment peaked in 2009, followed by a declining period that continues to the present day. Figure 1 shows WL enrollment trends at 4-year institutions and 2-year institutions between 1959–2016 (from MLA’s Language Enrollment Database).3 The overall trend shows a gradual increase in the number of students who studied a WL at community colleges between 1959 and 2009, followed by a rapid decrease in the enrollment in the 2010s.4 WL enrollment at community colleges increased fivefold between 1960 and 2009 while 4-year institutions saw only a 1.25M
1,242,994 1,189,790
1,170,232
1,105,173
1M
990,542
WLEnrollment
922,878
1,021,860 952,333
922,030 866,980
855,831
750K
757,748 742,177
728,892
737,639
778,101
910,737
808,486
558,755
500K 478,494
337,304
250K
364,980
393,050
343,245 288,741
227,625 233,123 243,096
44,609 52,099
0
19
59
l Fa
l 19
60
ll Fa
19
72,737
63
ll Fa
19
109,019
65
l Fa
129,852
l 19
68
ll Fa
19
155,154 151,878 154,713 163,464 162,716 163,023 161,683
70
ll Fa
19
72
l Fa
l 19
74
l Fa
l 19
77
ll Fa
19
80
l Fa
l 19
83
l Fa
l 86 19
l Fa
l 90
19
ll Fa
l
19
95
l Fa
19
98
ll Fa
02 20
l Fa
l 20
06
l Fa
l 20
09
ll Fa
20
13
l Fa
l 20
16
ll Fa
Year Type
4 year
2 year
Fig. 1 Undergraduate world language enrollment by year and institutional type 2 The MLA recent reports by Looney and Lusin (2021) and Lusin (2005) carefully examined and presented analysis of the MLA’s modern language enrollment data for 2-year institutions. 3 Enrollment numbers in Fig. 1 are slightly lower than those reported by Lusin (this volume) since I only report undergraduate enrollment. The MLA’s enrollment surveys include both undergraduate and graduate enrollment. 4 The declining trend happened even before topsy-turvy enrollment erosion at community colleges during the pandemic. The impact of the pandemic between 2020–2022 is outside of the scope of this review.
World Language Enrollment at Community Colleges in the United States. . .
43
modest increase (128.9%) during the same time period. To put it differently, WL enrollment at community colleges accounted for only 8% of the total WL enrollment in 1959, but its proportion in WL enrollment had increased to 20% in 2016. I will discuss several possible explanations for these enrollment trends with data. The goal of this chapter is to familiarize readers with the institutional history and mission of American community colleges and to make a proposal for collaboration between the WL faculty at community colleges and 4-year institutions in developing streamlined paths for community college students to 4-year institutions.
2 A Brief History of Community Colleges in the U.S. 2.1
Foundation of Community Colleges in the U.S.
Community colleges, defined in this manuscript as open-access institutions granting associate degrees, are a relatively new and evolving product of the U.S. higher education system. Community colleges, which were called “junior colleges” early in their history, were proposed by several educators in the twentieth century such as Harry Tappan (the University of Michigan), William Rainey Harper (University of Chicago), Alexis Lange (the University of California), David Starr Jordan (Stanford University), and Edmund J. James (the University of Illinois) (Cohen et al., 2013). The idea of junior colleges was well received by some academics influenced by the early European style higher education system, in which universities primarily focused on research and were separated from non-universities, which would provide general education and vocational training programs (such as College of Higher Education and Further Education College in the U.K. and Fachhochschule in Germany). However, the role of junior colleges in U.S. higher education was marginal in the beginning. There were only 74 junior colleges in 1915 (Snyder, 1993; Cohen et al., 2013) and the overwhelming majority of them were private institutions, mostly former high schools and schools affiliated with churches. As shown in Fig. 2, the number of 2-year institutions, especially public 2-year institutions, started to increase in the late 1920s and the number plateaued at around 1,000 institutions by the 1970s. The number of students attending community colleges also started to increase. In 1931, only 85,000 students were reported to attend community colleges (accounting for only 7.5% of undergraduate enrollment), but the number consistently increased until 2010, when the community college enrollment peaked at 7,683,597, or 42.5% of undergraduate enrollment (See Fig. 3) (Snyder, 1993; de Brey et al., 2022).
44
T. Nagano
2.2
Expansion of Community Colleges in the 1960s and Accessibility to College Education
A massive expansion of community colleges took place in the 1960s (see Figs. 2 and 3), during which community colleges started actively recruiting students with non-traditional backgrounds such as students of color, mature students, and immigrant-origin students. In 1947, President Harry Truman’s Commission on Higher Education published Higher Education for American Democracy, proposing to make higher education accessible for all Americans through a network of community colleges and using Federal spending for scholarships and grants. In 1965, the Pell Grant, a Federal financial assistance program for low-income families, was established by the Higher Education Act (HEA) of 1965. A more diverse body of students, including women, minorities, working class students, and older students, would need places for post-secondary education. The infrastructure of community colleges was ready for an expansion in the 1960s. Cohen et al. (2013) report that many community colleges had already been built within a reasonable commuting distance (within 25 miles) for most potential community college students. Several states (California, Florida, Illinois, New York, Ohio, Michigan, and Washington) had established a mature system for public community colleges by the 1970s. Demographic patterns, an expected increase of college-age population among the Baby Boomers and the increase of immigrants after the passage of the Hart-Cellar Act in 1965, also presented a favorable prospect for community colleges. 1,200 1,088
900
910
945
905
935
1,024
984
1,069 1,076 1,061 978 910
Number
835 739
600
300 258 137
19
−1
15
91
6 21
19
178
302 219
328 322
405
377
452
327 275
267
258
273
267
254
231
188
186
182
180
184
179
164
144
112
70
55 19
0
189 136
317
−1
92
2
19
25
9 −1
26 19
29
−1
93
0
19
33
−1
93
4
19
38
93
−1
9
19
47
94
−1
8
19
52
95
−1
3 56
19
−1
95
7
19
96
−1
60
1
19
64
−1
96
5
19
68
96
−1
9
19
72
−1
97
3
97
−1
76
19
7
98
−1
80 19
1
19
98
−1
84
5
19
88
9
98
−1
19
92
−1
99
3
19
99
−1
96
7
98 19
−1
99
9
00
−2
00 20
1
20
04
−2
5
00
20
10
87
−2
01
1
20
15
107
0 −2
16
85
−2
20 20
1
02
Year Control
Public 2−year
Private 2−year
Fig. 2 Number of community colleges by year and control. (Data from 1915 to 2010 are from Cohen et al. (2013) Table 1.1. Data between 2011–2021 are from the USED Digest of Education Statistics 2021 Table 317.10)
World Language Enrollment at Community Colleges in the United States. . .
45
6.0M 5,432K 5,176K 4,945K
Enrollment
4.5M
4,430K
4,520K
4,541K
2,478K
2,558K
252K
235K
3,902K 3,444K
3.0M
2,641K 2,298K
2,201K 1,955K
1.5M
1,499K 1,266K
1,534K
2,029K
1,372K
986K 910K 677K
0
361K 59K
141K
102K
115K
141K
19 3 19 1 3 19 3 35 19 3 19 7 3 19 9 4 19 1 4 19 3 4 19 5 4 19 7 4 19 8 49 19 5 19 0 5 19 1 52 19 5 19 3 5 19 4 55 19 5 19 6 5 19 7 58 19 5 19 9 6 19 0 6 19 1 62 19 6 19 3 6 19 4 6 19 5 66 19 6 19 7 6 19 8 6 19 9 7 19 0 71 19 7 19 2 7 19 3 74 19 7 19 5 7 19 6 77 19 7 19 8 7 19 9 8 19 0 8 19 1 8 19 2 83 19 8 19 4 8 19 5 8 19 6 87 19 8 19 8 8 19 9 90
192K 47K
Year Control
Private 2−year
Private 4−year
Public 2−year
Public 4−year
Fig. 3 Enrollment of higher education institutions by control and type of Institution. (The data between 1957 and 1962 are missing in Snyder (1993) and have been extrapolated from the adjacent years)
Accessibility to higher education, also known as an open-admission policy, has become the central mission for community colleges since this transformational period. An open-access policy is the standard for the overwhelming majority of public community colleges, which actively recruits students from non-traditional backgrounds such as women, minorities, immigrants, low-income students, and those academically less prepared for post-secondary education (Cohen et al., 2013). Many classes are scheduled in the evening, early morning, and on weekends for students with work and/or family responsibilities during the day. Curriculum has been redesigned for students who seek to transfer to 4-year institutions after community college. Community colleges have expanded their Liberal Arts offerings and have re-focused on general education curricula, including Basic Skills courses such as Remedial Math and English as a Second Language (ESL). Financial assistance programs, such as Pell Grants and the GI Bill, became available to a wider population. Many community colleges, especially those built as part of a larger higher education systems in major metropolitan areas such as California and New York, have become feeder institutions for 4-year institutions. Geographic distance, flexible schedule, general education curricula, and financial assistance were attractive to non-traditional students without the means for 4-year institutions, which often entailed relocation, full-time enrollment, financial commitment, and academic readiness for post-secondary education. This historical analysis of community colleges presents a few important considerations for how to analyze the trends of world language enrollment. First, we will need to analyze WL enrollment trends in comparison with the growth in
46
T. Nagano
undergraduate enrollment over the same period. While WL enrollment increased between 1959 and 2009, so was undergraduate enrollment during the same period. In other words, we need to control for the general growth of undergraduate enrollment in order to see the net growth of students who opted to study world languages. Second, community colleges cater to students from non-traditional backgrounds. Through a comparison of WL enrollment trends at 4-year and 2-year institutions after the 1960’s, we can postulate major changes in the student demographics that took place in the U.S. higher education as well as in the WL classroom.
2.3
Undergraduate Enrollment and World Language Enrollment
A quick comparison between the MLA’s modern language enrollment data (Fig. 1) and the overall increase in undergraduate enrollment in the past 50 years (Fig. 3) shows remarkable similarities. In the following sections, I will argue that much of the growth in the WL enrollment between the 1960s and the 2010s owes itself to the growth in undergraduate students in the past half century. In fact, if we control for the growth of general undergraduate enrollment at 4-year and 2-year institutions, the enrollment trends in WL suggest new interpretations of the MLA’s data. Figures 4 and 5 show growth rates of WL enrollment and undergraduate enrollment between 1970 and 2016 at community colleges and 4-year institutions, respectively.
Growth Rates
40%
40.78%
38.75%
28.41%
20%
22.12%
18.94% 15.21% 5.66%
0%
15.50%
11.98% 8.01%
1.87%
4.81% 2.42%
3.33% −0.82%
0.19% 0.08%
−0.46%
−2.11%
8.21%
7.69%
4.28% −0.05%
−0.24% −7.34% −12.67%
−20%
19
72
ll Fa
19
74
ll Fa
19
77
ll Fa
19
80
l Fa
l 19
83
l Fa
l 19
86
l Fa
l 90
19
l Fa
l 95
19
ll Fa
19
98
ll Fa
02
20
l Fa
l 20
06
ll Fa
20
09
l Fa
l 13
20
ll Fa
−12.60% −15.88%
20
16
l Fa
l
Year EnrollmentType
WL_Growth
UG_Growth
Fig. 4 Growth rates of undergraduate enrollment and world language enrollment at community colleges. (Data from the USED Digest of Education Statistics 2021 Table 303.70. The data for 1972, 1974, 1977, and 1983 are not reported in the dataset and have been extrapolated from the adjacent years)
World Language Enrollment at Community Colleges in the United States. . .
47
At community colleges (Fig. 4), the overall enrollment growth usually outpaced the WL enrollment growth except for periods in 1990 and 2002. The gap in the 1960s and the 1970s is remarkable. For example, between 1970 and 1972, while the overall enrollment at community colleges grew by 28.4%, the WL enrollment went down by a few percent. Overall, WL departments/programs at community colleges were unable to take advantage of their general enrollment growth until the 1980s. After 1986, however, WL enrollment at community colleges outpaced overall enrollment until 2009, especially in 1990 and 2002. After 2009, both the undergraduate enrollment and WL enrollment started to decline; the loss was slightly larger in the WL enrollment. To put it differently, fewer community college students than expected chose to enroll in WL courses throughout the history of MLA’s Enrollment Survey, except for brief moments in 1990 and 2002. Four-year institutions (Fig. 5) show a similar pattern, but with a lot less variability between the two enrollment trends. Like community colleges, the WL enrollment at 4-year institutions slightly lagged behind the overall enrollment between 1970 and early 1980s, but with a much smaller gap between the two enrollment trends. The widest gap took place in 1974, in which the general enrollment at 4-year institutions increased by 5.0% while the WL enrollment decreased by 11.5%. This pattern flipped after the late 1980s until 2009, but again the gap between the two trends remained much smaller at 4-year institutions than that of community colleges. In sum, it appears that WL enrollment in the past half century is, to a large extent, a function of the total undergraduate enrollment, especially at 4-year institutions. However, this explanation alone falls short to explain why community colleges had a much larger gap between undergraduate enrollment and WL enrollment compared to 4-year institutions.
Number
40%
20% 14.0% 5.3%
0%
5.0%
4.1%
5.5%
2.4% −0.6%
−2.1%
3.9% 1.6%
1.2%
14.7%
14.5% 12.1%
12.2% 11.2%
9.8%
6.2%
5.0% 3.1%
0.3%
5.7%
−6.0% −10.1%
2.6%
−4.3%
−7.1%
−11.5%
−20%
19
72
ll Fa
19
74
ll Fa
19
77
l Fa
l 19
80
l Fa
l 83
19
l Fa
l 19
86
ll Fa
19
90
ll Fa
19
95
l Fa
l 98
19
ll Fa
02 20
l Fa
l 06
20
l Fa
l 20
09
ll Fa
13
20
ll Fa
20
16
ll Fa
Year EnrollmentType
WL_Growth
UG_Growth
Fig. 5 Growth rates of undergraduate enrollment and world language enrollment at 4-year Institutions. (Data from the USED Digest of Education Statistics 2021 Table 303.70. The data for 1972, 1974, 1977, and 1983 are not reported in the dataset and have been extrapolated from the adjacent years)
48
2.4
T. Nagano
Accessibility to College Education for Students of Color and Immigrant-Origin Students
Cohen et al. (2013) and Snyder (1993) discuss two underlying causes for the increase of the overall undergraduate enrollment after the 1960s. After the baby boomers’ mass entry into higher education, undergraduate enrollment has been sustained by two new student populations. The first group is students from non-traditional backgrounds such as women, students of color, and low-income students. The second group is immigrant-origin students. Community colleges were essential to make higher education accessible to those two emerging new student populations. After the 1960s, higher education has become more accessible to a wider group of high school graduates. Cohen et al. (2013) show that college participation rates (the ratio of college-age population attending post-secondary education institutions to the total college-age population) increased from 18.3% in 1960 to 41.2% in 2010. Table 1 shows college participation rates by type of institution (2-year vs. 4-year), sex, and race/ethnicity. College participation rates have increased across all dimensions of student types, but most notable among student groups that were underrepresented until the 1960s. For example, only 20.3% of female at 18–24 years olds participated in higher education in 1970, but female students’ participation rates reached 44.5% in 2020 and surpassed the male participation rates by 8.9%. College participation rates among students of color nearly doubled between 1970 and 2020; for example, Black students’ participation rates increased from 15.5% in 1970 to 35.8% in 2020 and Hispanic students from 15.8% in 1990 to 35.8% in 2020. The college participation rates for 2-year college (i.e., the proportion of 18–24 years old who attend 2-year colleges) in Table 1 indicates almost no change between 1975 (9.0%) and 2020 (9.1%), but this is due to an artifact of data analysis. Community college enrollment has had a massive expansion after the 1960s and a significant number of new students entering to community colleges were from non-traditional backgrounds. Cohen et al. (2013) note that the increase of non-traditional students at community colleges are not properly represented in the United States Education Department (USED) data. It is because the USED historically used the age range of 18–24 to measure the college participation rate and missed a large part of community college students who are older than 24 years old. According to the American Association of Community Colleges (American Association of Community Colleges, 2022), the average age of community college students is 27 years old and students above 22 years old represent 56% of all community college enrollment. Therefore, if we include mature students (those older than 24 years old), the actual participation rates among students with non-traditional backgrounds is a lot higher, especially at community colleges. Immigrant students are another new group that added to the total enrollment in U.S. higher education after the 1960s. The most significant contributor to the increase of immigrant students is the Hart-Cellar Act, a landmark immigration policy that eliminated the national origins quota system for new immigrants (Hugo-Lopez
Total 2-year 4-year Male Female White Black Hispanic Asian Pacific Islander
32.1% 20.3% 27.1% 15.5%
1970 25.7%
1975 26.3% 9.0% 17.3% 29.0% 23.7% 27.4% 20.4% 20.4%
1980 25.7% 7.1% 18.6% 26.4% 25.0% 27.3% 19.4% 16.1%
1985 27.8% 7.4% 20.4% 28.4% 27.2% 30.0% 19.6% 16.9%
1990 32.0% 8.7% 23.3% 32.3% 31.8% 35.1% 25.4% 15.8% 56.9%
1995 34.3% 8.9% 25.4% 33.1% 35.5% 37.9% 27.5% 20.7% 54.6%
2000 35.5% 9.4% 26.0% 32.6% 38.4% 38.7% 30.5% 21.7% 55.9%
2005 38.9% 9.6% 29.2% 35.3% 42.5% 42.8% 33.1% 24.8% 61.0% 50.6%
2010 41.2% 12.9% 28.2% 38.3% 44.1% 43.3% 38.4% 31.9% 63.6% 36.0%
2015 40.5% 10.6% 29.9% 37.8% 43.2% 41.8% 34.9% 36.6% 62.6% 24.1%
2020 40.0% 9.1% 30.9% 35.6% 44.5% 40.9% 35.8% 35.8% 63.7% 33.6%
Table 1 Percentage of 18- to 24-year-olds enrolled in college, by level of institution and sex and race/ethnicity (USED Digest of Education Statistics (2022) Table 302.60. Percentage of 18- to 24-year-olds enrolled in college, by level of institution and sex and race/ethnicity of student: 1970 through 2020)
World Language Enrollment at Community Colleges in the United States. . . 49
50
T. Nagano
et al., 2015). After the passage of the Hart-Cellar Act in 1965, the foreign-born population in the U.S. increased to 45 million in 2015 from 9.6 million in 1965 (Hugo-Lopez et al., 2015). Students with an immigrant background, especially the children of immigrants, have become a major part of the student body in the current higher education. Information on immigration background is rarely available in the major higher education data sets such as IPEDS and Digest of Education Statistics, but a few studies have explored this topic. Batalova and Feldblum (2020) analyzed the Current Population Survey and estimated 5.3 million students in the U.S. higher education system have immigrant origins as of 2018. Immigrant-origin students account for 28% of total undergraduate enrollment, which increased from 2.9 million immigrantorigin students, or 20% of the total undergraduate enrollment, in 2000. Much of this increase is due to second-generation Americans (i.e., U.S.-born children of immigrants), who saw a 131% increase between 2000 and 2018. In terms of race/ ethnicity, the majority of immigrant-origin students are Latino (43%), followed by AAPI (22%), White (19%), Black (13%), and Other (4%). Since most higher education data do not actively collect immigration backgrounds of students, it is not entirely clear how many immigrant-origin students choose community colleges over 4-year institutions as their starting point to higher education. However, community colleges actively recruit students from non-traditional backgrounds and students in need of remedial English training are one of the typical student populations that they seek. Anecdotally, a large number of immigrant students are currently attending community college for their proximity to their home, affordability, and academic support for non-traditional students such as remedial education.
3 Student Linguistic Diversity in the WL Classroom at Community Colleges As discussed above, non-traditional and immigrant-origin students represent a significant part of the current enrollment at community colleges. This dynamic shift of the student population has had a direct impact on WL enrollment at community colleges. One major change is the level of linguistic diversity among students in WL classroom at community colleges. Students from minority and immigrant-origin backgrounds tend to speak minority languages at home, or are more likely to be exposed to them in their community. These immigrant-origin students display an interesting linguistic mélange with diverse heritage languages, which students bring into WL classroom. An unprecedented level of linguistic diversity at community colleges is anecdotally evident, but very few studies have documented the level of linguistic diversity that WL classrooms at community colleges are experiencing now. This motivated my colleagues at a National Language Resource Center at the CUNY Graduate Center and me to conduct a large-scale survey on this topic.
World Language Enrollment at Community Colleges in the United States. . .
51
In order to capture a snapshot of the dynamic student demographics in the WL classrooms at community colleges, the Students and Instructors of Languages at Community Colleges (SILCC) Surveys collected information from 1756 community college students in the WL classes as well as from 140 WL instructors at 101 community colleges in 33 different states (Nagano et al., 2017, 2019; Ketcham et al., 2020). The survey data showed that about a half of the survey respondents were either first-generation immigrants (9.5%), 1.5-generation immigrants (8.8%), or second-generation immigrants (29.5%). While gender of students in the WL classroom was similar to the general demographics of community college students (56.5% female in the WL classroom while the national average of female students at community colleges is 57.1% [American Association of Community Colleges, 2022]), there were some notable differences in ethnicity and age. The study found that a lot fewer Black students were in the WL classroom (7% while the national average for CC students is 14.9%) while Hispanic (27.5% while the national average for CC students is 21.5%) and Asian (13.9% while the national average for CC students is 5%) were overrepresented. In terms of age, students in the WL classroom were a lot younger than the national average; 71.7% of students in the WL classroom were 24 years old or younger, while the equivalent figure in the national average is 53.8%. The most significant finding in the SILCC Surveys was the level of linguistic diversity that students had already possessed before entering into the WL classroom. The survey results showed that 42% of respondents spoke a language other than English at home (home/heritage language). In addition, 8% of respondents identified themselves as native speakers of a language other than English. In other words, only half of the survey respondents were second language learners who had not been exposed to a non-English language outside of the classroom setting (that is, Englishmonolingual students with or without prior experience in learning a WL at school). Among those who spoke languages other than English at home, an overwhelming majority spoke Spanish (58%), followed by small groups of speakers of other languages such as Chinese (Mandarin and Cantonese) (4%), Korean (3%), German (3%), Tagalog/Filipino (2%), French (2%), Arabic (1%), Japanese (1%), Vietnamese (1%), ASL (1%), Italian (1%), and Portuguese (1%). The level of linguistic diversity that students represented was astonishing. In the survey, there were 737 students speaking languages other than English at home and they reported a total of 43 different languages. Also, a large number of the survey respondents (9%) reported speaking more than two languages other than English at home. The level of linguistic diversity in the WL classroom at community colleges is remarkable and it has undoubtedly impacted the teaching and learning of WL at community colleges. From an instructional perspective, students’ linguistic resources are an important asset for developing advanced-level language competency among WL students. Researchers and policy makers identify heritage languages as a national resource (Bradburn, 2016; Fanton, 2017) since heritage language speakers often have a high level of proficiency, many with a native-like phonological performance, as well as cultural fluency in their heritage language and culture.
52
T. Nagano
It’s important to note that not all community college students are actively engaged in developing and taking advantage of their home/heritage language skills. The SILCC Surveys show that only a half of heritage language students study their heritage language in the WL classroom. In other words, despite their familiarity and fluency in the heritage language, many students decide not to attempt to refine their heritage language skills in the classroom setting. The data show that 45% of heritage language speakers are learning a language different from their own home language. It is perplexing because there are many obvious advantages in learning one’s own heritage language, including a higher grade and an opportunity to improve one’s career and employability with advanced heritage language skills. Despite numerous advantages, many students decide to study a new language rather than their own heritage language. One reason seems to be curriculum. If students speak a language other than Spanish (such as Mandarin Chinese or French), the likelihood of taking their own heritage language significantly decreases to 19%. External factors, such as availability of a WL course in their heritage language, play a major role in determining which language to study for students who speak a world language other than Spanish. However, some heritage language students voluntarily choose a language other than their own heritage language too. Even among students who speak Spanish at home, only 63% of students chose to learn Spanish in the classroom despite the fact that Spanish is the most frequently offered world language at community colleges. In other words, 37% of Spanish heritage language students opted out of learning Spanish even when their own heritage language is offered as a world language class.
4 What Can We Learn from Analyzing World Language Enrollment at Community Colleges? The MLA’s Enrollment Survey shows steep declines in the WL enrollment at both 4-year institutions and community colleges after 2009. As Looney and Lusin (2021) put it, the declining pattern found in 2013 was “the beginning of a trend rather than a blip” and the overall decline in the WL enrollment between 2009 and 2016 reached as high as -26.5%. What’s troubling in this declining period is that, unlike previous times, the decline is happening at both 4-year institutions and 2-year institutions at the same time. In addition, at both types of institutions, the decline of WL enrollment is happening a lot faster than the decrease in the general undergraduate enrollment. In 2016, the general undergraduate enrollment at 4-year institutions increased by 2.6% while WL enrollment slightly decreased (-7.1%; see Fig. 5). At 2-year institutions, the general undergraduate enrollment decreased by 11.5% and the decrease of WL enrollment was 12.6% (see Fig. 4). We need to muster our effort urgently to revitalize world language enrollment and reverse this ominous enrollment pattern in our field.
World Language Enrollment at Community Colleges in the United States. . .
53
At community colleges, it is necessary to reconsider the world language curriculum in light of their unique student population and their untapped linguistic talents. It is fair to say that community college faculty usually make their best effort to emulate the world language curriculum and teaching practices at 4-year institutions for their community college students. Learning objectives for world language classes at community colleges are frequently judged against those for the equivalent courses at 4-year institutions, which are considered the gold standard. Students are expected to master subject matter sufficiently enough for a smooth transition to a subsequent level at a 4-year institution. This practice, however, overlooks both the foundational mission of community colleges as well as students’ unique linguistic skills. A unique WL curriculum for community college students is also important given the previous linguistic knowledge that community college students bring into the WL classroom. For example, more WL classes specifically designed for heritage language speakers should be offered at community colleges given the advanced-level proficiency in heritage/home language that many community college students have prior to enrolling in a WL class. Such WL courses for heritage language speakers typically focus on the areas where heritage language speakers have a limited command, such as high-register vocabulary, less frequent grammatical structures, and expressions in the formal social settings. The curriculum for home/heritage language students should be designed to assess students’ previous linguistic experience such as oral fluency and familiarity with colloquial expressions rather than to penalize them for not fitting the usage and style within the parameters of standardized linguistic norms. Curriculum properly designed for community college students and their unique needs will be a first step to revitalize WL enrollment at community colleges. Finally, if the primary mission of community colleges is equity in higher education rather than students’ scholarly excellence, the curriculum for individual classes must reflect its institutional goal. For students with family and work responsibilities, the curriculum should allow some level of flexibility in terms of its schedule, modality of instruction, and assessment. Community college instructors should be able to spend time helping first-generation students or students with insufficient academic preparation as much as delivering instruction in the subject matter. For example, the WL curriculum at community colleges might include additional instructional time such as individual tutoring and lab practice for elementary-level WL classes, which may not be common at 4-year institutions. Four-year institutions that are interested in collaborating with community colleges should understand the history and the institutional ethos of community colleges in order to establish a successful collaboration between the two. Community college faculty take pride in how they contribute to equity and accessibility in higher education more than individual students’ scholarly excellence. Community college students face multitudes of challenges, including insufficient opportunities for quality education in K-12 and the lack of familial support for post-secondary education. Many community college faculty value the progress that students have made from the first day in class as much as their final product at the end of the semester.
54
T. Nagano
Without understanding where professional goals and pride reside among the community college faculty, it is not easy to establish a meaningful collaboration among the WL faculty at 4-year institutions and community college students.
5 Conclusion WL enrollment at community colleges accounts for a significant part of students studying WL at post-secondary institutions, but only a few studies have carefully investigated it on its own account. In this manuscript, WL enrollment trends, especially those at community colleges, between the 1960s and the 2010s have been reviewed and a few unique institutional characteristics of community colleges have been introduced. Given the current devastating trend of decreasing enrollment in WL at all types of post-secondary education institution, it has never been more urgent for WL faculty to analyze and learn from the past history of our own field and strategize collaborative effort to reverse the current trend in the WL enrollment.
References American Association of Community Colleges. (2022). 2022 community college fast facts. https:// www.aacc.nche.edu/research-trends/fast-facts/. Batalova, J., & Feldblum, M. (2020). Immigrant-origin students in U.S. higher education. Migration Policy Institute. Bradburn, N. M. (2016). The state of languages in the U.S.: A statistical portrait. American Academy of Arts & Sciences. Cohen, A. M., Brawer, F. B., Kisker, B., & Carrie. (2013). The American community college (6th ed.). Jossey-Bass. de Brey, C., Snyder, T. D., Zhang, A., & Dillow, S. A. (2022). Digest of education statistics 2020. National Center for Education Statistics/American Institutes for Research. https://nces.ed.gov/ programs/digest/ Fanton, J. (2017). America’s languages: Investing in language education for the 21st century. American Academy of Arts & Sciences. Hugo-Lopez, M., Passel, J., & Rohal, M. (2015). Modern immigration wave brings 59 million to U.S., driving population growth and change through 2065. Pew Research Center. Ketcham, E., Nagano, T., & Funk, A. (2020). Students of languages at community colleges: Who studies which languages and why? ADFL Bulletin, 46(1), 56–70. https://doi.org/10.1632/adfl. 46.1.56 Levin, J. S., & Kater, S. T. (2012). In J. S. Levin & S. T. Kater (Eds.), Understanding community college. Routledge. https://doi.org/10.4324/9780203118931 Looney, D., & Lusin, N. (2021). Enrollments in languages other than English in United States institutions of higher education, Summer 2016 and Fall 2016: Report on two-year institutions. Modern Language Association. Lusin, N. (2005). Successful college and university foreign language programs, 1995–99: Part 3: Program features associated with rising enrollments in AA-granting institutions. ADFL Bulletin, 36(3), 63–78. https://doi.org/10.1632/adfl.36.3.63
World Language Enrollment at Community Colleges in the United States. . .
55
Nagano, T., Funk, A., & Ketcham, E. (2017). Modern language instruction at community’ college: A survey-based study of modern language instructors. Foreign Language Annals, 50(3), 621–631. https://doi.org/10.1111/flan.12284 Nagano, T., Ketcham, E., & Funk, A. (2019). Why do heritage language speakers opt out of their own heritage language? A survey-based study of heritage language learners at community colleges. Heritage Language Journal, 16(3), 318–339. https://doi.org/10.46538/hlj.16.3.3 Snyder, T. D. (1993). 120 years of American education: A statistical portrait. U.S. Department of Education. Teranishi, R. T., Suárez-Orozco, C., & Suárez-Orozco, M. (2011). Immigrants in community colleges. The Future of Children, 21(1), 153–169. https://doi.org/10.1353/foc.2011.0009
Part II
Student Voices
Amplifying Student Voices: US. Undergraduate Student Perspectives on Expanding Access and Increasing the Relevance of Courses in Languages Other Than English Dianna Murphy and Jana Martin
Abstract This chapter presents findings from a census survey of the full undergraduate student population at a U.S. university to investigate student reasons for (not) studying languages other than English (LOTEs) at the college level, and student ideas for how LOTE courses could be made more accessible and relevant to them. Participants in the study were undergraduate students who both had and had not enrolled in LOTE courses at the university. Findings suggest that for both groups of students, scheduling challenges, and the need to prioritize courses that fulfill degree requirements, were the main reasons students chose not to take LOTE courses. Student ideas for expanding access to LOTEs at the university included offering more options for class meeting times, fully or partially online courses, courses with fewer weekly class meeting times, and lower- or variable-credit courses. Student ideas for making LOTE courses more relevant to them were for courses to focus on aspects of contemporary life and culture in societies in which the language is used; to emphasize everyday language, especially in speaking; and to facilitate highly personalized learning in which LOTE study is linked with their individual academic and personal interests, and their professional goals. Keywords L2 motivation · Undergraduate students · Barriers to language study · Relevance of language study to students · Survey research
1 Introduction Research to understand student reasons for studying additional languages (L2) largely draws on theories of language learning motivation, of which the L2 Motivational Self System (L2MSS; Dörnyei, 2009; Dörnyei & Ryan, 2015; Dörnyei &
D. Murphy (✉) · J. Martin University of Wisconsin, Madison, WI, USA e-mail: [email protected]; [email protected] © The Author(s), under exclusive license to Springer Nature Switzerland AG 2023 E. Heidrich Uebel et al. (eds.), Language Program Vitality in the United States, Educational Linguistics 63, https://doi.org/10.1007/978-3-031-43654-3_6
59
60
D. Murphy and J. Martin
Ushioda, 2021) is by far the most influential (Boo et al., 2015).1 The L2MSS draws on self-discrepancy theory (Higgins, 1987) and the construct of possible selves (Markus & Nurius, 1986) to posit possible future L2 selves that explain individual differences in L2 motivation: “Possible selves denote a powerful and at the same time versatile motivational self-mechanism, representing individuals’ ideas of what they might become, what they would like to become, and what they are afraid of becoming” (Dörnyei & Ryan, 2015, p. 87). The possible selves of the L2MSS are not the only components of the model, however: student attitudes toward the L2 learning experience were also posited as a core, if under-theorized and under-researched (Dörnyei, 2019) component. Dörnyei (2019) suggested how engagement with the L2 learning experience might be conceptualized in the model, with different facets that include the school context, syllabus and teaching materials, learning tasks, one’s peers, and the teacher (p. 25). Some scholars look to broader, systemic factors – some of which are conceptually related to the school context of the L2 learning experience of the L2MSS – that may help to explain U.S. postsecondary students’ participation in LOTE study. Unlike research based on L2 motivation, which to date has been based on empirical studies of students who are already participating in instructed language learning, this complementary line of research takes a broader view to examine aspects of the educational context such as racially based educational inequities, educational policies, and institutional discourses and barriers that may shape student attitudes and behaviors related to LOTE study, and may shed light on the reasons that U.S. students both are and are not studying additional languages. Anya (2020), for example, in an examination of the underrepresentation of African Americans in LOTE programs in the United States, makes the case that “lack of desire and motivation . . . do not fully explain the low rates of participation of African Americans in world language study. . . Their underrepresentation originates from a history of systemic exclusion and marginalization in U.S. education” (p. 98). Considering educational policies, Lord (2020) reflects on the history of the relationship between changes in institutional policies related to language requirements and the decrease in U.S. LOTE course enrollments. Diao and Liu (2020), who followed a number of U.S. students in their transition from secondary to postsecondary education, revealed a number of institutional barriers to postsecondary LOTE study: despite the interest among their participants in continuing to studying a LOTE (in their study, specifically Chinese) at the postsecondary level, such study was “incompatible with STEM majors” (p. 6), and students “aborted Chinese learning to ‘stay on track’ to fulfill their major or general academic requirements. . .” (p. 12).
1
The large body of research on L2 motivation is primarily based on English as an additional language, however, with scant studies that focus on the study of languages other than English (LOTEs) in English-dominant countries such as the United States (Boo et al., 2015; Mendoza & Phung, 2019; see also the Modern Language Journal 2017 special issue on Beyond Global English: Motivation to Learn Languages in a Multicultural World).
Amplifying Student Voices: US. Undergraduate Student Perspectives. . .
61
Murphy et al. (2022) found similar institutional barriers to postsecondary LOTE study among undergraduates. That study surveyed the full undergraduate population of a U.S. university to investigate student reasons for choosing to enroll – or not to enroll – in LOTE courses. For participants in the study who had not studied a LOTE at the university (-LOTE), their top reasons for not taking LOTE courses were related to aspects of the educational context that had nothing to do with the students’ interest or motivation to learn additional languages, or with language learning at all: they were that LOTE courses weren’t required for the students’ major and that LOTE courses did not fit in the students’ schedule. Among all of the study participants, students indicated that they would be more likely to enroll in LOTE courses if there were course options that worked better for their schedule (-LOTE n = 951, 57.6%; +LOTE n = 1037, 62.9%). Both groups of students also indicated that they would be more likely to enroll in LOTE courses if the courses focused on topics of professional interest (-LOTE n = 1037, 62.8%; +LOTE n = 1233, 74.8%) or of personal interest (-LOTE n = 1004, 60.8%; +LOTE n = 1205, 73.1%) to them (p. 16). This chapter expands on the findings reported in Murphy et al. (2022) by presenting an analysis of qualitative data from that same study that provide insights into undergraduate student perspectives on (1) ways to expand access to universitylevel LOTE study by addressing scheduling issues, and (2) how LOTE courses might be made more relevant to students by addressing topics that are of professional or personal interest to them. The chapter addresses the following two research questions: 1. What are U.S. undergraduate students’ ideas for expanding access to LOTE courses, in terms of scheduling? 2. What are U.S. undergraduate students’ ideas for making LOTE courses more relevant to them? In addressing these research questions, the chapter aims to center and amplify the voices of U.S. undergraduate students regarding their perspectives on postsecondary L2 study.
2 About the Study This section provides a brief overview of the study participants, research instrument, data collection, and qualitative data analysis.2
2
More detailed information about the study methods, including details about the quantitative data analysis, is in Murphy et al. (2022).
62
2.1
D. Murphy and J. Martin
Participants
The study was based on a census survey of the full undergraduate population of the University of Wisconsin-Madison (UW-Madison) in mid-September 2019. Participants (N = 3298) were degree-seeking undergraduate students who were over age 18 and who had not requested that their contact information be withheld from the university directory. Approximately half of the participants (n = 1648, +LOTE) were enrolled in a LOTE course at the time the survey was administered (n = 979, 29.7%) or had enrolled in at least one LOTE course at the university in the past (n = 669, 20.3%); the other half (n = 1650, -LOTE) had never enrolled in a LOTE course at the university. The demographic profile of participants was largely representative of the full undergraduate population, with some over-represented groups (Asian, Women, and First-Year students), and two under-represented groups (Men and Fourth-Year students).
2.2
Study Questionnaire
The study instrument, available in an appendix in Murphy et al. (2022), was an online questionnaire developed at UW-Madison, following a collaborative and iterative approach to item development that included student and faculty focus groups, piloting and beta testing, and a technical review by survey experts with the UW Survey Center (UWSC). The questionnaire was comprised of 94 branching items that asked students to indicate how important the ability to speak LOTEs3 was to them personally, about their reasons for enrolling – or not enrolling – in LOTE courses, and about conditions that would make them more likely to undertake or continue LOTE study at the university in the future. The questionnaire also included numerous demographic items. Most of the questionnaire items were closed response, with the exception of several open-ended questions that asked students to explain or provide more information on their response to a closed question. The data that were analyzed for this chapter were responses to three open-ended questions that were presented to a sub-set of participants (#1 and #2, below) or to all participants (#3), as follows: 1. Students who indicated that they would be more likely to study LOTEs at the university if there were course options that worked better with their schedule were asked to describe what would work better for their schedule. 2. Students who indicated that they would be more likely to study LOTEs at the university if courses focused on topics of personal or professional interest to them were asked to describe those topics of interest.
3
Following feedback from students in focus groups, LOTE proficiency was operationalized in the questionnaire as the ability to speak languages other than English.
Amplifying Student Voices: US. Undergraduate Student Perspectives. . .
63
3. All students were given the option to respond to a final open-ended question to provide additional thoughts related to improving language learning at the university.
2.3
Data Collection
The survey was administered online by the UWSC to the full UW-Madison undergraduate population (N = 30,203).4 Student contact information (names and email addresses) was obtained from the University Registrar. Invitations to participate in the study were sent out by email over a 3-week period beginning in mid-September 2019, with multiple follow-up invitations sent to non-respondents. The final response rate, after incomplete questionnaires were removed, was 10.9%. The study was reviewed as exempt by the university’s Institutional Review Board.
2.4
Qualitative Data Analysis
The study’s qualitative data, student responses to open-ended questions on the questionnaire, were initially delivered by the UWSC separately from the quantitative dataset. To prepare the qualitative data for analysis, the researchers worked with the UWSC to link student responses to the open-ended questions with their responses to certain demographic items. The resulting master datafile was reviewed to remove any information that could potentially identify individuals and uploaded to NVIVO 12 for analysis. A pair of researchers5 began the analysis by reading through the data several times and meeting to discuss the major themes that seemed to be emerging from the preliminary review. Then, working in NVIVO, they began to code the data for themes, establishing an initial taxonomy of themes and subthemes as they coded. The researchers coded several hundred responses together to make sure that they had a common understanding of the coding process and theme categorization. They then coded the rest of the responses separately, consulting regularly with each other. The researchers followed an inductive process when coding, noting and following patterns that emerged from the data rather than referring to a hypothesis (Abbuhl & Mackey, 2017). The coding process followed Baralt (2012), with the researchers meeting frequently to discuss difficult-to-interpret student responses and to recode, merge, reorganize, and “winnow” the data (Creswell, 2007, p. 152) until they agreed 4
Students who did not give permission for the University Registrar to release their name and email address, or who were under age 18, were excluded from the study. 5 Coding of the data was completed by the second author of this chapter and Kristin Dalby, former assistant director of the UW-Madison Language Institute.
64
D. Murphy and J. Martin
on a final taxonomy and shared definitions of themes and several levels of subthemes. After the coding was completed, the authors ran NVIVO queries to obtain frequencies of the themes and sub-themes by groups of students, +LOTE and LOTE, and by the number of mentions of each (sub)theme. They then created tables with both frequencies and percentages to compare the two student groups, and to show the relative frequency that a given theme was mentioned. Finally, they reviewed the student responses to the open-ended questions again in NVIVO to select responses that were illustrative of major themes, and that represented both +LOTE and -LOTE students, and students with majors in different schools and colleges in the university. In Sects. 3.2 and 3.3, the number and relative proportion of mentions of each theme by -LOTE and + LOTE students are presented in tables. In line with the chapter’s goal to amplify student voices, examples of student responses that illustrate each of those themes are presented after the tables, with minimal framing and commentary by the authors.
3 Results and Discussion In expressing their ideas for expanding access to LOTE courses, students also described their reasons for not studying LOTEs at the university. This section thus begins with a discussion of those reasons, followed by findings to address the research questions related to undergraduate student ideas for expanding access and increasing the relevance of LOTE study for them.
3.1
Reasons for Not Taking LOTE Courses
The qualitative data analysis revealed two main inter-related themes explaining student reasons for not taking LOTE courses: students described (1) needing to prioritize their major or other degree requirements over LOTE study; and (2) not having enough room in their schedule for LOTE courses, given the way that LOTE courses are scheduled, the frequency of LOTE class meetings, and the number of credits of many LOTE courses.
3.1.1
I Need to Prioritize My Major or Other Degree Requirements Over LOTE Study
Students from both groups (-LOTE and + LOTE) described the need to prioritize courses that fulfill degree requirements over LOTE courses, although such comments were much more prevalent among -LOTE students. At UW-Madison, these degree requirements include university-wide general education breadth requirements
Amplifying Student Voices: US. Undergraduate Student Perspectives. . .
65
for all undergraduates; requirements based on the school or college in which the student is earning a major; and the requirements of the student’s major(s) or certificate(s).6 Coursework in LOTEs is only required for students in the College of Letters & Science, although LOTE courses may be used to fulfill humanities requirements in some other schools and colleges. For those students not planning to major or earn a certificate in a LOTE, then – even those that are interested in LOTE study – courses that fulfill degree requirements are prioritized more highly than LOTE courses that don’t. Some of the students’ discourse on this topic frames undergraduate education as an investment of both time and money to obtain credentials associated with a degree. If LOTE study doesn’t fulfill a requirement or lead to a major or certificate, it was viewed by some students as an unaffordable – if desirable – luxury. LOTE courses, which are typically offered at the beginning levels for four to five credits, were viewed as being too “costly.” These views were found in the responses of both +LOTE and -LOTE students, as illustrated by the following examples: Well, it’s really about prioritizing what I need to get done specifically for my major. So right now, to take a language course is a luxury, because with time and money, it is not efficient for me to take a language course. +LOTE student in Agriculture & Life Sciences Language classes here at UW are around five credits. That’s a lot considering that I’m not doing a language as my major. I’m a Legal Studies major, and I need to fulfill requirements for both L&S and my major. . . I would love to have taken Chinese language courses as I took the Chinese language in high school and even went to China! -LOTE student in Letters & Science
3.1.2
Not Enough Room in My Schedule
The prioritization of courses that fulfill degree requirements was related to a second major theme explaining student reasons for not studying LOTEs, which was students not having enough room in their schedule to take LOTE courses. Students described challenges related to scheduling in several ways. First, as the following two examples illustrate, some students indicated that their schedules were already full, given coursework requirements related to their degree and the importance of graduating on time: Well I have to take a lot of prerequisite course or courses focused on my major so there’s no room for extra classes. -LOTE student in Health Sciences7
6
UW-Madison offers undergraduate certificates, not minors. The category of Health Sciences was created as a variable in Murphy et al. (2022) to account for students in the School of Nursing, School of Pharmacy, or who intended to apply for graduate programs in the School of Medicine and Public Health. Health Sciences is not a school or college at UW-Madison.
7
66
D. Murphy and J. Martin I am an engineer so if I wanted to take language classes, I would have had to graduate late. -LOTE student in Engineering
Other students described scheduling challenges in terms of the frequency of LOTE class meetings (especially compared with how other courses at the university are scheduled) and the students’ other commitments or obligations, including work. At UW-Madison, most beginning-level LOTE courses are offered for four to five credits and meet 4–5 days per week at the same time of day. To the best of the authors’ knowledge, no other subject area at the university follows this schedule of class meetings, making it difficult for students to fit LOTE study in. Moreover, for many less commonly taught languages (LCTLs), and for upper-level courses in other LOTEs, there is often just one section of the course offered, making it even more difficult for students to fit the specific LOTE course that they want or need in their schedule. Students described these challenges as follows: It is incredibly difficult to fit in a class that I have to be at every day into my schedule. It limits my ability to make a schedule that works well with being involved in other clubs and organizations and having a job because I’m having to work around this class that is every day at the same time. +LOTE student in Letters & Science One thing that could use improvement is the scheduling of class times, especially at the early levels. While I agree that the frequent session meetings are beneficial for students learning a new language. . . it also discourages students from trying to learn a new language. . . . I wanted to start learning a second foreign language while at UW, but I would be unable to given the demanding schedule of class sessions. +LOTE student in Business . . . if I were to take a language class, it needs to be three credits and have the courseload of a three-credit class, not more. -LOTE student in Agriculture & Life Sciences
Finally, for this student, the frequency of LOTE class meetings was reminiscent of a high school, not a college, schedule: The teacher was great I just remember hating meeting so many times a week. I wish more of the work was independent I just felt like I was in high school again, so I think I sort of started to resent the class. +LOTE student in Letters & Science
3.2
Expanding Access to LOTE Courses
In this study, the student ideas for expanding access to LOTE study are primarily related to scheduling. Murphy et al. (2022) found that both -LOTE (n = 951, 57.6%) and + LOTE (n = 1037, 62.9%) students would be more likely to enroll in LOTE courses if there were LOTE course options that would work better for their schedule (p. 16). The findings below are from a sub-set of those students who
Amplifying Student Voices: US. Undergraduate Student Perspectives. . .
67
Table 1 Themes related expanding access to LOTE courses Themes
Offer more LOTE class time options Offer online or partially online LOTE courses Schedule fewer weekly LOTE class meetings Make LOTE study count toward major or certificate Offer lower- or variable-credit LOTE courses Total
LOTE course enrollment Mentions Mentions by by -LOTE +LOTE students students (n = 833) (n = 1015) n % n % 305 36.6 428 42.2 227 27.2 198 19.5 114 13.7 178 17.5 89 10.7 135 13.3
Total mentions (n = 1848) n % 733 39.7 425 23.0 292 15.8 224 12.1
98 833
174 1848
11.8 100.0
76 1015
7.5 100.0
9.4 100.0
responded to follow-up open-ended questions to provide more information on their ideas regarding what scheduling would work better for them. Table 1 shows major themes related to expanding access to LOTE courses by the number of mentions that correspond with those themes by both -LOTE (n = 833) and + LOTE (n = 1015) students. The two groups of students were identical in terms of a hierarchy of themes by the relative number of mentions. The greatest difference between the two groups was in their interest in online or partially online LOTE courses, which was more desirable for -LOTE students (n = 227 mentions, 27.2%) than for +LOTE students (n = 198 mentions, 19.5%).
3.2.1
Access Theme 1: Offer More Class Time Options
Student suggestions for offering more options for LOTE class meeting times included conflicting suggestions for scheduling LOTE courses at different times of day (e.g., later in the afternoon or evening, early in the morning, or at specific times that were desirable for individual students), scheduling LOTE courses at times that are more typical for other subjects in the university (e.g., on a Monday/Wednesday/ Friday or Tuesday/Thursday schedule) and scheduling LOTE classes at different times on different days of the week: . . .Classes that were not every day Monday-Friday, but instead were maybe Monday, Wednesday, Friday, etc. -LOTE student in Letters & Science It would help if language courses were offered at different times on different days. For example, if a language course is at 11:00 every day, it is difficult to fit that into my schedule given that other courses are likely to be during that time. Another option is to have more availability of languages that have longer classes that are not every day. +LOTE student in Letters & Science
68
D. Murphy and J. Martin
3.2.2
Access Theme 2: Offer Online or Partially Online Courses
To address challenges with scheduling, while still providing opportunities for daily language practice, some students were also interested in fully or partially online LOTE courses. The total number of mentions of this theme was relatively small (n = 425). The following examples are typical of student responses: Language courses take up a lot of in class time and it is difficult to block off that amount of time and have space for all my other courses including lengthy labs. A fully online immersive option would be awesome. I don’t care for classes that are mix of online and in-class but it could be a good option for a language class, where interaction is important. -LOTE student in Agriculture & Life Science A partially online class would be beneficial because it would keep the constant practice that is needed in learning a language but still be flexible with many people’s schedules. -LOTE student in Engineering I would be taking a second language if the introductory courses were not five credits and met every single day during the week. An option to complete introductory courses online would guarantee my participation. Or, at the very least, offer courses that don’t meet so frequently so those interested in learning a second (or third) language in addition to pursuing their primary studies could do so. +LOTE student in Letters & Science
3.2.3
Access Theme 3: Schedule Fewer Weekly Class Meetings
For some students, LOTE courses would be more accessible to them if they were offered fewer days per week. For this student, classes that would meet as few as two times per week would be desirable: It would work better for my schedule to have less classes per week. Instead offering a section that only met twice a week for longer class times would benefit me. It would give me more time in class to thoroughly cover the content and alleviate me from coming to campus four times a week. +LOTE student in Letters & Science
3.2.4
Access Theme 4: Make LOTE Study Count Toward Major or Certificate
Although not prompted to do so, some students described the importance to them for LOTE study to lead to a degree credential, such as a certificate. This desire aligned with their prioritization of taking courses to fulfill degree requirements (Sect. 3.1.1). For those students, taking LOTE courses without a certificate or other credential that would formally recognize their language study felt like a waste of time: Many people I’ve met felt discouraged from taking (language) because it does not have any non-major degree options for non-business students. I personally was disappointed by this, and it discouraged me from taking further (language) courses. Alternative certificate
Amplifying Student Voices: US. Undergraduate Student Perspectives. . .
69
programs would be excellent for students who would like to improve their (language) proficiency for their future professions without the academic aspects of the full major. +LOTE student in Agriculture & Life Sciences Adding a certificate so I have something to show for my study (Don’t have room in my schedule to take classes that don’t count towards something.) -LOTE student in Letters & Science They [LOTE courses] would work better with my schedule/4-year plan if I was able to use them for something useful, such as a certificate, but I have too many classes to take with engineering to waste time on . . . classes that don’t amount to anything academically for me. +LOTE student in Engineering
3.2.5
Access Theme 5: Offer Lower- or Variable-Credit Courses
Finally, and related to holding fewer class meetings, a small number of students mentioned that LOTE courses that were offered for a fewer number of credits, or for variable credit, would work them. These students envisioned LOTE courses that would be offered for three credits, in line with many other courses at the university; or that would offer flexibility for students in choosing to take more or less accelerated LOTE courses, with a corresponding flexibility in the number of credits: A normal three-credit course like pretty much any other department at the university. The structure and schedule burden of language classes . . . is absurd. -LOTE student in Letters & Science Language classes take a lot of time to put in them, so if there was a way to make certain classes have alternative sections that go slower and have fewer credits per semester. -LOTE student in Engineering
3.3
Increasing the Relevance of LOTE Courses for U.S. Undergraduates
Murphy et al. (2022) found that both -LOTE and + LOTE students indicated that they would be more likely to study LOTEs at the university if LOTE courses focused on topics of professional interest to them (-LOTE n = 1037, 62.8%; +LOTE n = 1233, 74.8%) or of personal interest to them (-LOTE n = 1004, 60.8%; +LOTE n = 1205, 73.1%) (p. 16). This section presents findings from the analysis of student responses to the follow-up question regarding topics in LOTE courses that would be of special interest. Table 2 shows the major themes and sub-themes from the content analysis of those responses. Two aspects of the data presented in Table 2 merit elaboration. First, the majority of student responses were captured by three main themes: students were interested in LOTE courses that focus on contemporary culture (n = 1299,
70
D. Murphy and J. Martin
Table 2 Themes related to increasing the relevance of LOTE courses to undergraduates Themes and example sub-themes
Focus on contemporary culture Popular culture, daily life, food, sports, literature, music, sports, arts, etc. Link LOTE courses to my academic major or professional goals Diverse areas, including biology, business, computer/data science, engineering, healthcare, law, literature, medicine, natural and physical sciences, psychology, other STEM fields, etc. Focus on everyday language, especially in speaking, with opportunities for functional language use Conversational language, colloquial language and slang, practice with native speakers Focus on history Other interests For example, environment and climate, social justice, other Focus on politics, world issues Total
LOTE course(s) enrollment Mentions by Mentions by -LOTE +LOTE students students (n = 1527) (n = 2117) n % n % 520 34.0 779 36.8
Total mentions (n = 3644) n % 1299 35.6
496
32.5
556
26.3
1052
28.9
350
22.9
496
23.4
846
23.2
65 73
4.3 4.8
115 93
5.4 4.4
180 166
4.9 4.6
23 1527
1.5 100.0
78 2117
3.7 100.0
101 3644
2.8 100.0
35.6%), in LOTE courses that are linked in some way to the students’ academic major(s) or professional goals (n = 1052, 28.9%), and LOTE courses that focus on everyday language, especially in speaking (n = 846, 23.2%). There were relatively fewer mentions from both -LOTE and + LOTE students related to an interest in other foci. Second, the responses from -LOTE and + LOTE students were fairly similar, with one major exception: there were relatively more mentions by -LOTE students (n = 496 mentions, 32.5%) that described interest in linking LOTE study to their major or professional goal than by +LOTE students (n = 556 mentions, 26.3%). The remainder of this section presents example student responses that illustrate each of the three main themes represented by the majority of student mentions.
3.3.1
Relevance Theme 1: Focus More on Contemporary Culture
More than any other possible topical focus for LOTE courses, students in this study described an interest in learning about contemporary culture(s) in which the
Amplifying Student Voices: US. Undergraduate Student Perspectives. . .
71
language is used. Their interests were primarily in contemporary popular culture (e.g., related to music, sports, literature, and other arts), and in aspects of daily life. In their responses, some +LOTE students implicitly contrasted their interest in contemporary culture to the historical approach to teaching culture through literature that they found in their courses. The students framed their interests in contemporary culture as being necessary for being able to understand and function in societies in which the language is spoken: Cultural rather than historical literature. I want to know what is that country or culture like today. Reading ancient literature is interesting but doesn’t help me much if I’m trying to live and work in that country. What can I learn that will provide me the skills I need to succeed in modern (country) society today? +LOTE student in Engineering I am taking a (language) culture class that focuses more on the history of (country), but I think it would be nice if there were a class about customs and culture today in (country) that would be helpful if I were going to study abroad. +LOTE student in Letters & Science
3.3.2
Relevance Theme 2: Link LOTE Courses to My Academic Major or Professional Goals
Students who described their interest in linking LOTE courses to their academic majors or their professional goals described or listed over 60 different academic subject areas and possible career trajectories. The subjects were across the spectrum: they included academic subjects related to fields such as biology, business, computer/data science, engineering, healthcare, law, literature, medicine, natural and physical sciences, psychology, and other STEM fields, just to name a few. Most student responses were comprised of just one or two words to describe their major or professional area of interest. Others offered more detail, as well as ideas for how LOTE courses might be modified to incorporate their academic or professional area(s) of interest: Spanish for running or managing a dairy farm, talking to employees about cattle and how to effectively communicate. -LOTE student in Agriculture & Life Sciences Topics could be focused on specific major-related content. For example, since my major focuses on biology, having language content that crosses over with the sciences for a little bit of the course would make the language more relevant to me. +LOTE student in Letters & Science Having discussion sections that focused on building vocabulary necessary for different areas of study such as technical language for engineering or words commonly used in business. -LOTE student in Engineering
72
D. Murphy and J. Martin
3.3.3
Relevance Theme 3: Focus More on Everyday Language, Especially in Speaking
Over one-fifth of student responses from both -LOTE (n = 350 mentions, 22.9%) and + LOTE students (n = 496 mentions, 23.4%) included mention of an interest in LOTE courses focusing more on everyday language. Students seemed to conceptualize everyday language primarily in terms of speaking, in both informal (e.g., in everyday conversation with peers in which more colloquial language would be used) and more formal (e.g., professional) contexts. Those students looking to the possibility of using the language in future study, travel, or work abroad, or in local communities in which the language is used, frequently mentioned a desire for LOTE courses to prepare them for daily life in which they envision speaking playing a more important role than writing. Similar to the above (related to the theme, focus more on contemporary culture), some +LOTE students described their interest in a focus on everyday spoken language in contrast to LOTE courses they have taken that focus on literary studies and writing: Speaking! I have traveled to several different countries, and not once have I ever found a use for being able to write the language I’m learning. Look at how we learned our first language it wasn’t until we were almost fluent that we started to read and write. More talking, more listening, more actually learning the language! +LOTE student in Agriculture & Life Sciences If the courses focused more on real skills needed in everyday conversation, like by placing people into contexts where the language is necessary to communicate. -LOTE student in Engineering More focus on speaking and professional life. Please, please offer more courses that specialize in oral communication. I would also appreciate more practical language courses that center on business life, not so much on literature. +LOTE student in Letters & Science Please offer more courses that are cross-listed with International Business/International Studies or otherwise take a more practical approach to learning a foreign language. I know literature is important and valuable for learning about the culture behind a language. As much as I love that, I really strongly believe that any course that centers more on oral communication and professional life would also be extremely valuable to students, especially students like me that are in 7th+ semester of a foreign language and would like to take something besides literature and writing practice. +LOTE student in Letters & Science
3.3.4
Relevance as Personalization
Overall, the undergraduate students in this study indicated an interest in LOTE courses that would be highly personalized, connected to their immediate or imagined future lives, and linked in some way with their individual academic and personal interests, and their professional goals.
Amplifying Student Voices: US. Undergraduate Student Perspectives. . .
73
The 70+ topics that the students described as being of interest were highly diverse. Some of these topics were clearly related to the students’ academic major(s) or professional interests, as described above (see Relevance Theme 2), but others were more related to personal interests: activism, agriculture and farming, animé, archaeology, architecture, art, bilingual education, biology, biopharma, business, chemical engineering, childcare, church, climate, colonialism, community development, computer science, cooking, communications, counseling, culture, current events, daily life, economy, engineering, environmental science, family dynamics, film, finance, fishing, food, games, gender, genetics, healthcare, higher education, history, identity, human rights, immigration, interior design, international relations, law, LGBTQ+ rights, linguistics, literature, manufacturing, medicine, military, modern fiction, media, music, nutrition, politics, pop music, public health, retail, science, science communication, slang, social justice, social media, special education, sports, sustainability, theater, using language for career/at work, video games, volunteering, wellness, wildlife, women’s rights, world issues.
4 Conclusion This chapter presented findings from the analysis of qualitative data from a census survey of undergraduate students at one U.S. university that shed light on some of the self-reported reasons that students are not taking courses in LOTEs at the university, and on their ideas for making LOTE courses more accessible (in terms of scheduling) and relevant to them. In doing so, the chapter aimed to foreground the voices of undergraduate students who had and hadn’t taken courses in LOTEs at the university, complementing L2 motivation research that looks only at students already participating in additional language learning. In line with the findings from Diao and Liu (2020), this study found that for many U.S. undergraduate students, despite the value that they report to place on proficiency in LOTEs for themselves personally (Murphy et al., 2022), students prioritized taking courses that fulfilled major or other degree requirements over LOTE courses that did not. To address barriers to access to LOTE study related to scheduling, some of the students in this study indicated an interest in LOTE courses that would be more modular and flexible, with traditional face-to-face, or partially or fully online LOTE courses that are better aligned with the typical credit load and weekly schedule of courses in other subject areas at the university. Overall, participants in the study expressed an interest in more personalized LOTE courses that would enable them to integrate their individual academic, professional, and personal interests with their LOTE study. The topics in which students expressed an interest in linking with their LOTE study were broad and diverse. The chapter shared data from -LOTE and + LOTE students in different schools and colleges in the university. It did not, however, look at other sub-groups, based on, for example, student demographic profiles. Research that amplifies the voices and experiences of minoritized students in LOTE study in particular is very much
74
D. Murphy and J. Martin
warranted to better understand the barriers to access and the relevance of LOTE study for those students (Anya, 2020). As one student in this study commented: Language professors should also be trained on instructing students of various backgrounds (e.g. individuals with disabilities, minoritized racial groups). I have noticed that language curriculum tends to target mainstream American culture as its audience. +LOTE student in Letters & Science
The chapter also did not discuss the potential pedagogical, programmatic, or administrative implications of the study’s findings. LOTE programs wishing to be more responsive to student interests might consider administering a similar survey of students on their campus to better understand what the barriers to access to LOTE study might be for their students, and what types of curricular or other programmatic innovations might attract a broader population of students to their courses. U.S. LOTE programs may find student voices to be useful to inform discussions about possible programmatic or curricular change, balanced with the voices – and expertise and experience – of LOTE instructors and program administrators.
References Abbuhl, R., & Mackey, A. J. (2017). Second language acquisition research methods. In K. A. King, Y.-J. Lai, & S. May (Eds.), Research methods in language and education, encyclopedia of language and education (3rd ed., pp. 183–193). Springer International Publishing. https://doi. org/10.1007/978-3-319-02249-9_13 Anya, U. (2020). African Americans in world language study: The forged path and future directions. Annual Review of Applied Linguistics, 40, 97–112. Baralt, M. (2012). Coding qualitative data. In A. Mackey & S. Gass (Eds.), Research methods in second language acquisition: A practical guide (Vol. 7, pp. 222–244). John Wiley & Sons. https://doi.org/10.1002/9781444347340 Boo, Z., Dörnyei, Z., & Ryan, S. (2015). L2 motivation research 2005–2014: Understanding a publication surge and a changing landscape. System, 55, 145–157. https://doi.org/10.1016/j. system.2015.10.006 Creswell, J. W. (2007). Qualitative inquiry and research design: Choosing among five approaches (2nd ed.). Sage Publications. Diao, W., & Liu, H. Y. (2020). Starting college, quitting foreign language: The case of learners of Chinese language during secondary-postsecondary transition. Journal of Language, Identity & Education, 20(2), 75–89. https://doi.org/10.1080/15348458.2020.1726753 Dörnyei, Z. (2009). The L2 motivational self system. In Z. Dörnyei & E. Ushioda (Eds.), Motivation, language identity and the L2 self (pp. 9–42). Multilingual Matters. https://doi.org/ 10.21832/9781847691293-003 Dörnyei, Z. (2019). Towards a better understanding of the L2 learning experience, the Cinderella of the L2 motivational self system. Studies in Second Language Learning and Teaching, 9(1), 19–30. https://doi.org/10.14746/ssllt.2019.9.1.2 Dörnyei, Z., & Ryan, S. (2015). The psychology of the language learner revisited. Routledge. https://doi.org/10.4324/9781315779553 Dörnyei, Z., & Ushioda, E. (2021). Teaching and researching motivation (3rd ed.). Routledge. https://doi.org/10.4324/9781351006743 Higgins, E. T. (1987). Self-discrepancy: A theory relating self and affect. Psychological Review, 94(3), 319–340. https://doi.org/10.1037/0033-295X.94.3.319
Amplifying Student Voices: US. Undergraduate Student Perspectives. . .
75
Lord, G. (2020). Is the sky falling (again)? Observations on the language requirement in U.S. higher education. ADFL Bulletin, 46(1), 114–122. https://doi.org/10.1632/adfl.46.1.114 Markus, H., & Nurius, P. (1986). Possible selves. American Psychologist, 41(9), 954–969. https:// psycnet.apa.org/doi/10.1037/0003-066X.41.9.954 Mendoza, A., & Phung, H. (2019). Motivation to learn languages other than English: A critical research synthesis. Foreign Language Annals, 52(1), 121–140. https://doi.org/10.1111/flan. 12380 Murphy, D., Sarac, M., & Sedivy, S. (2022). Why U.S. undergraduate students are (not) studying languages other than English. Second Language Research & Practice, 3(1), 1–33.
Understanding Student (A)motivation Towards Learning a Language: Students’ Perspectives on Continued Language Study Melanie L. D’Amico and Scott Sterling
Abstract This year-long qualitative project investigated students’ stated reasons for not enrolling in language courses at the college level. Using structured interviews, we surveyed 49 undergraduate students at a medium-sized midwestern university who had no plans to take language courses beyond the school-required minimum. In looking at our results in an optimistic fashion, participants appeared to be language positive, valued foreign language skills for both the individual and society, and believed that an additional language would increase future earnings. In many ways, participants parroted the talking points typically used to convince students to take language courses. Even though participants appeared to internalize the recruitment message, none of them had any plans to study a language. Their reasons for not doing so included scheduling/time constraints, a general sense of futility at learning languages, and a frustration at past inabilities to learn a language. The results largely show that students understand the importance of learning languages but that they face considerable roadblocks, both internal and institutional in nature. Discussion includes suggestions for updating recruitment efforts aimed at increasing the rate of USA college students in languages courses. Keywords Amotivation · Student voices · Learning barriers
1 Introduction Like many universities in recent years, our language department has seen a continued downward trend in the number of students choosing to study foreign language beyond the university’s non-native language requirement (see Lusin, this volume). In setting out to investigate this problem, we chose to speak to students on our campus who did not appear to be interested in taking foreign language courses while working towards their undergraduate degree. The goal of this was simple; we wanted
M. L. D’Amico (✉) · S. Sterling Indiana State University, Terre Haute, IN, USA e-mail: [email protected]; [email protected] © The Author(s), under exclusive license to Springer Nature Switzerland AG 2023 E. Heidrich Uebel et al. (eds.), Language Program Vitality in the United States, Educational Linguistics 63, https://doi.org/10.1007/978-3-031-43654-3_7
77
78
M. L. D’Amico and S. Sterling
to hear from the students themselves about their attitudes toward foreign language, their reasons why they chose not to enroll in language courses, and their experiences with prior language learning (if any). One of the other principal goals of this research was to consider how our language courses are marketed to students, and to see if we are truly addressing their needs and interests. Like most language programs, our faculty develops our flyers, online posts, and other advertisements designed to recruit students. Our faculty are highly proficient language learners with a deep love of learning and using languages, but only a limited knowledge in marketing. The idea behind these advertisements is to provide students with reasons why they should take language, according to our expertise. However, without considering the students’ perspectives, we grew concerned that we may be offering ideas that do not appeal to students nor resonate with their personal goals. Additionally, the faculty themselves are highly successful learners who may not share the same motivations towards language study or they may not have experienced language learning struggles that undergraduate students often do. In other words, in most cases, when we develop a campaign to entice students to take our classes, we are giving them what we think they want (which is in truth what we would have wanted to hear), rather than asking what they want. Within the field of Second Language Acquisition (SLA) it is generally well accepted that motivation is a key factor in dedicated language study that leads to achieving higher levels of proficiency (e.g. Cheon & Reeve, 2015; Cigan, 2014; Dörnyei, 1994, 2005, 2009; Gardner, 1988; Gardner & Lysynchuk, 1990; Masgoret & Gardner, 2003; Grey & Jackson, 2020; Ushioda & Dörnyei, 2009; Yu, 2019). As one of the most highly investigated individual differences in L2 learning, the field has uncovered a great deal about motivation and its role in helping a person achieve proficiency in their L2. Nonetheless, the body of research completed on motivation tends to focus on participants already enrolled in language classes or language programs. While this certainly is understandable given the goals of those research projects, it also shows a gap or bias in the research. Understanding the motivation of students already in language programs tells us little about the motivations of those who have opted to not study languages. When we think of students who chose not to take language classes at the university, we have a tendency to consider them as amotivated, in other words, lacking interest in foreign languages and cultures, and with negative attitudes towards L2 learning. Likely, we assume that they are not studying languages because they somehow do not understand just how cool, interesting, or useful it is. However, this is an overly harsh judgment to make given the lack of data collected on these types of students. Research on amotivation has found these results primarily for students who are required to take a language course and while in that course, do not have high motivation to learn (e.g. Bećirović & Hurić-Bećirović, 2017; Heidrich & Kraemer, 2018; Khazaie & Mesbah, 2014; Kondo-Brown, 2006; Mohammadian, 2013; O’Reilly, 2014; Wang, 2014). If our goal is to attract more students to our language programs, and we intend to do so on our own campuses, we need to have a better understanding of the students we have yet to reach, not the ones who are already in classes.
Understanding Student (A)motivation Towards Learning a Language: Students’. . .
79
One additional point we considered in completing this project was the motivational approach used in recruitment. If we consider the instrumental versus integrative motivation model (Noels et al., 2000), we find that integrative motivation is the stronger of the two, leading to greater dedication in studying the language, and as an antecedent towards achieving high, or native-like, proficiency. Yet, in reviewing strategies used by language programs, we see that there is often a tendency to appeal to instrumental motivation. Marketing materials often center on the usefulness of language in careers and travel. In general, the thinking is to use instrumental motivation as a means of bringing students to us, and then finding ways to help them develop integrative motivation through their experience in our classes. However, we might question if appealing to instrumental motivation is sufficient to motivating students to take courses in the first place.
2 The Site We conducted our project at a mid-size public university with an enrollment of approximately 11,000 students at the time of the data collection. Undergraduate students are required to take two semesters of foreign language courses at the 100 (or above) level. Students may choose to fill these classes with the same or two different languages. Many students meet this requirement by taking foreign language during high school. The department regularly offers French, German, Japanese, Latin, and Spanish as language choices, and occasionally offers Arabic, Chinese, Korean, and Greek. Students who wish to study beyond the language requirement can take a combined Language Studies major (39 h) with a concentration in a particular language, a Language Studies Teaching major (30 h), or a Language Studies minor (21 h). All three programs allow students the flexibility to specialize in one particular language, in linguistics, or combination of both.
3 Methodology Our participants were 39 undergraduate students who were not seriously studying a foreign language at the time nor had plans to seriously study a language in the future. We defined seriously studying a language as a student who was minoring/majoring in foreign languages, were taking additional courses beyond the requirement, or studying a language outside of a formal course. Since it can be challenging to find people who are not doing something, participants were selected through a semirandom process. Research assistants, both graduate and undergraduate students, went to common areas on campus and approached students. They asked two screener questions: (1) are you an undergraduate student?, and (2) are you currently taking a foreign language class? Students who qualified for the study were then asked if they would be willing to participate in a short oral interview about foreign language
80
M. L. D’Amico and S. Sterling
Table 1 Interview questions Interview questions 1. Why have you chosen not to study a language? 2. If you could magically speak any other language, which one would you choose and why? 3. Have you tried learning a language in the past? What was your experience like? 4. Why are you not successful in learning a language? 5. [University] requires that all students have the equivalent of 2 semesters of language experience what do you think of [university]‘s language requirement? 6. Is learning a language hard? Why yes or no? 7. How many years do you think you would need to learn another language? How many hours per day would you need to practice that language? 8. What would motivate you to learn another language? 9. How much extra money do you think you can earn if you were to know another language? 10. How important is it for Americans to speak another language?
learning. Biographical data was not collected due to ethical considerations, however, our research assistants disclosed that all participants appeared to them to be “typical undergraduate students” approximately between the ages of 18–25 and likely with English as their first language. All of the participants had prior foreign language learning experience before starting their undergraduate degree. This was not a required factor to participate in the study; however, it is a common trait of students at this university. Two graduate students and one undergraduate student research assistants collected data through oral interviews. These interviews consisted of ten questions on the participant’s personal experience with language learning and on their opinions about language learning in general (see Table 1). The interviews were designed to be fairly brief, lasting an average of 4 min. All interviews were audio recorded and then later transcribed for analysis. Consent was provided orally for the study and the whole research process received IRB approval. Following qualitative research practices, the interviews were first analyzed for major themes and a coding system was developed. The interviews were then re-coded to allow for the refinement of the themes and organization of the ideas presented by the participants. This process was repeated twice by each of the authors to ensure careful coding and consideration for the variety of information within the interviews. In some instances, simple percentages were used in grouping participants’ answers, particularly when the answers were a numerical value (for example, years of study).
4 Results and Discussion Data analysis revealed four major themes (see Table 2) that were present throughout the participants’ responses. Each theme along with examples will be discussed in the subheadings below.
Understanding Student (A)motivation Towards Learning a Language: Students’. . . Table 2 Themes
4.1
81
Themes Knowledge of SLA Understanding the importance of L2 acquisition Prior experience with L2 learning Roadblocks to L2 learning
Knowledge of SLA
The first theme dealt with the participants’ knowledge of SLA and languages in general. Please note that we did not choose to use comments from the interview transcripts for this first theme only because the answers were mostly numeric. What we found in this theme was that students’ understanding of language learning and the overall process of acquiring a second language (L2) varied greatly with some knowledge being rather accurate or at least within the realm of possibility. However, in other cases, students were inaccurate or lacking in knowledge all together. Where students appeared to be the most knowledgeable was in how many hours of practice they should do a week to be successful in learning a language with 95% of participants saying that a person needs 1–3 h of weekly practice. This is in line with the general guidelines provided with most language programs. Obviously, more language practice would be helpful, but most language teachers would probably be thrilled if they could get their students to practice for this amount of time outside of class. These answers demonstrated that students were generally realistic about the amount of work they would need to be successful. It is possible that through their previous foreign language study, the participants had seen that 1–3 h of practice was the expectation for outside of class work or that they were told this number. This result is promising in that students did not believe that language learning required a vast number of hours per week to be dedicated to the process. When asked how many years it would take to learn a new language, results were mixed and were only somewhat in line with standards found in SLA. The least amount of time provided was between six and 18 months (6.5% of participants). Arguably, too little time for most people to achieve anything resembling being a proficient user of the language. On the other extreme, about a quarter of participants (22.5%) responded that it would take 5–10 years to learn a language. While this is not an unreasonable amount of time to suggest, when we connect it to a topic we will discuss later (the need for perfection), we would argue that the 5–10 year timeframe is more indicative of a lack of knowledge of what language ability resembles at various levels. Finally, the most common response provided was that it takes around 1–4 years of study to learn a language (71% of participants). This number matches well with the length of most high schools and/or university programs. The lower number might represent the time required to complete a minor while 4 years of study will often complete a major. However, prior research has shown that on average, undergraduate students in the U.S. only reach ACTFL proficiency level of Intermediate High after 4 years of college-level language study (Fraga-Cañadas, 2010; Gass
82
M. L. D’Amico and S. Sterling
et al., 2016; Moeller, 2013; Rifkin, 2005; Tschirner, 2016) which again indicates that this amount of time might not be enough for students to reach their desired programmatic outcomes. Another metric we asked students was to estimate the amount of increased salary a person might receive from speaking additional languages. More than half of the students (56%) were unable to assign a specific dollar amount but had a general attitude that language skills would result in higher earnings. Participants who provided a specific salary indicated an increase in earnings that stretched from $1000 to $20,000 more annually. The main goal of asking this question was not for accuracy sake, but was to tap into their knowledge of value of language skills for their future career. It should be noted that we did not have financial information on how much extra money could be earned in various career paths in our local area. We are thus not better able to answer this question than our students, potentially showing an area of growth for our department to consider. What these responses showed us was that while many participants had a general idea that language skills did provide for additional income, they did not have a solid understanding of how much those earnings might be. However, as is often the case with the data from this study, even though students believed that language skills provided additional monetary benefits, those benefits were not enough to push them into actually taking language classes.
4.2
Understanding the Importance of L2 Acquisition
When participants were asked to reflect on the importance of foreign language study in the U.S., their attitudes and responses were overwhelmingly positive in nature. These positive attitudes surprised us, as the area in which we conducted the study does not have a stellar record in language diversity or inclusion. We entered this study fully expecting to receive hateful comments to these questions and overall negative attitudes towards learning languages. We were delighted that this was not the case. The majority of these students believed that Americans should be exposed to other languages and cultures. “I think it’s really important honestly. The rest of the world most of them are bilingual. . . and it’s just Americans only knowing English kind of hurts us. So. . . I think it’s pretty important.” Participant A4 “I think it is very important just cause it’s like. . . for Americans in general because uh, we’re not the only country in the world and. . . and uh it’s important to you know uh learn about other cultures cause this is a world culture that we live in. It’s important to integrate into the other cultures.” Participant B5
Students also frequently mentioned that the American system for learning L2s was deficient or inadequate when compared to other countries, particularly European countries. There seemed to be a common opinion that Americans could benefit from greater amounts of language study, often throughout their academic careers as is common in other countries.
Understanding Student (A)motivation Towards Learning a Language: Students’. . .
83
“I think it’s just as important as Europeans speaking multiple languages. It’s just we don’t want to for some reason. I think it’s pretty important.” Participant C3
While responses were most often positive in nature, they were also more generic rather than personal. This is partly due to the wording of the questions which focused on “Americans” at large. Nonetheless, we found there was a sense from some students that L2 learning was beneficial for some people, but not necessarily for themselves. So while they agreed in theory that L2 learning was important, it was not particularly important for them to learn an L2. “I think it is important that some Americans speak another language, but I don’t think it is important that everybody has to speak another language.” Participant A2 “Well I think as Americans we think that we should only know English and expect everyone else to know English. Even though it is a pretty common language over the world to be more of a fully developed person I think it’s important to at least try to understand other language. Even if you can’t speak it fluently. It’s important to be able to know how other people think and be able to communicate with other people.” Participant A14 “It’s pretty important I would say. Because a lot of uh. . . I mean even legally. . . I mean immigrations. . . I mean it happens a lot I mean we’re a land of immigrants so uh. . . we get a lot of that. People that speak a lot of different backgrounds from different languages so I think it’s important. I think I definitely think it would be. It’s uh something that’s coming in the future that’s gonna be expected a lot more of I would reckon.” Participant A20
In a similar vein, students also expressed support for our university’s non-native language requirement and stated that they liked the policy as they felt it was important to have some exposure to an L2 and to other cultures. Moreover, there was a fairly decent number of students who felt the requirement should be expanded to include more language classes. “I like that requirement. Um. . . I think it is good cause I think you need to have like at least some type of uh. . . experience with a different culture or anything like that. Cause I mean even. . . even if uh. . . even if it wasn’t part of it it’s just an interesting thing to be a part of. So yeah I, I think that is a good thing that they have it, I don’t think it should change any time soon.” Participant A6 “I mean I think it is good. Everyone should expand their. . .minds. But it’s just difficult for a lot of people.” Participant A5 “I think it should be, I think it should be more semesters that we have to uh take a foreign language or the at least to the max so we can max it out. Um cuz we are especially the in America, we are more getting integrated with other cultures and then there’s a lot of us who’s travelling wanting to see the world more uh it’s imperative that we learn how to, learn how to communicate with the others. Uh and America tend to tends to have this idea that you know people come here and I’m here they have to learn our language and we tend to study abroad and so we tend to have that idea of that I think when we leave and then go to other countries and that’s not fair. Uh if we are asking people to learn English we should learn theirs as well.” Participant C10
This result was unexpected, as discussions within higher-ups at the university often made it seem as though students disliked this policy and found it frustrating and burdensome. We initially believed that students would complain about the policy and use this interview as a chance to vent. Even with the six participants who
84
M. L. D’Amico and S. Sterling
reported not liking the policy, there was little animosity towards the language classes themselves. Students disliked the policy more because it felt unnecessary for their degree rather than through a dislike of languages. Thus, the complaints the university has received in the past might have come from a smaller segment of the population and not be generalizable to the whole campus. “I think it makes sense why. . . uh. . . but seeing it at a collegiate level I don’t see the importance of it because I would think that. . . if it was something that you were going to want to pursue you would already have the uh. . . foundation of it settled in high school or before. So I think coming into college and making kids take it is a waste of students’ time and waste of faculty resources that could be used towards students that are pursuing it for a reason not just a credit.” Participant A18 “I don’t think that we need it because what if it’s not in your profession to speak with people who have a different language.” Participant B2
There were a few participants that felt that L2 study was not important to Americans, mentioning English’s status in the world as a lingua franca and noting that many visitors to the U.S. already speak English. “I don’t think it’s too important if here in (state of the university) we don’t really. . . I don’t really come in contact with someone who doesn’t know how to speak English. There’s people who have English as a secondary language but they’re pretty good at it here. Uh. . . so as American and uh. . . the central area of America, United Sates I don’t think it’s too important. But if you live in Florida there’s a lot of Spanish people speaking people there. I think it would be more important to live. . . I mean to speak. Uh. . . Spanish or another language.” Participant A10 “For Americans? Not that important, but oth- for other people to speak English is very important cause it’s on the come-up of being like the #1 language. Isn’t Spanish the #1? You don’t know? We don’t know uh@@@ but yes, not, not that important, but yeah still important, but like not that important” Participant B7
While this represented a minority opinion in the data, it is noteworthy that some students felt that language learning was not necessary for them or others. We had expected to hear this type of opinion more often in the data since we targeted students who had already decided to not pursue language studies. It was surprising that this opinion was not more widely expressed as anticipated. One possible reason for this may have been that two of the research assistants were international students with non-native accents. There is a chance that the participants did not feel as comfortable expressing negative opinions towards people who were themselves L2 English speakers. However, response patterns were not different between data collected by the international students compared to the domestic student. “It’s not really important for Americans at all. We’re just kind of, we’re all speaking English for the most part. You know that’s. . . it works I guess.” Participant A16
Overall, this theme demonstrated the sense of value that the participants placed on foreign language knowledge and the importance that having language skills can have, even in an area where English is a dominate language. Nonetheless, we should recognize that this value appeared to be more hypothetical in nature. Learning an L2 was seen as beneficial for others as these values were not enough to push students into taking classes beyond the required minimum.
Understanding Student (A)motivation Towards Learning a Language: Students’. . .
4.3
85
Prior Experience with L2 Learning
As mentioned previously, all the participants in this study had prior experience with L2 learning before attending college with the majority of participants taking foreign language classes in high school. While they expressed a mixture of opinions, their overall attitudes towards high school language learning was frequently negative. The root of this negativity was typically about the difficulty of learning an L2, or was directed at the teachers or programs available to them. We had expected students to discuss the difficulty of language learning and therefore, comments on how hard it was to learn or how the person did not have the mindset for language learning were anticipated. “I did, I uh. . .I took Spanish for three years of high school and I still know a little bit, but I don’t really remember much of it and. . .it was kind of hard so. . . I don’t know, it’s just hard because it’s like a different aspect of something I do every day and it’s just hard for my mind to really like comprehend.” Participant, B3 “Uh. . . in high school I was never the best at it. Uh. . . I would always get Cs and so uh. . . . And I worked really hard at Spanish it’s the only um. . . Spanish is the only other language I really have uh. . . have experiences with. Uh. . . so I just didn’t. . . I see the value in it but I just didn’t feel like I would should go in that direction.” Participant A10
In many instances, students felt that their teachers were poorly prepared to teach the L2, or were not overly knowledgeable about the language itself. It is unclear on what basis the participants used to make these judgments since most lacked knowledge of the language beyond a novice level. We can see this attitude expressed by Participant A17 below who appears to be judging the teachers’ abilities based on their own lack of success, and by Participant C8 who also felt qualified to judge their teacher’s language knowledge. It is important to note that the actual knowledge held by the teacher is unknown. “I took German and Spanish in high school. But like I said earlier the teachers probably weren’t qualified to teach that language. They are just filling in so uh. . . It wasn’t beneficial to me I didn’t learn as much as I expected.” Participant A17 “It wasn’t that good, because the teacher didn’t know Mandarin that well so it was yeah kind of a joke.” Participant C8
Additionally, some of the ideas expressed about the quality of programs were not always clear. For example, several participants mentioned that they did not have the same teacher for their language classes each year and they felt this was indicative of a poor program. Having multiple teachers in a single area or high teacher turnover is common. Why this particular area was seen as a detriment to L2 learning success is unknown, but it was brought up in responses by multiple participants. “My experience wasn’t very good because my high school didn’t have a strong program for it, so it was hard to learn and we kept getting new teachers each semester” Participant B1 “Uh. . . I really liked it but uh. . . in the process of going through it we were in between professors so I don’t feel like I learned as much as I should have but I still enjoyed it. I still got a lot from it. I just. . . I don’t know. I felt. . . like I could’ve learned more. @@@ [yeah ok] if we weren’t in between teachers.” Participant A13
86
M. L. D’Amico and S. Sterling
Anecdotal accounts of negative experiences in prior learning are common and so these findings confirmed our expectations that poor experiences in high schools might negatively impact later decisions to formally study a language. It continues to be a struggle then to attract students to a university foreign language course, when their prior experiences have not been rewarding nor pleasant. Not all responses to these questions were negative. Several participants discussed the joy they had found in language classes while others noted that these courses were easy and even fun. Some participants expressed an interest in continuing with language study in the future, but commented that they had not yet been able to do so at the university and likely would not. “I took Spanish like in middle school and high school. [ok] before I got to [university]. You know I enjoyed it. I wasn’t the best at it but I went to uh Spanish speaking countries and I used a little bit of it. So it came handy.” Participant A12
When asked about their success with L2 learning, our participants were split with 45% claiming that they were successful and 55% stating that they were not. We expected most participants to feel as if they had not been successful in prior experiences learning languages and so the high number of students who felt they had performed well in their foreign language courses was a surprise. Some students indicated that they would like to be able to pursue more language study but were not able to do so. “I actually really like it a lot. Um I did use some of it. Um I thought of taking another year of it but I just [inaudible]” Participant C5 “I’ve always really loved it. I loved it in high school when I took it. And like I wish I had more time to put into just knowing more.” Participant C6
Of the students who said they were unsuccessful learners, we found that many mentioned issues related to perfection to be the key issue. There was often a clear sense of viewing language success as only being accomplished if one had high (maybe native-like) fluency. This all-or-nothing approach was illustrated by Participant A3 and Participant C3 who did not consider themselves to be successful despite years of study. “I studied Chinese when I was a kid for like 11 years. But I was really bad at it I didn’t pick it up at all. [follow-up question] Um. . . Chinese was just really difficult for me. And we would always have new teachers come in, and that I think was the biggest problem for me is that a new teacher would come in every like two years and restart. [uh-huh] So I never continued and like progressed like I should have. [ok]” Participant A3 “Um I took like 7 years and it was okay, I . . . didn’t do well, toward the last section by the [inaudible] section. . . I can understand it I just can’t construct the sentences” Participant C3
These students expressed a sense of uselessness at having language skills if one was not able to achieve a perfect or ideal native-like ability. This result indicates a mismatch between what students are being taught about proficiency and how to set appropriate expectations. For instance, while novice level students will not sound like native speakers, they will still have the starting foundation for basic, everyday conversation and will be able to use their language skills in many low-stakes communication settings. Finding a way to help university students see and understand this value might assist us in bringing more students to classes.
Understanding Student (A)motivation Towards Learning a Language: Students’. . .
4.4
87
Roadblocks to L2 Learning
In considering why they were not currently taking a foreign language course, participants most commonly answered that they did not have sufficient time in their schedule to allow for a language course. “Um I feel like I don’t have time. Like my major requires more work than what I thought I was going to do and I have a lot of foundational classes so I just wanna get those out of the way first I guess. Still an option though. We’ll see” Participant C2 “I don’t want to study a language because I honestly don’t have enough time in my course with my minor and my major” Participant B2 “. . .if I had more time, like I’m a senior this year and I’m like in between school, work, and interning if I had more time I definitely would probably think about it more.” Participant C5
If a language was not required for their degree program, students were unlikely to have flexibility in their course plan to accommodate language study. As our university has a four-year guarantee to graduation, many major programs are planned out meticulously to allow for minimal outside coursework and to limit the amount of credit hours a student can take. In general, if a student is not required to take a specific course or is advised by their program to take a course, they have little interest in seeking out additional credit hours on their own. This is understandable as students are already busy with their degree programs and asking them to take additional courses they deem as not useful will not be successful. “Uh. . . just because like my schedule has been filled with other classes that I have to complete first but I haven’t fully decided if I want to take one because my major doesn’t necessarily need one.” Participant A19 “For my major we weren’t required to take one. So that’s just why I never took it.” Participant A4
There is a need to find ways to promote our programs as a useful add-on to other programs across campus and to incorporate language study in as many degrees as possible. We also need to study other programs’ credit plans to see where students would be able to successfully add language classes that could work within their already crowded schedule or to find meaningful reasons for why additional time should be spent on learning languages. If we can identify programs with more flexibility, it would behoove us to work with those programs first. An additional roadblock that was discovered in the data was that the majority of the participants had completed the language requirement in high school and therefore had no incentive to take language classes at the university. It appears that students viewed language as a box to check off in a list of university requirements, and once that box has been completed there was no need to pursue additional study. This was true even when students reported enjoyment of languages, success at L2 learning, and a positive high school experience. “I took uh. . . French in high school. I took it for four years so I didn’t feel like I needed to take it in college.” Participant A13
88
M. L. D’Amico and S. Sterling “Uh. . . I think that the requirement is good I mean because most people usually finish it in high school. Uh. . . and it is a good skill to have once you get out of high school” Participant A11
This finding demonstrates a need to get the message about language study at the university level at an earlier time when potential students are still in high school. If we wait until students are on campus, they may already see language study as ‘complete’ for them. Additionally, we need to provide incentives for students that go beyond a traditional language minor or major. We must be realistic that not all students will be able to complete a minor nor a major but still desire to take language courses. If we can develop programs that are more accessible or remove roadblocks from taking language courses, we may be able to attract more students to continue their language study in ways that make sense to their college trajectory.
5 Realizations and Ideas for Improvement From the overwhelmingly positive nature of the interviews, we found that students were not anti-language, nor did they demonstrate animosity towards L2 learning as we expected at the beginning of this project. If anything, this study illustrated that students have heard our messages about the importance and usefulness of knowing a foreign language. In many cases, they parroted back phrases and buzzwords that we frequently use in our advertising. On one hand, we can be reassured that our message has been clearly received. However, this message is not sufficient to persuade students to enroll in our classes. Therefore, we need to develop messages that will help students see the value in adding language classes into their program of study. Part of this new message to students should include ways of educating students about the usefulness of ‘imperfect’ L2 learning and demonstrating to them concrete examples of what they can expect to do with language at different proficiency levels. Consider for example a flyer or social media post that provides clear examples of 100-level language skills in a variety of real world settings that would appeal to students. This would also help students understand what we mean when say someone is at the beginning or novice level. In fact, it might be preferable to stay away from traditional proficiency terminology and use terms that students understand. For example, instead of saying Novice we could call that level “Basic” or “Tourist.” We might also want to work with language teacher education programs to help them realize that language perfection might be the enemy. Developing the idea that language is messy and that perfection is never the goal might help ease students into studying languages. We would take 100 imperfect language students over ten perfect students any day. Similarly, we should strive to help students understand a more accurate timeline of proficiency. We want students to have goals for L2 learning but those goals need to be realistic. Just as we let students know that a 4-week study abroad program will not make them fluent in the L2, we need to give students real expectations for
Understanding Student (A)motivation Towards Learning a Language: Students’. . .
89
acquisition based on semesters or years of study. This message could easily accompany information on the different skill levels. Additionally, programs might want to consider setting goals around individual student plans instead of static programmatic outcomes. Not all people learning a language will want to read literature or understand cultural practices. Some might only want to watch movies in their L2 or have the base knowledge to live abroad for a year. In further increasing student knowledge about L2s, it would be beneficial to include other types of value statements such as salary differences for people with language skills or perhaps the increased likelihood of being hired with particular language knowledge. We should stress however that this type of information needs to be specific and detailed. As well, it will require faculty to seek ways of obtaining this information either through personal investigation or in tandem with the university’s career center. Although we like to believe that L2 learning can apply to any field, if we present it in that way to students it can be seen as too vague. Targeted messages that look at particular career fields that are popular at universities might be more attractive to students than a general platitude that language “goes with everything”. Additionally, it would be advisable to find ways to speak to students about their needs and expectations for a language class and/or a language program. This may mean designing new courses and new styles of programs that are more attractive to other types of students beyond the traditional minor or major foreign language student. As mentioned before, creating shorter and/or more accessible programs is highly recommended to overcome the roadblocks that students face. Moreover, in considering the challenges that students see with adding language to their already overcrowded schedules, it would be potentially helpful to speak to our colleagues across campus about what L2 study can provide for their students. Since other faculty are the ones who primarily advise students outside of our departments on whether or not they should take foreign language, we need to foster better relationships with them. As with their students, faculty in other areas may not be aware of the benefits of L2 study for their students or the ease with which it could be paired up with their programs. If we seek to build up faculty knowledge as well as student knowledge, we have a great chance of reaching more potential students for our classes. One of the primary takeaway messages we found from this research is that we can see that our students already have overall positive attitudes towards L2 learning. Meaning we do not need to convince them to like languages. Furthermore, we did not find evidence of amotivation in the classic sense, which again is an encouraging result. Nonetheless, we have to be aware that liking language or seeing its value is not a strong enough motivator for students to enroll in courses. Our reasons for taking language classes need to come from students’ wants. In order to stay in tune with students’ opinions and challenges, we must continue to talk to students who are not enrolled in classes and discover more about what would get them into the L2 classroom.
90
M. L. D’Amico and S. Sterling
References Bećirović, S., & Hurić-Bećirović, R. (2017). The role of age in students’ motivation and achievement in learning English as a second language. The Journal of Linguistic and Intercultural Education, 10(1), 23. https://doi.org/10.29302/jolie.2017.10.1.2 Cheon, S. H., & Reeve, J. (2015). A classroom-based intervention to help teachers decrease students’ a motivation. Contemporary Educational Psychology, 40, 99–111. https://doi.org/ 10.1016/j.cedpsych.2014.06.004 Cigan, V. (2014). Relationship between students’ motivation and their socio-demographic characteristics. Linguistica, 54(1), 11–30. https://doi.org/10.4312/linguistica.54.1.11-30 Dörnyei, Z. (1994). Motivation and motivating in the foreign language classroom. The Modern Language Journal, 78(3), 273–284. https://doi.org/10.1111/j.1540-4781.1994.tb02042.x Dörnyei, Z. (2005). The psychology of the language learner: Individual differences in second language acquisition. L. Erlbaum Associates. https://doi.org/10.4324/9781410613349 Dörnyei, Z. (2009). Individual differences: Interplay of learner characteristics and learning environment. Language Learning, 59(s1), 230–248. https://doi.org/10.1111/j.1467-9922.2009. 00542.x Fraga-Cañadas, C. P. (2010). Beyond the classroom: Maintaining and improving teachers’ language proficiency. Foreign Language Annals, 43, 395–421. https://doi.org/10.1111/j.1944-9720. 2010.01090.x Gardner, R. C. (1988). The socio-educational model of second language learning: Assumptions, findings, and issues. Language Learning, 38(1), 101–126. https://doi.org/10.1111/j.1467-1770. 1988.tb00403.x Gardner, R. C., & Lysynchuk, L. M. (1990). The role of aptitude, attitudes, motivation, and language use on second-language acquisition and retention. Canadian Journal of Behavioural Science, 22(3), 254–270. https://doi.org/10.1037/h0078924 Gass, S., Winke, P., & Van Gorp, K. (2016). The language flagship proficiency initiative. Language Teaching, 49(4), 592–595. https://doi.org/10.1017/S0261444816000215 Grey, S., & Jackson, C. (2020). The effects of learners’ perceptions and affective factors on L2 learning outcomes. Canadian Modern Language Review, 76(1), 2–30. https://doi.org/10.3138/ cmlr.2018-0209 Heidrich, E., & Kraemer, A. (2018). Factors that influence proficiency attainment in a college language program: A German case study. Die Unterrichtspraxis, 51(2), 132–143., 202. https:// doi.org/10.1111/tger.12069 Khazaie, Z. M., & Mesbah, Z. (2014). The relationship between extrinsic vs. intrinsic motivation and strategic use of language of Iranian intermediate EFL learners. Theory and Practice in Language Studies, 4(1), 99–109. https://doi.org/10.4304/tpls.4.1.99-109 Kondo-Brown, K. (2006). Affective variables and Japanese L2 reading ability. Reading in a Foreign Language, 18(1), 55–71. Masgoret, A., & Gardner, R. (2003). Attitudes, motivation, and second language learning: A metaanalysis of studies conducted by Gardner and associates. Language Learning, 53(1), 167–210. https://doi.org/10.1111/1467-9922.00227 Moeller, A. J. (2013). Advanced low language proficiency: An achievable goal? Modern Language Journal, 97, 549–553. https://doi.org/10.1111/j.1540-4781.2013.12021.x Mohammadian, T. (2013). The effect of shyness on Iranian EFL learners. Language learning motivation and willingness to communicate. Theory and Practice in Language Studies, 3(11), 2036–2045. https://doi.org/10.4304/tpls.3.11.2036-2045 Noels, K. A., Pelletier, L. G., Clement, R., & Vallerand, R. J. (2000). Why are you learning a second language? Motivational orientations and self-determination theory. Language Learning, 50(1), 57–85. https://doi.org/10.1111/0023-8333.00111 O’Reilly, E. N. (2014). Correlations among perceived autonomy support, intrinsic motivation, and learning outcomes in an intensive foreign language program. Theory and Practice in Language Studies, 4(7), 1313–1318. https://doi.org/10.4304/tpls.4.7.1313-1318
Understanding Student (A)motivation Towards Learning a Language: Students’. . .
91
Rifkin, B. (2005). A ceiling effect in traditional classroom foreign language instruction: Data from Russian. Modern Language Journal, 89, 3–18. https://doi.org/10.1111/j.0026-7902.2005. 00262.x Tschirner, E. (2016). Listening and reading proficiency levels of college students. Foreign Language Annals, 49(2), 201–223. https://doi.org/10.1111/flan.12198 Ushioda, E., & Dörnyei, Z. (2009). Motivation, language identities and the L2 self: A theoretical overview. In Z. Dörnyei & E. Ushioda (Eds.), Motivation, language identity and the L2 self (pp. 1–8). Multilingual Matters Ltd.. https://doi.org/10.21832/9781847691293-002 Wang, Y. (2014). A survey of postgraduates’ state of language learning at graduate school, Chinese academy of social science. Theory and Practice in Language Studies, 4(1), 160–166. https://doi. org/10.4304/tpls.4.1.160-166 Yu, B. (2019). The predicting roles of approaches to learning, L2 learning motivation, L2 learning strategies and L2 proficiency for learning outcomes: A comparison between mainland and Hong Kong Chinese students. Educational Studies, 45(4), 520–532. https://doi.org/10.1080/ 03055698.2018.1509775
Why Doesn’t Everyone Take a World Language Class? University Students’ Perspectives on World Language Learning Bret Linford
Abstract This chapter investigates whether factors such as students’ pre-college world language (WL) experiences, opinions and attitudes towards WL learning and cultures, knowledge of the WL benefits, and different types of motivating factors affect their decision to enroll in WL courses at the university level. A total of 336 undergraduate university students completed a survey that included a variety of items eliciting information such as past and current academic experiences, performance, opinions and goals; attitudes toward WL learning and cultures; etc. Results indicate that students who have enrolled or plan to enroll university-level WL courses tend to have more extensive and positive pre-college WL experiences, are more aware of the benefits of language learning, indicate a greater awareness and appreciation for foreign cultures, and have more intrinsic and extrinsic motivation to study languages than those who haven’t ever enrolled in a university WL course and who don’t plan to in the future. Furthermore, the differences from the latter group tend to be even greater when comparing to students who are minoring or majoring in a WL. These findings provide insights into students’ perspectives of WL study which will benefit discussions regarding world language advocacy and how to better meet the needs of current and future students. Keywords Second language acquisition · World languages · Enrollment
1 Introduction The Modern Language Association (MLA) reported that between 2013 and 2016, enrollment in world language (WL) courses at institutions of higher education dropped by 9.2% overall (Looney & Lusin, 2019) and this downward trend has continued (Lusin, this volume). This trend is reflected in the number of degrees awarded in Foreign Languages, Literatures, and Linguistics dropping 22.7%
B. Linford (✉) Brigham Young University - Idaho, Rexburg, ID, USA e-mail: [email protected] © The Author(s), under exclusive license to Springer Nature Switzerland AG 2023 E. Heidrich Uebel et al. (eds.), Language Program Vitality in the United States, Educational Linguistics 63, https://doi.org/10.1007/978-3-031-43654-3_8
93
94
B. Linford
between 2012 and 2021 (National Center for Education Statistics [NCES], 2021). The overall decrease in WL enrollment is a clear concern for language instructors and programs and, as VanPatten (2018) suggests in his American Association of Teachers of Spanish and Portuguese President’s message, research is needed to better understand these declines. Experts such as Rosemary Feal, the former executive director of the MLA, and Gillian Lord, the Associate Dean for College of Liberal Arts and Sciences at the University of Florida, suggest that the drop in WL enrollment could be an artifact of the overall decrease in humanities enrollments (Flaherty, 2015). In fact, data from the NCES shows that overall bachelor’s degrees in the U.S. in the humanities,1 when excluding Foreign Languages, Literatures, and Linguistics, fell by 23.9% between 2012 and 2021. Although the declines in WL enrollment are likely connected to the overall declines in enrollment in the humanities, more research is needed to discover the underlying reasons why students are opting to forgo university WL study.
2 Background It is well documented that motivation plays a key role, not only in the process of acquiring an additional language, but in the decision to begin learning an additional language in the first place. Dörnyei (2005) indicated that motivation “provides the primary impetus to initiate [second language] learning and later the driving force to sustain the long and often tedious learning process” (p. 65). Motivation to learn a second language can be integrative or instrumental (see Gardner & Lambert, 1959). Learners with integrative motivation learn a second language to be able to interact with native speakers and having positive attitudes toward the speakers and the cultures of the language, whereas those with instrumental motivation learn due to an interest in learning a second language for a practical goal such as benefiting a future career or fulfilling an academic requirement. Some feel that one of the reasons for fewer students enrolling in WL courses is related to their perception of what skills they need to be prepared for their future job (Stein-Smith, 2019; Flaherty, 2015). Kissau et al. (2015) found that older high school students commonly had “a specific career in mind and did not see its connection to foreign language study” (p. 298). However, a recent survey of U.S. employers by the American Council on the Teaching of Foreign Languages (ACTFL) indicated that “9 out of 10 U.S. employers rely on employees with language skills other than English” (ACTFL, 2019, p. 8). Despite the career benefits of speaking additional languages, many popular majors do not require WL courses and therefore may lead students to believe they are not beneficial or necessary.
1
This includes bachelor’s degrees awarded in Area, Ethnic, Cultural, Gender, and Group Studies; English Language and Literature/Letters; Liberal Arts and Sciences, General Studies and Humanities; Philosophy and Religious Studies; and History.
Why Doesn’t Everyone Take a World Language Class? University Students’. . .
95
Low WL enrollment may also be due to ignorance of other benefits not directly related to a future career that WL learning provides learners. Studies have shown there are various cognitive, academic and social benefits of learning/speaking more than one language (e.g., Armstrong & Rogers, 1997; Bialystok et al., 2004). Perhaps few students are aware of these benefits and as such, have decreased motivation to enroll in language courses. Additionally, declines in WL enrollment may be due to a lack of appreciation for and/or awareness of cultures associated with world languages other than English. In fact, it has been suggested that “[t]he current political trend towards nationalism and isolationism is rendering world language education vulnerable. . .” (Waldvogel, 2021, p. 37). Waldvogel (2021) describes how learning world languages can be perceived by some as going against “sentiments of patriotism or nationalism” (p. 39) that are prevalent among some politicians. If what Waldvogel (2021) describes is connected to students’ reasons for studying languages, then it would make sense that students who have a greater appreciation for and/or awareness of cultures in which world languages other than English are spoken would be more likely enroll in WL courses. It could also be that students’ experiences with WL before entering college is a strong predictor of why they decide to enroll. For instance, those who begin WL study earlier may be more likely to continue studying the language at the university level. Indeed, studies have shown that students who begin studying a WL in middle school gain greater proficiency, have less anxiety about language learning and have higher motivational intensity than those who begin in high school (Kissau et al., 2015). Additionally, it is reasonable to assume that students’ specific experiences and opinions toward their WL courses at the K-12 level may likely relate to university WL enrollment with those having more positive experiences being more inclined to enroll in WL courses at the university level. Finally, it may be that students believe there is no need to enroll in WL courses at the university level because they believe there are more cost-effective ways to learn languages such as language learning mobile applications like Duolingo, Memrise, and Babbel. Despite experts believing that classroom instruction is overall better than learning using a language learning app (see Popiolek, 2020), recent research shows that language learners are satisfied with and enjoy their experiences with these apps (Berti & Prenga, 2021) and others find that apps can be an effective tool for language learning (Jiang et al., 2021; Loewen et al., 2020).
3 Methods 3.1
Research Questions
The current study seeks to better understand the students’ decision to enroll in WL courses at the university level and whether factors such as experiences with world language learning, beliefs/attitudes toward world language learning and cultures,
96
B. Linford
knowledge of the benefits world language learning, and different types of motivation relate to their decision. The research questions are: How does university WL enrollment status relate to undergraduate university students’. . . 1. 2. 3. 4.
previous experiences with WL learning? beliefs/attitudes toward WL learning and cultures? knowledge of the benefits WL learning? intrinsic and extrinsic motivation?
3.2
Participants
There were 336 undergraduate students from a large midwestern regional public university that participated in the study between October and December of 2019. There were 250 females, 79 males and 7 non-binary/no response participants with a mean age of 20.6 years. Over 90% of the participants identified as White/Caucasian and 94.9% indicated that they spoke English as a first language. Almost all (98.2%) had completed at least 1 year of a WL before college. A total of 157 were underclassmen (freshman/sophomores) and 179 were upperclassmen (juniors/seniors). The most common reasons participants selected for attending college were all career-focused: Necessary for my future career choice (58%), Want to get a good job (52%), and To be able to make more money in the future (45%). Of the total participants, 170 had never enrolled in a university-level world language course, whereas 166 had enrolled in a language class at some point in their university career. Of the students who had enrolled in a WL course, the great majority had enrolled in Spanish (92 students), followed by French (35 students), then fewer than ten students for each of the other languages (i.e., Arabic, Chinese, German, Italian, Japanese, Russian).
3.3
Tasks
Students completed an online survey that consisted of 57 questions including fill-inthe-bank, multiple-choice selection, and statement rating types. The survey gathered demographic data including age, gender, parents’ education levels and professions, political views, etc.; academic background and performance at the secondary and university level2; linguistic profile and language learning background; and opinions
2
The item in the survey which asked students to indicate their reasons for attending college was based on a similar question in the CIRP Freshman Survey (Higher Education Research Institute, 2019).
Why Doesn’t Everyone Take a World Language Class? University Students’. . .
97
and attitudes regarding university courses, choice of major/minor, and world languages (learning & courses). A print version of the survey can be accessed here: http://tiny.cc/wlsurvey
3.4
Analysis
In order to discover factors that correlated with university language course enrollment, participants were split into three groups based on language course enrollment status at the time they completed the survey: • Never enrolled (NE) (n = 158): Participants had never enrolled in a universitylevel WL course, were not language majors/minors, and did not indicate plans to enroll in the future. • Not major/minor (NMM) (n = 119): Participants had enrolled or planned to enroll in a university-level WL course, but were NOT majors/minors. • World language minors/majors (MIN/MAJ) (n = 59): Participants were minoring or majoring in a world language.3 In order to determine significant differences between groups, SPSS 27.0. was used to run Chi-Square & One-Way ANOVA tests.
3.5
Hypotheses
Given the previous research and assumptions, it is hypothesized that students’ (a) whose previous experiences with WL learning are more extensive and/or positive, (b) whose awareness of WL cultures and opinions and attitudes toward them are more positive, (c) whose opinions and attitudes toward WL learning are more positive and who value classroom language learning, (d) that have greater awareness of the benefits of WL learning would be more likely to enroll in a WL course at the university level. In addition, it is projected that those with more intrinsic/integrative motivation toward WL learning and cultures will be more likely to enroll in WL courses.
3
Seven WL majors were also minoring in a WL. Also, one WL major and two WL minors had never enrolled in a university-level WL course.
98
B. Linford
4 Results This section begins by presenting the findings regarding the participants’ K-12 WL experiences and opinions, then their reasons for (not) enrolling in WL courses, then students’ opinions and attitudes towards WL learning and cultures and finally students’ knowledge of the benefits of language learning are presented.
4.1
K-12 WL Experiences and Opinions
In this section, the results for factors that related to K-12 experiences with WLs are reported. That is, when the participants reported beginning their WL study, whether they took the AP test in a WL, and what their experiences and opinions were toward their K-12 WL courses. As shown in Table 1, around one in five NE and one in four NMM students began studying a WL during elementary school. In contrast, nearly half of the MIN/MAJ group began studying a WL at the elementary level. Games-Howell Tests for multiple comparisons indicated that the MIN/MAJ group was significantly different from the NMM group (p = .003, 95% C.I. = [.02, .39]) and the NE group (p = 0.022, 95% C.I. = [.07, .42]), but the overall effect size (η2), or “the magnitude of the difference between groups” (Sullivan & Feinn, 2012, p. 279), was small. For AP test taking, it was found that almost no participants in the NE and NMM groups took the AP test whereas nearly a third of the MIN and MAJ groups did so. Games-Howell Tests for multiple comparisons showed that the MIN/MAJ group was significantly different from the NMM group (p < .001, 95% C.I. = [.10, .40]) and the NE group (p < .001, 95% C.I. = [.11, .40]). In this case, the effect size was medium. Table 2 shows the participants’ overall ratings of their K-12 WL courses ordered by level of significance from the One-Way ANOVAs. The results of the One-way ANOVAs indicated that the ratings of the first four statements had significant differences between groups and the following five did not. With regard to the statements for which no significant differences in ratings were found, all groups at least slightly agreed with each statement. With regard to significant differences, the only factor that was found to have a large effect size was statement 1 “Courses/instructors inspired me to continue studying language” in which there is a progression from disagree to agree as level of WL enrollment increases. Statements 2 “Courses were beneficial” and 3 “I enjoyed my world Table 1 Percentage of students beginning WL study in elementary school and taking the WL AP test by group Factor Elementary (PreK-4) WL study AP test taken
NE 20% 3%
NMM 24% 4%
MIN/MAJ 44% 29%
F 7.180 23.726
η2 .041 .125
Note. η2 (effect size) scale: small = 0.01–0.05, medium = 0.06–.13, large = 0.14+
p-value