Watching Earth from Space: How Surveillance Helps Us -- and Harms Us [1 ed.] 1441969373, 9781441969378
- Are satellites a threat to individual privacy? - How bad is climate change and global warming? - Why can we not find O
338 92 90MB
English Pages 284 [306] Year 2010
Front Matter....Pages i-xx
The threat of satellite images....Pages 1-21
Weather satellites....Pages 23-44
Climate change....Pages 45-72
Commercial surveillance: mapping on a large scale....Pages 73-109
Society and survival....Pages 111-129
Where am I? Where are they?....Pages 131-144
Monitoring nuclear weapons 1 ....Pages 145-187
Military imaging satellites: long-range intelligence....Pages 189-232
Military radio surveillance from space....Pages 233-260
The future....Pages 261-262
Back Matter....Pages 263-284
Recommend Papers


![Electric Brain: How the New Science of Brainwaves Reads Minds, Tells Us How We Learn, and Helps Us Change for the Better [1 ed.]
2019952185, 9781946885456, 9781948836296](https://ebin.pub/img/200x200/electric-brain-how-the-new-science-of-brainwaves-reads-minds-tells-us-how-we-learn-and-helps-us-change-for-the-better-1nbsped-2019952185-9781946885456-9781948836296.jpg)


![Watching Earth from Space: How Surveillance Helps Us -- and Harms Us [1 ed.]
1441969373, 9781441969378](https://ebin.pub/img/200x200/watching-earth-from-space-how-surveillance-helps-us-and-harms-us-1nbsped-1441969373-9781441969378.jpg)
File loading please wait...
Citation preview
Watching Earth from Space How Surveillance Helps Us - And Harms Us
Pat Norris
Watching Earth from Space How Surveillance Helps Us - And Harms Us
セ@
Published in association with
Springer
Praxis Publishing Chichester, UK
PR
Mr Pat Norris, FRIN, CITP Byfleet Surrey
UK
SPRINGER-PRAXIS BOOKS IN SPACE EXPLORATION SUBJECT ADVISORY EDITOR: John Mason, M.B.E., B.Sc., M.Sc., Ph.D. ISBN 978-1-4419-6937-8
e-ISBN 978-1-4419-6938-5
DOI 10.1007/978-1-4419-6938-5
Springer Dordrecht Heidelberg London New York Library of Congress Control Number: 2010932126 Springer Science + Business Media, LLC, 1&:) 2010 All rights reserved. This work may not be translated or copied in whole or in part without the written permission of the publisher (Springer Science+Business Media, LLC, 233 Spring Street, New York, NY 10013, USA) except for brief excerpts in connection with reviews or scholarly analysis. Use in connection with any form of information storage and retrieval, electronic adaptation, computer software, or by similar or dissimilar methodology now known or hereafter developed is forbidden. The use in this publication of trade names, trademarks, service marks, and similar terms, even if they are not identified as such, is not to be taken as an expression of opinion as to whether or not they are subject to proprietary rights. Cover design: Jim Wilkie Project copy editor: Christine Cressy Typesetting: BookEns, Royston, Herts., UK Printed on acid-free paper Springer is a part of Springer Science + Business Media (www.springer.com)
Contents Author's preface . . . . . . . . . . . . . . . . . . . . . . . . . . . . . . . . . . . . . . . . . . . . . ix List of figures . . . . . . . . . . . . . . . . . . . . . . . . . . . . . . . . . . . . . . . . . . . . . . . xi List of tables . ............................................... xv List of abbreviations ........................... . ............. xvii 1
The threat of satellite images . .................................. . Satellite images hit the headlines ........ .. .... . .... . .... .. .. . What can a satellite see from space? . . . . . . . . . . . . . . . . . . . . . . . . .. 2 The makings of a satellite. . . . . . . . . . . . . . . . . . . . . . . . . . . . . . . . .. 7 Mumbai attacks, November 2008. . . . . . . . . . . . . . . . . . . . . . . . . .. 12 Vice President Cheney's house, Iraq and the domestic use of spy satellites. . . . . . . . . . . . . . . . . . . . . . . . . . . . . . . . . . . . . . . . . .. 15 Privacy. . . . . . . . . . . . . . . . . . . . . . . . . . . . . . . . . . . . . . . . . . . . . .. 17 Counter-measures. . . . . . . . . . . . . . . . . . . . . . . . . . . . . . . . . . . . . .. 21
2
Weather satellites . ........................................... 23 Forecasting the weather . . . . . . . . . . . . . . . . . . . . . . . . . . . . . . . . .. 23 Ground facilities. . . . . . . . . . . . . . . . . . . . . . . . . . . . . . . . . . . . . . .. 43 Hurricanes, typhoons and tornadoes . . . . . . . . . . . . . . . . . . . . . . .. 44
3
Climate change .............................................. How humans change the earth. . . . . . . . . . . . . . . . . . . . . . . . . . . .. Sea level. . . . . . . . . . . . . . . . . . . . . . . . . . . . . . . . . . . . . . . . . . . . .. Global warming. . . . . . . . . . . . . . . . . . . . . . . . . . . . . . . . . . . . . . .. Ice ................................................. Other changes ..... .. ....... . . . . . . . . . . . . . . . . . . . . . . . . . .. The sun .............................................. The asteroids . . . . . . . . . . . . . . . . . . . . . . . . . . . . . . . . . . . . . . . . ..
4
Commercial surveillance: mapping on a large scale . .... . .............. 73 Introduction: from Landsat to GeoEye. . . . . . . . . . . . . . . . . . . . . .. 73
45 45 47 50 53 65 66 69
VI
Contents 3D maps ............................................. Farming, forestry and land use. . . . . . . . . . . . . . . . . . . . . . . . . . . .. Other types of infringement . . . . . . . . . . . . . . . . . . . . . . . . . . . . . .. Mineral exploration. . . . . . . . . . . . . . . . . . . . . . . . . . . . . . . . . . . . Construction . . . . . . . . . . . . . . . . . . . . . . . . . . . . . . . . . . . . . . . .. Recent new forms of satellite imaging. . . . . . . . . . . . . . . . . . . . . ..
80 85 99 102 106 106
5
Society and survival. . . . . . . . . . . . . . . . . . . . . . . . . . . . . . . . . . . . . . . . . . III Natural disasters . . . . . . . . . . . . . . . . . . . . . . . . . . . . . . . . . . . . .. III Water. . . . . . . . . . . . . . . . . . . . . . . . . . . . . . . . . . . . . . . . . . . . . .. 124
6
Where am I? Where are they? The surveillance society Why we need satnav. . . How satnav works. . . . Various kinds of satnav Accuracy . . . . . . . . . . . In-car navigation. . . . . Privacy and satnav. . . . GPS is watching you. .
7
Monitoring nuclear weapons .................................... The Cold War: CORONA and Zenit-2. . . . . . . . . . . . . . . . . . . . .. The nuclear non-proliferation treaty. . . . . . . . . . . . . . . . . . . . . . .. Facilities to produce nuclear materials. . . . . . . . . . . . . . . . . . . . .. Production of uranium. . . . . . . . . . . . . . . . . . . . . . . . . . . . . .. Enrichment of uranium . . . . . . . . . . . . . . . . . . . . . . . . . . . . .. Plutonium production and extraction. . . . . . . . . . . . . . . . . . .. Types of nuclear fission weapons . . . . . . . . . . . . . . . . . . . . . . . . . . Gun-type uranium weapons. . . . . . . . . . . . . . . . . . . . . . . . . . . Plutonium and uranium implosion bombs. . . . . . . . . . . . . . .. Policing the Non-Proliferation Treaty: the IAEA . . . . . . . . . . . . . . Countries in which the IAEA has been particularly active . . . . . .. India. . . . . . . . . . . . . . . . . . . . . . . . . . . . . . . . . . . . . . . . . . . . Pakistan. . . . . . . . . . . . . . . . . . . . . . . . . . . . . . . . . . . . . . . . .. Libya. . . . . . . . . . . . . . . . . . . . . . . . . . . . . . . . . . . . . . . . . . .. Iran. . . . . . . . . . . . . . . . . . . . . . . . . . . . . . . . . . . . . . . . . . . .. Syria. . . . . . . . . . . . . . . . . . . . . . . . . . . . . . . . . . . . . . . . . . . .. Israel . . . . . . . . . . . . . . . . . . . . . . . . . . . . . . . . . . . . . . . . . . .. Taiwan. . . . . . . . . . . . . . . . . . . . . . . . . . . . . . . . . . . . . . . . . .. South Africa. . . . . . . . . . . . . . . . . . . . . . . . . . . . . . . . . . . . . . . Brazil and Argentina . . . . . . . . . . . . . . . . . . . . . . . . . . . . . . .. Algeria. . . . . . . . . . . . . . . . . . . . . . . . . . . . . . . . . . . . . . . . . .. Egypt. . . . . . . . . . . . . . . . . . . . . . . . . . . . . . . . . . . . . . . . . . .. The IAEA and Iraq. . . . . . . . . . . . . . . . . . . . . . . . . . . . . . . . . . . .
. . . . . . . . .
. . . . . . . . .
. . . . . . . . .
. . . . . . . . .
. . . . . . . . .
. . . . . . . . .
. . . . . . . . .
. . . . . . . . .
. . . . . . . . .
. . . . . . . . .
. . . . . . . . .
. . . . . . . . .
. . . . . . . . .
. . . . . . . . .
. . . . . . . . .
. . . . . . . . .
. . . . . . . . .
. . . . . . . . .
. . . . . . . . .
. . . . . . . . .
. . . . . . . . .
. . . . . . . . .
. . . . . . . . .
. . . . . . . . .
. . . . . . . . .
. . . . . . . . .
. . . . . . . . .
. . . . . . . . .
. . . . . . . . .
. . . . . . . . .
... . .. . .. . .. . .. ... . .. . .. . ..
. 131 131 132 133 135 140 141 142 143 145 145 149 151 151 152 152 154 154 156 157 159 159 160 161 161 162 163 164 165 165 166 166 167
Contents
Vll
The IAEA is drawn into the Gulf War of 1991. . . . . . . . . . . .. The Iraq War of 1991 and its aftermath. . . . . . . . . . . . . . . . .. Resolution 687 creates UNSCOM and the IAEA Action Team .... . .......... . ......... .. ......... . .... .. . US Government imagery support to UNSCOM and the IAEA ............................................ Destruction of facilities in Iraq. . . . . . . . . . . . . . . . . . . . . . . .. Using imagery in the field. . . . . . . . . . . . . . . . . . . . . . . . . . . .. Olive Branch imagery. . . . . . . . . . . . . . . . . . . . . . . . . . . . . . .. UNSCOM Aerial Image Team. . . . . . . . . . . . . . . . . . . . . . . .. UNSCOM becomes UNMOVIC ....................... Imagery in support of verification in North Korea. . . . . . . . . . . .. Imagery and nuclear verification. . . . . . . . . . . . . . . . . . . . . . . . . .. Managing large imagery files . . . . . . . . . . . . . . . . . . . . . . . . .. Thermal and multi-spectral imaging. . . . . . . . . . . . . . . . . . . .. The future of imagery in verification. . . . . . . . . . . . . . . . . . ..
167 168
8
Military imaging satellites: long-range intelligence . . . . . . . . . . . . . . . . . . Introduction. . . . . . . . . . . . . . . . . . . . . . . . . . . . . . . . . . . . . . . . .. Tactical surveillance. . . . . . . . . . . . . . . . . . . . . . . . . . . . . . . . . . .. Keyhole: US optical reconnaissance satellites. . . . . . . . . . . . . . . .. Commercial imaging satellites. . . . . . . . . . . . . . . . . . . . . . . . . . . .. Russian imaging satellites. . . . . . . . . . . . . . . . . . . . . . . . . . . . . . .. Other countries. . . . . . . . . . . . . . . . . . . . . . . . . . . . . . . . . . . . . . .. China ............................... . ............ France and continental Europe. . . . . . . . . . . . . . . . . . . . . . . .. Great Britain. . . . . . . . . . . . . . . . . . . . . . . . . . . . . . . . . . . . .. Israel ............................................ India ......... .. ......... . .......... . ......... .. . Japan .... . .... .. .... . .... . .... .. .... . .... . .... .. . Radar imaging . . . . . . . . . . . . . . . . . . . . . . . . . . . . . . . . . . . . . . .. Missile early warning. . . . . . . . . . . . . . . . . . . . . . . . . . . . . . . . . . . Getting the images back quickly. . . . . . . . . . . . . . . . . . . . . . . . . .. Unmanned aircraft. . . . . . . . . . . . . . . . . . . . . . . . . . . . . . . . . . . . .
. 189 189 190 192 197 201 205 205 206 208 210 211 211 214 218 228 230
9
Military radio surveillance from space ............................ Introduction. . . . . . . . . . . . . . . . . . . . . . . . . . . . . . . . . . . . . . . . .. Satellites being listened to - and listening. . . . . . . . . . . . . . . . . . .. Military. . . . . . . . . . . . . . . . . . . . . . . . . . . . . . . . . . . . . . . . . . . .. Monitoring the oceans. . . . . . . . . . . . . . . . . . . . . . . . . . . . . . . . .. Spying on the spies. . . . . . . . . . . . . . . . . . . . . . . . . . . . . . . . . . . . . Money no object . . . . . . . . . . . . . . . . . . . . . . . . . . . . . . . . . . . . .. The Soviets/Russians: ocean surveillance . . . . . . . . . . . . . . . . . . .. The Soviets/Russians: eavesdropping . . . . . . . . . . . . . . . . . . . . . .. Other countries. . . . . . . . . . . . . . . . . . . . . . . . . . . . . . . . . . . . . . . .
169 172 175 177 178 179 179 180 182 182 182 185
233 233 234 240 243 244 246 248 252 257
V111
Contents
France ........................................... 257 China ............................................ 259 UK .............................................. 259 10 The future. . . . . . . . . . . . . . . . . . . . . . . . . . . . . . . . . . . . . . . . . . . . . . . . . 261 References . ................................................ 263 Index . ................................................... 277
Author's preface Surveillance cameras are difficult to avoid, from the CCTV cameras in streets, lobbies and shops to the cameras at traffic signals and roadside speed traps. There are cameras in outer space watching us too - not as obvious as the street level variety, but there nonetheless - and their number is increasing rapidly as costs fall and more countries want one that carries their flag. Occasionally they are discussed by the media as when Vice President Cheney's home was deliberately blurred in the satellite image on Google Earth. This book catalogs the main reasons why satellites in outer space are watching the earth. Many of the reasons are benign while others are deliberately intrusive. The theme of the book is that by and large Earth-watching satellites are a good thing. I was overwhelmed by the assistance I received from friends and colleagues, old and new, in collecting the material presented in the book. If it contains errors or ambiguities, it is because of my failure to correctly interpret their material. The long list of those who helped includes (in alphabetical order) Paul Brooks, Simon Casey, Jeremy Close, John Davey, Mark Drinkwater, Roy Gibson, Anders Hansson, Ray Harris, Dave Hodgson, David Keighley, Adam Keith, Bob Kelley, Hans Kristensen, Robert Meisner, Amy Norris, Allison Puccioni, Ray Purdy, Nick Shave, David Southwood, Sir Martin Sweeting, Nick Veck, Joanne Wheeler. Bob Kelley's contribution was particularly important as without him, chapter 7 on the monitoring of nuclear materials, would not have been possible. To them and all the others who helped me without hesitation, I extend my sincere thanks. I have tried to attribute copyrights for the images used where they were evident. If anyone wishes to claim an image, I will happily amend the appropriate caption in the next edition of the book. Pat Norris August 2010
This book is dedicated to Valerie
Figures
2 3 4 5 6 7 8 9 10 11 12 13 14 15 16 17 18 19 20 21 22 23 24 25 26 27 28 29
Simulation of images with various resolutions: 10 cm . . . . . . . . . . . . . . .. Simulation of images with various resolutions: 3 cm . . . . . . . . . . . . . . . .. Simulation of images with various resolutions: 1 cm . . . . . . . . . . . . . . . .. Simulation of images with various resolutions: 1 mm . . . . . . . . . . . . . . .. Artist's impression of Japan's Daichi satellite. . . . . . . . . . . . . . . . . . . . .. Daichi before being launched . . . . . . . . . . . . . . . . . . . . . . . . . . . . . . . . .. Artist's impression of four NASA's TDRSS satellites in orbit . .... .. ... Economic losses caused by US weather disasters .................... Schematic diagram of the current US low-orbit weather satellite ... .. ... NOAA N-Prime (later NOAA-19) on the factory floor ............... NOAA-19 being prepared for launch ............................ Wind directions and speeds at high, medium and low altitudes computed from three Meteosat images ........................... Composite of geostationary images with latitude-longitude lines and political boundaries added by computer .......................... Sandstorm in China illustrating a "comma"-shaped wind pattern ....... NOAA Administrator Dr Jane Lubchenco ........................ Senior NOAA Official Dr Jack Hayes ............................ Artist's impression of GOES-13 in orbit .......................... Artist's impression of a second-generation Meteosat in orbit. . .... .. ... GOES-12 captured Tropical Storms Danny and Jimena .............. Japan's MTSAT-IR satellite view of the earth .. ......... . .... .. ... Carbon dioxide content in the atmosphere for the past 250 years ....... Global mean sea level as measured by satellite altimetry .............. Regional variation in mean sea level measured by satellite altimetry ..... Global temperature change over the past 150 years .................. NASA's Terra satellite shows the Himalayas in Bhutan ............... The USA at night as viewed by US military weather satellites .......... North-West Passage, summer 2008 .............................. Envisat imaging radar mosaic of the Arctic in September 2007 ......... Map of northern hemisphere permafrost ..........................
6 6 6 6 8 9 11 24 25 26 28 31 32 33 35 36 37 38 41 42 46 48 49 50 52 52 54 56 57
xu 30 31 32 33 34 35 36 37 38 39 40 41 42 43 44 45 46 47 48 49 50 51 52 53 54 55 56 57 58 59 60 61 62 63 64 65 66 67 68 69 70 71
Figures Sulfur dioxide gas concentrations released by the Kasatochi Volcano .... 59 Antarctica ................................................. 60 The Mertz glacier tongue in December 2007 ....................... 61 Collapse of the Larsen-B ice shelf in 2002 .... .. ......... . ......... 62 Lake Vostok as viewed by the imaging radar on Canada's Radarsat ..... 64 The number of sunspots outlines the II-year solar cycle .............. 67 Measurements of solar energy reaching the earth since 1978 ........... 68 Meteor Crater, Arizona ....................................... 70 Tunguska trees flattened like matchsticks ......................... 71 NASA's Landsat series ....................................... 74 Satellite sweeps out an image with its pushbroom camera ............. 75 Strong growth of satellite image sales ............................ 78 Airborne Lidar image of "ground zero" 12 days after 9/11 ............ 81 Shuttle flight 99 in February 2000 ............................... 82 Pando Province, Bolivia, and adjacent parts of Brazil and Peru ........ 83 Elevation information of South America as measured by the Shuttle Radar Topography Mission on STS-99 in February 2000 ... . ......... 85 Overview of the Digital Elevation Model derived from ASTER images ... 86 Farmland in Minnesota as viewed by Landsat-7 in true color .......... 88 Farmland in Minnesota as viewed by Landsat-7 in false color .......... 88 Farming development in the Amazon basin, Brazil, August 2005 ....... 94 Tropical forest in western Brazil in 1984 .......................... 95 The same area as that shown in Figure 50 in 2001 .................. 97 Tropical deforestation around the world .......................... 98 Reduction in Brazil's deforestation rate since 2004 .................. 98 An oil slick off the Mississippi delta in the Gulf of Mexico ............ 99 Oil trail in TerraSAR-X radar image ............................ 100 Part of the Hammersley Range in the north of Western Australia. . . . . . 103 Saw-tooth-like anticline parallel to the Persian Gulf in southwest Iran .. 104 Tehran with the Elburz Mountains to its north .. ......... . ........ 105 Ground motion in central London derived from radar images ......... 107 COSMO-SkyMed Image ....... . ......... .. ......... . ........ 108 Activations of the International Charter for Space in Major Disasters ... 114 Reasons for activation of the Charter. . . . . . . . . . . . . . . . . . . . . . . . . . . 114 SSTL CEO Sir Martin Sweeting and ESA Director Claudio Mastracci sign the Giove-A contract. . . . . . . . . . . . . . . . . . . . . . . . . . . . . . . . . . . . 116 Olivier Colai'tis and ESA Director Claudio Mastracci sign the Giove-B contract. ................................................. 117 Moore's Law .............................................. 118 TSF users lining up, Matanda Camp, Uganda, December 4th 2008 ..... 120 Before and after images of the area of the Sidoarjo mud volcano ...... 123 Area of ground water loss and gain in India 2002-2008 ............. 126 Depletion in Californian groundwater, October 2003 to March 2009 .... 127 Lake Chad in 2001 and in earlier years .......................... 128 Lake Chad monitored by Nigeriasat-l, June 2005 .... . ......... .. .. 129
Figures
72 73 74 75 76 77 78 79 80 81 82 83 84 85 86 87 88 89 90 91 92 93 94 95 96 97 98 99 100 101 102 103 104 105 106 107 108 109 110 111
112
The disappearing Aral Sea (1977-2009) .......................... Three satellites give you your position ........................... Emergency events for which Cospas-Sarsat data were used (2008) ...... Cospas-Sarsat helping emergencies on land, at sea and in the air. .. . . .. "Father of GPS" Brad Parkinson .............................. Annotated Corona images of SS-7 ICBM site at Yur'ya ............. GAMBIT KH-7 image of China's nuclear test site at Lop Nur ........ Nuclear weapon stockpiles of the super-powers .................... Distribution of the 42,500 tons of uranium mined in 2007 ............ Suspected underground uranium enrichment plant at Qom in Iran ..... North Korea's nuclear reactor complex at Yongbyon ............... Uranium fission producing waste products, neutrons and heat ........ Schematic of a gun-type atomic bomb ........................... Schematic of an implosion-type atomic bomb ..................... Headquarters of the International Atomic Energy Agency. . . . . . . . . . . . Israeli satellite image of Pakistan nuclear facility at Khushab . . . . . . . . . Images of the destruction of the Iraqi Tuwaitha Nuclear Center ... .. .. The IAEA was only inspecting part of this Iraqi nuclear site .......... An example of the highly detailed line drawings supplied by NPIC ..... Action Team inspectors examine an electromagnetic isotope separation machine . . . . . . . . . . . . . . . . . . . . . . . . . . . . . . . . . . . . . . . . . . . . . . . . . Inspectors examining uranium separation equipment that was being removed by Iraqis and spotted by satellite imagery ................. "Before and after" - destruction of a building at Al Atheer .......... North Korea's Unha-2 rocket on the launch pad at Musudan-ri ....... Aerial photo of the massive damage at Chernobyl. ................. Secretaries of Defense, State and Energy Robert Gates, Hilary Clinton and Stephen Chu and Adm. Mike Mullen ........................ NRO Director General Bruce Carlson ............. . ......... .. .. Design of a nine-segment deployable mirror . . . . . . . . . . . . . . . . . . . . . . Russian submarine base in Kamchatka on the Pacific Coast .......... Ramenskoye Flight Test Centre near Moscow . .. ......... . .... .. .. Russian naval base near Odessa, leased from Ukraine. . . . . . . . . . . . . . . Vice Adm. Robert Murrett, Director of the NGA .............. .. .. US Air Force Chief of Staff General T. Michael Moseley ............ Europe's Ariane rocket, launching France's Helios-2B spy satellite ..... Sir Stephen Dalton, Head of Britain's Royal Air Force .............. Model of Israel's TecSAR imaging radar satellite, launched in 2008 .... Indian Army Chief of Staff Gen. Deepak Kapoor .................. Japanese, US and Singapore Defense Ministers Yasukazu Hamada, Robert M. Gates and Lee Sang-Hee ............................ How image resolution translates into military information ........... Lt General Patrick O'Reilly of the US Missile Defense Agency ........ Artist's impression of the the DSP satellite ....................... Trends in deployed US and Soviet/Russian ICBMs ... . ......... .. ..
X111
129 134 138 139 141 148 149 150 151 152 153 155 155 156 158 164 169 170 173 174 175 176 181 183 186 193 195 198 198 199 201 205 208 209 210 212 213 215 219 222 224
XIV
Figures
113 114 115 116 117 118 119 120 121 122 123 124 125 126 127 128 129 130
Image taken by the first SBIRS sensor showing a satellite launch ...... Imagery from the second SBIRS sensor showing a missile launch ...... Gen. Robert Kehler, Head of USAF Space Command .............. Russia's equivalent to TDRSS: the Loutch-5a satellite ..... . .... .. .. A microwave tower and a cell phone tower ....................... GCHQ's new headquarters in Cheltenham in the west of England ..... One of the two 19 x 17-m antennas on Japan's Kiku-8 satellite ....... Artist's impression of the Terrestar-1 communications satellite ........ Predator in flight ........................................... The world's first spy satellite: the US GRAB ELINT ............... Soviet spy Christopher Boyce ................................. NSA Director Lt General Keith Alexander ....................... Canadian officials dig for Cosmos 954 debris ..................... Piece of radioactive Cosmos 954 debris found in northern Canada ..... Future Pion ocean surveillance satellite .......................... Tselina-2 ................................................. Soviet spy John Walker. ....... . ......... .. ......... . .... .. .. The four Essaim ELINT satellites being inspected before launch .......
225 226 227 229 235 236 237 238 240 241 245 247 250 251 253 253 256 258
Tables
1 2 3 4 5 6
Low-orbit weather satellites as of July 2010 ........................ 27 Geostationary weather satellites as of July 2010 ..................... 29 Essential climate variables largely dependent upon satellite observations ... 66 Status of military imaging satellites and associated data relay satellites. . . 190 Current (July 2010) high-resolution imaging radar satellites .. . ........ 216 US intelligence view of short-, medium- and long-range and submarine-based missile arsenals of emerging countries ...... . .... .. .. 221
Abbreviations and acronyms Argentine-Brazilian Agency for Accounting and Control of Nuclear Materials Active Cavity Radiometer Irradiance Monitor ACRIM ADEOS ADvanced Earth Observing Satellite Automatic Identification System AIS Aerial Imaging Team AIT Advanced Land Observation Satellite ALOS ARTEMIS Advanced Relay and TEchnology MISsion ASTER Advanced Spaceborne Thermal Emission and Reflection Radiometer Advanced Very High-Resolution Radiometer AVHRR Advanced Visible and Near Infrared Radiometer type AVNIR BATMAV Battlefield Air Targeting Micro Air Vehicle BIRA-IASB Belgisch Instituut voor Ruimte-Aeronomie - Institut d' Aeronomie Spatiale de Belgiq ue Common Agricultural Policy CAP China-Brazil Earth Resources Satellite CBERS Charged Couple Device CCD Closed Circuit Television CCTV Coordination Group for Meteorological Satellites CGMS Central Intelligence Agency CIA Collect Localization Satellites CLS Centre National d'Etudes Spatiales CNES Canadian Nuclear Safety Commission CNSC Communications intelligence COMINT Communication, Ocean and Meteorological Satellite COMS Cold Regions Hydrology High-resolution Observatory CoReH 20 Chung-Shan Institute of Science and Technology CSIST District of Colombia DC Digital Elevation Model DEM Disaster Monitoring Constellation DMC Defense Meteorological Satellites Program DMSP
ABAAC
XV111
Abbreviations and acronyms
DoD DRC DRTS DSP EGNOS ELINT Elisa ELT EMP EORSAT ERTS ESA fAPAR FBI
GAGAN GB GCHQ GDACS GEO GMT GOES GPS GRACE GRU GSFC HIRU HQ IAEA ICBM lED IGS IMS INPE INVO IPCC IRS ISRO JAXA JPSD JWST KARl KGB KH LDCM
Department of Defense Democratic Republic of the Congo Data Relay Test Satellite Defense Support Program European Geostationary Navigation Overlay System Electronic Intelligence ELectronic Intelligence SAtellite Extremely Large Telescope Electromagnetic pulse ELINT Ocean Reconnaissance Satellites Earth Resources Technology Satellite European Space Agency fraction of Absorbed Photosynthetically Active Radiation Federal Bureau of Investigation GPS Aided Geostationary Augmented Navigation Gigabyte General Communications Headquarters Global Disaster Alert and Coordination System Geostationary Earth Orbit Greenwich Mean Time Geostationary Operational Environmental Satellite Global Positioning System Gravity Recovery and Climate Experiment Glavnoye Razvedyvatel'noye Upravleniye (Soviet military intelligence agency) Goddard Spaceflight Center Hemispherical inertial reference unit Headquarters International Atomic Energy Agency Intercontinental Ballistic Missile Improvised Explosive Device Information Gathering Satellite Indian Mini-Satellite Instituto Nacional de Pesquisas Espaciais Iraq Nuclear Verification Office Inter-governmental Panel on Climate Change Indian Remote Sensing Satellite Indian Space Research Organisation Japan Aerospace Exploration Agency Joint Precision Strike Demonstration James Webb Space Telescope Korean Aerospace Research Institute Komitet gosudarstvennoy bezopasnosti (Soviet security agency) Keyhole Landsat Data Continuity Mission
Abbreviations and acronyms
LEO Lidar LIMES LUSI MIRV MODIS MSAS MSG MTCR MTSAT MUSIS NASA NASDA NASIC NATO NCDC NESDIS NGA NGDC NGEO NGO NOAA NOSS NPIC NPOESS NPT NRO NSA NSG OCHA OECD OPCW PALSAR PRISM R&D REDD+ RORSAT SALT SAM SAR satnav SBIRS SDS SIAU
XIX
Low Earth Orbit Light detection and ranging Land and Sea Monitoring for Environment and Security Lumpur (mud) Sidoarjo Multiple Independently-targetable Re-entry Vehicle Moderate Resolution Imaging Spectroradiometer Multi-functional Satellite Augmentation System Meteosat Second Generation Missile Technology Control Regime Multi-mission Transport Satellite Multinational Space-based Imaging System National Aeronautics and Space Administration National Space Development Agency of Japan National Air and Space Intelligence Center North Atlantic Treaty Organisation National Climatic Data Center National Environmental Satellite, Data, and Information Service National Geospatial-Intelligence Agency National Geophysical Data Center Next Generation Electro-Optical Non-Governmental Organization National Oceanic & Atmospheric Administration Naval Ocean Surveillance Satellite National Photographic Interpretation Center National Polar Orbiting Environmental Satellite System Nuclear Non-Proliferation Treaty National Reconnaissance Office National Security Agency Nuclear Suppliers Group Office for the Coordination of Humanitarian Affairs Organisation for Economic Cooperation and Development Organization for the Prevention of Chemical Weapons Phased Array type L-band Synthetic Aperture Radar Panchromatic Remote-sensing Instrument for Stereo Mapping Research and Development Reducing Emissions from Deforestation and forest Degradation in developing countries Radar Ocean Reconnaissance Satellites Strategic Arms Limitation Treaty Surface-to-Air Missile Synthetic Aperture Radar or Search And Rescue Satellite navigation Space-Based Infra-Red System Space Data Systems Satellite Imagery Analysis Unit
xx
Abbreviations and acronyms
SSOT SSTL TAS TDRSS TES TSF TV UCAR UHF UK UN UNHCR UNICEF UNMOVIC UNO SAT UNSC UNSCOM URENCO USA USAF VLT VoIP VP VT WAAS WHO WiFi WMD WMO
Sistema Satelital para Observacicen de la Tierra Surrey Satellite Technology Limited Thales Alenia Space Tracking and Data Relay Satellite System Technology Experiment Satellite Telecoms Sans Frontieres Television University Corporation for Atmospheric Research Ultra High Frequency United Kingdom United Nations United Nations High Commissioner for Refugees United Nations Children's Fund United Nations Monitoring, Verification and Inspection Commission UN Institute for Training and Research (UNIT AR) Operational Satellite Applications Programme UN Security Council UN Special Commission URanium ENrichment COmpany United States of America US Air Force Very Large Telescope Voice over Internet Protocol Vice-President Victoria Terminal (Mumbai) Wide Area Augmentation System W orId Health Organization A play on the term "high fidelity" involving wireless broadband Weapons of Mass Destruction W orId Meteorological Organisation
1 The threat of satellite images
SATELLITE IMAGES HIT THE HEADLINES "Google Earth helps extremists terrorise Mumbai," scream the headlines as more than 170 people are killed in November 2008. The gunmen came ashore on the evening of November 26th and made their way to targets across the south of the city of 13 million. The attackers all came from Pakistan and were unfamiliar with India's most populous city. One of the gunmen was captured alive, and police say he confirmed that Google Earth was used to familiarize the gang with the streets of Mumbai. Mumbai lawyer Amit Karkhanis filed a petition at the Mumbai High Court calling for Google Earth images of sensitive areas to be blurred so as not to aid future terror groupS.l Confirmation of the perceived threat posed by satellite images comes from reports that then US Vice-President Dick Cheney persuaded Google Earth to blur images of his home in Washington, DC. British soldiers fighting insurgents in southern Iraq are considering suing Google Earth based on evidence that the imagery was being used to target mortar attacks on the army's base near Basra. "The terrorists know exactly where we eat, sleep and go to the toilet," one soldier said. 2 The addition of the Street View feature to Google Earth has incensed privacy campaigners even more. Satellite images and maps have now been joined by highquality ground-level photos in many of the areas covered by Google Earth. Greece has banned Google from expanding the Street View service. In Japan, Google has had to reshoot its photos closer to the ground to avoid looking over fences. A formal complaint against Street View in Britain was dismissed by the UK's Information Commissioner, although he ruled that it carried a risk of invading privacy.3
2
Blakely (2008). Harding (2007). BBC (2009).
P. Norris, Watching from Space, Space, Springer Praxis Books, Watching Earth from DOI DOT 10.1007/978-1-4419-6938-5_1, 10.1007/978-1-4419-6938-5_1, © Springer Science+Business Media, LLC 2010 20 II
2
The threat of satellite images
The Obama Administration has officially confirmed that satellite images are a threat to privacy. The Bush Administration had authorized domestic security agencies to receive spy satellite imagery previously seen only by the military and the CIA. However, Obama's Homeland Security chief, Janet Napolitano, killed that plan in response to concerns from privacy groups. Californian Democratic Congresswoman Jane Harman said the previous Administration's plan "was an ill-conceived vestige of the 'dark side' counterterrorism policies of the Bush years" and "just an invitation to huge mischief'. Welcoming the decision to halt the domestic use of spy satellites, she said "it showed real leadership on the part of [Homeland Security Director] Janet Napolitano".4 It seems that satellites can spy on us from space and pose a threat to our safety and privacy. But how real is this threat? Could it be media exaggeration or political spin? Let's examine each of the stories above - Mumbai, Dick Cheney's house, the Iraq mortar threat and Janet Napolitano's action - to see how much is hype and how much is reality. First, let's understand what satellites can and can't see from space.
WHAT CAN A SATELLITE SEE FROM SPACE? Satellites fly across the sky unimpeded by borders, typically 200-800 km above the ground. With a camera onboard, they can take photographs of the ground below (if there are no clouds in the way). Many satellites carry cameras for benign reasons, such as weather forecasting or environmental monitoring, but some are explicitly seeking military information, and these we call spy satellites. If they have a suitable radio receiver, they can listen in to whatever radio signals are being transmitted below and this sort of satellite usually has a military objective. In this part of the story, the camera-carrying satellites are the main focus of the story but I will return to the radio listening satellites in Chapter 9. Modern spy satellites are like a camera-equipped cell phone - with a very long telescope attached. You take a photo of an interesting scene using the built-in camera of your cell phone. The image is stored in the computer-style memory of the phone. Then, you send it to whoever is interested in it via the cell phone network - in other words, by radio link. The number of pixels in the image taken by the phone-camera dictates its graininess or resolution, namely the ability to blow it up and see further detail. The more pixels in the camera, the more you can magnify it without it becoming grainy. On the other hand, the more pixels in an image, the fewer the images you can store in the memory and the more you pay to transmit it over the network. You can zoom in on the subject before taking the photo, in which case you will see more detail in the final image but less of the surroundings.
4
Sullivan (2009), and Hsu (2009).
What can a satellite see from space?
3
Sometimes, there is no network coverage where you have taken the picture and you have to wait until your journey brings you to an area with network coverage before you can send it. If this is a frequent occurrence, you may consider switching to another network that offers better coverage. This same outline could as easily apply to a modern spy satellite, leaving aside the fact that it takes its pictures at a distance of 200 km or more through a telescope. It takes images - automatically to a predetermined schedule rather than when a human touches a button. The heart of the camera is the same technology as in the digital camera or cell phone you buy in the high street - probably a charged couple device (CCD), which is a form of solid-state electronics similar to the transistor and the computer chip, which turns light into electrical messages. The images are stored in computer memory on the satellite, which can only hold a certain number of images before it reaches its capacity. The images may be radioed to ground immediately, but frequently there isn't a friendly ground station within sight of the satellite so it waits until its orbit brings it within the coverage of its ground network. The USA and Russia have installed extra network relay stations to improve the coverage and thus get images back to ground from more or less anywhere in the world. The relay stations are actually satellites located at suitable very high orbits that relay the images from the spy satellite to the relevant ground network. These satellites therefore have no intrinsic limitation as to the number of images they take, provided the radio link has enough capacity to carry them. Other spy satellite operators such as France, China and India have to wait until their satellites appear over their ground stations before receiving the recorded images. The atmosphere limits what spy satellites can see in several ways. Cloud cover prevented the early spy satellites from taking useful photographs much of the time. It would be the late 1980s before the first radar spy satellite was in orbit able to see through the clouds - more about this later (Chapter 8). Even when the sky is clear of clouds, the hours of darkness prevent detailed photographs being taken. Most of the Soviet Union is north of SOc latitude and much of it above 60°. The good news for American spy satellites was that the summer provided long hours of daylight, but the bad news was that winter nights were equally long. Paranoid American military analysts worried about what the Soviets might be up to during those long hours of darkness. By contrast, all of the continental USA is south of the 49th parallel, making the summer/winter contrast less extreme for Soviet spies in the sky. Even when clear and in daytime, the atmosphere is turbulent. We see this for ourselves when viewing the stars - the twinkling of starlight is due to the shimmering of the atmosphere. This atmospheric turbulence puts limits on the accuracy of spy satellites. Although accuracy figures for the latest spy satellites are secret, we can work out the accuracy achievable with the Hubble Space Telescope if it were to point at the earth, which will give us a rough idea of what is possible. Hubble was designed to have a resolution of about 15-30 millionths of a degree. 5 If the atmosphere were
Chaisson (1998) p. 29.
4
The threat of satellite images
completely still and Hubble was pointing at the earth from a typical spy satellite altitude of 2S0 km, it could resolve objects on the earth's surface of about S-IO cm (2-4 inches) in size. What do we mean by a resolution of 10 cm? It doesn't mean that two objects 10 cm apart will always be recognized as two objects and that two objects 8 cm apart will always be recognized as a single larger object. The ability to detect the small gap between two objects will depend on factors such as lighting conditions, the shapes and surfaces of the objects, shadowing in the gap, and the color and sheen contrast between the two objects and between them and the gap. It means that, in general, objects 10 cm apart will be recognized as being separate, while objects 8 cm apart will be more likely to be recognized as a single object. It also means that a gap of I cm, say, between two objects would hardly ever be detected. Telescopes can focus an image onto a film down to a limit set by the color (wavelength) of the light. The resolution of the spy satellites comes down to how sharply you can focus light onto the film and the inherent graininess of the film itself. Early spy satellites generally worked at the limit of both of those parameters - the smallest image picked up by the telescope roughly eq ual to the graininess of the film. Digital cameras and the camera in our cell or mobile phone have familiarized us with the term pixel or picture element. A camera that takes images containing S million pixels gives better pictures than one that contains 2 million pixels. If you blow up the picture, the graininess in the 2-million-pixel image becomes evident, whereas the S-million-pixel image still looks sharp. When graininess appears, you have reached the ultimate resolution of the picture - objects smaller than the graininess are blurred and can't be resolved. Even if a surveillance satellite has a resolution of, say, 10m, it may be possible to detect and interpret features smaller than that. A satellite image with 10-m resolution of a IS-m-wide road may well show the white lines along the center of the road. The white line is only S cm wide so you could argue that the image has S-cm resolution. This illustrates that the contrast in brightness between two objects (the IS-m-wide road and the S-cm-wide white line) can make an object visible even though it is much smaller than the theoretical resolution of the image. The figure of 10-m resolution in this case is presumably based on some sort of average conditions. An example of getting information that is better than the resolution in the military sphere is to work out the width of a missile to see whether it complies with a Treaty agreement. It should be possible to tell this with an accuracy as much as 10 times better than the image resolution, because the rim of the missile is made up of several pixels, giving us an averaging effect. I can speak for this personally through two commercial systems that I have been involved with in recent years.6 In the first one for a Japanese customer, our software compares features in a satellite picture of the earth with features stored in a computerized digital map. The purpose is to work out from this comparison how much the image is distorted or the satellite is mis-
6
At my employer, Logica pIc.
What can a satellite see from space?
5
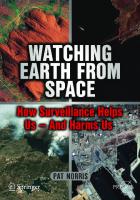
pointing. The resulting accuracy is 10 times better than the size of an individual pixel. The second system was for a European customer and achieved similar sub-pixel accuracy in monitoring the movement of clouds from one satellite image to the next - thereby measuring the speed and direction of the wind (more about this particular topic in the next chapter). So, the quality of a spy satellite image is not a simple resolution value in meters or centimeters. A sophisticated scale of quality from 0 (worst) to 9 (best) was defined by the National Reconnaissance Office in terms of the information you could obtain from the image. For example, to say that an image was level 4 meant that you could see whether the door of a missile silo was open or closed and was equivalent to a resolution of about 2 m. At level 6 or about 50-cm resolution, you could distinguish between several different types of missile. We will return to this topic in Chapter 8, in which Figure 109 outlines the military view of image resolution. During the Cold War, Robert Kohler, then at the CIA, recalls that in addition to defining what each quality level was in words, they tried to have an image that illustrated each level. It proved difficult to find an image, even a low-level airborne image, with level 9 quality - the highest possible quality level. Finally, a picture taken by an aircraft flying along the border between East and West Germany proved to have the required quality - it showed an East German soldier urinating. The image was displayed for all to see under the banner headline "German soldier pissing in the snow - level 9". 7 The four pictures in Figures 1, 2, 3 and 4 are courtesy of John Pike and his GlobalSecurity organization. s They show two newspaper front pages, a vehicle license plate and a golf ball in images of various resolutions. Figure 1, with a resolution of 10 cm, is probably the best that spy satellites can do and doesn't come close to reading the headlines or the number plate nor even detect the golf ball - no chance to use these satellites to find that golf ball in the rough, then! Figure 2 shows the quality available from some aerial imaging systems and this probably can detect the golf ball but nothing else. Figure 3, with a resolution of 1 cm, allows you to read large tabloid headlines but not the license plate or normal headlines - but, interestingly, does resolve the picture on the New York Times front page quite well. Finally, Figure 4, with I-mm resolution, which is way beyond the capability of current satellites, shows what the other images miss - the golf ball is distinguished as circular and not a small white box, the license plate is revealed and headlines, pictures and text in both newspapers are legible. The Hubble Space Telescope was developed more than 20 years ago, so we might expect current spy satellites to be somewhat better in their performance. But the fact remains that resolving from space details on the surface of the earth that are smaller than a few centimeters is almost impossible. Forget about recognizing Osama Bin Laden as he walks down the street (even if he conveniently looks up to the sky at the
7
McDonald (2002) p. 223. www.glohalsecurity.org.
6 The threat of satellite images
JFK
- .. . セ@
SHOT e;;;;;!
Figures 1, 2, 3 and 4. Simulation of images with various resolutions: 10 em (Figure I, high-quality spy-satellite image), 3 em (Figure 2, high-quality aerial photo), I em (Figure 3) and 1 mm (Figure 4). Courtesy John Pike and GlobaISecurity.org.
right moment!) or reading car license plates - or the newspaper headline. Photos that have been released show that it might occasionally be possible to identify the make and model of a car. And all of that assumes that the atmosphere is absolutely still - which it hardly ever is. The atmosphere is constantly moving due to thermal gradients within it. On a really hot day, the shimmering is visible to the naked eye, for example, above a tarmac surface or a hot sandy beach. As you look further and further through the air, the thermal shimmering accumulates, so that through a telescope or strong binoculars, the shimmer is quite apparent. Even in the cool of the night, the shimmering air causes the stars to twinkle. In astronomical photos, the atmospheric shimmer is about 1 second of arc, which, in a photo of an object 100 km distant, is about 50 cm. Thus, because of this shimmer, an astronomical telescope photographing a satellite overhead could not make out features smaller than 50 cm - and more or less the same applies in the reverse direction with a spy satellite taking photos of the ground. The technology in a modern digital camera that removes jitter or focuses on eyes can get around this air shimmer to some extent. The software in a digital camera detects each jitter event by seeing objects in the picture move and moves the camera lens in the opposite direction. Satellite cameras have always done something like this - in the one-thousandth of a second (a millisecond) needed to take an image, the satellite has moved across the ground by about 8 m.
The makings of a satellite
7
Satellite designers compensate by moving a mirror inside the camera in the opposite direction to avoid what would otherwise be a blurred image. Overcoming air shimmer takes this idea a bit further in that software in the satellite would find a suitable object in the picture - the edge of a building or a river or any sharp featureand if it moves more or less than expected, adjust the mirror movement accordingly. Astronomers on earth are using this concept to take images as sharp as those of Hubble in space, so it seems likely that military imaging satellites are doing the same from space. Legislators have tended to focus on resolution when formulating laws on satellite imaging. They have generally ignored other features of the satellites that can be just as important as resolution in allowing objects to be detected and analyzed. These other characteristics include the ability to distinguish color - or spectrum, to give it a technical name. Color in the images (as opposed to black and white) makes it possible to distinguish between crops, for example, and how healthy they are. It may also allow you to analyze the plume emitted by a rocket and thus tell what fuel it is using. The ability to analyze the brightness of an object is another important feature. An image that distinguishes subtle shades of gray will tell us much more than a simple black-and-white picture. The resolution of an image can be improved by taking two or more photos of the scene from slightly different angles. Combining the images will provide an image that has better resolution than one image on its own provided the scene hasn't changed in the meantime. A single satellite with a simple camera may take an image of the same scene for several days; thus, if a satellite or group of satellites has the ability to take a repeat image within a short time (seconds or minutes or even hours), that is important. A variation on this revisit feature is to combine two images to give a stereo view of the scene - features not evident in either image can stand out, literally as well as metaphorically, in the stereo image. These other capabilities are not covered in current legislation of surveillance by satellite, thereby weakening what legislation there is on the subject. 9
THE MAKINGS OF A SATELLITE Let's take a look at a typical imaging satellite. The artist's impression of the 4-ton JAXA (Japan's space agency) Daichi satellite launched in January 2006 (and previously called ALOS) in Figure 5 shows many features typical of all earth-observing satellites. The satellite is dominated by the elongated solar array panel on the right. The sun-facing side of this panel is covered with solar cells that convert sunlight into electricity. Daichi's solar array is 22.2 m (73 ft) long and 3.l m (10 ft) high. It is made up of nine panels that are folded concertina-fashion for the launch (on the left in Figure 6) then unfold once the satellite is in orbit. You may have seen pictures of the International Space Station,
Hanley (2000).
8
The threat of satellite images
Figure 5. Artist's impression of Japan's Daichi satellite showing the main features of a surveillance satellite. Courtesy JAXA.
which is also dominated by its several solar arrays, indicating the importance to all satellites of a sustainable source of electrical power - this allows them to stay in orbit for many years. On the left of the artist's impression (Figure 5) is another panel, which is the antenna for the imaging radar - the radar is sufficiently complex and sophisticated to be given a name of its own: PALSAR.lo It is almost 9 m (29 ft) long and 3.1 m (10 ft) high. Although the eventual information from P ALSAR is images, it is not a camera or telescope. It forms images by measuring the individual echoes of its radar transmission from each point on the ground below. Each individual echo is then considered as a pixel to form an image. The transmission and returning echo are radio signals, hence the need for an antenna. Daichi carries two other imaging instruments. The PRISMll instrument is a triple camera that can take stereo images using three telescopes that point towards the ground at slightly different angles - you can just make out two of the three telescopes in the image. One points straight down and the others point forward and backward. The three images are combined on the ground to create stereo imagery, which is helpful for analyzing ground contours. The resolution of the images is 212 m directly below the satellite but tails off as you look to either side.
10
]]
PALSAR is an acronym of Phased Array type L-band Synthetic Aperture Radar. PRISM = Panchromatic Remote-sensing Instrument for Stereo Mapping.
The makings of a satellite
Figure 6. Daichi before being launched. Courtesy JAXA.
9
10
The threat of satellite images
The final imager is called A VNIR-2, 12 which takes images in four colors, one of which is in the infrared and detects heat - this means that it can take images at night, with cold objects appearing black and warm ones bright. To take the color images, A VNIR-2 is effectively made up of four separate cameras, one for each color - the cameras all stare through the same telescope thanks to a clever arrangement of mirrors that focuses the scene onto all four cameras simultaneously. The images have a resolution of 10m. The main body of the satellite in Figure 5 is roughly a rectangular box, 6.2 x 4 x 3.5 m. It is packed full offuel tanks, electronics, batteries and the like. The fuel feeds its small rocket motors that keep it pointing in the right direction and make small changes to its orbit from time to time. The batteries are charged up when the satellite is in sunlight and are used to power the equipment on the satellite during the periods (sometimes a third of the orbit) when the sun is hidden behind the earth. The star tracker shown on the top of the main body ensures that the satellite is pointing in the right direction - it takes images of the dark sky overhead (the sky is always black in outer space) and identifies the brightest stars in its field of view so that it knows which way is up. Above the main body is a small dish antenna that communicates with a satellite in geostationary orbit (36,000 km above the earth). By having this dish, Daichi is able to immediately send its images to the ground when it is in view of the relay satellite. Without it, Daichi would have to store the images in its onboard memory and wait until a suitably equipped ground facility was in view. The geostationary satellite normally used by Daichi is Japan's Data Relay Test Satellite (DRTS, also called Kodoma), which is specially equipped to receive the transmission from satellites like Daichi. Kodoma is an experimental satellite and a replacement is not currently funded. Located over the Indian Ocean, it can pick up data when Daichi is over Asia, the Indian Ocean and the eastern Pacific Ocean. To deal with imagery of other parts of the globe or if Kodoma is not available, Daichi also has the ability to work in the conventional way - storing onboard and transmitting when a station is close. In 2010, Daichi started sending images to earth through NASA's TDRSS relay satellites (see below), thus doubling the number of images of the western hemisphere that it can provide. 13 Europe's ARTEMISI4 is similar to Kodoma and is used by other surveillance satellites such as France's SPOT satellites. Not many satellites have the ability to communicate with a geostationary satellite like this. In the past, the USA and Russia were the only countries with the technology to do it. The USA has a fleet of eight Tracking and Data Relay Satellite System (TDRSS) geostationary satellites for this purpose: TDRSS-C through -J (TDRSS-A was switched off in June 2010 after 27 years in use; TDRSS-B was destroyed in the explosion of the Space Shuttle Challenger in 1986) (see Figure 7).
12
13
14
A VNIR-2 = Advanced Visible and Near Infrared Radiometer type 2. A VNIR-l was onboard the ADEOS satellite launched in 1996. Morring (2010a). ARTEMIS = Advanced Relay and TEchnology MISsion.
The makings of a satellite
11
Figure 7. Artist's impression of four of NASA's TDRSS satellites in orbit. Each of its
big dishes can communicate with a separate satellite in orbit far below. Credit: NASA.
The TDRSS satellites act as relays for transmissions from NASA vehicles and satellites such as the Space Shuttle, the International Space Station, the Hubble Space Telescope and various earth-observing and scientific satellites. The two big dishes on TDRSS are 4.9 m (16 ft) wide and each can lock on to a separate satelliteJapan's Kodoma and Europe's ARTEMIS can only cope with one satellite at a time. The advantage of the TDRSS group of satellites is that they see a satellite in a low orbit for more than 85% of that orbit whereas each ground station would see the low-orbiting satellite for only about 10% of the orbit - so TDRSS is as good as eight or nine stations and avoids the need to find willing countries suitably located to give continuous coverage of the orbiting satellites. The disadvantage of TDRSS is that each TDRSS is pretty expensive and each satellite that uses it has to carry an antenna that can lock on to TDRSS and steer itself to stay locked on as it moves in its orbit. Furthermore, TDRSS itself needs a ground station, and a particularly complex one at that, since it is effectively dealing with dozens of different satellites around the world. The complexity of the station was brought home to NASA when an upgrade in the 1990s cost a lot more and took a lot more time than was intended. Unlike NASA, the commercial world has tended to prefer the ground station option rather than the geostationary relay option. Commercial satellites can usually afford to wait a few hours to get their images back, whereas NASA wants instant and continuous links to the Space Shuttle and the International Space Station. Commercial satellites therefore benefit from the recent advances in mass storage -
12
The threat of satellite images
consider the number of images you can now store on a tiny chip in your digital camera compared with just a few years ago. The satellites store the images until they are in sight of the station. The commercial operators also benefit from the trend to leave ground stations virtually unmanned - with maintenance staff visiting perhaps once a week and security provided by basing the station in a larger complex, such as a commercial park or a military base. Mind you, NASA's Landsat satellites have been thankful that they were equipped to send their images back through TDRSS. The two radio transmitters on Landsat 4 for sending images direct to ground both failed, leaving TDRSS as the only way to get its images back. The US military has its own relay satellites called SDS-2 and QUASAR 15 in high orbits, not all geostationary, allowing them to relay images from surveillance satellites over the poles, which would be out of view of a geostationary satellite. Some US military satellites also use TDRSS. Russia has similar relay satellites for its military surveillance satellites. This topic is discussed further in Chapter 8. Although most of the remainder if this book is about why satellites are watching the earth, I will return to how satellites work from time to time when a specific feature not described above is being discussed. You can find these sections in the index at the end of the book under "How satellites work". Let's now turn to the topics mentioned at the start of the book, beginning with the terrorist attack in Mumbai.
MUMBAI ATTACKS, NOVEMBER 2008
The 10 Pakistanis who came ashore on the evening of November 26th 2008 may never have been to Mumbai, India, before, but their trip had been prepared by others who had. One hundred and seventy-five people died in the 3 days of terror, including all but one of the terrorists. The terrorists took cabs from where they came ashore to the five target locations, thereby not requiring any great geographical knowledge. A detailed dossier of their movements and planning was compiled by the Indian Government based on information from the one captured terrorist and physical evidence such as the logs in the four GPS satellite navigation devices recovered (one on their boat), intercepted phone calls, and phones and documents found on the terrorists and in their boat. 16 The dossier was given to the Pakistani Government to persuade them to arrest several Pakistani residents identified by India as being implicated in the plot. The group left Karachi in Pakistan on November 22nd 2008, 550 km from their destination, and hove to 7 km off the coast of Mumbai about 4 p.m. on Wednesday November 26th. They waited until darkness, killed the captain of the boat (which
IS 16
SDS-2 = Space Data Systems second generation. Indian Government (2009).
Mumbai
13
they had hijacked near Pakistan) and came ashore in an inflatable dinghy at about 8:30 p.m. on the western side of Coloba Causeway close to the commercial and tourist heart of the city. They then split into five groups of two, each group taking a cab to the five target locations: the Taj Mahal Hotel, the Oberoi Trident Hotel, the Leopold Cafe, the Nariman or Chabad House Jewish outreach center and the Chatrapati Shivaji Terminus (commonly called "VT", based on its original name, Victoria Terminus). The groups appear to have staggered their departure from the landing area, since their arrival times at their targets ranged from 9:20 p.m. to 10:20 p.m. - the first attack taking place at VT, the farthest from their landing point. Except for Nariman House, which apparently was targeted because of its Israeli and/or Jewish connections, all of their destinations are well known and well signposted landmarks or tourist spots, and would have been easy to recognize. The rich extravaganza of domes, spires and arches ofVT station, for example, led railway historian Christian Wolmar to designate it "the world's most ostentatious and magnificent railway station".n The two hotels on the list were known to be frequented by local and foreign politicians and celebrities, as was the l40-year-old Leopold Cafe. Each terrorist was armed with a Kalashnikov AK-47 rifle, a hand-gun, about a dozen grenades and a small bomb (described as an Improvised Explosive Device, lED, in the Indian dossier). The death toll at each location was horrific and the list of seriously injured runs into many hundreds. IS Fifty-eight people died at VT station in a hail of indiscriminate gunfire and grenade blasts, and seven police officers and one of the terrorists were killed in the chase and confrontation that followed. The second terrorist, Ajmal Kasab,19 was captured. Ten people were killed at the Leopold Cafe from a grenade and Kalashnikov bursts - police recovered five empty or near empty AK-47 30-bullet magazines at the scene. The two terrorists then ran one block to the nearby Taj Mahal Hotel, where they joined up with another group. In a 2 Y2-day stand-off involving many hostages, gunfire, grenades and fires lit by the terrorists, 32 guests and staff plus one Army Major in the response team were killed - 20 died in the initial hail of gunfire in the entrance lobby. All four terrorists were killed. The death toll was similar at the Oberoi Trident Hotel, where the terrorists held out for nearly 2 days. Thirty-three guests and staff died at the Oberoi Trident plus both terrorists. At Nariman House, five staff and guests died plus one soldier in the response team and both terrorists. The gunmen fired at local residents and bystanders from Nariman House, leading to at least one tragic incident when an escaping Israeli guest was mistaken by neighbors as a gunman and badly beaten.2o
17 18
19
20
Wolmar (2009) p. 267 and figure. I have used the casualty figures in the Indian Government dossier. Figures in the media vary and differ slightly from those in the dossier but do not change the scale of the tragedy. The dossier gives his full name as Mohammed Ajmal Amir Kasab but media reports shorten it to Ajmal Kasab. Gee (2009) p. 28.
14
The threat of satellite images
Bombs left by the terrorists in two of the cabs went off some time later (one near the airport, the other near the port), killing the drivers and passengers in both plus a number of bystanders. Another bomb left by the Nariman House attackers exploded in a nearby petrol station. The random locations of these bombs led the detective directing operations at the police HQ, Joint Commissioner Rakesh Maria,21 to say "we felt the whole city was under siege, under attack". Newspaper reports around the time of the attack referred to Google Earth, with its satellite imagery being used by the terrorists to familiarize themselves with the streets of Mumbai. The Indian dossier makes no mention of Google Earth but does implicate two other advanced technologies. Four standard mass-market satellite-navigation devices were found by police and these would have been more useful than Google Earth in aiding the terrorists. This is the technology that guides hundreds of millions of cars, bicycles and pedestrians to destinations all over the world. Each device contains a digital road map of one or more countries, displays the location of the device using GPS satellites and issues instructions on how to reach the desired destination. Tourist hot spots like Leopold Cafe, the Taj Mahal Hotel and VT station would be explicitly marked. You don't need to recognize streets or landmarks; you just follow the instructions: "turn right", "turn left", etc. We will look at this technology in more detail in Chapter 6. The second technology is two modern forms of the telephone: the cell phone, including a relatively unusual version that uses satellites, and the internet phone. The Indian dossier states that the police intercepted calls between the terrorists and various callers. The callers used an internet phone service called VoIp22 so that the origin of the calls could not be traced. The nearest the dossier gets to identifying the location of the callers is to assert that the activation charges for the internet phone line were paid via Western Union money transfer by a Pakistani national. We will relate how VoIP is the bane of Western security services in Chapter 9. The satellite phone is a device slightly larger than a standard cell phone that communicates through the Thuraya satellite. Thuraya is a commercial service operated from Abu Dhabi in the (Arabian) Gulf available across south, east and west Asia, Africa and Europe. Although the published intercepted calls were all on normal cell phones, cryptic text messages were recovered from the Thuraya phone that had been sent to various other Thuraya phones - the dossier claims that one of these others belongs to a senior official in a Pakistani-based militant Islamic group called Lashkar-e-Taiba (Army of the Righteous), whose leader, Hafiz Saeed, had previously encouraged suicide attacks, stating that "a suicide attack is the best form of Jihad".23 The story as it has emerged suggests that Google Earth and satellite images played little or no part in the Mumbai attacks. The terrorists used other advanced technologies, including internet telephony and GPS handsets, to help achieve their objectives.
21 22 23
He has since been made chief of the Maharashtra State Anti-Terrorist Squad. VoIP = Voice over Internet Protocol. Rashid (2009) p. 228.
Vice President Cheney
15
VICE PRESIDENT CHENEY'S HOUSE, IRAQ AND THE DOMESTIC USE OF SPY SATELLITES At the start of this chapter, four high-profile stories were cited as evidence that satellite imagery was a danger to the public. The Mumbai attack was one and we have seen that satellite imagery was irrelevant to the tragic outcome of that event. Let's see whether the other three stories prove different. The second newspaper headline related to Vice-President Cheney arranging for his residence to appear as a blur in the satellite images on Google Earth. The VicePresident lives in the US Naval Observatory grounds near the up-market Embassy Row in North West Washington, DC. Google denied that it had pixellated or blurred the VP's residence and said that other online mapping services such as Yahoo and Microsoft gave the same level of detail - a view challenged by several online commentators. In any case, in the week that Vice President Biden took office, the view on Google Earth became a lot clearer. A Google spokeswoman said that the change was part of a routine and coincidental upgrade of imagery in the Washington, DC, area. She also said that "some of [our third party suppliers of overhead imagery] may blur images before they provide them to Google".24 Google says that its latest Washington, DC, imagery is supplied by GeoEye, one of the new breed of commercial high-quality satellite images (discussed further in Chapters 4 and 8). GeoEye Vice President Mark Brender denies that they are required to blur sensitive areas. 25 Imagery on Google, Microsoft or Yahoo is not current and can be months or years old. The suppliers of satellite imagery generally have a policy of delaying the provision of ultra-detailed images for at least a day - this is mandatory for US companies like GeoEye as a provision of their license to operate and voluntary for non-US companies that want to stay friendly with Uncle Sam, if they want to sell their images to the US Army, for example. A quick browse through the online imagery websites such as Google Earth shows that the White House and the VP's home are slightly blurred compared with housing 100 m away. But the Pentagon, home of the Defense Department, and the CIA headquarters, both just across the Potomac River, are clear as a bell. Even the headquarters of the super-secret National Security Agency a few miles north of the Capital Beltway in Maryland is not blurred. It is hard to see how security reasons would justify blurring the homes of the top politicians but not the country's top military and intelligence centers. So, the slight blurring of the White House and the US Naval Observatory is something of a mystery. The British Army complaint about Google Earth being used by Iraqi insurgents to target mortar attacks on their Basra base has some similarities with the Cheney story. The online images do indeed show the general layout of buildings and roads
24
25
Silva (2009). Weinberger (2008).
16
The threat of satellite images
on the base - but from some time in the past. Hundreds of local Iraqis work on the base, providing support services such as catering, cleaning and transport. Many of them have mobile phones with cameras, so any insurgency group looking for up-todate information on the base layout has only to seek the help of a few of these local support staff. It is a fact of modern military life that all activities have to be camouflaged to avoid overhead imagery, if not to fool Google Earth, then to avoid the imaging satellites of China or India or Russia or Algeria, etc. - 30 + countries operate such satellites and the list gets longer each year (more on this in Chapter 8). If the British Army has failed to observe this basic rule in Basra, it can hardly blame Google Earth. The US Navy was caught out in 2007 when a photo of a nuclear submarine appeared in a naval dockyard scene on Microsoft's Virtual Earth. The photo was taken by an aircraft rather than a satellite and showed the normally hidden propeller that helps keep the submarine silent when it's on patrol. "That propeller is a national secret" was how a military analyst described the image in Navy News magazine. 26 Images of the US military build-up for the 2003 Iraq War were readily available on the internet and gave rise to several news reports. Images on the internet are just the tip of the iceberg, since satellites belonging to governments not always friendly to the USA can take similar images at any time and place of their choosing. 27 The final news headline mentioned at the beginning of the book was that the Obama Administration has cancelled a plan to make military surveillance satellite information available to Homeland Security agencies. During the George W. Bush Administration, Arizona Governor Janet Napolitano had advocated using advanced security technology as a law-enforcement tool. She was presumably comfortable therefore with the signing into law in September 2008 by President Bush of a Bill that extended the domestic use of military satellite imagery for 6 months. The Bill was watered down by Democrats to focus only on emergency response and scientific needs. Homeland-security and law-enforcement surveillance were excluded for the moment. Now Homeland Security Director in the Obama Administration, Ms Napolitano has been subject to continued Democratic lobbying to ban the domestic use of the military imagery . The critics were concerned that the practice infringed the general principle enshrined in the Fourth Amendment of the US Constitution that guarantees "freedom from illegal search and seizure". That criticism was strengthened by a General Accounting Office report that said the Homeland Security Department "lacks controls to prevent improper use of domesticintelligence data by other agencies". Taking a different tack, Los Angeles Police Chief William Bratton,28 representing the Major Cities Chiefs Association, said that
26
27 28
Scutro (2007). Prober (2003). In the fall of 2009, Bratton retired from the LAPD and became Chairman of New Yorkbased Altegrity Risk International that is bidding to train police forces in Afghanistan and other post-conflict nations - Berfield (2010).
Privacy
17
using military satellites for domestic purposes would violate the Posse Comitatus law, which bars the use of the military for law enforcement in the USA. California Congresswoman Jane Harman, who heads a homeland-security subcommittee on intelligence, said "Having learned my lesson" with the National Security Agency's warrantless-surveillance program, "I don't want to go there again unless and until the legal framework for the entire program is entirely spelled out". Harman was referring to the use of eavesdropping satellites to intercept phone conversations without legal authorization, which had been a common practice during the Bush Administration's first term - and is described further in Chapter 9. 29 So the politicians weren't criticizing the use of spy satellite imagery within the USA per se, just the lack of practical legal safeguards about its use. For the moment, the Homeland Security Department is concentrating on building relationships with state and local officials - shown to be sorely lacking during the Hurricane Katrina crisis. Congresswoman Harman and the other privacy advocates appear to be unaware that the distinction between civil and military surveillance satellites is becoming blurred (see Chapter 8) and Chief Bratton's remark about violation of the Posse Comitatus Act may yet lead to legal action based on complaints about imagery from satellites such as GeoEye. The above examples confirm that Google Earth and its Microsoft, Yahoo and other equivalent websites make it easy to locate satellite and aerial imagery of a location of interest anywhere in the world. However, the imagery is of unknown age so you can't be sure that what it shows is still accurate. You can purchase recent satellite imagery on the internet from a number of sources and this is probably more of a threat to security than Google Earth. You can even order a new image to be taken at a certain time or as soon as possible and you will receive it within hours or perhaps a day or so of the image being taken - more expensive than purchasing an existing image but well within the financial reach of many terrorists organizations. So, just as the internet makes it easy to buy books, music and groceries, the same is true of buying satellite images of a quality that 20 years ago would have been highly classified. Donald H. Rumsfeld, Defense Secretary as the USA prepared to invade Iraq, acknowledged the problem but could only say "I wish we didn't have to live with it". 30
PRIVACY
There's a Latin phrase that enshrines a home-owner's rights to the ground below and the air above: ad coelum et ad in[eros, that is "upwards to heaven or the sky and downwards to hell or the centre of the earth". If this legal principle is valid, you own the minerals in the ground under your garden or field and you can exclude airplanes
29 30
Gorman (2008), and Gorman (2009). Umansky (2002).
18
The threat of satellite images
from flying over your house. If your rights extend all the way to "heaven", as the phrase states, then satellites need permission to overfly your house. Sadly, the ad coelum et ad in[eros phrase has little or no validity in law. In most countries, the government restricts your right to drill for oil or mine for minerals perhaps by requiring you to get a license. Likewise, governments allow airplanes to fly across the sky subject to certain regulations about noise and safety. So, it should come as no great surprise that you have little chance of legally stopping a satellite from flying above your property. However, there are some legal arguments to consider. The UN has agreed a set of principles for surveillance satellites. 31 They are not legally binding in the usual sense, but since no country has legally objected to them, they carry weight at least as a statement of common practice - or of "customary law". The UN principles say that surveillance "shall not be detrimental to the interests" of the country being observed. 32 This means presumably that they shouldn't invade your privacy or threaten your safety. It seems therefore that if you consider another country's satellite is detrimental to your interests, you could ask your government to take action against the owner of the satellite in question. This particular legal avenue appears not to have been tested yet. The courts in several countries have ruled on the admissibility of satellite images as evidence, with mixed results. The US Supreme Court ruled in 1986 against Dow Chemical in allowing the Environmental Protection Agency to use aerial photos to monitor Dow's facilities. The Court decided that aerial photography was sufficiently mundane that Dow had no reasonable expectation of privacy from it - the ruling stated that aerial photography was not intrusive if details as small as 12 inch (I 1. cm) in size could be made out under magnification. However, the Judges explicitly noted that satellite photos might be considered as "highly sophisticated and not generally available to the public" and therefore might require a warrant before being allowable in evidence. Aerial photography was perhaps considered routine in 1986 because some of the Supreme Court Justices were licensed pilots. That was a quarter of a century ago and nowadays you can order satellite photos via the web from a variety of suppliers, which would seem to make them "generally available to the public" and thus admissible as evidence without the need for a warrant. In 200 I, the US Supreme Court declared in a narrow 5:4 decision that thermal imaging of a home from outside was unconstitutional without a warrant because the technology in question is not in general public use. The Court expanded the scope beyond thermal imaging to "sense-enhancing technology". The case involved a Mr Kyllo growing marijuana in his home in Florida. Thermal imaging showed that Kyllo's garage was emitting more heat than was normal but was typical of the highintensity lamps often used when growing marijuana indoors. This was enough to get
31
32
United Nations (2000) 2-C, pp. 44--47. Principle IV.
Privacy
19
a Federal warrant to search the house, where the agents did indeed find marijuana growing. 33 These cases suggest that in the USA, satellite imagery taken in visible light may be deemed noninvasive, but that infrared imagery might be. The courts would have to decide whether infrared imagery is in general public use, such as used by weather forecasters. Until then, infrared satellite imagery is probably out of bounds as a tool for monitoring companies and individuals in the USA without a warrant. Generally speaking, satellite images alone are not enough to convince a court. First of all, as with any digital image, there is the possibility that the image has been "Photoshopped" - referring to the popular Adobe software for massaging digital photos on a computer. The same software that removes red eyes from a family photo can remove, insert or change pretty much any aspect of an image. Satellite images are usually manipulated on a computer to highlight topics or regions of interest. Figures 56, 57 and 58, appearing and discussed in Chapter 4, show some of the more complicated massaging that is done to help analysts identify what they are looking for. Judges have indeed thrown satellite images out of court because of this. The defendant in a 2001 UK court case argued that the image of his field had been misinterpreted - the prosecution said that his field contained no linseed and thus his claim for a linseed support grant was fraudulent. His defense persuaded the court that the linseed was relatively sparse and had simply been missed by the satellite imaging technique - the prosecution quickly sent a field inspection team to the farm and discovered that the farmer was correct, forcing them to drop the case. 34 If satellite images are combined with ground inspections, and if the computer massaging they received is carefully documented, courts are generally ready to convict. So, if you are growing something illegal in your backyard, better cover it up every time a surveillance satellite comes over the horizon. If there were only a few such satellites, you could use a website like www.heavens-above.com to determine when they would be flying close by. However, the large and increasing number of imaging satellites is such that this is not really a practical plan of action. The UK linseed farmer was able to argue in court against the evidence from satellites. However, a French businessman was not so lucky in 1997 when his fax messages were picked up by America's ECHELON satellite eavesdropping program - about which more in Chapter 9. As related by James Bamford in his bestselling book about ECHELON,35 the Frenchman's fax to an Iranian defense official was intercepted by Britain's GCHQ security agency and gave rise to accusations that the French company was selling missile engines to Iran. GCHQ shared the information with its American counterpart, the National Security Agency (NSA) , and the issue was rapidly escalated to the political level. America had just persuaded China to stop supplying its C-802 anti-ship missile to Iran; the intercepted fax suggested that the
33 34 3S
Petras (2005). Purdy (2006). Bamford (2001) pp. 411-422.
20
The threat of satellite images
French company would supply engines that would allow Iran to build its own antiship missiles. The intercepted fax was shared with the CIA, the Commerce Department and Customs in the USA plus similar organizations in Britain. The Frenchman's name was soon on a variety of "watch lists", although, of course, he was not aware of any of this. The USA eventually issued an official complaint to France demanding that the sale of the engines be stopped. The French company claimed that the sale was of electrical generators that could not be adapted to become engines. French export inspectors opened the crates that were waiting to be shipped to Iran and confirmed that they contained generators. The NSA reanalyzed the evidence and concluded that the fax and other intercepted communications were more ambiguous than at first sight. They admitted that the evidence did not warrant the official complaint, although it would have been a trigger for seeking additional evidence. So, where did this leave the unfairly accused French businessman? His name was now in the computers of law-enforcement organizations around the world and who knows with whom they shared this information. After NSA reconsidered its analysis and effectively cleared the Frenchman, did they share that with these other organizations? Will he be stopped the next time he enters the USA, or even arrested? How many other people are on watch lists based on ambiguous and dubious evidence from satellites? The issue is illustrated by the case of the Malaysian Ms Rahinah Ibrahim, who earned her PhD at Stanford University but has been placed on a watch list that prevents her entering the USA. Having already received $225,000 in settlement from two agencies, she is pursuing her claims against the Federal Government - from outside the country.36 There is often a tension between privacy and safety. By tracking your cell phone, the phone operator can advise your family, friends or emergency authorities where you are. Communications by satellite can extend that tracking worldwide. One manufacturer of a satellite tracker advertises "near real-time alerts to designated authorities the moment an employee or asset moves outside of their designated or planned route" and "a dedicated panic button provides fast worldwide E-911 alerting". The advertising emphasizes the ability of companies to track their employees especially in remote or high-risk areas. Steve Edgett, who runs the Britishbased EMS Global Tracking, says "there is a growing body of regulations in what is called 'corporate duty of care' for lone workers in remote places". He says that failure of an employer to provide this type of tracking may infringe the employer's duty of care and may result in higher insurance premiums.J7 The location of the person being tracked is, of course, determined by a GPS receiver in the satellite tracker, as described in Chapter 6.
36 37
McEntire (2010). Inmarsat (2010) pp. 64-65, and de Selding (2010b).
Counter-measures
21
COUNTER-MEASURES
How about spoofing the satellites? The military do this sort of thing from time to time, referring to it as "counter-measures", camouflaging missile sites or dotting cardboard tanks and aircraft around the landscape, even putting electrical heaters inside them to make them look active. 38 Or perhaps go a bit further and dazzle the satellite so that the image is over-exposed. China is said to have aimed a powerful laser at an American spy satellite a few years ago, although it is not thought to have done any damage - see Chapter 8. 39 Mirrors to reflect sunlight might achieve a similar effect on satellites taking optical images and a flat metal surface could do the same for satellites taking radar images. Such a scheme may well be legal but, of course, it would attract attention - the image will show a very bright spot even if it doesn't indicate what is causing it. The UN Principles mentioned above confirm the "freedom of exploration and use of outer space" ,40 which is usually interpreted as calling for satellites to be allowed to orbit freely. However, the phrase is sufficiently woolly to mean whatever a clever lawyer wants it to mean. It could mean that satellites in outer space must be allowed to undertake their duties freely, whatever those duties are. But, looking at the earth is hardly exploring outer space, even if it is arguably a use of outer space. Interference with surveillance satellites, even by deception, is explicitly forbidden in the arms limitation treaties signed by the USA and the Soviet Union. In the first Strategic Arms Limitation Treaty (SALT-I), each country "undertakes not to interfere with the national technical means of verification of the other Party".41 The phrase "national technical means of verification" includes spy satellites, and it was interpreted by both sides as meaning that they mustn't cover up their missile silos or submarine bays, thereby preventing the other side from counting and analyzing the missiles and submarines. One legal implication of this is that if another Treaty fails to mention deception, then the tactic is implicitly allowed.
38
39
40 41
Norris (2007) p. 107, and Wright et at. 2005. Covault (2007d). Principle IV. Article V.2 of the Treaty, available to download from several websites, such as that of the Federation of American Scientists, wwwfas.org/nuke/controlf.
2 Weather satellites
FORECASTING THE WEATHER The arrival of the telegraph in North America in the mid 1800s led to the invention of weather forecasting as we know it. Not the "red sky at night shepherd's or sailor's delight" type of forecast, but a recognition that weather conditions are transferred from one place to the next by the winds. Cleveland Abbe is usually cited as the first modern weather observer, initiating a network of weather stations linked by telegraph in 1869. The success of this initiative led to the creation of the national weather service in 1870. Run by the US Army Signal Corps, Cleveland Abbe was appointed its chief scientist. Today, satellites show us that the weather on the far side of the world affects our weather in 4 or 5 days' time. Sequences of pictures from satellites high above North America and the Atlantic Ocean show cloud formations forming in the Pacific Ocean and traveling all the way across Canada before eventually reaching Europe. This seq uence doesn't happen all of the time - that would make forecasting too easy - but it does happen sufficiently often to demonstrate the linkage in a general sense of Europe's weather today to that in the Pacific Ocean off America's West Coast several days before. This inter-continental linkage of weather systems was recognized during World War II when it was realized that the so-called "fire-balloons" landing in the USA and Canada had traveled in about 3 days all the way across the Pacific Ocean from Japan. The balloons were carried along at above 30,000 ft (9 km) by what we now call the Jet Stream. Before the age of satellites, weather bureaux collected data from weather stations and ships, buoys and balloons - the balloons carried weather instruments such as a thermometer and barometer and a radio to send the data collected as they rose through the atmosphere back to the ground. The data tended to come from wealthy nations, to be very sparse over the oceans and poor countries, and to be particularly sparse in the southern hemisphere and in both polar regions. Satellites have made the
P. Norris, Watching Earth from Space, Springer Praxis Books, DOI 10.1007/978-1-4419-6938-5_2, © Springer Science+Business Media, LLC 2010
24
Weather satellites
®ffl V.'· ,
Billion Dollar U.S. Weather Disasters 1980 - 2008
,
NOAAlNESDIS/NCDC
iセ
ヲ セLT
セ@ Q@
'1!I[I[IJ'
10 , - - - - - - - - - - - - - - - - - - , - - - - - - , 9 - - Zエ」セGヲウ@ 1 8 -------- Damage amounts normalized -E to 2007 using a Gross National 7 Product (GNP) inflation index > D Number of events per year セ@ 6 that exceed a cost of 1 billion o dollars in damages Q; 5 .0 Q)
E
:J
Z
4 ;
I
\
1 In.\
oI
セ@
セ@
175 セ@ 150 @セ 125
-
100
OJ
75
50
o
セ@
.Q
c en +-'
C :J
o
E
« Q)
25 セ@
o 80 81 8283848586878889 90 91 92939495969798990001 020304 05 06 07 08
OJ C1l
E C1l
o
Years (1980 - 2008)
Figure 8. Economic losses caused by US weather disasters. Credit: NOAAjNESDISj NCDC
location of the data more democratic - satellites don't distinguish between rich and poor countries, or between land and sea. Satellites spot the clouds - at least the tops of the clouds - and can measure sea state (the height and direction of waves), sea surface temperature, wind speed and direction, humidity and some of the chemical constituents of the air such as ozone. Some of these satellite measurements can only be made under clear skies and in daytime, but many are possible whatever the weather or the time of day. Satellites suffer from the fact that they are hundreds, or in some cases thousands, of miles above the earth. Being on the spot with your thermometer, your wind vane, your humidity reader, your barometer and so on is likely to provide more accurate measurements than those taken by a distant satellite. And satellites are expensive the costs range from tens of millions of dollars to a billion or more in the case of the most sophisticated satellites. But ships are expensive - millions of dollars - and you would need tens of thousands of them to cover all the oceans. So weather forecasters have come to realize that satellites are the cost-effective option, the way to get the best bang for your buck. As a consequence, the British Met Office says that over 70% of the data they use in their most accurate weather forecasts come from satellites - and the proportion is growing. The money is deemed well spent. Dr Jack Hayes, a top official in the US weather agency, claims that a third of the US economy is sensitive to weather and climate (see Figure 8). He goes on to list the results of bad weather, including 7,400 deaths and 600,000 injuries each year and two-thirds of air traffic delays. He reckons
Forecasting the weather Deployable Solar Shield
Thermal Control Pinwheels (15)
SLA AMSU AVHRR BDA
ESA HIRS IMP IMU MHS REA
25
Adv:amced Microwave Sounding Unit Adwnced Very Hich Re5olution Radiometer SQwn cッュセョ、@ Antenna Vhf Earth Sen50r As5emblv High Re50lution Infrared Radiation Sounder Instrument Mounting Pletfonn Inertial Measul'i!ment Unit
Microwave Humidity $en$Or Read:ion Engine Assemblv
SBUVI2 LEGEND SAD SAR SBA SBUV SLA SOA SRA UDA VRA
Sol8r Arr-r Dr"" Seorch And Re5cue S.8iitnd Antenna Solar Bad
Measured at Mauna Loa , Hawaii
--- ------- ------- ------- Mセ@ ,,
30l
------
,I
134l
360
1m
セ@
c
Q)
m
g-JOO
iセM@ ""0
380 E a. a. 370 -; o
",., Qセ@
1;00
Year
'''''
2000
j an
1960
1970
1980
1990
Apr jul
o
u
340
セ@
330
Z セ@
"0
320
.8
c
Oct jan
2000
セ@
350
310 2010
:0 u
Figure 21. Carbon dioxide content in the atmosphere for the past 250 years (left) and in more detail for the past 50 years (right).
increase in the world's temperature because carbon dioxide acts as a greenhouse gas. The phrase "greenhouse gas" is used to remind people of the way in which a greenhouse keeps warm - the idea is that the glass lets sunlight in, but lets out less of the heat that builds up inside. Similarly, carbon dioxide lets sunlight into the atmosphere but stops heat radiating back into space. The reason why a greenhouse gets warm seems to be more due to the elimination of drafts than to the sophisticated properties of glass, but, nevertheless, the phrase "greenhouse gas" has stuck as a descriptive way to explain the effects of carbon dioxide in the air. It would be nice if we could monitor which countries or regions are pumping carbon dioxide into the air. We could then fix quotas for each country or region and use fines or other inducements to ensure compliance. However, carbon dioxide is present in the air naturally and is not easily measured on a country-wide or regional scale. Scientists have had to work out how carbon dioxide and global warming affect the world, and try to monitor each of the effects - sea level rise, temperature rise, retreat of glaciers, melting of arctic ice, etc. Other chemicals resulting from human activity contribute to global warming such as methane from decay of man-made waste and from animal farming - discussed further below. Carbon dioxide was the first man-made chemical to be recognized as having major climate consequences, but global warming is affected by humans in many different ways. In order to decide what action is needed and then to check that those actions are working, we need to take good measurements of the earth's environment all the time. Each of the possible effects of global warming needs to be measured - everywhere. The scale of the task is daunting. We have to keep reminding ourselves that "nature doesn't do bail-outs" and press on with trying to monitor what is happening and then take remedial action.
Sea level
47
SEA LEVEL
Take sea level, for example. Global warming is thought to raise sea level by a few millimeters per year - 2 mm/year in the 20th century has risen to currently 3 mm/ year now. 2 But, each day, even the calmest sea rises and falls by meters because of the tides (except inland seas, such as the Mediterranean, which are less affected by tides). It is not easy to spot changes of millimeters when the effects of tides (and waves) swamp the measurement; the only way is to gather measurements over many years so that the accumulation of "a few millimeters" will become noticeable against the daily tidal ups and downs. If you measure over many years, you have to watch out that the tide gauge (as the measuring instrument is called) doesn't sink slightly as land often does on the coast - a sinking tide gauge will appear to measure a rising sea level. Land rises in some parts of the world, such as in Scandinavia and Canada, as the earth gradually recovers ("rebounds" as the scientists say) from the huge mass of glaciers that covered it during the last ice age. A rising tide gauge will appear to measure a falling sea level. Scientists estimate the amount of rise or fall of the land at each tide gauge and remove that from the sea level figures. You also have to take these measurements across the globe. Tide gauges are inevitably constrained to be on land, so sea level in vast areas of open ocean goes unmonitored. Satellites can address this issue. The idea is to have an altimeter on the satellite that measures the distance from the satellite to the ground below. If you know the trajectory of the satellite precisely, then you can work out the altitude of the ground below. The key here is that you know the satellite trajectory from Newton's laws, the same laws that allow us to predict eclipses of the sun and moon. Over Mount Everest in the Himalayas, the satellite altimeter will show that the distance to the ground is 8.8 km (29,000 ft) shorter than when over the ocean. Over the ocean, the altimeter measures the distance to the sea below which can be averaged to smooth out the effects of waves. Satellites circle the globe, so, day after day, year after year, a satellite altimeter measures how far below the satellite the sea surface is. Figure 22 shows the results from satellites developed by the USA and Europe - TOPEX/Poseidon until 2002, the Jason series thereafter. Sea level is shown as currently rising at more than 3 mm/year averaged across the globe. A global average hides a lot of regional variation. Figure 23 shows the sea level changes for the same period as Figure 22 but on a regional basis. In some areas, sea level is rising at 10 mm/year while in others it is falling at 10 mm/year. The rises outweigh the falls, thus giving the global average rise of 31. mm/year. A satellite altimeter has another big advantage over tide gauges in that just one instrument measures sea level over the whole world. It takes thousands of tide gauges to get close to this and it is difficult to ensure that all of the gauges are accurate. One of the big challenges with a satellite altimeter is to know the satellite's
2
Bindoff et al. (2007) pp. 408-419.
48
Climate change 7
ヲセ
6 5
>
3
Mtエ
2
Mtイ
1
Mᄋゥセ
:
4
セ@
Bsl f Kjャ t
エA
sャッーG
i セ SG セイBZt@
··--··.··--l------·--·.·--r.·--······.·°i···.·.·.·.···t·····--·····-r----····--··-i···--········-r---·······_·-t--,·iii iii s ヲエNZi⦅BG セ@
E セ@ Qj
G セf
Mイt
:
:
:
:
: ,r-----------r-----------'--r----------T-----------r-----------r-------:
I'
セ セ M ᄋ Z M Z M セ M セ M [I M G@
セ M
-or: :-.---_ ... _-
f
I
- 3000 l
"セ@
2500
セ@
2000
. u•
..
b
s:;
":
1500
j
o
E. : 1000
.. ... iii セ@
."
>
500
o
mongabay.com, using FAO d""a:::.t"" a _ _ _ _ _ _ _ _ _--'
Figure 52. Tropical deforestation around the world - Brazil and Indonesia together account for almost half. Credit: Rhett A. Butler/mongabay.com. 350 00 MN・Zi
⦅イNZセ@
30000 Cii
g:,
25000
Qj C>-
al
iil
20000
セ@
en セ@
15000 "0
E
.Y.
5f
10000
5000
o セ@
,,0.>
M イMNL⦅セ[t@
,,0.>
"Cl)
"Cl)
"Cl)
,,0.>
"Cl)
"Cl)
"Cl)
"Cl)
"Cl)
,,0.>
GILセ@ GILセ@ GILセ@
セ@
GILセ@ GILセ@
GILセ@
セ@
GILセ@ GILセ@
Figure 53. Reduction in Brazil's deforestation rate since 2004. Credit: Rhett A. Butler/ mongabay.com.
Other types of infringement
99
Figure 54. An oil slick off the Mississippi delta in the Gulf of Mexico. The top image taken by NASA's Aqua satellite gives an overview of the extent of the slick 9 days after the April 20th 20 I0 blowout as it approached the coast, while the lower image taken by NASA's EO-l satellite is a close-up of the edge of the slick on April 25th as the attempts to contain the oil got underway. Credit: NASA/Earth Observatory.
OTHER TYPES OF INFRINGEMENT In addition to farming and forestry discussed above, other enforcement activities in which satellite imagery is increasingly the norm include oil spills at sea and fishery conservation. In many cases, the detection is a case of watching for change to occur in an otherwise static scene. Image-analysis companies now offer a "change alert" service whereby they contact you if a change has occurred in an area you specified (you can specify what sort of change you are interested in) and send you a thumbnail version of the satellite image so that you can decide whether to buy the full image. 38
38
See, e.g. the SPOTMonitoring service at www.spotimage.com.
100
Commercial surveillance: mapping on a large scale
inidterra
Oil spill from ship east of Zhejiang province, PR China
TerraSAR-X StripMap Acq uisition Loeation 01 Scene:
.
NM
セ
.- ^Lセ L[イゥ B@
-
.
セ@ セ@
"ᄃセヲLK@ . ._.- -t'E
Satellite Information ウNセ⦅@
....
"......,
..
.......
Zセ@
,
.... _n"
:l.J_... _
ッ⦅セN@
"R:!!!
.. -,
Giogllj)/olo
e]セ@
I
UN_Tf..,I..... セ⦅NB@
セZ@
Figure 55. Oil trail clearly visible in this TerraSAR-X radar image taken on November 22nd 2008. Credit: Infoterra GmbH.
Oil spills show up in both radar and conventional images because of the smoothing effect the oil has on the sea surface. 39 Figure 54 shows two satellite views of the BP oil spill in April 2010 resulting from the explosion on the Deepwater Horizon offshore drilling rig in the Gulf of Mexico that killed 11 people and injured scores more. In the lower image, ships can be seen working at the edge of the slick and the individual waves are also visible. The upper image gives a bird's eye view of the slick as a whole and its proximity to New Orleans, LA, and Mobile, AL. In this case, the oil slick was known before the satellite images were taken. In other cases, the sequence is reversed, with a satellite, usually a radar imaging satellite, spotting the tell-tale track of an oil slick, often with a ship discernible at one end of it. An enforcement vessel can then be dispatched to intercept the culprit. An example of an oil slick detected by imaging radar is shown in Figure 55 . Radar images give considerable information about water and the things on it and under it. If the sea or lake is calm, it looks dark in a radar image. The satellite transmits its radio signal off to the side, which, if the earth's surface is bumpy, will be reflected back towards the satellite by the bumps. But if the ground is perfectly flat (as a mill pond, so to speak) and therefore lacks bumps, the radio signal is reflected
39
John Amos's website www.skytruth.org provides more information on this subject.
Other types of infringement
101
away from the satellite as if by a mirror. Thus, no signal comes back to the satellite and the resulting image is black. In flat seas, therefore, any ripples or disturbances stand out clearly in a radar image. Figure 55 illustrates this in reverse. The sea off the east coast of China is a bit choppy, but the oil being leaked by a ship calms the sea (hence the phrase "to pour oil on troubled water") and leaves a black trail in the Image. Reduced fish stocks across the globe are leading to national and international regulations to control over-fishing. The European Union requires all fishing vessels over 24 m in length to switch to electronic logbooks by the end of 2009 and those over 15 m long by June 2011 (about 10,000 vessels). They have to report their catch at least every 24 h while at sea. Among the benefits of the system is the elimination of problems with hard-to-read handwriting. An additional feature being discussed is to have satellite links that would allow regulators to capture nearly real-time information on the quantity of fish being caught by each country and help ensure stocks are harvested effectively. Rapid feedback from the authorities via a satellite link on each report would help fishermen adapt their actions to maximize their catch and still stay within the regulations, instead of having to stop at 90-95% to retain a safety margin. 4o Three-quarters of all marine fish species are at the brink of, or actually below, sustainable population levels. This situation is a horrific example of the ironic seq uence of events known as the "tragedy of the commons" in which short-term gain by the individual leads to over-exploiting a common resource to the long-term detriment of all, including themselves. Marine Conservation Professor Callum Roberts at the University of York in England argues that 10-20% of the ocean (especially feeding grounds and migration routes) should be no-take zones or marine reserves - currently, they occupy less than I % of the world's oceans. Conservation expert Tristram Stuart explains that "these reserves become spawning grounds and nurseries for stocks, thus increasing the number of fish available for fishermen to catch beyond the borders of the reserve". Monitoring whether any vessels are in a no-take zone is intrinsically easier to enforce than quota systems that are getting more and more complex. For example, in Europe, the quotas are replete with definitions of the type of allowable fishing gear, limits on discarding fish, banning of "high-grading" in which fish of a legal landing size are thrown away to make room for larger more valuable fish and so on. Electronic logbooks would facilitate a switch from quotas to no-fish zones, as would the "change alert" service mentioned above. Unlike the current complex, fraud-prone and wasteful quota-based systems in use around the world, a no-fishing zone is easily policed from space. If there's a ship in the zone, it's illegal, with perhaps special forms of identification for research vessels or scuba-diving tourists. Public awareness of discards by fishermen is high in the USA. Alaska, for example, bans it and requires "by-catch avoidance technology" - "by-catch" is
40
Inmarsat (201 0) pp. 52-55.
102
Commercial surveillance: mapping on a large scale
anything a fisherman didn't intend to catch. Despite this, according to Tristram Stuart, the Gulf of Mexico shrimp trawl fishery has about the worst discard record of any individual fishery in the world, throwing back nearly half a million tons of snappers, emperors, turtles, etc. 41 The horrendous oil spill shown in Figure 54 is interfering with the activities of these shrimp boats, but that is little consolation for the region's fish stocks, which are being poisoned by the millions of gallons of oil gushing from the leaking oil well. All ships over 300 tons are required under international regulations to carry an Automatic Identification System (AIS). This is a black box that sends out messages about the identity of the vessel, its whereabouts and its contents every 6 s. By comparing a map of all such ships with a satellite image that shows all ships in the region, illegal vessels can be spotted. These may be smuggling illegal immigrants or contraband between countries. They may be pirates off the African Coast. They may be fishing illegally. Once an unidentified vessel is spotted, surface or airborne inspection can follow. In another scenario, satellite imagery may spot a ship leaking oil (deliberately or accidentally) as it sails along. Tying an AIS identifier to the ship in the image gives the authorities what they need to pursue the culprit. Satellites can pick up the AIS signals far from land and several companies offer tracking services that rely on this. Virginia-based entrepreneur Dino Laurenzi launched two tiny satellites in 2009 dedicated to this purpose and two more of the 13-kg midgets are due to be launched in 2010. His company, SpaceQuest, is targeting not only the security services, but also commodity traders and other commercial companies. The first two satellites pick up half a million signals from 22,000 ships each day. That information is valuable to "commodity traders, who are very interested in knowing about the flow of energy around the world," says Laurenzi. Other satellite owners collecting AIS signals include London-based Inmarsat and New Jersey-based Orbcomm.42 The European Union is trialing a service to combine satellite imagery and AIS information on a routine basis. Imaging radar satellites provide imagery of the Mediterranean and other areas selected for the trials. All detected ships are then compared with the database of AIS reports and suspect vessels identified. This information is then passed to the Coast Guard and other security authorities for action. 43
MINERAL EXPLORATION
Figures 56, 57 and 58 illustrate the wealth of geological information that can be obtained from false color satellite imagery. As discussed above, many satellites
41
42 43
Stuart (2009) pp. 127-135. Brinton (2010f). Land and Sea Monitoring for Environment and Security (LIMES); see wwwfp6-limes.eu/ index.php.
Mineral exploration
103
Figure 56. Part of the Hammersley Range in the north of Western Australia, about 120 km from north to south. セI@ Fugro NPA Ltd, wwwfitgro-npa.com.
contain special cameras that photograph the scene below in several colors (or, more accurately, "spectral bands"), storing each color as a separate image. Computer manipulation on the ground is then used to combine the various colors to give a "false color" image, choosing the colors to highlight features of interest. In the previous section, we showed false color images tailored to show information relevant to farming and forestry. Other spectral combinations show up geological features. Figure 56 uses green coloring to highlight the iron-rich rocks in the Hammersley Range in Western Australia. Iron is widely mined in this region, mostly in open pits; one mine is evident in the lower right of the image as a red stain on the lower right of the green circular feature. Hematite is the principal iron mineral seen in banded iron formations of the heavily eroded Precambrian-age mountains. Figure 57 shows the intricate saw-tooth geology in an area formed by the collision of the Arabian tectonic plate on the left with the Eurasian plate. The area is in the southwest of Iran on the Persian Gulf. Just visible in the right of the image are the Zagros Mountains, which extend far to the north and east. The area near the coast contains major natural gas fields. Until satellite imagery became available, it was difficult to appreciate the large-scale nature of these geological features. Large-scale geological maps showing the fault and slip structure of a region can be drawn up from images such as this. In some inaccessible parts of the globe, this is virtually impossible to perform any other way - inaccessible because the conditions are extreme, such as in polar regions, or the politics are unfriendly, or the danger of personal injury or death is too high (in a failed state, for example). In such cases, the satellite images enable the planning to be performed before having to commit
104
Commercial surveillance: mapping on a large scale
Figure 57. Saw-tooth-like anticline (left) parallel to the Persian Gulf in southwest Iran with the river Mand in the lower right (about 70 km from north to south). Fugro NPA Ltd, wwwfilgro-npa.com.
Mineral exploration
105
Figure 58. Tehran, in the lower left of this false-color image, with the Elburz Mountains to its north (about 120 km from north to south). セI@ Fugro NPA Ltd, wwwfugro-npa.com.
personnel to on-site activities such as seismic surveys, test drilling or in-field sampling, and thus minimize the time spent actually in the region. The capital of Iran, Tehran, is about 800 km north of the previous image and Figure 58 shows how it is hemmed in to the north by the Elburz Mountains. Chromium is one of the minerals mined in the area. The peak of Mount Damavand
106
Commercial surveillance: mapping on a large scale
can just be seen on the center-right edge of the image - the highest peak in the Middle East and the highest volcano in Asia, at 5,610 m (18,406 ft). As we have already seen, satellite images, especially radar images, to be discussed below, are used to detect oil spillage at sea - both wide-area oil spills, such as following a tanker collision or sinking, and smaller-scale events, such as when a ship cleans out its tanks. One man's pollution is another man's gold dust and, in this case, satellite images of oil seepage at sea are of interest to oil exploration companies. Undersea oil reserves are frequently detected by virtue of the oil seeping through to the sea floor and thence to the surface.
CONSTRUCTION Major construction projects nowadays involve computer-based mapping of the environment, for which one of the sources of information is satellite imagery. Whether the project is a power station, a bridge, a road, an oil refinery, a factory, a retail complex, a transport hub or a residential complex, detailed mapping is required not only for the architectural and construction teams, but also for such things as environmental impact analysis, insurance analysis (floods, earthquakes, subsidence, etc.) and the financial risk analysis. The Chinese authorities, for example, used regular satellite images of the Beijing Olympic complex to provide clear and objective evidence to the International Olympic Committee that progress on the construction of the 2008 Olympic facilities was on schedule. Satellite images come into their own where the terrain is inaccessible, inhospitable, poorly mapped or stretches over large distances. Building an oil pipeline in West Asia would be an example of this. The pipeline is likely to cross one or more earthquake-prone areas and may well span a mountain range or two as well as crossing national borders and perhaps areas of civil unrest. Both large-scale and detailed local maps will be required to plan the route and in poorly mapped areas, that is likely to involve satellite imagery and probably satellite-derived elevation information as discussed earlier in this chapter. Even in well mapped cities, satellites can shed light on risks such as subsidence. Figure 59 shows the change in ground level in central London over an 8-year period as measured by imaging radar satellites. Two lines of previously unappreciated subsidence are shown in red. The first, in the upper half of the image, has occurred where a new underground train (Tube) line was being built - the $5 billion Jubilee Line extensionwith the subsidence running from Pall Mall on the west of the Thames to London Bridge. The second, between Battersea Park and Clapham on the lower left edge of the image, is not as clearly associated with a single major construction project.
RECENT NEW FORMS OF SATELLITE IMAGING In Chapter 8, imaging radar, hyper-spectral imaging and other advanced and even
Recent new forms of satellite imaging
107
Figure 59. Ground motion in central London is shown in this map derived from radar images taken by the ERS and Envisat satellites between 1992 and 2000; red indicates subsidence, green stability and blue uplift. Hyde Park (leftmost) and Green ParkjSt James's Park are visible as gray areas to the left of the Thames, which winds from bottom left to upper right; Battersea Park is just below the Thames and Clapham Common is at the lower edge of the image. HェZセ@ Fugro NPA Ltd, wwwjitgra-npa.com.
speculative forms of satellite imagery will be discussed. Many of these forms of imaging are of interest in the commercial world, although it has to be said that the military remain the most enthusiastic customers for the moment. The earliest imaging satellites (all military) found that 50% of the images they took were cloud-covered. The best that could be done to improve the ratio of cloudfree to cloudy images was to use weather satellites to try to warn the imaging satellite when the area of interest was cloudy - and if it stayed cloudy for a long time, there was nothing you could do. Another problem for the first imaging satellites was that they only obtained good images when the sun was shining - they didn't work in the dark. Taking images in the infrared gives some degree of nighttime imaging but with much less contrast and
108
Commercial surveillance: mapping on a large scale
Figure 60. COSMO-SkyMed Image.
ASI (2009). All rights reserved.
somewhat lower resolution. Satellites continue to take infrared images at night, but they are not an alternative to conventional optical imaging, but more a complement to provide information on specific features such as heat emission. And infrared doesn't see through clouds, so you still have that problem. The answer was recognized to be imaging radar, in which the satellite transmits a radio signal and detects the echo from each point below, thereby building up an image. A lot of processing is required to separate out the individual echoes and it wasn't until the 1970s that it became technically feasible and just about affordable to build a satellite with the necessary power and sophistication. The high price of the
Recent new forms of satellite imaging
109
technology meant that military and scientific users were the only communities willing to finance these satellites until the end of the 20th century. Now, in the first decade of the new century, the improvement in electronics has dropped the price of imaging radar satellites to the point at which commercial companies have been persuaded to build and launch them. Table 5 in Chapter 8 (military) lists the main examples of these satellites. A radar image of farmland shows up individual fields (see Figure 60) and, over time, changes in the field can be seen. However, a lot of research is still needed to reach the point at which radar images give us as much information as optical images, especially the multi-spectral and hyper-spectral ones. The US military has more experience of radar imaging from space that anyone else, so other characteristics of radar images are covered in the discussion on military surveillance in Chapter 8.
5 Society and survival To fully appreciate the contribution of satellites, we must look beyond commerce and defense. A comprehensive treatment of this subject could fill a volume, for example to describe the scientific research being undertaken using satellites attempting to measure the changing earth in new ways and in more detail. In this chapter, we look at two important ways in which surveillance satellites save lives helping to deal with natural disasters and to conserve fresh water. As in other roles for satellites, the key is their ability to span continents, to provide objective information and to be independent of ground facilities such as electricity grids and telephone networks.
NATURAL DISASTERS The horror of the tidal wave that engulfed Indian Ocean coasts on December 26th 2004 is hard to forget. Television showed pictures taken on personal camcorders that emphasized the stark contrast between the idyllic vacation setting of the tropical beaches and the inexorable wall of water that swept all before it. Coming the day after Christmas Day heightened the shock. The waters swept away roads, telegraph poles and mobile phone masts as well as homes, shops, schools, hospitals, farms, fields, cars and, of course, people. The death toll was in the region of 200,000 people, especially in the Indonesian province closest to the source of the tidal wave, but also in Thailand, Sri Lanka and other Indian Ocean states. It was difficult for relief agencies to know where to begin - all communications with the area were down, except by satellite phone, and maps of the area were no longer much use, given the scale of the devastation. Satellite pictures provided the first evidence of the breadth of the disaster and indicated where roads still existed. The first publicly available satellite images came from a group of satellites called the Disaster Monitoring Constellation (DMC). These five satellites were the brainchild of an energetic and brilliant British professor, Sir Martin Sweeting (he was knighted by the Queen in 2002 for his endeavors). In the 1980s, in parallel with
P. Norris, Watching from Space, Space, Springer Praxis Books, Watching Earth from DOI DOT 10.1007/978-1-4419-6938-5_5, 10.1007/978-1-4419-6938-5_5, © Springer Science+Business Media, LLC 2010 20 II
112
Society and survival
his duties as an engineering lecturer at the University of Surrey near London, Sir Martin began to design and build small satellites, weighing typically 50-70 kg (100150 lbs). The satellites were initially to demonstrate engineering technology and were sufficiently small and light to be carried into orbit in the spare space beside a big conventional satellite. Such "piggy-back" launches had the advantage of being relatively cheap, sometimes even free. Sir Martin expanded the scope of the small satellite business by helping universities and institutes in developing countries to build their own satellites. The engineers would come from their home country and work alongside Sir Martin's team in Surrey to help build their satellite, then return to Nigeria, Algeria, Pakistan or wherever having acquired skills and experience for the future. Over the years, as technology improved, the small satellites produced by Surrey Satellite Technology Limited (universally referred to as Surrey Satellite) became capable of performing useful functions. By the mid 1990s, having launched a dozen or so satellites already, Sir Martin realized that a small satellite could now carry a camera and telescope that would have sufficient power to provide useful pictures. He recognized that he couldn't compete with the very detailed pictures taken by the established commercial and government earth observation satellites, so he decided to address the problem of getting pictures rapidly. Geostationary satellites can take pictures continuously but as noted in Chapter 3, these satellites are so far from earth (36,000 km) that they provide very little detail. Commercial earth observation satellites are in orbit a few hundred miles high in order to get detailed images, but that means that they move rapidly across the sky, returning to the same part of the globe days or even weeks later. Sir Martin reasoned that by placing several satellites in orbit each with a wide field of view, he could guarantee to get an image of anywhere in the world within 24 h. He realized that this relatively rapid response imaging would be especially useful in the aftermath of natural disasters, so he called the concept the Disaster Monitoring Constellation (DMC). He drummed up support for the idea in a few of the countries with which Surrey Satellite had developed ties and began to manufacture the first satellite. With other earth observation satellites, it takes 3-5 days to get imagery of a new disaster area, so the I-day response time of DMC is an important improvement. Although its headline objective is to support the logistics of disaster relief, DMC's "day job" is to provide independent daily imaging capability to the partner nations Algeria, China, Nigeria, Spain, Turkey and the UK. Each country operates its own satellite and collaborates with the others through a UK-based coordination organization called DMCii. The satellites can take pictures that are 650 km wide and thus cover vast areas quickly. Each country has agreed to make up to 5% of the imagery available for disaster relief, although, thankfully, that limit has never been reached. When a disaster strikes, the main challenge is not the 5% limit, but whether the satellites are already scheduled to take images of other parts of the world. In principle, each satellite could take pictures continuously, since sunlight provides the electricity needed to keep going. The images have to be sent to the ground, of course, and there are only a few stations on the ground that can receive the images. The answer is to store the images in the satellite's memory until it passes over a station,
Natural disasters
113
so, in practice, the limit is the size of the satellite's memory. Once on the ground, the images are channeled to aid agencies initially through Reuters AlertNet. Reuters AlertNet is a free service run by the Thomson Reuters Foundation - a charity set up in 1982 by the Reuters news agency. AlertNet is dedicated to providing information to humanitarian organizations and the public about disasters. The service was started after the Rwanda crisis in 1994 when poor coordination between aid agencies was recognized as a barrier to providing aid. As well as benefitting from AlertNet, the DMC Consortium is also an active participant in another free service aimed at helping the response to disasters - the International Charter for Space in Major Disasters. The UN triggered the creation of this Charter by organizing the UNISPACE-III conference in 1999, with the ambitious aim of "creating a blueprint for the peaceful uses of outer space in the 21st century". Following the conference, held in Vienna (Austria), the European and French space agencies (ESA and CNES) made a commitment to set up and manage the proposed International Charter for "Space and Major Disasters".1 Since then, 10 other countries have joined (in order of signing): Canada, India and USA, Argentina, Japan, UK,* Algeria,* Nigeria* and Turkey,* and China. The US membership covers the Weather Agency (NOAA) and the US Geological Survey, which, in turn, brings in two US commercial satellite organizations, Digital Globe and GeoEye. Each member agency has committed resources to support the provisions of the Charter. A Charter member can call a single number to req uest the mobilization of the space and associated ground resources of the member agencies to obtain data and information on a disaster occurrence. An Emergency On-Call Officer analyzes the request and the scope of the disaster with the member and prepares an archive and acquisition plan using available space resources. The Charter was invoked on December 26th 2004, after the tsunami in south Asia. It covered three disaster-stricken zones along the coasts of southern India, Sri Lanka and Indonesia-Thailand. Member agencies contributed an estimated 200 satellite images, providing essential information about areas in which surface access was impossible or difficult. Images were used as base maps for assessing damage to infrastructure and coastal habitations, for measuring the extent of sea surge and for identifying the areas where emergency aid was most needed. UK Minister for Science and Innovation Ian Pearson said "By working together, the Charter's international partners are helping to save lives across the globe". His successor as Minister, Paul Drayson, called it a "unique international partnership whereby the saving of lives takes priority over politics, and country borders become meaningless in the face of disaster". The Charter has been activated over 200 times since it became operational in 2002 and is currently called upon about three times a month (see Figure 61).
See that organisation's website at www.disasterscharter.org.
*
Through the Disaster Monitoring Constellation CDMC) organization.
114
Society and survival
50 ,-------------------------------------------------------
45
+-----------------------------------------------------
40 +----------------------------------35
+---------------------------------
30
+-----------------------------------
25 +---------------------20 +---------------
15 +--------------
10 5
o 2002
2003
2004
2005
2006
2007
2008
2009
Figure 61. Annual activations of the International Charter for Space in Major Disasters.
tropical
earthquakes 12%
13%
volcanoes 6%
Figure 62. Reasons for activation of the Charter.
As shown in Figure 62, floods are the most frequent reason for which a member calls on the Charter. No doubt, this reflects the fact that floods can occur anywhere in the world and at any time, whereas earthquakes, for example, are infrequent and restricted to the earth's tectonically active zones. What Figure 62 fails to show is the relative severity of the individual disasters, so the relatively small number of earthquake incidents may well equal or exceed flooding as a cause of human misery and death. The 11 % lumped into the "Other" category in Figure 62 includes tsunamis, landslides and accidents. Accidents that resulted in Charter activation included a shipping collision in the English Channel (February 2006), 100 ships caught in ice off Newfoundland (April 2007) and a massive explosion on a train in North Korea (April 2004).
Natural disasters
115
Sir Martin and Surrey Satellite's success was not a foregone conclusion. When Queen Elizabeth II formally opened the new Surrey Satellite facilities in 1998, she remarked to Britain's Science Minister who was accompanying her that she hoped the government was helping Sir Martin in his endeavors. The irony was that the British Government had done nothing to help Surrey Satellite up to that point. Britain had invested large sums of money in earth observation satellites primarily through the European Space Agency (ESA), but these investments had focused more on radar imaging that was of interest to the military and involved large, heavy and expensive satellites - the Envisat satellite that carried an imaging radar developed in Britain cost over $1 billion, while one of Sir Martin's satellites cost less than 1% of that. Perhaps stung by the Queen's throw-away remark, the British Government now directed some funding Sir Martin's way. Following the launch of their 17th and 18th satellites, one of which was a miniature demonstrator of the DMC concept, SSTL received a total of $15 million from the UK Government in 2000 to begin three satellite programs. One of the three was the British satellite in the proposed DMC constellation. This commitment of about $7 million by the British Government to DMC was relatively small compared to Britain's ESA initiatives, but was enough to persuade the DMC international partners to join. Algeria, Turkey, Nigeria and China each signed up for SSTL to build them a DMC satellite. Another reason for Sir Martin's successful track record was that SSTL could build satellites not only cheaply and reliably, but quickly. Thus, it was less than 2 years later that the first DMC satellite was launched in 2002 for Algeria. The secret of SSTL's technical and engineering success is to use commercial electronic components wherever possible. This contrasts with the approach demanded by NASA, Department of Defense, ESA and other government agencies for specially developed "space-qualified" components to be used. The idea of "space-qualified" is that radiation from the sun is intense outside the earth's atmosphere and will destroy ordinary electronics. The vacuum of outer space also causes failure in many everyday components and mechanisms, so, again, NASA and other agencies require specially developed items to be used. What Sir Martin realized is that this is not a black-andwhite situation - not all everyday components will fail, so by testing them, you can select those that will best resist radiation. Furthermore, Sir Martin's satellites all orbited below 1,000-km altitude and it is above that altitude that the radiation starts to get really intense - the Van Allen radiation belts discovered by America's Explorer-l satellite in 1958. 2 Space-qualified electronic components are not only expensive (perhaps 100 times the price of commercial equivalents), but also are inevitably older and thus less powerful - it takes a few years to develop radiationresistant versions of commercial components and in that time, faster and cheaper commercial ones will have appeared on the market.
2
Instruments on the earlier Soviet Sputnik satellites had given a continuous maximum reading that the Soviets interpreted as a failure of the instruments, whereas Van Allen realised that what his instruments measured on Explorer-l was a true radiation reading.
116
Society and survival
Figure 63. SSTL CEO Sir Martin Sweeting (right) and ESA Director Claudio Mastracci
sign the Giove-A contract (with ESA officials in the background), II th July 2003. Credit: ESA.
SSTL's ability to build fast, reliably and cheaply was demonstrated in a head-tohead race against the big two European satellite companies in 2003-2005. The European Space Agency purchased two prototype navigation satellites, Giove-A and Giove-B (Figures 63 and 64), as the beginning of Europe's version of the American military GPS system. Giove-A was built by SSTL for $34 million, was ready on schedule 30 months later and duly launched in December 2005. Giove-B was built by a consortium of Astrium and Thales Alenia Space, the two giants of the European space industry, for about $120 million but wasn't delivered until 2008, more than 2 years late. SSTL's Giove-A was guaranteed to only last for 2 Y4 years, but at the time of writing (2010) was still going strong. The much more expensive Giove-B is also working well, although it failed a few times in the first year of life. Both satellites have pretty much the same capability - Giove-B is more powerful in some respects, Giove-A in others. SSTL's successful delivery of the sophisticated Giove-A confirmed beyond any doubt its credentials as a mainstream satellite builder. Sir Martin's DMC has been a success because by the start of the 21st century, commercial electronics were so powerful that a small satellite could achieve what would have required a giant satellite 10 or 15 years earlier. We see this improvement in electronics in our daily lives with the ever improving features in cameras, cell phones, television, laptop computers and the various hand-held devices for entertainment and information that didn't even exist 10 years ago. All of these products benefit from what is generally known as "Moore's Law" (Figure 65). This
Natural disasters
117
Figure 64. Olivier Colai"tis, representing the Astrium and Thales Alenia Space consortium (left), and a slightly apprehensive-looking ESA Director Claudio Mastracci sign the Giove-B contract (with ESA official Joachim Schaper in the background), 11th July 2003. Credit: ESA.
"Law" is named after one of the founders of the Intel Corporation, Graham Moore, who said in 1965 that electronic devices would double in performance every 2 years or SO.3 That doubling continues today, despite many forecasts that it must stop. The "Law" applies not only to the speed of computers, but also to the size of memory and the number of pixels in a digital camera. All three (computer power, memory size and number of pixels) help small satellites do what could only previously be done by large ones. Moore's Law allows engineers either to do more with the same size or do the same in a smaller size. The military tend to follow the first path - figure out the maximumsized satellite they can get into orbit then get the best possible pictures from that machine. Commercial satellite companies tend to have smaller budgets than the military and thus aim to use smaller size to reduce costs. Cell phones, digital cameras and other domestic products tend to be a bit of both - using more powerful electronics but reducing size a bit, too. Satellite images are not much use on their own. What aid workers need are up-todate maps and satellite images can be used to produce such maps. The maps will show roads, names of towns and villages, built-up areas, rivers and lakes, railway
More precisely, the number of transistors on a computer chip will double.
118
Society and survival 2.000.000.000 1.000,000,000 セ@
GcR ""I'U'fI2' •
G\ャ|セaッ@ IUInwft セ@ -.1\ (f.t1 wcf'le •
Cor9to-,
""'..... a
C ::l
0
Po&,. '
, . "en-lli
Curve SIlOW$ 'Moore s lavl
10,000,000
, ' , ' N セ@
transistor count doulJllll9 8'IOry two yoars
()
.... 0
,,
C/)
'in
c(\1
GIO .. _ RVT1O ., ,
セ@ .... "'0
,,1EW'o..o
--
LG L セ@
100.000,000
-
• CNad COlo tM1vm TIJt...
- ()JIW
,
.
" セGB@
_ Pili
e M,
M セ G@
1.000,000
,,
f!::
..
lit , "
"
100,000
,
. IOM 10,000
.
,
, . toIn
2,300
M
セNM
1971
M
1980
1990
2000
2008
Date of introduction Figure 65. Moore's Law: inexorable improvement in performance of digital electronics.
lines and so on. The satellite images can be used to spot flooding, washed out roads, new housing or encampments. One straightforward way to do all this is to compare a satellite image from before the disaster with one from after. Changes between the two images indicate what needs to be changed on a map. The UN has set up a unit to undertake just this disaster mapping function - the UNO SAT group based in Geneva, Switzerland. They respond to requests from other UN Agencies such as the UNHCR refugee and OCHA humanitarian agencies and have done so more than 100 times in the first 4 years since it began offering its "humanitarian rapid mapping service" in 2003. While UNOSA T is a service for UN agencies, GDACS is a related UN service for any organization or person. The GDACS website (www.gdacs.orgl) provides information on disasters around the world often within minutes of them occurring. Taking information from national and international agencies that monitor storms, earthquakes and volcanoes, GDACS is a "one-stop shop" for anyone interested in being alerted when a disaster occurs - you can sign up for an email or text message notification when a disaster occurs of the type you have expressed an interest in.
Natural disasters
119
UN-sponsored initiatives such as the International Charter and UNO SAT are aimed at the formally organized relief agencies. Countries, regions, communities or individuals affected by a disaster may find it more difficult to get up-to-the-minute information. The media have a legitimate need to get reliable and current information, as do individuals in countries not directly affected who may have relatives or interests in the affected area. The UN-sponsored agencies understandably resist getting drawn into providing information for anyone and everyone. They know that when a disaster happens, it will take all their available resources just to deal with those directly affected, so they are reluctant to divert people or resources for any other purpose. Europe's Respond program attempts to fill the gap. Although only funded for a 5-year period initially, Respond makes maps of disaster areas updated with satellite imagery available via the web. 4 Almost exactly a year after the tsunami disaster, the DMC and Respond organizations were called upon again to help out. Yet another New Year was spent working 15-hour days as the teams provided rapid response images and maps for agencies attempting to help the victims of a major earthquake in northern Pakistan. It's one thing to get images and maps immediately after a disaster; the next challenge is to get the information to the people who need it - usually in the field. Emergency agencies rely heavily on communications satellites for this. Typically, their work is in an area without modern infrastructure or where that infrastructure has been damaged. In those circumstances, satellites are the communications bearer of choice. In fact, a specialist aid agency has been created to provide communications satellite services to crisis areas. Telecoms Sans Frontieres (TSF), like its more famous near namesake Medecins Sans Frontieres, is based in France. Founded in 1998, it has helped survivors and agencies in more than 60 countries. In 2006, the UN signed its first ever worldwide agreement with a non-governmental organization (NGO) - a "First Responder" agreement with TSF. "There is an urgent need for food, water, shelter, protection and medical help in emergencies," said Ann M. Veneman, Executive Director of UNICEF. "None of these things are possible without quick and reliable communications. Rapid communications saves lives." The founders of TSF Jean-Fran