Visualising with VTK.A tutorial
261 80 137KB
English Pages 8
Recommend Papers


File loading please wait...
Citation preview
Tutorial
Visualizing with VTK: A Tutorial I
n this tutorial we introduce basic concepts behind the Visualization Toolkit (VTK). An overview of the system, plus some detailed examples, will assist you in learning this system. The tutorial targets researchers of any discipline who have 2D or 3D data and want more control over the visualization process than a turn-key system can provide. It also assists developers who would like to incorporate VTK into an application as a visualization or data processing engine. Although this tutorial can only provide an introduction to this extensive toolkit, we’ve provided references to additional material.
What is VTK? VTK1 is an open-source (see the sidebar “Open Source Breakout”), portable (WinTel/Unix), object-oriented software system for 3D computer graphics, visualization, and image processing. Implemented in C++, VTK also supports Tcl, Python, and Java language bindings, permitting complex applications, rapid application prototyping, and simple scripts. Although VTK doesn’t provide any user interface components, it can be integrated with existing widget sets such as Tk or X/Motif. VTK provides a variety of data representations including unorganized point sets, polygonal data, images, volumes, and structured, rectilinear, and unstructured grids. VTK comes with readers/importers and writers/exporters to exchange data with other applications. Hundreds of data processing filters are available to operate on these data, ranging from image convolution to Delaunay triangulation. VTK’s rendering model supports 2D, polygonal, volumetric, and texture-based approaches that can be used in any combination. VTK is one of several visualization systems available today. AVS2 was one of the first commercial systems available. IBM’s Data Explorer (DX),3 originally a commercial product, is now open source and known as OpenDX. NAG Explorer4 and Template Graphics Amira (see http://www.tgs.com/Amira/index.html) are other well-known commercial systems. VTK is a general-purpose system used in a variety of applications, as seen in Figure 1. Because VTK is open source, faculty at many universities—including Rens-
20
September/October 2000
William J. Schroeder, Lisa S. Avila, and William Hoffman Kitware
selaer Polytechnic Institute, State University of New York at Stony Brook, the Ohio State University, Stanford, and Brigham and Women’s Hospital use VTK to teach courses and as a research tool. National labs such as Los Alamos are adapting VTK to large-scale parallel processing. Commercial firms are building proprietary applications on top of the open-source foundation, including medical visualization, volume visualization, oil exploration, acoustics, fluid mechanics, finite element analysis, and surface reconstruction from laser-digitized, unorganized point-clouds. VTK began in December 1993 as companion software to the text The Visualization Toolkit: An Object-Oriented Approach to 3D Graphics by Will Schroeder, Ken Martin, and Bill Lorensen (Prentice Hall). In 1998 the second edition of the text appeared, with additional authors Lisa Avila, Rick Avila, and Charles Law. Since that time a sizable community has grown up around the software, including dozens of others as developers, often submitting bug fixes or full-blown class implementations. These community efforts have helped the software evolve. For example, David Gobbi in the Imaging Research Laboratories at the John P. Robarts Research Institute, University of Western Ontario, has reworked VTK’s transformation classes and is now an active developer.
Architecture VTK consists of two major pieces: a compiled core (implemented in C++) and an automatically generated interpreted layer. The interpreted layer currently supports Tcl, Java, and Python.
C++ core Data structures, algorithms, and time-critical system functions are implemented in the C++ core. Common design patterns such as object factories and virtual functions insure portability and extensibility. Since VTK is independent of any graphical user interface (GUI), it doesn’t depend on the windowing system. Hooks into the window ID and event loop let developers plug VTK into their own applications. An abstract graphics model (described in the next section) achieves graphics portability.
0272-1716/00/$10.00 © 2000 IEEE
Open Source Breakout
1 VTK can be used in diverse areas including medical visualization (left) and industrial inspection applications (right). Interpreted layer While the compiled core provides speed and efficiency, the interpreted layer offers flexibility and extensibility. For example, using GUI prototyping tools such as Tcl/Tk, Python/Tk, or Java AWT permits building professional applications rapidly. These popular programming languages come with other packages such as Python’s numerical library NumPy. We used Tcl in the examples in this article. You can type in the example code included here and immediately see the results. Follow the instructions found at http://www. visualizationtoolkit.org/CGA/Instructions.htm to install VTK and start a Tcl shell with VTK support.
The graphics model VTK has two major subsystems—the graphics model and visualization pipeline. The graphics model forms an abstract layer above the graphics language (for example, OpenGL) to insure cross-platform portability. When the development of VTK began in 1993, each computer platform had its own graphics language—XGL for Sun, Starbase for Hewlett-Packard, and gl for Silicon Graphics. Abstracting graphics concepts into a platform and deviceindependent layer created the graphics model. Since that time the industry has standardized on OpenGL. Although this is now the only low-level graphics language supported in VTK, the abstract layer has not been abandoned. In the future, new graphics languages are likely to become popular and even replace OpenGL as a standard. Keeping this abstract layer lets us update VTK with new technology without affecting backwards compatibility. We adapted the names of the classes in the graphics model from the movie-making industry. Lights, cameras, actors, and props are classes that the user instan-
A model of software development called open source is gaining acceptance in the software world. Although the exact definition of open source remains debatable, the basic premise is that the source code is freely available to anyone who wants it. This differs greatly from commercial software, freeware, and shareware, all of which are normally distributed in a binary format only. The availability of source code to a wide audience creates many opportunities and advantages in the software development process. Recently, several high-profile projects have brought this model to the attention of the media and general public. Those projects include the Linux operating system, the Apache Web server (running 50 percent of the World Wide Web), and sendmail (the backbone for much of the e-mail sent today). Although people have shared source code since the beginning of computers, new business models, software development tools, and the Internet have allowed the practice to expand greatly in the past five years. Open-source software has many benefits. Eric Raymond in The Cathedral and the Bazaar: Musings on Linux and Open Source by an Accidental Revolutionary (O’Reilly Publishers) argues that opensource software development (the bazaar model) is inherently more scalable than closed-team development (the cathedral model). With more eyes looking at source code, bugs can be discovered and fixed faster. In addition, new developers join the development team at no extra cost. This has created more reliable and portable software with faster development cycles than many closed commercial offerings. With many developers in diverse geographical areas, testing becomes even more important. In the past 10 years business models have emerged to support open-source development. It may seem impossible for a company to survive by giving away software. However, companies can thrive around an open-source project. Some common ways of generating revenue include consulting, training, adding features, selling technical support, building proprietary end-user applications on top of open-source libraries, and selling development tools.
tiates to create a scene. You’ll find that the model used for 3D polygonal rendering (lights, cameras, actors) is analogous to the model used for volume and other types of rendering (lights, cameras, volumes). In the following sections we’ll walk through a simple example demonstrating these classes for surface polygonal and volume rendering. You may wish to type these commands into a properly installed Tcl interpreter as described in the previous section. Figure 2 shows the resulting image from this example.
2
Two renderers in a rendering window combine surface, volume, and 2D rendering. The left renderer contains a simple cube; the right renderer contains a polygonal isosurface and volume rendering of electron potential. The scalar bar indicates data range and its relationship to color.
IEEE Computer Graphics and Applications
21
Tutorial
Render window and renderers To visualize your data, you first need to open a window on the computer screen. vtkRenderWindow is an abstract superclass representing the object into which one or more renderers draw. Like most graphics objects, it automatically instantiates the correct device-dependent subclass for your platform. The vtkRenderWindow is a container class for vtkRenderer objects, and multiple renderers can be tiled within a single render window to create complex visualizations. In this example we’ll place two renderers with different background colors side by side within the render window. The placement location is specified using normalized (0, 1) viewport coordinates in the render window:
be used. Otherwise, vtkDataSetMapper must be used. The following fragment of Tcl code can be used to create a polygonal cube and place it in the scene. In this code segment and others following, note that lines of code ending with a backslash (\) indicate a carryover of code that didn’t fit onto one line. The indented line following belongs with the preceding line. Simply delete the \ and type in a single line of code. vtkCubeSource cubeData vtkPolyDataMapper cubeMapper cubeMapper SetInput \ [cubeData GetOutput]
vtkRenderWindow renWin renWin SetSize 600 300
vtkActor cubeActor cubeActor SetMapper cubeMapper
vtkRenderer ren1 ren1 SetViewport 0.0 0.0 0.5 1.0 ren1 SetBackground 0.8 0.4 0.2 renWin AddRenderer ren1
ren1 AddProp cubeActor ren1 ResetCamera renWin Render
vtkRenderer ren2 ren2 SetViewport 0.5 0.0 1.0 1.0 ren2 SetBackground 0.1 0.2 0.4 renWin AddRenderer ren2
Since the output of the vtkCubeSource object is polygonal data, an instance of vtkPolyDataMapper renders the data. The ResetCamera() method centers the camera on the data. The following fragment of Tcl code rotates the cube and changes the color to pink:
renWin Render The vtkRenderWindow object manages the render process, so a single Render() call will cause the window to map onto the screen and the renderers to update their display. At this point in the example only solid background color will appear because we haven’t defined any props.
Props, mappers, and properties Props are the objects added to the renderer to create a scene. The class vtkProp is an abstract superclass for all 2D and 3D props and contains information about visibility, orientation, size, and position. Props associate with a mapper and a property object. The mapper refers to an input data object (described in the section on the visualization pipeline), and it knows how to render the data object. The property object contains rendering parameters such as color and material properties. In the next three sections we’ll cover some concrete subclasses for props, mappers, and properties that can be used for rendering 3D surface geometric data, 3D volumetric data, and 2D geometry, text, and images.
Rendering 3D geometric data One specific subclass of vtkProp that can be used to represent 3D geometric data in a scene is vtkActor. The actor object will automatically create a default vtkProperty object, but requires the user to specify a subclass of vtkMapper. Depending on the nature of the geometry referred to by the mapper, either the subclasses vtkDataSetMapper or vtkPolyDataMapper must be used. If the data contains points, lines, and polygons represented using a vtkPolyData, then a vtkPolyDataMapper can
22
September/October 2000
cubeActor RotateX 30.0 cubeActor RotateY 20.0 [cubeActor GetProperty] \ SetColor 1.0 0.7 0.7 renWin Render Use the GetProperty() method of the actor to access the automatically created property object.
Rendering 3D volumetric data The vtkImageData object can be used to represent one-, two-, and three-dimensional image data. As a subclass of vtkDataSet, vtkImageData can be represented by a vtkActor and rendered with a vtkDataSetMapper. In 3D this data can be considered a volume. Alternatively, it can be represented by a vtkVolume and rendered with a subclass of vtkVolumeMapper. Since some subclasses of vtkVolumeMapper use geometric techniques to render the volume data, the distinction between volumes and actors mostly arises from the different terminology and parameters used in volumetric rendering as opposed to the underlying rendering method. VTK currently supports three types of volume rendering—ray tracing, 2D texture mapping, and a method that uses the VolumePro graphics board.5 Although the example in this section uses the 2D texture mapping approach, you could change it to use an alternative method with only minor modifications. To begin our volume-rendering example, we’ll load a 3D structured data set of unsigned char values and use this as input for the volume mapper vtkVolumeTextureMapper2D.
vtkSLCReader negReader negReader SetFileName “neghip.slc” vtkVolumeTextureMapper2D negMapper negMapper SetInput \ [negReader GetOutput] The hardest step in volume visualization is often defining the transfer functions that map the scalar data values into color and opacity. In this example we’ll use a simple ramp from 0.0 to 0.2 for opacity, with the color function ranging through red, blue, and green. vtkPiecewiseFunction negOpacity negOpacity AddPoint 0 0.0 negOpacity AddPoint 255 0.2 vtkColorTransferFunction negColor AddRGBPoint 64 negColor AddRGBPoint 128 negColor AddRGBPoint 196
negColor 1.0 0.0 0.0 0.0 0.0 1.0 0.0 1.0 0.0
The first value defined when adding a point into a transfer function is always the scalar value, with one value following it for a vtkPiecewiseFunction or an RGB triple following it for a vtkColorTransferFunction. Since we’re visualizing 8-bit data, the scalar values in this example range from 0 to 255. Now that we’ve defined the two required transfer functions, we can create the volume property and the volume. vtkVolumeProperty negProperty negProperty SetColor negColor negProperty SetScalarOpacity \ negOpacity vtkVolume negVolume negVolume SetMapper negMapper negVolume SetProperty negProperty ren2 AddProp negVolume ren2 ResetCamera renWin Render
Intermixing geometry and volumes The VTK rendering process can combine multiple actors and volumes in the same scene. In the following example, a polygonal surface is displayed intermixed with the volume. vtkPolyDataReader posReader posReader SetFileName \ “poshipsurface.vtk” vtkPolyDataMapper posMapper posMapper SetInput \ [posReader GetOutput] vtkActor posActor posActor SetMapper posMapper
ren2 AddProp posActor renWin Render The combined VTK rendering process has a few limitations. VTK doesn’t support translucency of geometric data because the primitives aren’t sorted into a back-to-front ordering before rendering. Multiple volumes can be rendered in the same scene only if the bounds of the volumes don’t overlap. Opaque geometry can overlap volumes using the ray casting and texture mapping approaches, but not if a vtkVolumeProMapper is used because of limitations with this hardware.
Rendering 2D data In addition to 3D geometric and volumetric data, VTK visualizes 2D data such as geometry, images, and text. In the examples given here we’ll render 2D data into a 3D renderer to intermix 2D and 3D data. Alternatively, if we only have 2D data, we can use an image viewer for visualization. The concept of actors, mappers, and properties applies to both 2D and 3D data, although some of the specific parameters change. In the code fragment below, we add annotation to the renderer that displays the cube. A vtkActor2D represents the title in the scene, a vtkTextMapper holds and renders the data (which in this case is a string), and the vtkActor2D automatically creates a vtkProperty2D. Note, here and in code segments following, some long individual code words include hyphens because they didn’t fit onto one line. A hyphen, like a \, also indicates a carryover, but of a single word. When typing in the code, delete the hyphens to recreate a single word. vtkTextMapper titleMapper titleMapper SetInput \ “This is a Pink Cube” titleMapper \ SetJustificationToCentered vtkActor2D titleActor titleActor SetMapper titleMapper [titleActor GetProperty] \ SetColor 1 1 0 set pc [titleActor \ GetPositionCoordinate] $pc SetCoordinateSystemToNormalizedViewport $pc SetValue 0.5 0.92 ren1 AddProp titleActor renWin Render The code required to change the color of the text resembles the code used to change the cube’s color. However, 3D actors are positioned using world coordinates, whereas we chose to position this 2D actor in a normalized viewport coordinate system. Since 2D data is often used for annotation, VTK offers several objects that combine multiple 2D actors and mappers into one 2D actor. For example, the vtkScalarBarActor object combines text and 2D polygons to
IEEE Computer Graphics and Applications
23
Tutorial
vtkLight light light SetFocalPoint 0.0 0.0 0.0 light SetPosition 1.0 0.0 0.0 light SetColor 0.0 1.0 0.0 light SetIntensity 0.5 ren2 AddLight light renWin Render
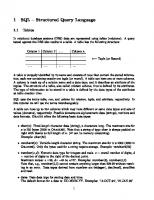
3 A VTK visualization network. Process objects (filters) appear as red spheres, data objects as blue cubes. The other objects represent props, properties, the renderer, and the rendering window.
display a representation of a color lookup table. vtkScalarBarActor scalarBar scalarBar SetLookupTable negColor scalarBar SetTitle “Density” set sPC \ [scalarBar GetPositionCoordinate] $sPC SetCoordinateSystemToNormalizedViewport $sPC SetValue 0.8 0.1 ren2 AddProp scalarBar renWin Render If you’d like to write your own composite actor in C++, start with vtkScalarBarActor. This object creates the scalar bar representation using other VTK classes and uses the rendering functionality of these created mappers to display the annotation object.
Lights, cameras, and interaction Many VTK applications never explicitly create a vtkLight or a vtkCamera, since the renderer will automatically create them if they’re not defined at the first render. Once the system creates a camera, you can access it from the renderer to change camera parameters such as position, focal point, and field of view. The camera contains some convenience methods for rotation about the position and the focal point such as Azimuth(), Elevation(), Roll(), Pitch(), and Yaw() (the angles are measured in degrees). set cam [ren2 GetActiveCamera] $cam Azimuth 20.0 $cam Elevation 10.0 renWin Render The light automatically created is a white light with the same position and focal point as the camera. If you use an interactor (as described later in this section), this light will follow the camera. You can use the following fragment of code to add a second light to the volume rendered scene. This light comes from the right side and is green. Since illumination is off by default in a volume property (ambient = 1.0, diffuse/specular = 0.0), the green light doesn’t alter the volume.
24
September/October 2000
Clearly, we’d prefer to use mouse events to control the camera’s position and orientation, and the props in the scene. The vtkRenderWindowInteractor object provides this functionality and can be attached to a render window as shown below. vtkRenderWindowInteractor iren iren SetRenderWindow renWin iren Initialize The interactor can be placed into joystick or trackball mode using the “j” or “t” keys. Left mouse operations control rotation, the middle mouse button controls panning (translation within the focal plane), and right mouse operations control zooming (translation towards or away from the focal point). The “r” key can always be used to reset the camera so that all the props can be seen in the image. VTK also provides interactivity in an application through user interface components. Below is a simple example of using a Tk text entry widget to change the title annotation. proc changeTitle {} { titleMapper SetInput [.top.entry \ get] renWin Render } toplevel .top entry .top.entry .top.entry insert 0 \ {This is a Pink Cube} pack .top.entry bind .top.entry changeTitle Now you can change the text in the entry, press the return key, and see the effect in the render window.
The visualization pipeline VTK’s data processing pipeline transforms data into forms that can be displayed by the graphics subsystem described previously or into other data forms that the pipeline can further process. For example, we may wish to read a set of unorganized points, create a polygonal mesh via Delaunay triangulation, then display the mesh using polygonal (surface) rendering.
Pipeline architecture The pipeline, or alternatively, visualization network, is constructed by connecting process objects and data objects (Figure 3). Data objects represent and provide
access to data, and process objects (or filters) operate on data objects. These networks can be elaborate and may include branches and loops. In implementation, the connections are made by using the SetInput()/ GetOutput() methods (as follows in Tcl): aFilter SetInput [bFilter \ GetOutput] Note that data objects are typically not explicitly created. Filters instantiate an internal data object consistent with their output requirements and return it in response to the GetOutput() method. Connections may only be made when the input/output types match. In the example above, bFilter returns a type that’s the same as, or a subclass of, what aFilter’s SetInput() method accepts. Depending on which language you use to build a VTK application, type checking may be enforced at compile time (for example, building with C++) or at runtime (for example, building with Tcl). Once constructed, the visualization pipeline’s execution must be carefully controlled. Filters should only reexecute when their internal state changes or when the input to the filter changes. VTK employs a distributed, implicit update process. Each object in VTK maintains an internal time stamp that’s automatically updated when the object state changes (usually as a result of setting an instance variable value). Process and data objects maintain additional time stamps that are updated upon execution of the pipeline. The system compares these time stamps (each of which is a unique, monotonically increasing, unsigned long integer value) to determine which objects are out of date and therefore which portion of the network must re-execute. Many visualization systems use a centralized executive to control network execution, which becomes a bottleneck in large parallel applications. VTK’s distributed execution mechanism allows scalable parallel processing.
Data objects Figure 4 illustrates the data objects that VTK supports. Data objects represent information very generally as a field (an array of arrays). Data sets are a specialization of data objects with topological and geometric structure. Besides their structure, data sets also have attribute data associated with their topology and/or geometry (for example, points and cells). The attribute data consist of scalars, vectors, tensors, normals, texture coordinates, and field data.
Process objects VTK offers several hundred process objects. Many of the filters operate on just one type of data (for example, image processing filters). Some filters such as vtkContourFilter accept an input of one type (volume) and produce an output of another type (polygons). The challenge of learning VTK involves becoming familiar with the many possible filters and learning how to combine them to create useful and interesting visualizations. Process objects are often referred to as filters. Specifically, VTK classifies process objects into three cate-
Images/volume (vtkStructuredPoints)
Linear primitives (vtkPolyData)
Structured data (vtkRectilinearGrid, vtkStructuredGrid)
Unstructured data (vtkUnstructuredGrid)
4 Some of VTK’s data objects: images/volume (top left), linear primitives (top right), structured data (lower left), and unstructured data (lower right).
gories: sources, filters, and mappers. Sources have no VTK data inputs, but produce one or more outputs—for example, readers or procedural source objects. Filters accept one or more inputs and produce one or more outputs. Mappers terminate the visualization pipeline, either by coupling to the graphics subsystem (as we saw in the previous section) or writing their data to disk or into a network connection.
Examples We’ve already seen example pipelines in the previous section. In the first example, we used a vtkCubeSource to procedurally generate a polygonal representation of a cube, then connected it to a vtkPolyDataMapper. Similarly, the next two examples in the previous section also created readers, then connected them directly to a mapper. We’ll now elaborate on this theme by creating a more complex pipeline. This example reads a polygonal data set generated from a Cyberware laser digitizer, reduces the triangle count via decimation, reduces surface noise via Laplacian smoothing, generates surface normals, and glyphs the surface with cones representing surface normals. We begin by reading the polygonal file: vtkBYUReader reader reader SetGeometryFileName “fran.g” Next we create the pipeline, consisting of a decimator, smoother, and normal generator. We set the decimator with a target reduction of 90 percent, constrained by the requirement to preserve topology. vtkDecimatePro deci deci SetInput [reader GetOutput] deci SetTargetReduction 0.9 deci PreserveTopologyOn vtkSmoothPolyDataFilter smoother smoother SetInput [deci GetOutput] vtkPolyDataNormals normals
IEEE Computer Graphics and Applications
25
Tutorial
transformF SetInput [cone GetOutput] transformF SetTransform transform vtkGlyph3D glyph glyph SetInput [ptMask GetOutput] glyph SetSource [transformF \ GetOutput] glyph SetVectorModeToUseNormal glyph SetScaleModeToScaleByVector glyph SetScaleFactor 0.004
5 This figure shows a polygonal mesh acquired from a laser scanner that has been decimated, smoothed, and glyphed to indicate surface normals.
vtkPolyDataMapper spikeMapper spikeMapper SetInput [glyph GetOutput] vtkActor spikeActor spikeActor SetMapper spikeMapper [spikeActor GetProperty] \ SetColor 0 .79 .34 We then add the two actors to the renderer and render the scene: vtkRenderer ren3 vtkRenderWindow renWin2 renWin2 AddRenderer ren3 normals SetInput [smoother \ GetOutput] normals SetFeatureAngle 60 vtkPolyDataMapper mapper mapper SetInput [normals GetOutput] vtkActor fran fran SetMapper mapper [fran GetProperty] \ SetColor 1 0.49 0.25 The next leg of the network is interesting because it uses a filter that takes two inputs. The first input is a data set containing some points; the second defines a glyph represented with polygonal data. (Here we use a cone, rotated by a transform to face in the direction expected by the vtkGlyph3D class.) We use the filter vtkMaskPoints to randomly select the points to glyph (to avoid visual clutter): vtkMaskPoints ptMask ptMask SetInput [normals GetOutput] ptMask SetOnRatio 10 ptMask RandomModeOn vtkConeSource cone cone SetResolution 6 vtkTransform transform transform Translate 0.5 0.0 0.0 vtkTransformPolyDataFilter \ transformF
26
September/October 2000
vtkRenderWindowInteractor iren2 iren2 SetRenderWindow renWin2 ren3 AddActor fran ren3 AddActor spikeActor renWin2 Render Figure 5 shows the final image.
Extending VTK The object-oriented design of VTK lets users add their own data objects and filters. For example, vtkDataSet is an abstract class that defines an application programming interface (API) that all data sets must follow. By subclassing from vtkDataSet, the user can create a data object that all filters accepting vtkDataSet as input can process (such as contouring). Such extensibility is true of almost every subsystem found in VTK, including the graphics subsystem. For further resources, see the “Additional Resources for VTK” sidebar. ■
References 1. W. Schroeder, K. Martin, and W. Lorensen, The Visualization Toolkit: An Object-Oriented Approach to 3D Graphics, 2nd ed., Prentice-Hall, Old Tappan, N.J., 1998. 2. C. Upson et al., “The Application Visualization System: A Computational Environment for Scientific Visualization,” IEEE Computer Graphics and Applications, Vol. 9, No. 40, July 1989, pp. 30-42. 3. Data Explorer Reference Manual, IBM, Armonk, New York, 1991. 4. IRIS Explorer User’s Guide, Numerical Algorithms Group, Oxford, UK, 2000.
5. H. Pfister et al., “The VolumePro Real-Time Ray-Casting System,” Proc. Siggraph 99, ACM Press, New York, Aug. 1999, pp. 251-260.
William J. Schroeder is first author of The Visualization Toolkit textbook and is currently president and co-founder of Kitware. He is also a research faculty member at Rensselaer Polytechnic Institute. His research interests include visualization, computational geometry, and numerical analysis. He received a BS in mechanical engineering from the University of Maryland College Park in 1980 and a PhD in applied mathematics from RPI in 1991.
Lisa Sobierajski Avila is a technical contributor and vice president of Kitware, where she is involved in the development of volume rendering software for medical and scientific applications. Her research interests include volume visualization, haptic interaction, and level-of-detail rendering. She received her BS, MS, and PhD in computer science from State University of New York at Stony Brook in 1989, 1990, and 1994, respectively.
William A. Hoffman is currently vice president and a technical lead at Kitware. His research interests include development of object-oriented toolkits and systems for visualization and computer vision software. He holds a BS in computer science from the University of Central Florida in 1990 and an MS in computer science from Rensselaer Polytechnic Institute in 1992.
Readers may contact the authors at Kitware, 469 Clifton Corporate Parkway, Clifton Park, NY 12065, e-mail {will.schroeder, lisa.avila, bill.hoffman}@kitware.com.
Additional Resources for VTK Visit http://www.visualizationtoolkit.org to access the VTK community Web site. Here you’ll find information including instructions for obtaining the software, online documentation, the results of the quality testing process for the nightly release, and pointers to academic and commercial sites that use VTK.
Obtaining the software VTK is available as an official release version and as a nightly release. The source code for either of these versions, along with data sets and test images may be downloaded from the VTK Web site or obtained via anonymous CVS (a source code, revision control system). Precompiled binaries are available on the Web site for Windows and Linux. A CD with the latest official release may be purchased from Kitware. If you plan to use VTK as a tool by developing applications with it using C++ or one of the scripting interfaces, then you’ll probably want to download the latest official release. If you plan to modify and extend the VTK source code, then you’ll probably want to work with the nightly release. Users can examine the Web-based quality dashboard (http://public.kitware .com/vtk/quality/MostRecentResults/) and decide whether the system is stable enough on any given day to obtain a periodic update. The dashboard generates every night after extensive testing across a variety of platforms.
Help In addition to the testing described above, VTK is supported through books, training courses, and support contracts by Kitware. Commercial products such as Principia, Mathematica’s graphical pipeline editor, can aid in the development of VTK applications (see http://www.principiamathematica.com). Descriptions of the underlying work are available from two sources. The textbook1 describes many of the algorithms and data structures in VTK. The User’s Guide (http://www.kitware.com) describes how to install, use, and extend VTK. In addition to commercial products and services, the VTK community provides many free resources. The vtkusers mailing list is a resource for beginners and developers alike. Approximately 900 subscribers answer questions, post bug fixes, and help VTK users get the most out of the software. Instructions for joining the list can be found on the VTK Web site. A searchable archive lets you find and follow interesting technical threads. Members of the VTK community have developed resources that the general community can use. Sebastian Barre maintains an extensive list of Web links at http://www.hds.utc.fr/~barre/vtk/ links.html to resources such as the source code for pipeline and object browsers, a VTK benchmark program and results from many platforms, and a description of the process used by Jan Sifter and collaborators to build online VTK documentation using doxygen (an open-source documentation system; see http://www.stack.nl/ ~dimitri/doxygen/index.html).
IEEE Computer Graphics and Applications
27