Trading with Candlesticks: Visual Tools for Improved Technical Analysis and Timing [1 ed.] 013138094X, 9780131380943
Want to consistently outperform? Candlestick charts can help! In this book, top investment author Michael C. Thomsett co
563 99 49MB
English Pages 256 [248] Year 2010
Recommend Papers

![Technical Analysis: Power Tools for Active Investors [illustrated edition]
0130094862](https://ebin.pub/img/200x200/technical-analysis-power-tools-for-active-investors-illustrated-edition-0130094862.jpg)

![Mastering Technical Analysis: Using the Tools of Technical Analysis for Profitable Trading (McGraw-Hill Traders Edge Series) [1 ed.]
0071448829, 9780071448826](https://ebin.pub/img/200x200/mastering-technical-analysis-using-the-tools-of-technical-analysis-for-profitable-trading-mcgraw-hill-traders-edge-series-1nbsped-0071448829-9780071448826.jpg)


![Introduction to AmiBroker: Advanced Technical Analysis Software for Charting and Trading System Development [2 ed.]](https://ebin.pub/img/200x200/introduction-to-amibroker-advanced-technical-analysis-software-for-charting-and-trading-system-development-2nbsped.jpg)

![Trading with Candlesticks: Visual Tools for Improved Technical Analysis and Timing [1 ed.]
013138094X, 9780131380943](https://ebin.pub/img/200x200/trading-with-candlesticks-visual-tools-for-improved-technical-analysis-and-timing-1nbsped-013138094x-9780131380943.jpg)
- Author / Uploaded
- Michael C. Thomsett
File loading please wait...
Citation preview
Tra in with an lesticks Visua l Too ls for Improved Technica l Ana lysis and Ti ming
Michael C. Thomsett
Vice PrelideO_l .
.... セN@ セ@
5Q ,O
". ". ,,.
Flgllre 4-7
Morning star
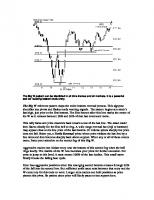
T he eVe/ling star is the bear version of the same formation . It consists of a bear inverted hammer (an upward d ay and upward gap) followed br a downward dOl)' moving lower. The chart of Ime! (INTC) anticipates a mild downward movement, which is shown in I"igure 4-8. In this case, the bear indicator appears where it should be, after an uptrend. (II Evening Star A bear three-stick pattern combining a bear inverted hammer with a subsequent third day moving downward.
8D
Tradin g wl1h Ca ndlestic ks
..
,'"
18 .0
". 17 .0
". :: : nj91
!IOIoI JUIII セ@
ャ セ N o@
Jun
8
13
20
Z1
Aug
10
17
Chart courtesy ofStockCharts.com
Figure 4·8
Eve ning slar
Neithe r the morning star nor the evening star in these two examples demonsmites how these patterns wo rk as revnsals. The first was a false indicator, and the second came before a mild downtrend. Even so, the evening star is worth paying atte ntion to when it appeaTS at the end of the trend. A similar pattern is the abandoned baby, which is an expansion of the twostick cluji scar. [n the bull abmulOlled baby, the bull cloji star (a dow nward day, downward gap, and cloji) is followed by an upward gap and the n an upward day. segment of The cluji, residing all by itself between two gaps, is the セ 。 「。 ョ 、ッョ・@ this formation.
m Bull Abandoned Baby A complex pattern consisting 01 a bull doji star (a downward day, downward gap, and doji) lollowed by an upward gap and then an upward day.
An example of the bull abandoned bab)' is the case of Bank of America (SAC). In Figure 4-9, the downtrend concludes with a bull abandoned baby and then a strong uptrend. [t is also interesting to note that the uptrend stalls and shows four downward sessions before resuming more strongly.
o
c ッ ュー ャ ・セ@
Sti ck Palter"!
,/KBY Point The abandoned baby pattern is a strong indir;;Jtor because of the reversal after the doN day. This tells you the direction supported by the pattern has a Jot 01 strength.
Figure 4-9
Sull abandoned baby
A bear abandoned baby is the opposite. It is the combination of a bear doii 4- 10 ーイッカゥ、セウ@ an セク。ューj@ in エィセ@ 」。ウセ@ star, a gap, and a downward day. fゥァオイセ@ of Duront (DD). Here, the pattern shows up at the top of an uptrend, as you day イセーᆳ wo uld expe(t. The abandoned portion (a very narrow trading イ 。ョァセ@ senring a near-doii) fits the pattern and predicts the reversal accurately, with ーイゥ」セウ@ immediately moving into a downturn, moving down six points ッカセイ@ {ィセ@ next month, and then creating a double bottom before rallying once again.
III Bear Abandoned Baby A complex formation consisting of a bear doii star (an upward day, upward gap, and doji) followed by a downward gap and then a downward day.
81
"
Trading with Candlnti cki
ョNaオセ@
DO (Do..p:rt Co .) N'1'SIO Op 32.'O Hi 33.00 L0 3.\jg C I 327 , \l0I 7.S '" DO (O.ily)
.ltockC .... ,t!..com セoサI
LWHセ
RLTQGャゥI
N@
"
"
Chan courtesy ofSlockCharts.com
Figure 4-10
Bear abandoned baby
. l l m omplex Trend PaHern' Besides easily recogni7,ed reversal patterns, some complex patterns create or confirm a trend. T hese trend patterns should be expccrcd to appear either after a period of sideways trading (representing uncertainty) or in highly volatile trends where no apparent direnion has been previously set. T he trend patterns forecast a direction, either immediately or after a brief delay in price movement. The first of these an: the side-by-side white lines (bull) and black lines (bcJr) patterns. The distinction of these formatio ns to those following is that the white line formatiuns are bullish and the black line formations are bearish. (In comparison. the next ones involve bullish black and bearish white side-by-side fo rmations.)
III Side·by·Side White Lines Bull A pattern 01 three white sessions. The first is lollowed by an upside gap and then two additional upward-moving sessions.
e
Comp lex St ick Patterns
B3
W Side-by-Side Black Lines Bear A formation of three black sessioos. The first is followed by a downside gap and then two additional downward·moving sessions.
An example containing several of these side-by-side patterns is shown in Figure 4- 11. Verizon (VZ) has three distinct side-hy-side lines, two white lines (bull), and in the middle, one series of black lines (bear). Even though prices appear to be quite volatile in this period, the side-by-side formations accurately predict short-term price direction . The gap with continued direction afterward makes this a strong indicator in either direction . |iz
Hv・イゥコッョセI@
. 'tockChort,.com
NYSE
:21-AY'£2OOQ
011 3 1.00 ttl 3 1.47 Lo 30 7 1 C13 1.37 \101 14.0"" C!!g +O.ocI H
KR
N QセGiゥI@
...
VZ (D .. ily)
,," ,,.
bull
"'"
block line,
00 .0
N.' NO
Chart courtesy ofS lodCharts.com
Figure 4-11
Side-by-side bull (while) and bear (black) lines
The opposite version of side-by-side lines is also going to be found . The sideby-side portion of the formation refers to the second and third da ys, and this is where you find the reverse of the white (bull) and the black (bear) interpretation. A bull side-by-side black lines panarn consists of an upward session, an upward gap, and two downward sessions. In this instance, even though the second and third sessions are black, the upward gap after the first session is the important sign. This is most likely to be foun d during an uptrend. The pattern reveals that although trading during the secnnd and thi rd sessions moved in a
84
Trading with Candlutick lO
bearish direction, the price trend did not fill the gap, creating new support at the
lower extension of the first day's range and making the pattern bullish.
ill Side-by-Side Black Lines Bull A formation of one white session, an upside gap, and two black sessioos. Price support prevents the bears from moving price down to fill the gap and forms new support, making this a bullish indicator,
For example, Figure 4-12 shuws how Johnson & Johnson ON]) prices acted durin g a mild uptrend with some sideways movement. The sidc-by-side black lines formation preceded
J.
strong upward movement. Nott: Jiso how the lower
shadow of the first day created a new line of support in trading after the sideby-side formed.
Chan courtesy of StockCharts. com
Figure 4·12 Bun side-by-slde black lines The bearish version of this, the side-by-side white lines bear form ation, co ntains the opposite anributes and creates a new level of resistance at the top
of the first day's trading range. The downward gap is followed by further downward price movement as bulls prove to be unable to fill the gap.
o
Complex Sti ck p. l1erns
8S
m Side-by-Side White Lines Bear A pattern of one black session, an upside gap, and two white sessioos. Price resistance prevents the bulls from moving price up to fil l the gap, making this a bearish indicator.
For example, Exxon Mobil (X OM), shown in Figure 4-13, reveals a bearish ウゥ、・Mィケセ@ white ャゥョセウ@ ー。エセイョ@ 。ヲエセイ@ エィセ@ セクゥウエョァ@ オーエイセョ、@ had 。ャ イ セ 。、ケ@ 「セァオョ@ to weaken. The trend had stalled over the previous two weeks, and the next price direction was uncertain, at least until the hearish side-by-side showed lip. Price levels then tumbled nine points over one month, which was predicted by the side-hy-side. It's the gap in trading het'.'1een days, follnwe{i hy no reversal and fill, which signals the trend.
Chart
」ッオイエ・セケ@
of SlockChart'.com
Figure 4-13 Bear si de-by-side while lines
./Key Point Side-by-side patterns are strong because they reveal a gap followed by the lack of reverSiJI or fill. This is a very strong sign of support for the direction forecast.
"
Trading with Ca ndl esticks
A tasuki is a Japanese sash used to hold up a shirt sleeve. similar to a garter. The tasllki gap pattnn is so-called due to the shape of the three sticks. The first session is followed by a gap and then '"held up" by the second and third session's price movement. An upside (bull) tasuki gap contains an upw;ud day folluwc{] by an upside gap and then a second upside day followed by a somew hat lower range. This pattern opens within t he range of the second dar and finishes below it. In this pattern, usually found either within an uptrend or afte r a period of sideways trading, the import:mt element is that even with the third day moving to the downside, the gap holds up; this is why the pattern is bullish, Although this portends an uptrt:nd, the result might be (ldared b}' several trading sessions.
W Upside Tasuki Gap A complex pattern creating a bull trend with an upward candle, an upside gap, a second upward candle, and then a downside can dle that does not fill the gap. It is a bull formation because the gap holds up.
A downside tasuki gap consists of a downward candle, a downside gap, a second downward candle, and then an upside candle. The third candle opens within the trading range of the se