Trace Determination of Pesticides and their Degradation Products in Water 0444818421, 9780444818423
The book covers a critical compilation of analytical methods used for the monitoring of pesticides and their degradation
279 37 30MB
English Pages 549 Year 1997
Recommend Papers


![Bioactive Natural Products: Detection, Isolation, and Structural Determination, 2nd Edition [2 ed.]
0849372585, 9780849372582, 9781420006889](https://ebin.pub/img/200x200/bioactive-natural-products-detection-isolation-and-structural-determination-2nd-edition-2nbsped-0849372585-9780849372582-9781420006889.jpg)

File loading please wait...
Citation preview
Preface The book covers a critical compilation of analytical methods used for the monitoring of pesticides and their degradation products in water. The broad range of analytical methodologies includes conventional techniques routinely used for the trace determination of pesticides in water as well as advanced monitoring techniques developed during the last few years. This book contains up-to-date material that we have been lecturing in recent years for short courses entitled: "Sample handling of pesticides in the aquatic environment" and it is the direct result of our experience in the field of pesticide analysis. The content of the book should solve most of the problems encountered in pesticide analysis, both for newcomers and expert laboratories looking either for a multiresidue analysis or for a tailor-made determination of a pesticide and/or a polar metabolite. The book is structured in six chapters, beginning with general aspects of pesticides such as usage, physicochemical parameters and occurrence in the environment. The second chapter is devoted to sampling from water matrices, stability methods of pesticides in water using advanced protocols such as solid phase extraction materials and quality assurance issues. The general chromatographic methods for pesticides are reported, including the newly developed electrophoresis methods. GC-MS and LC-MS are mainly used as confirmatory analytical methods but their increasing use as quantitative analytical techniques is also emphasized. Sample preparation methodologies, including off-line and on-line techniques, are described in the next two chapters, with a comprehensive list of examples of pesticides and many metabolites, including the use of different GC-based methods and LC-based-methods. The final chapter is devoted to the development of biological techniques that can be used in most cases without any sample pre-treatment and so are useful as early warning methods. The use of immunoassays, also called ELISA, which have been widely applied in monitoring programs, mainly in the US and scarcely in Europe, and biosensors, are described and a broad list of examples from the recent literature is reported. Overall, the book answers one of the key problems in pesticide analysis" the diversity of chemical functional groups with varying polarity and physicochemical properties. Pesticides and their metabolites have received particular attention during the last few years in environmental trace organic analysis. For instance, in the case of ground water, the use of pesticides has become a cause for concern and can move through the soil into ground water, a phenomenon once thought improbable. Water soluble pesticides and their polar metabolites are generally transported to estuarine
vI
Preface
and coastal waters. Estuarine waters feature gradients of both pollutant concentrations and physicochemical characteristics such as salinity, turbidity and pH, and all these parameters must be carefully considered when developing methods of analysis for trace organics in estuarine waters. Environmental sampling of pesticides in water has also been discussed in detail. The various protocols and devices needed for sampling sea water samples, usually using large sample volumes of more than 50 1 either with LLE or SPE, with the problems encountered due to dissolved and particulate matter, are different from those derived for drinking water and well water sampling. A major emphasis of the book concerns the various aspects related to the sample preparation of pesticides and their metabolites from water matrices. This question has been recognized to be a bottleneck and it has traditionally been neglected in the literature. We should comment, following the late R.W. Frei's comments, that the most sophisticated hardware is useless if the chemistry in the protocol does not work. During the last few years new sorbent materials have appeared - carbon type, polymeric sorbents with high capacity and immunosorbents- which can more efficiently trap highly polar compounds. The book covers advanced automation methods based usually on solid phase extraction techniques; PROSPEKT, OSP-2 and ASPEC XL are examples of commercially available equipment that are of growing importance. These systems are generally coupled to LC and GC techniques and in recent years more and more applications have been published using either GC-MS and/or LC-MS, that serve to avoid false positive determinations. Biosensors and immunoassays are also of growing interest for the determination of pesticides in environmental matrices and are covered in the last chapter of this book. The rapid development of these techniques, which are more sensitive and can work in drastic environmental conditions, such as very different pH and salinity values, makes them very useful and complementary to conventional GC and/or LC techniques for the trace determination of pesticides. Finally the authors wish to express their gratitude to a number of collaborators who have participated in the compilation of information and who are aware of all the work in finalizing the present book. Without them such a book project could not be sucessfully completed. They include Ph.D. colleagues V. Pichon, J. Dugay, S. Lacorte and S. Chiron, former Ph.D. students S. Guenu, S. Dupas, L. Chen, C. Cau-DitCoumes, M. Honing, G. Durand and the late C. Molina and present Ph.D. students A. Oubifia, J. Gascon, J.S. Salau, G.A. Pefiuela, D. Puig, I. Ferrer, J. Riu, M. Casti11o, E. Martinez and E. Mallat and the technicians R. Alonso and R. Chaler. Our thanks to them all.
D. Barcel6, Barcelona, Spain M.C. Hennion, Paris, France
CHAPTER 1
Pesticides and their Degradation Products: Characteristics, Usage and Environmental Behaviour 1.1. INTRODUCTION Since the late 1970s, concern about the contamination of water has increased, partly due to the increasing number of pesticide detections in water but also partly in connection with the strict directives that were set up for protecting drinking water sources, especially in North America and Western Europe. Pesticide residues have been monitored with regard to regulatory compliance at levels that can exceed the maximum allowed concentration in surface, groundwater and finished drinking waters [1-3]. The detection of some pesticides, mainly herbicides, in water sources has also indicated a lack of understanding of their behaviour and was the stimulus for many studies on their fate and transport. With the improvement of analytical methods involving gas and liquid chromatography coupled with mass spectrometry, the use of new sorbent materials with higher trapping abilities, and the development of automated methods, several degradation products have been identified in recent years. The term degradation products in this volume refers to both biotic and abiotic transformation products of a parent pesticide and therefore includes metabolites. 1.1.1.
Historical context of pesticide use
Although detailed evidence of water contamination is rather recent, the use of pesticides began several decades ago. The commercial active ingredients were discovered incidentally during global biological tests on a great number of compounds [4]. The use of synthetic organic pesticides began in the early 1930s after the demonstration of the insecticidal properties of some alkyl thiocyanates and fungicidal properties of dithiocarbamates. However, the real beginning of the pesticide industry occurred with the introduction of DDT, patented in 1942; it remained one of the leading insecticide products for during two decades. During the same period, the first herbicide 2,4-D was introduced into the market in 1944. In the period 1945-1955, References pp. 89-94
2
Chapter 1
the so-called "second generation of pesticides", i.e. most of the organophosphorus insecticides, many carbamates and ureas, was developed, some representatives of which are still commonly used today. Quaternary ammonium materials and triazines were introduced in the years 1955-1960. In the period 1960-70 many fungicides were developed, such as benzimidazoles, pyrimidines, triazoles and imidazoles. The last two groups act as inhibitors of sterol biosynthesis and represent a large part of the fungicide market. In the same period, major concern about pesticide risk appeared as a result of ecotoxicological effects following the intensive use of DDT and other persistent organochlorines, which led to the banning (DDT in 1972 in the USA) or the severe restriction of these compounds. They were gradually replaced by organophosphorus and carbamate compounds. The third generation of pesticides appeared in the period 1970-1980. It includes pyrethroids and sulfonylureas, which can be used at low dosage rates because of their strong biological action. Sterilants, pheromones, and chitin inhibitors have appeared more recently. 1.1.2.
Trends in the world usage of pesticides
The assessment of distribution and effects of pesticide residues in the environment requires a consideration of the usage of pesticides which were applied in the past and at the present. Data on pesticide usage and the amounts of active ingredients are seldom complete, but information on the agrochemical market is more readily available. Economic figures on pesticides (herbicides, insecticides, fungicides and others) on the market during the period 1960-1993 have been published elsewhere [5,6] and are shown in Table 1.1. It is shown that the pesticide market is an important one with an average 12% growth in dollar terms. One notable trend has been in the increased use of herbicides and the relative decrease of fungicides. In 1993, the total volume of active ingredients was estimated to be 2000 million tons, with a ratio of 57% of herbicides, 23% of insecticides and 12% of fungicides. The increase in the amounts of ingredients employed depends on geographic areas. In USA and Europe it has remained roughly constant since 1980. This is explained by lower application rates resulting from the introduction of more potent pesticides, more efficient use, and increasing concern of farmers and agencies in developing plans to reduce the risk and the use of pesticides. In the coming years, an increase in pesticide use is expected to occur rapidly in developing countries whereas a slight reduction will continue in North America and Western Europe. Table 1.2 indicates the top ten pesticides used in the world, in the USA, and in Europe. These top ten herbicides are not common to all areas and some trends can be seen. First, there are common herbicides, such as atrazine and glyphosate, that are used worldwide. Secondly, several herbicides have high world usage, but not in Europe and the USA. This is true for propanil, thiobencarb and trifluralin; these her-
Pesticides and their Degradation Products
3
TABLE 1.1 TRENDS IN THE PESTICIDE WORLD MARKET AND PERCENTAGES OF ACTIVE INGREDIENTS BY USAGE. FROM REFS. [5,6] 1960
1970
1980
Worm conventional pesticide sale in millions of dollars Total pesticides 580 2700 11600 Percentage of the total market value for the year for each pesticide usage Herbicides a 19 35 42 Insecticidesb 37 38 35 Fungicides c 40 22 18 Others d 4 5 5
1993
25300 45 31 19 5
Conventional pesticides represents those used in agricultural and non-agricultural sectors, as well as those use in private gardens and home. They exclude wood preservatives and disinfectants. alncludes plant growth regulators. blncludes miticides and contact nematicides. elnclude sulfur but not wood preservatives. dlnclude rodenticides, fumigants and molluscicides, but not wood preservatives and disinfectants.
TABLE 1.2 TOP TEN HERBICIDES USED IN THE WORLD [3], IN THE USA [2] AND IN EUROPE [ 1] Herbicides
World usage
USA
Europe
Glyphosate Alachlor Metolachor Thiobencarb Paraquat 2,4 D Atrazine Propanil MCPA Trifluralin Butylate EPTC Pendimethalin Cyanazine Isoproturon Chlorotoluron MCPP Maneb Metam-sodium Mancozeb 1,3-Dichloropropene
X
X
X
X
X
X
X
References pp. 89-94
X X X
X
X
X
X
X X X
X X X X X X
4
Chapter 1
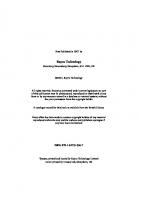
bicides are associated with rice culture which is the most extensive cultivation in the world and the basis o! food for China and many other developed countries. The other interesting point in T~lble 1.2 is that there are some differences between the top ten herbicides used in Europe and the USA. Whereas in Europe the urea herbicides are used extensively and ,zontaminate many water sources, they are not in the top ten list for the USA. It can l:e observed in the present book and in many published papers that many of the pesticides indicated in the top ten list are detected in ground- and surface waters arouncl the world. The absence of several of these compounds, e.g., glyphosate and paraq~tat, in pilot monitoring surveys, can have two reasons. First, the ionic structure of the:;e molecules means they can easily be bound to the inorganic component of the soil. These pesticides are commonly defined as practically immobile and non k aching. Questions arise from all the monitoring data that in several cases do not hatch the usage data. It is difficult to define whether the most frequently detected pesticides are really the most commonly occurring in the environment, or whelher they are just most frequently investigated. It is difficult to be sure whether compounds currently unreported really are not present in water or whether they are not ~ought, for reasons such as analytical difficulties, or low public concern. The signific:mce of non detection could have different meanings, depending on the detection limil of the technique used. In this respect a factor of two between the detection limits iJ~ the USA, Europe and less developed countries can be easily found. The question of the analytical difficulties in determining pesticides in water sources is certainly :rue for glyphosate and paraquat. The analytical methods for analyzing these pe;ticides are tedious and complicated, and many official laboratories do not have the techniques. Generally, the most common methods involve either liquid-liquid extraction or solid phase extraction followed by some kind of gas chromatographic detection. In this way, compounds such as atrazine, alachlor and metolachlor have been detected frequently, because practically all the methods can detect t~em. Considering all the points indicated above, the usage data give an indication an:l trends in the amounts in which compounds are being released into the environmenl, and in each case the analytical techniques should be adapted for detecting the pricrity- and widely used- pesticides in the environment. In several cases, as for glyphosate and paraquat, this will require tailor-made analytical methods. Herbicides represc;nt economically and quantitatively the most important category and they have show a the highest average annual increase between 1960 and 1993 [7]. Figure 1.1 show; the regional use of agrochemicals, based on the market values of 1993 [6]. The get,graphic distribution of pesticide usage depends on the culture. At present, more than 80% of the world market of herbicides is concentrated in the three geographic arq;as where agriculture is the most developed: North America, Western Europe ant East Asia. Insecticides are employed most in North America, East Asia and Latin America, and it is estimated that the half of the world-use of insecticides is in developing countries, especially in tropical regions. In China, a major
Pesticides and their Degradation Products
5
.
9
~ zo/m i-I ~.8 I ~
f//~o-zolm 10
soI
~ 10
20
a3.9 m
9.6
9.7
10 mm 1 3
I~
t~O
9
E
~///////
v.,/////F V'//Y
':.
,^ "
* 201
~q~_ ~ ~ .. 13..
o
East Asia
V'//--Z////)
Latin America Rest of World
~~
II
r---i Insecticides $ ?,580 mitlion $11,590 million
Herbicides
Fungicides $4,735 million
Fig. 1.1. Regional use of pesticides, based on market values, 1993. From Ref. [6] with permission.
world producer of rice and wheat, the total consumption of pesticides in 1990 includes 70% of insecticides, mainly organophosphorus [8]. Contamination of water by pesticides and their degradation products depends on several physico-chemical, agricultural and environmental factors. The first information to be considered for the leaching of a compound in a certain area regards its use. National and regional reports, when available, can then provide specific information. Table 1.3 reports the leading active ingredients which were sold in 1993 in the USA, and Table 1.4 lists the pesticides which were sold above 500 tons per year in 1990 in Western Europe. Only some leading compounds are common to the two lists, but it is easy to understand that both the types of culture and the influence of the pesticide industry may be different. It is worthwhile to note the importance of herbicides (see TABLE 1.3 PESTICIDES MOST COMMONLY USED IN THE US AGRICULTURAL CROP PRODUCTION IN 1993 [5] Range: 13-30 (millions of kg)
Range: 9-13 (millions of kg)
Range: 4-9 (millions of kg)
Range: 1.5-4 (millions of kg)
Atrazine Metolachlor Sulfur Alachlor Methyl-bromide Cyanazine Dichloropropene
2,4-D Metam sodium Trifluralin Petroleum oil Pendimethalin Glyphosate
EPTC Chlorpyrifos Chlorothanil Propanil Dicamba Terbufos
Bentazone Mancozeb Copper hydroxide Parathion Simazine Butylate
References pp. 89-94
6
Chapter 1
TABLE 1.4 PESTICIDES USED IN I. ARGE AMOUNTS IN WESTERN EUROPEAN COUNTRIES (ADAPTED FROM REF. [ 1]) >2000 tons/year
1000-2000 tons/year .
Atrazine 1,3-Dichloropropene Glyphosate Isoproturon Mancozeb Maneb MCCP (Mecoprop) MCPA Metam-sodium
.
.
.
.
.
.
.
.
.
.
.
.
.
.
.
.
.
.
.
.
.
.
.
.
.
.
.
Alachlor Chlortolurone Chlormequat Chlorothalonil 2,4-D Dichlorprop 1,2-Dichloropropane Dimethoate Ioxynil Malathion Metamitron Methabenzthiazuron Methyl bromide Parathion Prochloraz Trichloroacetic acid Trifluralin
500-1000 tons/year .
.
.
Azinphos-ethyl Azinphos-methyl Bentazone Captan Carbetamide Carbendazim Chloridazon Metazachlor Metolachlor Molinate Paraquat Phorate Pendimethalin Propanil Propiconazole Propineb Simazine Tri-allate Tridemorph Zineb Ziram
also Table 1.2.), wh ch have been shown to be the most common contaminants in surface water. Atraz:ne, metolachlor, alachlor, cyanazine and 2,4-D are used in the largest amounts. De~;radation products of atrazine, cyanazine and alachlor have frequently been detected along with the parent molecules in recent surveys performed by the US Geological Survey [9,10].
1.1.3.
Non-agricultural uses of pesticides
A further source r f pollution of ground waters is the non-agricultural use of pesticides. Most of the nc,n -point source pollution of ground- and surface waters by pesticides is of agricult Jral origin (e.g., non-irrigated, irrigated or speciality crop production, pasture lan,t, gangland) or land-disposal origin (landfills, channelization, hazardous wastes, o~ flow regulation). However, in recent years particular attention has been devoted to the non-agricultural uses of pesticides, e.g., on highways and railroads, and on golf courses. The non-agricultural uses of pesticides accounted for 550 tons of active i~lgredient in 1989, in England and Wales alone, with atrazine, simazine and diuron being the three major compounds used [ 11 ]. A considerable list of professional and t:onsumer end-users of a wide variety of pesticides has been re-
Pesticides and their Degradation Products
7
ported [12]. The list includes application in grass-management (golf courses, educational facilities, parks, and cemeteries), in industrial vegetation control (industrial facilities, electric utilities, roadways, railroads, pipelines), in public health (mosquito-abatement districts, rodent-control areas, and aquatic areas) and for nonagricultural crops such as commercial forestry and horticulture and plant-nurseries). Considering all these aspects of non-agricultural pollution, probably one of the most dangerous for ground water pollution relates to golf courses. In the US alone, there are over 14 000 golf courses; assuming an average of 48.6 ha per course would mean that there are over 0.68 million ha of tuff-grass in the golf course industry. The number of golfers in the US alone is estimated to be 22 million, and by the year 2000 the number of players could easily exceed 30 million. To keep up with the demands of the rapidly increasing number of golfers, it is suggested that a new golf course must be opened every day over the next few years [13]. Pesticides being used on golf courses, and for which studies on pesticide movement were carded out, are dicamba, mecroprop (MCPP), chlorothalonil, chlorpyrifos and pendimethalin. The compounds are used for the control of crabgrass in tuff-grass (including greens) and include metalaxyl, glyphosate, trichlorfon, 2,4-D, MCPP, chlorpyrifos, chlorothalonil, isofenphos and dithiopyr [14-16]. The reported data indicate that less than 1% was transported in the leachate from the base of the lysimiters. High concentrations of 200-800/~g/1 of the treatment herbicides, were detected in the runoff water from treated simulated fairway plots. In the above studies a risk assessment evaluation was carried out, using the DRASTIC model and GUS index. The non-agricultural use of pesticides has also encouraged comparative studies; one reported for chlorpyrifos showed the fate of this compound to be similar in both urban and agricultural environments. The high application rate of chlorpyrifos in the urban environment (1000 ppm for termite control versus 10 ppm for agricultural use) meant that in the urban environment it had a longer residual control and also a slower degradation resulting from the elevated concentrations [15]. Non-agricultural use of pesticides (e.g., for weed control on roads, railroads, paths, industrial and recreational areas, and for aquatic- and public-health pest control) is potentially a significant threat to ground- and surface water. This is especially true because such use involves application to areas where possible fast routes to ground water exist by runoff. Information on this is difficult to find, because it is not often collected. However, the amount of pesticides used for non-agricultural purposes is not negligible. Data available in the USA from the year 1993 are given in Table 1.5. The non-industrial applications and private home and garden consumption together represent about 25% of the total volume, and this ratio has been about the same for the last 15 years. Insecticides and fungicides represent 31 and 35% of the total consumption, respectively. Leading products in the US are in order of decreasing amounts: 2,4-D, chlorpyrifos, diazinon, glyphosate, malathion, dicamba, diuron, naled, MCPP and carbaryl [5]. In Europe, usage varies with the country [1]. In the References pp. 89-94
8
Chapter 1
TABLE 1.5 VOLUME OF CONVENT ONAL PESTICIDE ACTIVE INGREDIENTS IN USAGE SECTOR IN 1993, EXPRESSED AS PF RCENTAGE (FROM REF. [5]) ~gricultural use
Herbicides (%) Insecticides (%) Fungicides (%) Others (%) Total (%) Total (millions of kg)
78 69 64 90 75 2 65 .
.
.
.
.
Industrial, commercial and government
Home and garden
18 18 27 8 18 89
4 13 8 4 7 33
.
.
.
.
.
.
.
.
.
.
UK, the following account for 88% of the total estimated non-agricultural usage: atrazine, simazine, di~lron, 2,4-D, mecoprop, amitrole, glyphosate, sodium chlorate and MCPA. In The ]~letherlands, dalapon, dichlobenil and chlorthiamid should be added to that list. In France, diuron and amitrole represented more than 50% of pesticides applied on rail~vays in 1988-1989. In Spain, diuron, glyphosate, simazine and paraquat were the mai a non-agricultural products in 1990. The agricultural an :1 non-agricultural uses of pesticides represent a large number of different active ing~'edients. The usage of pesticides in 1993-1994 involved about 21 000 pesticide products and 860 active ingredients registered under the Federal Pesticides Law of the US. The last edition of the Pesticide Manual (1994) contains 725 "main entries", c(,rresponding to chemicals and biological agents used as active ingredients which are n use or being developed, and 559 "superseded entries" which correspond to materia believed to be no longer manufactured or marketed for crop protection use [ 17]. 1.1.4.
Formulation,
~
Pesticides are gene :ally sold and applied in agriculture as formulations. The importance of efficient c elivery to the target site of a herbicide's activity is generally recognized. Delivery ,~f a potential dose of active ingredient depends upon a complex interaction of facl ors including the efficiency of application, absorption, translocation, immobilizatior, and detoxification. Formulations of a pesticide should be as effective as possible and generally contain a mixture of surfactants, mineral and vegetable oils, emulsfl'iers, and salts, which are considered with particular reference to the penetration of the cuticle by foliage-applied herbicides. There are few requirements in the Eur 9pean Community for non-pesticidal co-formulants and adjuvants. For example information should be given on: (i) acute toxicity data via oral and dermal routes; (ii~ skin and eye irritancy data and skin sensitization data; (iii) formulation fish toxici-y data; and (iv) residue data on appropriate crops.
Pesticides and their Degradation Products
9
The adjuvant is a specific substance, other than water, which itself has no significant pesticidal properties, but which enhances or is intended to enhance the effectiveness of a particular pesticide to which it is added. It can only be used with a pesticide in accordance with the conditions of approval of that pesticide. A list of authorized adjuvants is given in Tables 1.6 and 1.7. Among the adjuvants listed, there are many surfactants; their function is as spreaders, stickers, antifoamers, compatibility agents, or activators. Surfactants play an important role in the formulation of herbicides, as emulsifiers for emusifiable concentrates and microemulsions or as wetting and dispersing agents for wettable powders, water dispersible granules and suspension concentrates. They can also be used as spray-tank additives to enhance their adhesion and wetting of foliage and uptake into the plant. Four classes of surfactants have been defined: anionic, cationic, non-ionic and amphoteric. Surfactants have a major effect on the surface tension of the spray droplets at the air-water interface and on the contact angle at the waterplant interface. They can also influence the spray droplet spectrum, spray drift, and the efficiency of delivery to the leaf surface. The adhesion, spreading, wetting, coverage and run-off may all be affected. Surfactants can be divided into a number of broad categories. Spray modifiers are added to improve the wetting and spreading properties of formulations and are regarded as more important for non-systemic herbicides, which need to be applied uniformly to the target canopy for maximum effect. Another type, the so-called activator surfactants, is added specially to enhance the foliar absorption of systemic herbicides, thereby enhancing their ultimate biological activity. Surfactants commonly used as activator adjuvants include polyoxyethylene condensate, with alcohols, alkylphenols, substituted sorbitants, and alkylamines with hydrophilic-liphophilic balance values ranging from 10 to 123. These products are normally used at final concentrations of 1-5 mg/1 in the spray solution. Oil based adjuvants are used for a variety of reasons, such as reducing vapour-loss of herbicide, enhancing the performance of herbicides on recalcitrant species, and in adverse conditions. Traditionally, spray formulations have incorporated petroleumbased oils, but more recently, oils extracted from crop seeds such as soybean, sunflower, canola and coconut have been used. In general, petroleum oil adjuvants enhance the performance of foliage-applied herbicides by increasing the absorption of the active ingredient. Such adjuvants consist of a mixture of phyto-bland oil and emulsifiers, and their effectiveness is related to the chemical composition of the oil. Their ability to form a stable oil-in-water emulsion depends upon the pesticide and the application equipment; the emulsion must be sufficiently stable to disperse the active ingredient and oil uniformly in the spray mixture and thus to distribute them efficiently over the target crop. Other adjuvants are based on crop oil. When refined or esterified, vegetable oils may be as effective as or more effective than petroleum oils or non-ionic surfactants in enhancing the phytotoxicity of herbicides. The vegetable oils can enhance the absorption, translocation and phytotoxicity of herbicides. References pp. 89-94
10
Chapter 1
TABLE 1.6 LIST OF AUTHORISED t DJUVANTS No.
Product trademark
Holder/marketing company
Chemical nature
0001 0002 0003 0004 0005 0006 0009 0010 0011 0013 0015 0017 0019 0020 0021 0020 0023 0024 0025 0026 0027 0028 0030 0031 0033 0034 0035 0037 0038 0039 0042 0044 0045 0047 0049 0050 0052 0053 0054 0055 0056 0057 0058 0059
High Trees Galion Tradename Adj. Farmon Blue High Trees Mixtm e B Cropspray 11E Tripart Cropspray 11E High Trees Non-It nic Wetter Quadrangle Crops )ray 11E Codacide Oil Actipron Spreadite Liquid Exell Adder Hyspray Atlas Adjuvant Oi Atlas Adze Atlas Adherbe Clifton Clyphosat~ Additive Planet Genamin T-200 C~', Sprayprover Clifton Wetter Genamin T-200 N] z Emerald Agral Spreader Vassgro Spreader Spraymate Bond Spraymate LI-700 Nu Film P Ethokem T25 Frigate High Trees WayfaJ er Citowett Ethokem C12 Libsorb Ethokem Sprayfast Quadrangle Quadf, tst Nu Film 17 Agstock Addwett Agriwett Agrisorb Lo-Dose
Service Chemicals Ltd. Farm Protection Ltd. Farm Protection Ltd. Service Chemicals Ltd. Chiltern Farm Chemicals Tripart Farm Chemicals Service Chemicals Ltd. Chiltern Farm Chemicals Microcide Ltd. BP Oil Ltd. Dow Agriculture Truchem Ltd. Rhone Poulenc Agr. Ltd. Fine Agrochemicals Ltd. Atlas Interlates Ltd. Atlas Interlates Ltd. Atlas Interlates Ltd. Clifton Farm Chem. Industrial Detergents UK Ltd. Monsanto plc Fine Agrochemical Ltd. Clifton Farm Chemicals Monsanto plc Intracrop Ltd. ICI Agrochemicals Pan Britannica Ind. Ltd. L.W. Vass (Agricultural) Ltd. Newman Agrochemicals Ltd. Newman Agrochemicals Ltd. Intracrop Ltd. Midkem Agrochem. Ltd. ISK Biotech Service Chemicals Ltd. BASF UK Ltd. Midkem Agrochem. Ltd. Atlas Interlates Ltd. Midkem Agrochem. Ltd. Mandops Ltd. Mandops Ltd. Intracrop Ltd. Agstock Chemicals Ltd. ABM Chemicals Ltd. ABM Chemicals Ltd. ISK Biotech
Ethylene oxide condensate Ethoxylated tallow amine Ethylene oxide condensate Ethylene oxide condensate Mineral oil Mineral oil Ethylene oxide condensate Mineral oil Vegetable oil Mineral oil Ethylene oxide condensate Ethoxylated tallow amine Mineral oil Ethoxylated tallow amine Mineral oil Ethylene oxide condensate Mineral oil Ethoxylated tallow amine Alkyl polyglycol ether Ethoxylated tallow amine Mineral oil Ethylene oxide condensate Ethoxylated tallow amine Di- 1-p-menthene Ethylene oxide condensate Ethylene oxide condensate Ethylene oxide condensate Synthetic latex Soya phospholipids Di- 1-p-menthene Ethoxylated tallow amine Ethoxylated tallow amine Ethoxylated tallow amine Ethylene oxide condensate Ethoxylated coco amine Ethoxylated coco amine Ethoxylated tallow amine Di- 1-p-menthene Di- 1-p-menthene Di- 1-p-menthene Ethoxylated tallow amine Ethylene oxide condensate Ethoxylated tallow amine Ethoxylated tallow amine
References pp. 89-94
Pesticides and their Degradation Products TABLE 1.6 (CONTINUED)
,
,
11
,
No.
Product trademark
Holder/marketing company
Chemical nature
0060 0061 0062 0067 0068 0069 0071 0072 0073 0074 0075 0079 0080 0081 0085 0086 0087 0094 0096 0097 0098 0099 0100 0102 0103 0106 0107 0108 0109 0110 0111 0112 0113 0114 0115 0116 0117 0118 0119 0120 0121 0122 0123 0124 0125 0126
Enhance Power Spray Save Spraymate Activator 90 Ashlade Adjuvant Oil Enhance Low Foam Sterox NJ Stick It Fyzol 11E Headland Guard Headland Intake Mangard Team surfactant Topup Surfactant Power Non-ionic Wetter Swirl Concorde Minder Tonic Tripart Tenax Tripart Acer Forestry Bee Pro-Mix Non-ionic 90 Ethywet Anphix GS 800 Adjuvant Keystone Tripart Minax Jogral Agropel Solar Quadrangle Q 900 Polycote Prime Polymer Polycote Polymer Polycote Pedigree Polymer Rapide Tripart Lentus Clifton Alky190 DuPont Adjuvant Farmon Wetter Barclay Dryfast XL Stefes Spread and Seal Barclay Dryfast Amos Non-ionic Wetter Intracrop BLA Barclay Actol
Midkem Agrochemicals Ltd. Power Agrochemicals Ltd. Newman Agrochem. Ltd. Ashlade Formul. Ltd. Midkem Agrochemicals Ltd. Monsanto plc Quadrangle Ltd. Schering Ltd. WBC Technology WBC Technology Mandops Ltd. Monsanto plc Farmers Crop Chem. Ltd. Power Agrochem. Ltd. Shell Chemicals UK Ltd. ICI Agrochemicals Stoller Chemical Ltd. Brown Butlin Group Tripart Farm Chemicals Ltd. Tripart Farm Chemicals Ltd. Top Farm Formulations Ltd. Service Chemicals Ltd. Top Farm Formulations Ltd. Top Farm Formulations Ltd. ANP Developments Ltd. Midkem Ltd. Farm Protection Ltd. Tripart Farm Chem. Ltd. Ind. Detergents UK Ltd. Ind. Detergents UK Ltd. Ind. Detergents UK Ltd. Crop Care Chemicals Ltd. Ciba Geigy Agrochem. Ltd. Ciba-Geigy Agrochem. Ltd. Ciba-Geigy Agrochem. Ltd. Intracrop Ltd. Tripart Farm Chemicals Ltd. Clifton Chemicals Ltd. DuPont UK Ltd. Farm Protection Ltd. Barclay Chemicals Ltd. Stefes Plant Protection Barclay Chemicals Ltd. Kommer Brookwick Intracrop Barclay Chemicals Ltd.
Ethylene oxide condensate Ethoxylated tallow amine Ethylene oxide condensate Mineral oil Ethylene oxide condensate Ethylene oxide condensate Ethylene oxide condensate Mineral oil Synthetic latex Propionic acid Di- 1-p-menthene Ethoxylated tallow amine Ethoxylated tallow amine Ethylene oxide condensate Mineral oil Mineral oil Vegetable oil Synthetic latex Synthetic latex Soya phospholipids Ethylene oxide condensate Ethylene oxide condensate Ethylene oxide condensate Ethylene oxide condensate Ethoxylated tallow amine Ethoxylated tallow amine Ethylene oxide condensate Ethylene oxide condensate Ethoxylated tallow amines Vegetable oil Ethylene oxide condensate Ethylene oxide condensate Poly(vinyl acetate) Poly(vinyl acetate) Poly(vinyl acetate) Propionic acid Synthetic latex Ethylene oxide condensate Ethylene oxide condensate Ethylene oxide condensate Di- 1-p-menthene Di- 1-p-menthene Di- 1-p-menthene Ethylene oxide condensate Synthetic latex Mineral oil
References pp. 89-94
12
Chapter 1
TABLE 1.6 (CONTINUE])) .
.
.
.
.
.
.
.
.
.
.
.
.
.
.
.
.
.
.
.
.
.
.
.
.
.
.
.
.
.
.
.
.
.
.
.
.
.
.
.
No.
Producttrademar ~
Holder/marketing company
Chemicalnature
0127 0128 0129
SM99 Frigate Lo Dose
Newman AgrochemicalsLtd. ISK Biotech Europe L t d . ISK Biotech Europe L t d .
Mineraloil Ethoxylated tallow amine Ethoxylated tallow amine
In addition, the us~ of certain inorganic salts such as ammonium sulfate, ammonium paramolybdate, iron ammonium sulfate and magnesium sulfate, together with a surfactant may greatl2' improve herbicidal activity. The combination of various adjuvants such as oils, surfactants, and fertilizer salts can enhance the activity of some herbicides [ 18-22]. To conclude, it sh 9uld be said that although the behaviour of specific pesticide formulations on the ~:nvironment has scarcely been studied, in this book we have given an overview of the major adjuvants used. For each pesticide, specific studies will need to be undertaken for each case. Overall, we believe that information on the formulations applied is needed in order to correlate better the analytical data with the pattern of use, physic, )chemical properties of each pesticide and climatological conditions. Certainly, the type of formulation and the way in which materials are applied, either by manual spraying, tractor, or plane, will help to explain their fate in the environment.
1.1.5.
Setting up m~thods for trace determination: which pesticides, where, and at what level?
Not all pesticides a:e likely to contaminate water or to be addressed by analytical chemists for trace-level determination in water. The occurrence of pesticides and degradation products in water in a given region of the world will first depend on whether that area has any concern regarding the compounds. The approach is not easy, and the question has to be addressed in the country of interest. At this point we di:.tinguish between the different reasons for setting up methods for the trace-level detc,rmination of pesticides and their degradation products in water. There is first a regulatory aspect regarding water for human consumption, i.e., ground water or surface water after appropriate treatment. In this case, the analytical chemist will either have a list of compounds, with their corresponding quantification limits, to be determined in well-defined types of water, or will not. Regulations for drinking water are well defined in North America with given analytical procedures, whereas in Europe the regulation for each pesticide is set at 0.1/zg/1, with no specific method being given, q'hese regulations are so stringent that they cannot be applied for all the compounds. First, it would be a waste of time to look regularly for a compound which is not and never will be used in the area, because of the type of culture.
Pesticides and their Degradation Products
13
TABLE 1.7 ADJUVANTS USED ACCORDING TO WEED SCIENCE, WEED TECHNOLOGY OR WSSA ABSTRACTS [20] Product trademark
Chemical nature
Agra190 Agri-Dex' Agri-Oil
Nonylphenyoxypolyethyoxyethanol Paraffin-based petroleum oil 83%; surfactant blend 17% Polyoxyethylene esters of polyglycol, fatty acids and polyoxyalkylene esters. Vegetable oil Acrylate polymer Paraffin-based mineral oil Polyoxyethylene alkyl ether 1-Dichloroacetyl-hexahydro-3,3,a-trimethyl pyrrolo- 1,2-c pyrimidin-6-(2H)-one Vegetable oil Proprietary adjuvant Soybean oil Octylphenoxypolyethoxyethanol Petroleum hydrocarbons, naphthalene and oleic oil Organosilicone adjuvant Nonylphenoxypolyethoxyethanol plus tallow fatty acid amine ethoxylate 87% (w/v) ethoxylated (15) tallow amine Polyoxyethylene (15) tallow amine Proprietary blend of polyalkyleneoxide-modified polydimethylsiloxane and non-ionic organosilicone adjuvant Blend of phosphatidylcholine and propionic acid 1H,3H-naphtho 1,8-cd pyran- 1,3-dione L-2-oxothiazolidine-4-carboxylic acid Hydrophobically modified polyacrylates Modified poly-p-menthene 85%; aliphatic amines 5% Polyoxyethylene (6) tridecyl ether (Nonoxynol 8 POE) (a(p-nonylphenyl)-to-hydroxypoly (oxyethylene) Methylated seed oil Silicone polyalkylene oxide-modified dimethyl polysiloxane Polyalkylene oxide-modified dimethyl polysiloxane Polymeric adjuvant Modified vegetable oil plus surfactant Trimethylnonylpolyethoxyethanol
Alkasurf-OP- 10 ASE-108 Assist Atplus-555 BAS 145-138 Bio-veg CC-16255 CD-407 Citowett Plus Dash (also BCH 815) DC-X2-5394 Enhance Ethokem Ethomeen Kinetic Li 700 Naphthalic anhydride OTC Pemulens TR-1 and TR-2 Plex Renex36 Renex 688 Scoil Silwet L-77 Silwet L-7607 Sta-Put Sun-It II Surfactant WK (not presently commercial) Sylgaard 309 Triton 11XE Triton XR Tween 20 Tween 80 X-77
References pp. 89-94
Organosilicone surfactant Isooctylphenylpolyethoxyethanol Proprietary, alcohol base Oxysorbic (20 POE) polyoxyethylene sorbitan monolaurate Polyoxyethylene sorbitan monooleate Alkylarylpolyoxyethylene glycols, free fatty acids and isopropanol
14
Chapter 1
TABLE 1.7 (CONTINUED) Product trademark
Chemical nature
Crop 'oil c oncenirate . . . . . . . . . . . . . . . . . . . Diammonium phosphate, diammonium sulfate Emulsified oil Isopropylamine (analytical grade) Aqueous solution of nitrogen (28%) Methylammonium Methylated seed oil, methylated sunflower oil Mono-ammonium phosphate Neodol linear alcohol surfactant Non-emulsified oil Non-ionic surfactant, octoxynol surfactant, oxysorbic surfactant, surfactant Oil adjuvant, oil-emulsified mixture Paraffin wax Petroleum oil, petroleum oil concentrate Sodium bisulfate Urea/ammonium nitrate
Secondly, drinking water monitoring would be much too expensive and, third, some pesticides cannot be analyzed at the regulatory level because of the lack of methods. This is the case for highly water-soluble pesticides, for which there are no methods for extraction from the aquatic environment. Therefore, it is important to be able to establish the lists of pesticides to be monitored, in order of priority based on well defined criteria, and on the local pesticide usage. European countries are now establishing local priority lists containing a limited number of pesticides, which take into account their usage, leaching properties, persistence, bio-accumulation potential, toxicity, and ecotoxicity data. It is also important to revise and update local pesticide priority lists since new products are being released and may replace those currently applied. The agrochemical market is very dynamic and the regulatory agencies should adapt quickly to new realities. This is not always the case, and even in the best situation there is always a 2-3 year period of adaptation. A second type of analytical method relates to monitoring surveys, which aim to determine the extent of the pesticide contamination or to study their environmental behaviour, i.e., their fate, transport, degradation, or ecotoxicological effects. In these surveys, the pesticides and their degradation products are selected and analytical conditions can then be optimized depending on the water type. The selection of the pesticides is also dictated by the possibility of the pesticide's entering the water directly, as a consequence of runoff water, or by volatilization for example, or indirectly via migration through the soil. In this chapter, we first examine the most relevant physico-chemical parameters for setting up the analytical scheme, for the extraction of the pesticides and their
Pesticides and their Degradation Products
15
trace-level analysis. The second section describes their environmental relevance in the aquatic environment and the main parameters governing their possible entry and that of their degradation products into water. The dissipation of pesticides under laboratory and in field conditions, and their toxicity ranking is also given. Overall, our intention is to give a general picture of the pesticide problem in the aquatic environment, with a few case studies that, in all cases, reflect our own experience. 1.2. CHEMICAL CLASSES AND PHYSICO-CHEMICAL PROPERTIES OF PESTICIDES As seen above, pesticides currently used over the world are numerous and have various chemical and physico-chemical properties. That is the first difficulty for their trace analysis, because environmental chemists are faced with the analysis of many compounds with various functionalities, over a wide range of polarity, solubility and acid-base properties. Survey lists can contain more than a hundred pesticides and degradation products; an example is the National Pesticides Survey list of the US EPA (see Table 1.8). The trace analysis of pesticides in water requires a sample-pretreatment which consists of an extraction, isolation, and concentration step, before quantitative analysis and determination via chromatographic analysis. The establishment of these methods, which is described in the following chapters, requires knowledge of some basic data. Chemical functionality, water-solubility, and polarity are important parameters for guiding the extraction procedure and the selection of the chromatographic method. If the extraction procedure contains some evaporation steps, a knowledge of the volatility is also useful. In addition, as shown later, knowledge of acid-base properties can be of great help for simply adjusting the sample's pH before extraction or for performing selective extraction-analysis based on ionized and nonionized forms. We now discuss the various parameters which need to be considered for traceanalysis purposes. Data have been compiled in reviews, and a variety of data can be found, depending on the difficulty of measurement of some physical parameters. We also provide definitions of a few other parameters which are useful in predicting the pesticide's environmental behaviour. Today, the agronomic efficiency and human toxicity of almost all the pesticides are well known. Less is known about the prediction of their fate and behaviour in the various environmental compartments resulting from the effect of the environmental conditions. Soil retention differs from one active ingredient to another, and also from one soil to another. Degradation routes are various and some substances can only be degraded by soil organisms whereas others are mainly degraded by biotic processes. However, despite the complexity of the behaviour of the 400-600 active ingredients used in different countries, the behaviour is strongly influenced by the physico-chemical properties, solubility in water, References pp. 89-94
16
Chapter 1
TABLE 1.8 PESTICIDES AND METABOLITES INCLUDED IN THE NATIONAL PESTICIDE SURVEY (USA) a-Chlordane ),-Chlordane a-HCH fl-HCH ),-HCH 6-HCH 1,2- Dichloropropane 2,4-D 2,4-DB 2,4,5-T 2,4,5-TP 3,5-Dichlorobenzoic acid 3-Hydroxycarbofuran 3-Ketocarbofuran phenol 4 -Nitrophenol 4,4'-DDD 4,4'-DDE 4,4'-DDT 5-Hydroxy dicamba Acifluorfen Alachlor Aldicarb Aldicarb sulfone Aldicarb sulfoxide Aldrin Ametraton Ametryn Aminocarb Atrazine Atrazine dealkylated Barban Baygon (Propoxur) Bentazone Bromacil Butachlor Butocarboxim Butoxycarboxim Butylate Carbaryl Carbendazim Carbofilran Carbofuran phenol Carboxin Chlarneh Chloramben Chloridazon
Cycloate Cymoxanil Dalapon DBCP DCPA DCPA acid metabolites De-eth ylatrazine Deisopropylatrazine Deltamethrin Diazinon Dicamba Dichlorprop Dichlorvos Dicrotophos Dieldrin Dimethoate Dinoseb Diphenamiphos sulfone DisuHfoton sulfoxide Disulfoton Disulfoton sulfone Diuron EDB Endosulfan I Endosulfan II Endosulfan sulfate Endrin Endrin aldehyde EPTC Ethirimol Ethoprop Etridiazole ETU Fenamiphos Fenamiphos sulfone Fenamiphos sulfoxide Fenamirol Fenitrothion Fenpropathrin Fenuron Fenvalerate Fluometuron Fluridone Folpet Heptachlor Heptachlor epoxide
Methiocarb Methomyl Methyl paraoxon Metolachlor Metoxuron Metoxychlor Metribuzin Metribuzin DA Metribuzin DADK Mevinphos MGK 264 Molinate Monocrotophos Napropamide Neburon Norflurazon Omethoate Oxamyl Parathion ethyl PCP Pebulate Pendimethalin Phenvalerate Phosphamidon Picloram Prometon Prometryn Pronamide Pronamide metabolite Propachlor Propanil Propazine Propham Propoxur Simazine Simetryn Simetryne Stirofos Swep Tebuthiuron Terbacil Terbufos Terbutryn Tetrachlorvinphos
trans-l,3-Dichloropropene trans-Permethrin
Pesticides and their Degradation Products
17
TABLE 1.8 (CONTINUED)TRIADIMEFON Chlorobenzilate Chlorosulfuron Chlorothalonil Chlorpropham cis- 1,3-Dichloropropene cis-Perrnethrin
Cyanazine
Hexachlorobenzene Hexazinone Isocarbamid Linuron Merphos Metalaxyl Metamitron
Triadimefon Tricyclazole Trietazine Trifluralin Vamidothion Vernolate Vinclozolin
polarity and volatility which are characteristic of each compound. The chemical structures and functionalities are important indicators and there is also a similarity in the behaviour of some related compounds. Therefore, it is worthwhile to have a classification of pesticides by chemical classes or in groups of substances. 1.2.1.
Chemical classes
The development of pesticides within chemically related groups is explained by the fact that when one active compound was discovered, others with similar structures were investigated. Some compounds can be classified easily and unambiguously because of their characteristic chemical structures. However, a few substances do not belong to well characterized groups and are harder to classify or can have similarities to two different groups. The main groups are listed in Table 1.9 with compounds having similar structures, according to the classification given in The Pesticide Manual [ 17] and in the Agrochemicals Handbook [23]. Not all the groups are equivalent in terms of number of compounds, usage, or amounts applied. Some groups can contain more than 80 different active compounds such as the organophosphorus compounds whereas some others contain very few, such as the imidazolinones. The azoles are mainly used as fungicides, whereas the organophosphorus, organochlorines and pyrethroid groups are used mainly as insecticides, acaricides or nematicides. Other groups contain mainly herbicides, except for the carbamates which are applied as herbicides or insecticides. The most widely sold herbicide families in North America are the triazines, amides and carbamates which are those commonly applied on maize, rice and soybean (atrazine, alachlor, metolachlor, EPTC, propanil and metribuzin). In Europe, one must add phenylureas and phenoxyacetic acids (isoproturon, MCPA, mecoprop). Sulfonylureas and imidazolinones are the two herbicide groups with a significant increase in use during the last 5 years. The chemical structures of one selected compound from each group and subgroup are given in Fig. 1.2.
References pp. 89-94
18
Chapter 1
TABLE 1.9 MAIN PESTICIDES GROUPS AND SUB-GROUPS Groups
Related sub-groups
Amide Azole Aryloxyalkanoic acid Dinitroaniline Diazine Carbamate
Acylanaline, chloroacetanilide, dichloroanilide Triazole, conazole Phenoxyacetic acid and salts
Diphenyl-ether Imidazolinone Organochlorine Organophosphorus Pyrethroid Pyrimidine Sulfonylurea Triazine Urea Various
1.2.2.
Carbamate, thiocarbamate, dithiocarbamate and dimethyldithiocarbamate
Phosphate, phosphonate, phosphorothionate, phosphorodithioate, phosphorothiolate, phosphoroamidate
1,3,5-Triazine, 1,3,5-triazinone, 1,2,4-triazine Phenylurea Single structure, no specific structure (benzoic acid derivatives), analyte containing too many functional groups to be easily classified
Physicochemical parameters: definition and data collection
The characteristic data of pesticides are usually measured according to well established protocols recognized by national and international agencies (US EPA guidelines, OECD and EU protocols, etc.). Most of the physicochemical data are measured in the laboratory under well-defined experimental conditions. Some data are characteristic of the single pesticide molecule, e.g., water solubility, vapour pressure, volatility, stability in water, photodegradation, water-octanol partition coefficient. Under given experimental conditions (temperature, pressure, pH, etc.), experiments should lead to similar values. Other, data such as the half-life in soils, or water-soil partition coefficients are measured in laboratory and/or field experiments and are strongly dependent on the experimental and environmental conditions, so they are only partly characteristic of the pesticide molecule. Therefore, data values that can be found in the literature sometimes spread over a wide range and it is not always easy to select "reliable" data. Characteristic data have been collected for more than 250 pesticides. Our criteria were pesticides included in the various current survey lists in the US and European countries [1,3,23-25] and in recent usage. Those reported to occur in surface- or
Fig. 1.2. Chemical structure of selected compounds of the different chemical classes of pesticides.
Pesticides and their Degradation Products Propanil (anilide)
19
Metolachlor (chloroacetanilide)
~/ ~
CI_~NHCOCH2CH 3
Carbofuran (carbamate)
CH2CH3 ._N ,COCH2CI
C'
~
Iprodione (dicarboximide)
CH3 C H 3 " ~ "CH3
Propiconazole
~
OCONHCH3
"CHCH2OCH3
CH3 OH3 Benalaxyl (acylalanine)
Cycloate (thiocarbamate)
CI
O
CI
O
"CONHCH(CH3)2
?COSCH2CH3 CH2CH3
CN3
Maneb (dlthiocarbamate)
Fenothiocarb (dimethylthiocarbamate)
[ - SC(S)NHCH2CH2NHCS2Mn- ]x
O (CH3)2N(~S(CH2),O-~
2,4-DB
(aryloxyalkanoic acid)
(azole)
# C!li ~ x ~ ' C l O
Chlornitrofen (diphenyl ether)
- - ~ CI
In,azapyr (imidazolinone)
CI
O(CH2)3CO2H
(CH3)2CH
CH3CH2CH
.
N3,N
c,
N ~ CH3 II )~O
CI ~CO2H
Trifluralin (dinitroaniline)
Bentazone (diazine)
NO2
Hi
NO2
O
Dichlorvos (phosphate)
Lindane (organochlorine)
CI I
Trichlorfon (phosphonate)
O , CI2C=CHOP(OCH3)2
O II Cl3CCHP(OCH3)2 OH
Parathion (phosphorothioate)
Demeton-S-methyl (phosphorothiolate)
S O II II OP(OCHzCH3)2 CH3CH2SCH2CH2SP(OCH3)2
O2N
Heptachlor (organochlorine)
CI Atrazine (1,3,5-triazine)
Chlorsulfuron (suifonylurea) OCH3
,-~
N=,x
CI
CI
CH3
Hexazinone (1,3,5-triazlnone)
CH3
(CH3)2N.,~.N...~O
CI-,.~ N~],.-NHCH2CH3
N..r~N NHCH(CH3)2 Metribuzin (1,2,4-triazinone) N-N (CH3)3C-~N>--" SCH3
(J~ \NH2 Azinphos-ethyl (phosphorodithioate)
Fenamiphos (phosphoroamidate)
Chlorotoluron (urea)
CH3
CH3S- - - ~ x OPINHCH(CH3)2 OCH2CH3
O Deltamethrin (pyrethroid) Br"C=CH OH3"~ H
H H/'C CH3
Ethirimol (pyrimidine) CH3
CN O.~
References pp. 89-94
N
CH3(CH2)3 T OH
NHCH2CH3
CH3-'~NHCON(CH3)2 CI
Bromacil (uracil) Hi CH3~ N../.O
Br~ ""111 "C,HCH2CH3 O
Paraquat (bipyridylium) CH3-N~N-CH3
CH3
Fenpropimorph (morpholine) CH3 #--.-& CH~ /---< (CH3)3C~CH2C;HCH2--N~ 0 CH~
20
Chapter 1
ground water monitoring have been added. We have also included data for compounds which are difficult to analyze, such as polar compounds. 1.2.2.1. Water solubility Water solubility is a fundamental, chemical-specific property defined as the concentration of a chemical dissolved in water when that water is both in contact and at equilibrium with the pure chemical. In Table 1.10, water solubilities are reported, measured in mg/1 and at temperatures in the range 20-25~ These values are those given in the Pesticide Manual [17] and are to be considered first for analyses of pesticides in water because they immediately indicate whether extraction from aqueous media is easy, difficult or impossible. As a general rule, a very soluble ingredient (water solubility above several g/l) cannot be extracted from water with the available extraction procedures. Very insoluble ones (water-solubility lower than 0.5-1 mg/1) are difficult to analyze at trace levels because they have a tendency to adsorb everywhere, especially on glassware; this leads to low extraction recoveries, unless some organic solvent is added to the samples prior to extraction. Water solubility indicates the tendency of a pesticide to be removed from soil by runoff- or irrigation water and to reach the surface water. It also indicates the tendency to precipitate at the surface soil. However, this parameter alone cannot be used for predicting leaching through soil, although the distribution of pesticides in the environment is conditioned by a variety of partition coefficients into water, and several authors have shown correlations between these partition coefficients and the water solubility. 1.2.2.2. Water-octanol partition coefficient This parameter is usually reported as a logarithm usually as log Kow or log Pow. It is defined as the ratio of the equilibrium concentrations of the two-phase system consisting of water and n-octanol. The concept of Kow was developed in the pharmaceutical industry as a useful index of a drug's behaviour in the body, because partitioning between water and octanol roughly mimics partitioning between water and biotic lipids. This parameter is characteristic of the liphophility of the molecule and gives an indication of the compound's tendency to accumulate in biological membranes and living organisms. Its determination gives data required for the registration of new organic chemicals. It is generally considered that substances with a log Kow value higher than 3 can show accumulation. This risk is measured experimentally by the bioconcentration factors in aquatic organisms, and some correlations have been found between these two parameters for very hydrophobic pesticides such as the organochlorines. Some persistent organochlorines withdrawn from the market were all characterized by log Kow > 4. The polarity of a molecule is strongly correlated with Kow. Polarity refers to the extent to which charge is unevenly distributed within the molecule and to the occurrence of polar functional groups in it. As a rough rule, non-polar analytes are char-
,.o
0
o
~2
"o
v
~8
o
> ~ , ~
r r.~
r ". 0,.,~
r
o
or~
~
c}
~
~
~
9.-~
r
o
o
~
~ ~
T..)
0
6u,~NN~oou
0
9
.~
~ ~ o ~
i~ i~ ~,
~ ~"~-
~
o ~ o 2.~ ~ ~
o
. .
Pesticides and their Degradation Products
%
r.~ f.~
0 r.~
r~ 0 r~ ,-1
100 Pa m 3 mo1-1) [44]. Other methods involve a flow system in which the concentration of the chemical in water with a steady stream of gas is measured as a function of time [45]. As a consequence of these variations in methods, the H values reported by different authors exhibit wide discrepancies, as is found for values of vapour pressure. The values reported in Table 1.10 come mainly from the critical review of Suntio et al., who calculated H values from selected vapour pressure and solubility values [41 ]. It is generally considered that compounds with H values < 10-5 Pa m 3 mo1-1 have little tendency to volatilize.
1.2.2.6. Normalized soil sorption coefficient (Ko~) One of the most critical factors for assessing the potential mobility of most pesticides in the soil compartment is the distribution between the solid and liquid phases of soil. This partitioning presents a difficult problem since the types of soil in the environment vary enormously. A first characterization is the measurement of the simple "sorption" coefficient, Kd, defined as the ratio of the concentration of the chemical adsorbed on soil to the concentration of pesticide in the soil solution. This can be measured simply by experiments endorsed by the OECD Council in 1981
Pesticides and their Degradation Products
39
[46]. Various studies have demonstrated that for adsorption Ka values measured in a range of soils, good correlations were obtained between Ka and the organic matter content of the soil. This indicates that the principal adsorption mechanism involves an interaction between the pesticide and the organic matter component of the soil. Therefore, the adsorption coefficient is normalized to take into account the different soil organic matter or organic carbon content, and Ka values are expressed per unit of organic matter as Kom, or per unit of organic carbon as Kor gom -- 100Ka/(%organic matter)
Ko~ = 100Kd/(% organic carbon) The Koc values are more commonly reported in the literature than gom values. They are referred to as "soil organic carbon sorption coefficients" and expressed in cm 3 g-1. The environmental relevance of this parameter is important for leaching properties in ground water and is discussed later in this chapter. A range of Ko~ values can be found in the literature for the same pesticide because of sensitivity to the characteristics of the soils used for measurements and to the experimental and environmental conditions. Most of the Ko~ values reported in Table 1.10 were selected by Wauchope et al. [30]. Pesticides with Koc values below 50 are considered to be highly mobile; values of 150-500 signify moderately mobile, and above 2000, slightly mobile compounds. 1.2.2.7. Field half-life The degradation of pesticides in the sub-surface of soils is often described using a modified first-order equation: Ct = Co exp[-k(t- to)]
where Ct and Co are the concentrations at times t and 0 (units typically in days), and k is a time constant expressed in the same reciprocal units. The "half-life", T0.5 is defined as the time required for the pesticide to undergo dissipation or degradation to half of its initial concentration. If the above equation is appropriate, the half-life is independent of the initial time and concentration. However, there is not a single halflife for pesticides, and measurements depend strongly on the environmental conditions (soil, site, climate, soil microbial activity, etc.). Both laboratory and field measurements are reported. Laboratory measurements have the advantage of being performed under well-controlled conditions of temperature, light and humidity, but are far from the "real" conditions, because of the lack of vegetation and intense microbial activity. Field experiments are certainly more reliable because they are made under real usage conditions. These include all the dissipation processes, i.e., biotic and abiotic degradation, migration by volatilization, runoff, leaching, plant References pp. 89-94
40
Chapter 1
absorption, etc. As a consequence, the exponential decay function can only be an approximation. Later in this chapter, we give a few examples of field half-lives. This is a subject that needs further research, since half-life data reported in the literature often do not reflect the local climatological conditions. Probably the tropical countries need particular attention in this respect. Many of these countries are still under development and use large amounts of pesticides for cultivation of crops such as bananas, rice and coffee. Since most of the half-life studies have been reported for the US or Europe, they are not applicable to tropical countries, owing to the very different climatological conditions, and soil-water composition. Wauchope et al. [30] noted that data collected from the temperate climate zone can vary over a factor of three. For the reasons given above, To.5 values are certainly the most uncertain. The values reported in Table 1.10 are mainly field data selected by Wauchope et al. [30]. 1.2.2.8. Mobility index Gustafson considered 22 pesticides for which some physico-chemical and environmental data were available and proposed the Ground Ubiquity Score (GUS index) which produces a leaching classification based on soil half-life and Koc:
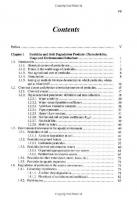
GUS = log To.5 x ( 4 - log Koc) These values are presented in Table 1.10, calculated from T0.5 and Koc values [1]. This parameter is discussed later. 1.3. E N V I R O N M E N T A L R E L E V A N C E IN THE AQUATIC ENVIRONMENT In evaluating the potential impact of a pesticide, one must consider its distribution and fate in the soil and in water. One should also consider the patterns of its use in localized areas, such as greenhouses or around buildings, with a limited environmental contamination, or whether it is widespread, as with the normal field-use of pesticides, or distributed by helicopter or plane. An example of the different types of pesticide pollution is shown in Fig. 1.4. Figure 1.4 shows that the important causes of pollution are: (i) direct pollution of wells and well borings by surface runoff waters, spills, and back-siphoning of dilute pesticide solution from spray equipment to the well; (ii) leaching from sites where tractors and sprayers are rinsed; (iii) leachate from municipal landfills and small waste disposals; (iv) infiltration of pesticide polluted water from lakes and rivers; and (v) leaching of surface-applied pesticides through mass flow or preferent-flow macropores [47]. It is essential to consider the environmental distribution of pesticides and their transformation products. Most pesticides are applied directly to the soil, or will reach
Pesticides and their Degradation Products
41
Back
Overflow \ [..., =_~, Run:ffilla~e ~ ~ . . ' ~ ~ siphoning
- keachin-gI!IiI ; I f
.#
~GrounLater
Rinsing Waste disposal
J~6~7~fnaeCwfer~~
) ~j~ ) -
[ ~ ~ ~~. - O--//U/-tl~q-~~--Leaching
S
Fig. 1.4.Pesticidepollution of water may be caused either by direct pollution of wells or well-boring,by leaching from point sources on soil surface, or in waste disposal sites or by leaching after treatment. the soil in spray after-drift or runoff during the spraying of crops. Studies on the fate in soil are therefore essential. Also, where the pesticide is applied directly to the water, via leaching, runoff or in the ways shown in Fig. 1.4, significant amounts of chemicals or their degradation products will reach the aquatic systems. In this respect, studies on the fate of pesticides in soil/water or sediment/water are being undertaken, and will provide knowledge on this behaviour. Such studies should supply information on: (i) rates of degradation of the pesticide in the soil; (ii) the nature and likely persistence of the major transformation products; (iii) the distribution of the pesticide and its transformation products via leaching, runoff and volatilization; (iv) possible contamination of aquatic systems; and (v) the fate of the pesticide and/or its transformation products in the aquatic system (when needed). Such information is vital for the prediction of the environmental fate of a pesticide. A study of the Minnesota river watershed, where atrazine, alachlor and cyanazine are being applied, showed that the intensive cultivation practices and subsequent soil erosion, resulted in high suspended sediment concentrations of 100-1000 mg/1 in the river. In addition, because the soil porosity is poor, much of the farmland had been tiled to enhance drainage. Figure 1.5 describes the dominant flow paths for drainage from agricultural fields in the Minnesota river watershed. The overall delivery of the water to the river is dramatically enhanced by subsurface drainage networks which increase the drainage by facilitating the removal of infiltrating water or collecting pond water and removing it through vertical tiles. Water removed to the tile networks is ultimately routed to drainage ditches, tributaries or naturally draining topography. Overland flow and removal of pond water via vertical tile drains are considered here as surface transport pathways (pathway A). Subsurface flow (pathway B) corresponds to water that travels through the unsaturated zone and is collected and transported by the tile lines, as well as water that infiltrates to the water table (pathway C) and then moves to the river in the local and/or regional groundwater References pp. 89-94
42
Chapter 1
Fig. 1.5. Transport pathways of water and associated herbicides in agricultural fields. Three major mechanisms exist in the Minnesota river watershed: overland flow or runoff (pathway A), subsurface flow enhanced by networks of tile drains (pathway B), and leaching into the water table and transport with ground water flow (pathway C). Some of the networks have vertical risers to remove ponded water, flow through these rivers, or rapid infiltration to a horizontal tile line produces a discharge signal similar to overland flow [48].
system. Tile drainage networks have the potential of producing two different hydrological and chemical signals: a rapid response via routing through vertical tile risers and/or fast infiltration to horizontal tiles, or a delayed signal via slow percolation of water into buried tile networks. In the above study, it was shown that the metabolite of atrazine, de-ethylatrazine, was present throughout the year. Half-lives of 21 and 58 days were calculated for 1990 and 1991, respectively. The longer conversion time in the 1991 soil was thought to result from rapid flushing from the soil and less exposure to soil microbes. In this respect, it should be noticed that the half-lives under real conditions can depend on the different mechanisms of transport of pesticides mentioned in Fig. 1.5 [48]. Another point to consider in the behaviour of pesticides is the so-called soil pore water. One of the more studied examples has been atrazine [49]. De-ethylatrazine and de-isopropylatrazine, major metabolites of atrazine, were found in the soil pore
43
Pesticides and their Degradation Products TABLE 1.11 SOLUBILITY IN DISTILLED WATER AT 22~ POINT FOR SEVERAL TRIAZINES Compound
Atrazine
De-ethylatrazine De-isopropylatrazine
Solubility (mg/1)
PARTITION COEFFICIENT (Kd) AND MELTING
Melting point (~
Kd [(ng/g)/(ng/ml)]
33
175
1.1
670 3200
133 177
0.4 0.3
water. To assess their relative adsorption on soil, the partition coefficients of the three compounds have been determined, and are shown in Table 1.11. It can be seen that the order of retention in soils varies as a function of the alkyl chain-length, as de-isopropylatrazine < de-ethylatrazine < atrazine. Following these studies, it was found that the DAR (relation between concentrations of de-ethylatrazine to atrazine ratio) was higher in soil pore water than in soil cores sampled from the same depth. The greater mobility of dealkylated metabolites throughout the unsaturated zone, via soil pore water, may pose a potential threat to groundwater quality, especially in more porous soils. Another topic of importance is the prediction of the transfer of pesticides into the aquatic environment. A list of physicochemical properties has been given in Table 1.10. A paper that has been much used for such studies is by Gustafson [50]. In this, a method has been proposed for 22 priority pesticides, which considers soil mobility and soil persistence to indicate which should leach and which should not. A particular combination of these two properties separates the leaching and non-leaching pesticides. The Gustafson expression, or GUS index, is given by GUS = log(soil half-life)(4- log Koc) When GUS is >2.8, the pesticide can be considered to be a leacher; for GUS higher than 1.8 and lower than 2.8, the pesticide can be considered a transition leacher, and for values lower than 1.8 the pesticide is considered to be a non-leacher to ground water. Typical values of the GUS index for common pesticides are indicated in Table 1.10. Other papers have showed correlations between the soil sorption constants based on organic carbon, water solubility, octanol-water partition coefficient, retentiontime in reversed-phase HPLC, and molecular weight [51]. In general, it has been shown that the chemicals with a low water solubility tend to adsorb to soil, those with a low vapour pressure tend to dissipate slowly from water, and those with relatively high octanol-water partition coefficients, or low water-solubility, have a high potential for bio-concentration [52]. References pp. 89-94
44
Chapter I
The choice of different soil types with different characteristics such as pH, organic matter, particle-size distribution, and biomass, and which should be fully characterized, is needed. Studies of various soil types - and usually fresh soils, since storage or drying causes loss of part of their microbial degradation capacity - are needed. Similarly, studies are required on the choice of sediments, the different water types (i.e., surface, ground, river, estuarine and soil-pore water) and the pesticide formulations for use under different application conditions. These should provide a better understanding of the behaviour of pesticides in the aquatic environment. 1.3.1.
Pesticides in soil
After application, a significant portion of the pesticides applied in agriculture is found to remain associated with the soil over long periods of time. It is important to ascertain the toxicity and stability of these chemicals in the soil environment. Soil itself plays a major role in determining the fate of chemical pollutants. In the soil, xenobiotics may be transformed by biotic or abiotic processes thus leading to pesticide transformation products. The study of pesticide metabolism in soil, sediment and waste systems is of great importance from environmental, ecological and economic standpoints. Most of the studies during the last few years have focused on the kinetics of degradation of the parent molecules, some transformation products have also been characterized in many instances. The various factors related to the transformation of pesticides in soil have been reviewed [53]. The mobility of pesticides in soils is relevant to their leaching, volatilization and bio-availability to flora and soil. This mobility is largely dominated by sorption processes following a variety of mechanisms. These processes depend on the lipophilicity of the pesticide, the soil mineralogy and organic matter content, and especially the soil humidity. In general, it has been stated that a decreasing water content increases adsorption and reduces the mobility, increasing temperature reduces the adsorption and increase mobility, increasing clay-mineral content and organic-matter content increase adsorption and reduce the mobility, and that plant cover increases metabolism and reduces leaching. Some of these aspects are discussed in more detail below. It is known that the soil type has a profound influence on the persistence of pesticides and their transformation products. The soil pH, for example, is an important parameter affecting the persistence of chemically unstable pesticides, especially those belonging to the organophosphorus and carbamate groups. The adsorption and mobility are interrelated, and the mobility depends essentially on the degree of interaction between the pesticide molecule and the soil components. The mobilities of acidic herbicides, organophosphorus pesticides, and atrazine are pH-related, with higher mobility in soils with higher pH [54]. In general, we can say that pesticides and their degradation products persist longer
Pesticides and their Degradation Products
45
in sandy soils than in organic-rich soils, and that the addition of rice straw accelerates the degradation of pesticides. Other aspects to consider, related to the soil type, are the differences in redox potential when soils are flooded, and the impact of flooding on pesticide-degrading microorganisms which might be responsible for such variations in the degradation pattern of pesticides in different soils. There is increasing evidence that chemically catalyzed interactions between the dominant redox system and pesticides or their degradation products may be common and widespread in anaerobic conditions such as flooded rice soils [55,56]. The water regime also affects the extent of degradation, the type of products formed, and the persistence of these product on soils. Usually, under flooded conditions, many organophosphorus (parathion, fenitrothion) and carbamate (carbaryl) pesticides are hydrolyzed. The degradation of the pesticides in soils is closely related to the redox potential following the flooding conditions. The redox status of most soils rich in active organic matter decreases within a few days after flooding. A recent study has been made on the pesticides triclorpyr and benomyl, which are applied after the permanent flood on a rice field [57]. In general, their dissipation in the rice-paddy water was rapid, by hydrolysis. For carbofuran, one of the most important mechanisms was shown to be adsorption to the soil, and the data indicated that breakdown in soils is rapid at 2 and 20 cm depth, so ground water contamination for rice production is probably low. However, higher concentrations of carbofuran would most likely be found in the paddy water since its target pest residues are there, and it is applied in granular form. Thus its potential would be greater for surface water contamination than ground water contamination if the flood water from the rice field is not maintained within the levels of the field. Organic matter and temperature are the other two parameters that essentially affect the formation of the transformation products of pesticides in soil samples. In general, by increasing the organic-matter content and the temperature, the degradation of pesticides in soils is enhanced. When the organic-matter content increases, the biomass of the active microbial population also increases and so does the degradation. The effect of temperature on degradation has been shown in different studies conducted in tropical ecosystems [58,59]. It is clear that the high temperatures encountered in the tropics will lead to faster degradation of pesticides, as has been shown for a few examples: fenitrothion, methyl-parathion, diazinon, carbaryl and carbofuran. For terbuthylazine, it was also been shown that the half life varied from 38 days at 25~ to 14 days at 35~ and also varied according to the soil type; it was always shorter in tropical regions [60]. The role of the organic matter in soils is very important. It has been shown that the most persistent complexes result from the direct covalent binding of pesticides to soil humic matter or clay. The pesticides most likely to bind covalently to the soil have chemical functionalities similar to the components of humus. The humic material is derived from the remains of decomposing plants, animals and microorganisms, and is composed primarily of humic and fulvic acids. These molecules are polymeric References pp. 89-94
Chapter 1
46
Review From
From
DIQUAT
From
PROPANIL pARATHION
0 Cl
~ o
From
o-
/
~
0 $=p/O"C2H5 CI
~'o
2.4 -D
!
m
1
..
o_.~~-~_.~
o "r IOL~C~J
Fig. 1.6. Example of binding of different pesticides to humic substances in soil.
and consist of an aromatic moiety containing mono- di- and polyphenolic subunits. In fact, phenolic compounds account for up to 30% by weight of the humic polymer. It is important to note that humic substances occur not only in the soil fraction, but also in sewage effluents, peat, coal, and lignite, and also in river, marine, and lake sediments. Thus, pesticides that structurally resemble phenolic compounds can bind covalently to humus, and their complexes can be found in all of the above environments. Figure 1.6 gives an example of the binding of the various pesticide families to humic substances. The cation exchange capacity is a further parameter to take into account, and was a significant predictor of the mobility of, e.g., diazinon and carbofuran. This capacity has been correlated negatively with the movement of pesticides and positively with adsorption [56]. The clay content should also be taken into consideration. Adsorption is often correlated with the clay content of soils and the mineral fractions of clay play an important role in adsorption. Organic matter has a stronger effect, but the adsorption of pesticides on to clay is important because must soils contain much more clay than organic matter, and the clay contributes significantly to the cation-exchange capacity. The influence of clay on pesticide adsorption and mobility is more evident in subsoils, which are rich in clay and poor in inorganic matter [54]. In order to investigate the soil degradation of pesticides, laboratory incubation
Pesticides and their Degradation Products
47
studies with ~4C-labelled pesticides are required. These allow one to assess the likely rate of degradation of parent pesticides in soil, and provide information on the structure and likely degradability of metabolites. The studies should also assess the rate of mineralization of the pesticides by monitoring the rate of formation of 14CO2. Traps should also be included in the apparatus to retain any other volatile compounds released from the soil. The 14C mass balance resulting from these studies is an important element of the hazard-assessment process. Degradation under aerobic conditions is of primary interest. Testing under anaerobic conditions may also be important in certain cases, to observe reductive reactions, e.g., with pesticides which penetrate deeply into the soil profile or which are used in paddy rice. Incubation with sterilized soil is sometimes carried out to determine the extent to which chemical mechanisms participate in the degradation of pesticides, and is also of interest. 1.3.1.1. Atrazine degradation in soil
One of the pesticides whose degradation in soil samples has been much studied is atrazine. An interesting paper has been published on the persistence and degradation of 14C atrazine in soil [61 ]. The degradation pathway of atrazine in soil is shown in Fig. 1.7. This was investigated under saturated and unsaturated conditions with samples of soil taken from four depths down to 120 cm. It was shown that under saturated conditions under 90-120 cm depth, the half-life of atrazine was 87 days. Deisopropylatrazine was less persistent in saturated soils with a half life of 58 days. The increased degradability of de-isopropylatrazine as compared to atrazine, and the reduced persistence of de-isopropylatrazine under saturated soil conditions, provide a logical explanation for its relatively low concentration in ground water, compared to atrazine. In this context, it was shown that de-isopropylatrazine was more susceptible to degradation than atrazine, in the top soil; the persistence of both compounds increased at greater depths. The microbial degradation of atrazine to de-isopropylatrazine is less favoured than that to de-ethylatrazine. The lower degradability of deisopropylatrazine than of atrazine, and the reduced persistence of de-isopropylatrazine under saturated soil conditions might also explain the very low concentrations of de-isopropylatrazine detected in ground water, as compared to atrazine and de-ethylatrazine. In this context, it has been shown [62] that the atrazine ring and its isopropyl side chain were mineralized more slowly under denitrifying conditions than under aerobic conditions in soil systems. Oxygen limitation at greater soil depths will retard the atrazine transformation and mineralization as the soil environment becomes more anoxic. The limitation is that if atrazine or its metabolites are transported into the deeper soil and ground water where denitrifying conditions may prevail, mineralization and the transformation of atrazine and its metabolites will be greatly reduced. The slow biotransformation pathway for atrazine and de-ethylatrazine is dealkylation by loss of the isopropyl side chain and this, in combination with denitrifying conditions, may account for the frequent detection of atrazine and some of its metabolites, especially de-ethylatrazine. Also, at greater soil depths the References pp. 89-94
48
Chapter 1
C!
Call ~ - Nit"
c, llaN N
Atrazine
/
(ATP3
(DI~
C2H s -
N-CH
Hydroxyatrazine (HYA) '
IL
--"
N
c2,, - NSLNH. Deisopropylatrazine
,
OH
c!
OH
N-CH H CH~
Deethylatrazine (DEA) ,
ll2N
N - C I! H CII~
N
CI
Didealkylatrazine (DDA)
OH
i
N -CH H CH~
Deisopropylhydroxyatrazine
OH
Deethylhydroxyatrazine (DEHYA)
~,~///k~ k HaN
N
(DIr~~
NHa
Ammeline o H / ,~~,, ~ ~ ----~Biurate - .o o. Cyanuric Acid N
Fig. 1.7. Degradation pathway of atrazine in soil.
CO~ Urea ----~ * NH3
49
Pesticides and their Degradation Products
microbial activity will be much lower with lower organic carbon, thus retarding the biotransformation processes even more. The slow dealkylation by loss of the isopropyl side chain of atrazine, and its even slower mineralization under anoxic conditions, will have implications for bio-remediation of sites contaminated with atrazine. Similarly it was shown [63] that, under field conditions, atrazine, simazine and deisopropylatrazine undergo preferential removal of an ethyl rather than an isopropyl side chain in the unsaturated zone. Furthermore, the dealkylation rates for atrazine and simazine are comparable and approximately 2-3 times more rapid than those of de-isopropylation of atrazine and propazine. This indicates that the removal of an ethyl side chain is preferred over that of an isopropyl side chain, regardless of the nature of the parent triazines. Further dealkylation of mono-dealkylated metabolites at depth in the unsaturated zone shows preferential removal of ethyl rather than isopropyl side chains. The degradation of atrazine in a deltaic rice soil is shown in Fig. 1.8 [64]. From this figure it can be seen that: the half life is ca. 1 month: and de-ethylatrazine is always detected to some extent with a ratio of de-ethylatrazine/atrazine of 0.1-0.3. Also, there is permanent soil contamination of the Ebro delta area by atrazine, which corresponds to a value of 20-25 ng/g, approximately 8% of the level detected when atrazine has been freshly applied (310 ng/g). The degradation of the herbicide atrazine in soils has led to numerous investigations. Three different factors affect the process: biological degradation, chemical degradation and volatilization. The conversion of atrazine to its main metabolite, deethylatrazine, results primarily from the metabolic activity of soil bacteria and fungi [65]. The formation of de-ethylatrazine as the main metabolite from atrazine has
ng/g
A
70 60
Application
50
310 n g / g
40 30
_-----4-
20 10 I
0
12/09
17/10
20/12 Day/Month
"f
(1990-91)
Atrazine
o ~- D e e t h y l a t r a z l n e
• 0 Deisopropylatrazlne
Fig. 1.8. Degradation of atrazine in a deltaic rice soil. References pp. 89-94
1
10/04
6/02
1
i
1
20/05
1
1
27/06
50
Chapter 1
been reported in a number of papers dealing with its behaviour in soil samples [66,67]. Chemical degradation by processes such as hydrolysis appear to be more important than biological degradation in sandy soils with organic carbon content up to 4.3% [68]. It has been reported that the concentration of atrazine in the same type of soils is consistent with the soil's organic matter and clay content, with the organic matter trying to immobilize atrazine [69]. Volatilization of atrazine seems to be of minor importance compared to the other degradation pathways. A report showed volatilization of atrazine in a soil from Maryland to be negligible, with only 2.4% loss after a 21-day period, indicating that such losses were much smaller than disappearance by chemical degradation [70]. This can be explained by the vapour pressure value of atrazine which is 0.00004 Pa, much lower than that of fenitrothion (0.0072 Pa) [41]. Consequently, fenitrothion losses in Ebro delta soils, where it is currently applied, are reported to be caused mainly by volatilization [71 ]. Under the real environmental conditions of the Ebro delta area, gave a half life for atrazine in the range reported in the literature. Values of 50 [68], 21.5 [72,73] and 28 days [74] have been reported in soils with similar characteristics to that soil studied in our work. Although volatilization does not play an important role in the degradation of atrazine from soil samples, it does affect the half lives when the temperatures vary between winter and summer periods. Thus the half-life varied between 19 and 60 days, depending on the year and season of applications in Maryland [75], and from 37 to 125 days when the dissipation period covered either the summer (up to 20~ or the winter periods (down to -16~ [66]. For the above reasons, it can be considered that the degradation of atrazine in the Ebro delta soil is caused mainly by chemical degradation since the soil contains a low organic-matter content, below 1% [68,69]. Since most of the sampling has been carried out during the winter season losses by volatilization are negligible. Another aspect to be considered is the so-called permanent contamination by atrazine in the soil. It has been reported that levels of atrazine remaining 238 days after application were 10 ng/g (i.e., 1.5% of the level applied) pesticide remaining after 238 days of application [72]. It has also been reported that on a soil containing 25 ppm of atrazine on the day of application, 30% remained 1 year after incubation. This amount corresponded to atrazine, de-isopropylatrazine, de-ethylatrazine and hydroxyatrazine, and was attributed to bound residues. The formation of such bound residues may be linked with the chemically stabilizing reactions between phenolicOH and -COOH groups of soil organic matter and the pesticide and/or metabolites. It has been suggested that humic materials consist of phenolic and benzene-carboxylic acids joined by hydrogen bonds to form a molecular-sieve type of polymeric structure of considerable stability. One of the characteristics of this proposed structure is that it would contain voids or holes of different molecular dimensions which could trap atrazine and/or its degradation products. It should be added that the application of this structural concept to the bound residues of pesticides and their metabolites in
Pesticides and their Degradation Products
51
organic matter or humic material is still a matter of conjecture [67]. Other authors have suggested a slightly different theory for such a permanent contamination, which is related to the mode of adsorption of atrazine turning slowly from physical to chemical adsorption. It may be that the basic compounds adsorbed onto the silicate surface migrate slowly from certain adsorption sites where they are chemisorbed via salt formation [75]. In the data on atrazine degradation shown in Fig. 1.8, it can be seen that the permanent contamination of the Ebro delta soil by atrazine corresponds to levels of 2025 ng/g, which is ca. 8% of the herbicide applied and is similar to values found by other authors [76]. The level of de-ethylatrazine is usually below 10 ng/g. When considering these levels, we should mention that there is a continuous treatment of soil with atrazine, which has resulted in permanent contamination of the soil surface. According to model programs, atrazine percolation in a soil takes approximately 2 years [77] and so the same period should be required for complete decontamination of the Ebro delta soil. It has also been shown [64] that although atrazine exhibits a half life of ca. 30 days under the Ebro delta conditions, a permanent level of 20-25 ng/g of atrazine has been obtained. This permanent level of contamination has been attributed to the organic fraction of the soil which appears to have a potential for forming bound residues. In this sense it is suggested that atrazine and de-ethylatrazine are retained by humic materials by a process involving adsorption on external surfaces and entrapment in the internal voids of a molecular-sieve-type of structural arrangement. In the future, it will be important to obtain more information about the mechanisms of binding of pesticides and their degradation products in the soil. In conclusion, we should point out that the study of the soil is not the main topic of the present book. The case study of atrazine has been given as an example, but there are many cases in the literature of soil dissipation studies and of the behaviour of pesticides in soil. We are more interested in the fact that after the herbicides are applied to the soil surface, they can leach through the ground and also to the surface waters by a variety of processes .These aspects are now discussed in more detail. 1.3.2.
Pesticides in ground waters
A general scheme of the zones of subsurface water is shown in Fig. 1.9. The data required to determine the environmental fate and potential of a pesticide to reach ground waters include information on its hydrolysis,, aquatic metabolism, leaching, and field dissipation. According to Ref. [78], a pesticide can reach ground water if its water solubility is greater than ca. 30 mg/1, its adsorptivity (Ko~) is below 300-500, its soil half-life is longer than ca. 2-3 weeks, its hydrolysis half-life is longer than ca. 6 months, and its photolysis half-life is longer than 3 days. The Office of Pesticide Programs (OPP) of the US EPA have evaluated approximately 800 active ingredients of pesticides in an effort to screen out those with the potential to References pp. 89-94
Chapter 1
52
Fig. 1.9. Zones of subsurface water.
leach in ground water. The pesticides were screened on the basis of broad criteria related to the mobilities and persistence of the compounds listed in Table 1.12 [79]. If a pesticide was believed to be persistent and mobile, relative to these criteria, it was selected for further evaluation. The potential of a pesticide to contaminate ground waters can also be assessed from the field conditions denoted by the acronym DRASTIC. This is an environmental index which includes seven key hydrogeological factors, namely, the depth to the water table, the recharging of ground water by precipitation and irrigation, the aquifer medium, soil medium, topography (slope), impact of the vadose zone, and TABLE 1.12 PHYSICAL AND CHEMICAL CHARACTERISTICS OF PESTICIDES FOUND IN GROUND WATER Characteristic
Leaching criteria
Water solubility Henry's Law constant Hydrolysis half-life Photolysis half-life Soil adsorption: Kd Soil adsorption: Koc Aerobic soil metabolism half life Field dissipation half life Depth of leaching in field dissipation
>30 ppm 25 weeks > 1 week 2-3 weeks >75-90 cm
Pesticides and their Degradation Products
53
hydraulic conductivity of the aquifer. A DRASTIC score greater than 150, recharge values larger than 25 cm/year, and thin soils with high nitrate levels (a few ppm of natural background), are indicative that pollution of the ground water by pesticides is likely [78]. Koterba et al. [80] have reported the application of DRASTIC to pesticides in shallow ground water in the Delmarva Peninsula. They concluded that the DRASTIC indices indicate that the shallow ground water in a region is generally vulnerable to contamination. The area- and depth-distribution of pesticide residues in ground water could depend chiefly on the patterns of land use, the associated pesticide use, the soils, and the shallow ground water flow. However, the DRASTIC method appears to be limited regarding pesticide movement. Consequently, instead of using DRASTIC, most potentially contaminated areas in the Delmarva Peninsula can be broadly targeted by first identifying leachable pesticides that are used at moderate to high rates and have a wide geographic use in the studied area. Then mapping the use of pesticides in relation to fine-scale data on associated crop types, and on naturally or artificially well-drained areas, provides a combination of features which were shown to relate to areas of shallow ground water contaminated by these pesticides under normal use. One of the key parameters relating to ground water pollution via soils is the mobility (leachability) of the pesticide, which in turn is determined by such factors as Ko~, and the soil half-life and hydrolysis half-life. According to Ref. [50], atrazine, aldicarb, picloram and diuron are most liable to leaching. The types of prevailing soil and water affect pesticide degradation, particularly by abiotic degradation processes (e.g., hydrolysis and photolysis). The European Union has recently proposed a priority list (Table 1.13) of pesticides that can leach or not, based on a consideration of their physicochemical properties (as shown in Table 1.12) and the amount used. These pesticides can be found in ground waters of the EU. Following the three general parameters (toxicity, persistence and input) used for selecting the priority list of pollutants in the UK, a redlist of substances was established that includes several pesticides, most of them common to the EU list. In order to prevent the contamination of ground and drinking water by pesticides in Europe, the priority list considers pesticides of which over 50 tons per annum are used (those over 500 tons are underlined) and their capacity for probable or transient leaching [ 1]. Many of the pesticides indicated in Table 1.13 are also the more widely used (see also Table 1.4). There are a few other pesticides, such as demeton-S-methyl, fentin acetate, mancozeb, propineb, thiobencarb and zineb, which although they are used in amounts over 50 tons per annum, have insufficient data available to allow evaluation of the probability of leaching. Consequently these are not included in the table. Glyphosate and thiram were also not added because large differences in the ground water ubiquity score (GUS) index were found. It is estimated that ground water is the source of drinking water for 90% of rural households and three-quarters of US cities. More than one-half of US citizens rely on ground water for their everyday needs. Owing to the amount of information indicatReferences pp. 89-94
Chapter I
54
TABLE 1.13 PESTICIDES USED IN EUROPE IN AMOUNTS OVER 50-500 TONS PER ANNUM WHICH WERE CLASSIFIED AS PROBABLE OR TRANSIENT LEACHERS
Alachlor Aldicarb Amitrole Atrazine
Benazolin Bentazone Bromofenoxim Carbaryl Carbendazim Carbetamide Chloridazon Chlorpyrifos Chlortoluron Cyanazine 2,4-D Dalapon Diazinon Dichlobenil Dimethoate
Dinoseb Diuron DNOC EPTC Ethofumesate Ethoprophos Fenamiphos Fluoroxypyr Iprodione Isoproturon Linuron Maneb MCPA MCPP Metamitron Metazachl0r Metham-sodium Metolachlor
Methabenzthiazuron Methiocarb Oxydemeton methyl Phenmedipham Prochloraz Propham Prometryn Propiconazole Propyzamide pyrethrin Simazine Terbuthylazine Terbutryn Triademinol Trichlorfon Trichloroacetic acid Vinclozolin Ziram
ing the presence of pesticides in ground water in the US states [81 ], a joint research project between the Environmental Protection Agency (EPA)'s Office of Drinking Water (ODW) and the Office of Pesticide Programs (OPP) conducted a statistically based survey of pesticide contamination of drinking water wells. During the National Pesticide Survey (NPS) (see Table 1.8) 1349 drinking water wells were sampled and analyzed for 101 pesticides, 25 pesticide transformation products (TPs) and nitrate, with a total of 127 analytes. The results of the NPS were released in November 1990 (Phase I) and January 1992 (Phase II). The selection of the analytes was based on a use of at least 1 000 000 lb in 1992, water solubility greater than 30 mg/1, and a hydrolysis half-life longer than 25 weeks. Pesticides and pesticide degradation products previously detected in ground water, and the pesticides regulated under the Safe Drinking Water Act, were automatically included in this priority list. There have been many studies on the levels of pesticides in ground waters, in the US mainly [82,83], many of them related to triazines, and to insecticides such as carbofuran, carbaryl, chlorpyrifos, dimethoate and deltamethrin. From 105 collected ground water samples, 47% contained residues of pesticides. Surprisingly, carbofuran was one of the pesticides found at the higher concentrations, at 1 #g/1. However, few studies have been performed on the behaviour of carbamates in ground waters. As a case example, we discuss one area, with the monitoring of various wells during a 1-year period.
Pesticides and their Degradation Products
55
1.3.2.1. Carbamate pesticides
There is considerable information on the non-point source pollution of surfaceand ground waters by herbicides such as triazines, amides and phenylureas [84-86]. However, hardly any data can be found on the ability of other pesticide families, such as the carbamate insecticides, to contaminate ground waters, or about their fate in aqueous environments. Carbamates are of environmental concern because of their high acute toxicity (e.g., aldicarb and carbofuran exhibit an LDs0 in rat of 1 and 8 mg kg -1, respectively). Some are suspected carcinogens and mutagens [87]. Generally, compounds which have a relatively high mobility and exhibit rather long soil halflives can be transported into the ground water, by runoff (irrigation and/or precipitation). According to the GUS scale index, carbamate insecticides are classified as potential leachers because of their high water solubility. Despite their widespread use (e.g., for carbaryl, over 500 tons per annum in the European Union) it is quite surprising that ground water monitoring surveys have so far only given a few carbamate positives. In monitoring within the US, no aldicarb residues were detected in 100 wells sampled [88]. Only 4 wells out of 58 were shown to be carbofuran-positive in a monitoring undertaken in Central Maine (US), while carbaryl residues ranged from undetectable to 38 ng/1 in rivers of Northern Greece [89,90]. The TPs of carbamate pesticides are generally more toxic than the parent compounds; e.g., 1-naphthol has been found to be more toxic to aquatic organisms than is carbaryl, its parent compound [91 ]. Therefore, there is a need to include in monitoring programmes the main polar carbamate TPs, as recommended by the National Pesticide Survey and as can be seen in Table 1.8 [92]. This will provide the information about their threat to ground waters. A case study has been recently reported for Almeria, which is a Spanish province located in the Southwest of the Mediterranean coast [93,94]. With 36 460 hectares of cultivated fields, mainly greenhouses, this region has become one of the major suppliers of green vegetables to most of the EU countries. The major crops grown include peppers, tomatoes, melons, and cucumbers; total production reached 1 384 240 tonnes during the 1992-1993 season. With a hot and dry climate (average maximum temperature 24.2~ and an average annual precipitation of 300 mm) large amounts of insecticides and, to a lesser extent, fungicides are sprayed to improve crop yields. Herbicides are used in very low amounts for weed control, as a consequence of the regular sprinkler or furrow irrigation. Figure 1.10 shows the area of Almeria (South East Spain) where the well water monitoring took place. The soil is predominantly silt; loamy with value near 60%. The clay content at the surface is 20% but it tends to increase with the depth. The organic-matter content averages 2% in the 1-50 cm surface layer, but falls rapidly with depth to a very low level. The Almeria soil has the ability to adsorb pesticides and has a rather high hydraulic conductivity; consequently pesticide movements can be expected. The soil pH is very similar between samples ranging from 7.5 to 8. One of the major factors References pp. 89-94
56
Chapter 1
Fig. 1.10. Almeriaarea with the monitoringof the different wells. affecting leaching is the water recharge rate (rainfall plus irrigation minus evapotranspiration). The extensive use of irrigation has been one of the reasons for the movement of agrochemicals in the soil. The amount of deep percolating water produced by irrigation can be related quantitatively to the leaching capacity of pesticides [95], and irrigation schedules can dramatically affect the downward movement of water soluble pesticides. In addition, the extensive use of greenhouses in this area would promote more rapid degradation of residues resulting from increased soil temperatures. In this respect, the agricultural practices have affected the Almeria ground water quality. The total pesticide pollution exceeded the maximum contaminant level for drinking water (0.5/tg/1), allowed by the EU Drinking Water Directive twice a year, in the summer (June, July) and the late winter (February, March), as shown in Fig. 1.11. The overall pollution behaviour is similar in each of the four wells despite a great variation in the hydrological conditions through the aquifer. The lack of spatial variation within the aquifer can be explained by the low flow within it, which results from its over-exploitation for irrigation purposes. The carbamate insecticides methiocarb, methomyl, and carbofuran and the triazine herbicides, simazine and atrazine were the main pollutants. Seasonal variations showed different environmental behaviours for the two pesticide families. The triazines are chemically stable and contamination levels of 0.04-0.2 ktg/1 were detected throughout the year. These
57
Pesticides and their Degradation Products ATRAZINE
X1031.5I ^
CARBOFURAN
TETHOMYL METHIOCARB
SIMAZlNE
..|
----lJ 9 '~
I
I
"\
I-
.~
"\
/
I=
\
't
I
I.
13.
4
3.2 3.5 4.1 3.6 2.8 4
4.4 4- 0.3 4.8 4- 0.3 5.9 4- 0.3
4- 0.2 4- 0.2 4- 0.2 4- 0.2 4- 0.2 4- 0.2
4.1 4-0.3 5.3 4- 0.3 5.7 4- 0.3
3.8 4- 0.2
log k' w values extrapolated from the relationships between log k' and the percentage of methanol.
tion of chlorophenoxy acids which were performed from a 200 mg cartridge with 3 ml of acetone for a subsequent GC analysis after derivatization [153]. As shown below, the desorption of an hydrophobic pesticide such as alachlor was performed with 4 ml of pure methanol from a 200 mg cartridge. The use of C~8 silica and Envi TM ChromP were compared for the analysis of polar thermolabile pesticides and surprisingly, recoveries were found to be lower using a cartridge packed with 2 g of Envi TM ChromP than when using a 2 g C~8 silica [154]. However, this can easily be explained by the fact that for both columns, the desorption was achieved with 5 ml of methanol, which is a minimum volume for 2 g of C18 silica (about twice the void volume) but too low for the SDB resin. All the other considerations that were mentioned for the desorption of non-polar pesticides from C18 silica cartridges are significant for desorption from these polymeric sorbents. Application to the extraction of polar pesticides. Some applications have been presented which show the advantage of the SDB disk over C~8 silica for better retention of compounds such as chlorophenols and other pesticides [155,156]. The recent HSA/SDB sorbents were investigated for the extraction of very polar pesticides and degradation products [151,157]. Table 4.12 compares the recoveries obtained on C~8 disks by percolating 500 ml of water spiked with polar pesticides to those obtained by percolating 1 1 of water spiked with the same compounds through a SDB disk or through a HSA/SDB cartridge. Recovery data for oxamyl and de-isopropylatrazine show the highest retention obtained with the new polymeric 200 mg cartridges. Only oxamyl has a breakthrough volume lower than 1 1, but the recovery is 88% and much higher than that obtained with the SDB disk (27%). The recoveries of 13 polar pesticides (with log Pow values 374~ and P > 221 bar) and the resulting corrosive nature of water in theses conditions. Hawthorne et al. have shown that subcritical H20 (250~ and 350 bar) was able to extract PAHs quantitatively from certified soil and air particulate samples in 15 min, as well as more polar compounds such as chlorinated phenols at lower temperatures [259,260]. Although this fluid will certainly be used more in environmental analysis in the near future, its application to pesticide analysis will be restricted to the thermally stable materials, and we can predict that CO2 will remain the fluid of choice for pesticide analysis. 4.2.5.1.2. Important parameters Temperature and pressure. The two basic parameters are the extraction recovery (usually expressed in mass percentage) and the extraction rate (extraction recovery per unit of time, at a given velocity of the supercritical fluid through the cell). The realization of a SFE requires the optimization of several parameters, mainly the pressure and temperature, the possible addition of an organic modifier to the fluid, and the flow rate [239]. Pressure and temperature are the two main parameters that influence the extraction recovery. Together, they define the density of the supercritical fluid, as shown by the well-known pressure-density diagram at different temperatures [239]. The maximum extraction fluid density is obtained with high pressures at temperatures close to the critical temperature of the fluid. An increase in pressure at a given temperature results in an increase in the density of the fluid, which means a better solubility of the solutes, as illustrated in Fig. 4.30 which shows the percentage recovery of atrazine from soil by extraction with CO2 at different pressures after 15 min at 80~ and constant flow rate, compared with the solubility of atrazine in CO2 at the same temperature [261]. However, one is not always recommended to increase the pressure too much for complex matrices because more interferences will also be coReferences pp. 349-356
Chapter 4
328
3 -
100
E
"O O
~tD
E E
5o
>., c~
| o,,~
loo
9
!
2oo pressure (bar)
O o9
A
3oo
I
t
lo0
2o0
3oo
pressure (bar)
Fig. 4.30. (a) Percentage recovery of atrazine from soil by extraction with CO 2 at different pressures after 15 min at 80~ and constant flow rate, (b) compared with solubility of atrazine in CO 2 at the same temperature. From Ref. [261 ] with permission.
extracted, resulting in a loss of selectivity. At constant pressure, the density of the fluid reduces with an increase in temperature so that, for a non-volatile analyte, a higher temperature should result in a lower recovery owing to a reduction in solubility. However, it is important to point out that the solubility of a substance in a supercritical fluid is affected by both the volatility of the substance and the solvating effect of the fluid, which is related to its density. Therefore, an increase in temperature of the fluid can increase the solubility of compounds with significant vapour pressures. For example, the extraction recovery of diuron from soil with methanol-modified CO2 was enhanced from 75 to 99% when the temperature increased from 80 to 120~ [239,262]. Dramatic increases in SFE recoveries have been observed when raising the temperature alone [263,264]. For example, at 50~ raising the extraction pressure of pure CO2 from 150 to 659 bar did not increase the recoveries of PAHs and PCBs in certified reference materials. The compounds were efficiently extracted only if the temperature was raised to 200~ and although PCBs were extracted from a sediment at 200~ with any pressure between 150 and 659 bar, the recoveries of PAHs still increase with the pressure and the temperature [263]. The recoveries of various analytes- PAHs, N- and S-heterocyclics, chlorinated phenols and pesticides from a variety of soil and soot s a m p l e s - h a v e been measured using pure CO2 (30 min) and compared to recoveries obtained with 18 h Soxhlet extractions [263]. For all the samples studied, increasing the extraction temperature from 50 to 200~ yielded significant increases in recoveries despite the reduction in CO2 density from 0.93 to 0.50 g/ml. Recoveries of three pesticides (atrazine, prometon and metolachlor) were improved from 30 to 40% at 200~ in comparison to those obtained at 50~ and were between 110 and 120% (versus Soxhlet experiments). Further in-
329
Sample Handling Techniques
90
80
I
-
70
..~..~..~
o~'7" 6 0 a~ ~_
50
-5
40
o
9
""
"
" ""
"
E to 30 20 1
0
20 40 60 80 100 120 140 160 180 time (min)
Fig. 4.31. Effect of the modifier on the extraction of diuron from a soil at constant pressure (340 bar) and temperature (100~ Flow rate, 5 ml/min. (O) 1.25% methanol, (11) 10% methanol, (~) 10% acetonitrile. From Ref. [265] with permission. creases in the SFE temperature to 350~ did not yield increased recoveries but did show evidence of causing thermal degradation. Addition of modifiers. Since CO2 is relatively non-polar, a few percent of a polar modifier is often added to enhance the solubility of the more polar compounds or to increase the ability of the fluid to better displace analytes from matrix sites. The modifier can be added directly to the sample in the cell, but then a static mode is needed (if not, it would lead to a concentration gradient within the matrix). This method is useful for rapidly evaluation of the effect of various modifiers. Premixed fluids, prepared with the addition of the modifier to the liquid COz can also be used, but the most accurate and reproducible method is to use a separate modifier pump, provided that the system compensates for the compressibility, and therefore density, of the CO2 [243]. Various modifiers have been tried over recent years, but methanol remains the most popular. The nature of the modifier depends on the nature of the analytes to be extracted. Predictions are difficult, and there is no clear understanding of the specific mechanism that operates, apart from the enhancement in solubility. A reasonable starting point for the selection of the modifier is that in its liquid state it should be a good solvent for the target analyte. As can be seen in Fig. 4.31, the extraction of diuron is greatly enhanced with methanol instead of acetonitrile as a modifier, probably because hydrogen bonding can occur between diuron and methanol [239,265]. The effect of the amount of modifier on recoveries is important. Langefeld et al. have recently studied the effect of eight different modifiers (methanol, methylene chloride, toluene, methanol-toluene, hexane, aniline, diethylamine, and acetic acid) at concentrations of 1 and 10%, and the results indicated that the
References pp. 349-356
330
Chapter 4
identity of the modifier was more important than its concentration [266]. The effect of polar modifiers is not really well known; they can affect the matrix by covering the active sites and preventing re-adsorption of analytes onto the matrix, and also by reducing the interaction energy between the matrix and the solute. Water also acts as a modifier. Many environmental samples contain water which may either help or hinder the extraction process, but the most important effect is to cause restrictor plugging; the most obvious way to avoid this is to dry the sample. However, both oven and room temperature drying have been shown to lead to substantial losses of analytes [243]. A drying agent can also be mixed into the sample, but this procedure can also lead to substantial losses of volatile and semi-volatile analytes since mixing a wet sample with a drying agent can cause heating. Although the role of water is still unclear, it appears that a small amount of water (e.g., 1-2%) is advantageous but that greater amounts may either increase or reduce the extraction efficiencies [243]. The addition of a polar modifier is required for moderately polar and polar pesticides. Papilloud and Haerdi have studied the SFE of atrazine and polar metabolites, such as hydroxyatrazine and de-ethyl-de-isopropylhydroxyatrazine by spiking a C18 silica sorbent. The optimal condition for 90-95% recoveries of atrazine and hydroxyatrazine were a pressure of 250 bar at 50~ the addition of 10% (v/v) methanol, and a 45-min extraction time at a flow rate of 0.5 ml/min. Under these conditions, the recovery of the very polar de-ethyl-de-isopropylhydroxyatrazine was only 20% [267,268]. When using 10% methanol that contained 2% of water (v/v), the recovery increased to 52%. SFE has also been shown to provide an alternative to polar organic solvents or water in the quantitative removal of atrazine and the two dealkylated metabolites, cyanazine and metolachlor from agricultural soils [269]. The addition of both water and methanol to the air-dried soil prior to commencement of the CO2 flow strongly enhanced the recoveries but did not promote the conversion of the chlorotriazine analytes to any of their corresponding hydroxy- or methoxyanalogues under the SFE conditions tested. Fluid velocity. The flow velocity of the supercritical fluid through the cell has a strong influence on the extraction efficiency, depending on whether this is limited by solubility considerations or by the kinetics of the desorption process [270]. A slow flow will ensure a deeper penetration of the fluid into the matrix. The speed of flow is usually expressed by the linear velocity, which depends on the flow rate and the cell geometry. Small cells are mainly used, and are more reliable, so the samples of typically in the order of 5-10 g. A minimum of 4-5 cell volumes is needed at least to sweep the cell void-volume sufficiently. If the extraction rates are limited by solubility considerations, the increase of the flow rate should lead to substantially higher recoveries, since in a given time a larger amount of supercritical fluid will be applied. If the kinetics of the desorption of the solutes into the supercritical fluid limit the extraction rate, an increase in the flow rate will have no significant effect on the recoveries, since the sample is exposed to the extraction fluid for the same time.
Sample Handling Techniques
331
In practice, a high flow rate may result in a reduction in the recovery by increasing the loss during decompression of the fluid. Typical values are around 1 ml/min of compressed fluid for an extraction cell of i.d. ca. 1 cm, which corresponds to ca. 500 ml/min of gas after decompression [239]. Matrix effect. Factors such as the particle-size, shape, surface area, and porosity of the solid sample, and the nature of the matrix, will affect the analytical results and are of prime importance. However, in the SFE of a SPE sorbent which has been loaded with aqueous samples, the effect of the matrix is expected to be small in comparison with that for native solid samples.
4.2.5.1.3. Efficiency of the analyte trapping system. Once the analytes of interest are in the supercritical fluid they have to be isolated for further analysis. Generally, this occurs by decompression of the fluid through a restrictor, which needs to be heated at 5~ to prevent the restrictor plugging with ice formation. In off-line techniques, a liquid trap or a solid surface are commonly used for collecting the extract. With a liquid trap, the restrictor is simply placed in a vial containing a suitable solvent. Obviously, the selection of the collection solvent is important. Methylene chloride, acetone or chloroform have been shown to be more appropriate than methanol and hexane for a varied set of organic pollutants [271]. The collection of relatively volatile substances can be difficult and losses of polycyclic aromatic hydrocarbons of up to 30% have been observed with different collection devices [272]. The use of a Dewar condenser placed on top of the SFE off-line collection vials was shown to reduce analyte losses significantly [273]. A solid-liquid trap was shown to minimize these trapping problems. Solid-phase trapping is usually carried out by depressurizing CO2 and the analytes prior to their collection onto a sorbent such as silica, Florisil or bonded silicas. After being cryogenically and chemically trapped, the solutes are eluted from the sorbent with a small volume of solvent. This technique is less straightforward than the liquid trapping, since its optimization requires the selection of the sorbent, trapping temperature, and elution solvent. Several new commercial instruments utilize this approach, so it will gain more attention. The liquid and solid trapping systems have been compared for the analysis of hydrocarbons [274]. It was shown that the average recoveries were increased by ca. 20% by using the solid-liquid trap, without loss of the less volatile analytes or dependence on the flow rate of the extraction fluid. Silicagel and C18 bonded silicas showed no difference in adsorbing the analytes. Separate analysis of the organic solvent and the solid traps after extraction with pure supercritical CO2 showed no PAHs in the organic solvent whereas when toluene was added as modifier, the analytes were not found in the sorbent but in the organic solvent. Moreover, this approach has the advantage over liquid trapping of allowing fractionation or clean-up during the desorption from the trapping solid [274]. On-line collection can also be performed by subsequent analysis with GC, LC, or SFC, and is discussed in the next chapter with other on-line techniques. References pp. 349-356
332
Chapter 4
4.2.5.2. Application to aqueous matrices 4.2.5.2.1. Direct extraction. Direct SFE is possible but is associated with several
problems. First, the nature of the sample necessitates the use of special extraction cells. Then, the main problem is the relatively high solubility of water in supercritical CO2, approximately 0.3%, which may cause restrictor plugging by ice. The first studies used a "close loop stripping" method, where the fluid was recirculated by a pump back into the water sample [245]. Another method included a phase separator to remove the water from the CO2 before analysis by SFC [246]. Barnabas et al. [244] have recently optimized the SFE conditions for the removal of organochlorine pesticides (OCPs) from water using a modified "headspace" extraction cell and compared the results with the tandem SPE-SFE. Despite the good solubility of OCPs in pure CO2, the recoveries decreased when they were directly extracted from water. Increasing the flow rate between 0.7 and 1.5 ml/min, with a typical extraction time of 45 min, had little effect, and the extraction was not affected by the addition of salt to the matrix. Maximum recoveries of lindane, aldrin and dieldrin were around 40-70% with 100 min extraction and were about 20% lower than from an extraction involving prior trapping of these analytes onto a C~8 extraction disk using the combined SPE-SFE method. These lower recoveries may be indicative of a poor diffusion of the supercritical CO2 through the aqueous matrix. Direct extraction of phenoxyacetic and phenoxybenzoic acids from water using supercritical CO2 has been described [247]. The effect of different pressures, temperatures and modifiers has been investigated, showing that the addition of a mixture of acetonitrile and water was more efficient for the extraction of phenoxybenzoic acids whereas supercritical CO2 modified with methanol and water yielded more efficient extraction of phenoxyacetic acids. Another approach described the simultaneous extraction and methylation of chlorophenoxyacetic acids from aqueous solution using supercritical CO2 containing methyl iodide and tetrahexylammonium hydrogen sulfate [248]. Conversion to methyl ester derivatives was achieved in 30 min with good recoveries from 1 ppm solutions. 4.2.5.2.2. SPE-SFE. This is certainly the most appropriate method for applying the
SFE selectivity to aqueous samples. The preliminary extraction of analytes can be performed directly in the SFE cell which has been previously filled with an appropriate sorbents or separately. However, in most examples, Empore C18 disks have been used to trap the analytes initially, prior to elution with pure or modified supercritical CO2. The first step is similar to that previously described in the SPE section. After percolation of the sample, the disk is first air-dried for several minutes, and additional drying in an oven at 40-50~ is often performed for at least 30 min. Then, the disk is rolled and placed in a 10 ml or smaller extraction cell. The integrity of the SPE disk under supercritical fluid extraction was investigated and the collected extract was analyzed by GC-EC-MS leading to chromatograms free of any contamination [251 ].
333
Sample Handling Techniques TABLE 4.18 PERCENT RECOVERIES OF ORGANOCHLORINEPESTICIDES AND UREA AND TRIAZINE HERBICIDES USING CO2 ALONE AND CO2 MODIFIEDWITH 10% METHANOL(ADAPTED FROM REF. [253] WITH PERMISSION) Compounds
Organochlorines Heptachlor Isodrin Dieldrin Herbicides Simazine Propazine Trietazine Chlortoluron Isoproturon Diuron
Recoveries using pure CO2 • SD)
Recoveries using modified CO2 _ SD
92 • 2 102 • 8.3 85 • 2.4
1.6 • 2.7 • 3.5 • 4.4 • 3.9 • 4.3 •
1.2 4.5 3.4 3.1 2.1 2.6
100 • 13 89 • 7 87 _ 8 86 • 8 90 • 5 88 • 7
Good recoveries have been obtained for aldrin and dieldrin with a static extraction of 30 min followed by a dynamic extraction with pure CO2 at 300 bar and 50~ [244]. A lower recovery was obtained for lindane with the same conditions, but the authors were unable to determine whether this was a results of poor extraction on the SPE disk or of the SFE of the disks. Another publication describes the determination of chlorinated pesticides and PCBs in water and wastewater with recoveries of at least 80% -which are around 10% higher than those obtained with SPE alone [251 ]. The advantage was that the particles filtered from the water could be extracted with the SPE disk. The quantitative SFE of sulfonylurea herbicides (sulfuron methyl and chlorsulfuron) from aqueous matrices via SPE with C18 disks has been described [249]. A Celite TM matrix was used first to determine optimum conditions for extraction and to see whether the analytes were, indeed, quantitatively extractable by SFE without the possibility of matrix interferences. Both herbicides were quantitatively extracted with supercritical 2% methanol-modified CO2 from the Celite matrix and water, via solidphase extraction. The optimized SFE conditions were 50~ 350 bar, a flow rate of 2ml/min and a 2 min static extraction followed by a 24 min dynamic extraction. Stainless-steel beads were used as the trapping material and elution was performed with acetonitrile. Comparisons were made with traditional organic solvent-elution of the SPE disk with 1-1 samples spiked with 50/~g/1 of both sulfuron methyl and chlorsulfuron, but no evidence is shown for a higher selectivity using the SPE-SFE procedure. Fractionation. Selectivity can be introduced when using SPE and a fractionation of organochlorine pesticides from phenylurea and triazine herbicides was obtained
References pp. 349-356
334
Chapter 4
by making two subsequent extractions of the SPE disk under different conditions [253]. A 200 ml aliquot of a spiked water sample was extracted on a C18 Empore disk which was dried at 45~ for 20 min. The disk was then placed in a 10 ml extraction cell at 50~ and extracted at 250 bar with CO2 at a flow rate of 2 ml/min. The extract containing the organochlorine pesticides was collected in hexane. The disk was then re-extracted under identical conditions but with the addition of 10% methanol. The herbicide fraction was collected in the HPLC mobile phase (55% methanol-water mixture, v/v). Table 4.18 shows the selectivity that was obtained within the two groups since the first extraction removes only the organochlorine pesticides whereas the second quantitatively removes the herbicides. A fractionation has also been obtained by adjusting the pressure of the supercritical CO2; the method was applied to the determination of pesticides in waste water [254]. Selectivity from the matrix. Few studies have shown the selectivity that can be obtained in using SFE for aqueous samples. Alzaga et al. examined the stability of freeze-dried samples spiked with eight pesticides for evaluating their suitability as candidate reference materials for their determination in water samples [275]. The SFE procedure was performed by introducing the freeze-dried residue within the SFE cell. The freeze-dried extract was reconstituted and liquid-liquid extraction was performed as a comparison. SFE recoveries of at least 90% were obtained at 50~ 200 bar and 30 ml of CO2; no modifier was required for these lyophilized extracts of spiked surface water samples. The characteristic LC-DAD chromatograms are shown in Fig. 4.32 where the higher selectivity of the SFE is apparent. In LLE, simazine co-elutes with an interfering substance and glycine which was added as a stabilizer was extracted by LLE but not with SFE. Moreover, analysis by GC-NPD was possible with the SFE extract whereas a further clean-up was required for the LLE extract. Selectivity was shown with the SFE of several organophosphorus pesticides in a spiked orange juice sample [252]. Initial attempts to extract the aqueous sample, as such, failed and the sample was added to a solid (Chromosorb W) packed in the extraction thimble. The SFE was performed at 50~ with 0.5 ml/min of pure CO2 at a density of 0.75 g/ml during 5 min of static- and 30 min of dynamic extraction. The extracted analytes were collected on a C18 silica trap held at 20~ and recovered after rinsing the trap with 1 ml of chloroform. Further analysis was performed by GC-MS. Under these moderate extraction conditions, a relatively clean chromatogram was obtained, with palmitic and oleic acids as the main peaks from the matrix. The selectivity of the SFE was fully exploited since both the silica sorbent in the thimble, and the C18 silica sorbent as the collection trap, helped to retain unwanted matrix solutes, polar compounds such as lower free fatty acids, and high-mass-molecular solutes such as triglycerides. The method was automated by positioning the SF extractor such that the GC automatic sampler arm of the injector could provide and withdraw vials from the SFE instrument. The total analysis time was approximately 1 h, and
335
Sample Handling Techniques
mAU
400
2
G
200, I.S.
5 02 W
...Y ~I ......
8 ......
z mAU
TIME
I~2
1'6
(Min.)
m ~D 200-
| G
100-
1
5~ 7 8 8
12
16
TIME (Min.)
Fig. 4.32. LC-DAD (220 nm) chromatograms of extracts isolated by (A) SFE (CO2, 50~ 30 MPa, 15 ml CO2) and (B) LLE (internal standardIS, cyanazine). Compounds: (1) simazine; (2) carbaryl; (3) atrazine; (4) propanil; (5) linuron; (6) fenitrothion; (7) fenamiphos; (8) parathion-ethyl; G; glycine. From Ref. [275] with permission.
was much more rapid that the conventional liquid-liquid extraction followed by a clean-up over silica-Florisil, or by size-exclusion chromatography. 4.2.5.3. Conclusion Obviously, SFE of aqueous samples is possible and relatively easy to perform when combined with a SPE step, although setting up an efficient SFE requires a good knowledge of the effect of the basic parameters. The selectivity of the SPESFE process compared to the SPE alone is certainly the main interest in the technique. It has proved to be competitive in terms of both accuracy and precision for the certification of reference materials [276]. Another advantage is the possibility of performing the SPE step directly in the field, using conventional sorbents, and carrying out the SFE step in the laboratory, as a consequence of the good preservation of many analytes when they are adsorbed on C~8 or polymeric materials. References pp. 349-356
336
Chapter 4
This approach has been applied with success to the control of rotenone in the Ohio river [250]. Future applications to aqueous samples will depend greatly on the implementation of SPE for the sample pretreatment of soils, sediments, and other solid matrices such as plant tissues or foodstuffs. Other techniques are now emerging, such as accelerated solvent extraction procedures under pressure and high temperature, and microwave-assisted extraction procedures which reduce the use of organic solvents [277]. However, SFE has the advantage of being a solvent-free technique. We can expect the subcritical water to be used more in the future, even if CO2 is now considered as the "greener solvent" [278]. EPA has recently accepted the use of supercritical fluid CO2 in extracting the total petroleum hydrocarbon and polycyclic hydrocarbons under SW846 (Method 3560 and 3561). Further developments are also expected in combination with those performed for the selective clean-up and/or detection. For polar and thermolabile pesticides, the combination of extraction by supercritical fluids with enzyme immunoassays has been shown to allow faster extraction and analysis, without further clean-up [279]. 4.3. CLEAN-UP PROCEDURES As seen previously in this chapter, in most cases clean-up is not necessary for ground and drinking water. For more complex matrices such as surface-, runoff- or soil water samples, selective extraction procedures offers an elegant solution since, in one step, pesticides are extracted and concentrated without a requirement for clean-up. However, although this is an active area of research, the methods most currently used are non-selective LLE or SPE which yield an extract that often contains too many interfering compounds for easy analysis by chromatography at a trace-level without additional clean-up. The need for clean-up depends on many factors such as the type of water, the concentration levels, the separation performed, and the degree of selectivity in the detection mode. Clean-up can be introduced into the SPE sequence as described in Fig. 4.4 or can be applied to the dry water extract using adsorption or size-exclusion chromatography. These last two methods have been extensively described for more complex matrices such as food or soil, and no difference exists between the clean-up process applied to dry extracts of soils, water or food.
4.3.1. Clean-up included in the SPE sequence with non-polar sorbents With hydrophobic sorbents, the clean-up step can be included in the SPE sequence just before the analyte desorption (see Fig. 4.4). It is performed by flushing the SPE cartridge with a small volume of water modified with an organic solvent so that many matrix components are eluted, but not the analytes of interest. In fact, this flushing can only remove interferences which are more polar that the analytes of in-
Sample Handling Techniques
337
terest, so the method can only be applied for the determination of hydrophobic pesticides. It is difficult to apply it for multiresidue analysis. In such cases, if some polar analytes are also to be determined, it is very important to verify that no loss occurs with this flushing solvent. Another means for removing some polar interferences is to add some organic solvent to the aqueous sample before percolation through the sorbent. Again, this procedure can only be applied for the determination of non-polar pesticides. The breakthrough volume will not be estimated from log k'w values but from log k' values obtained with that concentration of organic solvent. Figure 4.9, which shows the linear and/or quadratic relationship between log k' and the percentage of methanol in the mobile phase, indicates that the addition of 5% of methanol can considerably reduce the breakthrough volume. The two approaches mentioned above were applied by van der Hoff et al. [116] for the simultaneous extraction and clean-up of pyrethroids in the analysis of surface water, integrated into an on-line procedure. Some 30% of methanol was added to the sample prior to SPE and the cartridge was washed with an additional 1 ml of 30% methanol in water before on-line desorption by toluene and GC-ECD analysis. This clean-up was shown to be efficient and led to detection limits in surface water below the 0.1/zg/1 level. Fractionation can occur by coupling different sorbents when the clean-up cannot be performed after sample application and before analyte elution. Di Corcia and Samperi [162] have shown that selective SPE can be performed by coupling two sorbents. The first cartridge packed with the non-specific graphitized carbon black sorbent, traps the analyte of interest and many other compounds, but only basic analytes are transferred and re-concentrated into a second cartridge packed with a more specific sorbent such as a cation exchanger. They could then determine chlorotriazines at the ppt level. By percolating 2 1 of drinking water through a cartridge packed with 250 mg of graphitized carbon black, and then connecting this cartridge to a second one packed with a cation-exchanger and flushing the two columns with a mixture of dichloromethane and methanol, these authors have also determined 14 phenylurea herbicides in drinking water with detection limits at the ng/1 level. Phenylureas are eluted while all basic interferences such as chlorotriazines, and anilines are trapped by the ion-exchanger [ 162].
4.3.2. Clean-up using polar sorbents (adsorption chromatography) 4.3.2.1. Basic principles A widely used clean-up method is based on the fractionation of the extracts using polar LC sorbents such as silica, alumina, Florisil (synthetic magnesium silicate), or silica chemically modified with amino groups. The basic principle which governs this process is adsorption chromatography and is described in Fig. 4.33. The extract
References pp. 349-356
338
Chapter 4
is dissolved in a non-polar solvent, typically hexane, and percolated through the polar sorbent. Step-elution with solvents of increasing polarity allows a separation into fractions on the basis of polarity differences. Such a fractionation was described by Vails et al. [280], for the determination of ionic and non-ionic contaminants in urban waste and coastal waters. The fraction F1 was eluted by hexane and contained aromatic hydrocarbons. By adding increasing percentages of methylene chloride, methanol and diethyl ether in the eluting mixture, the authors obtained seven fractions containing linear alkylbenzenes and polychlorinated biphenyls (PCBs), polyaromatic hydrocarbons (PAHs), and waxes, fatty acid methyl esters, alkyl- and aryl phosphates, and ketones, sterols, and nonylphenol polyethoxylates in the last eluted fraction. This analytical procedure contains many steps and is very time-consuming. The only advantage is its broad screening for the identification of unknown compounds. 4.3.2.2. Clean-up with SPE cartridges or home-made SPE columns 4.3.2.2.1. Sorbents. Clean-up of extracts is based on a fractionation scheme similar to that described above. Dry extracts are dissolved in hexane and compounds are retained on the polar sorbent. Then, one has to find the appropriate solvent mixture which only elutes the analytes of interest. The most common sorbent is Florisil which has been successfully used for clean-up of water and/or soil extracts for the
WATER SAMPLE
Dry extract (LLE or SPE)
I
Extract in an apolar solvent (hexane)
a
b
c
d
F1
F2
F3
F4
...... (Fractionation)
Fig. 4.33. Typical scheme for the fractionation or clean-up of an extract. After injection of the extract, fractionation occurs by eluting the column with eluents a-d, etc., of increasing polarity.
Sample Handling Techniques
339
determination of various pesticides [281-284]. Silica gel has also been used, mainly in the determination of rather non-polar pesticides such as organochlorine, organophosphorus or pyrethroid pesticides [281,285,286]. Alumina in its different forms (neutral, acidic or basic) has been used less extensively, and only for the determination of organochlorine pesticides [287]. A relevant example is the clean-up of water samples for the determination of organochlorine and pyrethroid insecticides using silica cartridges [23]. The extract was obtained from 15 ml of surface water by LLE with hexane and was further evaporated down to 1 ml. Clean-up was made with a 100-mg silica cartridge and the whole sequence-i.e., conditioning with 2 ml of hexane-isopropyl alcohol (80:20, v/v) and 6 ml of hexane, application of 500 ktl of the extract, washing with 1 ml of hexane and desorption with 1 ml of hexane-toluene (70:30, v/v)- was automated by the ASPEC (Automatic Sample Preparation with Extraction Columns) from Gilson, which was coupled on-line to capillary GC-ECD by means of a loop-interface equipped with a solvent vapour exit. The complete analytical procedure was greatly facilitated by automation with a considerable reduction in the sample volume required, and the determination of synthetic pyrethroids at ppt levels in surface water. Figure 4.34 shows the difference in the chromatograms obtained with and without clean-up. The clean-up step can also be based on normal phase chromatography using cartridges packed with silica modified with polar aminopropyl groups. This was applied with success to the determination of N-methylcarbamates in soils, vegetables and fruits [288,289]. 4.3.2.2.2. Removal of humic and fulvic acids in surface water extracts. For contaminated surface water samples, the clean-up step is required to remove humic and fulvic acids. Figure 4.15 shows that when a C~8 cartridge was used for the extraction and concentration of acidic herbicides, the co-extraction of humic and fulvic acids did not permit detection limits below the 0.5/zg/1 level in surface water although the same procedure gave detection limits in the low to 0.1/~g/1 level in drinking water samples. A clean-up procedure was described which uses a Florisil cartridge [114]. A practical problem was that after percolation of 500 ml of surface water sample through a 500 mg- cartridge, it was impossible to dissolve the dry extract in pure hexane, even by increasing the volume to 20 ml. A moderately polar solvent was added, but then there is a risk of loss of the non-polar analytes which are eluted first in adsorption chromatography. A mixture containing 12 ml of hexane with 120/~1 of isopropanol was selected, which permits good dissolution of the extract without loss of the more apolar targeted pesticides. After conditioning the 500 mg Florisil cartridge with 10 ml of methanol-ethyl acetate (50:50, v/v) and 10 ml of hexane, the extract was applied, dissolved in the hexane-isopropanol solution, the cartridge was air-dried and desorption of the targeted pesticide was obtained with 12 ml of a solution of methanol-ethyl acetate (50:50, v/v). The efficiency of such a clean-up is References pp. 349-356
Chapter 4
340
i:
6
'
io
"
~o
3'o
,1o
~
tr(mh) 3
4
1
i
trY). Fig. 4. 34. Chromatograms obtained by GC-ECD analysis of a sample of surface water spiked with pyrethroids (A) without clean-up and (B) with silica clean-up using the ASPEC. Solutes: (1) fenpropathrin; (2) cis-/trans-permethrin; (3) cis-/trans-cypermethrin; (4) deltamethrin. From Ref. [23] with permission.
clearly shown in Fig. 4.35. This compares the chromatogram obtained after extraction and concentration on a C~8 silica cartridge, then acidification of the water sample at pH 2 for retaining acidic pesticides, to that obtained after clean-up of the dry
Sample Handling Techniques
341
extract on Florisil. The detection limits are really improved and are in the range 0.05-0.3/~g/1. However, average recoveries were around 10% lower because of losses during the additional clean-up, but were still in the range 70-100%. 4.3.2.2.3. Fractionation by step elution. Silica gel was used in a procedure described for the clean-up of crude extracts from plant material for the determination of pesticide residues [290]. The 500 mg silica cartridges were conditioned by a mixture of acetone and ether (30:70, v/v) and 5 ml of hexane. After application of the extracts dissolved in hexane it was shown than more than 160 pesticides could be fractionated with good recoveries by flushing the silica cartridge with three solutions of increasing polarity, i.e., 5 ml of ether-hexane (20:80, v/v), then 5 ml of ether-hexane (60:40, v/v), and 5 ml of acetone-ether (30:70, v/v) with an efficient clean-up. Silica gel, Florisil and alumina have been compared for the clean-up of extracts from soil and water from the vadose zone for the determination of organochlorine and organophosphorus pesticides [291]. The results showed that silica was the best oice of adsorbent. Non-polar interferences were removed by a flushing with cyclohexane. A step-elution with 6 ml of hexane containing 5% of ethyl acetate, then 4 ml of ethyl acetate, allowed fractionation of the organochlorine pesticides in the first fraction and then the organophosphorus pesticides in the second one. 4.3.2.3. Clean-up using analytical LC silica columns The basic principle of this procedure is adsorption or normal phase chromatography, as above, but an analytical LC column is used for the fractionation. This results in more efficient fractionation and more reproducible results, since a UV detector is used to monitor the elution pattern. This was applied to the semi-preparative separation of lipid extracts after saponification, with elution by a mobile phase containing 0.5-10% of 2-propanol in hexane. In a single injection it was possible to separate the lipidic fraction in alkanes, aromatic hydrocarbons, fatty acids, sterols and hydroxyfatty acids [292]. A similar multiresidue analytical method was described for pesticides, transformation products and related toxicants, based upon the fractionation of the extracted residue on a Partisil silica gel normal phase column followed by selective-detector gas chromatographic determination of the components in each fraction [293]. The LC mobile-phase gradient, i.e., hexane to methyl t-butyl ether gave good chromatographic efficiency, resolution, and recovery for 61 test compounds and allowed their collection in four fractions spanning polarities from low-polarity organochlorine compounds in fraction 1 to N-methylcarbamates and organophosphorus oxons in fraction 4, as shown in Fig. 4.36. Table 4.19 illustrates the recoveries obtained for 14 pesticides through this LC fractionation. A similar approach was described for the clean-up of fatty matrices and the fractionation of PCBs and organochlorine pesticides [294,295]. Compared to conventional clean-up methods with cartridges, this method was found to be advantageous because breakthrough of the matrix can be monitored by UV spectrophotometry. References pp. 349-356
Chapter 4
342
TABLE 4.19 RECOVERIES OF FOURTEEN PESTICIDES THROUGH LC FRACTIONATION ON PARTISIL SILICA GEL, DESCRIBED IN FIG. 4.36 (FROM REF. [293] WITH PERMISSION) Fraction 1
Fraction 2
Fraction 3
Fraction 4
Chemical
R (%)
Chemical
R (%)
Chemical
R (%)
Chemical
R (%)
DDT Chlorpyrifos DDD Ronnel Methoxychlor
91 90 89 93 90
Trifluralin Parathion Me-parathion Me-Trithion
92 88 92 88
Methiocarb Carbaryl Terbutol Carbofuran
95 98 90 98
Methomyl
95
4.3.3. Clean-up using size-exclusion chromatography 4.3.3.1. Basic principles and sorbents Clean-up using size-exclusion (or gel permeation) chromatography is based on separation by molecular size. Fractionation by polarity using Florisil, silica gel, or alumina selects a limited range of the pesticides but does not remove high molecular weight materials of similar polarity. In contrast, size-exclusion chromatography (SEC) primarily removes materials of high molecular weight, leaving all the pesticides and other compounds of the same weight in the selected fraction. That is particularly important for matrices containing high-molecular-weight interferences such as triglycerides in food or humic substances in soils. In the current environmental analysis of pesticides, polystyrene columns are the most used SEC sorbents, and are eluted with cyclohexane, ethyl acetate-toluene, cyclohexane-dichloromethane, or cyclohexane-ethyl acetate. This last mixture is often selected because of its compatibility with the ethyl acetate used for extraction of pesticides in various solid and liquid matrices [296]. A comparative study was carried out using various types of SEC columns for the isolation of the pesticides monuron, linuron, monolinuron, isoproturon, propanil,
Fig. 4. 35. Effect of the clean-up of samples (B) injection of an extract from the River Seine spiked with 0.5/zg/1 of each analyte extracted at pH 2 with a C18 cartridge, (A) injection of the same extract after clean-up on a Florisil cartridge From Ref. [ 114] with permission. (a) Preconcentration of 500 ml via a 500 mg C18 silica cartridge, desorption with 3 ml of methanol, evaporation to dryness, and addition of 500/tl of an acetonitrile-water mixture (20:80, v/v). (b) Preconcentration of 500 ml via a 500 mg C18 silica cartridge, desorption with 3 ml of methanol, evaporation to dryness, dissolution in 12 ml of hexane with 120/zl of isopropanol and clean-up on a 500 mg Florisil cartridge; desorption with 12 ml of methanol-ethyl acetate, evaporation to dryness and addition of 500/zl of an acetonitrile-water mixture (20:80, v/v). Analytical column, Bakerbond Narrow Pore C18 silica, 25 cm x 4.6 mm i.d.; acetonitrile gradient with 0.005 M phosphate buffer at pH 3. UV detection at 220 nm. Peaks: (1) chloridazon; (2) aldicarb; (3) metoxuron; (4) simazine; (5) cyanazine; (6) bentazone; (7) atrazine; (8) carbaryl; (9) isoproturon; (10) difenoxuron; (11) ioxynil; (12) MCPP; (13) 2,4-DB; (14) 2,4,5 TP; (15) metolachlor; (16) dinoterb.
Sample Handling Techniques
343
!
0.01
a.
u.
7
11
| 16
.L 8 0.0025
1
a.
u.
5
4
lO
6
9
12 14
I
16
,
__J 0
10
20
30
References pp. 349-356
40
50
60
70
T(min)
Chapter 4
344
|
m
9
|
| |
|
Ii | g
| |
|
"g | | | |
F1
F2
t
I |
I
I I |
|
F4
F3
m
|
| I
I I
I
O r m N
e-
_o t-
c~
2-
,T;, x
-r,
r-o
ul Z
i 6
I
I
I
I
I
I
12
18
24
30
36
42
Time (min)
Fig. 4.36. HPLC chromatogram of seven representative pesticides showing zones for fraction collection. Analytical column, Partisil PXS-10/25 silica, 10/~m, 25 • 0.46 cm i.d., injection of 240/~1 of extract dissolved in hexane. Mobile phase, linear gradient from 100% hexane to 100% methyl tert-butyl ether in 30 min, flow rate 1.6 ml/min. From Ref. [293] with permission.
fenitrothion, molinate, alachlor, trifluralin and atrazine from soil samples [297]. Low-resolution SEC polystyrene columns, B io-Beads SX-3, SX-8 and SX-12, a high-resolution SEC polystyrene column Phenogel, and a silica-based SEC column Zorbax PSM, were compared. The eluent was optimized for the screening of the pesticides and dichloromethane-cyclohexane mixtures gave the best results. The retention times of the various pesticides were measured in order to monitor all the pesticides and eliminate the soil matrix. Figure 4.37A-C gives the SEC profiles obtained with the polystyrene columns and sample collection intervals which correspond to the elution of the targeted pesticides. As expected, the high-resolution Phenogel column is more efficient than the low-resolution B io-Beads. Figure 4.37D-F shows the liquid chromatograms of the extracts obtained from pesticides added to a soil sample, after clean-up with the SEC columns. No significant differences were found between the B io-Beads columns, but excellent results were achieved for phenylureas and propanil, with good recoveries using the high-resolution SEC column, with a chromatogram exhibiting no interferences. Similar results were obtained when
Sample Handling Techniques
345
5
'
40 t ~
.....
|
30
|
20 10
I
E r.
10
'
i
20 TIME ( M i n )
i
30
4~0 Q
tN v 40 i
!
!
,
I
I
9
30
E o Q. 20 u) L 10 >
ab 50
2'0
TIME (iin)
40 30
4 :3
|
|
30
40
(~
6"t 5
2O i
"I .........
a5 ~'o
....
1 ..........
2~
_1
i
~ ....
~ ....
~
.....
~o'~g lo a
TIME (Min)
d
10 ,.., = ,~.,..,,,_..,,...__ TIME
(Min)
Fig. 4.37. SEC profiles of a soil sample spiked with pesticides(10ktg/g of each) (A) Bio-Beads SX-3; (B) Bio-Beads SX-8; (C) Phenogel high-resolution SEC and reversed-phase chromatograms of the extract after clean-up with (D) Bio-Beads SX-3; (E) Bio-Beads SX-8; (F) Phenogel high-resolution SEC. From Ref. [297]. (a) Eluent, dichloromethane-cyclohexane (1:1, v/v) for Bio-Beads columns and dichloromethane-cyclohexane (1:1, v/v) for Phenogel column. Flow rate, 1 ml/min; UV detection at 254 nm. The sample collection intervals are indicated by the horizontal bars. (b) Zorbax C 8 reversedphase analytical column eluted with water-methanol-acetonitrile (60:20:20, v/v/v) for 3 min followed by gradient elution to 100% acetonitrile in 30 min at a flow rate of 1 ml/min. Peaks: (3) monuron; (4) isoproturon; (5) monolinuron; (6) linuron; (7) propanil; (8) molinate; (9) alachlor + fenitrothion; (10) trifluralin.
analyzing the extracts by GC-NPD. The silica-based high-resolution SEC also gave good results, thus indicating that high-resolution SEC should be preferred over lowresolution SEC, but the price is three times higher, which can be a serious problem for their implementation in routine analysis.
4.3.3.2. Comparison with methods using polar sorbents Clean-up procedures using adsorption and size-exclusion chromatography were References pp. 349-356
346
Chapter 4
compared for the determination of chlorotriazine herbicides and organophosphorus pesticides in soils [298]. The soil samples were soxhlet extracted and the extracts dissolved in 300-500/zl of n-hexane or ethyl acetate, depending on whether the clean-up was carried out on a Florisil column or SEC column. With spiked soils, the recoveries were in the range 75-103% for a mixture of seven pesticides using both clean-up methods. Figure 4.38a represents the profile of a real soil extract after percolation through a Bio-Bead SX-3 column and elution with a mixture of ethyl acetate-cyclohexane (1:1, v/v). The fraction corresponding to elution the organophosphorus and chlorotriazine pesticides was evaporated, and Fig. 4.38b shows the GC-NPD chromatogram of the purified extract. As a comparison, the soil extract was purified using a Florisil column. Figure 4.38c shows the GC-NPD chromatogram. The chromatograms are similar although it can be seen that the Florisil column removes the interferences more efficiently from the soil matrix to give a GC-NPD with a better baseline and fewer unidentified tailing peaks. However, one can say that both clean-up procedures may be efficient when optimized. 4.3.4. Other methods
4.3.4.1. Chemical methods Chemical treatments with concentrated sulfuric acid, ethanolic potassium hydroxide, and chromium trioxide have been studied for the clean-up of contaminated waters for the determination of organochlorine and organophosphorus pesticides. Viana et al. showed that these treatments destroy some pesticides totally or partially, but left other ones unaltered, and have a clean-up effect so there may be interest in such procedures for some specific compounds [299]. 4.3.4.2. Dialysis The potential of the combination of dialysis, for the removal of interfering humic substances from environmental waters, and trace-enrichment on a precolumn packed with C18 silica for the determination of polar pesticides by LC-UV detection was investigated [300], showing that the chromatograms were improved. The applicability of the dialysis membrane depends on the material used and on the thickness and molecular-weight cut-off value of the membrane. One has to take care to prevent strong interactions of organic analytes with the membrane, and cellulose or cellulose acetate were preferred. Rapid analyte transport through a membrane, and consequently a high recovery per unit time, requires membranes with low thickness and high cut-off value. However, removing humic and fulvic acids requires a small molecular weight cut-off value, so a compromise has to be found. The detection limits in concentration units depends on the configuration of the dialysis system: a high ratio of membrane area/sample volume leads to a high recovery, and a large sample volume to a high response. Detection limits of 1/zg/1
Sample Handling Techniques
347
E l u t l o n volume =16 m l .
8
11ME
....
( mln.I
3
@ tI
.
.
.
.
.
3
G
J T.[*C) 280*
t.(minJ
(3*C/rnin.)
~;b
30
20
90*
I~)
0
Fig. 4.38. (a) SEC clean-up profile of soil sample and (b,c) comparison of GC-NPD chromatograms of extracts after Florisil clean-up (b) and SEC clean-up (c). From Ref. [298] with permission. (a) Eluent, ethyl acetate-cyclohexane (50:50, v/v) at 1 ml/min. Column: Bio-Beads SX-3 (450 x 10 mm i.d.). Elution volume of organophosphorus and chlorotriazine pesticides between 18 and 34 min. (b) Clean-up using a 150 x 5 mm i.d. Florisil column, extract dissolved in 300-500/~1 hexane, desorption with a mixture of n-hexane-ethyl ether (50:50, v/v) and evaporation to dryness, reconstitution in ethyl acetate before GC injection. (c) Extract corresponding to the 18-34 min fraction evaporated to dryness and reconstituted in ethyl acetate before GC injection. Compounds: (2) deethylatrazine; (3) atrazine at concentrations of 20 and 130 ng/g, respectively.
References pp. 349-356
348
Chapter 4
of six phenylurea herbicides were obtained by using a planar dialysis membrane with a cut-off value of 3.5 kDa and a sample volume of 1.2 ml. These detections were possible using an on-line system which allowed the analysis of all the compounds contained in the sample. 4.4. C O N C L U S I O N AND F U R T H E R DEVELOPMENTS
Research into new techniques for sample preparation is a very active area. This is partly explained by the need for reducing as much as possible the use, disposal, and release into the environment of toxic solvents, together with a reduction of the total analysis cost. The key words for any development in area of sample preparation are "solvent free method". This is certainly the near end of extensive liquid-liquid extractions followed by Florisil clean-up which are still used in many laboratories. For that purpose, SPE is now becoming a fully accepted technique which allows sample preparation time to be halved or better, and reduces solvent usage by up to 90% compared to liquid-liquid extractions. A proof of its acceptance is the introduction by commercial companies of several new extraction sorbents in both cartridge or disk formats during the past 2 years. Examples are several polymers with high specific surface areas, mixed-mode sulfonated resins, and new carbon-based sorbents. All these sorbents are also more adapted to the extraction of polar pesticides and degradation products. Emerging techniques such as SPME have high potential for eliminating the use of solvents and will certainly be developed with the introduction of new fibres in the near future. The trend is also to simplify the labour of sample preparation, increasing its reliability, and eliminating the clean-up step needed for aqueous samples by using more selective extraction procedures. These also avoid the problem from interfering components in complex matrices. The development of more selective sorbents, such as immunoaffinity sorbents, is an active research area, because they, too, can be applied for the clean-up of other environmental matrices such as soil, sediments, plants, or food. Increased selectivity can be obtained by coupling different techniques, as was shown in the development of SPE-SFE. Immunoassays are now receiving special attention from analytical laboratories, because the samplepreparation can be avoided or reduced to a minimum with simple SPE or SFE of samples. The "priority" research developments depend on the regulatory aspects within countries. In Europe, chemists are faced with the drastic drinking water regulatory level of 0.1 ktg/1 for each pesticide. Therefore, the trend is to the setting up of multiresidue analyses, developing means for avoiding the clean-up step, and the disposal of extraction sorbents for polar pesticides and degradation products. For these last two purposes, the new polymeric extraction sorbents have remarkable potential. In North America, the regulatory levels are higher and for a limited number of pesticides, so it is easier to target the methods for a group of pesticides. On the other hand, the pressure for reduc-
Sample Handling Techniques
349
ing the use of organic solvents is much stronger, so active research is being devoted to the development of alternative solvent-free methods. 4.5. REFERENCES 1. R.W. Frei and K. Zech, in: R.W. Frei and K. Zech (Eds.), Selective Sample Handling and Detection in High-Performance Liquid Chromatography, Vol. 39-A, Elsevier, Amsterdam, 1988, p. 1 2. R.E. Majors, LC-GC Int., 2 (1991) 10 3. P. Quevauviller, Trends Anal. Chem., 13 (1994) 404 4. P. Quevauviller, E.A. Maier and B. Griepink, Anal. Chim. Acta, 283 (1993) 583 5. D. Barcel6, in: D. Barcel6 (Ed.), Environmental Analysis: Techniques, Applications and Quality Assurance, Elsevier, Amsterdam, 1993, Chapter 5, pp. 149-178 6. D. Barcel6, J. Chromatogr., 643 (1993) 117 7. J.A. Jonsson and L. Mathiason, Trends Anal. Chem., 11 (1992) 106 8. R.E. Majors, LC-GC Int., 7 (1995) 375 9. A.A. Boyd-Boland, M. Chai, Y.Z. Luo, Z. Zhang, M.J. Yang, J.B. Pawliszyn and T. Gorecki, Environ. Sci. Technol., 28 (1994) 569A 10. M.J. Yang, S. Harms, Y.Z. Luo and J. Pawliszyn, Anal. Chem., 66 (1994) 1339 11. S.K. Poole, T.A. Dean, J.W. Oudsema and C.F. Poole, Anal. Chim. Acta, 236 (1990) 3 12. F.I. Onuska, J. High Resolut. Chromatogr., 12 (1989) 4 13. P. Subra, M.-C. Hennion and R. Rosset, Analusis, 17 (1989) 163 14. D. Barcel6, Analyst (London), 116 (1991) 681 15. M. Akerblom, in: H.J. Stan (Ed.), Analysis of pesticides in ground and surface water, Vol. 11, Springer, Berlin, 1995, pp. 19-66 16. M.-C. Hennion and P. Scribe, in: D. Barcel6 (Ed.), Environmental Analysis: Techniques, Applications and Quality Assurance, Elsevier, Amsterdam, 1993, Chapter 2, pp. 24-77 17. Organophosphorus Pesticides in River and Drinking Water 1980, Tentative Method, HMSO, London, 1983, pp. 1-17 18. Chlorophenoxy Acid Herbicides, Trichlorobenzoic Acid, Chlorophenols, Triazines and Glyphosate in Water 1985, H.M.S.O., London, 1986, pp. 1-150 19. Methods for the Determination of Organic Compounds in Drinking Water, Supplement I: PB91146027, US Environmental Protection Agency, National Technical Information Service, Springfield, VA, 1990 20. Methods for the Determination of Organic Compounds in Drinking Water, PB91-231480, US Environmental Protection Agency, National Technical Information Service, Springfield, VA, revised, 1991 21. T.L. Potter, T. Carpentier, R. Putman, K. Reddy and J. Marshall Clark, J. Agric. Food. Chem., 39 (1991) 2184 22. A. Zapf, R. Heyer and A.J. Stam, J. Chromatogr. A, 694 (1995) 453 23. G.R. van der Hoff, S.M. Gort, R.A. Baumann, P. van Zoonen and U.A.Th. Brinkman, J. High Resolut. Chromatogr., 14 (1991) 465 24. Determination of Synthetic Pyrethroid Insecticides in Water by Gas-Liquid Chromatography (1992), H.M. Stationery Office, London, 1991 25. T.A. Bellar and W.L. Budde, Anal. Chem., 60 (1986) 169 26. M.F. Legrand, E. Costentin and A. Bruchet, Environ. Technol., 12 (1991) 985 27. J. Czucwa, C. Leuenberger, J. Tremp, W. Giger and M. Ahel, J. Chromatogr., 403 (1987) 233 28. A. Bruchet, L. Cognet and J. Mallevialle, Rev. Fr. Sci. Eau, 2 (1983) 297 29. G.D. Foster and P. Rogerson, Int. J. Environ. Anal. Chem., 41 (1990) 105
References pp. 349-356
350
Chapter 4
30. 31. 32. 33. 34. 35. 36.
I. Cruz and D.E. Wells, Int. J. Environ. Anal. Chem., 48 (1992) 101 D.J. Munch and C.P. Frebis, Environ. Sci. Technol., 26 (1992) 921 G. Durand and D. Barcel6, Toxicol. Environ. Chem., 25 (1989) 1 S. Chiron, A. Fernandez Alba and D. Barcel6, Environ. Sci. Technol., 27 (1993) 2352 G. Stangl and R. Niessner, Int. J. Environ. Anal. Chem., 58 (1995) 15 D.A.D. Murray, J. Chromatogr., 177 (1979) 135 J.H. Hermans, F. Smedes, J.W. Hofstraat and W.P. Cofino, Environ. Sci. Technol., 26 (1992) 2028 M. Vails, J.M. Bayona and J. Albaiges, Int. J. Environ. Anal. Chem., 39 (1990) 329 W. Pereira and C. Rostad, Environ. Sci. Technol., 24 (1990) 1400 A. Montiel, M.F. Gapihan and A. Durnez, (1992) unpublished results K.Z. Taylor, D.S. Waddel, E.J. Reiner and A. MacPherson, Anal. Chem., 67 (1995) 1186 J.A. Jonsson, L. Mathiasson, J. Trocewicz, B. Lindergard and A.M. Olsonn, J. Chromatogr. A, 665 (1994) 259 L. Mathiasson, M. Knutsson, G. Bremle and L. Martensson, Swedish J. Agric. Res., 21 (1991) 147 Y. Shen, V. Obuseng, L. Gr/Snberg and J.A. Jtinsson, J. Chromatogr. A, 725 (1996) 189 L. Grtingerg, P. Ltivkvist and J.A. Jt~nsson, Chemosphere, 24 (1992) 1533 M. Knutsonn, L. Mathiasson and J.A. J/Snsson, Chromatographia, 42 (1996) 165 G. Nilv6, G.A. Audunsson and J.A. J/Snsson, J. Chromatogr., 471 (1991) 151 L. Mathiasson, G. Nilv6 and B. U16n, Int. J. Environ. Anal. Chem., 45 (1991) 117 M. Knutsson, G. Nilv6, L. Mathiasson and J.A. J/Snsson, J. Agric. Food Chem., 40 (1992) 2413 G. Nilv6, M. Knutsson and J.A. Jtinsson, J. Chromatogr. A, 688 (1994) 75 J. Trocewicz, J. Chromatogr. A, 725 (1996) 121 M. Papantoni, N.K. Djane, K. Ndungo, L. Mathiasson and J.A. Jtinsson, Analyst (Cambridge, UK), 120 (1995) 475 R.W. Frei, M.W.F. Nielen and U.A.Th. Brinkman, Int. J. Environ. Anal. Chem., 25 (1986) 3 M.W.F. Nielen, R.W. Frei and U.A.Th. Brinkman, in: R.W. Frei and K. Zech (Eds.), Selective Sample Handling and Detection in High Performance Liquid Chromatography, Vol. 39, Elsevier, Amsterdam, 1988, Chapter 1, p. 5 M.-C. Hennion, Trends Anal. Chem., 10 (1991) 317 M.-C. Hennion and V. Pichon, Environ. Sci. Technol., 28 (1994) 576 A G. Font, J. Manes, J.C. Molt6 and Y. Pic6, J. Chromatogr., 642 (1993) 135 I. Liska, J. Chromatogr. A, 665 (1993) 163 J.S. Fritz, P.J. Dumont and L.W. Schmidt, J. Chromatogr. A, 691 (1995) 133 E.R. Brouwer, S. Kofman and U.A.Th. Brinkman, J. Chromatogr. A, 703 (1995) 167 L.A. Berruetta, B. Gallo and F. Vicente, Chromatographia, 40 (1995) 474 J. Schulein, D. Martens, P. Spitzauer and A. Kettrup, Fresenius' J. Anal. Chem., 352 (1995) 565 R. Soniassy, P. Sandra and C. Schlett, in: Water Analysis-Organic micropollutants, HewlettPackard Company, Germany, 1994 D.F. Hagen, C.G. Markell, G.A. Schmitt and D.D. Blevins, Anal. Chim. Acta, 236 (1990) 157 A. Kraut-Vass and J.J. Thomas, J. Chromatogr., 538 (1991) 233 O. Evans, B.J. Jacob and A.L. Cohen, Analyst (London), 116 (1991) 15 D. Barcel6, G. Durand, V. Bouvot and M.W.F. Nielen, Environ. Sci. Technol., 27 (1993) 271 L.M. Davi, M. Baldi, L. Penazzi and M. Liboni, Pestic. Sci., 35 (1992) 63 B.A. Tomkins, R. Merriweather, R.A. Jenkins and C. Bayne, J.A.O.A.C. Int., 75 (1992) 1091 R. Hendriks, LC-GC Int., 6 (1993) 296 T. McDonnell, J. Rosenfeld and A. Rais-Firouz, J. Chromatogr., 629 (1993) 41
37. 38. 39. 40. 41. 42. 43. 44. 45. 46. 47. 48. 49. 50. 51. 52. 53.
54. 55. 56. 57. 58. 59. 60. 61. 62. 63. 64. 65. 66. 67. 68. 69. 70.
Sample Handling Techniques
351
71. S.A. Senseman, T.L. Lavy, J.D. Mattice, B.M. Myers and B.W. Skulman, Environ. Sci. Technol., 27 (1993) 516 72. D. Barcel6, S. Chiron, S. Lacorte, E. Martinez, J.S. Salau and M.-C. Hennion, Trends Anal. Chem., 13 (1994) 352 73. S. Lacorte, N. Ehresmann and D. Barcel6, Environ. Sci. Technol., 29 (1995) 2834 74. S.A. Senseman, T.L. Lavy and J.D. Mattice, Anal Chem., 67 (1995) 3064 75. J.S. Salau, R. Alonso, G. Battlo and D. Barcel6, Anal. Chim. Acta, 233 (1994) 105 76. J. Triska, Chromatographia, 40 (1995) 712 77. E. Martinez and D. Barcel6, Chromatographia, 42 (1996) 72 78. T. Albanis and G. Hela, J. Chromatogr. A, 707 (1995) 283 79. P. Subra, M.-C. Hennion, R. Rosset and R.W. Frei, J. Chromatogr., 456 (1988) 121 80. C.E. Werkhoven-Goewie, U.A.Th. Brinkman and R.W. Frei, Anal. Chem., 53 (1981) 2072 81. W. Golkiewicz, C.E. Werkhoven-Goewie, U.A. Th. Brinkman, R.W. Frei, H. Colin and G. Guiochon, J. Chromatogr. Sci., 21 (1983) 27 82. C.E. Werkoven-Goewie, W.M. Boon, A.J.J. Praat, R.W. Frei, U.A.Th. Brinkman and C.J. Little, Chromatrographia, 16 (1982) 53 83. P.J. Schoenmakers, H.A.H. Billiet and L. de Galan, J. Chromatogr., 282 (1983) 107 84. P. Jandera and J. Kubat, J. Chromatogr., 500 (1990) 281 85. V. Pichon, C. Cau Dit Coumes, L. Chen and M.-C. Hennion, in preparation 86. K.G. Miller and C.F. Poole, J. High Resolut. Chromatogr., 77 (1994) 125 87. M.L. Larrivee and C.F. Poole, Anal. Chem., 66 (1994) 63 88. A. Galencser, G. Kiss, Z. Krivaczy, Z. Varga-Puchony and J. Halvay, J. Chromatogr. A, 693 (1995) 217 89. A. Galencser, G. Kiss, Z. Krivaczy, Z. Varga-Puchony and J. Halvay, J. Chromatogr. A, 693 (1995) 227 90. K.K. Chee, M.K. Wong and H.K. Lee, Chromatographia, 41 (1995) 191 91. D. Seibert and C.F. Poole, Chromatographia, 41 (1995) 51 92. M.L. Mayer, C.F. Poole and M.P. Henry, J. Chromatogr. A, 695 (1995) 267 93. M.L. Mayer, S.K. Poole and C.F. Poole, J. Chromatogr. A, 697 (1995) 89 94. E.M. Thurman, M. Meyer, M. Pomes, C.A. Perry and A.P. Schwab, Anal. Chem., 62 (1995) 2043 95. M.-C. Hennion, C. Picard, C. Combellas, M. Caude and R. Rosset, J. Chromatogr., 210 (1981) 211 96. J.E. O'Gara, B.A. Alden, T.H. Walter, J.S. Petersen, C.L. Nierderlander and U.D. Neue, Anal. Chem., 67 (1995) 3809 97. D. Puig and D. Barcel6, Chromatographia, 40 (1995) 435 98. R.M. McDowall, LC-GC Int., 11 (1994) 638 99. T. Braumann, G. Weber and L.H. Grimme, J. Chromatogr., 261 (1983) 329 100. T. Braumann, J. Chromatogr., 373 (1986) 191 101. R.F. Rekker, in: The Hydrophobic Fragmental Constant (Pharmaco-Chemistry Library, Vol. 1) Elsevier, Amsterdam, 1977 102. A. Noble, J. Chromatogr., 642 (1993) 3 103. J.C. Molto, B. Lejeune, P. Prognon and D. Pradeau, Int. J. Environ. Anal. Chem., 54 (1994) 81 104. G.A. Junk and J.J. Richard, Anal. Chem., 60 (1988) 451 105. J.C. Molt6, Y. Pic6, G. Font and J. Manes, J. Chromatogr., 551 (1991) 137 106. C.H. Marvin, i.d. Brindle, C.D. Hall and M. Chiba, Anal. Chem., 62 (1990) 1495 107. M.T. Meyer, M.S. Mills and E.M. Thurman, J. Chromatogr., 629 (1993) 55 108. E. Durhan, M. Lukasewycz and S. Baker, J. Chromatogr., 629 (1993) 67 109. D.S. Aga, E.M. Thurman and M.L. Pomes, Anal. Chem., 66 (1994) 1495 110. G.A. Junk, M.J. Avery and J.J. Richard, Anal. Chem., 60 (1988) 1347
References pp. 349-356
352
Chapter 4
111. G. Durand and D. Barcel6, Talanta, 40 (1993) 1665 112. E. Benfenati, S. Garofani, M. Natangelo, S. Mangiapan and R. Fanelli, Int. J. Environ. Anal. Chem., 58 (1995) 23 113. E. Chladek and R.S. Marano, J. Chromatogr. Sci., 22 (1984) 313 114. V. Pichon, C. Cau Dit Coumes, L. Chen and M.-C. Hennion, Int. J. Environ. Anal. Chem., 65 (1996) 11 115. W.A. House and O. Ziqing, Chemosphere, 24 (1992) 819 116. G.R. van der Hoff, F. Pelusio, U.A.Th. Brinkman, R.A. Baumann and P. Van Zoonen, J. Chromatogr. A, 719 (1995) 59 117. R. Soniassy, PK. Sandra and C. Schlett, in: Water Analysis-Organic Micropollutants, HewlettPackard Company, Germany, 1994, p. 125 118. S.A. Senseman, T.L. Lavy, J.D. Mattice and E.E. Gbur, Environ. Sci. Technol., 29 (1995) 2647 119. M. Fielding, D. Barcel6, A. Helweg, S. Galassi, L. Tortenson, P. van Zoonen, R. Wolter and G. Angeletti, in: Pesticides in Ground and Drinking Water (Water Pollution Research Report, 27) Commission of the European Community, Brussels, 1992, pp. 1-136 120. J.W. Readman, T.A. Albanis, D. Barcel6, S. Galassi, J. Tronczynski and G.P. Gabrielides, Mar. Pollut. Bull., 26 (1993) 613 121. C. Skark and N. Zullei-Seibert, Int. J. Environ. Anal. Chem., 58 (1995) 387 122. J.P. Besset, Journal "le Monde", November 30, 1995 123. S. Butz, T. Heberer and H.J. Stan, J. Chromatogr. A, 677 (1994) 63 124. A. Di Corcia and M. Marchetti, Environ. Sci. Technol., 26 (1992) 66 125. A. Cappiello, G. Famiglini and F. Bruner, Anal. Chem., 66 (1994) 1416 126. Th. Heberer, S. Butz and H.J. Stan, Int. J. Environ. Anal. Chem., 58 (1995) 43 127. A. Balinova, J. Chromatogr., 643 (1993) 203 128. J. Slobodnik, E.R. Brouwer, R.B. Geerdink, W.H. Mulder, H. Lingeman and U.A.Th. Brinkman, Anal. Chim. Acta, 268 (1992) 55 129. J. Slobodnik, M.G.M. Groenewegen, E.R. Brouwer, H. Lingeman and U.A.Th. Brinkman, J. Chromatogr., 642 (1993) 359 130. V. Pichon and M.-C. Hennion, J. Chromatogr. A, 665 (1994) 269 131. V. Coquart and M.-C. Hennion, Sci. Total Environ., 132 (1993) 349 132. J.A. Leenheer, R.L. Wershaw and M.L. Reddy, Environ. Sci. Technol., 29 (1995) 393 133. J.A. Leenheer, R.L. Wershaw and M.L. Reddy, Environ. Sci. Technol., 29 (1995) 399 134. J.V. Sancho Lopez, F. Hernandez, E.A. Hogendoorn and P. van Zoonen, Anal. Chim. Acta, 283 (1993) 287 135. M. Dressier, J. Chromatogr., 165 (1978) 167 136. G.A. Junk, J.J. Richard, M.D. Grieser, D. Witiak, M.D. Arguello, R. Vick, H.J. Svec, J.S. Fritz and G.V. Calder, J. Chromatogr., 99 (1974) 745 137. P. Van Rossum and R.J. Webb, J. Chromatogr., 150 (1978) 381 138. M.W. Tabor and J.C. Loper, Int. J. Environ. Anal. Chem., 19 (1985) 281 139. R.A. Moore and F.W. Karasek, Int. J. Environ. Anal. Chem., 17 (1984) 187 140. H.A. James, C.P. Steel and I. Wilson, J. Chromatogr., 208 (1981) 89 141. N. Picer and M. Picer, J. Chromatogr., 193 (1980) 357 142. M.P. Maskarinee, D.L. Manning, R.W. Harvey, W.H. Griest and B.A. Tonkins, J. Chromatogr., 302 (1984) 51 143. M. Ishibashi and M. Suzuki, J. Chromatogr., 456 (1988) 382 144. J.I. Gomez-Belinchon, J.O. Grimalt and J. Albaiges, Environ. Sci. Technol., 22 (1988) 677 145. S.A. Daignault, D.K. Noot, D.T. Williams and P.M. Huck, Water Res., 22 (1988) 803 146. A. Przyjazny, J. Chromatogr., 346 (1985) 61 147. G.R. Aiken, E.M. Thurman, R.L. Malcolm and H.F. Walton, Anal. Chem., 51 (1979) 1799
Sample Handling Techniques
353
148. B. Wigilius, H. Boren, G.E. Carlberg, A. Grimwall, B.V. Lundgren and R. Savenhed, J. Chromatogr., 391 (1987) 169 149. M.-C. Hennion and V. Coquart, J. Chromatogr., 642 (1993) 211 150. M.-C. Hennion, V. Coquart, S. Guenu and C. Sella, J. Chromatogr. A, 712 (1995) 287 151. V. Pichon, C. Cau Dit Coumes, L. Chen, S. Guenu and M.-C. Hennion, J. Chromatogr. A, 737 (1996) 169 152. A. Junker-Buchheit and M. Witzenbacher, Poster at the 5th Symposium, "Chemistry and Fate of Modern Pesticides", Paris, 1995 153. Bakerbond Application note No EN-512, J.T Baker, 1995 154. R. Eisert, K. Levsen and G. Wtinsch, Int. J. Environ. Anal. Chem., 58 (1995) 103 155. C. Crespo, R.M. Marc6 and F. Burull, J. Chromatogr. A, 670 (1994) 135 156. J. Hodgeson, J. Collins and W. Bashe, J. Chromatogr. A, 659 (1994) 395 157. C. Molina, P. Grasso, E. Benfenati and D. Barcel6, J. Chromatogr. A, 737 (9916) 47 158. S. Guenu and M.-C. Hennion, J. Chromatogr. A, 712 (1995) 287 159. E. Matisova and S. Skrabakova, J. Chromatogr. A, 707 (1995) 145 160. C. Borra, A. Di Corcia, M. Marchetti and R. Samperi, Anal. Chem., 58 (1986) 2048 161. A. Di Corcia and M. Marchetti, Anal. Chem., 63 (1991) 580 162. A. Di Corcia and M. Samperi, Anal. Chem., 62 (1990) 1490 163. F. Mangani, G. Crescentini and F. Bruner, Anal. Chem., 53 (1981) 1627 164. M. Battista, A. Di Corcia and M. Marchetti, Anal. Chem., 61 (1989) 935 165. L. Campanella, A. Di Corcia and M. Marchetti, Mar. Chem, 7 (1982) 429 166. A. Di Corcia and M. Marchetti, J. Chromatogr., 541 (1991) 365 167. A. Di Corcia, M. Marchetti and R. Samperi, J. Chromatogr., 405 (1987) 357 168. A. Di Corcia, S. Marchese and R. Samperi, J. Chromatogr., 642 (1993) 175 169. A. Di Corcia, S. Marchese and R. Samperi, J. Chromatogr., 642 (1993) 163 170. A. Di Corcia, R. Samperi, A. Marcomini and S. Stelluto, Anal. Chem., 65 (1993) 907 171. A. Lagana, B.M. Petronio and M. Rotatori, J. Chromatogr., 198 (1980) 143 172. F. Mangani, G. Crescentini, P. Palma and F. Bruner, J. Chromatogr., 452 (1988) 527 173. A. Bacaloni, G. Goretti, A. Lagana, B. Petronio and M. Rotatori, Anal. Chem., 52 (1980) 2033 174. Z. Cai, V.M.S. Ramanujam, M.L. Gross, S.J. Monsson, D.A. Cassada and R.F. Spalding, Anal. Chem., 66 (1994) 4202 175. K.K. Unger, Anal. Chem., 55 (1983) 361A 176. H. Colin and G. Guiochon, J. Chromatogr., 126 (1976) 43 177. H. Colin, C. Eond and G. Guiochon, J. Chrornatogr., 119 (1976) 41 178. J.H. Knox, B. Kaur and G.R. Millward, J. Chromatogr., 352 (1986) 3 179. B. Bassler and R.A. Hartwick, J. Chromatogr. Sci., 27 (1989) 162 180. V. Coquart and M.-C. Hennion, J. Chromatogr., 600 (1992) 195 181. S. Guenu and M.-C. Hennion, J. Chromatogr. A, 665 (1994) 243 182. V. Pichon, L. Chen, S. Guenu and M.-C. Hennion, J. Chromatogr. A, 711 (1995) 257 183. M.-C. Hennion and R. Rosset, Chromatographia, 25 (1988) 43 184. S. Guenu and M.-C. Hennion, J. Chromatogr. A , 725 (1996) 57 185. C. Cau Dit Coumes and M.-C. Hennion, unpublished results 186. Z. Cai, M.L. Gross and R.F. Spalding, Anal. Chim. Acta, 304 (1995) 67 187. M.W.F. Nielen, J. de Jong, R.W. Frei and U.A.Th. Brinkman, Int. J. Environ. Anal. Chem., 25 (1987) 37 188. M.W.F. Nielen, U.A.Th. Brinkman and R.W. Frei, Anal. Chem., 57 (1985) 806 189. M.W.F. Nielen, U.A.Th. Brinkman and R.W. Frei, J. Chromatogr., 317 (1984) 557 190. V. Pichon and M.-C. Hennion, Anal. Chim. Acta, 284 (1993) 317 191. J. Dugay and M.-C. Hennion, Trends Anal. Chem, 14 (1995) 407
References pp. 349-356
354
Chapter 4
192. 193. 194. 195. 196. 197.
M.-C. Hennion, P. Subra, V. Coquart and R. Rosset, Fresenius' J. Anal. Chem., 339 (1991) 488 R.N. Lerch, W.W. Donald, Y.X. Li and E.E. Alberts, Environ. Sci. Technol., 29 (1995) 2759 M.S. Mills, E.M. Thurman and M.J. Pedersen, J. Chromatogr., 629 (1993) 11 P.J. Dumont and J.S. Fritz, J. Chromatogr. A, 691 (1995) 123 D. Puig, I. Silgower and D. Barcel6, J. Mass Spectrom., 31 (1996) 1297 A. Farjam, A.E. Brugman, A. Soldaat, P. Timmerman, H. Lingeman, G.J. de Jong and U.A.Th. Brinkman, Chromatographia, 31 (1991) 469 W. Haasnoot, M.E. Ploom, R.J.A. Palussen, R. Schilt and F.A. Huf, J. Chromatogr., 519 (1990) 323 R. Bagnati, M.G. Castelli, L. Airoldi, M.P. Oriundi, A. Ubaldi and R. Fanelli, J. Chromatogr., 527 (1989) 267 J.F. Lawrence and P.M. Scott, in: D. Barcel6 (Ed.), Environmental Analysis: Techniques, Applications and Quality Assurance, Elsevier, Amsterdam, 1993, Chapter 5, pp. 273-309 A. Kussak, B. Anderson and K. Anderson, J. Chromatogr. B., 672 (1995) 253 M.W. Trucksess and D.W. Koeltzow, in: J.O. Nelson, A.E. Karu and R.B. Wong (Eds.), Immunoanalysis of Agrochemicals, Emerging Technologies, ACS Symp. Ser. 442, American Chemical Society, Washington, DC, 1995, pp. 326-334 A. Farjam, N.C. van de Merbel, H. Lingeman, R.W. Frei and U.A.Th. Brinkman, J. Chromatogr., 589 (1992) 141 M. Sharman, S. MacDonald and J. Gilbert, J. Chromatogr., 603 (1992) 285 C. De Boevre and C. van Peteghem, Anal. Chim. Acta, 275 (1993) 341 A. Marx, T. Giersch and B. Hock, Anal. Lett., 28 (1995) 267 G.S. Rule, A.V. Mordehal and J. Henion, Anal Chem., 66 (1994) 230 D.H. Thomas, M. Beck-Westermeyer and D.S. Hage, Anal. Chem., 66 (1994) 3823 S.J. Shahtaheri, M.F. Katmeh, P. Kwasowski and D. Stevenson, J. Chromatogr. A, 697 (1995) 131 D.S. Hage, J.G. Rollag and D.H. Thomas, Preprints of Papers, 21st ACS National Meeting, NewOrleans, LO, 1996, pp. 101-103 V. Pichon, L. Chen and M.-C. Hennion, Anal. Chim. Acta, 311 (1995) 429 V. Pichon, L. Chen, M.-C. Hennion, R. Daniel, A. Martel, F. Le Goffic, J. Abian and D. Barcel6, Anal. Chem., 67 (1995) 2461 V. Pichon, L. Chen, N. Durand, F. le Goffic and M.-C. Hennion, J. Chromatogr. A, 725 (1996) 107 J.F. Lawrence, C. Menard, M.-C. Hennion, V. Pichon, F. Le Goffic and N. Durand, J. Chromatogr. A, 732 (1996) 277 J.F. Lawrence, C. Menard, M.-C. Hennion, V. Pichon, F. Le Goffic and N. Durand, J. Chromatogr. A, 752 (1996) 147 C.L. Arthur and J. Pawliszyn, Anal. Chem, 62 (1990) 2145 C.L. Arthur, D. Potter, K. Buchhloz, S. Motlaggh and J. Pawliszyn, LC-GC, 10 (1992) 656 D. Louch, S. Mortlaugh and J. Pawliszyn, Anal. Chem, 64 (1992) 1187 C.L. Arthur, K. Buchhloz and J. Pawliszyn, Anal. Chem., 64 (1992) 1960 C.L. Arthur, R. Belardi, K. Pratt, S. Motlaggh and J. Pawliszyn, J. High. Resolut. Chromatogr., 15 (1992) 741 D.W. Potter and J. Pawliszyn, J. Chromatogr. A, 625 (1992) 247 C.L. Arthur, L.M. Killiam, S. Motlaggh, M. Lim, D.W. Potter and J. Pawliszyn, Environ. Sci. Technol., 26 (1992) 979 M. Chai, C.L. Arthur, J. Pawliszyn, R.P. Belardi and K.F. Pratt, Analyst (London), 118 (1993) 501 C. Rivasseau and M. Caude, Chromatographia, 41 (1995) 462
198. 199. 200. 201. 202.
203. 204. 205. 206. .207. 208. 209. 210. 211. 212. 213. 214. 215. 216. 217. 218. 219. 220. 221. 222. 223. 224.
Sample Handling Techniques 225. 226. 227. 228. 229. 230. 231. 232. 233. .234. 235. 236. 237. 238. 239. 240. 241.
242. 243. 244. 245. 246. 247. 248. 249. 250. 251. 252. 253. 254. 255. 256. 257. 258. 259. 260. 261. 262. 263. 264. 265. 266.
355
K.D. Buchholz and J. Pawliszyn, Environ. Sci. Technol., 27 (1993) 2844 K.D. Buchholz and J. Pawliszyn, Anal. Chem., 66 (1994) 160 D.W. Potter and J. Pawliszyn, Environ. Sci. Technol., 28 (1994) 298 J. Pawliszyn, Trends Anal. Chem., 14 (1995) 113 A.A. Boyd-Boland and J.B. Pawliszyn, J. Chromatogr. A, 704 (1995) 163 S. Magdic and J.B. Pawliszyn, J. Chromatogr. A, 723 (1996) 129 R. Eisert and K. Levsen, Fresenius' J. Anal. Chem., 351 (1995) 555 K.N. Graham, L.P. Sarna, G.R.B. Webster, J.D. Gaynor and H.Y.F. Ng, J. Chromatogr. A, 725 (1996) 129 I.J. Barnabas, J.R. Dean, J.R. Fowlis and S.P. Owen, J. Chromatogr. A, 705 (1995) 305 R. Eisert, K. Levsen and G. Wtinsch, J. Chromatogr. A, 683 (1994) 175 R. Eisert and K. Levsen, J. Am. Soc. Mass Spectrom., 6 (1995) 1119 F. Mangani and R. Cenciarini, Chromatographia, 41 (1995) 462 Supelco Reporter, Vol. 14, No. 5, 1995, p. 4 J.R. Dean, W.R. Tomlinson, V. Makovskaya, R. Cumming, M. Hetheridge and M. Comber, Anal. Chem., 68 (1996) 130 V. Camel, A. Tambute and M. Caude, J. Chromatogr., 642 (1993) 263 V. Janda, K.D. Bartle and A.A. Clifford, J. Chromatogr., 642 (1993) 283 S.B. Hawthorne, D.J. Miller and J.J. Langenfeld, in: K. Jinno, (Ed.), Hyphenated Techniques in Supercritical Fluid Chromatography and Extraction, J. Chromatogr. Lib. 53, Elsevier, Amsterdam, 1992, p. 225 T.L. Chester, J.D. Pinkston and D.E. Raynie, Anal. Chem., 66 (1994) 106R S. Bowadt and S.B. Hawthorne, J. Chromatogr. A, 703 (1995) 549 I.J. Barnabas, J.R. Dean, S.M. Hitchen and S.P. Owen, J. Chromatogr. A, 665 (1994) 307 J. Hedrick and L.T. Taylor, J. High. Resolut. Chromatogr., 13 (1990) 312 D. Thiebaut, J.P. Chervet, R.W. Vannort, G.L. de Jong, U.A.Th. Brinkman and R.W. Frei, J. Chromatogr., 477 (1989) 151 A. Daneshfar, M. Barzegar, M. Ashraf-Khorassani and J.M. Levy, J. High. Resolut. Chromatogr., 18 (1995) 446 M.Y. Croft, E.J. Murby and R.J. Wells, Anal. Chem., 66 (1994) 4459 A.L. Howard and L. Taylor, J. Chromatogr. Sci., 30 (1992) 374 J.S. Ho and W.L. Budde, Anal. Chem., 66 (1994) 3716 W.S. Ong and R.A. Hites, Environ. Sci. Technol., 29 (1995) 1259 P. Sandra, A. Kot, A. Medvedovici and F. David, J. Chromatogr. A, 703 (1995) 467 I.J. Barnabas, J.R. Dean, S.M. Hitchen and S.P. Owen, J. Chromatogr. Sci., 32 (1994) 547 K. Wuchner and R. Grob, Analusis, 23 (1995) 227 T.A. Berger, Chromatographia, 41 (1995) 1693 S.B. Hawthorne, D.J. Miller, M.D. Burford, J.J. Langenfeld, S.E. Eckert-Tilotta and P.K. Louise, J. Chromatogr., 642 (1993) 301 D.E. Raynie, Anal. Chem., 65 (1993) 3127 S.B. Hawthorne, J.J. Langenfeld, D.J. Miller and M.D. Budford, Anal. Chem., 64 (1992) 1614 S.B. Hawthorne, Y. Yang and D.J. Miller, Anal. Chem., 66 (1994) 2912 Y. Yang, S. Bowadt, S.B. Hawthorne and D.J. Miller, Anal. Chem., 67 (1995) 4571 K.D. Bartle and A.A. Clifford, LC-GC Int., 4,10 (1991) 11 J.R. Wheeler and M.E. McNally, J. Chromatogr. Sci., 27 (1989) 534 S.B. Hawthorne and D.J. Miller, Anal. Chem., 66 (1994) 4005 J.H. Langenfeld, S.B. Hawthorne, D.J. Miller and J. Pawliszyn, Anal. Chem., 65 (1993) 338 M.E. McNally and J.R. Wheeler, J. Chromatogr., 447 (1988) 53 J.H. Langenfeld, S.B. Hawthorne, D.J. Miller and J. Pawliszyn, Anal. Chem., 66 (1994) 909
References pp. 349-356
356
Chapter 4
267. 268. 269. 270. 271. 272. 273.
S. Papilloud and W. Haerdi, Chromatographia, 38 (1994) 515 S. Papilloud and W. Haerdi, Chromatographia, 40 (1995) 705 T.R. Steinheimer, R.L. Pfeiffer and K.D. Scoggin, Anal. Chem., 66 (1994) 645 S.B. Hawthorne, A.B. Galy, V.O. Schmitt and D.J. Miller, Anal. Chem., 67 (1995) 2723 J.H. Langenfeld, M.D. Burford, S.B. Hawthorne and D.J. Miller, J. Chromatogr., 594 (1992) 297 N. Htisers and W. Kleib6hmer, J. Chromatogr. A, 697 (1995) 107 B.W. Wenclawiak, O.P. Heemken, D. Sterzenbach, J. Schipke, N. Theobald and V. Weigelt, Anal. Chem., 67 (1995) 4577 S. Bowadt, B. Johansson, F. Pelusio, B.R. Larsen and C. Rovida, J. Chromatogr., 662 (1994) 424 R. Alzaga, G. Durand, D. Barcel6 and J.M. Bayona, Chromatographia, 38 (1994) 502 S. Bowadt, B. Johansson, S. Wunderli, M. Zennegg, L.F. de Alencastro and D Grandjean, Anal. Chem., 67 (1995) 2424 V. Lopez-Avila, R. Young, J. Benedicto, P. Ho, R. Kim and W.F. Beckert, Anal. Chem., 67 (1995) 2096 H. Black, Environ. Sci. Technol., 30 (1996) 125A V. Lopez-Avila, C. Charan and W.F. Beckert, Trends Anal. Chem., 13 (1994) 118 M. Vails, J.M. Bayona and J. Albaiges, Int. J. Environ. Anal. Chem., 39 (1990) 329 D. Barcel6, M. Sole, G. Durand and J. Albaiges, Fresenius' J. Anal Chem, 339 (1991) 676 D.A. Hinckley and T.F. Bidlman, Environ. Sci. Technol., 23 (1989) 995 G. Durand, R. Forteza and D. Barcel6, Chromatographia, 28 (1989) 597 C.S. Helling, W. Zhuang, T.J. Gish, C.B. Coffman, A.R. Isensee, P.C. Kearney, D.R. Hoagland and M.D. Woodward, Chemosphere, 17 (1988) 175 D. Barcel6, C. Porte, J. Cid and J. Albaiges, Int. J. Environ. Anal. Chem., 38 (1990) 199 E.M. Lores, J.C. Moore and P. Moody, Chemosphere, 16 (1987) 1065 D.M. Swineford and A.A. Belisle, Environ. Toxicol. Chem., 8 (1989) 465 M.J. Page and M. French, J.A.O.A.C. Int., 75 (1992) 1073 N. de Bertrand, G. Durand and D. Barcel6, J. Environ. Sci. Health A, 26 (1991) 575 J.-P. Lautie, Analusis, 23 (1995) 356 F. Hernandez, J. Beltran and F.J. Lopez, Quim. Anal., 13 (1994) 115 M.-C. Hennion, J.-C. Thieblemont, R. Rosset, P. Scribe, J.-C. Marty and A. Saliot, J. Chromatogr., 280 (1983) 351 J.N. Seiber, D.E. Glotfelty, A.D. Lucas, M.M. McChesney, J.C. Sagebiel and T.A. Wenher, Arch. Environ. Contam. Toxicol., 19 (1990) 583 A.M. Gillespie and S.M. Walter, J. Liquid Chromatogr., 9 (1986) 2111 G.R. van der Hoff, A.C. van Beuzekom, U.A.Th. Brinkman, R.A. Baumann and P. van Zoonen, Poster at the 5th Symposium on Chemistry and Fate of Pesticides, Paris, 1995 A.H. Roos, A.J. van Munsteren, F.M. Nab and L.G.M.Th. Tuinstra, Anal. Chim. Acta, 196 (1987) 95 D. Puig and D. Barcel6, J. Chromatogr. A, 673 (1994) 55 G. Durand and D. Barcel6, Quim. Anal., 13 (1994) $89 E. Viana, J.C. Molto, J. Manes and G. Font, J. Chromatogr. A, 655 (1993) 285 N.C. van de Merbel, F.M. Lagerwerf, H. Lingeman and U.A.Th. Brinkman, Int. J. Environ. Anal. Chem., 54 (1994) 105
274. 275. 276. 277. 278. 279. 280. 281. 282. 283. 284. 285. 286. 287. 288. 289. 290. 291. 292. 293. 294. 295. 296. 297. 298. 299. 300.
357 CHAPTER 5
On-Line Sample Handling Strategies 5.1. INTRODUCTION With environmental protection on the agenda of many countries, monitoring programmes for pesticides and degradation products are currently being set up. Consequently, in many laboratories both the number of analyses to be performed and the number of pesticides to be determined have increased rapidly. The interest in using more powerful analytical methods which can be automated and allow the trace determination of many pesticides at the same time has therefore also grown rapidly. In the previous chapter, it was pointed out that sample pretreatment is the weakest link and the primary source of errors and discrepancies between laboratories. The development of more rapid and reliable strategies requires the removal of intermediate steps such as transfers, evaporation and derivatization, i.e., an emphasis on automation and techniques that maximize sample throughput. Solid-phase extraction considerably simplifies the sample pretreatment step, especially when selective sorbents can be used, but there is still some evaporation and transfer of the extract, so that losses from thermal decomposition still occur and contamination risks remain. With the introduction of bridge arms that can automatically transfer SPE collection vials to GC, LC or SFC autosamplers, the automation of the whole analytical scheme, i.e., the SPE process and chromatographic separation, can be performed. In an on-line system, the sample preparation step and the separation plus detection are combined in one analytical train. In most cases, the sample preparation step is performed by SPE, and the SPE precolumn is directly desorbed into the analytical column. Therefore, on-line SPE is less laborious and time-consuming than off-line SPE, but the most important advantages are that (i) the risk of contamination of the sample and sample extract is greatly reduced, (ii) analyte losses by evaporation do not occur, and (iii) the totality of the extracted species is transferred and analyzed. In contrast to off-line SPE, where only an aliquot of the extract is injected into the chromatograph, for example, in most instances, a volume of 1-5 y1 is injected into the GC whereas the extract is dissolved in at least 100 y1, the analysis of the complete sample allows the sample volume to be dramatically reduced to less than 5References pp. 423-427
358
Chapter 5
10 ml when SPE is coupled to GC or to 100-150 ml when it is coupled to LC. Finally, very low volumes of solvent are required for the on-line SPE process. The first commercial automated devices became available for the on-line coupling of SPE with LC because of the good compatibility of the LC aqueous mobile phases with the SPE of the samples. On-line coupling of SPE with GC is more delicate because of the inherent incompatibility between the aqueous part of the SPE step and the dry part of the GC system. However, much work has been done in this area and automated devices have recently become available. On-line techniques which couple SPE with the various chromatographic modes offer a fast, modem and reliable approach for monitoring traces of pesticides in water using completely automated methods with no risk of loss or contamination since there is no sample manipulation between the sample percolation and the analysis. It is clear that the state-of-the-art depends on the on-line methodology. The online SPE-LC-DAD system is being used routinely in many laboratories; this is the subject of the first part of the chapter. Most of the multiresidue methods for polar pesticides or degradation products involve LC, with identification of compounds using a diode-array UV detector (DAD). Special attention is given to the sample volume that can be handled, depending on the nature of the sorbent packed in the precolumn, and on the polarity of the analytes. The corresponding detection limits that can be reached in real samples, i.e., drinking, surface or sea water are presented. The total approach of the system is discussed. In the event of insufficient sensitivity, the use of more selective sorbents, or of on-line post-column derivatization techniques is required; these are described. Confirmation of identities is often obtained by mass spectrometry (MS) techniques which can also be included in the on-line system. The on-line coupling with MS can be added to on-line SPE-LC systems, thus providing the most efficient arrangement for multiresidue analysis of pesticides. The second part of the chapter is devoted to the on-line coupling of SPE with GC. The removal of water, required before transfer to the GC column, is described and various applications using different detection modes are presented. The new methods involving solid-phase microextraction have been discussed in the previous chapter. Although it can be considered as an on-line integrated technique since it includes the direct injection of the species concentrated on the fibre into the GC, there are no special conditions linked to the on-line transfer of the species from the fibre to the GC. In the last part of this chapter, the potential of the on-line coupling of SFE with SFC is presented. 5.2. ON-LINE TECHNIQUES W I T H SEPARATION BY LIQUID CHROMATOGRAPHY As seen in Chapter 3, liquid chromatography (LC) is particularly well adapted to multiresidue analysis because of its suitability for direct analysis over a wide range of polarity, without risk of thermal decomposition. The basic principles of SPE that
On-Line Sample Handling Strategies
359
have been described in the previous chapter are valuable for the prediction of recoveries. The main differences lie in the selection of the sorbent and in the possibility of coupling several sorbents in series.
5.2.1. On-line solid-phase extraction and liquid chromatography with conventional detectors (SPE-LC systems) 5.2.1.1. On-line arrangements The on-line coupling of SPE to LC is particularly easy to perform in any laboratory, and has been described extensively in general reviews dealing with the on-line preconcentration of organic compounds in environmental or biological samples [119]. The SPE column, the so-called precolumn, is generally made of stainless steel in order to be pressure-resistant. The apparatus is represented in Fig. 5.1. The traceenrichment is carried out on a small precolumn which is placed at the sample-loop position of a six-port liquid switching valve. A solvent delivery unit (SDU) provides the solvents necessary to purge, wash, and activate the precolumn. After conditioning, sample application, and eventual clean-up via the pump of the SPE part, the precolumn is placed in front of an analytical column by switching the valve into the "inject" position. The trapped compounds are then eluted directly from the precolumn into the analytical column by a suitable mobile phase which also brings about the chromatographic separation. Quantitative results of good accuracy can be expected as there is no sample manipulation between the preconcentration and the analysis. In contrast with off-line SPE procedures, the entire sample is transferred and analyzed, which allows the handling of smaller sample volumes. The LC system is often run in the reversed-phase mode, using apolar alkyl silica analytical columns because the mobile phase is a partly aqueous solvent mixture. This means that residual water in the precolumn after the preconcentration of aqueous samples does not have to be removed before the desorption. The addition of a second switching valve allows both direct injection onto the analytical column and preconcentration via the precolumn. Automation is very easy and several devices are now commercially available (such as the Prospekt from Spark Holland, and OSP-2 from Merck). In these systems, a new disposable precolumn is used for each run and the exchange is automatic. The whole sequence can be programmed and can be performed on a sample whilst the on-line analysis of a previous sample occurs [20-29]. This full automation has been used for on-site monitoring of pesticides in surface waters as part of an early warning alarm system [ 18,22,28,29]. These studies have contributed greatly in demonstrating that on-line SPE-LC is a robust and reliable technique that can be applied routinely in the field. 5.2.1.2. Precolumns The size of the precolumn is an important parameter because the profile of the concentrated species transferred from the precolumn to the analytical column should References pp. 423-427
360
Chapter 5
PRECONCENTRATION STEP SAMPLES
l'J
i
6
t/
WASTE
I
I
I
I
PROSPEKT
SDU
ON-LINE ELUTION AND SEPARATION STEP J ri
'-,,
e
1~
I||1 l',ff.
-.-- : :
lllll III1
!
J
PROSPEKT
1
J
SDU
Fig. 5.1. On-line arrangement. 1, LC switching valve; 2, precolumn; 3, switching valve of the solvent delivery unit; 4, preconcentration pump; 5, LC pump; 6, analytical column; 7, detector.
be as narrow as possible at the beginning of the separation in order to avoid bandbroadening. The quality of the coupling can easily be controlled by comparing chromatograms obtained by direct injection with those obtained by on-line preconcentration via the precolumn. The dimensions of the precolumn should be adapted to those of the analytical column [30,31] and are typically 2-15 mm long and 1-4.6 mm i.d. for a classical 15-25 cm long analytical column. The use of a
On-Line Sample Handling Strategies
361
small precolumn is important when the separation is carried out with an isocratic mobile phase [32]. It was shown that the dimensions of the precolumn can be increased without band-broadening when an appropriate methanol or acetonitrile gradient was applied for the separation [33]. Although it was first recommended to pack precolumns with 5-10/.tm packings [4], the trend now is to use 15-40/~m packings in order to have a high sampling rate during the loading of the sample and to prevent clogging with, for example, a surface water sample. Despite the granulometry, it is recommended to use LC-grade- and pressure-resistant sorbents. Prepacked precolumns with different sorbents are now available from various manufacturers. It is also easy to pack a precolumn in the laboratory, thus allowing the potential of using new sorbents. The use of Empore disks in on-line applications became possible after the production by U.A.Th. Brinkman's group of an appropriate membrane-disk holder [23,34-37]. Here again the advantage is the possibility of higher flow rates during the sample loading. Backflush-desorption of the precolumn should give the least amount of extra band broadening and should provide better peak shapes than forward-desorption. However, backflush-desorption has the drawback of creating problems of clogging of the analytical column when real samples are used. In the forward desorption mode, the precolumn has the additional role of acting as a guard column and thus preserving the lifetime of the analytical column. With precolumns of small dimensions, our own experience has indicated that very little difference can be observed between backflush and forward desorption. The compatibility between the sorbent and the precolumn is important. The most efficient system is ideally obtained for a precolumn and an analytical column of the same nature [4]. Various sorbents can be packed in precolumns which have different abilities for trapping the compounds, especially the more polar ones, but in practice it appears that the choice of sorbent to be packed in the precolumn is greater than the choice of analytical columns. When many components are to be separated, over a large range of polarity, their separation requires a highly efficient analytical column with both water-rich and organic-rich mobile phases. At present, only C18 silica columns meet this requirement. Polymeric SDB or carbonaceous columns are very efficient in organic-rich mobile phases but much less so in water-rich ones. The compatibility of sorbents for precolumn and analytical columns is discussed for each precolumn sorbent. 5.2.1.3. Selection of the sorbent for the precolumn A serious limitation of SPE-LC systems is that they use small precolumns which therefore contain a small amount of sorbent. In contrast to off-line SPE where there is the possibility of increasing the breakthrough volumes, Vb, by increasing the amount of sorbent in the cartridge, in on-line SPE, when compounds are poorly retained the only solution is to select a more retentive sorbent. The basic principles of References pp. 423-427
362
Chapter 5
SPE are similar for off-line and on-line methods and have been extensively described in the previous chapter. 5.2.1.3.1. Non-selective sorbents Alkyl bonded silica. Most of the published off-line procedures now utilize disposable cartridges packed with C8 or C18 silica and this is certainly the first sorbent to be tried in on-line techniques. The average limits of detection (LOD) with UV-DAD are between 0.5 and 10 ng injected, depending on the pesticide's UV properties. For an average LOD of 5 ng, if one wants determination in water at a concentration of 1/~g/1, a sample volume of 5 ml will be sufficient. Reupert et al. [27] have shown that the on-line handling of a 5 ml river-water sample was enough to detect most pesticides at the 5/tg/1 level. However, 5 ml will usually be too small a volume to reach a concentration limit of detection in real water samples and the presence of humic substances and other contaminants will often require the handling of a 10-fold higher volume, as shown below. When concentration levels of 50 ng/1 are required, the sample volume should be increased to at least 100 ml. Among alkyl silica sorbents, several C8 and C18 formulations are available in addition to cyclohexyl and phenylsilicas. We know from LC data that C8 silicas usually provide lower log k'w values (provided that C~8 sorbents with high carbon contents were considered for comparison). For this reason, the use of a precolumn packed with C8 silica will lead to lower Vb values and is not recommended for the more polar pesticides. Table 5.1 summarizes the percent recoveries using on-line cartridges packed with different alkyl silicas and with the apolar copolymer PLRP-S. The sample volume was 200 ml. Recoveries are very low with a C2 silica precolumn and are lower with a C8 than with a C~8 silica precolumn [38]. Similar results were obtained when comparing Vb values using C18 silicas, characterized by 5 and 15% carbon content and C8 silica for the preconcentration of a mixture of phenylureas and triazine herbicides [39]. This is also illustrated in Fig. 5.2 where the same volumes of water spiked with 24 polar and moderately polar pesticides and degradation products were analyzed on-line using a 15 x 3 mm i.d. precolumn packed using C8 silica (Fig. 5.2a), cyclohexyl silica (Fig. 5.2b) and C18 silica (Fig. 5.2c). For the first-eluted pesticides, the peak heights obtained by C8 or cyclohexyl silica are lower than those obtained with C18 silica, thus showing lower recoveries. On the other hand, the amount of co-concentrated species is lower on C8 silica. With the C~8 silica there is a large peak of interfering material eluted during the first 20 min of the chromatogram. This result is consistent with those reported in Ref. [39], showing the problem encountered in determination of polar pesticides requiting sorbents that also concentrate effectively the humic material of surface waters. One has to take care that C~8 sorbents "specific for the trapping of polar pesticides" do not really extract the polar compounds "selectively", as is often mentioned. The breakthrough volumes have been measured for polar carbamates by measuring the recoveries obtained with increasing sample volumes, using disposable cartridges
363
On-Line Sample Handling Strategies TABLE 5.1 PERCENT RECOVERY OF PESTICIDES USING CARTRIDGES PACKED WITH DIFFERENT PHASE MATERIAL Compound
Hydroxyatrazine De-isopropylatrazine Desethylatrazine Hexazinone Metoxuron Simazine Monuron Cyanazine Methabenzthiazuron Chlortoluron Atrazine Isoproturon Diuron Metobromuron Metazachlor Sebutylazine Terbutylazine Chloroxuron Linuron Anilazine Metolachlor Neburon
Phase C-2
C-8
C- 18
PLRP-S
0 0 0 10000 148
100 139 87 85 82 74 54 15 13 6 5 4
100 97 184 112 32 22 13 5 15 0.3 0.5
Immunochemical Methods and Biosensors
457
compounds, classified in order of increasing cross-reactivity; we have not reported all the data. Generally, the cross-reactivities of many other compounds with closely related structure are reported in the assay characteristics provided by companies. From the data of Table 6.1, it can be observed that many immunoassays show few or no cross-reactivity effects, and can be used for single component analysis. ELISAs for the analysis of pesticides such as cyanazine, chlorsulfuron, paraquat, carbaryl, carbofuran, chlorpyrifos, or methomyl are very specific. Class-selective IAs are available mainly for triazine and phenylurea herbicides. Regarding cross-reactivity measurements, it is worth mentioning that in real environmental situations, a single analyte is not to be expected, as indicated by commercial ELISAs, but that various analytes will be found together with the target compound. Another important factor in environmental work is the matrix type, which may affect the immunoassays. In this sense, the measurement of the cross-reactivity should approach the real environmental situation as closely as possible. In clinical chemistry, Miller and Valdes [137] reported a model that closely approaches real situations by measuring the cross-reactivity of an analyte in the presence of crossreactants. It was proposed that one should apply various doses of cross-reactant, each in the presence of various doses of the standard. This approach has been adapted to environmental cross-reactivity studies of immunoassays for chlorpyriphos-ethyl by Oubina et al. [138]. The specificity of the ELISA for chlorpyriphos-ethyl was determined at a fixed standard dose concentration of 0.5/tg/1 in the presence of various concentrations of cross-reactants and in various environmental matrices. In each experiment, a blank was measured in the absence of the interfering cross-reactant and with only chlorpyriphos at 0.5 ktg/1. The LDD and IC50 values were then determined using criteria similar to those reported for standard curves with a single compound. With this variation, a more realistic approximation of the environmental data is performed. This is an advantage over traditional methods where only the crossreactivity of individual cross-reactants using one matrix is presented, generally an appropriate IA buffer such as phosphate buffer saline (PBS) or ground water. Although the matrix effect is discussed later, the same research group had previously found a great difference between distilled or ground water, compared to estuarine water samples, in the atrazine assay mixed with common cross-reactants [62]. Table 6.5 summarizes the specificity data with the major chlorpyriphos-ethyl crossreactants. It was found that the response of chlorpyriphos-ethyl was greatest with the lowest IC50 concentration of 0.97, 0.98 and 0.99/tg/1 with distilled, ground, and estuarine water, respectively. Obviously this ELISA kit is not sensitive to the matrix effect with estuarine water. Significant cross-reactivity was thus measured with chlorpyriphos-methyl and pyridifenthion in the three water types. Diazinon, fenotrothion and azinphos-ethyl give much lower cross-reactivity while dichlorvos, temephos and fenthion presented CRs0 values below 0.01. Lawruk et al. [139] have described the specificity of the chlorpyriphos RaPidassay with various organophosphorous pesticides, calculating the % CRso, but each References pp. 509-517
458
M
0 r.r
~
II
9
~
o o. ~. ~ ~
~ . . ~
o
~-n
1//
~-"
e~
.....
/?~ ~. 9
i ~"
"-I 0 ~-
"ouoo
t
!
.:
'
!
i
"
i
e
e
'
~
'
.,
eu!ze.nlV
....
!
-i'
~.
......
I
i
0
~
o
)
0
~--
o.
aoueq~osqv
r
I
6o"1
t
I
t
~ 0
I 0
~.
()
)
-
~0
_
o. 0
C,,I
0
0D
o
o
m
r~ r~
N r
,~
0
. ,-(
.,..(
r~
~
CU
. ,..,(
~
~
~
f2~
.,..i
~'~
~,..(
0
~
~
m
o
o
o
e-
~
"~
~
~o ~
~ ' ~
~
9"-
o
0
. ,...~
0
o
~
...
~,-.E uJ
~~
.o
o
6
o 6
Chapter 6
Immunochemical Methods and Biosensors
469
6.2.5. Data interpretation, effect of cross-reactants in samples, and comparison with chromatographic methods in validation studies When a value is measured in an unknown and non-spiked sample, using the standard curve, one question to be asked is, "How can we be sure that this value corresponds to the amount of the analyte?" As seen above, any matrix effects resulting from the water type can be checked by spiking this sample with known amounts of analyte. However, also as pointed out above, some IAs are sensitive to crossreactants which may be present in the unknown sample and have a strong effect on the measured value. Therefore, special care must be taken in data interpretation. 6.2.5.1. Analyte equivalency
One must be aware that IAs do not measure the concentration of an analyte but that of an indicator species giving absorbance in a coloured solution. This results from a competition reaction between the "analyte-antigen" and the labelled analyte. For an unknown sample, the sample response is compared to standard responses obtained with calibrators made of solutions spiked with the analyte antigen. The conclusion from an IA is that, "a certain amount of the "analyte antigen" is present in the sample. In fact, it is more correct to say that the measurement corresponds to an "equivalent of the analyte antigen". Figure 6.15 simply illustrates the problem of data interpretation with real samples according to the presence of cross-reactants in samples and their effect on the ELISA kit. It shows first the results given by an atrazine ELISA kit, i.e., the concentration in atrazine equivalents, upon the addition of increasing amounts of de-ethylatrazine (Fig. 6.15a), de-isopropylatrazine (Fig. 6.15b), and simazine (Fig. 6.15c) to real samples each initially containing 0.5/zg/1 of atrazine. Figure 6.15d shows the results given by an alachlor ELISA kit when increasing amounts of metalochlor were added [62]. First, the matrix effect can be seen, since the concentration of distilled water and ground water samples spiked at the 0.5/zg/1 level, with the addition of 0.01/zg/1 of cross-reactants, indicates an "atrazine equivalent" around 0.60/zg/1 (+_0.03/zg/1), whereas these values are higher with estuarine water spiked at the same levels of atrazine and cross-reactants. From the various compounds studied, one should note the higher deviation observed for de-ethylatrazine as than for all the other analytes, which thus indicates a higher influence of this commonly detected transformation product in the atrazine determination, using this kit. We can also see that when the concentration of the cross-reacting analytes increases, the slope has a higher value and consequently a higher deviation from the original concentration is obtained. With the alachlor ELISA, the addition of metalochlor up to 1/zg/1 has no visible effect since the resulting alachlor concentration varies within 0.02/~g/l. This result confirms the low cross-reactivity (1%) of metalochlor provided by the antibody used in the alachlor ELISA. For a given amount of the added cross-reactants in the original samples, i.e.,
References pp. 509-517
470
Chapter 6
1.6
1.4 |
-
/
-- 0.9 "~ ~i
"~ 1.2'N
~
.... e,, ~176
..4, ......... -I
...0- . . . . . . . .
~
0.8
0- ........
9. . . . .
.......
,~ 0.7
" ~ .~.~~.~ 0.610"8 0.4 0.01
..e~ .......1t"" O' .1
~9 0.6 '< 0.5 0.01
' 1 ---
De-ethylatrazine (Bg/l)
0.1
Distilledw a t e r
1
De-isopropylatrazine (~g/l)
........ 9........ Groundwater .... 9.... Deltawater
~.,
1.1 1
0.68 I
|
...e
0.9
"
~
0.7"~ 0.61 < 0.5 0.01
@
..'"':
0.64-1
~ .
-~= 9 0.8
0.66]
.41r.. -~
t ............ .
..e ....... i.i:III'............... I
.
.
.
.
.
.
.
.
0 6 ............................... " T 01.1
i
1
Simazine (pg/l)
0
0.58-~0.01
, 0.1
~ , 1
'
10
Metolachlor (lag/l)
Fig. 6.15. Dose-response curve for atrazine and alachlor at 0.5/~g/1 in the presence of (a) deethylatrazine, (b) de-isopropylatrazine and (c) simazine (for the atrazine ELISA kit) and (d) metalochlor (for the alachlor ELISA kit). The concentrations of the cross-reactants are 0, 0.05, 0.16, 0.5, 1.5 and 5/~g/1 in buffered distilled water, ground water and estuarine water. From Ref. [62].
0.5/~g/1, the "atrazine-equivalents" measured in ground water samples are 0.85 #g/l, 0.64/~g/1, and 0.76ktg/1 when de-ethylatrazine, de-isopropylatrazine and simazine, respectively, are added. These values depend on the cross-reactivity properties of the kit (see the ELISA specificity in Table 6.7). Only cross-reactants with a CR value of 100% should give an atrazine equivalent of 1/zg/1 corresponding to the sum of the atrazine and cross-reactant concentrations. This explains why one should take care in data interpretation using triazine kits. They can only provide an "atrazine-equivalent" which has to be considered in the light of a close examination of the crossreactivities of the kit when the samples are unknown. Owing to the variable crossreactivity of the triazines, when several triazines or metabolites are present in the samples, the measured "atrazine-equivalent" cannot be equal to the true concentration of the total triazines, and is always lower. This is shown in Fig. 6.16a which represents the correlation between the "atrazine-equivalent" given by an atrazine ELISA kit and the total triazine concentration measured by GC-NPD in estuarine water samples, all containing atrazine and simazine, and one also containing de-ethylatrazine [147]. Owing to the cross-reactivity, measured in the
Immunochemical Methods and Biosensors
471
estuarine matrix, of 14.4% (CRs0) for simazine and 61.7% for de-ethylatrazine, it is easy to explain why the "atrazine-equivalent" is always lower than the total triazine concentration measured by GC-NPD (slope of 0.58). From the respective concentrations measured by GC-NPD, the authors consider that the "atrazineequivalent" was obtained by adding the concentration of atrazine in the sample to those of simazine and de-ethylatrazine, modified by the cross-reactivity values. They were then able to calculate the value given by the ELISA which was owing to atrazine. Figure 6.16b shows the good match between this calculated value and the concentration of atrazine measured by GC-NPD. These results provide an understanding of the mathematics that can be applied for data interpretation and show the necessity of knowing the cross-reactivity in order to predict the effect of the concentrations of the various triazines and/or metabolites to the "atrazineequivalent" number. This can be a help, for example, in estimating the level above which samples will have to analyzed by GC for a regulatory purpose. The results presented above indicate that the data interpretation for unknown samples requires a good knowledge of the characteristics of the kits, and explains why data interpretation for real samples is linked to validation studies by chromatographic techniques. 6.2.5.2.
Comparison with chromatographic measurements in validation studies
The validation of results given by IAs is usually performed by comparison with chromatographic methods, when available, and if possible with real samples. Environmental surveys provide a good opportunity, and the group of M. Thurman (US Geological Survey) was among the first to use immunoassays and gas chromatography-mass spectrometry in a reconnaissance study of herbicides and their metabolites in the midwestern United States [ 151 ]. In the section below, we report some selected results of validation studies, classified by their IA characteristics and whether crossreactants can be found in the sample matrix or not. 6.2.5.2.1. No probability of cross-reactants in the samples. From the characteristics
given by the companies with their kits, the user can easily obtain an idea of the crossreactants that have been identified so far and the probability of their being present in the sample. When possible, validation of IAs is better performed using real samples contaminated by the analyte. This can even give an opportunity for identifying new cross-reactants and metabolites, as was the case for alachlor. The ethanesulfonic acid (ESA) metabolite was identified in real samples as a result of the frequency of false positives which were observed by using the ELISA screening kits for alachlor and have been attributed to the significant cross-reactivity of the ESA metabolite towards the anti-alachlor antibody [152,153]. Aga et al. [154] applied a sample pretreatment for measuring alachlor and the ESA metabolite separately with the alachlor kits and it has recently been shown that the median ESA concentration exceeded the median concentration of alachlor in some rivers and reservoirs [ 155,156]. References pp. 509-517
Chapter 6
472
0.3
I
I
I
A
|
0.2
N
1 Sample
_J .-x
e~
, "j
N L_
< < UJ e m i l
eo
I
n=217 9" /
r = 0.96 Slope = 1.16
.y
Intercept = 0 . 0 2 9
~
w
0
1
2
3
4
1
5
GC/MS Atrazine (#g/L) Fig. 6.19. Regression comparison of stream water atrazine concentration as determined by immunoassay and gas chromatography-mass spectrometry. From Ref. [ 157], with permission.
6.2.6. Sample pretreatment before ELISA measurements Methods for sample extraction prior to IA analysis have been discussed [ 167,168]. First, approaches that emphasize speed and minimal steps are desirable to keep costs down. For solid samples and more complex matrices such as soil or foodstuffs, some sample preparation is generally needed. Classical extraction methods can be used. The combination of supercritical fluid extraction or microwave-assisted extraction with ELISA has been described for the determination of pesticides and PCBs in soils and sediments [169,170]. For soils or sediments, the extract is usually diluted before the ELISA measurement, so that the matrix effect is greatly reduced. One relevant example deals with the control of atrazine residue in soil after the atrazine ban in References pp. 5 0 9 - 5 1 7
478
Chapter 6
TABLE 6.8 CONCENTRATION (,ug/1)OF ATRAZINE AND SIMAZINEIN 1 1OF PREVIOUSLYFREEZEDRIED WATER SAMPLEUSING DIFFERENTTECHNIQUES (n = 6) (FROM REF. [148], WITH PERMISSION) Technique
Direct ELISA LLE-Florisil-ELISA LLE-Florisil GC-NPD % Recovery
Batch A
Batch B
Atrazine
Simazine
Atrazine
Simazine
1.63 _ 0.10 0.78 • 0.08 0.62 _+0.04 126
1.89 • 0.14
1.68 • 0.15 1.39 • 0.15 1.39 • 0.07 100
0.88 +_.0.09
Germany [171]. The comparison of results with HPLC was excellent (slope of 1.034) when the extracts were diluted 1:500, whereas a small bias was observed (slope of 0.858) when the same extracts were diluted 1:150. Usually, water samples are analyzed without sample pretreatment, since the typical environmental concentrations are in the range 0.1-10/~g/l: many examples have already been mentioned. Sample pretreatment is required when the expected concentrations are below or close to the limit of quantification, or when there is a strong matrix effect because of humic substances, for example. In that case, solid-phase extraction using disposable cartridges is well suited, the methanol desorption solution being diluted in buffer. Aga and Thurman [172] have applied a pretreatment as described above for the determination of atrazine in surface water samples from six lakes in the Isles Royal National Park (Mi, USA) using SPE-ELISA and GC-MS. The determined atrazine concentrations were in the range 2-20 ng/1, so an SPE step was required before ELISA. The same workers have also compared two atrazine ELISA kits. The correlation coefficient between magnetic particle-based ELISA and GC-MS was 0.96 with a regression line slope of 0.89, and the correlation coefficient between microtitre-plate-based ELISA and GC-MS was 0.93, with a regression line slope of 0.95 [172]. Although one can expect a low concentration of de-ethylatrazine in these samples, the regression slope was higher with the microtitre plate-based assay which shows less cross-reactivity with this metabolite. Lucas et al. [82] analyzed 75 well water samples for atrazine in a blind fashion. They found a good correlation with the GC method, with only one false negative and no false positive using ELISA. They applied a rapid SPE sequence using a C18 cartridge (100 ml sample) in order to reduce the detection limits and to have data in the middle of the working range of their IAs. The objective of this sample pretreatment was also to increase confidence in the data by eliminating potential interferences such as pH extremes, high ionic strengths, or potentially immunoreactive metabolites. It took 1 day for one trained analyst to complete the 75 well water samples,
479
Immunochemical Methods and Biosensors
from extraction with the SPE C~8 cartridges, to generation, and to the final atrazine concentration data from ELISA. The extra time and effort spent in using SPE permitted direct analysis by GC for confirmation, using the ethyl acetate extract. The coupling of SPE-ELISA was also applied to the simultaneous determination of alachlor and the ethanesulfonic acid (ESA) metabolite [154]. The anti-alachlor antibody cross-reacts with ESA, which produced false positive detections of alachlor in water samples by the ELISA kit. Alachlor and ESA were first isolated from water by SPE on a C~8 cartridge and then eluted sequentially with ethyl acetate and methanol. Alachlor is soluble in ethyl acetate while the anionic ESA is not. Thus, ESA remains on the cartridge and is eluted later by methanol. The combination of SPE with ELISA effectively separates and quantifies both alachlor and ESA, using the same antibody for the two ELISA methods, with detection limits of 0.01/zg/1 for alachlor and 0.05/zg/1 for ESA. Table 6.9 shows the analysis of ground water samples using the analytical procedure described above. The agreement between GC-MS and the SPE-ELISA determination for alachlor is good. The results for ESA concentration were confirmed by HPLC, and have shown that the values measured by the kit were mainly due to ESA and not to alachlor, thus explaining the false positive values.
6.2.7. Quality assurance and guidelines for validation and use The acceptance of immunoassays is dependent upon the demonstration of quality and validity compared to more traditional methods. We have already pointed out that TABLE 6.9 ANALYSIS OF GROUNDWATER SAMPLES FOR ALACHLORAND ESA BY ELISA, SPE-ELISA AND GC-MS (FROM REF. [ 154], WITH PERMISSION) Sample
1 2 3 4 5 6 7 8 9 10 11 12
Alachlor concentration (/zg/1)
ESA concentration ~g/1)
Direct analysis by ELISA
GC-MS
SPE-ELISA
SPE-ELISA
0.6 0.16 0.92 0.33 1.83 1.10 0.22 8.60 0.22 2.85 1.79 4.63
0.45