The Psychology of Human Differences [3 ed.] 013734939X
200 15 34MB
English Pages 588
Recommend Papers
![Psychology of Human Differences [3 ed.]
0137349394, 9780137349395](https://ebin.pub/img/200x200/psychology-of-human-differences-3nbsped-0137349394-9780137349395.jpg)


![Beyond Individual and Group Differences: Human Individuality, Scientific Psychology, and William Stern′s Critical Personalism [1 ed.]
0761921729, 9780761921721](https://ebin.pub/img/200x200/beyond-individual-and-group-differences-human-individuality-scientific-psychology-and-william-sterns-critical-personalism-1nbsped-0761921729-9780761921721.jpg)

![Male, Female: The Evolution of Human Sex Differences [Third ed.]
1433833573, 9781433833571](https://ebin.pub/img/200x200/male-female-the-evolution-of-human-sex-differences-thirdnbsped-1433833573-9781433833571.jpg)
![Male, female the evolution of human sex differences [2nd ed]
9781433806827, 1433806827, 9781433806834, 1433806835](https://ebin.pub/img/200x200/male-female-the-evolution-of-human-sex-differences-2nd-ed-9781433806827-1433806827-9781433806834-1433806835.jpg)
![The Psychology of Human Differences [3 ed.]
013734939X](https://ebin.pub/img/200x200/the-psychology-of-human-differences-3nbsped-013734939x.jpg)
- Author / Uploaded
- Leona E. Tyler
File loading please wait...
Citation preview
RATA
CENTURY
PSYCHOLOGY
S:ERLES
The Psychology of Human Differences LEONA E. TYLER
zee
BFL4?-T&
1965
|
AD2L445201
SR id
Fx.
SENECA
‘
CGi:
:
cae
Sarg b
Suk
oa APPLIED “ars TECHNOLOGY 50 Fines -8st, Willowdale
Ba
&
| ‘ iS
ae yon
THE
PSYCHOLOGY
HUMAN
OF
DIFFERENCES
THE
CENTURY
Richard M. Elliott, Gardner
PSYCHOLOGY
SERIES
Lindzey & Kenneth EDITORS
MacCorquodale
The Psychology of Human Differences By LEONA E. TYLER UNIVERSITY
THIRD
OF
OREGON
EDITION
Prentice-Hall, Inc., Englewood Cliffs, New Jersey
©1965 by PRENTICE-HALL, Englewood
Inc.,
Cliffs, New Jersey
All rights reserved. No part of this book may be reproduced without permission
in any form or by any means, in writing from the publisher.
Printed in the United States of America
ISBN:
0-13-734939-X
Library of Congress Catalog Card Number:
65-19221
I) Sts 7 (eh is cles}
«,,*
PRENTICE-HALL INTERNATIONAL, INC., London PRENTICE-HALL OF AUSTRALIA, PTY. LTD., Sydney PRENTICE-HALL OF CANADA, LTD., Toronto PRENTICE-HALL OF INDIA PRIVATE LIMITED: New Delhi PRENTICE-HALL OF JAPAN, INC., Tokyo
PREFACE FoR TEXTBOOK wRITERS the rapid and accelerating rate at which research findings accumulate is not an unmixed blessing. As more and more new
evidence on old questions becomes available, the author becomes more and more uncomfortable in the realization that successive groups of students are being led to conclusions and generalizations that are not quite sound. This is a possible, even a probable, outcome because of the fact that continuing research does more than fill in details of pictures whose
general outlines are already clear. Its effect in many instances is to make drastic changes in those outlines themselves. There are special practical reasons for making available all that we know about human differences at the present moment in history. Perhaps never before has there been so great an opportunity to apply such knowledge in the formulation of public policies and action programs. Testing in the schools has become a matter of public concern. Informed citizens need to know what measured differences in intelligence, achievement, and special abilities do and do not mean. Considered attempts to enlarge the scope of women’s activities will be more likely to succeed if they are based upon everything research has revealed about sex differences. To wage the “war on poverty” effectively, persons designing and carrying out policies and programs should be familiar with all the complex findings about differences related to race and social class. Any number of other examples could be cited of social reforms being undertaken in our time to which material in one or more of the following chapters is directly or indirectly related. Turning from application to theory, the most stimulating outgrowth of advancing knowledge is that differential psychology is beginning to emerge from the tight chrysalis in which previous thoughtways had wrapped it. A variety of new research methods is being employed to reveal kinds of individual differences that were not apparent when correlational procedures constituted almost the only technique of investigation. Instead of being content to represent an individual by a score or
set of scores, one can now push on to analyze the behavior, the central . processes, or the developmental sequences behind such scores. While it
is not quite possible to see as yet just what kind of a new science of human individuality will spread its wings when this metamorphosis has been completed, it is exciting to watch it take place. Chapter 19 presents the author’s synthesis of these developments. The reader is invited to share in this search for new directions, new organizing principles, new
vi
Preface
ways of conceptualizing what is one of the most remarkable aspects of the world of living things—the uniqueness of individuals. DAH ab:
University of Oregon
CONTENTS Preface
Vv
Part One
THE FIELD OF DIFFERENTIAL PSYCHOLOGY . Philosophical bo.
and Historical
Considerations
3
General Principles and Concepts
119/
. Research Strategies
38
Part Two MAJOR DIMENSIONS DIFFERENCES
OF
INDIVIDUAL
. Individual Differences in Intelligence . Individual Differences in School Achievement . Individual Differences in Special Aptitudes and Talents
100 124
. Individual
151
Differences
in Personality
61
. Individual Differences in Interests and Values
183
. Individual Differences in Cognitive Style
211
con® Oo of
Part Three VARIETIES
10. 11. 12. 13. 14. 15.
OF
GROUP
DIFFERENCES
Sex Differences
239
Age Differences
7S
Race Differences Social Class Differences The Mentally Retarded The Gifted
299 330 365 389
vill
Contents
Part Four FACTORS
PRODUCING
DIFFERENCES
16. The Relationship of Mental to Physical Characteristics
421
17. Environmental Factors Affecting Individual Differences 18. The Hereditary Basis of Individuality 19. The Science of Human Individuality: Past and Future
447 475 500
Bibliography
509
Index
557
Part One
THE
FIELD
OF
DIFFERENTIAL
PSYCHOLOGY
CHAPTER
1
Philosophical and Historical Considerations THE UNIQUENESS OF INDIVIDUALS is one of the most fundamental character-
istic facts of life. Plants raised in the same garden from apparently identical seeds grow into different sizes and shapes and produce different numbers of blossoms. Puppies, even those from the same litter, become dogs clearly distinguishable from one another in appearance and behavior. Children in the same family differ from one another even in infancy, and as they grow they develop different talents and interests, different moods and manners, different ways of reacting to success and failure, reward and punishment. Individual uniqueness was an impressive
phenomenon in the ancient world whose total population (at the beginning of the Christian era) was 250,000,000. Its impressiveness is even greater today when the world’s population is more than 3,000,000,000.
At all periods of human history men have observed and described differences
between
individuals.
From
Homer
to Hemingway,
literature
contains thousands of portrayals of memorable persons. The faces of unique men and women look out at us from the canvases of Rembrandt and Franz Hals. Writers, painters, sculptors, and actors have been content to capture and express the essential quality of each person they portray. But educators, politicians, and administrators have felt a need for some way of organizing or systematizing the many-faceted complexity of individual differences. Philosophers and, in recent periods, psychologists have attempted to produce such systems. Two kinds of ideal for mankind have played some part in these efforts to deal with human differences. Both are represented not only in the writings of eminent men of all historical periods, but in the accepted opinions of persons whom we know. For one kind of person the important thing, to be stressed above all others, is the equality of men. Such persons prefer
4
The Field of Differential Psychology
to think that in every human being lie the potentialities for almost unlimited development. They hold that the reason for the great differences in individual traits which we observe is that opportunities for the development of full human potentialities have always been anything but equal. The task before us, as they see it, is to hold high the ideal of equality and to work unceasingly at the task of making opportunities for all men truly equal. This way of thinking fits in very well with our American democratic philosophy. Back of the delight we all take in stories of the poor boy’s rise to fame and fortune lies the tacit belief that any one of us could, if he wished, achieve the same success. Our great faith in the power of education to overcome all handicaps and inequalities is related to this belief. The statement, “All men are created equal,” accepted without qualification, satisfies a basic emotional need for many people, even if their own achievements have clearly been mediocre. The line of approach taken by the other group of persons starts with the assumption that differences between men are basic and ineradicable,
biological facts which cannot be ignored. The ideal that such a belief generates is of a society fully utilizing these varied gifts for the enrichment of the common life. The caste system of India, in its ideal aspect, is
based on such a philosophy. Plato, in the Republic, discusses the problem of variation in individual endowments and even proposes a sort of aptitude test to select persons who are particularly well qualified for military
careers. The philosophy back of the educational systems in most European countries is based on this type of thinking. After their elementary schooling in the basic skills, only those individuals who show special intellectual gifts are selected for secondary and higher education along
academic lines. Even in democratic Britain, the unlimited educability of every individual has never been assumed. It is well to admit at the beginning that neither of these assumptions with regard to human individuality can be either proved or disproved. Many workers in social-science fields do, in fact, look at their data now
from one point of view, now from the other. Until we have equal opportunity for all, we can never know with certainty that inequalities would persist in spite of it. It is also true that each view carries with it the possibility that some one may draw from it unwarranted conclusions. The philosophy that differences are basic and ineradicable lends itself very conveniently to those who need a rationalization for the existence of the privileged classes. Hindu upper-caste leaders, pre-Civil War slaveowners, modern industrialists and business leaders—all have found it easy
to adopt this system of thinking without scrutinizing it too carefully to
make sure that it fits all the facts. The equalitarian philosophy, while it avoids this type of warped reasoning, may lead to another difficulty. If one believes that all normal human beings are creatures of unlimited possibilities, then one is almost certain
Philosophical and Historical Considerations
5
to be greatly disappointed in the achievements of many of them who have failed to measure up to the opportunities they have had. The result of this
disappointment is that wives nag their husbands, teachers prod their slower students, and many men and women live out their lives in the shadow of a haunting feeling of failure. Both tolerance toward others and
a frank admission of one’s own limitations are encouraged by an acceptance of human differences at their face value. The viewpoint to be adopted in this book is that while all individuals
may be considered to have equal value, they are not alike in how they think and feel and act. We assume that for all practical purposes of in-
dividual placement and group planning the fact that there are differences between people must be taken into consideration. Our first need is to understand what the differences are.
TYPES
VERSUS
TRAITS
In their efforts to impose some order on the enormously complicated subject matter of individual differences, the first strategy that occurred to mankind was to classify people into types. Various ways of doing this were proposed, even in antiquity, and type concepts serve a useful function in personality research even today. As early as the fifth century B.c.,
Hippocrates gave us a two-fold system based on body build, the habitus apoplecticus and habitus phthisicus. The later famous Greek physician, Galen, proposed a four-fold classification based on the predominance of different “humors” or biochemical fluids in the body. His four main types were the sanguine, the choleric, the phlegmatic, and the melancholic. Variations of these classifications have appeared under many names right
down to our own century, and have been supplemented by typologies based on other aspects of observable personality. Spranger, basing his
analysis on literature, analyzed the basic values men seem to live by, and elaborated six fundamental types: the theoretical, economic, aesthetic, social, political, and religious. Jaensch, basing his system on observations of eidetic imagery, described what he called a T-type, or integrated person, as opposed to a B-type or disintegrated person. Kretschmer attempted to relate a physical typology not too different from the early one of Hippocrates to a classification of temperaments, and tied the system in with
the two major varieties of psychosis, schizophrenia and the manic-depressive states. William James sorted people out into the tough-minded and the tender-minded. But more popular than any of these systems has
been the Jung classification into extraverted and introverted types. The fact that such typologies have appeared to many thinkers in many centuries to be a way of bringing some order into the complex realm of personality differences has kept us from dismissing them too lightly. The fact that they are so various and so confusing has led us to look beyond
6
The Field of Differential Psychology
the verbal formulations for evidence that can enable us to sift out the convincing from the merely plausible and to locate the unities underlying the diversity. During the twentieth century, psychologists, especially American psychologists, became very critical of type concepts. For one thing, the word type proved to be an ambiguous term. Because different theorists
attached different meanings to it, they often failed to communicate clearly. In their dictionary of psychological terms English and English (1958) specify nine distinguishable meanings. It is obvious that some persons
who talk and write about human “types,” are assuming “that the word means areal . . . or an ideal or fictitious individual embodying the characteristics of a category in fullest measure.” But such persons are not
really talking about the same concept as those who assume that “type” means “the peak instances of a bimodal distribution of a single variable:
a normal type vs. a pigmy type.” A second basis for objecting to particular typologies, such as Jung's extravert-introvert classification, arose from research attempts to appraise
people’s characteristics and assign them to one or the other category. It usually turned out that most persons fell in an in-between category. They would be, for example, introverts in some respects, extraverts in others. The way they were classified would depend on the particular questions about themselves they had been asked to answer. However, type concepts never entirely disappeared, even from American psychology, and in Europe they have been influential all along. In the 1960’s psychologists in the United States are showing an increasing willingness to return to typological systems of organization, at least for
some purposes. The Myers-Briggs Type Indicator (1962), for example, is a far more sophisticated effort to give objective form to Jung’s complex typology than previous attempts to assess
extraversion-introversion
have
been. Cognitive styles, constitutional types, interest patterns—these are all essentially typological concepts. They play a significant part in research on human differences in the 1960's. The other main strategy for imposing order upon individual differences was to study traits, one at a time and in combination with one another. Instead of attempting to assign individuals to classes, as type psychologists do, we can direct our attention to the qualities or traits that become evident in their behavior. In our common everyday affairs, a natural way to describe a person is to mention his salient characteristics. A teacher.may say, for example, that John is a handsome, athletic, somewhat shy. boy, with only average verbal intelligence but exceptional mechanical ability. He may then characterize Bill as not so goodlooking or athletic, less shy, more intelligent, and not so adept at mechanical reasoning. That is, he can, if he wishes, evaluate different individuals on the same traits. The strategy of describing many individuals in terms of the same traits serves
Philosophical and Historical Considerations to express
the differences
between
them
in quantitative
7 rather
than
qualitative form. Trait concepts have dominated American differential psychology for half a century or more, and most of the research reported in this book is based on acceptance of this way of thinking. As time has passed, however, some difficulties have arisen in its application. The principal one is the
sheer magnitude of the task of identifying all of the separate ways in which individuals can differ from one another and developing techniques for assessing these traits. Instead of the unitary quality early differential psychologists had in mind when they began to develop tests for intelligence, present-day workers are accumulating evidence for many distinct
intellectual abilities. J. P. Guilford (1959) concludes that there are probably 120 different varieties of intelligence. Allport and Odbert (1936) showed that there are from 3,000 to 5,000 words used in the languages of civilized people to describe personal qualities. While personality tests for all sorts of traits have proliferated during our century, it is clear that it is never going to be feasible to administer several thousand of them to one individual as a means of understanding and describing him. We shall consider in later sections of this book the attempts psychologists have made to reduce trait complexity by combining related traits through factor analysis, efforts that have brought about a partial but not a complete solution to the problem.
The other major objection to trait psychology arises from the question whether it is really meaningful to describe individuals in terms of traits
they all have in common. Allport (1937) raised this question in his discussion of the difference between nomothetic and idiographic methods of studying individuals. When we administer the same tests to all members of a group or rate all of them on the same set of rating scales we are using
the nomothetic approach. Underlying it is the assumption that the uniqueness of individuals is a matter of quantitative variation in characteristics they all share. In contrast to this, we use the idiographic approach when we look for characteristics peculiar to the one person we seek to understand or describe—the quality of his voice that distinguishes it from all others, for example, or his style of walking, writing, or thinking. These unique differentiating attributes are important aspects of individuality, and an overemphasis on trait concepts has perhaps prevented us from giving them the research attention they deserve.
THE DEVELOPMENT METHODS
OF QUANTITATIVE
One of the most prominent features of the work psychologists have done on individual differences is an emphasis on quantitative methods.
In the long history of man’s attempts to understand human individuality,
8
The Field of Differential Psychology
this is a fairly recent development. It is still not accepted completely, to judge by the many books and magazine articles in which mental testing and testers are attacked. Until about a century ago, the whole idea of measuring any aspect of human mental life was unthinkable. Mind was generally held to be an order of reality to which figures were just not applicable. The discovery of the possibility of numerical description of the way an individual’s nervous system functions was made by accident, and by an astronomer, not a psychologist. Bessel, looking over a history of the Greenwich Astronomical Observatory in 1816, was struck by an incident recorded there. A young assistant had been dismissed in 1796 for continually reporting the time of the apparent transit of stars across a hair line in the telescope’s field of view nearly a second later than his master did. Bessel asked him-
self why the young man should have been so slow, even when his job was at stake. He began to try out his fellow-astronomers, and discovered that there was considerable variation among individuals in the speed with
which they reacted to a visual stimulus. He called this the personal equation. Its importance to psychology was its demonstration that at least one mental characteristic could be measured. At about the same time, work was in progress on the development of methods of dealing with the numerical quantities obtained in the measurement of any human trait, physical or mental. Quetelet, the Belgian mathematician, was the first to discover that the mathematical theory of probability could be applied to human measurements. Sir Francis Galton, explorer, meteorologist, biologist, one of the most brilliant and versatile men of the nineteenth century, made great contributions to the science of handling such data. He was interested primarily in the problem of heredity, but found that he needed to measure human characteristics in order to get evidence. He set up an anthropometric laboratory in London and made physical measurements of thousands of persons who
volunteered to serve as subjects. In order to get at their mental characteristics, he developed some ingenious methods of his own, such as the Galton whistle for determining degree of sensitivity to high pitches and the famous breakfast-table test for determining the strength of an in-
dividual’s imagery (Galton, 1883). Many of the methods we shall take up in later chapters are based on Galton’s pioneering research activities. During the latter half of the nineteenth century the rise of psychology
as a science and the founding of the great psychological laboratories brought about a tremendous increase in the number of measurable human traits. Much research was done on sensation, and exact measurements were made of various aspects of vision, hearing, and the skin senses. Some workers were concerned with discrimination processes and measured the
accuracy with which subjects could judge differences in weights and brightnesses and lengths of lines. Others
worked
on memory
and de-
Philosophical and Historical Considerations
9
veloped methods for measuring how quickly the individual learned and how much he remembered.
Processes of attention, observation, aesthetic
judgment, and even thinking itself came under the scrutiny of these indefatigable workers.
Most of the early psychologists were far more interested in discovering general laws of human nature, which would hold for everybody, than in exploring differences between people. For each experiment, they would use enough subjects so that they could be fairly confident that the average of the group was a dependable index of the trait they were considering. But one of the early students
in the laboratory of the great German
psychologist, Wundt, became interested in the differences between the subjects and in the possible significance of these differences. He was James McKeen Cattell, an American. By thus changing the emphasis, he initiated the mental-test movement, which has become increasingly important from 1890 on to the present time. Though Cattell seems to have been the first to use the term mental test, others at about the same time
were initiating similar projects. In Germany, Oehrn (1889) published the results he had obtained using a series of tests of perception,
memory,
association, and motor functions. Kraepelin (1895) also attempted to work out a set of tests for several traits. Ebbinghaus (1897), whose research on
memory has made him famous, developed some tests at the request of the Breslau school authorities, among them the completion test which has be-
come a permanent part of our test repertory. In America, J. McK. Cattell (1890), Cattell and Farrand (1896), Jastrow (1891), Miinsterberg (1891), Bolton (1892), J. A. Gilbert (1897), Sharp (1899), Woodworth (1910), and a number of others were all attacking the problem in various ways. Most of this early work, however, failed to produce any significant results. Later research showed that this was because it was based on a false premise. The aim of these early test-makers was to measure intelligence. They were assuming that if you could measure all aspects of sensation, perception, attention, discrimination, and speed of reaction in the individual, the total efficiency index would be an index to his general intelligence. This seemed a reasonable inference, because the accepted psychological theory of the time held that all of mental life was built up of units of sensory experience,
just as the physical world is made up of atoms. Unfortunately, when the early mental-testers checked up on the measurements they had made, they found that there was something wrong with the idea. Persons who were quick, accurate, and skillful at simple tasks did not necessarily turn
out to be highly intelligent. The most famous name in mental testing is that of Alfred Binet, who in 1905, with the collaboration of Simon, published the first mental test that really worked. In the course of his work he developed assumptions quite different from those of his orthodox colleagues. He held that the complex mental abilities we classify under the term intelligence are not made up of
10
The Field of Differential Psychology
simple abilities. If we are to measure them at all, we must do it directly. If judgment in a complex situation is what we wish to evaluate, we must
give the individual a complex situation to work on and see how he handles it. If his ability to solve problems of various sorts is in question, we must give him those problems to grapple with. It seemed to many psychologists at the turn of the century that this approach to mental measurement could never be practical because of the simple fact that you could never measure such complex traits in seconds or millimeters or any other meaningful numerical unit. Binet got around this difficulty when, in the 1908 revision of the scale first published in 1905, he arranged the tests in groups according to difficulty and introduced the concept of mental age. Although this is not the same kind of measuring unit as inches or seconds, it proved to be a very satisfactory method for treating different performance levels
quantitatively. It was the standard method of scoring intelligence tests for children for half a century. Stern in Germany and Terman in this country supplemented the mental-age concept with the additional idea of dividing the obtained mental age by the actual chronological age in order to get an index of the rate at which mental growth occurs in a given
individual. Terman called this the intelligence quotient and used it in the 1916 Stanford-Binet scale. The term immediately became popular both with psychologists and with the general public until, at present, there is
scarcely a person who does not know something about IQ tests—whether or not what he knows is correct. For the student of individual differences, perhaps the most significant aspect of all this early research on mental tests is the indication it gives us of the great demand for such tools. As school attendance became more universal, the problem of the slow-leaming child became acute. Both Ebbinghaus and Binet, it is to be remembered, were working on definite
assignments from the school authorities to develop some technique by which the children who could not master the work of their grade might be distinguished from those who would not. With the professionalization of social services, the need arose for instruments by means of which the
dependent individual’s capacity for adjustment could be measured. The earliest work on Binet tests in the United States was done by Goddard, one of whose chief interests was the relationship of feeble-mindedness to delinquency. With all their flaws, mental tests made it possible to handle the problems created by individual differences more intelligently than they had ever been handled before. It is this plain fact that has kept research alive and flourishing.
THE
SHAPING
OF THE
NEW
SCIENCE
At about the turn of the century when all this activity centering around
the attempt to measure individual differences was going on, two compre-
Philosophical and Historical Considerations
17
hensive statements about the aims and methods of the new science were
published. Binet and Henri (1895) began their article, “We broach here a new
subject, difficult and as yet very meagerly explored.” They then
proposed as the two chief aims of this undertaking: first, the study of the nature and extent of individual differences in psychological processes; and second, the discovery of the interrelationships of mental processes within the individual so as to arrive at a classification of traits and determine
which are the more basic functions. Stern’s text (1900) outlined a threefold problem: (1) What is the nature and extent of differences in the psychological life of individuals and groups? (2) What factors determine or affect these differences? and (3) How are the differences manifested? To what extent can we use handwriting, facial conformation, and other signs to help us analyze them? These goals have remained primary from their day to ours, but a number of special emphases have become prominent in different periods. The
first of these was the search for group tests which was given great impetus during World War I. Individual intelligence tests are obviously impractical when large numbers of people are to be classified. It seemed that it
should be quite feasible to use some of the same types of material that had proved so useful in individual testing but to put them together in a form in which the answers to the questions would be short and definite enough to
be accurately scored. This was successfully accomplished at the time of World War I. Five psychologists, under the direction of Robert M. Yerkes, undertook to see if they could produce something that would
work in the army situation. Otis put at their disposal several types of test upon which he had been working. The results of their efforts were Army Alpha, a verbal test, and Army Beta, a nonverbal test, both of which could be given to large groups and scored by clerical workers with no psychological training. Since the mental-age concept was of little value in classifying adult soldiers, new ways of scoring had to be worked out, based on group norms. The fact that the research workers were provided by the
army draft with a large and fairly representative sample of the American population on which to base their derived scores facilitated the solution of the problem. Work on the development of various types of derived scores based on norms for different populations has continued up to the present. A great number of group tests of intelligence have been constructed since 1918 to meet the almost unlimited demand in schools, from kindergarten to college and graduate school. The second line of research had as its aim the development of nonverbal tests of intelligence. For many purposes, tests of either the Binet type or the ordinary group type were found to be useless. If the individual to be tested is deaf, he cannot, of course, hear the questions in an individual test. If he is illiterate, he cannot answer questions requiring that he read and write. If he is deficient in his knowledge of the language of the
12
The Field of Differential Psychology country in which he lives, he cannot be expected to distinguish himself on a vocabulary test. Furthermore, many psychologists felt that tests de-
pending on some school knowledge were inherently not valid as measures of basic native mental capacity. Psychologists who devoted their efforts to this problem brought forth a wide variety of performance and nonverbal tests, including form boards, puzzles, mazes, block-design problems, and many others. There are both individual and group tests of
this sort, and they form an important set of tools for the applied psychologist. It has become increasingly evident as time has passed that such tests do not measure exactly the same mental capacity as the verbal tests do, but once this fact is understood their usefulness is in no way diminished. If they are worth less to us than we expected as substitutes for the typical verbal intelligence test, they are worth more as supplements. With an increasing amount of statistical knowledge and clinical experience, we have become clearer as to what traits various types of tests measure and what situations call for these traits.
Thus a third direction that research has taken is a turning away from the search for universal intelligence tests suitable for all human beings under all circumstances. Test-makers have found that it is impractical if
not impossible to develop tests which will be equally valid for preschool children, college students, and illiterate adults. Separate tests are needed. It has also become increasingly apparent that intelligence itself has many
aspects. Much of the work of recent years has been concerned with identifying these aspects and developing separate tests for characteristics such as spatial judgment, numerical ability, and verbal ability. The relation-
ship between these separate factors, as they are called, and general intellectual ability is still a very live issue. It is discussed in some detail in Chapter 4.
A fourth and related direction of research has been toward the development of tests of special abilities and talents. A great deal of work has been done on mechanical, clerical, and musical aptitudes, somewhat less on talent in the field of art and on the capacity for understanding social situations and handling people. Achievement tests for all branches and levels of knowledge have been constructed. Most of this work has had a
strong practical orientation. Its aim has been the production of tools that
would be really useful in the selection, placement, education, and guidance of individuals in accordance with their special characteristics and needs. These findings will be discussed in Chapters 5 and 6. The fifth line of research has been toward the measurement, or at.least the rather precise evaluation, of the nonintellectual traits of the individ-
ual, such as intetésts, adjustment patterns, and personality traits. E. K.
Strong devoted his long research career to vocational interests. There are numerous inventories of traits related to maladjustment and tendencies toward mental illness. In the 1930’s an entirely new approach to the prob-
Philosophical and Historical Considerations
13
lems involved in personality measurement made its appearance, the so-
called projective technique, in which the subject by interpreting some material such as an ink blot or an ambiguous picture furnishes an indication of his basic attitudes, motives, and problems. These methods are further removed than the others from the quantitative techniques we have been discussing, but any survey of research on individual differences cannot ignore them entirely. In order to delimit the field with which this book is concerned, we shall not try to cover the vast literature on these clinical
techniques except for studies in which some clear-cut quantitative method of evaluating the responses of subjects has been worked out. To be familiar with studies where results are reported as verbal descriptions rather than numerical scores is indispensable to our grasp of individual differences in the broad sensé. The clinical psychologist, the teacher, and the social worker need such familiarity. But the task before us here is the
synthesis of research findings, and the quantitative methods have proved more serviceable for testing drawing conclusions.
hypotheses,
exploring
relationships,
and
Still a sixth research emphasis had begun to take definite shape by the late 1940’s. It was the use of objective laboratory methods to investigate differences in personality and temperament. This was not really an innovation. Hartshorne and May (1928), many German _ psychologists throughout the 1920’s and 1930's, and scattered research workers in Britain and America had all seen the advantages in analyzing personality differences by means of accurately measurable perceptual or motor responses
rather than by means of self-reports obtained on personality inventories. By 1950, however, several large-scale research programs were oriented in this direction, and some challenging new ideas had been launched upon the mainstream of our thinking about personality. One of the main contributions this work has made consists of some new variables to work with, characteristics that cut across the traditional line between ability and motivation, thought processes and emotions. This has opened up new horizons. It is not easy to formulate precisely the nature of the change in our thinking that is occurring as the result of these new kinds of concepts, such as Witkin’s field dependence, Gardner’s equivalence range, or Bru-
ner’s strategies of problem solving. What they seem to be doing is to enable us to break out of the rigid molds set for us by the type and trait formulations of the past by revealing another kind of way in which individuals differ from one another. Because of unique aspects of a person’s developmental history, he acquires preferred ways of dealing with complex situations. Research of the 1950’s and 1960's produced ingenious new test and experimental situations and new methods of analyzing data to facilitate the exploration of such differences. We shall be considering these in some detail later in this book.
14
The Field of Differential Psychology
In attacking all these types of problems, both old and new, there has been increasing emphasis, especially in the period since World War II, on large-scale, coordinated research programs rather than isolated studies. Results have been coming in from longitudinal studies that have been in
progress for a long time—Terman’s decades of work with a group originally selected as gifted children, for example, and the California Guidance
Study. Other programs consist of groups of related experiments organized around an important theoretical issue or practical need. The work of
Eysenck and his associates at the Institute of Psychiatry in London and the work of the Committee on Human
Development in Chicago are ex-
amples. What this trend toward large research programs means is that we now have far more dependable evidence to use in answering the basic questions of differential psychology than we have ever had before. In many instances we need no longer piece together scraps of information obtained from a host of small and inadequate studies but can make a thorough examination of a reasonable amount of sound evidence. This makes it less possible than it once was to argue for a favorite theory and support one’s position by dismissing the evidence against it. A whole body of data obtained by a reputable research institute cannot be ignored or ruled out as can a single questionable study based on a nonrepresentative sample. Arguments about the ill effects of acceleration on bright children, for example, are obsolete since Terman and Oden’s careful analysis of the problem became available (see Chapter 15). Arguments that heredity has nothing to do with psychological differences lose much of their weight when confronted with Kallman’s impressive accumulation
of facts and figures (see Chapter 18). The details about these and other issues will be discussed in later sections of this book. Many psychologists
would certainly insist that none of these complex problems is settled as yet. The only point here, one that perhaps is not sufficiently appreciated by workers in these vineyards, is that the raw material out of which conclusions and generalizations are now being produced is vastly superior to the best we had thirty years ago. Perhaps because of this, the present period is marked by a number of
rapprochements or syntheses by means of which conclusions once thought to be squarely in opposition to one another have been reconciled. For example, the question about whether or not the IQ is constant has been rephrased. Studies at the University of California and at the Fels Institute
have shown that IQ’s do change, but in orderly ways that can to a con-
siderable extent be predicted if we have the necessary information about
the age of each child when tested, the educational level of his family, and
the period of time intervening between examinations. Hereditarians and environmentalists no longer divide themselves into two hostile camps. Increasing knowledge about what is inherited, how learning processes change various mental characteristics, and what kinds of environmental
Philosophical and Historical Considerations
15
situations have favorable influences on mental growth has changed the
whole pattern of the controversy. The participation of laboratory workers in research on individual differences in personality, discussed as the sixth trend above, may mark an even
more significant rapprochement. For many years, experimental psychologists constituted one distinct group, mental-testers another. Experimental workers were familiar with complicated types of apparatus, controlled as
many variables as possible, and thought in terms of stimulus and response, independent and dependent variables. Mental measurement specialists used tests consisting of questions or simple tasks, worked in natural settings rather than laboratories, and developed statistical procedures based on correlation rather than dependency analysis. Most of these distinctions have become blurred in the years since World War II. One of the clearest landmarks pointing to this particular synthesis was Cronbach’s presidential address to the American Psychological Association (Cronbach, 1957), entitled “The Two Disciplines of Scientific Psychology.”
In it he argued cogently that the time had come for experimental psychology and correlational psychology to combine forces. The monograph by Cronbach and Gleser (1957) presented some techniques to use in research of this combined sort. For example, it makes good sense to com-
bine research on selection (a problem in correlational or differential psychology) with research on training (a problem in experimental psychology)
and try to find out what variety of training procedure works best for each of several sorts of people. With all this emphasis on progress we must recognize that the science of human differences is still immature. The most interesting questions are still unanswered, perhaps even unasked. Meanwhile, human life goes on.
Somehow, we must all adjust ourselves right now to those around us in some fashion and plan as intelligently as possible for ourselves and for each other. It is well that in doing this we use the best information that we have. The more complicated our world becomes, the more essential it is that we avoid any attempt to found human institutions on ideas about human nature that we know to be false. To proceed on the basis of tested evidence when such evidence can be obtained, to suspend judgment in cases where no conclusion is warranted, to formulate tentative courses of action in areas where doubt exists—these are the skills needed by the social scientist and applied psychologist. It is to be hoped that the study of what now is known about individual and group differences will contribute to the development of such skills.
SUMMARY Differences between individuals are a fundamental phenomenon. Artists have portrayed them; philosophers and psychologists have developed classification systems and concepts to deal with them. Some thinkers see
16
The Field of Differential Psychology
as an ideal the eradication of all differences in the name of equality; others cherish the differences and wish to use them for the enrichment of man’s common life. Classification systems dividing mankind into a limited number of types have existed from the early days of human history to our own day. Psychologists have preferred classification systems based on traits. Both systems have strengths and weaknesses. Psychological research on individual differences began when quantitative methods came into use during the latter years of the nineteenth century. Many psychologists participated in this development. Its culmination was the work of Binet and the first intelligence test. Other developments followed: group tests, nonverbal tests, specific tests for different groups and purposes, tests of special aptitudes and achievements, and personality tests. Laboratory methods have come into increasing use. Large-scale research programs have been designed to explore particular areas or problems. Rapprochements and syntheses have to a large extent superseded the controversies and divisions of the past. Hereditarians and environmentalists no longer line up in opposing camps. The merging of correlational and experimental psychology now seems possible.
CHAPTER
2
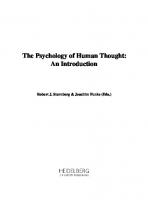
General Principles and Concepts VARIABILITY AMONG INDIVIDUALS— A UNIVERSAL PHENOMENON Tus Is A BOOK about human differences. But before we examine these human differences in detail, it may be instructive to consider briefly what we know about variability in other forms of animal life. Ordinary observation demonstrates again and again that one animal of a species differs in many ways—in behavior as well as appearance—from other animals of the same species. Dog-lovers never tire of stories about some dog’s unusual intelligence, resourcefulness, or devotion. Farmers recognize and deal appropriately with temperamental differences in cows. Horses differ in intellectual achievements as well as running speed. As experimental psychologists have observed animals in their laboratories, a body of scientific knowledge about individual differences has accumulated. It can be concluded with some certainty that individual variability characterizes all species—from the highest to the lowest. It is not surprising that monkeys differ in behavioral characteristics.
Any zoo visitor can observe this for himself. A study by Fjeld (1934) con-
tributes some quantitative evidence as to just how marked the differences between individual monkeys are in a kind of problem-solving capacity somewhat analogous to what we call intelligence in human beings. Figure 1 shows the sort of performance required. To get the food box open, each animal was required to depress one or more of the plates in the floor. In Problem 1, the easiest problem, all he had to do was to depress Plate 1 and the door would open. In Problem 2, he must depress Plates 1 and 2 in turn, then the door opened; in Problem 3, Plates 1, 2, and 3. Problem 4 required him to depress 1, 2, and 3, reverse his direction, and step on 2 again. In Problem 7 the order was Plate 1, 2, 3, 2, 1, 2, 3. Out of a group of fifteen rhesus monkeys who served as subjects
18
The Field of Differential Psychology
FIGURE 1 Design of Problem Box Used in Fjeld Experiment (Fjeld, 1934)
through the whole experiment, one was unable to learn more than 2 problems, whereas one learned 22. The rest varied all the way from 3 to 13. A
similar study by Koch (1935) on Cebus monkeys gave similar results with somewhat less variability in performance from animal to animal? A good demonstration of individual differences in cats is a study by
Warren (1961). What he required each animal to do in order to obtain food in this kind of experiment was to choose one of two small objects presented to him simultaneously. The “right” object was distinguished from the “wrong” one in different ways in different experiments. In some experiments, it was the position that mattered—for example, the left-hand
one was always correct. In other experiments it was the shape of the object that was the clue, and the animal had to notice whether it was a square,
General Principles and Concepts
19
triangle, circle, trapezoid, or some other geometrical form. The problem
was made more difficult for the animal by arranging things in such a way that he must take size, as well as position or shape, into consideration. Thus in the position experiments, he was rewarded for choosing the left-
hand object when the stimuli were small and for choosing the right-hand object when the stimuli were large. In the shape discrimination experiments, he was to choose one of the pair (e.g., square) when the stimuli were large and the other (e.g., semicircle) when the stimuli were small.
It was the task of each cat to discover through a series of trials just what he was expected to do. Once he “caught on” he would choose correctly every time.
It turned out that discriminations on the basis of shape were more diff-
cult than discriminations on the basis of position, but that there were very large differences between animals. The most “brilliant” of the 21 cats Warren tested required only 54 trials to solve the shape-size problem. The “dullest” one required 760 trials. The others ranged somewhere in between.
Because rats have been a favorite kind of experimental subject in psychological laboratories, a considerable amount of information about individual differences in this species has accumulated. They differ widely
in maze-running ability (Tryon, 1942), and in temperamental traits such as wildness (C. S. Hall, 1951). Geier, Levin, and Tolman (1941) carried out an elaborate study in which they identified four different traits upon
which their rat subjects differed from one another, two of them “intellectual” traits and two “emotional” or “motivational” traits. What is more surprising than these findings, however, is the report by J. Hirsch that there are individual differences in the behavior of fruit flies
(Hirsch, 1962). The object of Hirsch’s research program has been to find out more about the genetic bases of behavior, and we will consider it in some detail in a later chapter. But it is worth noting here that individual differences have been demonstrated in what biologists call taxes, such as
phototaxes and geotaxes—the tendency to approach or to withdraw from light, and the tendency to move upward (against gravity) or to move downward (with gravity). Figure 2 shows graphically the percentages of trials on which different individuals in one experimental population moved up in an ingeniously contrived geotactic maze (Hirsch, 1959). Its resemblance to the kind of distribution we often obtain from testing human
subjects is obvious. But individual differences in behavior have been found in species lower than the fruit fly, even in one-celled animals. There is evidence, for instance, that protozoa show changes in behavior with continued experience in a situation, a form of learning that seems to be an elementary sort of conditioned response. Razran (1933) reported that whereas the average protozoon took 138.5 trials to “learn” this, the range from fastest to slowest
The Field of Differential Psychology
20
PERCENT
ey FIGURE
a
ae ee a GEOTACTIC SCORES
2
Distribution of Geotactic Scores for Male Fruit Flies in a Particular Breeding Population
(Hirsch, J., 1959)
was from 79 to 284 trials. Some experiments by French (1940), using paramecia as subjects, supplied evidence on two other traits or characteristics. One is the tendency to form groups. By an ingenious method, French separated the “groupers” from the “free-swimmers,” kept them separate and in clear water for a half hour, and then put them back into separate food solutions to see if the grouping tendency persisted. It did, to a striking extent. Similar experiments were run to see whether tendencies to enter or not to enter solutions in which a small amount of some foreign chemical had been placed would persist. Again, differences turned
out to be fairly large in some of the experiments and statistically significant in all. Examples based on many other types of performance in many other
species might be given, but enough have probably been cited to convince the student of human psychology that variation in mental characteristics is far from being an exclusively human phenomenon. Such studies are important for us in that they suggest that differences are universal and usu-
ally ineradicable. If this is the case we must learn.to understand them, accept them, and use them in the building of our common society.
General Principles and Concepts HUMAN CHARACTERISTICS DIFFERENCES HAVE BEEN
21 IN WHICH MEASURED
Many types of measurement have been made on human beings. First, it is obvious to all of us that human individuals are not the same in size and shape. We have learned to expect and to make at least some provision for this kind of variation, though the army still sometimes has trouble fitting out the new recruit whose shoes are size 13, and women find that both the 8’s and the 46’s are sometimes hard to obtain at dress shops. Much first-rate work has been done in the field of anthropometric measure-
ments. Not only gross height and weight, but the exact sizes of most of the individual parts of the body have been measured. Second, measurements have been made of the physiological processes, or the way various organ
systems of the body function. Basal metabolism, the amount of calcium, sugar, acid, and hemoglobin in the blood, respiratory rate, pulse rate, and concentrations of acid and of urea in the urine are physiological characteristics in which individuals have been found to show definite, measurable differences.
The extensive research work of Williams (1956) has provided an im-
pressive amount of evidence about this variability in physical and physiological characteristics. The organs of the body, such as the stomach and the heart, differ markedly in size and shape. The chemical composition of the various fluids of the body show a similar variability. Take saliva, for example (Williams, 1956, p. 59). The amount of uric acid secreted in
saliva by nine different individual subjects varied from 2.5 yg. per ml. in one case to 150 yg. per ml. in another. The amino acids, serine, glycine, alanine, and lysine, were not present at all in some cases but occurred in appreciable amounts in others. Each person’s saliva is probably as unique as his appearance, voice, or disposition.
In successive chapters, Williams summarizes evidence with regard to individual differences in enzymic patterns, endocrine activities, excretion patterns, pharmacological manifestations, and nutrition, all of which he considers to be genetically determined. We shall return to his ideas in later chapters. Here we simply take notice that all these kinds of differences exist.
There is even more abundant evidence for individual differences in all sorts of psychological characteristics. There is much variability with regard to motor capacities, such as reaction time, speed of tapping, steadiness, and swiftness of blow. Individuals differ markedly in sensory and perceptual characteristics such as keenness of vision, hearing, and sense of smell. Some are better than others at analyzing and remembering complex patterns of lines, colors, or sounds. Differences in intelligence and the more narrowly-defined intellectual processes, such as memory, judgment,
22
The Field of Differential Psychology
and problem solving, have been demonstrated in hundreds of surveys at all age levels. Among persons who have had equal amounts of schooling
there are wide discrepancies in how much they know. People differ in aptitudes and talents, in interests, values, and attitudes, in personality assets and liabilities. In short, research on human beings corroborates the conclusion from animal studies—individual differences in measurable characteristics constitute a universal phenomenon.
THE
EXTENT
OF HUMAN
VARIABILITY
One group of questions falls in a different category from those that psychologists usually attempt to answer, because it touches on the realm of values and basic assumptions about human nature. How large are human differences, in general, in comparison with the magnitudes we have found ways to measure in the external world? Is there a difference in variability from one trait to another? Do men differ more with regard to intelligence, for example, than they do in stature or pulse rateP Such questions are connected with broad philosophical issues, and the answers one gives to them may be related to his religious, social, and political convictions. Many psychologists doubt, however, whether there is any way to attack them by research methods. The one person who has made a serious attempt to do so is Wechsler.
In his book The Range of Human Capacities (1952), he collected all the distributions he could find of various kinds of measurable characteristics. As an index of variability he used what he called the range ratio. Since he was only interested in the variability to be found in the healthy, nonpathological segment of the human race, he left out of his computations the highest and the lowest thousandth of each distribution. This would remove, for example, the measurements of dwarfs and giants, circus fat men and living skeletons, but would leave the great mass of people whose height and weight fall within the normal range. For each of these slightly curtailed distributions, he divided its highest by its lowest figure to obtain his range ratio. Wechsler was impressed with the fact that differences between human beings, expressed in this way, are relatively small. When we think of the enormous difference in size between the smallest and the largest living
creatures, to say nothing of the objects in the inorganic world, a range ratio of 1.27:1 for human stature seems quite insignificant. When we think of the immense superiority of human intelligence over that of any of the lower animals, a ratio of 2.30:1 for mental age appears trifling. His conclusion was that-the very large differences we find in income and social prestige certainly do not follow from natural differences, but are manmade exaggerations of those differences. Those who champion an equali-
tarian philosophy can take considerable comfort in these findings.
General Principles and Concepts
23
The most serious difficulty we encounter, however, when we attempt
to draw any such general conclusion about human psychological differences, is that a whole class of measurements must be left out. Unless a measuring scale has a true zero-point it is not legitimate to divide one number by another as one must to get range ratios. There is no question about the fact that 200 cubic inches of lung capacity is twice as much as
100 cubic inches. The person whose reaction time is 200 seconds is just twice as slow as the person who reacts in 100 seconds. As long as our scores are expressed in inches or seconds or pounds, we are on safe ground when we make such statements. But intelligence measurements
cannot be handled in this way. The individual with an IQ of 140 is not twice as bright as the one with an IQ of 70. Each IQ point represents no definite unit to which a division on some measuring rod corresponds. We do not know what zero intelligence is. Any ratio we could set up between high and low performances would be misleading. Certain questions in the field of differential psychology are thus unan-
swerable at present and will perhaps remain so forever. Questions involving comparisons of variability in different traits are of this nature, if the traits have to be measured by mental tests. Do people differ more in intelli-
gence than they do in sheer memory, for instance? Do adults differ more than children? Is artistic talent or emotional stability or integrity of char-
acter a more variable trait than intelligence? The fact that IQ’s run from zero to 200 and art-judgment scores from 50 to 125 means nothing at all, so
far as these problems are concerned. Neither the IQ nor the art score represents an exact amount of anything. Zero does not mean that the individual
has absolutely none of the ability involved. Five IQ points are not the equivalent of five points of difference in art score. Wechsler realized this limitation and left out the complex characteristics that cannot be measured in physical units except for Binet mental age, Otis IQ, and a hard-learning
test, all of which are subject to the criticism of not being measurements to which a ratio should be applied. But it is just these complex characteristics that are of most importance in human life.
Another objection that has been made to Wechsler’s conclusions is that even when measurements can be made in physical units such as inches or
seconds, the psychological units to which these correspond may be quite different in their magnitude and their significance. A runner whose speed on the hundred-yard dash is 15 seconds at the beginning of the practice
season can cut this down by one second with relative ease. But when he has reached the point where he is doing it in 10 seconds, a difference of
one second represents a tremendous improvement—a step so great, in fact,
that nobody has ever taken it. In factory production the fastest worker in a department may work at only twice the speed of the slowest, but the advantage this gives him in income and the standard of living that goes with
it makes it appear that the ratio in psychological units would be consider-
24
The Field of Differential Psychology
ably larger than 2:1. Because we cannot measure these psychological units in such a way as to make range ratios possible we must not conclude that we should ignore them. The thing that we can do with psychological measurements of many kinds is to arrange all the scores in order, express each individual's score in terms that will show how he compares with other people, and accumulate information as to the practical significance in human affairs of derived scores of various levels of magnitude. This is probably a more fruitful procedure than the attempt to describe in any absolute terms the variability of the human race. If we cannot state how many times as bright as the villege idiot Einstein
is, we can say with some assurance what kind of contribution to human progress each is likely to make. If we cannot say that the aviation cadet with a score of 9 on the qualifying examination is nine times as talented as the man with a score of 1, our statistical data allow us to state with some assurance that he has sixteen times as good a chance to get through his elementary training. If we cannot say that the student with a college aptitude score of 120 is four times as bright as her classmate with a score of 30, we do know that the one is almost certain to pass, the other almost certain to fail in college competition. It may not be philosophically satisfying to express the situation in these terms, but still it answers our practical needs fairly well.
THE
NATURE
OF DISTRIBUTION
As measurements of various human characteristics became available, it was necessary to work out methods of handling the data so as to bring order into them, make it possible to study them systematically, and pro-
vide for comparisons between the individual and the norms for his group. The first step in this procedure is to arrange the measurements or scores
in an orderly table called a frequency distribution. The method is simply to tally all scores falling within each specified range of score points. This method is illustrated in Table 1. It is easier to comprehend the significance of such arrays of figures if they are then portrayed in graphic form. Figure 3 shows how this distribution looks when graphed. Z A graphic presentation of the sort shown in F igure 3 is called a histogram and is the most common, most generally satisfactory way of graphing a frequency distribution. Measurements are always indicated as distances along the horizontal base line. Any convenient scale that will include the fullkrange of obtained measures may be used. In the present example, each unit of base-line distance represents an interval of 20 cubic
inches of lung capacity. Bars are then erected showing how many individ-
uals in the group obtained scores falling within that interval, and the scale
General Principles and Concepts TABLE 1 Frequency Distribution
25 of Lung Capacity
(White soldiers 66.5 to 67.5 inches in height)
(Gould’s data as reported by Wechsler, 1952, p. 28) CUBIC INCHES Below 96 96-115 116-135 136-155 156-175 176-195 196-215 216-235 236-255 256-275 Above 275
NUMBER
OF MEN
19 52 81 136 271 319 330 160 85 By 16
N = 1,491
along the side indicates how many individuals are represented by each bar. In this figure, each unit of height stands for 30 cases. A person who has never seen any sort of pictured distribution before, if asked to describe the shape of Figure 3, could not help noticing the short bars at the ends and the long bars in the middle. He would probably comment also on the fact that the height of the bars shows a gradual increase up to the middle and from there on a gradual decrease, giving a step-like effect similar to an old-fashioned stile over a fence. Again and
again, as they worked with sets of physical or psychological measurements of all the types listed in the preceding section, investigators encountered distributions of this same shape, high in the middle, tapering off at both ends. Almost all intelligence tests in common use, for example, show a pattern similar to Figure 4. This most common type of distribution is often
uncritically called the normal curve. It is not really correct to give it that designation unless a mathematical test has been made to see whether the
relationship between x and y (base-line distance and height) satisfies a certain mathematical equation. “Normal curve” is a mathematical rather than a psychological term. It is important to recognize this fact in order to get away from unwarranted connotations of the word “normal.” There is nothing abnormal about other distributions of human characteristics, as Figure 5 shows. ‘However, many biological, anatomical, and psychological measure-
ments do seem to distribute themselves in a fairly close approximation to the mathematical normal distribution. That is because this is the form of
curve one obtains for repeated determinations of any datum produced by
The Field of Differential Psychology
26
340 336 wate
1'50 same MEN OF NUMBER
"76
«96~—C«d:GSs«d36—«d‘H5SGSC«d176 «196-216 CUBIC INCHES
«236
«2256
276
FIGURE 3 Histogram Showing Frequency Distribution of Lung Capacity in 1,491 White Soldiers
(Wechsler, 1952)
an event due to what the mathematicians call pure chance. Chance, in this sense, does not mean that what is being studied is something outside the natural order in which cause-and-effect principles operate, but simply that it is a phenomenon with multiple causes so complex that they have never been isolated. Thus when one tosses ten coins at a time again and again, there is a very complicated interplay of forces which produce at each throw heads for some, tails for others. The most probable result in this situation is a combination of five heads and five tails. If the coins are tossed a thousand times, the distribution representing the frequency with which each number of heads, from zero to ten, is obtained, will closely approximate the normal curve. Measurements of physical and mental traits are also determined by a large number of independent factors, many of them at present unanalyzable. So it is natural that when large numbers
of subjects are measured, we get an approximation of the normal or chance distribution.
Because non-normal distributions are fairly common, sweeping gen-
General Principles and Concepts
27
400 375 350 = 325 = 300 275. 250 225 200 175 150 CASES OF 125 NUMBER 100 75 50 20
55 60 65 70 75 80 85 90 95 100 105110115 120 125130135 140145150 155 1.0. FIGURE
4
Frequency Distribution of IQ’s on Form L. Stanford-Binet Test, Ages Two and One-half to Eighteen (McNemar, 1942)
eralizations which were the rule in earlier stages of research on human differences have had to be abandoned or revised. This is especially true with regard to mental characteristics that must be evaluated by means of
tests. It is quite possible to change a skewed ’ distribution into a normal one simply by making the test on which it is based a little harder or a little easier, depending upon the direction of the skewness. A test that
produces a skewed distribution when given to a representative group of ten-year-olds may give a normal distribution for twelve-year-olds. A test
that gives a skewed distribution on a population of college students may give a normal distribution for new recruits at an induction center. We know now that test scores can be manipulated to give us any sort of distribution that we want. Because there are definite mathematical advantages to be obtained from normal distributions, one of the aims of present-day test-builders is the construction of tests that will give normal
distributions for the types of population in which they are to be used. Because of these facts about test scores and what we can do with them, it is impossible to determine whether or not most mental traits are actually
distributed normally in the population as a great many physical character1A skewed distribution is one that shows a piling up of cases in the direction of either the low or the high end rather than in the middle. Figure 5 is an example.
The Field of Differential Psychology
28
CASES OF NUMBER
40 60 NUMBER OF TRIALS
FIGURE Frequency
5
Distribution
Showing
Individual
Differences
in the
Ease
with
Which Conditioned Eyelid Responses Are Formed (Campbell and Hilgard, 1936)
istics seem to be. But there is a great deal of evidence that many distributions of both physical and mental traits are continuous, finding is of the highest importance. In continuous distributions no separate classes, no types. Any classifications we set up are
if not all and this there are for con-
venience only and do not completely represent the facts. Students are familiar with this idea as it applies to examinations on which grades in courses depend. It is necessary that a class be divided into A, B, C, D, and F groups at the end of a course, but there is always some unfortunate B man who is almost as high as the lowest person in the A group, and some
fortunate soul who just barely obtains a D rather than an F. The same holds true in many other classifications. Thus we probably should not say that one person has musical talent and another none, that one person is selfish and anather unselfish, that one is rigid, another flexible. Sensitive measuring devices for appraising musical talent, selfishness, and rigidity demonstrate that scores on such traits range from low to high, with no real breaks anywhere in the distributions.
General Principles and Concepts It was the apparent universality of continuous
29 distributions that led
psychologists to turn away from typological thinking and concentrate in-
stead on the identification and measurement of traits. This led to progress in research and probably had desirable effects on people’s thinking about individual differences. Instead of dividing people into the wicked and the
righteous, the stupid and the intelligent, the beautiful and the ugly, or the neat and the slovenly, we learned to pay attention to the common
human qualities in which we differ only in amount. In short, we learned to think of differences as quantitative, not qualitative. It may be that dif-
ferential psychologists have devoted their attention too exclusively to quantitative trait differences and thus have ignored some more elusive aspects of individuality not susceptible to this kind of description. (Tyler, 1959). Work on cognitive styles, interests, temperament, and various other
types of problem has been suggesting that we try out formulations better characterized as differences in structures or in directions of development than as amounts of specific traits. Type concepts are being scrutinized again with new interest. We shall return to these problems in the final chapter. For the present it is sufficient to say that by far the largest portion of the research findings in differential psychology is organized around concepts of trait and distribution, so that it is with these we shall be
chiefly concerned. The trait concept itself, however, has undergone changes as time has
passed. Increasingly the word dimension has been used in place of the word trait to signify some measurable aspect of human individuality. The score a person makes on a test is considered to represent a distance along some scale rather than an amount of knowledge or ability. If we look at Figure 3 or Figure 4 we can see how natural this interpretation is. The first thing we do in making a histogram is to arrange all the scores in order along a horizontal base line. On this line we can measure the distance that separates an IQ of 60, for example, from an IQ of 110. The
difference of 50 IQ points is given a spatial representation. This dimensional reformulation of the trait concept has been especially useful when we attempt to combine measurements of several traits. It provides a method for describing the uniqueness of an individual in spatial terms. If, for example, we administer three tests to a group, vocabulary, mechanical aptitude, and arithmetic, we can set up a threedimensional system to represent combinations of scores made by individual testees. Lucille makes a score of 6 on vocabulary, 3 on mechanical aptitude, 7 on arithmetic. Henry makes 7 on vocabulary, 10 on
mechanical aptitude, and 2 on arithmetic. Figure 6 shows how each of them could be located in the space represented by three dimensions corresponding to the three tests. It is a convenient and economical way of combining the available information about individuals and has made for considerable progress in the technology of psychological measurement.
The Field of Differential Psychology
30
ARITHMETIC
1
2
FIGURE
3
4 5 6 7 MECHANICAL APTITUDE
8
oy
10
6
Hypothetical Three-dimensional System to Represent Positions of Individuals on Measures of Vocabulary, Mechanical Aptitude, and Arithmetic
Methods like factor analysis and multidimensional scaling rest on dimensional thinking. Of course, when more than three test scores are obtained for each in-
dividual it is no longer possible to denote his position on an actual graph, as has been done in Figure 6. We must think in terms of n-dimensional space instead of the three-dimensional space with which we are familiar. But the reasoning and the methematical formulation are the same, regardless of the number of dimensions. In the chapters to come, the reader will
encounter again and again this dimensional approach to the measurement of human characteristics. _.USE OF STATISTICAL METHODS DIFFERENTIAL PSYCHOLOGY
IN
-
It was an important landmark in the early exploration of human differ-
ences when Galton decided that normal curve theory, which Quetelet in
General Principles and Concepts Belgium had been applying to vital and social statistics—-what
31 Galton
called “the very curious theoretical law of “deviation from an average’ ”— could also be applied to measurements of individual ability and achieve-
ment (Galton, 1870). It became the basic strategy for imposing order upon psychological measurements of all kinds. Since Galton’s time, the field of statistics has been enlarged in many directions and has taken on a complex organization of its own. Anyone who hopes to achieve a thorough understanding of differential psychology must be familiar with at least the most basic varieties of statistical reasoning. We shall not go into these in this book, but simple explanations are available elsewhere for those whose background does not include statistics (Tyler, 1963; Hammond and Householder, 1962). Here we shall simply summarize the principal purposes for which the main varieties of statistical concepts are used.
DESCRIPTIVE
STATISTICS
The most fundamental distinction that can be made between kinds of
statistical reasoning is the distinction between descriptive and inferential statistics. As suggested by the name, the main purpose of descriptive statistics is to describe in an ordered and economical way the main characteristics of a group of measurements. If a distribution of scores is normal—and as indicated above, test-makers try to guarantee that it will be—the mean and standard deviation of any set of scores summarize for us two kinds of essential information about the group on which the scores
were obtained: (1) How high on the average, is this group, or what is its central tendency?; and (2) How much do the individual members of the group, tend to differ or what is the group variability? Figures 7, 8, and 9 illustrate these concepts of central tendency and variability. If we were to compute the means and standard deviations for the pair of distributions pictured in each of these diagrams, we would find that for Figure 7 we would get different means but the same standard deviation in both cases. For Figure 8, the means would be the same, but one standard deviation would turn out to be much larger than the other. For Figure 9, the distribution to the right would show a higher mean but a lower standard deviation than the one at the left. Thus the use of the mean and standard deviation serves as a convenient shorthand method of communicating information about the characteristics of groups on which measurements have been made. The mean and standard deviation serve another very useful purpose in
descriptive statistics. They enable us to translate scores on different tests into the same language. The reason this is possible is that in a normal distribution there is a fixed relationship between the standard deviation and the total range of scores in a group. Figure 10 shows what this rela-
tionship is. In working with actual data, the horizontal base line is num-
r
Kk
eee ee
(oan enue cece
SASVO
FIGURE
Jeeseoes seeGEeSada emaag Bees ea ee a 2eoe CE enEe ie sce ae
YAEWNN 4O
My M2
~
YAEWNN 40 S4SVO
SASVO 4O YaEINNN SCORES
FIGURE 9 Two Distributions Which Differ in Both Central Tendency and Variability
ee
jSUSa8khE5 AH
YASWNN 4O SaSVO -3 SD
—2SD
Leal
D2
SEE EH —
FIGURE
10
The Significance of the Mean and Standard Deviation in a Normal Distribution
34
The Field of Differential Psychology
bered off to represent the total range of scores in the group represented in the graph. The units of distance along this line may represent one score point each, 5 score points each, or 21 score points each, or any other number of score points, and the total distance along this line may represent a distance of 24 points, 120 points, 504 points, or any other number of points. But whatever the numerical magnitudes involved are, if we measure off along this base line starting from M, the point representing the numerical value of the mean, a distance corresponding to the standard deviation we have computed from the individual scores themselves, we reach the positions shown by the points labeled + 1 SD and — 1 SD. If we examine the curve above the line between these points, and the area between the curve and the base line, which represents the number of persons getting scores within this range, we can see that approximately the middle two-thirds of the group fall into these two middle sections. If we continue the process of measuring off distances corresponding to the standard deviations along the base line and then examining the area under the curve that corresponds to the distance measured from the mean in both directions, we can see that approximately 95 per cent of the area is above the range between — 2 SD and + 2 SD, and the whole distribution is included between — 3 SD and + 3 SD. These relationships between area under the curve and distances from the mean along the X-axis have been worked out mathematically with great accuracy. Many varieties of derived scores are based on this constant relationship. An example or two will illustrate
how useful this “translation tool” is. Take the case of Sam Selby, just released from the Service, who is discussing with a counselor the question
of whether or not he qualifies for college work. The only information he has about his mental ability is that his Army Classification score was 125.
He has heard that an IQ of at least 115 is required for success in the kind of college he is considering. Does he qualify? The counselor knows that the mean of the Army Classification Test scores was 100 and the standard
deviation 20. He knows also that the mean of the IQ distribution upon which statements about the ability necessary for success in various kinds of colleges are usually based is 100 and the standard deviation 15. Both
the Army scores and the IQ scores refer to groups representative of the general population and are based on similar test material. The counselor then reasons in the following way: *
Sam is about 1% standard deviations above the mean of the general population.
The college seeks students who are at least one standard deviation above the mean of the population. N
Therefore Sain is within the college range. He does qualify.
Another statistical tool that is widely used in describing the characteristics of groups and traits is the correlation coefficient. We know very
General Principles and Concepts
35
little about what any one set of measurements means until we have related it to some other set of measurements. Whether this search for meaningful relationships takes the form of relating test scores to criterion measurements, as, for example, in the validation of a mechanical aptitude test, or whether it involves complex methods for analyzing a whole net-
work of correlations of test scores with one another, as in factor analysis, the basic question is always to what extent each individual occupies the same position in a group with regard to two or more measured characteristics. In other applications of correlation, the relationship is between persons rather than between traits, as, for example, the correlation between identical twins on intelligence and personality measures, a line of research to be explored in detail in a later chapter. For descriptive statistics, then, the three basic concepts are central tendency, variability, and correlation. There are many specific statistical techniques available for analyzing various kinds of measurements in various kinds of groups, but the details of these need not concern us here.
INFERENTIAL
STATISTICS
Besides the descriptive use of statistics to summarize
in a convenient
way the information contained in a whole distribution of scores, there is another use which involves some additional logical processes. In our attempts to create a science of human differences we cannot be content with simply a description of the groups of individuals we happened to test.
When we compare the scores 50 boys and 50 girls make on an interest test, we hope to be able to draw some general conclusion about masculine and feminine interests. When we correlate a particular set of scores on a musical talent test with achievement in music courses, we hope to be able
to draw some conclusions about what the relationship will be in other groups besides this one. We must necessarily carry on our research using only samples of the total population of human beings about which we wish to make inferences. And we know from experience that if we carry out exactly the same procedures on another sample of subjects chosen in exactly the same manner as the first sample, the measures of central tendency, variability, and relationship we obtain may not be identical in the two cases. The first thing any investigator must demonstrate, then, in order to prove that a difference between group averages or a correlation
between traits really means something, is that it is too large to be accounted for by the random variation in samples from the same population which we call chance error.
The term the statistician uses to convey the idea that a result is outside the range of those which sampling fluctuation alone is likely to produce is
statistically significant. It is expressed as a probability figure. The researcher, for example, may say that the difference or the correlation he is
36
The Field of Differential Psychology
reporting is significant at the 5 per cent level (P = .05), at the 1 per cent level (P = .01) or even perhaps at the .1 per cent level (P = .001). Applied to a difference between the means of two groups, such as middle-class and working-class men, for example, the statement P = .05 or P < .05 indicates that the statistical procedures one has carried out allow him to infer that, were it possible for him to test a hundred random pairs of samples from the same population, there would be not more than five comparisons out of the hundred in which the difference between means turned out to be as great as the difference he actually obtained in the one comparison he actually made. Thus he feels safe in concluding that the difference he is reporting applies to middle-class and working-class men as a whole and not just to the two particular groups he happened to test. If a person is to achieve a clear understanding of what the results that have been reported in differential psychology mean and to show good
judgment in applying them, he needs to understand precisely what the concept of statistical significance means in order to be aware of what it does not mean. Around this point much confusion centers, probably because the word “significant” as we use it in our common speech carries a rich freight of connotations. It is a symbol of value as well as fact. What we do when we place the word “statistically” in front of it is to strip it of all this cargo it is carrying. The statement that a result is statistically
significant means nothing but the fact that it is not accounted for by sampling fluctuations. The facts reported as a result of the research may
be unimportant, the conclusion may have no practical application whatever, and the researcher may have wasted his own and our time. It takes far more than statistically significant results to constitute a brilliant con-
tribution to knowledge. But no amount of brilliance in planning a study and interpreting its findings can make up for the failure to check first on statistical significance. Unless a researcher does this he runs the risk of expending all his brilliance in efforts to interpret differences or relationships that simply are not there.
SUMMARY Variability from individual to individual seems to be a universal phenomenon. As far down in the scale of life as it has been possible to go, individual organisms differ in the extent to which they show certain rudimentary psychological traits. One-celled animals differ in the readi-
ness with which they modify their behavior with experience, and con-
sistent individual tendencies toward such behavior as swimming in groups or tolerating chemnicals in the water have been noted. Individual rats differ from one another in both learning ability and temperamental traits.
Monkeys differ markedly in the complexity of problems they are able to
solve.
oS
General Principles and Concepts
37
In human subjects, measurable differences have been shown to exist in physical size and shape, physiological
functions,
motor
capacities,
sensory and perceptual sensitivity, intelligence, achievement and knowledge, interests, attitudes, and personality traits.
An ambitious attempt to assess the total amount of human variability and show how it varies from trait to trait was made by Wechsler, using range ratios, or the ratio of the next-to-the-highest to the next-to-thelowest individual scores in a thousand randomly selected cases. His conclusion is that variability in human capacities covers a relatively narrow range. The criticisms that the ratio method cannot be used on mental-test scores, and that for psychological traits measured in physical units the
psychological units may not correspond to the physical ones, throw some doubt on the conclusion. At any rate, the more important task for differential psychologists is to gather information about what measured differences mean in life situations. Thus we can avoid arguments over questions that are at present unanswerable and discover the facts that are really significant in human affairs. When a set of measurements of any of these characteristics has been obtained, the first thing that is done is to arrange them in order of magni-
tude in a frequency distribution which can be presented graphically as a histogram. Most measurable traits give us continuous distributions, with no breaks between groups. The majority of the distributions show some resemblance to the mathematical normal curve, and it is usually possible to transform the data in some way for those that do not, so that normal curve statistics may be used. The two summary figures usually computed in analyzing a distribution are the mean and standard deviation, which constitute measures of central tendency and variability. Relationships between traits or between individuals are expressed by means of correlation coefficients. The three principal concepts of descriptive statistics are central tendency, variability, and correlation.
Inferential statistics make it possible to draw conclusions about populations from measurements made on samples. To say that a difference or a correlation is statistically significant means that there is only a small probability that it could have been produced by chance variations in samples drawn from the same population.
CHAPTER
3
Research Strategies AS EXPLAINED IN THE PREVIOUS CHAPTERS, most of the research on human differences has been based on the concepts of trait and dimension. The first step in any such investigation is to identify some trait that can be measured and to show that different individuals do possess the trait in different degrees. Sometimes, as in the case of intelligence, the trait is one that has become apparent to everyone who observes children or adults in
the situations of everyday life. The task then is to construct some measuring instruments that will enable us to score subjects in sample situations.
Sometimes a hypothesis with regard to a trait that ought to be measurable arises out of clinical work with individuals, as in the case of “rigidity” which a number of workers have been attempting to pin down. Sometimes the conclusion that a measurable trait exists is reached by pure ac-
cident when marked individual differences show up among subjects who had been expected to give uniform results in an experiment. There are hundreds of traits in which measurable individual differences have been shown to exist. There is little we can do with such information, however, until we have gone beyond reporting that variability is present. Our concern in this book will be with traits for which research has been
carried through one or more further stages, until we have actually learned something significant about it. A complete catalog of all the characteristics
upon which human subjects differ, with references to the tests or experiments upon which the list is based, would be a valuable reference for research workers, but it would be of little value to students trying to organize their knowledge, or to teachers, social workers, and clinicians trying to apply what they have learned in real situations. The facts and principles thathave been most useful have been based on research that
did more than to present a distribution, or a mean and standard deviation for a group. =
The methods that have been devised to produce‘this additional know]4
Research Strategies
39
edge we need if trait measurements are to be useful in human affairs can be classified under three main headings: (1) correlational studies; (2) studies of group differences; and (3) developmental studies. CORRELATIONAL
RESEARCH
In order to satisfy himself that he is measuring something more than chance behavior, an investigator who is exploring a new technique is
likely first of all to compute some sort of self-correlation—what is ordinarily called a reliability coefficient. Even if his new test has resulted in a
perfectly normal distribution when tried out on a large group of subjects he still cannot be sure that anything except “pure chance” has produced the differences between individual scores. It is likely, for example, that if we gave only the answer sheets for one of our standard intelligence tests to 1,000 persons, and asked them to select a response for each item without ever seeing the questions at all, the distribution of the scores obtained in this way would be approximately normal. (This is not to deny, of course, that the scores would undoubtedly run lower than they do when the test is given in the ordinary way!) To some degree all test scores and measurements are determined by chance factors which it is impossible for anyone to analyze. The investigator must first of all find out how much of
the variability in scores is to be attributed to chance, and how much can be assumed to reflect the particular trait he has attempted to measure. One can assess the importance of some of these chance determiners by correlating scores based on some part of the test with scores based on another part. For example, scores based on the odd items alone can be correlated with scores based on even items alone. If two equivalent forms of the test are being constructed at the same time, scores based on Form A can be correlated with scores based on Form B. Correlations of this
type (there are many other specific varieties within the classification) are
what Cronbach (1960) has called equivalence coefficients. If it is satisfactorily high, such a reliability coefficient indicates that the parts of the test are consistent with one another—that they measure the same characteristic or combination of characteristics. The other principal way of finding out whether a test is measuring something over and above chance is to give it twice to the same group of subjects and correlate the two sets of scores. This produces what Cronbach calls a stability coefficient. When it is satisfactorily high, it indicates that the test measures an aspect of individuality that possesses some permanence. If the time interval between test and retest is longer than a week or two, a low correlation may indicate either that the test is unreliable or that the trait it measures changes as time passes, and that different individuals change at different rates. Many interesting questions arise as to how stable
40
The Field of Differential Psychology
various traits are at different life stages. Bloom
(1964) made a careful
analysis of all the evidence he could find in answer to these questions for certain physical characteristics, intelligence, some kinds of achievement, interests, attitudes, and personality. It is clear that some traits are more stable than others and that the shape of the growth curve determines how early a trait becomes stabilized. It is clear also that environmental factors help to determine whether stability or change will predominate. Bloom’s book has prepared the way for new research designed specifically to investigate stability and change. During the first two or three decades of research on mental measurement, little distinction was made between different kinds of self-correlations—coefficients of equivalence, coefficients of stability over short intervals, coefficients of stability over long intervals. They were all lumped together under the term reliability. As time passed, it became evident that they provide answers to different questions about any trait under consideration. A careful analysis of what one wishes to find out about whatever he proposes to measure is an indispensable foundation for intelligent decisions about what should be correlated with what. It may be that the term reliability has served its purpose and that we could now dispense with it. Cronbach, et. al. (1963) has proposed that a
more useful concept would be generalizability. This would suggest questions like: What is the evidence that I can generalize from scores on this particular test to scores on another test made up of similar questions? What is the evidence that I can generalize from scores on this test given now to scores to be expected from these same testees next month? next
year? ten years from now? The time is past when we can look at one reliability coefficient and make an overall evaluation of a test. To interpret scores in a variety of situations, one needs a variety of kinds of information. Even more enlightening than the information we gain by correlating two sets of scores obtained from the same test is what we learn by correlating these test scores with measurements of something else. Most often such correlational studies are undertaken in order to find out how valid a test is as an indicator of the trait it was designed to measure. In such cases, the variable with which the scores are correlated is called a criterion. One
of the commonest examples of this sort of research is to validate an intelligence test by correlating it with
grades
or
other
evaluations
of
academic performance in school or college. In other instances, scores on
an established test like the Stanford-Binet are used as a criterion in validating a new test, ‘
In thinking about validity, as well as reliability, psychologists have come to distinguish between situations they once lumped together. We use the term concurrent validity if the evidence consists of a correlation between test and criterion measurements obtained at about the same time.
Research Strategies
4]
We use the term predictive validity if the criterion measures were obtained some time later than the test scores. Which method a research worker chooses to employ depends, again, upon what he wishes to know.
If he hopes to develop a new and satisfactory substitute for the StanfordBinet intelligence test, the most important question for him is whether or not it really measures the same trait as the Stanford-Binet test does. Here a concurrent validity coefficient is indicated. If he is developing a new
test he hopes will serve to identify promising candidates for training in computer technology, it is the ability before training he needs to assess, and the predictive validity of the test becomes the important consideration.
During the 1950’s and 1960's there has been increasing emphasis on a
type of correlational research that does not involve any concrete empirical criteria of the traits under consideration. This variety of data about tests
has been classified under the general title construct validity. As psychologists explored the complex field of personality measurement, they discovered that their straightforward correlating them with criteria were
methods of validating tests not usually applicable. Take,
by for
example, the problem Adorno et al. (1950) faced when they set out to investigate the authoritarian
personality.
They were
not
attempting
to
produce just a new test to measure a generally recognized characteristic like intelligence. Rather they were trying to develop a new way of understanding the differences in personality underlying political and social attitudes and behavior. What is required in such an undertaking is a careful analysis of the relationships one would expect to find between different sets of measurements if one’s theoretical formulation is correct. A construct is a product of one’s thinking about a theoretical issue. A test has
construct validity if the relationships between scores obtained on it and various other measures entering into the theoretical formulation turn out to be significant and in the predicted direction. There is no one validity coefficient for a test like the F-scale used in the research on the authoritarian personality. Its construct validity rests on the whole body of evi-
dence reported in the book by Adorno et al. (1950) and in the many other research reports that have followed it. Our discussion of procedures used in validating psychological tests would not be complete without some mention of content validity. This term refers to evidence of various sorts that the items or tasks of which a
test is composed really represent an adequate sample of the body of knowledge or the kind of skill the test is designed to measure. In this sort of demonstration, correlational procedures are not necessary. To insure a test’s content validity one must exercise care in the selection of materials that go into it. It has been in the area of achievement testing that content validity has had the widest application.
These four varieties of validity study—concurrent, empirical, construct,
42
The Field of Differential Psychology
and content—make up a large part of the work done in investigating individual differences in measurable traits. But to consider this work as purely a matter of validating particular kinds of tests is to miss what it all adds up to. Each research program designed to produce new information about what a certain test is measuring also enables us to formulate a clearer, more precise definition of the human characteristic under consideration and the aspect of human personality of which it forms a part. Psychologists have come to realize that the unraveling of strands from the complex fabric of human individuality is a highly complex task. At an earlier stage of our thinking about these matters the order of procedure
to be followed seemed obvious: (1) formulate a clear definition of what you intend to measure; (2) construct a test out of items that can be considered a sample of the behavior in which you are interested; and (3) evaluate the success of your efforts. On the basis of their experience in trying to do this, researchers now know that it is seldom if ever possible to achieve a precise definition of any human trait until many kinds of evidence about it have accumulated. Work on the measurement of intelligence began more than half a century ago, but we are still modifying and clarifying our concept of what intelligence is. The provisional definitions, with which Binet and other early workers began, have been reformulated again and again. As psychological measuring techniques have been applied to each new area— achievement, aptitudes, interests, personality, and others—the same kind of process has repeatedly occurred. Definitions are changed, traits are reclassified, and new theories are developed about the way in which personality is organized. It is this precipitate from research on the validation of tests, these general conceptions of the dimensions of variation in human beings that chiefly concern us in this book. Correlational research has not been limited to the analysis of the relationships between two sets of measurements. By considering severai sets of scores and the correlations between them, psychologists have been able to make inferences, or at least to formulate hypotheses, about what it is that produces these correlations. This mathematical analysis of correlation
matrices (rectangular tables of correlation coefficients) is called factor
analysis. Its purpose is to discover the factors that cause the test scores to correlate. . The kind of reasoning on which the factor-analysis methods are based is an indirect or roundabout process. It is more like what an astronom er does as he tries to reach an understanding of conditions on a distant planet, or what a geologist does when he tries to describe what the earth
was like a milliotr‘years ago, than it is like the customary activity of the
laboratory scientist. It is largely this indirectness or deviousness in the original reasoning that confuses the beginning student. The necessity for it arises from the fact that the process we are interested in cannot be
Research Strategies
43
observed directly. The mental-tester tapping than the geologist can look in Both must somehow contrive to make and to check the correctness of these basic variables at all.
can no more see the abilities he is on the events of a million years ago. inferences from the data they have inferences without ever seeing their
What a scientist does when confronted with a problem like this is to construct a model (though not necessarily a concrete physical one) the workings of which would serve to account for the facts he is trying to
explain. If the model really accounts for everything, it becomes an accepted explanation. If there are certain facts it cannot account for, eventually someone devises a better model which takes precedence over the old one. We shall not try to explain here the elaborate computational procedures that are required for a modern factor analysis. It is enough that the reader, the consumer of factor-analytic research, be familiar with the end results that he is likely to encounter, so that he will know what to make of a table of factor loadings and how to avoid pitfalls that arise in their interpretation.
Table 2 is an example of the sort of final results a factor analysis gives
TABLE 2 Rotated Factor Matrix Based on Centroid Analysis of 21 Tests (Thurstone and Thurstone, 1941, p. 91)
Piiqdts G's (P) (N) (W) 1. Identical Numbers .. Bares ees a) eye 3. Mirror Reading ..... 4, First Names is. iase«. 5. Figure Recognition .. 6. Word-Number ..... 7. Sentences ......... S.Vocabulary 2. 2... 9. Completion ........ 10. .First,.Letters ....... 11. Four-Letter Words ..
Be a UXES cy eaealloyoh LALA GEE Cianiee Sepeaes Merete bY Figures 202).8. es ards We: . 5h: AG: Addition yess: ihe cise 17. Multiplication ...... 18. Three-Higher ...... 19. Letter Series ....... 20. Pedigrees .......... 21. Letter Grouping ....
42 40 45°°..17 26 09 —.02 09 .20 —.10 02 .13 00 01 —.01 02 —.01 00 12 —.02 04 —04 02 07 O01 01.
—.03 —.05
03 05 —.06 —.03 .64 ..67 —05 .38 =09 05, 02 —.05 06 .06
Tisayeit (V) (S)
Vive rsm(M) (R). vats
.05 —.02 —.07 —.06 —.06 .08 —.06 '.04 20 .05 .02 —.12 19 —02 05 —.01 .09 .12 02 00-05 53 .10 .02 .02 —02 .10 31 .07 —.17 —03 .00 .01 .58 —.04 .04 —.03 .66—.08 —.05 13 .07 05 66—.04 02 .02 .05 —.01 .67 .15 .00 —.01 —.11 .63 03 —.02 .00 —.00 —.08 61 —.01 .08 —.01 .04 —.05
45 03 01 —.03 —02 01 —01 .0a —.03 .13
.18-—.03 .03 —.08 .10 —.01 .68 .00 .01 —.07 —.02 .76 —.02 —.02 .07 .03 .72 02 —.03 .13 01 .05 .01 —.02 —.03 —03 —05 .02 .02 01 .06 .20 —05 .16 —.12 1.02.00 Ooi". 53-02 .22—.03 .05 .44 —.02 —.04 .01 —.06 42 .06
44
The Field of Differential Psychology
us. It shows the loading each factor has in each test. (The concept of loading is a sort of metaphor. Each test is thought of as a vehicle carrying a certain amount of one or more of the abilities. Another way of explaining it is that the loading of a certain factor in a certain test shows us the extent to which this factor determines the scores individuals make on the test.) The mathematical work that produces these loadings does not tell us what the factors are. The names that get attached to them are based on a careful scrutiny of the pattern of loadings shown in the table (or “matrix” in
technical factor-analytic language). Let us see how this works by examin-
ing Table 2. In the first place, since these loadings are on the correlation scale run-
ning from .00 to 1.00, and since they too are subject to sampling errors, it is customary to pay no attention to those which are near zero. The identification of the factor rests primarily on loadings of .30 or higher. When we look at Column I, where the loadings for the first factor are found, we find loadings above .30 for only three tests—Identical Numbers, Faces, and Mirror Reading. What is it that these three tests have in common? Thurstone decided that perceptual speed was the one ability they all required, so he called this factor P. Next we examine the higher loadings for Factor II. The tests on which they occur are Identical Numbers, Addition, Multiplication, and Three-Higher. Even without looking at the test papers themselves, the nature of this factor seems obvious. Thurstone called it N, because working with numbers is what these four tests require. We shall have more to say about the “primary mental abilities” represented in this table in a later chapter. The reader who has never studied the mathematical theory and the computational procedures of factor analysis must necessarily take the loadings he is given in a table like this one without questioning their numerical accuracy. He has the right, however, to make up his own mind as to what they show about the abilities or personality characteristics being investigated. The description and naming of the factors is a matter of psychological judgment, not mathematical skill. Instead of uncritically accepting the names that a factor analyst has given his factors, it is always a good plan to examine the factor loadings for oneself. There is often room
for a considerable difference of opinion as to just what it is that several tests have in common. Sometimes portant new research activity.
these differences
can
stimulate
im-
Even if one does not know anything about the mathematical procedures by means of which the “factor matrix” comes into existence, there are certain limitations and defects in it of which he should be aware. Itiis not as precise and rigid as many nonmathematical readers believe it to be. At several stages in the complicated sequence of steps that must be taken,
estimates or informed guesses are required. Mathematically, the loadings constitute distances measured along geometrical reference axes, and there
Research Strategies
45
is often room for some disagreement among skilled workers as to just where these reference axes should be placed with respect to the points that represent the tests. The encouraging thing is that in spite of the uncertainties that are an ineradicable part of the factor-analytic methods, a
great deal of agreement has been achieved. Another equally skillful person working independently from Thurstone’s data would probably not produce precisely the same set of factor loadings that we find in Table 2. But the loadings would be similar enough so that they would warrant exactly the same conclusions about the factor composition of the tests. It is these conclusions that we are working for. There is nothing sacrosanct about the exact loadings themselves. Let us then think of factor analysis as an aid to psychological judgment, a methodological tool designed to help us construct a useful body of theory about how traits determine test scores and the other measurements of individuals.
RESEARCH
ON GROUP
DIFFERENCES
The second main variety of research strategy used in differential psy-
chology is the comparison of groups to determine whether there is a significant difference between them on some measured psychological characteristic. This general method can be divided into two submethods:
(1) the comparison of some existing groups, and (2) the comparison of groups that have been constituted especially for the experiment on the basis of their performance in some test or experimental situation. The comparison of naturally occurring groups is the simpler procedure. It came into use very early in the development of differential psychology. The comparison of specially selected experimental groups has come into increasing prominence during recent periods.
On first glance, the setting up of a study to show whether two groups in the population differ with regard to some psychological trait looks easy.
This is probably one of the reasons why we have had so many of such studies comparing the intelligence, for example, of boys and girls, whites and Negroes, or farm- and city-dwellers. Actually such studies involve a number of problems and difficulties. One must plan what he does carefully if he expects to be able to draw clear-cut conclusions from his results. The first of these complexities has to do with the task of getting representative samples, a problem that will be discussed more fully in a later section. When two or more groups are chosen on the basis of convenience, it can often happen that each of them is in a different way unrepresentative of the population from which it comes. Measured differences between
them, in such cases, may do nothing more than to reflect these combined
biases. Suppose, for example, we wish to try out a new algebra test. A college freshman mathematics class is an easy place to get subjects. When we average the scores we find to our amazement that the average for the
46
The Field of Differential Psychology
girls in this class is ten points higher than that for the boys. How shall we account for this result in view of the almost universal finding that the sex difference in mathematics is in the direction of male superiority. First of all, we should realize that neither college boys nor college girls are really representative of the population in general. Furthermore, in a freshman mathematics class, the two sexes may very well have selected themselves on an entirely different basis. The girls here may be students who did un-
usually well in this subject in high school and decided to take more of it in spite of the fact that most of their sorority sisters shudder at the thought of math. The boys may be those who dodged mathematics in high school because they had less than the average amount of interest and ability in it and only face up to it now because they have learned that it is a prerequisite for later courses in other areas. The special selective factors are such as to wipe out the customary sex difference and produce a difference in the opposite direction. The important point is that such a comparison shows us nothing about differences between males and females in general. If we expected to be able to draw any such general conclusion, we have wasted our time in working with this particular group. There is much discussion of such selective factors in the literature of differential psychology. As psychologists have become more aware of them, they have made determined efforts to minimize them. Where it is impossible to avoid them because of practical difficulties in getting good representative samples, we can often resist being led astray by them if we try out hypotheses about group differences in various diverse settings. When several studies have been reported, a reasonable conclusion can often be drawn even if all of them are biased one way or another. It helps with such interpretation if the research worker reports what kinds of biases he thinks his sample may represent. Another problem in comparing groups is making sure the tests or measurements used are suitable for the purpose. Intelligence tests have often been criticized in this connection. They were developed expressly for the purpose of comparing each person with the others in the group to
which he belongs. An eight-year-old can be compared with other eight-
year-olds because we can make the assumption that all these children have
had an approximately equal opportunity to develop the mental skills the
test requires. All have been to school for at least two years. All have seen books, heard radios, gone to movies. When we shift over to a comparison of the averages of different groups of children, there is a basis for considerable doubt as to what the differences mean. We cannot immediately conclude that one group is brighter than the other. The difference may
represent some discrepancy in the opportunity they have had to develop
these mental qualities. The complexity of the problem is increased by the
fact that different varieties of intelligence test—even different types of questions within the same test—do not correlate perfectly with one an-
Research Strategies
47
other, so that some may be affected in one way, others in another, by whatever influences differentiate the groups we are comparing. This basic doubt as to what group differences in intelligence test scores and similar “measurements” mean has led some psychologists, sociologists,
and anthropologists to the conclusion that we would be better off to give up completely any attempt to use such tests for group comparisons. However, the fact that we already have the results of hundreds of such studies “in the record,” so to speak, and that they are constantly being cited by writers and speakers bent on proving such and such a point, suggests that it might be wiser to analyze what they do show than to try to suppress them. There are by now so many studies comparing boys with girls, Negroes with whites, and high-status with low-status groups, that it is possible to draw much sounder conclusions from the sum of them than could have been drawn from any one alone. Instead of phrasing the question, “Do these groups really differ from one another in intelligence and other mental traits?” we can ask simply, “What do the well-documented differences between groups on mental tests mean?” Then we can proceed
to pull together all the pieces of evidence that may enable us to answer the question. A demonstration that two or more identifiable groups in the population differ significantly with regard to some measured ability or person-
ality trait should constitute the beginning of a research program of related studies through which the meaning of the difference can be clarified. Un-
less this supplementary work is carried out, the report that a difference between groups exists is without much practical value. It may even lead to unwise or harmful policy decisions on the part of persons who do not understand its limitations.
The second main type of group comparison, setting up special groups on the basis of some experimental procedure, and then analyzing various ways in which they differ from one another, has many applications. It has been used extensively in the development of measuring devices, especially achievement tests, personality inventories, and attitude scales. If, for example, an investigator wishes to construct a scale to measure
radicalism-conservatism, he may first collect a set of items he thinks are related to this trait, and then administer the collection to a suitable group
of subjects. Assuming that his initial evaluation of the general import of these items was sound, he can use the scores on this try-out inventory as
a basis for selecting a group of high-scoring subjects and a scoring subjects, usually about the top 25 per cent and the cent of the distribution. He then tabulates, item by item, persons in these two groups gave. Any item on which these
group of lowbottom 25 per the responses tabulations do
not distinguish between high scorers and low scorers is thrown out. Thus the attitude scale is “purified” of extraneous elements and made into a
more accurate indicator of whatever it is that it measures. (The apparent
48
The Field of Differential Psychology
ambiguity of the last clause is deliberate. When this method is used, the
resulting test or scale can only be as valid as the investigator’s first judgment about what its items have in common. It is always advisable to seek further evidence of validity before resting important theoretical formulations on such measurements.) In other research investigations, especially in the field of personality, the groups to be compared are experimentally determined types of persons. For example, in the study by Vogel, Raymond, and Lazarus (1959) on the effects of psychological stress, one of the kinds of comparison the experimenters made was between a group of achievement-oriented sub-
jects and a group of affiliation-oriented subjects. They selected these groups of 20 each by obtaining a variety of kinds of information about motivation from 185 persons and then looking for “pure” cases—that is,
subjects clearly high in achievement motives and below average in affiliation and subjects who showed the opposite combination. Research of this sort, comparing groups selected experimentally on the basis of some initial theoretical hypothesis about individual differences,
constitutes an important methodological development. It is a feature of the increasing convergence of experimental and differential psychology. We shall come back to it in later chapters in discussions of special areas.
DEVELOPMENTAL
RESEARCH
Another way of increasing our knowledge about the sources and significance of human differences is to trace them back to their origins in childhood or to follow their vicissitudes through the adult years. Developmental research began with cross-sectional studies, comparison of differ-
ent age groups at one point in time. But it was soon apparent that if in 1950, for example, one compared the performance of ten-year-olds and
twenty-year-olds, he would not get unambiguous
evidence about the
changes associated with this ten-year developmental span. He could not be sure that the 1950 ten-year-olds would in 1960 be acting like the 1950 twenty-year-olds. The processes of history and social change, changes in educational practices, technological innovations such as television, for example—all these things make for variations from period to period in the development of individuals.
Thus the emphasis has been placed increasingly on longitudinal studies in which the same persons are observed at successive ages. The most dependable evidence we have about how intelligence develops and changes in children and in adults has come from such studies. More recently, personality characteristics have been scrutinized in this way. Longitudinal studies enable us to explore individual differences in not
only the rate of growth and ultimate level of development of a trait, but also in the shape of the growth curve itself. Thus gne child may obtain
Research Strategies
49
high scores on an intelligence test while he is a preschooler, drop to an
average position during the grade school years and show a sudden growth spurt at fourteen. Another may start low but show consistent increases each time he is tested. Longitudinal studies have their own hazards and difficulties. One can
use as subjects only persons or families who are willing to cooperate for a considerable length of time. Thus certain kinds of persons usually do not get studied by this method—the ignorant, the geographically mobile,
the antisocial. The inevitable loss of subjects along the way may change the character of the sample one starts with, introducing unknown biases into the evidence from which general conclusions are drawn. The research design and measuring instruments one decides upon at the beginning often limit what can be done at later periods when the advancing knowledge has made available more satisfactory techniques. Nevertheless, these systematic long-range programs of research on the same individuals, such as Terman’s study of gifted children, and the infancy-to-maturity studies at the University of California and at Fels Institute have produced
a rich harvest of knowledge about human lives—a harvest obtainable by no other means.
Cross-sectional developmental studies have also been useful in several ways. They have led to hypotheses about the origins or causes of observed differences between persons, hypotheses which could be tested by longi-
tudinal or experimental research. For example, Gordon’s (1923) report about the increasing intellectual retardation of successive age groups of canal-boat children in England led to many kinds of research on environmental influences that inhibit and facilitate mental growth. In collecting
evidence about the construct validity of a new test, it is often enlightening to compare two different age groups for which differences are hypothesized. The study of human development and the study of individuality are linked together in an especially close way. Development is basically
an individual phenomenon. SPECIAL PROBLEMS—OBTAINING REPRESENTATIVE SAMPLES In attempting to gather evidence on the kinds of research questions that have been outlined many problems have arisen, and we have gradually worked out acceptable ways of solving them. Perhaps the most funda-
mental of these is the problem of sampling. It is essential that the consumer as well as the producer of research data understand just what this
problem is. It is obvious when anyone begins to consider the matter that the pronouncements of psychologists about such things as, for example, the differences between males and females in dominance, the intellectual level
50
The Field of Differential Psychology
of ten-year-old children, or the vocational interests of engineers are not based on a thorough study of all the individuals in the class they are describing. No one has ever given any test to all the 90 million males and 90 million females even in this country alone, to say nothing of the rest of the world. No one has tested all the ten-year-old children or all the engineers. What assurances have we that the sample we have tested is typical of all the rest? If no attention is paid to this at all, subtle kinds of bias are introduced
into the conclusions we draw, and this bias may vary from one study to another. Persons who are working with children aged six through fourteen often obtain a fairly adequate sample of the population by accident, since our compulsory school laws insure that practically all the children within the age range will be in school. While no single grade school would be completely typical of all schools in the community, the state, or the nation, a combination of several of them in different geographical locations can often be used for research purposes. But with older or with younger populations, the problem of obtaining an adequate sample is far more difficult. Even at the high-school level, many students have left school to
go to work. Unless we seek them out and test them along with the rest, our generalizations about adolescent characteristics will be in error to an unknown extent. Particular care must be taken not to generalize to the
rest of the population from studies of college subjects, since college students are a selected group, both brighter and economically better off than the average. There is no one organization to which one can turn for representative samples of the adult population. Neither the luncheon club nor the labor union is typical of the whole world of adult men. We cannot find all the kinds of women we should like to study in a Ladies’ Aid Group, a PTA meeting, or a Business and Professional Women’s Club. A group of Negroes in a little southern town where policies of repression and discrimination have been applied for generations is not typical of the whole Negro race. But neither is a group of Negro children brought up under highly favorable educational conditions by parents who through unusual ability and determination have been able to lift themselves far above the general level. If a graduate student sends out questionnaires to 1,000 peo-
ple and 532 of them are returned, nobody knows just what kind of sample those 532 constitute. There is obviously some psychological difference between persons who cooperated and persons who did not. One important question that a student must learn to ask is, “On what sort of sample of the population are these reported results based?” Technical means are now available for solving the sampling problem in
a completely satisfactory manner. our statistical reasoning is related the names of all persons living in round discs so that they could be
The mathematical concept to which all is the random sample. If we could take the United States, write them on little thoroughly mixed up, place them in an
enormous hat, and then, blindfolded, draw out one name after another, we
Research Strategies
51
could secure a random sample of the U.S. population. Needless to say, such a procedure is impractical. Fortunately, we do not often attempt to
draw conclusions (at least in quantitative form) for the whole U.S. population, so that it is not really necessary either. But it constitutes a sort of mathematical ideal which other sampling methods approximate as nearly
as they can. The essential feature of random sampling is that any one individual in the population from which a sample is drawn has exactly the same chance of being included as another. It is in the field of public-opinion research that the greatest effort has
been made to develop practical methods for obtaining samples that represent the population adequately. Most of us are aware that, in spite of some embarrassing exceptions, in general these polls give much more accurate results than they used to in years gone by. Many special techniques for obtaining representative samples have been invented. For example, each part of the country can be divided and subdivided until the pointer falls
on a certain address in a certain block on a certain street. The interviewer goes to this place and asks his questions about soap or politics of the person who answers his knock. A reasonable substitute, much easier to work out, is the stratified sample. One first studies the census reports which show the proportions of different income groups, different age groups, males and females, farm dwellers and city dwellers, Republicans and Democrats, Easterners, Westerners, and Southerners, in the population. Then he selects the right number of individuals in each category and thus puts together a group which, in the aggregate, will have exactly the same proportions of all these characteristics as the whole population does. In this way a few thousand will accurately represent a hundred million. In studies using mental tests and other kinds of measurements that re-
quire a considerable amount of time from each subject, it has not usually been possible to be as careful and thorough about the sampling as the public-opinion pollsters are. Each study in the field of individual differences constitutes a unique challenge to work out some original way of making the sample to be studied as representative as possible. For questionnaire research, follow-up letters after the first appeal is made can
often serve to increase the response very markedly. Toops (1926) in a classical study of this sort found that six follow-up letters, each using a different kind of appeal, brought 100 per cent replies in a study where response to the original questionnaire was only 52.7 per cent. Psychologists in Scotland in 1935 and again in 1947 gave individual intelligence tests to a completely representative sample of one age group by testing every child who had been born on February 1, May 1, August 1,
and November 1, of a certain year (Scottish Council for Research in Education, 1939, 1949). Jones and Conrad (1933) gave free movies in order to draw in practically the whole population of the New England villages in which they were working. They then made home visits to obtain data from the individuals whose scores were still missing, thus including in their final
52
The Field of Differential Psychology
sample about 90 per cent of the total population of the place within the desired age range. Enough ingenious approaches to the sampling problem are now on record to serve as suggestions and sources of ideas to researchers launching out into new and unknown waters. If we were to pay attention only to studies that have been based on adequate representative samples, a book on differential psychology would be a very thin volume. Fortunately, if we have enough different research reports to draw on, we can make use of much information that has come from patently nonrepresentative samples. By considering the results from several such biased groups simultaneously, we can often come up with a reasonable conclusion that accounts for them all. If, for example, a certain kind of sex difference shows up in separate studies of ten-year-old children in one locality, college men and women in another, and husbands and wives at a PTA meeting in still a different spot, we are led to the conclusion that, at least in our culture, this is a sex difference not peculiar to the kind of group we happened to test. Or, if correlations of about the
same magnitude between motor skill and intelligence are reported by all investigators whose subjects are mentally retarded children but not by those whose subjects are of better than average intelligence, this combination of facts makes possible a meaningful conclusion. Furthermore, even findings about limited groups may have a great deal of practical usefulness. If there are important differences between highschool boys and high-school girls, that fact will have implications for education, whether or not the differences would be found in males and females generally. What we find out about the relationships between separate abilities in mentally retarded children can be useful in testing them, educating them, and placing them in employment whether or not we can expect to find such relationships in other groups. We must not generalize beyond our results. On the other hand, we must make use of everything we have. Some knowledge is better than no knowledge at all, and a conclusion with the weight of probability on its side is much better than complete ignorance.
What can be said with certainty about this problem of representative sampling is that it must always be kept in mind. The person doing research needs to concentrate on obtaining as satisfactory a sample as possible, considering the practical limits within which he operates. The
person reading, evaluating, and applying research conclusions must take into consideration all the information he has been given about the group or groups upon which results were obtained.
SPECIAL PROBLEMS—SEPARATING “CAUSES FROM EFFECTS
.
Neither the correlation methods nor the group-difference methods automatically tell us anything about the causes of the differences between in-
Research Strategies
53
dividuals. Experience has shown that we must be constantly on guard against jumping to conclusions about causation from such evidence. Take,
for example, the low positive correlation which has consistently shown up between socio-economic level and IQ. This may mean, as some have contended, that the more favorable environments produce more intelligent individuals, that is, that the socio-economic condition is the cause, the
IQ the effect. But it may just as easily mean that more intelligent individuals are more
successful in the competition for this world’s goods,
that is, that IQ is the cause and socio-economic status the effect. Causal factors may be working in both directions, that is, the IQ may to some
extent determine the economic level, which in turn may influence the IQ. Still another possibility is that some third variable such as education is
actually the causal factor and that the apparent relationship between IQ and socio-economic level arises from the fact that they are both related to this “something else.” The point is that there is no way we can extract from the correlation coefficient itself decisive information as to which of these hypotheses is correct.
Many psychologists realize this ambiguity in the causal interpretation of correlations, but fail to recognize similar with differences between groups. Suppose children known to have been weaned early emotionally than those known to have had
pitfalls when they are dealing it is found, for example, that are significantly more unstable a longer nursing period. Does
this prove that early weaning produces or causes neurotic tendencies? Not necessarily. It is quite possible that both the early weaning and the emotional difficulties in the children are caused by neurotic tendencies in
their mothers, leading them to reject unconsciously the responsibilities of motherhood. The children may have inherited such neurotic tendencies,
or they may have reacted to many other evidences of them besides the early weaning. Again the point is that such a study as this simply cannot tell us what the causal relationships are.
Problems of causation are especially complex and intricate, as many philosophers have pointed out. In one sense, everything in the universe is the cause of each event which occurs. In another sense, nothing can be known with certainty to be the cause of what happens since all that we can ever observe is some invariable sequence of the type: Event A is followed by Event B. Observations never show the link between them. What we have are correlations, coming to us without any guarantee that the relationships they show will always be maintained. For practical purposes, however, we can and certainly do isolate factors which appear to exercise a determining influence on succeeding events. We mix certain chemicals and an explosion takes place. We predict when an eclipse will occur. We change our tariff laws, and certain economic consequences appear. We deny our child the evidences of our affection which are rightly
due him, and he becomes refractory. We administer the proper treatment, and the sick man recovers.
The Field of Differential Psychology
54
It is the time factor characterizing these situations that makes it possible for us to refer to one as the cause of the other. Whether we say that the child’s crying is the cause or the effect of the spanking that he gets depends on which comes first. It is this time factor that we must get into our experiments in differential psychology if we are to explore causes. The independent variables must be introduced prior to the time we measure the dependent variable. The experimental method requires that we: (1) measure, (2) introduce the new factor or factors, and (3) measure again. If we wish to know, for example, whether vitamin-B deficiency has an unfavorable effect upon school achievement, the thing to do is to test a representative group of children, put them on a diet deficient in vitamin B, and test again at the end of the experimental period. We might, of course, proceed in the opposite way by testing a group of children known to be deficient in vitamin B, putting them on a diet rich in this substance,
and then testing them again. R. F. Harrell (1943, 1947) has in fact carried out an excellent study on this problem using an adaptation of this plan. In order to make such studies in time at all conclusive, however, some
supplementary steps must be taken. In the example given above, how do we know that improved scores on the second test are not simply practice effects? How do we know that they do not reflect some of the innumerable other influences to which children are exposed at home, in school, on the playground, or at the movies? How can we be sure that it is the nutritional factor rather than some of these others which has brought about the change?
The customary way of handling this difficulty is to use a control group. Subjects in this group are selected in exactly the same way as those who are to take part in the experiment. In some research designs, a control subject is paired with each experimental subject in respect to age, race,
sex, IQ, and other characteristics that might influence results. Only the
experimental subjects are exposed to the influence whose effect is being
investigated. The question at the end of the experiment is then, “Do the
experimental subjects differ from the controls?” In Harrell’s vitamin study, only half the orphanage children who were subjects were given the sup-
plementary rations. All were
tested before and after the experimental
period. Since they had all been exposed to the same general environmental
influences curing that time, the difference between the treated and un-
treated groups could be definitely tied in with the vitamin supplementa-
tion.
The use of a control group in an experiment is a universally recognized essential of scientific procedure. Our problems in psychology have centered around the difficulty of making experimental and control groups
truly comparable. To pair subjects is one method, but it is hard when we
are investigating a new kind of trait to be sure that we have paired them for everything that may be related to it. Investigations. of the effects of
Research Strategies
55
counseling, for example, have run into the difficulty that if a control group is set up by matching a noncounseled student with each student who
voluntarily seeks a counselor’s aid, the two individuals in each pair will not be alike in the characteristic
most
crucial for counseling
success,
namely, motivation for change or improvement. If persons in any experimental group think that they are being given special help or attention, increased
motivation
may
lead
to more
improvement
in performance
than individuals in the control group show, no matter how carefully they have been equated in the first place.
There is no single best method to overcome these control-group dif_iculties. Whenever it is practically feasible, randomization in the choice of individuals for the experimental and control groups should be carried out. That is, names or numbers of all persons available for the experiment
should be placed in one pool and assigned to the separate groups by tossing a coin or using a table of random numbers. Whenever it is possible, both experimental and control groups should be given some treatment that appears to be the same, so that no subject knows whether or not he is being exposed to the special experimental influence. In the Harrell vitamin
study, for example, each child received an identical-appearing capsule each day. Not even the personnel of the orphanage knew which capsules contained the extra nourishment. It is always important when tests are to be given and scored that the examiners be kept in ignorance of which subjects are in the experimental and which in the control groups. Hard as they
may try to be objective, examiners and raters tend to slant their judgments
slightly in the direction of what they hope will be the outcome of the experiment.
With the rise of analysis of variance methods, which permit compari-
sons between more than two groups at a time, problems very difficult to attack by the old methods have been brought under experimental scrutiny. There are numerous problems in psychology for which it appears to be impossible to isolate the effects of one variable alone, controlling every-
thing else. It is in just such instances that complex experimental designs
based on analysis of variance are most helpful. (To maximize the student’s confusion, such research plans in which the effects of several independent variables on a dependent variable are examined simultaneously are called
factorial designs, though they have absolutely nothing to do with the factor-analysis methods for analyzing correlations. They grow out of quite different statistical soil. In spite of the similarity in the labels, it is neces-
sary that one keep them separate in his thinking.) Besides making possible research on problems where causal factors cannot be unraveled and examined one by one, the experimental designs based on analysis of variance have another advantage. By setting a study up in this way, the investigator obtains considerably more information for the same expenditure of time, money, and effort. It would be quite
56
The Field of Differential Psychology
possible, for example, to plan a vitamin experiment in which one used the
same group of subjects to test out the effects of as many as six or eight
different kinds of treatment. Such a study would be planned so that a few subjects would get vitamin A alone, a few B, a few C, a few D, and so on through the vitamin alphabet. Some would get a combination of A and B, some A and CG, some B and D, and so on through all possible combinations. At the end, the total amount of variation in test gains would be broken down into the parts associated with the different kinds of treatment, and the statistical significance of each treatment determined. Instead of answering one question, the experiment would have been made to answer several. If it should happen that vitamin B supplementation improves mental functioning only when accompanied by increases in vitamin C intake, this research plan would enable us to find this out, whereas simple comparisons of experimental and control groups might never have brought it to light. These combination effects are what is meant by the term interaction among variables. In view of the fact that controlled experiments make it possible to draw conclusions about the causes of individual differences that cannot be drawn from correlational investigations, why are they not universally used in research on these problems? The answer is that in a great many important areas of human life it is not practically feasible or ethically justifiable to manipulate conditions in order to discover what the results will be. It is necessary that workers in some fields of knowledge, if they are to be cultivated at all, use less powerful tools. Careful observation of “natural experiments” and thoughtful study of relationships between variables in different groups and under different conditions will always be indis-
pensable in the human sciences. Kagan and Moss (1962, p. 4) have commented on this point and emphasized the special value of longitudinal studies of development as a substitute for experiments.
Many aspects of personality development are not subject to experimental manipulation. Aggressive children can not be transferred to loving homes; mothers can not be told to adopt a pattern of reinforcements so that the psychologist can have an aesthetically pleasing design. A longitudinal investigation, however, might be viewed as a substitute for the powerful strategy inherent in experimental manipulation—a halfway house between the correlational and experimental investigation. One can hypothesize antecedent-consequent relations, and assess, through continuous observation of the mother and child, the validity of the prediction. It is only through a combination of all these research methods that we can
hope to build up a dependable body of knowledge to draw upon ‘in our efforts to maké*wise decisions about individual human social policies.
lives and about
Research Strategies
57
SUMMARY
Research in any specific area of differential psychology usually begins with the identification or postulation of a trait and a demonstration that measurable differences between individuals with regard to it can be found. From here on there are three general methods
of procedure—correlation,
differences between groups, and developmental observation. Correlational studies are of many varieties. Reliability coefficients are self-correlations obtained by correlating a set of scores with another set
based on the same measuring instrument administered to the same group. Validity coefficients are of several kinds. Concurrent and predictive validity both involve correlating scores with criterion measures of the trait in question. Construct validity rests on the relationship of scores to other variables as they are suggested by some comprehensive theory. Factor
analysis is a method for analyzing a number of correlations simultaneously in a search for the basic variables involved in all of them. In using group difference methods, existing groups in the population, such as males and females, may be compared. Caution is necessary in interpreting the findings because of the possibility that one’s samples may be biased or the measuring instrument not equally appropriate for the groups. In another variety of research on group differences one selects the groups to be compared on the basis of some experimental situation set up in accordance with some theoretical hypothesis. Developmental studies are of two kinds—cross-sectional and _longi-
tudinal. While longitudinal studies have been more productive, crosssectional comparisons are also. useful, especially in suggesting hypotheses to be tested by other methods.
In carrying out research on individual differences, the investigator tries to secure as representative a sample as possible of the population in which he is interested. Statistically, a random sample is the ideal, but because of practical difficulties in achieving this, various methods have been devised for selecting individuals in such a way that the proportions of the sample
falling into various subgroups—age, income, sex, and so forth—will be the same as they are for the total population. In interpreting the results of studies that have been made, selective factors in the samples studied must always be taken into consideration. In analyzing causes and effects, an experiment of some sort is necessary because time relationships must be manipulated. The control group for such an experiment must be carefully chosen if results are to be meaningful. It is through a combination of these research methods that a useful body of knowledge accumulates.
‘
0! oe
a
“ony
4m
a
es
ae, BE Aes heh AY: HLS 7 i tasas£
thre ver
G0 Sy ri] try hata
i.
Stn
al
_
*
Part Two
MAJOR
DIMENSIONS
INDIVIDUAL
OF
DIFFERENCES
CHAPTER
4
Individual Differences in Intelligence For MANY YEARS the psychology of human differences was essentially the study of intelligence. After Binet demonstrated that a human trait of major importance could be measured, and American military psychologists showed that adults as well as children could be classified by such measurements, the ground was prepared for rapid development of many varieties of intelligence test. Psychologists proceeded for a time as though these differences in intelligence were the only differences between human be-
ings that had any relevance to decisions that must be made about them. When this assumption proved unsound the methods used in constructing intelligence tests were applied in constructing tests for other abilities and personality traits. Out of each attempt. to construct an intelligence test or to use an existing one in a new situation came an increment of new knowledge about intelligence, the abstract quality itself, as it operates in human affairs. In one sense we can see the whole body of work on intelligence measurement, covering almost a century if we consider Sir Francis Galton’s con-
tribution as its beginning, as a huge construct validation project, not yet completed. But certainly we can now give a more precise answer to the question, “What is intelligence?” than could have been given in 1950, 1930, or 1910. It was not realized until fairly recently that in the study of psychological
differences, clear and precise definitions of a trait to be measured follow rather than precede research on it. Early mental-testers attempted at the outset of their work to define intelligence. But it soon became apparent that there was a good deal of disagreement among them. Some definitions emphasized adaptability to new circumstances; some focused on abstract-ness and complexity; some considered that facility in the use of symbols was the essence of the trait. The general term “learning ability” was often used as a synonym for intelligence, but it never constituted a really satis-
factory definition. While many psychologists defined intelligence as a
62
Major Dimensions of Individual Differences
unitary trait, others were convinced that it must be considered as the sum or average of a great many separate abilities. The thing that saved psychology from bogging down in a mire of semantic confusion was the predominantly practical orientation of mentaltesters. Binet thought deeply and wrote wisely about the meaning of in-
telligence, but the tests that he developed justified themselves not so much by this “thinking about thinking” as by the success with which they identified mentally deficient children in schools. From his time on to the present, test development has been geared to practical problems. [logical as it seemed at first, psychologists found that it was not necessary to define intelligence in order to measure it. Experience in two world wars and many research undertakings showed that men with quite different theories
about the nature of intellectual activity could work together amicably on test-construction projects. The underlying aim was to produce tools that people could use to make with more precision the judgments about individual mental capacities that they were already making on some basis. Out of this procedure and in accordance with a point of view that be-
came very popular in science during the 1930’s came the so-called “operational” definition of intelligence—“intelligence is what these tests measure”
(Boring, 1923). Logically there are some difficulties with this approach. An intelligence test, if we consider its construction as well as its administration, is hard to describe in terms of a clearly definable set of operations, and no two tests involve exactly the same ones. The thinking that psychologists did along these lines, however, was of considerable value. It clarified the distinction between intelligence, the broad and somewhat
ambiguous term of common speech, and “intelligence,” the narrower, more limited trait with which tests were concerned. Although a psy-
chometrist thoroughly familiar with tests such as the Binet and the Wechsler might not be able to give a simple definition of the trait measured, he did have a fairly clear conception of what it did and did not include. In practical situations the increasing clarity and precision with which we could describe “what our tests test” constituted real progress. The varieties of research we have discussed in the previous chapter have all been brought to bear on the problem of intelligence. We shall now consider in some detail what each of thesé approaches has contributed to our understanding of what individual differences in this trait mean.
DEVELOPMENTAL
RESEARCH
One obvious fact that gave psychologists a means of attacking the
intelligence-testing problem is that in an absolute sense children become more intelligent asthey grow older. With the best teaching in the world the average five-year-old will not master counterpoint nor the average tenyear-old symbolic logic. What Binet and his successors tried to work out
Individual Differences in Intelligence
63
was a pool of items, questions, and tasks that sampled mental abilities typical of the various age levels. Any task of an intellectual nature that can be evaluated and scored has been considered a suitable item for intelligence testing if it can be shown that older children are significantly better at it than younger children. Intelligence as measured in children is first and foremost a matter of developmental level. Thus if we plot total score on any such group of items against chronological age for a representative group of children, we obtain a rising curve
often referred to as a mental-growth curve. For example, the Otis QuickScoring Mental Ability Test for children in the primary grades gives us the curve shown in Figure 11. We can see at a glance that older children get
150 140 | 130 120 = 110 & 100 = 90 | 80 SCORES TEST 70
60 | 50 ae
40
Se
sot emer
FIGURE 11 Graph Showing Average Scores of Successive Age Groups on Otis Quick-Scoring Test (Alpha, 1939)
higher scores than younger ones. The exact nature of the relationship between age and intellectual capacity cannot, however, be evaluated from such a diagram. The trouble is that we have no information as to the meaning of
‘the units in which the test scores are plotted. Is each question the equiv-
alent of every other question? Does the difference between scores of 50 and 60 have the same meaning as the difference between 90 and 100? We do not know. Thus the shape the curve should take is not determined.
64
Major Dimensions of Individual Differences
If we use the mental-age scores usually obtained from Binet-type in-
dividual tests as our units, we still are in no better position to describe the course of mental growth in children. For a test standardized in this
way, the average achievement of a representative group of children at a given age becomes the standard. Thus for each change in chronological age, the standardized test results show us exactly the same amount of change in mental age, as long as we are considering group averages rather than individual scores. For this reason, the “curve” of mental growth appears always to be a straight line like that shown in Figure 12, up to the
lu
o < —_ ras Zz Lu =
3:
FIGURE
(Ae
5s
62
7 6226510, et ieeeyo CHRONOLOGICAL AGE
ars
142.15
12
Graph Showing Average Mental Age for Each Chronological-age Group on Any Mental-age Scale
age at which intellectual
maturity is reached. It still does not tell us anything about whattthe real course of mental development is like. : During
an earlier period of mental testing a number of psychologists were interested in finding some statistical techn ique that would get around these difficulties and enable them to plot a curve that would really picture
Individual Differences in Intelligence
65
the course of mental development in children. It is quite obvious that this should not be a straight line indicating the same amount of change each
year from early childhood to maturity. Any observation of the way children change as they grow older shows that a year makes more difference in the younger ones than in the older ones. The difference between the problems and tasks that can be mastered by average five-year-olds and by average six-year-olds, for example, appears to be far greater than the difference between the abilities of thirteen-year-olds and fourteen-yearolds. Several mathematical procedures for what is called “absolute scaling” of intelligence tests have been worked out. (An absolute scale is one that starts from zero and proceeds by equal steps to its highest value.) It is not
necessary that we go into detail about these scaling procedures and the mental-development curves they generate. It has become apparent as time has passed that this whole search for a universal mental-growth curve was an unprofitable undertaking. Various assumptions had to be made as a basis for the mathematical treatments that were given the scores, and these are now seen to be untenable, or at least unprovable. Several lines of research have led io the conviction now generally held that mental-growth curves are of doubtful validity. One has to do with differences in the patterns of the curves obtained using different varieties of test item. Figure 13 illustrates this point. The curve for the maze test rises rapidly and reaches a plateau at about eleven. The curve for vocabulary rises evenly and slowly. At one stage in the history of mental testing, research workers believed that these differences in rate of improvement on different kinds of task were not too important, since each specific task was thought to be only an indicator of the general and innate quality we call intelligence. The factor-analytic studies we will turn to later have shown that the relationships between kinds of test material are much more complex than this, so that we cannot consider them interchangeable indicators of one general ability. Thus we are not justified in piecing together a single over-all growth curve from these specific curves of different shapes. It seems now that if there are such things as general laws of mental development that can be expressed as mathematical functions of age, they are more likely to be separate equations for separate processes than a single equation for the process as a whole. A second reason for abandoning the search for a universal mental-
growth curve is tied up with our increasing awareness action between
native capacities and environmental
of the inter-
influences.
If we
think of a general mental-growth curve as a way of portraying the natural development of pure native capacity, we know now that it cannot be achieved even as an abstraction. At every stage, development itself depends upon the opportunities for learning available at that stage. Later development is always an outgrowth of what the interaction of orig-
Major Dimensions of Individual Differences
66
10 9 8 i
6
5 SCORES 4
52
FIGURE
62
7-2
82-
9-2
10:2 11-2 AGE
12:2713:2
14-2—'52
13
Age Trends on Two Subtests of the Wechsler Intelligence Scale for Children (Wechsler, 1950a)
inal capacity and learned changes have made of the person up to that time. This becomes especially clear when we consider a specific question that has stimulated much discussion and controversy among “growth-curve” thinkers: “At what age is the development of intelligence completed?” Early test-makers, basing their judgments on their standardization data, chose sixteen as the point where increases with age ceased. Many users of the tests became convinced that fourteen was nearer to the true figure. As more different special groups were compared, it became clear that intelligence-test scores increased with age beyond fourteen if
schooling continued but remained constant or declined slightly in groups no longer in school. R. L. Thorndike (1948b), for example, showed that
average scores for 1,000 students increased consistently year by year up to the age of twenty-one and one-half. P. E. Vernon (1951) reported an
analysis of scores made by recruits of different ages in the British armed services. Decline in average score set in earlier for those in nonintellectual jobs than for those in intellectual jobs. The effect of this longer period of mental growth in persons remaining at school was clearly demonstrated in a study by Lorge (1945). He went back to the records of 131 boys who
as eighth-graders.in 1921-22 had been given a number of psychological tests. Twenty years later he gave them the Otis intelligence test. For subjects whose initial intelligence level was the same, the later score varied
Individual Differences in Intelligence 67 according to the amount of schooling. Those who had gone to college averaged considerably higher than those who had dropped out during the high-school years. The numbers in most of the subgroups were small, but the trend was unmistakable. Husen (1951) showed that the same sort of
relationship held in Sweden. Such findings make it appear unlikely that we shall ever be able to give a single answer to the question, “At what age age does mental growth cease?” We shall always have to say, “That depends.” Another source of dissatisfaction with generalized growth curves has been the constantly accumulating evidence that growth is an individual matter and that curves based on group averages tend to mask more than they reveal. One of the special questions about which controversy and
research have centered is, “How constant is the IQ?” Carefully analyzed results from several child development centers have produced a complex answer to this simple question. Practically speaking, there are a number of reasons why a child’s ob-
tained IQ may vary considerably from year to year, even if his intellectual status has not changed. One is the fact already mentioned that different tests do not draw on exactly the same kinds of ability. Even when the same measuring instrument, such as the Stanford-Binet, is used on different occasions, the items on which his score depends may not tap exactly the same aspects of intelligence. Nonverbal tests have a greater influence on scores at the lower age levels; educational deficiencies become more of a handicap at the upper age levels. Another problem in evaluating IQ
constancy is that variability differs for different tests, or even for the same test at different age levels. This can be true even when the test has been
standardized so as to give an average IQ of 100 at every age. An example will perhaps make this effect clear. If a six-year-old takes a test for which the standard deviation is 10 IQ points in the standardization group, and three years later takes another test for which the standard deviation is 16
IQ points, an IQ of 148 on the second test is actually the equivalent of an IQ of 130 on the first. On both occasions
the child has scored three
standard deviations above the mean, at or near the top of a normal distribution. What looks at first like a considerable improvement in IQ is only a statistical artifact. There has been no real change at all in intellec-
tual status relative to his age group. Pinneau (1961) made a thorough study of the differences in the variability of the distribution of Stanford-Binet 1Q’s in different age groups, differences that made it appear that individual IQ’s are less constant than they really are. On the basis of his suggestions, a new index of brightness was used in the most recent revision of the Stanford-Binet Test (Terman and Merrill, 1960), one that retains the same meaning from age to age. Very often teachers and clinical workers are called upon to make inferences about the course of an individual’s mental development from
68
Major Dimensions of Individual Differences
what the record tells them about his scores on different tests given at successive periods of his life. To do this they must make allowance for the two sources of error we have discussed, the fact that different tests do not measure exactly the same aspects of intelligence, and the fact that some distributions are more variable than others. Unless one has some definite information about these two matters it is probably better not to try to interpret a series of IQ’s. After we have allowed for these sources of error, however, we find that there is apparently some real fluctuation in intelligence from age to age. Some children become brighter as they grow older, some become less bright in comparison with their age-mates, and some move up and down on the intelligence scale in an apparently random manner. Changes that
frequently occur do not by any means cover the whole IQ range. The probability that a sixteen-year-old is in the first grade classmates will be
six-year-old retarded child will develop into a gifted negligible, but there is a real possibility that a boy who appears to be only slightly above the average of his leading his class when he reaches high school.
One principal source of our knowledge about these IQ changes is a study that has been going on at the University of California for a long period of time. Forty children, representative of the Berkeley population
(considerably above the national average in mental ability, however) were followed through from infancy to adulthood, with tests at frequent intervals. Reports by Bayley (1949) and by Honzik, Macfarlane, and Allen
(1948) threw considerable light on the problem of IQ constancy.
The
findings can be summarized under a few principal headings. Most of them were later corroborated by results from other less extended investigations. In the first place, infant tests, those given during the first year or year and a half of life, are useless for predicting later intellectual status. It is a curious fact that the correlations of first-year tests with later intelligence measures, though very close to zero, tend to be negative rather than positive. The persons destined to reach the highest ultimate level average slightly lower in scores reflecting rate of early development than do those who will later not reach this level. This negative correlation is so slight, however, that it is not worth speculating about. The important point is
that indices of the rapidity of infant development give us no clues at all from which we can predict later IQ. (This generalization does not hold for
extremely feeble-minded children or for those with gross organic: defects. An idiot who makes no progress at all during the first few months of life may be recognized as abnormal long before he reaches the age when valid predictive tests can be given.) ; The second general finding is that the degree of relationship between intelligence tests.given at different age levels depends upon both the age at first testing and the length of the time interval between tests. Figure 14
illustrates the way in which correlation with a later test rises as both these
69
Individual Differences in Intelligence
AGE AT 1.Q. 7WITH CORRELATION
5S
20
2500
3 0ee 3:5 7 4:0) 4s AGE AT FIRST TESTING
5.0.
0:0
6.0
FIGURE 14 Correlations of Preschool Tests Given at Different Ages with Stanford-Binet Intelligence-test Scores at Age Seven (Honzik, 1938)
factors are changed. A test given at two has very little predictive value. One given at four has considerably more. If later test scores are related to those obtained at the age of six or older, correlations of .7 or .8 are the rule. Six, the customary age for entering school, seems to represent a sort
of turning point. From this age on there is enough IQ constancy to give intelligence tests definite predictive value, at least over limited periods of
time. Husen (1953) reported test-retest correlations of .7 or higher for a number of Scandinavian groups. Bradway and Thompson (1962) reported
a similar pattern of correlations from a follow-up study of subjects used in the standardization of the 1937 Stanford-Binet test.
The third important finding, much more evident in the later California studies than in those reported earlier, is that even a dependable correla‘tion of .8 leaves room for marked fluctuations in individual cases. Honzik,
Macfarlane, and Allen (1948) showed that it is possible for a change of as
much as 50 IQ points to occur during the school years. Changes of 30 or more points were noted in 9 per cent of the cases, changes as great as 15
70
Major Dimensions of Individual Differences
points in 58 per cent of the cases. Only 15 per cent of the California group showed less than 10 points of IQ change. While a change of 15 to 20 IQ points is not great enough to lift a person from the “normal” to the “very superior” category or to drop him from “normal” to “retarded,” it is enough to make an appreciable difference in the evaluation of his potentialities that teachers and others are likely to make. As explained earlier, some of these reported IQ shifts are explained by differences in the variability of
the IQ distribution at different age levels. The Stanford-Binet test (Form L) has a standard deviation of 12.5 points at age six and of 20.0 points at age twelve, according to Terman and Merrill’s standardization data (1937). But even when all IQ’s were transformed into standard scores to rule out this source of variation, much of the fluctuation from age to age still remained. This variation in growth curves from individual to individual has become apparent wherever longitudinal studies have been undertaken. Several of these long-range studies have been set up at institutions in various parts of the country. Some of them have been in operation for
many years. Kagan (1964) has provided a useful summary of the design and objectives of ten of them. Not all are concerned primarily with in-
telligence, but data having to do with IQ change have been reported by several. Ebert and Simmons (1943) reported on a group of 181 children who were tested at regular intervals from the age of three to the age of ten. Changes of ten IQ points or more occurred in about half the cases. These children (mainly from superior socio-economic levels) were more
likely to gain than to lose. Hilden
(1949) reported on a group of 30
Colorado children who were tested annually from early childhood to maturity. Variations in individual scores from time to time ranged from 7
to 46 IQ points. Hilden cited some evidence that such changes could not
be accounted for by practice effects alone, and that a person’s final IQ could be predicted more accurately from the highest IQ he obtained before the age of twelve than from the average of all his scores up to that
time.
The California investigators made a special effort to identify influence s in individual lives that might help to account for IQ changes. Case studies of children with unusually regular or unusually irregular growth trends do show that there is a tendency for irregularity to go with life histories characterized by unusual variations in disturbing as against stabilizing factors. The connection is far from clear, however. Some persons with disturbing experiences show very stable mental growth trends. The most clear-cut relationship the California study demonstrated is that between a child’s final level of mental development and the educational level of his family. The-ckild from a well-educated family is more likely to increase than to decrease in IQ as time passes. The correlations between parents’ and children’s intellectual status become higher as children get
Individual Differences in Intelligence
Al
older (Bayley, 1954). Such findings fit in with those already cited, the Lorge study (1945), for example, which show that test scores are related to educational influences. Another longitudinal study carried out at the Fels Institute in Ohio
(Sontag, et al., 1958) focused particular attention on the question of what kinds of tend to intervals greatest
children tend to increase their IQ’s over the years and what kinds decrease them. Growth curves for 140 children tested at yearly from three to ten were ranged in order from those showing the increase to those showing the greatest decrease. Then the children
in the top and bottom quarters of this distribution of IQ changes were selected for special study. One interesting difference between the groups
was immediately apparent. In the “ascending” group, boys predominated; in the “descending” group, girls. When the information available in the case folders was examined, certain personality differences between “ascenders” and “descenders” showed up. Ascenders had been rated higher for such traits as independence, aggressiveness, initiative, and competi-
tion. Results of the projective testing corroborated
these differences
(Kagan, et al., 1958). The results suggest that children with an active, independent approach to the world are likely to grow intellectually at a rate faster than normal, whereas passive, dependent children tend to develop at a slower than normal rate. In spite of the qualifications brought to our attention by the longitudinal studies, a mental-test score is as good an indicator as it ever was of the level a child has already reached in his intellectual development. As such it is an enormously useful tool. Perhaps the cautions recently expressed
with regard to the IQ will lead us back toward a greater emphasis on the mental age, or some statistical equivalent, as a way of emphasizing present status rather than permanent endowment. Those responsible for the guidance of children need to realize that a single intelligence test can
never be used as a basis for a definite judgment about what a child will be able to do several years later. Each new decision, at successive stages of development, calls for a recheck. Although extreme changes occur only very rarely, changes from “average” to “superior” and vice versa are relatively frequent. We must remember, however, that we do not know how to produce such changes in an individual, and that the older he is the less likely it is that a marked shift will occur. To seize on the evidence
accumulated in mental-growth studies as proof that anyone can be a genius if he wants to (or his parents want him to) is fully as unwarranted as to cling to the belief that a person’s general level of intelligence is inalterably fixed for all time by the age of six. The fact that the IQ is not
completely constant does not make it completely meaningless. Besides their implications for practical judgments that must be made in the schoolroom and in the clinic, these facts we have been discussing are
important in planning and interpreting other research. Whenever
the
744
Major Dimensions of Individual Differences
effects of some special influence are to be determined—vitamins, teaching methods, foster homes, or play therapy, for example—it must always be remembered that many children show marked increases in IQ without any identifiable special treatment at all. Therefore the study must be designed to show that in the experimental group either the average shift in
an upward direction is greater or a larger number of individuals show upward shifts, than in a comparison group not exposed to the influence being
investigated. Too often a few extreme cases showing a striking amount of change are cited as evidence for the effectiveness of a certain method of treatment. Taken by themselves they prove nothing, since we know that such extreme cases occasionally occur regardless of circumstances. Logically a complete discussion of the relationship of intelligence meas-
urements to age requires a consideration of early and later maturity as well as childhood. When large groups of adults first became available for testing at the time of World War I, psychologists were struck with the fact that the curve of mental development from the early twenties on appeared to be a falling one. The older a group was the lower its average turned out to be, and this decrement with advancing years became
more
and
more noticeable throughout middle and old age. As psychological work with adults continued, however, the true relationships were seen to be more complex. The pattern or organization of abilities shifts with the years, and some kinds of capacity show much greater age differences than others. As results of longitudinal studies on the same individuals at different ages became available, the meaning of the group differences pre-
viously found became
still more
doubtful.
Able
subjects
tested
on
different occasions did not show the decline during their forties that the group difference studies had led us to expect (see Chapter 11). Since all
these findings can be brought together more clearly after we have taken up the subject of the patterning of mental abilities, the detailed facts about age trends in adults will be presented in a later chapter rather than here.
CORRELATIONAL VALIDITY
RESEARCH—PREDICTIVE
If we were to rest our conclusions about what intelligence tests measure on evidence with regard to their predictive validity, our verdict would be that they are primarily tests of “scholastic aptitude,” or what it takes to succeed in school. From the beginning, intelligence measurement has been more or less closely tied in with school situations. The judgments teachers
naturally make abqut the relative brightness of individual pupils has’ con-
stituted a readily available criterion by means of which test items could
be evaluated. If the teachers’ judgments were accurate and infallible, we
should of course need no tests for children. But if, on the other hand, our
Individual Differences in Intelligence tests showed
V3
no relationship to these judgments,
we
should
certainly
question their validity. What we would expect to find, and what we get when we try it out, is a moderately high but far from perfect correlation between teachers’ judgments and test scores. One thing that the research with tests has shown is that the variation in intellectual level in any one age or grade group is much greater than
the average teacher assumes it to be (Cook, 1947). In a typical schoolroom where no grouping on the basis of ability has occurred, the range of mental ages is five years at the primary level, six years at the intermediate level, and eight or more years at the secondary level. When we put test scores into mental age terms we find that the dullest child in a sixth-grade class may be functioning at the level of an average nine-year-old, the
brightest at the level of the average fifteen-year-old. School assignments requiring that a child understand abstract terms or reason about complex processes are easy enough for those near the top of this group, but for those at the bottom they may be completely meaningless. The correlation between measures of general intelligence and grades given for school achievement, though it is only moderately high, is remarkably consistent over the whole range of school situations. Either individual or group tests chosen so as to be suitable for the age group where they are used regularly correlate from .4 to .6 with school marks. Various qualifications can be appended to this statement. Tests calling for verbal reasoning tend to give higher correlations than those of the nonverbal or performance type. Predictions of grades over long periods of time
are not nearly so accurate
as predictions
over
short
periods.
Some
school subjects are more closely related to measured intelligence than others are. But even when we consider these complications and the variation they produce in the size of the reported correlations from study to study, the general consistency of the correlations from first grade through graduate school constitutes impressive evidence that our tests are revealing some general intellectual factor upon which success in school depends. Correlations of this magnitude are of considerable value in making predictions that will help students chart their courses. Examination of Figure 15 shows us that while we cannot hope to predict very accurately just what grade-point average any individual student will make, we can determine the range within which his grades are likely to fall and thus answer various specific questions that may arise. It is plain, for example,
that the majority of students with stanine ratings of 1, 2, or 3 do not achieve the grade-point average of 2.00 or higher that the university requires. The great majority of students with stanine ratings of 8 and 9, on
- the other hand, show averages above 2.5 and thus probably qualify for special honors programs. About students in the middle ranges with stanines of 4, 5, and 6, less definite statements can be made. It appears that they are much more likely than not to achieve the 2.00 minimum, but
Major Dimensions of Individual Differences
74
1.50 | 1.00.
AVERAGE POINT GRADE TERM 1st
0.50
0.00
Sa Lig 2h
sae
ORO
aos
2
STANINE RATING OHIO
FIGURE
PSYCHOLOGICAL
EXAMINATION
15
Scatter Diagram Showing Relationship of Scholastic Aptitude Test Scores to College Success for 589 University of Oregon Freshmen (r = .43) a fair proportion of them attain honors level, and a few fail completely. One of the things that keeps correlations between intelligence and scholarship from being any higher than they are is that failure can occur
at all levels of brightness. Figure 15, for example, shows that one of the students with a stanine of 9 made a GPA of less than 1.00, and GPA’s at
or near zero went with stanines ranging all the way from 2 to 7. Some reasons for such outcomes are obvious. Success in school calls for effort
and participation in the work of the class, and bright students as well as dull ones can be lacking in these essentials. It is a curious fact, however,
pointed out by Fisher (1959), that in predicting all sorts of criteria, nonadaptive or inadequate forms of behavior can be predicted more ac-
curately than good or superior performance. One possible explanation may be that the behavior of the adaptive, functioning organism is so complex that it is only under circumstances creating some unusual limitation, as in the case of school demands too complex to be mastered bya
person of a certain1 degree of intellectual complexity, that we can oieine it with any accuracy at all. Figure 16 is Fisher’s graphic fepresca ier of the “twisted pear” phenomenon. When instead of grades based on teachers’ judgments, scores on tests of
Individual Differences in Intelligence
75
o
=
a
As)
go)
ise S) = < es oc Oo Ts or uw oO
z S) ina
a a 3
i
BS ©
no)
4
i=
oO
z
Poor
FIGURE
Average PREDICTION SCORES
Good
16
Schematic Model of the Twisted Pear Phenomenon in Prediction
(After Fisher, 1959)
school achievement are correlated with intelligence-test scores, somewhat higher coefficients are usually obtained. Correlations reported between
group intelligence tests (more dependent on reading skill than individual tests) and standardized measures of school achievement often run as high as .8. This fairly close relationship between intelligence, especially as evaluated by means of group tests, and school-achievement tests, has at
times led psychologists to conclude that intelligence tests were nothing but tests of schooling. It should always be remembered, however, that within any group made up of individuals who have had equal educational opportunities, whether it be a| group of first-graders or a group of graduate students, there are marked individual differences in both variables—measured achievement and tested intelligence. Equal education does not tend to eradicate these differences. Thus the test score would seem to reflect
76
Major Dimensions of Individual Differences
something more basic than the influence of schooling. There are individual differences in the capacity for profiting by education, and it is these differences that intelligence-test scores reflect. Long-term predictions from intelligence-test scores also lend some sup-
port to the conclusion that the tests measure basic educational aptitude. A number of studies have shown that if school attendance laws are such
as to permit students to drop out after their fourteenth or even their sixteenth birthdays, intelligence tests given in grade school will predict with a fair degree of success how far up the educational ladder different students will go. Those who drop out at the ninth-grade level average lower
than those who reach the twelfth grade. Those who attend college average higher than those who stop with high-school graduation. It is useful for anyone who must interpret test scores to know something about the intellectual requirements of the higher educational levels. Studies by Embree (1948) and by Wrenn (1949) indicated that the average
Stanford-Binet IQ for college entrants was 118, for bachelor’s degree recipients 123, and for advanced degree recipients 126. Persons receiving Ph.D.’s averaged 141. A more recent summary of evidence from a number
of separate studies
(Plant and Richardson,
1958) concluded
that for
college students as a whole, the average IQ on the Wechsler test would be 120. For freshmen the average would be 116. All these reports stress the fact that there is much variation in the groups represented by these
averages. The range of IQ’s for degree recipients in Embree’s sample was from 95 to 180. In a supplementary study he showed that colleges vary widely in their intelligence requirements. In some, the average IQ of the student is as low as 100, in others as high as 133. In Wrenn’s study, 10 per cent of those ultimately receiving Ph.D’s scored below the average of entering freshmen at the colleges they attended. Thus the interpretations we make must always be in terms of probabilities. It is unlikely that a boy
with an IQ below 100 will be able to graduate from college. It is improbable that a person with an IQ below 125 will succeed at a first-rate graduate school. In making such judgments we must always keep in mind also the qualifications already discussed with regard to IQ constancy over long periods of time.
Intelligence tests show consistent, dependable relationships to occupa-
tional level as well as to educational level. We are accustomed to rank
jobs on a prestige scale with the professions at the top and unskilled labor
at the bottom. This ranking is not identical with what it would be for in-
come or for social utility, but it is made by various groups of people quite consistently (Deeg and Paterson, 1947). Ball (1938) in 1937 determined
the rating on one of these standardized occupational-level scales fon each of 219 men who-had taken a group test of intelligence as children in 1918 or in 1923. For the 1923 group, who were the younger ones at the time of
the follow-up, the correlation between test scores and occupational level
Individual Differences in Intelligence
77
rating turned out to be .57. For the older 1917 group, it was .71. This would suggest that there is some tendency for individuals to gravitate
toward an occupational level in keeping with their measured intelligence. Results of the tests given to large numbers of men in the Armed Forces
during both world wars pointed in the same direction (see Chapter 13).
The professions, probably because they require long periods of advanced education, rank highest in test scores. Business and white-collar occupations rank next highest, then skilled labor, then semiskilled labor, and finally unskilled labor at the bottom. Needless to say, here too there is a great deal of variability within groups. Some unskilled laborers actually score as high as any of the professional men.
These relationships with educational level and with the aspects of occupational placement that depend upon schooling are the clearest evi-
dence we have as to what intelligence tests are measuring. But they in turn require clarification before we can glibly characterize the tests as measures of learning ability. What is it about learning that depends upon intelligence? Do the bright learn more rapidly than the dull, do they keep
on learning longer, or do they learn different thingsP These are urgent questions when we wish to use tests for such purposes as the selection of
workers. For a job requiring a preliminary training period, is it advisable to choose applicants with the highest score? Just what does “learning ability,” often used as a synonym or euphemism for intelligence, mean? Fortunately there has been enough research centered around these issues so that we can differentiate between what intelligence tests do show and what they do not. In the first place, if what we mean by learning ability is the rapidity with which a person improves with practice on any motor or intellectual skill, then we can say quite definitely that intelli-
gence tests do not measure it. The most complete evidence on the point came from a series of studies by Woodrow (1938, 1939, 1940) in which a group of students were given a number of practice periods on a variety of different tasks. Before and after this series of practice trials they took intelligence and special aptitude tests. The analysis of the correlations
showed that there was no one general learning ability accounting for improvement on all the tasks. Some subjects made faster progress on one, some on another. Thus there was no basis for an identification of intelligence with general learning ability. Furthermore there was no significant relationship between any of the scores representing gain with practice and intelligence. In a later study, Woodrow (1946) analyzed correlations between IQ and gains from year to year in the scores obtained by school children on standardized achievement tests. In general, these results also . Showed almost no relationships between gain and intelligence, although the period from fourth to fifth grade did produce a few significant cor-
relations. Another study done by Simrall (1947) showed that even when the types of material the subjects worked with in practice periods were
78
Major Dimensions of Individual Differences
highly similar to the types of material in the intelligence test, gains during practice were still not significantly related to test scores. Such findings fit in with our common observation that average and dull students often progress as rapidly as bright students in football, automobile driving, accordion-playing, or using an adding machine. During the 1950’s and 1960's a special kind of experimental research has
produced some evidence about the nature of the relationship between
measured intelligence and learning ability. This is the work on programmed learning—the so-called “teaching machine.” This evidence is not entirely consistent. For example, some studies, like that of McNeil and Keisler (1961), report sizable correlations between the amount learned through automated teaching and intelligence. Others, like that of Porter
(1959) report near-zero correlations between measured intelligence and amount learned. Stolurow (1960, 1961) has most thoroughly discussed this
problem—the way in which intellectual characteristics of the learner are related to various aspects of his performance in a programmed learning situation. While some parts of the picture are not yet clear, most of the findings seem to fit in with Woodrow’s conclusions cited above. Neither the amount gained nor the rate at which it is acquired show any consistent relationship to measured intelligence. There may be differences, however,
in the type of program and the type of reward most likely to facilitate learning in persons of different intelligence levels, and there may be limits as to what can be taught by means of any program to persons below some minimal level. The McNeil and Keisler study, for example, was an attempt
to teach molecular physics to first graders. Perhaps this subject matter is just too complex and difficult to be mastered by the duller children under any program. If intelligence tests do not measure “learning ability,” how do the con-
sistent and fairly high correlations between IQ and school achievement come about? Tilton (1949) has called our attention to another factor that must be considered when we speak of “learning ability.” School success in-
volves not just increasing skill in the performance of simple tasks but continuous progress from the simple to the more complex. In arithmetic, for example, we are not content to have children practice, year after year, the
simple addition of two-place numbers. If we were, we should probably
find that the dull child showed as much improvement as his brilliant classmate. But what we do in our schools is to lead students on from addition to subtraction, multiplication, division, fractions, decimals, and square root. The more rapidly a child’s mental capacity is growing the better he is able to keep up with the constantly increasing complexity of what is
to be learned. The child with an IQ of 80 is handicapped all through
school not becauseé-he is slow or inept at learning things which are within
the capacity of all the children at his age level, but because he is never ready to grasp new and more complex ideas at the time when they are
Individual Differences in Intelligence 79 ordinarily presented to children of his age. Tilton’s study (1949) shows that one obtains substantial correlations between intelligence and gains in school achievement if this difficulty factor is allowed to operate. He obtained a correlation of .49 between intelligence rating and gains on a
history test by omitting from the test all the easier items, those answered correctly by 45 per cent or more of the group at the beginning. It seems then that if a test is designed so that a person must learn the more difficult things in order to improve his score on it, the advantage goes to persons
with higher IQ’s. The fact that gains from fourth to fifth grade were correlated with IQ in the Woodrow study (1946) cited above becomes intelligible from this viewpoint. The achievement test was one designed for the fourth grade and up. Thus it was undoubtedly more difficult for the fourth-graders than for any of the other grade groups. At the level where it was difficult, correlations between intelligence and gains appeared.
Another study by Tilton (1953) showed that at the fourth- and fifth-grade level gains in all the school subjects were positively correlated. The same
difficulty factor may be involved in a more recent study by Tempero and Ivanoff (1960) which showed that scores on the Cooperative School and
College Ability Test were correlated with gains as well as with end-of-theyear
achievement
scores
in
various
courses
after
a
television
cor-
respondence study program. In general, the correlations with gains were lower than those with achievement, but for one course, beginning algebra, the r was .50 for boys, .49 for girls. It may be that the euphemism “slow learner” is not really an accurate
characterization of the dull child. “Slow developer” would be closer to the true state of affairs during the elementary-school period. If he seems to have taken two years to master what his brighter classmates mastered in one, this is not because he learned more slowly but because it took him longer to reach the level of mental development at which these things could be learned at all. This change in interpretation fits in with the fact, quite familiar to teachers, that at the high-school and college ages which correspond to the leveling-off period in mental growth no amount of time spent by the dull on the same materials which the bright grasp with ease seems to produce mastery of them. There-probably is a fair proportion of the adult population who are incapable of understanding integral calculus, Platonism, or international finance. One hesitates to be overly dogmatic about such a negative conclusion, however, since a change in the way problems and materials are formulated, organized, and presented sometimes reduces the level of complexity enough to bring them within the range of much more limited minds. To develop ways of doing this is a constant challenge to educators, in and out of schools. Much of the current research on programmed learning has this explicit purpose, and evidence is accumulating that a good program makes it possible for persons of limited intellectual ability to learn concepts and principles that they
Major Dimensions of Individual Differences
80 would
probably have been
unable
to grasp
under
techniques (Stolurow, 1961). It is possible, also, that there are different ways of cepts and principles and that intelligence is related difference in procedure. Osler and Fivel (1961) studied in groups of average and superior children at the six-,
ordinary
teaching
learning new conto this qualitative
concept formation
ten-, and fourteenyear levels fourteenand tenthe at group IQ high year levels. Among the in the found they than learners sudden of n they found a larger proportio very the that mean s to difference ed the average groups. They interpret s formation hypothesi of process a g by intelligent children were proceedin and testing, whereas the less intelligent were simply accumulating stimulus-response associations. Osler and Trautman (1961) put this interpretation to a test by presenting the average and superior children with a variety of stimulus materials of such a nature that persons proceeding by means of hypothesis testing would be thrown off the track, as it were, by irrelevant characteristics. As the experimenters predicted, the bright children actually made more errors under these circumstances. Around the kinds of relationships we have been considering can be grouped a large number of miscellaneous studies reporting correlations between adult scores on intelligence tests and a variety of criteria. Tests correlate with occupational level, but not with degrees of success within an occupation. (See Wells, Williams, and Fowler, 1938.) In the military selection and training programs, tests correlate with grades given by instructors, which probably depend somewhat upon grasp of abstract concepts, but not with more “practical” criteria. (See Jenkins, 1946). That this is not simply a matter of “book learning” is suggested by H. A. Smith
(1949) who
found that intelligence
was
correlated
with
gains on
a
standardized biology test in both an experimental group taught by the use of films and a control group taught in the customary way. It seems to be clear, then, that there is no simple way of characterizing the relationship between measured intelligence and learning, but it is possible to get rid of a number of minconceptions about it. In school or out, intelligence tests cannot be expected to tell us how quickly individuals will “catch on” or how much they will improve their performance if the task is one they are all clearly capable of doing. Tests do provide an index of the level of complexity and difficulty in the manipulation of symbols to which any individual may be expected to advance under ordinary circumstances, but the research on programmed learning is sug-
gesting that it may be possible to break down complex symbolic processes
into smaller steps and thus bring them within the grasp of less intelligent
persons. Finally, intelligence tests may be related to the manner in which individuals learnerather than to the amount or the speed of learning. We will consider the question of qualitatively different stages of intellectual development in more detail in a later section of the chapter.
Individual Differences in Intelligence
8]
One practical conclusion can be emphasized. We should never underestimate the learning ability of persons at the low end of the IQ scale. Some of the research that has been done with the mentally retarded as subjects will be discussed in a later chapter, but it is well to remind our-
selves at this point that such persons can learn things within their range of mental ability very effectively, and there is a good deal of evidence that this range is broader than we once considered it to be. VARIETIES OF INTELLIGENCE—THE ANALYSIS OF RELATIONSHIPS BETWEEN TESTS Studies of mental growth and of the relationship of test scores to school success have taught us much about the meaning of individual differences in measured intelligence. The other principal pillar upon which our understanding of intelligence tests rests consists of research on the rela-
tionships between various intelligence tests. The idea that each person is endowed with a fixed quantity of mental ability, and that it will show up however we choose to measure it, has faded with the years. Mental organization has turned out to be vastly more complex than the early mental-testers suspected. Several kinds of evidence force us to recognize that intelligence is neither a single unitary quality nor a simple summation of separate, unrelated traits. Let us examine this evidence. The first type of results which bear on the problem consists of correlations which have been obtained when both verbal and performance tests
of intelligence have been given to the same subjects. If the individuals in the group are all of approximately the same age so that large differences
based on maturity level alone are ruled out, the correlations between the two varieties of test seldom run higher than .5 or .6. Gaw’s (1925) study on children of about thirteen found correlations of .41 for boys and .49 for
girls between Binet IQ and scores on fourteen unselected performance tests. Verbal and performance halves of the Wechsler-Bellevue test correlate .67 with each other when used with representative groups of adult
subjects comprising the whole intelligence range (Wechsler, 1950b). For the Wechsler Intelligence Scale for Children, the reported correlations between verbal and performance sections are .60 at age seven and one-
half, .68 at age ten and one-half, and .56 at age thirteen and one-half. In general we can say that the correlations between verbal and per-
formance tests are of about the same magnitude as the correlations between verbal tests and school marks. (Performance tests characteristically show a somewhat lower correlation with measures of school success than
' verbal tests do.) In interpreting both correlations we recognize that only a part of what is being measured is a common
trait represented by the
scores we have correlated. Verbal intelligence is not identical with performance
intelligence.
Neither
is identical
with brightness
in school.
Major Dimensions of Individual Differences
82
but it is only There is a common core of something underlying all of them, others. the in ed contain not ents ingredi a core. Each has also some is not a Another signpost pointing to the conclusion that intelligence corhighly are which test of types some that unitary trait is the finding to extent the in greatly differ od childho during related with one another vocabu, example For illness. or age ng advanci by which they are affected lary is an excellent indicator of general intelligence in children, as it correlates highly with most other types of intellectual activity. If a single test must be given to a child in order to ascertain the mental level at which he is functioning, a vocabulary test is more satisfactory than any other.
But in adults past middle age and patients suffering from brain injury and schizophrenia, vocabulary is not closely related to various other as-
sessments of intellectual level (Wechsler, 1950b). Performance tests show
more impairment of mental functioning in such cases than do verbal tests; memory tests show more than information tests; analogies items show more than comprehension items. There are many more such differences. In order to account for them we must assume some degree of independence in the functions measured. If intelligence were a single unitary quality it would decline as a whole. Another striking demonstration that intelligence is not a unitary quality is provided by the so-called idiots savants, feebleminded persons with one highly-developed talent of some sort. This may be mechanical aptitude, musical talent, proficiency in arithmetic, phenomenal memory, or marked
skill in drawing or painting. Of recent years, since tests have been available, it has been possible to make thorough studies of such persons
so
that actual documentation rather than just hearsay evidence testifies to the enormous discrepancy between the low general level of ability and the marked skill along some special line. Scheerer, Rothmann, and Goldstein
(1945) reported on one of these children whom they studied intensively between 1937 and 1943. In 1937 this eleven-year-old boy, L., was brought to these writers by
his mother, for neuropsychiatric
and psychological
consultation.
The
complaints about L. summed up to this: he could never follow the regular school curriculum like a normal child, or learn by instruction. His general
information was alarmingly substandard; he had made progress in only a few school subjects, and even in these, his achievements were very limited. His motivational and behavior peculiarities had been an early concern of
his parents. He had never shown interest in his social surroundings or in normal childhood activities. On the other hand he had always excelled in
certain performances. %
The first impression on meeting L. is that of an erratic and hyperkinetic child, driven by an urge to keep in constant motion. He seems to be governed by an ever recurring impulse to move all four fingers of each hand rapidly in a definite beat, rubbing them against the thumbs (in a snapping-like
Individual Differences in Intelligence
83
motion without the snaps). Alternating with extreme inattentiveness, selfpreoccupation and restlessness he displays a friendly poise and stereotyped politeness, as when responding to or addressing people. Most of the time L. appears motorically or otherwise self-absorbed and socially aloof. However,
he shows one unique interest in his human surroundings—an amazing phenomenon exhibited in the first minutes of the examination. Spontaneously the boy asks each of us, “When is your birthday?” Given the date, he answers
in a fraction of a minute, “Dr. G.’s birthday was on Saturday last year and Dr. S.’s birthday was on Wednesday.” A glance at the calendar proves him correct. We call others to the scene, and with amazing swiftness, L. gives correctly the day of the week of every person’s birthday. Moreover, he can tell at once exactly which day of the week a person’s birthday was last year or 5 years ago, and on what day it will fall in 1945, etc. More closely examined, L. proves capable of telling the day of the week for any given date between about 1880 and 1950. Conversely, he can also give the date for any given week-day in any year of that period, e.g. the date of the first Saturday in May 1950, or of the last Monday in January 1934, etc. As much as we
could determine he makes no mistakes in his calendar answers. Though L. unquestionably takes delight in the recognition of his feat, he never seems aware of its extraordinary character in the same sense as a normal person (e.g., the reader of this, if he could master such a task). On the other hand, it is known that, since his seventh year, he had developed a persistent in-
terest in the birthdays of everyone he meets. For some time he has been surprising people he met only once by volunteering their birthdays “on sight.” This, of course, happened to the writers on many occasions. In conjunction with this specific memory he almost inevitably will know the day and date of his first visit to a place and usually the names and birthdays of all the people he met there. He never fails to look for the date when he sees a newspaper, which otherwise does not interest him in the least. (Scheerer, Rothmann, & Goldstein, 1945).
The authors go on to describe other aspects of L.’s peculiar talents; his impressive skill in remembering and manipulating numbers without any general superiority in arithmetic, his excellent spelling ability, but lack of knowledge of or interest in the meaning of the words, his interest in opera and ability to play by ear coupled with a complete inability to profit from
musical instruction. His IQ on the Binet test was 50. As has what the facilitated deal with
been explained in the previous chapter, our understanding of complex interrelationships among tests mean has been greatly by a statistical technique called factor analysis. It enables us to large numbers of correlation coefficients at the same time and
to erect mathematically a structure that serves to account for the varying sizes of these coefficients in terms of hypothetical factors or abilities re. quired by different tests to different extents. In the case of a simple prob-
lem, it is easy to see without using any mathematical procedures the kind of reasoning that it involves. For example, one correlation coefficient between an arithmetical reasoning test and a reading test does not tell us
84
Major Dimensions of Individual Differences
much about the ability the tests measure.
This correlation could reflect
general intelligence or simply reading skill, since problems must be read to be solved. But let us add to the initial battery of two tests two others— an intelligence test that requires no reading and an arithmetic test that requires no reasoning but only simple manipulation of numbers. Then let us study all the correlations between the four tests and we may be able to decide between the different possible hypotheses. If they all show correlations of about the same magnitude, we shall have to postulate the
presence of some general ability. If the correlation between intelligence, arithmetical reasoning, and reading are all much higher than those between simple arithmetic and the other tests, it will look as though the manipulation of numbers constitutes a separate ability. The necessity for mathematical factor-analytic methods in the carrying
out of this type of thinking about abilities arises because a relatively small number of tests produces a large number of correlations and they cannot all be kept in mind at once. We can manage well enough with four tests and the six correlations we obtain from them, but for twenty tests we have 190 correlations and for fifty tests 1,225 correlations. Factor analysis does part of the work for us and simplifies the material before we attempt to interpret it.
If we remember always that factor analysis is only an extension of the method we find it quite natural to use when we wish to make an inference about mental traits on the basis of correlation coefficients, we may find the whole process less strange and difficult. We will also be reminded of the limitations of the method. As has been explained previously, it does not give us unequivocal mathematical statements informing us what the
basic abilities are. It simply rearranges the information contained in the
correlation coefficients. The psychologist doing the study must still name or identify the factors—name them in such a way that they fit the pattern obtained from the correlations. There is nothing mathematical at all about this naming process. And there is nothing unique about the mathematical solution. Another sort of rearrangement might fit the data just as well.
Thus the factor analyst can only say, “This is one combination of traits
which would serve to account for the relationships we have found between these tests.” Another research worker may propose another set of traits based on equally sound mathematical and psychological reasoning, which will account for the relationships equally well. The choice between them must be made on the grounds of simplicity, usefulness, and con-
gruence with the whole body of psychological knowledge. This is why there are so many arguments among factor analysts and why there is as yet no completely satisfactory account of the way mental abilities are organized.
+
In spite of these limitations of factor analysis as a metho d, however, factor analysts approaching the problem of mental organi zation from very
Individual Differences in Intelligence
1
85
different directions have found themselves meeting on common ground. By now the differences in interpretation are much less striking than the similarities. The most basic of the differences still not completely resolved has to do with types of solution of the factor problem preferred by American and British psychologists, respectively. The British workers were the ones who initiated this line of research.
Since the early years of the century Spearman, and later his students and colleagues, have been working on various aspects of a theory centered around the idea that mental tests all measure to some extent one basic
intellectual ability. In The Abilities of Man (1927), Spearman summarized
a vast amount of significant research. He showed that the intercorrelations for many test batteries containing a wide variety of materials and types of items could be accounted for in terms of the one characteristic he called “g.” To him it seemed to represent the total mental energy available to an individual, while the various kinds of “s” or specific factors in dif-
ferent tests stood for the engines through which this energy was applied. The data showed that “g” is most efficiently measured by items we should ordinarily label “reasoning” tests, where is asked to discover the relationship between two things something from its relationship to something else. For this
questions and the individual or to identify kind of think-
ing Spearman coined the term noegenesis. However, Spearman himself, and others using the methods he developed, encountered some test batteries in which not all of the correlation between certain tests could be adequately accounted for in terms of “g” alone. This seemed to occur in studies where several tests of somewhat
similar content were included in the battery to be factor-analyzed. If there were, for example, two tests of vocabulary, or two tests of the formboard type, the correlations between the two members of each pair were higher than their “g” loadings indicated that they should be. Out of this discrepancy grew the idea of “group” factors representing abilities less broad than “g” but broader than “s.” Thus has developed the hierarchical theory of mental organization. A clear statement of this rather complex theory as to what intelligence
consists of can be found in The Structure of Mental Abilities by P. E. Vernon (1950). What the theory means is illustrated in Vernon’s diagram as reproduced in Figure 17. We can apply this kind of theory both to tests and to persons being tested. If it is tests we are classifying in accordance with the system represented in Figure 17, we would evaluate them first
with regard to their “g” loadings. (The factor loadings, derived from the correlations, answer the question, “How necessary is the ability under consideration for success with this test?”) After this we can sort them out into two principal categories according to whether they require in addi-
tion to “g” the verbal-educational abilities important in all kinds of school work (v:ed) or the practical knack of understanding concrete things im-
Major Dimensions of Individual Differences
86
G
a MAJOR GROUP FACTORS
V:ED
K:M
MINOR GROUP FACTORS
even | FIGURE
17
Diagram Illustrating the Hierarchical Theory of Mental Organization (Vernon, 1950, p. 22)
portant in various mechanical jobs (k:m). We may if we wish make a still finer classification of tests by further subdividing the group that falls into each of the two main categories. Within the “v:ed” group, separate verbal and numerical abilities can be distinguished and tests of course differ in the extent to which they draw upon them. Within the “k:m” group, spatial and mechanical abilities can be separated. It is doubtful, however, how useful these finer differentiations of ability are. Vernon presents statistical evidence that in the school, military, or industrial situations where applied psychologists work, the relevant criteria can be predicted fairly well by using only the “g,” “v:ed,” and “k:m” ratings. The other narrower group factors contribute so little to the total variance in test and criterion scores that they can safely be ignored. Specific factors, including such things as temperamental and character traits, background and experience, as well as specific talents and aptitudes,
are of more importance in job situations than are the abilities at the minor group-factor level in Figure 17. Moursy (1952) presented evidence for the
suitability of the hierarchical scheme in accounting for correlations among
twenty tests for a group of ten- and eleven-year-olds. The point of view of the British factor analysts can be summed up in
this rule: try always to keep the pattern of abilities you are postulating as simple as you can. Measure “g” first and account for as much of the test
variance as you can in terms of “g” alone. Supplement this with the meas-
urement of broad educational and practical abilities. Separate out naxrow factors of lesser seope only when you need them in the solution of some special research or personnel problem. In America L. L. and T. G. Thurstone, in an important series of publica-
Individual Differences in Intelligence
87
tions beginning in the 1930's, became the principal spokesmen for a dif-
ferent point of view. The question they raised was, “Why must we necessarily postulate any general mental ability at allP Would it not be
possible to account for correlations between tests in terms of group factors alone, factors which inevitably overlap to some extent?” To put their idea
into common-sense terms, it is easy to conceive of five numerical tests that
correlate with one another simply because they all require an ability to manipulate figures, not because of “g.” But one of them may also correlate with a reading test because the problems to be worked have to be read. Another may correlate with a test calling for the sorting of geometrical figures into categories because in both cases rapid perception of details is involved. Such tie-ups make it possible for all the correlations to be positive even if there is no one ability common to all tests. L. L. Thurstone worked out the mathematical techniques for what he called multiple factor analysis. By these methods it is possible to find a set of separate factors that account for the correlations in a battery of tests. (Remember that no mathematical system can guarantee that this is the only way the
correlations can be explained. Solutions are not unique.) The multiple factor methods have been so successful that they have constituted the basis for the vast majority of American factor-analytical work done since they were formulated.
In his first large-scale study L. L. Thurstone (1938) assembled a battery
of fifty-six psychological tests, including as wide a variety as possible. Some had to do with seeing relationships between geometrical figures in space. Some were concerned with mechanical relationships such as are
found in arrangements of gears and pulleys. Some required computation, some reasoning from syllogisms. The subjects were 240 volunteer college students. Nine “primary abilities” were identified from the tables of factor loadings. Later 1,154 eighth-grade children were given a similar battery of tests in a research undertaking designed to find out whether the same “primary abilities” would turn up in a group that was younger and less
highly selected. Seven of them did (Thurstone and Thurstone, 1941). Still later evidence was presented (T. G. Thurstone, 1941) for the differentiation of six of the same factors in kindergarten children. The primary mental abilities appearing in both college and eighth-grade studies were as follows:
S (space). Visualization of geometrical figures in different positions in space. P (perceptual speed). Quick noting of details. (The interpretation of the loadings of different tests in this factor is somewhat less certain than for S.) N (number). Quickness in making arithmetical computations of all sorts. V (verbal meanings). Grasp of ideas and meanings of words. W (word fluency). Speed in manipulating single and isolated words.
Major Dimensions of Individual Differences
88 M
(rote memory). Facility in memorizing words, numbers, letters, and other
materials. I (induction). Ability to extract a rule common to the materials of a problem or test.
Many other investigators have confirmed Thurstones’ findings for factors V, N, S, and M. The distinction between the two verbal factors V and W was an unanticipated finding, and the meaning of W is still not completely clear. British psychologists have for a long time been interpreting a similar fluency factor they encountered in their studies as a
temperamental rather than an intellectual characteristic (Eysenck, 1952). For both the perception and the reasoning factors, correlations were low enough in these original studies to suggest the existence of several factors
rather than a single factor. Goodman
(1943) noted, for example, that the
average correlation of the various perceptual tests in the Primary Mental Abilities battery he was using with a group of engineering freshmen was
only .36. One of the lines of development most prominent during and after World War II was the breaking down of Thurstone’s “primary” abilities into others more homogeneous and narrower in their scope. If we analyze a battery of tests all of which have something to do with a single one of the primary abilities, we find that this ability splits up into others still more “primary.” Thus Carroll (1941) identified nine verbal abilities in place of
the two Thurstone had reported. L. L. Thurstone (1944a) found ten perceptual factors, eight of them represented in enough tests so that they could be identified with special aspects of perception such as “speed and
strength of closure” cussed in some detail It was a sustained order into the chaos
or “susceptibility to illusions.” (These will be disin Chapter 9.) program of research by J. P. Guilford that brought of partially independent factors that had developed
out of many such analyses. His work with the Army Air Force (Guilford,
1947) had produced evidence for at least twenty-seven identifiable factors representing different aspects of spatial ability, reasoning, and memory. After the war, Guilford initiated a thorough study of cognitive and think-
ing abilities, the Aptitudes Project at the University of Southern California. Year after year he and his associates mapped out separate areas of judg-
ment, evaluation, reasoning, and creative thinking. As the number of separate factors increased, Guilford saw that they could be related to one another in a three-dimensional system analogous to the periodic table of elements in chemistry. Figure 18 shows this system graphically. It indicates that there are three main ways of classifying mental abilities. If we use the kind-of process or operation the thinker performs as the basis
for the breakdown we find that there are five classes: (1) cognition (rediscovery or recognition); (2) memory (retention of what is cognized);
Individual Differences in Intelligence ae
oe
>
89
Evaluation
Convergent thinking
Divergent thinking
Memory, “~ 7
Cognition Units
Classes
”
5 Relations =)
5a oO
Systems
Transformations
Implications
Ac
L
ig
§& ”
§ ”
&ra)
RirQuetes
» iL
as
CONTENTS FIGURE
18
A Cubical Model Representing the Structure of Intellect
(From Guilford, J. P., Personality. Copyright, 1959, McGraw-Hill Used by permission)
Book
Co.
(3) divergent thinking (searching for different ideas or various solutions to
a problem); (4) convergent thinking (processing information in a way that leads to the correct or best answer); and (5) evaluation (reaching decisions as to how correct, or adequate the results of one’s thinking have been).
If we use the contents or material to be thought about as the basis for classifying abilities we come out with the four classes shown at the base of the cube in Figure 18: (1) figural (concrete material, such as sizes, forms, colors, or textures); (2) symbolic (letters, digits, etc.); (3) semantic (verbal meanings and ideas); and (4) behavioral (social situations of various kinds, so far not explored to any extent in intelligence testing). If we use the kind of answer the subject is asked to produce as the basis for our classification, the six classes along the vertical axis of Figure 18
cover the possible forms of response. This system (Guilford, 1959a, 1959b) makes a place for 120 factors of intellect, since all combinations of operations, products, and contents are theoretically possible (5x 4x6). Not all of these factors have actually
90
Major Dimensions of Individual Differences
shown up in factor analyses done so far, but a large proportion of them
have, especially since the formulation of the system has made it possible to design new tests to fit vacant cells. We have the least adequate knowledge of the behavioral class of abilities. While attempts to measure social
intelligence have a long history, no satisfactory technology has ever been
achieved. Guilford hopes that his theoretical system will suggest operations and products to be tried out in measuring abilities in the behavioral domain. Of all the distinctions embodied in the Guilford theoretical system, it has been the distinction between convergent and divergent thinking that has had the most important research consequences so far. Most intelligence tests, until this difference was pointed out, were made up of questions for which there is only one correct answer. When it became apparent that tests could be designed in such a way as to evoke many different answers that could be accurately evaluated, the way was cleared
for research on individual differences in creativity. It is the abilities in-
volved in thinking of new answers and different possible solutions to a problem in which the creative person excels. We shall consider this line of research in some detail in Chapter 15. Along with the increase in the number of “primary mental abilities” and the efforts to organize them in a meaningful way has come an increasing realization that not all these abilities are really independent of one another.
If subjects in a study are scored on the factors themselves, these sets of scores correlate positively. This state of affairs leads to a factor analysis of
factors and the identification of what are usually called second-order factors. When this fact first came to their attention psychologists on both sides of the Atlantic, including Thurstone (1944b), were quick to point out that we had here a basis for “rapprochement” between British and American viewpoints. A second-order general factor might well be the “g” on
which Spearman had been insisting. The fact that Spearman’s methods made it rise to the top first and Thurstone’s picked it up at the bottom last would be more or less immaterial if its existence had been demonstrated
both ways. Subsequent work has complicated this problem by producing evidence for not just one but several second-order factors that often show up when intelligence tests are factor analyzed. In this connection Rimoldi’s (1948, 1951) analysis of scores made on a large number of tests by a group of Argentine school children aged eleven to fourteen is pertinent. Three second-order general factors were indicated. The first of them seemed to be much like Spearman’s “g” in that it showed up most strongly in tests
requiring “noegenesis,” or perception of relationships. The nature of the
other two second-order factors was less clear. ‘ For the practical worker attempting to apply the results of research to the problems he faces in school or industry, the importance of these second-order factors is that they extend and support the idea that has
Individual Differences in Intelligence
91
been prominent since the early days of applied psychology—that abilities are positively correlated and that there is such a thing as general level of intellectual competence upon which special talents and skills are superimposed. A person high in one kind of intellectual performance is quite
likely to be average or above in others. It was thought for a time that the generality or specificity of mental abilities was primarily a function of age, but later evidence has made this
hypothesis doubtful. McNemar (1942) demonstrated that a large general
factor underlay the various problems and materials in the 1937 StanfordBinet test for children, but L. V. Jones (1949) showed that the correlations
could be accounted for just as well in terms of several primary abilities. (Both were probably right. An analysis in terms of second-order factors
would probably have given evidence for a general factor as well as for the separate ones.) The Thurstones (1941) stated that factors were more highly correlated with one another in the eighth grade than in the college group. Garrett (1938, 1946), reanalyzing two previous studies, found higher
correlations between factors for younger than for older children. Studies by Garrett, Bryan, and Perl (1935) and by Asch (1936) seemed to support this conclusion. However, later studies by Curtis (1949), by Chen and Chow (1948), and by Doppelt (1950) indicated that age was not the variable that determined how important the general factor was. The Curtis study pointed to something else instead. Here a representative group of nine-year-old boys and a similar group of twelve-year-old boys were given ten tests designed to measure N, S, and V as well as
“g,” in two different
“”?
difficulty levels. Holzinger’s factor-analysis method which takes out a “g
AapComention (conformity or cultural amenability) vs. Abcultion (abhorring and rejecting cultural identification) . Protension (projection and tension) vs. Inner Relaxation Autia (autonomous, self-absorbed relaxation) vs. Praxernia (incapacity to dissociate feelings of inadequacy) . Shrewdness vs. Naiveté s= OZ & . Guilt-proneness vs. Confidence Factor analyses based on questionnaire measurements offered substantiation for the above factors and added several more:
Q, Qz Q3 Q, Q;
some
Radicalism vs. Conservatism Self Sufficiency Self Sentiment Control Ergic Tension, or Conflict Pressure
Fantasy Tendency
Analyses of objective test results produced fewer good matches for the original source traits and a larger number of new traits than the questionnaire analyses did. It is the questionnaire approach that has been emphasized in more recent work. With the publication of the 16 P F test
built to measure all but the last of the factors listed above (which have
Major Dimensions of Individual Differences
174 been given more
commonplace
names
rather than the picturesque
neologisms), and of similar personality questionnaires
for high-school
students and for younger children (R. B. Cattell and Gruen, 1953, 1954),
this system of organizing variables has been made available for many kinds of research and application. In evaluating the contributions made to our knowledge of personality by these highly complicated and time-consuming factor-analytic investi-
gations, it can be said that while they have not as yet accomplished as
much as they set out to do they have been of considerable value. They have not given us an unambiguous picture of personality structure in terms of which we can describe the chief ways in which one person differs from another. But they have given us new tools and new ideas with which to work. Time will disclose how useful these prove to be.
IDENTIFYING BASIC TRAITS FACTOR ANALYSIS
1. Empirical Group
WITHOUT
Comparisons
There are other approaches to the problem of identifying measurable personality traits. One of these is to assume that different kinds of psychiatric disability represent the extreme ends of distributions covering the normal range, and then to use these distributions as indications of
what some of the important personality variables are. The most widely used personality test based initially on this assumption is the Minnesota Multiphasic Personality Inventory (MMPI). Each of the original clinical scoring keys is made up of items that differentiate significantly between patients with a specified diagnosis and normal persons. One trouble with accepting these as basic dimensions is that they have turned out to have rather high intercorrelations and thus represent fewer separate traits than the number of scores suggests. Comrey made a series of systematic attempts to clarify through factor analytic methods the underlying structure of personality traits represented in MMPI items (Comrey and Soufi, 1960).
His factors have not come into general use as either a replacement of or a supplement to the clinical scales, however. For practical purposes, it does
not seem to matter much whether the traits measured by a test are really separate and distinct from one another. In both the aptitude and the personality domains, tests developed empirically to serve specific purposes often lead to more accurate predictions of complex behavior than do the tests of pure factors.
2. Analysis of Lheoretical Systems
.
Contrasted with both the factor analytic and the empirical techniques
for identifying measurable personality traits is the method of scrutinizing
Individual Differences in Personality
175
some comprehensive personality theory in search of key variables. Freudian psychoanalysis, often used in this way, prompted attempts to measure
“oral” traits
(Goldman-Eisler,
1951;
Blum,
1949;
Blum
and
Miller, 1952) and “anal” traits (Sears, 1943). It provided the initial push
of the far-reaching research on the “authoritarian” personality (Adorno et al., 1950). During the course of their work on anti-semitism and other
varieties of prejudice it became apparent to these investigators that all of these prejudiced attitudes grew out of a common matrix which could be thought of as a personality type. A scale called the F-scale (pre-Fascism)
was devised to measure the personality variable directly. A high scorer on this scale is characterized by: (1) repression rather than awareness of his own unacceptable motives; (2) externalization or projection which leads him to suspect and blame others and to avoid introspection; (3) conventionalism or conformity; (4) an orientation toward others in terms of power rather than love; (5) rigidity rather than flexibility. “Authoritarianism” seems to be independent of “neuroticism” and “psychoticism” since both low and high scores on the F-scale can be found among neurotics undergoing psychotherapy and among hospitalized patients. Vigorous research programs in many places have investigated the relationship of the trait to other aspects of personality and behavior. A trait related to still another part of psychoanalytic theory is often used descriptively by clinical workers in their diagnoses of cases. It is usually called “ego-strength.” The idea is somewhat related to a matter discussed earlier in the chapter, the need for concepts to represent positive aspects of the personality. The ego, as analysts see it, is the part of the person that copes with reality. Some individuals seem to have more
of this coping ability than others do, so that they can endure large amounts of psychological stress. Barron (1953) selected the sixty-nine items from the Minnesota Multiphasic Personality Inventory that were related to success in psychotherapy and decided after inspection of the differentiating items that the scale was measuring ego-strength. By far the most complex and influential of these theory-based systems of personality variables has been formulated by H. A. Murray and his associates at the Harvard Psychological Clinic (Murray, 1938). The theory is a synthesis of concepts distilled from the thinking of Freud, McDougall, Jung, Rank, Adler, Lewin, Allport, and others. They fall into three main
categories: need (a large number of these, each a directional tendency in the person, press (a directional tendency in an object or situation operating upon the person), and thema (characteristic combinations of press
and need). The Murray list of personality needs has been used again _and again by investigators working with all sorts of assessment techniques. The terms n Achievement,
n Affiliation,
n Autonomy,
n Order,
and many others have become part of the basic vocabulary of personality researchers.
176
Major Dimensions of Individual Differences
A quite different organized set of personality dimensions has been derived from a theoretical analysis of the interpersonal aspects of behavior as these are formulated in the writings of Karen Horney, Erich Fromm, and especially Harry Stack Sullivan. While a number of psychologists
have
worked
with
variables
of this sort,
the system
was
elaborated most thoroughly by a research group of the Kaiser Foundation and presented in a book by Leary (1957). There are two principal dimensions, affection vs. hostility and dominance vs. submission. Many other traits are located with reference to these main axes. A circle is used to show these relationships, and a particular person is characterized by the areas of such a circle in which his interpersonal behavior tends to fall. Figure 30 shows what this system is like. The Interpersonal Check List, designed to measure at least the outward and visible aspects of these characteristics, has constituted a useful tool in research projects of many kinds. THE As mentioned
RETURN TO TYPE
CONCEPTS
at the beginning of this chapter, psychologists
pretty
generally turned away from the time-honored typologies for characterizing personality differences and directed their attention toward traits or dimensions instead. It was assumed that typologies were at best inaccurate, at worst downright unscientific.
Then Eysenck attempted to salvage the concept of type by setting up a hierarchical system in which a type is simply a higher-order trait. His idea is illustrated in Figure 31. It is based on the correlations that have
been obtained for all sorts of personality measurements. Specific bits of bahavior show some
consistency with one
another, thus defining what
Eysenck calls the habitual-response level. These habitual responses, in turn, are to some extent correlated, thus defining what we call traits. The
traits too tend to group themselves into clusters which can be cailed types. Much of the confusion and many of the conflicting results coming from various quantitative studies disappear when we think in terms of such an organization. Factor-analytic methods like those used by most
American investigators identify traits first but obtain types as secondorder factors when trait measurements are correlated with one another. British factor-analytic methods locate types first, traits afterward. Ratings based on observed behavior usually stand for personal characteristics at the habitual-response level; questionnaire scores are more likely £9; be concerned with the trait level.
This orderly way of classifying personality characteristics has a good deal of merit. It suggests that eventually we might have such systematic procedures for describing individuals, for example, as the following: .
NAD nn
FIGURE
,
nes
31
Diagrammatic Representation of Hierarchical Organization of Personality (Reprinted by permission of The Macmillan Company from Eysenck, Dimensions of personality, 1947, p. 29) Henry M. is a man with an average amount of general stability or freedom from abnormal trends (type level). He tends to be introverted rather than extraverted (type level). Of the traits related to this type, however, he shows
only shyness and subjectivity to a noticeable degree. In rigidity and irritability he is about average (trait level). Shyness is most marked in social groups involving both sexes and in meeting strangers. In classroom and business situations and on the speaker’s platform he expresses himself without hesitation (habitual-response level).
But as time has passed since Eysenck first proposed this hierarchical
system, it has seemed less and less satisfactory as a basis for research and practice. Perhaps its greatest weakness is the static character of the
concepts. For a person is not only a combination of traits but a process in time. What he is becoming, the direction in which he is going, is inherent in what he is at any one period. This is especially apparent in the case of a child, but the constant movement in time characterizes adults as well.
In order to deal with this aspect of an individual's personality, some psychologists have been returning to the concept of type, but defining it not as the top level in a hierarchy of traits but rather as a direction of
development. The penetrating discussion by Jung in his book Psychological Types (1923) has proved to be a source of fruitful hypotheses. In
the Myers-Briggs Type Indicator (Myers, 1962) these have been developed into a usable assessment technique. We have already considered in
some detail the best known of the Jungian distinctions, that betWeen extraverted and introverted orientations. This difference in the direction of one’s attitudes interacts with differences based on three pairs of contrasting functions. In the Myers-Briggs adaptation of Jung’s ideas, these are: Sensation vs. Intuition, Thinking vs. Feeling, and Judgment vs. Per-
Individual Differences in Personality ception. The
Extraversion-Introversion
179 index
shows
whether
a person
prefers to direct his mental activities toward the external world of people and things or toward the internal world of ideas The Sensation-Intuition index shows whether ceive his world in a factual, realistic way or partly created by his own imagination. The
and personal experience. a person prefers to perto perceive possibilities Thinking-Feeling index
shows whether a person prefers to arrive at decisions by a logical impersonal process or by using personal and interpersonal subjective values. The Judgment-Perception index shows whether the subject prefers to take a judgmental attitude or an understanding, perceptive attitude to-
ward people and situations. The combination of these four kinds of differentiation produce sixteen types. In the research on the Myers-Briggs Type Indicator, interest has centered on the characteristics of groups of persons in each of these sixteen categories rather than on how high or how low the score is on any of the variables one measures in order to determine which of the two al-
ternative approaches to life predominates. summarizes
a large number
The Manual
(Myers, 1962)
of studies in which predictions about the
way in which certain groups in the population would score or behave were to some extent corroborated. The question still remains, as in previous
attempts
to objectify or
quantify the Jungian typology, whether these distinctions really demarcate mutually exclusive directions of development or simply represent the extremes of trait distributions. Much of the evidence Myers presents would be compatible with either trait or type concepts, although some results, such as, the discontinuities and discontinuous regressions discussed in Chapter 9 of the Manual, do argue for a type interpretation. In a later presentation of research results, however, Stricker and Ross
(1964) did not find positive evidence for dichotomous types. So it seems that the question is still open. At any rate, this instrument based on Jung's ideas constitutes a new attempt to identify nonpsychiatric personality characteristics. It promises to be useful in many practical life situations.
THE STABILITY OF PERSONALITY CHARACTERISTICS OVER TIME Underlying all the research on individual differences in basic personality traits is the assumption that such traits are at least moderately consistent from day to day, month to month, or year to year. There has been only a limited amount of research on what we may call the stability
problem, however, not nearly as much as the problem of IQ constancy has generated. During the 1950’s and 1960's, results from several longi-
tudinal studies of personality characteristics were reported. From these it is now possible to draw some limited conclusions.
180
Major Dimensions of Individual Differences
Kelly (1955) reported on a retest during 1954-55 of 176 men and 192 women whom he had tested in the period 1935-38. The original investigation had been a study of 300 engaged couples. The average age of the men at that time was 26.7, of the women 24.7. Thus they were about
40 years old at the time of the followup. Correlations were significantly positive for all the kinds of personality measures used. For values, as measured by the Allport-Vernon instrument, they ranged from .32 to .60.
On the Bernreuter personality test, the correlation for Self-confidence was
.61, for Sociability .46. Correlations
of about
the same
order
of
magnitude were obtained for interests as measured by the Strong test. It appears, then, that for adults after they have reached maturity, scores on
personality tests tend to remain about the same over a 15-19 year period. We can carry the question one step further and ask whether adolescent characteristics are stable. Evidence on this point (Tuddenham, 1959) comes from a followup in 1953 of 32 men and 40 women who had been subjects in the Adolescent Growth Study during the years 1932-39. (These were all the subjects who still lived in the San Francisco Bay area.) In this study ratings made on the two occasions, separated by some 14 or 15 years, were correlated. The original ratings on a large number of traits had been made by staff members at the time of the adolescent study. The followup ratings on the same traits were made by two psychologists each of whom had interviewed the subjects. Of the many correlations computed, 92 per cent were positive and only 8 per cent zero or negative. While the average stability coefficient was only .27 for males and
.24 for females,
a considerable
number
of the coefficients
were
statistically significant and as high as one could expect in view of the un-
reliability of the ratings on which they were based. In another followup based on this same study of adolescents, McKee and Turner (1961) found a number of significant correlations between ratings of basic “drives” made in 1940 and relevant scores on the California Personality Inventory
given during the 1953-59 followup. So it would appear that there is a tendency for personality traits observable during adolescence to perpetuate themselves. Symonds (1961) contributed a little more evidence
supporting this adolescence-adult stability. The followup study covering the longest time period is that carried on at the Fels Institute (Kagan and Moss, 1962). During 1929-39 extensive data were collected on 89 subjects who became members of arr experi-
mental group at birth, using a wide variety of assessment methods. The Personality measures were grouped by periods: I. 0 to 3 years; II. 3 to 6 years; III. 6 to 10 years; IV. 10 to 14 years. Ratings based on these case materials were
then correlated with adult ratings obtained
during a
followup in 1957;-in which 71 of the original 89 subjects participated.
Many of the correlations were significant, especially from Period III on.
Some were fairly high. The most striking findings were in the areas of
Individual Differences in Personality
181
aggression, passivity, and independence. The most interesting aspect of these correlations, however, is the sex differences. In girls passive reaction to frustration is a highly stable characteristic. In boys it is not. Just the opposite tends to be true for aggression and competitiveness, which are stable for boys but not for girls. The authors discuss the significance of this sort of finding in some detail. Apparently a personality trait compatible with the standard sex role a young child must fit himself into is more likely to persist than a trait out of keeping with this role. We shall have more to say about this subject of sex roles in Chapter 10. One more study of the stability of personality traits is worth mention because of the suggestion it gives that some traits originate in the earliest months of life. Escalona and Heider (1959) cooperated on a research attempt to predict what individual children would be like during their preschool years from case material that had been obtained in an intensive examination before the subjects were 8 months old. The opportunity arose when it was found that 31 children who had been subjects in the infancy study were several years later enrolled in a preschool group on which another research investigation was being conducted. What Escalona did was to go through the case folders on the subjects as infants and make as many specific predictions as she could about the kinds of behavior she would expect of each individual in the preschool situation. These were matched with actual descriptions of each child made independently by the other investigator to see how many were borne out by the facts. The results showed that about 66 per cent of the 882 predictions turned out to be correct or predominantly correct. Some traits were more predictable than others, and some children were
more predictable than others. It is not possible to formulate any precise statement about the statistical significance of these results because one cannot determine what “chance” might produce in this particular predictive situation. But even the possibility that the roots of some kinds of personality manifestations are present within a few months after birth arrests our attention.
A large amount of evidence about the stability of all kinds of psychological traits has been assembled and organized by Bloom (1964). It is clear from his summary that in the personality area we need more and different kinds of evidence before any final conclusions can be drawn. Because of the prominence of developmental concepts in the leading
personality theories, such evidence should be assembled. SUMMARY
Individual differences in personality are very important to theory and practice, but their investigation has been hampered by various kinds of special difficulties. Even the term “personality” is defined in different
182
Major Dimensions of Individual Differences
ways by different psychologists. The number of traits that might be measured is unreasonably large. Criteria to be used in validating tests are difficult to find, especially for positive traits.
The major methods of assessment used in research on personality have been ratings, questionnaires, projective techniques, and “objective” tests.
Each method has serious weaknesses. The basic personality variables for which the most solid research support has been obtained are neuroticism or emotional instability and extraversion-introversion. The factor analytic work of Eysenck has contributed most to the clarification of these dimensions. Other, more complex systems based on factor analysis have been formulated by Guilford and Cattell. Other workers have approached the task of identifying and measuring basic variables either by an empirical comparison of well-defined psychiatric groups with normals or by abstracting from a comprehensive personality theory. The Minnesota Multiphasic Personality Inventory is a product of the first approach, the Murray list of needs a product of the
second. The Myers-Briggs Type Indicator represents a return to type rather than trait concepts. Several follow-up studies have reported a statistically significant degree of stability for personality traits measured in adulthood, adolescence, and childhood. One study suggests that certain kinds of personality characteristics may originate during the first few months of life.
CHAPTER
8
Individual Differences in Interests and Values THERE ARE IMPORTANT ASPECTS OF INDIVIDUALITY that seem to have little or nothing to do with the personality dimensions discussed in the previous chapter. It has not been customary to include vocational interests
in discussions of personality, although they certainly constitute a part of one’s personal life. But however we classify them, differences in interests and values have important practical and theoretical implications. As we think of our friends and associates or listen to the conversation of new acquaintances, what we are most likely to notice are expressions of interests and preferences. We can’t help knowing, for example, that Mary
Symonds, the thirteen-year-old daughter of our next-door neighbors, is tremendously interested in horses, and spends most of her weekends riding the horse her parents gave her for Christmas. We know that Mr. Sinnott, a successful banker, is strongly committed to “the American way
of life” and the free enterprise system he identifies with it. We know that Laura Landis is a deeply dedicated social worker. Her whole life is organized around her work and the human purposes she sees it as furthering. As psychological theorists have turned their attention to the significance of choices and decisions in human affairs, the significance of interests and values as determiners and organizers of such decisions has been increasingly stressed.
As in so many instances throughout the short history of psychology, the main
reason
for classifying interest
tests and personality
tests in
separate categories may be that they arose from independent lines of research. “Personality” tests originated as tools to be used by clinical psychologists in the diagnosis of psychiatric conditions.
“Interest” tests
originated as tools to be used by vocational psychologists in helping individuals find their way into suitable careers. As time has passed and
184
Major Dimensions of Individual Differences
research results have accumulated,
both undertakings
have broadened
their scope so that they are not so far apart as they were at the beginning. As long as the science of individual differences was conceived as a division of human knowledge that was to include only hereditary characteristics, interests and values did not seem to fall within its boundaries.
Nobody seriously considers the possibility of genes determining scientific interests or religious values. To many
observers, an individual’s assort-
ment of interests seems to represent a hodgepodge of miscellanea assembled from here and there, a collection that can perhaps be described but hardly ordered in any systematic fashion. It is often assumed that such traits are shallow and superficial in comparison with the kinds of traits that we have discussed in previous chapters, and that they are too changeable to permit any assessment. It has become increasingly apparent, however, that interests and values are not superficial and that they are less changeable than many “deeper” psychological traits. Furthermore, regularities about the way they are organized consistently show up.
These lead to interesting theoretical generalizations. What started as purely practical research can now play an important part in the building of more comprehensive personality theory. HOW
INTERESTS
ARE
MEASURED
Much of what we know about occupational interest rests on work that has been done with the Strong Vocational Interest Blank. First published in 1927, this test has been given to hundreds of thousands of persons in both counseling and research situations. A large bibliography has accumulated.
The system of scoring used for the Strong, novel at the time the blank was first brought out, has become one of the most useful methods in per-
sonality measurement. What Strong did was to collect several hundred
items of many kinds 1—occupations, school subjects, recreational activities, self-ratings—and ask the respondent to mark each one indicating whether he liked it, disliked it, or was indifferent toward it. Each scoring key was
constructed by tabulating the responses of a group of successful men in some one profession or occupation and comparing the percentage of this
1 The adequacy of the original item pool is a matter of some importance in cases like this where such a large structure of research rests on a single foundation.*It is very
difficult to evaluate this. Fryer (1931) gives the clearest account of what happened during the early 1920’s when work on interest inventories was getting started. About 1,000 items were collected in Yoakum’s seminar at Camegie Institute of Technology. Various people made up inventories for special purposes during the next few years. Items from the original pool were used, discarded, or replaced by new ones according to whether or not they seemed to be making any sort of occupational differentiation . There is no way now of determining what “universe” Strong’s items represent. This does not matter so far as the practical uses of the blank are concerned, but it makes for ambiguity in our attempts to fit the results into any theoretical structure. a&
Individual Differences in Interests and Values
185
group endorsing each response with the percentage characteristic of men in general. Any response for which
the difference
in percentage
was
statistically significant became a part of the scoring key for this particular occupation. Weights were attached to items according to the size of the difference. In developing the “Engineer” key, for example, Strong found
that 47 per cent of men in general as compared with 60 per cent of his engineers marked the first item of the blank, “Actor,” D for Dislike. This led to the inclusion of the D response on “Actor” as part of the Engineer scoring key, with one point of credit. A little farther down the list, on the item “Author of technical book,” 50 per cent of the engineers said L (Like) whereas only 31 per cent of the men in general gave this response. This greater difference meant that an L response to “Author of technical book” received three points of credit on the “Engineer” key (Strong, 1943,
p. 75). The advantage of this variety of scoring key is that it has a certain amount and kind of validity built into it. We may not be able to describe in psychological terms what it is that distinguishes engineers from other men, but we know that there is something. In practical counseling situa-
tions, such empirical validity in a measuring instrument is a very valuable characteristic. By 1954, Strong had developed keys for forty-five different occupations. A women’s blank with keys for twenty-five occupations had also been made available.
Scores based on item analysis have certain peculiarities that need always to be kept in mind. We do not know what kind of a measuring scale this technique gives us. On the Engineer scale, for example, the norms show that the average score for engineers is 112. If Harry Higgins comes out with a score of 200, what does that indicate about him? He seems to be much more like engineers than the average successful engineer is. This is a confusing, rather meaningless statement. What we must not conclude is that he has more interest in engineering than the average
engineer, or that he is likely to be more successful than the average. There is no evidence at all that within any one occupational group, degrees of success are correlated with magnitude of Strong score. Some of the ambiguous results that have been obtained when interest tests have
been correlated with other types of ability and personality measurements may arise from this basic ambiguity with regard to what sort of scale the measurements constitute.” Strong himself centered most of his research around broad categories
set up in such a way as to represent the degree of certainty one can feel that an individual really belongs to an occupational group. Strong’s A 2 Strong’s long-term followup of men first tested in college, indicated that the size _ of the score is related to remaining in the occupation represented by the key in question. Men with scores well above the average for a norm group were considerably more likely to be found in an occupation corresponding to it twenty years later than were men who made just average scores on the scale (Layton [ed.], 1960, p. 185).
Major Dimensions of Individual Differences
186
rating includes scores ranging all the way from a half standard deviation below the mean to the top of the distribution, thus covering the range over which it seems reasonable to say, “This individual unquestionably fits into this occupational group.” “B+,” “B,” and “B—” stand for ranges of scores below the average for an occupational group, thus representing increasing amounts of doubt as to whether an individual belongs in it. What a “B” score means is that a person has some attitudes in common with men in the occupation, but other attitudes that are different. A “C” score indicates that he shows little or no resemblance to persons in this
particular occupation. Research based on such letter grades, though it lacks the apparent precision of work with exact numerical scores, seems to rest on a sounder logical foundation. Another widely used method for measuring interests is the Kuder Preference Record. It was developed in a different manner from the
Strong. Kuder assembled a set of items representing diverse kinds of activity—such as “Visit an art gallery” or “Collect autographs,’—and gave
it to about 500 college students. He examined their responses to see if he could find a group of items that seemed to cluster together. The first such
group was the “Literary” scale. Using this as a starting point, he continued to use correlational methods of item analysis searching for another cluster of closely related items that would have little or no correlation
with the first one. Having developed a second scale by this means, he repeated the procedure, seeking still another set of items that would correlate highly with one another but negligibly with both of the first scales. Since 1934 when the work on the Kuder blank began, scale after scale has been added in this manner. Since 1948, ten scoring keys have been avail-
able for the Kuder Preference Record—Vocational.
They are: Outdoor,
Mechanical, Computational, Scientific, Persuasive, Artistic, Literary, Musical, Social Service, and Clerical. In 1953, Kuder published the Preference Record—Personal. It is built in the same manner as the vocational blank, but the scales represent preferences for different kinds of personal
or social activity, described as follows:
. Preference for being active in groups Preference for familiar and stable situations . Preference for working with ideas
. Preference for avoiding conflict
>HOW . Preference
for directing others.
Still more recently (Kuder, 1959) Kuder has published a third instru-
ment, the Kuder Preference Record—Occupational. For this he has used the preference type of item in which the person must choose which of
three things he likes most and which he likes least, but he has developed
scoring keys by comparing occupational groups with men in general, as
Individual Differences in Interests and Values
187
Strong did. Neither the Personal nor the Occupational tests have been used a great deal as yet, and the research with which we are concerned here has been based on the first of these three inventories, the Kuder
Preference Record—Vocational. When one carries on research with this Kuder test or evaluates research that others have done, it is important that he keep in mind the distinctive characteristics of the scores. For one thing, the validity of the test as a measure of characteristics actually involved in any occupation is not
guaranteed. The fact that a set of items hangs together and that all these items appear to have something to do with mechanical types of activity tells us nothing about men in mechanical occupations. The process of validating a test like this is a long and difficult task. With the passage of time, more and more of the essential information is being accumulated. Each successive Kuder Manual has summarized it and users of the blank need to be familiar with it. Another point that must be kept in mind is that a person’s score represents what he says when he is required to make a choice of the best- and least-liked activity in a group of three. Thus
each of a person’s scores is dependent upon all the others. It is the combination or profile that is meaningful rather than any one score taken singly. Embedded in a different set of choices, an individual’s score on the Clerical scale, for example, might be considerably higher or con-
siderably lower than it turns out to be in this particular context. The fact that scores obtained from the Strong and Kuder blanks represent different systems of measurement and that neither is a straightforward interval or
ratio scale complicates research undertakings, whether we wish to relate either test to criteria of success or to determine the amount of agreement
between them. The soundest procedure is probably to use the judgment made on the basis of the test as the experimental variable rather than to use test scores directly. Strong’s letter grades and Kuder’s reports of
differential profiles for occupations are ways of accomplishing this purpose.
Since World War II another major research program on interest measurement has been in progress. The resulting Minnesota Vocational Interest Inventory is designed to identify interests characterizing different
groups of nonprofessional men, such as electronics technicians, milkwagon drivers, plumbers, retail salespersons, and others at skilled and semiskilled levels. In this test a preference-type item format was com-
bined with a procedure similar to Strong’s for differentiating each particular occupational group from a group of tradesmen-in-general. Clark (1961) has reported on the research of many kinds entering into the con_ struction of this blank and its scoring keys. There are several other interest inventories on the market, but none of them has been used in enough research investigations to require discussion here. There is, however, one sort of interest research, attempted
188
Major Dimensions of Individual Differences
sporadically ever since psychologists first began to measure interests in the 1920’s, that does constitute a different approach altogether. It is the
evaluation of interests by “objective” rather than “subjective” methods. To do this requires that we set up some situation in which we can get an interest score from what a person does rather than from what he says about himself. The great advantage such objective tests would have is that scores on them could not be “faked.” Some ingenious techniques have been proposed, but so far all of them have shown limitations which kept them out of common use. Information tests consisting of questions about processes and terms in different occupations or areas of knowledge certainly reflect interests, but they also measure general intelligence. It is difficult to separate one from the other. Tests of how much a person remembers from different passages he has been allowed to read once tell us something about his interests, but reading ability and general habits of concentration also help to determine such scores. Another method which has been tried is to show movies of work in progress in different
occupational settings and then to gauge an individuals interest in such work by the amount he can recall when the showing is over (Super and Roper, 1941). Here too, other psychological characteristics besides interest probably figure, and the method has the further disadvantage that the large number of separate occupations there are in a modern industrial society make it impractical to show even short films of any considerable number of them. The Army Air Force psychologists during World War II did a considerable amount of research on objective-interest measures. Validity coefficients reported for these blanks were promising but not really satisfactory (about .3). More recently, this effort has been revived in England (Peel, 1959) in an attempt to differentiate children with P (practical) interests from children with A (academic) interests in order to
improve the allocation of eleven-year-olds to secondary schools. The majority of research workers and counselors have continued to use tests of the “subjective” or inventory type. We turn now to a summary of what we know about individual differences in interests on the basis of their experience with these inventories. THE
STABILITY
OF VOCATIONAL
INTERESTS
One of the most striking things that extensive research has shown is that the patterns of likes and dislikes identifying a person as a member of a certain occupational group are very stable aspects of his personality. Strong (1955a) accumulated follow-up data on a number of groups first
tested during their college years and then retested many years later. The intervals were of*different lengths for different occupational groups, the longest twenty-two years. Table 13 summarizes these results. When the set of scores originally making up a person’s interest profile was cor-
Individual Differences in Interests and Values
related with the set of scores
obtained
189
after a long time interval,
the individual correlations ranged from .67 to .88. For the groups with the
twenty-two-year interval, the median r’s were .76 and .72. How close the relationship is seems to depend about equally on the length of the interval and the age of the subject at the time he first took the test. The high level of the correlations
generally would
suggest, however,
that
permanence in vocational interest pattern is the rule, not the exception. Trinkaus (1954) reported results from a follow-up study of 308 Yale alumni about fifteen years after they first took the Strong test as college freshmen. Stordah] (1954) studied University of Minnesota students who had taken the Strong test two years before as high-school seniors. In both these studies, Strong’s findings with regard to the stability of in-
terest patterns was verified. Table 14 shows what Stordahl found with regard to letter grades. It can be seen that 60 per cent of the A’s remain
A after two years; 79 per cent of them are A or B+. The C’s are even more stable, with 68 per cent remaining C and 83 per cent C or C+.
It is apparent from all these studies of interest stability, however, that there are individual differences with regard to it. Most persons change
very little, but some few change a great deal. This fact shows up most clearly in studies of high-school students. Finch (1935), Taylor (1942), Carter (1940), Taylor and Carter (1942), and Dunkleberger and Tyler (1961) have shown that stability of interest pattern is the rule even for subjects as young as sixteen. But always in a few cases, the correlations between sets of scores obtained on two occasions turn out to be negative;
in other cases they are so low that attempts to predict the later from the earlier interests would have been seriously in error. Work on the Kuder has been less extensive, but here too there is some
evidence that a fair amount of stability in obtained pattern is the rule rather than the exception. Reid (1951), testing college subjects, found a median correlation of .77 for sets of scores separated by a fifteen-month interval. Rosenberg (1953), with high-school subjects tested in the ninth grade and again in the twelfth, obtained correlations ranging from .47
to .75. Herzberg and Bouton (1954) reported similar correlations for intervals up to four years. In all these studies, as in the Strong studies,
marked changes occurred in some individuals (Mallinson and Crumrine, 1952).
Many of the research studies on the long-range stability of vocational interests have attempted to find out what kinds of factors differentiate persons who show marked interest changes over the years from those who do not. This is a question that is obviously of considerable interest _ to counselors, who must often make judgments about whether or not a shift in the pattern of a client’s interests can be expected to occur. Stordahl (1954) hypothesized that the Interest Maturity score on the Strong blank (the special score based on items differentiating fifteen-year-
TABLE
13 Permanence
of Interest Profiles
(Strong, 1955, p. 64) ee
LE
DATES TESTED
COLLEGIATE LEVEL
NO. OF SUBJECTS 50 50 50 50 50 50 50 50 50 50
Freshmen Seniors Seniors Freshmen Freshmen Seniors Freshmen Seniors Seniors Business Graduates Freshmen Freshmen Seniors Graduates
50 50 228 198
TABLE
MEDIAN AGE AT TIME INTERVALOF ISTTEST CORRELATION
1930-31 1927-32 1932-37 1931-39 1930-39 1927-37 1939-49 1937-49 1932-49
i 5 5 8 9 10 10 12, l7/
19 22 27 20 19 22 28 32 Q7
.88 84 .86 We? .67 82 .87 88 .84
1931-49 1931-49 1930-49 1927-49 1927-49
18 18 19 22, 22,
23 20 19 22 25
.74 Age Aly .76
H
ij
a
i> r~(}
*
n dit ipvont gi P
te he, @
Ee,
4
4 |
OS ee
= ™ 4% ek5*
+7
ity 1
'
i ¢
5
So
é Lee
‘oe
3a
5
,
£
.
5
:
ts
i
;
« +
; =
:
-
‘
he
Gi »
tye
freei
apts TOFay
Pen AP
4
Bis vininay rcs
Te
70 f
far
i)
~
Brae)
PF the
’
f
ue
a
ae
|
in
Vitteqe
4
vs
ry is
PE
s :
“Subieres
ye
e eres
a
LYS iL
ee
rites
’
< >
>} gee reves: core
whut st ah desttieagh
-t!
22a 5
ear sane Monsees
»
i |
mS
iad nae
r.
Gig
eae
=v)
ass
;
“y
nner
bikie fe
im.
ee
;
Vs
3c2 “fnon
¢
€
’
ws
i
mee) 5 Pay
Vv
~
Tere
tess
ed) |
tap
ticioi
yia7
ixse
ft?
anaes
~
i%
'
biawetiee polly Maven tidegaainie pageant eoheg! te hard
ops
vile GeP Hibty ngs wes lued Take i
. a
*~
TBindsd sana
4
. {
4
Pm
‘
aE ate
SO
ra
onl
al
tat maya
ti Stier aeuenya
havin rota sere “pment viel hreensvolios= Bt B yen “ nities :
\
va
¢ wt
somvaillsiad 4ight gnc obu aaah ri Neisy
soot
ie
igi
Bal a jaxthacinns —
Part Four
FACTORS
PRODUCING
DIFFERENCES
CHAPTER
16
The Relationship of Mental to Physical Characteristics INTRODUCTION PROBABLY NO BELIEF has been more tenaciously held among people of all times than the conviction that it is possible to judge an individual’s mental characteristics by the way he is put together physically. Novelists describe the build, facial shape, coloring, and clothes of their characters in such a
way as to accentuate the inner qualities which they assume are expressed
by these things. Intelligent men and women who “pooh-pooh” the idea of fortune-telling in general still feel that “there may be something in this palmistry or phrenology.” Books explaining personality in terms of the glands obtain wide and enthusiastic acceptance. Employment interviewers
develop their own systems of judging prospective employees by their appearance. Habits of thinking in such terms are ingrained in our language in such expressions as “high-brow,” “long-headed,” or “thin-skinned.” The investigation of these relationships is an important scientific prob-
lem. It is advantageous for us to be able to make good sight judgments of people. Hundreds of life situations require us to make the attempt. But here, as in so many other areas covered by differential psychology, it
is important to remember that a wrong judgment is worse than a suspended judgment or no judgment at all. The trouble with most of our rule-of-thumb methods is that they may lead us to make serious errors. It is the task of the psychologist to check up on what the popular beliefs are and then to discover what physical characteristics, if any, really are related to mental ability and personality.
_ There are special reasons why people’s conclusions on this subject are likely to be faulty. The scientist along with the man in the street is sus-
ceptible to these errors and must constantly guard against them. First, human beings are very prone to base their beliefs on a few outstanding
422
Factors Producing Differences
instances and to neglect the much more numerous examples that do not
support them. It is this tendency that keeps superstitions alive and active. The untrained observer is likely to remember the one person he knows who broke a mirror just the night before his house burned down and to forget that mirror factories are constantly turning out replacements for other broken mirrors in houses still standing. Similarly, if a person has one intellectual friend with a high forehead or one timid associate with a
receding chin, his opinions tend to be determined or confirmed by his contact with these cases. Second, attitudes and prejudices with which people approach their personal relationships or their scientific research actually enter into their
judgments of mental characteristics. Even if the man with the receding chin is possessed of more than the average force of character, he is likely
to be adjudged a weakling until he proves himself otherwise. The slim, aristocratic-looking boy may get better marks in school for the same quality of work than his pudgy neighbor does. The sales manager who thinks size is related to aggressiveness may rate the tall salesmen on his staff higher than the short ones. In scientific research, wherever evaluation of personality is based on ratings by other people, we must watch out for this source of error. Only when tests are used, does it cease to be important.
Third, any unusual physical characteristic may appear to carry person-
ality characteristics along with it because of the way in which its possessor sees himself. These indirect effects of physical characteristics on personality can easily be confused with direct causal relationships. Careful study, however, will always show the difference, since in a group of people, examples will occur in which the same physical trait is associated with mental traits that are quite opposite. Take, for instance, the case of the weak, undersized child handicapped in infancy by a long illness. He may be shy, withdrawn, and retiring. On the other hand, he may try to
compensate for his weakness by being noisy and troublesome in school and terrorizing younger children. These indirect effects of physical characteristics on personality are highly important, but there is nothing con-
stant about them that we can use to help us make sight judgments of people. Only detailed study of an individual will show what his physical endowment means to him and how he is reacting to it. Fourth, it must be remembered that relationships holding at the extremes of the distribution of human characteristics do not necessarily hold throughout the average range. There are numerous pathological condi-
tions that produce abnormal personality characteristics, but unless conditions really are pathological, no abnormalities appear. Idiots of the microcephalic variety have extremely small heads. This does not, however, warrant a conclusion that the smaller your head is, the nearer you are to idiot status. The cretin’s feeble-mindedness, along with definite % +
Relationship of Mental to Physical Characteristics
423
physical symptoms, arises from an extreme thyroid deficiency; but that fact tells us nothing about the relationship of thyroid functioning to intelligence within the normal range. Extreme cases of various kinds often do suggest hypotheses which we may check by research. In themselves they do not prove anything about people in general. With these cautions in mind, we can proceed to the discussion of what the research workers have found. | BODY
STRUCTURES
AND
INTELLIGENCE
A tremendous amount of detailed research in which careful measurements of various structural and anatomical characteristics were correlated with scores on intelligence tests can be summarized in a single brief statement: the correlations are too low to be of any practical significance.
Paterson (1930) brought together the findings of the early studies, findings constituting conclusive evidence for this conclusion. Nothing in later correlational investigations has changed it, although the work on constitutional types to be discussed in a later section suggests that a different
formulation of the problem may be of some value. From the days of Porter’s (1895) pioneer investigation of 35,500 St. Louis school children on to the present time, evidence has been amassed that what correlation there is between body size and intelligence is positive rather than negative. Such coefficients seldom exceed .2, however, and probably .1 is a more typical figure. The most likely explanation seems to be that families in which good intellectual development occurs also stimulate good physical development, and vice versa. Some evidence
that the link is of this sort was furnished by Laycock and Caylor (1964),
who compared physical measurements of 81 gifted children (average IQ 141) with the measurements of 81 of their nongifted siblings (average IQ 109). Under these circumstances, when the high and the average IQ subjects came from the same families, no significant differences in their physiques were found. Correlations between other aspects of physique and intelligence test scores have also consistently turned out to be low. Some investigators have worked with height-weight ratios, some with head measurements,
some with facial characteristics. Some have used maturity indices such as X-ray photographs of the hand and wrist. Paterson’s 1930 book is an excellent source of detailed information about all of these unsuccessful attempts.
DISEASES
AND
PHYSICAL
HANDICAPS
Another research area where low correlations of no practical significance have repeatedly turned up is the study of the relationship of
424
Factors Producing Differences
physical impairments of various sorts to mental functioning. The general, common-sense opinion is that the way one feels has a good deal of influence on how well one thinks. Time after time students explain their inadequate performances on examinations in terms of the cold from which they are suffering or the sleep that they failed to get the night before. Teachers are taught to observe closely the physical defects shown by their
pupils and to expect better school work, once these are corrected. Thus the trend of the research evidence in this area is likely to be somewhat surprising to people. A number of studies have indicated that most kinds of physical defects bear little or no relationship to intelligence. A number of studies on malnutrition show that groups of undernourished children are fully as bright as those who are well fed. Defective teeth are just as common among the normal as among the dull. Children with diseased tonsils do not differ
intellectually from those with normal tonsils, as Figure 48 strikingly shows.
There is some evidence from the early study by Ayres (1909-10) and 40 35
-— Normal 30 25 20 15
PERCENTAGE CASES OF 10 5 0 40SOP
5060V160970
7080FSO FeSOs
90OORT
100LOR
110TL20Ren
INTELLIGENCE QUOTIENT
FIGURE
120SOR
130AOI
140FI50
.
48
Frequency Distributions for Groups of Children with Normal and Diseased Tonsils ‘ a 2
(Rogers, 1922)
Relationship of Mental to Physical Characteristics
425
the surveys by Sandwick (1920) and by Kempf and Collins (1929) that dull, normal, and bright groups of children are differentiated
number
of defects of all sorts, although some
by total
other school surveys
(Mallory, 1922; Stalnaker and Roller, 1927; Westenberger, 1927) failed to substantiate these findings. Smillie and Spencer (1926) showed that lowered intelligence tends to accompany hookworm infestations. The average IQ for the very heavily infested cases in a hookworm “area” was 76.3, whereas for the children free from the condition it was 90.2. The studies in which correlations have been computed between the
extent of the defects and intelligence are more meaningful than the group comparisons. With few exceptions, these correlations have all run very low. Condition of teeth, nutritional status, condition of cervical glands
and tonsils and adenoids all gave correlations of .15 or lower. (See Paterson, 1930, Ch. 6.) Since the data on which they were based were obtained by many different investigators working in a wide variety of places in
England and the United States, we are justified in concluding that the relationship in general is low and insignificant. The most reasonable explanation of whatever slight relationships have been found between physical defects and intelligence is in terms of the class differences we have already discussed in some detail. The poorer socio-economic groups have a larger number of uncorrected defects; they also average somewhat lower in IQ. The important correlation is the one between socio-economic status and intelligence, and we have already seen how difficult it is to analyze so as to show which is cause and which effect.
One other type of study has been carried out in connection with some physical defects. “Before-and-after” studies, designed to show whether or not the correction of a defect increases the intellectual level, are particularly interesting. It is important that a control group be used in this type of research to make sure that whatever change is noted arises from the elimination of the defect and not from some other unanalyzed factor in the situation. This has been done for malnutrition, for dental caries, and for tonsils. In general, such studies have shown the effect of the treatment
on the IQ to be negligible (Paterson, 1930). Feeding a child well and attending to his teeth and tonsils do not make him brighter, whatever en-
thusiastic champions of public health measures may say. The physical benefits must be valued on their own merits. Even the common belief that temporary illness depresses examination scores seems to be unwarranted. Some convincing evidence on this point
came from a study made during World War I when it was necessary to test a group.of men who had been recently inoculated for typhoid fever (Paterson, 1930, pp. 204-205). The average score for these 178 men was
67.7 as compared with an average of 67.1 for 7,167 men not recently inoculated. When the average score for those who reported that they were
426
Factors Producing Differences
feeling the after-effects was compared with the average for those who were subjectively not affected, the figures turned out to be 67.4 and 67.9, so much alike that it must be concluded that the illness had no effect on
the performance. It is still possible that certain individuals are so upset by their physical ailments as not to be able to concentrate on the tasks assigned them, and the good psychometrician is always on the lookout for such cases in individual testing. But, on the whole, regardless of what
people may think of their own test performances, they are not necessarily handicapped when they do not feel well. Whether they would be able to
carry on serious mental work for long periods of time under those circumstances is, of course, another matter, calling for a different kind of investigation.
The question whether longer periods of illness might have a depressing effect has also been considered. In a careful comparison between 101
children who had been stricken with poliomyelitis a year before the study began and a control group, E. L. Phillips, Berman,
and Hanson
(1948)
found that there had been a 1.5-point drop in IQ for the polio group as compared with a 2-point increase for the controls. While the difference is
statistically significant (at the 2 per cent level), it is too small to be of any practical importance. Harris (1950), who obtained ratings of 58 of these
same subjects two years after their illness on a variety of personality traits, found that they were undistinguishable from the controls. There seem to be only two kinds of physical handicap that have appreciable effects on mental functioning. The first is a disease or defect in the central nervous system itself, such as encephalitis lethargica. The other is a sensory handicap severe enough to reduce drastically the amount of stimulation a growing child receives from the world around him. It has become increasingly clear that mental growth depends upon this constant stimulation from the environment. Thus it is important to recognize such conditions as deafness and even minor hearing loss at an early age if a child’s intellectual development is not to be impaired.
In summarizing all the work on the relationship of physical defects to intelligence, Paterson (1930) stressed the point that nature has thrown strong safeguards around the central nervous system, upon which intellectual functioning depends. Were it possible for any minor illness or injury to disorganize the thinking processes, which are our chief resource when in difficulty, it is probable that the human race would not have been able to endure the vicissitudes of existence as long as it has. This viewpoint makes the research findings seem reasonable. The general conclusions are
that no physical condition except one that acts on the central nervous system itself has a serious effect on intellectual efficiency, at least, for limited periods ofatime, and that no developmental handicap except one that severely restricts the individual’s contact with his environment and
his mastery of language has a serious effect on his IQ. .__
Relationship of Mental to Physical Characteristics PHYSIOLOGICAL PROCESSES
AND
427
BIOCHEMICAL
As time passed, the research interests of psychologists shifted away from the kinds of problem we have just considered and focused more on
the relations between our mental makeup and the functioning of physiological and biochemical systems in the body. It seemed reasonable to suppose that differences in some kinds of intellectual functioning might be linked to some aspect of these systems. It seemed an even more plausible hypothesis that personality differences might be based on such internal physiological factors.
Some psychologists attempted to relate differences in blood composition to personality differences. Several hypotheses were proposed: (1) that alkalinity is correlated with excitability; (2) that proportions of creatinine, phosphorus, and cholesterol are correlated with specific per-
sonality traits such as good-nature and perseverance; (3) that variability of blood composition from day to day is related to emotional instability. Results were inconclusive. One investigator, using a small number of cases, would find a trend in one direction; another with a different small group would find an opposite trend. The study by H. Goldstein (1935)
demonstrated one of the reasons for this inconsistency. His subjects were nineteen college men. Each of them was given blood tests twice a week for ten weeks, and was asked to fill out the Bernreuter Personality Inventory and the CAVD intelligence test. The most striking finding was the great variability in the same individual from time to time. In all except one of the variables tested (cholesterol), there was as much variation in the twenty measurements of the same individuals as in one measurement for the nineteen individuals at any given time. For instance, the person whose blood was most alkaline one week might be average or even low in alkalinity the next week. The person who was very low in blood sugar on one trial might be fairly high the next time. What this means is that there is little prospect of getting significant correlations between blood concentrations taken at any single time and personality traits. There did seem to be a little evidence for the third hypothesis connecting blood variability with emotional instability, since individual variability from day to day was correlated to the extent of .41 with the neurotic-tendency score on the Bernreuter test. With an experimental group of only nineteen cases, however, it was impossible to be sure that this constituted evidence for an actual relationship. Other research workers attempted to relate hormonal differences to personality differences. A fact that suggested the possibility of such correlations was the finding that glandular disturbances were unusually fre-
quent in children with behavior problems. Lurie (1938), for instance,
found in his analysis of 1,000 problem children that 20 per cent showed
428
Factors Producing Differences
some glandular abnormality, and in 10 per cent this appeared to be a causative factor in the child’s behavior. The thing that makes it difficult to attribute any specific personality trait to the functioning of a specific
gland, however, is that quite different patterns of behavior may arise from the same apparent cause. Inadequate thyroid functioning usually produces a condition of sluggishness, dullness, and lack of energy. But some children with this same physiological defect show instead motor
restlessness, destructiveness, and speech disturbances. The most likely explanation is that the behavior disorders are a reaction or adjustment on the child’s part to the way he feels and his recognition of the fact that he is different from his fellows. They are thus indirectly rather than directly connected with the glandular disturbances. Since these patterns of adjustment are highly individual matters depending upon everything else in
the person’s experience, we would not expect to find general correlations between the physiological and the personality variables. The relationship of sex-hormone production to various
aspects
of
masculinity and femininity has also been a research topic of some interest. In general, as Beach (1948) has pointed out, the higher a species is in the
evolutionary scale the more its sex behavior is determined by social factors and learning rather than by hormonal influence directly. However, there have been a few studies that suggested that some correlation between
endocrine and personality lenberger (1940) reported tion of male sex hormone boys. Stone and Barker menarcheal girls differed studies, since the subjects
measurements persist in human subjects. Solsome relationships between the urinary excreand the interests and attitudes of adolescent (1939) showed that premenarcheal and _postsignificantly in their interests. In both these were adolescents, the interest differences might
have occurred, of course, as one consequence of their becoming aware of their own maturing, rather than as a direct consequence of the presence of sex hormones in the blood. It seems less possible to account in this
way, however, for the correlation of .58 that Levy (1953) obtained between whom The might
maternal behavior and duration of menstrual flow for 72 women he interviewed. one measurement of glandular functioning which, it appeared, have some definite relationship to intelligence was basal metab-
olism. This is a measure of oxygen consumption in the body, which is closely related to the functioning of the thyroid gland. When basal metabolism is low, it is standard medical practice to resort to thyroid medication. It has, of course, been known for a long time that an extreme degree of thyroid deficiency early in life results in the type of feeblemindedness called cretinism. The question is whether children beyend the earliest years whose thyroid deficiency is less extreme will exhibit some degree of mental retardation. The strongest evidence for such a rela-
tionship came from two studies by Hinton (1936, 1939). He obtained 4y
Relationship of Mental to Physical Characteristics
429
under very carefully controlled conditions the basal metabolic rates for 200 orphanage and private-school children in the Chicago area. He then gave each one a Binet Test and an Arthur Performance Test to get both a verbal and a non-verbal index of intelligence. For the total group, aged six to fifteen, the correlations were as follows: Binet IQ vs Arthur IQ vs
BMR_ BMR_
.71 .74
Analysis of the figures by separate age groups showed coefficients in the .70’s for all groups from six through eleven. Above that age they were considerably smaller. Hinton interpreted this to mean that the relationship holds most strongly during the childhood years of growth and is
upset by the metabolic changes associated with adolescence. Other investigators have not obtained significant correlations between BMR
and
either measured intelligence or academic performance, but their subjects were older than Hinton’s so that it is not clear whether the findings of
the different studies are in conflict or not. Shock and Jones (1939) found no significant relationships between any of the physiological variables they measured, basal metabolic rate, blood pressure, pulse rate, and vital capacity, and scores on the Terman Group Test, but their subjects were
adolescents. Yarbrough and McCurdy (1958) summarized several studies reporting near-zero relationships between basal metabolism and achievement for college students. Until or unless Hinton’s study is repeated, the question must be considered to be still open. Another physiological research area in which psychologists became interested was nutrition. The possibility of improving intelligence or personality by enriching the diet in one way or another is a very appealing one. The largest of the studies investigating the effects of dietary de-
ficiencies was carried on during the war years by Keys et al., and reported in detail in their book The Biology of Human
Starvation (1950).
The 36 young men who underwent a radical decrease in food intake over a period of six months were subjected to all sorts of tests and examinations. In general, the result seemed to substantiate those obtained previously in showing that mental abilities changed very little. Drive and motivation, however, were markedly decreased, and marked neurotic
characteristics appeared both in the subjects’ behavior
and in their
responses to the MMPI test (Schiele and Brozek, 1948). It is interesting to note that neurotic manifestations differed from person to person and that there were marked individual differences in the capacity to withstand this stress. There is some possibility that in younger children dietary deficiencies
may impair mental functioning as well as personality, and that proper
treatment may improve it. Examined superficially, results with regard to
430 the B-complex vitamins
Factors Producing Differences seem
to be conflicting. Guetzkow
and Brozek
(1946) and O’Shea et al. (1942), presented evidence that such deficiencies did not impair intelligence and supplementation did not improve it. R. F. Harrell (1947), on the other hand, in an unusually well-controlled study of
60 paired groups of orphanage children, showed that adding extra thiamin to the diet produced significant changes in intelligence test scores and in
performance on tests of learning and visual acuity. Bernhardt et al. (1948), applying similar treatment to eleven-year-old children in Toronto, where identical twins were used as experimental subjects and controls, did not
find any significant differences that could be attributed to the thiamin. Contradictory as they at first seem, taken as a whole these results make sense. The absence of any effect in the first two studies is explainable on the grounds that they used adult subjects. As we have noted previously, mental ability, once fully matured, is quite resistant to change. The difference between the two studies on children can be understood if we assume that the diet of Harrell’s orphanage group was somewhat deficient at the beginning, whereas the Toronto children, living in their own homes, were probably well enough nourished so that the extra thiamin was neither needed nor utilized by their bodies. Most of the
studies of IQ change in children following upon any sort of environmental change indicate that it is easier to produce IQ increases by improving unsatisfactory surroundings than by making an already good situation even better. This point will be considered in more detail in the next chapter. Perhaps the most controversial of the research problems has been the
attempt to improve the intelligence of feeble-minded children by giving large doses of glutamic acid. This is an amino acid which it was thought
might be used by the brain in the synthesis of acetylcholine, a chemical playing an important part in nerve action (Gadson, 1951). The earlier studies, especially those by Zimmerman et al. (1948, 1951), were so loosely designed that their results could not be said to prove anything. As research reports on this topic multiplied, some cited significant increases,
and others did not. Astin and Ross (1960) reviewed thirty-three of these conflicting reports and showed rather conclusively that the only studies in which positive results were obtained were those that had not used control groups for comparison purposes or those in which some other essential experimental control had been omitted. The well-designed studies uniformly produced nonsignificant results. The measurement of electrical activity in the brain and recording it on the electroencephalogram or EEG opened up new possibilities of exploring physical-mental relationships. The most common research approach was to correlate some aspect of what is called “alpha activity” with intelligence. Alpha waves are those with a frequency of about ten
per second, most characteristic of normal children and:adults in a relaxed
Relationship of Mental to Physical Characteristics
431
waking state. It was established by Travis and Gottlober (1936, 1937) that a person’s brain waves do show individuality, can be identified with a
high degree of agreement by different judges, and are consistent from day to day. Whether these individual differences in EEG are correlated with psychological traits of any sort, however, is less certain. Kreezer (1940) obtained correlations in the .30’s between Alpha Index and mental age
for Mongolian idiots whose mental ages ranged from 1.5 to 7.5 years. Since in these cases brain damage might produce both the abnormal EEG’s and the feeble-mindedness, it is impossible to generalize from this special group to nonpathological cases. In a similar study in which
the subjects were 46 familial mental defectives with no obvious physical pathology, Kreezer and Smith (1950) found that there was some correlation between Alpha Frequency and mental age, but it was too low for
statistical significance. Knott, Friedman, and Bardsley (1942) reported a correlation of .50 between Alpha Frequency and IQ for 48 eight-year-old children, a coefficient which is statistically above the chance level. For twelve-year-olds, however, the correlation was only .12. The decrease here might be due to adolescent changes which upset the relationship.
Generally speaking, investigators have not reported significant correlations between any aspect of EEG and intelligence for normal children.
There is some conflict in the results reported for adults. Shagass (1946) found no correlation between Alpha Frequency and intelligence in air-
crew candidates. But Mundy-Castle
(1958) found a correlation of .51
between Alpha Frequency and IQ for 34 South African adults. He interpreted this to mean that “central excitability” or “cortical conductivity” is directly related to intelligence, but there is insufficient evidence to permit such a conclusion to be drawn with certainty. There is some possibility that the EEG may be related to personality characteristics. Reports from various clinics and schools indicate that a large proportion of behavior problem children have abnormal brain waves, many of them of an epileptiform nature. Attempts to correlate alpha activity with scores on personality inventories (Henry and Knott,
1941) have not met with much success. Saul, Davis, and Davis (1949) reported some very striking relationships between the EEG patterns of 136 adult patients and their predominant personality characteristics as
these became apparent during psychoanalysis. (It is in line with all the evidence as to the persistence and distinctiveness of these EEG
“brain-
prints” that they did not change during psychotherapy.) The very passive individuals had high Alpha Indices. Women with strong masculine trends or maternal drives had low Alpha Indices. Frustrated, demanding, hostile, aggressive women had mixed or irregular records. These findings were reported in a descriptive way that made any check on the statistical significance of the relationships impossible, but the results are at least suggestive.
432
Factors Producing Differences
Great strides were made in electroencephalographic work after World
War II through the use of new methods of analyzing the record of electrical activity in the brain into its components (W. G. Walter, 1953). Much of this work has been designed to throw light on brain functioning in general, but some attention has also been paid to the relationship of individual patterns to personality. In addition to types based on the predominance of the three principal types of waves—alpha, delta, and theta —Walter and his co-workers have set up distinctions based on the way in which a person’s EEG record changes with stimulation. It is a familiar fact that alpha activity which is elicited from electrodes at the back of
the head when the eyes are closed usually disappears when the eyes are opened, or when the person is requested to make some mental effort. But some individuals, according to Walter, show no alpha rhythm at any time. These turn out to be persons who think by means of visual imagery. The opposite type, in which alpha rhythms persist even when the eyes are open, includes those who tend toward auditory or kinesthetic rather than visual perceptions. Here again the detailed evidence is not presented, and much of the discussion is speculative, but the ideas are extremely interesting. The most comprehensive attempt to analyze the relationships between certain aspects of brain chemistry and behavior is the program of research Rosenzweig, Krech, and their associates at the University of California have under way (Rosenzweig, Krech, and Bennett, 1960), us-
ing rats as subjects. The basic hypothesis is that the amount of acetylcholine, a substance known to be released at the synapse and to facilitate the transmission of the nerve impulse, is related to effectiveness in prob-
lem solving. The specific hypotheses guiding these research efforts have changed as the work has progressed, but the general trend of the evidence for this kind of relationship is positive. There has been continuous progress over a period of several decades in research on individual differences in the functioning of the autonomic nervous system as a whole. Using indices that appeared promising from
previous work, Wenger (1942) put together five measurements that would evaluate autonomic balance, or the extent to which sympathetic reactions, on the one hand or parasympathetic, on the other, predominate in a per-
son’s makeup. He showed that such scores were stable from day to day and that they distributed themselves in something like a normal distribution. He then looked for evidence with regard to psychological correlates
of these scores. In a study of 87 children, aged six to thirteen, Wenger (1947) picked out the ten with extreme sympathetic scores, and contrasted them with the ten obtaining the extreme parasympathetic scores. Qne would expect the $“group to be more reactive, excitable, unstable, and
inhibited, the P group calmer, better nourished, and more phlegmatic. Using a number
of indices of personality characteristics—ratings, &s
per-
Relationship of Mental to Physical Characteristics
433
sonality test scores of the parents, and the like—Wenger made specific predictions with regard to the differences between his two groups. The differences turned out to be in the predicted direction for most of them, but only a few were of clear statistical significance with such small numbers. Inspection of the distributions indicated that it was only at the extremes that personality differences were unambiguously evident. For
the bulk of the subjects with scores near the middle of the sympatheticparasympathetic distribution, no predictions could be made. In a later large-scale study of Army Air Force men, Wenger (1948) used a number of methods for assessing the meaning in personality terms of scores for autonomic balance. One comparison was made in order to check the
hypothesis that men with scores toward the sympathetic pole would show a tendency to become anxious in stress situations. Groups of men who had been returned from duty suffering from either operational fatigue or outright neurosis were compared with preflight cadets. As the hypothesis
would have led us to predict, these anxious airmen scored significantly higher in sympathetic activity. The fact that other returnees did not differ
from the cadets seemed to indicate that it was not simply exposure to combat that produced the difference. Another type of what might be called validation, in which autonomic balance scores were correlated
with scores on personality inventories, was less successful. Some of the correlations were statistically significant, but they were all low. This state of affairs might reflect the inadequacy of the personality tests rather than
the inadequacy of the physiological measure, but the doubt remains. Another important finding in work on individual differences in autonomic functioning is that individuals show characteristic patterns of
response. Lacey (1950) and Lacey and Van Lehn (1952) demonstrated the existence of such patterns and their consistency from one occasion to another. Terry (1953) made a factor analysis of twenty-two autonomic measures obtained from 85 male college students under rest and under mild stress conditions. There seemed to be evidence for three separate autonomic factors: conductance, heart period, and blood pressure. Later
work (Lacey and Lacey, 1958) indicated that there were even more complex kinds of individual differences than had been recognized at first. Some persons showed the same pattern of response in different stress situations; others did not. While the individual patterns of response were
generally consistent for a four-year period, some individuals were more consistent than others. The many aspects of this research program are conveniently summarized in Lacey (1959). These individual differences in the pattern and amount of reactivity in the autonomic nervous system have also been examined in the longi-
tudinal study of children at the Fels Institute (Sontag, 1963).
A number
of interesting correlations have turned up. For example, fetal activity in the eighth and ninth month correlates with social apprehension in nursery
434
Factors Producing Differences
school. This measure of social apprehension at the age of two to five in turn correlates significantly with social apprehension at the age of twentytwo to twenty-five. Fetal heartrate lability correlates significantly (rho = .52) with heart rate lability at eighteen in the 12 cases available for com-
parison. Individual differences in cardiac response to stress were related to personal style. Strong cardiac reactors were more likely to react af-
fectively to a picture story test and less likely to exhibit emotional control in social situations than the noncardiac reactors were. It appears now that it may be possible to bring many of these findings together under the general heading of individual differences in activation (Duffy, 1962), or arousal (Fiske and Maddi, 1961), and that neurophysiological research, particularly the work on the reticular formation in the brain, may help to explain them. It is clear that such individual differences exist and that they affect behavior in many situations. A good summary is available in Duffy (1962, Chap. 10).
Simply to say that individuals differ in the sensitivity of their activation mechanism, however, is to leave out what may be an important part of the story. There is some evidence that the persons showing the greatest amount of internal activation show the least evidence of it in their be-
havior. H. E. Jones (1935, 1950) found that in young children reactivity as measured by the galvanic skin response (GSR) was not correlated with overt response to fear-producing stimuli. Similarly, among adolescents, those whose GSR’s were most pronounced, higher than those with the low GSR’s, the traits such as being calm, good-natured, sponsible, resolute, constant in mood. It
the “internalizers” were rated “externalizers,” on many social deliberative, cooperative, rewas those with the low GSR
response who were rated excitable and unstable. A similar distinction was proposed on the basis of another physiological difference by Funkenstein, King, and Drolette (1954). “Anger in” subjects
could be distinguished from “anger out” subjects. The behavioral differences were like those produced experimentally by two hormones affecting the autonomic system—adrenalin and noradrenalin.
BIOCHEMICAL
INDIVIDUALITY
It may turn out that the most valuable contribution research on individual differences in physiological and biochemical reactions will make to further thinking is to turn our attention from traits studied one at a time to the patterns of characteristics which underlie the uniqueness of individuals. The person whose work has been most influential in this
direction is R. J. Williams. In his books, The Human Frontier, 1946, Free
and Unequal, 1983; and Biochemical Individuality, 1956, he has argued
eloquently that the individual should be investigated simultaneously by
scientists from many disciplines. In the last of these books, especially, he ‘.+
Relationship of Mental to Physical Characteristics
435
has assembled evidence showing just how marked the differences between individuals are. There is no such thing as a “normal” person, if one considers at the same time differences in digestive tracts, muscular systems, circulatory systems, numbers of different types of blood cells, and the many other things that can be measured. Because they have concerned themselves mainly with one of these systems at a time, medical men have assumed that most persons are somewhere near the norm, and
that only a minority are deviant. Psychologists make the same error when they measure one trait at a time and apply normal curve statistics. As a biochemist, Williams became especially interested in individuality
with regard to (1) the composition of body fluids, such as blood, digestive juices, etc.; (2) the enzyme levels in tissues and body fluids; (3) the pharmacological responses to specific drugs; and (4) the quantitative needs for specific nutrients, such as minerals, amino acids, and vitamins. He and his students showed that individuals differ markedly in their metabolic patterns, as measured by what is excreted in the urine. Figure
49 shows the device by which Williams portrays biochemical individuality graphically. Individual A was unusually sensitive to potassium chloride, and showed a predominantly alkaline urinary reaction. Individual B, on the other hand, was most sensitive to creatinine, and showed an acid
urinary reaction. Some of the difference persisted, even when the subjects were placed on exactly the same diet.
Psychologists would, of course, like to know what differences these unique patterns make in behavior. One study (F. J. King, Bowman,
and
Moreland, 1961) measured the amount of amino acids excreted in the urine and correlated these six measures with seven measures of intel-
lectual capacities, using a statistical technique, canonical correlation, by means of which a whole set of scores can be correlated with another set,
rather than dealing with only two variables at a time, as ordinary correlational techniques do. The subjects were 58 children ranging in age from eleven to sixteen. A sizable negative correlation (—.599) was found, indicating that those who excreted a large amount of the amino
acids
(and thus, by inference, had not metabolized them) were less bright than those who excreted a smaller amount. A more extensive study, growing directly out of Williams’ concepts, is
one by Sanders, Mefferd, and Bown (1960). Their subjects were male college freshmen assigned to one of three comparison groups on the bases of their verbal and quantitative scores on the entrance examination. There were 30 in the Vq group (high on verbal, low on quantitative), 25 in the vQ (low on verbal, high on quantitative), and 29 in the VQ group (high
on both). Besides comparing the groups on personality and achievement tests, these investigators analyzed 31 constituents number of significant differences appeared, most
of urine samples. A marked for the Vq
group. These boys were lower on 24 of the 31 constituents. It is not clear
Environmental Factors Affecting Differences TABLE
453
49 Some Data from Identical Twins Reared Apart *
(Newman, Freeman and Holzinger, 1937; Muller, 1925; Gardner and Newman, 1940; Saudek, 1934. Data brought together by Woodworth, 1941, p. 23) ENVIRONMENTAL
AGE
CASE NUMBER
SEX
AGE AT SEPARATION
Doe SS more Diese ts ul Simo Loy em 1 yr. Aastha 5mo. oe at LS m0, eee fa T8mo." iy orm 2 yr. Seek Smo. eet ce 2 2mo,., |1 reat A @ 6mo. See fee 14 m0. RSNA)
Hirsch, N. D. M., 302, 353 Hirt, M., 284 Histogram, 24 a!
*
563
Index Hobson, J. R., 244, 245 Hofstaetter, P. R., 98 Holland, J. L., 118 Hollenbeck, G. P., 192 Hollingshead, A., 350, 362 Hollingshead,
A. B., 360, 361
Hollingworth, L. S., 248, 405, 407 Holzinger, K. J., 451, 455, 457, 487, 491 Holtzman, W. H., 117 Holzman, P. S., 227, 228, 234 Homosexuals, 261, 263, 490-491 Honzik, M. P., 68, 69, 257, 258, 484 Hood, A. B., 350 Hormones, 427-428
Intelligence (Cont.) 432; family, 482 ff.; of genius, 415; hierarchical theory of, 85, 93-94; hormones and, 427-428; idiots savants, 82-83; interest and, 196; nationality differences, 323-325; Negro-white differences, 303 ff.; nervous system and, 432-434; nutrition and, 429-430; physical characteristics and, 421 ff., 437 ff.; physiological processes and, 95-97, 427 ff.; primary mental ability, 87-88, 92: school 108 ff.; sex
achievement and, 72 ff., differences in, 243-244;
Illness, intelligence and, 423 ff.
testing, development of, 9 ff.; theoretical issues, 95 ff.; urban-rural differences, 350 ff.; varieties of, 81 ff.; vocabulary and, 82 Intelligence and Experience, Hunt, 98 IQ (intelligence quotient), 10: age and, 68; Chinese and Japanese, 326, 328; class differences, 333 ff.; creativity and, 412, 413; education and, 70, 463 ff.; family size and, 495; foster children, 457 ff.; gifted child, 397, 404, 407; group differences, 46-47; Indian, American, 324-326; mentally retarded, 374— 376, 377; Negro, 306 ff.; occupation and, 76-77; school achievement and, 75-76, 78-79; sex differences, 71; socio-economic level, 53; time interval and change in, 68-69, 111; twin studies, 451-452, 486; variability, 23, 67 ff. Interaction of variables, 56 Interests, 183 ff.: achievement and, 115; class differences, 356 ff.; developmental research in, 204-206; faking and, 191-— 192; gifted children and, 398; measurement of, 184 ff.; personality measures and, 202-204; predictive validity of tests, 192 ff.; principal dimensions of, 198 ff.; sex differences, 251 ff.; stability of vocational, 188 ff.; values and,
Imbeciles, 367, 377 Index of Status Characteristics, 332, 341, 346 Indian, American, 304, 324-326
Interpersonal aspects of personality, Introversion-extraversion, 5, 167 ff. Iowa Every-Pupil Battery, 101
Homaday, J. A., 252 Horn, J., 202
Horst, P., 112 House, B. J., 383, 384
Householder, J. E., 31 Hughes, J. L., 197 Human differences: characteristics measured, 21—22; equality and, 4—5; extent of, 22-24; research methods, 10 ff., 45 ff.; universality of, 17 ff. Human Frontier, The, Williams, 450 Humors, 5, 152
Humphreys, L. G., 204 Hunt, J. McV., 98, 317 Hurst, 489 Husen, T., 67, 69, 487
Hydrocephalics, 387 Hysteria, 168-169
I factor, 88 Identification, 270 Idiographic method, 7, 504 Idiots, 367, 377
Idiots savants, 82-83, 378-379 Igorot race differences, 304, 305
lg, F. L., 242
Infants, intelligence
class differences
in,
344
Inoculation, Institute of Research, Institutions, Intelligence,
intelligence and, 425-426 Personality Assessment and 410, 415 children of, 455 ff. 27, 42, 61 ff.: age and, 62 ff.,
281-282; blood composition and, 427; class differences in, 333 ff.; correlation research in, 72 ff.; developmental research in, 62 ff.; disease and, 423 ff.; education and, 281-282, 463 f£.; electroencephalogram and, 430-
206 ff.
Irish, intelligence levels of, 326 Irwin, O. C., 344 Iscoe, I., 265 Isle of Wight, 494-495 Italians, intelligence levels of, 327 Itard, J. M. G., 366 Ivanoff, J. M., 79
276 ff.,
J-type perceiver, 216
Jackson, D. N., 157, 228 Jackson, P. W., 412, 413 Jacob, P. E., 209
176
Index
564 Klein, G. S., 226, 227, 229, 234
Jacobson, W. E., 445 Jaensch, E. R., 5, 152, 216, 234 Jahoda, G., 258 James, William, 5, 152, 390, 507
Klein, S. J., 477 Klineberg, O., 310, 311, 312, 315, 317, 322, 327, 352, 354, 439
Jamieson, E., 325
Janke, L. L., 331, 333, 334 Janoff, I. Z., 442 Japanese, intelligence research 328
on,
326,
Jarrett, R. F., 267 Jarvik, L. F., 487, 490 Jastrow, J., 9, 211
Jenkins, J. G., 80 Jenkins, M. D., 322 Jepsen, V. L., 122 Jerome, E. A., 289
Kluckhohn, C. K. M., 209 Kluckhohn, F., 208 Klugman, S. F., 316 “k:m” category, 86 Knapp, R. H., 358
Knott, J. R., 431 Koch, A. M., 18
Kogan, N., 256, 266, 267, 503, 504
Korean intelligence level, 328 Kounin, J. S., 381, 382
Kraepelin, E., 9 Krech, D., 97, 214, 426
Jews, intelligence level of, 326, 327 Johnson, D. M., 340, 341 Johnson, M. M., 271 Johnson, Samuel, 248 Jolles, I., 385 Jones, A. W., 357 Jones, D. C., 343 , Jones, H. E., 51, 276, 279, 344, 354, 434, 483
Kreezer, G. L., 431
Jones, L. V., 91
Kuhlmann-Finch Kutner, B., 292
Jones, M. C., 445
Kretschmer,
E., 5, 170, 389,
390, 391,
416, 437, 438 Kuder, G. F., 186, 252, 356
Kuder Preference Record,
191, 192, 253
Kuhlen, R. G., 284, 291, 292
Kuhlmann, F., 377 Kuhlmann-Anderson intelligence test, 313, 314, 403
intelligence test, 315
Journal of Social Issues, 323 Jukes family, 482
Jung, C. G., 5, 6, 167-168, 170, 178, 179 Justman, J., 347
Laboratory research, 13, 15 Lacey, J. I. and B. C., 433 Laird, 168
Kagan, J., 56, 70, 71, 180, 233, 264 Kallikak family, 482 Kallman, F. J., 14, 489, 490, 491, 493 Kansas, intelligence levels in, 351-352 Kardiner, A., 324 Karon, B. P., 324
Katz, C. J., 441 Keisler, E. R., 78 Kelly, E. L., 180 Kempf, G. A., 421 Kennedy, R. J. R., 373 Kennedy, W. A., 307, 308, 309, 316
Kentucky, intelligence studies in, 353 Kephart, N. C., 375 Key, C. B., 353 Keys, A., 429
Kimber, J. A. M., 259 Kincaid, M. A., 470
King, D. P., 198
King, F. J., 435 King, L. A., 191 King, S. H., 434 Kinsey, A.C., 357 4 Kirchner, W. K., 192, 204 Kirk, S. A., 374, 376, 466 Klaus, R. A., 321
Lambeth, M., 317 Lange-Eichbaum, W., 389 Lanier, L. H., 308, 317, 322 Lansky, L. M., 265, 269 Late developers, 378 Lateral inversion, 484 Laycock, F., 423 Layton, W. L., 185n. Lazarus, R. S., 48
Leahy, A. M., 458 Learned, W. S., 103, 104, 106, 107, 110 Learning ability, 77 ff.: age differences, 288-289; mentally retarded, 382-384; practice and, 467 ff. Leary, T., 176
Keer He Se slinol2 uote Lee, daeGs 238 Lehman, H. C., 295, 297, 389 * Leibowitz, H., 97 LeJeune, J., 387 Lepkin, M., 244 Leptosome, 438
:
Lessing, E. E., 270 Levee, R. F., 379 Leveling-sharpening, Levin, H., 265, 359
e
Levin, M., 19
%
&
226-228,
232
565
Index Levine, P. R., 194
McNamara, J. J., 197
Levitt, E. A., 337 Levy, D. M., 428, 445
McNemar, Q., 91, 243, 250, 340, 341, 350, 351, 353, 380, 464, 465, 487
Lewin, Kurt, 381, 382
McPherson, M. W., 382 McQueen, R., 311, 316 Macfarlane, J. W., 68, 69 Maccoby, E. E., 359 Machover, S., 318
Lewis, H., 462
Lewis, W. D., 249, 403
Lichte, W. H., 213 Lieberman, R., 387 Life stages, 293 ff. Lindner, R. S., 316 Lindzey, G., 206
Madadi, S. R., 434 Margaret, A., 380
Lipsett, L., 195
Maher, B. A., 387 Maladjustment. See
Littman, R. A., 359
Maller, J. B., 166, 316
Livesay, T. M., 343 Livson, F., 292 Livson, N., 97, 265
Mallinson, G. G., 189 Mallory, J. N., 421 Man of Genius, The, Lombroso, 390 Manic-depressive: physique and, 438; twin studies, 490 Manual dexterity, sex differences, 246
Loading of factors, 44 Loeb, M. B., 330 Loevinger, J., 340, 449
Lombroso,
C., 389, 390, 391, 416
Long, R. I., 229, 232
Longitudinal studies, 48-49: age differences, 274; intelligence, 283 ff. Longstaff, H. P., 192 Lorge, I., 66, 71, 110, 279, 490 Louisville Twin Study, 492 Lovell, C., 170, 171 Lowenfeld, V., 216 Lubin, A., 444 Luborsky, L. B., 172 Lung capacity, 25 Lunt, P. S., 330 Lurie, L. A., 427
Lynd, R. S. and H. M., 330 Lynn, D. B., 270, 271
M factor, 88
McAndrew, M. B., 247 McArthur, C., 193, 194, 358
McCall, W. C., 253 McCleam, G. E., 476, 481, 498 McClelland, D. C., 141, 142, 254
McConnell, J. W., 357 McConnell, T. R., 110 McCoy, R. A., 191 McCuen, J. T., 121, 265 McCulloch, T. L., 368 McCurdy, H. G., 429 McDougall, 202 McElroy, W. A., 258 McGee, E., 378 McGraw, M. B., 454 McGuire, C., 348 McGurk, F. C., 316
‘McIntosh, W. J., 373 McKay, G., 269
McKee, J. P., 180, 257, 268 McNeil, J. D., 78
Neuroticism.
Marston, 168 Martin, H. G., 170 Martin, L., 293
Marzolf, S. S., 254 Masculinity-femininity scales, 260 ff. Masland, R. L., 369 Mathematical ability, 245 Matrix, 44
Maturing, sex differences, 242, 265 Mauldin, W. P., 352 May, M. A., 13, 153, 162, 166
Maze-running ability of rats, 477 Mead, Margaret, 267, 271 Mean, in descriptive statistics, 31 Measurement, 7 ff., 500: characteristics measured, 21-22; distribution in, 24 ff.; of interests, 184 ff.; units in, 23-24 Mechanical aptitude, 139, 143-144 Medawar, P. B., 497 Medical profession, 122, 194, 197 Meeker, M., 332 Meenes, M., 343 Mefferd, R. B., 435 Meili, R., 96, 97
Melville, S. D., 195 Memory, 88: age differences, 290; sex differences, 246 Menninger Foundation: cognitive research, 226 ff.; twin studies, 492 Mental ability. See Intelligence. Mental age, 10, 63-65, 71 Mental Deficiency Act of 1913, 367 Mental growth curve, 63 ff. Mental Measurements Yearbook, Buros, 153 Mental tests: sampling, 51; use of term, 9. See also IQ. Mentally retarded, 82-83, 365 ff.: administrative view of, 368; age and, 369; changing concepts of, 365 ff.;
Index
566 Mentally retarded (Cont.) definition of, 370; diagnosis, 385, 386—
388; follow-up studies, 370ff.; IQ change, 374-376, 377; learning process, 382-384; levels of, 367; medical view of, 365-366; mothers, 460; personality differences, 384-386; practical research on, 377 ff.; psychometric view of, 366-367; rehabilitation, 381; rigidity, 381; sex differences, 248-249, 370; sociological concept of, 367-368; theoretical research on, 381 ff. Merrill, M. A., 67, 70, 340, 350, 353 Merrill, W. R., 118 Mesomorphy, 439 ff. Messick, S., 157, 228 Metfessel, M., 448 Metropolitan Achievement Tests, 101 Mexicans, intelligence level of, 326 Meyer, W. J., 92 Meyers, C. E., 92 Michael, W. B., 93 Michigan, University of, 359 Michigan Twin Study, 488 Microcephalics, 387 Middletown, 330 Midwest Project, 333 Miele, J. A., 246, 247 Migration, selective, 310, 351-352 Miles, C. C., 239, 260-261, 263, 279, 281, 286, 393, 396, 400 Miles, W. R., 279, 281, 286, 287, 297 Miller, D. E., 359 Miller, D. R., 175 Miller, K. S., 315 Milner, E., 269, 358 Milton, G. A., 256 Minnesota Clerical Test, 145, 247 Minnesota Employment Stabilization Research Institute, 134 Minnesota Multiphasic Personality Inventory, 117, 157, 163, 174, 175, 429, 491, 492 Minnesota Paper Form Board, 313 Minnesota Vocational Interest Inventory, 187, 195, 197 Mitchell, B. C., 457 Mitchell, J. V., 347 Models, 43, 140 Moderator variables, 141, 519 Mongolians, 387 Monkeys, variability in, 17-18 Montagu, M. F. A., 308 Moore, J. E., 317 Moore, R. C. A., 359 Moreland, H. J., 435.4.« Morgan, C. T., 448 Morgan, E. F., 265 Morons, 367, 370 ff., 377
Morris, C., 207 Mosier, M. F., 356 Moss, H. A., 56, 180, 233, 264
Motivation, 114 ff.: Negro-white intelligence and, 316-317; perception and, 214; sex differences, 254-255 Motor coordination, 144-145: age differences, 286, 287-288; racial differences, 304-306
Moursy, E. M., 86 Muench, G. A., 373 Mullen, F. A., 374 Mundy-Castle, A. C., 431 Munroe, R. L., 116, 163
Miinsterberg, H., 9 Murphy, G., 505 Murphy, L., 232 Murray, H. A., 140, 175 Musical talent, 147, 246 Mussen, P. H., 270 Myers, C. S., 96 Myers, I. B., 178, 179, 504 Myers, R. C., 118 Myers-Briggs Type Indicator,
6,
178,
179, 414, 504
N factor, 87, 93 National Intelligence
Test, 325 National Merit Scholarship, 492 National Society for the Study of Education, 457 Nationality differences, 326-328 Nebraska moron study, 372 Negrito race differences, 304, 305 Negro: blood types, 302-303; -white intelligence differences, 306 ff., age differences, 306-307, geographical differences, 308 ff., heredity and, 315, personality differences, 323 Neidt, C. O., 118 Nervous system, 432-434 Netherlands, tests in, 343 Neuroticism,
162 ff.: class and, 360, 362;
sex differences, 256-257; twin studies, 49] Newell, A., 98 Newman, H. H., 451, 453, 487, 491 Newton, E. S., 320, 321
New York Psychiatric Institute, 489 New York State Charities Aid Association, 456 Nichols, R., 118, 487, 492 Nisbet, J. D., 283, 496
Noegenesis, 85
.
Noll, V. H., 259
Nomothetic method, 7 Nonintellectual traits, 12-13 Nonverbal tests, development &Ss
of, 11-12
567
Index
Performance tests vs. verbal tests, 81 Perl, R. E., 91 Personality, 151ff.: achievement and, 115-116, 120; age differences, 290 ff.; class differences, 356 ff.; definitions, 151-152; ego-strength and, 175; extraversion-introversion, 5, 167 ff.; genius,
Normal curve, 25
Norman, R. D., 247 Norrell, G., 198 Northby, A. S., 241 Nosow, S., 332 Nugent, F. A., 203 Nursery school, 464—465 Nutrition, 424, 429-430
395, 396, 398-399,
Objective perceivers, 215
Objective personality evaluation, 160-162 Occupation: aptitude and, 132 ff., 148— 150; class and, 332; father’s, genius and, 394; IQ and, 76-77, 336 ff.; sex differences, 252. See also Vocational interests.
O’Connor, N., 369, 374, 381 Odbert, H. W., 7, 153, 172 Oden, M., 14, 122, 195, 283, 397, 399, 401, 404, 407, 408, 410 Odum, H. W., 300
Oehmn, A., 9 Oetzel, R. M., 258, 259 Olander, H. T., 111 Oldtown, 330, 331
Opinion research, 51, 357 Orpet, R. E., 92
Orphanage nursery school, 464-465 O’Shea, H. E., 430 Osler, S. F., 80 Otis, A. S., 11
Otis Quick-Scoring 63, 347, 351
Mental
407-408;
heredity
and, 491; interpersonal aspects of, 176; mentally retarded, 384-386; Negrowhite differences, 323; neuroticism,
Ability Test,
162 ff.; physical characteristics and, 422, 437 ff.; sex differences, 251 ff., 264-266; stability over time, 179-181 Personality evaluation: behavioral and physiological tests, 160-162; electroencephalogram, 431; empirical group comparisons; factor analytic research, 170 ff.; field dependence, 220 ff.; interests and, 202-204; projective techniques, 159-160; questionnaires, 156 ff.; ratings, 155-156, 172; twin studies, 453-454; types, research in, 48 Personality and Motivation: Structure and Measurement, Cattell, 173 Personality Through Perception, Witkin et al., 220 Peterson, J., 211, 308, 317, 322 Peterson, P. G., 292 Pettigrew, T. F., 229, 256, 323
Phenomenal regression, 212 Philadelphia Tests of Mental and Verbal Ability, 311, 312
Phillips, E. L., 356, 426
Pairing of control group, 54
Physical handicaps, 423 ff. Physical strength, age and, 288 Physicians, 122, 194, 197 Physiological processes, 21, 95-97, 427 ff.: mentally retarded and, 384, 387; personality and, 160-162 Physique, 423, 437 ff.
Paramecia, 20
Piaget, J., 98, 229, 234, 317, 504
Parker, J. F., 145 Parnell, R. W., 443 Passive perceiver, 215-216
Pickrel, E. W., 97 Pierce-Jones, J., 359 Pinneau, S. R., 67
Passow, A. H., 322, 323, 348, 363 Pastore, N., 447, 493 Patel, A. S., 259 Paterson, D. G., 76, 128, 143, 247, 280, 342, 343, 423, 425, 426
Pintler, M. H., 269 Pintner, R., 324, 326, 350
Ovesey, L., 324 Owens, W. A., 283, 469
P factor, 87 Page, J. D., 465
Payne, D. E., 270
Peck, R. F., 292, 362 Peel, E. A., 188 Pegram, E. L., 464 Pemberton, C. L., 219, 220 Perception: age differences, 286—287; learning, 289; Negro-white intelligence and, 319-320; sex differences, 255— 256. See also Cognitive style.
Pintner-Cunningham intelligence test, 325,
353 Plainville, 330 Plant, W. T., 76 Plato, 4 Poe, E. A., 389, 390 Point-of-reference, 200-201 Pool, D. A., 203
Population Porter, D., Porteus, S. Portuguese
trends, 494 ff. 423 D., 245
intelligence, 328
Index
568
Random sampling, 50-51, 55 Range of Human Capacities, The, Wechsler, 22
Position discrimination, 18-19 Practice, 467 ff.
“Prairie City,” 362 Pratt. W325 Prediction of predictability, 141 Predictive validity, 41: achievement tests, 111 ff.; creativity tests, 414; intelli-
gence testing, 72 ff.; interests tests, 192 ff.; motivational factors, 114 ff. Prell, D. B., 169, 491 Pressey, S. L., 316, 403 Pressey Mental Survey Test, 343 Price, B., 493 Price, P. B., 122, 132
Primary mental abilities, 87-88 Primary Mental Abilities Battery, 92, 112, 279, 336, 488 Problem solving, 245, 256 Professional students, tests for selection of, 148 Proficiency criteria, 132 Programmed learning, 78 Project Talent, 107-108 : Projective tests: achievement, 115-116; mentally retarded, 385; personality,
159-160 Protozoa, 19-20
Pseudo-feeble-mindedness, 385-386 Psychological Corporation, 264 Psychological Differentiation, Witkin et al:, 220 Psychological Types, Jung, 178 Psychological units, 23-24 Psychology, development of, 8 Psychosis, 163-165, 170: class and, 360, 362; physique and, 431-433; senile, heredity and, 490; twin studies, heredity and, 489-490 Public opinion research, 51, 357 Puerto Rican intelligence, 328 Purdue Pegboard, 379, 380 Pygmies, race differences, 304, 305 Pyknics, 438 Quantitative
methods,
development
Questionnaires, personality, Quetelet, 8, 30-31
of,
156 ff.
R factor, 93
Range ratio, 22 Rarick, G. L., 379
Raskin, A., 380 Ratings, personality, 155-156, 172 Rats, studies of, 19: heredity, 476 ff.; hoarding behavior, 448 Raven, J. C., 278, 337 Raymond, S., 48 Razran, G. H. S., 19 Reaction range, 498 Redlich, F. C., 360, 361 Reed, S. C., 496
Regression toward mean, 376 Reichard, S., 292 Reid, J. W., 189
Reliability of measurement, 39, 40 Research, 39 ff.: causes and effects, 52 ff.; correlational, 39 ff., 72 ff.; development of, 10 ff.; developmental, 48-49, 62 ff., 204-206; group differences, 45 ff.; new concepts from, 502 ff.; sampling, 49 ff.; special abilities, 127-129 Response set, 157 Restructuring, 245, 256 Rhodes, A., 317 Rhymer, R. M., 172 Richardson, H., 76 Rigidity, 381
Rimoldi, H. J. A., 90 River City, 331-332, 335, 350
Robinson, M. L., 343 Rod-and-Frame Test, 221 Rodgers, D. A., 481 Roe, A., 406, 410
Roller, R. D., Jr., 425 Roper, S., 188
Rorschach studies, 385, 386, 410, 411 Rosen, E., 257, 258, 263
Rosenberg, B. C., 265 Rosenberg, N., 189, 263 Rosenthal, D., 493 Rosenzweig, M. R., 432 Ross, J., 179, 204 Ross, S., 430 Rotating-Room Test, 221 Rothmann, E., 82-83
Rabban, M., 269
Rotter, J. B., 121 Ruch, F. L., 289 Rural-urban class
Rabson, A., 233 Race differences,
Russia,
Rabin, A. I., 321
299 ff.:
Chinese
and
Japanese, 326; early research in, 304— 306; Indian, Amegie¢an, 324-326; na-
tionality, 326-328; Negro-white, 306 ff. Races of Mankind, Benedict and Weltfish, 308
differences,
intelligence
and
350 ff. occupation in,
343
c
Rutherford, E., 270
.
“oo
s,’ Spearman’s, 85 S factor, Thurstone’s, 87
St. Louis World’s Fair, 304-305 &S
569
Index Sampling, 35-36, 49 ff. Sanders, E. M., 435 Sandiford, P., 325
Sandstrom, C. I., 256 Sandwick, R. L., 425 Sanford, G. A., 259, 352 Sarason, S. B., 369, 385, 386, 387 Sargent, S. S., 472 Satter, G., 378 Saudek, 453
Saul, L.G,, 431 Saunders, D. R., 172 Scandinavian intelligence, 326, 327 Scanning, 228-229 Schaefer, E. S., 265 Schaefer, T., Jr., 466, 467 Schaie, K. W., 279, 335 Scheerer, M., 82-83, 95, 96, 378 Schematizing Test, 227 Schiele, D. C., 429 Schizophrenia: physique and, 438; twin studies in, 489-490 Schlesinger, H. J., 226, 229, 234 Schmidt, B., 374, 455 Schneidler, G. G., 247 Schoen, R. A., 228, 229
School and, and, tors, sex
achievement, 100 ff.: intelligence 72 ff., 78-79, 108 ff.; personality 120; prediction, motivational fac114 ff., special abilities, 111 ff; differences, 241; sources of vari-
ation in, 108 ff.; success in later life and, 121-123; underachievement, 119— 121, 265
School and College Ability Tests, 113 Schulman, M. J., 335 Science achievement, 247
Scientific Study of Personality, The, Eysenck, 162 Scientists, studies of living, 408 ff. Scott, J. P., 481 Scottish intelligence levels, 326: class and, 355; occupation and, 337-340 Scottish Council for Research in Education, 51 Searle, L. V., 477 Sears, P. S., 269 Sears, R. R., 265, 269, 359
Seashore, C. E., 147 Seashore, H. G., 264 Seashore, R. H., 144, 472 Second-order factors, 90-91 Seder, M. A., 252 Seguin, 366
Seguin Form Board, 305
Selection, individuality and, 505-506 Selection of personnel, 126, 127 Selective migration, 310, 351-352
Selective
Service
College
Qualification
Test, 106
Self-correlation, 39 Self-report inventory, 156 ff. Seltzer, C. C., 442 Semantic ability, 89 Sensory differences, 304—306 Set, perception and, 214
Seward, G. H., 271 Sex differences, 46, 52, 239 ff.: in achievement, 240 ff., 254-255; in adjustment and maladjustment, 256-257; in aggression, 258-259, 265; class differences and, 334; in cognitive style, 255— 256; in emotional needs, 257-258; in gifted, 249; in interests and values, 205-206, 251 ff.; in IQ variability, 71; in masculinity-femininity scales, 260 ff.; in maturing, 242, 265; in mental retardation, 248-249, 370; in personality, 181, 251 ff., 264-266; in sex-role concepts, 266 ff.; in social sensitivity, 259260; in tested abilities, 240 ff. Sex-hormone production, 428
Sex-role concepts, 266 ff. Shagass, C., 431 Shakespeare, 293 Shakow, D., 280 Shape: constancy, 213; 18-19 Sharp, S. E., 9, 212 Sharpeners, 226-228, 232 Shaw, D. G., 93 Shaw, J. C., 98 Shaw, M. C., 121, 265 Shedd, C. L., 347 Sheehan, M. R., 213
discrimination,
Sheldon, W. H., 437 ff. Shepard, E. L., 351 Shepler, B. F., 263 Sherman, M., 353
Sherriffs, A. C., 267, 268 Shimberg, M. E., 354 Shuey, A. M., 306
Sibley, E., 349 Siblings, foster, 457 ff. Siegel, B., 442 Sigel, I. E., 233
. Sills, F. D., 444 Simmons, K., 70
Simon, H. A., 98 Simon, L. M., 337 Simrall, D., 77 Sims Score Card, 314 Siners, C., 319
Sirkin, M., 343 Skeels, H. M., 375, 376, 459, 460, 461 Skewed distribution, 27 Skodak, M., 459, 460
Index
570
Statistics, 30-31: descriptive, 31 ff.; inferential, 35-36; significant, 35 Stein, M. I., 140 Steinberg, A., 203 Stephens, M. A., 121
Slater, E., 491
Sloan, W., 377, 379, 380, 385 Smillie, W. G., 425 Smith, F. W., 431 Smith, H. A., 80 Smith, H. C., 442 Smith, M. B., 209 Smith, S., 268, 327, 463 Smith, W. D., 269 Social age, 368 Social class. See Class. Social Class in America, Warner Sin
Stern, G. G., 140 Stern, W., 10, 11
et al.,
Stevens, S. S., 440, 442 Stewart, N., 337 Stockard, C. R., 481 Stolurow, L. M., 78, 80 Stolz, H. R. and L. M., 445
Stone, C. P., 428
Social desirability, 157
Stone, V. W., 197
Social learning theory, 121 Social Science Research Council, 141 Social sensitivity, 259-260
Stordahl, K. E., 189, 190 Strategies, research in, 502-503 Strayer, L. C., 454 Stricker, L. J., 179, 204 Strodtbeck, F. L., 208, 321
Society for the Psychological
Study
of
Social Issues, 317 Sollenberger, R. T., 428 Somatotypes, 437 ff. Sommer, R., 246 Sontag, L. W., 71, 433 Sorenson, H., 280
Soufi, A., 174 Southern California: aptitudes project, 88; creativity studies, 411-412 Spatial relationships, 245 Spearman, C. E., 85, 90, 165 Special aptitudes and talents, 124 ff.: age differences, 286 ff.; clerical, 146-147; converging research, 127-129; general,
146-147; human needs and, 124-127; idiots savants, 82-83, 378-379; inventory of, 143 ff.; mechanical, 143-144; motor coordination, 144-145; musical and artistic, 147-148, 246, 411; new approaches to, 148-150; prediction of, 111 ff.; professional students, 148; promising directions in, 139 ff.; validity
problem in measuring, 129 ff. Speed of closure, 219, 220 Speed factor in race differences, 317
Strong, E. K., Jr, 12=13) 1857) 188s 251, 270, 290, 291, 324, 356 Strong, F. W., 204 Strong Vocational Interest Blank, 184, 189 ff., 204, 252, 402, 414 Structure
of Human Personality, The, Eysenck, 162 Structure of Mental Abilities, The, Vernon, 85 Study of Values, 206-207 Subjective perceivers, 215 Subnormality, 386-387. See also Mentally retarded. Suburban intelligence levels, 350 ff. Super, D. E., 115, 148, 188, 208, 295 Sutton-Smith, B., 263, 265 Swanson, G. E., 359
Sward, K., 281 Sweeney, E. J., 245 Symbolic ability, 89 Symonds, P. M., 168, 180
Synthesizers, 215 Szafran, J., 288
Spencer, C. R., 425
Taba, H., 118, 362, 363
Spencer, H., 390 Sperrazzo, G., 319
Talents.
Spier, L., 302 Spitzer, H. F., 102 Spranger, E., 5, 152, 207
Tanser, H. A., 313, 314, 315, 322, 325 Tate, M. W., 347 Taxes, 19
Stability coefficient, 39, 40
Taylor, D. W., 246n. . Taylor, K. von F., 189 Taylor, R. G., 120 Teaching machines, 78 Temperament, physique and, 437 ff. See also Personality.
Stacey, C. L., 379, 380
Stalnaker, E., 315, 316, 425 Standard deviation, 31 ff. Stanford Achievement Test, 315 Stanford-Binet Test, 10, 41, 67, 70, 76, 309, 311, 348, 354, 355, 366, 380, 399,
429
coni
Stanford Later Maturity Study, 281, 286,
289, 291
See Special aptitudes
and tal-
ents.
Tempero, H. E., 79
»
Tennessee intelligence studies, 353-354 10,000 Careers, Thorndike and Hagen, 133 &
571
Index Terman,
L. M., 10, 14, 49, 67, 70, 122,
195, 242, 260-261, 395, 397, Terrell, C., Terrell, M.,
244 245, 249, 250, 253, 257, 263, 283, 340, 350, 353, 367, 399, 403 ff., 411 121 321
Terry, R. A., 433
Testing:
development
of, 9-10,
62 ff.;
predictive validity of, 72 ff. (See also Predictive validity); relationships between types of, 81 ff. Theis, S. V., 456 Thematic Apperception Test, 358, 386, 410, 411 Thirty-Ninth Yearbook of the Society for the Study of Education, 465 Thompson, C. W., 69, 283, 377, 380 Thompson, H., 454 Thompson, L., 306
Turpin, R., 387 Twin studies: environmental, 450 ff.; hereditary, 486 ff. Two-Hand-Coordination Test, 222-223 Tyler, LL. E., 29; 31, 92, 149, 189) 1915
203, 205, 242, 244, 245, 254, 257, 263, 265, Tyler, Tylor, Types,
356, 501 R. W., 110 E. B., 300 5-7, 29, 152, 176, 504
Uhlinger, C. A., 121 Underachievement, ences in, 265
119-121:
sex
differ-
United States Employment Service, 146 Universal intelligence testing, 12 Unrealistic experience, tolerance for, 229 Urban-rural intelligence differences, 350 ff.
Thompson, W. R., 466, 467, 476 Thomson, G., 494, 495
Thorndike, E. L., 132, 289
Thorndike, R. L., 66, 120, 133, 134, 281.
V factor, 87, 88, 93
Tilton, J. W., 78, 79, 469 Time factor, causes and, 54
Validity, 40: of aptitude tests, 128, 129 ff.; construct, 158; factorial, 158; predictive, 192 ff., 414. See also predictive validity. Values, 152, 206 ff.: sex differences in, 251 ff. Vandenberg, S. G., 488, 489, 491 Van der Giessen, R. W., 343 Van de Riet, V., 307, 308, 309 Van Lehn, R., 433
Time interval, intelligence tests and, 68—
Van Wagenen, M. J., 111
69, 111 Tizard, J., 369, 370, 379, 381
Variability:
401
Thouless, R. H., 212, 213, 218, 306 Thurstone, Ib. L., 43, 664., 171, 217, 219, 220 Thurstone, T. G., 43, 86, 87, 91, 92 Tilting-Room-Tilting-Chair Test, 221, 222
Toal, R., 319
Tobias, J., 379
Tolerance for unrealistic experience, 229 Tolman, E. C., 19 Tomkins-Horn Picture Arrangement
Test.
324 Tomlinson, H., 319 Toops, H. A., 51 Torrance, E. P., 413 Torres Straits, 304, 305
16 ff.;
extent
Variance, analysis of, 55, 469 “V:ed” category, 85, 86, 114 Verbal ability, 87, 88: sex differences in, 244-945 Verbal destitution, 320 Verbal tests: Negro-white intelligence and, 316; vs. performance tests, 81 Vernon, M. D., 214, 215
132
Trautman, G. E., 80 Travers; R. M. W., 111 ‘Pravis, L. E., 431
Traxler, A. E., 253 Trend of Scottish Intelligence, The, 495 Trinkaus, W. K., 189 Trout, D. M., 122 ‘Tryon, R. C., 19, 476, 477 Tucker, A. C., 194 Tuddenham, R. D., 180, 268, 463 Turner, W. S., 180
individuals,
Variability coefficient, 250
Todd, F. C., 121
Training criteria for aptitudes, Traits, 5—7, 29, 38, 153, 176
among
descriptive statistics and, 31; of human, 22-24; IQ, 67 ff.
Vernon, P. E., 66, 85, 94, 95, 114, 135, 138, 168, 206, 282, 496 Vienna, University of, 294-295 Vincent, D. F., 276
Vineland Social Maturity Scale, 368 Visual perceiver, 216 Vocabulary: age and, 82, 280-281; sex differences, 244-245 Vocational interests, 184 ff.: dimensions of, principal, 198 ff.; predictive validity of tests, 192 ff.; stability, 188 ff. See
also Occupation. Vocational
Interests
lege, Strong, 192
18 Years After Col-
572 Vocational psychology, Vogel, W., 48 Voss, C. E., 347
Index 126, 148-150
“w’” factor (will), 165 W factor (word fluency), 87, 88 Walker, H. M., 317 Walker, R. N., 443
Wallach, M. A., 141, 256, 266, 267, 311, 503, 504 Wallen, R., 194 Walter, L. M., 254 Walter, W. G., 432 Walters, J., 359
Warner, W. L., 330, 332 Warren, J. M., 18-19
Ways to Live, Morris, 207-208
Webb, E., 165, 166 Wechsler, D., 22-23, 81, 82, 98, 278 Wechsler Adult Intelligence Scale, 244 Wechsler-Bellevue Test, 278-279, 318, 337 Wechsler Intelligence Scale for Children, 224, 244 Weitz, H., 264 Welford, A. T., 287, 288
Wellman, B. L., 244, 464, 465, 466 Wells, F. L., 80 Wells, W. D., 442 Weltfish, G., 308, 309 Wembridge, E. R., 371, 372 Wenger, M. A., 432, 433 Wernimont, P., 197
Wertheimer, F. I., 438 Wesman, A. G., 247 Westenberger, E. J., 425 Wheeler, L. R., 353, 463 White, B. W., 220
White, J. C., 307, 308, 309 Whitehorn, J. C., 197
Wilkins, W. L., 319 Williams, R., 80
Williams,R. J., 21, 434, 435, 437, 498 Wilson, 191
Wilson, F. T., 415 Wilson, J. W., 195 Wissler, C., 212 Witkin, H. A., 220, 222,°293-095" 234, 255, 256 Wittenborn, J. R., 144, 461 Wittman, P., 440, 441 Witty, P. A., 249, 389, 408 Wolfe, L. S., 393 Wolfle, D., 125, 126, 349 Wood,
B. D., 103,
104,
106,
107,
226,
110,
111 Woodrow, H., 77, 78, 384, 471, 472 Woods, W. A., 319 Woodworth, D. G., 226, 410 Woodworth, R. S., 9, 304, 305, 451, 453, 462 Woolley, H. T., 236 Worbois, G. M., 132 a
Work methods, 472
Work Values Inventory, 208 Wrenn, C. G., 76
Wright, B. A., 445 Wrightstone, J. W., 322 Wundt, 9 X factor, 114
“Yankee City,” 330, 331 Yannet, H., 387
Yarbrough, M. E., 429 Yarrow, L. J., 462
Yela, M., 219 Yerkes, R. M., 11, 276, 277 Zeaman, D., 383, 384 Zigler, E., 382 Zimmerman, F. T., 171, 430
Zook, E. A., 269 Zubek, J. P., 498 Zubin, J., 316 Zuckerman, M., 263 Zunich, M., 359, 360
0-13-734939-4