The Point and Figure Method of Anticipating Stock Price Movements 1883272831
305 71 16MB
English Pages [177] Year 1933
The Point and Figure Method of Anticipating Stock Price Movements: Complete Theory and Practice - Front Cover
Title Page
Summary Note
Printer's Imprint
Contents
Authors' Preface
I: The Principles of the Point and Figure Method
Logic Is the Basis of This Method
Irrelevant Fluctuations Eliminated
How the Method Got Its Name
Graphs Are Logical and Scientific
Introductory Summary of Important Principles
Needed Accessories Are Few
Plotting a Stock Price Movement
One-Point Charts the Basis of the Method
Accessories and Working Tools
II: The Weight of Authority Behind This Method
Refined to Coordinate with Present Day Markets
Mystery and Complications Have Been Clarified
Expensive Financial and Economic Reports Unnecessary
Certain Factors Taken for Granted
Analytical Technic Easy to Master
Losses Limited While Profits Accrue
Method Weighs Forces of Buying and Selling
III: Advantages of This Method Over Others
Speed and Ease of Recording Data
The Method Ignores Volume
Price Changes Versus Volume
Supply Versus Demand
Volume Easily Manipulated
Facility of This Method
The Utter Simplicity of the Records
Manipulation Readily Detected
Use All Full-Figure Changes in Making Charts
Method Is Superior to Inside Information
Isolation Develops Best Results
Our Charts Reveal Plans of the Majority
How the Move Begins
Stock Market Trading Is a Business
Inside Information Unnecessary
One-Point Charts Show All
IV: The Vital Points
Vital Point I - Recording Full-Figure Changes
Vital Point II - Only Full-Figure Changes
Vital Point III - Suitable Graph Paper
Vital Point IV - Use of Horizontal and Vertical Columns
Vital Point V - Trend Reversals
Vital Point VI - Only One Symbol to a Square
Vital Point VII - Move Over Diagonally
Vital Point VIII - Skip No Squares
Vital Point IX - Formation of Congestion Area
Vital Point X - The Full Fulcrum
Vital Point XI - First Buying Point
Vital Point XII - The Catapult
Vital Point XIII - Secondary Buying Point
Vital Point XIV - The Semi-Catapult
Vital Point XV - Third Buying Point
Vital Point XVI - Watch for Distribution
Vital Point XVII - Trend Lines
Vital Point XVIII - Forecasting the Extent of the Move
V: Approved Method of Assembling and Maintaining Proper Data
The Ticker Tape
Source of All Data
Daily Full-Figure Fluctuations Available
Method Ideal for Those at Distant Points
Application of the Data
How to Prepare and Collate the Needed Data
Proper Graph Paper Helpful
Arrange Charts Orderly
How to Select the Issues to Record
Clarifying the Use of the Symbols
Moving to Next Vertical Column
Use of Symbol "0"
One Cardinal Principle
Gaps Are Not Recorded
How the Gap Occurs
Plotting the Gap
The One-Point Chart
The Three-Point and Five-Point Charts
Condensing the One-Point Moves
Other Helpful Aids
The Method Substitutes for Tape Reading
Trend Outline and Geometrical Charts
The Proper Issues to Chart
Commodity Price Movements
VI: The Scientific Fundamentals
The Fulcrum
Leverage
Watch for a Fulcrum
The Ideal Full Fulcrum
Down Trend a Prerequisite to Fulcrum Formation
Supply Equals Demand
Advantage of Figure Charts
The Buying Points
The Broad Fulcrum
The Recoil Fulcrum
The Catapult
The True Catapult
The False Catapult
The Semi-Catapult
Use "Stops" to Protect Position
VII: The Principles of Charting
The One-Point Chart
Move to Next Column
Signs of a Fulcrum
Technical Aids
The Three-Point Chart
Determining Three-Point Moves
The Use of Five-Point Charts
VIII: Analyzing Technical Position
The Price Path Characteristics
Patterns of the Leaders Duplicated in the Secondary Issues
Solid Formations Give Confidence
Watch for Changes in Activity
Strong and Weak Technical Position
Weak Technical Position
Gauging the Length and Culmination of the Moves
The Count
Coordinating Your Studies
IX: Anticipating the Action of U.S. Steel
The Full Ideal Fulcrum
The Catapult Position
The Semi-Catapult Position
Consolidating the Gains
The Final Mark Up
The End of the Move - A Reverse Fulcrum
The Short Positions
Geometrical Charts
The Trend Outline Charts
The Three-Point Figure Charts
The Five-Point Charts
Summary
X: Analyzing a Campaign in Western Union
Selecting the Fast Moving Issues
The Full Fulcrum Base
The Catapult
The Semi-Catapults
The Short Positions
Summary
XI: Judging the Minor Swings
The Half-Hourly Index of the Dow Jones Industrials
The Half-Point Half-Hourly Log
Half-Point Technic
Scientific Tape Reading
Analyzing the Half-Point Chart
Ignore Rumors and Gossip
Summary
XII: Half-Point Technic in Atlas Tack
Historical Background
Analyzing the Campaign in Atlas Tack
Important Signal During July Break
The First Caution Signal
Boardroom Observations
The Shorts Began to Cover
Point and Figure Analysis
XIII: The Main Trend and Major Cycle Culminations
Critical Culmination Points Easily Detected
The One-Point Chart - The Basis for Analysis
Interpreting an Intricate Major Culmination
The First Temporary Top
Semi-Catapult Point - Unusually Bullish Pattern
Strength Carries Through Objective Level
The Change Over of Technical Action
The Top of the Move Clearly Indicated
Indications of a Major Culmination
Bear Trend Technical Action
The Investor or Long-Term Trader
XIV: Technical Indications at a Turning Point
The Change to an Up Trend
The Change to a Down Trend
Conclusion
Compendium of Charts - Figures 1 through 30
Trading Resource Guide
Rear Cover
Recommend Papers
![The Definitive Guide to Point and Figure: A Comprehensive Guide to the Theory and Practical Use of the Point and Figure Charting Method [2nd Revised Edition]
0857192450, 9780857192455](https://ebin.pub/img/200x200/the-definitive-guide-to-point-and-figure-a-comprehensive-guide-to-the-theory-and-practical-use-of-the-point-and-figure-charting-method-2nd-revised-edition-0857192450-9780857192455.jpg)


- Author / Uploaded
- de Villiers
- Victor and Taylor
- Owen
- Commentary
- First Edition July 1933. Second Edition January 1934. Reprinted 2000.
File loading please wait...
Citation preview
THE
POINT & FIGURE METHOD OF ANTICIPATING STOCK PRICE MOVEMENTS BY VICTOR DE VILLIERS AND OWEN TAYLOR
The Point and Figure Method of Anticipating Stock Price Movements Complete Theory and Practice
by VICTOR DE VILLIERS
and OWEN TAYLOR
Title and Contents Copyrighted 1934 Printed in U.S.A. First Edition July 1933.
Second Edition January 1934.
ONLY METHOD LoqlcClI
IIAJEt
oセ
jciセエQャゥ」
and
MECHANICAL PRINCIPLE! JI.I c セ
ThtJ' セechaセic l 、セカャッ ョi
(J'"
THE levセ ••• THE fULCRUM•• THE CATAPULl: • jpNiセc plejG
111
Jtock
art Gill
I>rlc(,
PROfiT' ARE
セッカ エョHL ャエB
AVAILABLE FOil
THOlf WHO WILL AP'LY theセ
JCIENTIFIC MECHANIC" POINT FIGURE dohteセ (HARTl .P
AND
セ
FORCE
I
セ
セ
FLjVER
V セ
LEVERAGE
•
CATAPULT ACTION !:::. •. JC.. )(;
...• Q
·:•• CATAPULT
セQiャ[ᄋ]
Q
•• •••UI
セZ]
• • :a;•••• •••
..
• ••
JIll_
••••
.....--FULCRU.. ---..
LEVERAGE
LEVERAGEANDCATAI>ULT ACTION CREATE·fROFITt FOR YOU
Copyright © 1934 by Victor De Villiers and Owen Taylor. Trading Resource Guide and cover Copyright © 2000 by Marketplace Books Published by Marketplace Books This publication is designed to provide accurate and authoritative information in regard to the subject matter covered. It is sold with the understanding that neither the author nor the publisher is engaged in rendering legal. accounting, or other professional service. If legal advice or other expert assistance is required, the services of a competent professional person should be sought. From a Declaratlon of Prlnclples jointly adopted by a Committee of the American Bar Association and a Committee of Publishers.
This book, along with other books, are available at discounts that make it realistic to provide them as gifts to your customers, clients and staff. For more information on these long-lasting, cost-effective premiums. please call John Boyer at 1-800-424-4550 or e-mail [email protected]
ISBN 1-883272-83-1 Printedin the United States of America.
Contents Authors' Preface
xi
1
I: The Principles of the Point and Figure Method Logic Is the Basis of This Method 2 Irrelevant Fluctuations Eliminated 3 3 How the Method Got Its Name Graphs Are Logical and Scientific. . . . . . . . . . . . . . . . . . . .. 4 4 Introductory Summary of Important Principles Needed Accessories Are Few 5 Plotting a Stock Price Movement. . . . . . . . . . . . . . . . . . . . . 6 One-Point Charts the Basis of the Method 6 Accessories and Working Tools 7
9
II: The Weight of Authority Behind This Method Refined to Coordinate with Present Day Markets Mystery and Complications Have Been Clarified. . . . . . . . . . Expensive Financial and Economic Reports Unnecessary Certain Factors Taken for Granted Analytical Technic Easy to Master Losses Limited While Profits Accrue. . . . . . . . . . . . . . . . . . Method Weighs Forces of Buying and Selling . . . . . . . . . . .
10 11 11 12 12 13 14
III: Advantages of This Method Over Others . . . . . . . . .
Speed and Ease of Recording Data .............. The Method Ignores Volume Price Changes Versus Volume . . . . . . . . . . . . . . . . . . . . . . Supply Versus Demand. . . . . . . . . . . . . . . . . . . . . . . . . . . Volume Easily Manipulated Facility of This Method v
15 15 16 16 17 17 18
The Utter Simplicity of the Records. . . . . . . . . . . . . . . . . . 18 Manipulation Readily Detected 20 Use All Full-Figure Changes in Making Charts 21 Method Is Superior to Inside Information 22 Isolation Develops Best Results . . . . . . . . . . . . . . . . . . 22 Our Charts Reveal Plans of the Majority 23 How the Move Begins 24 Stock Market Trading Is a Business . . . . . . . . . . . . . 25 Inside Information Unnecessary 25 One-Point Charts Show All 26 IV: The Vital Points. . . . . . . . . . . . . . . . . . . . . . . . Z7 Vital Point I - Recording Full-Figure Changes 28 Vital Point II - Only Full-Figure Changes 29 Vital Point III - Suitable Graph Paper . . . . . . . . . . . . . . .. 29 Vital Point IV - Use of Horizontal and Vertical Columns 30 Vital PointV - Trend Reversals 30 Vital PointVI - Only One Symbol to a Square. . . . . . . . . .. 30 Vital PointVII - Move Over Diagonally 32 Vital Point VIII - Skip No Squares 32 Vital Point IX - Formation of Congestion Area . . . 32 Vital PointX - The Full Fulcrum . . . . . . . . 33 Vital Point XI - First Buying Point. 33 Vital Point XII - The catapult . . 33 Vital PointXIII - Secondary Buying Point. . . . . . . 34 Vital Point XIV - The Semi-catapult 34 Vital Point XV - Third Buying Point. 34 Vital Point XVI - Watch for Distribution. . . . . . . . . . . 35 Vital PointXVII - Trend Lines . . . . . . . . . . . 35 Vital Point XVIII - Forecasting the Extent of the Move 35 V: Approved Method of Assembling and Maintaining Proper Data. . . . . . . . The Ticker Tape . . . . . . . . . . . . . . . . . . Source of All Data . . . . . . . . . . . . . . . . . . . . . . . Daily Full-Figure Fluctuations Available Method Ideal for Those at Distant Points Application of the Data. . . . . . . . . . . . . . . . . . . . . . . .
vi
37 38
38 39
40 40
How to Prepare and Collate the Needed Data . . . . . . . . . .. 41 Proper Graph Paper Helpful. . . . . . . . . . . . . . . . . . . . . .. 41 Arrange Charts Orderly . . . . . . . . . . . . . . . . . . . . . . . . . . 42 How to Select the Issues to Record. . . . . . . . . . . . . . . . . . 42 Clarifying the Use of the Symbols . . . . . . . . . 43 Moving to Next Vertical Column . . . . . . . . . . . . . . . . 44 Use of Symbol "0". . . . . . . . . . . . . . . . . . . 45 One Cardinal Principle . . . . . . . . . . . . . 46 Gaps Are Not Recorded 46 How the Gap Occurs 47 Plotting the Gap . . . . . . . . . . . . . . . . . . . . . . . . . . . . 48 The One-Point Chart 48 The Three-Point and Five-Point Charts 49 Condensing the One-Point Moves 49 Other Helpful Aids. . . . . . . . . . . . . . . . . . . . . . . . . . . 51 The Method Substitutes for Tape Reading . . . . . . . . . . 51 Trend Outline and Geometrical Charts . . . . . . . . . . . . . 52 The Proper Issues to Chart. . . . . . . . . . . . . . . . . . . . . 53 Commodity Price Movements . . . . . . . . . . . . . . . . . . 54 VI: The Scientific Fundamentals
57
The Fulcrum. . . . . . . . . . . . . . . . . . . . . . . . . . . . . . . . .. 57 Leverage . . . . . . . . . . . . . . . . . . . . . . . . . . . . . . ..... 58 Watch for a Fulcrum. . . . . . . . . . . . . . . . . . . . . . . . . . . 58 The Ideal Full Fulcrum. . . . . . . . . . . . . . . . . . . . . . . . . . 58 Down Trend a Prerequisite to Fulcrum Formation . . . . . . 59 Supply Equals Demand . . . . . . . . . . . . . . . . . . . . . . . . . 61 Advantage of Figure Charts . . . . . . . . . . . . . . . . . . . . . . 61 The Buying Points. . . . . . . . . . . . . . . . . . . . . . . . . . . . . 61 The Broad Fulcrum. . . . . . . . . . . . . . . . . . . . . . . . . . . . 62 The Recoil Fulcrum. . . . . . . . . . . . . . . . . . . . . . . . . . . . 63 The Catapult 64 The True Catapult. . . . . . . . . . . . . . . . . . . . . . . . . . . . . 64 The False Catapult . . . . . . . . . . . . . . . . . . . . . . . . . . . . 64 The semi-catapult 67 Use "Stops" to Protect Position 67 vii
VII: The Principles of Charting . . . . . . . . . . . . . . . . The One-Point Chart Move to Next Column. . . . . . . . . . . . . . . . . . . Signs of a Fulcrum . . . . . . . . . . . . . . . . . . . . . Technical Aids. . . . . . . . . . . . . . . . . . . . . . . . . The Three-Point Chart Determining Three-Point Moves The Use of Five-Point Charts
71 71
72 73 73
74 76 77
VIII: Analyzing Technical Position The Price Path Characteristics. . . . . . . . . . . . . . . Patterns of the Leaders Duplicated in the Secondary Issues . . . . . . . . . . . . . . . . . . . . Solid Formations Give Confidence Watch for Changes in Activity . . Strong and Weak Technical Position Weak Technical Position Gauging the Length and Culmination of the Moves The Count . . . . . . . . . . . . . . . . . . . . . . . . . . . . Coordinating Your Studies . . . . . . . . . . . . . . . . .
79 ...
79 79
80 80 81 81 . . . . . . . 82 ... 82 . 82
IX: Anticipating the Action of U.S. Steel The Full Ideal Fulcrum . . 85 The Catapult Position. . . . . . . . . . . . . . . . . . . . . . . . . . .. 86 The Semi-Catapult Position 86 Consolidating the Gains . . . . . . . . . . . . . . . . . . . . . . . . .. 86 The Final Mark Up 87 The End of the Move - A Reverse Fulcrum 88 The Short Positions. . . . . . . . . . . . . . . . . . 89 Geometrical Charts 89 TheTrend Outline Charts. . . . . . . . . . . . . . . . 89 91 TheThree-Point Figure Charts The Five-Point Charts 92 Summary 92 viii
85
X: Analyzing a Campaign in Western Union Selecting the Fast Moving Issues . . . . . . . . . . . . . The Full Fulcrum Base . . . . . . . . . . . . . . . . . . . . The Catapult The Semi-Catapults . . . . . . . . . . . . . . . . . . . . . . The Short Positions. . . . . . . . . . . . . . . . . . . . . . Summary
95 .. ...
95 96
97 .... 97 . . . . . . . 98 99
XI: Judging the Minor Swings
101
The Half-Hourly Index of the Dow Jones Industrials 101 The Half-Point Half-Hourly Log 102 Half-Point Technic 102 Scientific Tape Reading. . . . . . . . . . . . . . . . . . . . . . . . . . 105 Analyzing the Half-Point Chart 105 Ignore Rumors and Gossip 106 Summary 106 XII: Half-Point Technic in Atlas Tack Historical Background . . . . . . . . . . . . Analyzing the Campaign in Atlas Tack Important Signal During July Break The First caution Signal. . . . . . . . . . . Boardroom Observations . . . . . . . . . . The Shorts Began to Cover. . . . . . . . . Pointand Figure Analysis . . . . . . . . . .
107 . . . . . . . . . . . . . . 107 108 110 . . . . . . . . . . . . . . 111 . . . . . . . . . . . . . . 111 . . . . . . . . . . . . . . 112 . . . . . . . . . . . . . . 112
XIII: The Main Trend and Major Cycle Culminations Critical Culmination Points Easily Detected . . . . . . . . . . . . The One-Point Chart- The Basis for Analysis Interpreting an Intricate Major Culmination The First Temporary Top . . . . . . . . . . . . . . . . . . . . . . . . Semi-Catapult Point- Unusually Bullish Pattern Strength Carries Through Objective Level. . . . . . . . . . . . . The Change Over of Technical Action . . . . . . . . . . . . . . . . The Top of the Move Clearly Indicated Indications of a Major Culmination ix
115 115 116 116 116 117 118 120 121 122
Bear Trend Technical Action . . . . . . . . . . . . . . . . . . . . . . 122 The Investor or Long-Term Trader 123 12S XIV: Technical Indications at a 'furning Point . . . . . The Change to an Up Trend . . . . . . . . . . . . . . . . . . . . . . 125 The Change to a Down Trend. . . . . . . . . . . . . . . . . . . . . 126 Conclusion . . . . . . . . . . . . . . . . . . . . . . . . . . . . . . . . . . . . . . . 127 Compendium of Charts - Figures 1 through 30 . . . . . . ..... 129 Trading Resource Guide . . . . . . . . . . . . . . . . . . . . . . .
x
1S9
Authors' Preface xperiences of the recent bear market which had its termination in July 1932 caused many former investors and traders to turn to the literature of economics and markettechnic* in order to get a better understanding of the principles underlying stock price movements. Many have come to realize the futility of depending upon tips. rumors and gossip to guide them in their market commitments. Countless others have come to the conclusion that statistics and fundamentals serve only to aid the manipulators. banking sponsors and insiders to unload their stock on the unwary.
E
All will agree that a correct analysis of the technical position of stocks and the market in general is the only key to consistent profit from speculative and trading commitments. Until the publication of the original edition of this work. it was the privilege of the few who made fortunes from speculation to have the advantage of this. the most logical and pragmatical of all methods used for the purpose of plotting the price course of stocks and commodities. This Method has been the keystone and bulwarkof the plans of America's most successful speculators and commentators. from Charles Henry Dow. the father of the art of anticipating stock price movements. down to and including those who have profited most during 1929 and SUbsequently. We offer you the principles of this tried and proven Method because we feel that a broad dissemination of this information will do much to prevent the excesses of bull market peaks and also help avoid the unreasonable
• Technic is the spelling the author used in the original text. Today the more common spelling is technique(s).
xi
deflation of values. as well as the vicious cycles of forced selling and the resultant suffering of depression lows which so surely mustfollow. We desire to express our appreciation to Mr. J. Martiney of the publisher's technical staff for the many helpful suggestions given and his care in the preparation of the charts used in this work. We gratefully acknowledge our indebtedness to Charles Henry Dow. William Peter Hamilton. James R. Keene and others whose worksand achievements have been an inspiration and a guide. Victor de Villiers Owen Taylor New York City January 1934
xii
I
The Principles of the Point and Figure Method ifteen years before the turn of the last century. Charles H. Dow. student. scientist and philosopher. a brilliant economist and a wellrespected financial writer. began to observe and study the phenomena of Stock Price Movements. He was the founder of the Wall Street Journal. His writings. though not prolific. are the beginnings of all price movement comment, his observations the foundation underlying all technical methods. and his studies and graphic records the seeds from which the Pointand Figure Method grew.
F
The work of Dow was ably carried on by his protege and successor. William Peter Hamilton. who edited the Wall StreetJournal until hisdeath in 1929. The writings of Hamilton form the principal source from which Dow's Theory of Stock Price Movements has become available for study. At or around the beginning of the present century. when the expansion era was in full swing, a group of speculators recognized in Dow's research! a clear illustration of price movements portrayed through the use of figures which showed a repetition of pattern as it unfolded its tracings on Dow's graphic records. The patterns thus formed were oft-times repeated. and established a precedent and guide to future price move-
1 See pages 36 and 153 The StockMarket Barometer by W. P. Hamilton
THE POINT AND FIGURE METHOD - THEORY AND PRACTICE
ments. Here. then. was the beginning of a truly scientific and logical method of anticipating stock price movements. Fifty years of background. millions of dollars of profits taken out of the stockmarket. and thousands of hours of study and development. are historical events which commend this time-tried Method to you. In explaining the basic principles of the Pointand Figure Method. we will showthat the full point and full figure fluctuations in variable equities, be they commodities or stocks. are the vital statistics which hold the key to technical position and the future price path. Professionals and others who have been successful in theirjudgmentand anticipation of market action, have reached their conclusions by aid of recorded data of one kind or another. In practically every field of endeavor, whether it be in the arts or sciences. in the industrial world. or in the stock and commodity markets. full and detailed records of past and current essential data mustbe kept. It is of little consequence whether these records are maintained as tabulated figures or by means of logs or charts. which are merely graphic representations and plottings of those essential records. Charts of stock price movements are vital. There is an ancient Chinese axiom dating from the Confucian era which states. "A picture is better than a thousand words." It is self-evident that a picture conveys a clearer and more detailed message than a mass of words or columns of tabulated figures. Since instant comparison and maximum condensation are vital to the art of anticipating stockprice movements. we endorse the practice of keeping and maintaining up-to-date charts. Graphic representations of the fluctuations of stock prices are vitally important to a critical analysis of technical position and are the keystone of the Pointand Figure Method.
Logic Is the Basis of This Method Few will dispute the fact that the old-fashioned custom of relying solely upon published statistics of sales and earnings for market commitments. must now be relegated to the past. All will agree that by the time these
2
THE POINT AND FIGURE METHOD-THEORY AND PRACTICE
statistics become available for public consumption, others, principally the insiders. the sponsors and the manipulators, have already profited amply therefrom and are ready to unload their commitments as the news becomes public property. We must. therefore, find a method which will show us when the insiders are buying and also indicate when they are commencing to sell. Given the ability to recognize their acts on our charts, it follows logically that we will beable to buywhen the insiders buy and sell out when they sell. The patterns portrayed on our charts and application of the principles of the Point and Figure Method will show uswhen buying is overcoming selling and vice versa. If you are ready to agree that the present movement of stock prices, as recorded on the ticker tape, is the best and surest indication of the probable direction of the future price trend, then this Method can be used to show the way. It should be needless for us to state that some intensive study and a thorough understanding of the principles are necessary before you can hope to capitalize on that knowledge. Once a solid foundation is laid, your judgment will develop in a logical manner, and you will quickly begin to recognize many profitable opportunities. You will be more certain of yourself, and the courage of your convictions will materially increase your capital.
Irrelevant Fluctuations Eliminated The market fluctuates in countless fractional transactions which, in the final analysis, have little or no influence on future price paths. One of the basic principles of the Point and Figure Method is to eliminate the irrelevant and regard only the important movements upon which our deductions are based. Only full-point changes are considered, and fractional variations are totally disregarded.
How the Method Got Its Name The Point and Figure Method derives its name from the fact that we record by FIGURES all full POINT changes. This plan or system of plotting 3
THE POINT AND FIGURE METHOD-THEORY AND PRACTICE
and recording the movements of the market in general. and of selected individual stocks, is a basic principle of this particular Method. In this one characteristic, it is totally different from any other plan, method or system of anticipating stock price movements.
Graphs Are Logical and Scientific A casual glance at the illustrations in this work will show a new kind of chart which. in contrast to all others. has a scientific basis to recommend its use. The Point and Figure graphic records are made up of a series of symbols composed of X's, fives and zeros. The special design of graph paper, which we suggest for use with this Method. shows the relationship of these symbols to each other and to the pastand probable future price movement. Familiarize yourself with the form and style of these important aids, namely, the charts upon which we rely for our conclusions. Point and Figure charts condense the price fluctuations in such a manner that you will soon learn to recognize accumulation. mark-up. and distribution and thus be able to make your commitments more profitable.
Introductory Summary of Important Principles The Method will befully explained in every detail as we proceed. Each step will be carefully developed and clarified before we proceed with the next. All will be illustrated with examples from recent market action, showing the application of the principles. So that you may have a birds-eye view of the scope of the work, we list a summary of the important principles underlying the Point and Figure Method. 1. The Method develops the ability to recognize the technical position of individual stocks and of the market in general. 2. The Method is consistent and logical, definite and positive, eliminating, as far as possible. guesswork and emotional influences. 3. The data is recorded in such a manner as to create and force the development of true geometrical and symmetrical patterns easily discernible and classified, and which repeat themselves in the progression of the price path.
4
THE POINT AND FIGURE METHOD-THEORY AND PRACTICE
4. The patterns thusformed create precedents by which subsequent price movements are easily judged. 5. The Method disregards fractions resulting from minor and irrelevant fluctuations. It also ignores volume. The Method is simple and complete in itself. 6. The Method dispenses with news, fundamentals, statistics and the reasons for price movements. It concerns itself primarily with cause and effect.
Needed Accessories Are Few The data which we record in order to create the basis for the application of this Method is. primarily. all one-point changes of the price movement as it fluctuates. This principle is the same whether we apply it to stock price movements. market indices. or commodities. As a matter of fact, the Point and Figure Method of anticipating price movements may be applied to any form of equity for which a free and open market exists, and in which there are price fluctuations. When tun-point variations of the price movement are known. they are recorded by figures. Our records are unlike the conventional vertical line or bar charts in that they are created through the use of symbols. The symbol "x" is used to record the digits 1, 2, 3, 4. 6, 7, 8, and 9. The figure "5" is used to indicate figures ending with digit five. The symbol "0" is used to indicate figures in multiples of tens. At this point, it would be well for you to examine the illustrations used in this book in order that you may have a better understanding of this elementary principle used in making our charts. The full figure one-point changes are recognized by the price fluctuations when they reach each new full one-point change. The change thus noted is recorded. whether it be the next higher or the next lower figure, and the change must be recorded each and every time it shows on the tape. At this point, let usemphasize the fact that herein lies the vast superiority of this Method over all others. When we record all full figure changes, we are better able to detect accumulation, distribution and the characteristics
5
THE POINT AND FIGURE METHOD-THEORY AND PRACTICE
peculiar to the particular stock or commodity under observation. Note, here, that we disregard all movements of seven-eighths points or less. when fluctuations are in eighths. In cases where fluctuations are in tenths or dollars. we must determine whether we will plot the full one-dollar changes or whether the changes in tenths would better serve our purpose.
Plotting a Stock Price Movement After we obtain the full figure changes. we proceed to make our graphic record from that data. We require for that purpose, graph or charting paper ruled for quick and easy use. Ideal paper for this purpose is "Ideal Charting Sheet Number 5001." This paper is ruled with vertical and horizontal columns, arranged with shadowed symbols "a" and "5," and with the horizontal columns for these important digits accentuated. The vertical columns on our charts are used to limit the plottings of the price movement as long as it continues in one direction without a reversal. As soon as a reversal occurs, and we find the needed square already occupied, we move to the next right-hand vertical column. This vital principle must befixed firmly in your mind, as it is the onlyone that may give you difficulty later on when you proceed to make your own charts. The Pointand Figure Method relies on price changes. only, and the graph paper is designed to properly record those changes. The day-to-day time factor and daily volume are ignored. The columns of squares are scientifically designed soas to permit the plotting of true trend-lines and to force the development of true geometrical and symmetrical patterns which facilitate accurate comparisons and dependable diagnosis. In the case of a stockselling at $20 per share, we would record the zero in the square on the 20 line. The next record would be made when the stocksells at flat price 21, or at flat price 19. Should it go down to 191/ 8, or up to 20 7/8, no change would be made.
One-Point Charts the Basis of the Method When a series of full figure one-point changes of a price movement have been recorded, they create a scientific basis from which to draw conclu-
6
THE POINT AND FIGURE METHOD-THEORY AND PRACTICE
sions. Because of the fact that similar causes usually create similar effects, our conclusions have a dependable basis not available through the use of any other method. In addition to the one-point charts. one may easily prepare from them either three- or five-point charts or both. These are helpful for gauging the technical position of any and all issues, volatile or otherwise, and for revealing the broader intermediate moves of stocks and the market.
Accessories and Working Tools In addition to graph paper, one needs a record of the actual full figure changes garnered from the most accurate source, the ticker tape.2 When using this especially designed paper and the daily service which is available. it isa relatively simple matter to keep current the needed changes on one-hundred stocks and the important popular averages or indices, in about thirty minutes each day. Form this habit. as it will afford you an opportunity to analyze the patterns as they unfold themselves on your charts and thus take advantage of the implications which develop, first in one issue and then in another. The little effort expended in keeping these charts up to date will soon pay you handsomely, for you will be training yourself in stock market technic in a way not afforded by any other method.
2 Full Figure Daily Data puonshed by Stock MarketPublications. New York. N.Y.
7
II The Weight of Authority Behind This Method he Point and Figure Method has grown from a crude beginning which started more than fifty years ago. Charles H. Dow, the founder of the art of anticipating stock price movements, created much which led to the development of the technic of this Method. Dow. in his research, was interested primarily in recognizing the main, broad, long-term trend which results from the movement of major capital into or out of common stock equities. This main trend was rightly termed the "Capital Movement Trend" by Mr. Edwin L. Ayres in hisbook Key to Stock Price Movements. 3 The secondary corrections to the main trend, though of interest to Dow, were not the goal of his efforts. He considered the secondary movements highly misleading and concluded that the shorter day-to-day swings were unimportant.
T
However, we must bear in mind that since Dow's work was completed, the stock market and America's financial structures have undergone revolutionary changes. Common stock equities of American corporations have attracted a world-wide speculative following, unprecedented in the historyof finance and of speculation. In Dow's era, a move of 20 to 30 points in the Industrial or Rail Index consummated in a period of a few years was considered a complete bull cycle. 3 Key to Stock Price Movements - Logic of Stock Market Trends. StockMarket Publications, NewYork, N.Y
9
THE POINT AND FIGURE METHOD-THEORY AND PRACTICE
Under present day conditions, we note, on occasion, moves of 10 to 20 points in either or both indexes completed in a few weeks. Three-, nineor sixteen-million share days, such as were recently witnessed, were undreamed of at the time when ten or a dozen stocks were the active trading mediums, and volume was limited to a few hundred-thousand shares a day. One can, therefore, understand why Dow passed lightly over the minor and secondary movements and sought only to ascertain the main trend. These minor and secondary movements have now become all important. Theirstudy, analysis and the understanding of how to use them form the basis of the mostsuccessful method of stock price anticipation. It has been intimated that this Method was first successfully used by James R. Keene during the merger of the United States Steel Corporation in 1901. Mr. Keene was employed by the sponsors of the Steel Corporation to distribute to the public the original stock of the corporation, which its real founder, Andrew Carnegie, refused to take in payment for his equity and profits resulting from the merger. Mr. Keene, originally a Western mining promoter, was a skilled tape reader, a shrewd observer and a successful market operator. His ability has never been surpassed and rarely, if ever. equaled. It has been stated by his close associates that the Pointand Figure Method was known to and used by him during all of his successful campaigns.
Refined to Coordinate with Present Day Markets Like all knowledge, the Method has developed with the passing of years and has been refined, improved and coordinated with the ever-changing conditions of stockmarket action. The scientific basis of the fundamental principles underlying the Method alone accounts for its survival while most other methods have been relegated to the past. You may confidently depend upon the Point and Figure Method knowing, first, that it rests upon a sound scientific basis and, secondly, that it is vastly superior to any other plan for anticipating stock price movements. In the past as well as at present, it has been and is relied upon by many of Wall Street's most successful interests.
10
THE POINT AND FIGURE METHOD-THEORY AND PRACTICE
The data which should be kept will be described in utmost detail. Bear in mind that there is a great weight of authority behind this data. and we ask of you to respect its implications. We have found by the trial and error method those refinements needed to fit the basic principles to present day markets. It was ascertained that a careful checking and rechecking of the conclusions arrived at by means of this Method is of vital importance and cannot be overemphasized.
Mystery and Complications Have Been Clarified The Point and Figure Method. as here presented. is devoid of mystery and complications and has proven itself of incalculable aid to your authors. We begin by reducing the vast accumulation of transactions comprising market action to the important and relevant moves. which are plotted on charts. From these graphs showing the present marketaction. we are able to judge the probable future direction and extent of a stock's movement. The Pointand Figure Method permits stockmarkettrading to be considered a serious business with a scientific. substantial and definite background. based upon actual facts rather than guesswork. Like all other businesses. it demands the making and preserving of certain simple and vital records. It demands that you study those records carefully and permit your judgment to be based upon solid facts. None will deny the old copy book maxim "practice makes perfect." The Point and Figure Method actually compels practice and extensive study which soon becomes a habitas well as a fascinating hobby.
Expensive Financial and Economic Reports Unnecessary This Method dispenses entirely with the expense and labor involved in the purchase and maintenance of bulky reports. statistics. balance sheets. earnings statements and other cumbersome paraphernalia hitherto associated with trading and investing. The substitution of the simple records required by this Method is. in itself.animportantconsideration and a welcome relief. 11
THE POINT AND FIGURE METHOD-THEORY AND PRACTICE
Certain Factors Taken for Granted The following facts aretaken for granted by the Pointand Figure Method: • That the correct valuation of a stock, at any given time. is the price paid for it at the time of the consummated sale. This is because the forces underlying the law of supply and demand and the consensus of opinion of the buyers and sellers have determined the value at the time the sale is made. • That the lastpublished price of a stock reflects all that is known by the general public at the time when established, as a result of a sale and purchase which consummates a transaction. • That the insiders, who are presumed to know more about any particular stock than the public, cannot completely conceal their future intentions with regard thereto. • That the plans of the insiders will be revealed in due time by the technical action of the stock itself. The Pointand Figure Method is not a system for "beating the stock market." It is the result of the rationalization of logical principles successfully used by important market interests.
Analytical Technic Easy to Master Assuming that the studentwill keep the required records. there remains only the need of an understanding of the technic of reading and interpreting them. In the pages to follow, we illustrate for you in detail and with clarity the technic of interpreting the patterns which develop on your Point and Figure charts. While proficiency may not come at first, yet, in a short time, through study, practice and observation. the habit of correctthinking in terms of the Point and Figure Method will become apparent. and the resulting sound judgment will soon replace uncertainty and confusion. It is confidently expected that, as a result of this study, observation and practice. the reader will learn to properly appraise the price movements. 12
THE POINT AND FIGURE METHOD-THEORY AND PRACTICE
analyze the technical condition. and deduce therefrom plausible conclusions, the correctness of which will soon exceed the errors you are apt to make. With proficiency attained, your market operations cannot help but result in profit.
Losses Limited While Profits Accrue Success in trading and investing. whether by method or by chance. comes not as a resultof being perfect, but in consequence of completing a sufficient number of successful transactions netting substantial profits to offsetthe few errors which may show limited losses. In order to limit losses and to check possible errors, we employ the simple technical aid known as "stop orders." It is unnecessary for us to go into detail here, as the theory and application of stop orders are fully described in many other works,In no other enterprise or business is it possible to protectprofits or check losses with the same ease and facility as is possible in the stock or commodity markets. through the simple expedient of stoporders. We strongly endorse the use of stop orders except where "averaging" or "pyramiding" is resorted to. Many admonitions have been given against averaging and pyramiding, yet this Method not only tolerates. but. at times. presents ideal points at which both may be resorted to. for the reason that each commitment is independent and is made on its own merits. This will be fully explained in a later chapter. A pyramid is created when the profits accrued on a position are used to buy additional commitments. This practice usually develops into an inverted pyramid when it is resorted to in connection with credit- borrowed funds - used to finance a margin account. An inverted pyramid is exceedingly dangerous because the load gets top-heavy. as the human weakness to make huge and quick profits invites an overextended commitment, which, as a general rule, is wiped out on the first technical reaction.
4 Stop Orders-How to Use Them for Profit by Owen Taylor.
13
THE POINT AND FIGURE METHOD-THEORY AND PRACTICE
We average a position by buying additional quantities of stock as it sells lower in the price range. This Method indicates ideal points at which to make additional commitments for the purpose of averaging ones cost.
Method Weighs Forces of Buying and Selling The Point and Figure Method actually measures the forces of supply and demand, and records the support and resistances at all points. It permits of a wide range of visualization through its lucid, graphic records which allows quickand ready comparison of one stock with others and with the market in general. as reflected by a good index and, most important of all, with its previous technical action. These records, if properly compiled from reliable sources. will indicate the true trend of the market and of stocks. and will point out the best trading and investment opportunities. The Method indicates when and what to buy. It also cautions when to get out, first. through clear signals to act. then. through definite indications for the logical placement of stop orders. It teaches you to adopt a professional approach to your market transactions. Professionals may be considered as the insiders. pools. independent operators. stock sponsors. bankers and others usually referred to as "they" by many market commentators.
14
III
Advantages of This Method Over Others here are certain definite and inherent advantages of the Point and Figure Method not possessed by any other method. These advantages are: (a) the elimination of non-essentials, (b) the ease of condensation and (c) the speed bywhich results may beachieved. These superior qualities are again stressed in order to point out that the simplicity of this Method does not curtail its accuracy and dependability. A simple machine with a few well-constructed parts will operate far more efficiently than a complicated mechanism with ponderous accessories. So it is with the Pointand Figure Method.
T
Speed and Ease of Recording Data The Method provides, amongst other things, clarity and simplicity in the keeping of its graphic records. This results in the creation of logical and clean-cut patterns on the graphs and higher speed in the plotting of the necessary data. It will enable you to maintain the records of more stocks, and be a source of checking and correlating all of the facts. with a view of arriving at a correct interpretation of market activity and profiting therefrom. 15
THE POINT AND FIGURE METHOD-THEORY AND PRACTICE
The Method Ignores Volume The Point and Figure Method entirely dispenses with the recording of the volume of sales. Many have felt this to be a distinct deficiency under the belief that volume is a dominant factor. We are unwilling to concede that volume is the vital influence which. in the final analysis. governs the price movement. It is conceded. however. that volume isan influence when used as an aid in other methods. In our opinion, the Point and Figure Method has proven itself so much more reliable. that we are satisfied from our research and experience to conclude that the number of price changes andthe manner in which theycombine themselves have a more scientificfoundation than the influence of volume in the anticipation of price movements.
Price Changes Versus Volume Let us analyze the effect of the influence of volume as against the effect of price change only. What is the aim of all methods which seek to anticipate stockprice movements? Do we seek to know how many shares are exchanged? Or, do we desire to determine whether stocks are passing from weakholders into strong hands and vice versa? All will agree that it is the answer to the latter question which will permit us to profit most from our knowledge. Taking for granted the known fact, namely. that each transaction printed on the tape is at the same time a purchase by one and a sale by another, it is of little consequence to know the exact number of these transactions. Whatwe desire to ascertain is where in the price scale they occur and their relationship to each other. Letusapproach the problem in a logical manner by taking note of the definitely known elements. in order to determine whether price changes or volume has most influence. In a speculative market, where the laws of supply and demand are operative. we must have fluctuations in prices. These fluctuations are due mostly to differences of opinion which cause what is technically known as the bid and asked spread. Experience has taught usthat a great number of fluctuations in a congestion area usually indicates either accumulation or distribution. When stock is offered for sale at the market, 16
THE POINT AND FIGURE METHOD-THEORY AND PRACTICE
we musttake the nearest bid price: and when one is anxious to purchase a stock and offers to take it at the market. hemust pay the nearest asked price. The price changes of a stock. as it moves from one price to another. are caused by the difference of opinions of those who are buying and selling. These fluctuations have proven themselves more informative for our purpose than has volume.
Supply Versus Demand Furthermore. let us consider the effect of supply and demand on any product or commodity. be it stock. equities or horseshoes. When demand isgreater than supply, prices move upward. Should supply begreater than demand, then prices are forced downward. When demand has absorbed all the supply at any given price. it will begin to absorb the supply available at the next higher price at which offerings are available. As the demand increases. prices correspondingly increase. Prices recede as a result of absence of demand or an oversupply. These factors show that price. as such, holds the key to supply volume as well as to demand volume. These fluctuations or price changes. when plotted by means of the principles outlined for you in thisbook. will moreaccurately indicate the technical condition. the relationship of supply to demand. than any other known method which can be used for the purpose.
Volume Easily Manipulated Volume. as well as price fluctuation. can be artificially manipulated. Manipulations of volume at any given price level are deceptive and cannot reveal the difference between true and artificial demand. As contrasted with that principle. consider how easy it is to detect artificial support resorted to for the purpose of distribution when many changes in the price of a stock show that it cannot absorb the supply at the upper registered level. or that demand is insufficient to reach to the next level of supply. This principle becomes more clearly apparent as you compare these conditions in one particular stockwith the marketand other stocks. Volume indications have a tendency to vary greatly with the changes in the floating supply of stocks as well as changes due to the open short inter-
17
THE POINT AND FIGURE METHOD-THEORY AND PRACTICE
est in the market. We. therefore, conclude that price changes of themselves. with their relationship to each other and to the marketand other stocks for comparison, are vastly superior than is volume, used with any other combination. Herein, then, lies the vital and vast superiority of the use of price changes and the Pointand Figure Method.
Facility of This Method This Method permits and facilitates the easy recording of the essential data, and a simple and logical method of analysis. The direction of the trend, the extentof the move and a reasonable approximation of the culmination thereof, are all easily determinable. Through the aid of the one-, three- and five-point charts, one may be reasonably certain of the shorter immediate swings and the more profitable intermediate trend moves. as well as the main broad swings of the bull and bear marketcycles - the Capital Movement Trend. We can visualize at a glance. through the aids afforded by this Method, namely, the one-, three- and five-point charts, the broad zones of accumulation and distribution in the main swings, as well as the closer areas of supply and demand of the narrower and more speculative intermediate trend moves. Our data shows, at a glance, the moves by important areas, by months, by days. by the all important dividend periods. by seasonal influences and by main business cycle influences. It also shows the results of speculative influences, as well as the effects of long-range investment buying and selling.
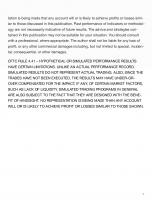
The Utter Simplicity of the Records Remove now from the rear of your binder* ChartFigure 1 (see page 19). Examine this illustration of a hypothetical move from a start and low of
* Note from the Publisher: Forthe convenience of the reader, the charts areinserted after the author refers to them andcaptions have been added. Please note the original edition was published in binder form and the charts appeared at the end of the text. In keeping with the spirit of the original edition, we have also added the charts at the end of this edition as they would have appeared in the original.
18
THE POINT AND FIGURE METHOD-THEORY AND PRACTICE
FIGURE 1
One-Point Chart T I I
FIGURE 55 53
nla 61 8 1 51
50
...••, .. ••. . .....,
I
I I
I I I I
I
I I
I
GEOMETRIC
jTREND OUTLINE IA i セ
aa
Ilea
セ
\J
JrTN I II
n
rrn
I n rn II I IIII
• eo
..•• . ........ .
5
54 1414
OIIaN
WI 1\1
n
II
II III
II I I
.,
1181
50
I.
If
In this one-point chart. we are given two possible price paths-each connoting a different technical condition. The upper half Is bearish and the lower half Is bullish. Both price paths are Illustrated using the three separate and distinct methods by which data may be recorded: figure (left). trend outline (center). and geometric (right).
50. to a high of 55. and a close at 54. Here we illustrate a one-day move which by other methods would not permit of technical analysis. yet by the Point and Figure Method. we are given two possible price paths. each of which would connote a different technical condition. Note the upper halfof the illustration. which we diagnose as bearish. Study carefully the three separate and distinct methods by which data may be recorded when using this Method. The first plan is recording by figures. Trace the move. 50. 51. 50. 51. 52. 51. 52. 53. 52. 53. 52, 51. 52. 53. 54. 55. 54. 53. 52. 53. to 54. the close. The pattern just to the right of the figure chart is called a trend outline chart and illustrated the same move. On the extreme right you may observe the geometrical chart of the same move. Note now that all of this action may be recorded by one 19
THE POINT AND FIGURE METHOD-THEORY AND PRACTICE
day's market fluctuations in a fairly active issue in normal markets. This illustration is bearish because it indicates stock in supply around the 52, and 53, levels with a temporary push through to 55, near the close. Nowregard the lower half of our illustration Figure 1 (see page 19).Trace NTUL NTUL TUNS TUN TUNS RUNS RUNQ PUN・カッュ・セ
53. 54. 55. 54. This move is diagnosed as bullish because it indicates scarcity of offerings below 55, and its ability to hold the advance above 53. The analysis above is made on the actual movement of the issue as shown. If the immediate previous action was plotted and available for comparison, our diagnosis might change.
Manipulation Readily Detected Records of fluctuations, upon careful analysis. reveal the manipulation. You have seen in the foregoing paragraph how the action which takes place during any market day is broken up into its importantfluctuations, namely, its component parts. in order that we may beable to detect what the manipulators. pool operators. and insiders may be doing with the issue. No method as yet devised will show manipulation as clearly and as surely as a diagram made according to the principles of the Point and Figure Method. Stock sponsors and operators vary their plans of campaign. Some prefer to depress a stockand make it look veryweak. even thouqh it istheir aim to mark it up to substantially higher prices. Otners. whose tactics are bolder and more open. do not hesitate to bid up the price of a stock very rapidly. taking all blocks offered on the way up, and thus creating a spectacular move. The latter method is daring but very effective. because spectacular moves attract wide public appeal through the aid of boardroom traders and others who watch tape action. as well as comments in the newspapers which usually follow spectacular moves as they develop on the tape. When operators resort to such spectacular manipulation. lively tape action excites gossip in boardrooms and thus attracts a great following for the issue. No matter what procedure is selected by the insiders in 20
THE POINT AND FIGURE METHOD-THEORY AND PRACTICE
any stock. our Point and Figure charts will reveal the areas in which they are accumulating stock and will. with equal accuracy. show zones of distribution.
Use All Full-Figure Changes in Making Charts Build up your Point and Figure data carefully, using for your purpose either the transactions recorded directly from the tape or the full-figure daily changes supplied by the publishers of this book. When you plot all of the full-figure fluctuations, you have a true representation of what is taking place in the issue. While Point and Figure charts may be compiled from the financial page quotations of your local newspaper, records thus compiled are not nearly as dependable for forecasting purposes as are those with all of the full-figure fluctuations. The charts built up from authentic data consisting of the actual full-figure changes. will always develop patterns in the progression of a move which soon become easy to recognize and classify. A careful study of past performances recorded in the same manner will reveal to the student several important factors which have vital forecasting significance - in that they show the proper points at which to make commitments. These patterns are created as a resultof better buying than selling when the move is in the upward direction. and likewise. when the move is down. they reflect the reverse-better selling than buying. Since a similar cause is always followed by a like effect. these patterns. as they develop. are generally followed by the same type of subsequent action. As we cannot build a house without some kind of foundation, so a stockcannot advance materially unless accumulation has first taken place. Since accumulation will always register on our charts. it becomes but a matter of careful observation and analysis to be able to recognize a move as it is developing and before it really gets started. In addition. we are able to know the exact point at which the risk may be limited while the profit possibilities are preserved to their fullest possible extent. These characteristic patterns on our Pointand Figure charts always develop. no matter what the condition of the market may be. It is immaterial 21
THE POINT AND FIGURE METHOD-THEORY AND PRACTICE
whether it be a slow day with a half-million shares as the average. or a fast session. with five million shares as the average: our Pointand Figure charts will reveal, with accuracy. the technical condition of the price movement as plotted and observed.
Method Is Superior to Inside Information Since it is the purpose of all market analysis to determine the balance between the forces of supply and demand. we seek a means of accurately measuring those forces. Whether demand be on the part of the wellinformed insiders. stock sponsors. manipulators or the consensus of opinion; whether it be one or more of the foregoing groups. or whether it results from sufficient outside public participation. it will bring about the same result on our Point and Figure charts. By means of the use of the Point and Figure Method, anyone who will devote sufficient time to the mastery of its principles can place himself in possession of the knowledge that will put him on an equal footing with the influential forces. whether they be insiders or outsiders. No basis for a movement in any stock can be completed without leaving definite indications in its price path. together with their logical implications as the action of the stock traces its movements clearly on our Point and Figure charts.
Isolation Develops Best Results As a matter of fact. those who apply the principles of this Method and handle their transactions independently are in a better position than members of a syndicate or a pool operation. for reasons later explained. Prices advance or decline because of the operation of the forces of demand and supply. While it is true that major interests. large-scale operators, syndicates and pools can temporarily accelerate or retard a movement, we must. nevertheless, keep in mind that no human force or group can very long obstruct the real trend of the market as it moves, because of influences of general economic cycles.
In the last analysis. all speculative operations. whether undertaken for trading profits or for long-term investment capital appreciation. must be
22
THE POINT AND FIGURE METHOD-THEORY AND PRACTICE
in harmony with the main trend of the capital-movement cycle. or they will result in grief and loss to those who undertake them. Those who operate with one- to five-hundred share lots of a stock are in vastly better position than are the large groups who mustnecessarily employ thousands and perhaps hundreds of thousands of shares in their operation. The small operator can reverse his position quickly. while the large-scale operator cannot quickly turn about. by reason of the very size and extent of his commitment and the inability of the market to absorb so vast an amount of stock into the floating supply without breaking the movement wide open and causing a major reversal. Thus, you see that the use of the principles of this Method is more reliable than inside information. We have actual knowledge of the mostpotentand vital influence. namely, the actual price changes, which must be considered as the verdict of the market resulting from the consensus of all opinions which influence the issue or commodity in which we are operating. Adhere to the principle of isolation. Turn a deafear to all gossip, rumor, inside tips and other information. Your Point and Figure charts are more reliable than any other source of information available.
Our Charts Reveal Plans of the Majority Our charts reveal. in a condensed form, all that is known to the insiders and unknown to others, about the movement of a stock up to the very last moment. What more can anyone wish to know? Authentic and reliable inside information must not. and cannot be disclosed. Disclosure may wreck costly plans. When such information is disclosed, it is no longer inside information, and then it is not worth knowing, for it immediately becomes common propertyand usually develops to be the most costly type of information in Wall Street. It generally leaves you long of stock while the insiders have sold their stock and are out of the market. Remember, the news and information you get is only what the insiders and sponsors wish you to know. and then onlyafter they have profited therefrom. 23
THE POINT AND FIGURE METHOD-THEORY AND PRACTICE
How the Move Begins In recent years. the markethas more quickly responded to combined public sentiment. Millions of investors and speculators comprise that public. On occasions. their demands have taken the marketcompletely out of the hands of the insiders. Their inactivity has. at times. upset many well-laid plans of some of the best banking and financial brains in the country. When these millions begin to act or show tentative signs of activity. the alert major interests - the sponsors. bankers. pool operators and insiders-endeavor to anticipate their demands. The insiders and operators can only anticipate and start the move by quickly completing their positions and temporarily taking stockout of the floating supply. This operation is often completed in secrecy during inactive markets. when all offerings are soon absorbed without indications of demand appearing on the tape. Then follows the demand or the beginning of the demand of the outside public. After this buying has commenced. sponsors continue to accelerate the advance in harmony with the trend. buying and selling on balance. so that the value of their position, completed at the lower level. increases. as prices are forced higher. As an illustration. a syndicate operation may own. let us say, 10,000 shares of a certain issue at an average price of $10 per share. As the price begins to advance. the manager of the syndicate buys and sells on balance. yet always holds at least the amount originally accumulated. until the market price of the stockis far above the average cost of hisposition. At the predetermined higher price level. he begins to sell more than he buys and only buys a sufficient quantity to hold the price of the stock at approximately the level at which he wishes to distribute his inventory. accumulated substantially lower down. These operations are always apparent from the patterns formed by the price changes and portrayed on our Point and Figure charts. When you possess this information. remember. you. too. may be considered one of the insiders.
Students who take this Method seriously and apply themselves to a better understanding of it are in a more advantageous position than the insiders. since. at the first signs of danger. their smaller positions can bequickly liquidated. enabling them to stand aside while the large-scale interests are struggling to complete their campaign.
24
THE POINT AND FIGURE METHOD-THEORY AND PRACTICE
Stock Market Trading Is a Business Again. we wish to emphasize this important fact-stock market trading or investing is a serious business and requires careful study and application. No otherbusiness offers similar opportunities for gain as often or as quickly as does the stock market. No other business permits one to limit loss or to insure ultimate success as do your transactions in the market, when you thoroughly understand markettechnic. Remember. your stock market transactions may be closed out quickly or you may reverse your position or protect it by placing strategic stop-loss orders. In business. it is the major interests who dominate. and the larger the unit. the more efficient can be its management; yet that is not applicable to the stock market. Here. a very large commitment may prevent quick action when speed is essential. It is wellto remember when you hear of inside information that is unsupported by positive confirmation from your Point and Figure charts that many insiders have. in the past. made serious errors. Testimony before governmental committees has revealed only a few of the grave mistakes made by many well grounded in the fields of finance. economics. and banking. Inside opinion. inside judgment or so-called inside information, may on occasion be very good. but if your transaction is not properly timed. you may be wiped out, notwithstanding the good intentions of your informant.
Inside Information Unnecessary It is best. at all times. to rely upon logicaljudgment. the result of conclusions arrived at through a careful analysis of actual facts. It is far more dependable than guesswork. tips. rumors and so-called inside information. Your full-figure changes. your knowledge of their implications. the direction of the trend and your faith in your own self. isallyou need when you employ the principles of the Point and Figure Method. Inasmuch as market knowledge. by and large. is not an exact science. errors of interpretation cause errors of judgment. and hence faulty con-
25
THE POINT AND FIGURE METHOD-THEORY AND PRACTICE
elusions may occur on occasions. The most positive indications may be reversed almost momentarily. Therefore, if in the beginning you err occasionally, do not bediscouraged. Profit from your mistakes. note the error carefully and resolve never to commit it again. Bear in mind, as you proceed, that coming events are usually anticipated or discounted by major interests and the insiders. When, in the face of bad news on a particular issue, formations indicative of accumulation develop, despite such adverse news, it is wiserfor you to follow the insiders than to pay attention to the news, which may have been deliberately released in order to cause the uninformed to dispose of their stocks at a low level.
One-Point Charts Show All The one-point figure changes. as they register on your charts, reflect all of the buying and selling. When such price changes have completed the pattern. the picture thus formed is the best sort of inside information, since it may be indicative of an impending up move or down move, as the case may be. When your three-point charts confirm the conclusions reached by a study of your one-point charts, you will then have corroborative proof, and your judgment is thereupon confirmed. Should the implications of your one-point charts beconfirmed by the three-point and also by the five-point charts of the same stock, then you may consider your knowledge absolute and definite, and you must act accordingly. Be ever alert and study at all times. Remember, the patterns which are traced on your charts resultfrom the action of individuals. Your chartdiscloses the balance of all influences. It tells you what is taking place and when to prepare for the move as well as how to take advantage of that information.
26
IV
The Vital Points he one-point price fluctuations are the starting base of this reliable and time tried Method of anticipating stock price movements. For the purpose of clarifying the basic principles. we reiterate and codify these principles so as to avoid any possibility of doubt or question.
T
The Vital Points underlying the Pointand Figure Method are as follows: I
Record all full-figure fluctuations registered on the tape.
II
Plotthese changes on suitable graph paper through the use of symbols representing the full-figure changes.
III
Make no record of a transaction unless a flat full-figure change has actually been registered.
IV
Use horizontal columns for specific price levels and vertical columns for price movements continuing in the same direction.
V
When a reversal of the price movement develops, move over to the first right-hand column and plot the subsequent changes of prices.
VI
A square already occupied by a symbol cannot again be used to accommodate another.
VII
A move to the next right-hand vertical column must be in a diagonal direction, either one square higher or one square lowerthanthe last recorded full figure.
VIII
No square may be skipped: the pattern traced must be a continuous joining of squares.
27
THE POINT AND FIGURE METHOD-THEORY AND PRACTICE
IX
Be alert to recognize and observe the formations known as congestion areas.
X
Analyze congestion areas in order to properly take advantage of a developing full fulcrum.
XI
Make commitment near base of a full fulcrum with a stopjust below lowest point of support.
XII
Watch for the development of the full catapult point.
XIII
Make commitment at the catapult point with a stop close below.
XIV
Watch for the development of the semi-catapult.
XV
Make commitment at the semi-catapult point with a stop close below.
XVI
After an extended advance, be on the alert for first signs of distribution.
XVII Learn the technic of the use of trend lines. XVIII Study and master the principle of the count to gauge the extent of future moves.
Vital Point I - Recording Full-Figure Changes We have set forth as Vital Point I the fact that we must record all fullfigure fluctuations which have registered on the tape. Many persons. after a casual study of the Point and Figure Method. may reach the conclusion that Point and Figure charts prepared from newspaper data, that is the opening, the high, the low and the close which are published daily in financial sections of newspapers, are sufficient from which to gather the full-figure changes necessary to prepare our one-point charts. However, this is not the case. One is not able to obtain all of the full-figure changes from newspaper quotations. All full-figure changes are necessary because only by recording all of them are we able to develop the proper congestion areas, which, in turn, show full fulcrums and subsequent catapult and semi-catapult formations. There is little advantage to the study and use of this Method unless you make records of all full-figure fluctuations. Furthermore. it is absolutely 28
THE POINT AND FIGURE METHOD-THEORY AND PRACTICE
essential to record all of the full-figure changes if we are to depend upon the count method for the purpose of anticipating the extentand probable culminating point of the next move. The technical terms used herein are more fully explained in subsequent chapters of this work. While it may be truthfully stated that some of the low-priced stocks do not fluctuate a full point during the day, and, therefore. the needed data could be obtained from the newspaper, it must be emphasized that even though we are interested in a low-priced stockwhich does not fluctuate actively during a trading day, we must plot the movement of the active stocks in order to get the pulse of the market and thus be able to judge the trend and turning points. Even in low-priced stocks, it is difficult to get an accurate analysis of all full-figure changes unless one has access to the tape so as to know whether the high or low was first established and their exact relationship to the close.
Vital Point II - Only Full-Figure Changes No transaction is recorded on our charts unless it is a flat full-figure change to the flat full figure above or below the last recorded price. A stock may fluctuate seven-eighths points above its last recorded figure. and seven-eighths points below. giving it a total fluctuating band of one and seven-eighths points, before we enter a new change on our graphic records.
Vital Point III - Suitable Graph Paper Graphs or charts, whichever you choose to call them, are absolutely essential to this Method. These condensed pictorial representations of the course of the price movement with its oscillations, its advances and declines. are absolutely essential to a scientific study of stock price movements. Charts may be made on any kind of paper which is suitably ruled for the purpose. We especially recommend Ideal Charting Sheets for Point and Figure Charts. because theyhave been carefully designed in order to facilitate the preparation of the charts and permit instantaneous analysis after the records have been completed. 29
THE POINT AND FIGURE METHOD-THEORY AND PRACTICE
Vital Point IV - Use of Horizontal and Vertical Columns The recommended graph paper for use with this Method is laid out in columns of squares vertically and horizontally arranged similar to a checker board. The lines dividing the vertical divisions are all of uniform thickness. These vertical columns are used for containing the price movement as they continue in the same direction. The horizontal columns of squares are used to represent specific price levels. The lines dividing the horizontal columns vary in their thickness, for we accentuate the columns for the "S's" and heavily accentuate the columns for the "IOs." The plan for accentuating the "5" and "10" squares is very helpful for swift recording and quick analysis. In addition, this especially designed paper has silhouettedfigures representing the "a's" and "S's.' which facilitate quick placement of these particular price levels on the page.
Vital Point V - Trend Reversals Vertical columns are used to include the price movements in one direction, up or down, until a reversal develops. When a reversal does develop and we require a symbol to be placed in a square that is already occupied, it is necessary for us to move over to the next immediate adjoining righhand column. After the first figure is recorded in a new column, we may proceed either upward or downward from that point, but not both. We must be especially careful to note that in every case we must have more than one symbol in a vertical column.
Vital Point VI - Only One Symbol to a Square Since no square can be used twice, it is essential that upon reversal of the trend of the stock price movement we move over to the next right-hand column. Each reversal in trend which calls for an "x" to be placed in a square already occupied requires that we move over to the next righthand column. In cases where a reversal requires onlya one-point change, after which the trend is again established in the previous direction, it is not necessary to move over to the next column, for the change in trend would require a plotting in a square above or below the first one used in
30
THE POINT AND FIGURE METHOD-THEORY AND PRACTICE
the new column. This square. above or below. being empty. we proceed to plot our next symbols. Thus. you will see that in no case can we have only one "x" in a vertical column. To cite an example. let us analyze the move in XYZ. Figure 2. We start plotting the action of this stock at full-figure 34. and indicate an upward move to full-figure 36. After 36. a reversal to 35 is required. but since the 35 square is already occupied. we move over diagonally (never horizontally) to the nextright-hand vertical column. Nowthe up move is again established and we continue in the same column plotting our symbols above the 5. first figure recorded in the new vertical column group. A similar situation develops on the reaction from 38. back to 37, from the second column in use to the third column. Another like example occurs
XVZ One-Point Chart
FIGURE 2 0
=
XYZ
ONE POINT
5
CHART
0
FIGURE
FIGURE
WITH TREND OUTLINE SUPERIMPOSED
45 X
xx
x
XX
/IX iセ
XX 40
00
]I
0
x x xxx xx xx x xx xx xx xx 55
35
t
x
1il xl:Ji
xiI< X
5
30
This chart Illustrates VItal Point VI- only one symbol to a square. Since no square can be used twice. each time a reversal of the trend of the stock price movement occurs, we must move over to the next right-hand column - diagonally. never horizontally. The trend outline superimposed over the figure chart visually emphasizes this movement.
31
THE POINT AND FIGURE METHOD-THEORY AND PRACTICE
on the one-point reaction from the first full-figure 40. down to the second 39. Now we come to a difference which develops after the stock rallies from 39. to 40. A sharp subsequent reaction develops and carries back down to 35. Here you see how in one instance a one-point change moves over to the first right-hand column. while another one-point change continues in the same column with subsequent changes again moving over to the next right-hand column. This is one of the most important principles to be carefully observed in preparing your Pointand Figure charts. Study it carefully and knowit thor0ughy before you proceed with the work. Unless you thoroughly understand the principles of making these important one-point records, you cannot hope to correctly analyze formations which are developed. You cannot hope to arrive at proper and reliable conclusions if you base analysis and deductions on incorrectly prepared data.
Vital Point VII - Move Over Diagonally This point needs very little further explanation. for it is carefully indicated for you on illustrations throughout the book and fully detailed in our previous paragraph.
Vital Point VIII - Skip No Squares In the progression of symbols across our graph paper. no square may be skipped. The pattern traced must be a continuous joining of squares of those above. below or adjacent to the diagonal corners. It is onlythrough the proper development of the price path patterns that the important zones of accumulation and distribution will become recognizable. Moreover, trend lines cannot be accurately plotted unless the patterns are likewise accurate and symmetrical.
Vital Point IX - Formation of Congestion Area The most importantpattern that will develop on your charts isthat which is known as the congestion area. It represents what is technically known as a trading range and shows the struggle between the forces of supply
32
THE POINT AND FIGURE METHOD-THEORY AND PRACTICE
and demand, either at the bottom of the move where accumulation is being completed or at the top of the move where distribution is taking place. At intervening points on the rallies and declines. congestion areas of minorsignificance form as a resultof temporary consolidation. You will soon learn to recognize the importance of the several different types of congestion areas which are formed on your charts.
Vital Point X - The Full Fulcrum The most important congestion area to form on your charts will be the full fulcrum. A full fulcrum congestion area develops after an extended down move when the forces of demand overcome the forces of supply and a base is formed. followed by two or moreattempts to rally. The first indication of strength occurs after accumulation begins at the bottom. when a sharp up move develops and subsequently fails with a recession to the previous support point or to a point slightly above the previous support level. Here. after a little backing and filling. the stock develops technical strength and a new rally carries it higher than the last previous high point, at which point, a full catapult develops.
Vital Point XI - First Buying Point When you are sure that a full fulcrum is in the process of formation. it is wise to make a commitment as near to the base of the congestion area as is possible. with a stopplacedjust below the lowest point of support. This is the best place to establish your long position. for here you have the opportunity of gaining the greatest number of points advance with the least possible risk. limited through the employment of a "stop order."
Vital Point XII - The Catapult The second importantplace to establish your long position "on stop" isthe full catapult point. The law of probability strongly points to the fact that you will quickly see profits after establishing your position at this point. The true full catapult which develops after a full fulcrum has been com-
33
THE POINT AND FIGURE METHOD - THEORY AND PRACTICE
pleted, normally shows from 3 to 6 points profit before a technical correction registers a paper loss on your position. The "stop" used to protect this long position should be placed one point below halfway between the low of the base in the fulcrum and the full catapult point.
Vital Point XIII - Secondary Buying Point Never fail to take advantage of every full catapult as it develops on your chart. Occasionally you may err and suffertemporary paper loss. but in the vast majorityof cases, the full catapult point always develops quick profits for a position established there. especially at the inception of an intermediate or main uptrend following a protracted period of declining prices.
Vital Point XIV - The Semi-Catapult The semi-catapult is somewhat similar to the full catapult with the exception that it develops duringthe advance. After a stock moves off the base known as a full fulcrum and an extended move is in progress. it hesitates and forms temporary congestion areas on the way up. These small congestion areas, usually resulting from minor technical reactions during the advance. create semi-catapult positions as soon as the strength in the stock registers a new high price over the high previously established before the technical reaction.
Vital Point XV - Third Buying Point Make a long commitment at the semi-catapult point each time it develops. Protect this position with a "stop order" placedjust below the lowest point established on the technical reaction preceding the semi-catapult figure. You may occasionally lose one or more of these positions and suffer the loss of a point or two between the semi-catapult price and your stop order. However, your losses will be limited while your chances for profits are far in excess of the probability of loss. Profits will accrue to this position in more than six out of ten times established. which profits should be far in excess of losses. especially if the "stop order" suggestion is followed. 34
THE POINT AND FIGURE METHOD-THEORY AND PRACTICE
Vital Point XVI - Watch for Distribution After an extended advance. be on the alert for the first signs of distribution. A trading range or congestion area which is built up after a sharp advance in price will be the point for you to watch for first signs of distribution. Use a "stop order" if you are in doubt. or sell on strength soon after you have recognized the beginning of distribution. Technical aids for determining signs of distribution will be found in Book 2 entitled Advanced Theory andPractice of the Point and Figure Method. *
Vital Point XVII - Trend Lines Trend lines are helpful technical aids to use in conjunction with your Point and Figure chart. The technic of the use of trend lines is fully described in the advanced book prepared for students who have already mastered the principles outlined in this book.
Vital Point XVIII - Forecasting the Extent of the Move The "count" principle of gauging the extent of future movements can be applied by those who have thoroughly mastered the elementary technic of the Pointand Figure Method. Through the use of certain well-established scientific principles. your Point and Figure charts will show the probable culmination point of the next move. The system of the "count" is highly technical in its character and fully described in the Advanced Theory of this Method.
* Notefrom the Publisher: This book is no longer available.
35
v Approved Method of Assembling and Maintaining Proper Data e have made clear to you the fact that this time-tried Method depends for its accuracy upon a radical and entirely different principle. Price changes, that is the fluctuations in the price of a stock, are more important as the basis upon which to judge its technical condition than are either volume or price range. Price range is the zone between the high and the low which the stock registers each day.
W
A carefully compiled transcription of these price changes will point the way to more consistent and greater profits. with less guesswork and more confidence in your market commitments. Before we begin to make the chart, it is most important that we obtain the exact price changes in the order in which they occur, and that we be certain of the source of our data. It is vital and most important to the proper application of this Method that we obtain all of the price changes and plot them all. The most vital signals given by this Method are those occurring in the trading ranges, the congestion areas, either at the termination of moves at bottoms and tops, or in the consolidation areas, during the advance or decline. A trading range is the zone in which a stockbacks and fills, i.e. fluctuates above the level of support where sufficient buying is encountered to
37
THE POINT AND FIGURE METHOD-THEORY AND PRACTICE
absorb all offerings and the resistance level above where the demand is unable to absorb the supply. A trading range is sometimes called a "line movement" especially when it is used to describe this action on the part of a marketindex. In the latter case it shows the base, that level at which sufficient capital is available and desirous of being exchanged for stock, and the resistance level above where the holders of stock desire to exchange their equities for cash. It, therefore, becomes evident and is of vital importance that all fluctuations be obtained from reliable sources and that they be carefully recorded in the order in which they occur.
The TIcker Tape Many years ago, Stock Exchange authorities recognized the importance of creating and preserving actual records of all transactions as they occur on the floor of the Stock Exchange. It was then that the ticker tape, as we know it today, was conceived. In the beginning, the records were crude. but as the market broadened in the number of corporate issues traded and this country grew in wealth and importance. the ticker became more highly developed, so that now it is capable of high speed, and the price fluctuations are printed almost as quickly as they occur. It is only on rare occasions that the new, high-speed ticker lags, a few minutes at most, behind the actual transactions.
Source of All Data The ticker tape is the official Stock Exchange record of all transactions, and it automatically becomes the source of all data for this or any other method of anticipating stock price movements. Whether you are guided by vertical line bar charts. by moving averages, by statistical information, business conditions or by the actual technical condition of the stock itself, the source of all information as to the price, the range, the daily closing. daily, weekly, monthly or yearly, high and low prices, or actual price fluctuations, the ticker tape isthe original source of all information. All errors which occur in the recording of the transactions effected on the floor of
38
THE POINT AND FIGURE METHOD-THEORY AND PRACTICE
the New York Stock Exchange are quickly corrected on the tape, sometimes within a minute or two after the error occurs. The ticker tape, therefore, is considered the very best source from which to get the price fluctuations so vitally necessary to the use of the Pointand Figure Method.
Daily Full-Figure Fluctuations Available It is not necessary for you to be in your broker's office in order to procure all of the full-figure fluctuations. The publishers of this book provide that service, and it is published daily. In order to insure the accuracy of the information, they have a trained and skilled staff of men who read closely all transactions on the ticker tape. Each morning, the previous day's changes are carefully checked against data supplied by the Stock Exchange blue sheet and the three most reliable daily financial publications. Errors, if any occur, are carefully noted by the service on the succeeding day in a special errata column. In the less volatile issues it ispossible to approximate the full-figure changes from the stock market quotations as published in your daily newspaper. Price fluctuations compiled from newspaper openings, highs, lows and closes, are not nearly as dependable as the information garnered directly from the tape. In one case, you are assured of all full-figure fluctuations, while in the other, a great number of full-point changes may be missed. This is vital and important because as you proceed with your work, you will soon realize that complete campaigns of accumulation and distribution can be effectuated in one, two or three market days. f15 a general rule, Point and Figure charts compiled from newspaper quotations will rarely show a complete fulcrum, catapult or semi-catapult formation. These formations will develop when you plot all of the full-figure fluctuations. Justas a house cannot bebuilt unless a foundation or base is first laid, so a stock cannot rally to any degree, as a general rule, without first creating a congestion area or base from which to advance. Therefore, you mustrealize that in order to have fullestadvantage from your knowledge of the Point and Figure Method it is absolutely essential that you record all of the full-flqure fluctuations.
39
THE POINT AND FIGURE METHOD-THEORY AND PRACTICE
Method Ideal for Those at Distant Points For students and observers at distant points. this Method offers a splendid opportunity for observation and study. Even though your Full Figure Daily Data may bethree or four days late in arriving. your charts will always tell the story in ample time for you to have fullest advantage of moves as they develop. If you are a great distance from New York City and cannot get the accurate full-figure changes, we suggest the following procedure. Obtain from your brokerage office. customers man or daily newspaper, your tentative full-fiqure fluctuations. and enter them on your charts by making pencil dots in the squares representing the temporary and estimated changes. A day or two laterwhen you receive your accurate full-figure changes. carry forward your chart in ink. Thus. you will have the opportunity of being right up to the minute on the few stocks in which you may have a commitment, and when authentic figures arrive. you are assured of having the correct changes for inking in your graphic records for future reference and study.
Application of the Data After you are certain that you are obtaining all of the authentic full-figure fluctuations. it is well for you to form the habit of recording the changes each day. It is best to maintain charts of at least fifty. and if possible. onehundred active stocks. as well as of the following averages. namely. the Dow Jones Industrials. the Dow Jones Rails. the Dow Jones Utilities and the New York Herald Tribune Index of 100 Stocks. A one-half point chart compiled from figures representing the half-hourly running line of the Dow Jones Industrial Averages is also very informative of the nearby minor swings. Elsewhere in the book. we supply full detailed explanations of this half-point, half-hourly running line index. For the sake of emphasis and clarity and in order to give the student a proper start. we describe. hereunder. the different types of charts which may be built up from the basic data. namely the one-point figure changes. 40
THE POINT AND FIGURE METHOD-THEORY AND PRACTICE
How to Prepare and Collate the Needed Data It is of vital importance that you keep allthe needed data in a uniform, neat and compact arrangement. The authors have devoted serious thought to this problem and the publishers have designed a series of special charting papers which are ideal for the purpose.
Proper Graph Paper Helpful We recommend and use, exclusively. "Ideal" charting sheets #5001. printed onwhite paper. for our one-point charts; #5003, printed on buff paper. for our three-point charts; and #5005, printed on blue-tinted paper for our five-point charts. No. 5001.5. our half-point paper, is especially recommended for fractional Point and Figure charts. Nos. 5001, 5003. and 5005, are printed on good quality rag stock, 8Yz x 11. and are perforated for the conventional three-ring binder. These sheets are convenient to inspect. easy to remove and ideal for the purpose of study and comparison. The ruling. especially designed, presents a simple arrangement for the digit, ciphers and full-figure fives. The sheet is so laid out that it may be read at a glance with the minimum probability of error. The price level is quickly realized, so that in going through your binders of charts. your attention can be concentrated on a study of technical conditions rather than on irrelevant details. All of the charts reproduced in this book were drafted on these special "Ideal" charting sheets. The sheets are printed in a special color of ink which permits you to make your charts in pencil or in ink. When using pencil. the special color of the background graph lines permitsthe pattern to stand out in contrast to that background. even though you use a hard #3 pencil. which permits the plotting to be made without smudging. as is sometimes the case when a softer pencil is used. As you progress with your work. you will soon be able to keep a graphic record of the movements of 100 stocks and five averages within the onehalf hour period. 41
THE POINT AND FIGURE METHOD-THEORY AND PRACTICE
Arrange Charts Orderly The charts kept in your loose-leaf binder should be segregated into one-. three-. and five-point groups. Since the sheets are printed on differentcolored paper stock. one may easily differentiate them and quickly select the desired chart. The arrangements within the binder may bealtered in accordance with your personal preference. We have found it more convenient to group the charts in alphabetical order according to the name of the stock. In this way. comparisons and daily changes are made quickly and easily. One need not feel that the pressure of other affairs will prevent one from mastering this Method. Primary records. the one- and three-point charts. can be kept and maintained by any clerk or stenographer. Any intelligent assistant. after a little preliminary study of the principles of this Method. can keep all the needed data and pass on the finished work for study and analysis.
How to Select the Issues to Record In selecting your group of stocks. it is well to include a minimum of fifty of the most actively traded issues. Whether or not you intend to trade in any or all of these stocks is of no consequence. In addition to the individual issues which it is important for you to keep. it is wise to record the movements of at least three or four of the important popular averages. We suggest the Dow Jones 30 Industrials. the Dow Jones 20 Rails. the Dow Jones 20 Utilities and the New York Herald Tribune Averages. The Dow Jones Averages are shown and quoted wherever American stocks are traded in. The Herald Tribune Average is a weighed index of 100 stocks and a better. truer. and more ideal cross section of the market as a whole. It is less volatile and more dependable due to the fact that it is not easily manipulated. In addition to the four indexes suggested above. your authors keep and observe a one-half point chart of the Dow Jones 30 Industrials. calculated on a half-hourly interval. The running line half-pointhalf-hourly index is a very helpful aid in determining the short swing trends and their terminations.
42
THE POINT AND FIGURE METHOD-THEORY AND PRACTICE
While at first glance it may appear that the necessary data hereinbefore outlined will cause an insurmountable amount of work, nevertheless, we want to call your attention to the important fact that the greatest losses in the stock market were occasioned by hasty judgment. want of incentive and lack of knowledge of actual market action. Investment and trading is a serious matter. If you desire to succeed and take profits from the stock market. you must expect to work and study. The work is interesting, the necessary materials inexpensive, and the compensation far in excess of the value of the effort and time consumed. If you want to have the greatest benefit from your knowledge of this time-tried Method, we urge you. once more, to keep and maintain the one-point moves in 100 stocks and five averages and the three-point moves for the same group. Five-point charts, which were mentioned before, are not absolutely essential. They are helpful and can be used for the important indices in order to aid in judging the main trend, and as condensation charts for the more volatile issues.
Clarifying the Use of the Symbols Recording these price movements, as we have already explained, is done through the use of three simple symbols, "x." "5," and "0." The symbol "x." stands for any full figure which does not include a five or a cipher. Therefore, the symbol "x" maystand for the digits one to four. sixto nine. eleven to fourteen. sixteen to nineteen, and so forth and so on. The symbol "5" represents all the multiples of five, such as five, fifteen, twentyfive. thirty-five, etc. Note here. that the figure "5" is used only where the figure ends in five and not when it ends in zero. The symbol "0" is used to represent all multiples of ten in the progression of the price movement. 10,20,30,40, 50,60,70, ett. Examine, now, one or more of the charts included in this book in order to get a better and clearer understanding of the use of these symbols. Charts show in clear and simple manner how to use the "x,' the "5," and the "0," in their proper places in the price progression and the pattern formation which it creates. 43
THE POINT AND FIGURE METHOD-THEORY AND PRACTICE
Examine Figure 2 on page 45, headed "XVZ One-Point Chart." Note how we have illustrated the use of all three of the symbols. The first and lowest "x" represents the full figure 34. Thefirst figure. "5," immediately above the first "x" represents the full figure 35 and indicates a progression in an upward direction from 34, to 35. as the stock moves upward. The "x" above the first single figure "5" stands for 36. This shows a move of two points from full figure 34, to full figure 36. or a move to 36 7/ 8 , which would be the fullest extent of an upward move represented by an "x' in the 36 square. The second full figure "5," indicated in the next right-hand column. again represents the price progression and a reversal of the former trend.
Moving to Next Vertical Column Note. here. one of the most important principles in plotting the price movements by the Pointand Figure Method. When the trend direction of a stock changes and the required square is already occupied by a symbol, it is necessary to move over to the nextadjacent right-hand column. This is very important and one of the principal stumbling blocks which may give you trouble if you do not thoroughly understand it. The chart of "XVZ" at this point indicates a move in a downward direction, from the previous 36 full figure or 36 and a fraction. to the full figure 35 or 34 and fractions above the flat full figure 34. After plotting the symbol in the 35 square. the trend again changes, and the price movement progresses in an upward direction. The next full figure required is a 36. Since the 36 square is open. we may plot this by recording our "x' just above the "35" most recently recorded. The move then continues in an upward direction registering 37 and 38, before a reversal takes place. Thereafter, we are required to indicate a downward move to 37 or fractionally lower, and since the 37 square in the column is already occupied, we are required to move over to the first right-hand column. Again the trend changes. Now we require a 38. indication, and the symbol "x" is placed in the square just above the 37 most recently recorded. 44
THE POINT AND FIGURE METHOD-THEORY AND PRACTICE
XVZ One-Point Chart
FIGURE 2 0
XYZ '-
'-"
ONE POINT
5
'-'-'-
CHART
0
FIGURE
r
FIGURE WITH TREND OUTLI NE SUPERIMPOSEO
45 X
xx xx xx 40
iセ
00
0 X X XXX
XX
xx
35
x
I.X I"
l\il!x
xxx
x:«
xx
XX
xx
5 5
5
t X
Ix
rI rI rl
fl
::II
"ll
C
Z
:I>
-
-
-I
0 Z
"'ll
[I]
-....J
W
FI GUR E 8
,.... .001 ONEPOINT STOCIC MARKET PUBLICATIONS
TRUE CATAPULT
e
COPYRIGHTED· 1933 K MKT. PUB.- N.Y.CITY
: J. lx brlx
JCr TJC
THE TRUE CATAPULT
ュャセ
TRUE CATAPULT
NEW YOIM CI'
['Il
n
-I
> n
." ::JJ
> Z o
-
Z e
-I
Z
o
."
['Il
-I :I:
00
W
NZクセ
FALSE
I、_jセl shGセeャ I
;
MKT. PUB.- N.Y.
Cl COPVRIGHTED· 1933
• - - TRUE CATAPULT
• If
•
FALSE
1
CATAPULT
·
S10CIl IWllln rueucAnONS
THE FALSE CATAPULT
•
;
••• x:: x:-
CATAPULTS
FIGURE 9
セN
·,1 · 1
* ,0. 5001 .. セe POINT YOllJI
セ
_
- - TRUE CIlTAPULT
セ
_
til
セ
セ
セ
セ
セ
::a
""D
セ
:I>
-
"'"
Z
o
"U
:c "'"
W
to
BN
Zイ -H
. 1'セ TRUE
e
K "KT. puB . - N.V.CITY
COPr RIGHTED·19 33
SEMI - CAllIPULT
セ
STOCK . . . .rr PU8LlCAnON S
THE TRUE SEMI- CATAPULT
FIGURE 10
セ YO•• c セ
T RUE SEMI- CATAPULT
om
セ
I
rrJ
n
セ
n
:I>
::D
"ll
:I> Z C
:z: rrJ o ::D -
Z C
セ
Z
o
"ll
rrJ
:z:
o
セ
IT5
QゥH
FALSE SEMI c.uAPULTS
_.)1,
Xx
)1,
-.
' ;1(1
t;c
f.
' , . lilii
|セイゥ
G
i st MFZ
THE FALSE
FIGURE II
セ セ セt
11 11
'-i+!+!+-
セ GャN W イ [Q セ e N on セァ V ィ
セ
.
..
B [エ GB セ セXl( lC.llft. B セQクLャN i イ AG ;JC
! N iN
セL
rt-t t -
FALSE SEMI-CATAPULT
SEMI- CATAPULT
h
HI=;:
1.1 , n -I .•4
STOCKMARKn ""aUCATIONS
MEW YORK C"
-I X
[Il
n
::!
::a > n
"'tl
C
> z
::a
o -
S c:: i
セ
N
r
X
ti
:>
'" セ
セgw
セ
'" 9
141
W 0:::
:::::>
u,
>-
w
W 0::
=>
C)
LL liCK.«
• • ••
• •
.lC
xx.. •
•
X IlI
セN X •
•
_
t()
N
>-
IZ 0
W 0::
a...
=>
w
ᄋセ ヲ r:
w X a::
セ
C)
-
::L l-
LL
142
.l::>. W
•
Icセ
)C
,11
:
•
セ
X )(
)C')C Icセ
)(
X 1IC
•
II
K_
IH
•
l "
JC,
ュ•セ ᄋ
セ
liCK
•
CエFYセno⦅e セi mtsi
•••• _CATAPULT
IHセ
....
.. . )C
,
SEMI- CATAPULT
JANUARY 19 3 4
FIGURE 15
1lI
•
JANUARY 1933
CHART
u. S. STEEL
ONE POINT
NO. s00 1 ONEPOINT
TREND
セ]
a
s te e •
> (!)
-u,
セ セ
C
145
THE POINT AND FIGURE METHOD-THEORY AND PRACTICE
セ
a::
«
::I: 0
II
...J W
::::>
セ
Cl
CJ)
セ
zIJJ
a:: セ
j!:
r!!
セ セ I :l
CO
2!
.
1< セ
Z
0 セ
セ
::>
...
0
w
CJ) !i:
セ
IJJ Z ..J
:::>
セ
W
a..
et:
IJJ IJJ
::::)
a::
C)
セ
LL
::I:
146
THE POINT AND FIGURE METHOD-THEORY AND PRACTICE
I s
i
i
IJ セ
zセ
z
::::j
...
セ
IJJ IJJ セ
a:: セ
0:
a..
:::I:
."JlLX
il I :l
0
(f)
セ
セ
!!!
:::I: 0
セ (f)
0
..
a::
«
...J W W
.... ...... en
...
セ
!!!
.. .....
セ
W
a:::
:::::> C)
LL
147
CO
.J::>,.
セ
JANUARY .933
FIGURE 20
&
セ
S. STEEL
ャセ
JANUARY 1934
FIVE POINT CHART
u.
NO. 5005 FIVEPOINT
C> COPVRIGHTEO ·1933 K MKT. PUB.· N.V.em
STOCIlIlAR.n IlIJButATIlJNS
NEW rOR"C.lY
t'Il -I
t'Il
n
n :j
:I>
::c
"'ll
:I> Z C
::c
o -
Z C
-I
Z
o
"'ll
t'Il
-I
:c
THE POINT AND FIGURE METHOD -THEORY AND PRACTICE
5
• !
I
l
xx
I:
•
i
!
I] QJZi
z
0 ..... a:: Z « :I: :::> 0 ..... Z z 0:: W
InW
0
a..
::l !!!
0 セ
0
セ
I
..'"
>-
::J
W
z
セ
0
III
セ
(\J
W セ セ ゥ
セ
.
149
:J C.9 -1.L
THE POINT AND FIGURE METHOD-THEORY AND PRACTICE
.
.!
セ
セ E
..
l:!
'0
1=
i t;
I
I CJ)
IJ セ
z
0 Z
::::> Z c::: W
-'i:
セR ゥセ
1
tilw セ
.....
a::
rtr:+ ;-r::r.T 'F F -l-'I i '·:-f, f : j-> ; j :F+ >r--1+ 1,t ·..,I , p:p , ' +H-:I 'I-' H
A Z Mヲ
Z セ セ i;'-
- I
セ ZM セ G
pゥ
セ N Mエ M G セ M [N セ N
.-t-. · j - ' P · i ';
G ャ ゥ ᄋi M Z M k セ ゥ ャ
t
•
MG
·1· '.
FIGURE 26
Z i N Z Nャセ
.. • T
:'
G L ゥ M[ャ " +' h
•
t -;· _: . ' セh _:_ c ._.
-«+ '1-'"
セ [ G GB
'-I-H'H ,-hI3+- H. ,-
i
Mh
..
セ
::±: BJ
ャ ゥ , ャQ
L h
セ
ェN hセ
N セ セ ゥ ᄋ ᄋ iGZK
...セ
M エ ェG[
..., N[
セ ェN [
セ i G、
·,F fI H -, H---
KGエ - セ ヲュ K ·"-"·mrt"t • - "1-,. ..セ I.Gセ '....
N ャM セ
H" ·'
.\.q p p
H-fH-I H+H·/-.: I' l ,. "I ' F I, -id" ' -' --
N
",,,'-1
-
"'ll
C
>Z
o = -
Z
Z -I
rII
U1
m
INVERTED
FULCRUM
セ
STOCKS
..., .
G
OCTOBER
1929
FIGURE 28
MAY -
ONE POINT CHART
FIFT Y
e
Bセ
セ
.1( ".
e
セ XI
J'I+H""' I I I I I I I I I I 1( 111
FULCRUM
STOCK MARKET PUBLICATIC*S
RECOIL
COPYRIGHTED· 1933 KMKT. PUB.-N.Y.cm
CATAPULT
o c
Nセ セ セ
セ
... -
!I
-INVERTED
srsr
TRUE INVERTED
it{
セ
セ セエ ᄋ
r
IDEAL Q・ヲhセ
N. Y. TIMES AVERAGE
NO. 5001 IlNE POINT
!
8
セ
z
[11
o
:!
o
:I>
::a
Z C
"'tI
:I>
:c [11 o ::a -
...,)
Z
"'tI
o
...,)
:c [11
0
Yb•• CI17
!!!
..
Nセ
U1
-...J
セ
セ
セ
セ
•
セ
c
• x I(
_'Ii r,
.セ
N TM
rt
セ [セ B エセ
FIGURE 29
r ..
II
•
•
NO. 5003
THREEPOINT
セ hu[tG
i st m
HEET
Gセ
d e a l
セ _イN
GN セ セ
ャG
セ エZ
セ
'lit....
.
TRUE INVERTED CATAPULT
•
•
i '
Q ':
o
1C:'Ir. ·i' " ": :., _It
iセ
STOCKS
e Non N セ Y セ ty
MAY -
OCTOBER
1929
THREE POINT CHART
FIFTY
ᄋセ
0 •
m;,n
••1-
1
g:
CI
iz
1TI
n
:::!
n
:J>
:xl
"'C
:J> Z C
:xl
o -