The Peopling of Hawaii 9780824886387
257 57 43MB
English Pages 243 [248] Year 2021
Recommend Papers


- Author / Uploaded
- Eleanor C. Nordyke
- Robert C. Schmitt
File loading please wait...
Citation preview
The Peopling of Hawaii
The Peopling of Hawaii
Eleanor C. Nordyke Foreword by Robert C. Schmitt
X AN EAST- WEST CENTER BOOK
from the East-West Population Institute Published for the East-West Center by The University Press of Hawaii Honolulu
Copyright © 1977 by East-West Center All rights reserved. No part of this work may be reproduced or transmitted in any form or by any means, electronic or mechanical, including photocopying and recording, or by any information storage or retrieval system, without permission in writing from the publisher. Manufactured in the United States of America
Library of Congress Cataloging in Publication Data Nordyke, Eleanor C The peopling of Hawaii. "An East-West Center book." Bibliography: p. Includes index. 1. Hawaii—Population. I. Title. HB3525.H3N67 301.32'9'969 ISBN 0-8248-0534-8 ISBN 0-8248-0511-9 pbk.
77-8842
To Bob and Mary Ellen Carolyn Tom Nunu Nini and to the people of Hawaii on whom its future depends
Contents
Figures
i>
Tables
x
Foreword
xiii
Preface
xvii
Introduction
1
Early Polynesian Immigrants
3
.
The Coming of Westerners and the Depopulation of the Native Hawaiians
.
Nineteenth- and Twentieth-Century Immigrants and
12
Admixtures
22
The Demographic Situation
58
Future Hawaii
84
Conclusions
122
Appendix: Demographic Tables
127
Glossary of Common Demographic Terms
187
References
193
Index
209
Figures
1. The Hawaiian Islands (map) 2. Routes of the Early Polynesian Migrants (map)
4 8-9
3. Population of Hawaii, 1778-1975
15
4. Sources of Subsidized Immigration to Hawaii (map)
23
5. Population Growth by Decade in Hawaii and the United States, 1900-1970 6. Population Densities on the Islands of Hawaii, 1975
59 60
7. Population Growth in Hawaii by Counties, 1900-1975
62
8. Population Pyramid Shapes
65
9. Total Population of Hawaii by Sex and Age, 1900-1970
67
10. Ethnic Population of Hawaii by Sex and Age, 1900-1970
70-73
11. Crude Birth Rates, Crude Death Rates, and Rates of Natural Increase in Hawaii, 1912-1975
76
12. Age-Specific Fertility Rates in Hawaii, 1920-1970
77
13. Life Expectancy in Hawaii, 1920-1970
78
14. Foreign Immigration Rates in the United States and in Hawaii, 1962-1975
80
15. In-Migrants from the United States Mainland and Immigrants from Other Countries, in Hawaii, 1952-1975
81
16. Impact of Migration as a Growth Factor in Hawaii, 1970-2020
82
X
FIGURES
17. Projections of the Civilian Population of Hawaii, 1970-2070
87
18. Motor Vehicle Registration in Hawaii, 1900-1975
97
19. Occupied Housing Units in Hawaii, 1890-1975
97
20. Water Usage on Oahu, 1940-2020
100
21. Visitors to Hawaii, 1920-1975
104
22. Natural Gas Energy Used on Oahu, 1940-1975
109
23. Electric Energy Used on Oahu, 1900-1975
109
24. Social Welfare Costs per Capita in Hawaii, 1940-1975
111
Tables
1. Population and Density, Islands and Counties of Hawaii, 1975
129
2. Population, Distribution, and Average Annual Growth Rate, Islands and Counties of Hawaii, 1778-1975
130
3. The Population of Hawaii, 1853-1970: Ethnic Composition, Distribution, and Rates of Growth
134
4. Population of Hawaii by Age, Sex, and Percentage Distribution, 1900-1970 a. Total Population
138
b. Ethnic Populations 1. Hawaiians
140
2. Part Hawaiians
142
3. Japanese
144
4. Chinese
146
5. Koreans
148
6. Caucasians
150
7. Filipinos
152
8. Blacks
154
9. Other Ethnic Groups
156
c. Total Population by Military Status
160
Xn
TABLES
5. Civilian and Military Populations of Hawaii (estimated, midyear), Vital Events and Vital Rates, 1900-1975
162
6. Births and Deaths in Ethnic Populations in Hawaii, 1900-1975
166
7. Fertility in Total, Military, and Ethnic Populations in Hawaii, 1900-1970
170
8. Life Expectancy in Hawaii by Age and Sex, 1920-1970
175
9. Life Expectancy at Birth in Selected Areas 10. Origins of Early Contract Labor Immigrants to Hawaii, 1852-1905
176 177
11. Rates of Growth
177
12. Migration to and from Hawaii, 1901-1975
178
13. Components of Change in the Civilian Population of Hawaii, 1960-1975
182
14. Population Densities in Selected Areas of the World
184
15. World Population, 1975
186
Foreword
who are unaware of the vast scope of modern demography may well ask: Why another work on the population of Hawaii? There is little doubt that the published literature on Hawaiian demography is already extensive. It includes at least four fullscale books, three sizable monographs, numerous technical articles, and a wide diversity of government bulletins and reports. The geographic index included in Population Index, the quarterly bibliography of the Population Association of America, invariably contains more references to Hawaii than to any other of the fifty states. Perhaps surprisingly, this rich literature is characterized by relatively little duplication and overlap. One important reason is the far-ranging scope of demography—a discipline that encompasses virtually everything that bears on thè human condition. Demographers are concerned with numbers, geographic distribution, and composition of human populations; with birth, marriage, illness, divorce, migration, and death; and with a disconcerting array of related matters, whether physical, geographic, political, economic, or whatever. Given this range of interests, demographers can hardly hope to do more than touch on a few of the most important. Hawaii, moreover, offers an uncommonly promising setting for demographic analysis. Its history is dominated by major de-
READERS
XIV
FOREWORD
mographic developments: the successive migrations of Polynesians, Westerners, Asians, and others, the plummeting birth rates and soaring mortality of the original inhabitants, and the mixtures of peoples that ensued. These developments, fortunately, have been documented in considerable detail, often by early observers whose primary skills (as clergymen, businessmen, and public officials) were accompanied by considerable expertise in statistics. The American missionaries, for example, conducted large-scale population censuses in 1831/1832 and 1835/1836 that compared favorably in coverage and accuracy to those then being taken, under government auspices, on the United States mainland. During the 1840s, Robert Crichton Wyllie, minister of foreign affairs, initiated what can only be described as the first social survey in the Pacific basin. Many of the problems addressed by this survey (for example, the causes of delinquency in the Islands, differentials in hours and earnings, and the correlates of interracial marriage) are still central to the studies of social scientists in Hawaii. Confronted with this wealth of material, Island demographers and their demographically inclined cousins, the sociologists, have managed to amass a considerable literature which, while appearing under almost identical titles, nonetheless focuses on quite distinct problems and appeals to different groups. The Peopling of Hawaii, like these earlier works, thus successfully breaks its own ground. Unlike Romanzo Adams's The Peoples of Hawaii, it is not limited to ethnic comparisons. Nor does it share the sociological focus on racial relations and intermixture that characterizes Andrew Lind's Hawaii's People. It is not, like Demographic Statistics of Hawaii: 1778-1965, primarily an annotated review of data sources and their limitations. It differs from The Demographic Situation in Hawaii in its expanded scope and appeal to a much broader readership. Eleanor C. Nordyke has in this work presented a comprehensive survey of the population of Hawaii, in a readable style geared to the needs and interests of nonspecialized students and intelligent lay people. The author has approached this endeavor through historical accounts of the arrival and expansion of the Islands' many ethnic groups, as viewed from a demographic perspective. In this task, she has been aided not only by her ac-
FOREWORD
XV
cess to a wealth of historical statistics (some newly uncovered) but also by recently released tabulations from the 1970 decennial census and postcensal estimates from federal, state, and county sources. In an area undergoing such rapid population change as Hawaii, the importance of accurate, up-to-date statistics cannot be overstressed. Eleanor C. Nordyke makes excellent use of all data available up to 1976. A feature of The Peopling of Hawaii not found in earlier works is its effort to project future population trends. One notable graph indicates the course of population growth to the year 2070, based on varying assumptions with regard to fertility, mortality, and migration. Such a set of projections carries no guarantee of realization; no one—not even demographers—can accurately predict anything so complex over such a great timespan. At the same time, these projections should not be treated merely as a sterile statistical exercise. More than most calculations, they dramatize the interactions among the components of population change and underscore their implications for an informed population policy. The association between population growth and environmental degradation presents a particularly vexing problem, undeniably important and surrounded by considerable controversy. It has only recently become a major topic of discussion in Hawaii, where government for many years pursued an implicit progrowth policy. This approach was openly challenged by the report of the Temporary Commission on Population Stabilization to the 1972 State legislature. Problems of growth received little or no attention from earlier writers on Hawaiian population, however, and their appearance in the concluding pages of The Peopling of Hawaii accordingly ranks as something of an Island first. Hawaii is now considering the formulation of an official population policy, involving goals in family planning, geographic redistribution, and the modification of migration patterns. The complexity of the problem, constitutional restrictions, and other practical considerations will inevitably hinder early agreement as to the best course to pursue. Even if such agreement is attained, implementation of the policy will be difficult. Even a modest degree of success will depend in large measure on public ap-
XVI
FOREWORD
prédation of the problem and its ramifications. If Eleanor C. Nordyke's discussion of these matters contributes to popular awareness of the problem of population and the need for a state policy, her work will have enduring value. ROBERT C . SCHMITT
State Statistician, State of Hawaii
Preface
the past half century, interest and concern about the growth of populations has increased within the international community. Malthus' thesis that the human species has power to grow geometrically, while subsistence can increase only arithmetically, has become increasingly cogent for island populations, dependent as they are on external sources of food. Hawaii can be viewed as a microcosm of world demographic change: the populations of both the world and Hawaii have been increasing at a historically unprecedented rate. The demographic study of Hawaii goes beyond a statistical review of population numbers. Interwoven in the figures is the fascinating history of different peoples who have come across a broad expanse of water to inhabit a small chain of islands in the north Pacific Ocean. The transition from a Polynesian feudal society dependent upon a subsistence economy to an urban industrialized community of multiethnic derivation has occurred in just two hundred years. The history of the residents of these islands is mirrored in the demographic changes that have taken place since the arrival of Captain James Cook in 1778: the depopulation of the native race during the century following the coming of Western man, the rebuilding of a society by subsidized importation of labor from nations across the globe, and the present threat of overload by a steadily increasing population on a finite and fragile land.
DURING
XVm
PREFACE
Perhaps the most difficult problem in the review of this broad topic is to present the facts objectively and to compact the rich assortment of resource material for brevity of presentation. This work does not attempt to duplicate the writings of Hawaiian historians or scholars of ethnic studies, nor does it propose to suggest solutions to problems of urban planning or environmental overload. Many subjects that contribute to a broader understanding of Hawaii's people, such as the relationships between population growth and economic, geographic, and social change, have not been included. To facilitate readability, quantitative statements and a discussion of methodologies and techniques have been minimized. This book is the fruit of personal concern and professional interest. The island of Oahu, where I was raised, has undergone tremendous growth in recent years. The once sparsely populated community of Honolulu is now the site of high-rise developments, automobile-cluttered highways, and urban sprawl. Similar patterns of growth are starting to be observed on the neighbor islands. Although the natural beauty of Hawaii still offers pleasure to the resident and tourist, there is reason for concern about the impact of continued population growth on environmental quality. By presenting the demography of Hawaii from a historical and environmental perspective, I hope to show that current population trends cannot continue indefinitely and to give the reader a broader understanding of factors and implications of rapid growth on the people of Hawaii today. To those persons named below and to the many others who contributed information, advice, criticism, and moral support, I wish to express my sincere appreciation. My primary obligation is to State Statistician Robert C. Schmitt, who generously shared his time and extensive knowledge of Hawaiian demography to give support and critical analysis to this manuscript. Special acknowledgment is also given to Robert W. Gardner, co-author of The Demographic Situation in Hawaii, for his permission to use some of the material and graphs from that publication and for his assistance in the preparation of this work. My gratitude is extended to those who offered technical and editorial assistance, including Janyce Blair, Sandra Ward, E. Ross Jenney, Victor L. Johnson, Griffith M. Feeney, Johannes
PREFACE
XIX
Overbeek, Paul A. Wright, Barbara F. Mills, and O. A. Bushnell. I am much indebted to the many dedicated librarians and their staffs who graciously helped to locate information and pictorial material, including Agnes C. Conrad, State Archivist of Hawaii, who reviewed the manuscript; David J. Kittelson, curator of the Hawaiian Collection at Sinclair Library of the University of Hawaii; and Alice D. Harris, librarian for the East-West Population Institute. Generous assistance was given by librarians and educators at the Hawaiian Mission Children's Society, the Hawaiian Historical Society, the Bernice P. Bishop Museum, the Hawaiian and Pacific Room of the State Library of Hawaii, the University of Hawaii Ethnic Studies Program, and the Multicultural Center of the Hawaiian Foundation for History and the Humanities. Other persons who have contributed in various ways include Thomas A. Burch, George H. Tokuyama, Shigeo Tengan, and Marie O. Viele of the Research and Statistics Office of the State Department of Health; Frank Skrivanek, Nancy Fowler, and Vickie Kim of the State Department of Planning and Economic Development; Donald D. Johnson, professor of Hawaiian history; and Y. Scott Matsumoto, Alan and Kajorn Howard, and Lee and Will Kyselka. Special appreciation goes to the photographers and artists who provided material for the pictorial presentation. The work of each has been credited with the appropriate illustration. I am grateful to Herb Kane and the Hawaii State Foundation on Culture and the Arts for permitting duplication of his original drawing. Others who contributed to the collection and production of pictures include Ted L. Bell, Susie Y. Anderson, Albert Katsuyama, and Fred N. Domingo of the Health Instructional Resources Unit of the John A. Burns School of Medicine of the University of Hawaii; Brother Lawrence Scrivani of the Society of Mary, Chaminade College of Honolulu, who generously offered use of the Brother Bertram Collection; Nancy Foon Young and Melvin Ezer of the General Assistance Center for the Pacific of the College of Education, University of Hawaii; James E. Pearson, Department of Architecture, University of Hawaii; Marjorie A. Wightman, Margot A. Morgan, Howard S. Kaohi, Clifford S. Tsuruda, Blase Camacho Souza, George E. Bacon, Patsy T. Mink, and George R. Ariyoshi. Thanks also go to the
XX
PREFACE
Honolulu Star-Bulletin and the Honolulu Advertiser, the Hawaii Visitors Bureau, Camera Hawaii, and the R. M. Towill Corporation for making their pictures available to this project. I am also grateful to the publications, computer, cartographic, and stenographic staff of the East-West Population Institute for their assistance. Special acknowledgment is given to the publications department, including Sandra Ward, Elizabeth B. Gould, and Lois M. Bender; to Minja Choe, Carol H. Carlson, Judith Tom, and Victoria C. H. Ho for computer programming; and to Irma Kaneshiro, Irene Oxiles, and Lynette Tong for typing. Appreciation goes to Director Lee-Jay Cho, Keith E. Adamson, and Virginia Dolan of the East-West Population Institute, and to Robert B. Hewett, director of Publications and Public Affairs of the East-West Center, for their encouragement. Finally, a word of thanks is expressed to my family. My inspiring husband and our children provided thoughtful criticism and continued support for this project, and they gave up the use of a dining room table for many months.
Introduction
is unique. It is the only state in the country where all racial groups are minorities and where the majority of the population has roots in the Pacific islands or Asia instead of Europe or Africa. Waves of immigrants of different ethnic groups have arrived in Hawaii over more than a century. With the passing of each generation, the racial identity and distinct cultural patterns have been diluted by intermarriage and culture-mixing. The rapid rise in population caused by continued in-migration and natural increase led to profound changes in the physical environment of the islands as well as in the economy, social structure, and life-style. Since 1900, when only 154,000 persons resided in Hawaii, the population has grown at an average annual rate of 2.3 percent and is now approaching one million inhabitants. The effects of unrestrained growth on the finite island community are readily visible. This brief review of the history of Hawaii's people offers demographic perspective on its native inhabitants, the nineteenthcentury immigrants, and the present population. Illustrations accompanying the text give evidence of the striking impact of increased numbers on a limited environment. HAWAII
1 Early Polynesian Immigrants
were probably the last large habitable landmass in the Pacific to be occupied by man. The chain of islands emerged, weathered, and eroded for millions of years without human incursions. The presence of people in Hawaii is a relatively recent phenomenon. Geologists indicate that volcanoes erupted through a rift in the north Pacific about 25 million years ago, gradually rising as much as 18,000 feet from the ocean floor to sea level and protruding above it to form the Hawaiian Archipelago. 1 Shoals, reefs, and 132 volcanic islands are the peaks of a submarine mountain range which extends 1523 miles from northwest to southeast across the Tropic of Cancer. 2 Island-building proceeded from west to east. The eight main islands—Kauai, Niihau, Oahu, Maui, Molokai, Lanai, Kahoolawe, and Hawaii—surfaced perhaps 5 million years ago, and volcanic action continues even now on the youngest, largest, and easternmost island of the group—Hawaii.3 (See Figure 1.) Over a long period of time plant and animal life were carried to the bare volcanic islands by trade winds, migrating birds, and currents of the sea.4 Living seed and spores dispersed and evolved to form native plants. Close examination of native Hawaiian flora and fauna reveals that they possess features adaptable to long-distance transport. The presence of flowering plants is attributed to birds which carried seeds, either internally, dropping them on arrival, or externally in the feathers. Such plants as THE HAWAIIAN ISLANDS
EARLY POLYNESIAN IMMIGRANTS
5
the pohuehue (a pink-flowered morning glory) and the hala tree probably drifted to the Islands on ocean currents and then took root along beaches. Later some plants evolved inland which are now found in upland forests. Some snails, insects, and birds demonstrate processes of evolution that are unique to these isolated islands. The only endemic land mammal found in Hawaii, however, is the hoary bat.5 Ancient Hawaiian stories give varied accounts of the coming of people to the islands. David Malo, a nineteenth-century Hawaiian scholar, reported contradictory genealogies that attempted to explain the origin of the first inhabitants.6 According to the genealogy called Kumulipo, the first human being was Lailai, whose union with Ke-alii-wahi-lani (the king who opens heaven) created the ancestors of this race. The genealogy called Lolo describes the first native Hawaiian as Kahiko, whose son Wakea and his wife Haumea (also known as Papa) were progenitors of the race. Abraham Fornander, in his study of the origin and migration of the Polynesian race, traces fifty-six generations from the time of Wakea to 1870 and dates Wakea's era at about 190 A.D.7 The nineteenth-century Hawaiian historian Samuel M. Kamakau wrote that a man named Hulihonua and a woman named Keakahulilani are said to have been the first inhabitants, preceding Wakea by twenty-eight generations.' Some Hawaiian legends tell of the creation of man. The legend of Hawaii Loa states, "The gods, seeing the man without a wife, descended on earth, put him into a sleep, took out one of his ribs and made it into a woman." But this tale was probably influenced by biblical teachings of the missionaries and was not based in authentic Hawaiian tradition.9'10 There is no written history from ancient days to describe the migration of the Polynesian ancestors of the Hawaiians, but scientists have gathered vast amounts of data from archeological, botanical, and linguistic studies that trace the probable origin of these people from south Asia. A Caucasian offshoot is believed to have moved eastward from south of the Himalayas, mixed with Mongoloid people of the Malay Archipelago, and then pushed into the Pacific." The languages of Polynesia have a common origin with those in Melanesia, Micronesia, and Indonesia, and most of the food plants and animals can be traced to southwestern islands.
6
EARLY POLYNESIAN IMMIGRANTS
As long as 3000 years ago, Polynesians were isolated in a home group of islands—perhaps Tonga and Samoa—where common traits of culture, physique, and language developed.12 Whether motivated to move by warfare, a search for land with more plentiful food, or the lure of adventure, these people migrated across vast stretches of the Pacific to the Marquesas, Tahiti and others of the Society Islands, Easter Island, New Zealand, and Hawaii. The Polynesian seafaring pioneers acquired knowledge of navigation.13 To travel long distances, they relied on the locations of the rising and setting sun and stars, the positions of the stars in the southern and northern hemispheres, the limits of the ecliptic and the weather at the equator, the winds, and the swells and currents of the tides.14 Trained judgment and keen observation enabled them to identify land by the color and dispersal of clouds, the flight of birds, the te lapa, or underwater lightning streaks which dart out from island positions, and other signs.15 In addition, these seafarers possessed courage, endurance, and confidence. They were accorded by their society a high prestige for their skills. The boat-builders constructed sturdy seagoing vessels which could carry men, women, children, and some animals. Provisions such as dried fish, breadfruit paste wrapped in pandanus leaves, coconuts, edible roots, fruits, and water-filled gourds enabled the voyagers to survive for several months at sea while traveling thousands of miles. It is possible that the large physique of the Polynesians resulted from selective pressures that required them to have natural insulation to withstand the rigors of the long voyages.16 The Hawaiian genealogies do not say how or when people arrived on the Islands, but Malo mentions, "It is thought that this people came from lands near Tahiti and from Tahiti itself, because the ancient Hawaiians at an early date mentioned the name of Tahiti in their mele [songs or chants], prayers, and legends.'" 7 The Hawaiian language closely resembles the Tahitian. Samoan, Tongan, and Maori words, however, have characteristics that indicate a common homeland for both eastern and western Polynesian groups." The Hawaiians'-physical features, their traditions, and the names of their deities and places are similar
EARLY POLYNESIAN IMMIGRANTS
7
Skill in boat-building and navigation made it possible for the ancient Polynesians to carry families, animals, and provisions across thousands of miles of the Pacific Ocean. Courtesy of artist Herb Kane from the collection of the Hawaii State Foundation on Culture and the A rts
to those of the Tahitians, and artifacts such as fishhooks, adzes, and ornaments bear a close resemblance to those of central Polynesia. In the ancient Hawaiian legend of Kumuhonua and his descendants, the Polynesians are called kapo'e Menehune, or "the Menehune people."" A Marquesan legend also refers to a group of people with a similar name, and in Tahiti the name Manahune referred to the laboring class, or commoners. It is possible that the Manahune of Tahiti were in the employ of early chiefs who settled the Hawaiian Islands. Later legends described the menehune as mythical, elflike creatures who built a heiau (temple) or a fish pond in a single night and performed other superhuman feats.20 Archeologists have determined by radiocarbon dating of ancient campsites that the earliest human habitation in the Hawaiian chain occurred from about 500 to 750 A.D. It is believed that the first settlers may have come from the Marquesas and that Tahitians may have arrived between 900 and 1300 A.D.21 Recent ar-
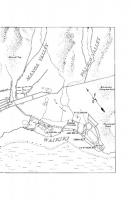
i igure 2.
Routes of the Early Polynesian Migrants
SOURCE: K y s e l k a 1971, p. 3 8 - 3 9 .
PRINCIPAL ROUTES OF THE POLYNESIANS
10
EARLY POLYNESIAN IMMIGRANTS
cheological theories suggest that the original migrants increased in population and then initiated voyages of exploration and conquest." The 2500-mile sea route between Hawaii and Tahiti was repeatedly negotiated until perhaps the fourteenth century, when the voyages gradually ceased (Figure 2). There are no reliable population figures in legendary Hawaiian history. An excess of births over deaths and an absence of contagious diseases accounted for a growth in numbers by natural increase, while warfare, infanticide, abortion, sacrificial killing, and limited health measures kept the rate of growth low. In the fifteenth century King Umi of the island of Hawaii is said to have conducted a census to determine the sizes of the populations of his various districts.23 He directed all of the people to come to his temple and each to bring a stone representing the bearer's strength. The rocks for each district were deposited in a
Early inhabitants of Hawaii, such as this Hawaiian pounding poi from a taro root, used natural resources with care and maintained life in harmony with the environment. State Archives
EARLY POLYNESIAN IMMIGRANTS
11
pile at the Heiau of Umi, located on the slopes of Hualalai Mountain. The district of Kona, according to tradition, was represented by the largest pile of stones. The early inhabitants of Hawaii developed a distinctive Stone Age culture over a period of about a thousand years. Although they had neither written language nor metals, they established a subsistence economy with complex religious, cultural, and social practices. Theirs was a cooperative society in which natural resources were used with care and life was maintained in harmony with the environment. NOTES 1. 2. 3. 4. 5. 6. 7. 8. 9. 10. 11. 12. 13. 14. 15. 16. 17. 18. 19. 20. 21. 22. 23.
Carlquist 1970, p. 3. University of Hawaii, Department of Geography, 1973, p. 9. Stearns 1966, pp. 1-3. Carlquist 1970, pp. 81-111. Berger 1972, pp. 7,14. Malo 1951, pp. 3-5. Fornander 1969, vol. 1, pp. 160-169. Kamakau 1964, p. 3. Kepelino and Kamakau, in Fornander 1974, p. 267. Barrère 1961, pp. 422-425. Buck, in Handy et al., 1965, p. 23. Emory 1974, p. 739. Lewis 1972, pp. 10-12. Fornander 1969, vol. 2, p. 8. Lewis 1974, p. 751. Emory 1974, p. 745. Malo 1951, p. 6. Elbert 1953, p. 169. Fornander 1969, vol. 1, p. 55. Luomala 1951, p. 10. Buck, in Handy et al. 1965, p. 28. Emory, in Handy et al. 1965, p. 320. Baker 1917, pp. 62-70.
2
The Coming of Westerners and the Depopulation of the Native Hawaiians
the Hawaiian race was relatively undisturbed by external influences. Legends describe the wanderings of Hawaiian voyagers to other lands, and one tale relates their return to Oahu with two white priests.' Shipwrecked Japanese sailors are said to have landed in Maui in the thirteenth century,2 and during the early sixteenth century white people, who may have been Spaniards, are reported to have arrived in Hawaii aboard a disabled vessel and to have cohabited with the populace.3 A Spaniard named Juan Gaetano in 1555 reported finding a group of islands at the same latitude as the Hawaiian Islands, which he named Los Majos ("the tableland"), which might have referred to the large, flat mountains of the island of Hawaii. He recorded the longitude incorrectly, however, so the islands remained isolated.4 Two hundred years ago Westerners again encountered the hospitable Hawaiians and permanently altered the course of civilization in the Islands. Captain James Cook, with H.M.S. Resolution and H.M.S. Discovery, found Hawaii on January 18, 1778, while on a voyage in search of a northern sea passage from the Pacific to the Atlantic.5 "I had never before met with the natives of any place so much astonished as these people were upon entering a ship—strongly marking to us that till now they had never been visited by Europeans, nor been acquainted with any of our commodities except iron, which, however, it was
FOR A THOUSAND YEARS
THE COMING OF WESTERNERS
13
plain they had only heard of, or had known it in some small quantity brought to them at some distant period," Captain Cook reported in his journal. 6 He named the group of islands the Sandwich Islands, in honor of his patron, the Earl of Sandwich, then first lord of the British Admiralty. The Hawaiians treated the visitors with awe and respect, identifying Cook with their god Lono. They referred to the ships as floating islands, and the chiefs called upon their people to contribute provisions and to supply the other needs of the foreigners. Cook described the islanders as frank, cheerful, and friendly, and he was impressed by the affection the women and men showed toward their children.7 On a return voyage in 1779, a tragic altercation with the Hawaiians at Kealakekua Bay resulted in Cook's death, but his detailed account of the discovery of the islands and their inhabitants awakened international interest and opened the door to world travelers." An estimate of the population of Hawaii in 1778 was made by Captain Cook's officers, based upon the average number of persons in each house multiplied by an average number of dwellings per village. The totals varied from William Bligh's figure of 242,000 to James King's estimate of 400,000.' In 1823 an English missionary, William Ellis, toured the Sandwich Islands and reported a population of about 85,000 on Hawaii; 20,000 on Maui; 2000 on Lanai; 3000 on Mojokai; 20,000 on Oahu (with 6000 or 7000 inhabitants in Honolulu); and 10,000 on Kauai
Captain Cook's ships, H. M. S. Resolution and H. M. S. Discovery, brought Western ideas and culture, industrial implements, tools of war, and unfamiliar diseases to the Islands. State Archives
14
THE COMING OF WESTERNERS
(including Niihau)—or a total of approximately 140,000.10 Censuses conducted by the American missionaries in 1831/1832 and 1835/1836 showed a decline from 130,313 to 108,579 during the four years; according to the official government census of 1850 the population had decreased to 84,165." An all-time low of 56,897 was recorded by the census in 1872, but the actual nadir was probably the 53,900 total population in January 1876, almost a hundred years after the arrival of foreigners (Table 2; Figure 3).12 The coming of Westerners had a fatal impact on the Hawaiians. Although foreigners made many contributions to the society, such as a written language, Western education, metal, cloth, and manufactured goods, they also introduced previously unknown diseases, firearms, gunpowder, and alcohol. The seventyfive years between 1778 and 1853 saw political consolidation and the establishment of the Hawaiian monarchy, but it also produced complex changes in religion, land use, the economy, and health practices that permanently altered the Hawaiian culture. The rapid depopulation of the Hawaiian race is traced to many causes. Missionary Ellis described deserted villages and abandoned enclosures, which he attributed to "the frequent and desolating wars which marked the early part of Kamehameha's reign, the ravages of a pestilence, brought in the first instance by foreign vessels, which has twice, during the above period [17781823] swept through the islands; the awful prevalence of infanticide; and the melancholy increase of depravity, and destructive consequences of vice." Hawaii State Statistician Robert C. Schmitt has explained the severe depopulation as a result of declining fertility, high infant mortality, and emigration. According to Schmitt in 1971, such factors as wars, famine, and natural disasters—including the 1790 volcanic explosion of Kilauea Crater—have been exaggerated as reasons for population decline. Altogether they caused only about a thousand deaths during the first fifty years following the Hawaiians' contact with Westerners.13 Catastrophies, including earthquakes, tidal waves, volcanoes, wars, marine disasters, fires, transportation accidents, storms, and violence, have taken fewer than 6000 lives in the Islands in almost 200 years.14 The natural increase of the Hawaiian population was severely
Population (1,000s)
Figure 3. Population of Hawaii, 1778-1975 NOTE: Population changes from 1970 to 1975 are based on estimates from birth, death, and migration tabulations. Figures for 1970 are not directly comparable with other years because of changed census definitions of race. SOURCES: Schmitt 1968, Table 11; 1971a, Table 3; 1973a, Table 1. Hawaii (Kingdom) General Superintendent of the Census 1878, 1884, and 1891. Hawaii (Republic) General Superintendent of the Census 1897, Table 1. United States Bureau of the Census 1913, Tables 8, 10, 25, 27; 1932, Table 4; 1943, Table 2; 1953, Tables 11, 29, 30; 1961, Tables 16, 17; 1962, Table 96; 1963, Table 61; 1971b, Tables 17, 20; 1972a, Tables 96, 138, 139. Nordyke 1975b, unpublished tables.
16
THE COMING OF WESTERNERS
retarded by a decline in births and by a high incidence of stillbirths and fetal deaths. The ancient Hawaiians prayed that their race might "increase, and flourish, and sprout from the parent stock. 'Thriving seedlings ka po'e kahiko [the people of old] bore; great gourds filled with seeds they were. But today they are poison gourds, bitter to the taste.' " 1S Diseases introduced by early visitors took a heavy toll of the unprotected natives. Venereal diseases, such as syphilis and gonorrhea, were brought first by men on Cook's ships and later by crews and wayfarers on vessels from many parts of the world." Syphilis impaired the health of its victims, causing prenatal infection and congenital defects that frequently were fatal to children, either before birth or in infancy. Gonorrhea caused inflammation and scarring of the reproductive tract, which resulted in sterility." Captain Cook declared in his journal: The order not to permit the crews of the boats to go on shore was issued that I might do everything in my power to prevent the importation of a fatal disease into this island, which I knew some of our men laboured under, and which, unfortunately, had already been communicated by us to other islands in these seas. With the same view, I ordered all visitors to be excluded from the ships."
His orders were not followed, however. Hawaiian women, who knew nothing of the negative concept of promiscuity or of diseases related to it, had sexual relations with members of Cook's crew and then passed the infection on to the community. In 1824 E. Loomis, a missionary, wrote that an order was published to prohibit women from going on board ships, but sailors from the ships in port "insisted that they must have their girls and would seize and carry them off by force."" Schmitt has suggested that crude birth rates of the 1830s and 1840s—the earliest dates for which statistics may be considered reliable—must have fallen below 30 per thousand inhabitants and may have dropped as low as 15.20 (Demographic terms such as crude birth rate are defined in the Glossary.) Another cause of depopulation was high infant mortality. Infanticide was described by the missionary Ellis: "However numerous the children among the lower orders, parents seldom rear more than two or three, and many spare only one; all the
THE COMING OF WESTERNERS
17
others are destroyed." 21 This practice was forbidden by the chiefs in the early nineteenth century.22 The disruption of the ancient social system and the discarding of old kapus (taboos) that controlled kinship and dietary patterns reduced protective measures and increased the susceptibility of Hawaiian infants to disease. In 1838, missionary A. Bishop reported that "the great majority of children born in the islands die before they are two years old." 23 Historian Samuel M. Kamakau wrote that some Hawaiian women had as many as ten or twenty children, but few of them grew to maturity. 24 Even in the early twentieth century, the infant mortality rate for Hawaiian babies was notably high.25 Emigration was also a cause of population decline. Young men, drawn by prospects of adventure on the high seas, joined the crews of transport, fur-trading, and whaling ships. Kamakau tells of the departure of some of his people who felt oppressed by new land laws. "The foreigners were benefited and they have stayed here because they like new lands, but the people of Hawaii waited for the benefits of the government under the law from strange lands. For fear of the law they went, and were not seen again in this Hawaii." 26 Statistics on out-migration of Hawaiians are speculative. The number of departing Hawaiians has not been tallied, although Hawaiian names are included in some crew listings. An 1829 expedition of the Hawaiian chief, Boki, with 479 aboard, is known to have been lost at sea. In 1850, it is said, 4000 Hawaiians were absent from the kingdom, a number that Schmitt has calculated "amounts to almost 5 percent of the total Hawaiian and part Hawaiian population at that time, and 12 percent of all Hawaiian males 18 years of age or more." 27 The mortality level among Hawaiians was excessively high. Because the islanders possessed no natural immunity to the diseases of Westerners, they became victims of contagious illnesses, such as measles and mumps, that were rarely fatal to Europeans and Asians. The crude death rate ranged between 30 and 50 deaths per 1000 in the total population, with higher rates recorded during epidemics.28»29 The heavy death toll during the first fifty years after Cook's arrival has been attributed to Kamehameha's wars, conquest, famine (caused in part by the di-
18
THE COMING OF WESTERNERS
version of farmers from agriculture to the gathering of sandalwood for export), human sacrifice, and natural disasters. In fact, the total loss of life from all these events was minimal. The major cause of the high mortality was a series of epidemics introduced by foreigners, against which the native population had no immunity. In 1804 the ma'i 'dku'u (squatting sickness), a dysenteric disease that may have been cholera, took between 5000 and 15,000 lives.30-31 An epidemic of "cough, congested lungs, and sore throat"—probably influenza—killed thousands in 1826; and mumps struck the island population in 1839.32 Measles, which had killed Kamehameha II and his wife, Kamamalu, while they were visiting in England in 1824, was one of the factors responsible for the high death rate of 98 per 1000 population in 1848—a loss of more than 10,000 persons.33-34 Smallpox was brought to Hawaii in 1853, where it cut a swath of death, especially on Oahu. Despite the opening of hospitals, the appointment of three commissioners of health, the development of a system for ship inspection and quarantine, and the establishment of a vaccination program, the number of smallpox cases in the mid-nineteenth century mounted into the thousands.35-36 In the 1880s another smallpox epidemic of smaller proportion was brought to the Islands by Chinese immigrants.37 Other contagious diseases having devastating consequences for the Hawaiians were whooping cough, influenza, bubonic plague, Asiatic cholera, scarlet fever, leprosy, and tuberculosis. The kahuna lapa'au (medical practitioner), who had been trained to care for the illnesses of ancient Hawaii, did not know how to treat infectious diseases.3' Some Western physicians settled in the Islands, but Hawaiians were confused and wary of their medical practices. A government physician wrote in 1892: "There are many cases of serious illnesses among the natives that never come under our observation, because of their indifference to receiving medical aid, or to their preference for the injurious and fatal humbuggery of kahunas." 3 ' In 1914 the superintendent of the Anti-Tuberculosis Bureau described problems relating to the health of Hawaiians. He wrote: [Tuberculosis] seems to be directing its deadly aim at one section of the community above all others—at the very class that this
THE COMING OF WESTERNERS
19
community is in duty bound to protect against all others—the Hawaiian race. The death rate amongst the Hawaiian race from tuberculosis is 66 per 10,000 (in contrast to 17.3 per 10,000 for the whole Territory). Two factors operate to produce this high death rate—first, an absence of race immunity; tuberculosis finding in them a virgin soil—they have inherited no resistance from their ancestors as other races have done. This is strongly borne out when the death rate of Part-Hawaiians is noted—the admixture of the susceptible Hawaiian with the more resistant races brings the death rate per 10,000 down from 66 to 11.2. The second factor is undoubtedly the adverseness of the Hawaiian race to submit to treatment or seek aid when ill, and often there is a seeming active evasion in order to seek treatment, and a reluctance to accept advice.40 In just two hundred years, the pure Hawaiian race has been almost completely depleted by high mortality, low fertility, outmigration, and intermarriage. The number of pure Hawaiians declined from an estimated 250,000 persons in 1778 to between
A Hawaiian family in 1890 poses beside their home at Puna, Hawaii. Brother Bertram Collection, State Archives
20
THE COMING OF WESTERNERS
1000 and 10,000 in 1970. An official government census of 1853 showed that they comprised 96 percent of the population; but by 1960, the last year in which they were counted as a separate ethnic group by the United States census, they represented only I.7 percent of the total population. University of Hawaii sociologist Bernhard L. Hormann has suggested, "groups which are statistically recognized are the ones which are sociologically rather than anthropologically recognizable. The fluidity of race relations is indicated by the fact that in the past decades certain races have 'disappeared', because in the first place they have become merged into wider groupings, e.g., Germans, Spanish, Portuguese, and all Caucasians as Caucasians, and Asiatic and Caucasian Hawaiians as part Hawaiians, these, in turn being in process of becoming once more simply Hawaiians. . . ." 41 As the Part Hawaiian and the non-Hawaiian population increased in the Islands, the pure descendants of the ancient Polynesian immigrants decreased in number until 1975, when they represented probably fewer than 1 percent of the people of Hawaii. NOTES 1. 2. 3. 4. 5. 6. 7. 8. 9. 10. II. 12. 13. 14. 15. 16. 17. 18. 19. 20. 21. 22. 23. 24.
Fornander 1969, pp. 24-26. Wakukawa 1938, pp. 3-4. Fornander 1969, pp. 106-110. Fornander 1969, pp. 158-159, 359-364. Ellis 1969, p. 1. Cook 1880, p. 829. Cook 1880, p. 843. Beaglehole 1967, pp. 637-672. Schmitt 1968, pp. 19-20. Ellis 1969, pp. 7-24. Schmitt 1973b, p. 8. Schmitt 1968, p. 223. Schmitt 1971a, p. 239. Schmitt 1969, pp. 66-86. Kamakau 1964, p. 99. Lee 1938, pp. 2-4. Benenson 1970, pp. 244, 97. Cook 1880, p. 830. Loomis, in Westervelt 1937, p. 46. Schmitt 1971a, p. 239; Schmitt 1973b, pp. 13, 15-17. Ellis 1969, pp. 326-332. Schmitt 1968, p. 31. Bishop 1838, p. 54. Kamakau 1961, p. 237.
THE COMING OF WESTERNERS 25. 26. 27. 28. 29. 30. 31. 32. 33. 34. 35. 36. 37. 38. 39. 40. 41.
Larsen, in Handy et al. 1965, p. 267. Kamakau 1961, p. 404. Schmitt 1968, p. 39. Schmitt 1971a, p. 240. Schmitt 1968, p. 33. Kuykendall 1938, p. 49. Schmitt 1970, pp. 359-364. Papa Ii 1973, pp. 163-164. Thrum 1897, pp. 95-101. Schmitt 1968, p. 33. Kuykendall 1938, pp. 411-413. Daws 1968, pp. 139-143. Kuykendall 1967, pp. 136-137. Alexander 1891, pp. 66-67. Hawaii (Kingdom), Board of Health 1892, pp. 3-6. Hawaii (Territory), Board of Health 1914, pp. 98-99. Hormann 1954, p. 47.
21
3 Nineteenth-and Twentieth-Century Immigrants and Admixtures
" T H E DECREASE of our population is a subject in comparison with which all others sink into insignificance," said King Kamehameha IV to his legislature in 1855. The economy of the kingdom was threatened by a shortage of labor. Merchants, missionaries, and officials of the royal government joined in a united effort to bring new life and new blood into Hawaii. The decision by island businessmen to grow sugar as a primary source of economic revenue set the course for population, politics, and commerce in the second half of the nineteenth century. The development of a sugar industry required a large labor force. Hawaiians were recognized as industrious and competent workers, but their declining numbers were insufficient to meet the increasing demand for field-workers. One report showed that more than 50 percent of the ablebodied Hawaiian male population of the kingdom were employed on plantations, yet this represented fewer than 3000 men. 1 With the discovery of gold in California and a growing population on the West Coast of the United States, there was a considerable increase in the demand for sugar; but to produce sugar cane profitably it was necessary to have dependable, abundant, and cheap labor. In the absence of an adequate supply of workers in the Islands, recruitment of new laborers was considered essential to build the kingdom's economy (Figure 4).
xi «
H
•O"" ro\ T M I3 O U
a a
00
24
NINETEENTH- A N D T W E N T I E T H - C E N T U R Y IMMIGRANTS
Chinese
Chinese had resided in Hawaii in small numbers since the time of the early traders and seafarers. Employed as crew members of British and American ships, some remained in the Islands and married Hawaiians.2-3 They established business enterprises and participated in early efforts to grow sugar. The early groups of indentured immigrants to enter Hawaii were from the two southeastern maritime provinces of Kwangtung and Fukien in mainland China.4 Under provisions authorized by Hawaii's Act for the Government of Masters and Servants, passed in 1850, laborers could be imported to Hawaii as apprenticed plantation workers, to serve for terms not to exceed five years. Chinese men willingly left their homeland, which was then in a state of political and economic crisis, to move to the "land of fragrant sandalwood mountains." They were offered free passage, wages of three dollars a month, room and board, and clothing, in exchange for a promise to work for five years on
Contract laborers from China arrive in Hawaii in the 1880s. State Archives
NINETEENTH- AND TWENTIETH-CENTURY IMMIGRANTS
25
a sugar plantation. 5 The first organized importation of Chinese coolies brought about 200 men in 1852, aboard the British bark Thetis. Later in the year the same vessel carried about a hundred more workers to Hawaii. The early Chinese arrivals were reported to be quiet, able, and willing workers, but they were criticized by King Kamehameha IV as having " n o affinities, attractions, or tendencies to blend with this or any other race." 6 Later, they were accused by health authorities of introducing smallpox, leprosy, and opium addiction to the Hawaiian community. As their contracts expired, they moved into the towns and were held responsible for contributing to unemployment, gambling, sexual perversion, and increased crime, as well as for competing with the islanders in business endeavors. Dr. William Hillebrand, royal commissioner to China and India, explained to the Hawaiian Board of Immigration in 1865, "The fault has been in great measure with ourselves, inasmuch as no females were imported at the time, and no organization existed to control and direct the course of those who had served out their time." 7 In 1864 the Bureau of Immigration had been created to control more closely the importation of foreign labor. 8 The United States, at the conclusion of its Civil War, and Great Britain were sensitive to the "coolie trade" in Hawaii because they objected to any contract labor system that might resemble serfdom or slavery. The Hawaiian government reaffirmed its position that immigration was promoted for the primary purpose of population reinforcement, rather than for obtaining plantation labor. Nevertheless, the effect of the imbalance of the numbers of males on the composition of the population was a continuing concern of the legislators. Dr. William Hillebrand had been appointed commissioner of immigration to go to China to secure coolies "of the most respectable and best class of persons" and to try to induce wives and families to accompany the men.® With the passage in 1876 of the Reciprocity Treaty, which allowed Hawaiian sugar to be imported to the United States free of duty, the demand for plantation labor skyrocketed.10 To encourage immigration, the legislative assembly appropriated funds to bring more laborers and their families to the kingdom. Wages of plantation workers increased to between twelve and fourteen dollars a month without board." Chinese were actively
26
NINETEENTH- A N D TWENTIETH-CENTURY IMMIGRANTS
recruited from China and California. Between 1866 and 1884, the population of Chinese in Hawaii increased from 1200 to more than 18,000 (Table 3; Table 4b.4). Community forces became concerned with the rapid inflow of the predominantly male Chinese population. For every seventeen Chinese men living in Hawaii in 1884, there was only one Chinese woman. United States Secretary of State James G. Blaine wrote about this in 1881: The steady diminution of the native population of the islands, amounting to some 10 percent between 1872 and 1878, and still continuing, is doubtless a cause of great alarm to the government of the kingdom. . . . The problem, however, is not to be met by a substitution of Mongolian supremacy for native control—as seems at first sight possible through the rapid increase in Chinese immigration to the islands. . . . The Hawaiian Islands cannot be joined to the Asiatic system. If they drift from their independent station it must be toward assimilation and identification with the American system. . . .' 2 In response to reports of mistreatment and exploitation of Hawaii plantation workers and of abuses in the policies of re-
Chinese workers labored on sugar plantations from 6 A.M.to 5 P.M., six days a week, in the late nineteenth century. State Archives
NINETEENTH- AND TWENTIETH-CENTURY IMMIGRANTS
27
cruiting and transporting laborers, the Chinese government prohibited emigration to Hawaii in 1881. The Colonial Office in London also issued a directive that emigration from Hong Kong to the Hawaiian Islands be stopped. In 1883 the Hawaiian Cabinet Council, concerned that the Chinese had glutted the Hawaiian labor market, passed a resolution restricting Chinese immigration to 2400 per year. Hawaiian government regulations in 1885 and 1886 virtually ended Chinese contract labor immigration by requiring that passports could be given only to residents who had been working in trade or industrial enterprises in Hawaii for at least one year, to Chinese women and children, and to a few residents of China who were invited to the islands by the minister of foreign affairs. Chinese were permitted to enter Hawaii only under conditional work permits, and they were required to leave after five years. 13 Some Chinese laborers returned to their homeland, and between 1884 and 1890 the Chinese population of Hawaii declined from 18,254 to 16,752. Many Chinese who settled in Hawaii before the 1885 and 1886 regulations fulfilled their contracts to work on the sugar plantations and moved to other agricultural pursuits, including the cultivation of rice, vegetables, and coffee. Others joined businesses in town, such as bakeries, liquor wholesalers, restaurants, and laundries. There were 5727 Chinese employed on the sugar plantations in 1888, but only 2617 in 1892. The legislature of 1890 arranged conditional work permits for Chinese immigrants in order to provide labor for the plantations and for rice growers, who were clamoring for workers. But these immigrants were required to leave the kingdom after five years. When Hawaii became a territory of the United States in 1900, immigration of Chinese labor was prohibited, although some groups (teachers, students, merchants, and travelers) were exempt from this ruling, and wives and children of residents were permitted to enter under special permits. Estimates of the total number of Chinese immigrants arriving in Hawaii over the past two hundred years have ranged from 40,000 to 50,000 (Table 10 and Table 11). Restrictive laws caused their numbers to decline, as about 27,000 Chinese left the Islands between 1886 and 1903. With repeal of the 1882 United States Chinese Exclusion Act in 1943 and a liberalization of im-
Upon completing their sugar contracts, the Chinese moved to town and to new occupations, such as merchandising. State Archives
NATIVE
CONGREGATION
IN
1828.
Fewer than 200 Caucasian Protestant missionaries were sent to Hawaii between 1820 and 1847 to preach to the natives in the Sandwich Islands. State Archives
NINETEENTH- AND TWENTIETH-CENTURY IMMIGRANTS
29
migration quotas, there has been a moderate increase in the Chinese population since then.15 The ratio of males to females in this group was unbalanced until recent decades, owing to disproportionate male immigration. Recently Chinese in Hawaii have had a high rate of intermarriage: during the 1960s, 58 percent of Chinese grooms and 62 percent of Chinese brides were reported as marrying persons of other races.16 The 1970 United States census tallied 52,375 Chinese in Hawaii, including many of mixed ancestry, or 6.8 percent of the total state population. Though their birth rates were high in the early part of the century, the Chinese had a low level of fertility in 1970 (Table 6; Table 7).17 Chinese women have become active in the labor force. The Chinese in Hawaii in 1975 are a highly urbanized group. Caucasians
White people came to Hawaii as seafarers, merchants, missionaries, plantation laborers, members of the armed forces, or simply as- in-migrants from the mainland United States. They became known as haole ("ha"=breath; "ole"=without), a term originally used by Hawaiians for persons who did not know the Hawaiian language and culture." Although haole did not indicate skin color in its early usage, the word was applied to lightcomplexioned residents and to persons from America, the British Empire, France, and Russia." Immigrants who were brought from Europe as plantation laborers, including Portuguese, Germans, Norwegians, Spaniards, and Puerto Ricans, were classified in the censuses of the Hawaiian Kingdom and the United States by their countries of origin until the United States census included them in the broader definition Caucasian (Table 3; Table 4b.6). The number of Caucasians remained small until about 1875. Protestant missionaries listed fewer than 200 arrivals between 1820 and 1847.20 Seafarers and travelers stopped at the Islands for short visits, but few remained to establish permanent homes. The adoption of the Reciprocity Treaty in 1876, which permitted the exportation from Hawaii of duty-free sugar to a large American market, gave economic impetus to the Hawaiian government to subsidize the recruitment of European labor.
30
NINETEENTH- AND TWENTIETH-CENTURY IMMIGRANTS
The Planters Society, later known as the Hawaiian Sugar Planters' Association (HSPA), was established in 1864 to coordinate the efforts of planters, plantation agents, and others concerned with agricultural production. With their disillusionment at the employment of Polynesians, who had been brought from some of the Pacific islands for plantation labor but who adapted poorly to the work, and with growing criticism by the resident community of the rapidly increasing number of Chinese, the HSPA prepared more liberal contract agreements with Portugal to secure workers from the islands of Madeira and the Azores. The Portuguese workers were considered sober, thrifty, honest, industrious, and peaceable, and the presence of their wives and families gave them social stability. Between 1878 and 1887 seventeen ships brought almost 12,000 Portuguese to the Hawaiian Islands.21 The Caucasian population increased from 3748 in 1878 to 16,579 in 1884. A second wave of Portuguese was recruited between 1906 and
Portuguese laborers came to Hawaii with their women and children; they brought with them a musical instrument which was adapted by the Hawaiians to become the ukelele. State Archives
Portuguese /««a and Chinese laborers on a sugar plantation in 1896. State Archives
A Portuguese business establishment in 1900. The Portuguese, too, moved to town and new occupations. State Archives
32
NINETEENTH- AND TWENTIETH-CENTURY IMMIGRANTS
1913. After becoming a United States territory in 1900, Hawaii was subject to United States laws, which at that time did not permit Asian people to become naturalized citizens, so the Hawaii Board of Immigration in 1905 adopted a policy of trying to bring to Hawaii persons who would be eligible for American citizenship. Potential immigrant families from Portugal and Spain each were offered an acre of land, a house, and improved working conditions; almost 13,000 (4334 men, 3169 women, and 5388 children) responded.22.23 The Portuguese became the iunas, or foremen, on the plantations, and their families settled into Island communities and multiplied. Most of the Spaniards moved on to California, where they joined other Spanish communities. Private enterprise initiated the recruitment of several northern European groups. Two vessels in 1881 brought about 600 Scandinavians—primarily Norwegians, with a few Swedes,—including women and children. However, their food preferences— meat and dairy products—and their training as artisans and tradesmen did not suit them to plantation life.24 Most of them departed without leaving an imprint on island society. German immigrants were selected by a private commercial
Russian immigrants arrive in Hawaii on the beach near Iwilei on Oahu in 1910. Courtesy of Nancy A. McLaren
NINETEENTH- AND TWENTIETH-CENTURY IMMIGRANTS
33
firm, H. Hackfeld and Company, with more regard to their adaptability to semitropical climate and plantation work. Almost 1400 arrived from northwest Germany between 1881 and 1897. Under the paternalistic care of a Kauai sugar plantation, they formed a successful community, which continued their homeland customs.25 Russians had lived in Hawaii between 1804 and 1819, during the reign of King Kamehameha I. A Russian fort was built at Waimea, Kauai, in 1817, but Czar Alexander I refused to acknowledge it, and he instructed his representatives to confine their work to peaceful commercial relations with the island kingdom. In the absence of government support, the Russians departed. 26 ' 27 In the early twentieth century, the Board of Immigration recruited 110 Molokans and more than 2000 Russians from Harbin in Manchuria, but few stayed in the Islands after their period of contract. 2 ' Puerto Ricans, a Spanish-speaking people, became U.S. nationals after the Spanish-American War. In 1900 and 1901, 5200 of them left their hurricane-devastated homeland to seek a new home and employment in Hawaii. Of the 5200, 2390 were men who came to Hawaii on a three-year agricultural contract; the remainder were wives and children. They drew their diverse ethnic heritage from pre-Columbian Indians, Caucasians of Spanish background, and blacks of African descent. Intermarriage with Portuguese, Spaniards, Hawaiians, and Filipinos was common and their families were large. In 1950, in the last census at which Puerto Ricans were counted separately, they had increased to almost 10,000 persons. Other Caucasian groups whose importation costs were paid by government or plantations came to the Islands during the late nineteenth and early twentieth centuries as well. They included 372 Austrians, 84 Italians, a few Scots, and about 100 white Americans.29 In 1900 Caucasians represented only 18.7 percent of the population. By 1960, their number had grown to 32 percent, and by 1970 Caucasians and part-Caucasians had increased to 39.2 percent (Table 4b.6). This population growth is partly attributed to the presence of the armed forces, who consist primarily of whites, to a recent large in-migration of Caucasians from con-
34
NINETEENTH- AND TWENTIETH-CENTURY IMMIGRANTS
A Puerto Rican immigrant, recently granted United States citizenship, poses with his family in 1917 in the military uniform of his country. Courtesy of Blase Camacho Souza
tinental United States, and to changed census definitions of race. As Hawaii became a United States military center of major importance, the numbers in the armed forces and their families increased from about 4000 in 1920, to 15,000 in 1930, to at least 110,000 in 1970 (Table 4c).30.3' Military residents are usually temporary, but they have a significant demographic impact on the total population because of the disproportionate number of males among them, a relatively high birth rate among the wives, a low death rate because of their youth, and a large in- and outmigration. Almost one-fourth of Hawaii's total 1970 population had moved from the mainland since 1965, and most of those new res-
NINETEENTH- AND TWENTIETH-CENTURY IMMIGRANTS
35
idents were white. The estimated net increase of white residents caused by in-migration was 35,845 between 1960 and 1970. A changed census definition of race, in which ethnicity was determined by the individual respondent, absorbed into the Caucasian group some persons previously classified as Part Hawaiian and swelled the total number of Caucasians from 202,230 in 1960 to 301,429 in 1970. (A discussion of the classification of racial groups in Hawaii appears in Chapter 4.) Japanese The first Japanese to land in Hawaii were shipwrecked sailors. 32 Several incidents in which Japanese ships had sailing mishaps during the early nineteenth century brought rescued seamen to the Islands, and three Japanese crew members were naturalized as citizens of the kingdom of Hawaii before 1850. But the movement of large numbers of these people to the Islands did not occur until the promotion of Japanese contract labor fifteen years after that. "First and nearest to us lies Japan, inhabited by a people generally considered akin to the Hawaiians and who, we all agree, would be desirable immigrants," said Dr. William Hillebrand, commissioner of the Bureau of Immigration in the 1860s, as he sought men to meet the labor and population needs of the kingdom." In 1868, 140 men, 6 women, and 2 children were the first Japanese to be brought to the Islands by contract. 34 It was not long before complaints were received from both employees and employers. The Japanese charged that their contracts had been violated and they had received ill treatment, while the plantation employers asserted that some of the immigrants were "unadapted by education or habits for the service at which they were being employed." 35 The Hawaiian government returned about forty persons to their homeland and redrafted the treaty with Japan on immigrant arrangements, to ensure improved treatment for the laborers. After a decade, the help of Japanese workers was again solicited. Politician Walter Murray Gibson declared to the Chamber of Commerce of Hawaii in 1872: You have considered the races that are desirable, not only to supply your needs of labor but to furnish an increase of population that will assimilate with the Hawaiian . . . . We must never for-
Immigrant Japanese workers arrive at the dock in Hawaii in 1890. State Archives
The living quarters for the families of Japanese workers on the island of Hawaii in 1890 were simple thatched huts. R. J. Baker Collection, Bernice P. Bishop Museum
NINETEENTH- AND TWENTIETH-CENTURY IMMIGRANTS
37
get the desires and privileges of the race among whom we reside and who properly enjoy a political supremacy, owing to birthright and numbers . . . . We must look to races, who, whilst being good workers, will not much affect the identity of the Hawaiian, and whose gradual influx will harmonize with, and strengthen, by the infusion of new blood, the native stock. A moderate portion of the Japanese, of the agricultural class, will not conflict with the view that I present, and if they bring their women with them, and settle permanently in the country, they may be counted upon as likely to become desirable Hawaiian subjects.3®
New treaties improved the relationship of Japan with Hawaii, to initiate the largest immigration movement from any of the Asian countries. King Kalakaua's visit to Japan in 1881 smoothed the path with Japanese officials, and an economic depression in Japan served as an impetus for agricultural workers to leave their homeland. Three-year contracts offered free steerage passage at monthly wages of nine dollars for men and six dollars for women, food allowance, lodging, medical care, fuel, no taxes, and rice at not more than five cents a pound. In addition, workers were required to set aside 25 percent of their earnings as savings.37 The laborers were selected "from the farming class with particular attention given to physical condition, youth, and industrious habits." 3 ' Mr. R. W. Irwin, agent in Japan for the Hawaiian Board of Immigration, urged that these people could be led "by the silken thread of kindness," and he requested sugar planters to provide five gallons of hot water for each person each day, since "cleanliness is a strong point in their lives." 39 The number of Japanese grew rapidly from 116 in 1884 to 61,111 in 1900, making them the largest ethnic group, with almost 40 percent of the total Hawaiian population (Table 3; Table 4b.3). About 20,000 Japanese immigrants from Okinawa arrived between 1900 and 1924. Although at first they were discriminated against by the Japanese from Japan, they gradually were assimilated into the Hawaiian community.40 A "gentlemen's agreement" between the United States and Japan in 1907 imposed restrictions on the numbers of male laborers, so that arrivals after that time were primarily wives, "picture brides," or sons and daughters of immigrants returning to Hawaii. 41 Between 1868 and 1924 (when the Immigration Act of 1924 pre-
38
NINETEENTH- AND TWENTIETH-CENTURY IMMIGRANTS
vented further immigration) arrivals from Japan totaled 159,288 men, 49,612 women, and 4852 children.42 For more than thirty years the Japanese provided the major source of labor for the sugar plantations. Eventually, the workers became disillusioned at the low wages, the limited opportunity for personal growth in the industry, and the lack of social status in plantation employment. Some returned to their native land, and others moved to the continental United States. Many sought economic security in other work. 43 The deliberate importation of Japanese women as brides created a higher percentage of married men among the Japanese than in any other racial group. The relatively high crude birth rate among Japanese in Hawaii during the first half of the twen-
The strength of the political contribution to Hawaii of persons of Japanese ancestry was recognized with the election of Governor George R. Ariyoshi and Lieutenant Governor Nelson K. Doi in 1974. Courtesy of Governor's Office, State of Hawaii.
NINETEENTH- AND TWENTIETH-CENTURY IMMIGRANTS
39
tieth century (33 births per 1000 Japanese in 1930) was due in part to the relatively large percentage who were married and to the age and sex composition of their population (Table 6; Table 7). This contributed to their rapid rate of natural increase. In early decades, most of the Japanese population were less than fifty years old. As the population aged, crude birth rates dropped, giving a more even distribution of males and females, old and young. The number of interracial marriages of Japanese was low in comparison with other racial groups in Hawaii, yet the percentage of out-marriages increased from 0.5 among grooms and 0.2 among brides from 1912 to 1916 to 19.6 and 28.0, respectively, from 1960 to 1969.44 By 1970 there were 217,669 Japanese in Hawaii (28.3 percent of the population). From the Issei (first-generation immigrants from Japan) through the Nisei (children of Issei), Sansei (children of Nisei), and Yonsei (children of Sansei) generations, the strength of their contribution has been recognized in educational, social, and political areas of Island life.45 Blacks
Blacks first came to Hawaii as crew members of sailing vessels. History records a black businessman, Anthony Allen, in Honolulu in the early 1800s; Betsy Stockton was a black member of the missionary Charles Stewart's household in 1823.46>47 A small number of black Portuguese arrived aboard whaling ships from the Cape Verde Islands between 1820 and 1880. They were classified in the census as Portuguese or Part Hawaiian, because many of them married Hawaiians. They did not maintain solidarity as an ethnic group. 48 Sugar planters were not in favor of importing American blacks to work in Hawaii in the 1860s, since the transportation costs were high, and after the Civil War blacks tended to distrust labor contracts. Public opinion, sensitive to the United States' problems in the use of blacks for plantation labor, also was opposed to this immigration. J. E. Bush, president of the Board of Immigration, reported in 1882, "The Legislature was decidedly averse to Negro immigrants, even to opposing people from New Hebrides." 4 ' The Puerto Ricans who came in 1901 were of black African,
40
NINETEENTH- AND TWENTIETH-CENTURY IMMIGRANTS
A black Puerto Rican child at Lahaina, Maui in 1915. R. J. Baker Collection, State Archives
American Indian, and Spanish descent. Although the United States census usually classified persons of black descent as "Negro," this group was included in the Puerto Rican category, which was later absorbed in the Caucasian totals. According to Romanzo C. Adams, pioneer sociologist in Hawaii, "In 1940 another change in the classification of part Puerto Ricans reduced the Negro population from 563 to 255 at a time when the American Negro population was in all probability growing." 50 The military establishment in Hawaii brought twenty-five to thirty blacks to the Islands after annexation of Hawaii to the United States in 1900, including a few families by 1910. World War II increased this group from 255 in 1940 to 2651 in 1950.
NINETEENTH- AND TWENTIETH-CENTURY IMMIGRANTS
41
Blacks, most of whom were military personnel and dependents, have shown the highest average annual growth rate among Hawaii's ethnic groups. In 1970 they numbered 7517, or 1 percent of the population (Table 3; Table 4b.8). Filipinos
As doors closed against the recruitment of Chinese labor, new sources of cheap labor were sought. The acquisition of the Philippine Islands by the United States after the Spanish-American War of 1898 lifted immigration restrictions for Filipinos. Subsequently, the Organic Act of 1900, the legislation that made Hawaii a territory of the United States, enabled large numbers of adult Filipino males to enter Hawaii as nationals. They took positions as unskilled workers on sugar and pineapple plantations, on coffee farms, and in commercial fishing. A numerical balance among ethnic groups was considered by sugar management to be a safeguard against labor strikes, so they encouraged the immigration of Filipinos, to counteract the increasing power of organized Japanese workers.51 The first group of Filipino laborers, numbering 160, arrived in 1906. By 1930 about 100,000—mostly males—had come to the islands (Table 3). More than 90 percent were Ilocanos from northern Luzon and from a section called Ilocos Sur; Tagalogs were recruited from central and southern Luzon; Visayans came from Cebu, Siquijor, and Leyte; and a small number of others migrated from Mindanao and other areas of the Philippine Islands.52-53 The Filipinos were slow to urbanize. In 1930 more than 30 percent of the immigrants were illiterate, and Filipino children had poor school-attendance records. Most of the men were unskilled laborers on rural plantations. The ratio of five men to every Filipino woman (Table 4b.7) and the economic hardships in the Depression of the 1930s were causative factors in an outmigration from Hawaii of approximately half of the Filipino alien residents, of whom two-thirds returned to the Philippines and one-third moved to the mainland United States.54 Following World War II there was renewed interest among the sugar planters in recruiting relatively cheap labor from the Philippines. With the attainment of Philippine independence in
42
NINETEENTH- AND TWENTIETH-CENTURY IMMIGRANTS
1946, however, Filipinos were restricted from entering Hawaii by United States immigration quotas. 55 The United States Immigration and Nationality Act of 1965 abolished the national origin quota system and permitted a larger number of immigrants to enter from Asia. In the past two decades, the number of Filipinos in Hawaii has increased rapidly (Table 12). This law has had a disproportionate effect upon Hawaii, to which more immigrants have come in relation to the size of the resident population than to any other state.56 The largest percentage of alien immigration to Hawaii in the 1970s is among persons from the Philippines, many of whom have relatives in Hawaii. 57 In 1961 through 1965 there were 2777 immigrants from the Philippines;
Filipino sugar workers newly arrived from the Philippines in the early twentieth century. State Archives
NINETEENTH- AND TWENTIETH-CENTURY IMMIGRANTS
43
following the liberalized quotas of the Act of 1965, 33,117 Filipinos arrived between 1966 and 1975, or an average of about 3000 persons each year. As one of the more recent immigrant groups, the Filipinos are confronted with difficult adjustments to problems of housing, employment, communication, and health. Intermarriage of Filipinos, Puerto Ricans, and Portuguese was common in an earlier period; 58 second- and third-generation families have also had high rates of out-marriage. The abnormalities of age and sex distribution resulting from an early excess of male immigration are gradually diminishing. 59 Filipinos have had a relatively high crude birth rate of more than 26 births per 1000 population and
Filipino laborers harvest pineapples at Wahiawa, Oahu, in 1964. State Archives
44
NINETEENTH- AND TWENTIETH-CENTURY IMMIGRANTS
A Filipino immigrant family in Hawaii in 1970. Courtesy of Health Education Office, Hawaii State Department of Health; photo by Tom Fujise
a high average annual growth rate of 3.2 percent in the decade between 1960 and 1970 (Table 6; Table 7). They have a larger proportion of children under the age of fifteen than other racial groups in the state. The 1970 census recorded the Filipino population at 95,354, or 12.4 percent of the total population in Hawaii. Koreans
Korea was the last of the large Asian coastal nations to open its door to Western visitors and to permit the departure of its citizens to serve as laborers in a foreign country. The emigration of Koreans from Chosen, the Land of the Morning Calm, was not solicited by the Hawaiian kingdom's Bureau of Immigration at the time of the early Chinese movement to Hawaii. Korean independence at the end of the Sino-Japanese War of 1895, a
NINETEENTH- AND TWENTIETH-CENTURY IMMIGRANTS
45
famine in Hwang Hai Do province from 1898 to 1901, the pride of the Korean emperor that his people were permitted to go where Chinese had been excluded, and an anticipation of better job opportunities were some of the factors luring Korean laborers to Hawaii at the turn of the century. Posters displayed in the port cities of Korea painted attractive pictures of life on Hawaiian plantations and offered the relatively high monthly wage of sixteen dollars. Between 1903 and 1905 more than 7000 Koreans, mostly single males between the ages of twenty and thirty, arrived in the Islands. They were farmers, port coolies, political refugees, and students. That period of Korean emigration was brief, however, because such movement was banned after the Korean emperor received reports of bad treatment of his people in Mexico. The Korean workers were known as patient, hard-working, and eager to learn and succeed. Methodist ministers from Hawaii, who often accompanied these recruits on the transporting vessels, caused the "unusual situation where an entire Oriental immigrant group discarded their time-honored beliefs and embraced Christianity." 60 Many from Korea have remained active in the Protestant church movement in Hawaii. The Korean immigrants were not indentured laborers, because the United States Organic Act of 1900 specifically prohibited the importation of "penal contract" labor, but they were free to work on plantations or elsewhere. Some left the Islands for higher wages to work in the California rice fields. By 1910 Koreans in Hawaii numbered only 3931 males and 602 females (Table 4b.5). The inequality of the sex ratio had contributed to interracial marriages, which were sanctioned by law and public opinion. Plantation managers hoped that having wives would increase the stability of the labor force, so almost 1000 picture brides between the ages of eighteen and twenty-four were brought to Hawaii from the densely populated and poor province of Kyung Song between 1910 and 1923. Most of the grooms came from northern Korea and the brides, from the southern area, but "ancient Korean sectionalism gave way to attitudes of toleration." 61 Between 1910 and 1916, 1168 Koreans moved to the continental United States and 1246 returned to the Orient. When Japa-
46
NINETEENTH- A N D TWENTIETH-CENTURY IMMIGRANTS
nese plantation workers took advantage of the abolition of penal contracts to stage strikes for better wages, some Koreans were employed at three dollars a day as strikebreakers; few, however, remained on the plantations. Largely because of their small number, early Korean immigrants lost most of their outward national characteristics. They became a heterogeneous group—urbanites working as carpenters, tailors, and laundry workers, and country farmers growing rice and vegetables. They had a relatively high rate of literacy compared with other immigrant groups. 62 They considered education important for their children, and they accorded the teacher and the learned person positions of esteem and dignity. 63
A Korean family in Hawaii in the early twentieth century. State Archives
NINETEENTH- AND TWENTIETH-CENTURY IMMIGRANTS
47
There was rapid Americanization of the second and third generations of Koreans. Since the relaxation of federal immigration laws in 1965, Hawaii has experienced an influx of Koreans; in fact, they have become the second largest annual foreign immigrant group and have added 6224 persons between 1969 and 1975 (Table 3; Table 10). Koreans in Hawaii have had a relatively high rate of outmarriage, a low crude birth rate, and a slightly higher crude death rate and older age composition than other ethnic groups (Table 6; Table 7). In 1970 they numbered 9625, or 1.3 percent of the people of Hawaii. Other Ethnic Groups
Most of the people living in Hawaii in the 1970s either migrated independently to the Islands or were related to members of national groups who had been selected by the kingdom for immigration in the previous century. Some ethnic groups, such as the Norwegians and the Spaniards, stayed only long enough to fulfill their labor contracts. Other large potential sources of labor—Malaysia and India, for example—were not tapped. In 1855 King Kamehameha IV proposed to his legislature that people from other Pacific islands be invited to Hawaii in order to continue the Polynesian stock there.64 However, no government funds were made available during his reign to carry out such a project, nor was a proposal to bring the population of Pitcairn Island to Hawaii carried out. In 1859 ten islanders from Rarotonga were brought by private businessmen to work on Kauai. A few years later, a more active recruitment of inhabitants of the Pacific succeeded in engaging about 2500 persons from the Caroline Islands, Fiji, the Gilberts, the New Hebrides, Rotuma, and various Melanesian islands. Missionary groups in Micronesia, however, disapproved of the solicitation of their congregations for plantation labor in Hawaii, and they discouraged emigration. The attempt to employ Pacific island people was not a success. Though women and children were included in the operation, the immigrant Polynesian, Melanesian, and Micronesian workers did not adapt well to life on plantations, and many returned to their homelands.
48
NINETEENTH- AND TWENTIETH-CENTURY IMMIGRANTS
Indonesians were considered for labor recruitment in the late nineteenth century, but they were not brought to Hawaii because the royal commissioner of immigration, W. N. Armstrong, reported in 1881 that he did not believe they would be valuable laborers or citizens of the kingdom. He explained, [they] " d o business as petty traders and make good servants in care of horses, but give way to the Chinese in occupations requiring thrifty habits and steady industry." 65 Several attempts were made to recruit East Indians, but Commissioner Henry A. P. Carter wrote from London that Hawaii "could not expect any active assistance from local authorities in India who were inclined to passively resist any efforts to induce the people to emigrate."" He said the British government would "throw every obstacle" in the way of Indian emigration to Hawaii because Indians had already been sent to Mauritius, and the British Empire did not wish to lose more people to work in other parts of the world. The United States Bureau of the Census, in an attempt to learn more about American Indians, added to the census of Hawaii in 1960 the racial category of "Indian." The classification was ambiguous, as the term could include "American Indians," persons of mixed ancestry who claimed to be native Americans, and East Indians.67 In Hawaii persons listed in this category increased from 472 in 1960 to 1216 in 1970, when they represented 0.2 percent of the state's total population (Table 3). Most of those classified as Indians were members of the armed forces and their dependents, and lived on Oahu. 68 In Hawaii the census category "others" referred primarily to Samoans, Micronesians, and East Indians in 1970. The most rapidly increasing group was the Samoans, a Polynesian people who, as American nationals, entered without immigration restrictions. Samoan Mormons first moved to Hawaii when their temple was built at Laie in 1919. By 1950 they had developed an agricultural community of about 500. A second surge of almost 1000 persons arrived in 1952, following administrative changes in American Samoa. This included a shipload of naval personnel, dependents, and sponsored friends, of whom "nearly half were nine years old or younger, with a substantial majority of females." 6 ' The exact number of Samoans in Hawaii in 1970
NINETEENTH- AND TWENTIETH-CENTURY IMMIGRANTS
49
A Samoan family at the Samoan Church Village at Nanakuli, Oahu, in 1972. Courtesy of the General Assistance Center for the Pacific, Department of Educational Foundations, University of Hawaii
was not known, since there was no count of their arrivals and departures, nor were Samoans counted as a separate category in the census. Samoan births recorded by the state Department of Health have been comparatively high in number, which may be explained both by the large percentage of women of reproductive age and by a cultural tendency to large families. Between 1963 and 1975, there were 3673 Samoan births in Hawaii and only 373 deaths (Table 6). Intermarriage has been frequent. The Samoan Task Force of Immigration conducted a survey in 1971 that recorded a population in Hawaii of 6544; according to its report, however, "the Samoan enumerators felt that they might have identified about one-half of the actual Samoan population in Hawaii." 70 A subsequent tabulation in a state health surveillance program survey between March 1971 and December 1971 numbered 13,058 Samoans and part-Samoans in Hawaii." There has been no separate tabulation of the populations of Micronesians, East Indians, or other small ethnic groups in Ha-
50
NINETEENTH- AND TWENTIETH-CENTURY IMMIGRANTS
waii by the United States census. The 1970 total of "others" was reported as 12,100, or 1.6 percent of the total population (Table 4b.9). Hawaiians
For about a thousand years the ancient Polynesians mingled on isolated islands, modifying their physique and temperament to become the Hawaiian race. And for almost 200 years since the arrival of persons from other parts of the world there has been a blending of persons of Hawaiian blood with representatives of many nationalities. The miscegenation over eight to ten genera-, tions has confused the anthropological identification of Hawaiians as a race and altered the biological factors of their genetic continuity. The Part Hawaiian of the late twentieth century is a racial hybrid who can claim only a fraction of his or her blood from Polynesian ancestors. The Hawaiians were known as kindhearted, affectionate, and hospitable people.72 The traditional Hawaiian society sanctioned spontaneous and casual love matches as a prelude to permanent unions, so they did not understand the Christian moral teachings that opposed indiscriminate sexual relationships.73'74 They had no experience or knowledge of venereal disease and its aftereffects of fetal wastage and sterility. Between 1778 and 1820 the Hawaiian women had contact with hundreds of seafarers and as many as eighty foreign residents. Missionary Artemas Bishop wrote in 1838 of the tragic depopulation of Hawaiians by venereal diseases, "Without a means of cure, the greatest influence [of these diseases] has been to destroy the power of procreation, thus writing childless a vast majority of Hawaiian families." 75 He spoke of large numbers of barren marriages and said that infertility and high mortality had left not more than one in four families with any living children. During this period of social disorganization he reported: "Many, if not a majority, of the elder and middle aged women have no children of their own. Their youth has been spent in unrestrained licentiousness and promiscuous concubinage." Bishop blamed the seafarers for the ravage of the Hawaiian race: "The unbridled rage of lust [of the seafarers] fastened upon them [the Hawaiians] this curse of foreign depravity . . . . The crisis is now approaching, and the
NINETEENTH- AND TWENTIETH-CENTURY IMMIGRANTS
51
question will soon be decided, whether the Hawaiian nation is to remain a distinct people, or be annihilated." 7 6 The surviving descendants of the early white seafarers were relatively few, in consequence of high infant mortality and high death rates. 77 However, about twenty white men were given positions of rank in the Hawaiian kingdom and received wives whose procreativity had been carefully protected to preserve the genealogy of the aliis (chiefs). These women were free of disease and fertile. They produced large families. Early Chinese crewmen also settled in the Islands, took young Hawaiian girls as wives, and had many children. According to Romanzo C. Adams, an early-twentieth-century scholar of interracial marriage in Hawaii, "Because of the superior effective fertility of the women who married white or Chinese men, their contribution to the later population was much more than proportionate to their numbers." 7 8 Early missionary censuses did not indicate the number of persons of mixed blood. The 1832 count gave Honolulu a foreign population of 180 and other places 15, but there was no identification of ethnicity. 7 ' It is probable that many half-Hawaiian children were adopted and accepted as wholly Hawaiian. "Doubtless the descendants of these pretty fully Hawaiianized half-white children were in the first and second generation almost wholly of the dark mixture, and, having no ground for pride of ancestry, many permitted the memory of their white ancestry to perish," wrote Adams.' 0 In 1853, when the number of pure-blooded Hawaiians had dropped to 70,036 from the approximately 250,000 that had populated the Islands at the time of Cook's arrival, the first census tabulation of Part Hawaiians was 983 (Table 3). During the following half-century, the count of Part Hawaiians increased at only a moderate rate. Social standards set by the white community of that period were averse to out-marriage, and fewer Hawaiian women were available for the increasing number of male foreign residents. By 1900 Part Hawaiians numbered only 7857 (Table 4b. 1; Table 4b .2). Miscegenation of ethnic groups in Hawaii occurred in three stages: first, there was extensive admixture between foreign men (primarily white and Chinese) and Hawaiian women; second, as immigrant groups brought their wives and picture brides, out-
52
NINETEENTH- AND TWENTIETH-CENTURY IMMIGRANTS
marriage was discouraged; and, finally, after World War II, intermarriage became increasingly accepted and widespread." Between 1912 and 1916 only 11.5 percent of Hawaiian marriages were interracial, but since 1951 out-marriages have ranged between 30.6 and 38.6 percent of all marriages recorded in the state.82 Such factors as length of residence in the Islands; size of migrant group; sex ratio within each ethnic category; and religious, economic and cultural traits have contributed to the rate of intermarriage. The Hawaiian out-marriage rate has been consistently high during the twentieth century, reaching 85.8 percent for grooms and 90.1 percent for brides of unmixed Hawaiian ancestry, and 52.1 percent for grooms and 56.7 percent for brides of Part Hawaiian backgrounds between 1960 and 1969.83 The classification of "Part Hawaiian" has been modified many times by successive censuses. The 1853 census applied the terms natives and half-natives to the people later called Hawaiian and Part Hawaiian. Between 1860 and 1890 the term halfcastes was used. The United States censuses between 1910 and 1930 adopted a special classification system for Hawaii, attempting to differentiate between "Caucasian-Hawaiians" and "Asiatic-Hawaiians." In 1940, 1950, and 1960 the United States census and the Hawaii Department of Health reported any Hawaiian admixture as Part Hawaiian, regardless of percentage.84 The 1970 census eliminated the "Part Hawaiian" category, combining some Part Hawaiians with (pure) Hawaiians. It also changed the method for gathering data, from giving household interviews to mailed questionnaires, which permitted individuals to identify their own races.85 The health surveillance program of the Hawaii Department of Health uses different standards from the census for racial definitions, interview procedure, sample design, and coverage. These differences in classification have resulted in confusion and lack of precise comparability of statistics. Terminology is still not standard among various state government departments. Hawaiians have served as a biological bridge between the many ethnic groups that have migrated to the Islands. In a 1967 study titled Genetics of Interracial Crosses in Hawaii, N. E. Morton, C. S. Chung, and M-P. Mi compared the blood types of almost 180,000 babies born in Hawaii between 1948 and 1958.
NINETEENTH- AND TWENTIETH-CENTURY IMMIGRANTS
53
They confirmed the historical pattern of intermarriage and concluded that pure-blooded Hawaiians had 8.5 percent Caucasian admixture and 13.7 percent Chinese admixture, whereas Part Hawaiians of Caucasian-Hawaiian descent had 8.4 percent Chinese admixture, and those of Chinese-Hawaiian ancestry had 14.6 percent Caucasian admixture." Intermarriage of Part Hawaiians with all ethnic groups has been frequent during the twentieth century, especially to those groups with high sex ratios, such as Filipinos, Koreans, and Caucasian and black members of the armed forces. How many Hawaiians and Part Hawaiians live in Hawaii 200 years after the arrival of the first foreigners? This question has been important to government departments with responsibilities for such activities as housing and welfare and to private enterprises, including schools and land-reform movements, which use racial statistics for program planning. Because the ethnic classification systems used over the decades in Hawaii have been altered repeatedly, data from successive censuses are not comparable. The present trend in data-gathering has been to resolve biological and sociological heterogeneity by assuming that persons with mixed genes are in many cases part of only one subculture, which can be identified with reasonable accuracy by each respondent." As indicated above, the 1970 census eliminated the traditional distinction of [full] Hawaiian and Part Hawaiian, since pure-blooded Hawaiians were very few and of questionable identity. Some Part Hawaiians were merged into the single category of "Hawaiian." The 1960 census figures of 11,294 Hawaiians and 91,109 Part Hawaiians dropped in 1970 to 71,274 Hawaiians (both full and Part), or a loss from 16.1 percent to 9.3 percent of the total state population (Table 3). The state of Hawaii's Department of Health and Department of Planning and Economic Development recorded 142,164 Part Hawaiians in a joint report on figures from a sample survey taken in 1972, based on household interviews." A tabulation of vital statistics of Hawaiians and Part Hawaiians between 1900 and 1975 shows 212,546 births, and 67,921 deaths. Excluding those who have emigrated, there were 144,625 living persons with Hawaiian blood in 1975 (Table 6; Table 7)." The discrepancy between United States census figures and the count of the Hawaii health
54
NINETEENTH- AND TWENTIETH-CENTURY IMMIGRANTS
surveillance program is explained by state statistician Robert Schmitt: The growing number of Hawaii residents with one-eighth, one sixteenth, or even less Hawaiian blood suggests the possibility that many such persons, technically classified as Part Hawaiians, may be reporting themselves as non-Hawaiians to census enumerators. Evidence supporting such a notion appears in migration estimates, which show a heavy net out-migration for Hawaiians and Part Hawaiians. These estimates, computed by the residual method, may in fact reflect "passing" of Part Hawaiians as non-Hawaiians as much as they mirror a true out-migration. A Part Hawaiian child, correctly classified on its birth certificate but thought of as non-Hawaiian by the census-taker, would appear as an out-migrant in computations of intercensal components of population change.' 0 Evidence of this loss appears in the Part Hawaiian population pyramids as a reduction in number of children up to fifteen years old between 1960 and 1970 (Chapter 4). The Hawaiians living in Hawaii in the mid-1970s are the most
A family living in Honolulu in 1975 of Hawaiian, Chinese, Japanese, Filipino, and Caucasian descent. Courtesy of Mr. and Mrs. Joseph Awa, Sr.
NINETEENTH- AND TWENTIETH-CENTURY IMMIGRANTS
55
intermingled of all the races there, and their solidarity as an ethnic group is not highly developed. Although their sex ratio is balanced and birth rates are relatively high (Table 7), intermarriage has amalgamated this group with others—primarily Caucasian, Filipino, and Chinese—and identification has thus become more complex. By the end of the next century the Hawaiian race may have merged beyond recognition. Admixtures will have fused biological differences, and education and life in Hawaii will have reduced cultural dissimilarities." By then it may not be necessary to have some blood of the ancient Polynesians to qualify as a Hawaiian. Hawaiiana scholar E. S. C. Handy has said: "All of us here in Hawaii, whether we have Hawaiian blood or not, are proud of the fact that we have aloha for each other and for strangers. It is really impossible for true Hawaiians to draw apart and be a separate group because there are many people who are just as Hawaiian in attitude and point of view as those of Hawaiian blood." 92 The Hawaiian race has joined and strengthened many races for 200 years. Perhaps the Hawaiian of the future will reflect newpaper columnist Sammy Amalu's description: A Hawaiian is a child born of this soil or bred of its bounty. A child who has known the mountain rain wet upon his cheeks, who has sipped of our sweet waters. A child who has worn our blossoms upon his neck and who has known tears when he has had to live away from our hills and our valleys. He is not of any one blood or of any one race."
NOTES 1. 2. 3. 4. 5. 6. 7. 8. 9. 10. 11. 12.
Kuykendall 1953, p. 178. Char, W. J. 1974, pp. 3-9. Kai 1974, pp. 39-72. Char, T. Y. 1975, pp. 16, 60-61. Kuykendall 1938, p. 329. Kuykendall 1953, p. 76. Hillebrand 1972, p. 150. Hawaii (Kingdom), Bureau of Immigration, 1886, pp. 16-17. Kuykendall 1953, pp. 181-182. Daws 1968, pp. 201-206. Hawaii (Territory), 1902, p. 81. Kuykendall 1967, pp. 135-141.
56 13. 14. 15. 16. 17. 18. 19. 20. 21. 22. 23. 24. 25. 26. 27. 28. 29. 30. 31. 32. 33. 34. 35. 36. 37. 38. 39. 40. 41. 42. 43. 44. 45. 46. 47. 48. 49. 50. 51. 52. 53. 54. 55. 56. 57. 58. 59. 60. 61.
NINETEENTH- A N D T W E N T I E T H - C E N T U R Y IMMIGRANTS
Hawaii (Kingdom), Bureau of Immigration, 1886, p. 199. University of Hawaii Ethnic Studies Program 1974b, Section IV p. 41. Boyd 1971, p. 52. Glick 1970, pp. 273-291. Gardner and Nordyke 1974, p. 49. Bushnell 1972, lecture notes. Adams, in Lind 1961, p. 20. Hawaiian Mission Children's Society Committee 1969, pp. 7-13. Hawaii Foundation for History and the Humanities 1973b, p. 11. Kuykendall 1967, pp. 122-126. Kuykendall and Day 1961, p. 211. Hawaii (Kingdom), Bureau of Immigration, 1886, p. 133. Hormann 1931, pp. 65-83. Kuykendall 1938, pp. 55-60. Mehnert 1939, pp. 61-68. McLaren 1951, p. 91. Ivers 1909, p. 2. Adams 1933, p. 16. Gardner and Nordyke 1974, p. 29. Wakukawa 1938, pp. 3-14. Hawaii (Kingdom), Bureau of Immigration, 1886, p. 80. Kuykendall 1953, p. 183. Conroy and Miyakawa 1972, pp. 25-29. Hawaii (Kingdom), Bureau of Immigration, 1886, p. 58. Kuykendall 1967, p. 166. Hawaii (Kingdom), Bureau of Immigration, 1886, p. 247. Hawaii (Kingdom), Bureau of Immigration, 1886, p. 227. Sakihara 1975. Adams 1924, pp. 10-11. Wakukawa 1938, pp. 344-354. Conroy 1973, pp. 123-127. Glick 1970, p. 283. Ariyoshi 1973, pp. 437-446. Kamakau 1961, p. 304. Stewart 1970, p. 37. Hormann 1954, p. 48. Hawaii (Kingdom), Bureau of Immigration, 1886, p. 143. Adams 1945, pp. 25-27. Wakukawa 1938, p. 187. Hormann 1954, p. 48. Hawaii (State), Commission on Manpower and Full Employment 1972, p. 46. Fuchs 1961, pp. 138-149. Clifford 1974, p. 25. Nordyke 1973, p. 212. Hawaii (State), Commission on Manpower and Full Employment 1972, p. 19. Adams 1937, p. 180. Hawaii (State), DPED, 1974, pp. 1-2. Kim 1937, p. 83. Kim 1937, p. 121.
NINETEENTH- AND TWENTIETH-CENTURY IMMIGRANTS 62. 63. 64. 65. 66. 67. 68. 69. 70. 71. 72. 73. 74. 75. 76. 77. 78. 79. 80. 81. 82. 83. 84. 85. 86. 87. 88. 89. 90. 91. 92. 93.
Adams, Livesay, and Van Winkle 1925, p. 31. Lind 1961, p. 88. Kuykendall 1953, pp. 77-78. Hawaii (Kingdom), Bureau of Immigration, 1886, p. 177. Hawaii (Kingdom), Bureau of Immigration, 1886, p. 113. Morton, Chung, and Mi 1967, p. 18. Nordyke 1975b, pp. 67-77. Born 1968, pp. 455-459. Schmitt 1972b, p. 2. Hawaii (State), DPED, 1973b, p. 3. Kamakau 1961, p. 244. Malo 1951, p. 74. Handy and Pukui 1972, p. 161. Bishop 1838, p. 59. Bishop 1838, p. 62. Adams 1937, p. 75. Adams 1937, p. 72. Schmitt 1973b, p. 4. Adams 1937, pp. 75-76. Glick 1970, p. 280. Schmitt 1968, p. 211. Glick 1970, p. 283. Lind 1961, p. 23. Schmitt 1973a, pp. 11-12. Morton, Chung, and Mi 1967, p. 127. Petersen 1969a, p. 873. Hawaii (State), DPED, 1974b, p. 14. Nordyke 1975a, pp. 1-4. Schmitt 1967, p. 474. Hormann 1948a, p. 34. Handy et al. 1965, p. 20. Amalu 1974.
4 The Demographic Situation
of the past 200 years in Hawaii reflects the depopulation of the Islands by the native Hawaiians, the government policy for deliberate and gradual repopulation by immigrant national groups, the intermarriage and development of a multiethnic society, and the recent expansion of the population by foreign immigrants and by in-migrants from the continental United States (Figure 3). Hawaii's population has been growing at an excessively high rate since 1900, reflecting patterns of high migration and fertility.' The 1970 population of 769,913 was more than five times as large as the 1900 population of 154,001. This increase was the result of an average annual growth rate of 2.3 percent; in contrast, the average rate during the same period for the entire United States was 1.4 percent (Figure 5). A 1975 estimate of the resident population of Hawaii as 865,000 shows an increase of 12.3 percent in just five years.2 THE DEMOGRAPHIC HISTORY
Size and Growth of Population
The eight major islands of Hawaii include a total of 6425 square miles (16,642 square kilometers), ranking forty-seventh among the states in land area. In 1975 the density of estimated de facto population of 144 persons per square mile for the state was more than double the average United States density of 59. The population was unevenly distributed, with 81.5 percent liv-
THE DEMOGRAPHIC SITUATION Growth (%)
50 -1
19001909
1
I
19101919
19201929
19301939
19401949
59
1
| United States
19501959
19601969
Figure 5. Population Growth by Decade in Hawaii and the United States, 1900-1970 SOURCES: United States Bureau of the Census 1971a, Table 28; Statistical Abstract of the United States 1972, Tables 5, 12.
ing on the island of Oahu (Figure 6). Hundreds of square miles in the higher regions of the larger islands are uninhabited, because of the steep land tilt, and those areas are reserved for forests and watershed. The state of Hawaii is divided into four counties: Honolulu (the island of Oahu); Kauai (the islands of Kauai and Niihau); Maui (the islands of Maui, Molokai, Lanai, and the uninhabited island of Kahoolawe); and Hawaii (the island of Hawaii) (Tables 1 and 2). Honolulu County (which includes the city of Honolulu) on Oahu is the industrial, business, and political center of the state. Oahu, the third-largest island, has 595.7 square miles, with about 704,500 residents in 1975. It has a de facto population density of almost 4500 persons per square mile in the city of Honolulu, and an average of 1251 per square mile on the island as a whole. Kauai, located 63 miles northeast of Oahu, has a population which has ranged in number since 1900 between 20,000 and 35,000. In 1975 the county had 31,700 residents, with
THE DEMOGRAPHIC SITUATION
61
59 persons per square mile. Niihau is a small, privately owned island of 70 square miles near Kauai; in 1975 it had 240 residents, of whom 95 percent were full- or Part Hawaiians; the population density was then 3.4 per square mile. The population of Maui, the second-largest island, has been growing rapidly since 1970. In that year the population of the county was 46,156, but the estimated total for 1975 reported an increase to 53,900 persons—a 16.8 percent growth in four years. Its average de facto density was 53 persons per square mile. Included in the county of Maui is Molokai, an island 40 miles long and 7 miles wide, which has held a relatively constant population of about 5000 for fifty years; Lanai, which is primarily agricultural, with more than 2200 persons; and the unoccupied small island of Kahoolawe. Hawaii is the largest island, and 200 years ago it was the most populous, having perhaps 40 percent of the inhabitants of the kingdoms of the Hawaiian chain. In contrast, in 1970 it accom^ modated only 8 percent of the state population (63,468 persons). By July 1, 1975, its population had increased by 17.7 percent to an estimated 74,700 and a de facto density of 20 per square mile. Most of the population growth of the past century has occurred in Honolulu County. Between 1940 and 1960 the Neighbor Island (the counties of Kauai, Maui, and Hawaii) census figures dropped from 165,000 to 132,000, partly because of the out-migration of young people looking for jobs in Honolulu and on the United States mainland. With the recent development of the tourist industry on the outer islands, the number of residents there grew to an estimated 160,400 in 1975 (Figure 7). Ethnicity and Intermarriage
Because the population of Hawaii emerged from a culturally and racially diverse stock, an analysis of its ethnic composition offers one of the most interesting and complex statistical problems in the study of Hawaiian demography. Race has been defined, interpreted, and redefined anew by succeeding censuses. Social terms, such as haole, or loose descriptions, like Caucasian-Hawaiians and other Caucasians, have been replaced by nonbiological census classifications. However, the lack of con-
P o p u l a t i o n 11,000s)
Figure 7.
Population Growth in Hawaii by Counties, 1900-1975 NOTE: Figures are based on resident population. SOURCES: United States Bureau of the Census 1932, Tables 3, 5; 1953, Table 4; 1961, Table 27; 1971b, Table 35. Hawaii (State) DPED 1976 Statistical Report No. 113, Table 2.
THE DEMOGRAPHIC SITUATION
63
sistency in definition has resulted in some inaccuracies when data are compared over a period of time. The earliest censuses were taken by missionaries and by government officials in the kingdom and in the r e p u b l i c . 3 E t h n i city was first recorded in 1890, although estimates of race based on place of birth data had been recorded since 1849. Preferential tabulation has been given to persons of Hawaiian blood. Until the 1970 census, "Hawaiian" referred to fullblooded descendants of ancient Polynesian inhabitants of the islands. All other persons with any Hawaiian blood were Part Hawaiian. Members of this latter group were first -called halfnative; later they were classified as Caucasian-Hawaiian and Asiatic-Hawaiian; then as Part Hawaiian. In 1970, with the decrease in number of full Hawaiians, both Hawaiian and some Part Hawaiians were combined into the single category of " H a waiian," and some persons with only a small fraction of Hawaiian blood merged their Hawaiian identity into other ethnic groups. Persons with ancestors from China, Japan, Korea, and the Philippines were classified in the 1970 United States census as Chinese, Japanese, Korean, and Filipino. Blacks were tallied as Negro, and American Indians were classified as Indian. Caucasians were defined as persons of European ancestry, including white Americans, Britons, Germans, Norwegians, Swedes, and other northern Europeans. Portuguese, Spaniards, and Puerto Ricans, who were tabulated separately in early censuses, were counted with Caucasians in this presentation. " O t h e r " included Samoans, Micronesians, East Indians, South Pacific islanders, and others. Intermarriage, sanctioned by public approval and law, had been honored in Hawaii since the arrival of Westerners. By 1930, 25 percent of births in the state were reported of mixed ancestry. Since 1955 more than one-third of all marriages were interracial, which resulted in ethnic confusion in census tabulations. The Office of Health Statistics of the state Department of Health determined the race of a child for statistical tabulations of births and deaths by the following criteria developed by the United States Bureau of the Census:
64
THE DEMOGRAPHIC SITUATION
a. If either parent is Hawaiian or Part Hawaiian, code as Part Hawaiian. b. If one parent is Caucasian and the other non-white, code the race of the non-white parent. c. If parents are of different non-white races, excepting Hawaiian or Part Hawaiian, code according to race of father. If the father is of mixed non-white racial extraction, code the race indicated by surname. d. If race o f one parent is not given, code race of child as that of the other parent. 6
The 1970 census did not follow these definitions of biologic stock and instead reflected self-identification by respondents through response to mailed questionnaires. For persons of mixed parentage who were in doubt about their classifications, recording the race of the person's father was suggested.7'8 This method of self-identification resulted in data that were not comparable and was partially responsible for an increase in the percentages of persons recorded as Caucasians, Filipinos, and Chinese and a decrease in percentages recorded as Japanese and Part Hawaiians. By 1970 full Hawaiians were no longer counted by the United States census as a separate group, and they probably numbered only between 1000 and 10,000 persons. The combination of full Hawaiians and some of the Part Hawaiians was tallied at 71,375, or 9.3 percent of the state population (Figure 3). Filipino, black, and Caucasian groups experienced the fastest average annual growth rate (Table 3; Table 4b). According to the definitions of the 1970 census, Caucasians made up 39.2 percent of the Hawaii population; Japanese, 28.3; Filipino, 12.4; Hawaiian, 9.3; Chinese, 6.8; Korean, 1.3; black, 1.0; and others, 1.6 percent. A g e and Sex Composition
Two of the most useful pieces of demographic information about a population are its age and sex composition. Knowledge of the age composition helps school administrators to know how many teachers and classrooms are needed, and it helps city officials determine needs for housing and transportation. Information on the number of young women who are old enough to have children gives an indication of how many babies may be born,
THE DEMOGRAPHIC SITUATION
65
and the number of older persons and the proportion of young people in a community influence the death rate. Age and sex figures are used to plan for employment and for the economics of a community—how many persons will work and pay taxes, and how many will need to be supported, for example. Economists classify people who are between 15 and 64 years old as the economically productive population, and those younger than 15 and older than 64 as dependent, even though there are many exceptions to this breakdown. Predictions for the future are not based on total populations but are developed from the numbers of persons at specific ages in the present population. The age and sex composition of a group may be seen on a graph called a population pyramid, in which the numbers of males in various age groups are represented on the left and those of females are shown on the right (see Figure 8). The youngest group appears at the base and the oldest is at the top. A population pyramid that resembles a triangle (as in India, 1970) shows a growing population with large numbers of young children and fewer persons in each higher age bracket. (Age pyramids are usually constructed for five-year intervals.) If a population pyramid is shaped like a rectangle (as in Sweden, 1970), it shows almost as many people in the older age groups as there are children, a situation characteristic of a population that is not inINDIA
50
Millions
SWEDEN
50
400
Thousands
HAWAII
400
50
Thousands
50
Figure 8. P o p u l a t i o n P y r a m i d S h a p e s NOTE: These pyramids indicate numbers of persons by five-year age groups according to varied scales. India's pyramid shows an expanding population with a larger percentage below the age of 20; Sweden's pyramid shows a slow-growing population, with persons over age 25 comprising an increasingly larger percentage of the population. Hawaii's pyramid indicates expansion over age 10 and contraction of younger age groups. SOURCE: United Nations 1974 Demographic Yearbook, Table 7; Gardner and Nordyke 1974, Table 4.
66
THE DEMOGRAPHIC SITUATION
creasing in size (a stable population). A pyramid that bulges out in one place (as in Hawaii, 1970), indicates a relatively large number of people in one age group. This is true of Hawaii's 1970 pyramid because of the large number of residents in the armed forces 20 to 24 years old. Over the past seventy years, the age and sex composition of Hawaii changed markedly (Figure 9; Table 4a). At the start of the century the age distribution, especially that of males, was distorted by immigrants who were primarily young male laborers without families. As time passed, the population grew and aged, and the pyramids assumed a more balanced and expanded shape. Recent pyramids, however, have indicated some irregularities: 1. The 1970 pyramid ballooned, in contrast to the 1960 graph, reflecting a population increase of more than 140,000; however, the base of the pyramid contracted, indicating a reduction in the number of children under age five (a drop from 80,000 to 70,000, which was probably the effect of lowered birth rates and an out-migration of military families with young children). 2. The sex ratio historically favored males in the Islands, as may be seen in the larger left halves of the pyramids. But, from a ratio of 223 males to 100 females in 1900, the ratio dropped to 108 males per 100 females in 1970. A heavy concentration of men in the 20-24 age group is evident. 3. The low birth rates of the Depression of the 1930s are observed in the contraction of the pyramids at ages 1019 in 1950, ages 20-29 in 1960, and ages 30-39 in 1970. 4. The aging of the population is apparent with the progressive expansion of the pyramid at each age level. In the ten years between 1960 and 1970, the median age in Hawaii rose from 24.2 to 25.0. Migration increased the number of young adults. Few retired persons migrated to Hawaii for permanent residence, but more people entered the older age groups as life expectancy lengthened. The population pyramids of ethnic groups depict changes in the population of each racial category in Hawaii since 1900
68
THE DEMOGRAPHIC SITUATION
(Figure 10; Tables 4b. 1-4b.9). Some of the situations they may reflect are the following: 1. Hawaiian. The depopulation of the "pure" Hawaiian is graphically portrayed in the pyramid sequence between 1900 and 1960. 2. Part Hawaiian. From a relatively small population with a balanced sex ratio in 1900, this group expanded steadily until 1960. High birth rates are evident from the increased number of persons in the lower age groups. The abrupt reduction in numbers of persons up to 20 years old in 1970 reflects the change in United States census definition, by which children of Part Hawaiian blood became identified with other ethnic groups. 3. Japanese. The excess of males in the ages between 20 and 40 in 1900 is visible in each succeeding decade as this group aged. A gradual balancing of sex ratios is observed. The high birth rates of the years from 1920 to 1930 and 1940 to 1960 contrast with a reduction of births in 1930 to 1940 and 1960 to 1970. 4. Chinese. From 1900 to 1940, there was an excess of males in this group. There was a relatively balanced sex ratio in the decades between 1950 and 1970. Although the number of Chinese in the total population has been comparatively small, the increase in their population during this century is seen in the expansion of the pyramids among persons over age 5. The growth between 1960 and 1970 could indicate an in-migration of Chinese (which did not really occur in that quantity) or the absorption of persons who had not been classified as Chinese in previous censuses (the transfer of persons who had been classified as Part Hawaiians in 1960 into the Chinese group in 1970). 5. Korean. The excess of Korean males aged 20 to 39 is shown in early pyramids for this group. Census tabulations of Koreans over the decades were inconsistent; hence, Koreans are included in the "other" pyramids for 1940, 1950, and 1960. By 1970 there is an aging of the population and an expansion in all age groups. 6. Caucasian. From a relatively small numerical base in
THE DEMOGRAPHIC SITUATION
69
1900, the Caucasian pyramids show a steady expansion at all age levels. The presence of Caucasian military personnel is observable in the heavy concentration of males aged 20 to 29, especially between 20 and 24. A decline in fertility during the Depression years is apparent in the contraction of numbers of persons born during that period and continues as they age through the decades. Reduced numbers in the 15-to-19 age group since 1950 show out-migration. The comparatively enlarged 1970 pyramid mirrors the expanded population of Caucasians of all ages through in-migration and through changes in ethnic classification. 7. Filipino. The heavy in-migration of Filipino males is evident in the excess number of males of ages 20 to 40 in 1920, and this group is observable as it becomes older during the successive decades. By 1970 the sex ratio is almost balanced, and the increased size of the 1970 pyramid reflects continued high fertility and rapid in-migration. 8. Black. The small number of blacks in Hawaii was recorded by age and sex only in 1960 and 1970. Since many were members of the armed forces or their dependents, a heavier concentration in the age group from 20 to 24 was evident. 9. Other. The composition of "other" was inconsistently recorded by United States censuses from decade to decade. It refers to Samoans, Micronesians, American and East Indians, and others. Blacks are included in this category from 1900 through 1950. The excess of males of ages 15 through 29 in 1910 is attributed to Filipino immigrants. The expansion of the "other" pyramids of 1940, 1950, and 1960 is explained by the inclusion of Koreans. The 1970 pyramid, which represents primarily Samoans, shows balanced sex ratios and a growing population. Birth a n d Death Rates
Births and deaths have been recorded in Hawaii since the days of the early missionaries, but the data were not complete, or
Figure 10. Ethnie Population of Hawaii by Sex and Age, 1900-1970
Thousands
Thoui
HAWAIIAN
A1à
1900
1
1930 J
1940
1960
PART
i
1960
HAWAIIAN
iA 1 1JL JL 1900
1930 II
1910
1940 li
A
JAPANESE 1900
1910
KOREAN
FILIPINO
A-—4-i 1920
1930
:
1940
¡
BLACK 1960
1 1910
I 1970
19?0
1930
i
_ j L „ li 19-10
J|
1950
i SOURCE: A p p e n d i x , T a b l e 4 b .
Ji
k
Ji 1960
I
i
1970
'
li
74
THE DEMOGRAPHIC SITUATION
even fairly reliable, until the second or third decade of this century. Although crude vital rates were calculated from 1900, analysis of early reports is complicated by underregistration of births and deaths and by the rapidly changing age and sex composition of the population during the period of heavy immigration from 1900 through 1924 (Table 5; Table 6; Table 7). The recorded rise in the crude birth rate between 1912 and 1924 (Figure 11), with a peak at 42 births per 1000 population, resulted from increasingly complete birth records, the existence of a greater number of women of childbearing age, and an actual rise in fertility. The birth rate fell during the Depression of the 1930s, rose during the "baby boom" after World War II, and since 1954 has fallen gradually to 18.1 per 1000 resident population in 1975. A higher birth rate, which might have been expected between 1960 and 1975, with a rise in the total number of women of childbearing age from 134,000 to over 200,000, has not occurred. That births have remained at a fairly constant level of about 15,000 per year in Hawaii suggests an increasing use of birth-control and planning for families. The death rate in Hawaii since 1942 has been low. From a crude death rate of 14.9 deaths per 1000 population in 1912, it dropped in the 1940s and has been sustained at a level of about 5.0, compared with a mid-1970 U.S. death rate of 9.0.' Infant mortality, which in 1910 accounted for 206 deaths per 1000 live births, was at a low of 13.6 in 1973. These low mortality figures are attributed to improved health care and to the control of communicable diseases; they are also explained by the young median age of the population (25 years), since death rates are generally low among young people. If birth rates remain low, the average age of the population is expected to increase, since there will be fewer children per adult. Because mortality rates are higher among older people, this "aging" of the population may be expected to lead to a higher crude death rate in the future. The rate of natural increase (the crude birth rate minus the crude death rate), which has paralleled the crude birth rate, was 13.2 per 1000 in 1975. This was a relatively low rate, considering the age and sex composition of the population, the low death rate, and the contribution to the birth rate by the transient military population. If military births are excluded from the
THE DEMOGRAPHIC SITUATION
75
total and allowance is made for the consequently older population (which has a slightly higher death rate and fewer women of reproductive age), the rate of natural increase drops to a very low level. However, Hawaii's actual population growth rate of over 2 percent indicates that net migration was responsible for a high proportion of the state's annual growth in the 1970s. There are numerous refined measures (in contrast to the crude birth rate) for analyzing fertility, including the age-standardized birth rate, the general fertility rate, the total fertility rate, and the gross and net reproduction rates, which are important in demographic evaluation (Table 7). Ethnic birth rates, which indicate the number of births per 1000 population of specific racial groups, show a sharp lessening of reproduction by Chinese, Japanese, and civilian Caucasian persons in the census of 1970. A still relatively high, but slightly declining, crude birth rate among Filipinos may indicate that this newer migrant group is also beginning to adapt to local cultural tendencies toward smaller family size. The high tabulations for Hawaiians and "others" are an overstatement reflecting problems of classification. (Babies were recorded in the vital statistics as Hawaiian, though their parents were counted by the census as non-Hawaiian; this inconsistency resulted in a spuriously high birth rate for Hawaiians.) Age-specific fertility measurement indicates the number of births per 1000 women in a specific age group. Until 1960 the fertility of women in Hawaii between the ages of 25 and 29 declined in comparison to that of women of ages 20 through 24. This indicates that before 1960 women had been having a higher percentage of their children at younger ages (Figure 12, Table 7). The sharp peak in the curve in 1960 at ages 20 through 24 reflected the baby boom of that period. Between 1960 and 1970, a marked drop in fertility is noted at all ages, with an especially sharp reduction among persons over age 30. Life E x p e c t a n c y
An examination of life tables for Hawaii shows the island state to be a favorable place to live. In the past fifty years there has been a remarkable increase in life expectancy.10 In comparison with other areas with low mortality in the world, Hawaii
o>
v> ro o\ r-. i Ol es 5! in U3 Œ> 'S £ Cd o X co a o u VJ Cd in U l-i u LO
" "
E < -o 3
OJ
S
"3 b 3 O IO o> cd z "
LO
o CM 05 '
ID
o>
f
o in
—
1
LT) •g-
O
—
1
—
io co
—
1
o
—
re
—
1
—
m
CSI
—
1
o
CSI
—
—
I
—
LO
—
r
o
-
Tlo
cud C O Q u T3 a 3 o ii a. U c wT u 3 cd U C* C J3 o Li •a 9J S iti V JO •O a» i« 3 — i CD U tfl Ht
o o
03
2
cS Q 4> 2
55 Q Î? o CD
3 « H
2
«
s
co w
G S
Im
00 E l> Ui
3 bO fa
w H o 2
« 5
I£
IO O)
co po -C J) M CTI 0
£
78
THE DEMOGRAPHIC SITUATION
Age 80
1920
1930
1940
1950
1960
1970
Figure 13. Life Expectancy in Hawaii, 1920-1970 NOTE: L i f e tables were taken f r o m two- or three-year periods centered on the census year. Military deaths were excluded f r o m the 1939 to 1941 calculations. SOURCE: Gardner and N o r d y k e 1974, Tables 28, 29, 30, 31, 32, 33.
ranks high for both men and women (Figure 13; Table 8; Table 9). In 1920 records show many lives lost prematurely by infant mortality, maternal mortality, and disease. As death rates fell, with improved health-care measures and rising standards of living, longevity was extended. A female baby born in 1970 could expect to live almost thirty years longer (to 76.8 years) than one born in 1920. For males the corresponding improvement in life expectancy was more than twenty-three years ( f r o m 47.8 years in 1920 to 71.0 years in 1970). In 1970 Hawaii led the nation with the longest life expectancy among all the states: the average person could expect to live 73.6 years. For males in the United States, Hawaii in 1970 was the only state in which expected life at birth exceeded 70 years.11 Migration A l l of the inhabitants of Hawaii or their forefathers established their residence in the Islands by migration. Polynesian
THE DEMOGRAPHIC SITUATION
79
ancestors of Hawaiians arrived more than a thousand years ago; the majority of persons of Chinese, Japanese, and Korean heritage arrived between 1852 and 1924 (Table 10; Table 12). Most persons of Caucasian and black descent moved to Hawaii from the continental United States in the past twenty-five years; these groups account for three-quarters of the total current in-migration. Filipinos and Koreans have been the largest groups of alien immigrants since 1965. Although no count has been made of persons entering from a United States territory, thousands of American Samoans have become residents of Hawaii in the past decade. What are the laws relating to migration? Implicit in the United States Constitution is a fundamental freedom for citizens to migrate and establish residence in any state in the country. 12 Federal laws for immigration from abroad have been altered several times during this century. The Immigration Act of 1924 favored immigration from Europe by basing the entry quotas on the nationality and number of foreign-born residents already living in the United States in 1890. The Chinese Exclusion Act of 1882 was repealed in 1943, permitting 105 Chinese to immigrate annually. The Immigration and Nationality Act of 1952 introduced selective immigration for skilled aliens and for relatives of United States residents; it also made all races eligible for immigration and naturalization. The Immigration and Nationality Act of 1965 abolished the quota system based on national origin and set up an annual limit of 170,000 immigrants from the Eastern Hemisphere. 13 It established a new preference system and redefined relatives of residents as nonquota immigrants. This policy had the effect of changing the profile of immigration. In proportion to its population, Hawaii received more legal immigrants than any other state in the country (Figure 14). Present counts are based on a 20 percent sample of a continuing survey, tabulated by the Hawaii Visitors Bureau, of westbound passengers (from the mainland United States) arriving in Hawaii. The survey questionnaire is included on a Hawaii State Department of Agriculture baggage-declaration form. Responses are voluntary. The tabulation is incomplete, since it does not include a count of military personnel or American citizens and nationals arriving on eastbound and northbound carriers, such as those from Japan, Tahiti, Samoa, the Philippines,
8o
THE DEMOGRAPHIC SITUATION
Immigrants par 1,000 Residents
0 1962
,
T
, 1965
,
1
—.
• 1970
1
r - —.
r 1975
Figure 14. Foreign Immigration Rates in the United States and in Hawaii, 1962-1975 SOURCES: United States Bureau of the Census, Statistical Abstract, 1973, Table 141. Hawaii (State) DPED 1976, Statistical Report No. 112, Table 13.
Australia, or New Zealand. Additional errors occur when westbound immigrants are double-counted by the United States Immigration and Naturalization Service and by the Hawaii Visitors Bureau.14 Annual statistics on out-migration are not tallied by any agency; hence, they are derived from decennial census counts and from records of births, deaths, and military inductions and separations. Net migration can be estimated from successive census counts, but this information does not tell whether the migrants came from abroad or the mainland; nor does it tell how many left and arrived. It is not only the number of migrants, but also the age and sex, ethnicity, occupation, education, health, and other characteristics that significantly influence the demographic situation in Hawaii. 15 '" The total number of in-migrants (from the mainland United States) and of immigrants (from abroad) showed an almost steady growth for the twenty-three years between 1952 and 1975 (Figure 15). In 1952 in-migrants numbered 6131 and immigrants totaled 702; in 1975 there were 34,969 new residents from other states, and 9012 from abroad. The estimated net migration to Hawaii in the decade between 1960 and 1970, excluding military dependents, yielded an annual average rate of civilian population growth by migration of about 5200. Between 1970 and 1975 this figure increased to almost 9000 annually (Table 13)." Migration accounted for more than half the civilian population growth in Hawaii between 1970 and 1975.
THE DEMOGRAPHIC SITUATION
81
Population (1,000s)
Figure 15. In-Migrants from the United States Mainland and Immigrants from Other Countries, in Hawaii, 1952-1975 SOURCE: Hawaii (State) DPED 1976, Statistical Report No. 112, Table 12.
Most recent arrivals to Hawaii have been young: in 1975 the median age was 23.6, and only 1.9 percent of the migrants were over age 60. While immigrants of the period 1850 to 1930 were primarily single male adults, the recently arrived nonmilitary residents of the 1970s have included more women than men. A large number of the new residents have been children and young adults of childbearing age. In 1970, almost 25 percent of the population of Hawaii age 5 or older had been bom elsewhere or else had been living elsewhere five years earlier. The continued inflow of population from the United States mainland and abroad resembles a running faucet. City planners and legislators have been drafting measures to cope with resultant increased population and migrant problems, but they have not attempted to close the open tap. Using the estimate of 5000 new residents per year by net migration between 1960 and 1970, a 1971 state projection suggested migration alone would add 350,000 persons to Hawaii's population in just fifty years—a number equal to the 1971 population of metropolitan Honolulu." Since 1970, however, the rate of net migration on which that projection was based has risen (to 8980 annually between 1970 and 1975), thus providing a far broader base for future growth. In 1975 the State Department of Planning and Econom-
Population (1,000$)
F i g u r e 16. I m p a c t of M i g r a t i o n a s a G r o w t h F a c t o r in H a w a i i , 1 9 7 0 2020 NOTE: Projections are based on total resident population. SOURCE: Hawaii (State) DPED 1976, Statistical Report No. 114, Tables A-13, A-14, A-15.
THE DEMOGRAPHIC SITUATION
83
ic Development endorsed a projection for State agency planning (called the E-2 projection series) that provides a population increase to 2,106,200 by 2 0 2 5 . " Another projection that used the same fertility-mortality figures but a balanced level of in- and out-migration (the E-0 projection series) only raised Hawaii's population to 1,041,900 over the same period. The Hawaii state planners indicated by their endorsement of the higher projection that they expected to maintain a pattern of replacement level fertility, while migration was anticipated to increase and add over one million persons to Hawaii in the next fifty years (Figure 16). In summary, migration dominated the problem of population growth in Hawaii in the 1970s. The quality of life that has made the Islands attractive to its inhabitants also attracts new residents. Hawaii's civilian population has reached low fertility, through birth control, education, and changed social and economic attitudes toward small families. If slow growth of the population of Hawaii is to be realized, migration looms as the primary area in which to attempt to reduce the rate of population increase. NOTES 1. For a more comprehensive discussion of Hawaii demographic information and statistics, see Schmitt 1968; Adams 1933; Lind 1961; Gardner and Nordyke 1974; and Hawaii (State), DPED Data Book (Annual). 2. Hawaii (State), DPED 1975, Statistical Report No. 106, p. 1. 3. Schmitt 1971a, pp. 237-243. 4. Schmitt 1973b, pp. 1-49. 5. Schmitt 1968, pp. 46-114. 6. Hawaii (State), Department of Health 1971, pp. 1-3. 7. U.S. Bureau of the Census, 1972, PC(1)-D13, Appendix B, pp. 4-5. 8. Schmitt, 1973b, pp. 11-13. 9. U.S. Department of Health, Education, and Welfare 1975, p. 1. 10. Gardner and Nordyke 1974, pp. 62-77. 11. U.S. Department of Health, Education, and Welfare 1976, p. 6. 12. Hood and Bell 1973, p. 4. 13. United States, Bureau of the Census 1970, pp. 89-90. 14. Hawaii (State), DPED, 1963+. Details on migration can be found in the series on Hawaii's In-Migrants in Statistical Reports Nos. 13, 65, 70, 80, 94, 101, and 112.
15. 16. 17. 18. 19.
Honolulu, City and County, Office of Social Resources 1972, pp. 1-81. Hawaii (State), Department of Health 1973, pp. 1-6. Schmitt 1975, memorandum, January 29. Schmitt 1971c, memorandum, September 14, p. 2. Hawaii (State) DPED 1976, Statistical Report No. 114, p. 23.
5 Future Hawaii
increased at the high rate of 2.3 percent annually between 1900 and 1975, implying a doubling of the number of persons living in the Islands in about thirty years.1 From 154,000 persons in 1900, the population of the Islands was to approach 1,000,000 by the 1980s. Profound changes have occurred in the physical environment, the economy, the social structure, and the life-style, and the effects of continued growth are a subject of serious concern. The implications of growth rates are often not fully understood. There are two basic components of growth: one is a population's actual size in numbers, and the other is its rate of increase. The annual rate of growth is the result of both natural increase and net migration. This rate determines the amount of time required for a population to double in size. (The same principle governs the effect of compound interest.2) A population that doubles requires twice the quantity of public servicesfood, water, education, housing, medical care, transportation, and energy, for example—just to maintain its standard of living, allowing for no improvement. If present rates of growth continue, the projected population of Hawaii could reach astronomical proportions.
HAWAII'S HETEROGENEOUS POPULATION
FUTURE HAW An
Rate of Growth per Year (%) 0.5 1.0 1.5 2.0 2.5 3.0 3.5 4.0 5.0 6.0
85
Years to Double 140 70 47 35 29 24 20 17 14 11
(The rate of growth determines the length of time it takes for a population to double in size.)
"WE CAN'T GO ON LIKE THIS!" Courtesy of Fred N. Domingo, Health Instructional Resources Unit, John A. Burns School of Medicine, University of Hawaii
86
FUTURE HAWAII
Population Projections
Predictions based on population projections are risky because it is impossible to anticipate precisely the medical, economic, social, and technological changes that may alter components of growth. The value of projections is not so much to predict the future as to show the changes that can occur if certain birth, death, and migration rates continue for a period of time. Projections concerning the civilian population (the resident population, excluding members of the armed forces stationed in Hawaii and their dependents) were prepared in 1971 by the EastWest Population Institute. The projections were based on six possible growth patterns over 100 years, ranging from immediate achievement of zero growth (Figure 17, Projection VI) to a continuance of recent high rates of net migration and natural increase (Projection I).3 Some major conclusions were drawn from this study: 1. Expected net migration as a growth factor has a much greater impact on increasing population than the anticipated levels of fertility-mortality. 2. Even if birth rates were reduced so that each couple had only two children (replacement fertility), and even if all migration were stopped, the population nevertheless would continue to grow until the middle of the next century, leveling off at a number 43 percent higher than existed in 1970. This continued growth may be expected because of the youthful age of Hawaii's present population. Population projections for Hawaii have been prepared during the past decade by federal, state, and county governments; planning consultants; engineers; bank economists; professional organizations; and many other individuals and groups. 4,5,6 The results reveal a wide range of views regarding future population trends, most of which anticipate rapid growth, although the degree has usually been underestimated. The state Department of Planning and Economic Development (DPED) released a series of projections that were based on the 1970 census total resident population of 770,000. Assuming a continued low birth rate, the current mortality rate, and net
Population (1,000s)
1970
1990
2010
2030
2050
2070
Figure 17. Projections of the Civilian Population of Hawaii, 19702070 NOTE: NRR is net reproduction rate (see Glossary). SOURCE: Gardner and Nordyke 1974, Table 45.
88
FUTURE HAW AN
migration at the 1970-to-1973 level, DPED projected a population of 1,017,000 for 1985, which would rise to 1,282,266 by the year 2000.7 However, revised figures compiled in 1975 indicated that the 1970 projections were too low and did not account for the increase in net migration. The new projections known as the E-2 projection series that were endorsed by the DPED for state agency planning estimated a population of 930,000 in 1980, 1,131,700 in 1990, and 1,349,200 by the year 2000." In mid-1975 Hawaii's estimated population of 865,000 indicated a growth rate that was greater than the highest East-West Population Institute projection (Figure 17, Projection I). Evidence of C h a n g e
Mark Twain referred to the Hawaiian Islands in the late nineteenth century as "the loveliest fleet of islands that lies anchored in any ocean.'" While his description may be appropriate in the 1970s, the effect of increasing numbers of people on natural resources and quality of life is a subject of increasing concern to residents of Hawaii. From the quiet, seaweed-strewn strip of sand where canoeing, swimming, and surfing were favorite local pastimes, Waikiki beach has become a crowded, hotel-lined playground for visitors from around the world. The Hawaiian Islands have only 24.4 miles of sandy shoreline defined as "safe, clean, accessible, and generally suitable for swimming," but as population has increased, the proportion of beach available to individual residents and visitors has declined. It has been calculated that if all the residents of the Islands (excluding tourists) decided to go to a beach at the same time, there would be only two inches of sandy shoreline for each person. 10 Honolulu's population density has increased from an average of fewer than 100 persons per square mile in 1900, to an average of 4500 per square mile in 1975. As many as 30,000 to 60,000 persons per square mile reside in a few heavily populated areas of the city, such as Makiki, Mayor Wright Housing, and Waikiki, which are comparable to some of the most densely occupied areas in the world (Table 14). The number of registered cars increased from four horseless carriages in 1900 to over half a million motor vehicles in 1975
Waikiki Beach in 1890. Brother Bertram Collection, State Archives
The same view of Waikiki Beach in 1970. Photo by Roy Ito; courtesy of the Honolulu Advertiser
Honolulu in 1930. Maison Lines Collection, State Archives
Honolulu in 1971. Courtesy of Hawaii State Department of Planning and Economic Development
In 1900 the population density was less than 100 persons per square mile in Honolulu. Brother Bertram Collection, State Archives
The density of population in some areas of Honolulu in 1975 is comparable to that of some of the most densely populated areas in the world. Photo by Antonio Andrés
Kailua, Kona, Hawaii in 1930. Inter Island Airways photo
Kailua, Kona, Hawaii in 1975. Photo by Werner Stoy; courtesy of Camera Hawaii
Hilo, Hawaii in 1930. Inter Island Airways photo
Hilo, Hawaii in 1974. Courtesy of R. M. Towili Corporation
A mule-drawn wagon of the Hawaiian Tramways Company carried passengers along Waikiki in the 1890s. Brother Bertram Collection, State Archives
Public transportation to Diamond Head in 1925 was provided by electric streetcars. State Archives
FUTURE HAWAII
95
(Figures 18)." Prime land has been converted to highways to accommodate the increasing numbers of cars, which, in turn, cause two-thirds of the air pollution. A 1973 DPED report on the implications for public services of urban growth in the late twentieth century in Hawaii states: "The strain placed on our transportation facility by urban growth is staggering. According to a state highway planner, the transportation system envisioned by the Oahu Transportation Study, costly as it is, is 'completely inadequate' to meet projected peak hour traffic.'" 2 It goes on to say that the state does not have funds to finance the proposed twenty-year program of state highway improvements, and the state funds available for matching federal aid fall far short of requirements. The number and style of housing units in Hawaii have altered markedly in two hundred years. Island residents have shifted from the simple grass shacks of the past to modern structures of wood, steel, and cement. In 1970 there were 217,000 dwelling places, with an average of 3.5 inhabitants per unit; by 1975 the number of dwellings had increased to 263,000.13 Housing styles have changed as the cost of single-family homes has risen, and
TheBus queue at Kapiolani Park in Waikiki in 1975. Courtesy of the Honolulu Advertiser
Pali traffic in 1890. Private collection
Homeward-bound Pali traffic in 1970. Courtesy of the Honolulu Star-Bulletin
Registered Vehicles. (1,000s)
Figure 18. Motor Vehicle Registration in Hawaii, 1900-1975 SOURCE: Hawaii (State) DPED, State Data Book 1975, Table 221.
Units Occupied (1.000s)
Figure 19. Occupied Housing Units in Hawaii, 18901975 SOURCE: Hawaii (State) DPED, State Data Book 1974, Table 260; State Data Book 1975, Table 274.
Fast-growing windward Oahu communities cover the land with new homes in 1970. Courtesy of Hawaii State Department of Planning and Economic Development
Urban sprawl replaces former greenbelt areas at Kahului, Maui, in 1974. Courtesy of Hawaii State Department of Planning and Economic Development
FUTURE HAWAII
99
increasing numbers reside in high-rise condominiums of thirty to forty stories. In Honolulu housing costs 23.5 percent more than the average for United States metropolitan areas.14 The gross assessed value of land almost tripled between 1965 and 1974, and the price per square foot rose from $1.68 in 1966 to $2.74 in 1972, compared to a United States average of $1.17 (Figure 19)." How much water will be needed to supply an increasing number of residents?16 Water used in 1970 averaged 2.7 billion gallons per day, compared with 1.5 billion in 1960. The Honolulu Board of Water Supply recognizes that reserves are finite and is already giving consideration to alternate sources of supply, such as brackish water, reclaimed or recycled water, and desalinated seawater (Figure 20). Concomitant to the use of water is the problem of sewage disposal. The ocean has been used as a repository for Honolulu's raw sewage; although the beaches are checked regularly for pollution, the consequences of unlimited discharge on marine life are receiving concerned ecological review. The fiscal impact of providing public sanitation facilities varies according to the amount, the rate, and the distribution of urban growth. The costs of servicing sprawling communities are much greater than those of meeting the needs of confined, small districts. A study prepared by the Honolulu Board of Water Supply suggests that the spatial distribution of the population of future Hawaii will be a primary determinant of the costs of developing water resources. A report issued by the Office of the Mayor of the City and County of Honolulu stated that resident, industry, agriculture, and the military produced more than 5000 tons of solid waste per day on Oahu in 1972 (more than twelve pounds per resident per day), creating a serious problem of garbage disposal.17 Environmentalists are exploring ways to alert legislators to what they see as a need for laws to promote the use of returnable containers and recycled papers, cans, glass, and other goods, in order to reduce wastage of natural resources. The clear blue skies in Hawaii are an attractive force. Despite the quantity of pollutants emitted by the metropolis, Honolulu
M i l l i o n s of G a l l o n s
100-,
90-
80-
70-
60-
50-
40-
30-
20-
10-
1940 1950 1960 1970 2020 Figure 20. Water Usage on Oahu, 1940-2020 SOURCES: Hawaii (State) Temporary Commission on Statewide Environmental Planning 1973, p. 11. Honolulu (City and County) Board of Water Supply 1971, p. 16.
In 1971, 55 million gallons of raw sewage poured daily into the ocean off Sand Island, Honolulu. Photo by Warren R. Roll; courtesy of the Honolulu Star-Bulletin
Waikiki beaches were closed to swimmers for one day in 1975 when ocean water failed to meet State Department of Health standards for public bathing areas. Courtesy of Health Education Office, Hawaii State Department of Health; Tom Fujise photo
102
FUTURE HAWAII
Unusually heavy smog blanketed Honolulu on a day in the 1970s when a layer of cold air over the city prevented contaminated air from rising into the upper atmosphere. Photo by Warren R. Roll; courtesy of the Honolulu Star-Bulletin
in the 1970s was still one of the cleanest cities in the nation, as measured by suspended particulate matter and radioactivity. When there are no breezes or if there is a kona (south) wind, a brown haze may hang over the city of Honolulu, obscuring the view; but the prevailing northeast trade winds and frequent rainfall usually keep the air clean. From 25,000 tourists in 1940, to 250,000 in 1960, to almost 3,000,000 overnight visitors in 1975, tourism has become Hawaii's major industry (Figure 21). Tourism is an important source of population growth in the Islands. Hotel construction has boomed, making it possible to accommodate more than 75,000 overnight guests at a time. Waikiki is a maze of hotels, and the Neighbor Islands are also changing their life-styles to provide for increasing numbers of visitors. Recently, Neighbor Island counties have been urged by urban planners to prevent overbuilding and to insist on high standards in design for new structures. Hawaii is particularly vulnerable to worldwide shortages of
Sailing vessels provided transportation and communication for Hawaii in the 1890s. Brother Bertram Collection, State Archives
Large ships brought tourists and goods to the Islands in 1972. Photo by Werner Stoy, courtesy of Camera Hawaii
Number of Visitors (millions)
Figure 21. Visitors t o Hawaii, 1920-1975 SOURCE: Hawaii (State) DPED, State Data Book 1974, Table 133; State Data Book 1975, Table 99.
Waikiki hotels in 1930. State Archives
Approximately 150 resort hotels and apartment hotels were located in this area of Waikiki in 1971. Courtesy of Hawaii Visitors Bureau
Air transportation over Waikiki in 1934. Private collection
Air transportation over Waikiki in 1955. Courtesy of United Airlines
FUTURE HAW An
IO7
Jumbo jets provide transportation for Hawaii in 1972. Courtesy Hawaii State Department of Transportation
of
gasoline and diesel oil. In the course of this century, island living has become harnessed to the use of these products. Islanders are now dependent upon the availability of petroleum as fuel for transportation, production of electricity, and related energy uses. While the population (including tourists) has increased by 27 percent in the 1963-1973 decade, fuel consumption has increased by 178 percent, the use of electricity by 132 percent, and the use of manufactured gas by 83 percent (Figure 22; Figure 23)." Alternate resources are being considered to lessen the Islands' dependency upon a product with limited global reserves." Wind, sea, biothermal, solar, and geothermal potentials are under investigation as sources of energy. There is little likelihood that coal could be introduced in sufficient quantities to serve as a short-term substitute for petroleum in Hawaii, but research on a number of indigenous renewable natural resources may offer possibilities to meet the technical, environmental, and economic criteria for future energy needs.20 Many other indicators could be cited as evidence of change influenced by the increasing numbers of people in Hawaii. 21 Rises
Honolulu airport in 1930. State Archives
Honolulu airport with reef runway under construction in 1975. Photo by R. M. Towill Corporation; courtesy of Hawaii State Department of Transportation
Gas S o l d (million therms)
Figure 22. N a t u r a l G a s Energy Used o n O a h u , 1940-1975 SOURCE: Hawaii (State) DPED, State Data Book 1975, Table 213; State Data Book 1976, preliminary table. Kilowatt Hours (millions)
Figure 23. Electric Energy Used o n O a h u , 1900-1975 SOURCE: Hawaii (State) DPED, State Data Book 1975, Table 211 ; State Data Book 1976, preliminary table.
110
FUTURE HAW An
in social welfare costs, in levels of noise, in quantities of imported food and merchandise, and in crime rates are measurable (Figure 24). Many other effects are less tangible, such as levels of health in relation to pollution, the psychological implications of density, and adaptability to changes in habits and life-style. There is growing concern that the natural environment of the state is in danger. The 1973 Legislature authorized the creation of a Temporary Commission on Statewide Environmental Planning that voiced its alarm: In Hawaii today, growth of population and increased levels of human desires have outspaced our capability to grow without environmental damage. . . . The man-made environment cannot continue to take indefinitely from the natural environment beyond the assimilative capacity of the natural environment to regenerate itself. Man must seek to attain a balance with the environment so as to optimize both the quality of his life and the quality of the environment." Growth and Population Policies
What is the future for the population of Hawaii? By the end of the twentieth century it is likely that there will be increased population density in metropolitan Honolulu, additional housing and industrial development along transit corridors on Oahu, and growth on Neighbor Islands. The ethnic composition may shift from all minorities to a majority of Caucasians because of the large influx of population from other states. This trend is already evident in the declining percentage of Japanese residents in Hawaii, although the percentages of Filipinos, Samoans, Koreans, blacks, and Vietnamese have been growing. Intermarriage is expected to reduce further the distinctive ethnic identity of Hawaiians. The median age of the state population may rise from 25.0 years in 1970 to 29.6 years in 2000." The gradual aging of the population would be characterized by a reduced proportion of children, increased numbers between ages 20 and 50, and a larger percentage of older persons. What changes are needed to accommodate the increasing numbers and how soon must they be made? Can the beauty of the natural environment and the charm of the Islands, as found in the expression of "the aloha spirit," be preserved in the rush of urbanization? Legislators, city planners, environmentalists,
FUTURE HAWAII
111
Costs (dollars per capita)
Figure 24. Social Welfare Costs per Capita in Hawaii, 1940-1975 SOURCE: Hawaii (State) DPED, State Data Book 1974, Table 172; State Data Book 1975, Table 131.
educators, private agencies, and the general public have become increasingly aware of problems caused by rapid growth, but can they—or will they—take action soon enough to check the steep upward trend? The concept of community planning is not new in Hawaii. Honolulu appointed a city planning commission in 1915 and developed a zoning ordinance in 1922. A territorial planning board was established in 1937, but it became inactive in 1941 because of funding limitations; it was replaced in 1955 when the territorial legislature created an economic planning and coordination authority. In 1957 the legislature requested the formulation of a "state general plan" to project a twenty-year plan for development of land use, transportation, public facilities, and population density. Although this plan was not enacted into
112
FUTURE HAWAII
law, a legislative resolution in 1961 approved the plan in principle as an interim policy guide for future development of the state.24 This was updated by a six-volume revision program in 1967 and a 1969 plan for the conservation and development of marine resources. Some of the impetus for another, more current, plan may have come in response to the 1970 Governor's Conference on the Year 2000, at which the Hawaiian community confronted on a local basis the worldwide problems of too many people, too little food, limited resources, destruction of the environment, and reevaluation of the quality of life.25 Task forces at the conference directed attention to the need for stronger public policy that would offer a new approach to planning and urban design, so that the population of future Hawaii could be accommodated in a manner which would provide carefully planned land use and quality environment. Hawaii Growth Policies Plan: 1974-1984
Prepared under the direction of the state Department of Planning and Economic Development in 1974, the State of Hawaii Growth Policies Plan, 1974-1984, is an analysis of economic and social factors that are likely to affect the growth rates of population, land use, housing, tourism, transportation, and environmental change in that decade. While studies in preceding years were prepared in a milieu that promoted growth, this plan was written with an awareness that increasing problems resulting from Hawaii's economic and population expansion had called into question the value of continued rapid growth. Hawaii's growth in the past decade has brought with it a higher standard of living for Hawaii's citizens, less poverty, increased availability of jobs, a more diversified economy, less crowding within homes, new educational opportunities, and increased government services. These improvements, however, have occurred at the cost of deterioration in other areas, such as air, water, and noise pollution; urbanization of agricultural, conservation, and beach-front lands; high housing costs which especially affect middle-income purchasers and low-income renters; increased traffic congestion; higher crime rates; and increased social stress. At the same time, there has been an unmistakable shift in community attitude, reflecting a concern that the costs of rapid
FUTURE HAW AD
113
growth may outweigh the benefits, and a belief that a more moderate growth policy would achieve a better balance between benefits and costs."
The Growth Policies Plan summarized the principal growthrelated problems and concerns, examined their causes, and reviewed the potential impact on them of a variety of state actions. Four basic growth alternatives were analyzed and the consequences of each choice were considered: (1) the existing rate of growth; (2) no growth; (3) slowed growth; or (4) accelerated growth. The plan called on the state to adopt a growth policy that would improve the quality of life for its citizens in the short and long terms. It endeavored to guide a reasonable balance between the benefits and problems of growth and to reduce conflicting actions of various agencies, commissions, departments, and organizations. It recognized that policy change could be effected only with considerable expenditure of resources. The option of growth recommended by the plan was chosen on the premise that the primary responsibility of the state was to residents (in 1974) having a desire to preserve the "Hawaiian way of life." The most important concerns, according to its authors, were: (1) the need for increased employment opportunities and a more diversified economy; (2) the problems of rapid population growth and the overconcentration of people on Oahu; (3) the need to prevent environmental degradation; and (4) how to provide for rapidly increasing costs of facilities, housing, and services. Slowed growth, it was suggested, would preserve the natural environment, permit a slower loss of agricultural land and open space, possibly reduce traffic congestion, slow increases in housing costs, reduce difficulties in meeting educational and other service demands, and limit the state's vulnerability to severe economic recession. Recognizing that the state has only limited resources and powers and must rely on voluntary compliance of citizens and corporations to effect a directional change, the authors of this plan presented the policies as guiding principles for public and private decision-makers. The Growth Policies Plan specifically recommended that efforts be made to reduce the growth rate of the resident civilian population to approximately 1.66 percent per year from the current annual 2.3 percent.27 Even the reduced rate implied a con-
114
FUTURE HAWAII
tinued rapid increase in population for the state, however. Stating, "the State has only partial and indirect control over economic and population growth so a major decrease in growth rates would be difficult to achieve," and, "Hawaii had a very healthy economy during the 1960s with net in-migration averaging 5250 civilians per year," the plan proposed continued action "to reduce the birth rate and also to reduce the level of net inmigration to approximately 3000 to 4000 persons per year." Unfortunately, a proposal to reduce the rate of population growth cannot be effective if there is a continuation of high fertility and migration patterns. As we have already seen, the population growth rate has two components: the rate of natural increase and the rate of net migration (Table 13). The crude birth rate of the civilian population of Hawaii is at an all-time low (15.0 in 1974) and reflects a low level of fertility. Military families account for about 25 percent of the state's births (they raised the crude birth rate of the total state population to 18.2 in 1974), but few of the military children born in Hawaii become permanent residents. Because low fertility implies an older age structure that would exert an upward pressure on the crude death rate, it is expected that Hawaii's low death rate will gradually rise from the present 5.0 to the United States 1975 average of 9.0 or higher. Thus, the eventual rate of natural increase (births minus deaths) may decline to 0.6 percent or less—a slow rate that implies a doubling of population in over 100 years and one that the finite island state might tolerate for a century or two. On the other hand, net migration, as measured in the rate of growth, is the principal source of Hawaii's rapid population increase, contributing over 1 percent per year to the growth rate. The Growth Policies Plan suggests reducing the net gain in inmigrants to about 3000 or 4000 persons per year (from the 9000 net gain each year between 1970 and 1975). It hopes to accomplish this by developing an educational program to inform potential in-migrants of the state's disadvantages—shortage of jobs, high cost of housing, and isolation from the mainland— and by promoting selectively slow employment growth and maintaining modest housing supports. But if the state continues to promote tourism or if the quality of life in Hawaii is enhanced
FUTURE HAW A n
115
through implementation of other growth-limiting proposals, it may be expected that the pool of potential migrants from other states and abroad will increase. It is doubtful that the goal of reducing net migration can be achieved in the absence of stronger policy and legislative measures. Land Use Law
State control of economic and population growth is rooted in Hawaii's pioneering land use law. Adopted in response to a recommendation of the state General Plan in 1961, it was the first law in the nation that designated one of several types of zoning to every square foot of land in the state. Hawaiian land has been lawfully controlled since the time of the Great Mahele (apportionment) in 1849, when the ownership of land by alii (Hawaiian chiefs) was formally changed to a legal division of land among government, alii, and maka'ainana (commoners).28 The 1961 state land use law was developed to preserve agricultural lands from urban sprawl; to protect recreational, wildlife, and scenic areas; and to make appropriate use of nonproductive lands in urban areas. It established a state Land Use Commission, classified all lands in the state, and authorized the adoption of land-use rules and regulations. Land was divided into districts classified as urban, agricultural, conservation, and rural. While the land use law has not been enforced as rigidly as some planners and environmentalists might wish, it has succeeded in reducing some speculative subdivision development and has served as a restricting force on the shift of open land to urban use. The future development of the Islands depends to a large degree on the plan for land use. Population density on Oahu, population dispersal to Neighbor Islands, housing, transportation, and public facilities are expected to follow this plan. Questions relating to the expansion of tourism, the promotion of agriculture, and the utilization of land by the military are answered under provisions of this land use law. The administration of land is under the complex control of the four counties, the land use commission, the Department of Planning and Economic Development, the Department of Land and Natural Resources, and the Department of Taxation. Differing opinions and conflicting interests add to the confusion of
116
FUTURE HAWAII
directions. The Land Use Commission is charged with responsibility for (1) identifying and assessing the impact of technological changes on the educational, social, economic, and labormarket policies of the state and the future implications of these changes as they affect land use, and (2) recommending administrative and legislative steps the state should take to cope with these problems.29 As urbanization continues, the land use law can have an increasingly important role in determining the directions of growth. Zoning for hotel and recreational use can be tightly administered, the supply of hotel rooms can be limited, and the planning for housing, industry, transportation, and other public services can be altered by land-use controls. State of Hawaii Energy Policies Plan
The problems of energy supply for Hawaii are intricately associated with the growth rate and the size of the population. The energy crisis emphasized the dependence of the islands upon the importation of petroleum as its primary energy source. The State of Hawaii Energy Policies Plan was prepared in 1974 in response to inquiries into public policy regarding energy, its sources, uses, and conservation. Hawaii receives petroleum from transport tankers: more than 29 percent goes to trans-Pacific and inter-island air transport; about 23 percent to generate electricity; 15 percent for ground transportation; 5 percent for off-highway diesel uses; 2.5 percent to manufacture gas, and 24 percent to the military, commercial shipping, and other uses.30 The Islands could reduce future energy requirements by slowing the economic growth rate. Economic and population growth contribute to the increased consumption of scarce resources. As land and industries are developed, energy needs expand. A lowered growth rate would help reduce the pressures of energy requirements. In the meantime, alternate energy sources are being explored. Environmental Policy
In 1973 the Temporary Commission on Statewide Environmental Planning submitted to the legislature " A Plan for Ha-
FUTURE HAWAII
117
waii's Environment," which voiced a warning of environmental overload and presented a framework for legislative action to determine environmental carrying capacity and to develop legal tools for control. Stressing a conservation ethic, the Plan urged balance between the humanly made and the natural environments. The report stated: The imbalance we see bears a close but not absolute relationship to population pressures. In Hawaii today, growth of population and increased levels of human desires have outpaced our capability to grow without environmental damage. . . . To put it another way, we are approaching, and in some cases have exceeded, the limits of the environment's ability to support human activities at present levels of technology. The Commission recognizes that the condition of Overload is not solely that of population density, but at least until consumption practices are moderated and technology advances are made, Hawaii must pause, or slow down its growth both in temporary as well as in permanent population. 31
Emerging from a society that until recently has vigorously supported the growth ethic, this document urged: changes in consumption practices, preservation of the fragile spirit of aloha, and government incentives and restrictions to achieve harmony between man and nature and to protect the quality of the environment. In cases of conflicting interests, it requested government and private enterprise to give preference to residents over nonresidents. Recognizing the population impact as a major cause of environmental degradation, it recommended the establishment of criteria to determine optimum population levels and the development of strategies to limit population to those levels. It also suggested economic restrictions on hotel and resort development, encouraged the continuance of environmentally compatible federal activities in Hawaii as a major component of the state economic base, and urged the development of industries related to oceanography, aquaculture, fishing, recreation, forestry, and research and development. The state legislature has passed some of the recommendations of this plan into law. The permanent Commission on Statewide Environmental Planning is continuing public and legal discussion to implement these proposals. Another important study sponsored by the state in the 1970s,
118
FUTURE HAWAII
The Hawaiian Energy House, built at the University of Hawaii in 1976 as an experimental energy-saving dwelling research project, conserves energy and resources through solar and wind energy generation, rainwater collection, water recycling, and tropical building design for natural ventilation and lighting. Courtesy of James E. Pearson, Department of Architecture, University of Hawaii
the Hawaii Water Resource Regional Plan, formulates proposals for government and private action to secure a balance in conservation, development, and use of water and related land resources. Although the target for this study is 1990-2000, the plan is also concerned with the preceding and subsequent twenty years. Projected population and economic activities are the primary determinants of future requirements for water.32 Many organizations and proposals have responded in the late 1960s and the 1970s to the growing awareness of population
FUTURE HAWAII
119
problems and their effect upon the environment. Hawaii became the first state in the nation in 1974 to create a commission to develop a broad population policy.33 Such local groups as Life of the Land, Citizens of Hawaii, and Save Our Surf, and local chapters of national groups as Zero Population Growth and the Sierra Club, alerted the community to the "insidious cancer" of increasing population. Hawaii Planned Parenthood, the Hawaii Department of Health, Kapiolani Hospital in Honolulu, and the University of Hawaii opened family-planning clinics.34 Hawaii pioneered in the legalization of abortion in 1970.35 The state legislature and county governments studied population redistribution, migration, environment, and energy concerns. Resolutions were passed in the 1974 and 1975 legislatures requesting the Office of the Governor and the State Department of Planning and Economic Development to establish criteria which could be used to limit, restrain, or redirect the state's growth in relation to the limited capacity of the environment and resource systems and to develop an exit and entry migration data collection system. Controlled-growth policies have been recommended by studies at the University of Hawaii, and legal methods of controlling migration have been reviewed.36 The Temporary Visitors Industry Council, convened at the request of the 1972 legislature, stated that the "unlimited expansion of the number of tourists in Hawaii is something which the fragility of our social and economic environment cannot tolerate" and suggested a strictly controlled growth policy.37 The state legislature passed a resolution in 1972 supporting a policy to achieve population stabilization by voluntary means. Stronger measures to control population growth have been urged. At the State Association of Counties meeting in 1971, then Lieutenant Governor George R. Ariyoshi urged Congress to look not only into controls on immigration from abroad but also into limitation of migration of Americans among the states. He suggested that such a study might promote federal action to amend the Constitution, which now forbids restrictions on interstate travel.38 State Senator Nadao Yoshinaga in 1974 proposed the state legislature create a full-time commission with powers to
120
FUTURE HAWAII
limit population, issue permanent and temporary residence permits, and regulate travel among Neighbor Islands." Although this measure did not pass, his efforts drew serious attention to population problems. Senator Yoshinaga also proposed a permanent Commission on Population Stabilization, which has been established as a model for the country. A report of the Temporary Commission on Population Stabilization in 1972 offered recommendations for legislative policies and action to stabilize Hawaii's population growth. It proposed state resolutions to encourage federal action on migration, population education, and family planning. This served as a framework for the permanent commission, which began in 1974 to review the economic, social, and environmental consequences of population growth with an objective to develop guidelines for future government policy on population size.
NOTES 1. Gardner and Nordyke 1974, p. 1. 2. Thompson and Lewis 1965, p. 11. 3. Gardner and Nordyke 1974, pp. 89-101. 4. Hawaii (State), DPED, General Plan Revision Program, 1967d, p. 22, tables 35,45, 50. 5. Hawaii (State), Temporary Commission on Population Stabilization 1972, p. 76. 6. Hawaii (State), DPED, Statistical Report No. 114, 1976, pp. 39-44. 7. Hawaii (State), DPED, State data book 1974, table 8. 8. Hawaii (State), DPED, 1975, pp. 43-44. 9. Twain (1908) in Frear 1947, opposite p. 243. 10. Babbie 1972, pp. 40-41. 11. Hawaii (State), DPED, State data book 1974, p. 205. 12. Hawaii (State), DPED, 1973a, p. 20. 13. Hawaii (State), DPED, State data book 1975, p. 242. 14. First Hawaiian Bank, Research and Planning Division, 1974 (August), p. 1. 15. Hawaii (State), DPED, Statistical Report No. 107, 1975, pp. 4-5. 16. Hawaii Water Resources Regional Study 1974, pp. 59-61. 17. Honolulu (City and County), Department of Housing and Urban Development 1972, pp. 6-7. 18. Hawaii (State), DPED, Statistical Report No. 100,1973, p. 3. 19. Meadows, Meadows, Randers, and Behrens 1972, pp. 66-67. 20. Hawaii (State), DPED and the Hawaii Natural Energy Institute 1975, pp. 3-6. 21. Hawaii (State), Department of Social Services and Housing 1973, pp. 1-11. 22. Hawaii (State), Commission on Statewide Environmental Planning, Temporary, 1973, pp. 7-9. 23. Hawaii (State), DPED, 1975, pp. 40-44.
FUTURE HAWAII
121
24. Hawaii (State), DPED, Land Use Commission, 1975, pp. 7-8. 25. Chaplin and Paige 1973, p. 199. 26. Hawaii (State), DPED, General Plan Revision Program, 1974a, p. iii. 27. Hawaii (State), DPED, General Plan Revision Program, 1974a, pp. 58-59. 28. Hawaii (State), Department of Education, 1972, p. 92. 29. Hawaii (State),'DPED, General Plan Revision Program, 1967e, p. 14. 30. Hawaii (State), DPED, General Plan Revision Program, 1974b, p. 137. 31. Hawaii (State), Commission on Statewide Environmental Planning, Temporary, 1973,p. 8. 32. Hawaii Water Resources Regional Study 1974, pp. 1-61. 33. Schmitt 1974, pp. 90-110. 34. Nordyke and Odom 1972, p. 1249. 35. Diamond, Palmore, Smith, and Steinhoff 1973, pp. 54-60. 36. Hood and Bell 1973, p. 4. 37. Hawaii (State), Council, Temporary Visitor Industry, 1973, pp. i-ii. 38. Quoted in the Honolulu Advertiser, December 8, 1971, p. A22. 39. Hawaii (State), Seventh Legislature, 1974.
6 Conclusions
" W E ARE AN ISLAND COMMUNITY gone mad, behaving like a limitless continent in a world that has already turned into a crowded, strained island," said Hawaiian historian Gavan Daws in 1974.' Hawaii, as a microcosm of the world, reflects the heterogeneous composition of mankind's global civilization (Table 15). The once-barren volcanic islands, invaded by people about 1500 years ago, have been inundated in the past 100 years at an increasing rate by a burgeoning wave of population. While the world is grappling with the problems of runaway population growth that accompany high birth rates and low death rates, Hawaii has been reducing its rate of natural increase by economic pressures and social attitudes toward small families, family planning, abortion services, and population education. However, unchecked growth by net migration from other states and abroad continues to swell the Island population and threatens environmental quality. The insularity of Hawaii offers a rare possibility for longrange creative planning and action. "The physical isolation and small scale give it a unique sense of identity and provide an unusual opportunity for measuring, projecting, and evaluating the processes of a total society," wrote George Chaplin, editor of the Honolulu Advertiser, in establishing in 1973 a Hawaii Commission Looking Toward the Year 2000.2 Planners for the future have suggested a major réévaluation of state policies affecting
CONCLUSIONS
123
the rate, type, and location of population and economic growth. The implications of population trends on the quality of life are primary considerations in the planning process. "We are clearly at a crossroads in our planning for the future," declared Shelley Mark, former director of the state Department of Planning and Economic Development. "We must face up now to the needed changes in values, habits, and practices relating to our use of scarce resources rather than encounter future shock later." 3 The petroleum shortage of the early 1970s sharpened the awareness of state residents that Hawaii is a very small and vulnerable segment of a large world system. The Islands have become dependent on exogenous forces for food and energy supplies, on economic subsidies from the federal government, and on financial support from industries based elsewhere. Rapid population increase has accentuated the biological and physical limitations of the Islands and raised questions about their maximum carrying capacity. The risk of an ecosystem catastrophe has grown with the increases in technological dependence and in population. 4 In 1905 the president of Hawaii's Board of Immigration declared: "Hawaii is a country that invites very little voluntary immigration . . . we are isolated, transportation is expensive, and the extent of the country is not great enough to attract much attention or to create any extensive immigration." 5 Today the problem is reversed: there is no isolation in this small and fragile sphere of Earth, transportation is available, rapid, and relatively inexpensive, and an expanding pool of potential migrants seek the equable climate and qualities of life that are found in Hawaii. The natural laws of the physical world warn that rapid growth cannot continue indefinitely. Even if a balanced in- and outmigration were immediately to be attained and fertility were to remain at replacement level (two children for two adults), Hawaii's age structure ensures continued growth until the middle of the twenty-first century, at which time the population would be more than 40 percent larger than it is today. At that time it is probable that stabilization or a very slow growth (0.3 percent) would offer a rate of population change which could be tolerated for generations. But the present 2.3 percent growth rate (imply-
124
CONCLUSIONS
ing a doubled population in thirty years), or the 1.6 percent "slowed growth" proposed by the state Growth Policies Plan (implying a doubled population in forty-three years), or the 1.9 percent growth rate of the 1976 draft of the Oahu General Plan are reckless courses which a finite environment cannot endure. State projections indicate the addition of almost 400,000 new residents by net migration between 1970 and 2000 and only 199,139 persons by natural increase. The total population in Hawaii at the end of the century would be 1,349,000 with a civilian labor force of about 600,000, or over twice that of 1970, and most of the added positions would be filled by new migrants. The population of two million projected by 2020 implies 550,000 dwelling units encroaching on agricultural lands, plus more than one million cars. But what happens then? Do planners accommodate for 4 million, 8 million, and 16 million people? Recognizing the effects of excess net migration on Hawaii, the City Council and the Honolulu Department of General Planning in 1976 endorsed the Oahu General Plan policy objective to promote a balance between the rate of in-migration and the rate of out-migration.6-7 However, there were no specific provisions for means to carry out this policy, and the Plan focused on accommodation to rising population. Some local government measures, such as strict limitation of land use and construction, could lead to a reduced movement of people to Hawaii. Federal action on immigration policies could amend the United States Immigration and Nationality Act to alleviate Hawaii's disproportionate percent of alien immigrants. (Hawaii gained 10.4 aliens per 1,000 resident population in 1975 in contrast to a national average of 1.8 [Table 11].) But it is questionable whether the objective of balanced migration is attainable without stronger state policy and action supported by legislation. Dr. Garrett Hardin, author of the population treatise "Tragedy of the Commons," suggested in 1971 that constitutional principles may need to be challenged to reduce the rate of inmigration to Hawaii. "The residents of a land of beauty have a responsibility to be its trustees. If you broadly share your wealth, you will probably lose it, and if you are fair to everyone, you are fair to no one.'"
CONCLUSIONS
125
An industrialized system geared to growth and to consumption of nonrenewable resources opposes the natural biological and physical system of which Hawaii is a part. A new ethic of population stabilization and a planned economy of conservation could offer hope for the future.' There is a space-age awareness of limits to growth and increasing recognition of the need to cast off traditional goals of private gain in order to preserve the environment and quality of life. Reducing the rate of population and economic growth in the future will entail modifications in the lifestyles of some of the Islands' inhabitants, but it may be the only way of providing a balance of mankind and nature that can assure harmonious evolution for Hawaii's people in the generations to come. NOTES 1. 2. 3. 4. 5. 6. 7. 8. 9.
Daws in Lee 1974a, p. 143, and 1974b, pp. 6-8. Chaplin and Paige 1973, p. 2. In Hawaii (State), DPED, General Plan Revision Program, 1974a, p. 11. University of Hawaii, Department of Geography, 1973, p. 82. Hawaii (Territory) 1905, p. 14. Honolulu (City and County), City Council, 1976, p. 5. Honolulu (City and County), Planning Department, 1976, pp. 2, 16. In Honolulu Advertiser 1971b, p. A18. Burgess 1974, pp. 3-9.
Appendix: Demographic Tables
ro
TU
CT S OO E O CU —
CO CO CO O 00 CM EVI •E*
CO O LO CD C5 00 '
o O O C O C O L O * — COOOOCO LO O CN COROJ CSI
LÍ) R>. 0> CD "O
W
ra X
O O O O CO T Ö LO" CO
O O 3 LO Q-I^ O ai a.
CNI A>
O O LO CO CO
O O VCNÌ CO
O O O O O O O O O O O C O O O O - A - O O O CO CNCN^LOCN^-CO*— CO CVJ ^ LO LO CO A I O CO 00 LO CO LO R-- CO CO
=J 5
(A « C 3 O
o "O C O (A
S Q> O E =3 O CT CO
CO CO CO O LO O •• A "> CA • Q> — n 3 Q. « - CO § E .2 ^ ÛJ ._ £ 3 > -C O A. C C/5 .. O
O) E • — W— > (/) > -D 0) O RT
$ CO JO "O (Q C _CU W OO ® CO CO
O
O LO LO LO L tOÖ 00 t-CSI MCMLO— r- co CN)C CN» — CO 00
00 C O co ,
m (O 01 cß m o o) o rCOCÓ0lT>COCN¡CN¡ Cvi^r CO CO CO 00 CO CNJ CN O CN CN
r^ m CD O
<
s » ^ m - I .CD 5 ™;—o cos — © , ; 2 1 £ "O .5 o CO ? ° > c Crt o'So-g; -2 i «! u II n — ^ fo - o- O a> (/) 3 -Q I3 < . . Ï > co "O I O E > £ 5 (0 ^ C O) co ü in — (tí 0) 0 3 CO yc O í o « CDCM 1 Dìo > CD o£ E o < 1— C0 -Q O "O 0) Ö -D
c û O ^ c s i c o i o c D C O r - M - r ^ c N c n o û c n c o t — C O T — c o N m w r o c ò c o c o ^ a i ' T ' O t r j ' - r N ' t r - c o i ù N N h - C O C Û i D i D T ^ C O f O f O C N C N I ^ T - r -
O ^ r ^ C O œ C M l T i C O C N i D t - O î O i C N C Û C O C N i - t t— » - N c N N c r i o ò c o a j ^ f ò i i j r o ò ^ t r - o ^ r ^ i r ) r ^ r ^ - c o c O L O L O ^ ^ c o c o c o c s j c N t — T —
O ^ N œ ^ i - C O ^ C O C D C n O O i O C O C D O C N C O ^ ^ Ö L O Ö C D r - C D T — c û c s i c o c o ô c o c s i a ^ r ^ ^ r ^ r ^ r ^ c o c O L O L O ^ ' ^ - c o c o c M c s i c M » —
< x > ò < o c M i ^ c M r ^ c M c o c o C T ) ^ o r ^ ^ ' — C O r ^ < £ 3 C O L O l O ^ ^ J - C O C O C N l C N C s i T — t — T—
c o a o c M ^ - L o r ^ a ^ c N L o œ i o c O '
CO 0 0
CM
io
CT) CM L O
O
CD O
00
r-> CT5 0 0
C D c s i c o CO O co co c o c o CM CM CM
CO i o Ö lO Ö CD CD CO CD CD LO LO
Ö
L O r-» CT) I O T— 0 0 co CO CD CD c o CO CM T f r - C O C O Csj c o C O CT> L O rc o c o CM CSI < N CD c o CD LO LO
T_
L O c o CD o T— C O co LO I O
CT>
IO
"si" CT) c o
CT5 C O
CD CD LO
CT) T T Ö
LO CO c o
c o CT> L O CM CM CM T— t — T—
:
0 5
r o o > o o i r ) a ) ( û r ^ c û O ' - L o a ) r O ' - c D c o T c D o ^ r ^ c o o o ^ ô c D c 6 œ L O » — C O L T ^ T — l O l O L O l O ^ ^ ^ C O C O C M C M C M t — T— r -
%
co
CO CO c o
C O 0 0 c o CM LO LO I O I O
lO
co
r — CM L O C D CT) CT)
co c o CT) i r » C O c o c o CM c s i
CT¡ CD
CT) 0 0 CT) r - r - CO Ö c o CM CM CM ' —
O D C D O C N ^ l í i f O r -
CO l O
CSI O
O
Q
*o — I
i o
o CD CT) IS
«í co lo co co co O CT) ö co
b O co CT5 '
m
1-
O o CM 2 "Sr-.
n ^ o 2 ° O O ño - o S O 8° t/5 X X
tr o . — co !E C D'C N ™ 2 ' " S 5— > m'e > Ci vi ^ i > > • o te £2 -o .c — '-E
I < 1O ( £ü" D O )
Table 14. Population Densities in Selected Areas of the World" Persons per Square Mile
Area
State of Hawaii City and County of Honolulu Oahu Northwestern Hawaiian Islands' 3
143 1.251 1.231 17
County of Hawaii
20
County of Kauai Island of Kauai Island of Niihau
59 66 3
County of Maui Island of Kahoolawe Island of Lanai Island of Maui Island of Molokai
53 0 16 75 21
United States (1974) Alaska Arizona California District of Columbia Florida New Jersey New York Oregon Rhode Island Washington Wyoming
Sources:
60 1 19 134 11,848 150 974 379 24 893 52 4
H a w a i i ( S t a t e ) D P E D . 1 9 7 5 S t a t i s t i c a l R e p o r t 1 0 6 , T a b l e 3; U n i t e d S t a t e s B u r e a u of t h e C e n s u s , 1 9 7 5 S t a t i s t i c a l A b s t r a c t , T a b l e s 1 1 , 2 5 . 1391; Bose 1 965 ( 9 ) : 251.
Area
Countries (1973) Canada China. People's Republic of China (Taiwan) Egypt France Germany, Federal Republic of India Israel Japan Korea. Republic of North Korea. Republic of South Mauritius Mexico Netherlands N e w Zealand Philippines Singapore Sri Lanka Switzerland United Kingdom USSR Cities Calcutta ( 1 9 7 1 ) H o n g Kong ( 1 9 7 2 ) c Honolulu (1975) London (1971) Los Angeles ( 1 9 7 0 ) Macau (1972) Manhattan (1970) N e w York City ( 1 9 7 0 ) San Francisco ( 1 9 7 0 ) Tokyo (1973) W a s h i n g t o n . D.C. ( 1 9 7 0 ) a.
Persons per Square Mile
5 221 1,111 94 247 647 455 400 757 325 868 1.102 13 855 29 348 9,779 525 406 595 29 17,578 10,221 4,440 11,544 6,073 44,667 67,808 26,343 15,764 23,891 12,321
F i g u r e s f o r H a w a i i r e p r e s e n t t h e d e f a c t o p o p u l a t i o n J u l y 1, 1 9 7 5 : t h o s e f o r o t h e r s t a t e s are f o r 1 9 7 4 , a n d c o u n t r i e s r e p r e s e n t 1 9 7 3 ; t h e d a t e s of c i t y p o p u l a t i o n s are as n o t e d . b. F r o m N i h o a t o Kure A t o l l , e x c l u d i n g M i d w a y . c. I n c l u d e s K o w l o o n a n d N e w T e r r i t o r i e s .
o o «í o r05 Cs) Cvl
O O O O CN to CO O co co co co «a- nf r-CN »—' CN ^
cl o ; J cmm « ••— X
mm LD LD COCT)^t CO O CO T— r-» cm cm lo T— CO CO evi r^ ö
00 ^ CO Tf .
CSI Tf co i— co CN CO CO CN
Q. O- Di— c"DLD' ; Q
« s § § CN CO CO u ai O 1= CO co f i s E
O O LO CO i CN «?f T— CO CO LO CO
o o QD
B 13 J ra 3 QI ai o o >•0. CT> co
in r» o> c o 3 a o a. o 5 iñ .o
cd r-» co O O co i— CN Csi Ö CN O LO CO CD LO 0