The End of Southern Exceptionalism: Class, Race, and Partisan Change in the Postwar South 9780674043466
The shift in Southern political allegiance from Democratic to Republican has been explained, by scholars and journalists
232 113 585KB
English Pages 240 [232] Year 2009
Contents
Preface
1. The Nature of the Puzzle
2. Economic Development and a Politics of Class
3. Legal Desegregation and a Politics of Race
4. Class, Race, and Partisan Change
5. Social Forces and Partisan Politicians
6. Old South, New South, No South?
Notes
References
Index
Recommend Papers


- Author / Uploaded
- Byron E. Shafer
- Richard Johnston
File loading please wait...
Citation preview
The End of Southern Exceptionalism
The End of Southern Exceptionalism
§ Class, Race, and Partisan Change in the Postwar South
byron e. shafer richard johnston
Harvard University Press Cambridge, Massachusetts • London, England
Copyright © 2006 by the President and Fellows of Harvard College All rights reserved Printed in the United States of America First Harvard University Press paperback edition, 2009. Library of Congress Cataloging-in-Publication Data Shafer, Byron E. The end of Southern exceptionalism : class, race, and partisan change in the postwar South / Byron E. Shafer and Richard Johnston. p. cm. Includes bibliographical references and index. ISBN 978-0-674-01934-8 (cloth : alk. paper) ISBN 978-0-674-03249-1 (pbk.) 1. Southern States—Politics and government—1951– 2. Political parties—Southern States. 3. Social classes—Southern States. 4. Southern States—Race relations. I. Johnston, Richard, 1948– II. Title. F216.2.S46 2006 975′.043—dc22 2005050268
§ Contents
Preface 1. The Nature of the Puzzle
vii 1
2. Economic Development and a Politics of Class
22
3. Legal Desegregation and a Politics of Race
51
4. Class, Race, and Partisan Change
92
5. Social Forces and Partisan Politicians
134
6. Old South, New South, No South?
173
Notes References Index
201 207 215
§ Preface
t hi s bo ok c a n be traced to the chance interaction of two events that will long since have become invisible to all but its authors. The first was a seminar—and an extended seminar argument—at Oxford University, introduced and chaired by Byron Shafer. An Inaugural Lecture by Nelson Polsby of the University of California at Berkeley, then a visiting professor of American Government at Oxford, produced a fierce argument in this subsequent seminar. Polsby had asserted that economic development was more central than racial desegregation to the evolution of the postwar South in the U.S. Congress, and, with the obvious exception of the late Leslie Stone, Chief Commentator for the BBC World Service, all the local Americanists took strong exception: Nigel Bowles, Desmond King, David Goldey, and Alan Ware in particular. Some weeks later, Byron recounted these events to Richard Johnston of the University of British Columbia at an informal working session aimed at finishing an edited collection on postwar politics within the G-7 nations (Shafer 1996), in which Dick contributed the Canadian and Byron the American chapters. By then, all that could safely be said by way of professional summary was: (a) that no one in the Southern argument appeared to have much systematically relevant evidence, but (b) that if economics was the root cause of the demise of the old South, then a new Republican Party would have arisen in one set of places, whereas if race was the root cause, it would obviously have arisen in another. Dick listened for a bit, then grew impatient. “Well, we can know that. I mean, it should be easy enough to formalize and test those possibilities.” The first product of this effort was a piece on the postwar House of Representatives, previewed at the 2000 meetings of the American Political Science Association, a piece that ultimately found a home in the British Journal of Political Science (Shafer and Johnston 2001). The results were as striking as they were unexpected. Seen through the lens of the postwar House, economics and social class clearly trumped desegregation and racial vii
viii
Preface
identity as engines for partisan change. Moreover, race actually worked in a way that was opposite to the dominant argument in the literature of Southern politics: Republicans did worse among whites in areas with large black populations than in those without this implicit “threat” to continued white dominance. Despite the obvious power of these two great social forces, economic development and legal desegregation, two key political factors—the provision of Republican challengers and, especially, the presence (or absence) of Democratic incumbents—still crucially shaped electoral outcomes. This led us to see whether the House analysis could be extended to the other major elective institutions of American national government, namely the Senate and the presidency. Accordingly, the second product of this accidental enterprise was a paper on class, race, and candidate impacts more generally, previewed at the 2002 meetings of the American Political Science Association (Shafer and Johnston 2002). The parade of substantive surprises continued. In particular, Congress— both the House and, in a weaker fashion, the Senate—behaved very differently in institutional terms than did the presidency. While class continued to trump race as an engine for partisan change, race now worked, for the presidency, in the way that the existing literature suggested: whites in blacker areas were more likely to vote Republican. As a result, where analysis of the impact of two social forces in the House had brought political intermediaries back into the picture, this difference in voting behavior between Congress and the presidency brought institutional structures back into the story as well. It also brought the analysis back around to the voting behavior that had started this entire progression. Needless to say, the ultimate registrar of all these influences in both of our papers—the place where the degree of their influence was effectively determined—was the mass electorate. As always, this electorate brought its own mix of background characteristics, social contexts, and, last but not least, individual policy attitudes to bear on its response. And the impact of this mix looked considerably different than it had when we began with two influences on one institution. Both papers were honored by the section on Political Organizations and Parties (POP) of the American Political Science Association as the best paper of their respective years. Yet by the time we had drafted the second APSA paper, it was clear that these data contained further puzzles which we ourselves did not understand, and that their proper unpacking required simultaneous consideration of economic development, legal desegregation,
Preface
ix
and strategic responses by intermediary elites, along with voting decisions by a (growing) mass electorate, all filtered through differing institutional structures. Which meant that we needed to write a book rather than yet another article. The realization of this book depended, of course, on fifty years of political behavior by residents of the American South, as well as on the interactions of two authors, at home and jointly in Oxford, Vancouver, and then Madison over a number of years. Its realization also depended on a small but crucial supporting cast, whose contribution can be only inadequately acknowledged here. Once Dick had created the initial dataset, its ongoing maintenance became the responsibility of Daniel Liam Singer, research assistant to Byron at Oxford while working on a D.Phil. of his own. Dan added substantially to the dataset, while executing most of the original analyses which convinced us that there was indeed a larger project here. He was the one who had to carry this total project as it ventured into unknown territory. Stuart N. Soroka, then research assistant to Dick in Vancouver and now on the Political Science faculty at McGill University, became a Prize Research (postdoctoral) Fellow at Nuffield College, Oxford, which allowed him to continue his methodological and theoretical contributions to the project. Although Stuart was only intermittently involved in the total effort, his involvements came at precisely those times when we needed a third opinion on some major analytic sticking-points. David C. W. Parker, subsequently research assistant to Byron in Madison, ultimately contributed the greatest amount of overall support. He was responsible for tweaking the dataset and considering the main analytic alternatives, while checking (and rechecking) our calculations all along the way. His patience, when an apparently robust finding had to be examined in yet another way, was constantly tested. His reliable ability to pass that test is why we could quite literally not have done it without him. Stacey L. Pelika, as successor to Dave, acquired the closing supportive duties on the manuscript. No doubt she will long remember that she was in fact hired to support a quite different project. Yet she tackled the set of analytic difficulties that always seem to cluster at the end of any large project with energy and initiative. And at the very end, she bore without complaint the burden of making sure that all tabular material was in alignment. A small cast of professional colleagues—Southerners both indigenous and transplanted—read the manuscript at various points and improved it immensely. Charles O. Jones (presently of Virginia) prevented us from
x
Preface
making some remarkably simple errors of analysis. Harold F. Bass, Jr. (presently of Arkansas) spent time with us at every APSA meeting along the way, trying hard to ground us in the practical details of Southern politics. Chuck and Hal, along with Bryan D. Jones (formerly of Alabama) and Nicol C. Rae (currently of Florida), then read the entire manuscript in the final stage. Richard F. Fenno, Jr. (honorary resident of Georgia) managed to escape manuscript duty, but suggested the distinction between cosmopolitans and locals that plays such a major role in Chapter 5. Finally, Michael A. Aronson, Senior Editor for the Social Sciences at Harvard University Press, took the manuscript under his wing from the very first moment when we were ready to discuss it with anyone outside this support team. His colleague, Mary Ellen Geer, then served as both manuscript editor and production manager. It is always a trick—and often a partial contradiction—to appreciate an entire supporting cast, to thank them for their help, but to absolve them from the product. Yet we do.
The End of Southern Exceptionalism
1 § The Nature of the Puzzle
h igh on t he l i st of transformative changes in American politics during the postwar years is partisan transformation of the South. Given the historical background—a populous one-party region, unshakable in attachment and behavior for nearly a century beforehand—such a transformation would loom large merely on its own. Yet serious partisan change in the American South inevitably brought a cascade of further changes in its wake—first regional, then national. Serious partisan change in the South, by definition, meant a change in partisan balance for the nation as a whole. Overall, this always seemed most likely to benefit the party previously disadvantaged in the region— the national Republicans. Yet the actual process by which partisan change came to the South, that is, the real identity of the underlying engine(s) for change, always had the potential for producing other, potentially countervailing shifts. Either way, partisan change in the South automatically meant a shift in the strategies by which the two major parties attempted to assemble nationwide majorities, in order to control the presidency but equally to control Congress. At one time Democrats began by assuming an overwhelming dominance in one-third of the nation, while Republicans began by writing it off. Both strategies died with the birth of serious Southern Republicanism. As a result, both the social coalitions assembled by the two parties and the policy programs those parties offered were destined to change. Pieces of the old one-party South would inevitably join various pieces of the national Democratic and Republican Parties, doubtless creating further tensions as they did. Yet the result was almost sure to be more programmatic 1
2
the end of southern exceptionalism
and ideological coherence in both parties, courtesy of the demise of a oneparty region that had choked such differences in its huge home area. So that in the end, serious partisan change in the South meant that the major institutions of American national government would just work differently. Everything about the presidency, from its electoral politics to its policy attachments, was linked to—embedded in—a national party system. The same could be said of Congress: Senators and Representatives, individually and collectively, were critically linked to the main contours of an old (and new) party system, at home and in Washington. These are grand claims, to which a broad array of observers would nevertheless quickly assent (Tindall 1972; Wolfinger and Arseneau 1978; Lamis 1984; Wattenberg 1991; Rohde 1996; Black and Black 2002; Green 2002). Moreover, the issue of where this comprehensive change came from is itself surprisingly consensual. It is here that we would disagree. The book that follows comes to a set of conclusions different from much of the literature of Southern politics, different both in its collection of individual propositions and in its composite picture. What emerges from an invasion of this literature with a handful of theoretical propositions plus the apparently relevant data is the following argument: • that the engine of partisan change in the postwar South was, first and foremost, economic development and an associated politics of social class; • that the impact of legal desegregation and an associated politics of racial identity had to be understood through its interaction with economic development, and otherwise as much for braking the pace of change as for accelerating it; • that during the long transition away from the political patterns of the old South, the impact of class, race, and their interaction was powerfully conditioned by the structure of the institutional arenas for that impact, namely, the presidency, the Senate, and the House; • that policy preferences in the general public for the realms most directly tied to class and race, that is, social welfare and aid to blacks, shifted in a partially autonomous fashion but came to play a larger and larger role in a new Southern politics; • that the place of intermediary elites in this dynamic lay not in their individual idiosyncrasies but in the simple provision of Republican challengers and, even more crucially, in the distinction between locals and cosmopolitans among Democratic incumbents;
The Nature of the Puzzle
3
• and that when there finally was a new pattern to Southern politics, one that was impressively uniform across states and across institutions, it was the result of a confluence of economic development, racial desegregation, and candidate responses which no one had intended, but which no one could ultimately derail.
The Historical Backdrop The smothering one-party character of Southern regional politics had long been a diagnostic feature of American politics generally, indeed of a sequence of national party systems in the years following the Civil War. In the highly competitive two-party world of the years immediately afterward, an important part of national politics involved policy aimed at reintegrating the South, and especially its black population, into national life. In this, the Southern Democracy was aggressively opposed to national— read “Northern Republican”—policy on Reconstruction, viewing it as an outside attempt to transform local life. Southern Democrats offered a critical and growing contribution to national Democratic totals in response. In the dominant Republican system that followed, which lasted from the 1890s until the Great Depression, the Southern Democracy, with Reconstruction ended and blacks gradually removed from political life, became the inalienable core of the national Democratic opposition. In this, it was comfortable with the national party preference for a federal government that interfered neither economically nor culturally in local affairs. In return, election in and election out, the South could be relied upon to send an overwhelming phalanx of Democrats to Congress and to offer its electoral votes as a bloc to the Democratic presidential candidate. With the coming of the Great Depression and then the New Deal, this dominant Republican system was replaced with a dominant Democratic one nationwide. In a sense, the Southern Democracy was now in the national majority, guaranteeing presidential and congressional majorities for national Democrats. In a different sense, however, it was often the key to the opposition, providing the critical counterweight to national—read “Northern Democratic”—policy preferences and initiatives. And for still other purposes, a “three-party system” was effectively in operation, featuring Northern Democrats, Northern Republicans, and Southern Democrats. What did not change, after the partisan settlement of 1876 and during all these subsequent party systems, was the practical absence of a fourth
4
the end of southern exceptionalism
group—Southern Republicans. That is, what did not change was an overwhelming Democratic dominance within the region, along with its conditional association to the national party. Three separate national party systems appeared in the years between the end of the Civil War and the end of the Second World War, and the policy role of the Southern Democracy shifted a bit within each. But that Democracy essentially altered very little in its partisan contours (Patterson 1965; Miller 1956). Yet change everywhere was to be, at last, the story of the postwar South. There was vibrant economic development, moving the South from subsistence agriculture to a modern economy. There was a veritable civil rights revolution, dismantling the formal organization of Southern racial life. And there was, simultaneously, a nascent and then an increasingly vigorous Southern Republican Party. When it finally arrived, one of the most enduring patterns of American politics, a pattern visible by the 1850s and evident still in the 1960s, would be swept away. A search for the real roots of partisan change in the postwar South is thus a prerequisite for understanding all the other changes that would follow inescapably once this enduring constraint on the shape of American politics had shattered. At the same time, a search for these roots is a precondition for understanding the direction of contemporary American politics. At a minimum, this implies careful separation of the partisan impact of the two great social forces shaping postwar Southern society, economic development and legal desegregation, along with careful consideration of their interaction. Yet if these propositions appear almost elementary as an analytic strategy, they bump up against an established literature of Southern politics—charming and richly contextualized, but also unsystematic and deeply inbred—which effectively assumes the opposite: • This literature assumes that the analyst must proceed, not with hypotheses and variables, but with the accumulation of local knowledge. Measures derived from the rest of the country and generalizations extracted from these measures will be trumped by the “fabric” of life in the South. • By our time, this literature also assumes that we know the answer which must result: Southern politics was, is, and will be principally about race. It is not that other factors do not acquire some mention; it is just that they serve more as elements of enrichment or complication, rather than as theoretical alternatives.
The Nature of the Puzzle
5
• In getting to such a conclusion, finally, the literature frequently just elides—combines and thereby confuses—the impact of two great social influences, those of class and race, implicitly dismissing what we take to be the core of the analytic puzzle.
Few other aspects of American politics (and no other geographic region) have generated as much focused work. We ourselves would never have proceeded without it. Yet that very focus brings its own problems, for it brings with it the presumption that this regional politics is sufficiently distinctive that it must be addressed largely in terms of itself, rather than importing into Southern political analysis the theoretical propositions, empirical data, and methodological techniques that would seem natural to an examination of most aspects of politics in most other realms. Instead, the uniquely Southern aspects of the South’s history and institutions often serve as the starting point for analyses of Southern politics. Moreover, the field shares some remarkably consensual propositions about the result. That is, those who differentiate themselves as students of Southern politics have reached a kind of closure about the nature and dynamics of politics in the American South. There are noteworthy exceptions, and we utilize them appreciatively in the book that follows. Yet this is a literature noted for the extent to which disciples elaborate, even just reiterate, the basic contours of an argument about the centrality of race. In a militantly ethnographic body of work, a myriad of other factors do make an appearance, but rarely such that they constitute propositions that would challenge a dominant-factor explanation; rarely such that they could even plausibly be judged for their comparative contribution to political change; rarely, indeed, such that they actually delineate the massive contribution of race itself as an influence on a differentiated, changing politics. One further result of this situation is that the data which would most commonly be mobilized to test—to affirm or to refute—these grand propositions are curiously thin on the ground. Evidence does get marshaled, but in an unsystematic, even anecdotal, fashion. By contrast, the centerpiece of our own effort is the creation of a dataset, and it alone might provide the justification for another book on the evolution of postwar Southern politics, especially given the centrality of this story to national politics during all these years. In other words, ours is an enterprise aimed at bringing the standard procedures of an orthodox political science into a realm famed for its local knowledge and elaborated lore.
6
the end of southern exceptionalism
Alternative Engines for Political Change Despite seventy years of partisan stasis, the main alternative explanations for potential change in the partisan South—the two main causal engines for change if it ever came—were not just generally recognized but increasingly invoked in the relevant professional literature as the postwar era opened. One explanation did receive disproportionate attention, and that fact would be important to the evolution, not of the political South, but of the literature purportedly describing it. Yet both alternative shapes of a Southern political future were consciously articulated, even if their articulators might doubt the practical prospects of their own projections. Earlier, really from the days of William Jennings Bryan until the Second World War, agrarian radicalism had been the change engine of choice, and the Democratic Party had seemed the natural theater for its resulting conflicts. One-party politics in an overwhelmingly agrarian economy appeared to require intense rural divisions within the dominant party if it was ever to undergo a fundamental shift. Yet by the beginning of the postwar period, agrarian radicalism was clearly being displaced by two alternative sources of putative political change. One was legal desegregation and a politics of race; the other was economic development and a politics of class. And both appeared as likely to achieve their influence through the Republican as through the Democratic Party. The foundation stone for both arguments in the immediate postwar years was to be Southern Politics in State and Nation by V. O. Key, Jr. Just as W. J. Cash’s The Mind of the South had earlier become the definitive treatment of Southern culture, so Key’s Southern Politics would become the defining text on Southern political life. Accordingly, as the postwar era began, it was Key who most effectively impelled the first great explanation for the distinctive character of Southern politics—and thus the first great social change that might ultimately crack it: In its grand outlines, the politics of the South revolves around the position of the Negro. It is at times interpreted as a politics of cotton, as a politics of free trade, as a politics of agrarian poverty, or as a politics of planter and plutocrat. Although such interpretations have a superficial validity, in the last analysis the major peculiarities of southern politics go back to the Negro. Whatever phase of the southern political process one seeks to understand, sooner or later the trail of inquiry leads to the Negro.
The Nature of the Puzzle
7
Yet it is far from the truth to paint a picture of southern politics as being chiefly concerned with the maintenance of the supremacy of white over black. That dominance is an outcome, but the observer must look more closely to determine which whites and which blacks give southern politics its individuality. The hard core of the political South—and the backbone of southern political unity—is made up of those counties and sections of the southern states in which Negroes constitute a substantial proportion of the population. In these areas, a real problem of politics, broadly considered, is the maintenance of control by a white minority. (Key 1949, 5)
On the other hand, Key himself advanced a second major line of argument about buttresses for the existing character of Southern politics, and hence about the social change that might cause those buttresses to crumble. Because he wavered not only in the relative emphasis but also in the rhetorical tone of his two larger arguments, disciples would not always credit both. Yet Key did insist that two great crises, not one, had shaped and then extended Southern political solidarity. These were, in his words, “the war of the ’sixties and the Populist revolt of the ’nineties” (Key 1949, 6), and he remained insistent that the social and political impact of the latter not be lost in the more dramatic context of the former: In the second great crisis whose influence persists—the Populist revolt—political cleavages often fell along the same lines as in the dispute leading to the War. The details of the pattern differed, of course, from state to state, as did the timing of the great upsurge of agrarian radicalism. Yet everywhere the most consistent, the most intense rural resistance to Populists and like radicals of the day came from the black-belt whites. They had valiant allies in the merchants and bankers of the towns and in the new industrialists. Against these defenders of the status quo were arrayed the upcountrymen, the small farmers of the highlands and other areas where there were few Negroes and where there was no basis for a plantation economy. And they were joined by many of the workers of the cities which were beginning to grow, as well as by many poor white farmers of other regions. The black-belt whites, the townsmen, and all the allied forces of conservatism staved off radical agrarianism, although not without leaving a residue of a belligerent attitude that for decades found ex-
8
the end of southern exceptionalism
pression in support for leaders who at least talked, if they did not always act, against the “interests.” And in crucial campaigns even now, the counties of several states divide about as they did in the elections of the agrarian uprising. (Key 1949, 7–8)
Modern political scientists rarely speak in such a concrete, specific, and engaged voice. Yet one can easily convert both arguments into theoretical propositions. In the first, social life in the South was organized around de jure segregation. Anything that threatened segregation would thus be genuinely revolutionary. A social revolution could hardly avoid changing the political character of the American South. Put differently, it was segregation that underpinned partisan solidarity. A civil rights movement was the great potential threat to segregation. Partisan solidarity would almost surely crumble if legal desegregation and an accompanying politics of race came to the political forefront. Converted into a theoretical proposition, the second argument too is easily abstracted. Economic life in the South was organized around agriculture. Anything that changed the agricultural nature of the economy would be inevitably and thoroughly disruptive to the larger society. An economic revolution could hardly avoid spilling over into, and changing, the political character of the American South. Put differently, it was underdevelopment that buttressed partisan solidarity. Economic growth and the accompanying politics of class were the great potential apposition to underdevelopment. Partisan solidarity would almost surely crumble in their wake. Moreover, with this second argument, the prior political evolution of the rest of the country offered a practical embodiment of just such a change. Or at least, where an agricultural economy still suppressed class distinctions in the South, a politics of class had become a signature characteristic of the New Deal party system outside it (Sundquist 1973; Ladd with Hadley 1975). Presumably, modernization of the Southern economy should thus bring this non-Southern politics, at long last, to Dixie. Many of Key’s disciples, continuing to honor the master in an era where his historical analysis did not automatically apply, implicitly downplayed this second possibility (economic development) by explicitly featuring the first (racial desegregation). One further reason to revisit partisan change in the postwar South is to redress this balance. Yet Key himself did not help these disciples by raising the two main theoretical alternatives and then implicitly eliding them. Some of this was Key as neo-Beardian: if politics
The Nature of the Puzzle
9
should “normally” be about economics, then if it was apparently about race, the two had to be intimately connected. Accordingly, we began this study by consciously formulating the opposite proposition: • If legal desegregation and a politics of racial identity were the driving force behind the rise of a Southern Republican Party, then it would appear among whites in areas where blacks were most numerous. But if economic development and a politics of social class were the driving force, then a new Southern Republican Party would appear instead in areas with a new and rising white-collar population. Given that black areas were poor areas generally, it seemed likely that these hypotheses were opposite, not parallel, in their implications.
In the analysis to follow, this grand alternative hypothesis likewise will need to be adjusted, elaborated, and nuanced in numerous ways. But as an opening guide to research, it has the undeniable advantage of not assuming the outcome—and imposing that outcome upon the analysis. In our view, then, the master’s insistence on the parallel nature of economic and racial divisions directed attention away from their analytic separation, and away from their practical interaction as well. Nevertheless, it remains true that in Key’s time, any effort to compare and contrast two alternative explanations—explanations of the absence of political change—would have been largely beside the point. A successful one-party resolution was indisputably in place, one that had obviously triumphed in the face of both latent challenges. As a result, Key’s further critical task was just to offer up the means, by way of the active agents and their practical strategies, whereby this resolution was maintained. A large part of his seminal account can be seen as addressing precisely this task, going state by state to examine the individual politicians and the areas of their social support which, together, constituted the political order of the old South. In this view, it was the behavior of these “Bourbon Democrats” and their inheritors that seamlessly blended the two grand engines of incipient change, while simultaneously dismissing them both, to produce that lasting one-party resolution. In the hands of a master miniaturist, the resulting composite picture was not a pretty one: The almost overwhelming temptation, especially in areas with many Negroes, is to take advantage of the short-run opportunity to main-
10
the end of southern exceptionalism
tain the status quo by using, or tolerating the use of, the race issue to blot up the discontents of the lesser whites. By this means, the governing class can kill off or minimize pressures for improved governmental services from whites and find support for low public outlays for the benefit of the Negro. It is naïve, of course, to interpret southern politics as a deliberate conspiracy among the better-off whites to divide the mass of people by tolerating Negro-baiting. Nevertheless, with a high degree of regularity those of the top economic groups—particularly the new industrialists—are to be found in communion with the strident advocates of white supremacy. In the political chaos and demoralization that ensue, alert men with a sharp eye for immediate advantage take and count their gains. (Key 1949, 662–663)
Careful consideration of these same arguments in the light of data unavailable to Key is the central purpose of this book. His disciples, on the other hand, did not just follow the master in eliding the impact of economic and racial change. They were much more attracted by his first line of argument than by his second. The result should probably be unsurprising. The disciples were to continue to find legal desegregation rather than economic development to be the main engine for the partisan change which would become increasingly apparent to all, and hence race rather than class to be the main means for creating a new resolution, in a new Southern politics. A forceful and compelling version of this summary view appears in a recent presidential address to the Southern Political Science Association. In a piece that draws the argument together succinctly, from its title onward, Earl Black sets it out as “The Newest Southern Politics.” In our reading, it is noteworthy that (a) all of the analytic distinctions are based on race, and (b) race appears to be sufficient to denominate the behavior of the minority racial group, but has nothing to say about the apparently decisive division within the (white) majority: The newest southern politics, as we have seen, involves three paths to victory. After the 1994 southern House elections, a much smaller group of white Democrats survived on the basis of biracial coalitions, an enhanced number of black Democrats established safe seats based on black majorities, and—for the first time since Reconstruction—white Republicans controlled a majority of the southern
The Nature of the Puzzle
11
delegation. The rule of white majorities, the universal road to victory of the white Republicans, thus reappeared as the central tendency of the newest southern politics. (Black 1998, 607)
Social Change Arrives Had he known where he was in history, V. O. Key himself might have been doubly happy with Southern Politics in State and Nation. On its own terms, the book was an immediate and then a lasting success. Two generations of scholarly offspring would sustain its themes and extend its analysis. Yet what Key was also doing, by writing in the late 1940s, was capturing a portentous historical moment. Looking backward, he was providing a richly textured description, built around the essential contours of a partisan world that, if you fuzzed the detail just a bit, might not have seemed all that different three or even four generations previously. Looking forward, however, these were contours that would shift within one further generation, and shatter within another. Which is to say: all three grand aspects of change did arrive in the postwar years. The South was to undergo that revolution in civil rights and race relations. The South was to secure economic development on a scale unimagined by earlier theorists of social change. And the South was to acquire a major regional branch of the national Republican Party, to such a degree that it could contribute not only to Republican presidencies but also to Republican majorities in Congress, and even make a claim—and a major claim at that—on leadership posts within those majorities. The next fifty years were thus to produce a Southern political world that would have been unrecognizable through the lens of the previous one hundred (Fenno 1998; Bullock and Rozell 1998). The postwar boom for the entire United States was to be historic, with a new economy, a new occupational structure, and new levels of personal affluence. Nevertheless, the South managed to narrow the gap with the rest of the nation on all such measures at the same time (Cobb 1993; Scranton 2001). Coming from farther back than the rest of the nation, it experienced a correspondingly greater economic shift, with the greater potential for partisan impact that came inevitably with greater change at a faster pace. Economic change on this scale could hardly fail to affect partisan politics in major ways. The intensity of this change—its compressed nature in historical perspective—only magnified the scope for impact. The very basis of the Southern economy was to change profoundly. At
12
the end of southern exceptionalism
the beginning of World War II, roughly 40 percent of the South was still employed in agriculture, a share twice that of the rest of the nation. By 1990, that figure was down to 1 percent, a smaller agricultural sector than the non-South. In its place, a modern occupational distribution inevitably emerged. The agricultural economy, and its agrarian society, were gone. An industrial, and then within short order a post-industrial, economy and society had appeared (Cobb 1984; Weinstein 1985). As a result, there was a profound change in economic well-being, though this aggregate gain was hardly the whole story: a rising tide did not lift all boats, and that fact would be central to the postwar partisan evolution of the South. Nevertheless, in the aggregate, the South had managed a per capita income only half that of the rest of the nation at the beginning of World War II—at $3,002 in constant 1940 dollars, a mere 53 percent of the non-Southern figure. The 1950s, 1960s, and 1970s were all explosive by this measure, and the income gap was substantially closed by 1980, at $14,138 or 85 percent (Statistical Abstract, relevant years). The force of this change only gains emphasis from the fact that it was sustained despite having to incorporate an increasing stream of in-migrants from the North, bent on sharing this new prosperity (Weinstein 1985). The economic South thus became a sharply different place within a historically short period of time. Once, within living memory of most of those who experienced the change, the Southern economy had been so backward as to be unable to sustain the familiar divisions of an industrial society—by class, by occupation, and by income—divisions that had come to characterize politics outside the South. Now, at a minimum, those incipient prerequisites of a different partisan politics had inescapably arrived (McKinney and Bourque 1971; Nadeau and Stanley 1993). Bedrock change in the racial organization of Southern society was likewise about to occur, and if that story is familiar, this familiarity should not be allowed to dull its impact (Sitkoff 1981; Graham 1990). Race was a consideration in American politics long before de jure segregation arrived, and it would remain a consideration long after de jure segregation was gone. Nevertheless, legal segregation—formal, explicit, codified separation of Southerners classified, by whatever means, as black or white—was well established as a central organizing principle for Southern society in the immediate postwar years. The dismantling of this social system, if it came, would necessarily change the fundamental nature of that society. Part and parcel of legal segregation were draconian limits on voter registration. Thus the dismantling of those limits was an early, obvious, and es-
The Nature of the Puzzle
13
sential step in practical desegregation, one that produced an immediate shift in the relative standing of blacks and whites as active participants in the political system (Keech 1968; Lawson 1976; Stanley 1987). Registration by Southern blacks accelerated remarkably: 5 percent in 1940, 20 percent in 1952, 29 percent in 1960, but 65 percent by 1969 (Bartley and Graham 1975). Voting by Southern blacks followed inexorably: they constituted 4 percent of the Southern electorate in the 1950s, 12 percent in the 1960s, 16 percent in the 1970s, and 22 percent—their proportionate share—by the 1980s (see Figure 3.1). Accordingly, what was once a chasm between the races in the availability of the ballot was now a residual. The racial South too had become a very different place within a historically short—an even shorter—period of time. In the process, the world that racial segregationists had feared, railed against, and actively suppressed had effectively come to pass. In combination with economic change, racial change promised to transform Southern society. Partisan change, at least in hindsight, could hardly be far behind. Indeed, both the presidency and Congress would shortly testify to this change in the most unprecedented way possible, through the obvious and inescapable (re)arrival of a Southern Republican Party.
The Great Partisan Shift The arrival of a new partisan political world would prove to be gradual in its appearance, multi-causal in its underpinnings, and, as a result, challenging to interpret. In that sense, too, it differed greatly from the world of Southern politics that it would displace. This older political world had possessed a clear and specific starting point, at least when measured through its signature pattern of partisan imbalance, along with an almost immediate realization. The resulting political order had then been very simply described. This old world had begun most pointedly with the election of 1876, or rather, with the compromise of 1876 that resolved the election. In a deal that kept the presidency in Republican hands, national Republicans agreed to remove federal voting marshals from the South, thereby ending the period of Reconstruction. In short order, resurgent Southern Democrats effectively dismissed the nascent Southern Republican Party—for a further seventy-five years or so. In the case of the presidency, the compromise of 1876 led instantly to the end of any Southern contribution to the electoral vote for Republican
14
the end of southern exceptionalism
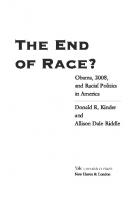
candidates (Figure 1.1). Within one election, the solidarity for which the South would afterward become famous was in existence presidentially. It was destined to be unruffled for upwards of seventy years, surviving the shift in the nation as a whole to a lasting period of Republican dominance after 1896 without so much as a Southern ripple. The Republican vote in the solid South did show an isolated uptick in 1928, the last presidential election before the Great Depression. In hindsight, this appears as nothing more than resistance to the quintessentially Northern character of presidential nominee Al Smith—immigrant-based, New York-accented, culturally “wet,” and, perhaps worst of all, Catholic. Regardless, that blip was wiped away by the coming of the Great Depression and the New Deal. Congress reflected the same underlying story. Southern Republican members of the House of Representatives from the Reconstruction period were quickly cut back to a handful of districts that had been Republican before the Civil War (Figure 1.1). These were almost entirely in the Appalachian Mountains of North Carolina, Tennessee, and Virginia, where the plantation economy and thus racial slavery had never had much relevance, so that the “lost cause” of Southern independence had never resonated much. A handful of idiosyncratic holdovers were squeezed away during the 1880s. A small apparent uptick in the 1890s was largely the result of a temporary Republican-Populist fusion in North Carolina. And the dire situa-
1.0
1.0 Electoral Vote Senate Seats
Proportion Won
0.8
House Seats
0.6
0.8
0.6
Electoral Vote 1928
0.4
0.4
0.2
0.2
0.0
0.0 1870
1880
1890
1900
1910 Year
Figure 1.1
Lines of Republican Progress, 1872–1948.
1920
1930
1940
1950
The Nature of the Puzzle
15
tion thereafter was nevertheless trimmed further by the coming of the Great Depression and the New Deal in the 1930s. This made it all the more remarkable that the Senate story could be even more desperate (Figure 1.1). Eight Republican Senators had already disappeared before the crucial election of 1876, as the Southern Democratic Party began its return to control of state legislatures. Five more Republicans disappeared that year, and one further election cycle eliminated four others. Louisiana and Mississippi gave up their lone holdouts in the early 1880s, and Virginia lost a pair of Republican Senators later that decade. Idiosyncratic political divisions restored one more Republican, that is, one Senator for one term, in North Carolina at the turn of the twentieth century. And then, from 1903 onward, there were no Republican Senators from the states of the Old Confederacy—literally none—until John Tower was elected as a Republican from Texas in a special election in 1961. Contemporary analysts in the immediate postwar years could thus be forgiven their disbelief in the prospects of a Southern Republican Party (Heard 1952; even Converse 1966). There was the ongoing inertial weight of an obvious, existing, one-party dominance as backdrop. Despite the apparent demise of the white primary at the hands of the Supreme Court in the 1940s, there remained major institutional means to sustain this dominance: the literacy test and the poll tax most notably, on top of idiosyncratic administration of electoral rules at the local level. And there were class-based maneuvering and race-based intimidation if all else failed. Seventy-five years of partisan stasis testified to the strength of this combination. Nevertheless, the first postwar generation stands out as the arrival date for a serious Southern Republicanism that would not, this time, prove to be merely a blip. The presidential harbinger arrived first, appearing in the early 1950s (Heard 1952; Seagull 1975; Lamis 1984). Its congressional counterpart arrived a bit later, but constituted a more stable and relentless embodiment when it came. Either way, it should have been clear by the 1960s that economic change was here to stay. By the 1970s, it would be clear that the same could be said of racial change. Habit buttressed by institutional manipulation would then prove insufficient to deter partisan change in the face of two such forces together. While the same underlying social forces were contributing changed Republican prospects to all three institutions, it was the presidency, by way of a new presidential Republicanism, that registered them first (Figure 1.2).
16
the end of southern exceptionalism
1.0
1.0 Electoral Vote Senate Seats
Proportion Won
0.8
0.8
House Seats
0.6
0.6
0.4
0.4
0.2
0.2
0.0
0.0 1940
1950
1960
1970
1980
1990
2000
Year
Figure 1.2
Lines of Republican Progress, 1940–2000.
The three elections of the 1940s still reflected the old world of Southern politics: there was no electoral vote from the South for any Republican candidate. The opening election of the 1950s was different. By 1952, a serious presidential Republicanism was on the dial, though at the time it seemed possible that this Eisenhower surge was just a personal tribute. Yet by 1972, only a generation later, there was a Republican majority for President in the South, the first Southern Republican majority since 1876. On the other hand, by comparison to the situation in the House or the Senate, these gains remained potential rather than reliable. John Kennedy managed to knock the first surge back in 1960. Jimmy Carter took the line of further progress back nearly to zero as late as 1976. But by 1992, even a national nominee who was a certified Southern Democrat, Bill Clinton of Arkansas, could not resurrect a presidential majority in his home region. In other words, what was still hopeless at the time V. O. Key went to press was incipiently in existence by the next succeeding election; moved into majority territory only a generation later; and could not be dislodged by even a highly successful native son a generation after that. In most ways, the House of Representatives told the same story, albeit in a superficially opposite fashion. A tiny rise for Republican seats in the House did join the surge of electoral votes for Eisenhower in the 1950s, though it accomplished little more than restoring the upper limits of the old Southern Republicanism before the Great Depression lowered them
The Nature of the Puzzle
17
additionally (Figure 1.2). Contemporary observers could be forgiven for viewing this as normal fluctuation within an established order. In the early 1960s, however, the share of Republican seats in the House moved sharply upward, and, as we shall see in Chapter 2, this breakthrough represented more than just a further increase in aggregate numbers: it was to be underpinned by voting patterns that were fundamentally different. Thereafter, what was noteworthy about the line of Republican progress in the Southern House, by comparison to that line for the presidency, was its relentlessness. From the late 1960s through the early 1990s, there was just a long, slow assertion of the Republican alternative. Along the way, this line did draw small additional increments from presidential advances in some years and suffer small additional decrements from presidential problems in others. Yet its overall trajectory was more noteworthy for the tiny character of these interruptions. Republican support largely expanded on the back of economic development while being restrained, to jump ahead of the story, by the civil rights revolution. In any case, in 1994, for the first time since 1876, the Southern Republican Party moved into majority territory in the House of Representatives as well—under the leadership of a Southern Republican, Congressman Newt Gingrich of Georgia. The Senate story was distinguished from that of the House by a later start and a bit more electoral volatility. Otherwise, their paths of Republican progress were hardly worth distinguishing (Figure 1.2). Because there were no entire states constituted from Appalachian Republicanism, party prospects in the upper house of Congress started farther behind: there were no Republican Senators from the Old Confederacy in the 1940s, and still none in the 1950s. Yet once Republican progress began in the Senate, it too moved relentlessly, along almost the same trajectory as the House. This Senate line gathered speed in the late 1960s and early 1970s. The lone subsequent point of notable difference with the House then came in 1980, when Ronald Reagan pulled an especially large crop of senatorial candidates into office with him, suggesting the possibility of an earlier arrival of majority status in the Senate. Reagan, however, gave back some of these Senators in 1986, so that it was ultimately to be 1994, as with the House, when Senate Republicans finally crossed into majority territory— never thereafter ceding that status, at least as this is being written. These three lines of historical progress, taken together, have encouraged analysts to posit a “presidency-driven,” even a “top-down,” story of partisan change (Aistrup 1996). This view has the advantage of powerful simplification. Yet even when the focus is only the difference among institu-
18
the end of southern exceptionalism
tions during this process of change, we think that a presidential story oversimplifies the picture. The presidency could run well ahead of Congress at key points, as it did in 1972. But it could also crash back behind it in short order, as it did just four years later. And it could suggest a modest Republican decline, for example from 1988 to 1996, when Congress was showing a strong Republican advance. Worse yet, an analysis that privileges the presidency risks suggesting that political change was a product, not of fundamental shifts within the social base for partisan politics, but rather of an institutional—a constitutional—dynamic. We think it makes more sense to look on the presidency as reflecting the potential for both growth and retreat, and Congress as representing “the base” beyond which neither was likely to be consolidated in the long run. Most of the resulting change would indeed well up from below, though some of it would also be imposed from above. Moreover, even if much of it would register first by way of the presidency, it could not be treated as characterizing a “new Southern politics” until it had been institutionalized in Congress. In other words, by showing a greater volatility of electoral outcomes, the presidency would indicate a profound change in underlying Republican potential but also the extent to which successful Democrats could claw it back. With a later start and slower growth, Congress would show much less volatility and, as a result, much more apparent inevitability in this same partisan shift. Accordingly, in the chapters that follow, we attempt to keep all three institutions in focus at all times. Our aim in so doing is to try to allow institutional structure to interact with social change in a manner that does not presuppose the outcome, a manner that permits institutional structure to become part of the overall explanation, not its defined essence.
Pursuing the Nexus of Partisan Change A historical overview of electoral outcomes for the major institutions of national politics in the American South attests both to the long period of partisan stasis after Reconstruction and to the coming of partisan change after the Second World War. Yet a better way to grasp the remarkable shift in the dynamic of Southern politics is just to compare the place of the South in two dramatic Republican surges, at opposite ends of the postwar era. The national Republican Party managed to recapture control of Congress in the first fully postwar election, that of 1946, without the aid of a Republican candidate for President. The national Republican Party did
The Nature of the Puzzle Table 1.1
19
The Changing Role of the Southern Republican Party: Regional Contributions to National Upheavals Southern Republicans
Non-Southern Republicans
All Other
A. The Congressional Upheaval of 1946 1944 142 103 1946 84 103 1948 160 103
2 2 2
188 245 169
0 1 1
B. The Congressional Upheaval of 1994 1992 182 77 1994 144 61 1996 155 54
48 64 71
127 165 153
1 1 2
Year
Non-Southern Democrats
Southern Democrats
not manage the same feat again, a congressional capture without presidential assistance, until 1994, forty-eight years later, when it did so resoundingly (Table 1.1). Yet if those are formally equivalent events, the practical role of the South in their execution could hardly have been more different. The opening contest of the postwar era, in 1946, featured massive partisan volatility in the North, coupled with amazing partisan stasis in the states of the Old Confederacy. In this first fully postwar congressional election, the national Republican Party surged to majorities in both houses of Congress for the first time since 1928, only to give back both majorities at the re-election of Harry Truman, Democratic President, a mere two years later. In the process, Northern Republicans went from 188 House seats in 1944, to 245 seats (and a majority) in 1946, then back to 169 seats in 1948. Northern Democrats, conversely, went from 142 seats in 1944, to 84 seats in 1946, to 160 seats in 1948. Southern Democrats, however, stayed at 103, 103, and 103 in those years; and Southern Republicans went from 2 to 2 to 2. The same story for 1994 can capture, concisely and powerfully, the nowchanged dynamic of this partisan situation. By 1994, every aspect of the situation, and hence an entire national party system, was different—and the South was now the essence of the difference. In that tumultuous year, Northern Democrats went from 182 seats in 1992 to 144 seats in 1994 to 155 seats in 1996, while Northern Republicans went from 127 to 165 to 153: a Democratic majority to a Republican majority to an effective partisan wash. But Southern Democrats went from 77 seats in 1992 to 61 seats in 1994 to 54 seats in 1996, while Southern Republicans went from 48 to 64 to 71: powerful, monotonic, opposite movements. Indeed, this time,
20
the end of southern exceptionalism
those movements were powerful enough to keep the Republicans in control of the House when Democrat Bill Clinton was solidly re-elected as President in 1996. All of this led us to one guiding operational conclusion: that unpacking the effects of economic development and legal desegregation on partisan change in the postwar South required a complex dataset which could withstand major and multiple demands. • At bottom, this unpacking required a dataset that would permit us to untangle the influence of two main causal agents, economic development and legal desegregation, and through them, class and race, on voting for public office. • It required a dataset that could examine individual voting behavior, while simultaneously considering individual social backgrounds and individual policy preferences, most especially on issues of social welfare and aid to blacks. • It required a dataset that could introduce contextual influences, especially the characteristics of electoral districts in which those individuals lived, characteristics which themselves reflected both economic and racial evolution. • It required the ability to disentangle key aspects of elite maneuvering, by congressional challengers or incumbents as well as by presidential candidates based inside but also outside the American South, and to locate crucial differences among them. • And of course, it required capturing the ultimate outcome, partisan wins and losses for national public office, institution by institution.
Three principal data collections were merged here to create such a dataset, and to permit such an analysis. An attempt to take these data seriously is critical to what follows. 1. The first of these was the cumulative file for the American National Election Studies, mostly tapped for individual-level data, including social background, voting behavior, and issue preferences.1 2. Second was the decennial census, mostly used for aggregate demographics of congressional districts. In earlier years, these were drawn from the Congressional District Data Book; in later years, they were drawn instead from the decennial volumes on congressional districting by Congressional Quarterly Press.2
The Nature of the Puzzle
21
3. Third was a more diverse set of specialized compilations for election outcomes, including Candidate and Constituency Statistics of Elections in the United States, 1788–1990; Guide to U.S. Elections; America Votes; A Statistical History of the American Electorate; and the Almanac of American Politics.3
Accordingly, it became possible to work with composite district demographics and specific personal backgrounds, elite candidate provision and mass public response, aggregate electoral outcomes and individual voting behavior. We think the result differs from much of the earlier work in several ways: in organizing the analysis, militantly and repeatedly, around two great changes in Southern social structure; in blending mass public attitudes, most especially on social welfare and civil rights, with objective social change; in highlighting the place of critical intermediaries—political parties and, most especially, partisan elites—as they addressed a changing society; in having concrete institutional outcomes as the focus, in terms of wins and losses for the House of Representatives, the Senate, and the presidency; and, last but not least, in using the best available data for addressing all of the above. What results is a story of the transformation of Southern politics, familiar in its main elements but with, we hope, fresh contours and a different balance. With obvious portents in the 1950s and substantial beginnings in the 1960s, the coming of a serious and competitive Republican Party in the years following World War II ended—annihilated, really—the one-party character of a large American region. In so doing, it contributed one of the handful of genuine structural shifts that established the contours of modern American politics. The rise of a Southern Republican Party fundamentally changed the nature of politics in a major American region, of course. At the same time, it changed the character of American politics nationwide.
2 § Economic Development and a Politics of Class
e con om i c d e v elopm en t wa s destined to come to the postwar South, and the politics of social class that might be expected to come with economic change did inexorably follow. Both would prove central to the rise of a Southern Republican Party. By the time they arrived, a politics of class would long since have become established—old news—in the nonSouth, where it had served for more than a generation as a diagnostic characteristic of the New Deal party system. Nevertheless, even if all that were not true, it makes sense to begin the story of postwar partisan change in the South by way of economic development and class politics for another, obvious reason. Economic development and legal desegregation, and with them a politics both of class and of race, would remain intertwined during the postwar years in the American South. Yet if the racial reorganization of Southern society was to be the more dramatic and emotive of these two impacts, the economic reorganization of Southern society was effectively under way first. Or at least, and critically for our purposes, its impacts are present earlier in the data. A one-party South had, by definition, repressed the main cleavage, social class, which had defined the non-Southern—the New Deal—party system elsewhere, with a blue-collar Democracy facing a white-collar GOP. Its restoration, bringing the South back into the partisan union at long last, would finally make that party system fully national. Beginning with the politics of class does, in turn, imply beginning with a focus on the white South. During the 1950s, there was some natural increase in the share of the Southern electorate contributed by black Southerners, the key trigger for a reorganization in the politics of race. Yet into 22
Economic Development and a Politics of Class
23
the 1960s, this was still an inconsequential number of black voters: a region that was 20+ percent black had a black electorate in the 1950s, after it had begun to grow, of about 4 percent. That fact alone almost mandates an opening focus on the white South and its divisions, first incipient and then very real, on lines of economic interest. Nevertheless, it is worth remembering that even in this most-black section of the United States, the Southern electorate was and would remain overwhelmingly white, so that any major divisions among white Southerners would perforce be a crucial part of the postwar Southern story. Curiously, much existing analysis of this fundamental structural shift, from economic development to class politics to resurgent Southern Republicanism, has remained rooted in descriptions of the Southern political world pre-change. It is as if an analysis appropriate to the 1920s, even the 1890s, has merely been brought forward with the dials adjusted. A major secondary purpose of this chapter, accordingly, is to help shift the overall frame of reference for the analysis of Southern politics, away from one more appropriate to the old order. A major secondary benefit of beginning with class politics is that it does precisely that. The reconstitution and then invigoration of a basic class cleavage in the American South is thus the essential opening part of the story. And the critical body of data for such an analysis, of economic growth, class division, and Republican prospects, is the series of opinion surveys that was to become the National Election Studies (NES). Serendipitously, their creation was to coincide with the rise of Southern Republicanism. That series received a kind of unofficial “pre-test” in 1948, with a small sample and very limited questions.1 But the real start of what was to become the central tool for the study of voting behavior in the United States came in 1952. Accordingly, this analysis needs to begin there as well. Fortunately, the pattern of politics that V. O. Key set out for the old South can still be discerned easily with 1950s data in the case of Congress, and can be teased out of that data in the case of the presidency. On the other hand, while it would have been ideal to have some composite measure of social class when addressing the impact of economic change on the white electorate, the NES presents obvious problems in this regard. Shifting occupational categories, coupled with shifting means for their assessment, along with different ways of treating spouses and/or breadwinners, make direct analyses in terms of “social class” as a comprehensive concept highly problematic, especially in the earlier years which are critical to this particular story.
24
the end of southern exceptionalism
Nevertheless, the NES does categorize by family income across the whole period from 1952 to 2000. While these are still income bands rather than precise figures, they do allow an easy division into terciles for the nation as a whole: bottom, middle, and top thirds by income. Moreover, such a division has a special advantage for an examination of the South. If income terciles are calculated for the nation as a whole, then the South can begin poor (with a disproportionate bottom third) and grow richer (with a top third growing disproportionately), as in fact it did.
Social Class and Southern Republicanism: The House For two main reasons, it makes additional sense to begin searching for the institutional impacts of economic change on partisan outcomes by way of the U.S. House of Representatives (Rohde 1991; Polsby 1997; Fenno 2000). From one side, as we have seen in Chapter 1, House votes and aggregate House outcomes were much less volatile than presidential votes and Electoral College outcomes. The main story-line is thus easier to recognize through the House. From the other side, the presidential candidacy of Dwight Eisenhower was such an important individualized phenomenon in the 1950s that, without some further analytic background, his candidacy risks opening the story through a potentially idiosyncratic focus. It is not immediately obvious how the analyst should separate the man from the moment. Yet Eisenhower is ultimately a specific instance of a more generic problem. For the presidency as an institutional lens is always open to precisely the sort of analysis we hope to avoid, one focused on individuals and idiosyncrasies—a different kind of “local knowledge”—rather than on social forces, institutional structures, and regularized behavior by the mass public. Moreover, because the presidency provides a single contest every four years, major idiosyncratic elements will intermittently present a second set of continuing problems, involving the proper basis for aggregation. We address these initially in Tables 2.3 and 2.5 below. By contrast, the House offers more than a hundred contests every two years, so that its analytic charm is the opposite. The wiping away of specific individuals encourages a focus on larger trends shaping aggregated cohorts. All three nationally elective institutions of American government—the presidency, Senate, and House—need ultimately to enter the analysis, since all three were available to register social change and its partisan impact,
Economic Development and a Politics of Class
25
and especially since both their common stories and their institutional differences are important. Yet the advantage of beginning with House elections is not just that there are sufficient House districts to allow an analysis that is not specific to personalities. It is also that, whereas the presidency often led in the registration of electoral trends, the House was the body that most obviously consolidated them into stable and ongoing patterns of politics. For interpretive purposes, then, the common insistence on the primacy of the presidency, a priori, can be actively distortive. In any case, Table 2.1 starts the analysis of the change underlying this postwar trajectory by looking at House elections by decade from the 1950s onward.2 At the beginning of this period, Southern Republican congressmen were confined to a handful of Appalachian districts, which were among the poorest in the entire nation. For our purposes, their confinement meant that any class relationship was automatically attenuated. Nevertheless, in
Table 2.1
Social Class and the Coming of Southern Republicanism: The House Income Terciles High
Total
A. Republican Percentage among All Whites 1950s 18 15 15 (N) (200) (140) (220) 1960s 25 28 35 (N) (223) (208) (225) 1970s 24 33 38 (N) (271) (317) (296) 1980s 26 37 48 (N) (232) (305) (313) 1990s 41 60 70 (N) (254) (329) (423)
16 (560) 29 (656) 32 (884) 38 (850) 60 (1006)
Decade
Low
Mid
B. Republican Percentage among All Whites in Contested Districts 1950s 40 32 25 31 (N) (80) (59) (100) (239) 1960s 31 37 44 37 (N) (137) (113) (122) (372) 1970s 34 44 50 43 (N) (184) (217) (201) (602) 1980s 34 49 53 47 (N) (131) (202) (230) (563) 1990s 40 58 64 56 (N) (225) (270) (338) (833)
Range (High-Low) -3 +10 +14 +22 +29
−15 +13 +16 +19 +24
26
the end of southern exceptionalism
the old world of Southern politics, the relationship that did appear was inverse to the pattern outside the South. Which is to say: the poor were modestly more likely to vote Republican (Table 2.1A). This situation changed, and the engine for a shift toward Southern Republicanism stood abruptly revealed, in the 1960s. Indeed, from one decade to the next, the overall relationship actually reversed. A politics of economic interest had evidently arrived. The wealthiest tercile was now most likely to vote Republican, the poorest tercile least likely—in a turn that was never in any way threatened thereafter. And while the move from the 1950s to the 1960s was the strongest overall shift, all subsequent decadal changes were to move further in the same direction. Table 2.1A does contain what will prove to be the overall story of partisan change among Southern whites during all the postwar years. Yet its aggregation still very much masks the extent of the change, even in just this one institution, because it still includes many who could not vote Republican for the House of Representatives because they had no Republican candidate. Accordingly, the analysis should really be restricted to white Southerners who possessed both a Democratic and a Republican congressional alternative. When this restriction is imposed, the same patterns recur, writ larger still. The column marked “Total” still shows relentless Republican progress across all these years, decade by decade (Table 2.1B). In the 1950s, even when the analysis is limited only to those districts that did indeed have Republican candidates, the party could attract less than a third of the total vote. By the 1990s, the Republican Party had reached majority status, at least among white voters, and it had done so on a far broader base of competition. Rather than drawing a third of the vote within the minority of seats that it could manage to contest, it drew a majority in a world where remarkably few seats lay beyond its aspirations. More to the point of explaining this growth, however, is the class shift that accompanied and underpinned it. The 1950s, as captured by these individual-level data in tabular form, stand out as the decade of the old South, a piece of the same world that V. O. Key had captured with ecological data graphed onto maps. As such, the Republican vote that did exist still featured a clear class inversion: the wealthy were least likely to vote Republican, the poor most likely to do so. The 1960s then reversed these old class patterns and laid the groundwork for Republican gains, forging a new link between partisan choice and social class, a link that had characterized the North at least since the New
Economic Development and a Politics of Class
27
Deal. From the 1960s and ever onward, at least as this is being written, the wealthy became most likely to vote Republican, in the South and not just in the North. In our terms, the top tercile became most likely to vote Republican, the bottom tercile least likely to do so. But in fact, there was more. At the beginning of this switch, it was the top income tercile that really contributed the great change, detaching itself from the Democrats and moving to support the Republicans. This proved to be a fearsome shift: the top tercile went on to reach majority status for a Republican House by the 1970s. The middle tercile followed at a distance, getting to that same point only in the 1990s, when it brought the party as a whole to (white) majority status. By then, the top tercile was approaching the two-thirds mark in Republican support. At the same time, the bottom tercile, creeping upward with overall Republican successes, had only just achieved the level of support it possessed even in the 1950s. Low-income Southerners participated in the new class politics of the 1960s by actually moving away from a newly energized Republican Party. In a new class politics, that party apparently lacked attraction for the low-income South, at least when examined by way of the House of Representatives, our benchmark for a stable and recurring partisan vote. In fact, low-income (white) Southerners were no more Republican in the 1990s than they had been in the 1950s. A politics newly built around social class should also have been a politics newly built around social welfare as a policy concern, as it turned out to be. This was not just because societal divisions and issue cleavages cohere naturally and logically: no social basis, no policy difference. Nor was it just because when politics in the North had shifted from an essentially geographic to an essentially economic division, social welfare issues had been part and parcel of that change. Nor was it only because the essence of the dominant policy agenda of the immediate postwar era, the New Deal agenda of Presidents Franklin Roosevelt and Harry Truman, was economics and social welfare. Rather, all three preconditions were present. On the other hand, they had been present in the North for a generation without infusing Southern politics to nearly the same degree (Ladd with Hadley 1975; Geer 1992). Fortunately, the National Election Studies asked one or more social welfare questions from the very first survey in 1948 onward. Even more fortunately, the longest-running single focus in the entire series is built around a welfare item first asked in 1952, so that its progeny can be used for a simple check on the policy implications of this Southern class shift. Tapping gov-
28
the end of southern exceptionalism
ernmental interventions on behalf of employment opportunities and economic well-being, this became the effective “marker item” whose surface content addressed welfare policy: Some people feel that the government in Washington should see to it that every person has a job and a good standard of living. Others think that the government should just let each person get ahead on their own.
In 1952, what was to become “a job and a good standard of living” was instead the many-headed mandate “unemployment, education, housing, and so on”; for 1956 and 1960, it was just “a job”; for 1964, just “a good standard of living”; and at that point, it became “a job and a good standard of living” in every year thereafter. For the 1950s, there was only a two-part answer: agree/disagree. For the 1960s, there was a four-part answer, from strongly agreeing with the first premise through strongly agreeing with the second. And for the 1970s onward, there was a seven-point range of agreement. At a minimum, then, it is possible to have a consistent liberal versus conservative dichotomy for the entire postwar period, with “0” the liberal point and “1” the conservative point. Table 2.2 reflects this dichotomy. Arrayed this way, the pattern of issue preferences and their relationship to partisan politics parallels the pattern of class memberships and their partisan relationship, with an opening twist. In the 1950s, preferences on welfare policy were not so much inverted as simply unrelated to a Republi-
Table 2.2
Welfare Attitudes and the Coming of Southern Republicanism: The House
Republican Percentage among All Whites in Contested Districts Welfare Attitudes
1950s (N) 1960s (N) 1970s (N) 1980s (N) 1990s (N)
Liberal
Conservative
31 (137) 24 (59) 36 (112) 27 (99) 32 (171)
31 (64) 38 (125) 48 (224) 58 (213) 68 (462)
Range (High-Low) 0 +14 +12 +31 +36
Economic Development and a Politics of Class
29
can or Democratic vote. This is, of course, the time when lower-income individuals were more likely to be voting Republican in the South. Yet the national parties had largely aligned themselves the other way around, and welfare policy was central to this alignment: national Democrats supported the welfare programs of the New Deal, while national Republicans opposed them. Moreover, just to confuse matters further in the South, national Republicans from poorer constituencies could be quite moderate on welfare issues, while Southern Democrats could stand almost anywhere in this policy realm. The result among white Southerners was a lack of any policy alignment. This is presumably another reflection of the old South, where most individuals had acquired their partisan attachments in a direct line to the Civil War and Reconstruction, events with no obvious relevance to modern welfare preferences. Yet the moment a change in class attachments to the two political parties arrived, in the 1960s, it brought with it a change, and a lasting one, in policy attachments. Conservatives on social welfare were now more likely to pull the Republican lever, liberals on social welfare to vote Democratic. And this relationship only got stronger as the postwar era aged. Moreover, the main secondary effect from a class inversion—the distinctive paths of low-income versus high-income Southerners within the overall picture—was likewise recapitulated with welfare preferences. With social class, the top tercile led the move to a new congressional Republicanism. This was the stratum of society that made the original break, while the bottom tercile remained impervious to Republican attractions. In an echo of the same phenomenon, Republican progress over time occurred almost entirely among those with conservative preferences on social welfare, while the congressional Republican Party scored hardly any gains at all among those with liberal preferences (Table 2.2). Remarkably, they still stood in the 1990s where they had stood in the 1950s, despite massive partisan change around them.3
Social Class and Southern Republicanism: The Presidency In the immediate postwar years, however, all this change was still to come, and congressional politicking in the old South looked as sleepy as ever. The same could not be said of presidential politicking. If Congress was to begin (at least superficially) as an indicator of stasis in Southern politics, an implicit argument that the old order adapted and endured, the presidency was
30
the end of southern exceptionalism
to elicit an immediate stream of predictions that something major had changed, was changing, or would inevitably change. Most of these predictions were not otherwise consistent with each other. Moreover, the volatility of postwar presidential outcomes, now in the American South as well, meant that each seemed temporarily to disconfirm its predecessor. Nevertheless, the same underlying structural factors that were transforming the South, and that were to change congressional politics so dramatically, were in fact transforming presidential politics as well. Such an outcome was not an absolute necessity. In theory, presidential politicking might have been so different from congressional politicking, through either differing policy substance or differing electoral strategy, that grand factors shaping the one would still largely bypass the other. In practice, they did not, and with structural shifts as large as these—with economic development and racial desegregation on this scale—it is hard in retrospect to see how they really could have. For seventy-five years, Republican candidates for President had been awaiting a serious and recurrent Republican vote from the American South. With the House, the harvesting of any such vote, the partisan product of social change, was partially dependent on the recruiting of candidates to capitalize upon it: no congressional challenger, no Republican vote. With the presidency, this secondary problem did not exist—there had been Republican presidential nominees across the South since the end of the Civil War. It was just that there had been no rising Republican vote to harvest. In 1952, that vote arrived. Moreover, it arrived in its modern form—the new South and not the old—with a new class connection, that is, with the class connection that it would have offered in the North for a generation before (Eulau 1962). Dwight Eisenhower not only drew a vastly expanded Southern vote for President, by comparison with Thomas Dewey in 1948 or Wendell Willkie in 1944; he also opened the era in which Republican candidates attracted that vote most heavily within the top income tercile, least heavily within the bottom (Table 2.3A). John Kennedy was to wrest the presidency back for the Democrats eight years later. What he did not do was to restore the old class order. The sharpness of this class cut in the Republican vote for President then jumped up again in the 1960s. At one end of the income spectrum, the Republican vote among low-income Southerners actually managed to fall, to its lowest level of the postwar era. But at the other end of the spectrum, the Republican vote among high-income Southerners continued upward, so that the gap between high- and low-income terciles essentially doubled. In
Economic Development and a Politics of Class Table 2.3
Social Class and the Coming of Southern Republicanism: The Presidency Income Terciles
Decade
31
Low
Mid
Range (High-Low)
High
Total
A. Republican Percentage among All Whites 1950s 43 47 53 (N) (200) (134) (201) 1960s 37 38 56 (N) (143) (103) (106) 1970s 56 64 72 (N) (223) (256) (238) 1980s 51 63 77 (N) (125) (194) (167) 1990s 38 54 57 (N) (228) (289) (323)
48 (535) 43 (352) 64 (717) 65 (486) 51 (840)
+10
B. Republican Percentage of the White Two-Party Vote 1950s 43 47 53 (N) (200) (134) (201) 1960s 44 47 62 (N) (121) (83) (95) 1970s 56 66 73 (N) (222) (251) (235) 1980s 51 63 77 (N) (125) (194) (167) 1990s 41 58 65 (N) (211) (271) (285)
48 (535) 51 (299) 65 (708) 65 (486) 56 (767)
+10
+19 +16 +26 +19
+18 +17 +23 +24
the process, the modern pattern—had anyone known—was effectively established. It is possible to make this change look additionally like the story for the House of Representatives, thereby emphasizing its common roots, by focusing on the Republican share of the two-party vote, since a major independent candidacy by George Wallace in the 1960s, along with a lesser independent effort from Ross Perot in the 1990s, does color all the numbers in Table 2.3A. Again, a class reversal in the old Southern pattern of the vote was already present in the 1950s (Table 2.3B). Again, it jumped up sharply in the 1960s. But seen this way, the line of Republican progress did not vacillate thereafter. Seen this way, in other words, the class escalator remained relentless for the presidency too. All of this helps to remove any individual peculiarity—any potential Eisenhower idiosyncrasy—from the coming of a Republican vote for Presi-
32
the end of southern exceptionalism
dent in 1952. In principle, it would have been possible for Eisenhower, the great American hero of his time, to expand the Southern Republican vote across the board, and for an expanded vote to acquire a class differentiation after he had left the political scene. This clearly was not the story. Instead, sharply rising Republican prospects in the South were tied to the arrival of a partisan attachment to income differences. In the process, Eisenhower served as the vehicle to register a pattern of class voting opposite to what had existed before, not as a transition to that outcome, much less as a brake upon it. The candidate himself would probably have been horrified at this contribution—no class warrior, he. Nevertheless, he was to serve as the crystallizing vehicle for a new and different attachment between social class and Republican voting for President in the South. Moreover, this attachment did not go on thereafter to drag all income levels up in roughly proportional fashion, as economic growth progressed and the postwar period aged. As with the House, the top income tercile led the charge to a new Republicanism. And as with the House, despite unprecedented general Republican growth, the bottom tercile, the poorest third of the white South, remained disproportionately immune to Republican attractions. The presence of a serious Republican vote for President in the first postwar election for which we have individual-level data does deny to the presidential tables one element of drama that the congressional tables possessed. With the Republican vote for Congress, one can see the Republican vote arrive and see that it represents a class reversal when it does (Table 2.1). That is, we possess the necessary “before” and “after” elections, before and after that reversal of the voting relationship to social class. With the Republican vote for President, one can see this arrival but not the change in class connection that came with it, at least not directly. Strictly speaking, there is no “before.” This missing data point is really a small matter, given the background situation. There was, after all, a remarkable absence of economic growth in the South before the 1940s. A poor agricultural economy had been only further devastated by the Great Depression. There was likewise a remarkable absence of a Republican presidential vote, in a line of electoral votes still running effectively at zero (Figure 1.2). When this Republican vote did appear, on the other hand, it arrived in the company of a clear income differentiation (Table 2.3). And this contextual before-and-after logic could be directly confirmed with individual-level data in Congress (Table 2.1). There is, however, one further means of looking for this temporal com-
Economic Development and a Politics of Class
33
parison in the case of the presidency, and if it is hardly ideal in terms of its measurement, it does coincide powerfully with the old South argument of V. O. Key and the new South patterns revealed in the House. What this also affirms, once more, is that the Republican surge around the Eisenhower candidacy, for all the attractions of its hero-candidate, was essentially a vehicle for tapping Southern economic development, with its new politics of economic interest. The way to do this additional investigation is to classify congressional districts according to whether they actually possessed a Republican candidate for Congress in 1952, before Eisenhower was nominated and then went on to expand the presidential vote. Districts that possessed Republican House candidates before Eisenhower thus become “old Republican”; all others are classified as “new.” Even then, the National Election Study did not code survey respondents in 1952 according to their congressional district. But the NES did code respondents that way in 1956 and thereafter, so that it is possible to look for structural resonances from the old South, and for contemporary differences between the old and the new. Looked at this way, these differences—the geological strata of Southern politics—stand out strongly (Table 2.4). For the 1950s, in fact, four things stand out: • First, despite the superficially seismic impact of Dwight Eisenhower, old Republican areas were still considerably more sympathetic to the Republican candidate for President. That did not change. • Second, old Republican areas simultaneously demonstrated the class inversion characteristic of the old South: the poor were most likely to vote Republican, the wealthy least likely to do so. By contrast, new Republican areas had this class tilt reversed—“righted.” • As a result, the difference in the class-based range of Republican support in old versus new Republican areas was huge: −12 percent in old areas to +19 percent in new ones, a massive reverse alignment. • And just to emphasize the nature of the change, this difference was at its most extreme among low-income whites: Eisenhower was hugely attractive to them in old Republican areas, garnering 60 percent of their votes, but notably unattractive in newer areas, at just 31 percent.
34 Table 2.4
the end of southern exceptionalism The Timing of a Class Reversal: The Presidency
Republican Percentage among All Whites Income Terciles Low
Mid
High
Range (High-Low)
Total
[N]
A. The 1950s Old Republican Areas New Republican Areas
60 31
58 44
48 50
−12 +19
56 42
[124] [250]
B. The 1960s Old Republican Areas New Republican Areas
44 35
32 41
57 55
+13 +20
46 42
[112] [240]
C. The 1970s Old Republican Areas New Republican Areas
58 55
67 63
71 73
+13 +18
65 64
[268] [449]
The 1960s then began an evolution, showing the gradual but insistent dominance of the new order, infusing but not yet obliterating the old (Table 2.4B). The gap in Republican presidential prospects between old and new Republican areas remained alive, with a real but rapidly declining advantage to old Republican areas. Yet by the 1960s, both areas showed the impact of the new (not the old) class-based voting patterns. These were strongly present (and strongly positive) in the new Republican areas, more shakily present—apparently still in transition—in the old. By the 1970s, the old South had disappeared (Table 2.4C). Old and new Republican areas were making an essentially equal contribution to the national Republican vote. Moreover, both now gave Republican presidential candidates a healthy majority. Old and new Republican areas could no longer be distinguished by the relationship between presidential voting and social class either; both now offered roughly the same percentage of support from lower-, middle-, and upper-income voters. This also meant that old and new Republican areas could no longer be distinguished by the behavior of their low-income denizens. Policy implications, at least in the social welfare realm, followed logically from these class impacts (Table 2.5A). Unlike the situation in voting for the House, the modern class pattern was already present in overall voting for the presidency by the 1950s, with the rich more Republican and the poor more Democratic. Not surprisingly, the modern pattern of welfare preferences was likewise present, with conservatives voting Republican and
Economic Development and a Politics of Class Table 2.5
35
Welfare Attitudes and the Coming of Southern Republicanism: The Presidency Welfare Attitudes Liberal
Conservative
Range (High-Low)
A. Republican Percentage among All Whites by Decade 1950s (N) 1960s (N) 1970s (N) 1980s (N) 1990s (N)
43 (207) 37 (84) 56 (145) 51 (103) 38 (161)
53 (93) 56 (198) 72 (368) 77 (273) 57 (427)
+10 +19 +16 +26 +19
B. Republican Percentage among All Whites by Grouped Presidencies Eisenhower-Kennedy (N) Johnson-Nixon (N) Carter-Reagan (N) Bush-Clinton (N)
43 (207) 46 (136) 44 (151) 27 (189)
53 (93) 66 (345) 69 (355) 63 (470)
+10 +20 +25 +36
liberals voting Democratic. This relationship was then confirmed and enlarged in the 1960s. Again unsurprisingly, the relationship between welfare preferences and the vote, having taken root a decade before the same relationship surfaced for the House, remained substantially stronger for the presidency (compare with Table 2.2). It would be possible to disaggregate the 1950s of Table 2.5A into old and new Republican areas, in the same manner as shown in Table 2.4. But in the case of welfare attitudes, there would be little point. Both new and established Republican areas showed the modern relationship to welfare attitudes by the 1950s, with liberals being Democratic and conservatives Republican. Established areas were still more Republican overall, as they would have to be. But within both older and newer areas, welfare ideology
36
the end of southern exceptionalism
conduced toward Republican support in the modern fashion (table not shown). One should not, however, miss the element of distinctiveness in this. With social class, older areas had shown an inverse relationship to the modern pattern; only the newer areas came with the modern relationship fully formed. With welfare ideology, on the other hand, the modern relationship arrived fully formed everywhere. In other words, in the old world of Southern politics, class attachments (dating to the Civil War) were inverse, but ideological attachments had come to reflect the policy positions of the national parties. In the newly emergent Southern world, by contrast, both class attachments and ideological positions were consistent with the modern world when they arrived, for they simply had no “old world” from which they needed to become disentangled. Table 2.5A, however, is one of those tables where the process of aggregating presidencies by decade rather than in equal groupings, putting two elections in some decades and three in others, suggests that subsequent developments were less linear—more wobbly—than was probably the case. Accordingly, Table 2.5B takes the same relationship between welfare preferences and the vote and presents it in three-election aggregates. The positive relationship between welfare conservatism or liberalism and voting Republican or Democratic is unchanged for the earliest period, the Eisenhower-Kennedy elections. That relationship is still confirmed and enhanced in the next period, the Johnson-Nixon elections. But it then moves up in an essentially straightforward fashion through the next two periods as well, that is, through the Carter-Reagan and then the BushClinton elections too.
Social Class and Southern Republicanism: The Senate The other branch of Congress, the Senate, requires several short digressions on institutional structure and its impact on data-handling before we can proceed to analysis of the link between economic development and partisan change. Part of this is statistical in an elementary way. With the presidency, while there was a presidential contest only every four years, that contest did feature a Republican candidate in every voting district. With the Senate, especially in the early years, it did not. For the House, although the provision of Republican candidates was also a major challenge, there were over a hundred contests every two years, over five hundred every de-
Economic Development and a Politics of Class
37
cade. But for the Senate, that is, for the eleven states of the Old Confederacy with their twenty-two Senators serving six-year terms, there were on average seven contests every other year, and thus only about thirty-five per decade. As a result, some of the statistical manipulations that are possible for the House and the presidency are just impossible with the Senate, and many others present a “choppier” picture. The situation is made worse by the fact that the NES is a national—not necessarily a regional—random sample, so that a year with few Senate elections on the calendar, and fewer contested elections within them, can also find them seriously under-sampled. This problem is at its worst for the 1950s and early 1960s, when NES samples tended to be more tightly clustered in geographic terms. The best we can do is to raise these cautions when the particular analysis appears to make them especially pertinent. Otherwise, when the focus is institutional arrangements with the potential to shape a relationship between social change and partisan shifts, there are some respects in which the Senate looks more like the presidency than the House. For example, the Senate and the presidency have effectively the same electoral districts, so that both allocate the spoils of victory, either a full term in office or a full complement of electoral votes, to the plurality winner statewide. In most regards, however, the Senate is institutionally closer to the House than to the presidency, starting with the fundamental facts that both are collective (rather than individual) and legislative (rather than executive) institutions. House and Senate districts did differ in potentially important ways. To begin with, the individual Southern states comprised as few as 6 and as many as 22 congressional districts in the 1950s, as few as 4 and as many as 30 by the 1990s. This meant that House districts were inevitably more homogeneous than any single state could be. Seen the other way around, however, the more important consequence is that Senate districts, being a blend of their House components, varied less among themselves—among the states—than did these component parts. There was just inherently less variation among the 11 states of the Old Confederacy than among the 106 congressional districts of the 1950s or the 123 of the 1990s. As a result, when partisan change began, the social changes that were contributing to it had the potential to register earlier in some minority of House seats, where they were always more concentrated. In the crucial example, there were congressional districts with white-collar majorities well
38
the end of southern exceptionalism
before there were any Senate districts (that is, states) that could make this claim. Thereafter, this differential variance between House and Senate districts meant that relationships between changing social characteristics and changing partisan behavior were likely to be stronger across House as opposed to Senate districts. In the crucial example here, there would always be a minority of House districts that were disproportionately white, along with a minority of House districts that were disproportionately black— disproportionate in both cases to any Senate seat—so that when racial context mattered, it ought to have mattered more in the House. Yet despite clear differences in their electoral districting, the Senate and the House often behaved in highly parallel ways, and this fact will sometimes prove to be a route around the statistical problems that the small number of Senate seats can introduce. Two House-Senate comparisons underline this parallelism. The first involves voting behavior and can be presented year by year. If we compare the mean Republican vote in contested districts across the postwar years, the two bodies are effectively indistinguishable (Figure 2.1A). Because there can be as few as two or three contested Senate elections from the South in any given year, we cannot reasonably compare outcomes—wins and losses—by year, but we can aggregate these by decade (Figure 2.1B). Once more, the resulting differences are inconsequential. Moreover, it may be surprising to discover how closely the Senate hewed to both the House and the presidency stories. That is, it is possible to see the same class reversal arrive with the Senate as it did with the House and the presidency, and it is even possible to isolate the apparent timing of the change. At first glance, aggregated by decade, both the 1950s and the 1960s show only unsystematic flux in the relationship between income terciles and a Republican vote for the U.S. Senate, so that the overall effect of a class reversal cannot be elicited until after 1970 (table not shown). By then, the story had become the same. In fact, however, this appears to be one of those cases where imposition of a temporal cut appropriate to the House and the presidency is modestly misleading with the Senate data. For even with a serious shortage of open seats and a chronic dearth of Republican candidates, it is possible, by examining Senate results year by year, to let the data themselves aggregate the early years a bit differently. If the point is to isolate the sharpest available shift from the old world (with its class inversion) to the new, then alternative ways of dividing the 1960s should be permitted. If they are, then Table 2.6 is the result.
Economic Development and a Politics of Class
39
A. Voting Behavior by Year: Contested House and Senate Compared
Proportion of Vote Won by Republicans
0.8 House Senate 0.6
0.4
0.2
0.0 1940
1950
1960
1970
1980
1990
2000
Year
B. Electoral Outcomes by Decade: Contested House and Senate Compared
Proportion of Vote Won by Republicans
0.8 House Senate 0.6
0.4
0.2
0.0 1940
1950
1960
1970
1980
1990
2000
Year
Figure 2.1
The Congressional Story Revisited.
Seen this way, for the period from the beginning of the National Election Studies through 1966, there was no evident patterning to the relationship between income terciles and Republican voting for the U.S. Senate in the American South. There was then a sharp jump toward the modern pattern from 1968 onward. That pattern was sustained in the 1980s. And
40 Table 2.6
the end of southern exceptionalism The Timing of a Class Reversal: The Senate
Republican Percentage among All Whites in Contested States Income Terciles Decade
Low
Mid
High
1952–1966 (N) 1968–1980 (N) 1982–1990 (N) 1992–2000 (N)
26 (139) 42 (227) 35 (162) 43 (165)
20 (95) 44 (259) 38 (208) 56 (226)
27 (122) 53 (257) 46 (222) 64 (288)
25 (356) 47 (743) 40 (592) 56 (679)
Range (High-Low)
Decadal Change
+1
—
+11
+10
+11
0
+21
+10
it jumped again in the 1990s, as Republicans moved to majority status. Cut this way, the Senate looks powerfully like the House, and the apparent time lag in its responsiveness shrinks substantially. The Republican breakthrough occurred perhaps four years earlier in the House than in the Senate, but that was all. A direct link to policy conflicts from this class shift, however, did lag the most for the Senate. Direct links to public preferences on social welfare were already there with the presidency in the 1950s, and they were destined to grow only stronger (Table 2.5). These same links arrived for the House in the 1960s, the point at which the old class inversion righted itself in this institution too, and they grew thereafter for the House as well (Table 2.2). Yet they did not really arrive for the Senate until the 1980s, at least a decade after the old class inversion had disappeared (Table 2.7). If the class inversion characterizing postwar politics arrived a bit later with the Senate, then, its social welfare link arrived later still. On the other hand, what came to characterize both the House and the presidency with regard to the place of public preferences on welfare policy could not be delayed indefinitely, and indeed it was not. The world of the old South for the Senate, like that same world when examined through the House, featured nearly no relationship between welfare attitudes and Republican voting. By the 1980s, that relationship was instead strongly present. By the 1990s, it was surging, becoming every bit as strong as the link to welfare attitudes for the other two nationally elective institutions, almost as if to make up for the delay. In other words, some mix of institutional and
Economic Development and a Politics of Class Table 2.7
41
Welfare Attitudes and the Coming of Southern Republicanism: The Senate Republican Percentage among All Whites in Contested States Welfare Attitudes Decade 1950s (N) 1960s (N) 1970s (N) 1980s (N) 1990s (N)
Liberal
Conservative
22 (109) 37 (41) 50 (104) 26 (119) 30 (141)
25 (56) 41 (110) 53 (301) 49 (299) 68 (359)
Range (High-Low) +3 +4 +3 +23 +38
candidate characteristics kept the Senate from looking like the new South for a little longer, though not by much.
Economic Development as Partisan Engine Economic development came to the American South in the years following World War II, in a manner that it had not experienced since well before the Civil War. And economic development proved to be directly associated with partisan change, most especially by way of the prospects, at long last, for a Southern Republican Party. The specific events of postwar politics still shaped these prospects in measurable ways: war and peace, boom and recession, achievement and scandal. So did the identities and abilities of individual candidates—for the presidency, for the Senate, and for the House. Yet what is more impressive, in the face of all these implicit sources of variation, is not just the relentlessness by which economic development remade Southern politics, but the essential homogeneity of its impact. When the focus was the share of actual wins and losses for public office, as it was in Figure 1.2, then the picture of relentless Republican progress did show some differential volatility, institution by institution. But when the focus is instead the relationship between social class and partisan choice, as it has been throughout this chapter, then volatility was only ini-
42
the end of southern exceptionalism
Percentage Difference in the Republican Vote between the Top and the Bottom Income Terciles 30 25
“New” Presidency
20 15 10 5 0 -5 −10
Senate
1950
1960
1970
1980
1990
“Old” Presidency House
−15 −20
Figure 2.2
Class Effects by Institution.
tial for all three institutions. Within an impressively short time, each came into line with the class patterns of the new and not the old South. Thereafter, what was striking was the extent to which the three separate institutions did not differ. Figure 2.2 plots the percentage difference in the Republican vote between the top and bottom income terciles by decade for the three governmental institutions, with the presidency divided into old and new areas for the early years. At one extreme, the areas for a new Republican vote, those areas that had never previously provided a serious vote for Republican presidential candidates, arrived with the modern class relationship fully formed. This is the line for the “New” Presidency in Figure 2.2. Thereafter, these areas differed very little from decade to decade in the range of their success among upper-income as opposed to lower-income sectors of society. The aggregate total for the Republican candidate could still vary enormously, from 42 percent in the 1950s to 65 percent in the 1980s. But the class relationship within that aggregate varied almost not at all. It should also be noted that this was not the presidency “dragging up” the Republican vote. If institutional dynamics were the story, they should have appeared earlier and continued later. Rather, social forces were “welling up” from the bottom and being reflected in newly Republican areas. It took a further decade for the older areas of Republican support, those that had always offered a serious vote to the Republican presidential candidate, to come into line with these new areas. Seen the other way around,
Economic Development and a Politics of Class
43
however, it took only another decade: this is the line for the “Old” Presidency in Figure 2.2. The class relationships of the old South, where the lower-income sector was more likely to vote Republican rather than Democratic, naturally provided some resistance to the class relationships emerging in the new South. People had presumably been voting opposite to these new patterns—inversely—for generations. Yet it took only another decade before the difference between old and new Republican areas was close to elimination, not by splitting the difference but by settling on the new Republican pattern. As the postwar era began, the House of Representatives actually looked most like the old presidency in terms of its voting relationships (Figure 2.2). This is the world sketched so richly by V. O. Key in Southern Politics in State and Nation, and it began with the strongest negative relationship between class and Republican support among the three nationally elective governmental institutions. Yet within a single decade, this pattern had reversed. Now, upper-income Southerners were voting Republican, lowerincome Southerners Democratic, as they had in the North for a generation and a half, and as they would in the South forever after. By the 1960s, the House relationship was well on its way to convergence with the presidency. By the 1970s, it was effectively indistinguishable. The Senate, finally, fell in between. At the start of the postwar era, voting relationships to social class were neither as inverted as they were for the House nor as contemporary as they were for newly Republican areas of the presidency (Figure 2.2). This initial ambiguity, coupled with the much smaller number of Senate contests, the presence of many long-lived incumbents, and some personal idiosyncrasies, appeared to delay the aligning impact of economic development on partisan politics. Yet by the 1970s, the Senate too had begun its move toward class convergence with the presidency and the House. By the 1990s, it had experienced a second sharp correction, essentially converging on the presidency/House pattern. A tabular way to see the same thing is just to recast the postwar presidential vote in a fashion precisely parallel to the postwar vote for the House of Representatives (Table 2.8). In the real world of practical politics, it makes no sense to do this: the two parties had presidential candidates everywhere, after all, and the degree to which they attracted votes is the appropriate measure of presidential Republican strength (Table 2.3). Moreover, if our concern is with the transition from an old Republican vote to a new, then the proper calculation is the Republican vote in areas with an es-
44
the end of southern exceptionalism
Table 2.8
Social Class and the Coming of Southern Republicanism: The Presidency in Contested House Districts
Republican Percentage among All Whites Income Terciles Decade
Low
Mid
High
Presidential Range
House Range
1950s (N) 1960s (N) 1970s (N) 1980s (N) 1990s (N)
55 (71) 34 (106) 53 (141) 52 (62) 36 (204)
52 (60) 39 (75) 58 (156) 68 (127) 53 (234)
46 (93) 57 (74) 69 (169) 80 (117) 56 (275)
-9 (224) +23 (255) +16 (466) +28 (306) +20 (713)
−13 (201) +25 (234) +20 (418) +14 (285) +25 (609)
tablished Republican Party by the time of Dwight Eisenhower, versus the Republican vote in areas that were not previously characterized by an organized Republican presence (Table 2.4). Yet there is no problem mechanically in looking at the effect of social class on Republican voting for the presidency in only those congressional districts that also possessed both Republican and Democratic House candidates, and comparing it with the effect of social class on Republican voting for the House in presidential years only, thereby creating a precisely parallel calculation. When this is done, the story the two institutions tell is remarkably parallel: • Now, both the presidency and the House showed the old Southern class inversion for the 1950s. • Now, that inversion was righted dramatically in the 1960s, with almost precisely the same amount of change. • For both—compare Table 2.8 with Table 2.1—it was the upper-income tercile that shifted its loyalties to start this change. • For both—same comparison—the lower-income tercile effectively sat in the 1990s where it had in the 1950s. • By the 1970s, the presidency and the House, calculated in this way, had converged on the same point. • By the 1990s, they had moved on, to a point of Republican progress that was nevertheless essentially the same.
Economic Development and a Politics of Class Table 2.9
45
Welfare Attitudes of Partisan Voters: The Presidency, the House, and the Senate
Mean Welfare Scores for Party Voters by Decade The Presidency Decade 1950s 1960s 1970s 1980s 1990s
Contested House
Contested Senate
Dems
Reps
Margin
Dems
Reps
Margin
Dems
Reps
Margin
.27 .60 .64 .50 .54
.36 .81 .76 .84 .87
+.09 +.21 +.12 +.34 +.33
.33 .67 .71 .64 .56
.36 .78 .78 .86 .84
+.03 +.11 +.07 +.22 +.28
.33 .72 .73 .64 .54
.32 .75 .72 .83 .85
−.01 +.03 +.02 +.19 +.31
In any event, a new Southern politics had clearly emerged by the 1960s. Implicitly present by the 1950s, it was to acquire its fully modern form by the 1970s. And it would move relentlessly in the same direction thereafter. What was this politics about, the new politics that came with a changed economic universe and its new social alignments? The obvious answer is “social welfare,” and it is obvious in two senses. First, a politics of social class was likely to be most centrally about social insurance and material (re)distribution. And second, the politics of the New Deal order— the Northern, class-based politics of the time—was profoundly about just that. It came as no surprise, then, when the main events of a great class reversal were reflected in economic ideology. To see this, Table 2.9 takes the contents of Tables 2.2, 2.5, and 2.7, showing the relationship of welfare attitudes to the coming of Southern Republicanism, and calculates them “the other way around”: the mean economic liberalism/conservatism of those who voted Republican or Democratic for each of these three national offices in all of the five postwar decades, where higher numbers are more conservative. What results is another variant of a familiar picture: • There was little or no difference in the welfare preferences of Democratic and Republican voters for the House or the Senate in the old world of the 1950s. Partisan attachments had not been formed through welfare attitudes, and they did not reflect them. There were, however, clear and strong beginnings of a difference—to go with an evident class reversal—in the case of the presidency. • Partisan voting for President moved forward to an even stronger link with public preferences on welfare policy in the 1960s, and partisan voting for the House now assumed the same alignment. Only
46
the end of southern exceptionalism
the Senate continued its lack of alignment with welfare policy conflict—not reverse alignment, just non-alignment. • Both the presidency and the House actually fell back a bit in the 1970s, before moving forward strongly in the 1980s. At this point the Senate moved, belatedly but strongly, to join them. Welfare policy differences between partisan voters were still greatest with the presidency, least with the Senate, but even for the latter, the relationship no longer looked problematic. • And that led to the strong policy differences of the modern era, in which Democratic voters were sharply more liberal and Republican voters sharply more conservative on welfare issues across all three national institutions. Not only had all three relationships strengthened over time, they were also at their most congruent across the three great institutions by the 1990s.
Class Politics and the New South Huge social forces reconfigured postwar society in the American South. Partisan shifts followed more or less ineluctably. Economic development, in particular, began its take-off as the Second World War ended. In truth, wartime industry had already helped in this transition, and the overall boom in the postwar economy then took over. This postwar American boom would be remarkable nearly everywhere, but the South actually caught up with the rest of the nation during its occurrence. Out-migration in search of a better life was a continuing motif of the old South, though the loss of the economically ambitious could only exacerbate the problems they left behind. Remarkably, in-migration in search of a better life would be a counter-motif in the new South—the famous Michigan-to-Texas, rustbelt-to-sun-belt stories of the 1980s being only a dramatic vignette (Gober 1993). In turn, the coming of economic development, and with it a new class structure, led to a crucial class reversal in partisan politics. Once—and presumably for generations before we have individual-level data to confirm the relationship—class attachments to the political parties were inverse. Inverse, that is, with regard to the situation in the North and to the overall New Deal order. The better-off in the South leaned Democratic, the worse-off Republican. This was not so much a class alignment directly as it was an indirect reflection of the social base of partisan identifications at the time of the Civil War, but it nevertheless contributed an inverse class relationship.
Economic Development and a Politics of Class
47
Regardless, in the immediate postwar years, that relationship began to change. At long last, it came into alignment with the situation in the North, and the Republicans, not the Democrats, thereby became the party of the better-off. This also meant, portentously, that the Republicans were now aligned with the growth segments of Southern society (Figure 2.3). As its economic prospects grew, so did their political prospects: economic development proved a relentless partisan escalator for a new Southern Republican Party. One of the two great engines for partisan change in the American South was finally on the scene, pumping away. Figure 2.3 just retells that story in one more way. Following on from this class reversal—part and parcel of it, but with a partially autonomous relationship to the partisan outcome—was a shift in policy conflict for the postwar South. As in the North, so in the South: a political order built upon social class was also a political order themed around social welfare. Class politics could, in principle, support any policy conflicts that were capable of being aligned with class differences. But in the late New Deal era, these were first and foremost conflicts over social welfare, and while these might be joined by other concerns as the postwar era aged, they would actually never recede. Indeed, they would only advance. The simplest way to bring all of this together in a single exhibit, thus providing a final summary device, is by means of elementary crosstabulations between welfare preferences and income terciles (Table 2.10).
Proportion of all Districts
0.5 1950s 1970s 1990s
0.4
0.3
0.2
0.1
0.0 0–10
10–20
20–30
30–40
40–50
50–60
60–70
Percent White-Collar in District
Figure 2.3
The Class Escalator: White-Collar Shares by Congressional District.
70–80
48 Table 2.10
the end of southern exceptionalism Social Class, Welfare Preference, and Partisan Change, 1952–2000
Republican Percentage among All Whites A. Presidency
B. Senate
C. House
Income
Income
Income
Low Welfare Attitude Lib Con
High
Low
1950s
High
Low
1950s
High 1950s
38 (90)
44 (54)
+6
23 (64)
30 (30)
+7
39 (57)
30 (44)
−9
72 (18)
48 (48)
−24
50 (26)
31 (54)
−19
38 (13)
30 (37)
−8
−1
0
+34
+4
+27
1960s–1980s
+1
1960s–1980s
1960s–1980s
Lib
37 (131)
56 (59)
+19
33 (85)
38 (53)
+5
29 (98)
33 (57)
+4
Con
59 (185)
75 (329)
+26
45 (137)
53 (274)
+8
36 (151)
54 (309)
+18
+22
+19
+12
+15
+7
+21
1990s
1990s
1990s
Lib
25 (55)
25 (44)
0
23 (40)
30 (44)
+7
29 (52)
34 (50)
+5
Con
49 (78)
69 (169)
+20
55 (62)
73 (149)
+18
55 (91)
74 (190)
+19
+24
+34
+32
+43
+26
+40
Welfare preferences are presented as a liberal-conservative dichotomy, since that allows a consistent scale over fifty years. Social class is captured by comparing top and bottom income terciles. The postwar years are divided into the old order of the 1950s, the transitional period of the 1960s through the 1980s, and the new world of the 1990s.4 And the presidency, the Senate, and the House are analyzed separately, to capture any institutional differences along the way. Cell entries are then just the percentage voting Republican.5 Even in this simplified format, the evidence from the 1950s is fragile, with small sample sizes and item formats that saw respondents opting more for the “Don’t Know” category than they would in subsequent years. We think that the bivariate format of earlier tables in this chapter is a better repre-
Economic Development and a Politics of Class
49
sentation of relationships at this period in many regards. Nevertheless, the picture that emerges here of the opening years of the postwar era is easily recognizable from what has gone before. The House remained the world of the old South. There was no policy relationship to the vote, and the class relationship, which clearly did exist, was inverse. That is to say: liberals or conservatives on social welfare did not differ in their partisan choices, but the poor were more likely to vote Republican and the rich Democratic. By contrast, social change was already beginning to reach into voting for the presidency, so that it offered a more complex picture of the impact of social class and welfare preferences. Welfare ideology had arrived as an influence, with conservatives more likely to vote Republican for President than liberals, though this was especially true among low-income voters. And the wealthy had become more likely overall to vote Republican, the poor to vote Democratic, though this effect was concentrated among welfare liberals and did not apply to welfare conservatives. On the other hand, there were so few low-income conservatives on social welfare that they should probably be disregarded. If they are, the story of the presidency in this period is that both class and race had become aligned, in what would come to be recognized as the modern pattern. The wealthy were more Republican than the poor, and welfare conservatives more Republican than welfare liberals, within each tercile. This was in striking contrast to the House, where the poor were more Republican than the wealthy, and where welfare preferences remained irrelevant within both groups. The Senate then approximated the presidency more than the House, again showing the beginnings of modern impacts from both social class and welfare preference, though in a weaker fashion than with the presidency. The transitional decades, from the 1960s through the 1980s, bring more robust data and tell a very different story: • For all three institutions, social class had become aligned with partisan choice. The upper tercile was going Republican, the lower tercile Democratic, and policy preferences were no longer a confusing factor in this relationship. This effect was strongest for the presidency and weakest for the Senate, though the greatest change came in the House, where an actual negative relationship had been reversed. • For all three institutions, policy preference too was now aligned with
50
the end of southern exceptionalism
partisan choice. Conservatives were voting Republican, liberals Democratic, and social class was no longer a confusing factor in this relationship. Again, the effect was strongest for the presidency. And again, it was the House that had made the largest overall shift, though low-income voters still lagged; it was upper-income voters who had most fully come into alignment with the other two institutions. • That said, the main point was a powerful symmetry emerging among all three institutions. High-income conservatives were uniformly most Republican. Low-income liberals were uniformly least Republican. And there was little to choose between high-income liberals or low-income conservatives in terms of their Republican proclivities.
The modern era, the 1990s, is then easily recognizable as a further evolution of this transition period. The overall class effect remained, and remained unconfused by the impact of policy preferences. The overall attitudinal effect remained as well, though by the 1990s, it was clearly the stronger of the two: differences between liberals and conservatives were larger than differences between the poor and the rich for every institution. As a result, the overall symmetry was additionally neat. Now, upper-income conservatives were the most Republican; lower-income conservatives came next; upper-income liberals followed them; and lower-income liberals were the least Republican. On the one hand, welfare liberals, rich or poor, were pretty uniformly resistant to Republican attractions. On the other, this was not much of a firewall against Republican gains: the vast majority of white Southerners were welfare conservatives. In the end, then, what emerges most strikingly is the consistent pattern of a new Southern politics, one built upon—indeed, generated by—economic growth, social class, and an underlying class reversion. The basic class change, away from the pattern of the old South but still visible in the 1950s, was a hugely powerful phenomenon. Yet the impact of policy preferences on social welfare also became a powerful relationship as the new South consolidated, culminating in a remarkably powerful effect of its own by the 1990s. Thus in the end, there was a composite political world strikingly different from the one that had gone before, and had lasted for so long.
3 § Legal Desegregation and a Politics of Race
e con om i c de v elopm en t w a s under way in the years immediately after the Second World War in the American South, and the resulting alteration of an economic base and its class structure was having an impact on partisan politics by the early 1950s, as we have seen. Yet economic development as social change was also gradual, indirect, and implicit. The same could not be said of the second great social change affecting partisan politics in the postwar years. The “civil rights revolution” and the resulting alteration of the racial organization of Southern life arrived in response to dramatic, and highly visible, social conflict. After generations in abeyance, these stimuli arrived in a concentrated rush. And they arrived with the stated expectation of changing Southern politics. Symbolically, the civil rights revolution was to be one of the signature events of the postwar era. Operationally, its direct impacts were secured by means of explicit legislative action and self-conscious administrative intervention. The Civil Rights Act of 1964 and the Voting Rights Act of 1965, in particular, directly attacked both the racial structuring of Southern society and the racial basis of Southern politics (Graham 1990). Yet these very facts, the very drama and concentration of the arrival of legal desegregation, drew the attention of scholars in a way that economic development did not, encouraging students of postwar Southern politics to extend the lead argument of V. O. Key, Jr., that “sooner or later the trail of inquiry leads to the Negro” (Key 1949, 5). As we shall see, their attention was fully justified. In the aftermath of these reforms, there were practical impacts with the potential for reshaping partisan politics nearly everywhere one looked. Yet that very fact also en51
52
the end of southern exceptionalism
couraged scholars to apply the basic argument in a manner that was lacking nuance at the least, and occasionally was just incorrect. Accordingly, we begin this chapter by introducing the black South back into the analysis, much as the civil rights revolution reintroduced black Southerners to Southern politics. That is the main explicit purpose of the chapter, and it pursues this purpose through the newly enfranchised black electorate, through the restructured composite electorate created by this enfranchisement, and through an older white electorate that would surely respond, one way or another, to racial change. Yet there is a major secondary purpose to this chapter as well. For in the process of pursuing the changing impacts of a politics of race, it is possible—indeed, it is necessary—to add sophistication to the manner in which they are usually addressed. It is necessary, first, to add precision to the changing impacts of a politics of race, for it was not some simple, single phenomenon. Yet it is also necessary to diversify those impacts, in terms of the social contexts in which they occurred and the policy attitudes with which they were associated. And it is necessary, finally, to embed the impact of a changing racial politics in political institutions that actually expressed this politics very differently. When this is done, three results stand out: • First, the partisan attachment of these new Southern black voters was to be central to everything that followed. In their case, an overwhelming attachment to the national—the Northern—Democratic Party, and not to the Southern Democrats nor to the national Republicans, dwarfed all other influences on their political behavior. • Second, their arrival was to restructure the Southern electorate as a whole, in class and not just racial terms. Black Southerners themselves effected much of this change, adding a huge leaven of lowincome voters to the electorate. But the institutional mechanisms that guaranteed their participation also brought a shift in the class structure of the white electorate, pulling it in the same direction and—this time—affirming suspicions long harbored in the literature of Southern politics. • Finally, the arrival of Southern blacks into the real (rather than just the hypothetical) electorate was to offer grounds for a newly energized politics of race among white Southerners too, should they choose to pursue it. When they did, this white racial politics drew the attention of scholars in a manner that often eclipsed the first
Legal Desegregation and a Politics of Race
53
two impacts of racial desegregation, and in a much more undifferentiated fashion than institutional distinctions would actually require.
Analytically, this latter politics—on the part of white Southerners in a racial context that had been transformed—was the most complex, and therefore the most revealing, part of the story. In a sense, its most remarkable aspect was the lack of apparent change in the pattern of congressional voting, though this was also a tribute to the ability of congressional politicians to finesse a huge societal shift. Before racial reform, whites in blacker areas voted more Democratic, whites in whiter areas more Republican. After reform, the same was true. Yet at the same time, presidential voting assumed precisely the opposite pattern, a pattern long hypothesized, either anticipated or feared, by students of Southern politics. Presidential candidates could not sustain old voting patterns across the same social divide. Before reform, whites in blacker areas had voted more Democratic, whites in whiter areas more Republican for President—just like Congress. After reform, however, whites in blacker areas voted more Republican, whites in whiter areas more Democratic. Finally, and just as remarkably, the relationship between white preferences on race policy and white voting also shifted strongly. Before the civil rights revolution, racial liberals voted Republican while racial conservatives voted Democratic. After the civil rights revolution, this pattern reversed. Moreover, it reversed in all three institutions—conservatives voting Republican, liberals Democratic—so that racial attitudes had a consistent impact across the House, the Senate, and the presidency, while racial contexts primed Congress and the presidency, simultaneously, in opposite directions.
Racial Desegregation and the Coming of a Northern Democracy Forty years later, it is easy to forget that a very substantial minority of Southern blacks had long been adherents of the Republican Party, the party that had freed the slaves and spearheaded the first great attempt to make them voting citizens. Likewise, it is easy to forget that the success of both the Civil Rights Act and the Voting Rights Act remained critically dependent on the support of Republican Senators. If it was Northern Democrats who spearheaded the legislative side of the civil rights revolution, it was Southern Democrats who led the fight against it. As a result,
54
the end of southern exceptionalism
it was Northern Republicans—the national Republican Party—that provided the votes to make this legislation pass. A higher percentage of Republican than Democratic Senators voted for both the Civil Rights Act and the Voting Rights Act. Had Republicans been only as supportive of civil rights as Democrats, neither bill would have survived. Nevertheless, it was Northern Democrats who principally initiated and sustained these legislative efforts. Thus when Southern blacks entered the electorate in a rush in the 1960s and 1970s, they entered as “national Democrats,” despite the obstructive presence of white regional Democrats. While the total contribution by Southern blacks to the NES sample of Southern voters in the 1950s was inevitably small, the National Election Studies could still elicit evidence of the underlying partisan story. In these data, over 40 percent of the presidential vote by black Southerners still belonged to national Republican nominees in the 1950s (Table 3.1A). That share fell catastrophically in the 1960s—to 3 percent!—and it never really recovered. Black Southerners would thereafter echo the pattern of support for Republican presidential candidates nationwide, albeit at a great distance, ticking up a bit in the 1970s and 1980s in conjunction with the fortunes of those candidates. But this would always remain the faintest and most distant of echoes. The historical vote by black Southerners for the Republican candidate, generated during Reconstruction and sustained in part by Democratic foreclosure, was thus gone presidentially. A side-look at the House and the Senate tells essentially the same story (Table 3.1B). The survey N
Table 3.1
The Demise of Black Republicanism % Republican
(N)
A. Presidential Vote by Black Southerners by Decade 1950s 1960s 1970s 1980s 1990s
42 3 10 9 3
(33) (74) (174) (130) (219)
B. Presidential, Senate, and House Voting after Legal Desegregation Presidency Senate House
7 13 11
(523) (493) (670)
Legal Desegregation and a Politics of Race
55
for the earlier period is additionally feeble in the case of this congressional electorate, but aggregating the three decades after the civil rights revolution shows a Republican vote of 7 percent for the presidency, 13 percent for the Senate, and 11 percent for the House—though in truth, this should probably be stated the other way around: as a Democratic vote of 93 percent for the Presidency, 87 percent for the Senate, and 89 percent for the House. A social group with that sort of overwhelming partisan imbalance left nearly no room for any other influences on its vote. Black Southerners in the new South were to be even more monolithically Democratic than white Southerners had been in the old. For them, racial identification overwhelmed any other social basis for partisan distinction. As a result, the obvious missing element, so very consequential among white Southerners, was social class. The coming of a class reversal had been crucial to the rise of Republican voting among Southern whites. Yet there was nearly no room for a parallel effect among their black fellow citizens, and there was effectively none. Black voters became Democratic voters, pure and simple. Class distinctions, such as they were, had nothing to add (Table 3.2A). The presidency showed a remarkably high and essentially uniform line of support for Democratic candidates. The Senate showed a “perverse” relationship, with the slightest trend toward the Democrats and away from Republicans in the top tercile. And the House showed a slightly larger trend in the opposite direction, if losing 80 percent of the small vote in the top income tercile of this social group can be considered a “Republican trend.” Yet that was essentially all there was to say, for a demographic influence that was powerfully reshaping the white electorate at the same time. Not surprisingly, given the lack of a class effect, there was no serious variation in partisan support among Southern blacks according to general preferences on social welfare. This is again in sharp contrast to the clear and strong relationship among Southern whites. Yet if nine out of ten Southern blacks voted Democratic for President after passage of the Civil Rights and Voting Rights Acts, welfare attitudes could add only the slightest increment or decrement to this relationship. There was the hint of a link for the presidency; the Senate was essentially a wash; and the House showed a slightly larger relationship (Table 3.2B). Overall, however, the point remained that, with little room for much further influence on the black vote, there was little further influence. A different possibility for some internal differentiation within a new and
56 Table 3.2
the end of southern exceptionalism The Rise of a Monolithic Voting Bloc A. Social Class and Partisan Voting Democratic Percentage among Black Southerners Income Terciles 1970s-1990s
Low
Mid
High
Presidency (N) Senate (N) House (N)
92 (290) 87 (240) 90 (249)
92 (128) 87 (122) 90 (117)
93 (61) 92 (59) 80 (58)
B. Welfare Attitudes and Partisan Voting Democratic Percentage among Black Southerners Welfare Attitudes 1970s-1990s Presidency (N) Senate (N) House (N)
Liberal 93 (260) 88 (237) 91 (313)
Conservative 90 (93) 89 (80) 84 (113)
exploding Southern black electorate involved the social contexts that these individuals inhabited. With many other social groups (Tingsten 1937; Butler and Stokes 1969), members of the group who lived in areas where that group was disproportionately concentrated did show different behaviors, including political behaviors, from members who lived in areas where the group was comparatively less numerous. In other words, members in areas where the group was numerous were more likely to display the modal behavior of the group, while members in other areas were more likely to deviate from it. In the 1950 census, blacks constituted more than one in four Southerners. They still constituted more than one in five in 2000, despite substantial white in-migration and black out-migration. These figures made the South as a region racially distinctive, but they naturally subsumed a much greater range of racial contexts, from electoral districts where blacks were a tiny percentage to those where they verged on being the majority.
Legal Desegregation and a Politics of Race
57
For many subsequent analyses, especially in Chapters 4 and 5, we shall use this full range, the actual racial composition of congressional districts. For an initial look at the impact of racial context, however, it is easiest just to take the later 20 percent figure—more than one in five—as a cutpoint. In practical terms, once black Southerners constituted more than 20 percent of the potential electorate, they would more or less automatically require some adjustment from the white Democrats whom they were supporting: some acknowledgement, some integration, or failing that, some confrontation. Along the way, the 20 percent cut emphasizes the momentousness of legal desegregation for all of southern politics in the 1960s, when the southern average was still well above that figure. And this division has the crucial collateral advantage of guaranteeing a substantial white population in more-black districts until very late in the analysis. In any case, it is easy to divide Southern voting districts into those that were more and less black than this benchmark figure.1 Such a division allows the possibility in practical and not just theoretical terms that new Southern black voters who found themselves in less-black (more-white) districts might exhibit some different voting behavior from those in moreblack (less-white) districts as a direct result. Once again, however, the simple fact of Democratic predominance among all black Southerners—the overwhelming tendency of Southern blacks to come into the electorate as, in effect, Northern Democrats and to stay that way—eliminated most of this possibility in practice. When black voters for the three main nationally elective institutions of American government are pooled across the three full decades after legal desegregation, presidential voters are overwhelmingly Democratic, regardless of blacker or whiter social context (Table 3.3A). The two houses of Congress do hint at a contextual effect: blacks in blacker districts were about 5 percent more likely to vote Democratic (and hence 5 percent less likely to vote Republican) than blacks in whiter districts for the House, about 6 percent more likely for the Senate. As we shall see, this congressional effect, small in its own right, was to be dwarfed in magnitude and consequence by the counterpart effect among whites. Racial context would indeed be important to the Southern story, but for whites, not for blacks. The final possibility in such an analysis is that it would not have been racially relevant contexts but racially relevant attitudes that should have been expected to shape voting behavior among black Southerners. That is, those who believed that governmental aid targeted specifically to black Ameri-
58
the end of southern exceptionalism
Table 3.3
The Rise of a Monolithic Voting Bloc, Continued A. Racial Context and Partisan Voting Democratic Percentage among Black Southerners 1970s-1990s Presidency (N) Senate (N) House (N)
20% Black
94 (152) 83 (113) 87 (126)
94 (371) 88 (347) 93 (353)
B. Racial Attitudes and Partisan Voting Democratic Percentage among Black Southerners Race Policy 1970s-1990s Presidency (N) Senate (N) House (N)
Liberal
Conservative
92 (222) 89 (216) 88 (290)
92 (109) 84 (103) 89 (143)
cans was a good thing might at least be more likely to vote Democratic than those who thought that racially targeted aid was not a good thing. Fortunately, although there are no civil rights items that span the entire NES in the way that the social welfare item on “a job and a good standard of living” does (see Chapter 2), there is an item on aid to black Americans that spans the aggregated period from 1972 onward, and it seems a reasonable proxy for this attitude: Some people feel that the government in Washington should make every possible effort to improve the social and economic position of blacks and other minority groups. Others feel that the government should not make any special effort to help minorities because they should help themselves.
Yet once again, on a policy division so apparently relevant to the arrival of black Southerners in practical politics, there was little relationship to the partisan choices they made thereafter (Table 3.3B). The presidency and the House showed effectively no difference; the Senate showed a tiny dif-
Legal Desegregation and a Politics of Race
59
ference in the “proper” direction, with conservative blacks being a shade less Democratic. Regarding this latter relationship, however, it is worth recalling the overall value of the effect: if black Southerners were 20 percent of the regional population, if black conservatives were 33 percent of black Southerners, and if Republicans did 5 percent better among black conservatives in Senate elections, then that was a further aggregate contribution to the Southern Republican vote for the Senate of one-third of one percent—0.33 percent.
Legal Desegregation and the New Southern Electorate Voting by black Southerners surged during the 1960s, under the dual protection of national law and federal marshals. As a result, the nature of the social base for Southern politics—the Southern electorate—was recast almost at a stroke (Lawson 1976; Stanley 1987). The postwar baseline for black participation in the politics of the old South, still visible in NES data for the 1950s, already represented some modest incremental gains (Bartley and Graham 1975; Bass and DeVries 1976). That baseline nevertheless experienced immediate and explosive growth in the 1960s, courtesy of a changed legal framework plus practical guarantees for its application. As we have seen, this new black electorate was all the more noteworthy for the fact that it was not further divided by other social considerations, by racial contexts, by racial attitudes, by welfare attitudes, or, most remarkably given the white Southern story of the postwar years, by social class. On the other hand, it is important not to allow this racial homogeneity to mask a major contribution that this new black electorate was making, both directly and indirectly, to the class basis of Southern politics. For if the new black electorate was still disproportionately located in the lowest income tercile, then it almost had to be pulling the total electorate strongly in that direction. This is its direct effect, and, as we shall see below, it was certain and strong. Yet it is important to remember that it had long been argued that the electoral rules for the old Southern politics functioned as a barrier to participation by poor whites as well. So the potential for an indirect effect on the class composition of the Southern electorate by way of white voters was automatically present too in the aftermath of electoral reform. Black Southerners may not themselves have been responsive to considerations of social class as distinct from racial identity. But they certainly held a class position in Southern society, and that position helped to under-
60
the end of southern exceptionalism
pin and augment considerations of economic voting in Southern politics. As a result, the composite class contribution of reforms aimed at ending black disfranchisement in the 1960s was substantial. Table 3.4 presents the aggregate of Southern voters for the presidency by decade, divided into top, middle, and bottom terciles by income. In the Southern electorate of the 1950s, an overwhelmingly poor electorate had nevertheless secured only a small edge for lower-income Southerners in voting totals. Upper-income Southerners, despite their relative paucity, were actually close behind (Table 3.4A). Voting reforms in the 1960s then fueled a substantial class shift, sharply elevating the lower-income share of the total vote while sharply reducing the upper-income share. Poor Southerners became almost a majority of the total electorate. Moreover, this racially impelled class shift coincided with the arrival of the class reversal in Southern voting patterns that began with the presidency in the 1950s and reached both houses of Congress in the 1960s. Reforms justified on racial grounds obviously had a powerful class impact. After the 1960s, these reformed electoral rules would go on to meet an economically booming Southern society, and the effects of that boom— plus, presumably, some differential voter turnout within it—would go on to alter these impacts in additional ways. While the lower-income tercile Table 3.4
Racial Desegregation and the Class Composition of the Southern Presidential Electorate Decade
Low
Mid
High
(N)
A. Share of Electorate by Income Terciles for the Full Southern Electorate 1950s 1960s 1970s 1980s 1990s
39 45 38 32 32
25 29 33 38 34
36 27 29 30 34
(568) (421) (885) (606) (1033)
B. Share of Electorate by Income Terciles for the White Southern Electorate 1950s 1960s 1970s 1980s 1990s
37 41 31 26 27
25 29 36 40 34
38 30 33 34 39
Note: Bolded decades are the ones before and after electoral reform.
(535) (352) (717) (486) (840)
Legal Desegregation and a Politics of Race
61
continued to be the modal part of the Southern electorate in the 1970s, its share was already declining; it was the middle tercile that was continuing to grow (Table 3.4A). This growth continued through the 1980s, when the middle-income tercile became the modal part of the electorate. The upperincome tercile did not benefit in similar ways until the 1990s, when it finally reached parity with the middle tercile, a parity still below the electoral share that it had enjoyed in the 1950s, forty years before. The numbers in Table 3.4, being based on the presidential vote, mask some modest further variation within the total electorate. While those who voted for President were obviously available to vote for Congress—always the House, usually the Senate—there was actually some ballot fall-off with these down-ticket offices in presidential years. As a result, figures calculated for the House or the Senate over this entire fifty-year period averaged a percentage point lower for the bottom tercile, a percentage point lower for the middle tercile, and two percentage points higher for the top tercile. In the same way, off-year elections could be expected to have a lower turnout on average than on-year (presidential-year) counterparts. As a result, House and Senate elections in presidential years for this same fifty-year period averaged four percentage points higher for the bottom tercile than in off-year elections, two percentage points lower for the middle tercile, and two percentage points lower for the top tercile (tables not shown). Within all these numbers, the change from the 1950s to the 1960s, courtesy of electoral reforms rooted in the civil rights revolution, still stands out dramatically. At a stroke, the class composition of the Southern electorate was changed. Yet the old rules that were swept away, rules justified as keeping black Southerners out of the voting population and the ones targeted by the Voting Rights Act—the literacy test and the poll tax, along with their differential and discriminatory application—had long been argued to have a secondary class effect, serving as an additional barrier to the participation of poor whites. Accordingly, when the old rules were swept away, even the Southern white electorate ought to have undergone some change in its class composition. As indeed it did (Table 3.4B). In this poorest region of the nation, upper-income whites had nevertheless managed to be the modal income group within the white Southern electorate of the 1950s. By the 1960s, the decade of legal reform in voting arrangements throughout the South, not only had they lost that position, but the modal group was actually lowerincome whites. By the 1970s, the combination of electoral reform and economic growth meant that middle-income whites would become the modal
62
the end of southern exceptionalism
category, and this situation would prevail through the 1980s as well. It was only in the 1990s, forty years later, that some combination of economic growth and active turnout brought upper-income whites back to the share of the white electorate that they had attained forty years before, in the 1950s. A different but complementary way to tell this story is to focus, not on the modal class sector of the electorate, but on the sector that was growing most rapidly across time as a result of electoral reform, economic development, or, presumably, both. Viewed in this way, Table 3.4B is essentially a story of middle-income ascendance. While the dramatic change in the 1960s, when measured by modal categories, was from upper-income to lower-income voters, middle-income whites were already increasing their electoral share at a faster rate. They would continue to do so in the 1970s, and again in the 1980s. Only in the 1990s would they surrender this growth standard to upper-income whites. Seen from one side of the partisan aisle, then, as long as the Democratic Party remained the preference of middle-income whites, the class shift in the 1960s electorate might have permitted Democratic partisan dominance to continue. Seen from the other side of the aisle, only when the Republican Party achieved majority preference with the white middle class could its triumph be complete. Seen either way, however, this was the great secondary effect of voting reform—rooted in the white community, expressed through social class. What a focus on real gains and losses (rather than modal positions) also underlines is the timing of the way that electoral reform interacted with economic development in the postwar South. If it were possible to conceive of the civil rights revolution as happening a generation earlier—in the 1930s, say, as part of the New Deal, rather than in the 1960s—then electoral reform would have fallen on a very different Southern economy, with a very different class structure. Presumably, the numerical transfer from upper-income to lower-income whites would have been even more striking. But in fact, by the time electoral reform arrived, economic development was already well under way, so that Southern society—or at least, white Southern society—was evolving into a middle-income, not a lowerincome, world. Told by way of modal income sectors, then, this was a story of upperclass advantage, lower-class mobilization, and upper-class resurgence. Told by way of the growing income sector, it was a story of middle-class ascendance, from the 1960s through the 1980s. Told either way, however, it was
Legal Desegregation and a Politics of Race
63
undeniably a class story. Moreover, it was undeniably a white and not just a black class story, courtesy of legal desegregation and the political mobilization that came with it. Yet this second effect implied an increased Democratic edge, by way of a substantial extension of the class reversal of the white electorate, only as long as the expansion of the black electorate did not alter the partisan implications of this white class story.
Legal Desegregation and a White Politics of Race The direct impact of black enfranchisement on partisan balance in the South was overwhelming. Its direct and indirect impacts on electoral composition were likewise impressive. Together, their potential influence on the rise of a Southern Republican Party ranged from conditionally damaging to absolutely disastrous. Yet that was not nearly all the grounds for a racial impact from the arrival of legal desegregation. In particular, none of this necessarily denied the prospects for a mass politics of racial voting among white Southerners. And indeed, a large literature has since pointed to precisely this possibility as a crucial ground—often privileged over economic development—for the rise of Southern Republicanism (Lamis 1999; Black and Black 2002). In this scenario, while black enfranchisement would be directly advantageous to the regional Democratic Party, it could be indirectly advantageous to the regional Republican Party as well. The keystone of this latter literature has been the notion of “racial threat,” the possibility that a new and disproportionately black electorate would cause white voters to move toward the Republican Party as a way to maintain their political influence on racial grounds (Giles 1977 and 1993; but see Voss 1996 and Abramowitz 1994). We shall return to this possibility explicitly. But before that, it is worth asking simply about the impact of racial context on white voting. We have seen only a mixed and modest impact from racial context on black voting. Yet once again, this did not require, by any practical extension, that there would likewise be no racial effect among whites. Again, it is easy to examine the behavior of white voters according to the racial composition of their electoral districts. The easiest initial way to do this is to go back to the same cut-point used to distinguish racial contexts among black Southerners—districts that were more or less than 20 percent black—and look, now, at white Southern voters within those districts. Methodologically, a white reaction to the racial restructuring of politics that was insufficient to register by this measure was, at the very least, not
64
the end of southern exceptionalism
very widespread. Practically, as before, when black Southerners constituted more than 20 percent of the total electorate, especially when they had previously constituted less than 5 percent, their presence could not very well be ignored by their white neighbors. Accordingly, Table 3.5A shows the vote among whites for the House of Representatives for those districts that possessed both a Republican and a Democratic candidate, dividing them into those that were more-black or less-black than our benchmark figure. In the 1950s, when blacks were essentially missing from the House electorate in much of the South, the resulting relationship was hardly a response to black participation. Yet it did accord with the old Southern politics as described by Key. In other words, whites in more-black areas were considerably less likely to vote Republican than were whites in less-black areas, even for those districts where the Re-
Table 3.5
Racial Contexts and White Voters: The House
A. Racial Contexts and Partisan Voting Republican Percentage among All Whites in Contested Districts Decade
20% Black
Range
33 (106) 44 (190) 48 (398) 60 (361) 55 (725)
27 (110) 27 (188) 36 (258) 29 (260) 61 (201)
−6
1950s (N) 1960s (N) 1970s (N) 1980s (N) 1990s (N)
−17 −8 −31 +6
B. Racial Contexts and Partisan Voting, Controlling for Social Class Republican Percentage among All Whites in Contested Districts Income Terciles Low Decades 1960s-1980s (N) 1990s (N)
Mid
High
20% Black
20% Black
20% Black
40 (267) 39 (171)
29 (181) 44 (54)
56 (295) 56 (207)
29 (218) 65 (63)
58 (310) 64 (274)
38 (239) 67 (64)
Legal Desegregation and a Politics of Race
65
publicans did possess a congressional challenger. This was a reflection of where Southern Democrats had been ensconced and where Southern Republicans had been able to mount a challenge for much of the previous century. The central point, however, is that when the electoral world turned upside down in the 1960s, with the rapid influx of a large black component to the Southern electorate, this relationship did not change (Table 3.5A). If anything, it became stronger. Now, with blacks surging as a greater and greater share of the Democratic electorate, whites in more-black areas remained more likely to stay with the Democrats, and therefore less likely to shift to the Republicans. Initial Republican gains in the aggregate were entirely within the less-black congressional districts, a tendency which Table 3.5A still understates. For more-black areas were also less likely to get Republican challengers (see Chapter 5), so that many of the worst areas for an incipient new Republican Party are ruled out of the analysis here. The same effect of racial context was repeated in the 1970s. And it was repeated in the 1980s, becoming stronger yet again. Republicans now had majorities among white voters in the more-white congressional districts. By comparison, they had progressed very little in the more-black districts. Instead of driving whites into the Republican Party, substantial black enfranchisement appeared to contain that party within areas where few blacks lived. Put differently, thirty years of evolution in Southern congressional voting still made it very difficult to find something called “racial threat” in the numbers. It was easy enough to see an impact of racial context, but that impact ran in the opposite direction. Only in the 1990s did this impact finally disappear. Indeed, it actually reversed, with whites in blacker House districts becoming more likely to vote Republican than their counterparts in whiter areas. In other words, the particular impact of racial context which supporters of legal desegregation had feared for the 1960s, and which scholars of Southern politics had attempted to use in explaining the rise of a Southern Republican Party in the 1970s and 1980s, arrived only thirty years later for the House of Representatives, after black Southerners had become an integral part of Southern electoral politics. If racial context had a role to play in Republican prospects for the House, it was as a capstone for those prospects, not as an underpinning, much less as an initial impetus. Nevertheless, it is also important to note that the end of this previous Democratic edge among whites in more-black districts arrived at the point when its demise mattered least. In the 1950s, 54 percent of white voters
66
the end of southern exceptionalism
had lived in such districts; in the 1960s, 51 percent; in the 1970s, still 49 percent. This percentage dipped in the 1980s, to 35 percent, though the Democratic edge among these whites actually rose in return, largely compensating for the loss of numbers. In other words, the difference in white voting by racial context actually declined in conjunction with the disappearance of whites in more-black districts, as the share of white voters in these districts fell to (only) 22 percent in the 1990s.2 The previous edge to the Democrats from racial context thus finally disappeared just as its numerical consequence plummeted. On the other hand, Table 3.5A is not by itself sufficient to sustain this overall reading of the effect of racial context. Precisely because social class came to have such a strong pro-Republican effect on the white electorate, it is possible that voting results by racial context are merely a surrogate for class. In other words, because blacker areas were also poorer areas generally, it is possible that poorer whites too lived there disproportionately, and that what looks like electoral division based on racial context is instead electoral division based on economic development, masked. Some simple notion of “racial threat” is obviously not sufficient to summarize this effect even then, since the hypothesized impact simply does not appear. But social class might still be the key to understanding an apparent pro-Democratic bias among whites in blacker districts. Therefore, Table 3.5B controls for income terciles—low, middle, and high—in comparing the Republican share of the vote by racial context. Little changes. For the period after the 1950s and until the 1990s, all paired comparisons—more-black versus less-black lower income, moreblack versus less-black middle income, and more-black versus less-black higher income—show the same pattern as the overall relationship. Whites in more-black areas were comparatively more likely to vote Democratic. Whites in less-black areas were comparatively more likely to vote Republican. Until that effect was erased for the South as a whole, it was not erased in any income tercile. Likewise, when it finally did disappear—reverse—in the 1990s, it reversed in every income stratum. The postwar Senate tells essentially the same story in a slightly attenuated version, though it does raise an immediate question about the proper unit for measuring racial context. In one sense, the state is the proper basis for comparison: states are, after all, the “districts” for Senate elections. Yet here, there are both theoretical and practical problems in relying on this measure. Theoretically, states as the basis of comparison are just too large to capture the effect of a “racial context,” if one were there to be captured.
Legal Desegregation and a Politics of Race
67
It is not clear, for example, why white voters in West Texas, with a nearly complete absence of blacks, should feel “threatened” by the widespread presence of black voters in East Texas, 800 miles away. Moreover, methodologically, states as units of measurement sharply compress the range of more-black and less-black districts. That is, states cluster far more closely around the Southern racial mean than do congressional districts, with the result that they offer limited variance on the variable alleged to be shaping the behavior of white voters. Accordingly, whenever the analysis requires electoral districts for the examination of contextual effects, we shall use the congressional district as the unit of analysis.3 This has the additional advantage of examining contextual influences on the partisan vote for House, Senate, and President by way of the same base unit, making results directly comparable. To that end, Table 3.6 shows the total vote for Republican senatorial candidates by decade, calculated on the basis of the congressional district in which the voter lived. Seen this way, the Senate too shows the racial pattern of the old South in the 1950s, with whites in whiter areas more likely to go Republican, whites in blacker areas to go Democratic. In the 1960s, the Senate too (still like the House) did not reverse this pattern as new black Democrats flooded into the Southern electorate. For the 1960s, 1970s, and 1980s, however, the scope of the difference between more-black and less-black areas remained considerably smaller in the Senate than in the House. Either senatorial elections did not prime racial context in the same way that House elections did, or statewide aggregation, no matter how measured, did not produce the same effect. Finally, in the 1990s, the Senate too
Table 3.6
Racial Contexts and White Voters: The Senate Republican Percentage among All Whites Decade
20% Black
Range
1950s (N) 1960s (N) 1970s (N) 1980s (N) 1990s (N)
27 (71) 40 (182) 52 (347) 40 (419) 56 (594)
13 (112) 32 (126) 47 (285) 39 (233) 60 (163)
−14 −8 −5 −1 +4
68
the end of southern exceptionalism
moved mildly in the other direction, with whites in more-black areas shifting to slightly more Republican, though this represents far less change than the counterpart movement in the House. Accordingly, even by this most elementary test, neither house of Congress provides support for the hypothesis of racial threat. There was an impact from racial context on white voters—from the presence or absence of a disproportionate number of black Southerners—but when it did appear, it was inverse to the established hypothesis. More-black areas remained kinder to Democratic candidates for national office, even among whites. It was less-black areas where Republican candidates scored their greater successes. On the other hand, the presidency tells a sharply different story, so that if there is an empirical grounding to those works attributing a heavy emphasis in the rise of a Southern Republican Party to racial context, it arrives with the presidency. Civil rights as a voting issue had actually arrived on the national agenda in 1948, when President Harry Truman received a strong civil rights plank at the Democratic National Convention from restive Northern Democrats, in the process splitting his party and producing a Southern Democratic—the Dixiecrat—revolt. In response, both parties shied away from the issue in the 1952 presidential contest, and again in 1956. By 1960, events had begun to outpace their strategic preferences, and both presidential candidates, John Kennedy and Richard Nixon, worked instead to find a position—some sort of straddle—that made them progressive on civil rights nationally while “unthreatening” on the issue in the South. By 1964, there was no straddle left in the Johnson-Goldwater contest: the two candidates drew the lines on governmental intervention in civil rights about as cleanly as they would ever be drawn. By 1968, in part as a direct result of that contest, the Civil Rights Act and the Voting Rights Act were national law, and a national administration was helping to reconstruct the racial basis of Southern life. What began seriously under John Kennedy, then, was the institutionalization of the civil rights issue in presidential politics. What began seriously under Lyndon Johnson was nothing less than the alteration of the racial organization of Southern social life. Not surprisingly, within that framework, the 1950s looked like the old South with regard to racial contexts and presidential voting (Table 3.7). Republican presidential candidates ran better among white voters in the less-black areas of the South, Democratic candidates among white voters in the more-black areas. By the
Legal Desegregation and a Politics of Race Table 3.7
69
Racial Contexts and White Voters: The Presidency Republican Percentage among All Whites Decade
20% Black
Range
1950s (N) 1960s (N) 1970s (N) 1980s (N) 1990s (N)
50 (167) 38 (180) 61 (396) 62 (325) 51 (743)
45 (199) 46 (173) 69 (369) 66 (208) 53 (192)
−5 +8 +8 +4 +2
1960s, however, the old order of racial segregation was being dismantled. It would have been very surprising if this upheaval had secured no reflection in partisan politics. There was to be no such surprise. White Southern voters, during this most intense period of social change, did indeed switch to voting more Republican for President in those areas where racial change would inevitably be greatest (Table 3.7). That is, during the 1960s, the relationship between presidential partisanship and racial context actually reversed. Now, whites in more-black areas were likely to be comparatively more Republican for President, while whites in less-black areas were likely to remain comparatively more Democratic. That same relationship continued through the 1970s. It continued, in reduced fashion, in the 1980s. And it was still present as a shadow in the 1990s, where the residual difference was of additionally reduced consequence because the imbalance between the distribution of white voters had become so extreme: there were very few whites left in the more-black districts. What resulted overall, then, was a much more mottled and curious pattern of voting influences for racial context than most summary hypotheses, new or old, would have countenanced: • The old “racial threat” hypothesis had little apparent utility in understanding congressional politics. Worse, it worked essentially in the opposite direction. As a result, it had little utility as a summary concept for the partisan impact of legal desegregation. • On the other hand, in the immediate aftermath of the civil rights
70
the end of southern exceptionalism
revolution, voting for President assumed precisely the contours hypothesized—feared or desired—by those who had imagined the impact of racial desegregation on the breakup of the political order of the old South. • Finally, when voting patterns for Congress and the presidency were put back together, what was most clear about the utility of an overarching distinction based on racial context was the power of two great governmental institutions to structure its impact in different (indeed, opposite!) ways.
Yet before accepting this composite picture as the partisan impact of legal desegregation, it is necessary to revisit the argument concerning racial threat in one important regard. For it might reasonably be argued in response to all of the above that a true “racial threat” would have to be defined much more extremely than we have defined it here (as “greater than 20 percent black”) in order to have a significant, measurable, behavioral impact. Indeed, V. O. Key had begun the story of the rise of the old order in Southern politics with the assertion that it was those areas of the South with an actual black majority that had been central to the institutionalized foundation of that order (Key 1949, 5). Perhaps we need to do the same? On the other hand, by the time Southern Politics appeared, such districts were already too rare to serve as the underpinnings for any new political order. For the 1950s, there was, to be exact, only one congressional district in the American South with an implicit black majority. Accordingly, Key himself had already shifted the argument, asserting that black majorities had been central to the foundation of an order, but that it was those areas that were more than 30 percent black that constituted the institutional bedrock—the electoral incentive—for a politics of racial segregation.4 This is the standard that Earl and Merle Black used subsequently to make the same sort of argument for postwar politics (Black and Black 2002), so perhaps this standard (rather than 20 percent) should be used here as the crucial cut-point when addressing racial threat rather than just racial context. Nevertheless, when this is done, precious little changes. Comparing the pattern of politics for the three great institutions of elective national government in the three decades when racial context primed a Republican vote differently as between the presidency and Congress—with racial context redefined at the 30 percent level—just does not change the underlying story (Table 3.8A versus 3.8B). Seen this way, the House still anchors an institutional continuum for the impact of this difference, in which larger
Legal Desegregation and a Politics of Race Table 3.8
71
Racial Contexts and White Voters: The House, the Senate, and the Presidency Revisited
A. Partisan Voting with a Racial Context at 20% Percent Republican for All Whites 1960s-1980s House (N) Senate (N) Presidency (N)
20% Black
Range
52 (949) 44 (948) 57 (901)
31 (706) 41 (644) 63 (750)
−21 −3 +6
B. Partisan Voting with a Racial Context at 30% Percent Republican for All Whites 1960s-1980s House (N) Senate (N) Presidency (N)
30% Black
Range
49 (1197) 45 (1190) 58 (1181)
27 (458) 37 (402) 63 (470)
−22 −8 +5
black populations reduce the prospects of Republican voting among whites very substantially. Once more, the Senate follows the House pattern, but in an attenuated fashion. And once more—still strikingly—the presidency reverses the story, such that larger black populations actually increase the prospects of Republican voting among whites. Needless to say, major institutional differences mediating the impact of racial context are, in the process, sustained. In other words, the differential impact of racial context on a Republican vote for the House, the Senate, and the presidency is not some simple product of understating the real divisions between less-black and more-black electoral districts. A cut-point of 20 percent black, based on racial divisions in the 1990s, does not differ from a cut-point of 30 percent black, the cut favored in the historical literature. It would be possible, mechanically, to impose an even more demanding cut-point, at 40 percent. But by then, any division within white voting patterns between more-black and less-black areas would be inconsequential. With a cut-point of 40 percent, less than 9 percent of the white South would have lived in more-black districts.
72
the end of southern exceptionalism
Racial Attitudes and Republican Prospects Racial context obviously worked in opposite ways as an influence on white voters, for Congress versus the presidency, and it continued to work in this opposite fashion for a full three decades. This makes it only more intriguing to know how racial attitudes operated in this new Southern politics. Yet here, unlike the relationships involving social class and economic liberalism or conservatism, relationships involving racial context and racial liberalism or conservatism do not contain an inherent set of hypotheses to serve as initial—test—answers to the question. That is, we cannot merely begin with attitudinal extrapolations from the underlying social structure. Social class had offered a “natural,” that is, an interest-based, hypothesis about the relationship between welfare attitudes and partisan support, at least once the party system featured one party (the Democrats) centered on governmental provision in social welfare, with the other party (the Republicans) centered on resisting it. Those most in need of welfare provision, presumably the less well-off, ought to have leaned Democratic; those least in need of welfare provision, presumably the better-off, should have leaned Republican. By extension, even within social classes, those favoring welfare provision ought to have leaned toward the Democrats, with those who opposed such provision leaning toward the Republicans. What made the voting patterns of the old South distinctive was that neither relationship had actually appeared. Instead, even after the coming of the New Deal had institutionalized these relationships in the North, the link between social class and partisan choice had been inverted in the South, with the poor leaning Republican, while the link between welfare preferences and partisan choice had just been nonexistent. Once a class reversion occurred, however, the related policy linkage followed hard upon it. Both relationships had thus fallen into practical alignment in the hypothetically appropriate direction: the bottom tercile Democratic and the top tercile Republican, with liberals Democratic and conservatives Republican within each tercile. The problem with racial policy, with governmental action specifically on behalf of black Americans, but also the potential added value, was that the underlying sociological influences offered no clear opening hypotheses. Should racial conservatism among white Southerners have been expected to be associated with more-black areas, presumably those areas where governmental aid to blacks represented more of a social upheaval, not to mention more of a fiscal drain? Should racial conservatism among
Legal Desegregation and a Politics of Race
73
white Southerners have been expected to be associated with less-black areas, presumably those areas where whites were less likely to know black Southerners as “real people,” as daily acquaintances rather than artificial stereotypes? Or was there no necessary connection? (See Glaser 1994; more generically, Forbes 1997.) Introducing racial attitudes into the story of legal desegregation and a politics of race will prove more difficult overall than introducing welfare attitudes into the story of economic development and a politics of class, because there is less substantive consistency in the opinion items asked by the NES in the realm of race policy for the full postwar period. Yet initially, with the question of the relationship of racial conservatism to racial context, and especially for the critical period of change in the American South, there is no problem at all. The NES does offer a consistent item on aid to blacks during the entire 1960s, and respondents to it can, as ever, be easily classified by more-black and less-black racial contexts: Should the government in Washington see to it that black people get fair treatment in jobs, or should the government in Washington leave these matters to the states and localities?
Accordingly, our first question is easily answered. During the 1960s, the critical time when the relationship between racial context and partisan choice changed for the presidency but not for Congress, racial attitudes— ideological liberalism or conservatism on race policy—were unrelated to racial context. The mean racial conservatism for white Southerners in lessblack districts was almost precisely equivalent to the mean racial conservatism for white Southerners in more-black districts: 0.70 for the former (on an N of 233), 0.69 for the latter (on an N of 249). White Southerners in less-black areas were not more racially conservative; nor were they more racially conservative in more-black areas. White Southerners were just equally conservative in less-black and more-black areas. Therefore, the next question becomes how racial attitudes were related to the vote. Given the institutional differences in the impact of racial context, there must actually be two parts to this question. First, how did racial liberalism or conservatism relate to a Democratic or Republican vote? And second, was this the same relationship across all three institutions—the House, the Senate, and the presidency? Nothing in the lack of a relationship between racial attitudes and racial context prevented whites from expressing their racial views through the ballot box, just as nothing in the
74
the end of southern exceptionalism
lack of this prior relationship prevented them from expressing these views differentially, as between Congress and the presidency. In addressing these questions, the matter of item consistency across the decades does make the analysis less neat than it was able to be with economic conservatism. In the matter of aid to blacks, the same item that we used to investigate the impact of policy preferences on race among black Southerners can be used among whites for the 1970s, the 1980s, and the 1990s: Some people feel that the government in Washington should make every possible effort to improve the social and economic position of blacks and other minority groups. Others feel that the government should not make any special effort to help minorities because they should help themselves.
Unfortunately, the 1950s and the 1960s each require a different base item, with specific rather than generic aid referents. Because the literature on Southern politics suggests that something major did happen in this area during the transition from the old to the new Southern politics, it seems worth trying to integrate these items into the analysis nevertheless. One apparently artifactual effect of changing not just item content but item format was to shift the marginals for these items between the 1950s and the 1960s. During the 1950s, the key item varied a bit, sometimes mentioning housing and sometimes not, but its form was at least essentially stable: If Negroes are not getting fair treatment in jobs and housing, the government should see to it that they do.
As above, this changed in the 1960s to: Should the government in Washington see to it that black people get fair treatment in jobs, or should the government in Washington leave these matters to the states and localities?
In the 1950s, without any priming for the alternative, responses were more liberal in the aggregate than they would be in the 1960s, when the alternative answer was explicitly prompted. We do know, however, that the shift in the marginals for these two items across these two decades was not a diagnostically Southern phenomenon; it almost exactly paralleled that same
Legal Desegregation and a Politics of Race
75
shift in the North. In any case, if we confine ourselves to looking at the relationship between racial liberals and racial conservatives in their partisan choice, we should still be able to make some use of data from the 1950s and 1960s, before the decade of the 1970s gives us a fully consistent item thereafter.5 Because two very different base items had to be used to add opinions on racial policy to the overall story of political change in the postwar South, Table 3.9 does have to be read in two pieces. Fortunately, each piece still has a major part of this story to tell. In the first of these, the 1950s and 1960s pull together substantively similar items in order to reach back into history, and their message is very clear. In elections for the U.S. Congress, both the House and the Senate, the 1950s were still the old South (Table 3.9A and B). Whites who were more liberal on racial policy were more likely to vote Republican; whites who were more conservative on racial policy were more likely to vote Democratic. The role of racial ideology was thus effectively inverted. In the racial upheavals of the 1960s, on the other hand, as Northern Democrats drove a legislative revolution in civil rights and as Southern blacks entered the electorate as in effect Northern Democrats, these patterns of policy association reversed. Now, whites who were more liberal on racial matters were more likely to vote Democratic, while whites who were more conservative on this measure were likely to vote Republican. Racial ideology had come to be aligned in the modern manner. The House, having started slightly farther behind, underwent a slightly larger change than the Senate, but that was all. The 1970s, 1980s, and 1990s in Table 3.9 then use the second base item on racial policy from the NES, the one on generic aid to blacks. While the results from this item cannot be directly compared to those for the 1950s and 1960s, it does offer an unchanged content for the next thirty years. Moreover, the story it tells with regard to Congress is clear enough (Table 3.9A and B). By the 1970s there was an evident relationship between policy preferences and partisan choice, with racial conservatives more Republican, racial liberals more Democratic. This is the situation created by the upheavals of the 1960s, and it obviously remained in place, even though the precise numbers cannot be compared. Those numbers can be directly compared from the 1970s to the 1980s, however, when the relationship grew. Indeed, it grew very considerably in the case of the House, making this one of the few instances where differences between the House and the Senate actually trace to the fact that
76 Table 3.9
the end of southern exceptionalism Racial Attitudes and Partisan Voting Republican Percentage among All Whites in Contested Districts Aid to Blacks Decade
Liberal
Conservative
Range
34 (118) 28 (50) 40 (115) 35 (89) 27 (128)
21 (72) 38 (154) 48 (330) 53 (329) 60 (546)
−13
21 (104) 33 (46) 37 (99) 28 (129) 38 (94)
14 (69) 41 (114) 54 (319) 46 (294) 67 (379)
45 (229) 41 (91) 55 (121) 45 (99) 20 (110)
50 (216) 47 (220) 72 (380) 74 (255) 62 (467)
A. The House 1950s (N) 1960s (N) 1970s (N) 1980s (N) 1990s (N)
+10 +8 +18 +33
B. The Senate 1950s (N) 1960s (N) 1970s (N) 1980s (N) 1990s (N)
−7 +8 +17 +18 +29
C. The Presidency 1950s (N) 1960s (N) 1970s (N) 1980s (N) 1990s (N)
+5 +6 +17 +29 +42
Legal Desegregation and a Politics of Race
77
it was the Senate that reached a stronger alignment earlier. That is, by the 1970s racial attitudes were strongly tied to Senate voting, at a level achieved by the House only in the 1980s. In any case, the numbers can be compared directly again for the 1980s to the 1990s, and the relationship grew stronger still, opening up a veritable policy chasm. The gap in Republican voting for both the House and the Senate, between racial liberals and racial conservatives, thus increased regularly from the 1970s through the 1990s. At the same time, the gap between the House and the Senate effectively closed. In other words, there was very little institutional difference left in the role of racial ideology as underpinning for a Republican vote. What had arrived instead was a huge partisan difference over aid to blacks, with Democratic voters supportive and Republican voters opposed. Moreover, this time, the presidency was different in only one regard (Table 3.9C). With the presidency, the 1950s and 1960s already showed a clear if modest relationship between public preferences on racial policy and partisan choice among presidential candidates, a relationship exemplifying the new, not the old, South. Apparently, in sharply expanding the Southern presidential vote for the Republican candidate, Dwight Eisenhower had attracted many Southern Democrats who were racial conservatives. In doing so, he had already reversed the old relationship to civil rights attitudes—liberals Republican, conservatives Democratic—that the House and Senate would reverse only a decade later. Yet thereafter, the presidential, House, and Senate stories were to be in complete alignment, growing only more tightly bound as time passed. Moreover, it is once again possible to excavate for an older stratum of Republican voting within the Eisenhower upsurge of the 1950s, thereby affirming that the same change characterized the presidency as characterized the Congress. When the presidential vote of the 1950s is divided into the vote from established Republican versus newly mobilized areas, this change stands out boldly. Established Republican areas, those possessing congressional candidates by the time of Eisenhower, were still much more likely to vote Republican overall; this is the “Total” column in Table 3.10. Yet in these older Republican areas, it was racial liberals who were more likely to vote Republican, while in newly Republican areas, it was racial conservatives who were more likely to do so. And the difference was very large. At one extreme, 60 percent of racial liberals were voting Republican in established areas; at the other, only 37 percent of racial liberals were voting Republican in the
78
the end of southern exceptionalism
Table 3.10
Racial Attitudes and Partisan Voting: The Presidency Revisited
Republican Percentage among All Whites Aid to Blacks Decade of 1950s Old Republican Areas (N) New Republican Areas (N)
Liberal
Conservative
60 (65) 37 (123)
50 (36) 46 (78)
Total
Range
56
−10
41
+9
newly emerging areas. Once more, this was a picture drawn from presidential voting of the old world of Southern politics versus the new. It was also a picture of an impressive difference that was about to disappear. Only a decade later, both established Republican and newly mobilized areas would have converged, with racial conservatives voting Republican for President in both areas. In other words, by the 1960s, it was racial conservatives who would be leaning Republican in every decade—for every office—thereafter. Yet this parallel behavior needs to be set directly beside the other great development in the politics of race. Or rather, it gains additional, independent significance from the way that these attitudinal relationships, consistent across institutions, were superimposed upon opposite relationships to racial context. That is to say: from the 1960s onward, racial conservatism was likely to foster Republican voting and racial liberalism Democratic voting for both Congress and the presidency. Yet from the 1960s through the 1980s, whites in blacker areas were more likely to vote Republican for President, whites in whiter areas to vote Democratic, while at the same time, whites in blacker areas were more likely to vote Democratic for Congress, whites in whiter areas to vote Republican. Only in the 1990s would this apparent disjunction ultimately disappear. On the other hand, an argument could be made that public preferences on race policy are the wrong measure of racial attitudes. In this line of argument, what was important was just racial feeling per se. It was this, at the very least, which should most logically have been associated with perceptions of racial “threat.” The direct threat (if any) was not that government would change public policies; the threat was that black enfranchisement would change—even overwhelm—white influence. So perhaps a different measure would produce a different outcome? Perhaps it would even remove the apparent disjunction between the impact of racial contexts versus racial attitudes?
Legal Desegregation and a Politics of Race
79
Fortunately, there is a simple way to tap these possibilities, though it does not have the full historical span that we would like. Beginning in the 1960s, the National Election Studies began to ask about attitudes toward blacks by way of a “feeling thermometer.” With this device, the respondent is asked to rank the positive or negative character of his/her feelings toward a variety of stimuli—often social groups, sometimes particular politicians as well—on a scale ranging from 0 (very negative) to 100 (very positive). The text introducing this item varied a bit over time, but the 1960s version is typical: There are many groups in America that try to get the government or the American people to see things more their way. We would like to get your feelings toward some of these groups. I have here a card on which there is something that looks like a thermometer. We call it a “feeling thermometer” because it measures your feelings towards groups. Here’s how it works. If you don’t know too much about a group or don’t feel particularly warm or cold toward them, then you place them in the middle, at the 50 degree mark. If you have a warm feeling toward a group or feel favorably toward it, you would give it a score somewhere between 50 degrees and 100 degrees, depending on how warm your feeling is toward the group. On the other hand, if you don’t feel very favorably toward some of these groups—if there are some you don’t care for too much—then you would place them somewhere between 0 degrees and 50 degrees.
Because there is no feeling thermometer regarding blacks for the 1950s, it is not possible to look for change in the relationship between white feelings toward black Southerners and their own partisan behavior at the point when this change was occurring explicitly for the House or Senate and just below the surface, in old but not new areas of Republican strength, for the presidency. On the other hand, the item—effectively the same item—does run from the 1960s through the 1990s, providing at least a consistent measure over all those years. What it manages to suggest, for all three institutions this time, is that it was policy preferences directly, not the racial feelings beneath them, that were more central to attitudinal relationships. In the case of the House of Representatives, any relationship that existed between racial feelings and partisan choice was modest (Table 3.11A). Those who felt negatively toward blacks—who put themselves on the “cold” side of the feeling thermometer—were slightly more likely to vote Republican in every decade, with their greatest differentiation in the 1970s. The same could be said of the Senate (Table 3.11B): always modest,
80
the end of southern exceptionalism
Table 3.11
Racial Feeling rather than Race Policy as a Measure of Racial Attitudes? Republican Percentage among All Whites in Contested Districts Feeling toward Blacks Decade
Positive
Negative
Range
35 (219) 42 (470) 44 (373) 49 (638)
40 (167) 52 (276) 50 (229) 52 (363)
+5
36 (180) 43 (282) 41 (399) 54 (470)
40 (129) 52 (177) 39 (238) 60 (255)
+4
42 (214) 59 (437) 61 (296) 50 (561)
45 (143) 71 (291) 69 (221) 54 (335)
+3
A. The House 1960s (N) 1970s (N) 1980s (N) 1990s (N)
+10 +6 +3
B. The Senate 1960s (N) 1970s (N) 1980s (N) 1990s (N)
+9 -2 +6
C. The Presidency 1960s (N) 1970s (N) 1980s (N) 1990s (N)
+12 +8 +4
Legal Desegregation and a Politics of Race
81
strongest in the 1970s, but never worth much. And this time, the same could be said for the presidency as well (Table 3.11C). Those who felt more negative toward blacks were more likely to vote Republican, those more positive to vote Democratic, with the 1970s again as the high point, but with this relationship always second to racial policy as an influence. To put it differently, the relationship to public policy, namely concrete aid to black Southerners, always dominated the relationship to racial feeling. A comparison between Tables 3.10 and 3.11 shows a considerably stronger relationship between the Republican vote and policy preferences rather than racial feelings at every point. This is clear-cut in the 1960s, when both effects were at their weakest. It remains clear-cut in the 1970s, when racial feelings had their strongest effect. And it is thereafter overwhelming. From the 1960s through the 1990s, it was policy preference, not group feelings, which aligned strongly—more and more strongly—with the Republican vote.
Legal Desegregation as Partisan Engine Major economic change began to come to the postwar South by the 1950s, and with it an impact on partisan politics, though this political fallout would be celebrated only much later. Major racial change followed hard upon it, and if racial change arrived a bit later than economic development, at least in terms of its impact on partisan politics, it registered much more explicitly when it did arrive. The institutional catalyst for this change—a deliberate institutional catalyst this time, not an aggregate market effect— was legal desegregation. Some of its impacts were direct and immediate. Others were indirect, the result of adaptations by other elements of the Southern political order. The most direct and immediate result of legal desegregation was that the share of the total electorate contributed by black Southerners shot up. The directly statistical impact of legal desegregation was thus hugely consequential: the potential Southern black electorate became a practical voting electorate within a remarkably compressed period of time. The longrun practical impact of this shift, on the other hand, was the product of three other aspects of the same great change: the partisan balance within this newest major sector of the Southern electorate; the degree of change that this contributed to the partisan balance for the South as a whole; and—part and parcel of both these aspects—how the non-black South reacted to them.
82
the end of southern exceptionalism
Figure 3.1 pulls together the black contribution to the Southern vote for the House, Senate, and President by decade. What it suggests is that, although efforts to desegregate the politics of the American South would involve additional years of federal intervention and many more years of federal monitoring, those efforts bore partisan political fruit almost immediately. Black voters flooded into the Southern electorate in a rush during the second half of the 1960s. They flooded in, overwhelmingly, as Democrats, and Northern Democrats to boot. At the same time, Republican voting by black Southerners actually collapsed. And the latter was not inevitably a consequence of the former. The Southern partisan landscape was effectively transformed—nearly, in hindsight, at a stroke. In the first of these bedrock partisan facts, whatever the proclivities of the black electorate in the old South had been, the new black voters who surged into that electorate after 1965 chose overwhelmingly to arrive as Democrats. Before this time, there remained a substantial minority of black support for the Republican Party, though it was clearly in decline from the days when national Republicans had actively championed the Southern black man’s cause. Nevertheless, seen as a share of partisan electorates in the decade before the civil rights revolution, the black contribution was still approximately equal as between Democratic and Republican candidates. After 1965, such support was effectively trivialized, and the scale of this disaster for an emergent Republican Party is hard to exaggerate: a black contribution to Southern Republicanism managed to fall despite the fact that the total black vote was variously tripling or quadrupling. 40% 35%
Share of Dem. Presidential Vote Share of Dem. Senate Vote
30% 25%
Share of Dem. House Vote
20% 15%
Share of GOP Senate Vote
10% 5% 0%
Share of GOP House Vote Share of GOP Presidential Vote
1950s
Figure 3.1
1960s
1970s
1980s
Black Contributions to the Democratic and Republican Vote.
1990s
Legal Desegregation and a Politics of Race
83
Conversely, the black share of the vote for Democratic candidates, presidential and congressional, jumped up—and never thereafter faltered. At first glance, the black contribution to the vote for Democratic presidential candidates appeared to rise more quickly and remain reliably greater than its share for congressional candidates. Yet some of this apparently greater contribution by black voters to Democratic presidential candidates actually reflected disproportionate defeats nationwide—situations where the most loyal groups would inevitably bulk larger. Moreover, while most of these presidential elections were not close, many individual House and Senate races were, so that a growing Democratic contribution from black Southerners could matter much more to congressional than to presidential outcomes. A second major impact of black enfranchisement followed from the way that this new, monolithic, and Democratic voting bloc changed the class composition of the Southern electorate. It should have been no surprise that black Southerners, among the very poorest demographic groups in the entire nation, pulled the Southern electorate strongly in their (lower-income) direction when they entered in substantial numbers. Yet in fact, the Southern white electorate itself reflected a reduced version of the same phenomenon. It had long been argued that restrictive Southern voting arrangements, justified as privileging white voters, simultaneously privileged upper-income rather than lower-income individuals among them (Kousser 1974). The electoral reforms of the 1960s suggested that this was still true. In this poorest region of the nation, upper-income voters had actually managed to be the modal group in the Southern electorate among whites through the 1950s. At a stroke, the electoral reforms of the 1960s, implemented on black racial grounds but conferring change on white class grounds as well, awarded this status to lower-income whites instead. Thereafter, a combination of economic growth and differential turnout, as registered through more neutral administration of electoral rules, would determine the class composition of electorates. This is not the same as saying that the combination would also determine partisan winners and losers. For the real partisan impact of this white class shift was also dependent in important ways on a third major aspect of legal desegregation and the associated politics of race: namely, the response of white voters to the arrival of a much blacker and more Democratic electorate. In Chapter 4 we will address the interaction of class and race in a more comprehensive and systematic—a multivariate—manner. In
84
the end of southern exceptionalism
the meantime, it is obvious that two elements of this white response were crucial: the extent to which it was conditioned by racial context, and the extent to which it was conditioned by racial attitudes. It is worth beginning with the fact that the impact of racial context was now a practical rather than just a theoretical question. More-black and less-black areas of the South now had greater or lesser black voting populations. Perhaps surprisingly, this fact registered very differently by institution. For Congress, especially the House, the impact of racial context ran opposite to fears of an implicit “racial threat”: whites in blacker areas remained more likely to stay Democratic. For the presidency, however, the impact was reversed and those fears were realized: whites in blacker areas became more likely to go Republican. In other words, the impact of this second great social change in the American South was crucially mediated by the structure of elective political institutions. The same change had opposite partisan impacts on Congress versus the presidency. Clearly, something was connecting social change to partisan outcomes in powerful—and powerfully different—ways. In Chapter 4 we will also examine this mediating process in more detail. What required less additional interpretation was the relationship between racial policy conflicts and ongoing partisan change. Liberalism or conservatism on a policy of governmental aid to black Americans shifted in its impact from the 1950s to the 1960s, and then grew steadily through the 1970s, the 1980s, and the 1990s. Positive or negative racial feelings, in the absence of any policy specifics, showed a weak echo of the same effect. And this time, both effects ran in the same direction for all three governmental institutions: racial liberals leaned Democratic, while racial conservatives leaned Republican. A different way to summarize the same overall result is just to look at aggregate policy preferences on governmental aid to blacks, the stronger of these two attitudinal measures. To that end, Table 3.12 calculates the contents of Table 3.9 “the other way around,” showing the mean racial liberalism/conservatism among those who voted Republican or Democratic for the presidency, the Senate, and the House in all five postwar decades. Again, higher scores are more conservative, lower scores more liberal. What stands out are the same institutionally general developments that were evident in the case of economic attitudes in Chapter 2 (Table 2.9), plus a difference between the presidency and Congress that was likewise in evidence there: • First is the obvious patterning in policy relationships in the old South. For the 1950s, the House and the Senate showed this histor-
Legal Desegregation and a Politics of Race Table 3.12
85
Racial Attitudes of Partisan Voters: The Presidency, the House, and the Senate
Mean Score on Aid to Blacks among White Voters The Presidency Decade 1950s 1960s 1970s 1980s 1990s
Contested House
Contested Senate
Dems.
Reps.
Margin
Dems.
Reps.
Margin
Dems.
Reps.
Margin
.46 .67 .66 .55 .63
.52 .74 .81 .81 .93
+.06 +.07 +.15 +.26 +.30
.50 .69 .76 .70 .65
.32 .76 .78 .84 .89
-.18 +.07 +.02 +.14 +.24
.45 .69 .72 .65 .68
.29 .76 .82 .79 .88
-.16 +.07 +.10 +.14 +.20
ical world most clearly: Democrats were more conservative, Republicans more liberal on race. The 1950s surge in the presidency had already muddied this effect, but it can be resurrected by dividing the presidential vote into new versus old Republican areas. Established presidential areas too featured Democrats as conservative, Republicans liberal. • A major reversal arrived in the 1960s. Congress, both the House and the Senate, now joined the presidency in the same overall direction: it was Democrats who were more liberal on race, Republicans who were more conservative. Moreover, this relationship had not just assumed the parallel, modern fashion for all three institutions, one that would last for the next four decades. The House and the Senate actually needed to produce a larger change in order to come into this alignment, and in the 1960s, they did so. • The 1960s and 1970s cannot be compared precisely, because their attitudinal scores are based on different issue questions. But thereafter, both this second measure and the second story remained the same for all three institutions. Thus the change that appeared in the 1960s was recapitulated in the 1970s. That distinction expanded in the 1980s, and again in the 1990s. By that time, voting differences on racial policy had reached an impressive partisan differentiation. • Fourth and last, but parallel to the situation with policy attitudes on social welfare, voting for President was more closely tied to racial attitudes for the 1970s, the 1980s, and the 1990s than was voting for Congress, for either the House or the Senate. In earlier years, the presidency “got there first.” In later years, the gap between Republican and Democratic voters remained consistently larger for the presidency.
86
the end of southern exceptionalism
Race Politics and the New South Economic development and a new politics of class had reversed old relationships among white Southerners. The Republican Party managed to put itself on the growth side of that equation. And economic growth dragged the party upwards in every decade after the 1950s. This was the great and continuing “Republican accelerator” for the postwar era in the American South. Legal desegregation and a new politics of race likewise reversed old relationships, or at least radically augmented a reversal already under way. With considerable irony, it was the Democratic Party that managed to put itself on the growth side of this equation. This was the great, though far more conditional, “Democratic brake” on Republican progress. Such a description underlines the way that these two great social forces, economic development and legal desegregation, worked in noticeably different fashions. A key class reversal was essential to the impact of economic development; without it, the story of class politics would have been very different. Yet once that reversal had occurred, further economic change became an irresistible further contribution to Republican progress. It was not a simple linear story even then: the underlying class distinctions actually expanded as time passed. But economic change was relentless, and the associated class politics went hand in hand with partisan change. By contrast, the big racial changes were essentially legal rather than demographic. The South did become modestly less black (more white) as the postwar era aged. But what really mattered was the way that the largely unchanging demographics of race applied—were applied—to partisan politics. The first big “application” came in the 1960s, with the civil rights revolution. At that point, established but hypothetical racial contexts became practical and direct influences on politicking. Then, thirty years later, an essentially stable racial demography was reapportioned in a strikingly different way. This second change will be addressed in Chapter 4. For now, the important point is that the resulting partisan shifts did not come from a change in overall racial balance, but from legal aspects of the application of an existing balance to partisan politics. This difference in the demography of two great social changes gains further emphasis from their differing institutional impacts. Economic development and a new politics of class, while they arrived at modestly different times and resonated somewhat differently as between the House, the Senate, and the presidency, really contributed one general and overarching pattern. By contrast, legal desegregation and a revised politics of race, while
Legal Desegregation and a Politics of Race
87
arriving simultaneously in formal terms, saw three separate forms of institutional impact. An old world of institutional uniformity in the 1950s became a new world of striking difference between the presidency and Congress in the period between 1960 and 1990, before this difference collapsed into a new uniformity in the 1990s. Summarizing two powerful sociological influences in this fashion does make the difference in their associated policy attitudes seem less surprising. Associated attitudes toward welfare policy followed logically from social class, in a double sense. The better-off were more conservative and the worse-off more liberal, where conservatives could be expected to vote Republican and liberals Democratic, once the South had joined the national party system. Moreover, within any given income stratum, the same relationship could be expected to apply—economic conservatives voting additionally Republican, economic liberals additionally Democratic. This too would have been true in the North since the 1930s. Now, it was true in the South as well. In the case of racial identity, the counterpart situation was not as simply described. To begin with, black Southerners, those with the strongest racial identity, voted so overwhelmingly Democratic that nothing else mattered. By contrast, for thirty years, white Southerners were additionally differentiated both by racial context and by racial ideology. For racial context, whites in blacker districts were more likely to vote Democratic for Congress, Republican for President, and whites in whiter districts of course the reverse. For racial ideology, whites who were racially conservative were more likely to vote Republican for Congress or the presidency, while whites who were racially liberal were more likely to vote Democratic. Racial ideology and racial context were and remained unrelated in their impact. Yet the voting relationship to racial context ultimately declined, converging effectively to zero in the 1990s, while the relationship to racial ideology continued, growing only stronger. Table 3.13 offers a different way to summarize these same developments, by looking at the joint impact of racial contexts and policy attitudes within the white Southern electorate. As with the final summary figure in Chapter 2, racial attitudes are retained as a simple liberal/conservative dichotomy in order to have comparability across the entire postwar period. Racial context is once again divided at plus or minus 20 percent black. The decades of transition, the 1960s through the 1980s, are contrasted with the old order of the 1950s and the new world of the 1990s. And the presidency, the Senate, and the House are presented separately, to capture any
88 Table 3.13
the end of southern exceptionalism Racial Context, Aid to Blacks, and Partisan Change, 1952–2000
Republican Percentage among All Whites A. Presidency
B. Senate
C. House
Racial Context
Racial Context
Racial Context
Low Racial Attitude Lib Con
High
Low
1950s
High
Low
1950s
High 1950s
51 (96)
38 (86)
−13
32 (44)
13 (45)
−19
43 (61)
27 (48)
−16
47 (43)
48 (64)
+1
12 (17)
11 (38)
−2
11 (27)
26 (35)
+15
−4
+10
−20
1960s–1980s
−2
−32
1960s–1980s
−1
1960s–1980s
Lib
47 (183)
48 (128)
+1
33 (182)
30 (92)
−3
45 (154)
22 (100)
−23
Con
63 (437)
69 (410)
+6
51 (398)
46 (327)
−5
56 (445)
38 (361)
−18
+16
+21
+18
+16
+11
+16
1990s
1990s
Lib
23 (93)
* (17)
Con
62 (358)
62 (109) +42
+1
1990s
40 (81)
* (13)
68 (310)
59 (69) +28
−7
28 (96)
* (23)
65 (376)
72 (116)
+8
+30
Note: Entries with an asterisk contain less than 5 percent of the total sample, and are suppressed. Summary numbers are calculated in a slightly different fashion as a result; see text.
institutional differences along the way. Cell entries are the percentage voting Republican.6 Once again, evidence from the 1950s is fragile. Yet one central circumstance did dominate this evidence, and thereby anchored voting patterns for all three institutions. This key point, the real story linking all three representations, was the disproportionately Republican support of whites in whiter areas who were also racial liberals. They were the bedrock of a Republican vote. It was their voting behavior that explained why whites in less-black (more-white) areas were disproportionately Republican. It was their voting behavior that had underpinned an older tendency for whites who were racial liberals to vote disproportionately Republican, although
Legal Desegregation and a Politics of Race
89
this was the part of the story that was already changing during the 1950s. Apart from their behavior, neither racial contexts nor racial attitudes made any consistent contribution to the Republican vote. These individuals were the main explanation for why Republican candidates appeared to do better in less-black areas in the South as a whole. This was because, by and large, they resided in what had been areas of Republican strength since the formation of the national Republican Party before the Civil War. In the years immediately after World War II, they still did. Yet with the presidency, there were also hints of change. In drawing a Republican vote across the entire South, Dwight Eisenhower had inevitably increased that vote in more-black areas, the stronghold of the old Southern Democracy. As a result, the old racial disjunction was being reduced. In the same way, these individuals were the explanation for why Republican candidates had long tended to do better among racial liberals than among racial conservatives. The Republican Party of the Civil War had been the party of abolition and then reconstruction. Remarkably, a hundred years later, it still was, at least as reflected in the attitudinal distribution of the vote. This time, however, the presidency did more than hint at change. With the presidency, whites in more-black areas were already more likely to vote Republican for President overall if they were racial conservatives rather than racial liberals, a tendency that would be generalized in the 1960s and would continue ever after. The next three decades were to convert the incipient demographic and attitudinal deviations in this picture into major partisan developments, harbingers of a new Southern politics. As a result, during this long transitional era, policy preferences and racial contexts would tell a very different story from that of the 1950s. Moreover, the impact of these two developments would itself have important further differences. The first aspect of this change, the influence of policy preferences, would be generalized across institutions. But the second aspect, the influence of racial contexts, would be powerfully differentiated as between the presidency, the Senate, and the House. In the simpler of these two changes, racial attitudes came to play a major and consistent role in shaping a Republican vote. Racial conservatives were now Republican, racial liberals Democratic, and this was an evident reversal of the situation in the 1950s. Nevertheless, this change came to characterize all six available theaters: the presidency, the Senate, and the House, in more-black and in less-black areas for each. Note that this represented even more of a change for Congress than for the President, since the presi-
90
the end of southern exceptionalism
dency had shown signs of moving this way in the 1950s whereas Congress had not, and thus the latter had much farther to go. So, the common story involved race policy and public attitudes toward it. By contrast, racial context came to play a distinguishable role for each separate institution. This was the more complex and confounding of the changes that characterized the great transitional period of Southern politics: • For the presidency, whites in blacker areas were now more Republican and whites in whiter areas more Democratic. The effect was small, but it was present among both racial liberals and racial conservatives, and it represented a clear shift from the 1950s. • At the opposite extreme, with the House, whites in blacker areas remained more Democratic, with whites in whiter areas more Republican, again among both liberals and conservatives. This was the strongest relationship to racial context among the three institutions, and it had actually increased from the 1950s. • The Senate, finally, fell in between, priming racial context in the manner of the House but much more weakly.
This second difference probably deserves emphasis. The congressional story for racial context remained in the pattern of the old South. Remarkably, it not only passed unchanged across the civil rights revolution, across a set of social changes that reworked the racial organization of Southern society; it actually increased in the case of the House. Yet the presidency moved in the opposite direction, and if the result was only a modest opposite tilt, it looked larger by comparison to the presidency in the 1950s, larger still by comparison to the House in its own time. The impact of a changed racial composition in the Southern electorate was thus registered with the presidency, but not with Congress. And then this impact too was gone. For the world shifted again in the 1990s, to a simpler pattern, one that again characterized all three institutions. In this modern world, all three institutions for both racial contexts showed the same relationship to racial attitudes that had characterized the transitional period: conservatives voted Republican, liberals Democratic. Not only did this relationship continue, it grew stronger still. Yet now, the previous institutional difference by racial context, a hallmark of the previous three decades, had effectively disappeared. For this most recent decade, Table 3.13 looks a little different, and is in
Legal Desegregation and a Politics of Race
91
one sense slightly less revealing. For there is a cell—whites in blacker areas who are racial liberals—that simply has no one left. Less than 3 percent of the sample is in this cell for the presidency and the Senate, less than 4 percent for the House, and therefore we have deleted it. This means that the summary numbers for the difference between liberals and conservatives or between whites in less-black versus more-black areas are just a single figure with all relevant respondents combined. What remains is simply described. Racial attitudes have a large effect for all three institutions, having continued to grow in a major way, while racial context has sharply declined as an influence. Where racial context distinguished the presidency, the Senate, and especially the House in the three preceding decades, it now features only small and institutionally idiosyncratic differences among the three institutions. Within these, the ability of the House to shed all of its previously inverse relationship to the racial composition of electoral districts is nevertheless striking, and will require further comment in the next chapter. Here, the point is just the collapse of the previous priming effect by racial context. In the end, after all of that, the racial South, like the economic South, was a different place. It was different in the racial organization of social life, merely by virtue of the coming of legal desegregation. But it was different in the organization of its partisan political life too, because legal desegregation brought a reconstituted politics of race. The demographics of race, by way of the racial composition of electoral districts, made its own contribution—actually two different contributions at different points in time—to the structure of a new Southern politics. Public preferences about racial policy, especially about governmental assistance to blacks, made a single, consistent, and massively growing contribution as well. To put it differently, one piece of this new racial politics, the piece contributed by black Southerners, was massively Democratic when it arrived, and moved not at all during the succeeding decades. Yet the larger piece, the one contributed by Southern whites, required careful attention not just to racial identity but also to electoral context, policy preference, time period, and institutional setting. Nevertheless, in the end, there was a composite political world, simply described and still notably influenced by considerations of race, but strikingly different from the one that had lasted for so many generations before the civil rights legislation—and revolution—of the 1960s.
4 § Class, Race, and Partisan Change
b y 19 70, sweeping change was well under way in the political order of the American South. Economic development and an associated politics of class had arrived earlier and were moving inexorably, though also gradually, to change the nature of partisan politics. Legal desegregation and an associated politics of race had arrived later but with a rush, changing the nature of politics almost at a stroke. If scholars had long recognized both possibilities in the abstract, as incipient social forces that would remake Southern politics if they finally appeared, those scholars had no way of knowing when such change would come. Nor, on the basis of historical patterns, did they have any way of knowing what form it would take. Nor did they possess any means of knowing what the impact even of each individual change would look like, much less what the two might look like in combination. Nevertheless, by 1970, both were vigorously present. Both were remaking Southern politics. And the direction of their separate and individual impacts was clear. Seen in isolation, these two grand social developments contributed a Republican accelerator in the form of economic development with its resulting politics of class, along with a more problematic Democratic brake upon this in the form of legal desegregation with its reconstituted politics of race. The latter looked to be stronger in the short run, the former to be stronger in the long term. Yet this comparison still depended to some unknown degree on the independent and additive effect of two social forces, where there was little reason in principle why these two forces should not have interacted as they evolved and much reason in practice to expect that they would. In this chapter, therefore, we return to economic development and legal 92
Class, Race, and Partisan Change
93
desegregation, and consider their joint impacts on partisan politics. At a minimum, this interaction contained the possibility that two great social forces, considered as simultaneous influences on partisan change, would not work in as simple and straightforward a fashion as they appeared to work when considered individually. In statistical terms, the multivariate relationships might look considerably different than two sets of bivariate relationships. One aspect of this reconsideration is thus to guarantee that an analysis built on investigating the two forces independently is not invalidated by a simultaneous investigation. Another, more forward-looking aspect is to fine-tune the resulting picture of comprehensive partisan change. This is not, however, just a matter of revisiting previous analyses in a new format. Chapters 2 and 3 have already channeled this multivariate analysis in important ways: • First, they have affirmed some findings that do not need to be revisited. In the lead example, they have demonstrated that the impact of legal desegregation and a politics of racial identity on the Southern black population was so powerful that it left no effective room for an additional politics of class. In that sense, race and class would not thereafter interact in this particular voting population. • Second, those two chapters have highlighted other findings that now sit at the center of the argument. Race and class most definitely did interact within the Southern white population: this is what made economic development into a long-running partisan escalator and legal desegregation into such a problematic brake upon it. We have done some elementary checks on their interaction; we need to offer more. • Finally, these two chapters have underlined the way in which different political institutions—differing institutional structures—mediated the impact of two great social forces in differing ways. Accordingly, a further check on the influence of a new politics of class and a revised politics of race needs to add political institutions back into the multivariate framework.
If the preceding analysis can indeed be affirmed and elaborated, there is still a major puzzle to be addressed: namely, the way a politics of race worked so differently for Congress than for the presidency. So far, we have highlighted the contours of this institutional puzzle but have left its explanation alone. Yet if this phenomenon—whites in more-black areas voting
94
the end of southern exceptionalism
more Democratic for Congress, more Republican for President—survives a multivariate examination of a changing Southern politics, it is surely time to inquire into both its lengthy reign and its sudden disappearance. When that inquiry is completed, the political attitudes associated with changing social forces—or sometimes impressively dissociated from them—can be put back into this comprehensive picture. The first part of such an analysis requires investigation of the way in which economic and racial ideologies themselves interacted across the postwar years. Only then is it possible to see their joint impact as an important elaboration of the structural changes that have impelled this story so far. When ideological preferences on class and race legislation not only survive their own multivariate analysis but prove to be a growing influence on the politics of the changing South, a new and different, composite political order will finally stand revealed. All of which assumes, however, that an analysis framed in this fashion proves superior to the main alternative way of thinking about the course of partisan change in the postwar South. For the literature of Southern politics does in fact offer a common alternative perspective. This view introduces—and privileges—a further, internal, regional difference, between the Peripheral South and the Deep South, and that difference then serves for many of these authors as the main structural intermediary shaping the course of Southern politics. In an afterword to this chapter, we confront this alternative view directly.
A Politics of Class with a Politics of Race The opening analysis for any simultaneous check upon the isolated impacts of social class and racial context needs, at a minimum, to demonstrate that the independent stories of economic development in Chapter 2 and of legal desegregation in Chapter 3 are not substantially changed when these two great social changes are considered together—considered, that is, in the way they actually occurred. The simplest way to do this is just to shift from bivariate to multivariate analysis, by way of a logistic regression of the Republican vote on both social class and racial context for the five complete decades of the postwar era, converted into a set of probabilities of voting Republican. The resulting pictures also provide a straightforward, data-driven way to summarize the story so far. Figure 4.1 shows the marginal impact of each of these two great influences, economic development and legal desegregation, controlling for the
Class, Race, and Partisan Change
95
other. For social class, the contrast is between the lowest and the highest income terciles, and the value is the difference in the likelihood of a Republican vote for a respondent living in a district with the region-wide average percentage black. For racial context, the marginal effect is calculated for a shift by white Southern voters from a district that is 10 percent black to one that is 30 percent black. Before the 1990s, about 25 percent of white Southerners lived in districts with 10 percent or fewer blacks while about 25 percent lived in districts with 30 percent or more, so this shift is effectively the interquartile range, a highly plausible contrast.1 Because the presence or absence of a Republican candidate was an essential precondition for a Republican vote, Figure 4.1A and B covers only contested seats for the House and Senate, those with both a Republican and a Democratic contender. The presidency always met this standard and thus its electorate is region-wide in both parts of the figure, but because the opening decades of this analysis already featured a serious Republican vote for President, we attempt to get at prior electoral change by breaking the presidential vote into old and new Republican areas—those which had Republican congressional contenders in 1952 versus those which did not— until this difference no longer has an empirical effect. In the case of social class, the individual stories that result should by now be very familiar. That is, the same stories surface from this collective multivariate analysis as surfaced in the individual bivariate tables (Figure 4.1A). Dividing the presidential vote into old and new Republican areas for the immediate postwar years creates three and a half such institutional lines of partisan change. Their initial differences, their common resolution, and their differing paths to it all deserve comment. With the House of Representatives, the relationship of Republican support to family income was modestly negative in the 1950s. That is, moving from the bottom to the top tercile actually reduced the probability of voting Republican by about 10 percent. The poor were modestly more Republican, the rich more Democratic. This relationship then shifted sharply in the opposite (the positive) direction, underpinning the changing fortunes of Southern Republicans in the House; this was the relationship that would resurface in every decade thereafter. In the 1960s, moving from the bottom to the top tercile increased the chance of a Republican vote by about 15 percent. The rich were now more Republican, the poor more Democratic. This class gap increased by a couple of points in the 1980s and by a further five or so in the 1990s, underpinning a final surge to majority status.
96
the end of southern exceptionalism
A. The Impact of Economic Development among White Southerners
Impact on Republican Vote
0.3 0.2 0.1 0.0 −0.1 New Presidency Old Presidency Senate House
−0.2 −0.3 1950s
1960s
1970s
1980s
1990s
Decade
B. The Impact of Legal Desegregation among White Southerners
Impact on Republican Vote
0.3
New Presidency Old Presidency Senate House
0.2 0.1 0.0 −0.1 −0.2 −0.3 1950s
1960s
1970s
1980s
1990s
Decade
Figure 4.1
Social Class, Racial Context, and Partisan Change: 1950–2000.
The Senate version of the story was delayed by a decade and was a bit more modest when it came. Otherwise, it was the same story.2 In the 1950s and into the 1960s, there was little or no linkage between income tercile and Republican vote. By the late 1960s and into the 1970s, the modern—in some sense, the “Northern” or national—pattern had arrived.
Class, Race, and Partisan Change
97
Now, that same move from bottom to top tercile was worth approximately a 10 percent Republican edge. This relationship then jumped up again in the 1990s, effectively doubling its impact at the point when the Senate and not just the House achieved a Republican majority in the South as a whole. As with the House and the presidency, moving from the bottom to the top tercile now increased the prospect of a Republican vote for the Senate by about 20 percent. When the presidential vote is parsed into established versus new Republican areas for the 1950s, older Republican areas also showed a negative relationship to social class. That is, moving from the bottom to the top income tercile again reduced the likelihood of a Republican vote, by about 10 percent. This relationship, like that for the House, then moved sharply in the opposite (and positive) direction in the 1960s, while almost closing the gap with new Republican areas at the same time, at better than 15 percent. By the 1970s, the gap was closed. This new/old distinction was no longer consequential, and the class relationship to a Republican presidential vote continued thereafter in a unitary fashion, with about a 20 percent increase in the probability of a Republican vote as one moved up the class scale. Newly Republican areas, by contrast, showed the strongest positive relationship of family income to Republican support for President at the start of this period. When this vote appeared, it featured a substantial increase in the probability of voting Republican as one moved from the bottom to the top tercile. These were, of course, the areas where the breakthrough that became a continuing class reversion first occurred, and that breakthrough proved to be strong, stable, and stereotypic: the rich were Republican, the poor Democratic, not the other way around. Moreover, having achieved this modern relationship pretty much from the start, these newly Republican areas more or less just sustained themselves thereafter on that (high) level of class alignment. Moving from the bottom to the top tercile increased the probability of a Republican vote by a full 20 percent, from the 1950s through the 1990s. One further difference and one other similarity are inherent in these coefficients. The difference is in the timing of the effect: presidency first, House second, Senate last—not presidency, Senate, House, as an undifferentiated institutional argument might suggest. As in the bivariate analysis, the Senate in the multivariate analysis lagged a bit in its response to changing social conditions. Yet the similarity, more consequential as time passed and these lines moved forward, involves their apparent convergence never-
98
the end of southern exceptionalism
theless. By the 1960s, the presidency and the House had converged on the modern pattern. By the 1970s, despite its lag, the Senate had joined them. “Northern” class politics appeared to have come to the South. In the case of racial context, all three individual stories—and this time, really only three, since old and new Republican areas always behaved in parallel fashion—should likewise seem familiar (Figure 4.1B). Yet here, the story of similarities and differences across institutions is more varied. That is to say: institutional structures contributed their own mediating influences to the impact of racial politics, producing differences that were not a simple matter of lag and arrival. If all three institutions ended up in the same general place, they neither started together nor traveled together on their way there. In the case of the House, a strong negative relationship between racial context and Republican support characterized the opening years of the postwar era: whites in blacker areas were more likely to support Democratic candidates. Moving from an electoral context that was 10 percent black to one that was 30 percent black actually reduced the prospect of a Republican vote by about 20 percent. Remarkably, given the upheaval in the racial organization of Southern society, this relationship was unshaken by the civil rights revolution. It remained stable, showing only minor fluctuations through the 1970s. It actually gained strength in the 1980s, opening an expected gap of more than 25 percent. Only in the 1990s did it finally decline, essentially to zero. The counterpart story for the Senate began in the same manner, with blacker areas more likely to provide white support for Southern Democrats and to resist emergent Southern Republicans. Indeed, it began with about the same 20-point gap. But as new black Democrats flooded into the electorate, this white relationship to racial context began a long, slow decline. It was still closer to the House than to the presidency in the 1960s, though it had already shed about half its original contribution to the partisan vote. It remained marginally closer to the House in the 1970s, while shedding half of its remaining vote impact. It became nearly zero in the 1980s. And it stayed there in the 1990s, as both the presidency and, especially, the House converged on it. The presidency offered yet a third trajectory. Presidential contests also began the postwar years with a negative relationship between Republican vote and racial context: whites in blacker areas were more likely to vote Democratic, whites in whiter areas to vote Republican. Both old and new Republican areas for the presidency showed this effect less strongly than
Class, Race, and Partisan Change
99
for the two houses of Congress, but there was still about a 10 percent reduction in Republican prospects by moving from whiter to blacker areas, and all “four” institutional arenas were in negative territory. Yet with racial context—and very much unlike the situation with social class—there was no real need thereafter to differentiate newly Republican from established Republican areas. Instead, the point is that the overall relationship moved clearly in the opposite direction in the 1960s: whites in blacker areas were now more attracted to Republican candidates. If this effect was still quite modest— moving from a 10-percent black to a 30-percent black district increased the prospect of a Republican vote by about 5 percent—it was also sharply different from the same effect for the House or the Senate, which decreased Republican prospects by 20 and 10 percent respectively. With the presidency, this new if modest relationship then strengthened a bit in the 1970s, moving to about 10 percent, before weakening in the 1980s and again in the 1990s, when it had effectively converged with the Senate and the House. Once more, all three institutions began in the realm of an old Southern politics, with whites in blacker areas more reliably Democratic. But thereafter, the 1960s produced an institutional divergence: the same social forces were obviously mediated very differently by three different institutions. As a result, • the House continued the old pattern for racial context, while simultaneously reversing its prior class allegiances; • the Senate began an extended decline toward electoral irrelevance for racial context, while picking up the modern pattern on class only after an initial lag; • and the presidency moved opposite to the House for one great social impact, reversing the influence of racial context, while leading the way on the other, strengthening the new—and also newly reversed—influence of social class.
Seen from above, Congress and the presidency actually primed the impact of racial context on white Southerners in opposite directions. Seen from below, white Southerners chose to respond both to economic development and to legal desegregation in their voting for President, but only to economic development (and its changing class politics) in their voting for Congress. Seen either way, this relationship lasted from the 1960s through
100
the end of southern exceptionalism
the 1980s, by which time it possessed a neat—a nearly symmetric—institutional array in terms of racial context: presidency positive, House negative, Senate neutral and in between. All three institutions then moved toward contextual neutrality in the 1990s, finally producing convergence on race and not just class.
Class, Race, and Institutional Structure Thus it appears that a focus on the interaction of economic development and legal desegregation, that is, on the interaction of a politics of social class and a politics of racial context, is sufficient to tell the postwar story of partisan change in the American South. A few relationships from the preceding bivariate analyses look modestly different at particular points in time when examined in a multivariate framework, but none such that the overall argument would shift. On the other hand, what emerges even more clearly—what derives further emphasis from the multivariate approach—is the mediating effect of differing institutional structures. And here, there is another way to tell this institutional story, one that is additionally helpful in highlighting the place of institutional intermediaries in shaping the partisan impact of social change. This further approach involves graphing income terciles and racial contexts simultaneously onto the Republican vote, for each of these three institutions individually (Figures 4.2 through 4.5). Each separate plot is derived from a logistic regression of the Republican vote among Southern whites on income tercile and racial context. In each, the vertical distance under the line, either the upper-income or the lower-income line, is a measure of Republican success: the distance between these lines is then a measure of the impact of social class on the vote. The slope of these lines is a measure of the impact of racial context: the steeper the slope, the stronger the relationship. Plots are confined to the effectively relevant range, which is 0 percent to 50 percent black. Before the 1990s, almost no districts were majority black; in the redistricting of the 1990s, very few whites were left in majority-black areas. With the initial exception of the 1950s, the resulting relationships are essentially linear throughout, notwithstanding the logistic estimation. Given the presence of this linearity, considering the problems of multicollinearity that come with interaction terms, and given our desire for clarity of presentation, we suppress interactions between income and racial context in the figures that follow, with that initial exception of Figure 4.2.
0.0
0.2
0.4
0.6
0.8
0.0
0.1
0.3
Proportion Black
0.2
High Income Low Income
0.4
0.5
Probability of Republican Vote 0.0
0.2
0.4
0.6
0.8
0.0 0.1 0.3
Proportion Black
0.2
High Income Low Income
B. Senate
Figure 4.2 Social Class, Racial Context, and the Southern Republican Vote: The 1950s.
Probability of Republican Vote
A. Presidency
0.4
0.5
Probability of Republican Vote 0.0
0.2
0.4
0.6
0.8
0.0
0.1
0.3 Proportion Black
0.2
High Income Low Income
C. House
0.4
0.5
102
the end of southern exceptionalism
Otherwise, any non-parallelism between lines is strictly the result of the logistic setup. Relationships that are estimated using logistical regression are then converted to graphical form, to show the probability of a Republican vote depending on income level and racial context simultaneously.3 With the first set of these relationships, for the 1950s, the grand and gross contours of the presidency, the Senate, and the House are not dissimilar, though there are still details worth highlighting (Figure 4.2). Overall, the Republicans had begun to enjoy some success with the presidency— both the lower-income and the upper-income lines are higher in the presidential than in the congressional graphs—though no one could have been sure at the time whether this was a harbinger of anything. Beyond that, three effects stand out. First, the class inversion characterizing the old South is still visible for all three institutions, though it was fast disappearing for the presidency. For the Senate and the House, the bulk of the area between the upper-income and lower-income lines is on the left-hand side of the plot and thus featured lower-income Southerners voting more Republican. By contrast, the larger area between these lines for the presidency is already on the right-hand side of the plot, so that it featured upper-income Southerners voting more Republican instead. Second, upper-income Southerners clearly had begun, with the presidency, that migration toward the Republicans which would underpin the general class reversal of the 1960s, and which would reach the House so strikingly at the beginning of that decade. The upper-income line, while much closer to flat for all three institutions and thus essentially less responsive to racial context, is found considerably higher on the plot for the presidency than for the Senate or the House, delivering a half rather than a fifth of its total vote to the Republican candidate. This upper-income “migration,” along with a lower-income resistance, would be the class story of postwar Southern politics for a very long time. Finally, while it might appear that it is lower-income voters who were distinctively responsive to racial context in their balloting, showing a steeper slope to their line of Republican support, this probably just reflects the lingering contours of the old South. Or at least, this shows that its poorest areas—the Appalachian mountains of Virginia, Tennessee, and North Carolina—were also its whitest areas, where Republicanism had sustained its hold over all the years after Reconstruction, and that pattern still shows clearly for all three institutions in the 1950s. Lower-income
Class, Race, and Partisan Change
103
whites remained distinctly more Republican in these less-black areas. If upper-income whites showed a more modest version of the same effect with Congress, their overwhelmingly Democratic support left little room for more. The main plot of the postwar story then considers these three institutions during the extended transitional years from 1962 through 1990 (Figure 4.3). Obviously, a comprehensive reversal in class support for Republican voting had arrived. We know from Chapter 2 that it appeared during the 1960s. Yet an institutionally differentiated impact of racial context had also arrived, at the same time. We know from Chapter 3 that this differentiation then lasted through the 1980s. Accordingly, Figure 4.3 depicts the central summary picture of postwar Southern politics in operational terms. The ability of changing social forces to break through earlier in the case of the presidency, producing an augmented Republican vote, is evident in this figure. That is, both the upper-income and the lower-income lines are considerably higher on the presidential plot than they are on the Senatorial or House plots. (We shall return to some of the contributing intermediary reasons for this difference in Chapter 5.) Republicanism had already arrived dramatically with the presidency in the 1950s. When it arrived for the House in the early 1960s and for the Senate in the late 1960s, the presidency still led them, as it would for a further twenty years. Nevertheless, the three decades following this basic class reversal do show it characterizing all three institutions. That is, higher-income voters were more likely to vote Republican, for all three major elective institutions and across every level of racial context. The distance between the high-income and low-income lines then represents the strength of this effect, which was clearly weakest in the Senate and strongest in the presidency, with the House falling in between. On the one hand, social class had already become a major driver for voting behavior with regard to all three institutions, and in the modern—the “Northern”—way. On the other, it was still upper-income voters who showed the greatest variation across these institutions—and who thus contributed the bulk of the institutional difference by class. The more striking differences among these three great elective institutions then concern the role of racial context. Recall that the main effect of racial context is captured in the degree of slope to the class lines—steeper slopes being a stronger relationship—along with their direction. Racial context lines slope clearly upward for the presidency, strongly downward
0.0
0.1
0.3
Proportion Black
0.2
High Income Low Income
0.4
0.5
Probability of Republican Vote
Probability of Republican Vote
0.0
0.2
0.4
0.6
0.8
0.0 0.1 0.3
Proportion Black
0.2
High Income Low Income
B. Senate
0.4
0.5
Figure 4.3 Social Class, Racial Context, and the Southern Republican Vote: The 1960s through the 1980s.
0.0
0.2
0.4
0.6
0.8
A. Presidency
Probability of Republican Vote 0.0
0.2
0.4
0.6
0.8
0.0
0.1
0.3 Proportion Black
0.2
High Income Low Income
C. House
0.4
0.5
Class, Race, and Partisan Change
105
for the House, with the Senate tagging along. In other words, in the 1960s and for two subsequent decades, this main effect was actually opposite for the presidency and Congress. With the presidency, white voters in blacker districts leaned Republican; with the Senate, they leaned Democratic; and with the House, the “lean” became a “plunge.” One specific comparison with the 1950s brings all this into even sharper focus (Figure 4.4). As we know, the class reversal that characterized all three institutions from the 1960s through the 1980s was already in place among those newly Republican areas that represented the Eisenhower breakthrough for the presidency. In the bivariate format, this is just a tale of institutional lag, with Congress needing another decade “to get there.” Yet when we switch to the multivariate format, two other points become equally and immediately striking. The first is a further aspect of temporal sequence: the class breakthrough is utterly unaccompanied by a race breakthrough. Economic development precedes legal desegregation in shaping partisan change in the postwar South. Consideration of the bivariate tables in Chapters 2 and 3 has already indicated as much; multivariate consideration of the same material confirms it. From above, the party system for the country as a whole had already aligned the two parties in this fashion on welfare policy outside the South; it would be another decade before it realigned them on racial policy. From below, this welfare alignment was apparently recognized and accepted by Southern voters who were coming afresh to the Republican
Probability of Republican Vote
0.8
High Income Low Income
0.6
0.4
0.2
0.0 0.0
0.1
0.2
0.3
0.4
0.5
Proportion Black
Figure 4.4 Social Class, Racial Context, and the Southern Republican Vote: New GOP Areas for the Presidency in the 1950s.
Probability of Republican Vote
0.0
Figure 4.5
0.0
0.2
0.4
0.6
0.8
0.3
Proportion Black
0.2
0.4
0.5
Probability of Republican Vote 0.0
0.2
0.4
0.6
0.8
0.0 0.1 0.3
Proportion Black
0.2
0.4
0.5
High Income Low Income
B. Senate
Social Class, Racial Context, and the Southern Republican Vote: The 1990s.
0.1
High Income Low Income
A. Presidency
Probability of Republican Vote 0.0
0.2
0.4
0.6
0.8
0.0
0.1
0.3 Proportion Black
0.2
0.4
0.5
High Income Low Income
C. House
Class, Race, and Partisan Change
107
Party, while the subsequent racial alignment was neither anticipated nor demanded by them, even implicitly. In other words, both the party system nationally and social change within the region were eliciting partisan change on grounds of social welfare. Neither the party system nor social change was yet doing that with civil rights. The second point is then an additional aspect of institutional difference in the impact of racial change when it did arrive. Uniquely among the institutions of national government, the presidency would undergo two major changes in succeeding decades: it would shift into a new class alignment in the 1950s, and it would shift again into a new racial alignment in the 1960s. Congress would follow quickly with the first of these changed alignments but not the second. To appreciate the distinction pictorially, note that newly Republican presidential areas from the 1950s (Figure 4.4), when considered for the joint impact of social class and racial context, look very much like the House picture for the next thirty years (Figure 4.3C). Indeed, as we shall see below, it was arguable that Congress would never adopt the presidential pattern on race. Differential alignments for the presidency versus Congress on grounds of racial context were finally to decline in the 1990s, underpinned by the deliberate re-engineering of House districts. Viewed from the presidential side, this was the House being drawn suddenly and sharply toward voting patterns that had long characterized the presidency. Viewed from the House side, however, the important point is that this was convergence on effective neutrality. The sharp disjunction in the impact of racial context between President and House would finally disappear in the 1990s, but if the main movement in this convergence occurred with voting patterns for the House rather than the presidency, the convergence point was still effectively zero. This further change in the impact of racial context, the second greatest change in the postwar period, arrived in the 1990s. Visually, the change looks like one more incarnation of the metaphorical “dog that did not bark.” Plots of a logistic regression of the Republican vote for the presidency, the Senate, and the House are now close to interchangeable. Class gaps are nearly identical. Racial slopes are not very different. Major institutional differences are thus not much in evidence (Figure 4.5). Yet by comparison with the previous thirty years, this uniformity represented a very substantial change. One part of this change was aggregate. Republicans were now fully competitive in Congress. That is to say, the presidency no longer offered a superior Republican performance overall. Moreover, underneath these ag-
108
the end of southern exceptionalism
gregates, there was an increasingly uniform class effect. Both lower-income and upper-income lines were now impressively similar, so that residual differences should probably be treated more for their collective distinction from the preceding thirty years than for any marginal differences among the three institutions. In other words, the impact of social class had become much more consistent across all three institutions, and nothing in the aggregate level of Republican support required such an outcome. Class differences were now present everywhere, and strongly so. More impressively still, the main visual difference among the three institutions across most of the postwar years, courtesy of the priming effect of racial context, had almost entirely disappeared. By the 1990s, the previously sharp—indeed, previously opposite—distinction between the presidency and the two houses of Congress was gone. The impressive ability of individual institutions to prime a major social force in different directions obviously disappeared with it. If the increasing uniformity of a class effect represented a real change worth noting, uniformity in the impact of racial context required a far greater shift for its realization. Nevertheless, not the slightest trace of the old, institutionally differentiated world remained. This change in the priming effect of racial context appeared to represent a convergence from both directions. With the presidency, there was a continuing decline in the positive impact of racial context: whites in blacker areas were now only modestly more likely to vote Republican (though as we shall see in Chapter 5, the permanence of this shift may still depend upon the specifics of presidential politicking). With the Senate, there was only extrapolation of a gradual drift toward neutrality. But with the House, there was something much larger: an abrupt reversal of the negative priming effect of racial context. For thirty years, whites in blacker areas had voted more Democratic; in the 1990s, they voted modestly more Republican instead. In so doing, they changed a crucial contour of politics in the new South.
Congress and the Presidency as Institutional Theaters What these composite multivariate pictures of Southern politics leave behind, after confirming the portraits sketched by the individual bivariate analyses in Chapters 2 and 3, are two questions. Why did the politics of race come to play out so differently, as between Congress and the presidency, from the 1960s onward? And why did this politics change again in the 1990s, effectively erasing that difference? At a minimum, any adequate
Class, Race, and Partisan Change
109
answer requires two elements: a truly major change in the structure of politics, one anchored in those critical decades, along with an evident and powerful link between racial politicking and this change. For the first of these impacts, the change into a differing racial politics for Congress versus the presidency, the leading candidate is obvious, and the puzzle is only why its reach did not extend farther. For the second, the change back to institutional uniformity in the role of racial context, the leading candidate is likewise easy to see, but its links to an altered politics of race are not so immediately self-evident. Before addressing either, however, it is worth emphasizing just how different the impact of racial context was in the crucial reshaping period from the 1960s through the 1980s, by contrast with the decade that preceded this period as well as with the decade that followed. Table 4.1 combines two previous tables (Tables 3.5A and 3.7) to highlight the distinctiveness of this crucial thirty-year period. Those tables featured the margin in the vote by white Southerners for Republican candidates for the House and the presidency from districts that were more than 20 percent black versus less than 20 percent black. Note that (a) any difference between these two institutional margins was essentially nonexistent in the 1950s; (b) this difference ballooned to an average of more than 25 percent of the entire white Southern electorate from the 1960s through the 1980s; and (c) the difference then collapsed—it returned to being essentially nonexistent—in the 1990s. Black racial politics, as we have seen, showed no such differentiation.
Table 4.1
Presidency versus House? Racial Context Difference in Republican Vote among White Southerners between Less-Black (20%) Districts Decade
House
President
Difference
1950s (N) 1960s (N) 1970s (N) 1980s (N) 1990s (N)
−6 (216) −17 (378) −12 (656) −31 (621) +6 (926)
-5 (366) +8 (353) +8 (765) +4 (533) +2 (935)
−1 +25 +20 +35 −4
110
the end of southern exceptionalism
Black Southerners voted Democratic, institution by institution and year after year. But white racial politics most certainly did show this distinction (Table 4.1). White Southerners in blacker areas voted more Democratic both for Congress and for President in the 1950s. White Southerners in blacker areas voted more Democratic for Congress and more Republican for President from the 1960s through the 1980s. And white Southerners in blacker areas voted more Republican both for Congress and for President in the 1990s. It is hard to miss a relevant stimulus event for the first of these changes, the reversal of presidential voting patterns by racial context in the 1960s. This was the decade of the civil rights revolution. Moreover, its impact was inescapably greater, for white as well as black Southerners, in those districts where black Southerners disproportionately lived. Black Southerners responded to this event by entering the electorate, in a flood, as Democrats. Clearly, they drew no institutional distinctions between the presidency and Congress in their newly practical partisanship. Just as clearly, white voters made one institutional change in their voting patterns in response to a sharply changed racial context—one institutional change, but not two. Before the fact, it would not have been obvious that this white response would be differentiated by institution. Yet if white Southern voters were to pick one institution on which to focus their protests about enforced change in the racial structuring of Southern society, it certainly made substantive sense for that institution to be the presidency. President Lyndon Johnson, after all, had been the driving institutional actor behind the Civil Rights Act of 1964 and the Voting Rights Act of 1965. If opposition to those changes was to be the propelling force behind one change in the impact of racial context, then that change ought to surface among white voters in more-black areas with regard to the presidency—which in fact it did. On the other hand, viewed retrospectively, what was equally noteworthy was the fact that this change reached the presidency but did not reach Congress, thus insulating the House to a remarkable degree. We believe that the same factor that ultimately led to the disappearance of this difference in the 1990s is sufficient to explain its advent in the 1960s as well: action by Democratic congressional candidates from the 1960s onward to prevent a parallel shift to that in the presidency, and their inability to sustain such action in the 1990s as a result of demographic redistricting. But before presenting the main evidence for that conclusion, it is important to
Class, Race, and Partisan Change
111
acknowledge the most obvious alternative possibility, perhaps the leading candidate to explain both the appearance and the disappearance of this institutional difference in the impact of a changed racial context. This other possibility is the mediating effect of incumbency. There were, after all, long-lived incumbents in Congress—and many of them—who managed to survive across this presidential shift in the impact of racial context, and to live well into the new era. By contrast, there were only short-lived incumbents (or none) in the presidency. Perhaps social forces were always taking all three institutions in the same—the presidential—direction? Perhaps it was just that resilient incumbents could stave off these forces for an incredible length of time, especially in the House? In the immediate postwar years, incumbent Southern Democrats did manifest a remarkable personal and institutional longevity (see Chapter 5). Was that all that needed to be understood? The simplest way to check on this possibility is to examine the impact of racial context for the 1960s–1980s and for the 1990s among those districts that did and did not have established incumbents running for re-election. Table 4.2 does this, and the result is that incumbency proves not to be the explanation. Familiar incumbency effects are certainly present during all these years. Indeed, every comparison—Republican vote totals for the period of the 1960s–1980s versus the decade of the 1990s, Republican vote totals in less-black districts for the period of the 1960s–1980s versus the decade of the 1990s, and Republican vote totals in more-black districts for Table 4.2
Open Seats, Incumbent Seats, and Racial Context: The House Decade
20% Black
A. Republican Vote in Open Seats 1960s-1980s (N) 1990s (N)
54 (158) 53 (109)
41 (61) 55 (42)
B. Republican Vote in Democratic Incumbent Seats 1960s-1980s (N) 1990s (N)
30 (386) 37 (350)
20 (525) 40 (63)
112
the end of southern exceptionalism
the period of the 1960s–1980s versus the decade of the 1990s—shows Republican candidates doing better in open rather than incumbent seats, as any analyst would expect (Hinckley 1981; Mayhew 1974). Yet for the comparison that is central to this analysis, the fate of Republican candidates in more-black congressional districts in the two periods, incumbency is not an explanation. Republicans lagged in more-black districts in the first thirty years of the comparison for both incumbent and open seats. And Republicans caught up in more-black districts in the final decade of the comparison for both incumbent and open seats. For open seats, Republican candidates in more-black districts went from a lag of 13 percentage points to an edge of 2 between the 1960s–1980s and the 1990s. For incumbent seats, Republican candidates in more-black districts went from a lag of 10 points to an edge of 3 between the 1960s–1980s and the 1990s. The change was, in short, effectively the same. By the same token, incumbency had a roughly equivalent repressing effect on the Republican vote in every cell of the comparison, between open versus incumbent seats. Yet incumbency had no differential impact—really none at all—in the more-black districts where the key change occurred. Incumbency had been massively insufficient to sustain an old class pattern in the Southern congressional vote at the time of the great reversal of that pattern, from the 1950s to the 1960s. Incumbency was totally insufficient to sustain a new race pattern in the Southern congressional vote at the time of the great reversal of this pattern, from the 1980s to the 1990s. As a result, the answer has to lie in some further characteristic(s) of the institutions themselves, almost surely in a characteristic directly affecting their politics. And it has to lie, by definition, in some characteristic affecting racial context, for that is the relationship that actually changed. In other words, what is necessary is some key structural characteristic that was essentially stable from the 1960s through the 1980s, and then changed radically in the 1990s. What is then additionally necessary, if such an influence can be found, is some mediating implication from racial context which would lead to this particular shift—that is, to the continuation of a previous relationship between Republican vote and racial context for thirty years, and then to its annihilation. The one obvious candidate for this role, a candidate possessing both necessary characteristics, is racial balance within congressional districts. Moreover, it offers a triggering event to cause the role of this balance to change: the widespread creation of so-called “majority-minority districts” after the 1990 census. The 1990s were indeed the decade when deliberate
Class, Race, and Partisan Change
113
reconstruction of Southern House districts on racial grounds came into being (Lublin 1997; Cunningham 2001). And the scope of the change they produced was dramatic: there were three majority-black congressional districts after the 1980 census, seventeen after its 1990 counterpart.4 The scope of that change was also temporally focused. That is, the 1990 census, as channeled by the Department of Justice, triggered the change in a single coordinated action. Moreover, the change occurred while the black percentage of the South as a whole was essentially stable. The question, then, really boils down to whether there was some further, triggering, racial impact on political calculations that could have linked the priming effect of racial context to the Republican vote. To us, the answer appears to be yes: if Southern congressional districts are further subdivided by racial context, a pattern does emerge. Three different types of district tell the story: 1. Districts that were less than 20 percent black. Many such districts were, of course, much less than 20 percent black—which is to say, much more than 80 percent white—but that figure will do for a division. These were districts where politics was a matter of striving for a majority of the white electorate. For Democratic candidates, black voters were undeniably valuable. Yet it was the fate of these candidates within the white electorate that mattered. Put differently, if efforts to augment black turnout raised any prospect that these efforts would alienate white voters, that was a bad trade-off. 2. Districts that were more than 40 percent black. At the other extreme in terms of racial balance, these districts were remarkably similar in strategic calculation: that is, they possessed the same strategic logic as those districts that were overwhelmingly white. For Democratic candidates, the key consideration was becoming the preference of black Democrats, and then turning out their vote. Any appeal to white voters that either lessened this preference or lowered that potential turnout was particularly disastrous, but all such appeals—assuming a preference among black voters—were effectively unnecessary. 3. Districts that were between 20 percent and 40 percent black. These were, in effect, the districts whose apportionment required a biracial strategy, at least for Democrats. There was little evidence that a biracial strategy would do much for Republicans, since blacks in these districts continued to vote about 90 percent Democratic. Differences by social class did not provide a Republican opening; differ-
114
the end of southern exceptionalism
ences by racial context did not provide a Republican opening; differences by policy preference did not provide a Republican opening. Yet for a Democratic candidate, successful strategies required the twin necessities of a high black turnout and a substantial minority of the white vote. These districts, accordingly, contributed the true biracial strategic context.
Within that framework, what happened to the distribution of these three types of districts for the entire South after the reapportionment of the 1990s was abundantly clear: • In the 1980s, most white Southerners already lived in the first category of districts, those that were more than 80 percent white. Yet this percentage managed to move up strongly in the 1990s (Table 4.3). In the 1980s, only a quarter of Southern blacks lived in these mostly-white districts. Yet that percentage too actually went up, as indirect fallout from the creation of majority-minority districts. • By contrast, in the 1980s, very few white Southerners lived in the (three out of one hundred twenty-three) districts that were more than 40 percent black. But then, with only three such districts, very few black Southerners lived in these districts either. In the 1990s, very few white Southerners still lived in districts that were more than 40 percent black. But now, after race-based reapportionment, 37 percent of all black Southerners actually did. • And the result for the middle category of congressional districts, those that were more than 20 but less than 40 percent black, followed ineluctably. In the 1980s, 35 percent of all white Southerners
Table 4.3
The End of Biracial Coalitions?
Racial Composition of Congressional Districts, 1980s versus 1990s (in percentages) White Southerners % Black 40 [N]
1980s
1990s
62 35 3
80 16 5
[2348]
[2375]
Black Southerners 1980s
1990s
25 72 3
32 31 37
[685]
[617]
All Southerners 1980s
1990s
54 44 3
70 19 11
[3033]
[2992]
Class, Race, and Partisan Change
115
had lived in such districts. In the 1990s, this figure was more than halved, to 16 percent. Likewise, in the 1980s, a full 72 percent of all black Southerners had lived in such districts. In the 1990s, this too was more than halved, to 31 percent. These were the districts that required a biracial electoral strategy. Within one iteration of the census, they were devastated.
Democratic candidates who refused to make the strategic adjustments required by a sharply revised racial composition were, at the very least, going to be additionally handicapped. In other words, sensible candidates should have been abandoning a biracial strategy, while candidates who would not or could not abandon this strategy ought to have been at increased risk. We have no individual-level data about feelings toward this specific arrangement. Yet in a careful deconstruction of the new districts, Petrocik and Desposato conclude that “the pro-GOP tide of the nineties followed a redistricting that left many Democratic incumbents with districts in which 40 percent or more of the constituents were new to the incumbent and ‘unimmunized’ by incumbency” (Petrocik and Desposato 1998, 619). One implication of population shifts on that scale is that our statistics for the 1990s, comparing open versus incumbent seats in the U.S. House, surely overstate the effect of incumbency by comparison to previous decades. In the 1980s, an incumbent would still have been expected to be standing for re-election in a district roughly equivalent to the one that incumbent had previously held. In the 1990s, an “incumbent” could have been standing for re-election in districts that were 40 percent new. It should not be surprising, then, that the largest change from the period of the 1960s–1980s to the decade of the 1990s in our individual-level data (in Table 4.2) was precisely among white voters in incumbent seats in moreblack districts: in these districts, the Republican vote literally doubled. Regardless, the total impact seemed easily sufficient to erase a longstanding relationship between racial context and voting for Congress in the South. Since the previously opposite relationship had been gradually decaying for the presidency, the combination seemed easily sufficient to bring the two institutions, finally, into alignment on the impact of racial context. The key piece of institutional engineering behind this convergence was accomplished by way of the 1990 census. Yet its full impact can perhaps best be appreciated by putting that story back into the total sweep of postwar Southern politics (Figure 4.6).
116
the end of southern exceptionalism
The world of the 1950s had actually clustered its congressional districts in the key 20–40 percent range. If black Southerners were ever enfranchised, this was the area that would have to develop some biracial electoral strategy in order to sustain the Southern Democracy. For thirty years after enfranchisement, it did. Conscious reapportionment in the 1990s then pushed both black and white Southerners out to the extremes. In this modern world, a biracial electoral strategy no longer made much sense: there was no longer a serious social base for it. And the difference between the presidency and Congress in terms of the impact of racial context finally disappeared.
Policy Conflicts as Partisan Engine Two questions are left hanging, after all of that. Both involve the policy conflicts accompanying a changing social structure as it shaped a shifting Southern politics. Each follows from earlier investigations of welfare policy (Chapter 2) and race policy (Chapter 3), in their relationship to social class and racial context. And both, inevitably, parallel the earlier questions in this chapter about the interaction of class, race, and political institutions: • To what extent does the interaction of policy preferences on social welfare and aid to blacks work differently than each policy attitude
0.4 1950s Proportion of all Districts
1990s 0.3
0.2
0.1
0.0 0–10
10–20
20–30
30–40
40–50
Percent Black in District
Figure 4.6
The End of Biracial Politics?
50–60
60–70
Class, Race, and Partisan Change
117
appeared to work when analyzed on its own, in their joint relationship to a partisan vote? • And have the reversal of old class alignments, the institutional differentiation of new racial alignments, and then the disappearance of that differentiation brought additional changes to this joint policy relationship?
The pursuit of an answer to these questions, that is, the pursuit of a multivariate analysis of what were previously two sets of bivariate analyses, cannot proceed quite as neatly in the case of policy attitudes as it could in the case of social structures. The latter could be addressed by means of logistic regressions converted into probability plots, in Figures 4.2, 4.3, and 4.5, where the two key variables, income tercile and racial context, retained the same response categories across the entire fifty-year period. The same formal setup is available for Figures 4.7, 4.8, and 4.9, but here the underlying attitude measures vary in the available response categories: three in the 1950s, five in the 1960s, seven thereafter. We believe that this variation has minimal impact on the substance of the resulting regressions, even though it was not possible to have complete uniformity in the underlying variables. The relevant interpretive logic is nevertheless identical. The distance between the liberal and conservative lines is a measure of the contribution of economic attitudes to the vote; the slope of these lines is a measure of the contribution of racial attitudes. Moreover, Figures 4.7 through 4.9 manage to summarize this story for all three nationally elective institutions in two ways: they show the evolution of joint policy impacts within each separate institution, and they permit an examination of these policy impacts across institutions for each succeeding period. Both stories are consequential. Figure 4.7 begins with the presidency. For the 1950s, bivariate analyses had suggested a clear relationship between opinion on social welfare and presidential voting: liberals more Democratic, conservatives more Republican (see Table 2.5). And bivariate analyses had suggested a weak counterpart relationship between opinion on aid to blacks and presidential voting, again with liberals Democratic and conservatives Republican (see Table 3.9C). When the two attitudes are put back together and considered jointly, however, this picture does change (Figure 4.7A). For the 1950s, welfare attitudes still differentiated the parties, regardless of racial preferences. Yet once welfare attitudes were in the picture, racial attitudes made effectively no contribution to differentiating Republican from Democratic presidential voters.
Probability of Republican Vote
Figure 4.7
Aid to Blacks
Oppose
Job Guarantees: Oppose Job Guarantees: Favor
Probability of Republican Vote Favor
0.0
0.2
0.4
0.6
0.8
Aid to Blacks
Oppose
Job Guarantees: Oppose Job Guarantees: Favor
B. 1962–1990
Economic Attitudes, Racial Attitudes, and the Southern Republican Vote: The Presidency.
Favor
0.0
0.2
0.4
0.6
0.8
A. 1952–1960
Probability of Republican Vote 0.0
0.2
0.4
0.6
0.8
Favor Aid to Blacks
Oppose
Job Guarantees: Oppose Job Guarantees: Favor
C. 1992–2000
Class, Race, and Partisan Change
119
In other words, welfare conservatives were already more likely to vote Republican for President than were welfare liberals, but aid to blacks was not yet on the policy dial for this presidential voting public. During the middle period of the postwar era, the 1960s through the 1980s, when a new Southern politics was being born, this relationship between policy preferences and presidential voting shifted (Figure 4.7B). Welfare attitudes expanded in their impact on the Republican vote, with liberals clearly Democratic and conservatives clearly Republican. And racial attitudes began to acquire a partisan attachment in the new—the modern—direction, with conservatives leaning Republican and liberals leaning Democratic, though this remained modest. Welfare preferences were still the main policy story. Without knowledge of these relationships for the 1990s, this modestly increased role for racial attitudes would not deserve much emphasis. With that knowledge, it appears instead as an important evolutionary trend (Figure 4.7C). The partisan difference between economic conservatives and economic liberals—the distance between their two lines—remained roughly stable and very substantial during this successor decade. But the partisan difference between racial conservatives and racial liberals—the slope of their lines—increased strongly. As a result, by the 1990s, both policy domains were strongly related to a presidential vote. Yet the story of the decade for the presidency was the rising relevance of racial ideology. Where the 1950s had seen the coming of welfare ideology as a voting influence, and where the 1960s had seen the coming of racial context as an influence, racial ideology registered as a major voting influence only with the coming of the 1990s. The great difference between this presidential story and the one that applied to the House of Representatives came at the very beginning. For the 1950s, in bivariate terms, welfare policy had shown no relationship to Democratic or Republican voting for the House (see Table 2.2). Racial policy, however, had shown a modest inverse relationship, with liberals more Republican and conservatives more Democratic (see Table 3.9A). When these two policy realms are considered together for the 1950s, the picture remains the same: no distance between the liberal and conservative lines on social welfare, an inverse tilt to liberalism and conservatism on race (Figure 4.8A). As a result, this time, the multivariate picture does not differ from the two previous bivariate pictures. What needs emphasis instead is the degree of difference between the presidential and House pictures. Welfare attitudes were on the dial with
Favor
0.0
0.2
0.4
0.6
Aid to Blacks
Oppose
Job Guarantees: Oppose Job Guarantees: Favor
Probability of Republican Vote Favor
0.0
0.2
0.4
0.6
0.8
Aid to Blacks
Oppose
Job Guarantees: Oppose Job Guarantees: Favor
B. 1962–1990
Figure 4.8 Economic Attitudes, Racial Attitudes, and the Southern Republican Vote: The House.
Probability of Republican Vote
0.8
A. 1952–1960
Probability of Republican Vote 0.0
0.2
0.4
0.6
0.8
Favor Aid to Blacks
Oppose
Job Guarantees: Oppose Job Guarantees: Favor
C. 1992–2000
Class, Race, and Partisan Change
121
the presidency, off the dial with the House. Racial attitudes were neutral with the presidency, inverse with the House. From previous analyses, we know that the House pattern actually approximated the situation for established Republican areas in their presidential voting as well, so that the real difference was between attitudinal impacts on the House vote or attitudinal impacts on the presidential vote in established Republican areas versus attitudinal impacts on the presidential vote in newly Republican territory. Though it is worth remembering that this latter relationship was already sufficient by the 1950s to color the overall institutional relationship for the presidency. In the great middle period of the postwar era, from the 1960s through the 1980s, these “pre-modern” relationships disappeared in both the House and the presidency. For the House, economic policy became central to the division between Democratic and Republican voters (Figure 4.8B). And this time, it ran in the national direction, with Republicans conservative and Democrats liberal. Indeed, the distance between economic liberals and conservatives expanded so much as to catch up with (and parallel) that for the presidency as a whole. Race policy, on the other hand, was now nearly absent as a voting influence for the House. When racial ideology was examined in bivariate terms (see Table 3.9A), there appeared to be a modest positive relationship to the House vote during these years, trailing the presidency at a distance. When racial ideology is put into the multivariate framework, however, economic ideology absorbs all of this relationship. Race policy, in sharp contrast to racial context, had not yet come onto the policy dial for House voters. It had been on the dial in the 1950s, in an inverse direction. Yet it collapsed to neutrality in this middle period. That situation could have implied a variety of evolutionary possibilities; what it actually implied was a long transitional period. For in the 1990s, the House brought racial policy back to an influence over actual voting, in the modern and not the inverse direction. As a result, both policy domains achieved substantial consequence (Figure 4.8C). As with the presidency, social welfare retained its influence—already a large one—by comparison to the 1960–1980 period. But now, racial policy acquired a strong relationship to the vote as well, likewise in the modern direction, with liberals voting Democratic and conservatives Republican. Indeed, in finally catching up with the presidency, the House achieved an effectively equivalent impact for racial ideology. The Senate then managed to mix and match these relationships in a fa-
Aid to Blacks
Job Guarantees: Oppose Job Guarantees: Favor
Oppose
Probability of Republican Vote Favor
0.0
0.2
0.4
0.6
0.8
Aid to Blacks
Job Guarantees: Oppose Job Guarantees: Favor
B. 1962–1990
Economic Attitudes, Racial Attitudes, and the Southern Republican Vote: The Senate.
Favor
0.0
0.2
0.4
0.6
Figure 4.9
Probability of Republican Vote
0.8
A. 1952–1960
Oppose
Probability of Republican Vote 0.0
0.2
0.4
0.6
0.8
Favor Aid to Blacks
Job Guarantees: Oppose Job Guarantees: Favor
C. 1992–2000
Oppose
Class, Race, and Partisan Change
123
miliar but institutionally distinctive pattern. Overall, for the 1950s, the Senate approximated the pattern of the House. As with the House, bivariate analyses had shown no relationship between welfare attitudes and the vote (see Table 2.7), along with an inverse relationship to racial attitudes (see Table 3.9B). For the Senate too, this picture is essentially unchanged when presented in a multivariate format (Figure 4.9A). By comparison with the House, there was a trace more impact from attitudes on welfare, a trace less from attitudes on race. That was all. For the 1960s through 1980s, by contrast, the Senate more closely approximated the pattern of the presidency. The Senate actually joined both other institutions in showing a clear but modest relationship to welfare preferences, the weakest of the three such relationships but still in the same positive direction: welfare conservatives going Republican, welfare liberals Democratic (Figure 4.9B). But where the House showed little additional relationship to racial attitudes, the Senate showed a modest but positive link there, looking much more like the presidency than the House during these decades: racial conservatives too were now more Republican, racial liberals more Democratic. Finally, for the 1990s, the Senate joined—actually exaggerated—the common pattern of the other two institutions (Figure 4.9C). The relationship between policy preferences on aid to blacks and partisan voting became stronger; the link to racial ideology from the 1960s through 1980s had clearly not been a fluke. But the relationship between policy preferences on social welfare and partisan voting became notably stronger too. Indeed, this latter relationship was actually the strongest of the three institutions during the 1990s. Where the House had needed to pick up influence from racial attitudes in order to approximate the issue environment of the other two institutions, the Senate needed to pick up influence from economic attitudes. And it did.
Policy Preferences and the New South From different directions and with different postwar histories, then, Southern voting patterns for the presidency, the House, and the Senate had come into apparent alignment during the 1990s. Policy preferences shaped partisan choice in a remarkably parallel fashion across all three institutions. Figure 4.10 merely reassembles Figures 4.7C, 4.8C, and 4.9C to reinforce that point. First and most strikingly, all three institutions were now aligned in
Probability of Republican Vote
Figure 4.10
Favor
0.0
0.2
0.4
0.6
0.8
Oppose
Probability of Republican Vote Favor
0.0
0.2
0.4
0.6
0.8
Aid to Blacks
Job Guarantees: Oppose Job Guarantees: Favor
B. Senate
Oppose
Economic Attitudes, Racial Attitudes, and the Southern Republican Vote: The 1990s Revisited.
Aid to Blacks
Job Guarantees: Oppose Job Guarantees: Favor
A. President
Probability of Republican Vote 0.0
0.2
0.4
0.6
0.8
Favor Aid to Blacks
Job Guarantees: Oppose Job Guarantees: Favor
C. House
Oppose
Class, Race, and Partisan Change
125
nearly precise parallel with regard to the relationship between partisan voting and policy conflicts. For all of the preceding decades for which we have survey data, for the 1950s through the 1980s, the impact of policy preferences on partisan choice had needed to be distinguished by institution. Different issues affected voting for different institutions at different times. They sometimes even affected that vote in different directions. In the newest Southern politics of the 1990s, all of this was no longer true. Within this alignment, each major policy domain, social welfare and aid to blacks, made serious contributions to the partisan composition of the vote. In the 1950s, economic attitudes had trumped racial attitudes with the presidency, while racial attitudes trumped economic attitudes with Congress. Then, for thirty years thereafter, economic attitudes had clearly led racial attitudes as an influence on voting behavior. In the newest Southern politics of the 1990s, none of this was true. Economic attitudes did not retreat, but racial attitudes clearly did advance. Given such parallel patterns in major policy underpinnings to the vote—especially as piled upon parallel developments in major demographic underpinnings, as seen in Figure 4.5—it should probably not be surprising that the overall outcome looked remarkably parallel as well. Both houses of Congress had now caught up to the presidency in their overall level of Republican support. What resulted was an institutionally common partisan phenomenon, driven initially by sociological change but showing a growing role by the 1990s for policy preference, that is, for liberalism and conservatism on both economics and race.5 One last possibility is that this analysis still measures racial attitudes in the wrong way, or that even if it does not, measuring those attitudes in a different way would deny the commonality of an apparent new politics. This is, once again, the possibility that it should be racial feelings rather than racial policy preferences that were being registered in voting for public office, and thus that it is the interaction of welfare attitudes and racial feelings that should really be examined. This proved not to be a particularly helpful perspective in the bivariate analyses of Chapter 3, but it is easy enough to check on this possibility in a multivariate framework. The result is once again negative. By the 1990s, white ratings of blacks as a social group on the feeling thermometer, when examined simultaneously with white preferences on social welfare as an influence on Republican voting, no longer had any real purchase, with any institution (Figure 4.11). As we have seen repeatedly, welfare attitudes were strongly related to Republican voting for President,
Probability of Republican Vote
Figure 4.11
Favor
0.0
0.2
0.4
0.6
0.8
Probability of Republican Vote Favor
0.0
0.2
0.4
0.6
0.8
Feelings toward Blacks
Oppose
Job Guarantees: Oppose Job Guarantees: Favor
B. Senate
Economic Attitudes, Racial Feeling, and the Southern Republican Vote: The 1990s.
Feelings toward Blacks
Oppose
Job Guarantees: Oppose Job Guarantees: Favor
A. President
Probability of Republican Vote 0.0
0.2
0.4
0.6
0.8
Favor Feelings toward Blacks
Oppose
Job Guarantees: Oppose Job Guarantees: Favor
C. House
Class, Race, and Partisan Change
127
Senate, and House. As we can now see, racial feelings showed only the tiniest hint of any relationship to that vote. Indeed, where racial policies had grown in their relationship to the vote for all three institutions, racial feelings had disappeared as a separable influence. Moreover, the pattern across institutions had become as close to identical as such data are likely to permit. In the end, then, it was not just the social structure of the vote that converged across institutions in the 1990s; it was the ideological structure of that vote too. The change in social structure was the more dramatic. For thirty years beforehand, the interactions of social class and racial context had looked (and had been) different as between Congress and the presidency. In the 1990s, this ceased to be so. What ultimately appeared to eliminate an institutional difference, and bring the whole South into alignment on what had once been the presidential and not the congressional pattern, was extensive, conscious racial redistricting after the 1990 census. At a stroke, the sociologically biracial districts were decimated. In the process, the need to build biracial electoral coalitions, the coalitions that had helped for so long in explaining why the influence of racial context did not change for Congress after the civil rights revolution, was sharply reduced. With it went that huge institutional difference in the impact of a politics of race. Yet the change in ideological underpinnings was also substantial. By the 1960s, there was already a clear role for economic conservatism and an intermittent hint—harbingers—of a role for racial conservatism. In the 1990s these came together, similarly, for all three institutions, with a sharply strengthened role for economic conservatism and, this time, an indisputable role for racial conservatism as well. In other words, like the economic South and the racial South, the ideological South too became a very different place. Once, within the lifetime of a goodly remnant of Southern politicians, economic ideology—attitudes toward public policy on social welfare—had been unrelated to partisan choice. At the same time, racial ideology—attitudes toward public policy on aid to blacks—had been inversely related, with liberals going Republican and conservatives going Democratic. As economic development and legal desegregation arrived, however, welfare attitudes came into alignment with partisan choice, and the old inversion between racial attitudes and party preference was destroyed. By the 1990s, the world had moved on additionally, such that economic conservatism and racial conservatism were both aligned with partisan choice in an
128
the end of southern exceptionalism
impressive fashion. Neither set of policy attitudes appears to have been central to the original shift. Welfare attitudes lagged the class change in partisan attachment, and racial attitudes were unrelated to a changing racial context. Thereafter, however, both sets of policy attitudes augmented the impact of social change in major ways. Social structure had evolved as a partisan influence. Policy conflict had evolved as a partisan influence. And they had simultaneously converged across governmental institutions.
Afterword: One South or Two? Our analysis of partisan change in the postwar South can be boiled down, so far, to a small set of summary assertions. Both economic development and legal desegregation, individually and together, were remaking the partisan character of Southern politics by the late 1960s. The impact of economic development had begun to arrive earlier. The impact of legal desegregation, when it came, was more insistent, more immediate, and more obvious. Once it became clear that the Republican Party would be on the growth side of the economic reorganization of Southern society—this required a complete partisan reversal—economic development became a partisan escalator for Southern Republicans. Once it became clear that the Democratic Party would be on the receiving end, overwhelmingly, of new black voters, racial desegregation became a countervailing brake, albeit more equivocal, on that same Republican progress. Much of the literature of Southern politics, however, tells the same story in a related but clearly distinguishable fashion. Our approach treats economic development as the dominant engine for partisan change in the postwar South and legal desegregation as the more complex and conditional secondary influence, with their interaction effectively dictating the story of partisan change once both were let loose on the Southern political landscape. In the literature, by contrast, legal desegregation together with a politics of race is often the overwhelming influence on partisan change. And even when it is not, when it is merely the dominant influence as between two great social forces, economic development and a new politics of class usually serve as parallel reinforcements to the same result (see Lamis 1990, especially chaps. 2 and 3). Either way, this literature then tends to introduce a third, major, separate, and distinct variable to mediate the partisan impact of social change. For this grand alternative, most authors adopt an analytic perspective that involves immersion in particular histories of regional life, rather than one drawn from the political science ordinarily used to study national politics.
Class, Race, and Partisan Change
129
What results is a focus on a distinction between the “Deep South” and the “Peripheral South” (the latter is also called the “Rim South” or the “Border South”), along with an insistence that this distinction matters. A fundamentally geographic variable, a kind of internal counterpart to the external distinction between South and non-South, thereby claims a central explanatory status. Our approach provides little reason theoretically—and in truth, little room empirically—to expect an impact from this excursion into what is essentially cultural geography. Yet having introduced both economic development and legal desegregation into the analysis, and having examined them simultaneously, we are now in a position to address this third alternative as well. For V. O. Key, who did find this distinction helpful in eliciting sub-patterns to Southern politics, it was principally an epiphenomenon of race, that is, of racial concentration, the share of the total population contributed by black Southerners. For his disciples, this remained part of the equation, but the Deep South/Peripheral South distinction also acquired an overlay of regional culture (see Black and Black 2002, especially chaps. 2, 4, 9, and 10). The Deep South was viewed as closer to the core of “Southernness”; the Peripheral South was inevitably more distant, corrupted and compromised by proximity to Northern or Western cultural patterns. The Deep South has traditionally comprised the states of Alabama, Georgia, Louisiana, Mississippi, and South Carolina, while the Peripheral South included Arkansas, Florida, North Carolina, Tennessee, Texas, and Virginia. Nothing in our analysis suggests any role for such a distinction. Yet that may be a result, so far, of failing to look for it. In any case, if the particular analysis remains undone here, its form is familiar, and the means for addressing it empirically are quite standard. This is a classic “container versus contents” assertion, and we should say a few words about the distinction: • Geographic differences based on “contents” are those where two or more geographic areas differ by virtue of their social composition. The groups that contribute to this composition do not themselves differ additionally between one geographic unit and another. It is merely the mix that differs from unit to unit, creating a recognizable distinction between (among) the units as wholes. • Differences based on the “container” feature the opposite situation: a dominant role for the geographic area. Social groups that live within the geographic unit may share some characteristics across
130
the end of southern exceptionalism
unit boundaries, but these are dominated, if not suppressed, by defining characteristics of the unit itself. Either a strong common culture or a sharply different historical trajectory is usually the explanation here.
Causal explanations that assert a relevant difference among the units in question, a difference that is not merely some compositional effect, are effectively asserting the importance of the container, of a geographic context. Otherwise there is no point—worse, there is real empirical confusion—in talking about, for example, the Deep South versus the Peripheral South. The usual way to pursue this distinction in the literature of Southern politics is to graph Republican progress onto maps that distinguish the Deep and Peripheral South. Lacking individual-level data, Key needed to proceed in this way, and what he squeezed from it remains impressive. His followers, proceeding in the same fashion, have been easily able to show that Republicans long did better in the Peripheral than in the Deep South, especially in voting for Congress. If we were to proceed in the same fashion, we could quickly explain away this finding. Into the 1980s, the Peripheral South was distinguished from the Deep South in having far more white-collar congressional districts, and thus (in our analysis) far better Republican prospects. On the other hand, when the Deep South did generate white-collar districts, they tended to be captured by the Republicans, and when the Deep South finally enjoyed a white-collar surge in the 1990s, it experienced a Republican surge as well. Moreover, throughout this entire period, the Deep South was more black (less white), suggesting (again in our analysis) additional restraints on Republican opportunities. Indeed, out-migration by blacks and in-migration by whites actually caused this to be, if anything, more true as time passed, leading us to expect additionally repressed Republican gains in the Deep South until the racial reapportionments of the 1990s. Yet what has distinguished our analysis so far, beyond a set of substantive conclusions, is a determined effort to escape anecdotal evidence, even in the form of mapped data with its great risk of ecological confusion, and to test assertions about the evolution of Southern politics through a complex dataset built around individual-level characteristics and behaviors but consciously including major aspects of political context. Accordingly, the first step in applying this dataset to the “Two Souths” argument involves comparing the district demographics of Republican success, stratified by location in the Peripheral or the Deep South, for the long period of the rise
Class, Race, and Partisan Change
131
of a new Southern politics, the 1960s through the 1980s. When this is done, district demographics appear to eliminate the need for sub-regions in explaining partisan change. The comparison is not perfect, since the Deep South lacked any substantial number of white-collar districts during this entire period. With fewer than five such congressional districts per decade, the behavior of a single district could move these percentages around in an extreme and idiosyncratic fashion. But for those districts that can be compared, that is, blue-collar districts which were more than 20 percent black or less than 20 percent black—districts that contributed more than three-quarters of the Southern total—the story is clear (Table 4.4). Republican success in parallel districts from the Peripheral South or the Deep South was effectively identical. There was no evident sub-regional contribution to the outcome at all. This is still aggregate-level rather than individual-level exposition. Yet we are easily able to confront the alleged difference between Deep South and Peripheral South with individual-level data too. To repeat: both social class and racial composition do distinguish the two areas, with the Peripheral South being more white-collar in every decade, the Deep South being blacker in every period. The key question is whether the distinction between a geographic Peripheral South and a geographic Deep South makes these racial and class differences work differently in their impact on the rise of a Southern Republican Party; or whether the difference between Southern Republican prospects in the Deep versus Peripheral South is instead just a product of the differential distribution of these—more fundamental—racial and class differences. A simple, reinforcing way to look for both sets of impacts, without
Table 4.4
The Distinctiveness of the Deep South? As an Influence on Congressional Outcomes
Share of Congressional Districts Captured by Republicans, 1960s through 1980s District Composition >50% White-Collar, 50% White-Collar, >20% Black