Sustainable Agriculture and Food 1844074080, 9781844074082, 9781435624665
* Essential collection of the most important literature covering the full scope and depth of agriculture and food produc
807 56 15MB
English Pages 1949 Year 2008
Recommend Papers


File loading please wait...
Citation preview
EARTHSCAN REFERENCE COLLECTIONS
Sustainable Agriculture and Food VOLUME I HISTORY OF A G R I C U LT U R E A N D F O OD ––––––––––––––––––– EDITED BY
Jules Pretty
ear t hscan
How to go to your page: This eBook contains four volumes. Each volume of the original hardcopy set is numbered separately. In order to avoid duplicate pagination in this eBook, we have included volume numbers within the page numbers. For example, to go to page 5 of the first volume, enter I-5 in the “page #” box at the top of the screen and click “Go”. To go to page 100 of the second volume enter II-100. To go to page xiv of the third volume enter III-xiv, and so on.
Sustainable Agriculture and Food Volume I
EARTHSCAN REFERENCE COLLECTION
Sustainable Agriculture and Food Volume I
Edited by Jules Pretty
London • Sterling, VA
First published by Earthscan in the UK and USA in 2008 Copyright © Jules Pretty, 2008 All rights reserved ISBN-13: 978-1-84407-408-2 Typeset by Composition and Design Services Printed and bound in the UK by Biddles Ltd, King’s Lynn, Norfolk Cover design by Andrew Corbett For a full list of publications please contact: Earthscan 8–12 Camden High Street London, NW1 0JH, UK Tel: +44 (0)20 7387 8558 Fax: +44 (0)20 7387 8998 Email: [email protected] Web: www.earthscan.co.uk 22883 Quicksilver Drive, Sterling, VA 20166-2012, USA Earthscan publishes in association with the International Institute for Environment and Development A catalogue record for this book is available from the British Library Library of Congress Cataloging-in-Publication Data has been applied for
The paper used for this book is FSC-certified and elemental chlorine-free. FSC (the Forest Stewardship Council) is an international network to promote responsible management of the world’s forests.
Contents VOLUME I HISTORY OF AGRICULTURE AND FOOD
List of Acronyms and Abbreviations Overview to Four Volumes: Sustainable Agriculture and Food Editorial introduction to Volume I
Part I 1 2 3 4 5
6 7 8
9
1
Before Agriculture
What Hunters Do for a Living, or, How to Make Out on Scarce Resources R. B. Lee Foragers and Others R. B. Lee and R. Daly Mind H. Brody Environmental and Health Benefits of Hunting Lifestyles and Diets for the Innu of Labrador C. Samson and J. Pretty Language: A Resource for Nature L. Maffi
Part II
xiii xv
17 41 73 107 136
Early Agriculture
Our Vanishing Genetic Resources J. R. Harlan Oriental Despotism K. Wittfogel Marcus Cato on Agriculture Marcus Porcius Cato Marcus Terentius Varro on Agriculture Marcus Terentius Varro Agroecological Farming Systems in China Li Wenhua
159 168 197 202 208
vi Sustainable Agriculture and Food 10 Farmers of Forty Centuries F. H. King
Part III
222
Agricultural Revolutions and Change
11 Agricultural Sustainability and Open-field Farming in England, c 1650–1830 M. Turner, J. Beckett and B. Afton 12 Farmers’ Extension Practice and Technology Adaptation: Agricultural Revolution in 17th–19th-Century Britain J. Pretty 13 Past Successes G. R. Conway 14 Soviet Collectivization, Capitalist Dreams J. C. Scott 15 Alternatives to Slash-and-Burn: Challenges and Approaches of an International Consortium P. A. Sanchez, C. A. Palm, S. A. Vosti, T. P. Tomich and J. Kasyoki
233 258 290 308 339
Part IV Modern Agricultural Reforms 16 Making Soil and Water Conservation Sustainable: From Coercion and Control to Partnerships and Participation J. Pretty and P. Shah 17 Rethinking Agriculture for New Opportunities E. Fernandes, A. Pell and N. Uphoff 18 Integrated Farming Systems at Different Scales Li Wenhua 19 Agricultural Biotechnology in Southern Africa: A Regional Synthesis D. Mnyulwa and J. Mugwagwa 20 Sustaining Cultivation M. Bell Index
375 403 423 475 501 519
Contents vii
VOLUME II AGRICULTURE AND THE ENVIRONMENT
List of Acronyms and Abbreviations Editorial introduction to Volume II
xiii 1
Part I Agricultural Harm to the Environment 1 2 3 4 5
A Fable for Tomorrow R. Carson Reality Cheques J. Pretty External Costs of Agricultural Production in the United States E. M. Tegtmeier and M. D. Duffy From Pesticides to People: Improving Ecosystem Health in the Northern Andes S. Sherwood, D. Cole, C. Crissman and M. Paredes Incidence of Acute Pesticide Poisoning Among Female and Male Cotton Growers in India F. Mancini, A. H. C. van Bruggen, J. L. S. Jiggins, A. C. Ambatipud and H. Murphy
Part II 6
15 22 53 82 97
Agroecology and Sustainability
The Properties of Agroecosytems G. R. Conway 7 Interdependent Social-Ecological Systems and Adaptive Governance for Ecosystem Services C. Folke, J. Colding, P. Olsson and T. Hahn 8 Agroecology and Agroecosystems S. R. Gliessman 9 Ecological Basis for Low-Toxicity Integrated Pest Management (IPM) in Rice and Vegetables K. Gallagher, P. Ooi, T. Mew, E. Borromeo, P. Kenmore and J.-W. Ketelaar 10 The Farm as Natural Habitat D. L. Jackson
119 139 166 178 201
viii Sustainable Agriculture and Food
Part III
Communities and Social Capital
11 Feminism and Environmental Ethics: A Materialist Perspective M. Mellor 12 Gender and Social Capital: The Importance of Gender Differences for the Maturity and Effectiveness of Natural Resource Management Groups O. Westermann, J. Ashby and J. Pretty 13 Social Capital and the Collective Management of Resources J. Pretty 14 Still Going: Recent Debates on the Goldschmidt Hypothesis L. M. Lobao, M. D. Schulman and L. E. Swanson 15 Social Connectedness in Marginal Rural China: The Case of Farmer Innovation Circles in Zhidan, North Shaanxi W. Bin and J. Pretty
217 234 257 263 274
Part IV Ecological Restoration and Design 16 Ecological Design and Education D. W. Orr 17 Multi-function Agricultural Biodiversity: Pest Management and Other Benefits G. M. Gurr, S. D. Wratten amd J. M. Luna 18 Generating Community Change C. B. Flora and J. L. Flora 19 Issues for More Sustainable Soil System Management N. Uphoff, A. S. Ball, E. C. M. Fernandes, H. Herren, O. Husson, C. Palm, J. Pretty, N. Sanginga and J. E. Thies 20 Farming With the Wild: Foreword and Introduction F. Kirschenmann and D. Imhoff Index
293 318 333 357 372 388
Contents ix
VOLUME III
AGRICULTURE AND FOOD SYSTEMS
List of Acronyms and Abbreviations
xiii
Editorial introduction to Volume III
1
Part I The Global Food System 1 2 3 4
5
The Environmental and Social Costs of Improvement J. Pretty The Performance of Low External Input Technology in Agricultural Development: A Summary of Three Case Studies R. Tripp The Politics of Food: An Introduction M. E. Lien The System of Rice Intensification (SRI): A Challenge for Science, and an Opportunity for Farmer Empowerment Towards Sustainable Agriculture A. Mishra, M. Whitten, J. W. Ketelaar and V. M. Salokhe The Struggle to Govern the Commons T. Dietz, E. Ostrom, and P. C. Stern
Part II 6
15 59 75
88 116
Poverty and Hunger
Words and Ideas: Commitment, Continuity and Irreversibility R. Chambers 7 Well-being and Ill-being: The Good and the Bad Life D. Narayan, R. Chambers, M. K. Shah and P. Petesch 8 Who Will Feed China? L. Brown 9 Introduction to Ecoagriculture J. McNeely and S. Scherr 10 Resource-conserving Agriculture Increases Yields in Developing Countries J. Pretty, A. D. Noble, D. Bossio, J. Dixon, R. E. Hine, F. W. T. Penning de Vries and J. I. L. Morison
137 169 190 203 209
x Sustainable Agriculture and Food
Part III
Diet and Health
11 Whole Diets E. Balfour 12 The Nutrition Transition and its Health Implications in Lower-income Countries B. M. Popkin 13 Diet and Health: Diseases and Food T. Lang and M. Heasman 14 Food Politics: How the Food Industry Influences Nutrition and Health M. Nestle 15 Your Trusted Friends E. Schlosser
225 240 270 314 340
Part IV Localized Food Systems 16 Coming in to the Foodshed J. Kloppenburg, J. Hendrickson and G. W. Stevenson 17 Farm Costs and Food Miles: An Assessment of the Full Cost of the UK Weekly Food Basket J. Pretty, A. S. Ball, T. Lang and J. I. L. Morison 18 French Quality and Ecolabelling Schemes: Do They Also Benefit the Environment? G. Nguyen, T. L. Dobbs, S. K. Bertramsen and B. Legagneux 19 The Growth of Urban Agriculture N. Companioni, Y. O. Hernández, E. Páez and C. Murphy 20 The Quest For Ecological Modernization: Re-spacing Rural Development and Agri-food Studies T. Marsden Index
363 375 398 415 431 451
Contents xi
VOLUME IV POLICIES, PROCESSES AND INSTITUTIONS
List of Acronyms and Abbreviations Editorial introduction to Volume IV
xiii 1
Part I Ethics and Systems Thinking 1 2 3 4 5
The Land Ethic A. Leopold Four Principles of Natural Farming M. Fukuoka Knowing Systems and the Environment R. Bawden Agricultural Sustainability: What It Is and What It Is Not P. B. Thompson Learning and Mislearning R. Chambers
Part II
29 34 52 69
Participatory Processes
6
Reversals, Institutions and Change R. Chambers 7 Participatory Learning for Sustainable Agriculture J. Pretty 8 Past, Present and Future J. D. Van der Ploeg 9 Diversifying Rice-based Systems and Empowering Farmers in Bangladesh Using the Farmer Field School Approach M. Barzman and S. Desilles 10 New Meanings for Old Knowledge: The People’s Biodiversity Registers Programme M. Gadgil, P. R. S. Rao, G. Utkarsh, P. Pramod, A. Chhatre and members of the People’s Biodiversity Initiative
Part III
15
93 109 136 184 194
Governance and Education
11 From Extension to Communication for Innovation C. Leeuwis
217
xii Sustainable Agriculture and Food 12 Use of Communication Media in Changing Rice Farmers’ Pest Management in the Mekong Delta, Vietnam K. L. Heong, M. M. Escalada, N. H. Huan and V. Mai 13 Landcare and Livelihoods: The Promotion and Adoption of Conservation Farming Systems in the Philippine Uplands R. A. Cramb and Z. Culaseno 14 Conserving Communities W. Berry 15 Becoming an Agroecologist Through Action Education G. Lieblin, E. Østergaard and C. Francs
236 261 281 290
Part IV Enabling Policies and Institutions for Sustainable Agricultural and Food Systems 16 A New Practice: Facilitating Sustainable Agriculture N. G. Roling and M. A. E. Wagemakers 17 Subsidies in Watershed Development Projects in India: Distortions and Opportunities J. M. Kerr, N. K. Sanghi and G. Sriramappa 18 Agri-environmental Stewardship Schemes and ‘Multifunctionality’ T. L. Dobbs and J. Pretty 19 Ways Forward? Technical Choices, Intervention Strategies and Policy Options C. Toulmin and I. Scoones 20 Social Visions of Future Sustainable Societies P. Benjamin, J. X. Kasperson, R. E. Kasperson, J. L. Emel and D. E. Rocheleau Index
303 321 337 356 393
430
List of Acronyms and Abbreviations
AARD Agency for Agricultural Research and Development AFTPs Agroforestry Tree Products ARPAC Agricultural Reseach Policy Advisory Committee BTZ Biotechnology Trust of Zimbabwe CAAS Chinese Academy of Agricultural Sciences CAS Chinese Academy of Sciences CBD Convention on Biological Diversity CENFOR Center for Forestry Research (Amazon) CGIAR Consultative Group on International Agricultural Research CHAGS Conference on Hunting and Gathering Societies CIAT Centro Internacional de Agricultura Tropical CIMMYT Centro Internacional de Mejoramento de Maíz y Trigo CIP Centro Internacional de Papas CODESU Consorcio para el Desarrollo Sostenible de Ucayali CPR common property regime CRIFC Central Research Institute for Food and Crops CSP Conservation Security Program EA Environment Agency (UK) EDRSS Ecological Demonstrative Rebuilding for Sustainable Settlements ESSO Standard Oil of New Jersey FAO Food and Agriculture Organization (UN) GDP gross domestic product GIS geographic information system IBP International Biological Program IBPGR International Board for Plant Genetic Resources ICA Instituto Columbiano Agropecuário ICRAF International Centre for Research in Agroforestry ICRISAT International Crops Research Institute for the Semi-Arid Tropics IFAD International Fund for Agricultural Development IFS integrated farming system IIAP Instituto de Investigación de la Amazonía Peruana IITA International Institute of Tropical Agriculture INAC Indian and Northern Affairs Canada INIA Instituto Nacional de Investigación Agraria INIFAP Instituto Nacional de Investigaciones Forestales, Agricolas y Pecuarias
xiv Sustainable Agriculture and Food
INRM IPCC IPM IRAD IRRI IUCN
integrated natural resource management Intergovernmental Panel on Climate Change integrated pest management Institut de Recherche Agricole pour le Développement International Rice Research Institute International Union for the Conservation of Nature and Natural Resources LMO living modified organism MEA Millennium Ecosystem Assessment NBC national biosafety committee NBF national biosafety framework NEP New Economic Policy (Russia) NGO non-governmental organization PCARRD Philippine Council for Agriculture, Forestry, and Natural Resources Research PFI Practical Farmers of Iowa PFTs plant functional types RDAs recommended daily allowances SADC Southern African Development Community SARD Sustainable Agriculture and Rural Development SRI system of rice intensification TAC Technical Advisory Committee TEK traditional ecological knowledge UN United Nations UNDP United Nations Development Programme UNEP United Nations Environment Programme UNESCO United Nations Educational, Scientific and Cultural Organization USAID US Aid Agency USDA US Department of Agriculture VIR N. I. Vavilov All-Union Institute of Plant Industry WCED World Commission on Environment and Development WN World Neighbors WTO World Trade Organization
Overview to Four Volumes: Sustainable Agriculture and Food Jules Pretty
The Context for Agricultural Sustainability The interest in the sustainability of agricultural and food systems can be traced to environmental concerns that began to appear in the 1950s and 1960s. However, ideas about sustainability date back at least to the oldest surviving writings from China, Greece and Rome (King, 1911; Cato, 1979; Hesiod, 1988; Conway, 1997; Li Wenhua, 2001; Pretty, 2002). More recent concerns began to develop during the 1960s, and were particularly driven by Rachel Carson’s book Silent Spring (Carson, 1963). Like other popular and scientific studies at the time, it focused on the environmental harm caused by agriculture. In the 1970s, the Club of Rome identified the economic problems that societies would face when environmental resources were overused, depleted or harmed, and pointed towards the need for different types of policies to generate sustainable economic growth. In the late 1980s, the World Commission on Environment and Development (WCED), chaired by Gro Harlem Brundtland, published Our Common Future, the first serious attempt to link poverty alleviation to natural resource management and the state of the environment. Sustainable development was defined as ‘meeting the needs of the present without compromising the ability of future generations to meet their own needs’. The concept implied both limits to growth and the idea of different patterns of growth (WCED, 1987). In 1992, the UN Conference on Environment and Development was held in Rio de Janeiro. The main outcome was Agenda 21, a 41-chapter document setting out priorities and practices across all economic and social sectors, and how these should relate to the environment. Chapter 14 addressed Sustainable Agriculture and Rural Development (SARD). The principles of sustainable forms of agriculture that encouraged minimizing harm to the environment and human health were agreed. However, progress since then has not been good, as Agenda 21 was not a binding treaty on national governments, and all remain free to choose whether to adopt or ignore these principles (Pretty and Koohafkan, 2002). The
xvi Sustainable Agriculture and Food
‘Rio Summit’ was, however, followed by several important actions that came to affect agriculture, including the signing of the Convention on Biodiversity in 1995; the establishment of the UN Global Integrated Pest Management (IPM) Facility in 1995, which provides international guidance and technical assistance for integrated pest management; the signing of the Stockholm Convention on Persistent Organic Pollutants in 2001, so addressing some problematic pesticides; and, ten years after Rio, the World Summit on Sustainable Development held in Johannesburg. In 2005, the Millennium Ecosystem Assessment then drew attention to the value of environmental services, and in particular the role that agriculture plays in affecting them (MEA, 2005). Today, concerns about sustainability centre on the need to incorporate agricultural technologies and practices that (i) do not have adverse effects on the environment (partly because the environment is an important asset for farming); and (ii) are accessible to and effective for farmers, and lead both to improvements in food productivity and have positive side-effects on environmental goods and services. Sustainability in agricultural systems incorporates concepts of both resilience (the capacity of systems to buffer shocks and stresses) and persistence (the capacity of systems to continue over long periods), and addresses many wider ecological, economic and social and political dimensions: •
•
•
Ecological – the core concerns are to reduce negative environmental and health externalities, to enhance and use local ecosystem resources, and preserve biodiversity. More recent concerns include broader recognition of the positive environmental services from agriculture (including carbon capture in soils, flood protection, biodiversity services). Economic – economic perspectives seek to assign value to ecological assets, and also to include a longer time frame in economic analysis. They also highlight the often hidden subsidies that promote the depletion of resources or unfair competition with other production systems. Social and political – there are many concerns about the equity of technological change. At the local level, agricultural sustainability is associated with farmer participation, group action and the promotion of local institutions, culture and farming communities. At the higher level, the concern is for enabling policies that target poverty reduction in developing countries and diet management in industrialized countries.
In recent decades, there has been remarkable growth in agricultural production worldwide. Since the beginning of the 1960s, aggregate world food production grew by 145 per cent to the early part of the 21st century. In Africa, it increased by 140 per cent, in Latin America by almost 200 per cent and in Asia by 280 per cent. The greatest increases have been in China, where a five-fold increase occurred, mostly during the 1980s and 1990s. In industrialized countries, production started from a higher base; yet it still doubled in the US over 40 years, and grew by 68 per cent in western Europe (FAO, 2005).
Overview to Four Volumes: Sustainable Agriculture and Food xvii
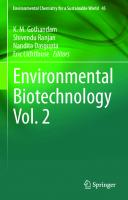
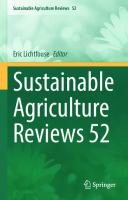
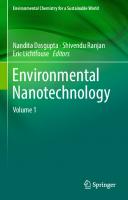
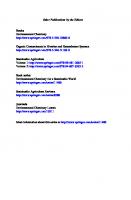
Over the same period, world population grew from 3 to 6.5 billion. Again, though, per capita agricultural production has outpaced population growth. For each person today, there is 25 per cent more food compared with 1960. These aggregate figures, however, hide important regional differences. In Asia and Latin America, per capita food production increased by 76 per cent and 28 per cent respectively. Africa has fared badly, with food production per person 10 per cent lower in the early 2000s than in 1960. China, again, performed best, with a trebling of per capita food production over the same period. These agricultural production gains have lifted millions out of poverty and provided a platform for both rural and urban economic growth in many parts of the world. However, these advances in aggregate productivity have not brought reductions in the incidence of hunger for all. In the early 21st century, there were still more than 800 million people hungry and lacking adequate access to food. A third were in East and South-East Asia, another third in South Asia, a quarter in subSaharan Africa, and 5 per cent each in Latin America/Caribbean and in North Africa/Near East. Nonetheless, there has been progress, as the incidence of undernourishment stood at 960 million in 1970, comprising a third of all people in developing countries at the time. Despite this progress in food output, it is likely that food-related ill health will remain widespread for many people. As world population continues to increase, until at least the mid 21st century, so the absolute demand for food will also increase. Increasing incomes will also mean people will have more purchasing power, and this will increase demand for food. But as diets change, so demand for the types of food will also shift radically, with large numbers of people going through the nutrition transition. In particular, increasing urbanization means people are more likely to adopt new diets, particularly consuming more meat, fats and refined cereals, and fewer traditional cereals, vegetables and fruit (Popkin, 1998). At the same time as these recent changes in agricultural productivity, consumer behaviour over food and the political economy of farming and food (Goodman and Watts, 1997), agricultural systems are now recognized to be a significant source of environmental harm (Tilman, 1999; Pretty et al, 2000; MEA, 2005; Pretty, 2007). Since the early 1960s, the total agricultural area has expanded by 11 per cent from 4.5 to 5 billion hectares, and arable area from 1.27 to 1.4 billion hectares. In industrialized countries, agricultural area has fallen by 3 per cent, but has risen by 21 per cent in developing countries (Figure 1a). Livestock production has also increased, with a worldwide four-fold increase in numbers of chickens, a twofold increase in pigs, and 40–50 per cent increases in numbers of cattle, sheep and goats (Figure 1b). During this period, the intensity of production on agricultural lands has also risen substantially. The area under irrigation and number of agricultural machines has grown by about two-fold, and the consumption of all fertilizers by four-fold (and nitrogen fertilizers by seven-fold) (Figures 1c and 1d). The use of pesticides in agriculture has also increased dramatically, and now amounts to some 2.56
xviii Sustainable Agriculture and Food
Source: FAO (2005)
Figure 1a Agricultural area (1961–2002)
Source: FAO (2005)
Figure 1b Head of livestock, world (1961–2004)
Overview to Four Volumes: Sustainable Agriculture and Food xix
Source: FAO (2005)
Figure 1c Irrigated area and agricultural machinery, world (1961–2002)
Source: FAO (2005)
Figure 1d World fertilizer consumption (1961–2002)
xx Sustainable Agriculture and Food Table 1 World and US use of pesticide active ingredients (mean for 1998–1999) Pesticide use
World pesticide use 1
Herbicides Insecticides Fungicides Other2 Total
US pesticide use
(Million kg ai )
%
(Million of ai1)
%
948 643 251 721
37 25 10 28
246 52 37 2193
44 9 7 40
2563
100
554
100
1 ai = active ingredient. 2 Other includes nematicides, fumigants, rodenticides, molluscicides, aquatic and fish/bird pesticides and other chemicals used as pesticides (e.g. sulphur, petroleum products). 3 Other in the US includes 150 million kg of sulphur, petroleum used as pesticides. Source: Pretty and Hine (2005), using EPA (2001), OECD (2001)
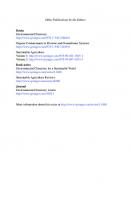
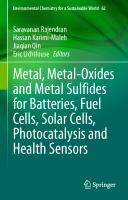
billion kilogrammes (kg) per year. In the early 21st century, the annual value of the global market was US$25 billion, of which some $3 billion of sales was in developing countries (Pretty, 2005). Herbicides account for 49 per cent of use, insecticides 25 per cent, fungicides 22 per cent, and others about 3 per cent (Table 1). A third of the world market by value is in the US, which represents 22 per cent of active ingredient use. In the US, though, large amounts of pesticide are used in the home/ garden (17 per cent by value) and in industrial, commercial and government settings (13 per cent by value). These factors of production have had a direct impact on world food production (Figures 2a–c). There are clear and significant relationships between fertilizer consumption, number of agricultural machines, irrigated area, agricultural land area and arable area with total world food production (comprising all cereals, coarse grains, pulses, roots and tubers, and oil crops). The inefficient use of some of these inputs has, however, led to considerable environmental harm. Increased agricultural area contributes substantially to the loss of habitats, associated biodiversity and their valuable environmental services (MEA, 2005). Some 30–80 per cent of nitrogen applied to farmland escapes to contaminate water systems and the atmosphere, as well as increasing the incidence of some disease vectors (Victor and Reuben, 2002; Smil, 2001; Pretty et al, 2003a; Townsend et al, 2003; Giles, 2005). Irrigation water is often used inefficiently, and causes waterlogging and salinization, as well as diverting water from other domestic and industrial users, and agricultural machinery has increased the consumption of fossil fuels in food production (Leach, 1976; Stout, 1998). These relationships clearly show the past effectiveness of these factors of production in increasing agricultural productivity. One argument is to suggest that the persistent world food crisis indicates a need for substantially greater use of these inputs (Avery, 1995; Trewevas, 2001; Cassman et al, 2002; Green et al, 2005; Tripp, 2006). But it would be both simplistic and optimistic to assume that
Overview to Four Volumes: Sustainable Agriculture and Food xxi
Source: FAO (2005)
Figure 2a Relationship between all fertilizers applied and world plant food production (1961–2002)
Source: FAO (2005)
Figure 2b Relationship between world irrigation area and world plant food production (1961–2002)
xxii Sustainable Agriculture and Food
Source: FAO (2005)
Figure 2c Relationship between world agricultural land area and world plant food production (1961–2002)
all these relationships will remain linear in the future, and that gains will continue at the previous rates (Tilman, 1999). This would assume a continuing supply of these factors and inputs, and that the environmental costs of their use will be small. There is also growing evidence to suggest that this approach to agricultural growth has reached critical environmental limits, and that the aggregate costs in terms of lost or forgone benefits from environmental services are too great for the world to bear (Ruttan, 1999; MEA, 2005). The costs of these environmental problems are often called externalities, as they do not appear in any formal accounting systems. Yet many agricultural systems themselves are now suffering because key natural assets that they require to be plentiful are being undermined or diminished. Agricultural systems in all parts of the world will have to make many improvements. In some, the challenge is to increase food production to solve immediate problems of hunger. In others, the focus will be more on adjustments that maintain food production whilst increasing the flow of environmental goods and services. World population is set to continue to increase until about 2040–2050, and then is likely to stabilize or fall because of changes in fertility patterns. The high fertility projection by the UN (2005) is unlikely to arise, as shifts towards lower fertility have already occurred in many countries worldwide, and so there are very real prospects of world population eventually falling over the one to two centuries
Overview to Four Volumes: Sustainable Agriculture and Food xxiii
after the maximum is reached. This suggests that the agricultural and food challenge is likely to be most acute in the next 50–100 years, and thereafter qualitatively change according to people’s aggregate consumption patterns.
What is Sustainable Agriculture? What, then, do we now understand by agricultural sustainability? Many different expressions have come to be used to imply greater sustainability in some agricultural systems over prevailing ones (both pre-industrial and industrialized). These include the terms biodynamic, community-based, ecoagriculture, ecological, environmentally-sensitive, extensive, farm-fresh, free-range, low-input, organic, permaculture, sustainable and wise-use (Pretty, 1995; Conway, 1997; NRC, 2000; McNeely and Scherr, 2003; Clements and Shrestha, 2004; Cox et al, 2004; Gliessman, 2005). There is continuing and intense debate about whether agricultural systems using some of these terms can qualify as sustainable (Balfour, 1943; Lampkin and Padel, 1994; Altieri, 1995; Trewevas, 2001). Systems high in sustainability can be taken to be those that aim to make the best use of environmental goods and services whilst not damaging these assets (Altieri, 1995; Pretty, 1995, 1998, 2005; Conway, 1997; Hinchliffe et al, 1999; NRC, 2000; Li Wenhua, 2001; Jackson and Jackson, 2002; Tilman et al, 2002; Uphoff, 2002; McNeely and Scherr, 2003; Swift et al, 2004; Tomich et al, 2004; Gliessman, 2004, 2005; MEA, 2005). The key principles for sustainability are to: (i) integrate biological and ecological processes such as nutrient cycling, nitrogen fixation, soil regeneration, allelopathy, competition, predation and parasitism into food production processes; (ii) minimize the use of those non-renewable inputs that cause harm to the environment or to the health of farmers and consumers; (iii) make productive use of the knowledge and problem-solving skills of farmers, so improving their self-reliance and substituting human capital for costly external inputs; (iv) make productive use of people’s collective capacities to work together to solve common agricultural and natural resource problems, such as for pest, watershed, irrigation, forest and credit management. The idea of agricultural sustainability, though, does not mean ruling out any technologies or practices on ideological grounds. If a technology works to improve productivity for farmers, and does not cause undue harm to the environment, then it is likely to have some sustainability benefits. Agricultural systems emphasizing these principles also tend to be multi-functional within landscapes and economies (Dobbs and Pretty, 2004; MEA, 2005). They jointly produce food and other goods for farmers and markets, but also contribute to a range of valued public goods,
xxiv Sustainable Agriculture and Food
such as clean water, wildlife and habitats, carbon sequestration, flood protection, groundwater recharge, landscape amenity value and leisure/tourism. In this way, sustainability can be seen as both relative and case-dependent, and implies a balance between a wide range of potential agricultural and environmental goods and services. As a more sustainable agriculture seeks to make the best use of nature’s goods and services, so technologies and practices must be locally adapted and fitted to place. These are most likely to emerge from new configurations of social capital, comprising relations of trust embodied in new social organizations, and new horizontal and vertical partnerships between institutions, and human capital comprising leadership, ingenuity, management skills and capacity to innovate. Agricultural systems with high levels of social and human assets are more able to innovate in the face of uncertainty (Chambers et al, 1989; Uphoff, 1998; Bunch and Lopez, 1999; Olsson and Folke, 2001; Pretty and Ward, 2001; Gallagher et al, 2005; Bawden, 2005; Folke et al, 2005). This suggests that there are likely to be many pathways towards agricultural sustainability, and further implies that no single configuration of technologies, inputs and ecological management is more likely to be widely applicable than another. Agricultural sustainability implies the need to fit these factors to the specific circumstances of different agricultural systems. A common, though erroneous, assumption about agricultural sustainability is that it implies a net reduction in input use, so making such systems essentially extensive (they require more land to produce the same amount of food). Recent empirical evidence shows that successful agricultural sustainability initiatives and projects arise from shifts in the factors of agricultural production (e.g. from use of fertilizers to nitrogen-fixing legumes; from pesticides to an emphasis on natural enemies; from ploughing to zero-tillage). A better concept than an extensive system is one that centres on the intensification of resources – making better use of existing resources (e.g. land, water, biodiversity) and technologies (Conway and Pretty, 1991; Pretty et al, 2000; Buttel, 2003; Tegtmeier and Duffy, 2004; Pretty et al, 2006). The critical question centres on the type of intensification. Intensification using natural, social and human capital assets, combined with the use of best available technologies and inputs (best genotypes and best ecological management) that minimize or eliminate harm to the environment, can be termed sustainable intensification.
Capital Assets for Agricultural Systems What makes agriculture unique as an economic sector is that it directly affects many of the very assets on which it relies for success. Agricultural systems at all levels rely on the value of services flowing from the total stock of assets that they influence and control, and five types of asset, natural, social, human, physical and financial capital, are now recognized as being important. There are, though, some
Overview to Four Volumes: Sustainable Agriculture and Food xxv
advantages and misgivings with the use of the term capital. On the one hand, capital implies an asset, and assets should be cared for, protected and accumulated over long periods. On the other, capital can imply easy measurability and transferability. Because the value of something can be assigned a monetary value, then it can appear not to matter if it is lost, as the required money could simply be allocated to purchase another asset, or to transfer it from elsewhere. But nature and its wider values are not so easily replaceable as a commodity (Coleman, 1988; Ostrom, 1990; Putnam, 1993; Flora and Flora, 1996; Costanza et al, 1997; Benton, 1998; Scoones, 1998; Uphoff, 1998, 2002; Pretty, 2003). Nonetheless, as terms, natural, social and human capital are useful in helping to shape concepts around basic questions such as what is agriculture for, and what system works best. The five capitals are defined in the following ways: 1
2
3
4
5
Natural capital produces environmental goods and services, and is the source of food (both farmed and harvested or caught from the wild), wood and fibre; water supply and regulation; treatment, assimilation and decomposition of wastes; nutrient cycling and fixation; soil formation; biological control of pests; climate regulation; wildlife habitats; storm protection and flood control; carbon sequestration; pollination; and recreation and leisure (Costanza et al, 1997; MEA, 2005). Social capital yields a flow of mutually beneficial collective action, contributing to the cohesiveness of people in their societies. The social assets comprising social capital include norms, values and attitudes that predispose people to cooperate; relations of trust, reciprocity and obligations; and common rules and sanctions mutually agreed or handed down. These are connected and structured in networks and groups (Flora and Flora, 1996; Pretty, 2003; Cramb and Culaseno, 2003). Human capital is the total capability residing in individuals, based on their stock of knowledge skills, health and nutrition (Orr, 1992; Byerlee, 1998; Lieblin et al, 2004; Leeuwis, 2004). It is enhanced by access to services that provide these, such as schools, medical services and adult training. People’s productivity is increased by their capacity to interact with productive technologies and with other people. Leadership and organizational skills are particularly important in making other resources more valuable. Physical capital is the store of human-made material resources, and comprises buildings, such as housing and factories, market infrastructure, irrigation works, roads and bridges, tools and tractors, communications, and energy and transportation systems, that make labour more productive. Financial capital is more of an accounting concept, as it serves as a facilitating role rather than as a source of productivity in and of itself. It represents accumulated claims on goods and services, built up through financial systems that gather savings and issue credit, such as pensions, remittances, welfare payments, grants and subsidies.
xxvi Sustainable Agriculture and Food
As agricultural systems shape the very assets on which they rely for inputs, a vital feedback loop occurs from outcomes to inputs (Worster, 1993). Thus sustainable agricultural systems tend to have a positive effect on natural, social and human capital, whilst unsustainable ones feed back to deplete these assets, leaving fewer for future generations. For example, an agricultural system that erodes soil whilst producing food externalizes costs that others must bear. But one that sequesters carbon in soils through organic matter accumulation helps to mediate climate change. Similarly, a diverse agricultural system that enhances on-farm wildlife for pest control contributes to wider stocks of biodiversity, whilst simplified modernized systems that eliminate wildlife do not. Agricultural systems that offer labourabsorption opportunities, through resource improvements or value-added activities, can boost local economies and help to reverse rural-to-urban migration patterns (Carney, 1998; Dasgupta, 1998; Ellis, 2000; Morison et al, 2005; Pretty et al, 2006). Any activities that lead to improvements in these renewable capital assets thus make a contribution towards sustainability. However, agricultural sustainability does not require that all assets are improved at the same time. One agricultural system that contributes more to these capital assets than another can be said to be more sustainable, but there may still be trade-offs with one asset increasing as another falls. In practice, though, there are usually strong links between changes in natural, social and human capital (Pretty, 2003), with agricultural systems having many potential effects on all three. Agriculture is, therefore, fundamentally multifunctional. It jointly produces many unique non-food functions that cannot be produced by other economic sectors so efficiently. Clearly, a key policy challenge, for both industrialized and developing countries, is to find ways to maintain and enhance food production. But a key question is: can this be done whilst seeking both to improve the positive sideeffects and to eliminate the negative ones? It will not be easy, as past agricultural development has tended to ignore both the multifunctionality of agriculture and the considerable external costs.
Side-effects and Externalities There are surprisingly few data on the environmental and health costs imposed by agriculture on other sectors and interests. Agriculture can negatively affect the environment through overuse of natural resources as inputs or through their use as a sink for pollution. Such effects are called negative externalities because they are usually non-market effects and therefore their costs are not part of market prices. Negative externalities are one of the classic causes of market failure whereby the polluter does not pay the full costs of their actions, and therefore these costs are called external costs (Baumol and Oates, 1988; Pretty et al, 2000, 2003a; Dobbs and Pretty, 2004).
Overview to Four Volumes: Sustainable Agriculture and Food xxvii
Externalities in the agricultural sector have at least four features: (i) their costs are often neglected; (ii) they often occur with a time lag; (iii) they often damage groups whose interests are not well represented in political or decision-making processes; and (iv) the identity of the source of the externality is not always known. For example, farmers generally have few incentives to prevent some pesticides escaping to water-bodies, to the atmosphere and to nearby natural systems as they transfer the full cost of cleaning up the environmental consequences to society at large. In the same way, pesticide manufacturers do not pay the full cost of all their products, as they do not have to pay for any adverse side effects that may occur. Partly as a result of a lack of information, there is little agreement on the economic costs of externalities in agriculture. Some authors suggest that the current system of economic calculations grossly underestimates the current and future value of natural capital (Abramovitz, 1997; Costanza et al, 1997; Daily, 1997; MEA, 2005). However, such valuation of ecosystem services remains controversial because of methodological and measurement problems (Georghiou et al, 1998; Hanley et al, 1998; Farrow et al, 2000; Carson, 2000) and because of the role monetary values have in influencing public opinions and policy decisions. What has become clear in recent years is that the success of modern agriculture has masked some significant negative externalities, with environmental and health problems recently costed for Ecuador, China, Germany, the Philippines, the UK and the USA (Pingali and Roger, 1995; Crissman et al, 1998; Waibel et al, 1999; Pretty et al, 2000, 2001, 2003a, 2005; Cuyno et al, 2001; Norse et al, 2001; Buttel, 2003; Tegtmeier and Duffy, 2004; Sherwood et al, 2005). These environmental costs begin to change conclusions about which agricultural systems are the most efficient, and suggest that alternatives which reduce externalities should be sought. Examples of costs in developing countries include The Philippines, where agricultural systems that do not use pesticides result in greater net social benefits because of the reduction in illnesses among farmers and their families, and the associated treatment costs (Rola and Pingali, 1993; Pingali and Roger, 1995). In China, the externalities of pesticides used in rice systems cause US$1.4 billion of costs per year through health costs to people, and adverse effects on both on- and off-farm biodiversity (Norse et al, 2001). In Ecuador, annual mortality in the remote highlands due to pesticides is among the highest reported anywhere in the world at 21 people per 100,000 people, and so the economic benefits of IPMbased systems that eliminate these effects are increasingly beneficial (Sherwood et al, 2005). In the UK, agricultural externalities have been calculated to be some £1.5 billion per year in the late 1990s (Pretty et al, 2000, 2001). These, though, are exceeded by the environmental costs of transporting food from farm to retail outlet to place of consumption – these ‘food miles’ in the UK result in a further £3.8 billion of environmental costs per year (Pretty et al, 2005). These data suggest that all types of agricultural systems impose some kinds of costs on the environment. It is, therefore, impossible to draw a boundary between what is and is not sustainable. If the external costs are high and can be reduced by
xxviii Sustainable Agriculture and Food
the adoption of new practices and technologies, then this is a move towards sustainability. Agricultural sustainability is thus partly a matter of judgement, which in turn depends on the comparators and baselines chosen. One system may be said to be more sustainable relative to another if its negative externalities are lower. Monetary criteria do, though, only capture some of the values of agricultural systems and the resources upon which they impinge (Carson, 2000), and so choices may depend on wider questions about the sustainability of farm practices (on farm, in field) and the sustainability of whole landscapes (interactions between agricultural and wild habitats) (Green et al, 2005).
Improving Natural Capital for Agroecosystems Agricultural sustainability emphasizes the potential benefits that arise from making the best use of both genotypes of crops and animals and their agroecological management. Agricultural sustainability does not, therefore, mean ruling out any technologies or practices on ideological grounds (e.g. genetically modified or organic crops) – provided they improve biological and/or economic productivity for farmers, and do not harm the environment (NRC, 2000; Pretty, 2001; Uphoff, 2002; Nuffield Council on Bioethics, 2004). Agricultural sustainability, therefore, emphasizes the potential dividends that can come from making the best use of the genotypes (G) of crops and animals and the ecological (Ec) conditions under which they are grown or raised. The outcome is a result of this G×Ec interaction (Khush et al, 1998). Agricultural sustainability suggests a focus on both genotype improvements through the full range of modern biological approaches, as well as improved understanding of the benefits of ecological and agronomic management, manipulation and redesign. Agricultural systems, or agroecosystems, are amended ecosystems (Conway, 1985; Gliessman, 1998; 2005; Olsson and Folke, 2001; Dalgaard et al, 2003; Odum and Barrett, 2004; Swift et al, 2004) that have a variety of different properties (Table 2). Modern agricultural systems have amended some of these properties to increase productivity. Sustainable agroecosystems, by contrast, have to seek to shift some of these properties towards natural systems without significantly trading off productivity. Modern agroecosystems have, for example, tended towards high through-flow systems, with energy supplied by fossil fuels directed out of the system (either deliberately for harvests or accidently through side effects). For a transition towards sustainability, renewable sources of energy need to be maximized, and some energy flows directed to fuel essential internal trophic interactions (e.g. to soil organic matter or to weeds for arable birds) so as to maintain other ecosystem functions (Rydberg and Jansén, 2002; Champion et al, 2003; Haberl et al, 2004; Firbank et al, 2005). All annual crops, though, are derived from opportunists, and so their resource use is inherently different to perennials.
Overview to Four Volumes: Sustainable Agriculture and Food xxix Table 2 Properties of natural ecosystems compared with modern and sustainable agroecosystems Property
Natural ecosystem
Modern Sustainable agroecosystem agroecosystem
Productivity
Medium
High
Medium (possibly high)
Species diversity
High
Low
Medium Medium–high
Functional diversity
High
Low
Output stability
Medium
Low–medium
High
Biomass accumulation
High
Low
Medium–high
Nutrient recycling
Closed
Open
Semi-closed
Trophic relationships
Complex
Simple
Intermediate
Natural population regulation
High
Low
Medium–high
Resilience
High
Low
Medium
Dependence on external inputs Low
High
Medium
Human displacement of ecological processes
Low
High
Low–medium
Sustainability
High
Low
High
Source: Gliessman, 2005
Modern agriculture has also come to rely heavily on nutrient inputs obtained from or driven by fossil fuel-based sources. Nutrients are also used inefficiently, and together with certain products (e.g. ammonia, nitrate, methane, carbon dioxide), are lost to the environment. For sustainability, nutrient leaks need to be reduced to a minimum, recycling and feedback mechanisms introduced and strengthened, and nutrients and materials diverted to capital accumulation. Agroecosystems are considerably more simplified than natural ecosystems, and loss of biological diversity (to improve crop and livestock productivity) results in the loss of some ecosystem services, such as pest and disease control (Gallagher et al, 2005). For sustainability, biological diversity needs to be increased to recreate natural control and regulation functions, and to manage pests and diseases rather than seeking to eliminate them. Mature ecosystems are now known to be not stable and unchanging, but in a state of dynamic equilibrium that buffers against large shocks and stresses. Modern agroecosystems have weak resilience, and for transitions towards sustainability need to focus on structures and functions that improve resilience (Holling et al, 1998; Folke et al, 2005). But converting an agroecosystem to a more sustainable design is complex, and generally requires a landscape or bioregional approach to restoration or management (Kloppenburg et al, 1996; Higgs, 2003; Jordan, 2003; Odum and Barrett, 2004; Swift et al, 2004; Terwan et al, 2004). An agroecosystem is a bounded system designed to produce food and fibre, yet it is also part of a wider landscape at which scale a number of ecosystem functions are important (Gliessman, 2005). For sustainability, interactions need to be developed between agroecosystems and
xxx Sustainable Agriculture and Food
whole landscapes of other farms and non-farmed or wild habitats (e.g. wetlands, woods, riverine habitats), as well as social systems of food procurement. Mosaic landscapes with a variety of farmed and non-farmed habitats are known to be good for birds as well as farms (Bignall and McCracken, 1996; Shennan et al, 2005; Woodhouse et al, 2005). There are several types of resource-conserving technologies and practices that can be used to improve the stocks and use of natural capital in and around agroecosystems. These are: 1
2
3 4 5 6 7
Integrated pest management, which uses ecosystem resilience and diversity for pest, disease and weed control, and seeks only to use pesticides when other options are ineffective (e.g. Lewis et al, 1997; Gallagher et al, 2005; Herren et al, 2005). Integrated nutrient management, which seeks both to balance the need to fix nitrogen within farm systems with the need to import inorganic and organic sources of nutrients, and to reduce nutrient losses through erosion control (Crews and Peoples, 2004; Leach et al, 2004). Conservation tillage, which reduces the amount of tillage, sometime to zero, so that soil can be conserved and available moisture used more efficiently (Petersen et al, 2000; Holland, 2004). Agroforestry, which incorporates multifunctional trees into agricultural systems, and collective management of nearby forest resources (Leakey et al, 2005). Aquaculture, which incorporates fish, shrimps and other aquatic resources into farm systems, such as into irrigated rice fields and fish ponds, and so leads to increases in protein production (Bunting, 2007). Water harvesting in dryland areas, which can mean formerly abandoned and degraded lands can be cultivated, and additional crops grown on small patches of irrigated land owing to better rain water retention (Pretty, 1995; Reij, 1996). Livestock integration into farming systems, such as dairy cattle, pigs and poultry, including using zero-grazing cut and carry systems (Altieri, 1995).
Many of these individual technologies are also multifunctional (Pretty, 1995; Lewis et al, 1997). This implies that their adoption should mean favourable changes in several components of the farming system at the same time. For example, hedgerows and alley crops encourage predators and act as windbreaks, so reducing soil erosion. Legumes introduced into rotations fix nitrogen, and also act as a break crop to prevent carry-over of pests and diseases. Grass contour strips slow surface water run-off, encourage percolation to groundwater, and can be a source of fodder for livestock. Catch crops prevent soil erosion and leaching during critical periods, and can also be ploughed in as a green manure. The incorporation of green manures not only provides a readily available source of nutrients for the growing crop but also increases soil organic matter and hence water retentive capacity, further reducing susceptibility to erosion.
Overview to Four Volumes: Sustainable Agriculture and Food xxxi
Although many resource-conserving technologies and practices are currently being used, the total number of farmers using them worldwide is still relatively small. This is because their adoption is not a costless process for farmers. They cannot simply cut their existing use of fertilizer or pesticides and hope to maintain outputs, so making operations more profitable. They also cannot simply introduce a new productive element into their farming systems, and hope it succeeds. These transition costs arise for several reasons. Farmers must first invest in learning (Orr, 1992; Röling and Wagermakers, 1997; Bentley et al, 2003; Lieblin et al, 2004; Bawden, 2005; Chambers, 2005). As recent and current policies have tended to promote specialized, non-adaptive systems with a lower innovation capacity, so farmers have to spend time learning about a greater diversity of practices and measures (Gallagher et al, 2005). Lack of information and management skills is, therefore, a major barrier to the adoption of sustainable agriculture. During the transition period, farmers must experiment more, and so incur the costs of making mistakes as well as of acquiring new knowledge and information. The on-farm biological processes that make sustainable agroecosystems productive also take time to become established. These include the rebuilding of depleted natural buffers of predator stocks and wild host plants; increasing the levels of nutrients; developing and exploiting microenvironments and positive interactions between them; and the establishment and growth of trees. These higher variable and capital investment costs must be incurred before returns increase. Examples include costs for: labour in the construction of soil and water conservation measures; the planting of trees and hedgerows; pest and predator monitoring and management; fencing of paddocks; the establishment of zerograzing units; and the purchase of new technologies, such as manure storage equipment or global positioning systems for tractors. It has also been argued that farmers adopting more sustainable agroecosystems are internalizing many of the agricultural externalities associated with intensive farming, and so could be compensated for effectively providing environmental goods and services. Providing such compensation or incentives would be likely to increase the adoption of resource conserving technologies (Dobbs and Pretty, 2004). Nonetheless, periods of lower yields seem to be more apparent during conversions of industrialized agroecosystems. There is growing evidence to suggest that most pre-industrial and modernized farming systems in developing countries can make rapid transitions to both sustainable and productive farming.
Social Learning and Asset Building The term participation is now part of the normal language of most development and conservation agencies. It has become such a fashion that almost everyone says that it is part of their work. This has created many paradoxes, as it is easy to misinterpret the term. In conventional development, participation has commonly
xxxii Sustainable Agriculture and Food
centred on encouraging local people to contribute their labour in return for food, cash or materials. But material incentives distort perceptions, create dependencies, and give the misleading impression that local people are supportive of externally driven initiatives. When little effort is made to build local interests and capacity, then people have no stake in maintaining structures or practices once the flow of incentives stops. If people do not cross a cognitive frontier, then there will be no ecological literacy. The dilemma for authorities is that they both need and fear people’s participation. They need people’s agreement and support, but they fear that wider and openended involvement is less controllable. But if this fear permits only stage-managed forms of participation, then distrust and greater alienation are the most likely outcomes. Participation can mean finding something out and proceeding as originally planned. Alternatively, it can mean developing processes of collective learning that change the way that people think and act. The many ways that organizations interpret and use the term participation range from passive participation, where people are told what is to happen and act out predetermined roles, to self-mobilization, where people take initiatives independently of external institutions (Pretty, 1995). Agricultural development often starts with the notion that there are technologies that work, and so it is just a matter of inducing or persuading farmers to adopt them (Leeuwis, 2004). But the problem is that the imposed models look good at first, and then tend to fade away (Kerr et al, 1999). Alley cropping, an agroforestry system comprising rows of nitrogen-fixing trees or bushes separated by rows of cereals, has long been the focus of research. Many productive and sustainable systems, needing few or no external inputs, have been developed. They stop erosion, produce food and wood, and can be cropped over long periods. But the problem is that very few farmers have adopted these systems as designed – they appear to have been produced as suitable largely only for research stations, with their plentiful supplies of labour and resources and standardized soil conditions. It is critical that sustainable agriculture and conservation management do not prescribe concretely defined sets of technologies and practices. This only serves to restrict the future options of farmers and rural people. As conditions change and as knowledge changes, so must the capacity of farmers and communities be enhanced to allow them to change and adapt too. Agricultural sustainability should not imply simple models or packages to be imposed. Rather it should be seen as a process of social learning, and emergent technologies fitted to specific local circumstances. This centres on building the capacity of farmers and their communities to learn about the complex ecological and biophysical complexity in their fields and farms, and then to act on this information. The process of learning, if it is socially embedded and jointly engaged upon, provokes changes in behaviour and can bring forth a new world (Maturana and Varela, 1992). What lessons have we learned from programmes that successfully promote social learning and sustainable natural resource management? The first is that sustainability is an emergent property of systems high in social, human and natural
Overview to Four Volumes: Sustainable Agriculture and Food xxxiii
capital. When these assets are in decline, then we are retreating from sustainability. Next is the recognition that farmers can improve their agroecological understanding of the complexities of their farms and related ecosystems, and that new information can lead to improved agricultural outcomes. In turn, increased understanding is also an emergent property, derived in particular from farmers engaging in their own experimentation, supported by scientists and extensionists, leading to the development of novel technologies and practices. These are more likely to spread from farmer to farmer, and from group to group. These conclusions strongly suggest that social learning processes should become an important focus for all agricultural and natural resource management programmes, and that professionals should make every effort to appreciate both the complementarity of such social processes with sustainable technology development and spread, and the subtlety and care required in their implementation. What can be done both to encourage the greater adoption of group-based programmes for environmental improvements, and to identify the necessary support for groups to evolve to maturity, and thence to spread and connect with others? Clearly, international agencies, governments, banks and non-government organizations should invest more in social and human capital creation. It is not costless to build human capital and establish new forms of organization and social capital. The main danger lies in being satisfied with any degree of partial progress, and so not going far enough. Of course, group-based approaches alone are not sufficient conditions for achieving sustainable natural resource management. Policy reform is an additional requirement for shaping the wider context, in order to make it more favourable to the emergence and sustenance of local groups. This has clearly worked in countries such as India, Sri Lanka and Australia. One way to ensure the stability of social connectedness is for groups to work together by federating to influence district, regional or even national bodies. This can open up economies of scale to bring greater economic and ecological benefits. The emergence of such federated groups with strong leadership also makes it easier for government and non-governmental organizations to develop direct links with poor and formerly excluded groups, although if these groups were dominated by the wealthy, the opposite would be true. This could result in greater empowerment of poor households, as they draw on public services more efficiently. Such interconnectedness between groups is more likely to lead to improvements in natural resources than regulatory schemes alone (Röling and Wagemakers, 1997; Dobbs and Pretty, 2004). But this raises further questions. How, too, can policy makers protect existing programmes in the face of new threats? What will happen to state–community relations when social capital in the form of local associations and their federated bodies spreads to very large numbers of people? Will the state colonize these groups, or will new broad-based forms of democratic governance emerge? Important questions also relate to the groups themselves. Good programmes may falter if individuals start to ‘burn out’, feeling that investments in social capital are no longer paying. It is vitally important that policy makers and practitioners continue to seek
xxxiv Sustainable Agriculture and Food
ways to provide support for the processes that both help groups to form, and help them mature along the lines that local people desire and need, and from which natural environments will benefit. There are also persistent concerns that the establishment of new community institutions and users’ groups may not always benefit the poor. There are signs that they can all too easily become a new rhetoric without fundamentally improving equity and natural resources. If, for example, joint forest management becomes the new order of the day for foresters, then there is a very real danger that some will coerce local people into externally run groups so that targets and quotas are met. This is an inevitable part of any transformation process. The old guard adopts the new language, implies they were doing it all the time, and nothing really changes. But this is not a reason for abandoning the new. Just because some groups are captured by the wealthy, or are run by government staff with little real local participation, does not mean that all are fatally flawed. What it does show clearly is that the critical frontiers are inside us. Transformations must occur in the way we all think if there are to be real and large-scale transformations in the land and the lives of people.
Effects of Sustainable Agriculture on Yields One persistent question regarding the potential benefits of more sustainable agroecosystems centres on productivity trade-offs. If environmental goods and services are to be protected or improved, what then happens to productivity? If it falls, then more land will be required to produce the same amount of food, thus resulting in further losses of natural capital (Green et al, 2005). As indicated earlier, the challenge is to seek sustainable intensification of all resources in order to improve food production. In industrialized farming systems, this has proven to be impossible to do with organic production systems, as food productivity is lower for both crop and livestock systems (Lampkin and Padel, 1994; Caporali et al, 2003). Nonetheless, there are now some 3Mha of agricultural land in Europe managed with certified organic practices. Some have led to lower energy use (though lower yields too); others to better nutrient retention, and some greater nutrient losses (Dalgaard et al, 1998, 2002; Løes and Øgaard, 2003; Gosling and Shepherd, 2004), and some to greater labour absorption (Morison et al, 2005). Many other farmers have adopted integrated farming practices, which represent a step or several steps towards sustainability. What has become increasingly clear is that many modern farming systems are wasteful, as integrated farmers have found they can cut down many purchased inputs without losing out on profitability (EA, 2005). Some of these cuts in use are substantial, others are relatively small. By adopting better targeting and precision methods, there is less wastage and so more benefit to the environment. They can then make greater cuts in input use once they substitute some regenerative technologies for external inputs, such as
Overview to Four Volumes: Sustainable Agriculture and Food xxxv
legumes for inorganic fertilizers or predators for pesticides. Finally, they can replace some or all external inputs entirely over time once they have learned their way into a new type of farming characterized by new goals and technologies (Pretty and Ward, 2001). What is clear is that resource-conserving and regenerative technologies are spreading. In Denmark, some 150 farms have in-field weather stations to help predict disease outbreaks in potatoes, leading to cuts in fungicide use, with some growers able to postpone first applications for five or more weeks. In the UK, some 150,000 hectares of cereal farms were computer-mapped in the early 2000s, enabling inputs to be targeted more precisely and the total use of pesticide and fertilizer to be cut. Also in the UK, three-quarters of crops grown in glasshouses use natural predators to control pests rather than pesticides. In France, there are 700 farms in the national network researching and implementing ‘agriculture durable’. In the state of Baden-Württemberg in southern Germany, 100,000 farms are using sustainable practices and technologies, though not all are integrated at the whole farm level. In Australia, one third of all farmers are members of Landcare groups. The organic revolution also continues, with demand from consumers growing, and the number of farmers converted entirely to organic practices in industrialized countries continues to grow rapidly. However, it is in developing countries that some of the most significant progress towards sustainable agroecosystems has been made in the past decade (Uphoff, 2002; McNeely and Scherr, 2003; Pretty et al, 2003b). The largest study comprised the analysis of 286 projects in 57 countries (Pretty et al, 2006). This involved the use of both questionnaires and published reports by projects to assess changes over time. As in earlier research (Pretty et al, 2003b), data were triangulated from several sources, and cross-checked by external reviewers and regional experts. The study involved analysis of projects sampled once in time (n = 218) and those sampled twice over a 4-year period (n = 68). Not all proposed cases were accepted for the dataset, and rejections were based on a strict set of criteria. As this was a purposive sample of ‘best practice’ initiatives, the findings are not representative of all developing country farms. Table 3 contains a summary of the location and extent of the 286 agricultural sustainability projects across the eight categories of FAO farming systems (Dixon et al, 2001) in the 57 countries. In all, some 12.6 million farmers on 37 million hectares were engaged in transitions towards agricultural sustainability in these 286 projects. This is just over 3 per cent of the total cultivated area (1136 million ha) in developing countries. The largest number of farmers was in wetland ricebased systems, mainly in Asia (category 2), and the largest area was in dualistic mixed systems, mainly in southern Latin America (category 6). This study showed that agricultural sustainability was spreading to more farmers and hectares. In the 68 randomly re-sampled projects from the original study, there was a 54 per cent increase over the four years in the number of farmers, and 45 per cent in the number of hectares. These resurveyed projects comprised 60 per cent of the farmers and 44 per cent of the hectares in the original sample of 208 projects.
xxxvi Sustainable Agriculture and Food Table 3 Summary of adoption and impact of agricultural sustainability technologies and practices on 286 projects in 57 countries FAO farm system category1 1. Smallholder irrigated
Number of farmers adopting 177,287
Number of hectares Average % increase under sustainable in crop yields2 agriculture 357,940
129.8 (±21.5)
2. Wetland rice
8,711,236
7,007,564
22.3 (±2.8)
3. Smallholder rainfed humid
1,704,958
1,081,071
102.2 (±9.0)
4. Smallholder rainfed highland
401,699
725,535
107.3 (±14.7)
5. Smallholder rainfed dry/cold
604,804
737,896
99.2 (±12.5)
6. Dualistic mixed
537,311
26,846,750
76.5 (±12.6)
7. Coastal artisanal
220,000
160,000
62.0 (±20.0)
8. Urban-based and kitchen garden
207,479
36,147
146.0 (±32.9)
12,564,774
36,952,903
All projects
79.2 (±4.5)
1
Farm categories from Dixon et al (2001). Yield data from 360 crop-project combinations; reported as % increase (thus a 100% increase is a doubling of yields). Standard errors in brackets.
2
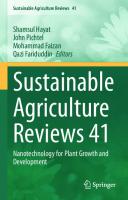
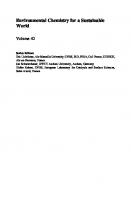
For the 360 reliable yield comparisons from 198 projects, the mean relative yield increase was 79 per cent across the very wide variety of systems and crop types. However, there was a wide spread in results (Figure 3). While 25 per cent of projects reported relative yields greater than 2.0 (i.e. 100 per cent increase), half of all the projects had yield increases of between 18 per cent and 100 per cent. The geometric mean is a better indicator of the average for such data with a positive skew, but this still shows a 64 per cent increase in yield. These sustainable agroecosystems also have positive side effects, helping to build natural capital, strengthen communities (social capital) and develop human capacities (Ostrom, 1990; Pretty, 2003). Examples of positive side effects recently recorded in various developing countries include: •
• •
improvements to natural capital, including increased water retention in soils, improvements in water table (with more drinking water in the dry season), reduced soil erosion combined with improved organic matter in soils, leading to better carbon sequestration, and increased agro-biodiversity; improvements to social capital, including more and stronger social organizations at local level, new rules and norms for managing collective natural resources, and better connectedness to external policy institutions; improvements to human capital, including more local capacity to experiment and solve own problems; reduced incidence of malaria in rice–fish zones,
Overview to Four Volumes: Sustainable Agriculture and Food xxxvii
Note: Only field crops with n > 9 are shown.
Figure 3 Relationship between relative changes in crop yield after (or with project) to yield before (or without project)
increased self-esteem in formerly marginalized groups, increased status of women, better child health and nutrition, especially in dry seasons, and reversed migration and more local employment. What we do not know, however, is the full economic benefits of these spin-offs. In many industrialized countries, agriculture is now assumed to contribute very little to GDP, leading many commentators to assume that agriculture is not important for modernized economies (NRC, 2000). But such a conclusion is a function of the fact that too few measures are being made of the positive side effects of agriculture (MEA, 2005). In poor countries, where financial support is limited and markets weak, then people rely even more on the value they can derive from the natural environment and from working together to achieve collective outcomes.
xxxviii Sustainable Agriculture and Food
Effects of Sustainable Agriculture on Pesticide Use and Yields Recent integrated pest management (IPM) programmes, particularly in developing countries, are beginning to show how pesticide use can be reduced and pest management practices can be modified without yield penalties (Heong et al, 1999; Brethour and Weerskink, 2001; Wilson and Tisdell, 2001; Gallagher et al, 2005; Herren et al, 2005; Pretty and Waibel, 2005). In principle, there are four possible trajectories of impact if IPM is introduced: 1 2 3 4
both pesticide use and yields increase (A); pesticide use increases but yields decline (B); both pesticide use and yields fall (C); pesticide use declines, but yields increase (D).
The assumption in modern agriculture is that pesticide use and yields are positively correlated. For IPM, the trajectory moving into sector A is therefore unlikely but not impossible, for example in low-input systems. What is expected is a move into sector C. While a change into sector B would be against economic rationale, farmers are unlikely to adopt IPM if their profits would be lowered. A shift into sector D would indicate that current pesticide use has negative yield effects or that the amount saved from pesticides is reallocated to other yield increasing inputs. This could be possible with an excessive use of herbicides or when pesticides cause outbreaks of secondary pests, such as observed with the brown plant hopper in rice (Kenmore et al, 1984). Figure 4 shows data from 62 IPM initiatives in 26 developing and industrialized countries (Australia, Bangladesh, China, Cuba, Ecuador, Egypt, Germany, Honduras, India, Indonesia, Japan, Kenya, Laos, Nepal, the Netherlands, Pakistan, the Philippines, Senegal, Sri Lanka, Switzerland, Tanzania, Thailand, the UK, the USA, Vietnam and Zimbabwe) (Pretty and Waibel, 2005). The 62 IPM initiatives have some 5.4 million farm households on 25.3Mha. The evidence on pesticide use is derived from data on both the number of sprays per hectare and the amount of active ingredient used per hectare. This analysis does not include recent evidence on the effect of some genetically modified crops, some of which result in reductions in the use of herbicides (Champion et al, 2003) and pesticides (Nuffield Council on Bioethics, 2004), and some of which have led to increases (Benbrook, 2003). There is only one sector B case reported in recent literature (Feder et al, 2004). Such a case has recently been reported from Java for rice farmers. The cases in sector C, where yields fall slightly while pesticide use falls dramatically, are mainly cereal farming systems in Europe, where yields typically fall to some 80 per cent of current levels while pesticide use is reduced to 10–90 per cent of current levels (Pretty, 1998; Röling and Wagemakers, 1997). Sector A contains 10 projects where
Overview to Four Volumes: Sustainable Agriculture and Food xxxix
Note: Data from 80 crop combinations, 62 projects, 26 countries.
Figure 4 Association between pesticide use and crop yields
total pesticide use has indeed increased in the course of IPM introduction. These are mainly in zero-tillage and conservation agriculture systems, where reduced tillage creates substantial benefits for soil health and reduces off-site pollution and flooding costs. These systems usually require an increased use of herbicides for weed control (de Freitas, 1999), although there are some examples of organic zero-tillage systems (Petersen et al, 2000). Over 60 per cent of the projects are in category D where pesticide use declines and yields increase. While pesticide reduction is to be expected, as farmers substitute pesticides by information, yield increases induced by IPM are a more complex issue. It is likely, for example, that farmers who receive good quality field training will not only improve their pest management skills but also become more efficient in other agronomic practices such as water, soil and nutrient management. They can also invest some of the cash saved from pesticides in other inputs such as higher quality seeds and inorganic fertilizers.
Effects on Carbon Balances The 1997 Kyoto Protocol to the UN Framework Convention on Climate Change established an international policy context for the reduction of carbon emissions
xl Sustainable Agriculture and Food
and increases in carbon sinks in order to address the global challenge of anthropogenic interference with the climate system. It is clear that both emission reductions and sink growth will be necessary for mitigation of current climate change trends (Watson et al, 2000; IPCC, 2001, 2007; Royal Society, 2001; Swingland, 2003; Oelbermann et al, 2004). A source is any process or activity that releases a greenhouse gas, or aerosol or a precursor of a greenhouse gas into the atmosphere, whereas a sink is a mechanism that removes these from the atmosphere. Carbon sequestration is defined as the capture and secure storage of carbon that would otherwise be emitted to or remain in the atmosphere. Agricultural systems emit carbon through the direct use of fossil fuels in food production, the indirect use of embodied energy in inputs that are energy-intensive to manufacture, and the cultivation of soils and/or soil erosion resulting in the loss of soil organic matter. Agriculture also contributes to climate change through emissions of methane from irrigated rice systems and ruminant livestock. The direct effects of land use and land use change (including forest loss) have led to a net emission of 1.7Gt C yr–1 in the 1980s and 1.6Gt C yr–1 in the 1990s (Watson et al, 2000; Bellamy et al, 2005). On the other hand, agriculture can also be an accumulator of carbon when organic matter is accumulated in the soil, and when above-ground biomass acts either as a permanent sink or is used as an energy source that substitutes for fossil fuels and so avoids carbon emissions. There are three main mechanisms and 21 technical options (Table 4) through which positive actions can be taken by farmers by: A increasing carbon sinks in soil organic matter and above-ground biomass; B avoiding carbon dioxide or other greenhouse gas emissions from farms by reducing direct and indirect energy use; C increasing renewable energy production from biomass that either substitutes for consumption of fossil fuels or replaces inefficient burning of fuelwood or crop residues, and so avoids carbon emissions.
Social Outcomes in Developing Countries At some locations, agroecological approaches have had a significant impact on labour markets. Some practices result in increased on-farm demand for labour (e.g. water harvesting in Niger), whilst others actually reduce labour demand (e.g. zerotillage in Brazil). Some result in the opening up of whole new seasons for agricultural production, particularly in dryland contexts, through improved harvesting of rainfall, leading to much greater demand for labour. Migration reversals can also occur when wage labour opportunities increase as part of the project (e.g. watershed improvements), when more productive agriculture leads to higher wages and employment, when there are higher returns to agriculture, and when there are
Overview to Four Volumes: Sustainable Agriculture and Food xli Table 4 Mechanisms for increasing carbon sinks and reducing CO2 and other greenhouse gas emissions in agricultural systems Mechanism A. Increase carbon sinks in soil organic matter and above-ground biomass • • • • • • • • • •
Replace inversion ploughing with conservation- and zero-tillage systems Adopt mixed rotations with cover crops and green manures to increase biomass additions to soil Adopt agroforestry in cropping systems to increase above-ground standing biomass Minimize summer fallows and periods with no ground cover to maintain soil organic matter stocks Use soil conservation measures to avoid soil erosion and loss of soil organic matter Apply composts and manures to increase soil organic matter stocks Improve pasture/rangelands through grazing, vegetation and fire management both to reduce degradation and increase soil organic matter Cultivate perennial grasses (60–80% of biomass below ground) rather than annuals (20% below ground) Restore and protect agricultural wetlands Convert marginal agricultural land to woodlands to increase standing biomass of carbon
Mechanism B. Reduce direct and indirect energy use to avoid greenhouse gas emissions (CO2, CH4 and N2O) • • • • • • •
Conserve fuel and reduce machinery use to avoid fossil-fuel consumption Use conservation or zero-tillage to reduce CO2 emissions from soils Adopt grass-based grazing systems to reduce methane emissions from ruminant livestock Use composting to reduce manure methane emissions Substitute biofuel for fossil fuel consumption Reduce the use of inorganic N fertilizers (as manufacture is highly energyintensive), and adopt targeted- and slow-release fertilizers Use integrated pest management to reduce pesticide use (avoid indirect energy consumption)
Mechanism C. Increase biomass-based renewable energy production to avoid carbon emissions • • • •
Cultivate annual crops for biofuel production, such as ethanol from maize and sugar cane Cultivate annual and perennial crops, such as grasses and coppiced trees, for combustion and electricity generation, with crops replanted each cycle for continued energy production Use biogas digesters to produce methane, so substituting for fossil fuel sources Use improved cookstoves to increase efficiency of biomass fuels
Source: Pretty et al, 2002
overall improvements in village conditions, such as infrastructure and services. Improvements in urban gardening have led to increases in employment (Funes et al, 2002).
xlii Sustainable Agriculture and Food
There are several documented cases where these approaches have helped to reverse seasonal or even long-term migration. In the Guinope and Cantarranas regions of Honduras, families returned from the capital city to take up labour opportunities brought by rural economic growth centred on improved agricultural productivity. In India, seasonal migration from a number of rainfed projects (e.g. in Maharashtra, Gujarat and Tamil Nadu) declined as sufficient water becomes available to crop in the dry season, with women in particular benefiting from being able to remain at home all year. In Niger, young men have been able to form labour-societies to meet the demand for water-harvesting construction, rather than migrate to the coast for work (Reij, 1996; Bunch and Lopez, 1999; Pretty, 2002; Kabore and Reij, 2004) However, in some locations increasing labour requirements may be an impediment to adoption, and farmers may actually desire labour-saving technologies and practices. All transformations in agricultural systems are costly, thus always mitigating against the poorest households and economies. Given the appropriate institutional conditions, poor households may, however, be able to make use of new configurations of human and social capital to make more productive use of natural capital and available technologies. In some areas, but not all, this also means an increase in on-farm labour requirements. Within households, such additional labour is often supplied by women rather than men. Where labour is scarce, such as in HIV-affected populations, or where women suffer a particularly heavy double load of domestic and agricultural labour, or when there are significant off-farm labour opportunities (e.g. 52 per cent of rural household income in Latin America comes from non-agricultural employment) then technologies for agricultural sustainability will either need to emphasize labour saving or result in sufficiently high productivity gains that labour can be hired. Examples of the former include zero-tillage using herbicides for weed control in Brazil and Argentina, and legumes as green manures and cover crops in Central America. Examples of the latter include raised-bed vegetable technology for women’s groups in East Africa and fish-raising in paddy fields in South Asia. What we do not know is how internal labour markets will affect incentives to work in agriculture and rural regions, and how best to promote regional rural development based on agricultural intensification. Sustainable agriculture has the potential directly and indirectly to influence the health of rural people. In the first instance, improved food supply throughout the year has a fundamental impact on health, which in turn allows adults to be more productive, and children to attend school and still be able to concentrate on learning. In Kenya, for example, the simple technology of double-dug beds has improved domestic food supply for several tens of thousands of households by producing a year-round supply of vegetables. It is children who have been noted as major beneficiaries. In some cases, a more sustainable agriculture can also help to remove threats to health in the environment – such as consumption of mosquito larva by fish in rice fields – with measurable reductions in malaria incidence recorded in China. In Jiangsu Province, there has been rapid growth of rice aquaculture: from about
Overview to Four Volumes: Sustainable Agriculture and Food xliii
5000ha in 1994 to 117,000ha of rice–fish, rice–crab and rice–shrimp systems. Rice yields have increased by 10–15 per cent, but the greatest dividend is in protein: each mu (one fifteenth of a hectare) can produce 50kg of fish (Li Wenhua, 2001). Additional benefits come from reduced insecticide use, and measured reductions in malaria incidence owing to fish predation of mosquito larvae. Sustainable agriculture can also have an indirect effect on reproductive health. Where women are organized into groups, such as for microfinance delivery (credit and savings), livestock raising or watershed development, such social capital creation offers opportunities or ‘entry points’ for other sectors to interact closely with women. In Ecuador, for example, the World Neighbors (WN) programme working with remote rural communities on sustainable agriculture and natural resource management made a substantial impact on family planning. WN actively compared two types of programme in Guaranda canton, Bolivar Province, by working in six communities that only received health input, and another six that received an integrated programme involving soil and water conservation, green manures, vegetable gardening and farmer-experimentation with barley, wheat, maize and potato varieties, combined with group formation. The health interventions yielded few results. But the integrated approach brought pronounced changes in attitudes and values. Contraceptive use in these communities was double that in the ‘health only’ villages. The family planning clinic, on the verge of closure in 1992, provided 18,000 consultations in 1998 (Ruddell, 1995; Hinchcliffe et al, 1999; Uphoff, 2002). In Nepal, World Neighbors also found that reproductive health and family planning were not effective entry points. Instead, women’s reproductive health, status, work and fertility could be better addressed by forming and working with women’s savings and credit groups that could participate in planning a wide range of development activities. Confident groups with better literacy, income and food security were able to challenge traditional roles and norms, leading to capacity to deal directly with reproductive health. In certain circumstances, sustainable agriculture practices appear to be currently more accessible to larger farmers – particularly the zero-tillage systems in Argentina, Brazil and Paraguay. However, evidence from Paraguay and Brazil also suggests that larger numbers of small farmers are now adopting and adapting elements of these practices. It is important to note that adoption of conservation agriculture by large farmers may still result in significant regional change: ‘zerotillage has been a major factor in changing the top-down nature of agricultural services to farmers towards a participatory, on-farm approach’ (John Landers, pers. comm.). But in other contexts, sustainable agriculture has first been adopted by small farmers, and is only now spreading to larger ones once they have seen the initial success. In Bangladesh, the rice–fish and rice–IPM technologies were adopted by very small farmers first, with larger farmers attracted only when success had been proven. Can agroecological approaches result in improvements in livelihoods for landless families and the core poor? There are three possibilities: improvements to
xliv Sustainable Agriculture and Food
labour markets, improved access to land through land reform, or changed social norms that encourage greater equity and sharing. The first of these seems more likely than the others – though as noted above, some sustainable agriculture applications are favoured by farm families precisely because they reduce labour requirements. There is some evidence that social capital formation can result in new equitable arrangements within communities. Landless families, for example, have been given new opportunities to join farmers’ groups in western and central Kenya. Such changes cannot be directly attributed to sustainable agriculture – rather it is due to changes in values and norms arising from new configurations of local social capital.
Is There a Place for Genetic Modification? Only a few years after the development of the first genetically modified crops for agriculture, opinions on benefits and risk remain sharply divided. Some argue that genetically modified organisms are safe and essential for world progress; others state they are not needed, and hold too many risks. The first group believes that media manipulation and scaremongering are limiting useful technologies; the second that scientists, private companies and regulators are understating hazards for the sake of economic returns. Neither view is entirely correct, for one simple reason. Genetically modified organisms are not a single, simple technology (Pretty, 2001; GM Science Review, 2003; Nuffield Council on Bioethics, 2004). Each product brings different potential benefits for different stakeholders; each poses different environmental and health risks. It is, therefore, useful to distinguish between different generations of genetically modified technologies. The first generation technologies came into commercial use in the late 1990s and early 2000s, and have tended not to bring distinct consumer benefits, one reason why there is so much current public opposition. The realization of promised benefits to farmers and the environment has only been patchy. First generation technologies include herbicide-tolerant crops, insect-resistant crops, long-life tomatoes, bacteria in containment for the production of cheese and washing-powder enzymes, and flowers with amended colour. The second generation technologies comprise those already developed and tested, but not yet commercially released on a large scale, either because of uncertainties over the stability of the technology itself, or over concerns for potential environmental risks. Some of these applications are likely to bring more public and consumer benefits, and include a range of medical applications. These include viral resistance in rice, cassava, papaya, sweet potatoes, peppers; nematode resistance in various cereal and other crops, such as banana and potato; frost tolerance in strawberry, B.t. clover, trees with reduced lignin, vitamin A rice and bio-pharming with crops and animals for pharmaceuticals. The third generation technologies are those that are still far from market, but generally require a better understanding of whole gene complexes that control
Overview to Four Volumes: Sustainable Agriculture and Food xlv
such traits as drought- or salt-tolerance, and nitrogen-fixation. These are likely to bring more explicit consumer benefits than the first generation. These include stress tolerance in cereals, such as thermo, salt- and heavy metal-tolerance; drought resistance; physiological modifications of crops and trees to increase efficiency of resource use (nutrients, water, light) or delaying of ageing in leaves; neutraceuticals (crops boosted with vitamins/minerals); vaccine crops (such as banana and potato); designer crops modified to produce oils or plastics; the development of new markers to replace antibiotics; and legumes with increased tannins for bloat control in cattle. The first generation technologies have tended only to provide substantial private benefits for the companies producing them and farmers using them. Many of the later generation genetically modified organisms are, by contrast, more multifunctional and public-good oriented, although like all technologies clearly none are without risk. Modifications of crops with low value in rotations, such as legumes and oats, will make them more attractive to farmers because of high protein and energy content. Others will be more efficient in nitrogen use, so reducing nitrate leaching, or modifications of rhizobia could improve the nitrogen-fixing capacity of a wide range of crops. Both options would reduce the need to use nitrogen fertilizers. Although the pace of change in the development of GM has provoked many debates, there has been relatively little said about the potential benefits for developing countries. Many concerns are about important indirect effects, such as the growing centralization of world agriculture. These represent structural changes in agriculture in which GM crops are a contributor to change, but not necessarily the driver. These contested positions raise important questions. Will GM crops contribute to the further promotion of technological approaches to agricultural development? Could such technologies bring environmental benefits, and so promote sustainability? Are GM technologies essential for feeding a hungry world, or is hunger more a result of poverty, with poor consumers and farmers unable to afford modern, expensive technologies? Some say emphatically yes, often raising the spectre of famine and excessive population growth as a way to gain greater support for GM as a whole. But GM crops can only help to feed the world if attention is paid to the processes of technology development, to benefit-sharing, and to low-cost methods of production. Most commentators agree that food production will have to increase, and that this will have to come from existing farmland. But past approaches to modern agricultural development have not been successful in all parts of the world. In most contexts, people are hungry because they are poor. They simply do not have the money to buy either the food they need or the modern technologies that could increase their yields. What they need are readily available and cheap means to improve their farm productivity. So a cereal crop engineered to have bacteria on the roots to fix free nitrogen from the air, or another with the apomixis trait, would be a great benefit for poor farmers. But unless such technologies are cheap, they are unlikely to be accessible to the very people who need them most.
xlvi Sustainable Agriculture and Food
As indicated earlier, agroecological approaches and agricultural sustainability are now an increasingly viable option for many farmers in developing and industrialized countries alike. But where there are no alternatives to specific problems, then GM could bring forth novel and effective options. If research is conducted by public-interest bodies, such as universities, non-government organizations and governments themselves, whose concern is to produce public goods, then biotechnology could result in the spread of technologies that have immense benefits. Genetically modified organisms are not a single, homogeneous technology. Each application brings different potential benefits and risks for different stakeholders. Regulators, therefore, face special challenges in the face of rapidly developing technical applications. To date, the general approach to risk assessment in agriculture as a whole has been to establish rigorous procedures prior to release, but then to assume that farmers engage in ‘good agricultural practice’. The novel nature of emerging policies centres on a fundamental shift in risk assessment to a need to understand the effects of technologies in the field and on the farm. Much of the harm to the environment arises when technologies, whether pesticides, fertilizers or machinery, are not used in accordance with regulators’ criteria. The assessment of GMs will, however, now contain new requirements to assess the effects in the context of diverse farm practices, and how this interaction will affect desirable environmental outcomes, such as the integrity of local biodiversity. Such new risk assessments could have a positive side effect by increasing our understanding of agricultural–environment interactions in agricultural systems at large. There are many types of application of biotechnology, and likely to be several distinct generations of released technologies. It would be wrong, therefore, to generalize about genetic modification – each application needs to be addressed on a case-by-case basis. We need to ask questions about who produces each technology and why; whether it can benefit the poorest, and if so how will they access it; and whether it will have adverse or positive environmental and health side effects. It is likely that biotechnology will make some contributions to agricultural sustainability, but developing the research systems, institutions and policies to make them pro-poor will be more difficult.
Policy Challenges What we do not yet know is whether a transition to sustainable agriculture will result in enough food to meet the current food needs in developing and industrialized countries, let alone the future needs after continued population growth and the adoption of more urban and meat-rich diets. But what we are seeing is highly promising. There is also scope for additional confidence, as evidence indicates that productivity can grow over time if natural, social and human assets are accumulated. Sustainable agriculture systems appear to become more productive when human capacity increases, particularly in the form of farmers’ capacity to innovate
Overview to Four Volumes: Sustainable Agriculture and Food xlvii
and adapt their farm systems for sustainable outcomes. Sustainable agriculture is not a concretely defined set of technologies, nor is it a simple model or package to be widely applied or fixed with time. It needs to be conceived of as a process for social learning. Lack of information on agroecology and necessary skills to manage complex farms is a major barrier to the adoption of sustainable agriculture. A problem is that we know much less about these resource-conserving technologies than we do about the use of external inputs in modernized systems. So it is clear that the process by which farmers learn about technology alternatives is crucial. If they are enforced or coerced, then they may only be adopted for a limited period. But if the process is participatory and enhances farmers’ ecological literacy of their farms and resources, then the foundation for redesign and continuous innovation is laid. The idea of agricultural sustainability, therefore, raises important policy questions. In particular, should farmers receive public support for the public benefits they produce in addition to food? Should those that pollute have to pay for restoring the environment and human health? These two principles are called ‘the provider gets’ and ‘the polluter pays’, and they are important to both industrialized and developing countries. Three categories of policy instruments are available: advisory and institutional measures, regulatory and legal measures and economic instruments. In practice, effective pollution control and supply of desired public goods requires a mix of all three approaches, together with integration across sectors (MEA, 2005). Advisory and institutional measures have long formed the backbone of policies to internalize costs and so prevent agricultural pollution. These rely on the voluntary actions of farmers, and are favoured by policy makers because they are cheap and adaptable. Advice is commonly given in the form of codes of good agricultural practice, such as recommended rates of application of pesticides and fertilizer, or measures for soil erosion control. Most governments still employ extension agents to work with farmers on technology development and transfer. A variety of institutional mechanisms can also help to increase social capital and the uptake of more sustainable practices, including encouraging farmers to work together in study groups, investing in extension and advisory services to encourage greater interaction between farmers and extensionists, and encouraging new partnerships between farmers and other rural stakeholders, as regular exchanges and reciprocity increase trust and confidence, and lubricate cooperation. Regulatory and legal measures are also used to internalize external costs. This can be done either by setting emissions standards for the discharge of a pollutant, or by establishing quality standards for the environment receiving the pollutant. Polluters who exceed standards are then subject to penalties. There are many types of standards, such as operating standards to protect workers, production standards to limit levels of contaminants of residues in foods, emissions standards to limit releases or discharges, such as silage effluents, and environmental quality standards for undesirable pollutants in vulnerable environments, such as pesticides in water. But the problem with such regulations is that most agricultural pollutants
xlviii Sustainable Agriculture and Food
are diffuse, or non-point, in nature. It is impossible for inspectors to ensure compliance on hundreds of thousands of farms in the way that they can with a small number of factories. Regulations are also used to eliminate certain practices, and include bans on spraying of pesticides close to rivers and on straw-burning in the UK, and the mandatory requirement to complete full nutrient accounts for farms, such as in the Netherlands and Switzerland. A final use for regulations is the designation and legal protection of certain habitats and species, which are set at national or international levels. Economic instruments can be used either to ensure that the polluter bears the costs of the pollution damage and the abatement costs incurred in controlling the pollution. They can also be used to reward good behaviour. A variety of economic instruments are available for achieving internalization, including environmental taxes and charges, tradable permits and the targeted use of public subsidies and incentives. Environmental taxes seek to shift the burden of taxation away from economic ‘goods’, such as labour, towards environmental ‘bads’, such as waste and pollution. Clearly the market prices for agricultural inputs do not currently reflect the full costs of their use. Environmental taxes or pollution payments, however, seek to internalize some of these costs, so encouraging individuals and businesses to use them more efficiently. Such taxes offer the opportunity of a ‘double dividend’ by cutting environmental damage, particularly from non-point sources of pollution, whilst promoting welfare. However, many opponents still believe that environmental taxes stifle economic growth. There are now a wide range of environmental taxes used by countries in Europe and North America. These include carbon and energy taxes in Belgium, Denmark and Sweden; chlorofluorocarbon taxes in Denmark and the US; sulphur taxes in Denmark, France, Finland and Sweden; nitrogen oxide charges in France and Sweden; leaded and unleaded petrol differentials in all EU countries; landfill taxes in Denmark, the Netherlands and the UK; groundwater extraction charges in the Netherlands; and sewage charges in Spain and Sweden. However, environmental taxes have rarely been applied to agriculture, with the notable exception of pesticide taxes in Denmark, Finland, Sweden and in several states of the US; fertilizer taxes in Austria, Finland, Sweden and again several states of the US; and manure charges in Belgium and the Netherlands (Ekins, 1999). The alternative to penalizing farmers through taxation is to encourage them to adopt non-polluting technologies and practices. This can be done by offering direct subsidies for adoption of sustainable technologies, and by removing perverse subsidies that currently encourage polluting activities. An important policy principle suggests that it is more efficient to promote practices that do not damage the environment rather than to spend on cleaning up after a problem has been created. Many governments provide some direct or indirect public support to their domestic agricultural and rural sectors. Increasingly, payments are being shifted away from being production linked, such as through price support or direct payments, to being retargeted to support sustainable practices. Generally, though, only small amounts of total budgets have been put aside for environmental improvements
Overview to Four Volumes: Sustainable Agriculture and Food xlix
through such policies as the US Conservation Reserve Programme, the EU’s agrienvironmental and rural development programmes, and the Australian Landcare programme. Many now believe that all public support for farming should be entirely linked to the provision of public environmental and social goods and services. The substantial external costs of modern agriculture, and the known external benefits of sustainable agricultural systems, pose great challenges for policy makers. A range of policy reforms could do much to internalize some of these costs and benefits in prices. In practice, as no single solution is likely to suffice, the key issue rests on how policy makers choose an appropriate mix of solutions, how these are integrated, and how farmers, consumers and other stakeholders are involved in the process of reform itself. Attention will therefore need to be paid to the social and institutional processes that both encourage farmers to work and learn together, and result in integrated cross-sectoral partnerships. Policy integration is vital, yet most policies seeking to link agriculture with more environmentally-sensitive management are still highly fragmented.
References Abramovitz J. 1997. Valuing nature’s services. In Brown L, Flavin C and French H (eds). State of the World. Worldwatch Institute, Washington DC Altieri M A. 1995. Agroecology: The Science of Sustainable Agriculture. Westview Press, Boulder, CO Avery D. 1995. Saving the Planet with Pesticides and Plastic. The Hudson Institute, Indianapolis, IN Balfour E B. 1943. The Living Soil. Faber and Faber, London Baumol W J and Oates W E. 1988. The Theory of Environmental Policy. Cambridge University Press, Cambridge Bawden R. 2005. The Hawkesbury experience: Tales from a road less travelled. In Pretty J (ed). The Earthscan Reader in Sustainable Agriculture. Earthscan, London Bellamy P H, Loveland P J, Bradley R I, Lark R M and Kirk G J D. 2005. Carbon losses from all soils across England and Wales 1978–2003. Nature 437, 245–248 Benbrook C M. 2003. Impacts of Genetically Engineered Crops on Pesticide Use in the United States: The First Eight Years. Benbrook; Northwest Science and Environmental Policy Center, Ames, IA Bentley J W, Boa E, van Mele P, Almanza J, Vasquez D and Eguino S. 2003. Going public: A new extension method. Int J Agric Sustainability 1(2), 108–123 Benton T. 1998. Sustainable development and the accumulation of capital: Reconciling the irreconcilable? In Dobson A (ed). Fairness and Futurity. Oxford University Press, Oxford Bignall E M and McCracken D I. 1996. Low intensity farming systems in the conservation of the countryside. Journal of Applied Ecology 33, 416–424 Brethour C and Weerskink A. 2001. An economic evaluation of the environmental benefits from pesticide reduction. Agricultural Economics 25, 219–226 Bunch R and Lopez G. 1999. Soil recuperation in Central America. In Hinchcliffe F, Thompson J, Pretty J N, Guijt I and Shah P (eds). 1999. Fertile Ground: The Impact of Participatory Watershed Management. Intermediate Technology Publ, London, 32–41 Bunting S. 2007. Confronting the realities of wastewater aquaculture in peri-urban Kolkata with bioeconomic modeling. Water Research 41, 499–505
l Sustainable Agriculture and Food Buttel F H. 2003. Internalising the societal costs of agricultural production. Plant Physiol 133, 1656– 1665 Byerlee D. 1998. Knowledge-intensive crop management technologies: Concepts, impacts and prospects in Asian agriculture. In Pingali P and Hossain M (eds). Impacts of Rice Research. IRRI, Manila Caporali F, Mancinelli R and Campiglia E. 2003. Indicators of cropping system diversity in organic and conventional farms in central Italy. Int J Agric Sustainability 1(1), 67–72 Carney D. 1998. Sustainable Rural Livelihoods. Department for International Development, London Carson R. 1963. Silent Spring. Penguin Books, Harmondsworth Carson R T. 2000. Contingent Valuation: A user’s guide. Environmental Science and Technology 34, 1413–1418 Cassman K G, Doberman A and Walters D T. 2002. Agroecosystems, nitrogen use efficiency and nitrogen management. Ambio 31, 132–140 Cato M P. (1979) Di Agri Cultura. In Hooper W D (revised Ash H B). Translation of on Agriculture. Harvard University Press, Cambridge, MA Chambers R. 2005. Ideas for Development. Earthscan, London Chambers R, Pacey A and Thrupp L A (eds). 1989. Farmer First: Farmer Innovation and Agricultural Research. IT Publ, London Champion G T, May M J, Bennett S, Brooks D R, Clark S J, Daniels R E, Firbank L G, Haughton A J, Hawes C, Heard M S, Perry J N, Randle Z, Rossall M J, Rothery P, Skellern M P, Scott R J, Squire G R and Thomas M R. 2003. Crop management and agronomic context of the Farm Scale Evaluations of genetically modified herbicide-tolerant crops. Phil Trans Roy Soc Lond 358, 1801– 1818 Clements D and Shrestha A. 2004. New Dimensions in Agroecology. Food Products Press, Binghampton, NY Coleman J. 1988. Social capital and the creation of human capital. American Journal of Sociology 94, supplement S95–S120 Conway, G. 1985. Agroecosystem analysis. Agricultural Administration 20, 31–55 Conway G R. 1997. The Doubly Green Revolution. Penguin, London Conway G R and Pretty J N. 1991. Unwelcome Harvest: Agriculture and Pollution. Earthscan, London Costanza R, d’Arge R, de Groot R, Farber S, Grasso M, Hannon B, Limburg K, Naeem S, O’Neil R V, Paruelo J, Raskin R G, Sutton P and van den Belt M. 1997. The value of the world’s ecosystem services and natural capital. Nature 387, 253–260 Cox T S, Picone C and Jackson W. 2004. Research priorities in natural systems agriculture. In Clements D and Shrestha A. New Dimensions in Agroecology. Food Products Press, Binghampton, NY Cramb R A and Culaseno Z. 2003. Landcare and livelihoods: the promotion and adoption of conservation farming systems in the Philippine uplands. Int J Agric Sustainability 1(2), 141–154 Crews T E and Peoples M B. 2004. Legume versus fertilizer sources of nitrogen: Ecological tradeoffs and human needs. Agric Ecosys Environ 102(3), 279–297 Crissman C C, Antle J M and Capalbo S M (eds). 1998. Economic, Environmental and Health Tradeoffs in Agriculture: Pesticides and the Sustainability of Andean Potato Production. CIP, Lima and Kluwer, Boston Cuyno L C M, Norton G W and Rola A. 2001. Economic analysis of environmental benefits of integrated pest management. A Philippine case study. Agricultural Economics 25, 227–233 Daily G (ed). 1997. Nature’s Services: Societal Dependence on Natural Ecosystems. Island Press, Washington DC Dalgaard T, Halberg N and Kristensen I S. 1998. Can organic farming help to reduce N-losses? Nutrient Recycling in Agroecosystems 52, 277–287 Dalgaard T, Heidmann T and Mogensen L. 2002. Potential N-losses in three scenarios for conversion to organic farming in a local area of Denmark. Eur J Agronomy 16, 207–217
Overview to Four Volumes: Sustainable Agriculture and Food li Dalgaard T, Hutchings N J and Porter J R. 2003. Agroecology, scaling and interdisciplinarity. Agric Ecosys Environ 100, 39–51 Dasgupta P. 1998. The economics of food. In Waterlow J C, Armstrong D G, Fowden L and Riley R (eds). Feeding the World Population of More Than Eight Billion People. Oxford University Press, New York and Oxford De Freitas H. 1999. Transforming miscatchments in Santa Caterina, Brazil. In Hinchcliffe F, Thompson J, Pretty J, Guijt I and Shan P (eds). Fertile Ground: The Impacts of Participatory Watershed Development. IT Publ, London Dixon J, Gulliver A and Gibbon D. 2001. Farming Systems and Poverty. FAO, Rome Dobbs T and Pretty J N. 2004. Agri-environmental stewardship schemes and ‘multifunctionality’. Review of Agricultural Economics 26(2), 220–237 EA (Environment Agency). 2005. Assessment of Win–Win Case Studies of Resource Management in Agriculture. EA and English Nature, Bristol Ekins P. 1999. European environmental taxes and charges: Recent experience, issues and trends. Ecol. Econ. 31, 39–62 Ellis F. 2000. Rural Livelihoods and Diversity in Developing Countries. Oxford University Press, Oxford EPA. 2001. Pesticide Industry Sales and Usage. 1998 and 1999 Market Estimates. Environmental Protection Agency, Washington DC FAO. 2005. FAOSTAT database. Rome Farrow R S, Goldburg C B and Small M J. 2000. Economic valuation of the environment: a special issue. Environmental Science and Technology 34 (8), 1381–1383 Feder G, Murgai R and Quizon J B. 2004. Sending farmers back to school: The impact of Farmer Field Schools in Indonesia. Review of Agricultural Economics 26(1), 45–62 Firbank L G, Rothery P, May M J, Clark S J, Scott R J, Stuart R C, Boffey C W H, Brooks D R, Champion G T, Haughton A J, Hawes C, Heard M S, Dewar A M, Perry J N and Squire G R. 2005. Effects of genetically modified herbicide-tolerant cropping systems on weed seedbanks in two years of following crops. Biol Lett 1–5 Flora C B and Flora J L. 1996. Creating social capital. In Vitek W and Jackson W (eds). Rooted in the Land: Essays on Community and Place. Yale University Press, Haven and London, 217–225 Folke C, Colding J and Olsson P and Hahn T. 2005. Integrated social-ecological systems and adaptive governance for ecosystem services. In Pretty J, Ball A, Benton T, Guivant J, Lee D, Orr D, Pfeffer M and Ward H (eds). Sage Handbook on Environment and Development. Sage, London Funes F, Garcia L, Bourque M, Perez N and Rosset P (eds). 2002. Sustainable Agriculture and Resistance. Food First Books, Oakland, CA Gallagher K, Ooi P, Mew T, Borromeo E, Kenmore P and Ketelaar J-W. 2005. Ecological basis for low-toxicity integrated pest management (IPM) in rice and vegetables. In Pretty J (ed). 2004. The Pesticide Detox. Earthscan, London Georgiou S, Langford I H, Bateman I J and Turner R K. 1998. Determinants of individuals’ willingness to pay for perceived reductions in environmental health risks: A case study of bathing water quality. Environment and Planning 30(4), 577–594 Giles J. 2005. Nitrogen study fertilizes fears of pollution. Nature 433, 791 Gliessman S R. 1998. Agroecology: Ecological Processes in Sustainable Agriculture. CRC Press, Boca Raton, FL Gliessman S R. 2004. Integrating agroecological processes into cropping systems research. In Clements D and Shrestha A. New Dimensions in Agroecology. Food Products Press, Binghampton, NY Gliessman S R. 2005. Agroecology and agroecosystems. In Pretty J (ed). The Earthscan Reader in Sustainable Agriculture. Earthscan, London GM Science Review. 2003. GM Science Review 1st Report. UK Government, London Goodman D and Watts M J (eds). 1997. Globalising Food: Agrarian Questions and Global Restructuring. Routledge, London and New York
lii Sustainable Agriculture and Food Gosling P and Shepherd M. 2004. Long-term changes in soil fertility in organic arable farming systems in England, with particular reference to phosphorus and potassium. Agric Ecosys and Environ 105(1–2), 425–432 Green R E, Cornell S J, Scharlemann J P W and Balmford A. 2005. Farming and the fate of wild nature. Science 307, 550–555 Haberl H, Schultz N B, Plutzar C, Erb K H, Krausman F, Loibl W, Moser D, Sauberer N, Weisz H, Zechmeister H G and Zulka P. 2004. Human appropriation of net primary production and species diversity in agricultural landscapes. Agric Ecosys and Environ 102, 213–218 Hanley N, MacMillan D, Wright R E, Bullock C, Simpson I, Parrison D and Crabtree R. 1998. Contingent valuation versus choice experiments: Estimating the benefits of environmentally sensitive areas in Scotland. Journal of Agricultural Economics 49(1) 1–15 Heong K L, Escalada M M, Huan N H and Mai V. 1999. Use of communication media in changing rice farmers’ pest management in the Mekong Delta, Vietnam. Crop Management 17(5), 413– 425 Herren H, Schulthess F and Knapp M. 2005. Towards zero-pesticide use in tropical agroecosytems. In Pretty J (ed). The Pesticide Detox. Earthscan, London Hesiod. 1988. Theogony. Works and Days. Oxford World’s Classics. OUP, Oxford Higgs E. 2003. Nature by Design. MIT Press, Cambridge, MA Hinchcliffe F, Thompson J, Pretty J, Guijt I and Shah P (eds). 1999. Fertile Ground: The Impacts of Participatory Watershed Development. IT Publications, London Holland J M. 2004. The environmental consequences of adopting conservation tillage in Europe: Reviewing the evidence. Agric Ecosys and Environment 103, 1–21 Holling C S, Berkes F and Folke P. 1998. Science, sustainability and resource management. In Berkes F and Folke F (eds). Linking Social and Ecological Systems: Management Practices and Social Mechanisms for Building Resilience. Cambridge University Press, Cambridge IPCC. 2001. Climate Change 2001: Impacts, Adaptation and Vulnerability. Third Assessment Report. Intergovernmental Panel on Climate Change. IPCC Secretariat, Geneva, Switzerland. [At URL http://www.ipcc.ch/] IPCC. 2007. Climate Change 2007. 4th Assessment Report. Intergovernmental Panel on Climate Change. IPCC Secretariat, Geneva, Switzerland. [At URL http://www.ipcc.ch/] Jackson D L and Jackson D L. 2002. The Farm as Natural Habitat. Island Press, Washington DC Jordan. 2003. The Sunflower Forest. University of California Press Kabore D and Reij C. 2004. The Emergence and Spreading of an Improved Traditional Soil and Water Conservation Practice in Burkina Faso. Environment and Production Technology Division Paper 114. IFPRI, Washington DC Kenmore P E, Carino F O, Perez C A, Dyck V A and Gutierrez A P. 1984. Population regulation of the brown planthopper within rice fields in the Philippines. Journal of Plant Protection in the Tropics 1(1), 19–37 Kerr J, Sanghi N K and Sriramappa G. 1999. Subsidies in watershed development projects in India: Distortions and opportunities. In Hinchcliffe F et al (eds). Fertile Ground. IT Publications, London Khush G S, Peng S and Virmani S S. 1998. Improving yield potential by modifying plant type and exploiting heterosis. In Waterlow J C, Armstrong D G, Fowden L and Riley R (eds). Feeding the World Population of More Than Eight Billion People. Oxford University Press, New York and Oxford King F H. 1911. Farmers of Forty Centuries. Rodall Press, Penn Kloppenburg J, Hendrickson J and Stevenson G W. 1996. Coming to the foodshed. In Vitek W and Jackson W (eds). Rooted in the Land: Essays on Community and Place. Yale University Press, Haven and London, 113–123 Lampkin N H and Padel S (eds). 1994. The Economics of Organic Farming. An International Perspective. CAB International, Wallingford Leach, G. 1976. Energy and Food Production. IPC Science and Technology Press, Guildford and IIED, London
Overview to Four Volumes: Sustainable Agriculture and Food liii Leach K A, Allingham K D, Conway J S, Goulding K W T and Hatch D J. 2004. Nitrogen management for profitable farming with maximal environmental impact: The challenge for mixed farms in the Cotswold Hills, England. Int J Agric Sustainability 2(1), 21–32 Leakey R B, Tchoundjeu Z, Schreckenberg K and Shackleton S E. 2005. Agroforestry Tree Products (AFTPs): Targeting poverty reduction and enhanced livelihoods. Int J Agric Sust 3(1), 1–23. Leeuwis C. 2004. Communication for Rural Innovation. Blackwell Publishing, Oxford Lewis W J, van Lenteren J C, Phatak S C and Tumlinson J H. 1997. A total system approach to sustainable pest managmement. Proc Nat Acad Sci 94, 12243–12248 Lieblin G, Østergaard E and Francis C. 2004. Becoming an agroecologist through action education. Int J Agric Sustainability 2(3), 147–153 Li Wenhua. 2001. Agro-Ecological Farming Systems in China. Man and the Biosphere Series Volume 26. UNESCO, Paris Løes A-K and Øgaard A F. 2003. Concentrations of soil potassium and long-term organic dairy production. Int J Agric Sustainability 1(1), 14–29 Maturana H R and Varela F J. 1992. The Tree of Knowledge. The Biological Roots of Human Understanding. Revised Edition. Shambhala, Boston and London McNeely J A and Scherr S J. 2003. Ecoagriculture. Island Press, Washington DC MEA (Millennium Ecosystem Assessment). 2005. Ecosystems and Well-Being. Island Press, Washington DC Morison J, Hine R and Pretty J. 2005. Survey and analysis of labour on organic farms in the UK and Republic of Ireland. Int J Agric Sustainability 3(1), 24–43 Norse D, Li Ji, Jin Leshan and Zhang Zheng. 2001. Environmental Costs of Rice Production in China. Aileen Press, Bethesda NRC. 2000. Our Common Journey: Transition towards sustainability. Board on Sustainable development, Policy Division, National Research Council. National Academy Press, Washington DC Nuffield Council on Bioethics. 2004. The Use of Genetically Modified Crops in Developing Countries. London Odum E P and Barrett G W. 2004. Redesigning industrial agroecosystems: Incorporating more ecological processes and reducing pollution. In Clements D and Shrestha A (eds). New Dimensions in Agroecology. Food Products Press, Binghampton, NY OECD. 2001. Environmental Outlook for the Chemicals Industry. OECD, Paris Oelbermann M, Voroney R P and Kass D C L. 2004. Gliricidia sepium carbon inputs and soil carbon pools in Costa Rican alley cropping systems. Int J Agric Sustainability 2(1), 33–42 Olsson P and Folke P. 2001. Local ecological knowledge and institutional dynamics for ecosystem management: a study of Lake Racken watershed, Sweden. Ecosystems 4, 85–104 Orr D. 1992. Ecological Literacy. SUNY Press, Albany, NY Ostrom E. 1990. Governing the Commons: The Evolution of Institutions for Collective Action. Cambridge University Press, New York Petersen P, Tardin J M and Marochi F. 2000. Participatory development of non-tillage systems without herbicides for family farming: the experience of the center-south region of Paraná. Environ Dev and Sust 1, 235–252 Pingali P L and Roger P A. 1995. Impact of Pesticides on Farmers’ Health and the Rice Environment. Kluwer, Dordrecht Popkin B. 1998. The nutrition transition and its health implications in lower-income countries. Public Health Nutrition 1(1), 5–21 Pretty J. 1995. Regenerating Agriculture: Policies and Practice for Sustainability and Self-Reliance. Earthscan, London; National Academy Press, Washington Pretty J. 1998. The Living Land: Agriculture, Food and Community Regeneration in Rural Europe. Earthscan Publications Ltd, London Pretty J. 2001. The rapid emergence of genetically-modified crops in world agriculture. Environmental Conservation 28(3), 248–262
liv Sustainable Agriculture and Food Pretty J. 2002. Agri-Culture: Reconnecting People, Land and Nature. Earthscan, London Pretty J. 2003. Social capital and the collective management of resources. Science 302, 1912–1915 Pretty J (ed). 2005. The Pesticide Detox. Earthscan, London Pretty J. 2007. Agricultural sustainability: concepts, principles and evidence. Phil Trans R Soc Lond B (in press) Pretty J and Ward H. 2001. Social capital and the environment. World Development 29 (2), 209–227 Pretty J and Koohafkan P. 2002. Land and Agriculture: From UNCED Rio to WSSD Johannesburg. FAO, Rome Pretty J and Hine R. 2005. Pesticide use and the environment. In Pretty J (ed). The Pesticide Detox. Earthscan, London Pretty J and Waibel H. 2005. Paying the price: the full cost of pesticides. In Pretty J (ed). The Pesticide Detox. Earthscan, London Pretty J, Brett C, Gee D, Hine R, Mason C F, Morison J I L, Raven H, Rayment M and van der Bijl G. 2000. An assessment of the total external costs of UK agriculture. Agricultural Systems 65(2), 113–136 Pretty J, Brett C, Gee D, Hine R E, Mason C F, Morison J I L, Rayment M, van der Bijl G and Dobbs T. 2001. Policy challenges and priorities for internalising the externalities of agriculture. J Environ Planning and Manage 44(2), 263–283 Pretty J, Ball A S, Li Xiaoyun and Ravindranath N H. 2002. The role of sustainable agriculture and renewable resource management in reducing greenhouse gas emissions and increasing sinks in China and India. Phil Trans Roy Soc Series A 360, 1741-1761 Pretty J, Mason C F, Nedwell D B and Hine R E. 2003a. Environmental costs of freshwater eutrophication in England and Wales. Environmental Science and Technology 37(2), 201–208 Pretty J, Morison J I L and Hine R E. 2003b. Reducing food poverty by increasing agricultural sustainability in developing countries. Agric Ecosys and Environ 95(1), 217–234 Pretty J, Lang T, Ball A and Morison J. 2005. Farm costs and food miles: An assessment of the full cost of the weekly food basket. Food Policy 30(1), 1–20 Pretty J, Noble A, Bossio D, Dixon J, Hine R E, Penning de Vries P and Morison J I L. 2006. Resource conserving agriculture increases yields in developing countries. Environmental Science and Technology 40(4), 1114–1119 Putnam R D, with Leonardi R and Nanetti R Y. 1993. Making Democracy Work: Civic Traditions in Modern Italy. Princeton University Press, Princeton, NJ Reij C. 1996. Evolution et impacts des techniques de conservation des eaux et des sols. Centre for Development Cooperation Services, Vrije Universiteit, Amsterdam Rola A and Pingali P. 1993. Pesticides, Rice Productivity, and Farmers’ Health – An Economic Assessment. IRRI, Los Baños, Philippines Röling N G and Wagemakers M A E. (eds). 1997. Facilitating Sustainable Agriculture. Cambridge University Press, Cambridge Royal Society. 2001. The Role of Land Carbon Sinks in Mitigating Global Carbon Change. London Ruddell E. 1995 Growing food for thought: A new model of site-specific research from Bolivia. Grassroots Development 19(1), 18–26 Ruttan V. 1999. The transition to agricultural sustainability. Proc Natl Acad Sci 96, 5960–5967 Rydberg T and Jansén J. 2002. Comparison of horse and tractor traction using energy analysis. Ecological Engineering 19, 13–28 Scoones I. 1998. Sustainable Rural Livelihoods: A Framework for Analysis. IDS Discussion Paper 72, University of Sussex Shennan C, Gareau T P and Sirrine J R. 2005. Agroecological Interventions in the USA. In Pretty J (ed). The Pesticide Detox. Earthscan, London Sherwood S, Cole D, Crissman C and Paredes M. 2005. Transforming Potato Systems in the Andes. In Pretty J (ed). The Pesticide Detox. Earthscan, London Smil V. 2001. Enriching the Earth. MIT Press, Cambridge, MA
Overview to Four Volumes: Sustainable Agriculture and Food lv Stout B A. 1998. Energy for agriculture in the 21st century. In Waterlow J C, Armstrong D G, Fowden L and Riley R (eds). Feeding the World Population of More Than Eight Billion People. Oxford University Press, New York and Oxford Swift M J, Izac A-M N, and van Noordwijk M. 2004. Biodiversity and ecosystem services in agricultural landscapes – are we asking the right questions? Agric Ecosys and Environment 104, 113–134 Swingland, I. (ed). 2003. Carbon and Biodiversity. Earthscan, London Tegtmeier E M and Duffy M D. 2004. External costs of agricultural production in the United States. Int J Agric Sust 2(1), 1–20 Terwan P, Ritchie M, van der Weijden W, Verschur G and Joannides J. 2004. Values of Agrarian Landscapes across Europe and North America. Reed Business Information, Doetinchem Tilman D. 1999. Global environmental impacts of agricultural expansion: The need for sustainable and efficient practices. Proc Natl Acad Sci 96, 5995–6000 Tilman D, Cassman K G, Matson P A, Naylor R and Polasky S. 2002. Agricultural sustainability and intensive production practices. Nature 418, 671–677 Tomich T P, Chomitz K, Francisco H, Izac A-M N, Murdiyarso D, Ratner B D, Thomas D E and van Noordwijk M. 2004. Policy analysis and environmental problems at different scales: Asking the right questions. Agric Ecosys and Environment 104, 5–18 Townsend A R, Howarth R W, Bazzaz F A, Booth M S, Cleveland C C, Collinge S K, Dobson A P, Epstein P R, Holland E A, Keeney D R, Mallin M A, Rogers C A, Wayne P and Wolfe A H. 2003. Human health effects of a changing global nitrogen cycle. Front Ecol Environ 1(5), 240–246 Trewevas, A. 2001. Malthus foiled again and again. Nature 418, 668–670 Tripp R. 2006. The performance of low external input technology in agricultural development. A summary of three case studies. Int J Agric Sustainability 3(3), 143–153 United Nations. 2005. Long-range World Population Projections: Based on the 1998 Revision. UN Population Division, New York Uphoff N. 1998. Understanding social capital: Learning from the analysis and experience of participation. In Dasgupta P. and Serageldin I. (eds). Social Capital: A Multiperspective Approach. World Bank, Washington, DC Uphoff N (ed). 2002. Agroecological Innovations. Earthscan, London Victor T J and Reuben R. 2002. Effects of organic and inorganic fertilizers on mosquito populations in rice fields of southern India. Med Vet Entomol 14, 361–368 Waibel H, Fleischer G and Becker H. 1999. The economic benefits of pesticides: A case study from Germany. Agrarwirtschaft 48(6), 219–230 Watson R T, Noble I R, Bolin B, Ravindranath N H, Verardo D J and Dokken D J (eds). 2000. IPCC Special Report on Land Use, Land-Use Change and Forestry. A special report of the Intergovernmental Panel on Climate Change. Approved at IPCC Plenary XVI (Montreal, 1–8 May). IPCC Secretariat, c/o World Meteorological Organization, Geneva, Switzerland. [At URL http://www. ipcc.ch/] WCED. 1987. Our Common Future. Oxford University Press, Oxford Wilson C and Tisdell. 2001. Why farmers continue to use pesticides despite environmental, health and sustainability costs. Ecological Economics 39, 449–462 Woodhouse S P, Good J E G, Lovett A A, Fuller R J and Dolman P M. 2005. Effects of land use and agricultural management on birds of marginal farmland: A case study in the Llŷn peninsula, Wales. Agric Ecosys and Environment 107, 331–340 Worster D. 1993. The Wealth of Nature: Environmental History and the Ecological Imagination. Oxford University Press, New York
Editorial Introduction to Volume I Jules Pretty
Agricultural Modernization and Interactions with Nature Agriculture has had many ‘revolutions’ throughout history, from its advent some 8–10,000 years ago to the renowned 17th–19th-century agricultural revolution in Europe. In the past century, rural environments in most parts of the world have also undergone massive transformations. In some senses, these have been the most extraordinary in their speed of spread of new technologies and the far-reaching nature of their impacts upon social, economic and ecological systems. Two guiding themes have dominated this period of agricultural and rural development. One has been the need for increased food production to meet the needs of growing populations. Governments have intervened to transform traditional agricultural systems by encouraging the adoption of modern varieties of crops and modern breeds of livestock, together with associated packages of external inputs (such as fertilizers, pesticides, antibiotics, credit, machinery) necessary to make these productive. In addition, they have supported new infrastructure, such as irrigation schemes, roads and markets, guaranteed prices and markets for agricultural produce, as well as a range of other policies. The other theme has been the desire to prevent the degradation of natural resources, perceived to be largely caused by growing populations and their bad practices. To conserve natural resources, governments have encouraged the adoption of soil and water conservation measures to control soil erosion. They have established grazing management schemes to control rangeland degradation. They have excluded people from forests and other sites of high biodiversity to protect wildlife and plants. According to just these two themes, it would appear that agricultural and rural development has been remarkably successful. Both food production and the amount of land conserved have increased dramatically. Although often seen as mutually exclusive, both have been achieved with largely the same process of modernization. The approach is firmly rooted in and driven by the enlightenment tradition of positivist science (Harvey, 1989; Kurokawa, 1991). External actors identify the problem that needs solving, in these cases too little food or too much degradation. Their concern is to intervene so as to encourage rural people to change
2 Sustainable Agriculture and Food
their practices. Rational solutions are proposed, and technologies developed. These technologies, known to work in a research station or other controlled environments, are assumed to work elsewhere. They are then passed to the mass of rural people and farmers, and the benefits awaited. It was Cartesian reductionism and the enlightenment that set the scene for this approach, largely casting aside the assumed folklore and superstitions of age-old thinking. A revolution in science occurred in the late 16th and 17th centuries, largely due to the observations, theories and experiments of Bacon, Galileo, Descartes and Newton, which brought forth mechanistic reductionism, experimental inquiry and positivist science. These methods brought great progress, and continue to be enormously important. But one unfortunate side effect has been an enduring separation of humans from the rest of nature. In the 19th and 20th centuries, wilderness writers, landscape painters, ecologists and farmers sought to reverse, or at least temper, the dominance of this new thinking. It is, though, in the indigenous groups of the world that we find surviving examples of close nature– people connectivity. One of the most comprehensive collections on the diversity of human cultures and their connectedness with nature and the land is Darrell Posey’s Cultural and Spiritual Values of Biodiversity (1999). Containing contributions from nearly three hundred authors from across the world, these highlight ‘the central importance of cultural and spiritual values in an appreciation and preservation of all life’. These voices of the earth demonstrate the widespread intimate connectivity that people have with nature, whether as hunter-gatherers or agriculturalists. Johan Mathis Turi of the Saami reflects on the mutual shaping in the Norwegian arctic: ‘The reindeer is the centre of nature as a whole and I feel I hunt whatever nature gives. Our lives have remained around the reindeer and this is how we have managed the new times so well. It is difficult for me to pick out specific details or particular incidences as explanations for what has happened because my daily life, my nature, is so comprehensive. It includes everything. We say “lotwantua”, which means everything is included.’ A similar perspective is put by Gamaillie Kilukishah, an Inuit from northern Canada who in translation by Meeka Mike says, ‘You must be in constant contact with the land and the animals and the plants... When Gamaillie was growing up, he was taught to respect animals in such a way as to survive from them. At the same time, he was taught to treat them as kindly as you would another fellow person.’ Pera of the Bakalaharil tribe in Botswana points to their attitudes in using and sustaining wild resources: ‘Some of our food is from the wild – like fruits and some of our meat... We are happy to conserve, but some conservationists come and say that preservation means that we cannot use the animals at all. To us, preservation means to use, but with love, so that you can use again tomorrow and the following year.’ Says Cristina Gualinga of the Quicha, ‘Nature, what you call biodiversity, is the primary thing that is in the jungle, in the river, everywhere. It is part of human life. Nature helps us to be free, but if we trouble it, nature becomes angry. All living things are equal parts of nature and we have to care for each other.’ Finally, in
Editorial Introduction to Volume I 3
Australia, Henrietta Fourmile of the Polidingi Tribe says: ‘Not only is it the land and soil that forms our connections with the earth but also our entire life-cycle touches most of our surroundings. The fact that our people hunt and gather these particular species on the land means emphasis is placed on maintaining their presence in the future... What is sometimes called “wildlife” in Australia isn’t wild; rather it’s something that we have always maintained’ (all quotes in Posey, 1999).
Part 1: Before Agriculture For almost all of human history, people have been hunter-gatherers. If, as seems likely, hominids emerged around 6 million years ago, then some 300,000 generations passed before agriculture was invented, since when some 500–600 generations passed until the emergence of the industrialized era. We must have been good at hunting and gathering, otherwise hominids would never have made it to the present day. Yet in recent times, hunter-gatherer societies have been characterized as backward, uncivilized and unable to enter the modern world. After Darwin, the concept of evolution as a linear and progressive force became widely adopted, and remains with us today. Jean Lamarck erroneously believed in the inheritance of acquired characteristics, and he suggested that species strove to evolve greater complexity, and thus the pinnacle of evolution had to be humans. Later, Social Darwinism came to suggest that nature was more important than nurture, and that the development of individuals from birth to death (ontogeny) reflected closely the evolutionary development of species (phylogeny). Such ideas of progression (implying that the later is better, and the more complex the cleverer), were subsequently applied to human societies. Lewis Henry Morgan’s Ancient Society, published in 1877, suggested seven stages of human cultural evolution, beginning with lower savagery and progressing through barbarism eventually to reach civilization. The idea was that all human societies did share a common ancestor, but that some groups (or races) were now higher on the ladder than others. Such ideas fitted very well with prevailing views about the superiority of European and North American culture, and again came to be widely accepted (though of course still hotly contested by many). It was not until the later 20th century that new perspectives began to emerge. Richard Lee was one of the pioneers of the later 20th century who clearly demonstrated the efficiencies and effectiveness of hunter-gatherer lifestyles. This first paper is drawn from the classic Man the Hunter (1968), and shows how huntergatherers do not have a precarious existence in which they struggle to survive – the view that had become common. The hunter-gatherer resource base is ‘at least routine and reliable and at best surprisingly abundant’. The chapter draws particularly on evidence from the !Kung Bushmen of the Kalahari Desert, and illustrates in detail the wide range of food resources used by local people in this extremely challenging environment. A key finding (again, counter-intuitive to many at the time) was that
4 Sustainable Agriculture and Food
hunter-gatherers have plenty of time for leisure, often working fewer hours than agriculturalists, and the caloric returns of their activities are good. Richard Lee and Richard Daly’s later Cambridge Encyclopedia of Hunters and Gatherers (1999) is an important and comprehensive volume containing case studies of more than 50 of the world’s remaining hunter and gatherer peoples. These tell a story of resilience in the face of change, and of the many ways they are affected by modern problems. Thematic essays discuss prehistory, social life, gender, music and art, food and health, religion and indigenous knowledge. In their introductory essay, Lee and Daly make the point that the world’s hunter-gatherer peoples – the Arctic Inuit, Aboriginal Australians, Kalahari San and other similar groups – represent the oldest and perhaps most successful human adaptation. Until 12,000 years ago, virtually all humanity lived as hunters and gatherers. Yet in recent centuries they have suffered the ill-effects of modernity. However, fascination with hunting peoples and their ways of life still remains strong. Hunters and gatherers stand at the opposite pole from the dense urban life now experienced by a large proportion of humanity. Yet these same hunters may hold the key to many contemporary concerns – about diet, politics, communities, physical activity and relations with nature. A late Australian Aboriginal writer is quoted here, ‘modern ecology can learn a great deal from a people who managed and maintained their world so well for 50,000 years’. The third paper in this section is from Hugh Brodie’s The Other Side of Eden (2000). His fieldwork experience is mainly from the polar and boreal north, and he weaves the experiences of native hunter-gatherers into a narrative that reveals a paradox: agriculture is a settled activity, yet has been fundamentally expansionist; whereas hunter-gathering is a mobile activity, cultures and communities selfregulate and stay in the same areas over thousands of years. This points to a problem – current narratives often describe hunter-gatherers as the backward and irresponsible peoples, yet left alone they do not seek to impinge on others. This chapter, entitled Mind, explores some of the differences between communities, and shows how change has often been destructive to whole hunter-gatherer peoples. Says Mary Adele, an Innu of Labrador, ‘on the land, we are ourselves. In the settlements we are lost.That was why they made our minds weak’. Some believe that hunter-gatherers will inevitably become extinct; others that they represent ways of living that are instructive. Says Brodie, ‘without hunter-gatherers, humanity is diminished and cursed; with them, we can achieve a more complete version of ourselves’. The fourth chapter of this opening section focuses on the Innu of northern Labrador, and analyses the environmental and health benefits of hunting lifestyles and diets. They have undergone profound transitions in recent decades with important implications for conservation, food and health policy. The change from permanent nomadic hunting, gathering and trapping in the country (nutshimit) to sedentary village life (known as ‘sedentarization’) has been associated with a marked decline in physical and mental health. The overarching response of the national government has been to emphasize village-based and institutional solutions. Samson
Editorial Introduction to Volume I 5
and Pretty show that changing the balance back to country-based activities would address both the primary causes of the crisis and improve the health and well-being of the Innu. Drawing on ethnographic fieldwork, interviews with Innu older people (Tshenut), empirical data on nutrition and activity, and comparative data from the experiences of other indigenous peoples, they identify biological and environmental transitions of significance to the current plight of the Innu. They also show that nutrition and physical activity transitions have had major negative impacts on individual and community health. However, hunting and its associated social and cultural forms is still a viable option as part of a mixed livelihood and economy in the environmentally significant boreal forests and tundra of northern Labrador. Cultural continuity through Innu hunting activities is a means to decelerate, and possibly reverse, their decline. Finally, four new policy areas to help restore country-based activities are suggested: (i) a food policy for country food; (ii) an outpost programme; (iii) ecotourism; and (iv) an amended school calendar. In the final paper of this section, Luisa Maffi analyses the concept of biocultural diversity and how it relates to current concerns about both ecological and cultural sustainability. Biocultural diversity draws on anthropological, ethnobiological and ethnoecological insights about the relationships between human language, knowledge and practices with the environment. Evidence now indicates that the idea of the existence of pristine environments unaffected by humans is erroneous. Humans have maintained, enhanced and even created biodiversity through culturally diverse practices over many thousands of generations. There are some suggestions that biodiversity and cultural diversity in the form of linguistic differences are associated, though at the local level these relationships do not always stand up to scrutiny. But the role of language is nonetheless critical as a vehicle for communicating and transmitting cultural values, traditional knowledges and practices, and thus for mediating human–environment interactions. Landscapes can be networks of knowledge and wisdom, conveyed by the language of local people. But the problem is that many languages are under threat. There are some 5000–7000 languages spoken today, of which 32 per cent are in Asia, 30 per cent in Africa, 19 per cent in the Pacific, 15 per cent in the Americas, and 3 per cent in Europe. Yet only half of these languages are each spoken by more than 10,000 speakers. Some 90 per cent of all the world’s languages may disappear in the course of this century – yet these very languages are tied to the creation, transmission and perpetuation of local knowledge and cultural behaviour. As language disappears, so does people’s ability to understand and talk about their worlds. Natural and cultural continuity are thus connected. The phenomenon of loss has been called the extinction of experience – and the loss of traditional languages and cultures may be hastened by environmental degradation. Yet in many parts of the world, both in developing and industrialized countries, such traditional ecological knowledge is declining and under threat of extinction. As humans coevolved with their local environments, and have now come to be disconnected, so knowledges that coded stories, binding people to place, have
6 Sustainable Agriculture and Food
become less valued. New efforts to analyse biocultural diversity on a country-bycountry basis are reviewed, and despite some important progress in the international sphere, such as in the Convention on Biodiversity, the most fundamental changes must come from ground-up actions.
Part 2: Early Agriculture Some 10,000 years ago, hunter-gatherers in various parts of the world began to domesticate some wild plants and animals. These evolved over thousands of seasons under the guidance of people, producing domesticated forms strikingly different from their wild progenitors. Now, wheat, rice, maize, sorghum, barley, potato, cassava, taro, yam, sweet potato and grain legumes are the main sources of human nutrition for billions of people. Plant geneticist, Jack Harlan, reflects on these processes that generated huge reserves of genetic diversity, pointing to the importance of the intimate knowledge of crops by so-called primitive agricultural societies. Centres of diversity are found on every continent (except Australia, where native people did not widely domesticate plants). These centres are characterized by ancient agriculture, great ecological diversity and great human diversity. Such centres were first recognized and described by the Russian agronomist N I Vavilov. This paper goes on to describe contemporary efforts to protect crop genetic diversity in the face of modernizing tendencies to simplify agriculture. All agricultural systems need water. A few can rely only on rainfall, but most require some kind of system to manage the collection and delivery of water to crops and livestock. Karl Wittfogel’s classic Oriental Despotism explored the characteristics of hydraulic economies: they involve a division of labour; they intensify cultivation; and they necessitate cooperation on a large scale. All three contribute to the requirement for a particular type of management of both inputs, including water, and outputs of food to markets and consumers. Water necessitates control, and some of this has to be very large-scale, both for flood protection (such as in Egypt or Mesopotamia) and for irrigation management (such as for the rice terrace cultures of Asia). Cooperation is also essential, as water can be captured by the more powerful, and tail-enders in irrigation systems can easily go without. Wittfogel’s contribution is to show how such cooperation easily slips into coercion, with punishment for transgression never really absent. Agrohydraulic societies also require active timekeeping and calendar-making and close observation of weather, seasonal patterns and astronomy, as well as the capacity to build canals, dams, roads and other monuments. Marcus Porcius Cato lived 234–149 BC, and was known as the Orator, the Censor or Cato Major. He was born at Tusculum, some 15km from Rome. His youth was spent on his father’s farm, and a love for the soil remained with him though life. He entered the military aged 17 and served in the Second Punic War. Political offices came later, including the consulship in 195 and the censorship in
Editorial Introduction to Volume I 7
184 BC. He was always the champion of the common people. Quintilian speaks of Cato’s great versatility as a general, philosopher, orator, historian and expert on agriculture. De Agri Cultura resembles a farmer’s notebook, and constitutes the earliest surviving specimen of connected prose. Although haphazard in style, it contains many long-standing truths, including on the first page, ‘And when they would praise a worthy man, their praise took this form: good husbandman, good farmer; one so praised was thought to have received the greatest commendation’. Marcus Terentius Varro was born more than 30 years after Cato’s death, and lived 116–27 BC. He was born in Reate, where Cato’s father had his farm, and devoted his life to literature and the antiquities. Under the political banner of Pompey, he held the offices of tribune, aedile and praetor. He came into conflict with Caesar for twice supporting Pompey, was later forgiven and then commanded by Caesar to supervise the great library. Varro claimed by his 78th year to have written several hundred books, but only six survive. The Res Rusticae was begun in Varro’s 80th year, and it contains perhaps the earliest suggestion of the importance of sustainability in farming. Identified first by Gordon Conway, a section in Varro’s third book states that ‘agriculture is not only an art, but an important and noble art. It is, as well, a science, which teaches what crops are planted in each kind of soil … in order that the land may regularly produce the largest crops (quo terra maximos perpetuo reddat fructus)’. Li Wenhua provides an historical review of the emergence of agroecological farming systems in China. As he says, ‘for thousands of years, Chinese philosophers have pondered on the harmonious relationship between humans, nature and the environment’. As a result, many effective technologies and practices have been developed (and also forgotten), some of which are now being championed today. It is in China that there is the greatest and most continuous record of agriculture’s development. He dates the earliest records of integrated crop, tree, livestock and fish farming to the Shang-West Zhou Dynasties of 1600–800 BC. Later Mensius said in 400 BC, ‘if a family owns a certain piece of land with mulberry trees around it, a house for breeding silkworms, domesticated animals raised in its yard for meat, and crop fields cultivated and managed properly for cereals, it will be prosperous and will not suffer starvation’. In one of the earliest recognitions of the need for the sustainable use of natural resources, he also said, ‘if the forests are timely felled, then an abundant supply of timber and firewood is ensured, if the fishing net with relatively big holes is timely cast into the pond, then there will be no shortage of fish and turtle for use’. Still later, other treatises such as the collectively written Li Shi Chun Qiu (239 BC) and the Qi Min Yao Shu by Jia Sixia (600 AD) celebrated the fundamental value of agriculture to communities and economies, and documented the best approaches for sustaining food production without damage to the environment. These included rotation methods and green manures for soil fertility, the rules and norms for collective management of resources, the raising of fish in rice fields, and the use of manures. Li Wenhua indicates that, ‘these present a picture of a prosperous, diversified rural economy and a vivid sketch of pastoral peace’. The chapter goes
8 Sustainable Agriculture and Food
on to describe the emergence of modern integrated farming systems, including the innovative eco-county programme promoted by the Chinese government from 1994 onwards. Ecological agriculture, with a long history of development in ancient China, is now being ‘enriched and upgraded with the progress of modern science and technology, and has gradually become a real approach for sustainable agriculture’. In 1911, F H King’s Farmers of Forty Centuries was first published, showing for the first time to the Western world many of the details of agricultural practices and customs of China, Korea and Japan. At that time, the US was ‘as yet a nation of but few people widely scattered over a broad land’, and yet the ancient cultures of the Far East had been intensively farming for several thousand years on the same land. Here, then, is an early indication of the importance and relevance of sustainability, not that King used this term. Sustainability at least implies being able to do the same thing over long periods of time without causing harm to the environment, and King in his travels came to realize this was precisely what farmers in these three countries had been doing for at least 40 centuries. Many factors were important, including careful selection of crops and livestock breeds, water management and soil fertility maintenance. Manures from both animals and humans were widely used, soil amendments of canal mud regularly dredged and applied to fields, and nitrogen-fixing legumes were widespread in a variety of rotation patterns. King indicates, ‘almost every foot of land is made to contribute material for food, fuel or fabric’.
Part 3: Agricultural Revolutions and Change The landscape itself is a type of common property. It can be enjoyed and appreciated by many if, of course, they are allowed to access it. The idea of commons implies jointness, something people can enjoy either collectively or individually and from which they derive value. Over the centuries, two types of common management emerged in Europe. These were for the common or open-field system of cropland, which persisted for a thousand years, and the common management of wild resources, woodlands, pastures, wastes, rivers and coasts. In these systems, local people held rights for grazing, cutting peat for fuel (turbaries), cutting timber for housing (estovers), grazing acorns and beech mast (pannage), and fishing (piscary). Over the years, though, both types of common came to be steadily enclosed and privatized, mostly as a result of the actions of landowners and the state driven by the prevailing view that commons were inefficient. The result was an extraordinary transformation of the landscape, particularly in the 18th and early 19th centuries. In the UK, local enclosure had been occurring up to the 17th century, but the process accelerated with the introduction of parliamentary inclosure acts, dating from the early 18th century and continuing through 2750 Acts to 1845, the
Editorial Introduction to Volume I 9
date of the last general Inclosure Act. At the same time, wastes, heaths, moors and commons were enclosed through 1800 Acts between 1760 and the 1840s. Commissioners with extensive powers were appointed to redesign the landscape in more than 3000 parishes. As a result, 2.75 million hectares of common land were enclosed, comprising 1.82 million hectares of open-field arable, and 0.93 million hectares of so-called wastes. To put this in perspective, there are about 18 million hectares of agricultural land in the UK, of which just 4 million are currently under arable farming, and about half a million still under common land. In the first paper of this section, Michael Turner and colleagues analyse openfield agriculture of 17th and 18th century England, and show how collective community action had developed to protect scarce resources, and how pressure upon these resources through changing economic and demographic conditions inspired communities to develop and promote sustainable methods of husbandry and management. They show how ecological integrity and equitable ownership in decision making went hand-in-hand. This is in stark contrast to the dominant narrative of the time – that the commons were inefficient and backward. The next paper describes the elements of the agricultural change in 17th–18thcentury Europe in what has generally come to be called The Agricultural Revolution. During a period where there was no government ministry of agriculture, no national agricultural research or extension agencies, no radio or TV, no pesticides or inorganic fertilizers, and poor rural transport infrastructure, aggregate cereal and livestock production increased to unprecedented levels. In the 150 years after 1700, wheat production in Britain increase four-fold, and barley and oats threefold; the number of cattle supplied to markets tripled and sheep doubled. Two components were vital: a wide range of innovative technologies were developed by farmers, and then these were spread to other farmers through tours, farmer groups, open days and publications, and then adapted to local conditions by rigorous experimentation. New crops offered diversification opportunities to farmers by allowing intensification of land use. Increased fodder supply meant more livestock, and so increased the supply of manure to improve soil fertility. Selective breeding of livestock produced more efficient conversion of feed to meat, so permitting slaughter at an earlier age and higher stocking rates. New labour-saving machinery released farmers from labour-bottlenecks at cereal and hay harvests, and new tools and techniques improved the efficiency of seed saving. Farmers widely experimented with livestock breeding, irrigation, drainage, handtools and pest control. The Green Revolution of the latter half of the 20th century was another significant agricultural revolution. Without it, poverty and hunger would be much more widespread, especially as it coincided with a period of rapid worldwide population growth. In this chapter, drawn from Gordon Conway’s Doubly Green Revolution, the factors of success of the green revolution are discussed and analysed. Fundamental to success was the application of modern science and technology to the task of getting crops to yield more. The success of the green revolution lay in its simplicity. Agricultural scientists bred new varieties of staple cereals that matured quickly, so permitting two or three crops to be grown each year; that were day-
10 Sustainable Agriculture and Food
length insensitive, so could be extended to farmers at a wide range of latitudes; and that were producers of more grain at the expense of straw. They were also much more nitrogen-responsive than traditional varieties. These modern varieties were distributed to farmers together with inputs, including inorganic fertilizers, pesticides, machinery, credit and water regulation. These technical innovations were then implemented in the best favoured agroclimatic regions and for those classes of farmers with the best expectations of and means for realizing the potential yield increases. Conway draws attention to the limitations of the green revolution – its impact on the poor has been less than expected, it has not reduced natural resource degradation, its geographic impact has been localized, and there are signs of diminishing returns. In particular, the green revolution missed many agricultural systems which, until recently, represent a largely forgotten agriculture. These tend to be located in the drylands, wetlands, uplands, savannas, swamps, near-deserts, mountains and hills, and forests. Farming systems in these areas are complex and diverse, agricultural yields are low, and rural livelihoods are often dependent on wild resources as well as agricultural produce. They are remote from markets and infrastructure; they are located on fragile or problem soils; and less likely to be visited by agricultural scientists and extension workers or studied in research institutions. The poorest countries tend to have higher proportions of these agricultural systems. James Scott’s book Seeing Like a State deploys the Greek term metis to describe ‘forms of knowledge embedded in local experience’. Metis is normally translated as meaning ‘cunning’ or ‘cunning intelligence’, but Scott says this fails to do justice to a range of practical skills and acquired intelligence represented by the term. He contrasts such metis with the ‘more general, abstract knowledge displayed by the state and its technical agencies’ by describing villagization in Tanzania and Ethiopia, Soviet collectivization, the emergence of high-modernist cities and the widespread standardization of agriculture. Failures come when metis is designed out, as the state rarely makes the kinds of necessary daily adjustments required for the effective working of systems. Metis, he says, is ‘plastic, local and divergent... It is in fact the idiosyncrasies of metis, its contextualities, and its fragmentation that make it so permeable, so open to new ideas’. This particular chapter explores the Soviet collectivization project, and shows how high modernism was implemented by thinking big. Nearly everything was planned on a monumental scale – from cities, buildings, construction projects and collectivization of agriculture through rationalization and industrialization. Many of these ideas were imported from the US by Russian agronomists and engineers in the 1920s and 1930s. Some of the resulting projects were enormous. One Sovkhoz collective farm established 1600km south of Moscow cropped 150,000 hectares of solely wheat culture – and was later found to be an abject failure. The state prosecuted a ‘war’ against the peasantry in the period of 1930–1934 in order to liquidate the kulaks (peasant farmers) and enforce collectivization. The ensuing famine resulted in a death toll of at least 3–4 million people, and possibly as many as 20 million.
Editorial Introduction to Volume I 11
In the final chapter of this section, Pedro Sanchez and colleagues set out the themes and challenges for alternatives to slash-and-burn agriculture. Known also as shifting, swidden, milpa, shamba, jhum and kaingin agriculture, slash-and-burn has long been a sustainable and persistent form of agricultural system in the forests of the tropics and sub-tropics. Trees are cleared, crops grown for 1–2 years, livestock then grazed, and then the community moves to cut another area of the forest. Provided they do not return for 20–30 years to the same plot, then sufficient time elapses for the forest fully to regenerate, and the system can persist over long periods. But when total forest cover declines, through logging, ranching or other development projects, or population increases, then the rotation cycle shortens, and the system cannot retain its fertility and success. In some quarters, small farmers engaged in slash-and-burn are blamed for the destruction of tropical rainforests, but in truth it is other pressures that have made their management systems no longer viable. This chapter documents the recent international efforts to produce effective alternatives to slash and burn for the roughly 40 million people (2 per cent of the world’s agricultural population in the tropics) of Latin America, Africa and Asia who currently rely on these systems of management. Lands can be rehabilitated with the right scientific and technological innovations, as well as the appropriate social, economic and policy support.
Part 4: Modern Agricultural Reforms The knowledge that soil erosion was both costly and damaging was first appreciated on a wide scale by agricultural authorities in the US and colonial Africa and India in the early part of the 20th century. They took the view that farmers were mismanagers of soil and water, and so had to be encouraged to adopt conserving practices. Erosion was considered a technical problem requiring only technical action, and so authorities encouraged farmers to construct terraces, bunds (embankments of soil), ditches and drains, and to adopt alternative cropping patterns and contour planting. They also resettled people to discourage the use of certain lands, and destocked other regions of livestock to reduce grazing pressure. The first chapter in this section by Pretty and Shah describes how this style of intervention was first established in the US. It emerged followed the period of severe wind erosion and dust storms that came to be known as the Dust Bowl of the early 1930s. Even though there were subsidies to encourage farmers to adopt new measures, authorities were granted wide-ranging powers to enforce land use regulations. This pattern of intervention was then repeated by colonial authorities in Africa and Asia. Early regulations had been adapted to local conditions and were grounded in farming and grazing practice. But later, administrators travelling to the US saw the devastation, and brought back recommendations for large-scale bunding and ridging, combined with contour ploughing and planting. Locally adapted practices were largely ignored, even though they were more effective in
12 Sustainable Agriculture and Food
droughts. These measures were imposed on farmers, who were then monitored closely to ensure their compliance. In some countries, this meant the compulsory resettlement of many people to new villages. This has been the style for many soil conservation programmes. Technologies known to work under certain conditions are widely used or recommended, and backed up by local and national policies that give powers to the state to execute specified improvements on farmers’ fields and to allocate the costs of these improvements between the farmers and the state. In many places, provisions have been made for compulsory treatment of the fields of farmers refusing land treatment. This has led to increased alienation with, for example, people uprooting plantations and destroying fencing and conservation measures. The quantitative achievements of conventional soil conservation programmes can appear impressive. Throughout the world, terraces have been built, trees planted and farmers trained on a massive scale. Yet these results have often been short-lived, tending to occur only within project boundaries and before project completion. If performance is measured over long periods, the results have been extraordinarily poor for the amount of effort and money expended: technologies have neither persisted nor spread independently into non-project areas. In the second paper, Erick Fernandes and colleagues summarize the types of transitions effected by the Green Revolution, and then set out a vision for agriculture centred on field-culture, with sensitivities towards patterns in space and time. Monocultures are often erroneously seen as real agriculture, yet it is polycultures that have long offered rural people opportunities to maintain on-farm diversity of products and their functions. Multifunctional systems with many components are more resilient and meet many needs compared with mono-functional systems. This chapter sets out four ideas that need revising: that pest control always needs pesticides, that soil fertility constraints always need chemical fertilizers, that solving water problems needs new irrigation, and that raising productivity only needs genetic and breeding approaches. There are many productive opportunities that can arise by adopting more biological and people-centred approaches to agricultural development and its sustainability. The third paper is the second of two chapters from Li Wenhua’s 2001 book on agroecological farming systems in China. This long chapter contains considerable detail on integrated farming systems at different scales from homestead gardens, eco-villages, eco-counties and forest shelterbelts. All contain many significant innovations of relevance to many systems elsewhere in the world. Most rural families in China have very small amounts of land, on average 0.02ha per household, and so their approaches need to be intensive, make effective use of all resources, and above all produce enough food. Of particular importance are the sections on eco-villages and eco-counties. Both represent geographically integrated efforts of what is called ecological engineering in China. The benefits of integrated systems for local people and the environment can be substantial – more income from the vegetables, better and more diverse food, reduced costs for fertilizers, reduced workload for women, and better living conditions in the
Editorial Introduction to Volume I 13
house and kitchen. The Ministry promotes a variety of integrated models across the country, involving mixtures of biogas digesters, fruit and vegetable gardens, underground water tanks, solar greenhouses, solar stoves and heaters, and pigs and poultry. These are fitted to local conditions. Whole integrated systems are now being demonstrated across many regions of China, and altogether 8.5 million households have biogas digesters. The target for the coming decade is the construction of another one million digesters per year. As the systems of waste digestion and energy production are substituting for fuelwood, coal or inefficient cropresidue burning, the benefits for the natural environment are substantial – each digester saves the equivalent of 1.5 tonnes of wood per year, or 3–5mu of forest. Each year, these biogas digesters are effectively preventing 6–7 million tonnes of carbon from being emitted to the atmosphere. Biotechnology remains a controversial topic in agricultural development. Some believe it represents huge risks to agricultural and natural systems; others indicate that such new technologies are essential for agricultural development. Neither view is entirely correct, as biotechnology, and particularly genetic modification, is not one thing, but a wide variety of technologies that represent different potential benefits and risks. Thus assessment should be on a case-by-case basis so that useful technologies are able to be used by farmers, and potentially harmful ones not approved for cultivation. In this paper, Doreen Mnyulwa and Julius Mugwagwa review agricultural biotechnology and its safety mechanisms across southern Africa. Only in South Africa itself have GM crops been commercially cultivated to date, and these are already proving beneficial to small farmers. Some of these technologies have been developed within South Africa with domestic government support. Yet the murky interface between food aid, international politics, science and regulations remains complex, particularly over the potential ‘dumping’ of GM food aid to the region. The final chapter of this volume is drawn from Michael Bell’s excellent account of the transformations brought about by the Practical Farmers of Iowa (PFI). Formed to develop and spread new ideas for sustainable farming, this organization is run by farmers for themselves. They saw that big agriculture was no longer the success it made itself out to be, and realized they needed to help themselves by developing new ways of collaborating and generating new effective farming methods. But PFI is about much more than that. Bell begins by recalling a conversation with Dick Thompson, who has more than 20 years of innovation on his farm. Thompson says you should ‘get along, but don’t go along’. Get along by working with others, emphasizing the importance of communication and dialogue. Don’t go along by not just following what others do – then adapt, change, evolve and be in control. This suggests a very different model for post- or non-modern agriculture. Not the land of monocultures and monologues, of simple diffusion of ideas and adoption of without thinking. Here is an approach to cultivation that embraces the creativity of difference and openness, a project that will never be finished. As Bell says, ‘let us put the culture back in agriculture of all farms and all places’.
14 Sustainable Agriculture and Food
References Harvey D. 1989. The Condition of Postmodernity: An Enquiry into the Origins of Cultural Change. Blackwell, Oxford Kurokawa K. 1991. Intercultural Architecture. The Philosophy of Symbiosis. Academy Editions, London Morgan L H. 1877. Ancient Society. Macmillan, London Posey D. (ed) 1999. Cultural and Spiritual Values of Biodiversity. Intermediate Technology Publications (on behalf of UNEP), London
Part I
Before Agriculture
1
What Hunters Do for a Living, or, How to Make Out on Scarce Resources Richard B. Lee
The current anthropological view of hunter-gatherer subsistence rests on two questionable assumptions. First is the notion that these peoples are primarily dependent on the hunting of game animals, and second is the assumption that their way of life is generally a precarious and arduous struggle for existence. Recent data on living hunter-gatherers (Meggitt, 1964b; Service, 1960) show a radically different picture. We have learned that in many societies, plant and marine resources are far more important than are game animals in the diet. More important, it is becoming clear that, with a few conspicuous exceptions, the huntergatherer subsistence base is at least routine and reliable and at best surprisingly abundant. Anthropologists have consistently tended to under-estimate the viability of even those ‘marginal isolates’ of hunting peoples that have been available to ethnographers. The purpose of this paper is to analyse the food getting activities of one such ‘marginal’ people, the !Kung Bushmen of the Kalahari Desert. Three related questions are posed: How do the Bushmen make a living? How easy or difficult is it for them to do this? What kinds of evidence are necessary to measure and evaluate the precariousness or security of a way of life? And after the relevant data are presented, two further questions are asked: What makes this security of life possible? To what extent are the Bushmen typical of hunter-gatherers in general?
Bushman Subsistence The !Kung Bushmen of Botswana are an apt case for analysis.1 They inhabit the semi-arid north-west region of the Kalahari Desert. With only six to nine inches of Lee R B. 1968. What hunters do for a living, or, how to make out on scarce resources. In Lee R and Devore E. Man the Hunter. Aldine, Chicago, 30–48. Copyright © 1968 by Aldine Publishers. Reprinted by permission of Aldine Transaction, a division of Transaction Publishers.
18 Before Agriculture
rainfall per year, this is, by any account, a marginal environment for human habitation. In fact, it is precisely the unattractiveness of their homeland that has kept the !Kung isolated from extensive contact with their agricultural and pastoral neighbours. Fieldwork was carried out in the Dobe area, a line of eight permanent waterholes near the South-West Africa border and 125 miles south of the Okavango River. The population of the Dobe area consists of 466 Bushmen, including 379 permanent residents living in independent camps or associated with Bantu cattle posts, as well as 87 seasonal visitors. The Bushmen share the area with some 340 Bantu pastoralists largely of the Herero and Tswana tribes. The ethnographic present refers to the period of fieldwork: October 1963–January, 1965. The Bushmen living in independent camps lack firearms, livestock and agriculture. Apart from occasional visits to the Herero for milk, these !Kung are entirely dependent upon hunting and gathering for their subsistence. Politically they are under the nominal authority of the Tswana headman, although they pay no taxes and receive very few government services. European presence amounts to one overnight government patrol every six to eight weeks. Although Dobe-area !Kung have had some contact with outsiders since the 1880s, the majority of them continue to hunt and gather because there is no viable alternative locally available to them.2 Each of the 14 independent camps is associated with one of the permanent waterholes. During the dry season (May–October) the entire population is clustered around these wells. Table 1.1 shows the numbers at each well at the end of the 1964 dry season. Two wells had no camp resident and one large well supported five camps. The number of camps at each well and the size of each camp changed frequently during the course of the year. The ‘camp’ is an open aggregate of cooperating persons which changes in size and composition from day to day. Therefore, I have avoided the term ‘band’ in describing the !Kung Bushman living groups.3 Table 1.1 Number and distribution of resident Bushmen and Bantu by waterholea Name of waterhole
No. of camps Population of camps
Other Bushmen
Total Bushmen
Bantu
Dobe
2
37
—
37
—
!angwa
1
16
23
39
84
Bate
2
30
12
42
21
!ubi
1
19
—
19
65
!gose
3
52
9
61
18
/ai/ai
5
94
13
107
67
!xabe
—
—
8
8
12
Mahopa
—
—
23
23
73
Total
14
248
88
336
340
Note: a Figures do not include 130 Bushmen outside area on the date of census.
What Hunters Do for a Living, or, How to Make Out on Scarce Resources 19
Each waterhole has a hinterland lying within a six-mile radius which is regularly exploited for vegetable and animal foods. These areas are not territories in the zoological sense, since they are not defended against outsiders. Rather they constitute the resources that lie within a convenient walking distance of a waterhole. The camp is a self-sufficient subsistence unit. The members move out each day to hunt and gather, and return in the evening to pool the collected foods in such a way that every person present receives an equitable share. Trade in foodstuffs between camps is minimal; personnel do move freely from camp to camp, however. The net effect is of a population constantly in motion. On the average, an individual spends a third of his time living only with close relatives, a third visiting other camps, and a third entertaining visitors from other camps. Because of the strong emphasis on sharing, and the frequency of movement, surplus accumulation of storable plant foods and dried meat is kept to a minimum. There is rarely more than two or three days’ supply of food on hand in a camp at any time. The result of this lack of surplus is that a constant subsistence effort must be maintained throughout the year. Unlike agriculturalists who work hard during the planting and harvesting seasons and undergo ‘seasonal unemployment’ for several months, the Bushmen hunter-gatherers collect food every third or fourth day throughout the year. Vegetable foods comprise from 60–80 per cent of the total diet by weight, and collecting involves two or three days of work per woman per week. The men also collect plants and small animals but their major contribution to the diet is the hunting of medium and large game. The men are conscientious but not particularly successful hunters; although men’s and women’s work input is roughly equivalent in terms of man-day of effort, the women provide two to three times as much food by weight as the men. Table 1.2 summarizes the seasonal activity cycle observed among the Dobearea !Kung in 1964. For the greater part of the year, food is locally abundant and easily collected. It is only during the end of the dry season in September and October, when desirable foods have been eaten out in the immediate vicinity of the waterholes that the people have to plan longer hikes of 10–15 miles and carry their own water to those areas where the mongongo nut is still available. The important point is that food is a constant, but distance required to reach food is a variable; it is short in the summer, fall and early winter, and reaches its maximum in the spring. This analysis attempts to provide quantitative measures of subsistence status including data on the following topics: abundance and variety of resources, diet selectivity, range size and population density, the composition of the work force, the ratio of work to leisure time, and the caloric and protein levels in the diet. The value of quantitative data is that they can be used comparatively and also may be useful in archaeological reconstruction. In addition, one can avoid the pitfalls of subjective and qualitative impressions; for example, statements about food ‘anxiety’ have proven to be difficult to generalize across cultures (see Holmberg, 1950; and Needham’s critique, 1954).
Feb.
b
a
May
At large summer pools
Large summer pools
Autumn Dry
April
Water-food distance minimal
Aug.
Sept.
All population restricted to permanent waterholes
Permanent waterholes only
Winter Dry
July
Increasing distance from water to food
Roots, bulbs, resins
Trapping small game in snares
June
Boys’ initiationa
Dancing, trance performances and ritual curing (Year-round)
Fruits, berries, melons
2.
Some gathering (Year-round)
Gathering of mongongo nuts (Year-round)
3.
1.
Running down immatures
2.
1. Hunting with bow, arrows and dogs (Year-round)
Mar.
Held once every five years; none in 1963–64. New Year’s: Bushmen join the celebrations of their missionized Bantu neighbours.
Relative subsistence hardship
Ritual activities
Women’s subsistence activities
Men’s subsistence activities
Widely dispersed at summer pools
Group moves
Summer Rains
Temporary summer pools everywhere
Jan.
Availability of water
Season
Table 1.2 The Bushman annual round Oct.
Dec.
Water-food distance minimal
b
Running down newborn animals
Moving out to summer pools
Summer pools developing
First Rains
Nov.
Roots, leafy, greens
Spring Dry
20 Before Agriculture
What Hunters Do for a Living, or, How to Make Out on Scarce Resources 21
Abundance and variety of resources It is impossible to define ‘abundance’ of resources absolutely. However, one index of relative abundance is whether or not a population exhausts all the food available from a given area. By this criterion, the habitat of the Dobe-area Bushmen is abundant in naturally occurring foods. By far the most important food is the Mongongo (mangetti) nut (Ricinodendron rautanenii Schinz). Although tens of thousands of pounds of these nuts are harvested and eaten each year, thousands more rot on the ground each year for want of picking. The mongongo nut, because of its abundance and reliability, alone accounts for 50 per cent of the vegetable diet by weight. In this respect it resembles a cultivated staple crop such as maize or rice. Nutritionally it is even more remarkable, for it contains five times the calories and ten times the proteins per cooked unit of the cereal crops. The average daily per-capita consumption of 300 nuts yields about 1260 calories and 56 grammes (g) of protein. This modest portion, weighing only about 7.5 ounces, contains the caloric equivalent of 2.5 pounds of cooked rice and the protein equivalent of 14 ounces of lean beef (Watt and Merrill, 1963). Furthermore the mongongo nut is drought resistant and it will still be abundant in the dry years when cultivated crops may fail. The extremely hard outer shell protects the inner kernel from rot and allows the nuts to be harvested for up to 12 months after they have fallen to the ground. A diet based on mongongo nuts is in fact more reliable than one based on cultivated foods, and it is not surprising, therefore, that when a Bushman was asked why he hadn’t taken to agriculture he replied: ‘Why should we plant, when there are so many mongongo nuts in the world?’ Apart from the mongongo, the Bushmen have available 84 other species of edible food plants, including 29 species of fruits, berries and melons and 30 species of roots and bulbs. The existence of this variety allows for a wide range of alternatives in subsistence strategy. During the summer months the Bushmen have no problem other than to choose among the tastiest and most easily collected foods. Many species, which are quite edible but less attractive, are bypassed, so that gathering never exhausts all the available plant foods of an area. During the dry season the diet becomes much more eclectic and the many species of roots, bulbs and edible resins make an important contribution. It is this broad base that provides an essential margin of safety during the end of the dry season when the mongongo nut forests are difficult to reach. In addition, it is likely that these rarely utilized species provide important nutritional and mineral trace elements that may be lacking in the more popular foods.
Diet selectivity If the Bushmen were living close to the ‘starvation’ level, then one would expect them to exploit every available source of nutrition. That their life is well above this level is indicated by the data in Table 1.3. Here all the edible plant species are
—
1
—
—
—
— 1
1
1
—
—
—
—
2
Fruit Bean and and nut root
1
—
—
—
—
1
—
Fruit and stalk
30
4
9
9
7
1
—
Root, bulb
29
6
4
12
3
4
—
16
4
—
10
2
—
—
Part eaten Fruit, Resin berry, melon
1 species constitutes 50 per cent of the vegetable diet by weight. b 23 species constitutes 90 per cent of the vegetable diet by weight. c 62 species constitutes the remaining 10 per cent of the diet.
a
I. PRIMARY Eaten daily throughout year (mongongo nut) II. MAJOR Eaten daily in season III. MINOR Eaten several times per week in season IV. SUPPLEMENTARY Eaten when classes I–III locally unavailable V. RARE Eaten several times per year VI. PROBLEMATIC Edible but not observed to be eaten Total Species
Food class
4
1
—
1
2
—
—
2
2
—
—
—
—
—
85
17
13
32
14
8
1
100
nil
c. 3
c. 7
c. 15
c. 25
c. 50
—
nil
c. 0.1
c. 0.2
c. 1
c. 3
c. 50a
Totals (%) Estimated Estimated Leaves Seed, Total number bean of species contribution by weight contribution of to vegetable diet each species in class
Table 1.3 !Kung Bushman plant foods
c
b
22 Before Agriculture
What Hunters Do for a Living, or, How to Make Out on Scarce Resources 23
arranged in classes according to the frequency with which they were observed to be eaten. It should be noted, that although there are some 85 species available, about 90 per cent of the vegetable diet by weight is drawn from only 23 species. In other words, 75 per cent of the listed species provide only 10 per cent of the food value. In their meat-eating habits, the Bushmen show a similar selectivity. Of the 223 local species of animals known and named by the Bushmen, 54 species are classified as edible, and of these only 17 species were hunted on a regular basis.4 Only a handful of the dozens of edible species of small mammals, birds, reptiles and insects that occur locally are regarded as food. Such animals as rodents, snakes, lizards, termites and grasshoppers, which in the literature are included in the Bushman dietary (Schapera, 1930), are despised by the Bushmen of the Dobe area.
Range size and population density The necessity to travel long distances, the high frequency of moves, and the maintenance of populations at low densities are also features commonly associated with the hunting and gathering way of life. Density estimates for hunters in western North America and Australia have ranged from 3 persons/square mile to as low as 1 person/100 square miles (Kroeber, 1939; Radcliffe-Brown, 1930). In 1963– 1965, the resident and visiting Bushmen were observed to utilize an area of about 1000 square miles during the course of the annual round for an effective population density of 41 persons/100 square miles. Within this area, however, the amount of ground covered by members of an individual camp was surprisingly small. A day’s round-trip of 12 miles serves to define a ‘core’ area 6 miles in radius surrounding each water point. By fanning out in all directions from their well, the members of a camp can gain access to the food resources of well over 100 square miles of territory within a two-hour hike. Except for a few weeks each year, areas lying beyond this 6-mile radius are rarely utilized, even though they are no less rich in plants and game than are the core areas. Although the Bushmen move their camps frequently (five or six times a year) they do not move them very far. A rainy season camp in the nut forests is rarely more than 10 or 12 miles from the home waterhole, and often new campsites are occupied only a few hundred yards away from the previous one. By these criteria, the Bushmen do not lead a free-ranging nomadic way of life. For example, they do not undertake long marches of 30 to 100 miles to get food, since this task can be readily fulfilled within a day’s walk of home base. When such long marches do occur they are invariably for visiting, trading and marriage arrangements, and should not be confused with the normal routine of subsistence.
Demographic factors Another indicator of the harshness of a way of life is the age at which people die. Ever since Hobbes characterized life in the state of nature as ‘nasty, brutish and
24 Before Agriculture
short’, the assumption has been that hunting and gathering is so rigorous that members of such societies are rapidly worn out and meet an early death. Silberbauer, for example, says of the Gwi Bushmen of the central Kalahari that ‘life expectancy … is difficult to calculate, but I do not believe that many live beyond 45’ (1965, p17). And Coon has said of the hunters in general: The practice of abandoning the hopelessly ill and aged has been observed in many parts of the world. It is always done by people living in poor environments where it is necessary to move about frequently to obtain food, where food is scarce, and transportation difficult … Among peoples who are forced to live in this way the oldest generation, the generation of individuals who have passed their physical peak is reduced in numbers and influence. There is no body of elders to hand on tradition and control the affairs of younger men and women, and no formal system of age grading (1948, p55).
The !Kung Bushmen of the Dobe area flatly contradict this view. In a total population of 466, no fewer than 46 individuals (17 men and 29 women) were determined to be over 60 years of age, a proportion that compares favourably to the percentage of elderly in industrialized populations. The aged hold a respected position in Bushman society and are the effective leaders of the camps. Senilicide is extremely rare. Long after their productive years have passed, the old people are fed and cared for by their children and grandchildren. The blind, the senile and the crippled are respected for the special ritual and technical skills they possess. For instance, the four elders at !gose waterhole were totally or partially blind, but this handicap did not prevent their active participation in decision making and ritual curing. Another significant feature of the composition of the work force is the late assumption of adult responsibility by the adolescents. Young people are not expected to provide food regularly until they are married. Girls typically marry between the ages of 15 and 20, and boys about five years later, so that it is not unusual to find healthy, active teenagers visiting from camp to camp while their older relatives provide food for them. As a result, the people in the age group 20–60 support a surprisingly large percentage of non-productive young and old people. About 40 per cent of the population in camps contribute little to the food supplies. This allocation of work to young and middle-aged adults allows for a relatively carefree childhood and adolescence and a relatively unstrenuous old age.
Leisure and work Another important index of ease or difficulty of subsistence is the amount of time devoted to the food quest.5 Hunting has usually been regarded by social scientists as a way of life in which merely keeping alive is so formidable a task that members of such societies lack the leisure time necessary to ‘build culture’.6 The !Kung Bushmen would appear to conform to the rule, for as Lorna Marshall says:
What Hunters Do for a Living, or, How to Make Out on Scarce Resources 25 It is vividly apparent that among the !Kung Bushmen, ethos, or ‘the spirit which actuates manners and customs,’ is survival. Their time and energies are almost wholly given to this task, for life in their environment requires that they spend their days mainly in procuring food (1965, p247).
It is certainly true that getting food is the most important single activity in Bushman life. However this statement would apply equally well to small-scale agricultural and pastoral societies too. How much time is actually devoted to the food quest is fortunately an empirical question. And an analysis of the work effort of the Dobe Bushmen shows some unexpected results. From 6 July to 2 August 1964, I recorded all the daily activities of the Bushmen living at the Dobe waterhole. Because of the coming and going of visitors, the camp population fluctuated in size day by day, from a low of 23 to a high of 40, with a mean of 31.8 persons. Each day some of the adult members of the camp went out to hunt and/or gather while others stayed home or went visiting. The daily recording of all personnel on hand made it possible to calculate the number of man-days of work as a percentage of total number of man-days of consumption. Although the Bushmen do not organize their activities on the basis of a sevenday week, I have divided the data this way to make them more intelligible. The work-week was calculated to show how many days out of seven each adult spent in subsistence activities (Table 1.4, Column 7). Week II has been eliminated from the totals since the investigator contributed food. In week I, the people spent an average of 2.3 days in subsistence activities, in week III, 1.9 days, and in week IV, 3.2 days. In all, the adults of the Dobe camp worked about two and a half days a week. Since the average working day was about six hours long, the fact emerges that !Kung Bushmen of Dobe, despite their harsh environment, devote from 12 to 19 hours a week to getting food. Even the hardest working individual in the camp, a man named ≠oma who went out hunting on 16 of the 28 days, spent a maximum of 32 hours a week in the food quest. Because the Bushmen do not amass a surplus of foods, there are no seasons of exceptionally intensive activities such as planting and harvesting, and no seasons of unemployment. The level of work observed is an accurate reflection of the effort required to meet the immediate caloric needs of the group. This work diary covers the mid-winter dry season, a period when food is neither at its most plentiful nor at its scarcest levels, and the diary documents the transition from better to worse conditions (see Table 1.2). During the fourth week the gatherers were making overnight trips to camps in the mongongo nut forests seven to ten miles distant from the waterhole. These longer trips account for the rise in the level of work, from 12 or 13 to 19 hours per week. If food getting occupies such a small proportion of a Bushman’s waking hours, then how do people allocate their time? A woman gathers on one day enough food to feed her family for three days, and spends the rest of her time resting in camp, doing embroidery, visiting other camps or entertaining visitors from other camps. For each day at home, kitchen routines, such as cooking, nut cracking, collecting
231
304
82
84
73
65
668
866
249
240
198
179
410
490
129
177
80
104
(6) Meat (lbs)
2.5
2.2
3.2
1.9
1.2
2.3
.23
.21
.31
.18
.11
.21
(7) (8) Average work Index of week/adult subsistence effort
Column 8: Index of subsistence effort =
man-days of work (e.g., in Week I, the value of ‘S’ = .21, i.e., 21 days of work/100 days of man-days of consumption consumption or 1 work day produces food for 5 consumption days).
156
178
77
42
22
37
(3) (4) (5) Child-days Total man-days of Man-days consumption of work
total man-days of consumption . 7 Column 7: Work week = the number of work days per adult per week.
See text
Key: Column 1: Mean group size =
a
437
167
31.8
35.6 (32–40)
IV (July 27– Aug. 2)
156
125
Adjusted totala
34.3 (29–40)
III (July 20–26) 562
28.3 (23–27)
II (July 13–19)
114
30.9
25.6 (23–29)
I (July 6–12)
(2) Adult-days
4-wk. total
(I) Mean group size
Week
Table 1.4 Summery of Dobe work diary
26 Before Agriculture
What Hunters Do for a Living, or, How to Make Out on Scarce Resources 27
firewood and fetching water, occupy one to three hours of her time. This rhythm of steady work and steady leisure is maintained throughout the year. The hunters tend to work more frequently than the women, but their schedule is uneven. It is not unusual for a man to hunt avidly for a week and then do no hunting at all for two or three weeks. Since hunting is an unpredictable business and subject to magical control, hunters sometimes experience a run of bad luck and stop hunting for a month or longer. During these periods, visiting, entertaining and especially dancing are the primary activities of men. (Unlike the Hadza, gambling is only a minor leisure activity.) The trance-dance is the focus of Bushman ritual life; over 50 per cent of the men have trained as trance-performers and regularly enter trance during the course of the all-night dances. At some camps, trance-dances occur as frequently as two or three times a week and those who have entered trances the night before rarely go out hunting the following day. Accounts of Bushman trance performances have been published in Lorna Marshall (1962) and Lee (1967). In a camp with five or more hunters, there are usually two or three who are actively hunting and several others who are inactive. The net effect is to phase the hunting and non-hunting so that a fairly steady supply of meat is brought into a camp.
Caloric returns Is the modest work effort of the Bushmen sufficient to provide the calories necessary to maintain the health of the population? Or have the !Kung, in common with some agricultural peoples (see Richards, 1939), adjusted to a permanently substandard nutritional level? During my fieldwork I did not encounter any cases of kwashiorkor, the most common nutritional disease in the children of African agricultural societies. However, without medical examinations, it is impossible to exclude the possibility that subclinical signs of malnutrition existed.7 Another measure of nutritional adequacy is the average consumption of calories and proteins per person per day. The estimate for the Bushmen is based on observations of the weights of foods of known composition that were brought into Dobe camp on each day of the study period. The per-capita figure is obtained by dividing the total weight of foodstuffs by the total number of persons in the camp. These results are set out in detail elsewhere (Lee, in press) and can only be summarized here. During the study period 410 pounds of meat were brought in by the hunters of the Dobe camp, for a daily share of nine ounces of meat per person. About 700 pounds of vegetable foods were gathered and consumed during the same period. Table 1.5 sets out the calories and proteins available per capita in the !Kung Bushman dietary from meat, mongongo nuts and other vegetable sources. This output of 2140 calories and 93.1 grams of protein per person per day may be compared with the Recommended Daily Allowances (RDA) for persons of the small size and stature but vigorous activity regime of the !Kung Bushmen. The RDA for Bushmen can be estimated at 1975 calories and 60 grams of protein per
28 Before Agriculture Table 1.5 Caloric and protein levels in the !Kung Bushman dietary, July–August 1964 Class of food Percentage contribution to diet by weight
Per capita consumption Weight in grams
Protein in grams
Percentage caloric Calories per contribution of meat and person per vegetables day
Meat
37
230
34.5
690
33
Mongongo nuts
33
210
56.7
1260
67
Other vegetable foods
30
190
1.9
190
100
630
93.1
2140
Total All sources
100
person per day. (Taylor and Pye, 1966, pp45–48, 463). Thus it is apparent that food output exceeds energy requirements by 165 calories and 33 grams of protein. One can tentatively conclude that even a modest subsistence effort of two or three days work per week is enough to provide an adequate diet for the !Kung Bushmen.
The Security of Bushman Life I have attempted to evaluate the subsistence base of one contemporary huntergatherer society living in a marginal environment. The !Kung Bushmen have available to them some relatively abundant high-quality foods, and they do not have to walk very far or work very hard to get them. Furthermore this modest work effort provides sufficient calories to support not only the active adults, but also a large number of middle-aged and elderly people. The Bushmen do not have to press their youngsters into the service of the food quest, nor do they have to dispose of the oldsters after they have ceased to be productive. The evidence presented assumes an added significance because this security of life was observed during the third year of one of the most severe droughts in South Africa’s history. Most of the 576,000 people of Botswana are pastoralists and agriculturalists. After the crops had failed three years in succession and over 100,000 head of cattle had died on the range for lack of water, the World Food Program of the United Nations instituted a famine relief programme which has grown to include 180,000 people, over 30 per cent of the population (Government of Botswana, 1966). This programme did not touch the Dobe area in the isolated northwest corner of the country and the Herero and Tswana women there were able to feed their families only by joining the Bushman women to forage for wild foods. Thus the natural plant resources of the Dobe area were carrying a higher
What Hunters Do for a Living, or, How to Make Out on Scarce Resources 29
proportion of population than would be the case in years when the Bantu harvested crops. Yet this added pressure on the land did not seem to adversely affect the Bushmen. In one sense it was unfortunate that the period of my fieldwork happened to coincide with the drought, since I was unable to witness a ‘typical’ annual subsistence cycle. However, in another sense, the coincidence was a lucky one, for the drought put the Bushmen and their subsistence system to the acid test and, in terms of adaptation to scarce resources, they passed with flying colours. One can postulate that their subsistence base would be even more substantial during years of higher rainfall. What are the crucial factors that make this way of life possible? I suggest that the primary factor is the Bushmen’s strong emphasis on vegetable food sources. Although hunting involves a great deal of effort and prestige, plant foods provide from 60–80 per cent of the annual diet by weight. Meat has come to be regarded as a special treat; when available, it is welcomed as a break from the routine of vegetable foods, but it is never depended upon as a staple. No one ever goes hungry when hunting fails. The reason for this emphasis is not hard to find. Vegetable foods are abundant, sedentary and predictable. They grow in the same place year after year, and the gatherer is guaranteed a day’s return of food for a day’s expenditure of energy. Game animals, by contrast, are scarce, mobile, unpredictable and difficult to catch. A hunter has no guarantee of success and may in fact go for days or weeks without killing a large mammal. During the study period, there were 11 men in the Dobe camp, of whom four did no hunting at all. The seven active men spent a total of 78 man-days hunting, and this work input yielded 18 animals killed, or one kill for every four man-days of hunting. The probability of any one hunter making a kill on a given day was 0.23. By contrast, the probability of a woman finding plant food on a given day was 1.00. In other words, hunting and gathering are not equally felicitous subsistence alternatives. Consider the productivity per man-hour of the two kinds of subsistence activities. One man-hour of hunting produces about 100 edible calories, and of gathering, 240 calories. Gathering is thus seen to be 2.4 times more productive than hunting. In short, hunting is a high-risk, low-return subsistence activity, while gathering is a low-risk, high-return subsistence activity. It is not at all contradictory that the hunting complex holds a central place in the Bushman ethos and that meat is valued more highly than vegetable foods (Marshall, 1960). Analogously, steak is valued more highly than potatoes in the food preferences of our own society. In both situations the meat is more ‘costly’ than the vegetable food. In the Bushman case, the cost of food can be measured in terms of time and energy expended. By this standard, 1000 calories of meat ‘costs’ 10 man-hours, while the ‘cost’ of 1000 calories of vegetable foods is only four man-hours. Further, it is to be expected that the less predictable, more expensive food source would have a greater accretion of myth and ritual built up around it than would the routine staples of life, which rarely if ever fail.
30 Before Agriculture
Eskimo–Bushman comparisons Were the Bushmen to be deprived of their vegetable food sources, their life would become much more arduous and precarious. This lack of plant foods, in fact, is precisely the situation among the Netsilik Eskimo, reported by Balikci (1968). The Netsilik and other Central Arctic peoples are perhaps unique in the almost total absence of vegetable foods in their diet. This factor, in combination with the great cyclical variation in the numbers and distribution of Arctic fauna, makes Eskimo life the most precarious human adaptation on earth. In effect, the kinds of animals that are ‘luxury goods’ to many hunters and gatherers, are to the Eskimos, the absolute necessities of life. However, even this view should not be exaggerated, since most of the Eskimos in historic times have lived south of the Arctic Circle (Laughlin, 1968) and many of the Eskimos at all latitudes have depended primarily on fishing, which is a much more reliable source of food than is the hunting of land and sea mammals.
What Hunters Do for a Living: A Comparative Study I have discussed how the !Kung Bushmen are able to manage on the scarce resources of their inhospitable environment. The essence of their successful strategy seems to be that while they depend primarily on the more stable and abundant food sources (vegetables in their case), they are nevertheless willing to devote considerable energy to the less reliable and more highly valued food sources such as medium and large mammals. The steady but modest input of work by the women provides the former, and the more intensive labours of the men provide the latter. It would be theoretically possible for the Bushmen to survive entirely on vegetable foods, but life would be boring indeed without the excitement of meat feasts. The totality of their subsistence activities thus represents an outcome of two individual goals; the first is the desire to live well with adequate leisure time, and the second is the desire to enjoy the rewards, both social and nutritional, afforded by the killing of game. In short, the Bushmen of the Dobe area eat as much vegetable food as they need, and as much meat as they can. It seems reasonable that a similar kind of subsistence strategy would be characteristic of hunters and gatherers in general. Wherever two or more kinds of natural foods are available, one would predict that the population exploiting them would emphasize the more reliable source. We would also expect, however, that the people would not neglect the alternative means of subsistence. The general view offered here is that gathering activities, for plants and shellfish, should be the most productive of food for hunting and gathering man, followed by fishing, where this source is available. The hunting of mammals is the least reliable source of food and should be generally less important than either gathering or fishing. In order to test this hypothesis, a sample of 58 societies was drawn from the Ethnographic Atlas (Murdock, 1967). The basis for inclusion in the sample was a
What Hunters Do for a Living, or, How to Make Out on Scarce Resources 31
100 per cent dependence on hunting, gathering and fishing for subsistence as rated in Columns 7–11 of the Atlas (Murdock, 1967, pp154–155). These 58 societies are plotted in Figures 1.1 and 1.2 and are listed in Tables 1.7 and 1.8 of the Appendix to this chapter.8, 9 The Ethnographic Atlas coding discusses ‘Subsistence Economy’ as follows: A set of five digits indicates the estimated relative dependence of the society on each of the five major types of subsistence activity. The first digit refers to the gathering of wild plants and small land fauna; the second, to hunting, including trapping and fowling; the third, to fishing, including shell fishing and the pursuit of large aquatic animals; the fourth, to animal husbandry; the fifth, to agriculture (Murdock, 1967, pp154–55).
Two changes have been made in the definitions of subsistence. First, the participants at the symposium on Man the Hunter agreed that the ‘pursuit of large aquatic animals’ is more properly classified under hunting than under fishing. Similarly, it was recommended that shellfishing should be classified under gathering, not fishing. These suggestions have been followed and the definitions now read: Gathering – collecting of wild plant, small land fauna and shellfish; Hunting – pursuit of land and sea mammals; Fishing – obtaining of fish by any technique. In 25 cases, the subsistence scores have been changed in light of these definitions and after consulting ethnographic sources.10 In Tables 1.9 and 1.10 of the Appendix to this article, the percentage dependence on gathering, hunting and fishing, and the most important single source of food for each society are presented. Such scores can be at best only rough approximations; however, the results are so striking that the use of these scores seems justified. In the Old World and South American sample of 24 societies, 16 depend on gathering, five on fishing, while only three depend primarily on mammal hunting: the Yukaghir of northeast Asia, and the Ona and Shiriana of South America. In the North American sample, 13 societies have primary dependence on gathering, 13 on fishing, and eight on hunting. Thus for the world as a whole, half of the societies (29 cases) emphasize gathering, one-third (18 cases) fishing, and the remaining one-sixth (11 cases) hunting. On this evidence, the ‘hunting’ way of life appears to be in the minority. The result serves to underline the point made earlier that mammal hunting is the least reliable of the subsistence sources, and one would expect few societies to place primary dependence on it. As will be shown, most of the societies that rely primarily on mammals do so because their particular habitats offer no viable alternative subsistence strategy.
The relation of latitude to subsistence The peoples we have classified as ‘hunters’ apparently depend for most of their subsistence on sources other than meat, namely, wild plants, shellfish and fish. In fact the present sample over-emphasizes the incidence of hunting and fishing since
32 Before Agriculture Table 1.6 Primary subsistence source by latitude Degrees from the equator
Primary subsistence source Gathering
Fishing
Total
More than 60°
—
6
2
8
50°–59°
—
1
9
10
40°–49°
4
3
5
12
30°–39°
9
—
—
9
20°–29°
7
—
1
8
10°–19°
5
—
1
6
0°–9°
4
1
—
5
World
29
11
18
58
Hunting
some three-fifths of the cases (34/58) are drawn from North America (north of the Rio Grande) a region which lies entirely within the temperate and arctic zones. Since the abundance and species variety of edible plants decreases as one moves out of the tropical and temperate zones, and approaches zero in the arctic, it is essential that the incidence of hunting, gathering and fishing be related to latitude. Table 1.6 shows the relative importance of gathering, hunting and fishing within each of seven latitude divisions. Hunting appears as the dominant mode of subsistence only in the highest latitudes (60 or more degrees from the equator). In the arctic, hunting is primary in six of the eight societies. In the cool to cold temperate latitudes, 40 to 59 degrees from the equator, fishing is the dominant mode, appearing as primary in 14 out of 22 cases. In the warm-temperate, subtropical and tropical latitudes, zero to 39 degrees from the equator, gathering is by far the dominant mode of subsistence, appearing as primary in 25 of the 28 cases. For modern hunters, at any rate, it seems legitimate to predict a hunting emphasis only in the arctic, a fishing emphasis in the mid–high latitudes, and a gathering emphasis in the rest of the world.11
The importance of hunting Although hunting is rarely the primary source of food, it does make a remarkably stable contribution to the diet. Fishing appears to be dispensable in the tropics, and a number of northern peoples manage to do without gathered foods, but, with a single exception, all societies at all latitudes derive at least 20 per cent of their diet from the hunting of mammals. Latitude appears to make little difference in the amount of hunting that people do. Except for the highest latitudes, where hunting contributes over half of the diet in many cases, hunted foods almost everywhere else constitute 20 to 45 per cent of the diet. In fact, the mean, the median and the mode for hunting all converge on a figure of 35 per cent for hunter-gatherers at all latitudes. This percentage of meat corresponds closely to the 37 per cent noted in
What Hunters Do for a Living, or, How to Make Out on Scarce Resources 33
the diet of the !Kung Bushmen of the Dobe area. It is evident that the !Kung, far from being an aberrant case, are entirely typical of the hunters in general in the amount of meat they consume.
Conclusions Three points ought to be stressed. First, life in the state of nature is not necessarily nasty, brutish and short. The Dobe-area Bushmen live well today on wild plants and meat, in spite of the fact that they are confined to the least productive portion of the range in which Bushman peoples were formerly found. It is likely that an even more substantial subsistence base would have been characteristic of these hunters and gatherers in the past, when they had the pick of African habitats to choose from. Second, the basis of Bushman diet is derived from sources other than meat. This emphasis makes good ecological sense to the !Kung Bushmen and appears to be a common feature among hunters and gatherers in general. Since a 30 to 40 per cent input of meat is such a consistent target for modern hunters in a variety of habitats, is it not reasonable to postulate a similar percentage for prehistoric hunters? Certainly the absence of plant remains on archaeological sites is by itself not sufficient evidence for the absence of gathering. Recently abandoned Bushman campsites show a similar absence of vegetable remains, although this paper has clearly shown that plant foods comprise over 60 per cent of the actual diet. Finally, one gets the impression that hunting societies have been chosen by ethnologists to illustrate a dominant theme, such as the extreme importance of environment in the moulding of certain cultures. Such a theme can be best exemplified by cases in which the technology is simple and/or the environment is harsh. This emphasis on the dramatic may have been pedagogically useful, but unfortunately it has led to the assumption that a precarious hunting subsistence base was characteristic of all cultures in the Pleistocene. This view of both modern and ancient hunters ought to be reconsidered. Specifically I am suggesting a shift in focus away from the dramatic and unusual cases, and towards a consideration of hunting and gathering as a persistent and well-adapted way of life.
34 Before Agriculture
Appendix Table 1.7 The sample of hunter-gatherers (excluding North America) People (Atlas No.)
Latitude and longitude (degrees)
AFRICA n = 5 1. !Kung Bushmen (Aa1)
20S, 21E
2. Dorobo (Aa2)
2S, 36E
3. Mbuti Pygmies (Aa5)
2N, 28E
4. Hadza (Aa9)
3S, 35E
5. Gwi Bushmen (1)
22S, 23E
ASIA n = 5 6. Gilyak (Eci)
53N, 142E
7. Yukaghir (Ec6)
70N, 145E
8. Ainu (Ec7)
44N, 144E
9. Andamanese (Eh1)
12N, 93E
10. Semang (Ej3)
6N, 101E
AUSTRALIA n = 6 11. Aranda (Id1)
24S, 134E
12. Murngin (Id2)
12S, 136E
13. Tiwi (Id3)
12S, 131E
14. Dieri (Id4)
28S, 138E
15. Wikmunkan (Id6)
14S, 142E
16. Walbiri (2)
22S, 133E
SOUTH AMERICA n = 8 17. Paraujano (Sb5)
11N, 72W
18. Shiriana (Sd6)
4N, 63W
19. Yahgan (Sg1)
55S, 69W
20. Ona (Sg3)
54S, 69W
21. Alacaluf (Sg5)
52S, 74W
22. Chamacoco (Sh6)
20S, 59W
23. Aweikoma (Sj3)
28S, 50W
24. Botocudo (Sj5)
18S, 42W
What Hunters Do for a Living, or, How to Make Out on Scarce Resources 35 Table 1.8 The North American sample People (Atlas No.)
Latitude and longitude (degrees)
1. Copper Eskimo (Na3)
69N, 110W
2. Kaska (Na4)
59N, 128W
3. Ingalik (Na8)
62N, 160W
4. Chugach (Na10)
60N, 166W
5. Nunamiut (Na12)
68N, 152W
6. Kutchin (Na20)
66N, 135W
7. Chipewyan (Na30)
60N, 105W
8. Montagnais (Na32)
48N, 72W
9. Northern Saulteaux (Na33)
52N, 98W
10. Eyak (Nb5)
60N, 145W
11. Tsimshian (Nb7)
55N, 130W
12. Quileute (Nb18)
48N, 125W
13. Chinook (Nb19)
46N, 124W
14. Tlingit (Nb22)
58N, 134W
15. Bellabella (Nb23)
52N, 128W
16. Cowichan (Nb26)
49N, 123W
17. Tututni (Nb31)
42N, 124W
18. Chimariko (Nb33)
41N, 123W
19. Tubatulabal (Nc2)
36N, 118W
20. Diegueno (Nc6)
32N, 116W
21. Modoc (Nc9)
43N, 122W
22. Achomawi (Nc10)
41N, 121W
23. Wintu (Nc14)
41N, 122W
24. Coast Yuki (Nc15)
39N, 124W
25. Lake Yokuts (Nc24)
36N, 120W
26. Cahuilla (Nc31)
33N, 116W
27. Washo (Nd6)
39N, 120W
28. Chilcotin (Nd8)
52N, 122W
29. Flathead (Nd12)
46N, 113W
30. Umatilla (Nd19)
46N, 119W
31. Panamint (Nd32)
36N, 117W
32. Kaibab (Nd53)
36N, 113W
33. Yavapai (Nd66)
35N, 112W
34. Seri (Ni4)
29N, 112W
36 Before Agriculture
Figure 1.1 Old World and South American Hunter-gatherers Table 1.9 Subsistence base of hunter-gatherers (Old World and South America) Percentage dependence on: People
Primary subsistence source
Gathering
Hunting
Fishing
1. !Kung Bushmana
70
30
0
G
2. Dorobo
60
40
0
G
3. Mbuti
60
30
10
G
4. Hadza
80
20
0
G
5. Gwi Bushmen
70
30
0
G
a
a
6. Gilyak
30
30
40
7. Yukaghira
10
60
30
8. Ainua
30
30
40
9. Andamanesea
50
20
30
a
F H F G
10. Semang
40
30
30
G
11. Arandaa
70
30
0
G
12. Murngina
60
30
10
G
13. Tiwia
60
30
10
G
70
30
0
G
15. Wikmunkan
60
30
10
G
16. Walbiri
70
30
0
G
14. Dieri a
17. Paraujano
40
10
50
18. Shiriana
30
40
30
19. Yahgana
30
20
50
20. Ona
20
60
20
a
F H F H
What Hunters Do for a Living, or, How to Make Out on Scarce Resources 37 Table 1.9 (continued) Percentage dependence on: People
Gathering
Hunting
Fishing
Primary subsistence source
22. Chamacoco
60
40
0
G
23. Aweikomaa
60
40
0
G
24. Botocudo
50
40
10
G
Total
16
a
3
5
In some of the cases marked, the subsistence percentages have been changed from those published in the Ethnographic Atlas. The categories have been redefined so that shell fishing is included under ‘Gathering’, and pursuit of sea-mammals under ‘Hunting’. In the Atlas, both are included under ‘Fishing’.
Figure 1.2 North American Hunter-gatherers
38 Before Agriculture Table 1.10 Subsistence base of hunter-gatherers (North America) People 1. Copper Eskimoa 2. Kaska 3. Ingalik 4. Ghugacha 5. Nunamiut 6. Kutchin 7. Chipewyan 8. Montagnais 9. Saulteaux 10. Eyaka 11. Tsimshiana 12. Quilcutea 13. Chinooka 14. Tlingita 15. Bellabella 16. Cowichana 17. Tututnia 18. Chimariko 19. Tubatulabal 20. Diegueno 21. Modoc 22. Achomawi 23. Wintu 24. Coast Yukia 25. Lake Yokuts 26. Cahuilla 27. Washo 28. Chilcotin 29. Flathead 30. Umatilla 31. Panamint 32. Kaibab 33. Yavapai 34. Seria Total (North America) Total (World) a
Percentage dependence on: Gathering Hunting Fishing 0 55 45 10 40 50 10 40 50 10 60 30 10 70 20 10 40 50 0 60 40 20 60 20 20 35 45 20 45 35 20 30 50 30 30 40 30 20 50 10 40 50 20 30 50 40 30 30 45 20 35 40 30 30 50 30 20 50 40 10 50 30 20 30 40 30 30 30 40 60 20 20 50 20 30 60 40 0 40 30 30 20 30 50 30 40 30 30 30 40 60 40 0 70 30 0 60 40 0 30 20 50
Primary subsistence source H F F H H F H H F H F F F F F G G G G G G H F G G G G F H F G G G F 13 8 13 29 11 18
In some of the cases marked, the subsistence percentages have been changed from those published in the Ethnographic Atlas. The categories have been redefined so that shell fishing is included under ‘Gathering’, and pursuit of sea-mammals under ‘Hunting’. In the Atlas, both are included under ‘Fishing’.
What Hunters Do for a Living, or, How to Make Out on Scarce Resources 39
Notes 1
These data are based on 15 months of field research from October 1963, to January 1965. I would like to thank the National Science Foundation (US) for its generous financial support. This paper has been substantially revised since being presented at the symposium on Man the Hunter. 2 The Nyae Nyae !Kung Bushmen studied by Lorna Marshall (1957, 1960, 1965) have been involved in a settlement scheme instituted by the South African government. Although closely related to the Nyae Nyae !Kung, the Dobe !Kung across the border in Botswana have not participated in the scheme. 3 Bushman group structure is discussed in more detail in Lee (1965, pp38–53; and Chapter 17c, this volume). 4 Listed in order of their importance, the principal species in the diet are: wart hog, kudu, duiker, steenbok, gemsbok, wildebeeste, springhare, porcupine, ant bear, hare, guinea fowl, francolin (two species), korhaan, tortoise and python. 5 This and the following topic are discussed in greater detail in Lee, ‘!Kung Bushman Subsistence: An Input-Output Analysis’ (in press). 6 Lenski, for example, in a recent review of the subject, states: ‘Unlike the members of hunting and gathering societies [the horticulturalists] are not compelled to spend most of their working hours in the search for food and other necessities of life, but are able to use more of their time in other ways’ (1966, p121). 7 During future fieldwork with the !Kung Bushmen, a professional paediatrician and nutritionist are planning to examine children and adults as part of a general study of hunter-gatherer health and nutrition sponsored by the US National Institutes of Health and the Wenner-Gren Foundation for Anthropological Research. 8 Two societies, the Gwi Bushmen and the Walbiri of Australia, were not coded by the Ethnographic Atlas. Their subsistence base was scored after consulting the original ethnographies (for the Gwi, Silberbauer, 1965; for the Walbiri, Meggitt, 1962, 1964). 9 In order to make more valid comparisons, I have excluded from the sample mounted hunters with guns such as the Plains Indians, and casual agriculturalists such as the Gê and Siriono. Twentyfour societies are drawn from Africa, Asia, Australia and South America. This number includes practically all of the cases that fit the definition. North America alone, with 137 hunting societies, contains over 80 per cent of the 165 hunting societies listed in the Ethnographic Atlas. The sampling procedure used here was to choose randomly one case from each of the 34 ‘clusters’ of North American hunter-gatherers. 10 For their useful suggestions, my thanks go to Donald Lathrap, Robin Ridington, George Silberbauer, Hitoshi Watanabe and James Woodburn. Special thanks are due to Wayne Suttles for his advice on Pacific coast subsistence. 11 When severity of winter is plotted against subsistence choices, a similar picture emerges. Hunting is primary in three of the five societies in very cold climates (annual temperature less than 32° F); fishing is primary in 10 of the 17 societies in cold climates (32°–50° F); and gathering is primary in 27 of the 36 societies in mild to hot climates (over 50° F).
References Balikci A. 1968. The Netsilik Eskimos: Adaptive processes. In Lee R and Devore I (eds). Man the Hunter. Aldine, Chicago Coon C S. 1948. Reader in General Anthropology. Henry Holt, New York
40 Before Agriculture Government of Botswana. 1966. Republic of Botswana fact sheet. Gabarone, Botswana Holmberg A R. 1950. Nomads of the Long Bow: The Siriono of Eastern Bolivia. Smithsonian Institute, Publications of the Institute of Social Anthropology, no 10, Washington DC Kroeber A L. 1939. Cultural and Natural Areas of Native North America. University of California Publications in American Archaeology and Ethnology, 38, Berkeley, CA Laughlin W S. 1968. Hunting: An Integrated Behavior System. In Lee R and Devore I (eds). Man the Hunter. Aldine, Chicago Lee R B. 1965. Subsistence ecology of !Kung Bushmen. Unpublished doctoral dissertation, University of California, Berkeley, CA Lee R B. 1967. The sociology of Bushman trance performances. In Prince R (ed). Trance and Possession States. McGill University Press, Montreal Lee R B. In press. !Kung Bushman subsistence: Input–output analysis. In Vayda A P (ed). Human Ecology: An Anthropological Reader. Natural History Press, New York Lenski G. 1966. Power and Privilege: A Theory of Social Stratification. McGraw-Hill, New York Marshall L K. 1957. The kin terminology system of the !Kung Bushmen. Africa 27, 1–25 Marshall L K. 1960. !Kung Bushmen bands. Africa 30, 325–355 Marshall L K. 1962. !Kung Bushmen religious beliefs. Africa 32, 221–252 Marshall L K. 1965. The !Kung Bushmen of the Kalahari Desert. In Gibb J (ed). Peoples of Africa. Holt, Rinehart, and Winston, New York Meggitt M J. 1962. Desert People: A Study of the Walbiri Aborigines of Central Australia. Angus and Robertson, Sydney Meggitt M J. 1964a. Indigenous forms of government among the Australian aborigines. Bijdragen tot de Taal-, Land-, en Volenkunde 120, 163–180 Meggitt M J. 1964b. Pre-industrial man in the tropical environment: Aboriginal food-gatherers of tropical Australia. Proceedings and Papers of the Ninth Technical Meeting I.U.C.N., Nairobi, Kenya, 1963. Morges (Vaud), International Union for the Conservation of Nature and Natural Resources, Switzerland Murdock G P. 1967. The ethnographic atlas: A summary. Ethnology 6(2) Needham R. 1954. Siriono and Penen: A test of some hypotheses. Southwestern Journal of Anthropology 10(3), 228–232 Radcliffe-Brown A R. 1930. Former numbers and distribution of the Australian aborigines. Official Yearbook of the Commonwealth of Australia 23, 671–696 Richards A I. 1939. Land, Labour and Diet in Northern Rhodesia. Oxford University Press, London Schapera I. 1930. The Khoisan Peoples of South Africa: Bushmen and Hottentots. Routledge and Kegan Paul, London Service E R. 1960. Sociocentric relationship terms and the Australian class system. In Dole G E and Carneiro R L (eds). Essays in the Science of Culture in Honor of Leslie A. White. Thomas Y. Crowell, New York Silberbauer G B. 1965. Report to the Government of Bechuanaland on the Bushman Survey. Government of Bechuanaland, Gaberone Taylor C M and Pye O F. 1966. Foundations of Nutrition. 6th edition. Macmillan, New York Watt B K and Merrill A L. 1963. Composition of Foods: Raw, Processed, Prepared. Agricultural Handbook no 8. US Department of Agriculture, Agricultural Research Service, Washington DC
2
Foragers and Others Richard B. Lee and Richard Daly
Recently an aboriginal guide was showing a group of tourists around Alberta’s renowned Head-Smashed-In Buffalo-Jump, a UNESCO World Heritage Site staffed by First Nations personnel. The guide graphically described how in ancient times the buffalo would be driven over the edge of a 15-metre precipice, to land in a gory heap at the base of the cliff. A diorama showed men and women clambering over the bodies to club and spear those still living. When one tourist expressed shock at the bloody nature of the enterprise, the guide responded simply but with conviction, ‘We were hunters!’ connecting her own generation with those of the past. She then amended her statement with equal conviction, adding, ‘Humans were hunters!’ thus expanding complicity in the act of carnage to the whole of humanity, not excluding her interlocutor. This incident summarizes neatly the historical conjuncture that brings The Cambridge Encyclopedia of Hunters and Gatherers to fruition. The world’s hunting and gathering peoples – the Arctic Inuit, Aboriginal Australians, Kalahari San and similar groups – represent the oldest and perhaps most successful human adaptation. Until 12,000 years ago virtually all humanity lived as hunters and gatherers. In recent centuries hunters have retreated precipitously in the face of the steamroller of modernity. However, fascination with hunting peoples and their ways of life remains strong, a fascination tinged with ambivalence. The reason for public and academic interest is not hard to find. Hunters and gatherers stand at the opposite pole from the dense urban life experienced by most of humanity. Yet these same hunters may hold the key to some of the central questions about the human condition – about social life, politics and gender, about diet and nutrition and living in nature: how people can live and have lived without the state; how to live without accumulated technology; the possibility of living in Nature without destroying it. This book offers no simple answers to these questions. Huntergatherers are a diverse group of peoples living in a wide range of conditions. One of the themes of the book is the exploration of that diversity. Yet within the range Lee R B and Daly R. Foragers and others. In Lee R B and Daly R (eds). Cambridge Encyclopedia of Hunters and Gatherers, 1999, Cambridge University Press, Cambridge. © Richard B Lee and Richard Daly, reproduced with permission.
42 Before Agriculture
of variation, certain common motifs can be identified. Hunter-gatherers are generally peoples who have lived until recently without the overarching discipline imposed by the state. They have lived in relatively small groups, without centralized authority, standing armies or bureaucratic systems. Yet the evidence indicates that they have lived together surprisingly well, solving their problems among themselves largely without recourse to authority figures and without a particular propensity for violence. It was not the situation that Thomas Hobbes, the great 17th-century philosopher, described in a famous phrase as ‘the war of all against all’. By all accounts life was not ‘nasty, brutish and short’. With relatively simple technology – wood, bone, stone, fibres – they were able to meet their material needs without a great expenditure of energy, leading the American anthropologist and social critic Marshall Sahlins to call them, in another famous phrase, ‘the original affluent society’. Most striking, the hunter-gatherers have demonstrated the remarkable ability to survive and thrive for long periods – in some cases thousands of years – without destroying their environment. The contemporary industrial world lives in highly structured societies at immensely higher densities and enjoys luxuries of technology that foragers could hardly imagine. Yet all these same societies are sharply divided into haves and havenots, and after only a few millennia of stewardship by agricultural and industrial civilizations, the environments of large parts of the planet lie in ruins. Therefore the hunter-gatherers may well be able to teach us something, not only about past ways of life but also about long-term human futures. If technological humanity is to survive it may have to learn the keys to longevity from fellow humans whose way of life has been around a lot longer than industrial commercial ‘civilization’. As Burnum Burnum, the late Australian Aboriginal writer and lecturer, put it, ‘Modern ecology can learn a great deal from a people who managed and maintained their world so well for 50,000 years.’ Hunter-gatherers in recent history have been surprisingly persistent. As recently as AD 1500 hunters occupied fully one-third of the globe, including all of Australia and most of North America, as well as large tracts of South America, Africa and North-east Asia. The 20th century has seen particularly dramatic changes in their life circumstances. The century began with dozens of hunting and gathering peoples still pursuing ancient (though not isolated) lifeways in small communities, as foragers with systems of local meaning centred on kin, plants, animals and the spirit world. As the century proceeded, a wave of self-appointed civilizers washed over the world’s foragers, bringing schools, clinics and administrative structures, and, not incidentally, taking their land and resources. The year 2000 will have seen the vast majority of former foragers settled and encapsulated in the administrative structures of one state or another. And given their tragic history of forced acculturation one would imagine that the millennium will bring to a close a long chapter in human history. But will it? We believe not. Hunter-gatherers live on, not only in the pages of anthropological and historical texts, but also, in 40 countries, in the presence of hundreds of thousands of descendants a generation or two removed from a foraging way of life, and these
Foragers and Others 43
Map 2.1 Case studies in the Cambridge Encyclopedia of Hunters and Gatherers
peoples and their supporters are creating a strong international voice for indigenous peoples and their human rights. Among the public-at-large, images of hunters and gatherers have swung between two poles. For centuries they were regarded as ‘savages’, variously ignorant or cunning, beyond the pale of ‘civilization’. This distorted image was usually associated with settler societies who coveted the foragers’ land; the negative stereotypes justified dispossession. In recent years a different view has dominated, with hunter-less gatherers as the repository of virtues seemingly lacking in the materialism and marked inequalities of contemporary urban life. How to balance these two views? For many current observers the contrast between savage inequities of modernity and the relative egalitarianism of the so-called ‘primitives’ gives the latter more weight on the scales of natural justice. Jack Weatherford’s eloquently argued book, Savages and Civilization: Who Will Survive? (1994), draws on a long intellectual tradition dating from Rousseau which, contemplating the horrors of the modern world, raises the question of who are the truly civilized: the ‘savage’ with his occasional blood-feud, or the ‘civilized’ who gave the world the Inquisition, the Atlantic slave trade, the Catling gun, napalm, Hiroshima and the Holocaust? (For an opposing view see Robert Edgerton’s Sick Societies [1992].) The present work thus grows out of the intersection between three discourses: anthropological knowledge, public fascination and indigenous peoples’
44 Before Agriculture
own worldviews. The Encyclopedia speaks to scholars, to general readers, and particularly to the members of the cultures themselves. The book offers an up-to-date and encyclopedic inventory of hunters and gatherers, written in accessible language by recognized authorities, some of whom are representatives of the cultures they write about.
Foraging Defined Foraging refers to subsistence based on hunting of wild animals, gathering of wild plant foods, and fishing, with no domestication of plants, and no domesticated animals except the dog. In contemporary theory this minimal definition is only the starting point in defining hunter-gatherers. Recent research has brought a more nuanced understanding of the issue of who the hunters are and why they have persisted. While it is true that hunting and gathering represent the original condition of humankind and 90 per cent of human history, the contemporary people called hunter-gatherers arrived at their present condition by a variety of pathways. At one end of a continuum are the areas of the world where modern huntergatherers have persisted in a more or less direct tradition of descent from ancient hunter-gatherer populations. This would characterize the aboriginal peoples of Australia, north-western North America, the southern cone of South America and pockets in other world areas. The Australian Pintupi, Arrernte and Warlpiri, the North American Eskimo, Shoshone and Cree, the South American Yamana, and the African Ju/’hoansi are examples of this first grouping, represented in case studies in this volume. In pre-colonial Australia and parts of North America we come closest to Marshall Sahlins’ rubric of ‘hunters in a world of hunters’ (Lee and DeVore 1968). But even here the histories offer examples of complex interrelations between foragers and others. Along the middle of the continuum are hunting and gathering peoples who have lived in degrees of contact and integration with non-hunting societies, and these include a number whose own histories include life as farmers and/or herders in the past. South and South-east Asian hunter-gatherers are linked to settled villagers and their markets, trading forest products: furs, honey, medicinal plants and rattan, for rice, metals and consumer goods. Some of these arrangements have persisted for millennia. Similar arrangements are seen in central Africa where Pygmies have lived for centuries in patron–client relations with settled villagers while still maintaining a period of the year when they lived more autonomously in the forest. And in East Africa the foraging Okiek traditionally supplied honey and other forest products to neighbouring Maasai and Kipsigis. South American hunter-gatherers present an even more interesting case, since archaeological evidence indicates that in Amazonia farming replaced foraging several millennia ago. In the view of Anna Roosevelt, much of the foraging observed in tropical South America represents a secondary readaptation. After the European conquests of the 16th–18th centuries many groups found that mobile hunting and gathering
Foragers and Others 45
made them less vulnerable to colonial exploitation. Other groups had been operating this way far longer, back into the pre-colonial period. And almost all tropical South American foragers today plant gardens as one part of their annual trek. There are parallels here with Siberia, where most of the ‘small peoples’ classified as hunter-gatherers also herded reindeer, a practice which greatly expanded during the Soviet period. Finally, at the other end of the continuum are peoples who once were hunters but who changed their subsistence in the more distant past. And that includes the rest of us: the 5-billion-strong remainder of humanity.
Social Life In defining foragers we must recognize that contemporary foragers practise a mixed subsistence: gardening in tropical South America, reindeer herding in northern Asia, trading in South/South-east Asia and parts of Africa. Given this diversity, what constitutes the category ‘hunter-gatherer’? The answer is that subsistence is one part of a multifaceted definition of hunter-gatherers: social organization forms a second major area of convergence, and cosmology and worldview a third. All three sets of criteria have to be taken into account in understanding hunting and gathering peoples today. The basic unit of social organization of most (but not all) hunting and gathering peoples is the band, a small-scale nomadic group of 15–50 people related by kinship. Band societies are found throughout the Old and New Worlds and share a number of features in common. Most observers would agree that the social and economic life of small-scale hunter-gatherers shares the following features. First they are relatively egalitarian. Leadership is less formal and more subject to constraints of popular opinion than in village societies governed by headmen and chiefs. Leadership in band societies tends to be by example, not by fiat. The leader can persuade but not command. This important aspect of their way of life allowed for a degree of freedom unheard of in more hierarchical societies but it has put them at a distinct disadvantage in their encounters with centrally organized colonial authorities. Mobility is another characteristic of band societies. People tend to move their settlements frequently, several times a year or more, in search of food, and this mobility is an important element of their politics. People in band societies tend to ‘vote with their feet’, moving away rather than submitting to the will of an unpopular leader. Mobility is also a means of resolving conflicts that would be more difficult for settled peoples. A third characteristic is the remarkable fact that all band-organized peoples exhibit a pattern of concentration and dispersion. Rather than living in uniformly sized groupings throughout the year, band societies tend to spend part of the year dispersed into small foraging units and another part of the year aggregated into much larger units. The Innu (Naskapi) discussed by Mailhot would spend the winter dispersed in small foraging groups of 10–30, while in the summer they would aggregate in groups of up to 200–300 at lake or river fishing sites. It seems
46 Before Agriculture
clear that the concentration/dispersion patterns of hunter-gatherers represent a dialectical interplay of social and ecological factors. A fourth characteristic common to almost all band societies (and hundreds of village-based societies as well) is a land tenure system based on a common property regime (CPR). These regimes were, until recently, far more common worldwide than regimes based on private property. In traditional CPRs, while movable property is held by individuals, land is held by a kinship-based collective. Rules of reciprocal access make it possible for each individual to draw on the resources of several territories. Rarer is the situation where the whole society has unrestricted access to all the land controlled by the group.
Ethos and Worldview Another broad area of commonalities lies in the domains of the quality of interpersonal relations and forms of consciousness. Sharing is the central rule of social interaction among hunters and gatherers. There are strong injunctions on the importance of reciprocity. Generalized reciprocity, the giving of something without an immediate expectation of return, is the dominant form within face-to-face groups. Its presence in hunting and gathering societies is almost universal (Sahlins 1965). This, combined with an absence of private ownership of land, has led many observers from Lewis Henry Morgan forward to attribute to hunter-gatherers a way of life based on ‘primitive communism’ (Morgan, 1881; Testart, 1985; Lee, 1988). Found among many but not all hunter-gatherers is the notion of the giving environment, the idea that the land around them is their spiritual home and the source of all good things (Turnbull, 1965; Bird-David, 1990). This view is the direct antithesis of the Western Judeo-Christian perspective on the natural environment as a ‘wilderness’, a hostile space to be subdued and brought to heel by the force of will. This latter view is seen by many ecological humanists as the source of both the environmental crisis and the spiritual malaise afflicting contemporary humanity (Shiva, 1988, 1997; Suzuki, 1989, 1992, 1997). Hunter-gatherers are peoples who live with nature. When we examine the cosmology of hunting and gathering peoples, one striking commonality is the view of nature as animated with moral and mystical force, in Robert Bellah’s phrase ‘the hovering closeness of the world of myth to the actual world’ (1965, p19). As discussed by Mathias Guenther (Cambridge Encyclopedia of Hunters and Gatherers), the world of hunter-gatherers is a multilayered world, composed of two or more planes: an above/ beyond zone and an underworld in addition to the present world inhabited by humans. There are invariably two temporal orders of existence, with an Early mythical or ‘dreamtime’ preceding the present. In the former, nature and culture are not yet fully separated. Out of this Ur-existence, a veritable cauldron of cultural possibilities, crystallizes the distinction between humans and animals, the origin of fire, cooking, incest taboos, even mortality itself and virtually everything of cultural significance.
Foragers and Others 47
The world of the Past and the above-and-below world of myth are in intimate contact with the normal plane of existence. The Australian Aborigines present the most fully realized instance of this process of world-enchantment. The famous ‘songlines’ of the Dreamtime criss-cross the landscape and saturate it with significance. Every rock and feature has symbolic meaning and these are bound up in the reproduction of life itself. It is these totemic elements that are the sources of the spirit children that enter women’s wombs and trigger conception. Parallels are found in many other hunter-gatherer groups. The Trickster is a central figure in the myth worlds of many hunting and gathering societies. A divine figure, but deeply flawed and very human, the Trickster is found in myth cycles from the Americas, Africa, Australia and Siberia. Similar figures grace the pantheons of most village farming and herding peoples as well. The Trickster symbolizes the frailty and human qualities of the gods and their closeness to humans. These stand in pointed contrast to the omnipotent, all-knowing but distant deities that are central to the pantheons of state religions and their powerful ecclesiastical hierarchies (Radin, 1956; Diamond, 1974; Wallace, 1966). Shamanism is another major practice common to the great majority of hunting and gathering peoples. The word originates in eastern Siberia, from the Evenki/Tungus word saman meaning ‘one who is excited or raised’. Throughout the hunter-gatherer world community-based ritual specialists (usually part-time) heal the sick and provide spiritual protection. They mediate between the social/human world and the dangerous and unpredictable world of the supernatural. Shamanism is performative, mixing theatre and instrumental acts in order to approach the plane of the sacred. Performances vary widely. Among the Ju/’hoansi the ‘owners of medicine’, after a long and difficult training period, enter an altered state of consciousness called Ikia, to heal the sick through a laying on of hands (Marshall, 1968; Katz, 1982). The northern Ojibwa practised the famous shaking tent ceremony or midewiwin, while other shamans used dreams, psychoactive drugs, or intense mental concentration to reach the sacred plane. The brilliant use of language and metaphor in the form of powerful and moving verbal images is a central part of the shaman’s craft (Rothenberg, 1968). So powerful are these techniques that they have been widely and successfully adapted to the visualization therapies in the treatment of cancer and other conditions in Western medicine. Ethos and social organization are both essential components of hunter-gatherer lifeways. Laura Rival (Cambridge Encyclopedia of Hunters and Gatherers) makes the point that two South American tropical forest peoples may well have a rather similar subsistence mix, but different orientations: analysing them on the basis of their social organization and mobility patterns, as well as mythology, rituals and inter-personal relations, the researcher finds that one has a clearly agricultural orientation, the other a foraging one. What is remarkable is that, despite marked differences in historical circumstances, foragers seem to arrive at similar organizational and ideational solutions to the problems of living in groups, a convergence that Tim Ingold, the foremost authority on hunter-gatherer social life, has labelled ‘a distinct mode of sociality’ (Cambridge Encyclopedia of Hunters and Gatherers).
48 Before Agriculture
Divergences Despite these commonalities, there are a number of significant divergences among hunters and gatherers. And consideration of these must temper any attempt to present an idealized picture of foraging peoples. First the foragers as a group are not particularly peaceful. Interpersonal violence is documented for most and warfare is recorded for a number of hunting and gathering peoples. Although peaceful peoples such as the Malaysian Semang are celebrated in the literature (Dentan, 1968), for many others (Inupiat, Warlpiri, Blackfoot, Aché, Agta) raids and bloodfeuds are common occurrences, particularly before the pacification campaigns of the colonial authorities (see for example Ember, 1992; Moss, 1992; Bamforth, 1994). But mention of the colonial context raises another important issue. Did high levels of ‘primitive’ warfare represent a primordial condition, or were these exacerbated by the pressure of colonial conquest? The question remains an ongoing subject of debate (Divale and Harris, 1976; Ferguson, 1984). Gender is another dimension in which hunting and gathering societies show considerable variation. As Karen Endicott argues (Cambridge Encyclopedia of Hunters and Gatherers), the women of hunter-gatherer societies do have higher status than women in most of the world’s societies, including industrial and post-industrial modernity. This status is expressed in greater freedom of movement and involvement in decision making and a lower incidence of domestic violence against them when compared to women in farming, herding, and agrarian societies (Leacock, 1978, 1982; Lee, 1982). Nevertheless variation exists: wife-beating and rape are recorded for societies as disparate as those of Alaska (Eskimo) and northern Australian Aborigines (Friedl, 1975; Abler, 1992) and are not unknown elsewhere; nowhere can it be said that women and men live in a state of perfect equality. A third area of divergence is found in the important distinction between simple vs. complex hunter-gatherers. Price and Brown (1985) argued that not all hunting and gathering peoples – prehistoric and contemporary – lived in small mobile bands. Some, like the Indians of the North-west Coast (Donald, 1984, 1997; Mitchell and Donald, 1985) and the Calusa of Florida (Marquardt, 1988), as well as many prehistoric peoples, lived in large semi-sedentary settlements with chiefs, commoners and slaves, yet were entirely dependent on wild foods. In social organization and ethos these societies showed significant divergence from the patterns outlined above, yet in other ways a basic foraging pattern is discernible. For example the North-west Coast peoples still maintained a concentration–dispersion pattern, breaking down their large permanent plank houses in the summer and incorporating them into temporary structures at seasonal fishing sites (Boas, 1966, Daly, Cambridge Encyclopedia of Hunters and Gatherers). A related concept is James Woodburn’s notion of immediate-return vs. delayed-return societies (1982). Although both were subsumed under the heading of ‘band society’, in immediate-return societies food was consumed on the spot or soon after, while in delayed-return societies food and other resources might he stored for months or years, with marked effects on social organization and cultural notions of property (Woodburn, 1982).
Foragers and Others 49
In a superb synthesis Robert L. Kelly has documented these divergences on many fronts in his book The Foraging Spectrum: Diversity in Hunter-gatherer Lifeways (1995). Recently Susan Kent (1996b) has attempted a similar exercise for the diversity and variation in the hunting and gathering societies of a single continent, Africa. The point is that hunter-gatherers encompass a wide range of variability and analysts seeking to make sense of them ignore this diversity at their peril!
The Importance of History Any adequate representation of hunting and gathering peoples in the 21st century has to address the complex historical circumstances in which they are found. Foragers have persisted to the present for a variety of reasons but all have developed historical links with non-foraging peoples, some extending over centuries or millennia. And all have experienced the transformative effects of colonial conquest and incorporation into states. Situating the foraging peoples in history is thus essential to any deeper understanding of them, a point that was often lost on earlier observers who preferred to treat foragers as unmediated visions of the past. One recent school of thought has questioned the validity of the very concept ‘hunter-gatherer’. Starting from the fact that some hunter-gatherers have been dominated by more powerful outsiders for centuries, proponents of this school see contemporary foraging peoples more as victims of colonialism or subalterns at the bottom of a class structure than as exemplars of the hunting and gathering way of life (Schrire, 1984; Wilmsen, 1989; Wilmsen and Denbow, 1990). This ‘revisionist’ view sees the foragers’ simple technology, nomadism and sharing of food as part of a culture of poverty generated by the larger political economy and not as institutions generated by the demands of foraging life. (There is a large and growing literature on both sides of this issue known in recent years as ‘the Kalahari Debate’. Readers interested in pursuing this issue should begin with Barnard [1992a]). While recognizing that many foraging peoples have suffered at the hands of more powerful neighbours and colonizers, The Cambridge Encyclopedia of Hunters and Gatherers challenges the view that recent hunter-gatherers are simply victims of colonial forces. Autonomy and dependency are a continuum, not an either/or proposition, and as John Bodley documents (Cambridge Encyclopedia of Hunters and Gatherers), despite the damage brought by colonialism, foragers persist and show a surprising resilience. Foragers may persist for a variety of reasons. As illustrated by the example of the Kalahari San of southern Africa, where much of the debate has focused, some San did become early subordinates of Bantu-speaking overlords, but many others maintained viable and independent hunter-gatherer lifeways into the 19th and 20th centuries (Solway and Lee, 1990; Guenther, 1993, 1998; Kent, 1996a; Robertshaw, Cambridge Encyclopedia of Hunters and Gatherers). Archaeological evidence reviewed by Sadr (1997) strongly supports the position that a number of San peoples maintained a classic Later Stone Age tool kit and
50 Before Agriculture
a hunting and gathering lifeway into the late 19th century. When Ju/’hoan San people themselves are asked to reflect on their own history they insist that, prior to the arrival of the Europeans in the latter part of the 19th century, they lived as hunters on their own, without cattle, while maintaining links of trade to the wider world (Smith and Lee, 1997). The general point to be made is that outside links do not automatically make hunter-gatherers subordinate to the will of their trading partners. Exchange is a universal aspect of human culture; all peoples at all times have traded. In the case of recent foragers, trading relations may in fact have allowed foraging peoples to maintain a degree of autonomy and continue to practise a way of life that they valued (Peterson, 1991, 1993). Another case in point is exemplified by the Toba of the western Argentinian Gran Chaco. Gastón Gordillo (Cambridge Encyclopedia of Hunters and Gatherers) notes how the foraging Toba have maintained their base in the Pilcomayo marshes as a partial haven against direct exploitation. As the Toba say, ‘At least we have the bush,’ seeing their Pilcomayo territory as a refuge to come home to after their annual trips to the plantations to earn necessary cash. The view of the ‘bush’ as a refuge seems to be a common theme among many hunter-gatherers. What it brings home is that foragers believe in their way of life: foraging for them is a positive choice, not just a result of exclusion by the wider society. To the contrary, the authors of this book, led by Lakota anthropologist Beatrice Medicine in the Foreword, question whether victimhood at the hands of more powerful peoples is the only or even the main issue of interest about hunters and gatherers. The authors start from the position that the first priority is to represent the life-worlds of contemporary hunter-gatherers faithfully. This invariably includes documenting the peoples’ sense of themselves as having a collective history as hunter-gatherers. Whether this foraging represents a primary or secondary adaptation, it often continues because that way of life has meaning for its practitioners. It seems unwise, if not patronizing, to assume that all foragers are primarily so because they were forced into it by poverty or oppression. It is more illuminating to understand hunter-gatherer history and culture as the product of a complex triple dynamic: part of their culture needs to be understood in terms of the dynamic of the foraging way of life itself, part from the dynamic of their interaction with (often more powerful) non-foraging neighbours, and part from the dynamic of their interaction with the dominant state administrative structures (cf. Leacock and Lee, 1982).
A Brief History of Hunter-gatherer Studies If a single long-term trend can be discerned in hunter-gatherer studies it is this: studies began with a vast gulf between observers and observed. 18th- and 19thcentury treatises on the subject objectified the hunters and treated them as external
Foragers and Others 51
objects of scrutiny. With the development of field anthropology, observers began to know the foragers as people and the boundaries between observers and observed began to break down. Finally in the most recent period, the production of knowledge has become a two-way process; the role of observer has begun to merge with the role of advocate and the field of hunter-gatherer studies has come to be increasingly influenced by agendas set by the hunter-gatherers themselves (Lee, 1992). The more formal history of hunter-gatherer studies parallels the history of the discipline of anthropology. The peoples who much later were to become known as ‘hunters and gatherers’ have been an important element in central debates of European social and political thought from the 16th century forward (Barnes, 1937; Barnes and Becker, 1938; Meek, 1976). As described in the chapter by Alan Barnard (Cambridge Encyclopedia of Hunters and Gatherers, Part II), philosophers from Hobbes, Locke and Rousseau onward have drawn upon contemporary accounts of ‘savages’ as a starting point for speculations about life in the state of nature and what constitutes the good society. These constructions became more detailed as more information accumulated from travellers’ accounts, resulting in elaborate schemes for human social evolution in the works of the 18th-century Scottish Enlightenment – Smith, Millar and Ferguson – as well as on the continent – Diderot, Vico and Voltaire (Barnes, 1937; Harris, 1968). Well before the 1859 publication of Darwin’s On the Origin of Species the question of the antiquity of humanity became a central preoccupation of scholars, initiated in part by John Frere’s famous 1800 essay which made the then heretical suggestion that teardrop-shaped, worked-stone objects found buried in river gravels at Hoxne, Suffolk, UK in association with extinct mammals may indeed not have been Zeus’ thunderbolts, but instead implements made by humans that could be traced ‘to a very distant period, far more remote in time than the modern world’ (quoted in Boule and Vallois 1957, p11). With the rise of European imperialism and the conquest of new lands came the beginnings of anthropology as a formal discipline. In the academic division of labour, while sociologists adopted as their mandate understanding urban society of the Western metropole, anthropologists took on the rest of the world: classifying diverse humanity and theorizing about its origins and present condition. The 19th-century classical evolutionists erected elaborate schemes correlating social forms, kinship and marriage with mental development and levels of technology. The world’s hunters were usually relegated to the bottom levels. In Lewis Henry Morgan’s tripartite scheme, of ‘Savagery, Barbarism, and Civilization’, hunters were either Lower or Middle Savages, depending on the absence or presence of the bow and arrow (Morgan, 1877). William Sollas was one of the first to define hunting and gathering as a specific lifeway, and in Ancient Hunters and their Modern Representatives (1911) he linked ethnographies of recent hunters with their putative archaeological analogues. Modern Eskimo resembled Magdalenians, African Bushmen stood in for Aurignacians, and so on.
52 Before Agriculture
Essential to the development of modern anthropology was the decisive repudiation of the classical evolutionary schemes and their implicit (and often explicit) racism. Franz Boas’ watershed study Race, Language and Culture (1948) demonstrated that the three core factors varied independently. A ‘simple’ technology could be associated with a complex cosmology, members of one ‘race’ could show a wide range of cultural achievements, and all languages possessed the capacity for conveying abstract thought. It was only on the twin foundations of Boasian cultural relativism and the emphasis on fieldwork that modern social and cultural anthropology could develop. It is striking that most of the founders of the discipline both in North America and in Europe carried out landmark studies of hunters and gatherers. Boas himself went to the Canadian Arctic in 1886 as a physical geographer (his doctoral dissertation was on the colour of sea water), but his ethnographic study of the Central Eskimo (1888) became one of the seminal works in American anthropology. He went on to carry out decades of research with the KwaKwaKa’wakw (Kwakiutl) on the North-west Coast of British Columbia, a classic example of a complex huntergatherer group (Boas, 1966). Boas’ close associates A. L. Kroeber and Robert Lowie also established their reputations through major research on hunting and gathering peoples, Californian and Crow Indians respectively (Kroeber, 1925; Lowie, 1935). Founders of British anthropology shared a similar early focus, beginning with A. R. Radcliffe-Brown’s study of the Andaman Islanders in 1906–1908 (1922). The great Bronislaw Malinowski, before going to the Trobriand Islands, wrote his doctoral dissertation on the family among the Australian Aborigines (1913). In France, while neither did hunter-gatherer fieldwork, both Emile Durkheim and Marcel Mauss carried out intensive library research on foraging peoples, with the former writing about Australian aboriginal religion in Elementary Forms of the Religious Life (Durkheim, 1912) and the latter writing his seminal essay on the seasonal life of the Eskimo (Mauss, 1906). Two decades later Claude Lévi-Strauss began his distinguished career with a 1930s field study of the hunting and gathering Nambicuara in the Brazilian Mato Grosso, before returning to Paris to write his influential works on the origins of kinship and mythology (1949, 1962a, 1962b, 1987). Mention should also be made of the 1898 British expedition, led by A. C. Haddon, to the Torres Strait Islanders with their affinities to the Australian Aborigines, of the American Museum of Natural History’s Jesup North Pacific Expedition to Siberia in 1897 (see Grant, 1995), and of the brilliant series of expeditions by Danish anthropologists to Greenland and the Canadian Arctic led by Mattiessen and Rasmussen. Important research traditions can also be discerned in Australia and Russia. Modern studies of hunting and gathering peoples can be traced arguably to two landmark studies of the 1930s. First is the 1936 essay by Julian Steward who, in a festschrift for his mentor, A. L. Kroeber, wrote on ‘The social and economic basis of primitive bands’ (1936). After four decades of scholarly emphasis on careful
Foragers and Others 53
description without theory building, Steward sought to revive an interest in placing hunter-gatherer studies in a broader theoretical framework. Steward argued that resource exploitation determined to a significant extent the shape and dynamics of band organization and this ecological approach became one of the two foundations of hunter-gatherer studies for the next 30 years. The second base was the classic essay by Radcliffe-Brown on Australian Aboriginal social organization (1930–1931). The peripatetic R-B had begun his career in South Africa and from there moved to Sydney, São Paulo and Chicago before taking up the chair in social anthropology at Oxford. During his Australian tenure he wrote a series of influential overviews of Aboriginal social organization. But unlike Steward, for whom ecological factors were paramount, R-B saw structural factors of kinship as primary. Australian Aboriginal societies were usually divided into moieties, and these dual divisions were often subdivided into four sections or eight subsections. These divisions had profound effects on marriage patterns, producing an intricate and elegant algebra of prescriptive alliances between intermarrying groups. Radcliffe-Brown was far less interested than Steward in what the Aborigines did for a living. While the clan and section membership ruled the kinship universe and nominally held the land, it was the more informal horde, a bandlike entity, whose members lived together on a daily basis and shouldered the tasks of subsistence. In the 1940s Radcliffe-Brown’s kinship models were taken up by Lévi-Strauss, who placed Australian Aboriginal moieties at the centre of his monumental work Les Structures élémentaires de la parenté (1949). It is worthy of note that theories of band organization have continued to be dominated by these two alternative paradigms: an ecological or adaptationist approach which relies on material factors to account for forager social life, and a structural approach which sees kinship, marriage and other such social factors as the primary determinants. The two approaches are by no means incompatible, and although the two tendencies are still discernible in hunter-gatherer studies, many analysts have posited a dialectic of social and ecological forces in the dynamics of forager life (see Sahlins, 1972; Lee, 1979; Leacock, 1982; Peterson, 1991, 1993 and others).
The Man the Hunter Conference In 1965, Sol Tax announced the convening of a conference on ‘Man the Hunter’ at the University of Chicago; the conference, organized by Irven DeVore and Richard Lee, took place 6–8 April 1966 and proved to be the starting point of a new era of systematic research on hunting and gathering peoples. One commentator called the Man the Hunter conference ‘the century’s watershed for knowledge about hunter-gatherers’ (Kelly, 1995, p14). Present at the conference were representatives of many of the major constituencies in the field of hunter-gatherer studies (though no hunter-gatherers themselves), including proponents of the ecological
54 Before Agriculture
and structural schools. There were critics of the late Radcliffe-Brown’s theories as well as supporters; there were archaeologists, demographers and physical anthropologists, reflecting the revival of interest in evolutionary approaches then current in American anthropology. Among the key findings of the Man the Hunter conference were the papers focusing on the relative ease of foraging subsistence, epitomized in Marshall Sahlins’ famous ‘Notes on the original affluent society’ (1968). Gender and the importance of women’s work was a second key theme of the conference. The name ‘Man the Hunter’ was a misnomer since among tropical foragers plant foods, produced largely by women, were the dominant source of subsistence.
After Man the Hunter A burst of research activity followed the convening of Man the Hunter and the publication of the book of the same title (Lee and DeVore, 1968). Scholars present at the conference brought out their own monographs and edited volumes (Damas, 1969; Balikci, 1970; Bicchieri, 1972; Sahlins, 1972; Watanabe, 1973; Marshall, 1976; Binford, 1978; Lee, 1979; Laughlin, 1980; Helm, 1981; Suttles, 1990). The field of hunter-gatherer studies has always been a fractious one and consensus is rarely achieved. After 1968 new work critiqued key theses from Man the Hunter. The irony of the mistitle was not lost on feminist anthropologists who produced a series of articles and books with the counter theme of ‘Woman the Gatherer’ (Slocum, 1975; Hiatt, 1978; Dahlberg, 1981). The feminist critics were certainly taking issue with the concept of Man the Hunter, and not necessarily with the book’s content since the latter had gone a long way toward re-establishing the importance of women’s work and women’s roles in hunter-gatherer society. This last point was taken up in detail by Adrienne Zihlman and Nancy Tanner in an important article which drew upon the evidence assembled in Man the Hunter to place ‘woman the gatherer’ at the centre of human evolution (Tanner and Zihlman, 1976). At the same time a counter-counter-discourse developed among scholars who questioned whether women’s subsistence contribution had been overestimated, and several cross-cultural studies were produced to argue this view, summarized in Kelly (1995, pp261–292). A related development was the discovery that women in hunter-gatherer societies do hunt, the most famous case being that of the Agta of the Philippines. Original ‘affluence’ came in for much discussion and critique, with a long series of debates over the definition of affluence and whether it applied to all hunters and gatherers at all times or even to all the !Kung (Hawkes and O’Connell, 1981, 1985; Koyama and Thomas, 1981; Altman, 1984, 1987; Hill et al, 1985; BirdDavid, 1992; Kelly, 1995, pp15–23). Seeking to rehabilitate the concept, Binford (1978) and Cohen (1977) addressed some of these issues, while James Woodburn’s
Foragers and Others 55
introduction of the distinction between immediate- and delayed-return societies (1982) helped to account for some of the variability in the level of work effort among hunter-gatherers. A major development in hunter-gatherer research was stimulated by this debate. Struck by the often imprecise data on which arguments about affluence (or its absence) had been based, a group of younger scholars resolved to do better. They adopted from biology models about optimal foraging (Charnov, 1976) and attempted to apply these rigorously to the actual foraging behaviours observed among the shrinking number of foraging peoples where it was still possible to observe actual hunting and gathering subsistence. Important work in this area was carried out by a close-knit group of scholars, often collaborating, and variously influenced by sociobiology and other neo-Darwinian approaches: Bailey (1991), Blurton Jones (1983), Hawkes (Hawkes, Hill, and O’Connell, 1982; Hawkes, O’Connell and Blurton Jones, 1989), Hewlett (1991), Hill and Hurtado (1995), Hurtado (Hurtado and Hill, 1990), Kaplan (Kaplan and Hill, 1985), O’Connell (O’Connell and Hawkes, 1981), Eric Smith (1983, 1991), and Winterhalder (1983, 1986). Reviews and summaries of Optimal Foraging Theory are found in Winterhalder and Smith (1981), Smith and Winterhalder (1992), Bettinger (1991) and Kelly (1995). For critiques see Ingold (1992) and Martin (1983). More classically oriented research on hunter-gatherers attempted to bring together much of the rich historical and ethnographic material that had accumulated since the 1940s. The Handbook of North American Indians, under the general editorship of William Sturtevant, chronicled the 500 Nations of the continent in a series of landmark regional volumes. Six of these deal largely if not exclusively with hunting and gathering peoples: Northwest Coast, edited by Wayne Suttles (1990); Subarctic, edited by June Helm (1981); The Great Basin, edited by Warren D’Azevedo (1986); California, edited by Robert Heizer (1978); Arctic, edited by David Damas (1984); and Northeast, edited by Bruce Trigger (1978) (see also Trigger and Washburn 1996). On other continents Barnard (1992b) and Edwards (1987) produced overview volumes on the Khoisan peoples and Aboriginal Australians respectively.
A New Generation of Research While the optimal foraging researchers based their work on models from biology and the natural sciences, a larger cohort of hunter-gatherer specialists were moving in quite different directions. Drawing on symbolic, interpretive and historical frameworks this group of scholars grounded their studies in the lived experience of foragers and post-foragers seen as encapsulated minorities within nation states, who still strongly adhered to traditional cosmologies and lifeways. Examples include Diane Bell’s Daughters of the Dreaming (1983), Hugh Brody’s Maps and Dreams (1981), Julie Cruikshank’s Life Lived like a Story (1990), Fred Myers’ Pintupi
56 Before Agriculture
Country, Pintupi Self (1986), Elizabeth Povinelli’s Labor’s Lot (1993), and Marjorie Shostak’s Nisa: The Life and Words of a !Kung Woman (1981).
The Conferences on Hunting and Gathering Societies (CHAGS) One way of tracking broader trends in hunter-gatherer research is to follow the CHAGS series of conferences through the 1970s, 1980s and 1990s. In 1978 Maurice Godelier convened a Conference on Hunting and Gathering Societies in Paris to observe the tenth anniversary of the publication of Man the Hunter. The conference brought together scholars from a dozen countries including the Dean of the Faculty of the University of Yakutia, himself an indigenous Siberian (Leacock and Lee 1982). The conference proved such a success that Laval University offered to host a follow-up conference in Quebec in 1980. Organized by Bernard Saladin d’Anglure and Bernard Arcand, the conference continued the tradition begun in Paris, wherein anyone who wanted to participate could do so as long as they were self-financing. Inuit broadcasters were among the several members of huntergatherer societies present. By now it was becoming clear that a need existed for continuing the series, and Professor I. Eibl-Eibesfeldt of the Max Planck Institute in the Federal Republic of Germany took on the task of organizing CHAGS III. The Munich CHAGS in 1983 was a smaller, by-invitation affair, and the book that resulted reflected one particular school (revisionist) of hunter-gatherer studies (Schrire, 1984). CHAGS IV, held at the London School of Economics in September 1986, returned to the more open policy with a wide range of constituencies represented. The active British organizing committee led by James Woodburn and Tim Ingold along with Alan Barnard, Barbara Bender, Brian Morris and David Riches produced two strong thematically organized volumes of papers from the conference (Ingold et al, 1988a, 1988b). CHAGS then moved to Australia. Hosted by Les Hiatt of Sydney University, CHAGS V convened in Darwin, capital of the Northern Territory, in August 1988. CHAGS V proved to be a marvellous world showcase for the active community of anthropologists, Aboriginal people, and activists working on indigenous issues in Australia. Fairbanks, Alaska was the location of CHAGS VI (1990), the first of the CHAGS series to be held in the US since the original 1966 Chicago conference. Convened by the late Linda Ellanna, the Fairbanks conference was memorable for being the first CHAGS at which a large delegation of Russian anthropologists was present, flying in from Provedinya just across the Bering Straits in Chukotka. Indigenous Alaskans played a prominent role in Fairbanks as well (Burch and Ellanna, 1994). CHAGS VII, in Moscow in August 1993, convened by Valeriy Tischkov and organized by Victor Shnirelman at the Russian Academy of Sciences,
Foragers and Others 57
is discussed below. The international hunter-gatherer community convened for CHAGS VIII, at the National Museum of Ethnology in Osaka, Japan, in October, 1998, with future meetings projected in the new millennium for Scotland, India and southern Africa. This ongoing series of CHAGS gatherings held on four continents has provided an excellent monitor on the state of hunter-gatherer research in recent decades, and a unique perspective on its increasingly international and cosmopolitan outlook. While the theoretical debates of the Man the Hunter conference of 1966 had revolved around issues of the evolution of human behaviour, the recent series has moved relatively far from evolutionary and ecological preoccupations. In their stead hunter-gatherer specialists have developed several major foci of inquiry. At the Moscow CHAGS in August 1993 and at Osaka, 1998, a large and active scholarly contingent focused on foragers in relation to the state; papers on land rights, court battles, bureaucratic domination and media representations documented the struggles of foragers and former foragers for viability and cultural identity in the era of Late Capitalism. Many of the research problematics grew out of close consultation with members of the societies in question. Increasingly it is they who are setting research agendas, and in some cases – Aleuts at Fairbanks, Evenkis at Moscow and Ainu at Osaka – presenting the actual papers. This branch of hunter-gatherer studies is closely aligned with the emerging worldwide movement for recognition of the significance of ‘indigenous peoples’ and their rights. The humanistic wing of hunter-gatherer studies has been represented by a major focus at the recent CHAGS on symbolic and spiritual aspects of huntergatherer life. Here were found richly textured accounts of forms of consciousness, cosmology and ritual, while other papers dealt with the changing worldviews of foragers under the impact of ideologies of state and marketplace. To showcase the offering of the Moscow CHAGS there is an excellent volume of papers edited by Biesele et al (1999), with an equally rich set of publications planned for Osaka. One theme unifying these diverse scholars from many countries was that all were able to see in hunter-gatherer society some component of historical autonomy and distinctiveness. The notion of ‘pristine’ hunter-gatherer was nowhere in sight, but neither did anyone argue that the cultural practices or cosmological beliefs observed were simply refractions of dominant outsiders, Soviet or Western. Refreshingly, the ‘other’s’ reality was not considered to be so alien that the ethnographer was incapable of representing it with some coherence. Another unifying theme was the recognition that change was accelerating, and that the magnitude of the problems faced by these indigenous peoples was enormous, especially those in the Russian North, for whom ecologically destructive socialist industrialization has been followed directly by the advent of get-rich-quick capitalism. Similar conditions were replicated in most of the world’s regions where foragers persist.
58 Before Agriculture
Hunter-gatherer Studies Today As humankind approaches the millennium, what are some of the main currents in research about hunter-gatherers, present, past and future? Four principal tendencies can be discerned. These are set out below with two provisos: first, none of these approaches has a monopoly on ‘the truth’; each has something to offer and each has its shortcomings. Second, none in practice is air-tight, and many scholars may participate in two or more. 1. Classic. The internal dynamics of hunter-gatherer society and ecology continue to interest many scholars. Kinship, social organization, land use, trade, material culture and cosmology provide an ongoing source of ideas, models and analogies for archaeologists and others reconstructing the past. When due account is taken of the historical circumstances, ethnographic analogies can be a valuable tool. Archaeologists are now arguably the largest ‘consumers’ (and producers) of research on hunting and gathering peoples, even though the opportunities for basic ethnographic research are shrinking rapidly. Robert Kelly’s book The Foraging Spectrum (1995) is an excellent example of work in the classic tradition (with a minor in behavioural ecology). Tim Ingold has authored several works which sought to integrate the social and the ecological through an application of neo-Marxist theory (1986), and Ernest Burch Jr. continues to produce meticulous ethnographies on arctic Alaska and Canada in the classic tradition (e.g. Burch, 1998). Theorists beyond anthropology continue to turn to the hunter-gatherer evidence in constructing their own models about economics or gender roles or cosmology or many other subjects where a basic human substrate is sought. The results are highly variable. 2. Adaptationist. Discussed above, the second ‘tendency’ is the area of behavioural ecology and Optimal Foraging Theory, with a strong presence in the US, particularly at the Universities of Utah and New Mexico. The adaptationists are the prime advocates of a strictly ‘scientific’ paradigm within hunter-gatherer studies and this places them, to a degree, at odds with others in the field for whom humanistic and political economic approaches are primary (cf. Lee, 1992). While some behavioural ecologists approach issues of demography and subsistence from a historically contextualized position, a significant number continue to march under the banner of neo-Darwinian sociobiology. And while some acknowledge the impact of outside forces – such as dam construction, logging, mining, rainforest destruction, bureaucracies, missionaries and land alienation – on the people they study, others focus narrowly on quantitative models of foraging behaviours as if these existed in isolation. In addition to criticizing their science, critics of this school have argued that by treating foragers primarily as raw material for model building, the behavioural ecologists fail to acknowledge foragers’ humanity and agency, as conscious actors living through tough times and facing the same challenges as the rest of the planet’s beleaguered inhabitants. Having fought to maintain their scientific rigour as
Foragers and Others 59
anthropology-at-large moves in a more humanistic direction, the challenge for the behavioural ecologists now is to make their work also relevant and useful to their subjects in their fight for cultural, economic and ecological survival. Within the field of behavioural ecology of hunter-gatherers, and in relation to the terms of this field, Kristen Hawkes has been the most articulate spokesperson, while Hill and Hurtado (1995) and Smith and Winterhalder (1992) offer some of the best recent work. 3. Revisionist. This school of thought argues that the peoples known as ‘huntergatherers’ are something quite different: primarily ragged remnants of past ways of life largely transformed by subordination to stronger peoples and the steamroller of modernity. Two of the principal authors of this view are Schrire (1984) and Wilmsen (1989). Although the evidence presented in this volume challenges this thesis at a fundamental level, the ‘revisionists’ do raise serious questions. For too long students of hunter-gatherers and other pre-state societies tended to treat in isolation the peoples they researched, regarding them as unmediated visions of the past. Today history looms much larger in these studies. Hunter-gatherers arrive at their present condition by a variety of pathways. By acknowledging this fact and being sensitive to the impact of the wider political economy, the authors of this volume are responding to the challenges made by the revisionists. Beside the archaeological and historical evidence contra the revisionist position, the most eloquent testimony in the revisionist debate is the voices of the people, setting out their ongoing sense of themselves as historically rooted peoples with a tradition and identity as hunters and gatherers. Their eloquence, resilience and strength demonstrate that even in this hardbitten age of ‘globalization’ other ways of being are possible. 4. Indigenist. This fourth perspective brings the people studied, their goals and aspirations, firmly into the centre of the scholarly equation. For many of the authors in this book the indigenist perspective represents the outcome of a long search for an anthropology of engagement that is also scientifically responsible. The long revolution in the ethics of anthropology has come to the present conjuncture in which the still-legitimate goals of careful scholarship must he situated in tandem with ethical responsibilities to the subjects of inquiry. This involves at the very least attempting to account for the forces impacting on peoples’ lives in ways that valorize their choices and give them useful tools to work with. For example, in the volume Cash, Commoditization, and Changing Foragers (1991), co-edited with Toshio Matsuyama, Nicolas Peterson offers a coherent framework for understanding the complex impacts of the market economy on the internal dynamics of foraging peoples. This issue has tended to polarize the field of huntergatherer studies into two camps: the revisionists who see capitalism as having long ago destroyed the foraging economy, and the ‘pristinists’ who deny or minimize these effects. Peterson’s subtle and insightful analysis succeeds in bridging these two entrenched positions and showing areas of common ground. The market and
60 Before Agriculture
the welfare state, in Peterson’s view, have altered but not destroyed foraging economies; in many cases the impacts have been absorbed and put to use in reproducing forager communities and identity within the wider society. A similarly lucid and original analysis underlies Peterson’s re-analysis of the subject of sharing and giftgiving (1993). He focuses on the ways in which sharing reproduces core values within foraging communities, enabling them to maintain independent identity in spite of the vastly greater power and reach of the enveloping market-based society. Researchers in the indigenist perspective must perform a difficult balancing act: how to combine advocacy and good rigorous scholarship, without subsuming ethical obligations of the scholar to political expediency (or vice versa). In addition to a number of authors in this volume, the ‘indigenist’ perspective on hunter-gatherers is evident in the work of such scholars as Eugene Hunn (1990), Joe Jorgensen (1990), Basil Sansom (1980), Janet Siskind (1980) and Polly Wiessner (1982). Given the growing political visibility of modern foragers within their respective nationstates and the worldwide movement for indigenous rights, recent research has been based increasingly on agendas arising from within the communities themselves. Land claims, social disintegration, substance abuse and the concomitant movements to reconstitute ‘traditional’ culture and revitalize institutions have become central concerns.
About the Cambridge Encyclopedia of Hunters and Gatherers Part I is arranged into seven sections, based on the world’s principal geographical regions. Each is introduced by an overview of the region’s foraging peoples by the regional editor, followed by an essay on the area’s prehistory. The heart of the Encyclopedia is the individual case studies of the history, ethnography and current status of over 50 of the world’s best-documented hunter-gatherer groups. The goal here is to present a balanced account that includes both the traditional culture and social forms, and the contemporary circumstances and organization for resistance. Authors were chosen not only for their expertise as authorities but also for the contributions they have made as advocates for the well-being of the people they write about. Each chapter also contains a sidebar in which members of the society speak to the reader in direct quotations. Part II contains thematic essays covering a broad array of topics: from mythology, religion, nutrition, gender and social life, to experience at the hands of colonial forces and status in contemporary states and human rights. Other essays address the traditional and contemporary music of hunter-gatherers on the ‘Worldbeat’ scene, and their current position in world art markets where works by aboriginal artists may fetch four and five figures. These essays thus situate the hunting
Foragers and Others 61
and gathering peoples not only in their own world but also in the wider world’s political economy and the emerging global culture.
The Regions 1 North America (regional editor: Harvey A. Feit; archaeological background: Aubrey Cannon) Prior to colonization about two-thirds of North America was occupied by hunters and gatherers, including most of what is now Canada and much of the US west of the Mississippi. Some of the best-known recent foragers reported in the Encyclopedia include the James Bay Cree (Feit) and Labrador Innu (Mailhot), the Subarctic Dene in western Canada and Alaska (Asch and Smith), and the Inuit (Eskimo) of Arctic Canada (Burch and Csonka) and Alaska (Worl). The foragers of the Great Basin are represented by the Timbisha Shoshone of Nevada (Fowler). The mounted hunters of the Plains and intermontane West represent a successful secondary adaptation to big-game hunting by former farmers and foragers after the arrival of the horse in the 17th century (Kehoe). Complex foraging societies, with slavery and rank distinctions, occupied all of the west coast of North America from California to the Alaskan panhandle (Daly).
2 South America (regional editor: Laura M. Rival; archaeological background: Anna C. Roosevelt) The southern cone of the South American continent was occupied by foragers including, at the extreme south, the Ona, Yamana and Selknam of Tierra del Fuego (Vidal) and the Toba of the western Chaco (Gordillo). Some of the hunters of the southern cone became mounted hunters with the arrival of the horse, paralleling processes in North America. The numerous peoples of the Amazon and Orinoco basins combined foraging with shifting horticulture, with some like the Equadorean Huaorani (Rival) relying largely, and a few peoples like the Cuiva of Venezuela (Arcand) almost entirely, on foraging. South American foragers like the Sirionó (Balée) show evidence of having been more reliant on farming in the past. The Paraguayan Aché (Hill and Hurtado) are well known in anthropological circles for the detailed behavioural ecological studies made about them.
3 North Eurasia (regional editors: Victor A. Shnirelman and David G. Anderson, with Bruce Grant; archaeological background: Victor A. Shnirelman) In northern Siberia and the Russian Far East a number of hunter-gatherer groups exist, combining foraging with small-scale reindeer herding. These groups vary
62 Before Agriculture
widely in the timing of colonial encounter (some being reached only in the late 19th century), and in the degree to which they have suffered from the industrialization of the Soviet period. Notable among those who were primarily foragers are the Khanti (Nemysova, with Bartels and Bartels), Nia/Nganasan (Golovnev), Iukagir (Ivanov), Ket (Alekseenko), and the Chukchi and Siberian Yupik (Schweitzer), the latter close relatives of the Alaskan Eskimo. The Evenki of central Siberia (Anderson) and the Nivkh of Sakhalin Island (Grant) have been particularly hard hit by industrial pollution and the break-up of the Soviet Union. In addition Svensson discusses the well-known Ainu culture of Hokkaido, Sakhalin and the Kurile Islands.
4 Africa (regional editor: Robert K. Hitchcock; archaeological background: Peter Robertshaw) Although most of the continent pre-colonially was occupied by farmers, herders and agrarian states, Africa was home to several well-known foraging peoples. The Pygmies occupy the equatorial rainforest in a broad belt across central Africa from Cameroon to Rwanda, represented in the volume by the Mbuti of the Congolese Ituri Forest (Ichikawa) and the Aka of the Central African Republic (Bahuchet). In East Africa the Hadza of Tanzania (Kaare and Woodburn) have remained staunchly independent of neighbouring farmer-herders, while the Okiek of Kenya (Kratz) have long-established trade relations with the Maasai. In the Kalahari Desert of Botswana, Namibia and Angola live the well-known San or Bushmen peoples. Some, like the Ju/’hoansi (Biesele and Kxao Royal-/O/oo) and the central Kalahari/Gui of Botswana (Tanaka and Sugawara), remained relatively autonomous until recently; others like the Tyua of eastern Botswana (Hitchcock) have a long history of close contact. The Mikea of south-eastern Madagascar became foragers in the 19th century, adopting the relative security of forest hunting and gathering during a period of instability and warfare (Kelly et al).
5 South Asia (regional editor: Nurit Bird-David; archaeological background: Kathleen Morrison) In this region of ancient civilizations a surprising number of foragers exist, occupying upland forested areas and providing forest products (honey, medicinal herbs, furs) to lowland markets. It is this economic niche presumably that has allowed the South Asian hunter-gatherers to persist to the present and remain viable. Examples include the Wanniyala-aetto (Veddah) of Sri Lanka (Stegeborn), the Nayaka of Kerala (Bird-David), the Paliyan (Gardner), and the Hill Pandaram (Morris) in the southern tip of the subcontinent, and the Birhor (Adhikary) and Chenchu (Turin) in central and eastern India. Most famous are the Andamanese, occupying a series of islands in the Bay of Bengal, who remained isolated into the late 19th century and in one case well into the 20th (Pandya).
Foragers and Others 63
6 South-east Asia (regional editor: Kirk Endicott; archaeological background: Peter Bellwood) Orang Asli is a cover term for the indigenous non-agricultural peoples of the Malay peninsula and insular South-east Asia. Among the best known are the Batek (Endicott) and Jahai (Van der Sluys) in the Malaysian forest and the Batak (Eder) on the Philippine island of Palawan. Other groups are found in Thailand, Myanmar, Laos and China’s Yunnan province (Song and Shen). On the island of Borneo live the Penan of Sarawak (Brosius), firmly rooted in hunting and gathering until recent displacement by multinational logging interests. The Philippine main islands have several pockets of foraging peoples, including the Agta of northeastern Luzon famous for their female hunters (Griffin and Griffin).
7 Australia (regional editor: Nicolas Peterson; archaeological background: Michael A. Smith) Prior to European colonization in the late 18th century, Australia was entirely occupied by hunting and gathering peoples. These suffered a precipitous decline after 1788. Nevertheless in the centre, north and west, Aboriginal people have persisted, the last nomadic Pintupi foragers in the Western Desert coming in to settlements in the 1950s and 1960s (Myers). Arnhem Land Aborigines such as the Yolngu (Keen) retain significant elements of social and ritual organization, as do some of the desert groups like the Warlpiri (Dussart), Pintupi (Myers), and Arrernte (Arunta) (Morton). The Aborigines of Cape York in north-east Queensland (Martin) and the Kimberleys (Toussaint) and the famous Tiwi of Bathurst and Melville Islands (Goodale) give a sense of the range of variation among contemporary Aboriginal peoples. A significant percentage of Aborigines are urbanized and, like the Ngarrindjeri in South Australia (Tonkinson), are struggling to preserve and revivify their cultures and land rights in the face of the indifference and tokenism of Australian society at large. The Torres Strait Islanders (Beckett) lie geographically and culturally midway between Australia and Papua New Guinea. They are active partners with Aborigines in political movements, legal challenges, and administrative structures. Although the main story of hunters and gatherers today is carried by the 53 case studies and their regional introductions, important themes cross-cut the focus on regions and cultures. The special topic essays focus attention on broader issues involving or affecting hunting and gathering peoples worldwide. Alan Barnard traces the complex perceptions (and misperceptions) of huntergatherers through Western intellectual history. As noted above, Barnard sensitizes us to the fact that foragers have always been viewed through a thick lens of ideology and this became even more pronounced when European colonialism and its oppositions became predominant sites of political and cultural discourse about foragers. Barnard documents how current debates are actually reprises of older controversies resurfacing anew.
64 Before Agriculture
Andrew Smith follows with a magisterial survey of the world prehistory of hunting and gathering peoples. Smith notes that for much of human history hunting and gathering was the universal mode of life. His overview offers a sense of the world-historical events that led first to the 2 million year ascendancy and then the eclipse of hunting and gathering as, continent by continent, farmers, herders and states arose, ultimately to marginalize and encapsulate the foraging world. John Gowdy represents a refreshing incursion by a sister discipline to the world of hunter-gatherers. An economist, Gowdy makes good use of hunter-gatherer materials to take a sharp look at the conventional wisdom economists (and the rest of us) live by. Gowdy questions in turn the economic concepts of scarcity, production, distribution, ownership and capital and in each instance counterposes alternative examples from the hunter-gatherer literature. Following on Marshall Sahlins’ pioneering work (1968, 1972), Gowdy portrays these economic core concepts more accurately as culturally bound constructions specific to a time and place and not eternal expression of basic human nature. These themes are developed in greater depth in Gowdy (1998). For over 20 years Tim Ingold has been reflecting on hunting and gathering as a way of life, a mode of production and an ecological adaptation. Here he brings these lines of inquiry together to ponder the nature of hunter-gatherer sociality. Ingold asks whether hunter-gatherers, living in direct, face-to-face groupings, do not exhibit a form of sociality of a qualitatively different nature from that of the rest of humanity, living in hierarchical, often anonymous, often alienated circumstances. After reviewing theories of the patrilocal band and of ‘primitive communism’ Ingold then draws out some of the profound implications of this line of inquiry for social theory more generally. The second group of special essays surveys six major aspects of hunter-gatherer life in cross-cultural perspective. Karen Endicott addresses the large ethnographic and critical literature about gender in hunting and gathering societies. Noting the persistent male bias of older ethnographies that pushed women to the margins, Endicott discusses a number of recent studies that rectify this misperception. Women’s roles in subsistence, kinship and politics are explored. Drawing on her own familiarity with South-east Asian foragers, Endicott considers the well-known views of Eleanor Leacock about women in foraging societies (1978, 1982) in opposing the doctrine of universal female subordination. Catherine Fowler and Nancy Turner discuss Traditional Ecological Knowledge (TEK). Hunter-gatherers are notable for the intensity of their spirituality and connection to the land, a connection further intensified by the experience of dispossession. Fowler and Turner show how, among hunter-gatherers, systems in the natural world are incorporated into the spiritual and social worlds. ‘Particularly important’, in their view, ‘is the sense of place and purpose communicated by the oral tradition, and the cumulative wisdom derived from knowledge of complex ecological relationships.’ The authors point to the negative consequences of breaking this connection, leading to loss of purpose, language and culture. They also speak of groups in which the connection to land and foraging is being recaptured.
Foragers and Others 65
Mathias Guenther presents a rich account of the intellectual and spiritual world of hunter-gatherers, a vast continent of myth and practice that is a major world-historic heritage. While Fowler and Turner show how Nature is an encyclopedia of practical knowledge, Guenther views the cosmologies of foraging peoples as wellsprings of supernatural and ontological meanings. He explores the ubiquity of the Trickster figure in world mythology and traces the anthropological history of shamanism from its first documentation in eastern Siberia in the late 19th century to its recognition as a religious phenomenon found in every continent. Guenther also documents the successful adaptation of some shamanistic methods into healing practices of contemporary medicine. In an original synthesis Victor Barac explores the world of hunter-gatherer music. Presenting examples from Africa, Australia and North America, Barac documents the core features of this genre and its points of difference from the musics of non-foraging peoples. He then gives an account of the extraordinary impact made by hunting and gathering musicians and singers upon the ‘Worldbeat’ and pop music scenes. In examples ranging from the Australian Aboriginal group Yothu Yindi to the Canadian Inuit artist Susan Aglukark, Barac documents the unique interweaving in the music of these artists of traditional elements along with profound reflections on contemporary themes of poverty, violence, racism and loss. Howard Morphy follows with an overview of the art of hunting and gathering peoples. He first notes variation in artistic production and the wide variance in the permanence of this art – from body and sand painting which lasts a day to rock art lasting millennia. Morphy traces three cases of hunter-gatherer art which have reached world status: North-west Coast art, Aboriginal Australian bark paintings, and Inuit soapstone carvings. Each has enjoyed extraordinary success on international art markets, as well as becoming part of the iconography of their respective nationstates. One of the recurrent themes in hunter-gatherer research is the surprisingly good nutritional status of foraging peoples. As S. Boyd Eaton and Stanley Eaton point out, there are many lessons to be learned from the study of foragers’ diet and exercise regime. In the precolonial period foragers led healthy outdoor lives with a diet consisting entirely of ‘natural’ foods. Salt intake and refined carbohydrate consumption were low and obesity rare, as were many of the diseases associated with high-stress sedentary urban living such as diabetes, heart disease and stroke. While infectious diseases took their toll, some of these were evidently introduced during the colonial period well before the colonists themselves arrived in local areas. One of the strangest episodes in the history of hunter-gatherer studies began in 1972 when a Philippine-American team reported finding a ‘Stone Age people’ who were claimed to have been living in caves on a diet of wild foods out of touch with the rest of the world for over 500 years! The Tasaday, as they came to be known, became world-famous, featured in international media and in several National Geographic specials. Despite the public’s acceptance, nagging doubts remained among scholars about the authenticity of such a seemingly far-fetched
66 Before Agriculture
story. Gerald Berreman traces the history of the Tasaday from the beginning and reveals it as an elaborate hoax, probably the biggest anthropological hoax since the Piltdown fraud. With painstaking detail Berreman invites the reader to evaluate the evidence in what has become a fascinating detective story of greed in high places and otherwise blameless indigenous people drawn in as accomplices. John Bodley chronicles the complex history of the encounter between hunting and gathering peoples and European colonialism. In the 500 years of European incursions into the rest of the world, band and village societies faced insurmountable odds and many succumbed to a combination of military predation, land loss and the effects of introduced diseases. Yet despite the horrors of the colonial period, a surprising number of foragers survived and are present to witness the dawn of the third millennium. Bodley documents the tenacity and ingenuity of these survivors and how they combined resistance and accommodation to preserve a way of life they valued. As long as they had the frontier, hunting and gathering peoples could survive by moving beyond the reach of the colonial authorities. But with the arrival of the modern nationstate, administrative structures reached everywhere. David Trigger surveys the ways in which states of the First, Second and Third Worlds first pacified and censused and then divided and ruled foraging peoples, attempting to make them conform to the role of ‘good citizens’. Trigger offers important insights into the lived realities of foragers and post-foragers today as they adjust to bureaucratic domination. He notes significant differences between the situation of former foragers in the Western capitalist states, and those in the developing world and the former USSR. In the last chapter, Robert Hitchcock surveys the state of human rights for indigenous peoples. Given their new status as ‘wards’ of states, foragers have undergone transformations in political consciousness. Foragers are increasingly coming to see themselves as encapsulated minorities, as ethnic groups, and as stakeholders within the civil societies of states. At a broader level they are coming to see themselves as part of the larger global community of indigenous peoples. Indigenous peoples now are a force on the world stage, but despite the UN’s declaration of the period 1995–2004 as the ‘Decade of Indigenous Peoples’ the human rights of many continue to be abridged, violated and denied, Hitchcock surveys the complex terrain on which foragers and post-foragers make claims on the political agendas of states and international organizations. Hitchcock appends a useful up-to-date list of over 50 indigenous organizations and advocacy groups.
An Afterword These 14 essays and the case studies that precede them convey a sense of what makes present-day hunters and gatherers so intriguing. Long the subject of myth and misconception, the hunting and gathering peoples have come into focus in
Foragers and Others 67
recent years. Far from being simply the cast-offs of creation or victims of history, the foraging peoples have become political actors in their own right, mounting land claims cases, participating in the environmental movement, and lobbying for their rights with governments and the UN. Also they are being sought out by spiritual pilgrims from urban industrial societies seeking to recapture wholeness from an increasingly fragmented and alienated modernity. As humanity marks the new millennium, there is an increasing preoccupation with where we have come from and where we are going. The accelerating pace of change and the ceaseless transformations brought about by economic forces have had the effect of obliterating history, creating a deepening spiritual malaise. For centuries philosophers have sought the answers to humanity’s multiple problems in the search for the holy grail of ‘natural man’, the search for our ancestors. The Cambridge Encyclopedia of Hunters and Gatherers does not offer simple or pat answers to the questions of the social philosophers. Yet it is our hope that in the documentation of foragers’ history, culture and current situation, readers will find a rich source of ideas, concepts and alternatives to fuel the political imagination.
References Abler T. 1992. Scalping, torture, cannibalism and rape: an ethnohistoric analysis of conflicting cultural values. Anthropologica 34, 3–20 Altman J. 1984. Hunter-gatherer subsistence production in Arnhem Land: the original affluence hypothesis re-examined. Mankind 14, 179–90 Altman J. 1987. Hunter-Gatherers Today. Canberra: Australian Institute of Aboriginal Studies Bailey R. 1991. The Behavioral Ecology of Efe Pygmy Men in the Ituri Forest, Zaire. Ann Arbor: Museum of Anthropology, University of Michigan, Anthropological Papers 86 Balikci A. 1970. The Netsilik Eskimo. Garden City, NY: Natural History Press Bamforth D. 1994. Indigenous people, indigenous violence: pre-contact warfare on the North American Great Plains. Man 29, 95–115 Barnard A. 1992a. The Kalahari Debate: A bibliographic essay. Edinburgh: University of Edinburgh, Centre for African Studies Barnard A. 1992b. Hunters and Herders of Southern Africa. Cambridge: Cambridge University Press Barnes H. E. 1937. An Intellectual and Cultural History of the Western World. New York: Random House Barnes H. E. and H. Becker 1938. Social Thought from Lore to Science. Boston: D. C. Heath Bell D. 1983. Daughters of the Dreaming. London: Allen and Unwin Bellah R. N. 1965. Religious evolution. In W. A. Lessa and E. Z. Vogt (eds), Reader in Comparative Religion (3rd edn). New York, Harper and Row, 36–50 Bettinger R. 1991. Hunter-Gatherers: Archaeological and Evolutionary Theory. New York: Plenum Bicchieri M. (ed.) 1972. Hunters and Gatherers Today. New York: Holt, Rinehart and Winston Biesele M., R. Hitchcock and P. Schweitzer (eds.) 1999. Hunter-Gatherers in the Modern World: Conflict, Resistance, and Self-Determination. Providence, RI: Berghahn Binford L. R. 1978. Nuniamiut Ethnoarchaeology. New York: Academic Press Bird-David N. 1990. The giving environment: another perspective on the economic system of gathererhunters. Current Anthropology 31, 189–96 Bird-David N. 1992. Beyond ‘the original affluent society’: a culturalist reformulation. Current Anthropology 33, 25–48
68 Before Agriculture Blurton Jones N. G. 1983. A selfish origin for human food sharing: tolerated theft. Ethology and Sociobiology 5(1), 1–3 Boas F. 1888. The Central Eskimo. Washington DC: Bureau of American Ethnology Annual Report 6 Boas F. 1948. Race, Language and Culture. New York: Macmillan Boas F. 1966. Kwakiutl Ethnography, ed. H. Codere. Chicago: University of Chicago Press Bonta B. 1993. Peaceful Peoples: An Annotated Bibliography. Metuchen, NJ: Scarecrow Press Boule M. and H. Vallois. 1957. Fossil Men (5th edn). New York: The Dryden Press Brody H. 1981. Maps and Dreams: Indians of the British Columbia Frontier. Harmondsworth: Penguin Burch E. Jr. 1998. The Inupiaq Eskimo Nations of Northwest Alaska. Fairbanks: University of Alaska Press Burch E. Jr. and L. Ellanna (eds) 1994. Key Issues in Hunter-Gatherer Studies. Oxford: Berg Charnov E. L. 1976. Optimal foraging: the marginal value theorem. Theoretical Population Biology 9, 129–36 Cohen M. N. 1977. The Food Crisis in Prehistory. New Haven: Yale University Press Cruikshank J. 1990. Life Lived Like a Story: Life Stories of Three Yukon Native Elders. Vancouver: University of British Columbia Press Dahlberg F. (ed.) 1981. Woman the Gatherer. New Haven: Yale University Press Damas D. (ed.) 1969. Contributions to Anthropology: Band Societies. National Museum of Canada Bulletin 228 Damas D. 1984. Handbook of North American Indians, vol. V, Arctic. Washington DC: Smithsonian Institution D’Azevedo W. (ed.) 1986. Handbook of North American Indians, vol. XI, Great Basin. Washington DC: Smithsonian Institution Dentan R. 1968. The Semai: A Non-Violent People of Malaya. New York: Holt, Rinehart and Winston Diamond S. 1974. Plato and the definition of the primitive. In S. Diamond, In Search of the Primitive: A Critique of Civilization. New Brunswick, NJ: Transaction Books Divale W. and M. Harris. 1976. Population, warfare and the male supremacist complex, American Anthropologist 78, 521–38 Donald L. 1984. The slave trade on the northwest coast of North America. Researches in Economic Anthropology 6, 121–58 Donald L. 1997. Aboriginal slavery on the Northwest Coast of North America. Berkeley: University of California Press Durkheim E. 1915 [1912]. Elementary Forms of the Religious Life. London: Allen and Unwin Edgerton R. 1992. Sick Societies: Challenging the Myth of Primitive Harmony. New York: Free Press Edwards W. H. 1987. Traditional Aboriginal Society. Melbourne: Macmillan Ember C. 1992. Warfare, aggression, and resource problems: cross-cultural codes. Behavior Science Research 26(1–4), 169–226 Ferguson B. 1984. A reexamination of the causes of Northwest Coast warfare. In B. Ferguson (ed.), Warfare, Culture and the Environment. New York: Academic Press, 267–328 Friedl E. 1975. Women and Men: An Anthropologist’s View. New York: Holt, Rinehart and Winston Gowdy J. (ed.) 1998. Limited Wants, Unlimited Means: A Hunter-Gatherer Primer in Economics and the Environment. Washington DC: Island Press Grant B. 1995. In the Soviet House of Culture: A Century of Perestroikas. Princeton: Princeton University Press Guenther M. 1993. ‘Independent, fearless and rather bold’: a historical narrative of the Ghanzi Bushmen of Botswana. Namibia Scientific Society 44, 25–40 Guenther M. 1998. Lords of the desert land: politics and resistance of the Ghanzi Basarwa of the nineteenth century. Botswana Notes and Records 29, 121–41 Harris M. 1968. The Rise of Anthropological Theory. New York: Crowell
Foragers and Others 69 Hawkes K., K. Hill and J. O’Connell 1982. Why hunters gather: optimal foraging and the Aché of eastern Paraguay. American Ethnologist 9, 379–98 Hawkes K. and J. O’Connell 1981. Affluent hunters? Some comments in light of the Alywara case. American Anthropologist 83, 622–6 Hawkes K. and J. O’Connell 1985. Optimal foraging models and the case of the !Kung. American Anthropologist 87, 401–5 Hawkes K., J. O’Connell and N. Blurton Jones 1989. Hardworking Hadza grandmothers. In V. Standen and R. Foley (eds), The Behavioral Ecology of Humans and Other Mammals. Oxford: Blackwell, 341–66 Heizer R. (ed.) 1978. Handbook of North American Indians, vol. VIII, California. Washington DC: Smithsonian Institution Helm J. (ed.) 1981. Handbook of North American Indians, vol. VI, Subarctic. Washington DC: Smithsonian Institution Hewlett B. 1991. Intimate Fathers: The Nature and Context of Aka Pygmy Paternal Infant Care. Ann Arbor: University of Michigan Press Hiatt (Meehan) B. 1978. Woman the gatherer. In F. Gale (ed.), Woman’s Role in Aboriginal Society. Canberra: Australian Institute of Aboriginal Studies, 4–15 Hill K. et al. 1985. Men’s time allocation to subsistence work among the Aché of eastern Paraguay. Human Ecology 13, 29–47 Hill K. and M. Hurtado 1995. Aché Life History: The Ecology and Demography of a Foraging People. New York: Aldine Hunn E., with J. Selam and family 1990. Nch’i-Wana, the ‘big river’: Mid Columbia Indians and their land. Seattle: University of Washington Press Hurtado M. and K. Hill 1990. Seasonality in a foraging society: variation in diet, work effort, fertility and sexual division of labor among the Hiwi of Venezuela. Journal of Anthropological Research 46, 293–346 Ingold T. 1986. The Appropriation of Nature: Essays on Human Ecology and Social Relations. Manchester: Manchester University Press Ingold T. 1992. Review Article: Foraging for data, camping with theories: hunter-gatherers and nomadic pastoralists in archaeology and anthropology. Antiquity 66, 790–803 Ingold T., D. Riches and J. Woodburn (eds) 1988a. Hunters and Gatherers, vol. I, History, Evolution and Social Change. London: Berg Ingold T., D. Riches and J. Woodburn (eds) 1988b. Hunters and Gatherers, vol. II, Power, Property and Ideology. London: Berg Jorgensen J. 1990. Oil Age Eskimos. Berkeley: University of California Press Kaplan H. and K. Hill 1985. Food sharing among Aché foragers: tests of explanatory hypotheses. Current Anthropology 26, 223–46 Katz R. 1982. Boiling Energy: Community Healing Among the Kalahari !Kung. Cambridge, MA: Harvard University Press. Kelly R. L. 1995. The Foraging Spectrum: Diversity in Hunter-Gatherer Lifeways. Washington DC: Smithsonian Institution Kent S. 1996a. The current forager controversy: real versus ideal views of hunter-gatherers. Man 27, 45–70 Kent S. (ed.) 1996b. Cultural Diversity Among Twentieth-Century Foragers: An African Perspective. Cambridge: Cambridge University Press Koyama S. and D. Thomas (eds) 1981. Affluent Foragers. Senri Ethnological Studies 9. Osaka: National Museum of Ethnology Kroeber A. L. 1925. Handbook of the Indians of California. Washington DC: Bureau of American Ethnology Bulletin 78 Laughlin W. 1980. The Aleuts: Survivors of the Bering Land Bridge. New York: Holt, Rinehart and Winston
70 Before Agriculture Leacock E. 1978. Women’s status in egalitarian society: implications for social evolution. Current Anthropology 19, 247–75 Leacock E. 1982. Myths of Male Dominance. New York: Monthly Review Press Leacock E. and R. Lee (eds) 1982. Politics and History in Band Societies. Cambridge: Cambridge University Press Lee R. B. 1979. The !Kung San: Men, Women and Work in a Foraging Society. Cambridge: Cambridge University Press Lee R. B. 1982. Politics, sexual and non sexual, in an egalitarian society. In E. Leacock and R. Lee (eds.), Politics and history in band societies. Cambridge: Cambridge University Press, 37–59 Lee R. B. 1988. Reflections on primitive communism. In T. Ingold, D. Riches and J. Woodburn (eds), Hunters and Gatherers: vol. I, History, Evolution and Social Change. London: Berg, 200–16 Lee R. B. 1992. Art, science or politics: the crisis in hunter-gatherer studies. American Anthropologist 94, 31–54 Lee R. B. and I. DeVore (eds) 1968. Man the Hunter. Chicago: Aldine Lévi-Strauss C. 1949. Les Structures Élémentaires de la Parenté. Paris: Presses Universitaires de France Lévi-Strauss C. 1962a. Le Totémisme Aujourd’ Hui. Paris: Plon Lévi-Strauss C. 1962b. La Pensée Sauvage. Paris: Plon Lévi-Strauss C. 1987. Anthropology and Myth: Lectures 1951–1982. Oxford: Blackwell Lowie R. H. 1935. The Crow Indians. New York: Farrar and Rinehart Malinowski B. 1963 [1913]. The Family Among the Australian Aborigines. New York; Schocken Marquardt W. 1988. Politics and production among the Calusa of south Florida. In T. Ingold, D. Riches and J. Woodburn (eds), Hunters and Gatherers: vol. I, History, Evolution and Social Change. London: Berg, 161–88 Marshall L. 1968. The medicine dance of the !Kung Bushmen. Africa 39, 347–81 Marshall L. 1976. The !Kung of Nyae Nyae. Cambridge, MA: Harvard University Press Martin J. F. 1983. Optimal foraging theory: a review of some models and their applications. American Anthropologist 85(3), 612–29 Mauss M. with H. Beuchat 1906. Essai sur les variations saisonières des sociétés Eskimos: étude de morphologic sociale. L’Année Sociologique 9 (1904–5), 39–132 Meek R. 1976. Social Science and the Ignoble Savage. Cambridge: Cambridge University Press Mitchell D. and L. Donald 1985. Some economic aspects of Tlingit, Haida, and Tsimshian slavery. Research in Economic Anthropology 7, 19–35 Morgan L. H. 1963 [1877]. Ancient Society, ed. E. Leacock. New York: Meridian Morgan L. H. 1965 [1881]. Houses and House-Life of the American Aborigines. Chicago: University of Chicago Press Moss M. L. 1992. Forts, refuges, rocks, and defensive sites: the antiquity of warfare along the north Pacific coast of North America. Arctic Anthropology 29, 73–90 Myers F. 1986. Pintupi Country, Pintupi Self: Sentiment, Place and Politics Among Western Desert Aborigines. Washington DC: Smithsonian Institution O’Connell J. and K. Hawkes 1981. Alywara plant use and Optimal Foraging Theory. In B. Winterhalder and E. A. Smith (eds), Hunter-Gatherer Foraging Strategies. Chicago: University of Chicago Press, 99–125 Peterson N. 1991. Introduction: cash, commoditisation and changing foragers. In N. Peterson and T. Matsuyama (eds), Cash, Commoditization, and Changing Foragers. Senri Ethnological Studies 30. Osaka: National Museum of Ethnology, 1–16 Peterson N. 1993. Demand sharing: reciprocity and the pressure for generosity among foragers. American Anthropologist 95, 860–74 Povinelli E. 1993. Labor’s Lot: The Power, History, and Culture of Aboriginal Action. Chicago: University of Chicago Press Price T. D. and J. A. Brown 1985. Prehistoric Hunter-Gatherers: The Emergence of Cultural Complexity. Orlando, FL: Academic Press
Foragers and Others 71 Radcliffe-Brown A. R. 1922. The Andaman Islanders. Cambridge: Cambridge University Press Radcliffe-Brown A. R. 1930–1. The social organization of Australian tribes. Oceania 1:34–63, 322–41, 426–56 Radin P. 1956. The Trickster: A Study in American Indian Mythology. London: Routledge and Kegan Paul Rothenberg J. 1968. Technicians of the Sacred: A Range of Poetries from Africa, America, Asia, and Oceania. Garden City, NY: Doubleday Sadr K. 1997. Kalahari archaeology and the Bushman debate. Current Anthropology 38, 104–12 Sahlins M. 1965. On the sociology of primitive exchange. In M. Banton (ed.), The Relevance of Models in Social Anthropology. London: Tavistock, 139–236 Sahlins M. 1968. Notes on the original affluent society. In R. B. Lee and I. DeVore (eds), Man the Hunter. Chicago: Aldine, 85–9 Sahlins M. 1972. Stone Age Economics. Chicago: Aldine Sansom B. 1980. The Camp at Wallaby Cross: Aboriginal Fringe-Dwellers in Darwin. Canberra: Australian Institute of Aboriginal Studies Schrire C. (ed.) 1984. Past and Present in Hunter-Gatherer Studies. San Francisco: Academic Press Shiva V. 1988. Staying Alive: Women, Ecology and Development. Atlantic Highlands, NJ: Zed Press Shiva V. 1997. Biopiracy: The Plunder of Nature and Knowledge. Boston: South End Press Shostak M. 1981. Nisa: The Life and Words of a !Kung Woman. Cambridge, MA: Harvard University Press Siskind J. 1980. To Hunt in the Morning. New York: Oxford University Press Slocum S. 1975. Woman the gatherer. In R. Reiter (Rapp) (ed.), Toward an Anthropology of Women. New York: Monthly Review Press, 36–50 Smith A. and R. B. Lee 1997. Cho/ana: a hxaro meeting place in northeastern Namibia. South African Archaeological Bulletin 32, 118–27 Smith E. A. 1983. Anthropological applications of Optimal Foraging Theory: a critical review. Current Anthropology 24, 625–51 Smith E. A. 1991. Inujjuamiut Foraging Strategies. New York: Aldine Smith E. A. and B. Winterhalder (eds) 1992. Evolutionary ecology and human behavior. New York: Aldine Sollas W. 1911. Ancient Hunters and Their Modern Representatives. London: Macmillan Solway J. and R. B. Lee 1990. Foragers genuine or spurious? Situating the Kalahari San in history. Current Anthropology 31, 109–46 Steward J. 1936. The economic and social basis of primitive bands. In R. H. Lowie (ed.), Essays in Anthropology in Honor of Alfred Louis Kroeber. Berkeley: University of California Press, 311–50 Sturtevant W. (gen. ed.) 1978. Handbook of the North American Indians. 20 vols. Washington DC: Smithsonian Institution Suttles W. (ed.) 1990. Handbook of North American Indians, vol. VII, Northwest Coast. Washington DC: Smithsonian Institution Suzuki D. 1989. Inventing the Future: Reflections on Science, Technology, and Nature. Toronto: Stoddart Suzuki D. 1992. Wisdom of the Elders: Honoring Sacred Native Visions of Nature. New York: Bantam Suzuki D. 1997. The Sacred Balance: A Vision of Life on Earth. Vancouver: Greystone Tanner N. and A. Zihlman 1976. Women in evolution I: innovation and selection in human origins. Signs 1, 585–608 Testart A. 1985. Le Communisme Primitif. Paris: Editions de la Maison des Sciences de l’Homme Trigger B. (ed.) 1978. Handbook of North American Indians, vol. XV, Northeast. Washington DC: Smithsonian Institution Trigger B. and W. Washburn (eds) 1996. The Cambridge History of the Native Peoples of the Americas, vol. I, North America. Cambridge: Cambridge University Press Turnbull C. 1965. Wayward Servants: The Two Worlds of the African Pygmies. Garden City, NY: Doubleday
72 Before Agriculture Wallace A. F. C. 1966. Religion: An Anthropological View. New York: Random House Watanabe H. 1973. The Ainu Ecosystem. Seattle: University of Washington Press Weatherford J. 1994. Savages and Civilization: Who Will Survive? New York: Crown Wiessner P. 1982. Risk, reciprocity and social influences in !Kung San economics. In E. Leacock and R. Lee (eds), Politics and History in Hand Societies. Cambridge: Cambridge University Press, 61–84 Wilmsen E. 1989. Land Filled With Flies: Apolitical Economy of the Kalahari. Chicago: University of Chicago Press Wilmsen E. and J. Denbow 1990. Paradigmatic histories of San-speaking peoples and current attempts at revision. Current Anthropology 31, 489–507 Winterhalder B. 1983. Opportunity-cost foraging models for stationary and mobile predators. American Naturalist 122(1), 73–84 Winterhalder B. 1986. Optimal foraging: simulation studies of diet choice in a stochastic environment. Journal of Ethnobiology 6, 205–23 Winterhalder B. and E. A. Smith (eds) 1981. Hunter-Gatherer Foraging Strategies. Chicago: University of Chicago Press Woodburn J. 1982. Egalitarian societies. Man 17, 431–51
3
Mind H. Brody
1 In 1973, after a year in the Arctic, early one morning I visited Anaviapik’s house in Pond Inlet. Anaviapik and Ulajuk were at their small kitchen table, drinking tea. Everyone else was asleep. I went in, helped myself to a mug and sat down with them. As always, they said how pleased they were to be visited. ‘Pulartiarit,’ said Anaviapik, meaning literally ‘Visit well,’ ‘Be welcome.’ Then he asked: ‘Isumassaqarpit?’ ‘Do you have the material for thought?’, meaning ‘Is there something on your mind?’ ‘No,’ I said. ‘I’m just visiting.’ ‘That’s good,’ said Anaviapik, ‘because I have a thought, and I have a question for you.’ His question, which seemed to arise from a conversation that he and Ulajuk had been having just before I came into their house, was this: ‘Qanuingmat tassumanik Qallunaat isumaqattalaursimajuit Inunnit isumarqanigitunit iila isumarqijugut Inuulluta? Taima isumangmata tusaumavit?’ ‘How is it that in the old days the Qallunaat always thought that the Inuit had no thoughts and that we Inuit were mindless? Is that what you have heard?’ As I thought about what to say, Ulajuk and Anaviapik smiled at me. Then both of them burst out laughing. I recognized their laughter as a way of removing any possible risk that they might sound aggressive. This was just a question, a puzzle, something they wanted to talk to me about.
2 In 1979, late in the year but before the snows had come, I arrived in Fort St. John to discover that Thomas Hunter, the Dunne-za elder, was in hospital. Thomas was now in his eighties, a small, tough man whose face had become a maze of wrinkles but whose hands were still strong and whose eyes were still bright with curiosity Brody H. 2000. Mind. In The Other Side of Eden, reproduced with permission of A P Watt Ltd on behalf of H R Brody Ltd, and with permission of Faber and Faber, London.
74 Before Agriculture
and ideas. He had been ill for a while, coughing a great deal and suffering periods of sudden weakness. A few weeks earlier, Thomas’s family, along with several others, had moved from the Halfway River Reserve to a moose-hunting area a few miles to the north. There they had been preparing dry meat. Moose were plentiful, and the hunters had killed several. The meat had been brought back to the family tents for the women to slice into long, paper-thin sheets. They hung these on wooden frames beside fires, where the meat part dried and part smoked. After a few days, the slices were almost weightless and perfectly preserved. They were a source of concentrated protein that could be stored for many months and packed into bags that were easy to carry. Thomas had not gone to the dry-meat camp that year. He had become very weak; before the others left, he had been taken to the Fort St. John hospital. I found him lying on his bed in a small public ward, dressed in jeans and a vest. As soon as he saw me, he said, as he had so often before when I arrived back in Dunne-za country: ‘I know you here. Time to hunt. We better go someplace, look for moose.’ I thought he was making a joke, then realized he was serious. ‘But can you leave the hospital?’ I asked. ‘You see doctor,’ said Thomas. ‘Then we go to drymeat camp.’ Thomas’s English was fluent, but it came from his fur-trading days. He used it to make direct statements or to ask straightforward questions. His real language was Dunne-za Athabaskan. So we did not have a discussion about just how he was going to manage in the camp. He had made himself clear, and I went to find his doctor. The doctor was a tall young man in a hurry. He said that Thomas was very sick. His lungs were ‘gone’. I asked what the actual diagnosis was. ‘TB,’ he said. ‘Maybe cancer as well.’ He paused, then added: ‘Nothing we can do.’ So was it all right to take him out of the hospital? ‘Fine,’ said the doctor. ‘I just hope that you take him somewhere he can get some care.’ Were there medicines I should take with us? Was there any treatment he should come back to the hospital for? The doctor shrugged. ‘There’s nothing much anyone can do,’ he said. ‘He’s old and his lungs are gone.’ I could take Thomas whenever he wanted to go. I was upset. There was a certain callousness about the way the diagnosis had been given, and something eerie about the lack of medical prescription. Was Thomas about to die? I went back to Thomas’s bed and sat down beside him. He looked at me. He must have known that I had seen the doctor. He didn’t say anything. I looked at his eyes, which seemed to have sunk back into his skull. He had lost weight. ‘The doctor says you can leave here when you want. But I guess you could stay, too, if that seemed better.’ I paused. ‘You would be cared for here.’ Thomas did not hesitate. ‘Okay we leave now?’ ‘Yes,’ I said. ‘When you want.’ ‘Now,’ he said. He sat up on his bed, swung his legs over the side and stood up. We found his shoes and jacket and walked out. Thomas wanted to go straight to the dry-meat camp. He did not say much, and I noticed that he was breathing with some difficulty. I was worried. Maybe we should go to the reserve, where he would have a bed and be within a few hundred
Mind 75
yards of the clinic; at least we would have access to a phone. He could call for emergency help if he needed it, or see the nurse who came each week. No, said Thomas, he wanted to be in the camp. When we got to the camp, everyone else was away. I asked Thomas again if he would like to go to the reserve, at least to find other members of his family. ‘No,’ he said. ‘Better finish here.’ He went to his family’s tent and sat down at its entrance. He was tired and weak. I made a fire for him and put a kettle on to boil. I fetched a few pieces of dry meat so that he could eat whenever he was hungry. He sat very still, looking around, not saying much. As the fire blazed up and the kettle began to steam, Thomas said: ‘See the horses.’ I looked up and saw that the family’s horses were all standing close to the little group of tents. They had their heads low to the ground and seemed to be staring at us. I was astonished: the horses always kept their distance from the camp, moving far into the forest, doing their best not to be caught and ridden or loaded with packs. Every morning they had to be trailed into the woods and, often with some difficulty, herded back to the tents, where they could be tethered for use. Now they stood there, close, unmoving. ‘Horses they know,’ he said. ‘In my mind.’ I waited for a while, making sure Thomas got his tea and was comfortable. The horses stayed there, watching. Thomas died a few weeks later.
3 In 1988, during the filming of Hunters and Bombers, we interviewed Mary Adele Andrew, the mother of Alex Andrew, my Innu guide and interpreter. She was a large, energetic woman who had brought up a big family as a single parent – her husband had died when the children were still young. She had a strong inner warmth, a generosity of spirit that insisted anyone who came to her house must sit and eat whatever she happened to be cooking. I had been with her at a summer camp, and I knew how much she loved to be far away from the settlement, out on the land. I knew she would have a great deal to say about what had happened to her family, and to all the Innu she knew, as a result of having spent so much time stuck in Sheshashiu. Mary Adele sat at her kitchen table and talked to Alex. She spoke slowly, carefully, with great force. ‘These houses were built to trap us,’ she said. ‘They told us, “Stay here, you’ll get a house.” But it was a trick to get our children to go to school and to make sure we stayed in one place. It was a lie, so we wouldn’t see our land being destroyed. They hoped we wouldn’t say anything. They said when our children leave school, they’ll get good jobs. But nothing happened.’ Instead, the people had lost their real wealth, their real homes. Their land had been taken. The Church and the school, the priests and the government, had joined forces to do this. In one of our interviews, Elisabeth Penashue told us: ‘In the old days we used to revere the priests. They were powerful and said, “Don’t go
76 Before Agriculture
out on the land. Send the kids to school or you will lose your family allowance.” Parents were afraid. They made the children go to school. When a priest told us to do something, we did it. We listened to him as if he was Jesus.’ In defiance of these intense pressures, Mary Adele Andrew and Elisabeth Penashue, as well as some others, continued to spend as much time as they possibly could on their lands with their families. They were teaching the young how to live there, as Innu. It had been hard, and some had lost a great deal, but there was hope – so long as they could keep going onto the land. One day at a summer camp, where the women were baking bread in ovens they had scooped out of sand heated with large fires of driftwood, Mary Adele said: ‘On the land we are ourselves. In the settlement we are lost. That was the way they made our minds weak.’
4 European ‘discovery’ of the New World, those great adventures to the Americas as well as to southern Africa and Australasia, led to a set of theories about the peoples who lived in these lands. The theories, which disregarded hunter-gatherer economic systems, languages and belief, were underpinned by the idea that huntergatherers were not quite human beings at all.1 Articulate colonists of southern Africa in the 16th century declared that the Khoisan peoples they encountered at the Cape of Good Hope were ‘the very reverse of humankind … so that if there’s any medium between a rational animal and a beast, the Hotantot [sic] lays the fairest claim to that species.’ In Australia, Aborigines were classified as being at a midpoint on the evolutionary ladder, more a species of animal than human. When William Lanney, the last Aborigine of Tasmania, died in 1869, a struggle to get possession of his bones was fuelled by the belief that ‘he represented a last living link between man and ape’. In 16th-century Spain, the question arose as to whether or not the original inhabitants of the colonies in the Americas were ‘natural slaves’. The notion came from Aristotle, whom the Spanish monk Juan Gines de Sepulveda relied on for judging the rights of ‘the Indians’. A ‘natural slave’, according to Sepulveda’s interpretation of Aristotle, was a person whose inferiority and ignorance were such that only through servitude could the necessary human development be achieved. In Aristotle, this idea arose as part of a justification of slavery in Greek society; he sought to show that the slave’s opportunity to work in the master’s household was a chance to experience and learn the arts of civilization. Applying this to Spanish colonial rule, Sepulveda saw slavery as a necessary opportunity. The enslavement of the Indians of the newly conquered territories in South America, who lived far beyond Christian influence and teaching, was ‘natural’ – and it would bring them into the ‘natural’ joys and benedictions of the Christian Church. But slaves did not have the right to own property; those who did the
Mind 77
enslaving had the right to take all the land and compel its former inhabitants to work for them. Had it not been for King Philip of Spain, this quasi-Aristotelian justification for the dispossession of South American Indian peoples would have been long forgotten, a small footnote in colonial rationalizations of conquest and theft. In 1550, alerted by his legal experts to disagreements about the question of Indian rights to their lands, the Spanish king authorized a formal public inquiry – the first Royal Commission to deal with indigenous peoples. The inquiry took the form of a debate. On the one side was Sepulveda, very much the theorist: he had never set foot in the new colonies. He advanced the idea that these new peoples were ‘natural slaves’ and therefore had no rights that could restrict the claims of Spain’s conquerors and settlers. The other side of the argument was entrusted to Bartolomé de Las Casas, a monk who had spent 30 years in South America and lived close to indigenous peoples there. He had been among agricultural, imperial societies – not the hunter-gatherers of Amazonia – and he had been surprised by complex and, in many ways, familiar kinds of social institutions. Las Casas had written extensively about his experiences, arguing that the Indians of the colonies had systems of law and administration, as well as ideas of property and morality, that should be respected. The debate lasted almost two years; the king of Spain then took 18 years to decide which argument he would accept. In 1568 he gave his support to Las Casas’s point of view. Meanwhile, of course, Spanish policy and practice had been ruthless: Indians were deemed to have neither land rights nor souls. Some were enslaved, many were killed, and their lands were appropriated. Neither the sophistication of the Indians Las Casas described nor the vigour of the public debate in Seville moderated the conviction, shared by colonists and Christian missionaries alike, that these people had not yet reached the evolutionary level of real human beings.2 On the settlement frontiers of the North American colonies, the question of the Indians’ humanity was also raised. If the indigenous occupants of the lands to which settlers were moving were not humans, but roamed, rather, ‘as beasts of the field’, then they had no right to resist the new Americans’ ‘manifest destiny’ to take and use all new-found lands. It is easy to see that an insistence on people’s being something other than, or less than, human has been inseparable from the wish to occupy their lands. Doubts about an unquestionable right to appropriate land did effect some challenge to the theory of colonial expansion: legal justifications were sought to defend claims to new territories. At the frontiers themselves, however, colonists at times killed huntergatherers as if they were animals. Colonial governments licensed these murders by turning a blind eye, sometimes even condoning them as a suitable response to the ‘primitives’ and ‘savages’, whose want of humanity made them a threat to settlement. History records Aborigine hunts in Australia, the killings of Bushman families throughout southern Africa, attacks on the tribes of Amazonia, and relentless campaigns against the Indians of the American West. Early in the 19th century, the philosopher Hegel observed that the development of the American West
78 Before Agriculture
had cost some 2 million Indian lives – an outcome he deemed to be a necessary part of progress.
5 The assertion that some humans are not human – or are not human enough to have rights – is absurd as well as brutal. The Spanish conquistadores destroyed communities with elaborate agricultural and urban systems. They insisted that the Aztec were barbarous and undeserving of compassion, for they practised human sacrifice and cannibalism. In reality, the Spanish had arrived among people whose material wealth they wanted to plunder. The idea that the victims of this plunder were ‘savages’ was belied by the very thing the Spanish most wanted from them – the elaborate and magnificent creations of Meso-American artists, including worked silver and fine jewellery.3 In reality, explorers and adventurers arrived in the lands of societies that were at least equal to their own. Hunter-gatherers did not display abundant material goods or the technology of warfare, and they did not have the knowledge of mathematics, astronomy, engineering and textiles that was to be found in some indigenous societies of South America. But the Europeans who came ashore from those ships of exploration – dirty, malnourished and ill clad – encountered hunters and gatherers who showed all the signs of being well fed and healthy. The societies of these people were more stable and more secure than those of the explorers; they were also societies in which private and public well-being intertwined to ensure much fairer distribution of resources and greater social justice than the newcomers had ever experienced. But the representatives of ‘civilization’ did not hesitate to condemn as ‘savages’ the people who provided the food that kept them alive. These encounters between unhealthy newcomers and vigorous tribal communities began in the 1400s and continued until the beginning of the 20th century. Another such paradox is to be seen in the history of European ideas. While describing the peoples they were discovering as inferior beings and claiming their lands for themselves, European travellers and intellectuals also began to extol the moral superiority of the peoples who were being conquered, enslaved and dispossessed. Columbus’s description of the very first Carib hunter-gatherers he met includes a recognition that they are ‘so generous with all that they possess, that no one would believe it who has not seen it … and [they] display as much love as if they would give their hearts.’ Social philosophers made intellectual use of what they saw as life that existed in pure nature. Hobbes’s famous reference to life as ‘nasty, brutish, and short’ came from his imagining a society ‘with no place for Industry … no Culture of the Earth … no Arts; no Letters; no Society.’4 He wrote this in 1650, a critique not so much of the hunter-gatherer world as of the early capitalism of the England in which he lived. In subsequent centuries, philosophers as diverse as Vico, Montesquieu, Rousseau, Hegel, Engels and Marx5 made use of the idea of a
Mind 79
‘natural’ human condition both to criticize the societies of their day and to celebrate ‘innocence’ and ‘simplicity’ – a core of deep human goodness – in peoples whom we would now call hunter-gatherers. In one context, these newly discovered tribes were savages whose conditions gave them no rights to life, liberty or property. In another, they became symbols for the human potential for goodness, equality and freedom. These paradoxes point to the cynicism of the colonial project. The explorer Ralph Standish wrote in 1612 about the ‘savages’ he had met at the Cape of Good Hope.6 Given their want of human achievements, it was, he said, ‘a great pittie that such creatures as they bee should injoy so sweett a country.’ The countries of the new worlds were indeed ‘sweett’ to the farmers who wanted to make them their own. Inca and Aztec silver provided wealth for the impecunious monarchy of 17th-century Spain; extensive grasslands and forest offered at least a hope of wealth to the landless settlers who had reached the expanding edges of European empires. In each place colonists claimed as their own, they concocted justifications for dispossessing people and taking their territories. To say that those they encountered were not human was the most general – and, in its way, the simplest – device for depriving hundreds of cultures and millions of human beings of their rights.
6 When Anaviapik and Ulajuk raised the question of how southerners have seen the Inuit, they expressed a concern that must have puzzled, alarmed and at times oppressed many, if not all, hunter-gatherers. They have experienced the attitudes of settlers and settler governments towards them. They have felt the consequences of the judgement that they, the original inhabitants, are not entitled to their own lands, languages and ways of life. They know that this judgement is somehow connected to a refusal by the colonists to see that hunter-gatherers have minds – a refusal that sits at the centre of the history of colonial misrepresentation. The indigenous peoples of Canada have been forced to respond to a strong implication in modern legal theory that they do not qualify as fully human. This version of frontier racism has arisen in legal arguments about ‘aboriginal title’, the rights indigenous peoples may or may not have to their own systems, territories and resources. The legal and political actions that lie behind these contests over title are referred to in Canada as ‘land claims’. For a century, various aboriginal peoples have had to make these claims. After his election in 1968, Prime Minister Pierre Elliott Trudeau maintained a long colonial tradition by insisting that the nation’s Indians should be assimilated into the mainstream of national life. In 1971, Trudeau announced a change of policy from adamant rejection to circumspect acceptance of a land-claims process.7 This shift resulted from a judgement in the Supreme Court of Canada in what is known as the Calder case – an action brought by the Nisga’a people, who argued that they had aboriginal
80 Before Agriculture
title to their territories throughout the Nass Valley. Although the judges were split on the decision 3–3, the message was clear: aboriginal title did, after all, have some legal reality. Since then, arguments over who has which rights have been full of legal complexity. Land claims have at times appeared to define the nation.8 The term ‘land claim’ is itself an anomaly, implying that the onus should be on the original occupants to claim their homes, resources and territories from the colonists. This is a reversal of common sense; the burden of proof should lie with the newcomers. This reverse sense is a first indication of the onerous task indigenous groups have had to undertake. Their elders, historians and lawyers must find ways of satisfying criteria set by the Canadian courts for testing whether or not a claim can indeed be said to amount to a claim to aboriginal title. Litigants from hunter-gatherer and fishing societies have had to prove that: • • •
they use and occupy a definite territory to the exclusion of all other peoples; they have used and occupied the territory ‘since time immemorial’; they are ‘an organized society’.
These tests have arisen from accumulated precedents in cases that reach back to the 19th century. But each of the particular requirements for evidence has been confirmed by Canadian courts in the 1970–1990 era. The problems inherent in proving the first two requirements – exclusive use and occupancy – are severe. In many hunter-gatherer systems, there are imprecisions and overlaps of territory that unsettle the demand for boundaries and boundary maintenance that the colonial model requires. For oral cultures to prove continuity of land use beyond the present generation, to the satisfaction of courts that rely above all on first-hand experience and written documents, is also a daunting undertaking. The imposition of legal process and rules on the peoples the colonists have sought to dispossess makes it hard for hunter-gatherers to give evidence of their own kind in their own way. But the difficulties that arise with questions about use and occupation of land do not challenge the hunter-gatherers’ humanity. It is in the ‘organized society’ test that the deepest prejudices reveal themselves.9 What are the qualities by which society is judged to be organized? Rules and conventions of behaviour, shared economic practices, common religious beliefs and customs – these things are society. To speak of society is to imply organization. People who live without a shared set of values and rules cannot live as a people. The human condition is composed of social realities. And the central indication of this is language. Language and society are inseparable. Each is a necessary condition for the other. Children who grow up without any form of society do not learn to speak; human societies do not exist without language. The organization of the human mind requires a community of fellows who speak to one another, sharing and thereby teaching the words and rules that constitute the language. We know what words mean because they are used by a group of people to mean things. Society has
Mind 81
an existence because it is composed of people who share these meanings and who use them to share everything else that makes human life possible. To suggest that there are human beings who might live without ‘organized society’, therefore, is to say that there are human beings who live without society at all. To suggest that a people might live without society is to imply that they are living without language. And to imagine a people without language is to suggest humans who are not quite human. Think of an elder on the witness stand being quizzed about whether her society is ‘organized’. Are there laws? the lawyers ask. Do you have rules about your ways of using land? Do you collaborate? Do you live in anything that we can call a society? To experience this kind of interrogation is to endure scepticism about the obvious. The suggestion is that your people have not lived long on their lands, that they have not lived there in the belief these lands are indeed theirs and no one else’s, that they are not attached to these lands in any profound way, and that they do not have customs or beliefs uniquely their own. To answer these kinds of questions is thus to respond to insults. Aboriginal people who take the witness stand in land-claims cases often have an intense feeling of not existing; their history, their homes, the integrity of their grandparents are all contested. To be obliged to prove that which defines you is to have a sense that your very humanity is in question.
7 Imagine the crowded, roaring bar of the George on 96th Street, Edmonton, a Prairie city in the Canadian midwest. The George is a rundown beer parlour in a part of town where no one goes. No one, that is, except drifters, down-and-outs and hard drinkers. There are Indians, some hookers, winos from many backgrounds. It is a place to have friends who don’t ask questions, providing warmth that has nothing to do with family or home and a chance to lose any sense of weakness. The tables are crowded; the noise is a shrill mixture of shrieking laughter and shouted conversation; fights break out. A tough place. But for all its toughness, the men and women who come here are far more often generous to one another than they are belligerent. Everyone has almost nothing; people give out drinks, cigarettes, small change and advice about where to bum a hot meal. Everyone belongs because they have all chosen, for a while at least – maybe a week or maybe a year – to belong nowhere. I went to the George every day for a few months in the spring and summer of 1969. It was my first fieldwork in Canada and my first encounter, therefore, with ‘Indians’. In this and other bars, on street corners, in abandoned shacks and at the edges of a park, I talked and drank and laughed with men and women whose lives reached into the Plains of the Midwest, to the Pacific Coast and to the forests of the Subarctic. They spoke to me of spending time ‘in the bush’, away from ‘the white man’. Sometimes, at night, when a slight drunkenness had not yet given way
82 Before Agriculture
to incoherence, when sadness rather than defiance or humour was the mood of the moment, a few of those I knew best would tell me they would soon be heading home. But I was never sure what home meant or just how many of them would be able to get there. One of the first people I met in Edmonton was Harry. A tall, heavily built man of about 50, with the strong features of a Plains Indian, he was leaning on the wall outside the George, playing a harmonica. The music was beautiful – a bubbling of sounds, fast and rich, with a blend of tunes that I learned later was part Scottish and part Cree. It was the music of the fur trade, of the encounter between those who manned the trading posts and bought the furs and those who trapped and sold them. I stopped to listen. Harry watched me as he played, then paused and asked if I had a quarter to spare. ‘Sure,’ I said. I handed him 50 cents. He looked at the two coins, as if measuring their possibilities. ‘Good,’ he said. ‘Now you and me can go buy a few beers.’ Harry became my best friend on skid row. He was a good friend to have. Everyone knew him, and many took pride in his musical skill. He played the fiddle as well as the harmonica, and knew where he could go to find both cups of tea and instruments that he could borrow. He made money by busking on street corners, but only enough to fund more rounds of beer and the occasional bottle of cheap sherry. I suppose he was an alcoholic, but he never got rotten drunk, and he somehow placed himself at a distance from those who did. He was courteous and helpful, and a bit of a street-person social worker: he would take care of those who were most destitute, and he did what he could to prevent fights from drawing real blood. One Sunday, when the bars were closed and the skid row community broke into little clusters of people on street corners and vacant lots, Harry told me to come and hear some real music. He took me to a bootlegger who sold us a bottle of the cheapest sherry, then led me to an abandoned house a few blocks from the George. It appeared to be boarded up. But Harry knew a way in through a broken door to its basement. Down there, in the gloom, a group of men and women sat in a circle. A few bottles stood around, and one man was unconscious in a corner. We joined the group. No one said much, and then two or three people began to sing. Then another few people; a different song. It was Algonquian music, with drumbeat rhythms tapped out on a broken chair and the floor, the voices highpitched, the words a strange and haunting wail. The singers sat with their bodies hunched a little forward and their eyes shut tight. They strained to get the sounds right, to keep the rhythm, to take and keep themselves elsewhere. This was no longer skid row – or was it actually the very heart of skid row, where those who lived as marginals could be themselves at the centre of the white man’s city? The songs were separated by quiet pauses, a hand passing the bottle, a shifting of bodies, but no one spoke. After one of the songs, a young woman broke the silence and said to me: ‘Now you hear our minds, in our song. How come the white man says we have no mind? When they hear a Cree song, I guess they think it’s a coyote howling.’ Everyone laughed.
Mind 83
8 20th-century cameras have allowed us to look into the eyes of the wildest of animals. There is no corner of nature, however remote or small or dangerous, that does not appear in intimate proximity on television screens. At the same time, researchers into animal behaviour and its genetic sources are developing ever more sophisticated techniques for seeing the mechanisms and achievements of the natural world. There is a new kind of relationship, based on technical sophistication and the knowledge of experts, between humans and the rest of nature. Photographers and scientists are the wizards, if not the shamans, of our age, making revelatory journeys into places where, in the course of ordinary life, the rest of us cannot go. We rely on them to show us the world that is not human. This ever-increasing closeness to the natural world influences our sense of the dividing line between human and animal. We discover an unexpected complexity of animal systems and learn about the intricate links between one animal and another. We find that there are divisions of labour, with one part of an animal community raising newborns, others getting food, and others defending the group. We are shown the sophisticated behaviour required to capture or evade capture, elaborate forms of courtship, and myriad forms of communication. We discover that leaf-cutter ants make gardens and harvest crops; that gannets can recognize their own nests among a hundred thousand others; that humpback whales coordinate their fishing; that in some species, monkeys can warn one another about several different kinds of impending danger; that male fruit flies sing elaborate love songs to court females. These are occupations and purposes that we understand. They depend upon qualities, characteristics and motivations that humans also possess. Detailed portraits of the natural world again and again reveal similarities between humans and other beings. The evidence of DNA, with its apparent overlap of gene sequences between mushrooms and people, is the newest way in which the lines between us and the rest of nature can seem to be uncertain. This apparent blurring of the divide could also be seen as an echo of shamanism. Perhaps the boundaries around the human are less definite, more porous, than most scientists and many farmers have tended to suppose. Animal rights advocates often make this kind of argument; they point out that the use of animals for experiments, or even as food, depends on human beings keeping animals in a separate and inferior moral category. The promise of Genesis is integral to the domestication of animals and to their use as a resource. The exiles from Eden go forth and have dominion.10 In fact, real shamans – as opposed to those who provide wildlife programmes for television or make new-age forms of argument – say that humans and animals exist in separate domains. In the shamanic myths of very ancient times, humans and animals lived in the same circumstances, able to speak and procreate with one another. But these myths also tell of how ancient times yielded to an era in which the divide between humans and other creatures became much clearer. Indeed, the need for shamans, or for spirit possession, derives from the periodic need to cross
84 Before Agriculture
this divide. Hunter-gatherers and their shamans insist that life depends on maintaining the right kind of relationship with the natural world, and the negotiations necessary to sustain this relationship are difficult. The power of the shaman centres on this difficulty. By overcoming it, the journey can be made from human to animal and back again. This is the power that comes from transformation. When we look into the eyes of animals, be they pets or creatures that we hunt, cows and horses on the farm, dogs in our homes, or the subjects of wildlife documentaries, we seem to see thought. Animals watch, wait, appear to ponder. They look as if they are assessing one another’s movements in order to make sure that their own are safe or effective. They give many signs that they are thinking. In 1999, British television broadcast a wildlife programme made with a new level of film technology: it had become possible to film in almost complete darkness. The footage included sequences of lions stalking and killing their prey. They moved with great stealth, peering, watching, calculating, manoeuvring. Several individuals collaborated to approach and surround their prey; two remained still, one continued to move closer. Then, with great skill and precision, they made their attack. Were they thinking? Surely they must have been. To calculate in this way, to make decisions about how best to carry out the kill, must require some form of thought. Or is this so? It is very hard to imagine thought without language. And these lions do not speak; they have no more than the most minimal form of vocal communication. Their brains work without words. This wordlessness is integral to how we see animals. It arouses in us a form of gentle sympathy, an anthropomorphic kind of pity. It also means that, for all their ferocious killing of weaker species, we see animals as innocent. Those lions do not lie, because to tell a lie requires speech; they cannot be condemned for the cruelty of their ways, because morality arises only with articulate thought, in words. The lions show a kind of purity of judgement, rather like pure emotion. There can be no process of the kind that depends on thinking as a silent form of speech. Lions do not talk to themselves. When we look at them we see, rather, the strange dumbness of the animal as it thinks without thoughts. We see feelings that we recognize, of course: fear, excitement, even pride. These feelings also arouse our sympathies. But animals are untainted by the ambiguities and distractions and complexities of what humans know to be the heartland or even defining features of thought.
9 ‘What, then, is the difference between brute and man? What is it that man can do, and of which we find no signs, no rudiments, in the whole brute world? I answer without hesitation: the one great barrier between the brute and man is language.’ These are the words of Max Müller, among the first theorists of language, writing in 1875. Müller’s view has been shared by many others, including late 20thcentury scientists who have sought to identify the part of the brain where the
Mind 85
potential for language resides. Language theorist Derek Bickerton observes that language is probably ‘the antecedent of most or even all of the other characteristics that differentiate us even from our closest relatives among the apes’. The miracle of this ability to understand, use and make language is the miracle of being human. ‘Simply by making noises with our mouths, we can reliably cause precise new combinations of ideas to arise in each other’s minds.’11 There has always been a popular view, endorsed to some extent by Darwin’s ideas about language, that places the calls of birds and the cries of animals on a single spectrum of communication. This is to say that humans do the same as animals, except that they do it more and better. Yet the attempts of primatologists who spend years teaching a chimpanzee to recognize and in some way make use of four or five words, or the intensive efforts of marine biologists to decipher the communication systems of dolphins, are projects that seem to confound any claim that even the most intelligent of other mammals have anything like language. They communicate, but they do not have language. There is no equivalent of grammar or syntax; no parallel, therefore, to the way human children learn to speak. Animals do not do what humans call thinking. They may exist in a Zen-like state, where the brain works without self-consciousness (consciousness is also inseparable from words), but they are not thinking. This is why animals are outside moral judgements and why, also, they inspire such a sense of puzzlement. To look into their eyes is to see a creature with a brain. We see facial expressions and even gestures that are very like our own. Yet something is missing. We humans may be able to get a sense of animal ‘thinking’ from our remarkable capacity to make quite complex decisions without thought. The driver of a car who suddenly has to deal with an emergency is capable of making a quick set of decisions – changing gears and speed and direction – without any apparent thinking. Similarly, drivers of cars often have the experience of picking the route home without being aware of doing so. Actions of this and many other kinds are said to be unconscious, in that the thinking takes place somewhere other than where we are using – or are aware of using – language. The terms ‘mindless’ and ‘thoughtless’ indicate the significance of action that fails to proceed from the necessary mental processes: such behaviour is wrong, in either a moral or a practical sense, precisely because we did not think – that is, we acted without the benefit of words. In mythology and literature, creatures that are almost human are often monsters. Their animal characteristics are exaggerated in a symbolic manner: they represent the frightening power of the animal in ourselves. These creatures are somehow primitive or savage; they take human shape, yet are outside human culture. And their condition draws its most poignant qualities from their lack of articulate language. Prospero’s Caliban, Beauty’s Beast, King Kong, Marian Engel’s Bear. The stories in which such characters have greatest effect are those in which they are discovered to be innocent despite their apparent beastliness. They are without the guile of language. When human beings began to use language, their brain structure made an evolutionary leap of huge importance. The physiological difference between those
86 Before Agriculture
who spoke and those who did not may have been very small, a tiny fraction of the total brain. But once it was there, a divide opened up between human beings and all other animals, a divide that had immense and ever-expanding consequences. Language allowed human evolution to take a very different and much more elaborate path. In the absence of language, inheritance is limited to the gene pool. Parents pass on to their offspring a bundle of genes and very little else. But with language, they can pass on vast bodies of knowledge, moral codes, forms of social arrangement. And with language, it is possible to think. With thought, it is possible for each generation to transform knowledge and ideas, which are then passed on to the generation that follows. Once it had language, the human species spread throughout the world, from environment to environment, each group with its own ways of occupying territory, knowing about their land and ordering their lives in a particular region. In this way humans came to live in cultures – that is, in many kinds of articulate and organized societies.12 The human mind is this combination of language, thought and culture. The capacity to be human is inseparable from the capacity to think, be articulate and change life through words. The best-trained chimpanzee and the least-educated human being are far, far apart in linguistic skills. The one has nothing more than a tiny number of words it can use in restricted conditions. The other has grammar, syntax and hundreds of words that he or she can use in any circumstances. The human mind, at its least, is rich with potential that makes human evolution unlike anything else in history. All the mind’s capacities are shared by all humans, irrespective of any other consideration. Each culture may give rise to its own kind of mind. But mind is what gives rise to culture itself.
10 No one knows when human beings first used language. Homo erectus, the human ancestor who lived about 2 million years ago, used tools and has been declared by some archaeologists to have had many qualities that are more human than animal. But the kind of tools erectus used seem to have remained unchanged for about a million years, and the structure of its upper body suggests that it did not have the breathing system necessary for elaborate speech. As one scholar has put it: ‘If these ancient people were talking to each other, they were saying the same thing over and over again.’13 The evidence that does suggest language, where the tool kit is complex and changing and where the physiology of the upper body is consistent with the use of speech, comes from about 800,000 years ago. The dating of the acquisition of language, however, is less important in this context than the nature of the process. Did language appear through a long and gradual evolution, with lower levels of linguistic achievement giving way to higher levels? Or was the ability to use language a more sudden, cataclysmic event, or set
Mind 87
of events, which meant that humanoids became humans in a revolutionary change to the mind? The importance of this issue is very great. A slow process means that different peoples could have been at different levels of linguistic ability, or that languages with different forms of linguistic sophistication could have emerged and disappeared. A revolution means that a single evolutionary development created the mind of the original Homo sapiens, the ancestor of all modern human beings. Various kinds of evidence suggest an answer to this question. There is, first of all, what seems to have been a sudden explosion of human culture – the great spread of hunter-gatherer systems around the world, each with its own sophisticated and specialized technology. Then there is the evidence of language itself. What has been called ‘the language instinct’ turns out to be fundamental to the activity of all human minds, even those denied the normal means to develop language. Every child acquires or uses grammar, irrespective of the circumstances. And given even minimal language-learning opportunities, children begin to employ grammatical techniques with astonishing speed, soon applying linguistic rules and making their own sentences – ones that they could never have heard before. These findings suggest that the capacity for language developed in a short period of time and by means of a specific evolutionary leap – the ability to acquire and employ grammar. Some experts have argued that the ability to learn a language is ‘hard-wired’ into the human brain.14 By this they posit the existence of a faculty that serves as the language-learning element in the human mind. In other words, this is the capacity to be a human that all humans inherit; and it is this capacity each society then relies upon to build its particular array of knowledge, skills and norms. The immense evolutionary advantage that came with this hard-wired faculty lay in the way humans could think, know and distribute resources in collaboration with one another, in ever-changing ways. The social dimension of language is thus intrinsic to both its form and its opportunities. These pieces in the jigsaw of human prehistory can be assembled to show a picture of human beings living in groups that use language, and therefore thought, to deal with all their concerns. The universal qualities of mind mean that humans are able to learn one another’s languages. One person knows more or less than another. One person is more eloquent than the next. But all of us share the faculty that makes eloquence possible. Languages rely, of course, on the sounds that people make. Linguists have identified some 140 separate pieces of sound – the total for all the world’s ways of speaking. English uses about 40 of them; Norwegian, the most elaborate vocal system of all Indo-European languages, uses about 60; Inuktitut uses about 50; there are Bushman languages in southern Africa that use about 120. As one of the world’s most eminent linguists has said, the Bushman is ‘the acrobat of the mouth’.15 This wide range of sounds does not suggest that the sophistication of a particular culture has any links with the outward complexity of its language or languages. Nor are there differences in grammar that indicate any one language is more or less
88 Before Agriculture
evolved than another. The popular idea that some languages are ‘primitive’ is false. Each language has its own sophistication, but all share a basic level of intellectual achievement. The Khoisan languages, which may have the most direct links to the birthplace of language itself, have been despised by Europeans as ‘the chattering of monkeys’. In reality, the Khoisan use about 85 per cent of all language sounds. This is not to argue that their languages are more complex or can therefore achieve greater intellectual heights than those of other peoples. The point is that they are not less complex. There is no relative simplicity of language. The underlying faculty for language, the hard-wired component of the human brain, is universal: an ultimate equality of opportunity.
11 The brain struggles when it comes to thinking about thinking. Being able to speak, however, may have much in common with other kinds of human natural potential – to have arms, for example, or a particular arrangement of nerves. Noam Chomsky, the most influential modern theorist of language, has described an important implication of the similarity between the capacity for speech and other capacities: No one would take seriously the proposal that the human organism learns through experience to have arms rather than wings, or that the basic structure of particular organs results from accidental experience. Rather it is taken for granted that the physical structure of the organism is genetically determined.16
Chomsky makes this self-evident observation to support his proposal that the underlying feature of language – the thing in every human brain that makes language possible – is also a physical structure that is genetically determined. Chomsky situates the source of language, the piece or pieces of the brain that make language possible, alongside other faculties that are inherited rather than learned. In the same context, he goes on to ask: ‘Why, then, should we not study the acquisition of a cognitive structure such as language more or less as we study some complex bodily organ?’ According to Chomsky and other researchers, the speed at which a child’s vocabulary grows, and a child’s ability to use grammatical rules, are not influenced by teaching. Studies have found that attempts to correct children’s grammatical errors by repeating the correct form back to them are unsuccessful. Researchers looking at cases where parents corrected their children’s English found that this correcting ‘had no effect – if anything, it had an adverse effect – on the child’s subsequent development’. This research, and the discovery that children do not respond to being taught correct grammar, is discussed in Steven
Mind 89
Pinker’s remarkable book Words and Rules, which builds on many of Chomsky’s original insights.17 Pinker focuses attention on irregular verbs as indicators of how the brain acquires, builds and uses grammar. In this context, he looks at studies of identical twins, noting that ‘vocabulary growth, the first word combinations, and the rate of making past-tense errors are all in tighter lockstep in identical twins than in fraternal twins’. Pinker’s striking conclusion to a chapter centred on the relation between nature and nurture in language learning is clear enough: ‘Every bit of content is learned, but the system doing the learning works by a logic innately specified.’ This account of language learning establishes that every child inherits a fundamental set of characteristics prior to and independent of culture. These create the possibility of language and also set the limits to what can be taught. Findings from the modern heartland of linguistic theory are consistent with hunter-gatherer ideas of child raising and education, in which children are expected to develop in their own ways, at their own pace. Nature is relied upon to do its part in the business; the mind is expected to grow very much on its own. Pedagogy is viewed as of limited benefit at best, and as counterproductive at worst. Children learn when and what they are ready to learn. In Inuktitut, there is a linguistic indication of this faith in the extent to which human potential is hard-wired. When a person experiences extreme grief, he might say ‘Isumaga asiujuq’. ‘My isuma is lost; I am out of my mind.’ When Anaviapik’s son Inukuluk was talking about his experience of adult education and his struggle to ‘be a white man’, he began what he said with ‘Isumanguar’, ‘appearing or pretending to think’, which I translated as ‘I sort of thought’. And in many conversations I heard ‘Isumatuinnarpunga’, ‘I just thought’, a caveat that conveys the sense of the English words ‘It’s only my opinion’. The root isuma has many uses; they show it to be something that also has an independent existence. In Inuktitut, thought is tightly linked to the capacity for thought. When a child misbehaves or misunderstands, adults are likely to say ‘Isumaqijuq’, meaning that she lacks isuma, is without the necessary thought. It is striking that in this use of isuma, the child is no more blamed for this lack of thought, for having an undeveloped isuma, than she could be criticized for having short legs or a large nose. Everyone is aware of a child’s development, in body as well as mind. Comments are made noting progress. These comments are not judgemental, though they will, of course, have their effect. Social pressure comes from what a child hears said about her. Adults do influence the way a child learns, shaping aspects of character and affecting the rate at which many kinds of learning take place. But the Inuit trust that individual development comes from what goes on in the child, not from any systematic pedagogy. Isuma grows at its own pace. A child has the potential, and she will grow in her own good time. Once the capacity has developed, and there is a mind and language that expresses mind, then some children will learn better than others. External factors come into play, just as they do with the strength of arms and legs. But for hunter-gatherers, the individual mind is the thing that must choose to learn, develop, make decisions. Pressures from
90 Before Agriculture
others on that mind, according to the deep beliefs and social conventions of hunting peoples, are more destructive than instructive. The mind has the capacity to learn, and, left to develop on its own, it will do so. The place of thinking in Inuit ideas of psychological development, and the related ways in which the word isuma is used, offer many clues about Inuit society. Parents identify children with respected elders, trust children to know what they need, do not seek to manipulate who children are or what children say they want. This way of treating children tends to secure confidence and mental health. And Inuit child raising is inseparable from many aspects of interpersonal behaviour. Adults respect one another as separate but equal. This is the basis for cooperation – by respecting individual skills, judgements and knowledge, the strengths of the economy and the social order are shared. Isuma is the notion that underlies and unites many of these features of Inuit life, for it affirms that in crucial ways the development of isuma is independent of social manipulation and control. Embedded in this use of the word for mind is a view of mind itself. The work of Chomsky and Pinker and the Inuit use of isuma reveal the same truth: there is some logical and physiological antecedent to the cultural specifics of learning. In the hunter-gatherer reliance on individual egalitarianism lies the freedom for everyone to be themselves, and a confidence that the integrity of society – the respect that hunter-gatherers show to one another as well as to the natural world around them – will achieve the best results for both individuals and the group. The egalitarian individualism of hunter-gatherers is of a piece with a compelling theory of mind.
12 The linguistic theories of Noam Chomsky have been closely associated with the school of thought, or the theory of thought itself, known as structuralism. Structuralist theory originates with ideas about grammar and its relation to the structure of the mind, and it relies on the view that grammar has at its heart a logical principle akin to the law of excluded middle, the principle that nothing can be both X and not X at the same time. The merits of this approach to grammar may well be inseparable from the insights of Chomsky and others into universal grammar. But anthropology made structuralism its own with a series of assertions about a seemingly fundamental dichotomy between culture and nature. Beginning with these ideas as a way of looking at ritual and myth – seeing rituals and myths as expressing or mediating the need for humans to establish their cultures in defiance of nature – structuralist anthropology then proceeded to explore many other kinds of dichotomies, some of which resonated with the culture : nature paradigm. Man : woman. Dark : light. Raw : cooked. Upstream : downstream. Sky : earth. Sun : moon. Human : animal. The anthropologist who made the most elaborate play with pairs of opposites, and who originated the claim to see in them a clue to the nature of the human
Mind 91
mind itself, was Claude Lévi-Strauss. Lévi-Strauss’s followers in the English-speaking world were led by Edmund Leach, who for many years was professor of anthropology at the University of Cambridge. Their views became an orthodoxy. No ritual or myth, no piece of social life or sacred text was safe from a grid of interpretive dichotomies. This ‘structure’ was set out as if it were an explanatory reduction of social and intellectual life, a scheme that laid bare some primary meaning. When I first read Lévi-Strauss in 1967, I was impressed by the originality and apparent insight of his way of writing about both tribal and European cultures.18 In Tristes Tropiques and The Savage Mind, and then in his ever-burgeoning Structural Anthropology, Lévi-Strauss carried a generation of intellectuals on a wave of ideas that began with Cartesian philosophy and proceeded to overtake all branches of sociology and philosophy. This was work that addressed central questions about reason and mind, while taking the reader to tribe after tribe. Lévi-Strauss’s description of the Nambikwara, hunter-gatherers of the Amazon, was both compelling and poignant. Here were people whose material simplicity was matched by extraordinary cultural beauty, and yet they were disappearing from the world. His account of the myth of Asdiwal, collated from Nisga’a stories set in the Nass Valley, with its hero figure moving up and down the river and between the earth and the sky, was analysed into binary pairs as if it were underlain by a kind of mathematics of human consciousness.19 To read this work was to experience a sense of intellectual wonder, to feel that one was being led on a journey of remarkable discovery. Yet the journey was oddly frustrating, as if it passed through fabulous landscapes but never reached a destination. The ideas floated high above reality, circling; and many of us circled up there with them, not sure where we were or where we were going, in awe of the height, feeling uneasy, but not quite daring to land. Over the years, the magic of the journey faded; a sense of dissatisfaction remained. In retrospect, the trouble with the intellectual claims of structuralism is not hard to discern. To say that a tribal myth contains opposing elements, and that its structure is demonstrated by laying these out in a formal manner, revealing at the same time dichotomies that are otherwise obscure, is to explain nothing. The analysis may well claim that a reduction of these pairs shows them all to be expressions of the fundamental opposition of culture to nature. But what is the explanation being made of the myth? The myth expresses the core issue of all societies: to establish how human life seeks to separate itself from natural life. Or the myth expresses the deep nature of human mind, the structure of mind itself, where dichotomies lie at the heart of us all. But these are not explanations of anything. To say that a myth expresses the core of society and the nature of mind is to say very little. Myths and ritual are the products of language and society; it would be strange indeed if they did not give expression to them. Structuralism in anthropology is an elaborate and at times fascinating game. It looks scientific, for it has a direct link with scientific linguistic theory and follows scientific methods of exposition, deducing an underlying reality from social, verbal and textual surfaces. But there is no explanatory achievement that goes beyond an a priori assertion about the structure of mind and a somewhat tautological process
92 Before Agriculture
of deduction: the theory knows what it is going to find, then relies on a thorough but predictable exposition to find it. It is very striking that when Edmund Leach wrote about the Bible, and gave himself the task of explaining the nature of much of the text, he showed how a particular complexity of the stories is in the interest of a priestly class. Here is an explanation, but it is to do with function, not structure. A further objection to structuralism in anthropology is more down-to-earth. The use of binary pairs to create an analytical grid is at odds with the way in which indigenous cultures, starting with hunter-gatherers, achieve so much by avoiding dichotomies. Hunter-gatherers also reject any complete reliance on deductive reasoning. So the structuralist analysis that commits from its outset to display the inner workings of dichotomies is in a perplexing, and somewhat imperial, relationship to its subject matter. The anthropologist’s ways of thinking here occupy the intellectual territory, obscuring and ousting the people’s own modes of thought and discourse. An irony of Lévi-Strauss’s achievement is that it yields much more insight into his own culture, so centred on binary logic and attempts to create rational order, than into those of the tribes he examined. Postmodern work in literature and social science has emerged in part from frustration with this structuralist reliance on dichotomies and its attendant pseudoscientific qualities.20 These new approaches to history, culture and knowledge centre on meaning rather than on mind. And they pay close attention to the ways in which meanings themselves are constructed by the would-be analysers. Thus postmodernists deconstruct the accounts, be they myths or theories of myths, allowing presuppositions, intentions and colonial purposes to disclose themselves in whatever array of complexity or contradiction may emerge. It is easy to imagine the intertwining puzzle that this exercise in scrutiny can yield. The postmodern task is the analysis of analyses – an approach that can indeed yield insightful theories about theory. Its problems, like those of structuralism, stem from a failure to describe a world whose reality would be recognized by those who spend their days living in it. The deconstruction of hunter-gatherers has contributed to the view that they do not exist at all; they become, instead, a myth of colonial theory, a part of someone else’s ideology, or, at best, an edge of some other way of life. To those who live, or whose ancestors have lived, by hunting and gathering, this deconstruction must come as a surprise.
13 Let me return for a moment to dichotomies, this time to the pair of terms that I have relied upon not only for the writing of this book but in much of my thinking about the world. In my notes and letters, places where writing is not laundered for fear of critics, I have long used the pair of abbreviations h-g : p-g. These stand for hunter-gatherers and potato growers. This pairing began as a small and rather
Mind 93
obscure joke about the romantic appeal of hunter-gatherers in their vast territories opposed to the confined, harsh lives of peasants in their fields of potatoes. The joke – if it can claim to be more than a piece of grim and private humour – needs some explanation. I began anthropological work in the west of Ireland. I spent long periods of time living and working with men and women whose lives centred on small gardens and a few fields. This was an experience of peasant life. And all the notions and tensions of what it means to be a farmer in Ireland turned my attention to potatoes. The history of the families I knew, and the stories of their farms, had been shaped by the potato. Peoples’ attachment to their fields, their occupation of the hillsides and bogs and islets of the west coast, were made possible by potatoes. They could live on ever smaller areas of ground and still feed large numbers of children thanks to the potato’s remarkable productivity and nutritional value. The shattering of this system, the breaking of the cycle whereby each family would divide its holdings to allow the sons to inherit land, and in which sons and daughters would marry young and begin their own households, was the result of the potato famine of 1846–1851. The Ireland I knew had its roots in the changes after the famine.21 Not that the potato was gone; rather, it could no longer be the basis for an ever-increasing farming population. Modern Ireland was born of potato blight and a population that was declining fast. The language of modern Irish writing (some of James Joyce, Samuel Beckett, Sean O’Casey, Patrick Kavanagh, even Seamus Heaney) reflects all this, though I know there is a harking back to the ‘real’ Irishness of pre-famine days in Yeats and Synge. These Irish ‘traditions’ were of short duration, but the potato was always there. It shaped the harshness of the work and became the condition of both attachment to the farm and the inevitable emigration of so many to other places. The history of the potato in Ireland provided a chance to see, in stark and clear form, the reasons for and consequences of the exile from Eden. Here were peoples who were indeed enduring the curses of the God of biblical creation. They lived by the sweat of their brows, gave birth to many children, then had to go forth and multiply elsewhere. After living in and writing about Ireland, I travelled to the lands, lives and stories of hunter-gatherers. I have already described the intense feelings this gave me of making a journey to a very different kind of human condition. The immense landscapes were matched by human beings who seemed to be free and at home. I had made a move from the realm of troubled exiles to the other side of Eden. Through this move I was to discover a contrast that was both personal and anthropological: I felt liberated from the anxious inner landscapes of middle-class Europe, and I was able to experience the warmth and ease of people who have the deepest possible sense of being in the best of all possible places. So the h-g’s came to oppose the p-g’s, the hunter-gatherers the potato-growers. One absurdity of this construct is obvious enough. Potatoes came from the Americas, and were domesticated there, I would imagine, by peoples more in the hunter-gatherer mould than in any other. There must be a better agricultural
94 Before Agriculture
abbreviation, one that refers to some resource other than potatoes. The obvious candidate is g-g, grain-growers. At least this makes a childlike pun on the existence of the horse (gee-gee), though this is a creature that can leap across the divide – as, of course, it did when Indians in the Plains and the North-west got hold of horses in the 1600s. In fact, the h-g : p-g abbreviation, along with its alternatives, should be put aside so that other weaknesses of this dichotomy may be confessed. Hunter-gatherers rely on wild animals and plants. But there are many indigenous societies that depend on domesticated animals and crops – tribal peoples who are not hunter-gatherers. Relations between these two forms of indigenous economy are often marked by mutual suspicion and animosity, with tribal agriculturalists tending to despise their hunter-gatherer neighbours. James Woodburn, the British academic who has made some of the most important contributions to hunter-gather anthropology, summarized the kind of discrimination that huntergatherers have suffered from their pastoralist neighbours in southern Africa, noting that they tend to be described as ‘dirty, disgusting, gluttonous, ignorant, stupid, primitive, backward, incestuous, lacking a proper culture and language and even as animal-like, not fully human.’22 He goes on to explain how these attitudes are often accompanied by deep fears about the apparent exotic powers of huntergatherers. The important point here, however, is that the divide between agriculturalists/pastoralists on the one hand and hunter-gatherers on the other appears between indigenous societies as well as between hunter-gatherers and European settlers. Both the sociology and the colonial histories of Australia, North America and southern Africa justify, and can be illuminated by, some version of the h-g : p-g distinction. In the Americas, some indigenous agriculturalists developed the dense populations, severe inequalities and military aggression that I have linked to settler farming. Similarly, to reflect on the ancient history of Europe, where farmers occupied hunters’ lands millennia ago, is to contemplate the possibility of many mixed economic systems. Farming peoples moving into new lands would have relied on herds and hunting while they established fields and waited for crops to grow. Some hunter-gatherer societies, having exhausted their supplies of wild game, either adopted a form of agriculture or pastoralism or entered into complex dependence on neighbours who were farmers or herders. And hunters in many regions may well have tried to farm or make use of domestic animals as adjuncts to their hunting systems. The evidence of language, as I have said, argues that the farmers overwhelmed the hunters. But this does not mean that farmers were not also hunters or that the hunters, before being overwhelmed, did not attempt some farming. Anthropological accuracy requires, therefore, a great deal of caution about the hunter : farmer dichotomy. In reality, there is a possible spectrum of economic systems – with hunters at one end, farmers at the other, and many kinds of mixture in between – rather than two exclusive categories, some pairs of opposites that between them include all possible human societies. In this respect, the huntergatherer : farmer divide is itself a form of myth.
Mind 95
Nonetheless, I believe that within this distinction lies a set of intellectual and imaginative opportunities. Thinking about the place of hunting peoples in the human story offers an insight into the history of the world. It provides a parallel insight into the nature of the human mind. The destiny of the hunter-gatherer is both an external and an internal process, an issue for societies and for individuals.
14 The hunter-gatherer mind is humanity’s most sophisticated combination of detailed knowledge and intuition. It is where direct experience and metaphor unite in a joint concern to know and use the truth. The agricultural mind is a result of specialized, intense development of specific systems of intellectual order, with many kinds of analytical category and exacting uses of deductive reasoning. The hunter-gatherer seeks a relationship with all parts of the world that will be in both personal and material balance. The spirits are the evidence and the metaphors for this relationship. If they are treated well, and are known in the right way, and are therefore at peace with human beings, then people will find the things they need. The farmer has the task of controlling and shaping the world, making it yield the produce upon which agricultural life depends. If this is done well, then crops will grow. Discovery by discovery, change by change, field by field, control is increased and produce is more secure. The dichotomies of good and evil, right and wrong express this farming project: control comes with separating manipulable resources from the rest of the environment and working with determination and consistency against all that might undermine this endeavour. The differences between hunter-gatherers living before agriculture developed or beyond the later farming frontier, and small indigenous societies based on a mix of farming, herding, hunting and gathering, may not best be understood as issues of mind. As noted, ideas about spirituality and the boundaries between the physical and the metaphysical are shared by many indigenous societies, both huntergatherers and small-scale farmers. However, all agriculture depends on controlling and remaking the natural world, and farmers have the task of both defending their fields and finding new ones. These are social and economic reasons for relatively high levels of organization and aggression. It is no coincidence that in so many parts of the world, including regions where different indigenous systems live alongside one another, agriculturalists despise hunter-gatherers for being ‘primitive’ and hunter-gatherers complain that farmers are belligerent. In the colonial era of the past 500 years, ‘developed’ agricultural societies have launched themselves with particular ferocity against all other peoples, and have, in particular, sought new land in vast territories occupied by hunter-gatherers. However complex the overlap between different kinds of indigenous societies, the dichotomy of hunter-gatherer : farmer says a great deal about how the world and the mind have been shaped.
96 Before Agriculture
Two ways of being in the world yield two kinds of human condition, each with its own set of circumstances. History reveals that exponents of the one have made war on the other, and the world has changed accordingly. Yet these different ways of thought are, as potential, within everyone. Human beings can reach into themselves and find two versions of life, two ways of speaking and knowing. Internally, many people are torn between these two ways. Individuals are born into one or the other society, and therefore learn its particular skills and disposition; but nobody is born to be either. The potential for language, and therefore for thought itself, is a shared human characteristic. The specifics of the language that are learned – not language itself – are what embody the intellectual and personal characteristics of one or another kind of mind and society. What makes us who we are? Things we inherit, be they aspects of body or the hard-wiring of the mind. But language means that much of who we are does not lie within us as individuals so much as between us. The child is shaped by the society she lives in as a result of how others speak and behave towards her. All of us learn and live in relationships with one another: much of our reality lies in how these relationships take shape, function and maybe fail. Much of who people are comes from events and processes that are more than just internal and personal. And this is where we can see a particular importance of hunter-gatherer societies: they have established and relied upon respect for children, other adults and the resources on which people depend. If these relationships are not respectful, then everything will go wrong. The sickness of particular individuals, the failure of the hunt, the weather itself – these are all expressed in terms of relationship. The egalitarian individualism of hunter-gatherer societies, arguably their greatest achievement and their most compelling lesson for other peoples, relies on many kinds of respect. The hunter-gatherer achievement, however, is not a matter of mutually exclusive qualities. Every healthy human being has the potential for all human qualities; nobody develops one kind of strength to the complete exclusion of its opposite. To this extent we are all hunters and farmers. The differences between one kind of society and the other are therefore to do with balance. And the imbalance has arisen because farmers have achieved such complete domination over huntergatherers. Many hunter-gatherer societies have made accommodations to farmers and herders. In many parts of southern Africa and South America, hunter-gatherers have created gardens and become shepherds or farmworkers or suppliers of pots and spears. In North America, many became cowboys, and some worked as domestic servants. Modern hunter-gatherers have taken advantage of farmers to supplement their own resources, or they have looked to the new wealth of farmers to help them deal with the loss of land and the destruction of wild animals that the farmers’ arrival has caused. But in many places, in many ways, hunter-gatherers are not at ease with farming and herding ways of life. Again and again, the farmers, while using their huntergatherer neighbours as casual and cheap labour, complain about their ‘unreliability’.
Mind 97
The hunters want to go hunting; gatherers like to gather. Hunter-gatherers tend not to plan and manage surplus. They need food or money now, not in several weeks’ time. In the modern world, the hunter-gatherer often appears to be restless as well as poor. The genius of hunter-gatherers is not rooted in their readiness to learn from or to work for others, however widespread these attributes may be. The compelling expression of hunter-gatherer culture lies in the balance of need with resources; the reliance on a blend of the dreamer’s intuition with the naturalist’s love of detailed knowledge; and the commitment to respectful relationships between people. The hunter-gatherer within the modern, urban world is not extinct. Remaining hunter-gatherer societies continue to exhibit the qualities they have always possessed. And there are also hunter-gatherer points of view, beliefs and habits of mind within the farmers’ world, inside the nations and towns that the exiles from Eden have established and from which they continue to press outwards with a nomadic imperative. Some anthropologists have pointed to the presence of people who forage at the urban community’s social and economic margins – men and women, even some families, who make do on a day-to-day basis, relying on resources that are found here and there rather than earned from the routines of daily labour. This portrayal of the hunter-gatherer in the modern city accords with widespread images of hunter-gatherer destitution and landlessness. It speaks to loss rather than to achievement. But there are more optimistic views of the hunter-gatherer in the urban setting. Indeed, there are eruptions of the hunter-gatherer mind in the farmers’ world, as evidenced in the many voices raised in opposition to the unquestioned dominance of the agricultural way: protests against repressive order, bureaucratic planning, chronic inequality, patriarchal conceit, poisonous pedagogy and the denial of all that is essential to art. These are arenas in which a rival mind seeks expression and longs for its particular forms of freedom. Throughout the Western world, there are men and women who consciously choose low levels of material comfort and small numbers of children to avoid the need for large incomes, thereby pursuing lives in which they may survive without regular jobs and devote themselves instead to creative work and family life. This way of being encompasses a concern about the destruction of the natural world by the ever-growing pressures to reshape it in the interests of surplus and profit. And dissident voices within mainstream culture have long criticized the use of repression and violence both in maintaining social order and in raising children. In all these we can hear echoes of hunter-gatherer ideas and practices. Men and women galloping on horses across the countryside in pursuit of foxes; men with shotguns who fire at pheasants, grouse or partridges driven towards them by a line of beaters; those whose wealth allows them to trawl the seas for game fish in their powerful boats – these people may claim to represent the huntergatherer within us all. Yet their habits and minds are fixed firm to the farming condition. Their hunting, shooting and fishing is evidence of the very characteristics that agricultural development has exaggerated, with the help of capitalist and
98 Before Agriculture
industrial developments, to an extreme. They are suppressors rather than exemplifiers of the hunter-gatherer. They live by the systems of privilege and organization that are hallmarks of the agricultural mind. No: the hunter-gatherers in the heartland of the exiles, living in the nationstates of farmers and in the cities farmers have built, are opponents of the dominant order. They oppose hierarchy and challenge the need to control both other people and the land itself. Consciously or not, they are radicals in their own lives. At the least, they experience the tension in themselves that comes from a longing not to plan and not to acquiesce in plans; at most, they use a mixture of knowledge and dreams to express their vision. It is artists, speculative scientists and those whose journeys in life depend on not quite knowing the destination who are close to hunter-gatherers, who rely upon a hunter-gatherer mind. The visionaries in society are always there, and they are perhaps a part of us all. The agriculturalist mind and its economic order never quite obscure evidence of the hunters. Many people feel the strain of a way of life and a mindset that disallow all forms of improvisation and intuition. The controlling features of a life that has no place for the hunter-gatherer mind create a longing for spirituality and underpin many forms of protest, from Quaker ideals of equality to the call for deschooling society, from New-Age mysticism to concern about rainforests. There is a common experience of something being wrong that may receive real illumination from a much more direct acknowledgement of rival forms of mind. Rival forms of mind are, of course, reducible to rival forms of society – and, in the end, to the displacement of one kind of economy by another. Hunter-gatherers may well represent a need in all peoples to experience a profound form of freedom. But they are also within the social universe in a literal way: there are hunter-gatherer societies, along with other indigenous peoples, whose demands for cultural survival and actual territories are no less vociferous than they ever were. In every part of the colonial world, the issue of aboriginal rights is alive as an issue whose urgency and poignancy are augmented by the prospect of a final destruction. In Australia, Aborigines contest government and industrial invasions of their lands. There have been struggles in the courts, in political campaigns and on the land itself. Settlers still want to eliminate hunter-gatherer claims to the Australian outback. Aborigine organizations protest, and in some crucial places win, their right to their own way of life, their own heritage, their own place on the earth. In 1992, the Australian High Court established a common law principle of native title to native lands. In South Africa, the -Khomani San, the remaining Bushmen of the southern Kalahari, have managed to survive their complete displacement and dispossession, after 50 years of subsistence at the most destitute margins of South African farms and townships. With the fall of the apartheid system, these few survivors began a campaign for the return of their lands and for the right to live in whatever combination of social and economic systems they choose for themselves. In March 1999, the South African government accepted their claim and agreed to return some
Mind 99
50,000 hectares of original -Khomani San territory. In Amazonia, Colombian hunter-gatherers have been mapping their territory as part of new negotiations with the government, which has at last moved towards recognition of tribal rights to tribal lands. In Canada, the land-claims era that began in 1971 has led to a number of settlements that recognize hunter-gatherer heritage and lands. The Cree of the James Bay area in northern Quebec have managed to secure the basis for a huntergatherer economy in a large and complex settlement of their dispute over the flooding of much of their lands to create hydroelectric dams. The Inuvialuit of the western Arctic have negotiated a settlement of their claim to aboriginal title in a large area in the Mackenzie Delta and adjacent islands. The Gitxsan and Witsuwit’en have won much greater basis for their rights in the Supreme Court of Canada. The Nisga’a have reached an agreement with Canada that gives them a core of territory and extensive rights of self-government. And the Inuit of the North-west Territories have secured from the Canadian government a territory and jurisdiction that is based on the spread of their hunting territories in the eastern Arctic. This is the new territory of Nunavut – the most ambitious attempt in the history of the encounter between colonists and hunter-gatherers to secure coexistence at the frontier. These victories are all the result of modern political processes. They represent a small proportion of the struggles and claims that continue, in South America and Australasia, in Siberia and the US, in Australia, Africa and Canada. In all these places, there are indigenous groups who fight for their survival. The exiles from Eden, the nomads who roam the world looking for new places to settle, transform and control, must make common cause with these struggles.
15 Human activities have shaped the surface of much of the world. Farmers have effected the greatest changes, turning forests, deserts and swamps into fields and pastures. Hunter-gatherers have also shaped the world, but more subtly, intent on keeping it a place where wild plants, animals and fish can thrive. The displacement of hunters by farmers has meant less ‘land’ and more ‘countryside’. These different ways of moving on the earth reflect the economies and societies of different kinds of human being. The world is also shaped by stories. What people feel, know and need to pass on from generation to generation has existed in words: words that speak of how the world began, of how humans emerged in it and found both places to live and ways to deal with one another. Words are entitlement to these places. The stories of farmers, including the Creation as described in Genesis, give meaning to their ways of life. The stories of hunter-gatherers give meaning to theirs. These are different meanings, different kinds of stories. The history of the one has dominated and, to a large extent, silenced the other.
100 Before Agriculture
Many hunter-gatherer ways of knowing the world have disappeared, along with hunter-gatherer languages. These are rich and unique parts of human history that cannot be recovered. If the words are gone, so are the stories. A particular shape is lost forever. There are fears that hundreds more languages – many of them those of hunter-gatherers – will have disappeared within another generation. Each such case represents a harm that is inestimable: the cumulative loss of language constitutes a diminution in the range of what it means to be human. There is, however, a story about these stories that has its own importance. The encounter between hunter-gatherers and farmers is a history of loss to one kind of society, gain to another. For hunter-gatherers, some losses cannot be compensated. But the story itself is one form of compensation. If the world can acknowledge who hunter-gatherers are, how they know and own their lands, what the encounter with farmers and colonists has meant, then some restitution can be made. An inquiry into the fate as well as the achievements of hunter-gatherers is, in this regard, part of a story that hunter-gatherers need to tell and have told. Without the hunter-gatherers, humanity is diminished and cursed; with them, we can achieve a more complete version of ourselves.
Notes Full publication information for the sources cited in these notes is given in the references. In addition to the specific sources I refer to in the notes that follow, I have received help and inspiration from a wide range of Arctic literature. Some of this has been popular and anecdotal, as in the case of the work of Farley Mowat (which some would say is more literary than anecdotal). I have drawn on detailed ethnography, especially in relation to the central and eastern areas of the Arctic. No fieldwork proceeds without a background of writing by others that sometimes shapes and sometimes contradicts one’s own work. There is, of course, an extensive literature dealing with many aspects of Inuit archaeology, ethnography and social organization. The work that gives a particularly wide-ranging but detailed account of Inuit life across the Arctic is that of Knud Rasmussen, who, as the child of missionaries in Greenland, grew up speaking Inuktitut, and who therefore, when he became an explorer and ethnographer, had the rare ability to speak to the peoples he met in their own language. The results of his epic expedition across the Arctic were published in the Report on the Fifth Thule Expedition. The work runs to several volumes; Kaj Birket-Smith wrote some, Rasmussen others. I have always found volumes 4, 6, 7, 8 and 9 most compelling; they include shamanic stories, poems and vivid accounts of Inuit elders as well as a wealth of ethnographic detail. (It should be said, however, that Rasmussen has been criticized for taking liberties with some of his sources and oddly failing to give Inuktitut versions of all the stories he includes in the report.) Prior to Rasmussen’s Thule expedition, two other Arctic ethnographers of great importance were Vilhjalmur Stefansson and Diamond Jenness. Stefansson wrote a great deal, but his book My Life with the Eskimo draws together much of his work in a very readable form. Also, his Not by Bread Alone is a remarkable exploration of Inuit (and other peoples’) diets. Jenness’s most important ethnography is The People of the Twilight, in which he describes his stay with the Copper Eskimo of the central Arctic. Jenness subsequently became an influential member of the Canadian administration of northern affairs, and was associated with plans for relocating Inuit farther south, where, he proposed, they would
Mind 101 be able to take advantage of employment opportunities arising with new activity on the subarctic frontier. (Plans of this kind for the most part failed very quickly.) 1
2 3
4
5
In Frontiers, a book that looks at the web of intergroup conflicts that constitutes the early history of the southern African Cape, Neil Mostert gives many details about how both settlers and Xhosa herders thought about and behaved towards Khoihoi and San peoples. The quote I use is from comments made by John Ovington, master of the Benjamin, on seeing the Khoihoi of the Cape in 1693. The words of Pyrard de Laval, written in 1610, are also revealing: ‘Of all people they are the most bestial and sordid… They eat … as do dogs … they live … like animals’ (Frontiers, p108). The fate of Tasmania’s hunter-gatherers is described in Mark Cocker’s Rivers of Blood. See p115ff and p127 for the quotes I use. The literature reveals many voices that concur in their suggestion that the ‘savages’ Europeans encountered during the early years of exploration and colonization were not quite human. Of course, many societies and nations dehumanize their enemies and competitors. Yet to say that men, women and children who have languages, beliefs, clothing, implements and art are nonetheless something other than human is both strange and troubling. When aboriginal women are also the objects of sexual desire and the bearers of colonists’ children, the suggestion that they are not human appears to be as ridiculous as it is grotesque. All the more striking, therefore, to find it occurs in so much commentary by settlers and explorers as they arrived in new frontiers. There are, of course, some counterexamples, among which are the observations in G. F. Lyon’s Private Journal about the Inuit of the Igloolik area, whom he visited often when icebound in north Hudson Bay in the 1820s. Lyon was impressed in many ways by the people, whose snowhouses he visited, and who, in turn, visited Lyon’s ship. Yet even in these sympathetic and seemingly accurate reports, there are troubling descriptions of the Inuit visitors’ taste for sugar and salt and their reactions to liquor. An account of the Las Casa/Sepulveda debate is given in Lewis Hanke’s Aristotle and the American Indians. There is also an article on the subject in Thomas Berger’s A Long and Terrible Shadow. Mexica (or Aztec), Maya and Inca societies constituted the ‘high civilizations’ of the Americas. The Mexica world – including its use of human sacrifice – is described by Inge Clendinnen in her book Aztecs. Marvin Harris’s Cannibals and Kings documents, and speculates about the rationales for sacrifice and cannibalism in the region. It is important to emphasize here again that Aztec society was very distant from hunter-gatherer modes of life. Thomas Hobbes’s famous dictum about life being ‘nasty, brutish, and short’ comes from his Leviathan, first published in 1651. For a compelling account of how the philosophical views of both Hobbes and John Locke related to the development of capitalism, see C. B. Macpherson, The Political Theory of Possessive Individualism. Vico, writing in the 1740s, sought to create a philosophy of history and a theory of knowledge in which the artefacts of humans (from chairs to social and economic events) could be known with certainty – unlike the creations of God (i.e. the natural world), which could not thus be known. His speculations about a ‘savage state’ rather surprisingly include a theory about a transition from hunters to herders, representing a shift from ‘bestial wandering’ to a reliance on pasture. Vico’s work is cited in Alan Barnard’s essay ‘Images of hunters and gatherers in European thought’. The idea that human beings are born free and then enslaved by the evils of civilization is associated with Rousseau and the romantic tradition within the Enlightenment school of philosophy. But Hugo Grotius, the Dutch theorist of law, noted in the early 1600s that ‘foragers’ lived ‘without toil’, and Engels, writing in the 1880s, saw in hunter-gatherer systems evidence of both ‘primitive communism’ and matriarchy. In this regard, Engels’s Family, Private Property and the State stands as a fascinating attempt to use anthropology as the basis for a social critique of 19thcentury society. For a review of the history of this issue, see Alan Barnard, op. cit., pp375–383. Barnard also quotes Montesquieu’s 1748 De l’esprit des lois; Hegel, writing in 1820; and Marx, writing in 1857 (pp378–379).
102 Before Agriculture
6
7
8
The question about where a theory of hunter-gatherer society (albeit not always thus named) arises in European intellectual history can perhaps be answered by examining the purposes such a theory may have served. In his paper ‘On the origins of hunter-gatherers in seventeenthcentury Europe’, Mark Pluciennik of the University of Wales speculates about these purposes (see note 20). Ralph Standish is quoted in Neil Mostert’s Frontiers (p108). Mostert also quotes a Reverend Terry, who wrote in 1616 of the Khoihoi that they were: ‘Beasts in the skins of men rather than men in the skins of beasts’ (pp107–108). In fact, Khoihoi were pastoralists, relying on herds of fat-tailed sheep; early settlers, however, did not make a significant distinction in their judgement of degrees of human development between Khoihoi sheep herders and San (or Bushmen) hunter-gatherers. Mostert writes very compellingly of the relationships between early settlers – black and white – and the San, describing both the degree of dependence that settlers had on San knowledge and the low level of humanity to which the San were nonetheless consigned. He quotes the South African historian George MacCall Theal as representative of his time in observing that Bushmen habits ‘were not much more elevated than those of animals’, and that it was difficult to conceive of a human being ‘in a more degraded condition’ (pp31–32). The Trudeau government’s position on the place of Indians in Canadian society was first set out in a 1969 white paper, issued on the authority of the then minister for Indian Affairs, now Canadian prime minister, Jean Chrétien. The white paper argues that there should be a gradual ending of treaty rights of Indians, and that the dissolution of their reserves and related special status would be an appropriate and necessary form of development. This position caused outrage throughout the country’s aboriginal communities, mobilizing a newly radical form of First Nation politics. The Calder case entered the courts in the same year, reaching the Supreme Court (after comprehensive defeats in the two lower courts) two years later. The shift in Trudeau’s policy may be said to have resulted from the combined impacts of the new Indian politics and the Supreme Court judgement. In fact, the Calder case was not the first such consideration of aboriginal rights in Canada. Its significance lay in the Supreme Court’s split decision – the sign of a changing legal atmosphere. The sequence of events, and the uses of evidence, that determined this atmosphere are set out in Dara Culhane’s The Pleasure of the Crown (see especially pp72–89). Culhane quotes the Canadian historian Peter Kulchyski, who has observed that the legal forum is a strange and even incoherent one for resolving issues of rights. Kulchyski comments that the history of the court cases is often one of ‘losses and gains, of shifting terrain … a history where the losers often win and the winners often lose’ (Culhane, p73). The modern case that most clearly defined the test for aboriginal title and right in Canadian courts was Baker Lake v. the Crown. This case also led to a view that aboriginal people could only claim rights to resources they actually use. This created uncertainty about the question of resources people did not know about in their territories, for example, minerals, oil and gas. The judgment in Baker Lake suggested that if people did not know about their assets and were therefore not using them, they had no rights to them. The Delgamuukw case, which reached the courts in 1994 and was decided in 1997, has led to a redefinition of the tests, and recognizes much more of indigenous peoples’ potentially inherent rights in all aspects of their territories, including the potential for development without reference to particular use. One of the issues that Degamuukw settled was the depth of time that evidence must show. It ruled that for title, the relevant date was 1846; for rights (i.e. use and resource, including fishing, hunting and gathering), the date should be time of first contact with Europeans. The St. Catherine’s Milling case of 1885 is an early judgment that has been brought to bear in modern land-rights cases. It is important because it speaks to which agency has the right to extinguish aboriginal title, the federal or provincial Crown. It also speaks to the consequences of extinguishment. It is not a case, however, that establishes a precedent for any protection of aboriginal rights or titles to either land or resources.
Mind 103
9
10
11 12
13
The earliest case that does address the nature of aboriginal rights, and which also bears on modern cases, was decided in Southern Rhodesia in 1919. Judgment in this case introduced the notion that you could have aboriginal people who roam and have no society, and therefore led to the requirement that native litigants show they have an organized society. It was here that the idea that human beings can be placed at different levels of an evolutionary ladder entered into modern jurisprudence, with the attendant notion that some peoples are so low on this ladder – as evidenced by their way of ‘just wandering around’ – that they have no rights to lands or resources. (See Dara Culhane’s The Pleasure of the Crown for these and other cases, especially chapter 6.) The ‘organized society’ test depends on the idea that some humans are not humans. This is socialscientific nonsense, of course, and originates in an attempt to justify expropriation on racial or cultural grounds. At the end of the 20th century this was given the name ‘ethnic cleansing’ – a new term for what many hunter-gatherers have long experienced. Biologists spend a great deal of time testing the intelligence of many species, from rats and pigeons to chimpanzees and parrots. Many forms and levels of intelligence are described as a result of this research. But biologists who assess the achievements of animals in experimental tests, or measure their speed and effectiveness at learning new skills, are not creating models of internal linguistic abilities. It may be that some human actions that we believe arise from consciously made decisions, processed in language, are more directly controlled by our genetic hard-wiring than we would like to admit – though this is an area of ongoing contention. The central point is that what happens with language, and therefore in the mind, pertains to a uniquely human form of intelligence. The observation on apes is from Derek Bickerton’s Language and Human Behaviour, p7. The quote about noises from our mouths is from the first page of Steven Pinker’s Language Instinct. A question arises in relation to the spread of humans across the world: what was the process that resulted in so many different languages? Linguists have identified correlations between the length of time a society is isolated from its neighbours and the evolution of a distinct language. By analysing vocabulary and grammar, it is possible to analyse links between peoples and even sequences of movement. The human geographer James L. Newman has suggested that farming, by causing people to settle in scattered but definite places, increased the degree of isolation between communities. He uses this to explain the multiplicity of agricultural languages in, for example, much of Africa (see his Peopling of Africa, especially p4). Obviously hunter-gatherers settled in large territories giving rise to a language map with accordingly large areas in which people speak the same language. But where one hunter-gatherer society’s territories meet those of another hunter-gatherer society, languages differ – sometimes at the level of dialect, sometimes at the level of language family. The boundary between Athabaskan and Algonquian speakers in subarctic North America, for example, suggests deep conservatism with regard to language, despite closely related economic systems. Similarly, a map of languages for the North Pacific Coast would show great varieties of languages in relatively small regions. The region that came to be California once contained approximately 80 different aboriginal languages. By comparison, the spread of Indo-European languages is a homogenizing process resulting from farming. It may be that when it comes to the variety of human languages, Newman has attributed to agriculturalists some of the features of hunter-gatherers. The quote comes from Desmond Clark of the University of California at Berkeley. It is cited in a summary of the findings pertaining to Homo erectus and language in Robin McKie’s Ape/Man (pp82–84). McKie reviews the evidence for the links between language and Homo Heidelbergiensis on pp122–124. In fact, the evidence he gives of humans who probably had language comes from European sites. Much related evidence argues strongly in favour of the view that these language users in Europe came from somewhere in Africa, and that their dispersal was itself a result of speech. This means that the date of Heidelbergiensis is a very late date to use in pinpointing the beginnings of language. The matter remains unresolved, but it would seem reasonable to say that our ancestors made the evolutionary step necessary for language at least 1 million years ago.
104 Before Agriculture 14 The process by which human beings acquired language is bound to involve speculations about the nature of evolution, the structure of the human brain and the functional advantages of language itself. The science that pertains to these things is constantly evolving. An account of the evidence, and the state of the relevant scientific art, is to be found in Steven Pinker’s Language Instinct. Pinker reviews the results obtained by experts who have attempted to teach apes to use language (see pp335–349), revealing how unsuccessful these attempts ultimately are as language learning, then considers evolution and the probably development of a hard-wired faculty for language in human brains (p349ff ). On the question of how long it took for humans to evolve language, he notes: ‘We expect a fade-in, but we see a big bang’ (p343). 15 Anthony Traill made the observation that San speakers are ‘the acrobats of the mouth’. His essay ‘!Khwa-Ka Hhouiten, The Rush of the Storm’ offers many insights into both the nature of San Language and the causes of language loss. I am grateful to the ethnolinguist Nigel Crawhall for details about the sound elements in different languages (personal communication, 1999). 16 Noam Chomsky’s work on language began in the 1950s and continued into the 1970s. The quotes here come from Reflections on Language. These passages are quoted at greater length in Steven Pinker’s Language Instinct, pp22–23. 17 This issue is discussed in Steven Pinker’s Words and Rules (p198), where he cites the work of Arnold Zwicky, James Morgan, Lisa Travis, J. Tooby and Irven DeVore. For Pinker’s comments on grammar learning and identical twins, see Words and Rules, p203. For Pinker’s concluding remarks, see p210. 18 Lévi-Strauss first wrote about the Nambikwara in the 1940s. He contributed an essay to volume 3 of the 1948 Handbook of South American Indians. The first edition of Tristes Tropiques was published in 1955; it was translated into English as A World on the Wane, first published in 1961. The Savage Mind (La Pensée Sauvage), published in French in 1962 and in English in 1966, is the book of his that had the most widespread impact on European intellectuals. Lévi-Strauss’s work on kinship and totemism, especially Les Structures elémentaires de la parentée and Totemism, published in 1962 and 1963, respectively, examined core questions of anthropology. 19 The Lévi-Strauss version of the myth, which takes place in the Nass Valley in Nisga’a territory (though Lévi-Strauss identified it by the broader term Tsimshian, now used to refer to the language family of the region), was drawn from written accounts. His analysis of the myth, ‘The Story of Asdiwal’, was published with an accompanying essay by Edmund Leach, in which Leach gave himself the task of explaining and celebrating structuralism to English anthropologists. Neither Lévi-Strauss nor Leach ever did fieldwork in the region. 20 In his paper ‘On the origins of hunter-gatherers in seventeenth century Europe’, Mark Pluciennik of the University of Wales suggests that the new science of political economy divided human society into hunters, herders and farmers as part of a need to rationalize and justify individualism, inequality and the unquestionable obligation of labour. Natural laws were sought that would show that certain kinds of individual owed service to society but could not expect to be an equal member of it. Pluciennik suggests that the purported ‘laziness’, ‘ignorance’ and ‘inferiority’ of ‘savages’ was useful to this project because it laid a ‘natural’ foundation for hierarchy and the possibility of fundamental differences among people. He also suggested that these categories – hunter, herder and farmer – are contingent and heuristic: they were invented to meet a particular intellectual and political need, and are not grounded in sociological or anthropological reality. A difficulty with this reductionist account of the categories lies in the extent to which they are to be found in other languages and times. At the Cambridge conference where Pluciennik put forward his view that the categories belonged to 17th- and 18thcentury social theory, not to reality, James Woodburn pointed out that the same categories are to be found in the Bantu languages of southern Africa, with a provenance far from the political economists of 17th-century Europe. Woodburn also observed that these categories correspond to what people can most readily observe. Hence it is not surprising to find that a distinction between hunter-gatherers and the herders or farmers who are their neighbours is of great importance to both the hunter-gatherers and the agropasturalists themselves.
Mind 105 21 The history of peasant life in Ireland has yielded a number of ‘traditions’. In reality the domination of peasant families by landlords seeking to maximize rents created the Ireland that is most often said to be ‘traditional’. This is the peasant life described in Conrad Arensberg’s Irish Countryman, then in Conrad Arensberg and Solon Kimball’s famous Family and Community in Ireland. This particular peasant society, whose features made it so vulnerable to potato blight, developed in the period between 1700 and 1850. An ancient Irish society, reaching back to Erse myths and the ‘golden age’ of Irish ruling families, was destroyed by British invasion, beginning in the 13th century and ending with Cromwell’s conquest of Ireland in the mid-17th century. I discuss Arensberg and Kimball’s sociology in Inishkillane, pp4–7. The literature of Ireland is not to be reduced, of course, to a reflection of any single aspect of Irish (or any other) history. Yet there is a connection between the moods of much Irish writing and the successive transformations and disasters in the history of the country’s peasantry. This idea is something I use throughout the text of Inishkillane, setting literature alongside sociology. 22 James Woodburn’s summary of attitudes to hunter-gatherers in southern Africa is in his essay ‘Indigenous Discrimination’. There Woodburn details a set of negative attitudes that their neighbours appear to hold towards hunter-gatherers, then goes on to identify reasons for the discrimination. This includes the appearance of hunter-gatherers in the eyes of agriculturalists or pastoralists, with a related identification of hunter-gatherers with the wild, and the apparent absence among hunter-gatherers of institutions of authority and social control. Woodburn also cites evaluations of hunter-gatherers that are ambiguous or even positive, identifying the extent to which they are believed to have exotic powers; but he adds a fascinating observation about the extent to which in Africa and many other places, ‘there is a fear that those who are weak and impotent have mysterious supernatural powers which threaten those who exercise power. Power holders tend to be ambivalent about their right to power, wealth and prestige and they fear that resentment of those who lack power, wealth and prestige may mysteriously threaten their health, well-being and prosperity.’ He adds that hunter-gatherers can, at times, use this fear to redress some of the political imbalance between themselves and others. Other writing by James Woodburn that bears on these issues includes the introduction he co-authored with Alan Barnard to Hunters and Gatherers and his essay ‘Egalitarian Societies’.
References Barnard A. 1999. Images of hunters and gatherers in European thought. In Lee R B and Daly R (eds). The Cambridge Encyclopedia of Hunters and Gatherers. Cambridge University Press, Cambridge, pp375–383 Berger T. 1991. A Long and Terrrible Shadow: White Values, Native Rights in the Americas, 1491–1992. Douglas & McIntyre, Vancouver Bickerton D. 1996. Language and Human Behaviour. University College, London Brody H. 1973. Inishkillane: Change and Decline in the West of Ireland. Allen Lane/Penguin, London Chomsky N. 1975. Reflections on Language. Pantheon, New York Clendinnen I. 1991. Aztecs: An Interpretation. Cambridge University Press, Cambridge Cocker M. 1998. Rivers of Blood, Rivers of Gold: Europe’s Conflict with Tribal Peoples. Jonathan Cape, London Culhane D. 1989. The Pleasure of the Crown: Anthropology, Law and First Nations. Talonbooks, Burnaby, BC Hanke L. 1970. Aristotle and the American Indians: A Study in Race Prejudice in the Modern World. Indiana University Press, Bloomington, IN Harris M. 1977. Cannibals and Kings: The Origins of Cultures. Random House, New York
106 Before Agriculture Lévi-Strauss C. 1948. The Nambokwara. In Steward J (ed). Handbook of South American Indians. Smithsonian Institute, Washington DC, 465–486 Lévi-Strauss C. 1955. Tristes Tropiques. Translated by John Russell as A World on the Wane. Hutchison, London (1961) Lévi-Strauss C. 1963. Structural Anthropology. Allen Lane/Penguin, London Lévi-Strauss C. 1967. The story of Asdiwal. In Leach E (ed). The Structural Study of Myth and Totemism. Tavistock Productions, London, 1–40 Lyon G F. 1824. The Private Journal. J. Murray, London McKie R. 2000. Ape/Man: The Story of Human Evolution. BBC Worldwide, London Macpherson C B. 1964. The Political Theory of Possessive Individualism: Hobbes to Locke. Oxford University Press, Oxford Mostert N. 1992. Frontiers: The Epic of South Africa’s Creation and the Tragedy of the Xhosa People. Jonathan Cape, London Newman J L. 1995. The Peopling of Africa. Yale University Press, New Haven and London Pinker S. 1994. The Language Instinct: The New Science of Language and Mind. Penguin, London and New York Pinker S. 1999. Words and Rules: The Ingredients of Language. Weidenfeld and Nicolson, London Pluciennik M. 2000. On the origins of hunter-gatherers in seventeenth-century Europe. Paper presented at Global Hunters and Gatherers: After Revisionism, Department of Archaeology, University of Cambridge, May Traill A. 1996. !Khwa-Ka Hhouiten Hhouiten, the rush of the storm: The linguistic death of the/Xan. In Skotnas P (ed). Miscast: Negotiating the Presence of the Bushmen. University of Cape Town Press, Cape Town, 161–185 Woodburn J. 1981. Egalitarian societies. Man 17, 31–51 Woodburn J. 1988. African hunter-gatherer social organization: Is it best understood as a product of encapsulation? In Ingold T, Riches D and Woodburn J (eds). Hunters and Gatherers: History, Evolution and Social Change. Vol 1. Berg, London, 31–64 Woodburn J. 1997. Indigenous discrimination: The ideological basis for local discrimination against hunter-gatherer minorities in sub-Saharan Africa. Ethnic Studies and Racial Studies 20(2), 345– 351
4
Environmental and Health Benefits of Hunting Lifestyles and Diets for the Innu of Labrador Colin Samson and Jules Pretty
Background to the Sedentarization of the Innu The Innu are Algonquian-speaking people of the Labrador-Quebec peninsula. For some 8000 years, they and their ancestors were permanent nomadic hunters ranging over an area the size of France. In the boreal forests and tundra of the interior of the peninsula they hunted caribou, including the vast George River herd, as well as bear, marten, lynx, fox, beaver, otter, muskrat, partridges, ptarmigan, ducks, geese, several species of fish and occasionally seals in the coastal bays. Archaeological evidence suggests that the ancestors of the Innu also had a maritime element in their economy and that the ancestors of the Innu moved inland to concentrate on caribou hunting following Inuit expansion to the Labrador coast around 1300 (Loring, 1997, 1998; Loring and Ashini, 2000; Loring et al, 2002). But from the 1600s onwards, the Innu way of life was gradually reshaped following contact with European colonists and by subsequent pressures placed upon it by missionaries, fur traders and the Canadian state (Leacock, 1954, 1995; Henriksen, 1973; Samson, 2003a). In the mid 20th century, the Indian Act was implemented in Quebec and those Innu coming to trade at the various posts, which eventually became villages, were registered and officially regarded as domiciled there. In Labrador, the focus of this study, the provincial authorities initiated an aggressive assimilation campaign soon after Newfoundland joined the Canadian confederation in 1949. This resulted in the sedentarization of Innu hunting families in the late 1950s in the village of Sheshatshiu, on the opposite shore to the North West River trading post on Lake Melville in Central Labrador, and in Davis Inlet (or Utshimassits) on Iluikoyak Island, across from the old Davis Inlet trading post on the north Labrador Reprinted from Food Policy, Vol 30, No 1, Samson and Pretty, Environmental and health benefits of hunting lifestyles and diets for the Innu of Labrador, pp1–20, Copyright (2006), with permission from Elsevier.
108 Before Agriculture
coast in 1967. Davis Inlet is now abandoned following a further relocation of the Mushuau (or ‘tundra’) Innu to Natuashish on the mainland in 2003. Today, there are some 18,000 Innu in Labrador and Quebec, of whom some 2100 live in the two villages in Labrador (Indian and Northern Affairs Canada, 2005a, 2005b). Sedentarization inevitably undermined the relationship of the Innu to their hunting culture, because mobility was central to its efficiency (Loring, 1997, p198) and the land provided the basis for their social, economic and religious ideas and practices. As with other indigenous people across North America, ‘breaking the Indian relation to the land had concrete as well as symbolic significance’ (Rogin, 1987, p155). The vast interior of Labrador-Quebec suddenly became free of mobile populations. Severing the relationship between people and land was then an important precursor to natural resource exploitation and extraction for timber, energy and minerals (Samson, 2003a, pp86–96). In addition, placing the Innu in villages also had vast symbolic value, as the authorities saw it as a measure of their integration into Canadian society. At the centre of the sedentarization project was the conversion of the Innu not simply to Christianity but to a Western and modernist worldview. Formal schooling was central to the goal of making Innu think more like Canadians and, it was thought, eventually helping them accept the change from subsistence hunting to lives of paid wage labour. However, to date no reliable source of wage labour has been found for the Innu, and most families survive on welfare payments. With the exception of a few individual political leaders, Innu are at best peripheral to all decisions about economic development and the environment in Labrador. Most employed Innu work in the government-created institutions of the villages. Only a handful work in Goose Bay or in resource extraction industries, such as the Voisey’s Bay mine, 75km north of Davis Inlet. These latter jobs primarily offer sporadic and temporary employment. Similarly, experiences of the Innu around Bersimis (Charest, 1982, pp421–422) and Schefferville, both in Quebec, indicate that only a handful were employed in hydroelectric and mining projects respectively, and then only at low levels on below-average salaries. Instead of employment, sedentarization has been accompanied by an increase in heavy drinking, suicide, solvent abuse and sexual abuse (Samson et al, 1999; Samson, 2003b). Ironically, much of the employment for the Innu is now in non-professional jobs in clinics, homes, shelters and treatment programmes in the villages. The advent of village-based social pathology among peoples immersed in what had hitherto been a relatively stable and mobile society is similar to changes recorded in other northern native communities subject to similar pressures (Brody, 1981; Bussidor and Bilgen-Reinart, 1997; Boothroyd et al, 2001; Inuit Tapiiriit Kanatami, 2004). Sedentarization policies, motivated by a mixture of desires to assimilate mobile groups and clear lands for agriculture and resource extraction, have occurred in many other places, including Australia (Trudgen, 2000; McKnight, 2002), Botswana (Gall, 2002; Olmsted, 2004) and Mongolia (Humphrey and Sneath, 1999) with similarly negative consequences for the populations involved. The loss of self-esteem, manifested in ubiquitous alcohol abuse, child gas sniffing and suicides, has had a
Environmental and Health Benefits of Hunting Lifestyles and Diets 109
profound effect on the Innu and their way of life. More than two decades ago, Brody (1981, p72) described the pathology of similarly situated aboriginal communities elsewhere in Canada: ‘many northern reserves appear to be grim and even hateful little places, clusters of houses crowded together by planners in order to achieve economies of administration and services… Such compression of a people distinctive for their free roamings through unbounded forest is bizarre and painful.’ The feeling of loss experienced by the Innu is bound up with a tension that has built up between the past life in the country and the present life in the villages. The nomadic hunting way of life is often regarded as strenuous and sometimes demanding to the point of life-threatening, but it is healthy, vibrant and connects people to a core of their cultural and environmental identity. Typically, hunting families are spread out across a vast expanse of territory, and so have little aggregate impact on resources. Settlements, on the other hand, are seen as permeated by misery created by alcohol, sexual abuse, family rivalries, boredom and the physical confinement to a relatively small area. Because the village is now the site of so many recent personal tragedies the feeling of loss is magnified, especially among the generation that have known both country and village life. The remarks of Kanikuen Penashue, a resident of Sheshatshiu, are typical: ‘the problem is that we are so scared because the things that exist today are not explainable. They are so new to us. The whole world changed right under our feet. We are lost.’ (Innu Nation and Mushuau Innu Band Council, 1993; see also, Innu Nation and Mushuau Innu Band Council, 1995, pp24–41). Local settlers at North West River have also observed a change in the Innu from their confidence and generosity in the country to their trauma and suspicion of whites after sedentarization (Plaice, 1990, pp74–87). The primary response of the Canadian government has been to fund villagebased solutions such as medical and quasi-medical establishments, emergency medical evacuations to Newfoundland, and housing, sports and building infrastructure (especially for alcohol programmes, clinics and homes). The relocation of the Mushuau Innu from Davis Inlet, where they endured life in shacks without sanitation and running water from 1967 to 2003 to the new C$152 million village of Natuashish can also be seen as part of these efforts (Indian and Northern Affairs Canada, 2005b). The Labrador Innu Comprehensive Healing Strategy implemented by the Canadian government is almost entirely ‘community-based’ (see Treasury Board Secretariat, 2004). Despite these efforts, social pathology has continued to worsen since the move with four suicides in the first year and with the discovery that 35 per cent of students at the Natuashish school suffered from Foetal Alcohol Syndrome (Philpott et al, 2004). While some government policy reactions to the visible health crisis among the Innu have been welcomed, by ignoring the importance of Innu connections to the land, they fail to address some of the root causes of that crisis. Our objectives in this paper are to examine the biological and environmental underpinnings of this crisis, and use them as a basis to show how country-oriented solutions might offer more hope of stemming the physical, psychological and cultural decline of the Innu. We make our case for a country-oriented shift in policy by arguing that two transitions have been fundamental to recent Innu history.
110 Before Agriculture
Firstly, a nutrition transition can be discerned in the abrupt shift from consumption of wild foods to processed foods. This is paralleled by a physical activity transition, from regularly active and strenuous exercise to much less demanding set of activities in the village. We investigate these transitions through both historical sources and interviews with Innu, and then explore how such changes have impacted upon health. We also compare nutritional properties of country foods with those of foods consumed in the village, as well as compare activity patterns in the country and in the village. We then use medical and environmental data to examine how the new junk food diets and lack of exercise are affecting the health of the Innu. Finally, we look at how practical policy changes and economic activities such as those being promoted by the Tshikapisk Foundation (2004), an association of Innu hunting families, could be put into effect to restore hunting activities and address some of the manifold health problems of the Innu. The research is based on the fieldwork of one of the authors (CS) with the Innu since 1994, and joint research since 2002, involving interviews, observations and data collection in Sheshatshiu and in the country at Kenemau.
The Nutrition Transition The indigenous relationship with the land A key to understanding the crisis of the Innu lies in setting their recent experiences in the villages in contrast to their historical and continuing connections with the land. In the country, the Innu experience daily connectedness and respect for nature, and the closeness of families and communities. When Innu look at the country, they do not just see animals, trees and water. Like many other indigenous peoples, they see places with stories, they locate events, they see ancestors wandering the land, they see past and present intimately linked, they see tracks and signs, and nature tied together with them (Brody, 1981; Lopez, 1986; Basso, 1996; Cruikshank, 1998; Nuttall, 1998; Posey, 1999; Clayton and Opotow, 2003; Folke, 2004). But when Canadian and Newfoundland policy makers turned their attentions to Labrador, they instead saw the economic value of timber, of reservoirs for hydroelectricity, of iron ore and nickel in the rocks, and of the wildlife that needed protecting (Samson, 2003a, pp96–111). This core difference in values is critical. For the Innu, to destroy a part of a connected system is eventually to undermine the whole. In the country, the Innu feel they have much greater autonomy and freedom. They are able to choose when to hunt and when to rest. Their decisions affect the land and its resources, and their knowledge accrued over hundreds of generations of observation and experimentation determines their success. By contrast, life in the village is quite different. Because the economy required to support wage labour never materialized as the provincial authorities had earlier promised (Samson, 2003a, pp96, 142–147),
Environmental and Health Benefits of Hunting Lifestyles and Diets 111
there are few secure jobs for Innu, and thus a dependence on welfare has emerged with little opportunity for self-reliance or self-determined life choices. A significant component of this change involves food. In the country, the Innu were selfreliant in providing for their sustenance. Contacts with missionaries and traders brought firearms, tea, flour and tobacco, but because they were relatively autonomous until sedentarization, the Innu diet largely consisted of wild meat, fish, waterfowl and berries (Samson, 2003a, pp127–142).
The transition to processed foods The nutrition transition is a well-established phenomenon in both industrialized and developing countries (Popkin, 1998). In almost all of these industrialized and developing country contexts, people have been largely dependent on the produce from agriculture for several thousand years, and the nutrition transition has involved a change from one diet based largely on foods from domesticated crops and animals to another with similar derivation but with increased processing. For the most recently settled hunter-gatherer societies, such as the Innu and other indigenous peoples of Canada, their transition has occurred directly from wild foods to modern refined (and often junk) foods. In the Arctic and Subarctic regions, indigenous peoples’ diets have changed from foods that are typically nutrient-dense, with high levels of protein and fat (especially omega-3 fatty acids), and vitamins and minerals (e.g. vitamin C, selenium), but relatively low levels of carbohydrates, to diets high in carbohydrates and saturated fats and low in essential nutrients (McGrath-Hanna et al, 2003, pp230–231). Importantly, these changes are on the whole very recent, with northern peoples such as the Innu and Eastern James Bay Cree (Delormier and Kuhnlein, 1999, p182) still engaged in some hunting activities while domiciled in villages. Hence, their diets consist of both country and modern, largely processed, foods. While country foods can remain a significant part of the sustenance and nutritional intake of some northern peoples, the diet that has become the norm over recent decades is one that is deficient in many of the healthy properties of food. A survey of seven northern aboriginal communities in the 1990s characterized this pattern as being low in fruits, vegetables and dairy products, high in sugar, fat and saturated fat, and consisting of intakes of calcium, magnesium, folate, vitamin C and vitamin A that do not reach recommended doses (Lawn et al, 2002, p10). Amongst Innu Tshenut, there is a widespread view that store bought food is both unhealthy and makes people ill. This was evident almost as soon as the Innu were sedentarized in the 1950s and 1960s when Father Frank Peters (1972, pp10–11) quoted Innu at the new Davis Inlet village as feeling hungry after eating processed food, and feeling that chicken, pork and beef were not as substantial as caribou meat. At the same time, he also noted the rapid deterioration of the teeth of the population, a condition he attributed to the sudden availability of sweets and soft drinks in the store. Other observers noted exactly the same unfavourable
112 Before Agriculture
comparisons being made between store and country food at the time (Henriksen, 1977, p4), and as late as the 1990s, many Innu believed that the foods in the store were also adulterated, stale and unsafe to eat (Innu Nation and Mushuau Innu Band Council, 1995, p39). By contrast, a visiting physician reported that people in the country were remarkably healthy, with very few cardiovascular or lung problems, and good dental health (Sarsfield, 1977). The major causes of mortality were trauma from accidents and infant illnesses. These observations of the worries Innu had about store food in the early days of Utshimassits are backed up by the reminiscences of people who remember the times of transition from permanent country living to semi-sedentary village life. Some believed that their children would starve because store food is not as good for them as caribou, beaver and porcupine (Elizabeth Penashue, interview, 1994). Others observed high numbers of children getting sick in the community (Shimiu Penashue, interviewed 1995) and other Innu maintain that the food purchased in the stores does not taste good (Pien and Lizette Penashue, interviewed 1997). These sentiments were shared by Mary Adele Penashue (interviewed 2003), who remarked, ‘I have strange feelings when I’m in the house eating store-bought food… It’s making us sick and weak, this fast food’ Despite these views, storebought processed food has become increasingly dominant in the diets of Innu in the villages, and is starting to be preferred by the younger generations.
Nutritional content of country and store foods Once there has been a lifestyle change brought about by sedentarization, then indigenous people have no constant access to country food throughout the year, and so come to rely on store-bought food derived from distant agricultural systems. This becomes a health problem as hunted and gathered foods are very different in nutrient content and density than store-bought foods. Table 4.1 shows the energy, protein, fat and key vitamin content of eight types of wild meat and fish compared with eight domestic meats available in local shops. These data show energy and protein levels similar to those measured in situ for the Cree (Berkes et al, 1995). Table 4.2 contains details of the recommended daily allowances (RDAs) for adults and children, and shows that RDAs for minerals, vitamins and energy can be reached with relatively modest quantities of country foods. For this sample of 16 foods, store food has 75 per cent more energy content than country food (1.26MJ 100g–1 compared with 0.72MJ 100g–1), 37 per cent less protein (20.9g compared with 28.7g), and more than four times as much fat (23.2g compared with 5.7g), of which 8.7g are saturated fats. These saturated fats are known to be an important risk factor in coronary heart disease and also contribute to the addition of body fat. Country foods also contain more iron (4mg 100g–1 compared with 1.68g in store foods). Iron deficiency is now a recognized problem for an increasing number of mothers and children worldwide following the adoption of modern diets (ACC/ SCN, 2000). There is more than three times the vitamin C in this sample of coun-
0.72 1.40 1.27 1.03 1.43 1.07 1.04 1.34 1.54 1.26
Average for country foods
Luncheon meat Bologna beef/pork Pork loin chops Beef, braised Steak Beef corned Beef/pork frankfurter Pork sausage
Average for store foods
20.9
12.5 15.2 27.9 26.9 28.0 26.9 11.1 19.2
28.7
29.8 32.4 34.9 33.0 29.3 19.9 27.4 22.9
23.2
30.3 24.6 14.5 25.7 15.2 15.2 28.9 30.8
5.69
4.42 12.10 6.96 3.51 0.97 4.25 7.50 5.80
8.7
10.8 9.7 5.3 10.2 6.1 6.2 10.7 10.8
1.64
1.70 3.50 2.10 1.10 0.29 1.32 1.59 1.52
1.68
0.72 1.21 1.05 3.04 3.04 2.10 1.10 1.15
4.03
6.17 1.43 10.00 4.85 4.22 4.51 0.71 0.38
0.81
1.0 0.8 0.9 0.0 0.0 0.0 0.0 3.8
2.8
3.0 2.3 3.0 0.0 5.0 6.2 1.0 2.0
0.31
0.37 0.22 0.77 0.07 0.10 0.02 0.20 0.73
0.14
0.25 0.07 0.05 0.02 0.05 0.42 0.12 0.15
0.20
0.19 0.19 0.22 0.23 0.27 0.14 0.11 0.27
0.30
0.90 0.18 0.31 0.07 0.34 0.31 0.16 0.09
3.3
3.1 2.5 4.6 2.5 3.9 2.4 2.7 4.6
5.5
5.8 7.5 2.2 6.4 5.3 3.4 7.8 5.8
Total fat Saturated fat Iron Vitamin C Thiamin Riboflavin Niacin (g 100g–1) (g 100g–1) (mg 100g–1) (mg 100g–1) (mg 100g–1) (mg 100g–1) (mg 100g–1)
Source: USDA National Nutrient Database, 2003; Gebhardt and Thomas, 2002
0.69 1.03 0.89 0.72 0.56 0.51 0.77 0.63
Energy Protein (MJ 100g–1) (g 100g–1)
Caribou Pheasant Beaver Rabbit (wild) Moose Duck Salmon Trout
Food
Table 4.1 Nutrient content for wild and store foods Environmental and Health Benefits of Hunting Lifestyles and Diets 113
114 Before Agriculture Table 4.2 Recommended daily dietary allowances of key nutrients, minerals and vitamins
Children 1–10 years Males 11–18 18–50 > 51 Females 11–18 18–50 > 51
Energy (MJ)
Protein (g)
Iron (mg)
Vitamin C Thiamin Riboflavin (mg) (mg) (mg)
Niacin (mg)
7.11
24
10
20
0.55
0.55
7
11.50 12.12 9.61
52 61 63
12 10 10
60 90 90
1.1 1.2 1.2
1.1 1.3 1.3
14 16 16
9.20 9.20 7.95
45 48 50
15 15 10
55 75 75
1.0 1.1 1.1
1.0 1.1 1.1
13 14 14
Note: RDAs contain safety margins, and do not represent the level at which deficiency symptoms might occur. These are lower than the DRIs (dietary reference intakes). Source: Gebhardt and Thomas, 2002
try foods, 50 per cent more riboflavin, 67 per cent more niacin, though less than half the thiamine. These high concentrations of vitamins in country foods are important for hunters such as the Innu with little or no cereals or vegetables in their traditional diets. Some country foods are very high in certain vitamins – ptarmigan, for example, has ten times as much niacin than other meats and fish (Mackey, 1987), and caribou and duck are high in thiamin. A variety of berries are important sources of vitamin C, even though only relatively small amounts are consumed as a result of the short growing season. Clearly, these country foods were once able to supply the necessary macro- and micro-nutrients to ensure adults and children remained healthy over thousands of years. How do these foods compare with a typical ‘junk’ food meal of the sort now increasingly available to the Innu and other indigenous peoples? One typical meal of a cheeseburger with French fries, each of some 170g in weight, would supply 52g fat (of which 16g are saturated), 31g of protein, and a total of 4.29MJ (35 per cent of the daily recommended total for adult males and 47 per cent for women). By contrast, a 340g meal of caribou meat would supply 15g of fat (of which 5.8g are saturated), 101g of protein, and 2.37MJ (20 per cent of male and 26 per cent of female RDAs). A similar meal of salmon provides 25g of fat, 93g of protein, and 2.62MJ of energy, and of beaver 23.7g of fat, 119g of protein, and 3.01MJ of energy. The nutritional value of hunted, fished and gathered foods is magnified still further because almost all edible parts of foods are consumed by northern peoples. With the caribou, for example, all the organs are eaten, as well as bone marrow, both of which provide important sources of fat from an animal that is typically very lean (Tracy and Kramer, 2000, p48). A variety of studies of indigenous groups across the Canadian Subarctic have recorded how much country food is consumed after the lifestyles of aboriginal
Environmental and Health Benefits of Hunting Lifestyles and Diets 115
peoples were shifted from being nomadic to settled. These vary from a low of 52kg per person per year in Manitoba communities, to 96kg yr–1 for Inuit in Labrador, 115kg yr–1 for the James Bay Cree, 146kg yr–1 for Omushkego Cree in Ontario, 221kg yr–1 for groups in the Keewatin region, and 285kg yr–1 for the Inuit of north Quebec (Mackey and Orr, 1987; Wein et al, 1991; Berkes et al, 1995a). These amount to a daily consumption of between 140g and 781g of country food. Some 200g of country food supplies the recommended daily protein requirement for adult males, while 175g is sufficient for adult females (see Tables 4.1 and 4.2). Clearly, continuing to consume country food will be good for the physical health of Innu and other northern peoples. The hunter-gatherer nutritional regime is the oldest human diet and is well-suited to human physiologies (Eaton and Eaton, 1999, p449).
The decline in country food consumption Country foods still remain a part of the diets of the Innu and other northern peoples. Among the Cree, for example, 29 species of wildlife are still eaten, each with 2–11 edible parts, with fish and birds the most consumed in summer, and large and small mammals the most important in winter (Delormier and Kuhnlein, 1999). During summer, about half of the fat consumed by women comes from country foods, with Canada goose the most important single source (14.3 per cent). In winter, though, only one of the top 20 sources of fat was a country food (goose again), with the top source now french fries (9.6 per cent of total fat). Among the Cree, Chipewyan and Metis peoples around Buffalo National Park, Wein et al (1991) estimated that households ate country foods six times per week during the late 1980s. Wagner’s (1986) study of ten reserve communities in Manitoba indicated that the harvest size and diversity of country foods depended on the local availability of wildlife habitats and cultural preferences. Harvests were greater in the more sparsely populated northern communities. By comparing documented records for 1912– 1914, it was clear that consumption of country foods had declined (Table 4.3). Table 4.3 Changes in annual household consumption of country foods between 1912–1914 and 1983–1984 Central Quebec 1912–1914 (numbers of each animal; fish in kg) Moose Caribou Beaver Muskrat Black bear Rabbit Duck Fish (kg) Source: Wagner, 1986
0.8 2.5 94.3 70.5 4.5 5740 135 7215
Manitoba 1983–1984 (numbers of each animal; fish in kg)
Changes (%)
0.54 0.07 5.6 23 0.03 3 15 78
–32.5 –97.3 –94.1 –67.4 –99.4 –99.9 –88.9 –98.9
116 Before Agriculture
Using a caesium tracing method, Tracy and Kramer (2000) found that caribou consumption in northern Canada had declined by 80 per cent in 11 communities from 183g day–1 in 1967–1968 to 35.1g day–1 in the 1990s. Similar declines in country food consumption have been recorded amongst the Inuit of Greenland (Pars et al, 2001). In the north-west, country foods (including here seal and whale) provided 54 per cent of daily energy intake in 1952, but this had fallen to 25 per cent by 1991. Once again, younger people consume fewer country foods, as do those in households resident in larger towns compared with those in villages. The youngest group consumed the most soft drinks, fruit syrups, and fruit and vegetables. Most studies have found that young people now consume less country food than elders (Wein et al, 1991; Tracy and Kramer, 2000, p46), and that there have been declines in consumption over time. Delormier and Kuhnlein (1999) found that there had been a decline in use of traditional foods among the Cree of Quebec, particularly by the younger generation. Berkes et al (1995a, 1995b) found similar changes amongst the Cree of northern Ontario. An Indian and Northern Affairs Canada (INAC) nutrition survey (Lawn et al, 2002, p4) found that among adults over 45 in Inuit communities in Nunavik (northern Quebec) about a third of energy was obtained from country foods, compared with only 22 per cent among younger women and 18 per cent among younger men. Older people were also reported to be eating much less junk food than their younger counterparts. There are few data on changes in consumption of country foods by the Innu over time (Usher, 1976; Mackey and Orr, 1987). Usher (1976) found that the major source of food and income in northern Labrador came from harvesting country foods. In the 1980s, Mackey (1987) indicated that 30–65 per cent of the Innu in Labrador continued to spend the autumn and/or spring months in the interior hunting, trapping, fishing and gathering. This has fallen dramatically since the withdrawal of funding for the Outpost programme, which enabled Innu families to spend several months a year in the country.
Health consequences Changes in diet have had severe and costly public health consequences in most industrialized countries (CDC, 1996; Ferro-Luzzi and James, 2000; Eurodiet, 2001; Nestle, 2002). One of the most serious consequences of poor diet is the emerging obesity epidemic, the costs of which are some US$117 billion per year in the US, compared with US$97 billion for smoking (Kenkel and Manning, 1999). The Eurodiet (2001) study has also concluded that disabilities associated with high intakes of saturated fat and inadequate intakes of vegetable and fruit exceed the cost of tobacco use. It is further acknowledged that sedentary lifestyles are a major public health problem. However, unlike most Europeans and North Americans, the Innu are still fortunate enough to have wild foods at their disposal in the vast Labrador-Quebec interior. A wide range of country foods are still consumed by all indigenous
Environmental and Health Benefits of Hunting Lifestyles and Diets 117
peoples in Canada, with more than 50 species of animals and birds regular in diets, including caribou, moose, rabbit, muskrat, beaver, porcupine, muskox, squirrel, lynx, fish, duck, geese, ptarmigan and grouse, together with a variety of fish, marine mammals, berries, wild rhubarb, wild onions and Labrador tea (Mackey and Orr, 1987; Berkes et al, 1995a; Wein et al, 1996). While northern peoples have been consuming these foods, the incidence of obesity, diabetes and cardiovascular diseases has been relatively low. It has been suggested that this is partly due to the high content of omega-3 fatty acids and antioxidants in the traditional diet (McGrathHanna et al, 2003, p230). Although one facet of the changes occurring among northern indigenous peoples should never be taken in isolation, the public health consequences of new diets are now known to be serious contributors to a wide range of ailments. Some health problems arise from nutritional deficiencies of iron, iodide, folic acid, vitamin D and omega-3 polyunsaturated fatty acids, but most are due to excess consumption of energy and fat (causing obesity), sodium as salt (high blood pressure), saturated and trans fats (heart disease) and refined sugars (diabetes and dental caries). Diet is thought to be a factor in 30 per cent of cases of cancer in developed countries (Riboli and Norat, 2001). While degenerative diseases such as diabetes, coronary heart disease and cancer have been relatively rare in hunter-gatherers, they are now becoming common among hunting peoples who have been sedentarized. As well as more energy expenditure and lifestyles that are more protective of the body (for example, the shorter gap between menarche and childbirth among hunter-gatherers protects against breast cancer), hunter-gatherer diets are composed of foods that are denser and more fibrous, have a high protein-to-fat ratio and lack the high amounts of sugar, salt, saturated fats and high calorie counts characteristic of many diets of people in industrialized societies. There is, therefore, much to learn from the qualities of the hunter-gatherer diet and lifestyle in terms of health promotion (Eaton and Eaton, 1999). Analysing broad epidemiological changes over time, McKeown (1988, p37) has found that diseases such as cancer, obesity, diabetes, hypertension and heart disease, as well as non-communicable diseases, are uncommon in hunter-gatherers and peasant agriculturists, appearing only when traditional ways of life are abandoned or disturbed. Amongst Native North Americans, the result of the transition has been a rapid increase in recent years in diet-related health problems, particularly of type II diabetes, coronary heart disease and obesity (Thouez et al, 1990; Hegele et al, 1997; Story et al, 2003). This follows significant advances in reducing infant mortality, such as from 150 per 1000 live births amongst the Inuit in mid 20th century to 10 per 1000 towards the end of the century (Young, 1994). One study of Cree women in Quebec found 30 per cent with a BMI (body mass index in kg m–2) of 25–29.9, and 57 per cent in the obese category of a BMI of more than 30kg m–2 (Delormier and Kuhnlein, 1999). Fifty per cent of the 36 women surveyed in Davis Inlet in 1992 had a BMI of greater than 30 per cent and 75 per cent of these women exceeded a BMI of 27 per cent, making Mushuau Innu women, according to these
118 Before Agriculture
measures, the most obese of all the seven northern aboriginal communities surveyed by the INAC study (Lawn et al, 2002, p44). These are problems shared by many circumpolar peoples (McGrath-Hanna et al, 2003), and this extends to indigenous peoples across North America. Story et al (2003) suggest that ‘obesity is now one of the most serious public health problems facing American-Indian children’. Hovering at an average of 25 per cent, the rates of obesity among aboriginal populations in Canada are almost twice that of Canadians as a whole (Canadian Institute for Health Information, 2004, p116). As well as the adverse effects on physical health, there is also evidence that the change in diets for indigenous peoples may be implicated in the high rates of mental health problems suffered by these populations in recent years. Based on an extensive review of literature, McGrath-Hanna et al (2003, pp233–235) argue that the sudden shift from diets derived from hunting, fishing and gathering to those based on Western store-bought foods is an important risk factor linked with the deterioration in the mental health of circumpolar peoples. This claim is based on several lines of evidence. For example, the decline in consumption of omega-3 fatty acids has important implications for neuronal and brain development, function and health, and this has been associated with increased levels of aggression, depression, postpartum depression and suicide. Given the scientific evidence on the adverse effects of store food on the health of aboriginal peoples, it is not surprising that some indigenous groups view this so-called ‘whitemans’ food’ as literally and symbolically polluting (Adelson, 2000, p104).
Pollution and country foods The decline in aboriginal wild food consumption has a generational basis (Wein et al, 1991; Tracy and Kramer, 2000, p46; Pars et al, 2000; Lawn et al, 2002), and this coincides with policies of relocation and sedentarization, as well as with the acceleration of resource extraction activities from indigenous peoples’ land and water resources. Not only do such activities bring with them an influx of nonnative people requiring processed and frozen foods (this region is beyond the zones of agricultural production), but the industries themselves disrupt the relationships between aboriginal peoples and the lands. The decrease in country food consumption among aboriginal peoples affected by industry has been shown to be closely related to difficulties in hunting and reduced availability of animals, and to community concerns over the taste and safety of the wild foods (Loney, 1995, p233). Hence, industrialization of aboriginal lands creates both a push factor, discouraging hunting and fishing, and a pull factor, drawing people to processed foods because of fears over the adulteration of wild foods from industry (see Horton, 2004, p10A). In northern areas, processed foods have been even more attractive because of the lower costs compared with fresh produce, which is perishable, and consequently relatively expensive, especially to aboriginal families living on welfare. The decline of country food consumption has coincided with the new threat from contaminants in country foods. For example, radioactive caesium (Tracey
Environmental and Health Benefits of Hunting Lifestyles and Diets 119
and Kramer, 2000, p48) and cadmium (Adelson, 2000, p84) have been found in caribou in the Canadian north. Methylmercury has been discovered in fish caught by Eastern James Bay and northern Manitoba Cree (Delormier and Kuhnlein, 1999, p182; Loney, 1995, p239), along with mercury, PCBs and pesticides in traditional foods consumed by Inuit populations in Greenland (Pars et al, 2001, p29). One of the most notorious cases of mercury poisoning affects the Ojibwa people of Grassy Narrows, northern Ontario. In the 1970s, it was discovered that a pulp mill was the source of mercury poisoning of fish caught by Ojibwa. On recent visits to the Grassy Narrows and Wabaseemong reserves, the Japanese neurologist who publicized the first cases reported that some of the residents experienced increased symptoms of the poisoning with age (Aiken, 2004). Even if the industrial developments are not as malign in their effects as this case, there are always some adverse changes to local ecosystems. Many aboriginal peoples believe that such damage diminishes the abundance of animals (Adelson, 2000, p84). For the Innu in Labrador, environmental threats are posed by a number of large industrial projects. These include mercury in fish caught in some of the water passing through the Churchill Falls hydroelectric project, adverse changes to animal habitats (e.g. waterfowl migration patterns), water pollution from the Voisey’s Bay mine, the creation of the Trans-Labrador highway, connecting Goose Bay with Labrador City, and low-level flight training (see Samson, 2003a, pp96–116). As with similar industrial projects in Canada, these also have much wider negative effects on the social fabric of the peoples themselves. The creation of hydroelectric generating projects has been found to be associated with interpersonal violence, family break-ups, alcohol and drug abuse and cultural disintegration among aboriginal peoples across Canada (Loney, 1995; Kirkness, 2000, p309).
The Physical Activity Transition Activity transition in settled and agricultural societies The second transition of significance to Innu physical and mental health is the activity transition. Like the nutrient transition, this has already occurred in industrialized countries, and is having a significant impact on health and well-being (CDC, 1996; Wanless, 2002; Lang and Heasman, 2004; Pretty et al, 2005a). Along with diet, physical activity is now known to be an important determinant of health and well-being. Again, human metabolism and genetic make-up have been unable to adapt to the rate of change and magnitude of changes in lifestyle that have taken place over recent decades. People in both industrialized countries and urban settlements in developing countries have become increasingly sedentary in all aspects of daily life, including during leisure time, in travelling to and from work, and during work itself. In Europe, there has been a dramatic fall in physical activity over the past 50 years with on average 2MJ less energy output per day in adults aged
120 Before Agriculture
20–60 years (Eurodiet, 2001). Yet the public health consequences of these changes have not, until very recently, been widely discussed or accepted (DCMS, 2002; DoH, 2004). The Eurodiet (2001) study states ‘the importance of physical activity has been underestimated for many years by both doctors and policy-makers’. In the US, the report of the Surgeon General (CDC, 1996) documented similar alarming declines in physical activity and consequent increases in ill health, finding that 60 per cent of Americans are not regularly active, and 25 per cent are not active at all. Although there is no systematic data to establish long-term trends, it is clear that lifestyles have changed in many countries, and that even leisure time is increasingly filled with sedentary behaviour (CDC, 1996). Echoing Popkin’s phrase (1998), we believe that modern societies have also gone through an ‘activity transition’ in the past two to three generations (Pretty et al, 2004, 2005a, 2005b), with people no longer active in the workplace nor in travelling to and from work, nor during leisure time. This too has very significant health consequences for whole populations. Yet physical activity is known to reduce the risk of dying from coronary heart disease, the leading cause of death in industrialized countries, and also reduces the risk of developing diabetes, hypertension and colon cancer. It enhances mental health, fosters healthy muscles and bones, and helps maintain health and independence in older adults (Paffenbarger et al, 1994; CDC, 1996; Hermansen et al, 2002). Compared with active people, those who are sedentary have a 1.2–2 fold increased risk of dying (Paffenbarger et al, 1994), with levels of cardiovascular fitness strongly associated with overall mortality (Berlin and Colditz, 1990). Physical activity provides a protective effect in later life, though taking up physical activity at any time can have an immediate effect on long-term morbidity (Paffenbarger et al, 1994). A variety of studies have also shown that aerobic exercise improves self-esteem as well as having an antidepressant effect (Fox and Corbin, 1989; North et al, 1990; McDonald and Hodgdon, 1991; Scully et al, 1999; Frumkin, 2001; Pretty et al, 2005a). Exercise appears to affect an undetermined psycho-physiological mechanism, leading to improved fitness and/or weight loss, more autonomy and personal control, and a better sense of belonging and significance. However, there is much about the underlying mechanisms that is not known (Camacho et al, 1991; Farmer et al, 1998). It appears that if the amount of activity decreases in active individuals, then the risk of depression increases (North et al, 1990; McDonald and Hodgdon, 1991; Dishman, 1995). Paffenbarger et al (1994) found that men who engaged in three hours or more of sporting activity had a 27 per cent reduction in the risk of developing depression at follow-up compared to those who did an hour or less. There was also some important evidence for a dose response. Those who expended 10.5MJ or more per week were 28 per cent less at risk of developing clinically recognizable depression than those expending less than a 4MJ wk–1; those who expended 4–10MJ wk–1 had a 17 per cent risk reduction compared to those in the least active group.
Environmental and Health Benefits of Hunting Lifestyles and Diets 121
Physical activity in the country The importance of sedentarization as a factor in reducing physical activity has been documented elsewhere in Canada amongst Cree communities, where efforts to increase physical activity have centred on aerobic classes, walking and cycling, and swimming (Lavalée et al, 1994), even though 19 per cent of those questioned said they preferred traditional activities such as wood-cutting or snowshoeing. Medical professionals working with the Innu have also recommended organized physical activities, but there has been little take-up as a result of ongoing social problems in the villages and the foreign nature of such activities which separate exercise from purposeful physical activity. By contrast, physical activity in the context of hunting is an integral part of a way of life. Innu almost unanimously speak of hunting as fulfilling and therapeutic, providing a stark contrast to the inactive and stressful life in the villages. Observing the changes brought about when Innu leave the villages and spend months in the country, Andrew and Sarsfield (1984, p429) remark, ‘alcohol abuse suddenly stops. A combination of improved diet, a rigorous lifestyle and the stable emotional and social environment offered by a functioning Innu society, make for a startling contrast with life in the villages.’ In his seminal study of northern Athapaskan people, Brody (1981, p253) describes similar transformations in which ‘tense people relax; the uncertain and shy become more confident’, and all members of the hunting camp find the physical activity satisfying. The activity transition for the Innu has been more rapid and pronounced than it has been for people in industrialized countries. Their transition has been from a nomadic lifestyle centred on physically demanding hunting, gathering and fishing to a modern lifestyle with its associated motorized vehicles and inactive jobs. As late as the end of the 1960s, the entire Mushuau Innu population was using dog teams, walking in winter on snowshoes and transporting themselves across long distances in blizzards, often under sub-zero temperatures with no guarantees of a successful hunt. The anthropologist Henriksen (1973, pp21–24) recounts Innu endurance and stamina that indicates just how much physical activity could be involved in Innu life. The camp in which he was staying in the 1960s was situated 100 miles inland from Davis Inlet. There a group of men decided to go to the trading post to purchase some provisions. They rose at one in the morning and set off on sleds, taking turns to ride and run beside the sled. Some of the men shot ptarmigan along the way. They travelled non-stop until noon, having only a 15-minute tea break, before travelling further until five o’clock when it became dark. They then had to find a suitable campsite near a creek. The tent frame and supports were then fashioned from surrounding trees and the canvas tent thrown over the frame. A floor was built by shovelling away snow and then tramping down the remaining snow. The dog’s meat was boiled and the dogs tied up before the men were able to prepare their own food for the night. After eating, the men got up and tramped down a path in the snow to make their passage easier the next day. They returned to the
122 Before Agriculture
camp at one o’clock in the morning, having been up for 24 hours, then rose after two hours sleep and finally arrived at Davis Inlet by the next afternoon. After spending a short night at Davis Inlet, the group set off back for their camp 100 miles distant, and returned in the same fashion as the outward journey. Even today, with snowmobiles and outboard motors, the Innu hunting life is highly physically demanding for all members of the camp, from the older Tshenut to the children.
Energy expenditure There are no time and motion studies to illustrate the precise difference in physical activities in the country compared with life in the village. However, both written records and the testimony of Innu indicate a large difference in energy expenditure. Table 4.4 summarizes the hourly calorific output for a selection of activities typical to both country and village life. In the country, most days involve long periods of physical activity. First, Innu have to get to where they will camp. In the past, this would have been by walking, with loads carried or dragged on sledges. Today, most use snowmobiles in winter. From the camp, men engage in hunting and trapping, and fuelwood cutting and hauling. Often they will be away for the whole day. Women engage in gathering plants and boughs of spruce for tent floors, snaring rabbits, setting nets for fishing, and a wide range of camp activities, including preparing and cooking foods, collecting water, looking after infants, repairing cloths and tents, and taking care of meat and hides. Jean-Pierre Ashini, interviewed in 2004, told us that, ‘we were always busy in the country. I didn’t consider this Table 4.4 Energy expenditure in various country and village activities (for adult of 77kg, 170lb) Activity Sitting or lying (watching TV) Writing Cooking Shopping Walking in country Walking at 6.4kph (4mph) Running across country Fishing Canoeing Snowmobiling Snowshoeing Woodcutting with axe Hand sawing Stacking firewood Playing ice hockey
Energy expenditure (MJ hour–1) 0.42 0.54 0.88 1.21 1.59 1.88 3.16 1.21 1.42 1.46 3.26 3.76 2.36 1.71 4.01
Note: Energy expenditure rises with body weight (e.g. a 47kg (104lb) person snowshoeing expends 2MJ hr–1, whereas a 98kg (216lb) person expends 4.1MJ hr–1. Source: McArdle et al, 1996
Environmental and Health Benefits of Hunting Lifestyles and Diets 123
hard work’. Only when there were heavy snow storms or days of continuous rainfall did activity diminish in Jean-Pierre’s camps (see also, Ambler, 1996; Pratt, 2002). Hunting days would typically begin at daybreak so that Innu could maximize the hours of daylight while hunting. This could mean 12–15 hours of walking a day, which during the spring and summer would require 19–25MJ of energy expenditure, and up to 38–48MJ in winter. Another typical day might involve 6 hours of cutting trees and hauling wood for fuel – with an expenditure of 17.5MJ. Innu today recognize what such activity does to them physically. Jean-Pierre Ashini says, ‘I eat a lot in the country, but I burn it off. Even though I am eating fatty foods, I am still 20–30 lbs lighter than when I live in the village’. Some Innu recall acts of extraordinary physical endurance and capacity. JeanPierre Ashini recalls carrying a whole caribou of some 160kg weight some 2.5km back to camp. Dominic Pokue, interviewed in 2003, remembers as a young man canoeing 65km in two days, and travelling 110km in five days to reach camp at Minaipi Lake. Sometimes travel to the camp could involve walking both day and night, often carrying or dragging heavy loads. When men were hunting, they could travel very long distances, often spending 1–2 days away from the camp until they were successful in the hunt. Mary May Rich (interviewed in 2003) says women were active all day until they went to bed – chopping wood, collecting boughs, preparing foods. She did not consider this hard work, but an integral part of life and her identity. She said, ‘I miss life in the country. It hurts to be in the village now.’ It is clear that physical activity in the country involves energy expenditure in excess of the normal recognized maximum intake for adult women and men (8–10MJ day–1). A typical day in the village might only involve expenditure of 0.8–2.1MJ on physical activity (not counting sitting, lying, etc.). By contrast, a typical day in the country might involve expenditure of 12.5–50MJ, depending on time of year and activities. Consumption of food calories would therefore rarely exceed energy expenditure. In the village, however, intake greatly exceeds expenditure. For those Innu without jobs, a typical day may involve no more physical activity than an hour of walking from house to house or to the local store. Some children with bicycles may be more active and new sports facilities in the villages now occupy the time of some Innu children. Despite this, without access to the country, the Innu have little or no regular physical activity to fill the vacuum created by lack of hunting, trapping and gathering. It is, therefore, inevitable that energy input from food, even around recommended maximum intakes, will exceed expenditure. As we have shown, the situation is considerably worsened by the adoption of modern diets dense in fats and calories.
124 Before Agriculture
Restoring Country-based Activities This disconnection from the country has a profound effect on the Innu’s identity and their sense of connection to places and to each other. Underlying the nutritional and physical activity transitions is a fundamental change from largely selfreliant nomadic lifestyles in close contact with the land to welfare-dependent settled existences in villages. The Innu are virtually unanimous in describing nutshimit (the country) as synonymous with health (Samson, 2003a, pp255–262). Despite the open admission of some hardships, the country is depicted as providing the physical, mental and spiritual sustenance needed to survive as well as the social solidarity needed to maintain the Innu as a distinct society. For example, in a vast amount of Innu testimony on the changes imposed upon them since sedentarization, nutshimit was mentioned repeatedly as a source of healing and revitalization, often making direct links between wild food, physical activity, collective autonomy, and physical and psychological strength (Innu Nation and Mushuau Innu Band Council, 1995). Reports from explorers, scientists and other nonnative observers before sedentarization also depict the Innu as a healthy, vibrant and self-reliant people, living into advanced age (Turner, 1979 [1889], p106; Tanner, 1944, pp599, 663). The idea that being in the country can bring mental health and esteem benefits should not come as a surprise, as it has been established by a variety of empirical studies on largely urban-based people in industrialized countries (Pretty, 2004). These include analyses of the effects of views from the window or in pictures (Moore, 1981; Ulrich, 1984; Tennessen and Cimprich, 1995; Kaplan, 2001; Kuo and Sullivan, 2001; Diette et al, 2003), of incidental exposure to nature (CooperMarcus and Barnes, 1999; Wells, 2000; Whitehouse et al, 2001; Wells and Evans, 2003), and of immersion in wild nature (Hartig et al, 1991, 2003; Fredrickson and Anderson, 1999; Williams and Harvey, 2001; Herzog et al, 2002). We must, therefore, assume that the same applies to the Innu. This is reinforced by a growing body of research in social psychology and epidemiology relating to other aboriginal communities in Canada. These studies indicate that a command of traditional knowledge, spirituality, and higher levels of cultural continuity are associated with less suicide, solvent abuse and self-destructive tendencies (Chandler and Lalonde, 1998; Dell et al, 2002). Researchers noting the close association between suicide and rapid social and cultural change in the far north have recommended both ‘activities directed towards continuity of valued practices … continue to be developed’ (Kral, 2003, p38) and a ‘recovery of tradition’ (Kirmayer et al, 2003, pS16). Given the profound loss of autonomy and change in lifestyle brought about by sedentarization, it is doubtful that the Innu will revert to permanent nomadic hunting. But, with only very limited wage labour options and no viable educational training or economic plan for the Innu villages, it is clear that country-based activities could be vital for both economic and cultural survival of a sizeable number of Innu. Several policy options are available to increase access to the country
Environmental and Health Benefits of Hunting Lifestyles and Diets 125
and its food whilst not contributing to any further natural resource declines. These would not represent a ‘backward’ step for the Innu, but would rather seek to make the best use of available technologies and practices. Several of these options have been tested elsewhere, such as the outstation movement for Aborigine communities in Australia (Morice, 1976) and ecotourism in Saami areas of Scandinavia and among indigenous peoples in Siberia. For the Innu, these options are not necessarily new. Some have been discussed for decades, but no action has been taken. There is now even more urgency for action. We suggest four key policy changes: 1 2 3 4
a regional food policy to promote country food sourcing and consumption; following the recommendations of the Canadian Human Rights Commission (Backhouse and McCrae, 2002), a fully-funded outpost or hunter support programme to strengthen regular connections to the country; an ecotourism programme to increase visitor travel to the country and expenditure for Innu goods and services; a new school calendar policy to ensure that children can visit the country for a month or more in spring and autumn without increasing their likelihood of being held back a year for missing school time.
Establish a food policy for country food Some countries, such as Greenland, have progressive policies to support hunting lifestyles and consumption of country foods (Marquardt and Caulfield, 1996). The Greenland Home Rule government has been promoting local country food markets since 1988, and hunters regularly sell via formal kiosks, informally to relatives and neighbours, directly to schools, hospitals and senior citizens’ homes, and directly to government-controlled processing facilities. The aim of the policy is to support country food consumption as a substitute for expensive and less healthy imported foods. At the same time, such a policy helps to promote the economic viability of indigenous communities. Country foods are not permitted to be exported. An important factor which enables this in Greenland is that there is effective indigenous control over land and sea tenure systems (Marquardt and Caulfield, 1996, p116). Experience closer to Innu country shows that as long as Innu were able to maintain collective control of certain lands and waters, as consistent with the United Nations Draft Declaration on the Rights of Indigenous Peoples, such a policy could be a possibility. In the Inuit and Cree regions of northern Quebec, a Hunter’s Support programme has been in existence since 1982 when the Quebec provincial government legalized it. The programme operates by the province releasing funds to aboriginal organizations that pay Inuit and Cree hunters for the meat and fish they bring home. It also helps to subsidize the purchase of hunting equipment, transportation and a small fee for the hunters’ time. After taking some of the food from the hunters, the aboriginal organizations then distribute food throughout
126 Before Agriculture
the villages for free. The aim of the programme is to encourage the perpetuation of hunting and to offer alternatives to aboriginal hunting families that are excluded from, or do not wish to participate in, wage labour (Kishigami, 2000). It is clear that a similar policy could assist in maintaining hunting, fishing and trapping activities as well as improve the diets of the Innu. If pursued, such a governmental investment could be perceived as a preventive health measure, avoiding healthcare costs and averting some of the suffering associated with sedentary village life. To date, the government of Newfoundland has not been as imaginative as its Quebec counterpart in implementing such a programme. A further suggestion is a policy in Labrador to encourage local food sourcing by stores and institutions (e.g. hospitals, schools). While this policy may conflict with the religious antipathy many Innu feel to the buying and selling of animals, especially the caribou, it would be possible to source some fish and wildfowl. How to revise incentives for the private food stores is more difficult. Northern stores in Canada are smaller than their southern counterparts, with, according to one study, 457 items compared with 10–20,000, and 20–50 times less the floor space (Green and Green, 1987). Very few sell fresh meat, fish and country foods. If an accelerated programme of activities in the country were to be initiated, however, a reinvigorated communal system of food distribution could make some commercial transactions superfluous and reduce reliance on cash.
Reinstate the Outpost programme Access to the country now requires money and technologies, especially for older Innu. With no settler communities and few industrial incursions except the Voisey’s Bay mine, the Innu in Natuashish can access the immediate country relatively easily. However, further excursions to favoured hunting and fishing locations such as Kamestastin and Ashuapun require snowmobiles or airplanes. Because of settler and industrial activity in Central Labrador, the Innu living in Sheshatshiu are more heavily reliant on money and technology to reach preferred locations in the country. Unfortunately, the Outpost programme which funded Innu hunting encampments in the autumn and spring of each year has been discontinued. This is despite a recommendation from the Canadian Human Rights Commission in 1993 that this programme should be continued indefinitely as a crucial enabler of Innu cultural continuity (Backhouse and McCrae, 2002, p7). In this regard, the government has yet to honour its own obligations towards the Innu. The follow-up report concluded that ‘the Government has not implemented that aspect of the second recommendation in the 1993 Report that called on the Government of Canada to preserve “the unique aspects of existing arrangements such as the outposts program”’ (Backhouse and McCrae, 2002, p3). An immediate reinstatement of funding for this important project (or one like it) is necessary if Innu health is to be restored and cultural continuity maintained. While no research has been done on the uptake that a reintroduced Outpost programme would have, there is ample anecdotal evidence that large numbers of the Innu
Environmental and Health Benefits of Hunting Lifestyles and Diets 127
population would avail themselves of the opportunities to experience healthier and more meaningful activities in the country and remove themselves from the many sources of suffering and pain in the villages. A Band Council commissioned study of Tshiskutamashun, an Innu experiential learning project in the country in 1999, found widespread support for its continued existence, with unanimous support among adults (Samson, 2000/01; Samson, 2003a, pp218–221).
Promote ecotourism At present, the Innu are almost totally reliant on funds from the Canadian state for their village-based livelihoods. Ecotourism provides an opportunity to build a small Innu economy that would encourage more contact with the country, while also having little ecological impact on the landscape. Possible projects could include many of those now being formulated by the Tshikapisk Foundation, an organization of Innu hunting families dedicated to revitalizing Innu country life through specifically Innu educational projects and revenue-generating activities. The Foundation has secured funds for the construction of an Innu cultural centre at Kamestastin Lake. From Kamestastin and other locations, the unspoiled terrain of boreal forests, rivers and tundra affords numerous opportunities for fishing, caribou migration viewing, trekking, cross-country skiing and variants of cultural tourism in which clients would share in Innu country activities of fishing, hunting and gathering. Paying clients would also be involved in learning camp skills, Innu crafts and events would be organized so that we would hear about the history of the Innu, including Innu legends and cosmology. Ecotourism along these lines could provide valuable funding for the various Tshikapisk experiential learning projects by which Innu youth could undertake a rigorous curriculum of Innu learning and be exposed to country life for a prolonged period of time. Equally important is that ecotourism could provide employment for those Innu preferring a more country-based life, lessening their dependence on welfare and government funds (Tshikapisk Foundation, 2004).
Amend the school calendar A relatively simple adjustment to the school calendar could be made to assist Innu families with balancing country activities and village obligations. At present, schoolchildren are in session during the most important hunting seasons, the autumn and spring, and are on vacation during the long summer months when the presence of blackflies and the migration patterns of the animals make hunting less desirable. The Innu themselves and outside researchers including Henriksen (1993, p6) for the Mushuau Innu of Davis Inlet and Samson (2000/01) on behalf of the Sheshatshiu Innu Band Council have made recommendations to the Labrador School Board to change the calendar, but no action has been taken by the authorities. In Quebec where several school boards have been devolved to Innu control, modifications to the school calendar, enabling Innu children to participate in
128 Before Agriculture
hunting activities for short periods during the autumn and spring have been made. Similarly, the Cree School Board serving ten Cree communities around the James Bay and northern Quebec areas is strongly committed to instruction in the Cree language and value system. School calendars primarily follow the dominant North American model of instruction from August to June, but make some allowance for country activities in May through the ‘floating goose break’. Although the Labrador School Board which controls Innu schools in Sheshatshiu and Natuashish has included ‘culture days’ in its curriculum, these consist primarily of Tshenut providing instruction in Innu skills or storytelling in the school building, and therefore, out of the predominant context of the country in which these are most meaningful (Samson, 2003a, pp189–192). In some other parts of Canada, similar arrangements have been made to incorporate native activities within schools. On the whole, however, very little has been done across North America to reconcile the conflict between the statutory schooling schedule and the seasonal rhythms of Native American cultural activities. This is because an agricultural society model has simply been imposed, reflecting the need for ‘summer holidays’, originally designed to allow children to help with the harvests, a need which is nonsensical in the far north. The model was also indirectly imposed as a means of eradicating indigenous practices, sensibilities and orientations to time, and inculcating a different time discipline necessary for wage labour (Pickering, 2004).
Concluding Comments If the scale of health problems experienced by indigenous populations with longer standing experiences of assimilation and colonization is any indication, the future of the Innu looks bleak. According to a recent report by the US Commission on Civil Rights (2004), Native Americans in the US are 770 per cent more likely to die from alcoholism, 650 per cent more likely to die from tuberculosis and 420 per cent more likely to die from diabetes than the general population. If figures could be obtained for the Innu they are likely to approximate to the US rates for alcoholism and diabetes, though not for tuberculosis. Part of the problem lies in the fact that while much money is invested in treatments for the medical, social and psychological pathologies that afflict the Innu, hardly any resources are devoted to prevention. Canadian authorities take the contemporary village as the baseline for social intervention, devoting funds almost exclusively to village-based solutions. This is lamentable for the Innu who continue to receive largely Western-based institutional treatments. This, we argue, deals only with the individual symptoms of the larger processes of cultural, spiritual and physical dispossession incurred by sedentarization. It is also costly to continue to treat what are clearly preventable conditions. The costs of the treatment of the social and health problems arising from new diets and sedentary lifestyles are
Environmental and Health Benefits of Hunting Lifestyles and Diets 129
likely to far exceed the costs of a restoration of country-based activities we suggest here. But this will require a fundamental change in the way local, regional and national policy makers conceive of the problems that the Innu face. Canadian policy makers will have to be more imaginative in working with the Innu. They will have to embrace ‘bottom-up’ ideas such as the various programmes offered by the Tshikapisk Foundation. Of course, it is not helpful to look to the government for all the answers. The initiatives of many Innu to spend time in the country practising their way of life, eating wild foods and benefiting from the plentiful exercise of country life is vital to the success of any of the positive changes we are endorsing in this paper. These endeavours could be facilitated by a combination of some government subsidies through an Outpost or Hunter Support programme and the development of non-profit revenue generation through ecotourism and other activities consonant with Innu hunting life. It is clear, too, that the changes suggested here also have some relevance for people elsewhere in industrialized countries who are suffering ill-health from inappropriate diets and sedentary lifestyles. Better connections to food and the land, supported by reformed agricultural, food and land policies, could do much to promote wider and long-lasting changes in behaviour (Pretty, 2002; Pretty et al, 2004). However, the trends seen through most food systems towards commodification and processing of foods, combined with the self-interest of manufacturers and retailers, will make these changes difficult to sustain unless individuals and communities are able to take the links between health, food and the natural environment seriously, and act to develop new projects to address them. Being in the country for the Innu has considerable resonance for people in other societies who too have become disconnected from nature, land and food, yet who have a greater political voice to do something about these disconnections.
Acknowledgements We are especially grateful to the many Innu people that have helped and hosted us. We thank Joseph Mark, Sebastien Rich, Basile Penashue, Dominic Pokue, Daniel Ashini, Mary Adele and Louis Penashue, Mary May Rich, Anastasia Qupee, JeanPierre Ashini, George Rich, Armand McKenzie and Anthony Jenkinson. We are also grateful to Stephen Loring for his comments on Innu pre-contact history, Marlene Atleo for her reflections on school calendars, and to two anonymous reviewers for their helpful comments.
References ACC/SCN. 2000. 4th Report on The World Nutrition Situation. UN Administrative Committee on Coordination, Sub-Committee on Nutrition. In collaboration with IFPRI. New York: United Nations.
130 Before Agriculture Adelson N. 2000. Being Alive Well: Health and the politics of Cree well-being, Toronto: University of Toronto Press. Aiken M. 2004. Japanese expert says mercury victims need more than money. Kenora Daily Miner, 3 September, [WWW document] URL http://www.kenoradailyminerandnews.com/story.php?id= 115377 Ambler M. 1996. Jean-Pierre Ashini: Innu hunter and teacher. Tribal College Journal, Spring, 24–27 Andrew B. and Sarsfield P. 1984. Innu health: The role of self-determination. Circumpolar Health ‘84: Proceedings of the Sixth International Symposium on Circumpolar Health, ed. R. Fortune, pp 428–430. Seattle: University of Washington Press. Backhouse C. and McCrae D. 2002. Report to the Canadian Human Rights Commission on the Treatment of the Innu of Labrador by the Government of Canada, University of Ottawa, Faculty of Law. Basso K. 1996. Wisdom Sits in High Places: Landscape and Language among the Western Apache, Albuquerque: University of New Mexico Press. Berkes F., George P.J., Preston R.J., Hughes A., Turner J. and Cummins B.D. 1995a. Wildlife harvesting and sustainable regional native economy in the Hudson and James Bay lowland, Ontario. Arctic 47 (4), 350–360 Berkes F., Hughes A., George P.J., Preston R.J., Cummins B.D. and Turner J. 1995b.The persistence of Aboriginal land use: fish and wildlife harvest areas in the Hudson and James Bay lowland, Ontario. Arctic 48 (1), 81–93 Berlin J.A. and Colditz G. 1990. A meta analysis of physical activity in the prevention of coronary heart disease. Am. J. Epidemiol. 132, 612–628. Boothroyd L.J., Kirmayer L.J., Spreng S., Malus M. and Hodgins S. 2001. Completed suicides among the Inuit of northern Quebec, 1982–1996: a case control study. Canadian Medical Association Journal 165, 749–55. Brody H. 1981. Maps and Dreams. New York: Pantheon. Bussidor I. and Bilgen-Reinart U. 1997. Night Spirits: The Story of the Relocation of the Sayisi Dene, Winnipeg: University of Manitoba Press. Camacho T.C., Roberts R.E., Lazarus N.B., Kaplan G.A. and Cohen R.D. 1991. Physical activity and depression: evidence from the Alameda county study. American Journal of Epidemiology 134, 220–231. Canadian Institute for Health Information. 2004. Improving the Health of Canadians, Ottawa: Canadian Institute for Health Information. CDC (Centers for Disease Control and Prevention). 1996. Physical Activity and Health. A Report of the Surgeon General. CDC: Washington DC. Charest P. 1982. Hydroelectric dam construction and the foraging activities of eastern Quebec Montagnais. In: Politics and History in Band Societies, E. Leacock and R. Lee (eds.), pp 413–426, Cambridge, UK: Cambridge University Press. Chandler M. and Lalonde C. 1998. Cultural continuity as a hedge against suicide in Canada’s First Nations. Transcultural Psychiatry 35 (2), 191–219. Clayton S. and Opotow S. (eds.). 2003. Identity and the Natural Environment. Boston: MIT Press. Cooper-Marcus C. and Barnes M. 1999. Healing Gardens: Therapeutic Benefits and Design Recommendations. John Wiley and Sons, New York. Cruikshank J. 1998. The Social Life of Stories: Narrative and Knowledge in the Yukon Territory, Lincoln: University of Nebraska Press. DCMS. 2002. Game Plan: a strategy for delivering Government’s sport and physical activity objectives. London: Department of Culture, Media and Sport and Cabinet Office. Dell D. et al. 2002. ‘Resiliency and Holistic Inhalant Abuse Treatment’, unpublished manuscript, White Buffalo Youth Inhalant Treatment Centre. Delormier T. and Kuhnlein H. 1999. Dietary characteristics of eastern James Bay Cree women. Arctic 52 (2), 182–187.
Environmental and Health Benefits of Hunting Lifestyles and Diets 131 Department of Health. 2004. At least five a week: Evidence on the impact of physical activity and its relationship to health. A report from the Chief Medical Officer. London: DoH. Diette G.B., Lechtzin N., Haponil E., Devrotes A. and Rubin H.R. 2003. Distraction theory with nature sights and sounds reduces pain during flexible bronchoscopy. Chest 123, 941–948. Dishman R.K. 1995. Physical activity and public health. Mental Health Quest 47, 362–385. Eaton S.B. and Eaton S.B. III. 1999. Hunter-gatherers and human health. In: The Cambridge Encyclopedia of Hunters and Gatherers. R. Lee and R. Daly (eds.), pp 449–456. Cambridge: Cambridge University Press. Eurodiet. 2001. The Eurodiet Reports and Proceedings. Public Health Nutrition Special Issue 4.2 (A), 265–436. Farmer M., Locke B., Moscicki E., Dannenberg A., Larson D. and Radloff L. 1998. Physical activity and depressive symptoms: The NHANES edipemiologic follow up study. Amer J Epidemiology 128, 1340–1341. Ferro-Luzzi A. and James P. 2000. European Diet and Public Health: The Continuing Challenge. Brussels: Eurodiet Final Report. Folke, C. 2004. Traditional knowledge in social-ecological systems. Ecology and Society 9 (3), 7 Fox K.R. and Corbin C.B. 1989. The physical self perception profile: development and preliminary validation. Journal of Sport and Exercise Psychology 11, 408–430. Fredrickson L.M. and Anderson D.H. 1999. A qualitative exploration of the wilderness experience as a source of spiritual inspiration. J. Environ. Psychology 19, 21–39. Frumkin H. 2001. Beyond toxicity. Human health and the natural environment. American Journal of Preventative Medicine 20 (3), 47–53. Gall S. 2002. The Bushmen of Southern Africa: Slaughter of the Innocent, London: Pimlico. Gebhardt S.E. and Thomas R.G. 2002. Nutritive Value of Foods. Home and Garden Bulletin 72, Beltsville, MD: USDA. Green D. and Green M. 1987. The food retailing structure of the Northwest Territories. Arctic. 40 (2), 123–130. Hartig T., Evans G.W., Jamner L.D., Davis D.S. and Garling T. 2003. Tracking restoration in natural and urban field settings. Journal of Environmental Psychology 23, 109–123. Hartig T., Mang M. and Evans G.W. 1991. Restorative effects of natural environment experiences. Environment and Behaviour 23, 3–26. Hegele R., Young T.K. and Connelly P. 1997. Are Canadian Inuit at increased genetic risk for coronary heart disease? Journal of Molecular Medicine 75 (5), 364–370. Henriksen G. 1973. Hunters in the Barrens: The Naskapi on the edge of the white man’s world. St John’s: Institute of Social and Economic Research Press. Henriksen G. 1977. Land Use and Occupancy among the Naskapis of Davis Inlet, Sheshatshiu: NaskapiMontagnais Innu Association. Henriksen G. 1993. Report on the Social and Economic Development of the Innu Community of Davis Inlet to the Economic Recovery Commission. St John’s: Government of Newfoundland and Labrador. Hermansen R., Njølstad, S., Fønnebø, V. 2002. Physical Activity According to Ethnic Origin in Finnmark County, Norway: The Finnmark Study. International Journal of Circumpolar Health. 61, 189–200. Herzog T., Chen H.C. and Primeau J.S. 2002. Perception of the restorative potential of natural and other settings. J. Environ. Psychol. 22, 295–306. Horton T. 2004. Pollution fears threaten way of life. Baltimore Sun, 20 September, 10A. Humphrey C. and Sneath D. 1999. The End of Nomadism?: Society, State and the Environment in Inner Asia, Durham, NC: Duke University Press. Indian and Northern Affairs Canada. 2005a. Indian and Inuit Populations in Quebec as of December 31, 2004. [WWW document) URL http://www.ainc-inac.gc.ca/qc/aqc/pop_e.html Indian and Northern Affairs Canada. 2005b. Fast Facts: Labrador Innu. [WWW document] URL http://www.ainc-inac.gc.ca/irp/irp-Pf_e.html
132 Before Agriculture Innu Nation. 1996. Between a Rock and a Hard Place, Sheshatshiu: Innu Nation. Innu Nation and Mushuau Innu Band Council. 1993. Gathering Voices: Discovering our Past, Present and Future. Innu Nation Office, Sheshatshiu, Labrador. Innu Nation and Mushuau Innu Band Council. 1995. Gathering Voices: Finding Strength to Help Our Children, Vancouver: Douglas and McIntyre. Inuit Tapiiriit Kanatami. 2004. World Suicide Prevention Day, September 10, 2004: Inuit Backgrounder. Ottawa: Inuit Tapiiriit Kanatami. Kaplan R. 2001. The nature of the view from home: psychological benefits. Environment and Behaviour 33, 507–542. Kenkel D.S. and Manning W. 1999. Economic evaluation of nutrition policy. Or, there’s no such thing as a free lunch. Food Policy 24, 145–162. Kirkness R. 2000. Northern communities in transition: traditional economies and the impact of hydro-electric development in two Cree First Nations, Northern Manitoba, Canada. In International Labour Organization (ed.), Traditional Occupations of Indigenous and Tribal peoples: Emerging Trends, Geneva: ILO. Kirmayer L., Simpson C. and Cargo M. 2003. Healing traditions: culture, community and mental health promotion with Canadian Aboriginal peoples. Australasian Psychiatry 11, Supplement, S15–S23. Kishigami N. 2000. Contemporary Inuit Food Sharing and Hunter Support Program of Nunavik, Canada. In G. Wenzel, G. Hovelstrud-Broda and N. Kishigami (eds.), The Social Economy of Sharing: Resource Allocation and Modern Hunter-Gatherers, Senri Ethnological Series No. 53, Osaka, Japan: National Museum of Ethnology. Kral M. 2003. Unikkaatuit: Meanings of well-being, sadness, suicide, and change in two Inuit communities, Final Report to the National Health Research and Development Programs, Health Canada, Ottawa: Health Canada. Kuo F.E. and Sullivan W.C. 2001. Environment and crime in the inner city: does vegetation reduce crime? Environment and Behaviour 33, 343–367. Lang T. and Heasman M. 2004. Food Wars. London: Earthscan. Lavalée C., Robinson E. and Valverde C. 1994. Promoting physical activity in a Cree Community. Arctic Medical Research, 53, Suppl. 2 197–203. Lawn J., with Harvey D., Hill F. and Brulé D. 2002. An Update on Nutrition Surveys in Isolated Northern Communities, Ottawa: Indian and Northern Affairs Canada. Leacock E.B. 1954. The Montagnais Hunting Territory and the Fur Trade. American Anthropological Association 56 (5), Part 2, Memoir No.78. Leacock E.B. 1995. The Montagnais-Naskapi of the Labrador Peninsula. In: Native Peoples: The Canadian Experience, R.B. Morrison and C.R. Wilson (eds.), pp.150–180, Second Edition, Toronto: McClelland and Stewart. Loney M. 1995. Social problems, community trauma and hydro project impacts. Canadian Journal of Native Studies 15 (2), 231–254. Lopez B. 1986. Arctic Dreams. Harvill, London. Loring S. 1997. On the Trail of the Caribou House: Some Reflections on Innu Caribou Hunters in Northern Ntessinan (Labrador). In: Caribou and Reindeer Hunters of the Northern Hemisphere, L. Jackson and P. Thacker (eds.), pp.180–214, Brookfield, Vermont: Avebury Press. Loring S. 1998. Stubborn independence: an essay on the Innu and archaeology. In: Bringing Back the Past: Historical Perspectives on Canadian Archaeology, P. J. Smith and D. Mitchell (eds.), pp.259– 276, Mercury Series, Archaeological Survey of Canada, Paper 158. Canadian Museum of Civilization: Hull, Quebec. Loring S. and Ashini D. 2000. Past and Present Pathways: Innu Cultural Heritage in the Twenty-first Century. In: Indigenous Cultures in an Interconnected World, C. Smith and G. Ward (eds.), pp.167– 200, St. Leonards, NSW, Australia: Allen and Unwin.
Environmental and Health Benefits of Hunting Lifestyles and Diets 133 Loring S., McCaffrey M., Armitage P. and Ashini D. 2002. The Archeology and Ethnohistory of a Drowned Land: Innu Nation Research Along the Former Michikamats Lake Shore in Nitassinan (interior Labrador). Unpublished paper, Sheshatshiu: Innu Nation. Mackey M.G. Alton. 1987. Nutrition: Does access to country food really matter? presentation to the Fearo Assessment Review Panel Military Flying Activities in Labrador and Quebec, Montreal, October 7. Mackey M.G. Alton and Orr R.D. 1987. An evaluation of household country food use in Makkovik, Labrador, July 1980–June 1981, Arctic 40, 1, 60–65. Marquardt O. and Caulfield R. 1996. Development of West Greenlandic markets for country foods since the 18th century. Arctic 49 (2), 107–119. McArdle W.D., Katch F.I. and Katch V.L. 1996. Exercise Physiology, Energy, Nutrition and Human Performance. Lippincott Williams and Wilkins, Fourth Edition. McDonald D.G. and Hodgdon J.A. 1991. Psychological Effects of Aerobic Fitness Training: Research and Theory. Springer-Verlag, New York. McGrath-Hanna N., Greene D, Tavernier R. and Bult-Ito A. 2003. Diet and mental health in the Arctic: Is diet an important risk factor for mental health in circumpolar peoples? A review. International Journal of Circumpolar Health. 62, 3, 228–241. McKeown T. 1998. The Origins of Human Disease, Oxford: Blackwell. McKnight D. 2002. From Hunting to Drinking: The Devastating Effects of Alcohol on an Australian Aboriginal Community, London: Routledge. Moore E.O. 1981 A prison environment’s effect on health care service demands. J. Environ. Systems 11, 17–34. Morice R.D. 1976. Woman Dancing Dreaming: Psychosocial benefits of the Aboriginal Outstation Movement, Medical Journal of Australia, 225–26, 939–42. NAO. 2001. Tackling Obesity in England. National Audit Office. London: HM Stationary Office. Nestle M. 2002 Food Politics: How the Food Industry Influences Nutrition and Health. Berkeley: University of California Press. North T.C., McCullagh P. and Tran Z.V. 1990. The effects of exercise on depression. Exercise and Sport Sciences Reviews 18, 379–415. Nuttall M. 1998. Protecting the Arctic: Indigenous Peoples and Cultural Survival. Routledge, London Olmsted N. 2004. ‘Indigenous Rights in Botswana: Development, Democracy and Dispossession,’ Washington University Global Studies Law Review, 3, 799–866. Paffenbarger R.S., Lee I-M. and Leung R. 1994. Physical activity and personal characteristics associated with depression and suicide in American college men. Acta Psychiatrica Scandinavica Supplementum 377, 16–22. Pars T., Osler M. and Bjerregaard P. 2001. Contemporary use of traditional and imported food among Greenlandic Inuit. Arctic 54, 1, 22–31. Peters F. 1972. Acculturation Process Among the Naskopi Indians of Davis Inlet under Influence of the North-American Society. Unpublished Manuscript, Utshimassits: Utshimassits Band Council. Philpott D., Cahill, M., Nesbit, W. and Jeffrey, G. 2004. An Educational Profile of the Learning Needs of Innu Youth, Ottawa: Indian and Northern Affairs Canada. Pickering K. 2004. Decolonizing time regimes: Lakota conceptions of work, economy and society. American Anthropologist 106, (1), 85–97. Plaice E. 1990. The Native Game: Settler Perceptions of Indian/Settler Relations in Central Labrador, St Johns: Institute for Social and Economic Research Press. Popkin B. 1998. The nutrition transition and its health implications in lower-income countries. Public Health Nutrition 1(1), 5–21. Posey D. (ed.). 1999. Cultural and Spiritual Values of Biodiversity. IT Publications and UNEP, London. Pratt A. 2002. Lost Lands, Forgotten Stories: A Woman’s Journey Into the Heart of Labrador, Toronto: HarperCollins Canada. Pretty J. 2002. Agri-Culture. Reconnecting People, Land and Nature. Earthscan, London.
134 Before Agriculture Pretty J. 2004. How nature contributes to mental and physical health. Spirituality and Health International 5(2), 68–78. Pretty J., Griffin M., Hine R., Peacock J, Sellens M. and South N. 2005a. A Countryside for Health and Well-Being: The Physical and Mental Health Benefits of Green Exercise. Sheffield: Countryside Recreation Network. Pretty J., Griffin M. and Sellens M. 2004. Is nature good for you? Ecos 24, 2–9. Pretty J., Peacock J., Sellens M. and Griffin M. 2005b. The mental and physical health outcomes of green exercise. International Journal of Environmental Health Research 15(5), 319–337. Riboli E. and Norat T. 2001. Cancer prevention and diet: opportunities in Europe. Public Health Nutrition 4(2B), 473–484. Rogin M.P. 1987. Ronald Reagan, the movie and other episodes in political demonology. Berkeley: University of California Press. Samson C. 2000/01. Teaching lies: The Innu experience of schooling. London Journal of Canadian Studies 16, 83–102. Samson C. 2003a. A Way of Life That Does Not Exist: Canada and the Extinguishment of the Innu, London: Verso. Samson C. 2003b. Sexual abuse and assimilation: Oblates, teachers and the Innu of Labrador. Sexualities 6(1), 47–54. Samson C., Wilson J. and Mazower J. 1999. Canada’s Tibet: the killing of the Innu, London: Survival International. Sarsfield P. 1977. Report to the Naskapi Montagnais Innu Association and the Labrador Inuit Association Regarding the Health Care Delivery System in Northern Labrador, Sheshatshiu: Naskapi Montagnais Innu Association. Scully D., Kremer J., Meade M., Graham R. and Dudgeon K. 1999. Physical exercise and psychological wellbeing: a critical review. British Journal of Sports Science 32, 11–20. Story M., Stevens J., Himes J., Rock B.H., Ethelbah B. and Davis S. 2003. Obesity in American Indian children: Prevalence, consequences and prevention. Preventive Medicine. 37, Suppl. 1, S3–S12. Tanner V. 1944. Outlines of the Geography, Life and Customs of Newfoundland-Labrador (The Eastern Part of the Labrador Peninsula), two volumes, Cambridge: Cambridge University Press. Tennessen C.M. and Cimprich B. 1995. Views to nature: effects on attention. Journal of Environmental Psychology 15, 77–85. Thouez J.P., Ekoe J.M., Foggin P.M. et al. 1990. Obesity, hypertension, hyperuricemia and diabetes mellitus among the Cree and Inuit of northern Quebec. Artic. Med Res 49, 180–88. Tracy B.L. and G.H. Kramer. 2000. A Method for estimating caribou consumption by Northern Canadians. Arctic 53(1), 42–52. Treasury Board Secretariat. 2004. Labrador Innu Comprehensive Healing Strategy: Plans, Spending and Results for 2003/4. [WWW document] URL http://www.tbs-sct.gc.ca/rma/eppi-ibdrp/hrdbrhbd/lichs-sggil/2003-2004_e.asp#s6 Trudgen R. 2000. Why Warriors Lie Down and Die, Darwin: Aboriginal Resource and Development Services Inc. Tshikapisk Foundation. 2004. Kamestastin Lodge Business and Marketing Plan, New Liskeard, ON: MacLeod Farley and Associates. Turner L. 1979 [1889]. Ethnology of the Ungava District and Hudson Bay Territory: Indians and Eskimos in the Quebec-Labrador Peninsula, Quebec City: Presses Comeditex. Ulrich R.S. 1984. View through a window may influence recovery from surgery. Science 224, 420–21. United States Commission on Civil Rights. 2004. Broken Promises: Evaluating the Native American health care system. Draft report for commissioners’ view, Washington DC: Office of the General Counsel. USDA. 2003. USDA National Nutrient Database for Standard Reference. [WWW document] URL www.nal.usda.gov/fnic
Environmental and Health Benefits of Hunting Lifestyles and Diets 135 Usher P.J. 1976. Evaluating country food in the northern native economy. Arctic 29(2), 105–120. Wagner M.W. 1986. Domestic hunting and fishing by Manitoba Indians: Magnitude, Composition and implications for management. Canadian Journal of Native Studies VI (2), 333–349. Wanless D. 2002. Securing Our Future Health: Taking a Long-Term View. HM Treasury, London. Wein E., Henderson Sabry J. and Evers F.T. 1991. Food consumption patterns and use of country foods by Native Canadians near Wood Buffalo National Park, Canada. Arctic 44 (3), 196–205. Wein E., Freeman M. and Makus J. 1996. Use and preference for traditional foods among the Belcher Island Inuit. Arctic 49 (3), 256–264. Wells N. 2000. At home with nature: effects of ‘greenness’ on children’s cognitive functioning. Environment and Behaviour 32, 775–795. Wells N. and Evans G. 2003. Nearby nature: a buffer of life stress among rural children. Environment and Behaviour 35, 311–330. Whitehouse S., Varni J.W., Seid M., Cooper-Marcus C., Ensberg M.J., Jacobs J.R. and Mehlenbeck R.S. 2001. Evaluating a children’s hospital garden environment: utilisation and consumer satisfaction. J. Environ. Psychology 21, 301–314. Williams K. and Harvey D. 2001. Transcendent experience in forest environments. J. Environ. Psychol. 21, 249–260. Young T.K. 1994. The Health of Native Americans, New York: Oxford University Press.
5
Language: A Resource for Nature Luisa Maffi
The concept of biocultural diversity is becoming increasingly familiar in environmental conservation circles internationally, especially since finding its way into international instruments such as the Convention on Biological Diversity (CBD) after the 1992 Rio Summit (UN Conference on Environment and Development). Article 8(j) of the CBD is specifically concerned with indigenous peoples, traditional knowledge and related rights. It states that each Contracting Party must: Subject to its national legislation, respect, preserve and maintain knowledge, innovations and practices of indigenous and local communities embodying traditional lifestyles relevant for the conservation and sustainable use of biological diversity and promote their wider application with the approval and involvement of the holders of such knowledge, innovations and practices and encourage the equitable sharing of the benefits arising from the utilization of such knowledge, innovations and practices.
Indigenous organizations have been very active vis-à-vis the implementation of Article 8(j) at the meetings of the Conference of the Parties (COP) to the CBD. At the latest meeting (COP IV, 4–15 May 1998, Bratislava, Slovakia), they succeeded in passing a decision that calls for the creation of a continuous working group in charge of advising on the measures necessary to protect indigenous peoples’ knowledge, innovations and practices. In spite of persisting concerns about being actually enabled to participate in the working group and affect its recommendations, indigenous organizations consider this decision a success on the road to full recognition of the importance of their environmental knowledge and practices for the conservation and sustainable use of biological diversity. While the processes surrounding the CBD have been in the spotlight, it is perhaps less well known that the first international document to incorporate an integrated notion of biocultural diversity was the Declaration of Belém of the International Society of Ethnobiology, elaborated in 1988 at the First International Congress of Ethnobiology in Belém, Brazil. Aware of the simultaneous L Maffi, Laguage: A resource for nature, in: Nature and Resources, The UNESCO Journal on the Environment and Natural Resources Research, 34(4), pp. 12–21 © UNESCO, used by permission of UNESCO.
Language: A Resource for Nature 137
extinction threats facing tropical and other fragile ecosystems on the one hand, and indigenous peoples on the other, ethnobiologists stressed indigenous peoples’ stewardship over the world’s biological resources and affirmed the existence of an ‘inextricable link’ between cultural and biological diversity on Earth. Interestingly, at about the same time, linguists were beginning to voice widespread concern on the status of the world’s languages and to warn of another impending extinction crisis, of a magnitude and pace comparable to, if not greater than, that affecting biodiversity: one that would dramatically reduce linguistic diversity through the disappearance of most of the numerically small languages spoken by indigenous and minority peoples. In linguists’ calls to action vis-à-vis this crisis, a parallel was often drawn with the loss of biodiversity, as a way of suggesting comparable damage to humanity’s heritage. However, in these initial pronouncements, no significant attempt was made to go beyond such parallels and ask whether there might be more than a metaphorical relationship between these phenomena. It is only recently that this question has been explicitly asked and the idea proposed that, along with cultural diversity, linguistic diversity should also be seen as inextricably linked to biodiversity.1 The present article2 seeks to contribute to the debate on these issues and linkages.
Linguistic Diversify and Biodiversity Defining and measuring linguistic diversity In order to address this issue, let us begin by defining linguistic diversity. As with biodiversity, there are various definitions of linguistic diversity. Most commonly, however, the number of different languages spoken on Earth is used as a proxy for global linguistic diversity. There are an estimated 5000 to 7000 languages spoken today on the five continents, of which 32 per cent in Asia, 30 per cent in Africa, 19 per cent in the Pacific, 15 per cent in the Americas, and 3 per cent in Europe. Of these languages, about half are spoken by communities of 10,000 speakers or less; half of these, in turn, are spoken by communities of 1000 or fewer speakers (Figures 5.1–5.2). Overall, languages with up to 10,000 speakers total about 8 million people, less than 0.2 per cent of an estimated world population of 5.3 billion.3 On the other hand, of the remaining half of the world’s languages, a small group of less than 300 (such as Chinese, English, Spanish, Arabic, Hindi and so forth) are spoken by communities of 1 million speakers or more, accounting for a total of over 5 billion speakers, or close to 95 per cent of the world’s population (Figure 5.3). The top ten of these alone actually comprise almost half of this global population.
Indigenous and minority languages at risk Taken together, these figures show that, while more than nine out of ten people in the world are native speakers of one, or other, of only about 300 languages, most
138 Before Agriculture
Source: From Harmon (1995)3
Figure 5.1 Size classification of world’s languages by number of mother-tongue speakers
Source: From Harmon (1995)3
Figure 5.2 Proportion of world’s living languages by size category (n = 6526)
Language: A Resource for Nature 139
Source: From Harmon (1995)3
Figure 5.3 Languages with the most mother-tongue speakers: proportion of world population
of the world’s linguistic diversity is carried by very small communities of indigenous and minority people. These are the languages that have been and continue to be under threat, due to the ever-growing assimilation pressures that promote incorporation of their speakers into ‘mainstream’ society and the collective abandonment of the native languages in favour of majority languages (a phenomenon known as ‘language shift’). Virtually all languages with 1000 speakers or less are threatened in this sense, although even more widely spoken languages are fully susceptible to the same pressures. Many of these smaller languages are already at risk of disappearing due to a drastic reduction in the number of their speakers, with younger generations decreasingly or no longer learning their language of heritage. Many more have reached a stage of near extinction, with only a few elderly speakers left. Statistics on ‘nearly extinct’ languages range between 6 and 11 per cent of the currently spoken languages. In some projections, as many as 90 per cent of the world’s languages may disappear during the course of the next century. These figures portray a threat to linguistic diversity that may be far greater and more imminent than the threat facing biodiversity. It is a historical fact that languages, like biological species, have undergone extinction before. Informed guesses suggest that the peak of linguistic diversity on Earth may have occurred at the beginning of the Neolithic (10,000 years Before Present), at which time more than twice the current number of languages may have been spoken. Population movements and political and economic expansion
140 Before Agriculture
have long contributed to reducing linguistic diversity everywhere in the world, even well before the era of colonization and empire building. As with biodiversity, however, what is unprecedented is an extinction crisis of the present magnitude and pace. It has been estimated that there may already be 15 per cent fewer languages now than 500 years ago, when the era of European colonization began.4 Losses have been especially marked in the Americas and Australia. And the trend is now accelerating throughout the world, with Australia and the Americas (especially the US) still in the lead.
Causes of language loss By and large, the main waves of colonial and imperial expansion in human history (both European and of other major civilizations) have come not only to the detriment of local peoples’ sovereignty and control over their ancestral territories, resources and cultural traditions, but also to the detriment of their ancestral languages. Whenever assimilation into the dominant culture has been the goal (as it has been in most cases), this assimilation has been effected crucially by way of linguistic assimilation, through the imposition of the dominant language in schooling, the media, government affairs and most other public contexts – and, in parallel, through the denigration of the local languages (and the cultures they embody) as defective, primitive, unfit for the ‘modern world’, as well as through the severe restriction of their contexts of use and even the explicit prohibition of and punishment for their use. Awareness of the political implications of linguistic assimilation was perhaps never better expressed than by the 15th-century Spanish grammarian Antonio de Nebrija. In 1492, presenting Queen Isabella of Spain with his grammar of Spanish (the first grammar of any modern European language), Nebrija so explained its purposes in his introduction: ‘Language has always been the consort of empire’.5
The ‘curse of Babel’ debunked We may well feel sorry for the speakers of these smaller languages who have lost or are losing their ancestral tongues. But is it not the case that this linguistic assimilation is ultimately just an inevitable consequence of the in turn inevitable process of globalization the world is witnessing? Is this not, after all, a small price to pay for intercommunication and world stability? At long last, a widespread attitude has it, humanity will be freed of the burden laid upon it by the ‘curse of Babel’: the multiplicity of languages. With fewer different languages in use, this line of reasoning goes, it will be easier to communicate with people elsewhere in the world; once marginalized populations will be able to develop and prosper: ethnic conflict will decrease; national unity will no longer be threatened; and we will finally be moving toward the globalized cosmopolitan world that is the ultimate destiny of humanity. However – whatever we may think about the inevitability of globalization and the ultimate destiny of humanity – none of these arguments is supportable. First,
Language: A Resource for Nature 141
they are mostly expounded by speakers of languages that are comfortably not at risk of going extinct. Second, and very importantly, the learning of other languages does not have to occur at the cost of losing one’s own language (in technical terms, it does not have to be subtractive); it can be additive, leading to a situation of stable multilingualism in one’s mother tongue and one or more other languages. Again, it is rare for indigenous or minority groups to abandon their languages in favour of a majority one without direct or indirect pressures from governments and other outside forces. Faced with the challenges of modernity, indigenous and minority language speakers may or may not wish to preserve their own languages and cultural traditions, but should not have to find themselves systematically pressured into the latter choice. Indeed, one may seriously question whether choice under such pressure can be called choice at all. Furthermore, marginalized ethnic groups who opt for or are forced into assimilation into a linguistic and cultural majority often do not succeed in overcoming their marginalization but end up among the dispossessed within ‘mainstream’ society. As for the issue of ethnic conflict and national security, specialized studies show that ethnic differences (whether identified with language, culture, religion, or any aspects of social organization) do not normally constitute the source of conflict, although they may be seized upon and attributed special meaning as a basis for mobilization when conflict arises. In particular, there is no evidence to suggest that the use of different languages by neighbouring populations may constitute per se a cause of conflict; nor, for that matter, does monolingualism within or between countries seem to be a guarantee for peace. When populations of speakers of different languages coexisting in adjacent or the same territory do come into conflict, the causes of such conflict reside more commonly in socioeconomic and political inequality and competition over land and resources, as well as in the denial (rather than the granting) of linguistic and cultural rights.6 The idea of Babel as a ‘curse’ is a widespread interpretation of this element of the Judaeo-Christian religious tradition, yet not necessarily a valid one. It is perhaps more accurate to see the divine intervention that brings about a multiplicity of languages as a way of curbing the arrogance and single-mindedness of monolingual empire builders. Other religious traditions suggest that a diversity of languages (and cultures) is a good thing. To cite just one example, according to the Acoma Pueblo Indians of New Mexico, the mother goddess latiku causes people to speak different languages so that it will not be as easy for them to quarrel.
Multilingualism and linguistic ecologies Above all, these arguments completely ignore that – for most of human history, and even today in many parts of the world – high concentrations of different languages have coexisted side by side in the same areas. Over 800 different languages are still spoken in the island of New Guinea – the main hotspot of linguistic diversity. There and elsewhere, complex networks of multilingualism in several local languages and pidgins or lingua francas have been a commonplace way of dealing
142 Before Agriculture
with cross-language communication in situations of contact. This extensive multilingualism has been a key factor in the maintenance of linguistic diversity historically, countering the increasing effects of linguistic assimilation. Linguists are only beginning to realize that there may be structure to such linguistic diversity. The functional relationships that develop in space and time among linguistic communities that communicate across language barriers have been referred to as ‘linguistic ecologies’. An ecological theory of language takes as its focus the diversity of languages per se, and investigates the functions of such diversity in the history of humanity. It seeks to identify the mechanisms that sustain a language ecology over time – which are, in fact, the very same mechanisms that will be required to build a genuine multilingual and multicultural society in today’s global world. Furthermore, the study of traditional linguistic ecologies reveals that they encompass not only the linguistic and social environment, but also the physical environment, within a worldview in which physical reality and the description of that reality are not seen as separate phenomena, but instead as interrelated parts of a whole.7
Language and the Environment: the Inextricable Link Overlap of linguistic and biological diversity To understand how language and the environment may be seen as parts of the same whole, let us first consider some striking correlations between linguistic and biological diversity.8 The majority of the smaller languages (which, as we have seen, account for most of the world’s linguistic diversity) can be labelled as ‘endemic’, in that they are spoken exclusively within this or that country’s borders. Comparing a list of countries by number of endemic languages with the IUCN list of ‘megadiversity’ countries, one finds that 10 out of the top 12 megadiversity countries (or 83 per cent) also figure among the top 25 countries for endemic languages (Table 5.1). A global cross-mapping of endemic languages and higher vertebrate species brings out the remarkable overlap between linguistic and biological diversity throughout the world. Similar results can be obtained by cross-mapping endemic languages and flowering plant species.
Language, knowledge and human–environment coevolution What may account for these correlations? Several geographical and environmental factors have been suggested that may comparably affect both biological and linguistic diversity, and especially endemism: (1) Extensive land masses with a variety of terrains, climates and ecosystems (e.g. Brazil, China, India, Mexico, US); (2) Island territories, especially with internal geophysical barriers (such as Australia,
Language: A Resource for Nature 143 Table 5.1 Megadiversity countries: concurrence with endemic languages • • • • • • • • • • • •
Australia (5) Brazil (8) China (17) Colombia (23) Democratic Republic of the Congo (9) Ecuador (–) India (4) Indonesia (2) Madagascar (–) Malaysia (15) Mexico (6) Peru (18) Concurrence: 10 of 12 (83%)
Countries in top 25 for endemic languages in bold*. Country listed alphabetically (endemic language rank in parentheses). Source: *Modified from Harmon (in press). ‘Megadiversity countries’ have been identified as those likely to contain a large percentage of global species richness. The 12 listed were identified on the basis of species lists for vertebrates, swallowtail butterflies and higher plants
Indonesia, New Guinea, the Philippines); (3) Tropical climates, fostering higher numbers and densities of species (e.g. Cameroon, Democratic Republic of the Congo). All these factors are thought to increase linguistic diversity by increasing mutual isolation between human populations and thus favouring linguistic diversification. In addition, an ecological phenomenon has also been proposed as possibly accounting for biodiversity-linguistic diversity correlations: a process of coevolution of small-scale human groups with their local ecosystems, in which over time humans interacted closely with the environment, modifying it as they adapted to it, and acquiring intimate knowledge of it. This knowledge was encoded and transmitted through the local languages, which thus became in turn moulded by and specifically adapted to their socio-ecological environments. As one linguist puts it: ‘Life in a particular human environment is dependent on people’s ability to talk about it.’9 This may sound like a truism worthy of little note, but it is not so. That remark embodies one of the most basic functions that language performs for humans, and in its deceptive simplicity reveals where the ‘inextricable link’ between language and the environment is to be found. At the local level, linguistic and cultural distinctiveness has often developed even among human groups defined as belonging to the same cultural area or whose languages are considered to be historically related, and who live within the same bioregion. As local groups have adapted to life in specific ecological niches, they have developed specialized knowledge of them, and specialized ways of talking about them, to convey this vital knowledge and ways of acting upon it for individual and group survival. What has
144 Before Agriculture
been said of Australian Aboriginal tribes could be said in hundreds of other cases of local peoples around the world: ‘Coincidences of tribal boundaries to local ecology are not uncommon and imply that a given group of people may achieve stability by becoming the most efficient users of a given area and understanding its potentialities.’10
Linguistically anthropogenic landscapes In this light, then, it becomes possible to suggest that landscapes are anthropogenic (human-made) not only in the sense that they are physically modified by human intervention – as ethnobiologists and ethnoecologists have shown contra the myth of pristine wildernesses – but also because they are symbolically brought into the sphere of human communication by language: by the words, expressions, stories, legends, songs that encode and convey human relationships with the environment and that inscribe the history of those relationships onto the land. Traditional place-naming also both occurs in an ecological context and carries high cultural significance for indigenous peoples, ‘as a framework for cultural transmission and moral instruction, as a symbolic link to their land, and as a ground for their identity’. Named landmarks convey and evoke knowledge on both the physical environment and daily human activities, historical events, social relations, ritual and moral conduct: ‘wisdom sits in places’.11 Landscapes are networks of such places of knowledge and wisdom and thus, in this sense also, anthropogenic.
Losing the Link The extinction of experience It is this inextricable link between language and the environment that is lost when external forces begin to undermine traditional cultures, pushing them into the ‘mainstream’. Whether this process is propelled by dispossessing local peoples of their sovereignty over land and resources, trampling their cultural traditions, or promoting linguistic assimilation (generally, all three phenomena occur at once and are mutually reinforcing), the end result is the same. Local peoples lose control over, and contact with, their natural and cultural environments. As they are removed from their lands, or subsist in highly degraded ecosystems, and are absorbed into a market economy in which there normally is little room for traditional subsistence practices and resource use, local ecological knowledge and beliefs find the wisdom about human–environment relationships begin to lose their relevance to people’s lives. This phenomenon has been called the ‘extinction of experience’, the radical loss of direct contact and hands-on interaction with the surrounding environ-
Language: A Resource for Nature 145
ment.12 In turn, local languages lose their crucial function of communicating and upholding such knowledge, beliefs and wisdom that are increasingly less significant and intelligible to younger generations. Furthermore, local knowledge does not ‘translate’ easily into the majority language to which minority language speakers switch; and along with the dominant language usually comes a dominant cultural framework that begins to take over and displace the traditional one. Because in most cases indigenous knowledge is only carried by oral tradition, when shift toward ‘modernization’ and dominant languages occurs and oral tradition in the native languages is not kept up, local knowledge is lost. Due to its place-specific and subsistence-related nature, local ecological knowledge is at an especially high risk of disappearing.
Knowledge loss The patterns and factors of erosion of languages and linguistically encoded environmental knowledge are beginning to be systematically identified and quantified. For example, among the Piaroa Indians of Venezuela, the persistence of ethnobotanical knowledge has been found to negatively correlate with age, bilingualism and schooling (Figures 5.4–5.7).13 Younger, more acculturated Piaroa show dramatically lower levels of competence than their older, less acculturated counterparts in identifying local plants by their Piaroa names and the cultural uses of those same plant species.
The regression lines drawn represent: (a) a linear or binomal model (r2 = 0.539; y = 0.2739 + 0.0126x); and (b) a curvilinear or polynomial model (r2 = 0.625; y = 8.3118 + 0.4465x – 3.359√x – 15.7723x2 – 0.0023x3). Source: Zent (in press)13
Figure 5.4 Regression of age and ethnobotanical competence among the Piaroa of Venezuela
146 Before Agriculture
The regression lines drawn here represent: (a) a linear model for 30 and above age group (r2 = 0.002; y = 0.8176 + 0.00032x); and (b) a linear model for below 30 age group (r2 = 0.296; y = 0.1786 + 0.017x). Source: Zent (in press)13
Figure 5.5 Regression of age and ethnobotanical competence according to age subgroups among the Piaroa of Venezuela
The regression lines drawn here represent: (a) a linear or binomial model (r2 = 0.113; y = 0.727 – 0.0667x); and (b) a curvilinear or polynomial model (r2 = 0.209; y = 0.8154 – 0.226x + 0.0162x3). Source: Zent (in press)13
Figure 5.6 Regression of bilingual ability and ethnobotanical competence among the Piaroa of Venezuela
Language: A Resource for Nature 147
The regression lines drawn here represent: (a) a linear or binomial model (r2 = 0.22: y = 0.7471 – 0.0307x); and (b) a curvilinear or polynomial model (r2 = 0.415; y = 1.7739 + 0.2311x – 1.1022√x – 0.0009/x). Source: Zent (in press)13
Figure 5.7 Regression of formal education and ethnobotanical competence among the Piaroa of Venezuela
Often, the loss of traditional languages and cultures may be hastened by environmental degradation – such as logging, mining, agribusiness, cattle-raising and so forth – by creating a negative feedback loop. In the Yoeme pueblo of the Yaqui people of the Sonoran Desert in Arizona, the performance of Yoeme ritual is hampered by the disappearance from the local environment of many plant species that were traditionally employed in religious ceremonies. Ritual is one of the main contexts for the teaching of the Yoeme Truth, and in particular of the intimate spiritual and physical connection with and respect for nature. ‘Yaquis have always believed that a close communication exists among all the inhabitants of the Sonoran desert world in which they live: plants, animals, birds, fishes, even rocks and springs. All of these come together as a part of one living community which Yaquis call the huya ania, the wilderness world … Yaquis regard song [as a part of ritual] as a special language of this community, a kind of “lingua franca of the intelligent universe”.’ The Yoeme elders’ inability to correctly perform ritual due to environmental degradation thus contributes to precipitating language and knowledge loss, and creates a vicious circle that in turn affects the local ecosystem.13
148 Before Agriculture
Preserving and Restoring Language, Culture, and Land Community efforts The Yoeme example clearly shows how, for local peoples, the struggle for maintaining or restoring the integrity of their cultures, languages and environments configures itself as one interrelated goal. This holistic approach is increasingly evident in the grassroots efforts that are being made around the world. As an example, Native Californians are engaging in integrated biocultural conservation efforts. The linguistic and cultural revival activities in which they are involved go hand in hand with advocacy for environmental restoration on their lands and the renewed use of native plants for traditional handicrafts, such as basket-weaving, and for other purposes. On the other hand, if acculturation has such measurably negative effects on traditional knowledge and languages, as in the case of the Piaroa, should local peoples reject the framework of modernity altogether, including the Western schooling that brings about dominant languages and cultural patterns – or, for that matter, the biomedical care that undermines the prestige of traditional medicine, and other similar cultural change? Some indigenous groups, such as certain Amazonian tribes, have made this choice, taking refuge deeper into the forest. Others have chosen to integrate aspects of the two worlds, for instance by combining formal schooling with curricula based on their own cultural traditions and formulated in their native languages. The Hawaiians and Maori have been at the forefront of the latter kind of approach. In still other cases, educational efforts have been aimed at marking the distinction between formal Western-type learning and traditional informal learning. In Australia, several Aboriginal groups use an approach whereby they separate ‘white knowledge’ (literacy, numeracy, etc.), taught by monolingual English-speakers, with White-Australian content and structure, from their own Aboriginal knowledge. Their own knowledge is ‘lived’ rather than taught in schools.14
The need for choices Whatever choices local peoples may make – and as we have seen, they make a variety of them – what matters is that there be choices. As in the case of language learning (acquisition of a majority language does not have to be subtractive; it can and should be additive), it does not have to be a matter of either–or between different cultural frameworks (as it is far too often purported to be by dominant cultures). Local peoples must simply remain free to consciously choose if and how much of either framework – the traditional and the exogenous – they may wish to maintain or adopt. Some groups, as in the Amazonian case, may indeed choose isolation. But others, perhaps most, will probably choose some form of integration between, or parallel adoption of, frameworks. And in so doing, after all, they will not be doing anything different – if done in freedom and not under pressure –
Language: A Resource for Nature 149
from what humans throughout history have done in situations of contact: mixing and matching, which has contributed to so much of the cultural and linguistic diversity that we know today.
Language as a Resource Linguistic diversity and the human potential So far, questions about the consequences of loss of linguistic and cultural diversity have been raised mostly in terms of ethics and social justice, and of maintaining the human heritage from the past – and rightly so. However, when we consider the interrelationships between linguistic, cultural and biological diversity, we may begin to ask these questions also as questions about the future – as related to the continued viability of humanity on Earth. We may ask whether linguistic and cultural diversity and diversification may not share substantive characteristics with biological diversity and diversification, characteristics that are ultimately those of all life on Earth. The relevant issues relate to the adaptive nature of variation in humans (as well as other species), and to the role of language and culture as providers of diversity in humans. Human culture is a powerful adaptation tool, and language at one and the same time enables and conveys much cultural behaviour. While not all knowledge, beliefs and values may be linguistically encoded, language represents the main instrument for humans to elaborate, maintain, develop and transmit such ideas. ‘Linguistic diversity … is at least the correlate of (though not the cause of ) diversity of adaptational ideas.’ Therefore, it is possible to suggest that ‘any reduction of language diversity diminishes the adaptational strength of our species because it lowers the pool of knowledge from which we can draw’.15 It is true that diversity characterizes languages (and cultures) not just with respect to one another, but also internally, with patterns of variation by geographical location, age grade, gender, social status and a host of other variables. This internal variation combines with the variation ensuing from historical contact among human populations propelling language and culture change and all manner of innovation. However, as more and more languages and cultural traditions are overwhelmed by more dominant ones and increasing homogenization ensues, one of the two main motors of change and innovation – the observation of linguistic and cultural difference – breaks down, or is seriously damaged. The end result is a global loss of diversity.
Avoiding ‘cultural blind spots’ From this perspective, issues of linguistic and cultural diversity preservation may then be formulated in the same terms that have been proposed for biodiversity
150 Before Agriculture
conservation: as a matter of ‘keeping options alive’ and of presenting ‘monocultures of the mind’.16 It has been argued that convergence toward majority cultural models increases the likelihood that more and more people will encounter the same ‘cultural blind spots’ – undetected instances in which the prevailing cultural model fails to provide adequate solutions to societal problems. Instead, ‘[i]t is by pooling the resources of many understandings that more reliable knowledge can arise’; and ‘access to these perspectives is best gained through a diversity of languages’. Or simply stated: ‘Ecology shows that a variety of forms is a prerequisite for biological survival. Monocultures are vulnerable and easily destroyed. Plurality in human ecology functions in the same way.’17
Supporting Linguistic, Cultural and Biological Diversity: the Role of Scientists Benefit for the many or for the few? Pronouncements on the importance of diversity often conclude on some universalistic note. Yet it is time to go beyond these general (and generic) statements, true as they may be. That we need diversity – cultural, linguistic, biological – for the benefit of humanity is undoubtedly true. But far too often, as local peoples are the first to know, the hailed ‘benefit for humanity’ has actually meant the benefit (and specifically the economic benefit) of a very small, privileged subset of said humanity, one that does not include that vast majority of humans in which most of this diversity resides. Ethnoscientists have realized to their dismay that they may have been even too successful in affirming the validity of traditional ethnobiological and ethnomedical knowledge – thus unwittingly attracting droves of unscrupulous bioprospectors (‘biopirates’) to the lands of the indigenous peoples whose knowledge they have painstakingly documented. Supporters of cultural diversity baulk at the thought that someone may now be earning large sums of money selling multicultural T-shirts in the places where cultural diversity least abounds. And if we are good enough at explicating and advocating for the role of language in the diversity equation, the time may not be far away when someone will begin to devise ways to make a business out of linguistic diversity – and not to the advantage of those who hold most of it.
Terralingua As we work for the maintenance of cultural, linguistic and biological diversity, we must be constantly aware of these risks. And this is why research, applied work, and advocacy must go hand in hand today. This is not to say that basic research is no longer needed, but it is to say that it can no longer proceed in a vacuum, and that scientists need to educate themselves and others as to the nature and implications of
Language: A Resource for Nature 151
what they do. It also means that scientists must become much better at listening to what indigenous and other local peoples around the world have to say about what they want and need, and be more prepared to ask if and how they can be of service. With these thoughts in mind, in 1996, an international and multicultural group of scholars and professionals created the non-governmental organization Terralingua: Partnerships for Linguistic and Biological Diversity, which is devoted to a mixture of research, information, applied work and advocacy concerning the world’s linguistic diversity and its relationships with biodiversity (Box 5.1). Among the basic principles guiding Terralingua’s work are: • • •
• •
that the diversity of languages and their variant forms is a vital part of the world’s cultural diversity; that biological diversity and cultural diversity (of which linguistic diversity is a major component) are not only related, but often inseparable, perhaps causally connected through coevolution; that, like biological diversity, linguistic diversity (represented mostly by indigenous languages) is facing rapidly increasing threats that are causing a drastic loss of both languages and the knowledge of which they are carriers, including knowledge on the environment and sustainable resource use; that the continued loss of linguistic, cultural and biological diversity will have dangerous consequences for humans and the Earth; and that, therefore, the fate of the lands, languages and cultures of indigenous peoples is decisive for the maintenance of biodiversity and linguistic and cultural diversity.18
Acknowledging the link Over the past two years, Terralingua has been striving to promote this perspective both locally and globally in support of indigenous as well as minority communities’ struggle to holistically preserve and protect their linguistic, cultural and natural environments through self-determination (or local determination in the case of local communities). It is apparent that these concerted efforts are beginning to make a difference, and that recognition of the inextricable link between linguistic and biological diversity is beginning to emerge internationally. The International Society of Ethnobiology has enshrined this perspective in its Draft Code of Ethics,19 which states that: ‘Culture and language are intrinsically connected to land and territory, and cultural and linguistic diversity are inextricably linked to biological diversity’, and upholds the right to preserve and protect local languages as a part of the principle of self-determination. International bodies such as UNESCO, UNEP and the UN Centre for Human Rights are turning their attention to issues of indigenous languages within the framework of biocultural diversity preservation and the protection of the rights of indigenous peoples. It is likely that in the near future the notion of linguistic diversity will become as familiar as that of cultural
152 Before Agriculture
Box 5.1 Terralingua … at a glance ‘Terralingua: Partnerships for Linguistic and Biological Diversity’ is an international non-profit organization dedicated to: • •
Supporting the perpetuation and continued development of the world’s linguistic diversity, and Exploring the connections between linguistic, cultural and biological diversity.
Statement of purpose A. Terralingua recognizes: 1. That the diversity of languages and their variant forms is a vital part of the world’s cultural diversity; 2. That cultural diversity and biological diversity are not only related, but often inseparable; and 3. That, like biological species, many languages and their variant forms around the world are now faced with an extinction crisis whose magnitude may well prove very large. B. Terralingua declares: 4. That every language, along with its variant forms, is inherently valuable and therefore worthy of being preserved and perpetuated, regardless of its political, demographic or linguistic status; 5. That deciding which language to use, and for what purposes, is a basic human right inhering to members of the community of speakers now using the language or whose ancestors traditionally used it; and 6. That such usage decisions should be freely made in an atmosphere of tolerance and reciprocal respect for cultural distinctiveness – a condition that is a prerequisite for increased mutual understanding among the world’s peoples and a recognition of our common humanity. C. Therefore, Terralingua sets forth the following goals: 7. To help preserve and perpetuate the world’s linguistic diversity in all its variant forms (languages, dialects, pidgins, creoles, sign languages, languages used in rituals, etc.) through research, programmes of public education, advocacy and community support. 8. To learn about languages and the knowledge they embody from the communities of speakers themselves, to encourage partnerships between communitybased language/cultural groups and scientific/professional organizations who are interested in preserving cultural and biological diversity, and to support the right of communities of speakers to language self-determination. 9. To illuminate the connections between cultural and biological diversity by establishing working relationships with scientific/professional organizations and individuals who are interested in preserving cultural diversity (such as linguists, educators, anthropologists, ethnologists, cultural workers, native advocates, cultural geographers, sociologists, and so on) and those who are interested in preserving biological diversity (such as biologists, botanists, ecologists, zoologists, physical geographers, ethnobiologists, ethnoecologists, conservationists, environmental advocates, natural resource managers and so on), thus promoting the joint preservation and perpetuation of cultural and biological diversity. 10. To work with all appropriate entities in both the public and private sectors, and at all levels from the local to the international, to accomplish the foregoing.
Language: A Resource for Nature 153
diversity in the debates surrounding international instruments concerned with biodiversity, such as the CBD. As this process unfolds, we are coming full circle to a holistic view of language, culture and land that may have once characterized localized human communities throughout the world, and that indigenous peoples today are holding up for the rest of humanity to see.
Notes 1
2
3
4
5
6
On language endangerment, see especially: Krauss, M. 1992. The world’s languages in crisis. Language 68(1): 4–10. An integrated perspective on linguistic, cultural and biological diversity was developed in particular at the international interdisciplinary working conference ‘Endangered Languages, Endangered Knowledge, Endangered Environments’ (Berkeley, California, 25–27 October 1996). See: (a) Maffi, L. 1997. Language, knowledge and the environment: Threats to the world’s biocultural diversity. Anthropology Newsletter 38(2): 11; (b) Maffi, L. (ed.). forthcoming. Language, Knowledge and the Environment: The Interdependence of Biological and Cultural Diversity. Submitted to Oxford University Press. This article draws in part on the author’s contribution to the chapter ‘Linguistic Diversity’, cowritten with T. Skutnabb-Kangas and J. Andrianarivo, in the forthcoming volume Cultural and Spiritual Values of Biodiversity, edited by Darrel Posey for the United Nations Environment Programme (UNEP). For the most comprehensive catalogue of the world’s languages, see: Grimes, B. (ed.). 1996. Ethnologue: Languages of the World. 13th edn. Summer Institute of Linguistics, Dallas. Available on the World Wide Web @ http://www.sil.org/ethnologue/. The mentioned figures do not include sign languages, that may be almost as numerous as oral languages. The data on classification of languages by number of mother-tongue speakers and relative size are from: Harmon, D. 1995. The status of the world’s languages as reported in the Ethnologue: Southwest Journal of Linguistics, 14: 1–33. Figures 5.1–5.3 are reproduced from Harmon (1995); with the author’s permission. The statistics on ‘nearly extinct’ languages are from Harmon (1995), see note 3 above. The estimate of the possible magnitude of impending linguistic diversity loss is from: Krauss (1992), see note 1 above. For hypotheses on the historical peak of linguistic diversity, see: Hill, J.H. 1997. The meaning of linguistic diversity: Knowable or unknowable? Anthropology Newsletter, 38(1): 9–10. For estimates of linguistic diversity loss since the colonial era, see: Bernard, R. 1992. Preserving language diversity. Human Organization, 51(1): 82–9. On the causes of language loss see: Wurm, S.A. 1991. Language death and disappearance: Causes and circumstances. In: Robins, R.H.; Uhlenbeck, E.M. (eds), Endangered Languages, pp. 1–18. Berg, Oxford. The Nebrija quote is reported on p. 6 of: Illich, I. 1981. Taught mother tongue and vernacular tongue. In Pattanayak, D.P., Multilingualism and Mother-Tongue Education, pp. 1–46. Oxford University Press. Delhi. The issue of additive vs. subtractive bilingualism is treated extensively in: Skutnabb-Kangas, T. 1984. Bilingualism or Not: The Education of Minorities. Multilingual Matters, Clevedon, UK. On ethnic groups, marginalization, and ethnic conflict, see: (a) Bodley, J.H. 1990. Victims of Progress. Mayfield Publishing Co., Mountain View, CA. (b) Pattanayak, D.P. 1988. Monolingual myopia and the petals of the Indian lotus: Do many languages divide or unite a nation? In: SkutnabbKangas, T.; Cummins, J. (eds), Minority Education: from Shame to Struggle, pp. 379–89. Multilingual Matters, Clevedon, UK. (c) Stavenhagen, R. 1990. The Ethnic Question: Conflicts, Development, and Human Rights. United Nations University Press, Tokyo.
154 Before Agriculture 7
8
9
10 11
12
13
14
15
16
The concept of ‘linguistic ecology’ described here is due to Peter Mühlhausler, building on earlier work by Einar Haugen. See: (a) Mühlhausler, P. 1996. Linguistic Ecology: Language Change and Linguistic Imperialism in the Pacific Rim. Routledge, London. (b) Haugen, E. 1972. The Ecology of Language. Stanford University Press, Stanford. The correlations reported here are from: Harmon, D. in press. Losing species, losing languages: Connections between biological and linguistic diversity. Southwest Journal of Linguistics. Figure 5.4 and Table 5.1 are reproduced from Harmon (in press) with the author’s permission. The source of biodiversity data in Table 5.1 is: McNeely, J. et al. 1990. Conserving the World’s Biological Diversity. IUCN/WRI/CI/WWF-US/The World Bank, Gland, Washington DC. Source for linguistic-diversity data: Grimes, B. (ed.). 1992. Ethnologue: Languages of the World. 12th edition. Summer Institute of Linguistics, Dallas. The discussion of factors of linguistic diversity-biodiversity correlations is from: Harmon (in press), note 8 above. The quote is from p. 155 of: Mühlhausler, P. 1995. The interdependence of linguistic and biological diversity. In: Myers, D. (ed.), The Politics of Multiculturalism in the Asia/ Pacific, pp. 154–61. Northern Territory University Press, Darwin. Quoted from p. 133 of: Tindale, N.B. 1974. Aboriginal Tribes of Australia. University of California Press, Berkeley. The quote on place names is from p. 4 of: Huhn, E.S. 1996. Columbia Plateau place names: What can they teach us? Journal of Linguistic Anthropology, 6(1): 3–26. The expression ‘wisdom sits in places’ is derived from: Basso, K.H. 1996. Wisdom Sits in Places: Landscape and Language among the Western Apache. University of New Mexico Press, Albuquerque. See Nabhan, G.P.; St Antoine, S. 1993. The loss of floral and faunal story: The extinction of experience. In: Kellett, S.R.; Wilson, E.O. (eds), The Biophilia Hypothesis, pp. 229–50. Island Press, Washington DC. For the Piaroa study, see: Zent, S. in press. The quandary of conserving ethnoecological knowledge: A Piaroa example. In Blount, B.G.; Gragson, T.S. (eds), Ethnoecology: Knowledge, Resources and Rights. Georgia University Press, Athens. The Yoeme case is described in: Molina, E.S. 1998. Wa huya ania ama vutti yo’oriwa – the wilderness world is respected greatly: The Yoeme (Yaqui) truth from the Yoeme communities of Arizona and Sonora, Mexico. In: Maffi, L. (ed.), forthcoming. Language, Knowledge and the Environment: The Interdependence of Biological and Cultural Diversity. Submitted to Oxford University Press. The quote is from p. 18 of: Evers, L.; Molina, F.S. 1987. Maso Bwikam/Yaqui Deer Songs: A Native American Poetry. Sun Track and University of Arizona Press, Tucson. Figures 5.5–5.8 are reproduced from Zent (in press), with the author’s permission. On Native Californians, see: Manriquez, L.F. 1998. Silent no more; California Indians reclaim their culture – and they invite you to listen. In: Maffi, L. (ed.) forthcoming. Language, Knowledge and the Environment: The Interdependence of Biological and Cultural Diversity. Submitted to Oxford University Press. On Hawaiians, see: Kamana, K.; Wilson, W.H. 1996. Hawaiian language programs. In: Cantoni, G. (ed.), Stabilizing Indigenous Languages, pp. 153–6. Center for Excellence in Education, Northern Arizona University: Flagstaff, AZ. On Maori, see Benton, R.A. 1996. Language policy in New Zealand: Defining the ineffable. In Hernman, M.; Burnaby, B. (eds), Language Policies In English-Dominant Countries; Six Case Studies, pp. 62–98. Multilingual Matters, Clevedon/Philadelphia/Adelaide. On Australian Aborigines, see: Harris, S. 1990. Two-way Aboriginal Schooling. Education and Cultural Survival. Aboriginal Studies Press, Canberra. For a review of commonly proposed reasons for preserving languages, see: Thieberger, N. 1990. Language maintenance: Why bother? Multilingua, 9(4): 333–58. The quotes are from p. 82 of Bernard (1992), see note 4 above. See also: Diamond, J. 1993. Speaking with a single tongue. Discover, 14(2): 78–85. See: (a) Reid, W.V.; Miller, K.R. 1993. Keeping Options Alive: The Scientific Basis for Conserving the Biodiversity. World Resources Institute, Washington DC. (b) Shiva, V. 1993. Monocultures of
Language: A Resource for Nature 155 the Mind: Perspectives on Biodiversity and Biotechnology. Zed Books, London/Atlantic Heights, NJ. 17 The two quotes are: (a) from p. 160 of Mühlhausler (1995), see note 7 above; (b) from p. 380 of Patanayak (1988), see note 6 above. 18 Terralingua can be reached by e-mail at: , or on the World Wide Web at: http://cougar.ucdavis.edu/nas/terralin/home.html. 19 To be submitted for approval by the membership at the Sixth International Congress of Ethnobiology, Whakatane, Aotearoa/New Zealand, 23–26 November 1998.
Part II
Early Agriculture
6
Our Vanishing Genetic Resources Jack R. Harlan
All of the major food and fibre crops of the world are of ancient origin. The main sources of human nutrition today are contributed by such plants as wheat, rice, corn, sorghum, barley, potatoes, cassava, taro, yams, sweet potatoes and grain legumes such as beans, soybeans, peanuts, peas, chickpeas and so on. All of these plants were domesticated by Stone Age men some thousands of years ago and had become staples of the agricultural peoples of the world long before recorded history. We are not able to trace with certainty the genetic pathways that led to domestication, but we do know that these crops evolved for a long time under the guidance of man living in a subsistence agricultural economy. In the process of evolution, the domesticated forms often became strikingly different from their wild progenitors and generated enormous reserves of genetic variability. Darwin opened his book On the Origin of Species with a discussion of variability of plants and animals under domestication. Genetic variability is the raw stuff of evolution, and he was struck by the range of morphological variation found in domesticated forms in contrast to their wild relatives. We are all familiar with the enormous differences among such breeds of dogs as Pekingese, dachshund, beagle, bulldog, Afghan and Great Dane and how far removed they are in appearance from either wolves or any other wild species that could have been progenitor to domestic dogs. Similar ranges of diversity are seen in chickens, pigeons, cats, cattle, horses and so on. Domestic plants exhibit the same phenomenon, especially among species that have been cultivated for a very long time and that have wide distributions. Genetic diversity is essential for evolution in nature and is, obviously, equally necessary for improvement by plant breeding. Crop evolution through the millennia was shaped by complex interactions involving natural and artificial selection pressures and the alternate isolation of stocks followed by migrations and seed exchanges that brought the stocks into new environments and that permitted new hybridizations and recombinations of characteristics. Subsistence farmers of what we often call ‘primitive’ agricultural societies have an intimate knowledge of their crops and a keen eye for variation. From Harlan J R. 1975. Our vanishing genetic resources. Science 188: 618–621. Reprinted with permission from AAAS.
160 Early Agriculture
Artificial selection is often very intense, for the only forms to survive are those that man chooses to plant. The end products that emerged in primitive agricultural systems were variable, integrated, adapted populations called land races. While land race populations are variable, diversity is far from random. They consist of mixtures of genotypes or genetic lines, all of which are reasonably well adapted to the region in which they evolved but which differ in detail as to specific adaptations to particular conditions within the environment. They differ in reaction to diseases and pests, some lines being resistant or tolerant to certain races of pathogens and some to other races. This is a fairly effective defence against serious epiphytotics. Some components of the population are susceptible to prevalent pathogenic races, but not all, and no particular race of pathogen is likely to build up to epiphytotic proportions because there are always resistant plants in the population. Land races tend to be rather low yielding but dependable. They are adapted to the rather crude land preparation seeding, weeding and harvesting procedures of traditional agriculture. They are also adapted to low soil fertility; they are not very demanding, partly because they do not produce very much. Land races have a certain genetic integrity. They are recognizable morphologically; farmers have names for them and different land races are understood to differ in adaptation to soil type, time of seeding, date of maturity, height, nutritive value, use and other properties. Most important, they are genetically diverse. Such balanced populations – variable, in equilibrium with both environment and pathogens, and genetically dynamic – are our heritage from past generations of cultivators. They are the result of millennia of natural and artificial selections and are the basic resources upon which future plant breeding must depend. In addition to variable land race populations, traditional agriculture generated enormous diversity in identifiable geographic regions called ‘centres of diversity’ or ‘gene centres’. Such centres are (or were) found on every continent, except Australia where the native people did not cultivate plants. Wherever they are located they are always characterized by (i) very ancient agriculture, (ii) great ecological diversity (usually mountainous regions), and (iii) great human diversity in the sense of numerous culturally distinct tribes with complex interacting histories. Centres of diversity were first recognized and described by the great Russian agronomist and geneticist N. I. Vavilov in the 1920s and 1930s.1 H. V. Harlan and M. L. Martini, concerned with genetic resources of barley, put it this way as early as 1936: In the great laboratory of Asia, Europe and Africa, unguided barley breeding has been going on for thousands of years. Types without number have arisen over an enormous area. The better ones have survived. Many of the surviving types are old. Spikes from Egyptian ruins can often be matched with ones still growing in the basins along the Nile. The Egypt of the Pyramids, however, is probably recent in the history of barley. In the hinterlands of Asia there were probably barley fields when man was young. The progenies of these fields with all their surviving variations constitute the world’s priceless reservoir of germ plasm. It has waited through long centuries. Unfortunately, from
Our Vanishing Genetic Resources 161 the breeder’s standpoint, it is now being imperiled. When new barleys replace those grown by the farmers of Ethiopia or Tibet, the world will have lost something irreplaceable.2
That is the way it was before World War II. Genetic erosion was already well advanced in much of Europe, the US, Canada, Japan, Australia and New Zealand, where active plant-breeding programmes had been under way for some decades. But, the ancient reservoirs of germ plasm were still there in the more remote parts of the world and seemed to most people as inexhaustible as oil in Arabia. We could afford to squander our genetic resources because we never had much of our own, and we could always send collectors to such places as Turkey, Afghanistan, Ethiopia, India, South-east Asia, China, Mexico, Colombia and Peru and assemble all the diversity we could use. No one paid much attention to the prophetic warning of Harlan and Martini.
International Programmes for Genetic Resource Conservation After World War II, the picture began to change. Modern plant-breeding programmes were established in many of the developing nations and often right in the midst of genetically rich centres of diversity. Some of the programmes were successful, and new, uniform, high-yielding, modern varieties began to replace the old land races that had evolved over the millennia. The speed with which enormous crop diversity can be essentially wiped out is astonishing, and the slowness with which people have reacted to salvage of threatened genetic resources is dismaying.3 Cries of alarm began to be sounded on the international scene about 15 years ago. A short chronology of events and actions associated with the Food and Agriculture Organization (FAO) of the United Nations is presented below. 1961
1962 1963 1964
FAO convened a technical meeting on plant exploration and introduction. Among the recommendations was one to the effect that a panel of experts be appointed ‘to assist and advise the Director of the Plant Production and Protection Division in this field’. A proposal for a Crop Research and Introduction Centre, Izmir (Turkey), was submitted to the UN Special Fund. The twelfth session of the FAO conference also recommended the establishment of a Panel of Experts on Plant Exploration and Introduction to advise FAO on these matters. The Crop Research and Introduction Centre, Izmir, became operative with UN Special Fund support. The Centre has collected, stored and distributed germ plasm and now, under support of the Swedish government, is serving as a regional centre for the Near East.
162 Early Agriculture
1965 1967 1968 1971
1971 1972
1972 1973 1973 1973 1974
The panel of experts was appointed. FAO and the International Biological Program (IBP) jointly sponsored a Technical Conference on Exploration, Utilization and Conservation of Plant Genetic Resources.4 A Crop Ecology and Genetic Resources Unit was established in the Plant Production and Protection Division, FAO. The Consultative Group on International Agricultural Research (CGIAR) was established under joint sponsorship of the World Bank, FAO and UN Development Programme (UNDP). Members include governments, private foundations and regional development banks, and money is generated to support international agricultural research programmes and institutes. A Technical Advisory Committee (TAG) was established to assist the CGIAR. Under joint sponsorship of TAC, FAO and CGIAR a meeting was convened at Beltsville, Maryland, and a plan for a global network of Genetic Resources Centres was drawn up. Recommendations for location and funding were made and suggestions for international organization and coordination submitted to CGIAR through TAC. The UN Stockholm Conference on the Human Environment called for action on genetic resource conservation. A second FAO/IBP technical conference was convened in Rome.5 The CGIAR established a subcommittee on genetic resources, The International Board for Plant Genetic Resources (IBPGR) was established with a secretariat in FAO and financial resources provided by CGIAR, as recommended at the Beltsville meeting. Portions of the global strategy devised at Beltsville began to be funded through bilateral agreements with donor governments; for example, Sweden agreed to support the Izmir Centre for a time, and the Federal Republic of Germany agreed to support genetic resources centres in Ethiopia and Costa Rica. Other similar agreements have been or are being arranged.
Within the FAO structure, rather parallel developments took place with respect to forest genetic resources. Reports of technical conferences and meetings of the panel of experts, Plant Introduction Newletter and Forest Genetic Resources Information are published by FAO. It must be admitted that for all the organizational developments, and despite repeated and urgent pleas by the panel of experts, remarkably little collecting has been done to date. The Izmir Centre has been plagued with political, financial, administrative and personnel problems from the start. It has managed to assemble a modest collection of some 10,000 accessions, and the long-term storage facilities now installed are excellent. The conception of the Izmir Centre is sound, and it is to be hoped that it will eventually perform the function for which it was established. FAO has conducted a few collecting expeditions and has given support to
Our Vanishing Genetic Resources 163
more, but the urgency of the situation demands much more vigorous action than has been generated so far. The next few years, however, should show an increase in plant exploration. Funds should be available from the consultative group to support adequate exploration programmes. For some regions it will probably be too late to salvage much. It must also be admitted that much less would have been achieved without the dogged and determined insistence of Sir Otto Frankel of Australia.4 Through the years he has refused to abandon hope that serious action could, one day, be launched through an international cooperative programme, and he has shaped most of the events described above. Meanwhile, the international institutes, supported largely by CGIAR, have fared somewhat better. They each deal with one or a few crops and have usually understood that a part of the mission was to assemble and preserve germ plasm of the crops being developed. The world maize collection, for example, traces back to early international agricultural research sponsored by the Rockefeller Foundation in Mexico, Colombia and elsewhere. A rather systematic effort was made to collect the races of maize, country by country, throughout Latin America. A major portion of the collection is maintained by the Centro Internacional de Mejoramento de Maíz y Trigo (CIMMYT) in Mexico, the Andean collection by the Instituto Colombiano Agropecuario (ICA) in Colombia, and the eastern South American collection is maintained at Piracicaba, Brazil. The maize collection appears to be in reasonably good shape, although some additional exploration is desirable. The world rice collection has been growing rapidly in recent years through activities of the International Rice Research Institute (IRRI) in the Philippines. It is certainly not complete, but it is far better than it was 3 to 4 years ago. The Centro Internacional de Agricultura Tropical (CIAT) in Colombia is assembling cassava and beans. The International Institute of Tropical Agriculture (IITA) in Nigeria has been collecting cowpeas, pigeon peas, yams and other tropical tuber crops, and tropical vegetable species. The International Crops Research Institute for the Semi-Arid Tropics (ICRISAT), Hyderabad, India, has assumed responsibility for world collections of sorghum, millets, chickpeas and pigeon peas. The Centro Internacional de Papas (CIP) in Peru is starting to assemble potatoes for breeding work. All of these institutes are located in the tropics and should be able to maintain and rejuvenate collections of these crops much more efficiently than can be done in temperate countries.
National Programmes: US The agriculture of the US is an imported agriculture. Even crops domesticated by the American Indians – such as corn, potatoes, peanuts, cotton, tomatoes and so
164 Early Agriculture
on – originated in Latin America outside of the US, and were introduced, some by Indians and some by Europeans. Because of our dependence on exotic germ plasm, the national government has sponsored collections and introductions from the beginning. As early as 1819, the Secretary of the Treasury issued a circular requesting Americans serving as consuls to send useful plant materials back to the US. Formal plant exploration was conducted by the Office of the Patent Commissioner before 1862, when the US Department of Agriculture (USDA) was created. In 1898 a Section of Seed and Plant Introduction was established in the USDA; and ever since, through various name changes and reorganizations, some unit within the department has been charged with responsibility for germ plasm assembly and maintenance.6 A considerable impetus was given to the plant introduction programme by the Research and Marketing Act of 1946. Regional Plant Introduction Stations were established in the four administrative regions of the country. An Inter-Regional Potato Project was established in 1949 with a special station at Sturgeon Bay, Wisconsin, where exotic potato germ plasm could be grown and evaluated. A National Seed Storage Laboratory was built in Fort Collins, Colorado, and began operation in 1958. The primary objective of the laboratory is long-term seed storage, although research on the physiology of germination, dormancy and longevity of seeds is also conducted. Nearly 400,000 accessions have been introduced since 1898, but there has been substantial attrition over the years. The importance of maintenance was not at first generally realized, and much material was lost for one reason or another. Nevertheless, the present holdings of the USDA are very considerable and extremely important. The small grains (wheat, barley, oats and rye) collection, for example, consists of more than 60,000 items, many of which could not possibly be replaced because they have disappeared from their original homelands. Substantial ‘world collections’ of the major crops and many of the minor ones are being maintained at the Regional Plant Introduction Stations or through cooperative arrangements with other state and federal stations. It would be nice to think that all the genetic diversity we will ever need is safely stored away in gene banks for future use. Unfortunately this is hardly the case. Some of our collections are large even when the numerous duplicates are accounted for, but none is really complete, and sources of diversity are drying up all over the world. We are particularly deficient in the wild and weedy relatives of our more important crops, and some geographic regions have been very poorly sampled. While the USDA has sponsored plant introduction work from the beginning, it has never been able to obtain enough support to systematically sample the world’s germ plasm. The National Seed Storage Laboratory has received step-child treatment with no increase in the operating budget for more than 15 years after establishment. The southern corn leaf blight epidemic in 1970 aroused some activity in the area of crop vulnerability. A survey was commissioned by the National Academy of Sciences, resulting in a report on genetic vulnerability.7 It was found, not surprisingly,
Our Vanishing Genetic Resources 165
that not only corn but also every major crop we grow has a very narrow genetic base. The entire soybean industry, for example, traces back to six introductions from the same part of China. The leaf blight epidemic of 1970 came about because most of the hybrids produced had a common cytoplasm which conferred susceptibility to a particular race of the pathogen. We are just as vulnerable in sorghum where a cytoplasmic sterile system is used to produce hybrids. A crop-by-crop analysis reveals an extremely risky dependence on narrow genetic bases. More than this, the number of crops we grow has been declining steadily. More and more people are being fed on fewer and fewer crops and these are becoming increasingly uniform, genetically. After a series of meetings in Washington, an ad hoc committee drew up recommendations and presented them to the Agricultural Research Policy Advisory Committee (ARPAC) of the Agricultural Research Service. Among the recommendations was the establishment of a Genetic Resources Board at the national level which would, among other things, devise a national plan and programme for systematic assembly, maintenance, evaluation and utilization of plant genetic resources. It is to be hoped that a more systematic, coordinated and effective programme of genetic resource management can be generated for the country and that adequate financial support can be found. Approval for the board was obtained in January 1975.
National Programmes: Other Countries The USSR probably has holdings of about the same magnitude as ours. No doubt, there is a good deal of duplication, yet they have arrays of collections that we do not have and we have materials they do not have. It would undoubtedly be of great mutual benefit if we could exchange collections and hold a complete set of duplicates in two different parts of the world. It would be a disaster if something should happen to either collection. Duplicate storage would be much safer. National collections can be vulnerable. There is a heroic tale about the siege of Leningrad during World War II. People were dying of cold and starvation, reduced to eating rats, cats, dogs, dried glue from furniture joints and wall paper, or anything else that might prolong life. All this time, truckloads of edible seeds were in storage at the All-Union Institute of Plant Industry. The seeds were too precious to be sacrificed even at the cost of human life, and the collections survived for future use. We may pray that such a threat will never occur again, but prayer may not be adequate to save priceless genetic resources. The Vavilovian emphasis on plant genetic resources persisted despite the long twilight of genetics under the political influence of T. D. Lysenko and Vavilov’s tragic death as a result.8 The institute, which he directed for 20 years (1920–1940), was renamed the N. I. Vavilov All-Union Institute of Plant Industry (VIR) in 1968, just in time for the 75th anniversary of the organization in 1969.9
166 Early Agriculture
There may be some question as to how well the original collections of the Vavilovian era have been maintained with respect to genetic authenticity, but there is no doubt that Soviet scientists are more collection minded than plant scientists elsewhere. Genetic resource management has been emphasized since 1920 and has become an integral part of the national agricultural development programme. No doubt there are genes in Soviet collections that no longer exist anywhere else. The Japanese, under the stimulus of H. Kihara, have also had strong genetic conservation programmes, especially with certain crops. Expeditions have been sent to several centres of diversity over the decades and a national seed storage facility has been established at Hiratsuka. The University of Kyoto and the National Institute of Genetics, Misima, have been especially active, although others have also participated. Genetic resources centres with cold storage for long-term conservation have been established in a number of other countries. Some of the major ones include Brisbane, Australia; Prague, Czechoslovakia; Copenhagen, Denmark; Gatersleben, German Democratic Republic; Braunschweig-Volkenröde, German Federal Republic; New Delhi, India; Bari, Italy; Wageningen, Netherlands; and Warsaw, Poland. Others are being constructed or present facilities are being upgraded. Substantial holdings are being maintained in the UK, France, Sweden, Canada and elsewhere. The necessity for genetic conservation is gradually being accepted throughout the world, but the urgency of salvage collection operations has yet to be generally appreciated. A recent visit by a Plant Studies Delegation to the People’s Republic of China revealed a somewhat ambiguous situation. The following observations may be pertinent. (i) China is, indeed, very rich in genetic diversity for many crops; (ii) Chinese scientists are not collection minded, and little effort is being made to conserve land races as they are replaced by modern varieties; (iii) the trend, at the moment, is to produce many species and varieties of fruits and vegetables, which tends to maintain diversity; and (iv) there is a strong emphasis on local self-sufficiency with respect to seed production at both the people’s commune and production brigade levels which may tend to maintain variability at the national level. Overall, the picture is discouraging with respect to major crops. Two rice collections are being maintained, one for japonica and one for indica rices, but the ancient kaoliangs are disappearing from the Chinese sorghum belt, and the traditional millets are hanging on primarily in marginal dryland zones. Altogether, a good deal has been done to collect genetic resources, and tentative, if unsystematic, steps have been taken to conserve much of it on a long-term basis. In view of the obvious limitations of our collections and in face of the current genetic ‘wipe out’ of centres of diversity, it may be too little and too late. We continue to act as though we could always replenish our supplies of genetic diversity. Such is not the case. The time is approaching, and may not be far off, when essentially all the genetic resources of our major crops will be found either in the crops being grown in the field or in our gene banks. This will be a risky state of affairs and will demand a great deal more time and effort on genetic resource management than we have ever devoted to it in the past.
Our Vanishing Genetic Resources 167
Notes 1 2 3 4 5 6 7 8 9
Vavilov N. I. 1926. Studies on the Origin of Cultivated Plants. Institute of Applied Botany and Plant Breeding, Leningrad Harlan H. V. and Martini M. L. 1936. U.S. Department of Agriculture Yearbook, 1936. Government Printing Office, Washington DC Harlan J. R. 1972. Journal of Environ. Qual. 1, 212 Frankel O. H. and Bennett E. (eds) 1970. Genetic Resources in Plants – Their Exploration and Conservation. FAO/IBP, Blackwell, Oxford Hawkes J. G. (ed.) 1974. Crop Genetic Resources for Today and Tomorrow. Cambridge University Press, London. This is an IBP synthesis volume and includes papers from the 1973 meeting. Anon. 1971. The National Program for Conservation of Crop Germ Plasm. University of Georgia Press, Athens, GA National Academy of Sciences. 1972. Genetic Vulnerability of Major Crops. National Academy of Sciences, Washington DC Medvedev Z. A. 1969. The Rise and Fall of T. D. Lysenko, trans Lerner I. M., Columbia University Press, New York Anniversary volume 1969 of Bulletin of Applied Botany, Genetics and Plant Breeding 41, fasc.1
7
Oriental Despotism K. Wittfogel
The characteristics of hydraulic economy are many, but three are paramount. Hydraulic agriculture involves a specific type of division of labour. It intensifies cultivation. And it necessitates cooperation on a large scale. The third characteristic has been described by a number of students of Oriental farming. The second has been frequently noted, but rarely analysed. The first has been given practically no attention. This neglect is particularly unfortunate, since the hydraulic patterns of organization and operation have decisively affected the managerial role of the hydraulic state. Economists generally consider the division of labour and cooperation key prerequisites of modern industry, but they find them almost completely lacking in farming.1 Their claim reflects the conditions of Western rainfall agriculture. For this type of agriculture it is indeed by and large correct. However, the economists do not as a rule so limit themselves. Speaking of agriculture without any geographical or institutional qualification, they give the impression that their thesis, being universally valid, applies to hydraulic as well as to hydroagriculture and rainfall farming. Comparative examination of the facts quickly discloses the fallacy of this contention.
A. Division of Labour in Hydraulic Agriculture 1. Preparatory and protective operations separated from farming proper What is true for modern industry – that production proper depends on a variety of preparatory and protective operations2 – has been true for hydraulic agriculture since its beginnings. The peculiarity of the preparatory and protective hydraulic operations is an essential aspect of the peculiarity of hydraulic agriculture. Reprinted from Wittfogel K. 1957. Oriental Despotism. Yale University Press, New Haven, Chapter 2, pp22–48.
Oriental Despotism 169
a. Large-scale preparatory operations (Purpose: irrigation) The combined agricultural activities of an irrigation farmer are comparable to the combined agricultural activities of a rainfall farmer. But the operations of the former include types of labour (on-the-spot ditching, damming and watering) that are absent in the operations of the latter. The magnitude of this special type of labour can be judged from the fact that in a Chinese village a peasant may spend from 20 to over 50 per cent of his work time irrigating, and that in many Indian villages irrigation is the most time-consuming single item in the farmer’s budget.3 Hydroagriculture (small-scale irrigation farming) involves a high intensity of cultivation on irrigated fields – and often also on non-irrigated fields.4 But it does not involve a division of labour on a communal, territorial or national level. Such a work pattern occurs only when large quantities of water have to be manipulated. Wherever, in pre-industrial civilizations, man gathered, stored and conducted water on a large scale, we find the conspicuous division between preparatory (feeding) and ultimate labour characteristic of all hydraulic agriculture. b. Large-scale protective operations (Purpose: flood control) But the fight against the disastrous consequences of too little water may involve a fight against the disastrous consequences of too much water. The potentially most rewarding areas of hydraulic farming are arid and semi-arid plains and humid regions suitable for aquatic crops, such as rice, that are sufficiently low-lying to permit watering from nearby rivers. These rivers usually have their sources in remote mountains, and they rise substantially as the summer sun melts part of the snow accumulated there. Upstream developments of this kind cause annual inundations in Egypt, Mesopotamia, Turkestan, India, China and in the Andean and Mexican zones of America. In semi-arid areas on-the-spot rains create additional dangers when they are overconcentrated (convectional) or irregular. This condition prevails in North China, northern Mesopotamia (Assyria) and the Mexican lake region. Thus a hydraulic community that resorts to preparatory labour to safeguard the productive use of water may also have to resort to protective labour to safeguard its crops from periodic and excessive inundations. When, in protohistorical times, the Chinese began to cultivate the great plains of North China, they quickly recognized that the centres of greatest potential fertility were also the centres of greatest potential destruction. To quote John Lossing Buck: ‘Geologically speaking, man has settled these plains thousands of years before they were ready for occupation.’5 The Chinese built huge embankments which, although unable to remove entirely the risk inhering in the ambivalent situation, matched and even surpassed in magnitude the area’s preparatory (feeding) works.6 In India enormous problems of flood control are posed by the Indus River7 and, in a particularly one-sided way, by the Ganges and Brahmaputra Rivers, which in Bengal create optimal conditions for the cultivation of rice and maximal dangers from floods. By 1900 Bengal boasted 97 miles of larger irrigation canals and 1298 miles of embankments.8
170 Early Agriculture
In ancient Mesopotamia even watchful rulers could not completely prevent the inundations from damaging the densely settled plains.9 In Turkestan excessive floods periodically threatened the Zarafshan River Valley.10 In Upper Egypt the Nile, in very high flood, rises 1 metre above the level of the settled countryside, in Middle Egypt 2 metres, and in the Delta area up to 3.5 metres.11 The inhabitants of the lake area of Mexico could benefit from its fertility only if they accepted the periodic overflow of its short, irregular, narrow streams,12 which they sought to control through a variety of protective works. Thus in virtually all major hydraulic civilizations, preparatory (feeding) works for the purpose of irrigation are supplemented by and interlocked with protective works for the purpose of flood control.
2. Cooperation A study of the hydraulic patterns of China (especially North China), India, Turkestan, Mesopotamia (especially Assyria), Egypt or Meso-America (especially the Mexican lake region) must therefore consider both forms of agrohydraulic activities. Only by proceeding in such a way can we hope to determine realistically the dimension and character of their organizational key device: cooperation. a. Dimension When a hydraulic society covers only a single locality, all adult males may be assigned to one or a few communal work teams. Varying needs and circumstances modify the size of the mobilized labour force. In hydraulic countries having several independent sources of water supply, the task of controlling the moisture is performed by a number of separated work teams. Among the Hill Suk of East Africa, ‘every male must assist in making the ditches’.13 In almost all Pueblos ‘irrigation or cleaning a spring is work for all’.14 Among the Chagga, the maintenance of a relatively elaborate irrigation system is assured by ‘the participation of the entire people’.15 In Bali the peasants are obliged to render labour service for the hydraulic regional unit, the subak, to which they belong.16 The masters of the Sumerian temple economy expected every adult male within their jurisdiction ‘to participate in the digging and cleaning of the canals’.17 Most inscriptions of Pharaonic Egypt take this work pattern for granted. Only occasionally does a text specify the character of the universally demanded activities, among which lifting and digging are outstanding.18 In imperial China every commoner family was expected on demand to provide labour for hydraulic and other public services. The political and legal writings of India indicate a similar claim on corviable labour.19 The laws of Inca Peru obliged all able-bodied men to render corvée service.20 In ancient Mexico both commoner and upper-class adolescents were instructed in the techniques of digging and damming.21 At times the masters of this hydraulic area levied the manpower of several territorial states for their gigantic hydraulic enterprises.22 In 19th-century Egypt ‘the whole corviable population’ worked in four huge shifts on Mehmed Ali’s hydraulic installations. Each group laboured on the canals
Oriental Despotism 171
for 45 days until, after 180 days, the job was completed.23 From 1881 on, at a time of decay and disintegration, ‘the whole of the corvée fell on the poorest classes’,24 the smaller number being compensated for by an increase in the labour-time to 90 days. In some regions the conscripts were kept busy ‘for 180 days’.25 b. Integration Orderly cooperation involves planned integration. Such integration is especially necessary when the objectives are elaborate and the cooperating teams large. Above the tribal level, hydraulic activities are usually comprehensive. Most writers who mention the cooperative aspect of hydraulic agriculture think in the main of digging, dredging and damming; and the organizational tasks involved in these labours is certainly considerable. But the planners of a major hydraulic enterprise are confronted with problems of a much more complex kind. How many persons are needed? And where can such persons be found? On the basis of previously made registers, the planners must determine the quota and criteria of selection. Notification follows selection, and mobilization notification. The assembled groups frequently proceed in quasimilitary columns. Having reached their destination, the buck privates of the hydraulic army must be distributed in proper numbers and according to whatever division of operations (spading, carrying of mud, etc.) is customary. If raw materials such as straw, faggots, lumber or stone have to be procured, auxiliary operations are organized; and if the work teams – in toto or in part – must be provided with food and drink, still other ways of appropriation, transport and distribution have to be developed. Even in its simplest form, agrohydraulic operations necessitate substantial integrative action. In their more elaborate variations, they involve extensive and complex organizational planning. c. Leadership All teamwork requires team leaders; and the work of large integrated teams requires on-the-spot leaders and disciplinarians as well as overall organizers and planners. The great enterprises of hydraulic agriculture involve both types of direction. The foreman usually performs no menial work at all; and except for a few engineering specialists the sergeants and officers of the labour force are essentially organizers. To be sure, the physical element – including threats of punishment and actual coercion – is never absent. But here, if anywhere, recorded experience and calculated foresight are crucial. It is the circumspection, resourcefulness and integrative skill of the supreme leader and his aides which play the decisive role in initiating, accomplishing and perpetuating the major works of hydraulic economy. d. Hydraulic leadership – political leadership The effective management of these works involves an organizational web which covers either the whole, or at least the dynamic core, of the country’s population. In consequence, those who control this network are uniquely prepared to wield supreme political power.
172 Early Agriculture
From the standpoint of the historical effect, it makes no difference whether the heads of a hydraulic government were originally peace chiefs, war leaders, priests, priest-chiefs or hydraulic officials sans phrase. Among the Chagga, the hydraulic corvée is called into action by the same horn that traditionally rallied the tribesmen for war.26 Among the Pueblo Indians the war chiefs (or priests), although subordinated to the cacique (the supreme chief ), direct and supervise the communal activities.27 The early hydraulic city states of Mesopotamia seem to have been for the most part ruled by priest-kings. In China the legendary trail blazer of governmental water control, the Great Yü, is said to have risen from the rank of a supreme hydraulic functionary to that of king, becoming, according to protohistorical records, the founder of the first hereditary dynasty, Hsia. No matter whether traditionally nonhydraulic leaders initiated or seized the incipient hydraulic ‘apparatus’, or whether the masters of this apparatus became the motive force behind all important public functions,28 there can be no doubt that in all these cases the resulting regime was decisively shaped by the leadership and social control required by hydraulic agriculture.
B. Heavy Water Works and Heavy Industry With regard to operational form, hydraulic agriculture exhibits important similarities to heavy industry. Both types of economic activities are preparatory to the ultimate processes of production. Both provide the workers with essential material for these ultimate processes. And both tend to be comprehensive, ‘heavy’. For these reasons the large enterprises of hydraulic agriculture may be designated as ‘heavy water works’. But the dissimilarities are as illuminating as the similarities. The heavy water works of hydraulic agriculture and the heavy industry of modern economy are distinguished by a number of basic differences, which, properly defined, may aid us in more clearly recognizing the peculiarities of hydraulic society. Heavy water works feed the ultimate agrarian producer one crucial auxiliary material: water; heavy industry provides auxiliary and raw materials of various kinds, including tools for finishing and heavy industry. Heavy water works fulfil important protective functions for the country at large; the protective installations (buildings, etc.) of industry do not. Heavy water works cover at their inception a relatively large area; and with the development of the hydraulic order they are usually spread still further. The operations of heavy industry are spatially much more restricted. At first, and for a number of preliminary processes, they may depend on small and dispersed shops; with the growth of the industrial order they tend to merge into one, or a few, major establishments. The character of the labour force varies with these spatial and operational differences. Heavy water works are best served by a widely distributed personnel, whereas heavy industry requires the workers to reside near the locally restricted
Oriental Despotism 173
‘big’ enterprises which employ them. The hydraulic demand is satisfied by adult peasant males, who continue to reside in their respective villages; whereas the industrial demand is satisfied by a geographically concentrated labour force. The bulk of the hydraulic workers are expected to remain peasants, and in most cases they are mobilized for a relatively short period only – at best for a few days, at worst for any time that will not destroy their agricultural usefulness. Thus division of agrohydraulic labour is not accompanied by a corresponding division of labourers. The contrast to the labour policy of heavy industry is manifest. Different from heavy water works, which may be created and maintained during a fraction of the year, heavy industry operates most effectively when it operates continuously. The industrial employers prefer to occupy their personnel throughout the year; and with the growth of the industrial system full-time labour became the rule. Thus division of industrial labour moves toward a more or less complete division of labourers. The two sectors are also differently administered. In the main, modern heavy industry is directed by private owners or managers. The heavy water works of hydraulic agriculture are directed essentially by the government. The government also engages in certain other large enterprises, which, in varying combinations, supplement the agrohydraulic economy proper.
C. Calendar Making and Astronomy – Important Functions of the Hydraulic Regime Among the intellectual functions fulfilled by the leaders of agrohydraulic activities, some are only indirectly connected with the organization of men and material; but the relation is highly significant nevertheless. Time keeping and calendar making are essential for the success of all hydraulic economies; and under special conditions special operations of measuring and calculating may be urgently needed.29 The way in which these tasks are executed affect both the political and the cultural development of hydraulic society. To be sure, man is deeply concerned about the swing of the seasons under all forms of extractive economy and throughout the agrarian world. But in most cases he is content to determine in a general way when spring or summer begin, when cold will set in, when rain or snow will fall. In hydraulic civilizations such general knowledge is insufficient. In areas of full aridity it is crucial to be prepared for the rise of the rivers whose overflow, properly handled, brings fertility and life and whose unchecked waters leave death and devastation in their wake. The dykes have to be repaired in the proper season so that they will hold in times of inundation; and the canals have to be cleaned so that the moisture will be satisfactorily distributed. In semi-arid areas receiving a limited or uneven rainfall an accurate calendar is similarly important. Only when the embankments, canals and reservoirs are ready and in good condition can the scanty precipitation be fully utilized.
174 Early Agriculture
The need for reallocating the periodically flooded fields and determining the dimension and bulk of hydraulic and other structures provide continual stimulation for developments in geometry and arithmetic. Herodotus ascribes the beginnings of geometry in Egypt to the need for annually remeasuring the inundated land.30 No matter whether the earliest scientific steps in this direction were made in the Nile Valley or in Mesopotamia, the basic correlation is eminently plausible. Obviously the pioneers and masters of hydraulic civilization were singularly well equipped to lay the foundations for two major and interrelated sciences: astronomy and mathematics. As a rule, the operations of time keeping and scientific measuring and counting were performed by official dignitaries or by priestly (or secular) specialists attached to the hydraulic regime. Wrapped in a cloak of magic and astrology and hedged with profound secrecy, these mathematical and astronomical operations became the means both for improving hydraulic production and bulwarking the superior power of the hydraulic leaders.
D. Further Construction Activities Customary in Hydraulic Societies The masters of the hydraulic state did not confine their activities to matters immediately connected with agriculture. The methods of cooperation which were so effective in the sphere of crop-raising were easily applied to a variety of other large tasks. Certain types of works are likely to precede others. Generally speaking, the irrigation canal is older than the navigation canal; and hydraulic digging and damming occurred prior to the building of highways. But often derivative steps were taken before the original activities had progressed far, and different regional conditions favoured different evolutionary sequences. Thus the divergencies of interaction and growth are great. They include many constructional activities above and beyond the sphere of hydraulic agriculture.31
1. Nonagrarian hydraulic works a. Aqueducts and reservoirs providing drinking water A commonwealth able to transfer water for purposes of irrigation readily applies its hydraulic know-how to the providing of drinking water. The need for such action was slight in the greater part of Medieval Europe, where the annual precipitation furnished sufficient ground water for the wells on which most towns depended for their water supply.32 Even in the hydraulic world, drinking water is not necessarily an issue. Wherever rivers, streams or springs carry enough moisture to satisfy the drinking needs
Oriental Despotism 175
of the population throughout the year, no major problem arises. The inhabitants of the Nile and Ganges Valleys and of many similar areas did not have to construct elaborate aqueducts for this purpose. The irregular flow of rivers or streams or the relatively easy access to fresh and clear mountain water has stimulated in many hydraulic landscapes the construction of comprehensive installations for the storage and distribution of drinking water. In America great aqueducts were built by the hydraulic civilizations of the Andean zone and Meso-America.33 The many reservoirs (tanks) of Southern India frequently serve several uses; but near the large residential centres the providing of drinking water is usually paramount. In certain areas of the Near East, such as Syria and Assyria, brilliantly designed aqueducts have satisfied the water needs of many famous cities, Tyre,34 Antioch35 and Nineveh36 among them. In the Western world of rainfall agriculture, aqueducts were built primarily by such Mediterranean peoples as the Greeks and the Romans, who since the dawn of history maintained contact with – and learned from – the technically advanced countries of Western Asia and North Africa. No doubt the Greeks and Romans would have been able to solve their drinking-water problem without inspiration from the outside; but the form of their answer strongly suggests the influence of Oriental engineering.37 b. Navigation canals Among the great agrarian conformations of history, only hydraulic society has constructed navigation canals of any major size. The seafaring Greeks, making the Mediterranean their highway, avoided an issue which the ancient city states were poorly equipped to handle. The not-too-numerous Roman canals were apparently all dug at a time when the growing Orientalization of the governmental apparatus stimulated, among other things, a growing interest in all kinds of public works.38 The rainfall farmers of Medieval Europe, like their counterparts elsewhere, shunned rather than sought the marshy river lowlands. And their feudal masters paid little attention to the condition of the watercourses, for which they had no use. Still less did they feel obliged to construct additional and artificial rivers – canals. Few if any important canals were built during the Middle Ages,39 and medieval trade and transport were seriously handicapped by the state of the navigable rivers. 40 It was in connection with the rise of a governmentally encouraged commercial and industrial capitalism that the West began to build canals on a conspicuous scale. The ‘pioneer of the canals of modern Europe’, the French Canal du Midi, was completed only in the second half of the 17th century, in 1681,41 that is, little more than a century before the end of the absolutist regime. And in the classical country of inland navigation, England,42 ‘little … was done in making canals … until the middle of the eighteenth century’43 – that is, until a time well after the close of England’s absolutist period and immediately prior to the beginning of the machine age. As stated above, the members of a hydraulic commonwealth felt quite differently about the management of natural and artificial watercourses. They approached
176 Early Agriculture
the fertility-bearing rivers as closely as possible, and in doing so they had to find ways of draining the lowland marshes and strengthening and reshaping the river banks. Naturally the question of inland navigation did not arise everywhere. Existing rivers and streams might be suitable for irrigation, but not for shipping (Pueblos, Chagga, Highland Peru); or the ocean might prove an ideal means of transportation (Hawaii, Coastal Peru). In certain localities inland navigation was satisfactorily served by man-managed rivers (Egypt, India) and lakes (Mexico) plus whatever irrigation canals were large enough to accommodate boats (Mesopotamia). But when supplementary watercourses were not only possible but desirable, the organizers of agrohydraulic works had little difficulty in utilizing their cooperative ‘apparatus’ to make them available. The new canals might be only minor additions to the existing watercourses. The ancient Egyptians constructed canals in order to circumnavigate impassable cataracts, and they temporarily connected the Nile and the Red Sea;44 but these enterprises had little effect on the overall pattern of the country’s hydraulic economy. In other instances, navigation canals assumed great importance. They satisfied the needs of the masters of the hydraulic state: the transfer of parts of the agrarian surplus to the administrative centres and the transport of messengers and troops. In Thailand (Siam) the different hydraulic tasks overlapped. In addition to the various types of productive and protective hydraulic installations, the government constructed in the centres of rice production and state power a number of canals, which essentially served as ‘waterways’, that is, as a means for transporting the rice surplus to the capital.45 The corresponding development in China is particularly well documented. In the large plains of North China the beginnings of navigation canals go back to the days of the territorial states – that is, to the period prior to 221 BC, when the various regional governments were still administered by officials who were given office lands in payment for their services. The difference between the state-centred system of land grants as it prevailed in early China and the knighthood feudalism of Medieval Europe is spectacularly demonstrated by the almost complete absence of public works in feudal Europe and the enormous development of such works – hydraulic and otherwise – in the territorial states of China.46 The geographical and administrative unification of China which vastly increased the political need for navigation canals also increased the state’s organizational power to build them. The first centuries of the empire saw a great advance not only in the construction of irrigation canals,47 reservoirs, and protective river dikes but also in the digging of long canals for administrative and fiscal purposes.48 When, after several centuries of political fragmentation, the Sui rulers at the end of the 6th century again unified ‘all-under-heaven’, they bulwarked the new political structure by creating out of earlier and substantial beginnings the gigantic Imperial Canal, significantly known in China as Yün Ho, ‘the Transport Canal’. This canal extends today for about 800 miles, its length equalling the distance from the American-Canadian Great Lakes to the Gulf of Mexico or – in European
Oriental Despotism 177
terms – the distance from Berlin to Bordeaux or from Hamburg to Rome. For labour on part of this gigantic water work the Sui government mobilized in the regions north of the Yellow River alone ‘more than a million of men and women’,49 that is, almost one-half of the total population which England is said to have had from the 14th to the 16th century.50 The gigantic effort involved in banking the rivers and building the canals of China is indicated by the American agronomist, F. H. King, who conservatively estimates the combined lengths of the man-managed watercourses of China, Korea and Japan at some 200,000 miles. ‘Forty canals across the United States from east to west and sixty from north to south would not equal in number of miles those in these three countries today. Indeed, it is probable that this estimate is not too large for China alone.’51
2. Large nonhydraulic constructions a. Huge defence structures The need for comprehensive works of defence arises almost as soon as hydraulic agriculture is practised. Contrary to the rainfall farmer, who may shift his fields with relative ease, the irrigation farmer finds himself depending on an unmovable, if highly rewarding, source of fertility. In the early days of hydraulic cultivation reliance on a fixed system of water supply must in many cases have driven the agrarian community to build strong defences around its homes and fields. For this purpose hydraulic agriculture proved suggestive in two ways: it taught man how to handle all kinds of building materials, earth, stone, timber, etc., and it trained him to manipulate these materials in an organized way. The builders of canals and dams easily became the builders of trenches, towers, palisades and extended defence walls. In this, as in all corresponding cases, the character and magnitude of the operations were determined by internal and external circumstances. Surrounded by aggressive neighbours, the Pueblo Indians ingeniously utilized whatever building material was at hand to protect their settlements, which rarely comprised more than a few hundred inhabitants.52 The fortress-like quality of their villages is manifest to the present-day anthropologist; it struck the Spanish conquistadores, who were forced at times to besiege a single settlement for days and weeks before they could take it.53 Rigid cooperation assured security of residence, just as it assured success in farming. An early observer stresses this aspect of Pueblo life: ‘They all work together to build the villages.’54 The Chagga were equally effective in the transfer of their hydraulic work patterns to military constructions. Their great chieftain, Horombo (fl. 1830), used ‘thousands of people’ to build great fortifications, which in part still stand today.55 ‘The walls of these fortifications are some six feet high, and in length 305 yards on the south side, 443 yards on the north, 277 yards on the east side, and 137 yards on the west side.’56 Tunnels, extended trenches and dugouts added to the defence of the walled settlements, which appeared early in the history of the Chagga.57
178 Early Agriculture
‘Deep dugouts excavated under the huts, and often leading into underground passages with outlets at some distance, were used for refuge. Almost every country was secured with great war trenches, which are everywhere to be seen at the present day and are often still of great depth.’58 These instances show what even primitive hydraulic societies could achieve in the field of defence construction, when they strained their cooperative resources to the full. Higher hydraulic societies employed and varied the basic principle in accordance with technical and institutional circumstances. In pre-Columbian Mexico the absence of suitable labour animals placed a limitation on transport, and while this restricted siege craft, it did not preclude the struggle for or the defence of the cities. In emergencies many government-built hydraulic works in the main lake area fulfilled military functions, just as the monster palaces and temples served as bastions against an invading enemy.59 Recent research draws attention to various types of Mexican forts and defence walls.60 Because of their size and importance, they may safely be adjudged as state-directed enterprises. The colossal fortresses and walls of pre-Spanish Peru, which astonished early and recent observers,61 are known to have been built at the order of the government and by ‘incredibly’ large teams of corvée labourers.62 Many texts and pictorial representations have portrayed the walls, gates and towers of ancient Egypt, Sumer, Babylonia, Assyria and Syria. The Arthashāstra indicates the systematic manner in which the rulers of the first great Indian empire treated problems of fortification and defence.63 At the dawn of Chinese history new capitals were created at the ruler’s command, and during the last centuries of the Chou period the territorial states used their corviable manpower to wall entire frontier regions, not only against the tribal barbarians but also against each other. In the 3rd century BC the unifier of China, Ch’in Shih Huang-ti, linked together and elaborated older territorial structures to form the longest unbroken defence installation ever made by man.64 The periodic reconstruction of the Chinese Great Wall expresses the continued effectiveness of hydraulic economy and governmentdirected mass labour. b. Roads The existence of government-made highways is suggested for the Babylonian period;65 it is documented for Assyria.66 And the relationship between these early constructions and the roads of Persia, the Hellenistic states and Rome seems ‘beyond doubt’.67 The great Persian ‘royal road’ deeply impressed the contemporary Greeks;68 it served as a model for the Hellenistic rulers,69 whose efforts in turn inspired the official road builders of the Roman empire.70 According to Mez, the Arabs inherited ‘the type of “governmental road”, like its name, from the Persian “Royal Road”.’71 Beyond this, however, they showed little interest in maintaining good roads, probably because they continued to rely in the main on camel caravans for purposes of transport. The later Muslim regimes of the Near East used highways, but they never restored them to the state of technical perfection which characterized the pre-Arab period.72
Oriental Despotism 179
Roads were a serious concern of India’s vigorous Maurya kings.73 A ‘royal road’ of 10,000 stadia, which is said to have led from the capital to the north-western border, had a system of marking distances which, in a modified form, was again employed by the Mogul emperors.74 In Southern India, where Hindu civilization was perpetuated for centuries after the north had been conquered, government-made roads are mentioned in the inscriptions; and ‘some of them are called king’s highways’.75 The Muslim rulers of India continued the Indian rather than the West Asian pattern in their effort to maintain a network of state roads.76 Sher Shāh (d. 1545) built four great roads, one of which ran from Bengal to Agra, Delhi and Lahore.77 Akbar is said to have been inspired by Sher Shāh when he built a new ‘king’s highway’, called the Long Walk, which for 400 miles was ‘shaded by great trees on both sides’.78 In China, a gigantic network of highways was constructed immediately after the establishment of the empire in 221 BC. But in this case, as in the cases of the irrigation and navigation canals or the long defence walls, the imperial engineers systematized and elaborated only what their territorial predecessors had initiated. Long before the 3rd century BC an efficient territorial state was expected to have well kept overland highways, supervised by central and local officials, lined with trees, and provided with stations and guest houses.79 Under the empire, great state roads connected all the important centres of the northern core area with the capital. According to the official History of the Han Dynasty, the First Emperor built the Imperial Road throughout the empire. To the east it stretched to Yen and Ch’i and to the south it reached Wu and Ch’u. The banks and the shore of the Chiang [the Yangtze River] and the lakes and the littoral along the sea coast were all made accessible. The highway was fifty paces wide. A space three chang [approximately twenty-two feet] wide in the center was set apart by trees. The two sides were firmly built, and metal bars were used to reinforce them. Green pine trees were planted along it. He constructed the Imperial Highway with such a degree of elegance that later generations were even unable to find a crooked path upon which to place their feet.80
In the subsequent dynasties the building and maintenance of the great trunk roads and their many regional branches remained a standard task of China’s central and local administration. The rugged terrain of Meso-America and the absence of fully coordinated empires seems to have discouraged the construction of highways during the preColumbian period, at least on the high plateau. But the Andean area was the scene of extraordinary road building. The Spanish conquerors described in detail the fine highways which crossed both the coastal plain and the highlands and which formed connecting links between them.81 Commenting on the Andean roads, Hernando Pizarro writes he never saw their like in similar terrain ‘within the entire Christian world’.82 In fact the only parallel he could think of was the system of highways built by the Romans. The similarity is telling. As we shall discuss below, the extensive Roman roads were the fruits of a fateful transformation that made the Roman Empire a Hellenistically (Orientally) despotic state.
180 Early Agriculture
The efforts required to build all these great highways have attracted much less attention than the finished products. But what evidence we have indicates that like most other major government enterprises, they were mainly executed through the cooperative effort of state-levied corvée labourers. Under the Inca empire supervisory officials marked off the land and informed the local inhabitants ‘that they should make these roads’. And this was done with little cost to the government. The commandeered men ‘come with their food and tools to make them’.83 The highways of imperial China required an enormous labour force for their construction and a very sizable one for their maintenance. A Han inscription notes that the construction of a certain highway in the years AD 63–66 occupied 766,800 men. Of this great number only 2690 were convicts.84 c. Palaces, capital cities and tombs A governmental apparatus capable of executing all these hydraulic and nonhydraulic works could easily be used in building palaces and pleasure grounds for the ruler and his court, palace-like government edifices for his aides, and monuments and tombs for the distinguished dead. It could be used wherever the equalitarian conditions of a primitive tribal society yielded to tribal or no-longer tribal forms of autocracy. The head chief of a Pueblo community had his fields worked for him by the villagers. But apparently his dwelling did not differ from the houses of other tribesmen, except perhaps that it was better and more securely located. The Chagga chieftains had veritable palaces erected for their personal use; and the corvée labour involved in their construction was substantial.85 The colossal palaces of the rulers of ancient Peru were erected by the integrated manpower of many labourers. In pre-Columbian Mexico, Nezahualcoyotzin, the king of Tezcuco, the second largest country in the Aztec Federation, is said to have employed more than 200,000 workers each day for the building of his magnificent palace and park.86 Unlimited control over the labour power of their subjects enabled the rulers of Sumer, Babylon and Egypt to build their spectacular palaces, gardens and tombs. The same work pattern prevailed in the many smaller states that shaped their government on the Mesopotamian or Egyptian model. According to the biblical records, King Solomon built his beautiful temple with labour teams that, like those of Babylonia, were kept at work for four months of the year.87 The great edifices of Mogul India have been frequently described. Less known but equally worthy of mention are the constructions of the earlier periods. The third ruler of the Tughluq, Fīrūs Shāh (ca. 1308–1388), dug several important irrigation canals, the famous ‘Old Jumna Canal’ among them. He built forts, palaces, and palace-cities, mosques and tombs. The palace-fort of Kotla Fīrūs Shāh, which rose in his new capital of Fīrūsābād (Delhi), faithfully preserved the grand style of pre-Islamic Indian and Eastern architecture.88 The Chinese variant of the general agromanagerial building trend is revealed in many elaborate works. The First Emperor of China, Ch’in Shih Huang-ti, began
Oriental Despotism 181
to build great hydraulic works in the early days of his power; and in the course of his reign he completed colossal works of the nonhydraulic public and semi-private types. Having destroyed all his territorial rivals, he constructed the previously mentioned network of highways which gave his officials, messengers and troops easy access to all regions of his far-flung empire. Later he defended himself against the northern pastoralists by consolidating the Great Wall. Palaces for his personal use had been built in the early days of his reign; but it was only in 213 BC that work was begun on his superpalace. This monster project, together with the construction of his enormous tomb,89 is said to have occupied work teams numbering over 700,000 persons.90 Eight hundred years later the second monarch of a reunified China, Emperor Yang (604–17) of the Sui Dynasty, mobilized a still larger labour force for the execution of similar monster enterprises. In addition to the more than 1 million persons – men and women – levied for the making of the Grand Canal,91 he dispatched huge corvée teams to extend the imperial roads92 and to work on the Great Wall. According to the History of the Sui Dynasty, over a million persons toiled at the Great Wall.93 According to the same official source, the construction of the new eastern capital, which included a gigantic new imperial palace, involved no less than 2 million people ‘every month’.94 d. Temples The position, fate and prestige of the secular masters of hydraulic society were closely interlinked with that of their divine protectors. Without exception, the political rulers were eager to confirm and bulwark their own legitimacy and majesty by underlining the greatness of their supernatural supporters. Whether the government was headed by secular monarchs or priest-kings, the commanding centre made every effort to provide the supreme gods and their earthly functionaries with adequate surroundings for worship and residence. Government-directed work teams, which erected gigantic palaces, were equally fitted to erect gigantic temples. Ancient inscriptions note the many temples built by the Mesopotamian rulers.95 Usually the sovereign speaks as if these achievements resulted solely from his personal efforts. But occasional remarks indicate the presence of ‘the people’ who toiled ‘according to the established plan’.96 Similarly, most Pharaonic texts refer to the final achievement97 or to the greatness of the directing sovereign;98 but again a number of texts refer to the government-led labour forces, ‘the people’.99 In the agromanagerial cultures of pre-Columbian America, buildings for religious purposes were particularly conspicuous. Native tradition as well as the early Spanish accounts emphasize the tremendous labour required to construct and maintain the sacred houses and pyramids. The Mexicans coordinated their communal energies to erect the first temple for the newly established island city, the later Aztec capital;100 and their increasingly powerful descendants mobilized the manpower of many subjugated countries for the construction of increasingly huge temples.101 The city-like palace of the famous King of Tezcuco, Nezahualcoyotzin,
182 Early Agriculture
contained no less than 40 temples.102 The great number of labourers engaged in building this palace- and temple-city has already been cited. Like the monster work teams of Mexico, those of Tezcuco could draw upon the entire corviable population.103 In another country of the main lake region, Cuauhtitlan, the construction of large-scale hydraulic works104 was followed by the building of a great temple. It took 13 years to complete the second task.105 In the Andean zone, as in most other areas of the hydraulic world, the attachment of the priesthood to the government is beyond doubt. The Incas made heavy levies on their empire’s material wealth in order to beautify their temples and pyramids.106 They called up whatever manpower was needed to collect the raw material, transport it and do the actual work of construction.107
E. The Masters of Hydraulic Society – Great Builders Evidently the masters of hydraulic society, whether they ruled in the Near East, India, China or pre-Conquest America, were great builders. The formula is usually invoked for both the aesthetic and the technical aspect of the matter; and these two aspects are indeed closely interrelated. We shall briefly discuss both of them with regard to the following types of hydraulic and nonhydraulic construction works: I. Hydraulic works A. Productive installations (Canals, aqueducts, reservoirs, sluices and dikes for the purpose of irrigation) B. Protective installations (Drainage canals and dikes for flood control) C. Aqueducts providing drinking water D. Navigation canals II. Nonhydraulic works A. Works of defence and communication 1. Walls and other structures of defence 2. Highways B. Edifices serving the public and personal needs of the secular and religious masters of hydraulic society 1. Palaces and capital cities 2. Tombs 3. Temples
Oriental Despotism 183
1. The aesthetic aspect a. Uneven conspicuousness The majority of persons who have commented on the great builders of Asia and ancient America are far more articulate on the nonhydraulic than on the hydraulic achievements. Within the hydraulic sphere more attention is again given to the aqueducts for drinking water and the navigation canals than to the productive and protective installations of hydraulic agriculture. In fact, these last are frequently overlooked altogether. Among the nonhydraulic works, the ‘big houses’ of power and worship and the tombs of the great are much more carefully investigated than are the large installations of communication and defence. This uneven treatment of the monster constructions of hydraulic society is no accident. For functional, aesthetic and social reasons the hydraulic works are usually less impressive than the nonhydraulic constructions. And similar reasons encourage uneven treatment also within each of the two main categories. Functionally speaking, irrigation canals and protective embankments are widely and monotonously spread over the landscape, whereas the palaces, tombs and temples are spatially concentrated. Aesthetically speaking, most of the hydraulic works are undertaken primarily for utilitarian purposes, whereas the residences of the rulers and priests, the houses of worship and the tombs of the great are meant to be beautiful. Socially speaking, those who organize the distribution of manpower and material are the same persons who particularly and directly enjoy the benefits of many nonhydraulic structures. In consequence they are eager to invest a maximum of aesthetic effort in these structures (palaces, temples and capital cities) and a minimum of such effort in all other works. Of course, the contrast is not absolute. Some irrigation works, dikes, aqueducts, navigation canals, highways and defence walls do achieve considerable functional beauty. And closeness to the centres of power may lead the officials in charge to construct embankments, aqueducts, highways, bridges, walls, gates and towers with as much care for aesthetic detail as material and labour permit. But these secondary tendencies do not alter the two basic facts that the majority of all hydraulic and nonhydraulic public works are aesthetically less conspicuous than the royal and official palaces, temples and tombs, and that the most important of all hydraulic works – the canals and dykes – from the standpoint of art and artistry are the least spectacular of all. b. The monumental style Such discrepancies notwithstanding, the palaces, government buildings, temples and tombs share one feature with the ‘public’ works proper: they, too, tend to be large. The architectural style of hydraulic society is monumental. This style is apparent in the fortress-like settlements of the Pueblo Indians. It is conspicuous in the palaces, temple cities and fortresses of ancient Middle and South America. It characterizes the tombs, palace-cities, temples and royal monuments of Pharaonic Egypt and ancient Mesopotamia. No one who has ever
184 Early Agriculture
observed the city gates and walls of a Chinese capital, such as Peking, or who has walked through the immense palace gates and squares of the Forbidden City to enter its equally immense court buildings, ancestral temples and private residences can fail to be awed by their monumental design. Pyramids and dome-shaped tombs manifest most consistently the monumental style of hydraulic building. They achieve their aesthetic effect with a minimum of ideas and a maximum of material. The pyramid is little more than a huge pile of symmetrically arranged stones. The property-based and increasingly individualistic society of ancient Greece loosened up the massive architecture, which had emerged in the quasihydraulic Mycenaean period.108 During the later part of the first millennium BC, when Alexander and his successors ruled the entire Near East, the architectural concepts of Hellas transformed and refined the hydraulic style without, however, destroying its monumental quality. In Islamic architecture the two styles blended to create a third. The products of this development were as spectacular in the western-most outpost of Islamic culture – Moorish Spain – as they were in the great eastern centres: Cairo, Baghdad, Bukhara, Samarkand and Istanbul. The Taj Mahal of Agra and kindred buildings show the same forces at work in India, a subcontinent which, before the Islamic invasion, had evolved a rich monumental architecture of its own. c. The institutional meaning It hardly needs to be said that other agrarian civilizations also combined architectural beauty with magnitude. But the hydraulic rulers differed from the secular and priestly lords of the ancient and medieval West, first because their constructional operations penetrated more spheres of life, and second because control over the entire country’s labour power and material enabled them to attain much more monumental results. The scattered operations of rainfall farming did not involve the establishment of national patterns of cooperation, as did hydraulic agriculture. The many manorial centres of Europe’s knighthood society gave rise to as many fortified residences (castles); and their size was limited by the number of the attached serfs. The king, being little more than the most important feudal lord, had to build his castles with whatever labour force his personal domain provided. The concentration of revenue in the regional or territorial centres of ecclesiastical authority permitted the creation of the largest individual medieval edifices: churches, abbeys and cathedrals. It may be noted that these buildings were erected by an institution which, in contrast to all other prominent Western bodies, combined feudal with quasihydraulic patterns of organization and acquisition. With regard to social control and natural resources, however, the master builders of the hydraulic state had no equal in the nonhydraulic world. The modest Tower of London and the dispersed castles of medieval Europe express the balanced baronial society of the Magna Carta as clearly as the huge administrative cities and colossal palaces, temples and tombs of Asia, Egypt and ancient America
Oriental Despotism 185
express the organizational coordination and the mobilization potential of hydraulic economy and statecraft.109
F. The Bulk of All Large Nonconstructional Industrial Enterprises Managed also by The Hydraulic Government 1. A comparative view A government capable of handling all major hydraulic and nonhydraulic construction may, if it desires, play a leading role also in the nonconstructional branches of industry. There are ‘feeding’ industries, such as mining, quarrying, salt gathering, etc.; and there are finishing industries, such as the manufacture of weapons, textiles, chariots, furniture, etc. Insofar as the activities in these two spheres proceeded on a large scale, they were for the most part either directly managed or monopolistically controlled by the hydraulic governments. Under the conditions of Pharaonic Egypt and Inca Peru, direct management prevailed. Under more differentiated social conditions, the government tended to leave part of mining, salt gathering, etc. to heavily taxed and carefully supervised entrepreneurs, while it continued to manage directly most of the large manufacturing workshops. By combining these facts with what we know of the hydraulic and nonhydraulic constructional operations of the state, we may in the following table indicate the managerial position of the hydraulic state both in agriculture and industry. For purposes of comparison, we include corresponding data from two other agrarian societies and from mercantilist Europe. Table 7.1 Government management in the spheres of agriculture and industry Institutional conformations
AGRICULTURE Heavy Farming waterworks
INDUSTRY Mining, Construction etc. industry
Manufacturing Large shops
Small shops
Hydraulic society
+
–
(+)1
+2
+
–
Coastal city states of classical Greece
–
–
_
–
–
–
Medieval Europe
–
(+)3
–
(+)3
(+)3
–
Mercantilist Europe
–
–
(–)
–
–
–
Key + Predominant + Outstandingly significant – Irrelevant or absent ( ) Trend limited or modified by factors indicated in the text
1. Simpler conditions 2. On a national scale 3. On a manorial scale
186 Early Agriculture
In ancient Greece, mining was mainly in the hands of licensed businessmen. As long as the concessionaire delivered a fixed part of his output to the state, he enjoyed ‘very extensive’ rights; he ‘was said to “buy” the mine, he organized the working as he pleased, the ore was his, and he could cede his concession to a third party’.110 In Medieval Europe mining was also essentially left to private entrepreneurs, who, having obtained a concession from the royal or territorial authorities, proceeded independently and mostly through craft cooperatives.111 The mercantilist governments of Europe operated some mines directly; but the majority was managed by strictly supervised private owners.112 All these arrangements differ profoundly from the system of government mining prevailing in Pharaonic Egypt and Inca Peru. Mercantilist usage resembles in form, but not in institutional substance, the policy pursued in certain of the more differentiated hydraulic societies, where government operation of some mines was combined with private, but government-licensed, handling of others.113 Except for mining, Oriental and Occidental absolutism are less similar in the industrial sphere than has been claimed, whereas a resemblance of sorts does exist between hydraulic society and feudal Europe. In hydraulic society, the majority of the not-too-many larger industrial workshops was government managed. In the mercantilist Occident they were, under varying forms of state supervision, predominantly owned and run by private entrepreneurs. In the coastal city-states of classical Greece the government was neither equipped nor inclined to engage in industrial activities. The rulers of medieval Europe, faced with a different situation, proceeded differently. In their manorial workshops they employed a number of serf-artisans, who were kept busy satisfying the needs of their masters. The feudal lords also summoned serf labour for the construction of ‘big houses’ – castles. The similarity between this manorial system of cooperative work and the hydraulic pattern is evident. But again the functional similarity is limited by the differences in the societal setting. The medieval kings and barons could dispose only over the labour force of their own domains and estates, while the hydraulic rulers could draw on the unskilled and skilled labour of large territories, and ultimately on that of the whole country. The decisive difference, however, between hydraulic society and the three civilizations with which we compare it lies, insofar as industry is concerned, in the sphere of construction. It is this sphere which more than any other sector of industry demonstrates the organizational power of hydraulic society. And it is this sphere which achieved results never attained by any other agrarian or mercantilist society. The full institutional significance of this fact becomes apparent as soon as we connect it with the corresponding agrarian development. Government-managed heavy waterworks place the large-scale feeding apparatus of agriculture in the hands of the state. Government-managed construction works make the state the undisputed master of the most comprehensive sector of large-scale industry. In the two main spheres of production the state occupied an unrivalled position of operational leadership and organizational control.
Oriental Despotism 187
2. The power of the hydraulic state over labour greater than that of capitalist enterprises In both spheres the hydraulic state levied and controlled the needed labour forces by coercive methods that were invocable by a feudal lord only within a restricted area, and that were altogether different from the methods customary under capitalist conditions. The hydraulic rulers were sufficiently strong to do on a national scale what a feudal sovereign or lord could accomplish only within the borders of his domain. They compelled able-bodied commoners to work for them through the agency of the corvée. Corvée labour is forced labour. But unlike slave labour, which is demanded permanently, corvée labour is conscripted on a temporary, although recurring, basis. After the corvée service is completed, the worker is expected to go home and continue with his own business. Thus the corvée labourer is freer than the slave. But he is less free than a wage labourer. He does not enjoy the bargaining advantages of the labour market, and this is the case even if the state gives him food (in the ancient Near East often ‘bread and beer’) or some cash. In areas with a highly developed money economy the hydraulic government may levy a corvée tax and hire rather than conscript the needed labour. This was done largely in China at the close of the Ming dynasty and during the greater part of Ch’ing rule. But there as elsewhere the government arbitrarily fixed the wage. And it always kept the workers under quasimilitary discipline.114 Except in times of open political crisis, the hydraulic state could always muster the labor forces it required; and this whether the workers were levied or hired. It has been said that the Mogul ruler Akbar, ‘by his firmān (order) could collect any number of men he liked. There was no limit to his massing of labourers, save the number of people in his Empire.’115 Mutatis mutandis, this statement is valid for all hydraulic civilizations.
G. A Genuine and Specific Type of Managerial Regime Thus the hydraulic state fulfilled a variety of important managerial functions.116 In most instances it maintained crucial hydraulic works, appearing in the agrarian sphere as the sole operator of large preparatory and protective enterprises. And usually it also controlled the major nonhydraulic industrial enterprises, especially large constructions. This was the case even in certain ‘marginal’ areas, where the hydraulic works were insignificant. The hydraulic state differs from the modern total managerial states in that it is based on agriculture and operates only part of the country’s economy. It differs from the laissez-faire states of a private-property-based industrial society in that, in its core form, it fulfils crucial economic functions by means of commandeered (forced) labour.
188 Early Agriculture
Notes 1
2
3 4 5 6 7 8 9 10 11 12 13 14 15 16 17 18 19 20 21 22 23 24 25 26 27 28
29 30
For early formulations of this view see Smith, 1937: 6; Mill, 1909: 131, 144; Marx, 1890–1894, I: 300, 322 ff. Modern economists have perpetuated and even sharpened them. Writes Seligman (1914: 350): ‘In the immense domain of agricultural production the possibility of combination is almost entirely eliminated.’ And Marshall (1946: 290): ‘In agriculture there is not much division of labour, and there is no production on a very large scale.’ For the concept of ‘previous or preparatory labor’ see Mill, 1909: 29, 31. The general principle was already indicated by Smith (1937), who, when discussing the division of operations in industry, pointed to the ‘growers of the flax and the wool’ and the miners as providers of raw material (5 ff., 11), to the spinners and weavers as engaged in special processing operations (6), and to the makers of tools as combining elements of both procedures (11). Mill (1909: 36 ff.) also includes, in the category of previous labour, activities aimed at protecting industrial production proper. Wittfogel, 1956: 157. Wittfogel, 1931: 312, 424, 337–344. Ibid., 1956: 158. Buck, 1937: 61. See Wittfogel, 1931: 253 ff., 261 ff., 267 ff. Buckley, 1893: 10. Cf. Marshall, 1931, I: 6. RRCAI: 359. Cf. Saha, 1930: 12. See Strabo, 1917–1932, 16.1.10. Wittfogel and Fêng, 1949: 661, n. 52. Willcocks, 1904: 70. See Humboldt, 1811, II: 193 ff. Beech, 1911: 15. Parsons, 1939, I; 111. Gutmann, 1909: 20. Eck and Liefrinck, 1876: 228 ff. Deimel, 1928: 34. Ibid., 1931: 83. Sethe, 1912: 710 ff. Arthaçāstra, 1926: 60. Arthaçāstra, 1923: 51 ff. Blas Valeras = Garcilaso, 1945, I: 245. Sahagun, 1938, I: 292, 296. Ramirez, 1944: 52, 75. Tezozomoc, 1944: 381, 385. Willcocks, 1889: 274. Ibid.; 279. Ibid. Gutmann, 1926: 369, 374. Parsons, 1939, I: 124–126. Wittfogel and Goldfrank, 1943: 29. Rüstow, who in general accepts Kern’s view concerning the correlation between large-scale and government-directed water control and the centralized and despotic character of the state in ancient Egypt and Mesopotamia, assumes that in these areas nomadic conquerors developed the hydraulic works after establishing conquest empires (Rüstow, 1950–1952, I: 306). Patterns of leadership and discipline traditional to conquering groups could be, and probably were, invoked in establishing certain hydraulic governments; but Pueblo, Chagga and Hawaiian society show that such formative patterns could also be endogenous. In any case, the ethnographic and historical facts point to a multiple rather than a single origin for hydraulic societies. Cf. Wittfogel, 1931: 456 ff., 680 ff. Ibid., 1938: 98 ff. Wittfogel and Fêng, 1949: 123, 467. Herodotus, 1942, 2.10g.
Oriental Despotism 189 31 Anyone interested in studying the technical and organizational details of a major hydraulic order may consult Willcocks’s admirable description of irrigation and flood control in 19th-century Egypt (Willcocks, 1889: passim). A comprehensive survey of the hydraulic conditions in India at the close of the 19th century has been made by the Indian Irrigation Commission (RRCAI). In my study of Chinese economics and society I have systematically analysed the ecological foundations and the various aspects of China’s traditional hydraulic order (Wittfogel, 1931: 61–93, 188–300, and 410–456). Today we also have an archaeological account of the growth of hydraulic and other constructions over time and for a limited, but evidently, representative area: the Virú Valley in Peru (see Willey, 1953: 344–389). 32 Reed, 1937: 373. Robins, 1946: 91 ff., 129 ff. 33 For Palenque see Stevens, 1863–1877, II: 321, 344. For Aztec Mexico see Tezozomoc, 1944: 23, 379 ff.; Chimalpahin Quauhtlehuanitzin, 1889: 117, 128. 34 Cf. Pietschmann, 1889: 70. 35 Cf. Cahen, 1940: 132. 36 Jacobsen and Lloyd, 1935: 31; Luckenbill, 1926–1927, II: 150. Cf. Olmstead, 1923: 332; Thompson and Hutchinson, 1929: 129 ff. 37 See Wittfogel, 1957, ch 6. 38 Heichelheim, 1938: 728. See also Wittfogel, 1957, ch 7. 39 Williams, 1910: 168. Cf. Sombart, 1919, I: 396; II: 252. 40 Kulischer, 1928–1929, II: 381 ff. 41 Williams, 1910: 168. 42 Sombart, 1919, II: 251. 43 Williams, 1910: 168. 44 Kees, 1933: 129, cf. 109. Breasted, 1927: 147 and passim. 45 Thompson, 1941: 515. 46 Previously I viewed Chou China as a feudal society exhibiting Oriental features, which appeared early and became increasingly conspicuous until, at the close of the period, they prevailed completely (Wittfogel, 1931: 278 ff.; ibid., 1935: 40 ff.). The idea of a society that crosses the institutional divide is entirely compatible with the findings of the present inquiry; and by interpreting Chou society in this way, I would not have had to change a long-held position. But intensified comparative studies compel me to change. The arid and semi-arid settings of North China (17 inches annual rainfall in the old Chou domain and 24 inches in the domain of the pre-Chou dynasty, Shang) suggest hydraulic agriculture for the ancient core areas. The lay of the land, the summer floods, and the periodic silting-up of the rivers necessitated comprehensive measures of flood control especially in the heartland of Shang power. A realistic interpretation of legends and protohistorical sources (cf. Wittfogel and Goldfrank, 1943: passim) points to the rise of a hydraulic way of life long before the Shang dynasty, whose artifacts (bronzes) and inscriptions reflect a highly developed agrarian civilization with refined techniques of record keeping, calculations and astronomy. The recognizable institutions of early Chou are those of a hydraulic society, which gradually intensified its managerial and bureaucratic ‘density’. The Chou sovereigns behaved toward the territorial rulers not as the first among equals but as supreme masters responsible only to Heaven. It was not their fault that their despotic claims, which possibly imitated Shang precedents, were realized imperfectly and with decreasing effect. In contrast, the rulers of the territorial states were strong enough to proceed absolutistically within their respective realms. The lands that they assigned were given not in a contractual way and to independently organized (corporated) knights and barons, but to office holders and persons permitted to enjoy sinecures. They were not fiefs but office lands. 47 See Shih Chi, 29.3a–b, 4b–5a, 5b–6a, 7b–8a, 126.15b. Han Shu, 29.2b–3a, 4a–b, 5a–b, 7a–8a, 89.14b–15a. 48 See Shih Chi, 29.2a–b, 4a–b. Han Shu, 29.1b–2a, 3b–4a, 64A.6b. Hou Han Shu, 35.3b. 49 Sui Shu, 3.11a, cf. 5a.
190 Early Agriculture 50 Kulischer, 1928–1929, II: 6. 51 King, 1927: 97 ff. 52 Castañeda, 1896: 512. Bandelier upholds Castañeda’s figures against divergent statements made in other early Spanish sources (Bandelier, 1890&1892, I: 120 ff. and nn.; cf. ibid., 1929&1930: 312, 46 ff., 171–173). 53 Castañeda, who was the official chronicler of the first Spanish expedition, notes (1896: 494) that the defence towers of a large Zuni settlement were equipped with ‘embrassures and loopholes … for defending the roofs of the different stories’. He adds, ‘The roofs have to be reached first, and these upper houses are the means of defending them.’ The experiences of the second expedition confirmed and supplemented the initial observations. Gallegos concludes his remarks concerning Pueblo building by referring to the movable wooden ladders ‘by means of which they climb to their quarters’. At night ‘they lift them up since they wage war with one another’ (Gallegos, 1927: 265). Obregon also stresses the military value of the ladders; in addition, he explains how the edifices themselves served to protect the community: ‘These houses have walls and loopholes from which they defend themselves and attack their enemies in their battles’ (Obregon, 1928: 293). One of Coronado’s lieutenants, approaching certain Tigua settlements, ‘found the villages closed by palisades’. The Pueblos, whose inhabitants had been subjected to various forms of extortion and insult ‘were all ready for fighting. Nothing could be done, because they would not come down onto the plain and the villages are so strong that the Spaniards could not dislodge them.’ Attacking a hostile village, the Spanish soldiers reached the upper story by surprise tactics. They remained in this dangerous position for a whole day, unable to prevail until the Mexican Indians, who accompanied them, approached the Pueblo from below, digging their way in and smoking out the defenders (Castañeda, 1896: 496. For a discussion of Castañeda’s report see Bandelier, 1929&1930: 38 ff.). Besieging a large Tigua settlement, Coronado’s men had an opportunity to test thoroughly the defence potential of a Pueblo which was not taken by surprise: ‘As the enemy had had several days to provide themselves with stores, they threw down such quantities of rocks upon our men that many of them were laid down, and they wounded nearly a hundred with arrows.’ The siege lasted for seven weeks. During this time, the Spaniards made several assaults; but they were unable to take the Pueblo. The villagers eventually abandoned their fortress-like bulwark, not because the aggressors had penetrated their defences, but because of lack of water (Castañeda, 1896: 498 ff.; cf. RDS, 1896: 576). Bandelier supplements Castañeda’s report of this significant event by an account given by Mota Padilla, an 18th-century author, who claims to have had access to the original writings of still another member of Coronado’s staff (Bandelier, 1929&1930: 323). Mota Padilla’s version contains a number of details which reveal the techniques of attack as well as the strength and ingenuity of the defence. Some of the Spaniards ‘reached the top of the wall, but there they found that the natives had removed the roofs of many (upper) rooms, so that there was no communication between them, and as there were little towers at short distances from each other, from which missiles were showered upon the assailants on the top, the Spaniards had more than 60 of their number hurt, three of whom died of their wounds’ (ibid., 48). 54 Castañeda (1896: 520) qualifies this general statement by saying that the women were ‘engaged in making the [adobe] mixture and the walls, while the men bring the wood and put it in place’. Modern reports assign the above duties to the men and credit them in addition with erecting the walls, the construction labours of the women being confined to plastering (White, 1932: 33; cf. Parsons, 1932: 212). The divergence between the early and recent descriptions may reflect an actual institutional change or merely a difference in the accuracy of observation. While interesting to the anthropologist, this discrepancy does not affect our basic conclusions regarding the communal character of large-scale building in the American Pueblos. 55 Dundas, 1924: 73; cf. Widenmann, 1899: 63 ff.
Oriental Despotism 191 56 57 58 59 60 61
62 63 64 65 66 67
68 69 70 71 72 73 74 75 76 77 78 79 80 81
82 83
84 85 86 87 88 89 90 91 92 93 94
Dundas, 1924: 73. Ibid.: 95 ff. Ibid. Cf. Widenmann, 1899: 63 ff. Cortes, 1866: passim. Díaz, 1944: passim. Cf. Vaillant, 1941: 135. Armillas, 1944: passim. Vaillant, 1941: 219. Jerez, 1938: 38. Sancho de la Hos, 1938: 177 ff. Cieza, 1945: 206 ff., 245. Ondegardo, 1872: 75 ff. Garcilaso, 1945, II: 31, 146 ff. Espinosa, 1942: 565 ff. Cobo, 1890–1895, IV: 65 ff., 207 ff. Cf. Rowe, 1946: 224 ff. Cobo, 1890–1895, III: 272. Garcilaso, 1945, II: 147. Arthaçāstra, 1923: 54 ff. Shih Chi, 88.1b. Meissner, 1920–1925, I: 340. Ibid.: 340 ff. Olmstead, 1923: 334. Meissner, 1920–1925, I: 341. The term ‘royal road’ was used in an Assyrian inscription (Olmstead, 1923: 334). The operational pattern of the Roman state post, the cursus publicus, can be traced back through the Hellenistic period to Persia and perhaps even to Babylonia (Wilcken, 1912: 372 and n. 2). Herodotus, 1942, 5.52 f.; 8.g8. Cf. Xenophon, 1914, 8.6.17. Rostovtzeff, 1941, I: 133, 135, 173 ff., 484, 517. For Diocletian’s achievements in this sphere see Bury, 1931, I: 95 ff.; and Ensslin, 1939: 397. Mez, 1922: 461. For the Mamluks see Sauvaget, 1941: 35. For the Ottoman Turks see Taeschner, 1926: 203 ff. Arthaçāstra, 1926: 60, and esp. 74. Strabo, 1917–1932, 15.1.50. Cf. Smith, 1914: 135. Appadorai, 1936, I: 424 ff. Sabahuddin, 1944: 272 ff. Haig, 1937: 57. Smith, 1926: 413 ff. Kuo Yü, 1935, 2.22 ff. Han Shu, 51.2a. Jerez, 1938: 55. Estete, 1938: 83 ff., 97 ff., 244 ff. Sancho de la Hos, 1938: 175. Pizarro, 1938: 259. CPLNC, 1938: 310. Cieza, 1945: passim. Sarmiento, 1906: 88. Ondegardo, 1872: 12. Cf. Garcilaso, 1945, II: 242 and passim; Cobo, 1890–1895, III: 260 ff. Pizarro, 1938: 259. Cieza, 1943: 95. The regional organization and the repair work on the roads had already been noted by a member of the conquering army (Estete, 1938: 246). The lack of payment for services rendered in the road corvée is also recorded by Blas Valeras, who states that similar conditions prevailed with regard to work on the bridges and irrigation canals (Garcilaso, 1945, I: 258). Chin Shih Ts’ui Pien, 5.13a–b. Widenmann, 1899: 70. Ixtlilxochitl, 1891–1892, II: 174. I Kings 5: 14. For ancient Mesopotamia see Schneider, 1920: 92; Mendelsohn, 1949. Marshall, 1928: 587 ff. Shih Chi, 6.31a–b. Shih Chi, 6.13b–14a, 24a–25a. See above. Sui Shu, 3.9b. Over a million in 607; an additional 200,000 persons were employed in 608 (Sui Shu 3. 10b, 12a). Sui Shu, 24.16a.
192 Early Agriculture 95 Barton, 1929: 3 ff. Thureau-Dangin, 1907: 3 and passim. For epigraphic references to the temples of Babylonia and Assyria see Meissner, 1920–1925, I: 303 ff.; and Luckenbill, 1925–1927: passim. 96 Price, 1927: 24; cf. Thureau-Dangin, 1907: 111, and Barton, 1929: 225. Schneider (1920: 46) and Deimel (1931: 101 ff.) deplore the scarcity of concrete data concerning the Sumerian construction industry. 97 Thus in one of the oldest inscriptions of Egypt extant, the Palermo Stone (Breasted, 1927, I: 64). 98 Breasted, 1927, I: 186, 244, 336; II: 64, 72, 245, 311, 318; III: 96 ff.; IV: 116 ff., 179 ff. and passim. 99 ‘I have commanded those who work, to do according as thou shalt exact’ (Breasted, 1927, I: 245). The ‘people’ bring the stone for the Amon Temple; and the ‘people’ also do the building. Among the workmen are several types of artisans (ibid., II: 294, 293). 100 Ramirez, 1944: 39. 101 Tezozomoc, 1944: 79 (the Temple of Huitzilopochtli) and 157 (the great Cu edifice of the same god). 102 Ixtlilxochitl, 1891–1892, II: 184. 103 Ixtlilxochitl, 1891–1892, II: 173 ff. The Annals of Cuauhtitlan also refer to this construction (Chimalpópoca, 1945: 52), without, however, discussing the labour aspect. 104 Chimalpópoca, 1945: 49. 105 Ibid.: 52. 106 Cieza, 1943: 150 ff. 107 Ibid.: 241. Cf. Garcilaso, 1945, I: 245, 257 ff. 108 Cf. Bengtson, 1950: 38. 109 For another peculiarity of hydraulic architecture, the ‘introvert’ character of most of the residential buildings, with the exception of those of the ruler, see Wittfogel, 1957: 86, n. b. 110 Glotz, 1926: 152, cf. 267. 111 Kulischer, 1928–1929, I: 224. 112 Sombart, 1919, II: 792. Cf. Cole, 1939, II: 458 ff. 113 Cf., for Ottoman Turkey, Anhegger, 1943: 5, 8 ff., 22 ff., 123 ff., 126 ff. 114 Boulais, 1924: 728. 115 Pant, 1930: 70. 116 Social science is indebted to James Burnham for pointing to the power potential inherent in managerial control. The present inquiry stresses the importance of the general (political) organizer as compared not only to the technical specialist (see Veblen, 1945: 441 ff.), but also to the economic manager. This, however, does not diminish the author’s appreciation of the contribution made by Burnham through his concept of managerial leadership.
References Anhegger R. 1943. Beitraege zur Geschichte des Begbaus im osmanischen Reich, I. Istanbul Appadorai A. 1936. Economic Conditions in Southern India (1000–1500 AD). 2 volumes. Madras University Historical Series, 12 and 12-bis. Madras Armillas, P. 1944. Revista Mexicana de estudios anthropologicos. Sociedad Mexicana de Anthropologia VI(3), September 1942–December 1944. Mexico City Arthaçāstra. 1923. Kautilya’s Arthaçāstra. Trans. R. Shamasastry. 2nd edn. Mysore Arthaçāstra. 1926. Das Altindische Buch vom Welt- und Staatsleben des Arthaçāstra des Kautilya, trans. Johann Jakob Meyer. Leipzig
Oriental Despotism 193 Bandelier A E. 1929 & 1930. Documentary history of the Rio Grande Pueblos, New Mexico. New Mexico Historical Review IV, 303–334; V, 38–66, 154–185 Bandelier A E. 1890 & 1892. Final Report of Investigations among the Indians of the South-Western United States, Carried on Mainly in the Years from 1880 to 1885, Archaeological Institute of America, American Series, Cambridge, MA, Papers III & IV Barton G A. 1929. The Royal Inscriptions of Sumer and Akhad. New Haven and London Beech M W H. 1911. The Suk, Their Language and Folklore. Oxford Bengtson H. 1950. Griechische Geschichte. Munich Boulais G. 1924. Manuel du Code Chinois. Shanghai Breasted J H. 1927. Ancient Records of Egypt. 5 vols. Chicago Buck J L. 1937. Land Utilization in China. Chicago Buckley R B. 1893. Irrigation Works in India and Egypt. London and New York Bury J B. 1931. History of the Later Roman Empire. 2 vols. London Cahen C. 1940. La Syrie du Nord à l’époque des Croisades. Institute Français de Damas Bibliothèque Orientale, I. Paris Castañeda. 1896. Translation of narrative of Castañeda. In Winship G P. Coronado expedition 1540– 1542. Fourteenth Annual Report. SIBAE, Washington DC, Part 1, 470–546 Chimalpahin Quauhtlehuanitzin. 1889. Annales de Domingo Francisco de San Anton Muñon Chimalpahin Quauhtlehuanitzin. Trans. Remi Simeon, Bibliothèque Linguistique Américaine, Xii. Paris Chimalpópoca C. 1945. Anales de Cuauhtitlan y leyenda de los soles. Trans. Primo Feliciano Velázquez. Publicaciones del Instituto de Historia 1 (1), Mexico Chin Shih Ts’ui Pien. 1805. By Wang Ch’ang. Ching-hsün t’ang edition, 1805 Cieza de León P. 1945. Del Señorio de los Incas. Prologue and notes by Alberto Mario Salas. Buenos Aires Cobo B. 1890–1895. Historia del Nuevo Mundo. M. Jiménez de la Espada. Sociedad de Bibliófilos Andaluces. 4 vols. Seville Cole C W. 1939. Colbert and a Century of French Mercantilism. 2 volumes. New York Cortes, D P de Gayangos. 1866. Cartas y relaciónes de Hernán Cortés al Emperador Carlos V. Paris CPLNC. 1938. La conquista del Perú llanda la nueva Castilla. BCPP 307–328. Paris Deimel A. 1928. Die Lohnlisten aus der Zeit Urukaginas und seines Vorgängers: I sĕ-ba-Texte d. h. Gerste-Lohn-Listen. OCRAA 5, 34–35: 1–129 Deimel A. 1931. Šumerische Tempelwirtschaft zur Zeit Urukaginas und seiner Vorgänger. Analecta Orientalia 2 Díaz del Castillo B. 1944. Historia verdadera de la conquista de la Nueva España, with introduction and notes by Joaquin Ramirez Cahanas. 3 volumes. Mexico Dundas C. 1924. Kilimanjaro and its People. London Eck R van and Liefrinck F A. 1876. Kertå-Simå of Gemeente- en Waterschaps-Wetten of Bali. Tijdschrift voor Indische Taal-, Land- en Volkenkunde, XXIII. 161–215 Ensslin W. 1939. The senate and the army. CAH XII, 57–95 Espinosa A V de. 1942. Compendium and Description of the West Indies. Trans. Charles Upson Clark. The Smithsonian Institution, Washington DC, Miscelleneous Collections, CII Estete M de. 1938. La relación del viaje que hizo el Señor Capitán Hernando Pizarro por mandado del Señor Gobernador, su hermano, desde el Pueblo de Caxamalca a Pachacama y de allí a Jauja, and Noticia del Perú. BCPP, Paris, 77–98, 195–25i Gallegos. 1927. The Gallegos Relation of the Rodriguez Expedition to New Mexico. Trans George P Hammond and Agapito Rey. Historical Society of New Mexico, Publications in History II, 239–268, 334–362 Garcilaso de la Vega, Inca. 1945. Commentarios Reales de los Incas. Rosenblat A (ed). 2nd edn, 2 volumes. Buenos Aires Glotz G. 1926. Ancient Greece at Work. New York Gutmann B. 1909. Dichten und Denker der Dschagganeger. Leipzig
194 Early Agriculture Gutmann B. 1926. Das Recht der Dschagga. Munich Haig. W. 1937. Sher Shāh and the Sūr Dynasty. The return of Humāyūn. CHI IV, 45–69 Han Shu. Po-na ed. Commercial Press Heichelheim F M. 1938. Wirtschaftsgeschichte des Altertums. 2 volumes. Leiden Herodotus. 1942. The Persian wars. Trans. George Rawlinson in The Greek Historians I. New York, 1–563 Hou Han Shu. Po-na ed. Commercial Press Humboldt A de. 1811. Essai Politique sur le Royaume de la Nouvelle-Espagne. 5 volumes. Paris Ixtlilxochitl, Don Fernando de Alba. 1891–1892. Obras Historicas. Chavero A (ed). 2 volumes. Mexico Jacobsen T and Lloyd S. 1935. Sennacherib’s Aqueduct at Jerwan. Chicago Jerez F de. 1938. … la Conquista del Perú … BCCP, 15–115 Kees H. 1933. Ägypten. Munich King F H. 1927. Farmers of Forty Centuries. London Kulischer J. 1928–1929. Allgemeine Wirtschaftsgeschichte des Mittelalters und der Neuzeit. 2 volumes. Munich and Berlin Kuo Yü. 1935. Commercial Press, Shanghai Luckenbill D D. 1926–1927. Ancient Records of Assyria and Babylonia. 2 volumes. Chicago Marshall A. 1946. Principles of Economics. London Marshall J. 1928. The monuments of Muslim India. CHI III, 568–640 Marshall J. 1931. Mohenjo-daro and the Indus Civilization. 3 volumes. London Marx K. 1890–1894. Das Kapital. 4th, 2nd and 1st editions. 3 volumes. Hamburg Meissner B. 1920–1925. Babylonien und Assyrien. 2 volumes. Heidelberg Mendelsohn I. 1949. Slavery in the Ancient Near East. New York Mez A. 1922. Die Renaissance des Islams. Heidelberg Mill J S. 1909. Principles of Political Economy. London, New York, Bombay and Calcutta Obregon. 1928. Obregon’s History of the 16th Century Explorations in Western America. Trans G P Hammond and A Rey. Los Angeles Olmstead A T. 1923. History of Assyria. New York and London Ondegardo P de. 1872. Relación de los fundamentos acerca del notable Daño que resulta de no guardar á los Indios sus fueros. Colección de Documentos Inéditos … de América y Oceanîa XVII, 5–177 Pant D. 1930. The Commercial Policy of the Moguls. Bombay Parsons E C. 1932. Islete, New Mexico. SIBAE. Forty-seventh Annual Report, 201–1087 Parsons E C. 1939. Pueblo Indian Religion. 2 volumes. Chicago Pietschmann R. 1889. Geschichte der Phönizier. Berlin Pizarro H. 1938. A los magnificos Señores, los Señores oidores de la audiencia real de Su Majestad, que residen en la cuidad de Santo Domingo. BCPP, Paris, 253–264 Price I M. 1927. The Great Cylinder Inscriptions A and B of Gudea. Part 2. Leipzig and New Haven Ramirez C. 1944. Codice Tamirez. Manuscrito del Siglo XVI Intitulado: Relación del origen de los Indios que habitan esta Nueva España, Segun sus Historias. Orozco y Berra M (ed). Mexico City RDS. 1896. Translation of the Relación del Suceso, account of what happened on the journey which Francisco Vazquez made to discover Cibola. In Winship G P. Coronada Expedition 1540–1542. SIBAE. Fourteenth Annual Report, 1892–1893, Part 1, 572–579 Reed T H. 1937. Water supply. ESS XV, 372–377 Robins F W. 1946. The Story of Water Supply. London, New York and Toronto Rostovtzeff M. 1941. The Social and Economic History of the Hellenistic World. 3 volumes. Oxford Rowe J H. 1946. Inca culture at the time of the Spanish conquest. Handbook of South Amercian Indians, II, SIBAE, CXLIII, 183–330 RRCAI. 1928. Report of the Royal Commission on Agriculture in India, Presented to Parliament by Command of His Majesty. June. Abridged
Oriental Despotism 195 Rüstow A. 1950–1952. Ortsbestimmung der Gegenwart. 2 volumes. Erlenback-Zurich Sabahuddin S. 1944. The postal system during the Muslim rule in India. IC XVIII(3), 269–282 Saha K B. 1930. Economics of Royal Bengal, with a foreword by Sir Jehangir Coyajee. Calcutta Sahagun B de. 1938. Historia General de las Cosas de Nueva España. 5 volumes. Mexico City Sancho de la Hos P. 1938. Relación para S. M. de lo Sucedido en la conquista y pacificación de estas provincias de la Nueve Castille y de la Calidad de la Tierra. BCPP, 117–193 Sarmiento de Gamboa P. 1906. Geschichte des Inkareiches. In Pietschmann R (ed). Adhandlingen der Königlichen Gesellschaft der Wissenschaften zu Göttingen, Philologisch-Historische Klasse, VI, Fasc. 4 Sauvaget J. 1941. La Poste aux Chevaux dans l’empire des Mamelouks. Paris Schneider A. 1920. Die Anfänge der Kulturwirtschaft: Die Sumerische Temelstadt. Essen Seligman E R A. 1914. Principles of Economics. New York and London Sethe K. 1912. R. Weill, Les Décrets royaux de l’ancien empire égyptien. Göttingische gelehrte Anzeigen. CLXXIV, 705–726 Shih Chi. Po-na ed. Commercial Press Smith A. 1937. An Inquiry into the Nature and Causes of the Wealth of Nations. Modern Library, New York Smith V A. 1914. The Early History of India. 3rd edition. Oxford Smith V A. 1926. Akbar, the Great Mogul, 1542–1605. 2nd edition. Oxford Sombart W. 1919. Der Moderne Kapitalismus. 2 volumes. Munich and Leipzig Stevens J L. 1863–1877. Incidents of Travel in Central America, Chiapas and Yucatan. 12th edition. 2 volumes. New York Strabo. 1917–1932. The Geography of Strabo. With an English trans. by Horace Leonard Jones. New York Sui Shu. Po-na ed. Commercial Press Taeschner F. 1926. Die Verkehrslage und das Wegenetz Anatoliens im Wandel der Zeiten. PM LXXII, 202–206 Tezozomoc H A. 1944. Crónica Mexicana escrita hacia el año de 1598, notes by Manuel Orozco y Berra. Mexico City Thompson R C and Hutchinson R W. 1929. A History of Exploration at Nineveh. London Thompson V. 1941. Thailand: The New Siam. New York Thureau-Danglin F. 1907. Die Sumerischen und Akkadischen Königsinschriften. Vorderasiatische Bibliothek I. Part 1. Leipzig Vaillant G C. 1941. Aztecs of Mexico. Garden City, New York Veblen T. 1945. What Veblen Taught. Selected writings. Mitchel W C (ed). New York White L A. 1932. The Acoma Indians. SIBAE. Forty-seventh Annual Report, 17–192 Widenmann A. 1899. Die Kilimanscharo-bevölkerung anthropologisches und ethnographisches aus dem Dschaggalande. PM, Suppl XXVII(129) Wilcken U. 1912. Historischer Teil: Grundzüge. Volume 1, Part 1 of Grundzüges und Chrestomathie der Papyruskunde. Mitteis L and Wilcken U. Leipzig and Berlin Willcocks W. 1889. Egyptian Irrigation. London and New York Willcocks W. 1904. The Nile in 1904. London and New York Willey G E. 1953. Prehistoric Settlement Patterns in the Virú Valley, Perú. SIBAE, CLV Williams E L. 1910. Canal. Encyclopaedia Britannica V. 11th edition. 168–171 Wittfogel K A. 1931. Wirtschaft und Gesellschaft Chinas, Erster Teil, Produktivkräfte, Produktions- und Zirkulationsprozess. Leipzig Wittfogel K A. 1935. The foundations and stages of Chinese economic history. Zeitschrift für Sozialforschung IV, 26–60 Wittfogel K A. 1956. Hydraulic civilizations. In Thomas W L Jr (ed). Man’s Role In Changing the Face of the Earth. Wenner-Gren Foundation, Chicago Wittfogel K A. 1957. Oriental Despotism. Yale University Press, New Haven
196 Early Agriculture Wittfogel K A and Fêng Chia-shêng. 1949. History of Chinese Society, Liao. American Philosophical Society, Transactions XXXVI, Philadelphia Wittfogel K A and Goldfrank E S. 1943. Some aspects of pueblo mythology and society. Journal of American Folklore January–March, 17–30 Xenophon. 1914. The Education of Cyrus. Everyman Library, London and New York
8
Marcus Cato on Agriculture Marcus Porcius Cato
It is true that to obtain money by trade is sometimes more profitable, were it not so hazardous; and likewise money-lending, if it were as honourable. Our ancestors held this view and embodied it in their laws, which required that the thief be mulcted double and the usurer fourfold; how much less desirable a citizen they considered the usurer than the thief, one may judge from this. And when they would praise a worthy man their praise took this form: ‘good husbandman’, ‘good farmer’; one so praised was thought to have received the greatest commendation. The trader I consider to be an energetic man, and one bent on making money; but, as I said above, it is a dangerous career and one subject to disaster. On the other hand, it is from the farming class that the bravest men and the sturdiest soldiers come, their calling is most highly respected, their livelihood is most assured and is looked on with the least hostility, and those who are engaged in that pursuit are least inclined to be disaffected. And now, to come back to my subject, the above will serve as an introduction to what I have undertaken. I. When you are thinking of acquiring a farm, keep in mind these points: that you be not over-eager in buying nor spare your pains in examining, and that you consider it not sufficient to go over it once. However often you go, a good piece of land will please you more at each visit. Notice how the neighbours keep up their places; if the district is good, they should be well kept. Go in and keep your eyes open, so that you may be able to find your way out. It should have a good climate, not subject to storms; the soil should be good, and naturally strong. If possible, it should lie at the foot of a mountain and face south; the situation should be healthful, there should be a good supply of labourers, it should be well watered, and near it there should be a flourishing town, or the sea, or a navigable stream, or a good and much travelled road. It should lie among those farms which do not often change owners; where those who have sold farms are sorry to have done so. It should be well furnished with buildings. Do not be hasty in despising the methods of management Reprinted by permission of the publishers and the Trustees of the Loeb Classical Library from Cato and Varro: On Agriculture, Loeb Classical Library ® Volume 283, translated by W D Hooper and H B Ash, pp3–23, 161–165, 185–193, Cambridge, Mass.: Harvard University Press, Copyright © 1934 by the President and Fellows of Harvard College. The Loeb Classical Library ® is a registered trademark of the President and Fellows of Harvard University.
198 Early Agriculture
adopted by others.1 It will be better to purchase from an owner who is a good farmer and a good builder. When you reach the steading, observe whether there are numerous oil presses and wine vats; if there are not, you may infer that the amount of the yield is in proportion. The farm should be one of no great equipment, but should be well situated. See that it be equipped as economically as possible, and that the land be not extravagant. Remember that a farm is like a man – however great the income, if there is extravagance but little is left. If you ask me what is the best kind of farm, I should say: a hundred iugera2 of land, comprising all sorts of soils, and in a good situation; a vineyard comes first if it produces bountifully wine of a good quality; second, a watered garden; third, an osier-bed; fourth, an oliveyard; fifth, a meadow; sixth, grain land;3 seventh, a wood lot; eighth, an arbustum;4 ninth, a mast grove.5 II. When the master arrives at the farmstead, after paying his respects to the god of the household, let him go over the whole farm, if possible, on the same day; if not, at least on the next. When he has learned the condition of the farm, what work has been accomplished and what remains to be done, let him call in his overseer the next day and inquire of him what part of the work has been completed, what has been left undone; whether what has been finished was done betimes, and whether it is possible to complete the rest; and what was the yield of wine, grain and all other products. Having gone into this, he should make a calculation of the labourers and the time consumed. If the amount of work does not seem satisfactory, the overseer claims that he has done his best, but that the slaves have not been well, the weather has been bad, slaves have run away, he has had public work6 to do; when he has given these and many other excuses, call the overseer back to your estimate of the work done and the hands employed. If it has been a rainy season, remind him of the work that could have been done on rainy days: scrubbing and pitching wine vats, cleaning the farmstead, shifting grain, hauling out manure, making a manure pit, cleaning seed, mending old harness and making new; and that the hands ought to have mended their smocks and hoods. Remind him, also, that on feast days old ditches might have been cleaned, road work done, brambles cut, the garden spaded, a meadow cleared, faggots bundled, thorns rooted out, spelt ground and general cleaning done. When the slaves were sick, such large rations should not have been issued. After this has been gone into calmly, give orders for the completion of what work remains; run over the cash accounts, grain accounts and purchases of fodder; run over the wine accounts, the oil accounts – what has been sold, what collected, balance due and what is left that is saleable; where security for an account should be taken, let it be taken; and let the supplies on hand be checked over. Give orders that whatever may be lacking for the current year be supplied; that what is superfluous be sold; that whatever work should be let out be let. Give directions as to what work you want done on the place, and what you want let out,7 and leave the directions in writing. Look over the live stock and hold a sale. Sell your oil, if the price is satisfactory, and sell the surplus of your wine and grain. Sell worn-out oxen, blemished cattle, blemished sheep, wool, hides, an old wagon, old tools, an old slave, a sickly slave and whatever else is superfluous. The master should have the selling habit, not the buying habit.
Marcus Cato on Agriculture 199
III. In his youth the owner should devote his attention to planting. He should think a long time about building, but planting is a thing not to be thought about but done. When you reach the age of thirty-six you should build, if you have your land planted.8 In building, you should see that the steading does not lag behind the farm nor the farm behind the steading. It is well for the master to have a well-built barn9 and storage room and plenty of vats for oil and wine, so that he may hold his products for good prices; it will redound to his wealth, his self-respect and his reputation. He should have good presses, so that the work may be done thoroughly. Let the olives be pressed immediately after gathering, to prevent the oil from spoiling. Remember that high winds come every year and are apt to beat off the olives; if you gather them at once and the presses are ready, there will be no loss on account of the storm, and the oil will be greener and better. If the olives remain too long on the ground or the floor they will spoil, and the oil will be rancid. Any sort of olive will produce a good and greener oil if it is pressed betimes. For an oliveyard of 120 iugera there should be two pressing equipments, if the trees are vigorous, thickly planted and well cultivated. The mills should be stout and of different sizes, so that if the stones become worn you may change. Each should have its own leather ropes, six sets of hand bars, six double sets of pins and leather belts. Greek blocks run on double ropes of Spanish broom; you can work more rapidly with eight pulleys above, and six below; if you wish to use wheels it will work more slowly but with less effort. IV. Have good stalls, stout pens and latticed feed-racks. The rack bars should be a foot apart; if you make them in this way the cattle will not scatter their feed. Build your dwelling-house in accordance with your means. If you build substantially on a good farm, placing the house in a good situation, so that you can live comfortably in the country, you will like to visit it, and will do so oftener; the farm will improve, there will be less wrongdoing, and you will receive greater returns; the forehead is better than the hindhead.10 Be a good neighbour, and do not let your people commit offences. If you are popular in the neighbourhood it will be easier for you to sell your produce, easier to let out your work,11 easier to secure extra hands. If you build, the neighbours will help you with their work, their teams, and their materials; if trouble comes upon you, which God forbid,12 they will be glad to stand by you. V. The following are the duties of the overseer: He must show good management. The feast days must be observed. He must withhold his hands from another’s goods and diligently preserve his own. He must settle disputes among the slaves; and if anyone commits an offence he must punish him properly in proportion to the fault. He must see that the servants are well provided for, and that they do not suffer from cold or hunger. Let him keep them busy with their work – he will more easily keep them from wrongdoing and meddling. If the overseer sets his face against wrongdoing, they will not do it; if he allows it, the master must not let him go unpunished. He must express his appreciation of good work, so that others may take pleasure in well-doing. The overseer must not be a gadabout, he must always be sober, and must not go out to dine. He must keep the servants busy, and see that the master’s orders are carried out.
200 Early Agriculture
He must not assume that he knows more than the master. He must consider the master’s friends his own friends. He must pay heed to anyone to whom he has been bidden to listen. He must perform no religious rites, except on the occasion of the Compitalia13 at the cross-roads, or before the hearth. He must extend credit to no one without orders from the master, and must collect the loans made by the master. He must lend to no one seed-grain, fodder, spelt, wine or oil. He must have two or three households, no more, from whom he borrows and to whom he lends. He must make up accounts with the master often. He must not hire the same day-labourer or servant or caretaker for longer than a day. He must not want to make any purchases without the knowledge of the master, nor want to keep anything hidden from the master. He must have no hanger-on. He must not consult a fortune-teller, or prophet or diviner or astrologer.14 He must not stint the seed for sowing, for that brings bad fortune. He must see to it that he knows how to perform all the operations of the farm, and actually does perform them often, but not to the extent of becoming exhausted; by so doing he will learn what is in his servants’ minds, and they will perform their work more contentedly. Also, he will be less disposed to gad about, will be in better health, and will enjoy his sleep more. He must be the first out of bed, the last to go to bed. Before then he must see that the farmstead is closed, that each one is asleep in his proper place, and that the stock have fodder. See that the draft oxen are looked after with the greatest care, and be somewhat indulgent to the teamsters to make them look after their stock with more pleasure. See that you keep your ploughs and ploughshares in good condition. Be careful not to plough land which is cariosa15 or drive a cart over it, or turn cattle into it; if you are not careful about this, you will lose three years’ crop of the land on which you have turned them. Litter the cattle and flocks carefully, and see that their hoofs are kept clean. Guard against the scab in flocks and herds; it is usually caused by under-feeding and exposure to wet weather. See that you carry out all farm operations betimes, for this is the way with farming: if you are late in doing one thing you will be late in doing everything. If bedding runs short, gather oak leaves and use them for bedding down sheep and cattle. See that you have a large dunghill; save the manure carefully, and when you carry it out, clean it of foreign matter and break it up. Autumn is the time to haul it out. During the autumn also dig trenches around the olive trees and manure them. Cut poplar, elm and oak leaves betimes; store them before they are entirely dry, as fodder for sheep. Second-crop hay and aftermath should also be stored dry. Sow turnips, forage crops and lupins after the autumn rains. VI. This rule should be observed as to what you should plant in what places: Grain should be sown in heavy, rich, treeless soil; and if this sort of soil is subject to fogs it should preferably be sown with rape, turnips, millet and panic-grass. In heavy, warm soil plant olives16 – those for pickling, the long variety, the Sallentine, the orcites, the posea, the Sergian, the Colminian and the waxy-white; choose especially the varieties which are commonly agreed to be the best for these districts. Plant this variety of olives at intervals of 25 or 30 feet. Land which is suitable for
Marcus Cato on Agriculture 201
olive planting is that which faces the west and is exposed to the sun; no other will be good. Plant the Licinian olive in colder and thinner soil. If you plant it in heavy or warm soil the yield will be worthless, the tree will exhaust itself in bearing, and a reddish scale will injure it. Around the borders of the farm and along the roads plant elms and some poplars, so that you may have leaves for the sheep and cattle; and the timber will be available if you need it. Wherever there is a river bank or wet ground, plant poplar cuttings and a reed thicket. The method of planting is as follows: turn the ground with the mattock and then plant the eyes of the reed three feet apart. Plant there also the wild asparagus,17 so that it may produce asparagus; for a reed thicket goes well with the wild asparagus, because it is worked and burned over, and furnishes a shade when shade is needed. Plant Greek willows along the border of the thicket, so that you may have withes for tying up vines. Choose soil for laying out a vineyard by the following rules: In soil which is thought to be best adapted for grapes and which is exposed to the sun, plant the small Aminnian,18 the double eugeneum and the small parti-coloured; in soil that is heavy or more subject to fogs plant the large Aminnian, the Murgentian, the Apician and the Lucanian. The other varieties, and especially the hybrids, grow well anywhere. VII. It is especially desirable to have a plantation19 on a suburban farm, so that firewood and faggots may be sold, and also may be furnished for the master’s use. On the same farm should be planted anything adapted to the soil, and several varieties of grapes, such as the small and large Aminnian and the Apician. Grapes are preserved in grape-pulp in jars;20 also they keep well in boiled wine, or must, or after-wine.21 You may hang up the hard-berried and the larger Aminnian and they will keep as well dried before the forge fire as when spread in the sun. Plant or ingraft all kinds of fruit – sparrow-apples, Scantian and Quirinian quinces,22 also other varieties for preserving, must-apples and pomegranates (the urine or dung of swine should be applied around the roots of these to serve as food for the fruit); of pears, the volema, the Anician frost-pears (these are excellent when preserved in boiled wine),23 the Tarentine, the must-pear, the gourd-pear and as many other varieties as possible; of olives, the orcite and posea, which are excellent when preserved green in brine or bruised in mastic24 oil. When the orcites are black and dry, powder them with salt for five days; then shake off the salt, and spread them in the sun for two days, or pack them in boiled must without salt. Preserve sorbs in boiled must; or you may dry them; make them quite free from moisture. Preserve pears in the same way. VIII. Plant mariscan figs in chalky, open soil; the African, Herculanean, Saguntine, the winter variety, the black Tellanian with long pedicles, in soil which is richer or manured. Lay down a meadow, so that you may have a supply of hay – a water meadow if you have it, if not, a dry meadow. Near a town it is well to have a garden planted with all manner of vegetables, and all manner of flowers for garlands – Megarian bulbs, conjugulan myrtle,25 white and black myrtle, Delphian, Cyprian, and wild laurel, smooth nuts, such as Abellan, Praenestine and Greek filberts. The suburban farm, and especially if it be the only one, should be laid out and planted as ingeniously as possible.
Marcus Terentius Varro on Agriculture Marcus Terentius Varro
Book I 1. Had I possessed the leisure, Fundania,1 I should write in a more serviceable form what now I must set forth as I can, reflecting that I must hasten; for if man is a bubble, as the proverb has it, all the more so is an old man. For my 80th year admonishes me to gather up my pack before I set forth from life. Wherefore, since you have bought an estate and wish to make it profitable by good cultivation, and ask that I concern myself with the matter, I will make the attempt; and in such wise as to advise you with regard to the proper practice not only while I live but even after my death. And I cannot allow the Sibyl to have uttered prophecies which benefited mankind not only while she lived, but even after she had passed away, and that too people whom she never knew – for so many years later we are wont officially to consult her books when we desire to know what we should do after some portent – and not do something, even while I am alive, to help my friends and kinsfolk. Therefore I shall write for you three handbooks to which you may turn whenever you wish to know, in a given case, how you ought to proceed in farming. And since, as we are told, the gods help those who call upon them, I will first invoke them – not the Muses, as Homer and Ennius do, but the 12 councillor-gods;2 and I do not mean those urban gods, whose images stand around the forum, bedecked with gold, six male and a like number female, but those 12 gods who are the special patrons of husbandmen. First, then, I invoke Jupiter and Tellus, who, by means of the sky and the earth, embrace all the fruits of agriculture; and hence, as we are told that they are the universal parents, Jupiter is called ‘the Father’, and Tellus is called ‘Mother Earth’. And second, Sol and Luna, whose courses are watched in all matters of planting and harvesting. Third, Ceres and Liber, because their fruits are most necessary for life; for it is by their favour that food and drink come from the farm. Fourth, Robigus and Flora; for when they are propitious the rust will not harm the grain and the trees, and they will not fail to bloom in their season; wherefore, in honour of Robigus has been established the solemn feast of the Robigalia, and in honour of Flora the games called Floralia. Likewise I beseech Minerva and Venus, of whom the one protects the oliveyard
Marcus Terentius Varro on Agriculture 203
and the other the garden; and in her honour the rustic Vinalia has been established.3 And I shall not fail to pray also to Lympha and Bonus Eventus, since without moisture all tilling of the ground is parched and barren, and without success and ‘good issue’ it is not tillage but vexation. Having now duly invoked these divinities, I shall relate the conversations which we had recently about agriculture, from which you may learn what you ought to do; and if matters in which you are interested are not treated, I shall indicate the writers, both Greek and Roman, from whom you may learn them. III. ‘Well, then’, said Agrasius, ‘since we have decided the nature of the subjects which are to be excluded from agriculture, tell us whether the knowledge of those things used in agriculture is an art or not, and trace its course from starting-point to goal.’ Glancing at Scrofa, Stolo said: ‘You are our superior in age, in position, and in knowledge, so you ought to speak.’ And he, nothing loath, began: ‘In the first place, it is not only an art but an important and noble art. It is, as well, a science, which teaches what crops are to be planted in each kind of soil, and what operations are to be carried on, in order that the land may regularly produce the largest crops. IV. ‘Its elements are the same as those which Ennius says are the elements of the universe – water, earth, air and fire.4 You should have some knowledge of these before you cast your seed, which is the first step in all production.5 Equipped with this knowledge, the farmer should aim at two goals, profit and pleasure; the object of the first is material return, and of the second enjoyment. The profitable plays a more important role than the pleasurable; and yet for the most part the methods of cultivation which improve the aspect of the land, such as the planting of fruit and olive trees in rows, make it not only more profitable but also more saleable, and add to the value of the estate. For any man would rather pay more for a piece of land which is attractive than for one of the same value which, though profitable, is unsightly. Further, land which is more wholesome is more valuable, because on it the profit is certain; while, on the other hand, on land that is unwholesome, however rich it may be, misfortune does not permit the farmer to reap a profit. For where the reckoning is with death, not only is the profit uncertain, but also the life of the farmers; so that, lacking wholesomeness, agriculture becomes nothing else than a game of chance, in which the life and the property of the owner are at stake. And yet this risk can be lessened by science; for, granting that healthfulness, being a product of climate and soil, is not in our power but in that of nature, still it depends greatly on us, because we can, by care, lessen the evil effects. For if the farm is unwholesome on account of the nature of the land or the water, from the miasma which is exhaled in some spots; or if, on account of the climate, the land is too hot or the wind is not salubrious, these faults can be alleviated by the science and the outlay of the owner. The situation of the buildings, their size, the exposure of the galleries, the doors and the windows, are matters of the highest importance. Did not that famous physician, Hippocrates, during a great pestilence save not one farm but many cities by his skill?6 But why do I cite him? Did not our friend Varro here, when the army and fleet were at Corcyra, and all the houses were crowded
204 Early Agriculture
with the sick and the dead, by cutting new windows to admit the north wind, and shutting out the infected winds, by changing the position of doors, and other precautions of the same kind, bring back his comrades and his servants in good health?7 V. ‘But as I have stated the origin and the limits of the science, it remains to determine the number of its divisions.’ ‘Really,’ said Agrius, ‘it seems to me that they are endless, when I read the many books of Theophrastus, those which are entitled “The History of Plants” and “The Causes of Vegetation”.’ ‘His books,’ replied Stolo, ‘are not so well adapted to those who wish to tend land as to those who wish to attend the schools of the philosophers;8 which is not to say that they do not contain matter which is both profitable and of general interest. So, then, do you rather explain to us the divisions of the subject.’ ‘The chief divisions of agriculture are four in number,’ resumed Scrofa: ‘First, a knowledge of the farm, comprising the nature of the soil and its constituents; second, the equipment needed for the operation of the farm in question; third, the operations to be carried out on the place in the way of tilling; and fourth, the proper season for each of these operations. Each of these four general divisions is divided into at least two subdivisions: the first comprises questions with regard to the soil as such, and those which pertain to housing and stabling. The second division, comprising the movable equipment which is needed for the cultivation of the farm, is also subdivided into two: the persons who are to do the farming, and the other equipment. The third, which covers operations, is subdivided: the plans to be made for each operation, and where each is to be carried on. The fourth, covering the seasons, is subdivided: those which are determined by the annual revolution of the sun, and those determined by the monthly revolution of the moon. I shall discuss first the four chief divisions, and then the eight subdivisions in more detail. VI. ‘First, then, with respect to the soil of the farm, four points must be considered: the conformation of the land, the quality of the soil, its extent, and in what way it is naturally protected. As there are two kinds of conformation, the natural and that which is added by cultivation, in the former case one piece of land being naturally good, another naturally bad, and in the latter case one being well tilled, another badly, I shall discuss first the natural conformation. There are, then, with respect to the topography, three simple types of land – plain, hill and mountain; though there is a fourth type consisting of a combination of these, as, for instance, on a farm which may contain two or three of those named, as may be seen in many places. Of these three simple types, undoubtedly a different system is applicable to the lowlands than to the mountains, because the former are hotter than the latter; and the same is true of hillsides, because they are more temperate than either the plains or the mountains. These qualities are more apparent in broad stretches, when they are uniform; thus the heat is greater where there are broad plains, and hence in Apulia the climate is hotter and more humid, while in mountain regions, as on Vesuvius, the air is lighter and therefore more wholesome. Those who live in the lowlands suffer more in summer; those who live in the uplands suffer more in winter; the same crops are planted earlier in the spring in the lowlands than in the
Marcus Terentius Varro on Agriculture 205
uplands, and are harvested earlier, while both sowing and reaping come later in the uplands. Certain trees, such as the fir and the pine, flourish best and are sturdiest in the mountains on account of the cold climate, while the poplar and the willow thrive here where the climate is warmer; the arbute and the oak do better in the uplands, the almond and the mariscan fig in the lowlands. On the foothills the growth is nearer akin to that of the plains than to that of the mountains; on the higher hills the opposite is true. Owing to these three types of configuration different crops are planted, grain being considered best adapted to the plains, vines to the hills, and forests to the mountains. Usually the winter is better for those who live in the plains, because at that season the pastures are fresh, and pruning can be carried on in more comfort. On the other hand, the summer is better in the mountains, because there is abundant forage at that time, whereas it is dry in the plains, and the cultivation of the trees is more convenient because of the cooler air. A lowland farm that everywhere slopes regularly in one direction is better than one that is perfectly level, because the latter, having no outlet for the water, tends to become marshy. Even more unfavourable is one that is irregular, because pools are liable to form in the depressions. These points and the like have their differing importance for the cultivation of the three types of configuration.’
Notes Marcus Cato on Agriculture 1 2 3
4
5 6 7 8 9
Others render, ‘Be careful not rashly to refuse to learn from others.’ A iugerum is approximately two-thirds of an acre. It is most significant that Cato places grain farming sixth in importance. The second Punic War had completely demoralized the Republic. The yeomanry had been conscripted and the fields desolated and burned. ‘Roman farmers torn from their homes for years and demoralized by the camps were unable or unwilling to settle down into the quiet routine of agricultural life… Their farms passed into the hands of capitalists, and the rich lands of Italy fell back into pasture, and half-naked slaves tended herds of cattle’ (Bosworth Smith, Rome and Carthage, p230). Grain farming was no longer profitable, and it had become the custom to import grain from Sicily and Africa. The new Rome that emerged from this horrible war centred around a nobility of wealth and was in a state of demoralization. Such a condition naturally caused the cultivation of grain to be less important than that of the vine, the olive, domestic vegetables or the rearing of cattle. The word is used of a plantation of trees, to which the vines were ‘wedded’ or of an orchard. Columella gives a description, Book V, Chapter 6, but Cato seems not to use the word in the sense first given. To furnish feed for livestock. Possibly on the public roads, as in the French corvée. It was the regular custom among the Romans to let out certain work by contract in contrast with the work that was done by the farm organization under the management of the overseer. The ‘planting’ is, of course, of trees and vines. See Columella, I, 6; but Cato’s villa had only two units, the villa urbana, or dwelling-house, and the villa rustica, for all other purposes.
206 Early Agriculture 10 The content of this homely maxim appears in practically all the writers on agriculture, and has entered, in some form, into almost all proverbial wisdom. Perhaps its most popular modern form is taken from Poor Richard’a almanack: ‘The eye of a master will do more work than both his hands.’ Cf Columella, I, 1, 18; Pliny, N. H., XVIII, 31. 11 See note 7. 12 bona salute is merely a formula to avoid the evil omen of mentioning misfortune. 13 The festival held annually at the cross-roads, in honour of the Lares Compitales. It occurred soon after the Saturnalia, in December, on a day, or days appointed by the praetor. 14 Compare Horace’s warning against ‘meddling with Babylonian calculations’ (Odes, I, II), and many others. Columella, I, 8, 6, emphasizes the warning. 15 The term is explained by Columella, II, 4, 5: ‘that is, when after a long, dry spell, a light rain wets the surface but does not sink in.’ The injunction is repeated there. 16 For a description of the various varieties of olives, see Columella, V, 8. The Romans were experts in plant selection, and developed distinct varieties of all the leading horticultural and field crops. 17 Corruda: identified in the 5th (?) cent. Herbal under the name of Pseudo-Apuleius (Herb., 84) as ‘the wild asparagus which the Greeks call ορµινον or µνακανδον and by other names.’ 18 See Columella, III, 2 for a detailed discussion of varieties of grapes. In Chapter 9 he returns to the discussion of the Aminnian, and remarks that these were ‘almost the only varieties known to the ancients’. 19 Cf note 4. 20 Cf Varro, I, 54, 2. 21 A small or sharp wine made from the husks of grapes; cf Varro, I, 54, 3. 22 Cf Varro, I, 59, 1. 23 Cf Varro, I, 59, 3. 24 This resin from the mastic-tree is used also to flavour a distilled liquor used in various countries, as Turkey, Greece, etc. 25 Pliny says (XV, 122) that the name is perhaps derived from that for marriage (coniugium). The colours are those of the berries.
Marcus Terentius Varro on agriculture 1 2
Varro’s wife. In the Etrusco-Romish language of religion, the twelve superior deities who formed the common council of the gods, assembled by Jupiter. The word occurs only in this phrase. Their names are given by Ennius in the hexameters: Juno, Vesta, Minerva, Ceres, Diana, Venus, Mars, Mercurius, Ioui’, Neptunus, Vulcanus, Apollo.
3
4 5 6 7 8
The festival occurred on 19 August; and Varro tells us (De Ling. Lat., VI, 16) that it was ‘because at that time a temple was dedicated to Venus, and the protection of the garden is assigned to her’. But Ovid, Fasti, IV, 877f offers another explanation. Ennius, Epicharmus, frag. III, aqua, terra, anima, sol. Quod initium fructuum oritur is variously interpreted. The present editors believe that quod must refer to the nominal idea iacere semina derived from the preceding clause. The incident is mentioned by Pliny, N.H., VII, 123. Pompey’s forces lay at Corcyra before Pharsalia, and Varro had joined him after surrendering to Caesar in Spain. It will be understood that the word covers the meaning of our ‘scientist’.
Marcus Terentius Varro on Agriculture 207
References Bosworth Smith R. 1887. Rome and Carthage: The Punic Wars. Longmans, Green, New York Cato. De Re Rustica; Varro. De Re Rustica. Ash H B and Hooper W D. The Loeb Classical Library. Harvard University Press and William Heinemann Ltd, Cambridge MA and London Columella. De Re Rustica. De Arboribus. Ash H B, Forster E S and Hefner C (eds). 3 volumes. The Loeb Classical Library. Harvard University Press and William Heinemann Ltd, Cambridge MA and London Horace. Odes and Epodes. Bennett C E. The Loeb Classical Library. Harvard University Press and William Heinemann Ltd, Cambridge MA and London Ovid. Fasti. Frazer J G Sir. The Loeb Classical Library. Harvard University Press and William Heinemann Ltd, Cambridge MA and London Pliny. Natural History. Rackham H, volumes I–V and IX. Jones W H S, VI–VIII. Eichholz D E, X. 10 volumes. The Loeb Classical Library. Harvard University Press and William Heinemann Ltd, Cambridge MA and London Varro. De Lingua Latina. Kent R G. 2 volumes. The Loeb Classical Library. Harvard University Press and William Heinemann Ltd, Cambridge MA and London
9
Agroecological Farming Systems in China Li Wenhua
The Philosophy and Technology Related to IFS in Ancient China Though the term integrated farming system (IFS) has been formally used for no more than 30 years, some primitive philosophy and technologies for implementation of this system can be traced back to ancient times (Tang, 1988; Tang, 1990; Li, 1993; Zhang et al, 1996).
Influence of ancient philosophical ideas on development of IFS For thousands of years, Chinese philosophers have pondered on the harmonious relationship between humans, nature and the environment. The Tian Ren He Yi theory (heaven/nature and human/society are merged into one unit) had great influence among Chinese people and formed the roots of China’s IFS. The most vigorous and flourishing development of the integrated concept was in the Spring and Autumn to Warring States period (720–221 BC). A set of systematic principles for the management of the relationships between man and the environment was formulated. For example, in a famous treatise, Zhou Yi (The Book of Change), a brief but deeply philosophical concept of the holistic relationship between Tian (heaven or nature), Di (earth or resources) and Ren (humans or society) was described. Respect for Dao-Li (natural relationship with the universe, geography, climate, etc.), Shi-Li (planning and management of human activities, such as agriculture, warfare, politics, family and others), and Qing-Li (ecological ethics, psychology, motives and values towards the environment) became a general principle for managing all social and productive Reprinted from Chapter 3 ‘Historical Review,’ pp23–36, in Li Wenhua, Agro-Ecological Farming Systems in China, Man and the Biosphere Series Volume 26. Copyright © 2001 UNESCO/Parthenon Publishing Group.
Agroecological Farming Systems in China 209
matters. The Yin and Yang theory (negative and positive forces interacting with each other and ecological relationships) and the Wuxing theory (five elements within a system and the interrelated movements between them) have been widely used in agriculture to reflect the relationship between different components. In ancient China, the people have long used the terms of Xiang Cheng and Xiang Ke to express the positive and negative relationships between different components when they co-exist. Two or more of these can integrate to exert Xi ang Cheng for their mutual benefits, and to use Xiang Ke for living control. All these basic philosophical concepts have profound influence on the practice and formulation of IFS (Wang, 1996).
The beginnings of IFS in ancient China In the course of China’s long history of agriculture, a wealth of knowledge and theories have accumulated (Institute of the History of Natural Sciences, 1985; Guo et al, 1986; Tang, 1986; Liang, 1989). Archaeological evidence has revealed that the ancestors of the Chinese people inhabited forests where they sheltered from external hazards and lived on edible parts of wild plants and animals. In the New Stone Age (6000–8000 BC), the Chinese initiated fire farming in which forests were burned and seeds were directly sown in soil covered with the ash. Tillage farming arose later on the burned land and the ash was mixed with soil before planting. Grains or other crops were grown without external fertilizer. After several years the crop yield decreased remarkably, and cultivation would shift to another forest and the same practices were repeated. Such slash-and-burn cultivation is the oldest and most primitive form of ecoagriculture and was widely practised over a period of 6000–7000 years until the Xia Dynasty (2000–1600 BC) when there was a gradual shift to settled farming, except in some remote mountainous areas in south-western China and among some minorities such as the Du Long, Nu, Xi Wa and Yao. Slash-and-burn was also widely used in silviculture, for reforestation and afforestation with Chinese fir (Cunninghamia laceolata) in southern China, for thousands of years. Farmers remove all ground cover, including small trees and shrubs in summer, burn them in autumn, level the ground to mix in the ashes in winter and then either plant seedlings or cuttings of fir trees with other crops in spring, or grow crops for one or two years before tree planting. In newly established fir stands, intercropping is also practised until crown closure. Such measures, used in the process of establishment of fir forests, are similar to the Taungya system developed for management of teak (Tectona grandis) stands in Myanmar in the mid-1800s. Interplanting of trees and crops, now known as agroforestry, originated in the Shang-West Zhou Dynasties (1600–800 BC), as the forested land of the plains was converted into cultivated land, and farmers planted trees in or around the crop fields. Some grew fruit trees, vegetables or bred domestic animals (Gui Mowen, 1990), whereas in the mountainous areas with fewer people and more forests, peasants cultivated cash crops in the forests or interplanted food crops during reforestation and afforestation. Since then, various forms of agroforestry–animal
210 Early Agriculture
husbandry have been developed and improved with appropriate facilities and structures in accordance with local conditions, particularly in the Ming and Qing Dynasties (14th–19th centuries) (Liang, 1983). According to historical records, in the latter part of the New Stone Age (2500– 2100 BC), along with an increase in population, collapse of the clan society and the appearance of slavery, agriculture developed rapidly. Slash-and-burn was no longer the main farming system except in less-populated but abundantly forested and underdeveloped areas. Instead of nomadic farming, the slave owners allotted a portion of their land to each slave. The slaves no longer moved to forested land for cultivation but settled in one place where they engaged in farming permanently. The forests on hilly land were preserved as pasture or hunting sites. Settled farming in the Xia and Shang Dynasties (2000–1100 BC) became a force pushing agricultural development. By that time, people began to make and improve bronze and wooden agricultural tools; to use animal labour in farming; to grow different crops, such as rice, wheat, millet, sorghum and beans; to raise domestic animals such as horses, cattle, sheep, chickens, pigs; and to cultivate fruit trees, vegetables, mulberry trees (Morus alba) and flax. Thus appeared the embryonic form of management of multi-component farming which included agriculture, silviculture, animal husbandry and sericulture and laid the foundation for small self-sufficient household economy. During the West Zhou Dynasty (1100–700 BC), the slavery system gradually collapsed, and a land tenancy system, the ‘nine squares’, was widely adopted, particularly in the northern China Plain, as described by Mensius (400 BC). Under this system, a large portion of land was divided into nine equal square areas, of which the eight on the edges were allotted to serfs, while the central one belonged to the landlord and was managed by the eight serfs for him. Thus private land ownership was gradually established and resulted in further development of self-sufficient small farmers in which the family was the production unit. In this unit, agriculture, animal husbandry, silviculture, sericulture and domestic handicrafts were developed simultaneously and formed the so-called ‘man-farming, woman-weaving’ rural economy. This scenario was recorded in the Book of Songs (800 BC): ‘trespass not on my lane, break not my willow trees; leap not over my fence, pick not my mulberry leaves; intrude not into my garden, cut not my sandwood trees’ (Li, 1993). Agricultural policy during these periods advocated and encouraged comprehensive production for multiple purposes as an effective way to prosperity. Mensius (400 BC), in praise of the self-sufficient small farming economy, emphasized ‘if a family owns a certain piece of land with mulberry trees around its house for breeding silkworms, domesticated animals raised in its yard for meat, and crop fields cultivated and managed properly for cereals, it will be prosperous and will not suffer from starvation’ (Tang, 1986). He also said that ‘If the forests are timely felled, then an abundant supply of timber and firewood is ensured, if the fishing net with relatively big holes is timely cast into the pond, then there will be no shortage of fish and turtle for use’ (Zhang, 1992). These present a picture of a prosperous, diversified rural economy and a vivid sketch of pastoral peace.
Agroecological Farming Systems in China 211
In the Spring–Autumn (770–481 BC) and Warring States (490–220 BC) Dynasties, a more sophisticated system of integrated farming developed. In the Guan Zi, written in the Warring States period, it was recorded that ‘food will be plentiful, if five kinds of cereal crops were planted, the people would be satisfied if animals were raised, and the farmers would be enriched if mulberry and economic crops were planted’. This multi-planting system with effective use of time was reported in the Xun Zi published in the Warring States period. Many examples were recorded which showed the order in time of multi-harvest plantation.
Thoughts and practices from the Qin to the Tang Dynasty History next witnessed the unification and fall of the Qin Dynasty (221–207 BC) and the decades of warring between Chu and Han States (210–105 BC). We are lucky to be able to find a number of systematic agriculture treatises from that time. Some contain valuable ideas and primitive concepts of ecological agriculture. Among the extant comprehensive works on agriculture, the four essays in Lu Shi Chun Qiu (Master Lu’s Spring and Autumn Annals), namely, Shen Nong (Lay Stress on Agriculture), Ren Di (Capacity of Soil), Bian Tu (Work on Ground) and Shen Shi (Fitness of the Season) completed in 239 BC, can be claimed as the earliest agricultural treatises. Lu Shi Chun Qiu was written collectively by scholars who were guests at the house of Lu Buwei, the first prime minister of Qin. The above-mentioned essays are not independent specialized writings on agriculture, but together form a systematic and complete set of treatises. If Shen Nong deals mainly with the importance of promoting agricultural production at a political level, emphasizing agriculture as the root and industry and commerce as the branches, then the three essays Ren Di, Bian Tu and Shen Shi were devoted solely to agronomy. The three sum up the experiences of agricultural production of the labouring people before the Qin Dynasty and include a series of profound ideas and techniques for promoting productivity and conservation of natural resources and the environment. At the beginning of the Han Dynasty, society became stable and the population grew steadily to 40 million. Experience accumulated from the past was collated, revised and much extended to serve as a guideline for agricultural policy making. In the Western Han Dynasty (206 BC–AD 24), Fan Sheng Zhi Shu (The Book of Fan Shengzhi) sums up the basic principles of farming in northern China. It gives an accurate description of the cultivation techniques, of the main crops and cash tree species, such as spiked millet, glutinous millet, winter wheat, spring wheat, rice, lesser beans and soya, female hemp, common perilla, male hemp, melon, gourd, taro and mulberry. The so-called San Yi principle was formulated by that time, as stated in Huai Nan Zi (The Book of Huai Nan Zi, about 100 BC). Since ancient times, those who want to become masters of the people were exorted to make the best use of time and land plus human labour for production. Consequently, crops flourished, domestic animals thrived, trees were timely planted, and fields were regularly worked. Mulberry trees and hemp were grown on fertile soil, while on hilly and steep mountain slopes unsuitable for crop growing, trees were planted for timber and firewood.
212 Early Agriculture
Therefore, each site was used for appropriate production and ‘to fish where water is rich, to forest where mountain is dominant, to raise livestock where forage is abundant, to plant crops where land is arable’, and to guide year-round activities with 24 solar subseasons in order to synchronize these activities with the climate. Such timely and well arranged multi-component activities resulted in enormous economic benefits. (Institute of the History of Natural Sciences, 1985). Among the Chinese classics, Qi Min Yao Shu (Essential Farming Skills of the People of Qi), written by Jia Sixie some 1400 years ago, is the best preserved and most comprehensive. Jia Sixie’s attitude towards writing Qi Min Yao Shu was very serious. According to his own account, he gathered a large amount of data from classic and contemporary writings, collected many proverbs and folksongs, made inquiries from experts and drew from personal experience. The book embraces farming, forestry, animal husbandry, sideline production and fishery in an area comprising today’s southeastern Shanxi, central–south Hebei, part of Henan, north of the Huanghe (Yellow) River, and Shandong. Consisting of 110,000 words, the book covered a wide range of knowledge of agriculture including detailed description of rotation and intercropping systems, as well as a wealth of useful knowledge on the improvement of soil fertility and soil and water conservation. In accordance with the characteristics of crops, he distinguished those that could be rotted from those that could not. He also provided a set of rotation methods and pointed out that plants of the bean family were the best forerunner crops for improving soil fertility. He remarked that ‘For spiked millet, it is best to sow in soils following mung bean or lesser bean, or to sow panicled millet or sesame in soil following hemp, and least successful to sow in soil that has been planted to turnip.’ The Chinese labouring people have rich experience in breeding varieties of crops/ vegetables for a fixed cultivation system. The term ‘garden-style cultivation’ or ‘gardenization’ is sometimes used to describe this multi-component system. The Qi Min Yao Shu mentioned that mallow (Malva verticillata, called kui in ancient China) can be sown three times and that chives were harvested not more than five times a year, indicating that the vegetation was sown and harvested continually on one piece of land. Sowing coriander and scallion or lesser beans among melonvines and growing coriander and green onion together suggests that interplanting was practised in the cultivation of vegetables at that time (Fan Chuyu, 1984). Qi Min Yao Shu also provides, in its ‘Miscellany’, notes on growing a large variety of vegetables: near the cities and towns, more melons, fruits and eggplants should be grown, as what is not consumed by the family can easily be sold. If there are 10mu (1mu equals 1/15ha or roughly 1/6 acre) of land, pick out the five that are most fertile. Use 2.5mu to grow green onion and the other half to sow sundry vegetables like gourds, radish, mallow, lettuce, turnip, white pea, lesser bean and eggplant in the second, fourth, sixth, seventh and eighth month, respectively (Dong Kaichen, 1984). The chapter Zhong Sang Zhe (Mulberry Cultivation) in Qi Min Yao Shu described the experience of intercropping mulberry with bean and other crops. The seedlings of mulberry tree were first grown in a nursery 5 feet apart and then replanted 10bu apart (approximately 7–8m). If beans and appropriate crops are
Agroecological Farming Systems in China 213
cultivated between mulberry, the space can be fully utilized, while the fertility of the soil can be improved. However, the intercropping of mulberry with maize and sorgum or millet will be harmful to the soil. Radish can be grown within 60cm of the trees. When the radish are harvested, pigs can be put in to feed on the residues of crops and to loosen the soil. Jia Sixie affirmed the role of green manure in soil improvement, and suggested that the best way is to plough in mung beans, then lesser beans and sesame. In brief, Qi Min Yao Shu is not only rich in content, it is detailed and accurate. It sums up the vast amount of agricultural knowledge accumulated in China before the 6th century, with a deep understanding of the interrelationship between crops and their environment and implementation of the knowledge in agricultural practice. China is the country which first raised silkworms, planted mulberry trees and wove the wonderful silk fabric. Silk culture existed in China 4000 years ago, the embryo of IFS had appeared in the Shang–Zhou period (1600–1100 BC), and records of the Han Dynasty (206 BC– AD 220) mention sericulture in the Can Shu (Books on Silkworm Raising) and Zhong Shu Cang Guo Xiang Can (How to Plant Trees, Store Fruits and Judge Silkworm). Unfortunately, none of these has come down to us. In the more than 2000 years since the Han Dynasty, however, a number of ancient books discussing sericulture have been handed down. Some are monographs; others devote chapters to sericulture. In the techniques of sericulture, not only the integration of mulberry cultivation with silkworm raising was included, but the methods of cultivation of different types of mulberry in cooperation with other plants. For instance, Fan Sheng Zhi Shu tells how to grow mulberry trees: ‘In the first year, sow a mixture of mulberry seeds and glutinous millet. When the mulberry plants are as high as the millet, cut them down with a sickle close to the ground. Next spring mulberry suckers will spring out. Such mulberry trees are convenient for plucking and management because of their shortness.’ Through continuous efforts and improvement by farmers in different periods, sericulture, together with animal husbandry or fishery, has become the major ‘sideline’ production in the self-sufficient rural economy. Handicraft industries, including silk reeling, spinning and weaving, also rapidly developed. Around 200 BC silk from China made its way to middle and western Asia and Europe along a route that became known as the Silk Road (Institute of the History of Natural Sciences, 1985). In the Nong Sang Tong Jue (Handbook for Farming and Mulberry) it is said that ‘among the nine prefectures, each field is different in its landscape, water condition and climate. Different crop varieties are suitable for different fields.’ It was recorded in the Xia Zhou Shu that ‘The following is law: To cut the trees on the mountain in spring is forbidden, fishing is forbidden in water areas during summer.’ This was the first law for the protection of natural resources. In the Huainan Tzi, it was also pointed out that ‘Those pregnant cannot be killed; those in egg stage cannot be fetched; fish shorter than 12 inches cannot be caught; pigs younger than one year should not be eaten.’
214 Early Agriculture
Thoughts and practices from the Tang to the Yuan Dynasty A well-known paper on comprehensive agriculture, Chen Fu Nong Shu (Agricultural Treatise of Chen Fu), was completed in 1149 in the Southern Song Dynasty (1127–1179). In spite of its small size (only 12,500 words), it is substantial in content. This ancient treatise systematically discussed land utilization, giving priority to agricultural techniques of the rice-growing regions south of the Changjiang (Yangtze) River. The author provides a general view of intercropping and preservation of soil fertility using comprehensive measures. Multi-component systems were recorded in Wang Zheng Nong Shu (Agricultural Treatise by Wang Zheng) in the Yuan Dynasty (1271–1368). Wang Zheng was a local administrative officer in the area now called Anhui and Jiangxi, who often visited rural areas for inspections and was very interested in agricultural production. This treatise sums up the production practice of dry farmland cultivation in the Yellow River plain and paddy-rice cultivation in the Yangtze River Basin. Its present edition has about 110,000 words and is divided into three parts: Nong Song Tong Jue (General Survey of Agriculture and Silviculture), Bai Gu Pu (Guide to a Hundred Cereals), and Nong Qi Tu Pu (A Collection of Illustrative Plates for Agricultural Implements). Wang Zheng summarized the various technologies and experiences in farming, forestry, animal husbandry, sideline production and fishery and discussed the fitness of season and soil. The farming chart is a praiseworthy creation of Wang Zheng: ingeniously combining constellation periodicity, seasons, natural signs and procedures of agricultural production into an organic whole, it puts together all the main points of Nong Jia Yue Ling (Monthly Ordinances for Farmers) and sums them up in a small chart which is clear, definite, handy and very practical (Figure 9.1). Another example is fishery in paddy fields. In Ling Biao Lu Yi, written during the Tang Dynasty, it was described that ‘putting the eggs of grass carp into paddy fields, when fish grow up, the roots of weeds were eaten up and the field is fertilized. Consequently the rice can yield a good harvest.’ Another excellent example of Chinese people in development of traditional ecological farming is the now world-famous dyke-pond system, or so-called integrated agriculture–aquaculture system (Zhong et al, 1987). China has a long history of mulberry planting, silkworm rearing and silk reeling and weaving. The integration of aquaculture and agriculture systems and silviculture is an old, widespread and enduring practice in south and south-east China. According to the literature, such systems existed in the Tang Dynasty (7th century AD), but did not flourish until the 14th century of the Yuan Dynasty. In the Zhujiang Delta ponds were dug to drain marshes and natural ponds in order to create arable land, and the excavated soil was used to construct dykes. The first commercial crops grown on the dykes were fruits, particularly litchi and longan, while the early artificial ponds were utilized for breeding and rearing fish for sale. However, there was apparently little or no conscious organization of an integrated fruit dyke–fishpond system in terms of linked input and output of material and energy, although both
Agroecological Farming Systems in China 215
Source: Agricultural Treatise of Wang Zheng
Figure 9.1 The farming chart in Wang Zheng Nong Shu
activities might be going on at the same farm unit. By 1620, however, mulberry was widely cultivated on the dykes between the fishponds. Experience has shown that economic returns from integrated mulberry dyke–fishpond systems were greater than those obtained from cultivating fruit trees on the dykes. Moreover, pond mud enriched with silkworm excrement and other wastes that had been first used to fertilize the pond and feed the fish was found to be a superior fertilizer for mulberry bushes than raw silkworm excrement which, when applied to excess, damaged mulberry leaves. With this discovery an integrated dyke–pond system was found to be beneficial to both mulberry and fish, and far better than growing rice.
Thoughts and practices in the Ming and Qing Dynasties Nong Zheng Quan Shu (Complete Treatise on Agriculture), an unprecedented monumental work compiled by Xu Guangqi (1562–1633), an outstanding scientist of the Ming Dynasty (1368–1644), in mathematics and astronomy as well as use of the lunar calendar. This book contains more than 700,000 words and makes use of 229 written documents. It is the most comprehensive of all works on agriculture up to that time. The 60 volumes of the book are divided into 12 sections: 1
agriculture as the foundation (classics, history, literary references, various schools of thought, miscellaneous essays, studies of various dynasty’s policies stressing agriculture);
216 Early Agriculture
2 3
farmland systems; farming (management and administration, land reclamation, issuing almanacs for enforcement, divination of seasons); 4 water conservancy; 5 agricultural implements; 6 cultivation; 7 sericulture; 8 extension of sericulture; 9 planting (cash crops); 10 animal husbandry; 11 processing and construction; 12 protection against disaster. Many advanced thoughts on ecological and successful technologies were introduced in this treatise, including presentation of the intercropping system. For example, the well-known Tangua system has been shown to be the earliest practice in formulation of agroforestry. In fact, similar practices had been implemented in China and were recorded in the literature at least 200 years earlier than those reported in Myanmar. A detailed description on planting crops is described in Nong Zheng Quan Shu. During the first few years of establishment of young stands of Chinese fir, cereal crops can be cultivated between the rows of trees. This tree/ crop interplanting system can accelerate the growth of both tree and crops to make full use of space. Xu Guangqi also introduced the technology of making sheepfolds on the banks of fishponds and sweeping the manure on the bank into the pond to feed the fish. In Zhi Huang Quan Shu (A Monograph on the Control of Locusts), written in the Qing Dynasty, an example of using ducks to control pests was given: in a mountain region, the locusts were caught by 700 ducks. Besides, raising ducks in paddy fields could also help to catch other leafhoppers. The Bu Nong Shu (Additional Farming Book), written more than 300 years ago, stated that ‘The manure of human and other animals as well as ash and dirt will become food and clothes soon if they are put into fields.’ Farming, animal husbandry and composting were tightly combined in order to preserve biodiversity in the agriculture system. Crop stalks, manure of human and animals, organic wastes, etc. were put together to make compost, then applied into fields on the basis of ‘come from soil, return to soil’. In this book an integrated system in the low wetlands of Zhejiang Province was described in which grain crops and mulberry trees were planted and fish and livestock were raised. By the end of the Qing Dynasty (1911), the Pearl River (Zhujiang) Delta had this kind of agroecosystem developed in some 66,700ha, and by 1925, at the peak of Guangdong silk production, 93,000ha of dykes were planted with mulberry. But a massive decline was soon to set in with the worldwide Great Depression. The excellent techniques used in the planning of farm landscapes of traditional agriculture in China included information on tall and short crops, trailing and
Agroecological Farming Systems in China 217
erect stem plants, deep- and shallow-rooted plants, sun-loving plants and shade resistance, early and lately maturing varieties. These characteristics were expanded to include all land resources within the organic combination of agriculture, forestry, animal husbandry, fishery and sideline production, together with comprehensive development and beneficial recycling systems. In the Qing Dynasty four methods of raising fish with different foods and living condition were combined in the same pond to maximize use of the water, to save on bait and to increase efficiency. The system, in which grass carp, silver carp, variegated carp and common carp were fed in the same waterbody to rationally utilize the water, save forage and increase benefits, is still used nowadays. A large variety of aquaculture and agriculture interactive systems have been developed in China. Sugarcane has been cultivated on the dykes since the beginning of this [20th] century. Despite the widespread adoption of sugarcane cultivation, many former mulberry dykes were converted to vegetable production or paddy rice. Historically, although excavation of fishponds and dyke construction is considered to be the best way of transforming formerly economically marginal areas, subject to a range of natural disasters, until 1949 cropping patterns on the dykes were dictated by market prices rather than by ecological considerations. In the Wei Ya Wen Ji (Collected Works of Wei Ya Wen) written in the Ming Dynasty, it was recorded that a variety of small crab lived in paddy field and fed on tender sprouts of rice. To control this little crab, the local farmers raised ducks in the paddy. As a result, ducks produced meat and eggs, the paddy fields were fertilized by the manure of ducks and the little crabs and insect pests were devoured by the fish. During the Ming and Qing Dynasties, multiple cropping spread throughout north and south China. In the Jiang Nan Cui Geng Ke Dao Biao (The Situation of Rice in South China), Li Yanzhang summarized the growing of double-harvest rice on wheat stubble in the south of the Yangtze River, in which barley was harvested in the last ten days of March and the wheat was harvested in the first ten days of April. Seed soaking was done in the first ten days of March and on 30 March the rice seedlings germinated. After the harvest of wheat, the fields were fertilized, ploughed and raked and then rice seedlings were transplanted. In this way, three harvests in one year are realized. In Hunan Province, beans were planted after rice harvesting, and ripened in winter; then wheat was planted in the field and ripened in the next summer, followed by rice, etc.
Development of Modern IFS Rapid development and upgrading of knowledge in IFS Since the founding of the People’s Republic of China in 1949, there has been a rapid growth in population and the economy, together with a decrease in arable
218 Early Agriculture
land and a deterioration in the environment. However, IFS has been revived and developed on an ever-wider scale and upgraded on the basis of modern science. For example, some very interesting results have been obtained on energy flow and nutrient cycles of some systems and systems dynamics analysis and simulation have been initiated. At the same time, many experimental farms and field stations have been established. These are important bases for scientific research as well as important areas for demonstration and extension to vast areas. A monograph entitled Agroecological Engineering in China, edited by Ma Shijun and Li Songhua (1987), provides a review of the concepts, history, principles, major types, methods of analysis and assessment, as well as perspectives of implementation of IFS in China. Many other publications have expounded the structure and benefits of specific types of IFS. Although interesting facts and encouraging results have confirmed the great potential and inherent advantages in this system, most of these publications remain descriptive and qualitative rather than analytical, quantitative studies. Nevertheless, a few interesting projects have emerged in which systematic, in-depth studies were carried out. For example, the rubber/tea intercropping system, widely practised in tropical regions, has been subjected to detailed studies by the Yunnan Institute of Ecology and the Reclamation Bureau of Hainan Province. The most popular and successful model, the Paulownia intercropping system, was studied by the Chinese Academy of Forestry Sciences and other local institutions. It is of particular value to mention the work of Zhong Gongfu and his colleagues who have studied the terrestrial/aquatic interactive system in the Zhujiang (Pearl River) Delta in Guangdong Province since the early 1950s and published Integrated Agriculture/Aquaculture in South China in 1988. This examined the historical development, agricultural and aquacultural components, energy flow, labour requirements and household economics of the system and is the first ever broad analysis of any such traditional integrated system (Ruddle and Zhong, 1988). Many films and videos have been created to introduce integrated farming projects and specific technology useful in this system. In recent years, a number of national and international symposia/workshops have been organized by the Chinese Academy of Sciences, Ministry of Agriculture and the Ecological Society of China. All of these have provided a sound basis for further development of the integrated systems in China.
Improvement of production organization and agricultural policies Policies play an important role in the development of IFS. Before 1987 the agricultural administrative system of China had assumed the familiar three-tier form of the People’s Commune, Production Brigade and Production Team. Nevertheless, the household remained the smallest single unit of Chinese social organization and one in which the de facto use and management of privately owned resources, such as small homestead garden plots and domestic animals, was vested.
Agroecological Farming Systems in China 219
Since December 1978 the notion of a highly collectivized and egalitarian society has gradually been repudiated. China has moved towards the creation of a mixed, state-owned, marketing economy with rural reforms giving more flexibility to individual householders. This has led to decollectivization of many agricultural practices, transforming the status of the individual family to the basic rural economic unit from de facto to de jure. As a consequence of these reforms, most areas in rural China now practise some form of responsibility system, with land and production contracted either to individual households or to the production team. Since 1981 the government has devoted much effort to stabilize the present ownership structure of hills and forests, allotting hillsides to peasants for their private use and setting up the forest production responsibility system throughout the country. Barren hills and flood plains owned by the collectives have been offered partly or entirely to peasants to be used privately in a way consistent with their desires and management ability. The trees and grass growing on lots belong to the landholders, who are entitled to manage their allotments on a long-term basis. Allotments can also be inherited, and young trees and half-mature trees on these may be exchanged for money. Trees of economic value, e.g. bamboo groves and shelterbelts owned by a collective, can be either contracted to specialized teams or groups or to households. The opening and development of free markets has encouraged farmers to produce diversified products. In addition, rural village industries have developed rapidly. Some 1.56 million ‘township enterprises’ have been established, employing around 70 million workers. These are capable of processing some agricultural products. All these reforms and policies not only are economically successful but also promote the enthusiasm of the farmers to develop a diversified IFS in China.
Support and incentives from the government The support and incentives provided by the government are indispensable for the rapid development of IFS. Because the concept of ecoagriculture conforms to the basic strategy for development of agriculture, the Chinese Government attaches great importance to its development. In 1984, the State Council formally promulgated a decision on further expanding ecological agriculture in China. Soon after that the Eighth Five-Year National Development Plan decided to develop demonstration engineering for ecological agriculture. The requirement for conservation of national resources and development of ecoagriculture has been explicitly delineated in the Ninth Five-Year Plan for development of the national economy and society. The comprehensive management for sustainable agricultural development has been emphasized in China’s Agenda 21, a significant national document for further domestic economic growth and medium- to long-term development and was approved by the State Council on 25 March 1994 in the form of the White Paper on China’s Population, Environment and Development in the Twenty-first Century. Due to stimulation from government at various levels, ecoagriculture has been developed rapidly and profitably from household, to village, to county, as
220 Early Agriculture
well as the regional level. In 1993, a leading group for the construction of ecocounties was approved by the State Council. This cross-ministry organization consists of representatives of the Ministry of Agriculture, the State Planning Commission, the National Environmental Protection Agency, the State Science and Technology Commission, the Ministry of Finance, the Ministry of Forestry and the Ministry of Water Resources. The need for incentives to encourage farmers to adopt IFS practice, particularly the initial stages, is well recognized, as farmers do not have the resources to invest in reforming their conventional mono-cultivation system into a diversified integrated system. There are many forms of incentives in China; some direct and others indirect. Direct incentives include subsidies and loans to the farmers. Indirect incentives include technical assistance, tax exemption, tax deductions, security in land tenure, and marketing services. The goal of the incentive schemes is to encourage eventual self-reliance on the part of the farmer and the community and should fit in both short- and long-range plans. By 1999, 51 counties contained trial sites for implementation of IFS. Although these sites are varied in scale as well as in physical and social conditions, most have obtained remarkable results. In 2000, another 100 counties were selected as trial sites. Therefore, China’s IFS, or ecological agriculture, with a long history of development in ancient China, has been enriched and upgraded with the progress of modern science and technology, and has gradually become a real approach for sustainable agriculture.
References Dong Kaichen (1984). Horticulture, In Ancient China’s Technology and Science. Foreign Language Press, Beijing Fan Chuyu (1984). Some outstanding works on Agriculture, In Ancient China’s Technology and Science. Foreign Language Press, Beijing Gui Mowen (1990). Discussion on the past, present and future of homestead economy. Agricultural Archeology, 1, 20–5 Guo Wentao et al. (1986). China’s Traditional Agriculture and Modern Agriculture. China Agricultural Sci. and Tech. Press, Beijing Institute of the History of Natural Sciences (1985). Ancient China’s Technology and Science. Foreign Language Press, Beijing Li Wenhua (1993). Integrated Farming Systems in China. Veroffentlichungen des Geobotanischen Institutes der ETH, Stiftung Rubel, Zurich, 113. p. 80 Liang Jiamian (1983). The emergence and development of China’s terraces. Agricultural History Research, 1, 46–56 Liang Jiamian (1989). The History of Agricultural Science and Technology in China. Agriculture Press, Beijing Ma Shijun and Songhua Li (1987). Agro-ecological Engineering in China. Science Press, Beijing (in Chinese) Ruddle and Zhong (1988). Integrated agriculture-aquaculture in South China. Cambridge University Press, Cambridge
Agroecological Farming Systems in China 221 Tang Defu (1988). The long history of China’s eco-agriculture. Ecological Economics, 1, 50–5 Tang Defu (1990). The ecological thoughts and theory in ancient China. Agricultural Archeology, 2, 8–17 Tang Qiyu (1986). History of China’s Agriculture. Agriculture Press, Beijing Wang Rusung (1996). Ecological combination – Scientific methods for sustainable development of humans. Science Review, 41, 47–67 (In Chinese) Zhang Renwu et al. (1996). The ecological thoughts in Chinese traditional agriculture and its utilization. Acta Ecologia, Sinica, 16(1), 100–6 Zhong Gongfu et al. (1987). Research on Dyke-pond Systems in the Pearl River. Science Press, Beijing
10
Farmers of Forty Centuries F. H. King
A word of introduction is needed to place the reader at the best viewpoint from which to consider what is said in the following pages regarding the agricultural practices and customs of China, Korea and Japan. It should be borne in mind that the great factors which today characterize, dominate and determine the agricultural and other industrial operations of Western nations were physical impossibilities to them 100 years ago, and until then had been so to all people. It should be observed, too, that the US as yet is a nation of but few people widely scattered over a broad virgin land with more than 20 acres to the support of every man, woman and child, while the people whose practices are to be considered are toiling in fields tilled more than 3000 years and who have scarcely more than two acres per capita,1 more than one-half of which is uncultivable mountain land. Again, the great movement of cargoes of feeding stuffs and mineral fertilizers to western Europe and to the eastern US began less than a century ago and has never been possible as a means of maintaining soil fertility in China, Korea or Japan, nor can it be continued indefinitely in either Europe or America. These importations are for the time making tolerable the waste of plant food materials through our modern systems of sewage disposal and other faulty practices; but the Mongolian races have held all such wastes, both urban and rural, and many others which we ignore, sacred to agriculture, applying them to their fields. We are to consider some of the practices of a virile race of some 500 millions of people who have an unimpaired inheritance moving with the momentum acquired through 4000 years; a people morally and intellectually strong, mechanically capable, who are awakening to a utilization of all the possibilities which science and invention during recent years have brought to Western nations; and a people who have long dearly loved peace but who can and will fight in self-defence if compelled to do so. We had long desired to stand face to face with Chinese and Japanese farmers; to walk through their fields and to learn by seeing some of their methods, appliances and practices which centuries of stress and experience have led these oldest farmers in the world to adopt. We desired to learn how it is possible, after 20 and Reprinted from King F H. 1911. Farmers of Forty Centuries, Rodale Press, Penn., pp1–13.
Farmers of Forty Centuries 223
perhaps 30 or even 40 centuries, for their soils to be made to produce sufficiently for the maintenance of such dense populations as are living now in these three countries. We have now had this opportunity and almost every day we were instructed, surprised and amazed at the conditions and practices which confronted us whichever way we turned; instructed in the ways and extent to which these nations for centuries have been and are conserving and utilizing their natural resources, surprised at the magnitude of the returns they are getting from their fields, and amazed at the amount of efficient human labour cheerfully given for a daily wage of five cents and their food, or for 15 cents, US currency, without food. The three main islands of Japan in 1907 had a population of 46,977,003 maintained on 20,000 square miles of cultivated field. This is at the rate of more than three people to each acre, and of 2349 to each square mile; and yet the total agricultural imports into Japan in 1907 exceeded the agricultural exports by less than one dollar per capita. If the cultivated land of Holland is estimated at but one-third of her total area, the density of her population in 1905 was, on this basis, less than one-third that of Japan in her three main islands. At the same time Japan is feeding 69 horses and 56 cattle, nearly all labouring animals, to each square mile of cultivated field, while we were feeding in 1900 but 30 horses and mules per same area, these being our labouring animals. As coarse food transformers Japan was maintaining 16,500,000 domestic fowl, 825 per square mile, but only one for almost three of her people. We were maintaining, in 1900, 250,600,000 poultry, but only 387 per square mile of cultivated field and yet more than three for each person. Japan’s coarse food transformers in the form of swine, goats and sheep aggregated but 13 to the square mile and provided but one of these units for each 180 of her people; while in the US in 1900 there were being maintained, as transformers of grass and coarse grain into meat and milk, 95 cattle, 99 sheep and 72 swine per each square mile of improved farms. In this reckoning each of the cattle should be counted as the equivalent of perhaps five of the sheep and swine, for the transforming power of the dairy cow is high. On this basis we are maintaining at the rate of more than 646 of the Japanese units per square mile, and more than five of these to every man, woman and child, instead of one to every 180 of the population, as is the case in Japan. Correspondingly accurate statistics are not accessible for China but in the Shantung province we talked with a farmer having 12 in his family and who kept one donkey, one cow, both exclusively labouring animals, and two pigs on 2.5 acres of cultivated land where he grew wheat, millet, sweet potatoes and beans. Here is a density of population equal to 3072 people, 256 donkeys, 256 cattle and 512 swine per square mile. In another instance where the holding was one and two-thirds acres the farmer had 10 in his family and was maintaining one donkey and one pig, giving to this farm land a maintenance capacity of 3840 people, 384 donkeys and 384 pigs to the square mile, or 240 people, 24 donkeys and 24 pigs to one of our 40-acre farms which our farmers regard too small for a single family. The average of seven Chinese holdings which we visited and where we obtained similar data indicates a maintenance capacity for those lands of 1783
224 Early Agriculture
people, 212 cattle or donkeys and 399 swine – 1995 consumers and 399 rough food transformers per square mile of farm land. These statements for China represent strictly rural populations. The rural population of the US in 1900 was placed at the rate of 61 per square mile of improved farm land and there were 30 horses and mules. In Japan the rural population had a density in 1907 of 1922 per square mile, and of horses and cattle together 125. The population of the large island of Chungming in the mouth of the Yangtse river, having an area of 270 square miles, possessed, according to the official census of 1902, a density of 3700 per square mile and yet there was but one large city on the island, hence the population is largely rural. It could not be other than a matter of the highest industrial, educational and social importance to all nations if there might be brought to them a full and accurate account of all those conditions which have made it possible for such dense populations to be maintained so largely upon the products of Chinese, Korean and Japanese soils. Many of the steps, phases and practices through which this evolution has passed are irrevocably buried in the past but such remarkable maintenance efficiency attained centuries ago and projected into the present with little apparent decadence merits the most profound study and the time is fully ripe when it should be made. Living as we are in the morning of a century of transition from isolated to cosmopolitan national life when profound readjustments, industrial, educational and social, must result, such an investigation cannot be made too soon. It is high time for each nation to study the others and by mutual agreement and cooperative effort, the results of such studies should become available to all concerned, made so in the spirit that each should become coordinate and mutually helpful component factors in the world’s progress. One very appropriate and immensely helpful means for attacking this problem, and which should prove mutually helpful to citizen and state, would be for the higher educational institutions of all nations, instead of exchanging courtesies through their baseball teams, to send select bodies of their best students under competent leadership and by international agreement, both east and west, organizing therefrom investigating bodies each containing components of the Eastern and Western civilization and whose purpose it should be to study specifically set problems. Such a movement well conceived and directed, manned by the most capable young men, should create an international acquaintance and spread broadcast a body of important knowledge which would develop as the young men mature and contribute immensely toward world peace and world progress. If some broad plan of international effort such as is here suggested were organized the expense of maintenance might well be met by diverting so much as is needful from the large sums set aside for the expansion of navies, for such steps as these, taken in the interests of world uplift and world peace, could not fail to be more efficacious and less expensive than increase in fighting equipment. It would cultivate the spirit of pulling together and of a square deal rather than one of holding aloof and of striving to gain unneighbourly advantage. Many factors and conditions conspire to give to the farms and farmers of the Far East their high maintenance efficiency and some of these may be succinctly
Farmers of Forty Centuries 225
stated. The portions of China, Korea and Japan where dense populations have developed and are being maintained occupy exceptionally favourable geographic positions so far as these influence agricultural production. Canton in the south of China has the latitude of Havana, Cuba, while Mukden in Manchuria, and northern Honshu in Japan are only as far north as New York city, Chicago and northern California. The US lies mainly between 50° and 30° of latitude while these three countries lie between 40° and 20°, some 700 miles further south. This difference of position, giving them longer seasons, has made it possible for them to devise systems of agriculture whereby they grow two, three and even four crops on the same piece of ground each year. In southern China, in Formosa and in parts of Japan two crops of rice are grown; in the Chekiang province there may be a crop of rape, of wheat or barley or of Windsor beans or clover which is followed in midsummer by another of cotton or of rice. In the Shantung province wheat or barley in the winter and spring may be followed in summer by large or small millet, sweet potatoes, soybeans or peanuts. At Tientsin, 39° north, in the latitude of Cincinnati, Indianapolis and Springfield, Illinois, we talked with a farmer who followed his crop of wheat on his smallholding with one of onions and the onions with cabbage, realizing from the three crops at the rate of $163, gold, per acre; and with another who planted Irish potatoes at the earliest opportunity in the spring, marketing them when small, and following these with radishes, the radishes with cabbage, realizing from the three crops at the rate of $203 per acre. Nearly 500,000,000 people are being maintained, chiefly upon the products of an area smaller than the improved farm lands of the US. Complete a square on the lines drawn from Chicago southward to the Gulf and westward across Kansas, and there will be enclosed an area greater than the cultivated fields of China, Korea and Japan and from which five times our present population are fed. The rainfall in these countries is not only larger than that even in our Atlantic and Gulf states, but it falls more exclusively during the summer season when its efficiency in crop production may be highest. South China has a rainfall of some 80 inches with little of it during the winter, while in our southern states the rainfall is nearer 60 inches with less than one-half of it between June and September. Along a line drawn from Lake Superior through central Texas the yearly precipitation is about 30 inches but only 16 inches of this falls during the months May to September; while in the Shantung province, China, with an annual rainfall of little more than 24 inches, 17 of these fall during the months designated and most of this in July and August. When it is stated that under the best tillage and with no loss of water through percolation, most of our agricultural crops require 300 to 600 tons of water for each ton of dry substance brought to maturity, it can be readily understood that the right amount of available moisture, coming at the proper time, must be one of the prime factors of a high maintenance capacity for any soil, and hence that in the Far East, with their intensive methods, it is possible to make their soils yield large returns. The selection of rice and of the millets as the great staple food crops of these three nations, and the systems of agriculture they have evolved to realize the most
226 Early Agriculture
from them, are to us remarkable and indicate a grasp of essentials and principles which may well cause Western nations to pause and reflect. Notwithstanding the large and favourable rainfall of these countries, each of the nations have selected the one crop which permits them to utilize not only practically the entire amount of rain which falls upon their fields, but in addition enormous volumes of the run-off from adjacent uncultivable mountain country. Wherever paddy fields are practicable there rice is grown. In the three main islands of Japan 56 per cent of the cultivated fields, 11,000 square miles, is laid out for rice growing and is maintained under water from transplanting to near harvest time, after which the land is allowed to dry, to be devoted to dry land crops during the balance of the year, where the season permits. To anyone who studies the agricultural methods of the Far East in the field it is evident that these people, centuries ago, came to appreciate the value of water in crop production as no other nations have. They have adapted conditions to crops and crops to conditions until with rice they have a cereal which permits the most intense fertilization and at the same time the ensuring of maximum yields against both drought and flood. With the practice of Western nations in all humid climates, no matter how completely and highly we fertilize, in more years than not yields are reduced by a deficiency or an excess of water. It is difficult to convey, by word or map, an adequate conception of the magnitude of the systems of canalization which contribute primarily to rice culture. A conservative estimate would place the miles of canals in China at fully 200,000 and there are probably more miles of canal in China, Korea and Japan than there are miles of railroad in the US. China alone has as many acres in rice each year as the US has in wheat and her annual product is more than double and probably threefold our annual wheat crop, and yet the whole of the rice area produces at least one and sometimes two other crops each year. The selection of the quick-maturing, drought-resisting millets as the great staple food crops to be grown wherever water is not available for irrigation, and the almost universal planting in hills or drills, permitting intertillage, thus adopting centuries ago the utilization of earth mulches in conserving soil moisture, has enabled these people to secure maximum returns in seasons of drought and where the rainfall is small. The millets thrive in the hot summer climates; they survive when the available soil moisture is reduced to a low limit, and they grow vigorously when the heavy rains come. Thus we find in the Far East, with more rainfall and a better distribution of it than occurs in the US, and with warmer, longer seasons, that these people have with rare wisdom combined both irrigation and dry farming methods to an extent and with an intensity far beyond anything our people have ever dreamed, in order that they might maintain their dense populations. Notwithstanding the fact that in each of these countries the soils are naturally more than ordinarily deep, inherently fertile and enduring, judicious and rational methods of fertilization are everywhere practised; but not until recent years, and only in Japan, have mineral commercial fertilizers been used. For centuries, however,
Farmers of Forty Centuries 227
all cultivated lands, including adjacent hill and mountain sides, the canals, streams and the sea have been made to contribute what they could toward the fertilization of cultivated fields and these contributions in the aggregate have been large. In China, in Korea and in Japan all but the inaccessible portions of their vast extent of mountain and hill lands have long been taxed to their full capacity for fuel, lumber and herbage for green manure and compost material; and the ash of practically all of the fuel and of all of the lumber used at home finds its way ultimately to the fields as fertilizer. In China enormous quantities of canal mud are applied to the fields, sometimes at the rate of even 70 and more tons per acre. So, too, where there are no canals, both soil and subsoil are carried into the villages and there between the intervals when needed they are, at the expense of great labour, composted with organic refuse and often afterwards dried and pulverized before being carried back and used on the fields as home-made fertilizers. Manure of all kinds, human and animal, is religiously saved and applied to the fields in a manner which secures an efficiency far above our own practices. Statistics obtained through the Bureau of Agriculture, Japan, place the amount of human waste in that country in 1908 at 23,950,295 tons, or 1.75 tons per acre of her cultivated land. The International Concession of the city of Shanghai, in 1908, sold to a Chinese contractor the privilege of entering residences and public places early in the morning of each day in the year and removing the night soil, receiving therefore more than $31,000, gold, for 78,000 tons of waste. All of this we not only throw away but expend much larger sums in doing so. Japan’s production of fertilizing material, regularly prepared and applied to the land annually, amounts to more than 4.5 tons per acre of cultivated field exclusive of the commercial fertilizers purchased. Between Shanhaikwan and Mukden in Manchuria we passed, on 18 June, thousands of tons of the dry highly nitrified compost soil recently carried into the fields and laid down in piles where it was waiting to be ‘fed to the crops’. It was not until 1888, and then after a prolonged war of more than 30 years, generalled by the best scientists of all Europe, that it was finally conceded as demonstrated that leguminous plants acting as hosts for lower organisms living on their roots are largely responsible for the maintenance of soil nitrogen, drawing it directly from the air to which it is returned through the processes of decay. But centuries of practice had taught the Far East farmers that the culture and use of these crops are essential to enduring fertility, and so in each of the three countries the growing of legumes in rotation with other crops vary extensively for the express purpose of fertilizing the soil is one of their old, fixed practices. Just before, or immediately after the rice crop is harvested, fields are often sowed to ‘clover’ (Astragalus sinicus) which is allowed to grow until near the next transplanting time when it is either turned under directly, or more often stacked along the canals and saturated while doing so with soft mud dipped from the bottom of the canal. After fermenting 20 or 30 days it is applied to the field. And so it is literally true that these old world farmers whom we regard as ignorant, perhaps
228 Early Agriculture
because they do not ride sulky ploughs as we do, have long included legumes in their crop rotation, regarding them as indispensable. Time is a function of every life process as it is of every physical, chemical and mental reaction. The husbandman is an industrial biologist and as such is compelled to shape his operations so as to conform with the time requirements of his crops. The oriental farmer is a time economizer beyond all others. He utilizes the first and last minute and all that are between. The foreigner accuses the Chinaman of being always long on time, never in a fret, never in a hurry. This is quite true and made possible for the reason that they are a people who definitely set their faces towards the future and lead time by the forelock. They have long realized that much time is required to transform organic matter into forms available for plant food and although they are the heaviest users in the world, the largest portion of this organic matter is predigested with soil or subsoil before it is applied to their fields, and at an enormous cost of human time and labour, but it practically lengthens their growing season and enables them to adopt a system of multiple cropping which would not otherwise be possible. By planting in hills and rows with intertillage it is very common to see three crops growing upon the same field at one time, but in different stages of maturity, one nearly ready to harvest; one just coming up, and the other at the stage when it is drawing most heavily upon the soil. By such practice, with heavy fertilization, and by supplemental irrigation when needful, the soil is made to do full duty throughout the growing season. Then, notwithstanding the enormous acreage of rice planted each year in these countries, it is all set in hills and every spear is transplanted. Doing this, they save in many ways except in the matter of human labour, which is the one thing they have in excess. By thoroughly preparing the seed bed, fertilizing highly and giving the most careful attention, they are able to grow on one acre, during 30 to 50 days, enough plants to occupy ten acres and in the mean time on the other nine acres crops are maturing, being harvested and the fields being fitted to receive the rice when it is ready for transplanting, and in effect this interval of time is added to their growing season. Silk culture is a great and, in some ways, one of the most remarkable industries of the Orient. Remarkable for its magnitude; for having had its birthplace apparently in oldest China at least 2700 years BC; for having been laid on the domestication of a wild insect of the woods; and for having lived through more than 4000 years, expanding until a million-dollar cargo of the product has been laid down on our western coast and rushed by special fast express to the east for the Christmas trade. A low estimate of China’s production of raw silk would be 120,000,000 pounds annually, and this with the output of Japan, Korea and a small area of southern Manchuria, would probably exceed 150,000,000 pounds annually, representing a total value of perhaps $700,000,000, quite equalling in value the wheat crop of the US, but produced on less than one-eighth the area of our wheat fields. The cultivation of tea in China and Japan is another of the great industries of these nations, taking rank with that of sericulture if not above it in the important
Farmers of Forty Centuries 229
part it plays in the welfare of the people. There is little reason to doubt that this industry has its foundation in the need of something to render boiled water palatable for drinking purposes. The drinking of boiled water is universally adopted in these countries as an individually available and thoroughly efficient safeguard against that class of deadly disease germs which thus far it has been impossible to exclude from the drinking water of any densely peopled country. Judged by the success of the most thorough sanitary measures thus far instituted, and taking into consideration the inherent difficulties which must increase enormously with increasing populations, it appears inevitable that modern methods must ultimately fail in sanitary efficiency and that absolute safety can be secured only in some manner having the equivalent effect of boiling drinking water, long ago adopted by the Mongolian races. In the year 1907 Japan had 124,482 acres of land in tea plantations, producing 60,877,975 pounds of cured tea. In China the volume annually produced is much larger than that of Japan, 40,000,000 pounds going annually to Tibet alone from the Szechwan province; and the direct export to foreign countries was, in 1905, 176,027,255 pounds, and in 1906 it was 180,271,000, so that their annual export must exceed 200,000,000 pounds with a total annual output more than double this amount of cured tea. But above any other factor, and perhaps greater than all of them combined in contributing to the high maintenance efficiency attained in these countries, must be placed the standard of living to which the industrial classes have been compelled to adjust themselves, combined with their remarkable industry and with the most intense economy they practise along every line of effort and of living. Almost every foot of land is made to contribute material for food, fuel or fabric. Everything which can be made edible serves as food for man or domestic animals. Whatever cannot be eaten or worn is used for fuel. The wastes of the body, of fuel and of fabric worn beyond other use are taken back to the field; before doing so they are housed against waste from weather, compounded with intelligence and forethought and patiently laboured with through one, three or even six months, to bring them into the most efficient form to serve as manure for the soil or as feed for the crop. It seems to be a golden rule with these industrial classes, or if not golden, then an inviolable one, that whenever an extra hour or day of labour can promise even a little larger return then that shall be given, and neither a rainy day nor the hottest sunshine shall be permitted to cancel the obligation or defer its execution.
Note 1
This figure was wrongly stated in the first edition as 1 acre, owing to a mistake in confusing the area of cultivated land with total area.
Part III
Agricultural Revolutions and Change
11
Agricultural Sustainability and OpenField Farming in England, c. 1650–1830 Michael Turner, John Beckett and Bethanie Afton
Introduction Sustainability has become a key concept in the modern approach to development studies. The guiding definition proposed in 1987 by the World Commission on Environment and Development (Brundtland Commission) emphasized that ‘Sustainable development is that development that meets the needs of the present generation without compromising the ability of future generations to meet their own needs’ (World Commission, 1987, p144). To that extent sustainability was regarded as something to be achieved in the future, which can in turn lead to a view of the past in which everything had been sustainable, but this was a state of affairs that had only recently changed or was in danger of changing. Thus Conway and Pretty (1991, p1) invoke a distant past (or certainly the pre-1945 period), in heralding the problems of the present or very recent past in agricultural development: … agriculture, for most of its history, has been environmentally benign. Even when industrial technology began to have an impact in the eighteenth and nineteenth centuries, agriculture continued to rely on natural ecological processes. Crop residues were incorporated into the soil or fed to livestock, and the manure returned to the land in amounts that could be absorbed and utilised. The traditional mixed farm was a closed, stable and sustainable ecological system, generating few external impacts. Since the Second World War this system had disintegrated. (Conway and Pretty, 1991, p1)
This suggests that there are lessons for the future that might be drawn from the past. In this sense Pretty’s (1991) summary of extension practices in the classical British ‘Agricultural Revolution’ demonstrated the way the past has sometimes prefigured the future. Reprinted from Turner M, Beckett J and Afton B. 2003. Agricultural sustainability and open-field farming in England, c. 1650–1830. Int J Agric Sust 1(2), pp124–140, Earthscan.
234 Agricultural Revolutions and Change
Nevertheless, the late 20th-century agricultural revolution in industrialized countries suggests a quantum leap in modern agricultural change. Thus Wes Jackson (1980, pp2–3) pointed to the enormity of the process of post-1945 change: ‘So destructive has the agricultural revolution been that, geologically speaking, it surely stands as the most significant and explosive event to appear on the face of the earth…’ Yet there is no doubt that in the past there was real ecological stress caused by farming practised in particular contexts. All societies have had to adapt to forces over which they have had little or no control (Mannion, 1995, pp83–84; Evans, 1998, pp57–61). By looking at some specific historical features in the context of the modern debate over sustainability, we may be able to offer some new perspectives on agriculture. The purpose of this paper is to examine the issue of agricultural sustainability specifically in the historical context of open-field farming in the English midland counties. While there is a tradition in agrarian history to address some of the issues that we raise in the paper, we do not think that a concerted attempt has been made to place agricultural or indeed rural history into the holistic framework that we explore here. Standard historical assessments of the past did not have the benefits of modern thinking on sustainability, yet all of them contain elements that might be reconfigured in its language (Tawney, 1912; Hoskins, 1949b; Broad, 1980; Butlin, 1982; Havinden, 1961). But we believe that this could be a two-way street. While our fellow historians might benefit from the language of the present we wonder whether present environmental concerns about soil, and more widely, resource degradation, and the solutions offered, might reflect that these concerns had been confronted in the past in England. Many local solutions were found by trial and error in the English open fields that in modern parlance (see Wendell Berry’s Foreword in Jackson, 1996) might be termed resource management schemes.
The Geographical and Chronological Context Our focus of attention in this paper is specific. We concentrate on the open-field farming system that prevailed over much of England until its final dissolution in the 80 or so years after 1750. This was a system that was based on communally administered agricultural organization and production, and it persisted, sometimes without any major adjustments, for several centuries. It was part of the northern European system of communal agriculture, though most historians would recognize significant regional variations even within the confines of the British Isles (Baker and Butlin, 1973). The study of the system has relatively recently undergone renewed attention under the gaze of New Institutional Economics. This relates to collective action and land rights, by which route it has modern applications in quite diverse societies and contexts (see for example Hardin, 1968; Ostrom, 1990; Baland and Platteau, 1998). While open-field farming in communally organized ways prevailed to a greater or lesser degree over nearly all of England, it was most prevalent and survived longest in a narrower geographical region. This
Agricultural Sustainability and Open-Field Farming in England 235
was particularly concentrated in the midland counties of England. We therefore draw our main references from Bedfordshire, Buckinghamshire, Leicestershire, Lincolnshire, Northamptonshire, Nottinghamshire and Rutland, forming a contiguous group of counties in the central and eastern parts of England (though we also include some references to adjacent counties). An impression of the prevalence and persistence of open-field farming is best demonstrated by measuring its dissolution. There are various ways by which this was achieved, all of which fall under the description of enclosure, but the fullest record of enclosure was undertaken through private and local acts of parliament, most of which changed the farming system from communal to several (private) ownership, and from communal to several administration. This was achieved mainly on a village by village basis (Turner, 1984). Figure 11.1 locates our study area, but in representing the incidence of enclosure in a quantified way it also measures the size of the task that was undertaken, and thereby conveys the importance of the process in the whole history of English agricultural change. The mirror image of enclosure is precisely the dominance of open-field farming. The illustrative village examples we subsequently use demonstrate some of the pressures that open-field farming faced and how they were resisted. However, these pressures were eventually too great to resist the final outcome, which was the ultimate dissolution of the open-field farming system by enclosure.
The Simplified Model The standard literature of traditional agricultural history has still properly to acknowledge modern methodologies of approach. The core elements of agricultural sustainability that we adopt here first came to our attention through relatively little-known work (Pannell and Schilizzi, 1999), which encouraged a wider review of the literature (to include Norman et al, 1997; Pretty, 2002; Uphoff, 2002; O’Riordan and Stoll-Kleemann, 2003). The core model appropriate to a lengthy historical dimension embraces ecology, economy and equity. The last in this list is our adaptation of what might equally be referred to as ethics. The appropriateness of this adaptation should become apparent as these three elements in the model are applied to our empirical base. In the best of sustainable worlds they should be in harmony. It is when these linkages separated that we conclude that farming in a sustainability framework was at risk. The principal ecological elements of our application of sustainability relate to husbandry practices, and the extent to which these maximized the use of the available land resources without compromising soil quality, soil texture and underlying fertility. This was achieved by using a nutrient recycling regime. However, it must be understood that this took place during a time of relative scientific ignorance, and therefore it was recognized by contemporaries through time-honoured processes. These included the use of tried and tested crop rotations, including experimentation with plants capable of fixing atmospheric nitrogen, even if this scientific
236 Agricultural Revolutions and Change
Figure 11.1 Density of parliamentary enclosure, c. 1740–1840 (England only)
process was not understood at the time. The end result was the crop, but measured through yields or by the deterioration or improvement in those yields according to the laboratory of experience over the generations. By such methods, for example, medieval farmers in Oxfordshire solved the problem of nitrogen management (Newman and Harvey, 1997). Ecological considerations also involved application of animal manures, and thus returning the nutrients otherwise removed by farming. We take this as a given in modern society, but in the past it came about by experiment and experience. The integration of plants and animals was essential, and in a world of limited resources recycling evolved as the antidote to resource loss. In the words of Sir Albert Howard in 1940 there was an ecological balance in which: Mother earth never attempts to farm without livestock; she always raises mixed crops; great pains are taken to preserve the soil and prevent erosion; the mixed vegetable and animal wastes are converted into humus; there is no waste; the processes of growth and the processes of decay balance one another; ample provision is made to maintain large reserves of fertility; the greatest care is taken to store the rainfall; both plants and animals are left to protect themselves from disease. (quoted by Jackson in Soule and Piper, 1992, pxiv)
Agricultural Sustainability and Open-Field Farming in England 237
Successions of farmers mimicked nature but they did this by a process of chance and folk experience rather than by the grand designs that are available in modern agriculture. The second core element was economy, which is recognized as a critical issue in modern literature (Heap, 1992; Gregorich, 1995; Pannell and Schilizzi, 1999). Self-evidently no system is sustainable if farmers go out of business, but the rural community also maintained many other groups and individuals, including landlords, through traditional landlord/tenant relationships, and armies of service providers. The English village evolved as a community of responsible, self-regulating partners, with a duty not simply to the present but also to future generations. Obviously the potential legacy had to be tempered by current need, including a direct income to each generation of farmers. To this extent our characterization of the village community may seem idealized, but periodically the community was subject to risks of shortage and sometimes the ultimate penalty when poor harvests had ensuing mortality consequences. The troughs of hardship were broken up by long periods of, not necessarily plenty, but a less romanticized sufficiency which made communities think about their long-term survival strategies. There have been well-defined periods in English history when the ultimate calamity in agricultural supply resulted in deepest famine and mortality crises, but in the period on which we concentrate, the link between food shortage as measured by adjustments in the relationship of crop and food prices and mortality is statistically weak (Wrigley and Schofield, 1981, pp371–372). We contend that this was because the management of resources, and thus the sustainability of the agricultural system, was successful not least because of the strengths of the communal organization of agriculture. To this extent we are certain that our understanding does not fall foul of a romantic view of the past that tends ‘to presume that “tradition” is somehow “good” for ecosystem maintenance’ (O’Riordan, 2003, p8). If communal decision making, very often based on tradition, is still very much a feature of non-Western agriculture, then perhaps therein lies a strength rather than a weakness which can be built upon (to this extent many of the modern-day examples in Uphoff, 2002, are built on a tradition of community ownership and participation). The third core element is equity. Farmers were the stewards of the environment they inhabited. In their contemporary language they were judged on whether they cared for the land in a husbandlike manner, or with a care for the well-being of the farming habitat. This has always implied ensuring that the soil would retain its fertility. In practice this involved farming in a manner agreed to be the best practice in the locality. However, not all farmers behaved in the same way and with the same attitude of care. Moreover, the resource that delivered the product – the soil itself – was communally administered and subject to a good deal of communal sharing. Therefore good husbandry must not always be assumed, it might have been enforced – through lease covenants for example. Nevertheless, the reward was equitably derived in that all participants shared in both the ownership and/or the management of local resources. Disputes over equitable access to these resources were the most common ways in which sustainable agriculture was compromised,
238 Agricultural Revolutions and Change
hence an elaborate system of manorial and other local courts acted as regulators and policemen within the community. Access to the outcome of farming, to the food itself, also had to be equitable. As in modern societies, so also in the past, there was a basic requirement for secure and adequate food. To that extent we can invoke Sen’s modern theory of entitlements. This he related to famines in which supply was not the problem, rather it was the equity of access to that supply that was put at risk. So also in the English open-field village basic output was also adequate but in time there developed a problem over the equity of access to that output (Sen, 1981, 1986).
The Experience of Open-Field England The textbook management system of the English open fields suggests they operated in a rotational process involving three fields. This simple characterization hides the flexibility and variation within the system. In a study of the organization of Leicestershire church property in the 17th century, Beresford (1949) found that 9 per cent of the parishes for which he had information were more simply arranged in two rather than three fields, 79 per cent were in three, and the remainder in combinations of four, five and more fields. In 18th-century Northamptonshire 57 villages were in four or more fields (Hall, 1995, pp157–164), and although the Nottinghamshire village of Laxton, which incidentally is the last unenclosed example of open-field husbandry to survive on any scale, was a four-field village it was worked on a three-course rotation (Beckett, 1989, pp43–45). Generally in the midland counties each field was divided into a multitude of other units known variously as furlongs, strips and lands, not all of which would necessarily be under the same land use as their neighbours at any one time. For example, at Husbands Bosworth in Leicestershire in 1770, the North Field was divided into 109 arable strips, 56 under temporary grass leys, and 46 in more or less permanent meadow. In the South Field there were 105 strips of arable and 67 in leys, and in West Field there were 102 in arable and 74 in leys (Beresford, 1949). Such divisions within fields made more complex cropping patterns possible, but if we simplify things we recognize three basic ‘units’ of rotation, the corn crops, the pulses and the fallow. The corn ‘unit’ was typically sown to barley, wheat or rye (Leicestershire Archives, DE 783/78; Northamptonshire Archives, IL 16). For much of the early part of the period barley was the most common crop. In Leicestershire, between 1558 and 1608, the acreage of barley averaged between 35 and 40 per cent of the cropped arable. Wheat varied between 8.5 and 14 per cent and rye declined from 8.5 per cent to an insignificant amount by the early 17th century (Hoskins, 1950, pp168, 171; Thirsk, 1954, p212). Barley had the advantage of flexibility in its end use because it could be used for bread and beer production, and also as animal feed, and its straw made fodder and other products.
Agricultural Sustainability and Open-Field Farming in England 239
The flexibility of the open-field system was maximized by having alternative grain crops. For example, wheat and rye were autumn-sown crops, while barley was planted in the spring. Sometimes such flexibility was paramount where the vagaries of the weather in relation to the underlying soil structure demanded it. On the extensive clayland for example, inadequate drainage resulted in excessive water retention and this meant that the period during which the ground could be prepared for cropping was limited. In such circumstances, when there was a delay in the preparation of the ground, the ability to plant a spring-sown crop was not just desirable, it was vital to the general well-being of the community. Yet in some parishes otherwise dominated by the heavy clays, there were also areas where quite different soils also existed. Here the planting of rye provided a good alternative because it could be concentrated in those parts of the open fields least likely to produce good crops of wheat or barley. In such cases it was grown every second or third year (Hoskins, 1950, pp163–165). The inclusion of similar crops that provided such flexibility in response to soil conditions, the weather and the market, went a long way to ensuring the ecological sustainability of the open fields. In time the growth of the market economy saw adjustments in the grain crop mix, in particular there was a shift towards wheat, which became the premier cash crop. In 32 open-field villages in Bedfordshire in 1801 31 per cent of the arable was under wheat, and 18 per cent under barley. In neighbouring Northamptonshire the equivalent distribution was 31 per cent wheat and 27 per cent barley (Turner, 1989, p52). In comparable Leicestershire villages wheat was planted on between 27 and 30 per cent of the cropped arable in the three open fields, while barley occupied between 18 and 25 per cent (Hoskins, 1949a, pp134–135). Rye remained as the dominant bread grain in much of north and east Europe but by the period under review it was only occasionally planted in England, and then mixed with wheat as a bread grain known regionally as muncorn, maslin, blend corn and other names. By the late 18th century whenever it was grown, however rarely, it was used mainly as an early spring feed crop rather than as a bread grain (Hoskins, 1949b, pp161, 174). By 1801 only 3 per cent of the open fields of Bedfordshire were sown with rye, and less than 1 per cent of those in Northamptonshire (Turner, 1989, p52). Nevertheless, what we can conclude of the bread grains is that within communally administered agricultural systems there was adaptability that had evolved over many generations. The second part of the rotation was generically known as the pease field (whether it was one or more actual fields), and represented the pulse rotation. Traditionally, beans and peas were planted in the late winter. The land was ploughed typically at Epiphany (6 January), left for a short while so that frost action could break it up further, and then sown. The purpose of this course was mainly as livestock feed. In Leicestershire in the second half of the 16th century, peas (the term was used indiscriminately for both peas and beans) commonly occupied 35–40 per cent of the cropped arable (Hoskins, 1950, pp168, 171; Thirsk, 1954, p212). By 1801 we know that 47 per cent or so of the cropped arable in the Leicestershire villages of Congerstone, Glenfield and Bringhurst was under beans or peas (Hoskins,
240 Agricultural Revolutions and Change
1949a, pp134–135), though in the county as a whole the proportion was only 9 per cent. By 1801 much of this county had been enclosed and converted to pasture (Turner, 1981, p296). The balance in other places was quite different: in Bedfordshire 21 per cent of the arable in 32 open-field parishes was under peas and beans, and 29 per cent in 45 Northamptonshire parishes (Turner, 1989, p52). While pulses are less efficient at fixing atmospheric nitrogen than are small seeded legumes such as clover, trefoil or sainfoin, they would have made at least as important a contribution to the amount of nitrogen in the system thereby helping to ensure the overall sustainability of the arable (Shiel, 1991, p76). The standard model of the nitrogen cycle suggests that grain crops can experience an increase in yields of 15 kilograms for every one kilogram of nitrogen supplied, but this relationship does not expand infinitely. Instead it is driven by Liebig’s ‘Law of the Minimum’ in which the initial nitrogen deficiency is rectified by the fixing of nitrogen from appropriate crops in a more or less linear relationship of 1:15 until such time that a limit is achieved. Beyond this limit further application of nitrogen does not result in further yield improvements. Thus the integral base fertility of the soil was maintained but constantly we need to remind ourselves that this was not scientifically understood. Instead it was a sustainability cycle borne of generations of experience and experimentation. So what might appear as cutting edge innovation in crop mixes was more likely to have evolved through trial and error. For example, oats were occasionally planted in the pease field (Marshall, 1790, p225), but if they were this took place in late spring, and in common with the use of barley in the corn field, they provided a safety net if bad weather had previously prevented farmers from sowing pulses. This safety net ensured sustenance for the animals. The pease or pulse course might occupy as much as 50 per cent of the arable land that was not in fallow, and its principal purpose was to supply fodder for the livestock. The final course in the rotation was the fallow, which was a restorative period, without the demands of a sown crop. It also acted as a cleaning period, providing an opportunity to remove weeds from the field. Once the pease crop was harvested the field was thrown open for livestock to feed on the stubble, on remnant grasses, weeds and the grass leys. Depasturing also took place on the passageways that afforded access into and across the fields. These were strips of lands known as baulks and headlands. They were integral to the fields and their functions. So also, paradoxically, were weeds. If they were allowed to proliferate at certain times this was not always a sign of backwardness in field management. Arthur Young, the noted agricultural writer and traveller of the late 18th and early 19th centuries observed, ‘you cannot clear weeds until first you let them germinate’ (Young, 1771, p291). Therefore the fallow field was not normally ploughed in the autumn. Instead the weed seeds were allowed to germinate, thus providing feed for the sheep that were grazed on the fallow. The first ploughing was left until late in the spring (Marshall, 1790, p225; Loudon, 1831, p802; Fox, 1981, pp94–95). A second ploughing was typically made in midsummer, when any weeds which were going to seed were ploughed in before they produced seed heads. A final ploughing
Agricultural Sustainability and Open-Field Farming in England 241
occurred about the autumn equinox, shortly before the autumn sowing of the succeeding corn crop. Consequently through the fallow year the field was cleared of sufficient weeds to minimize competition for the limited nutrients available for the future cultivated crops. The groundcover provided by the weeds limited the leaching of nutrients and the erosion of the topsoil. It helped to recycle the nitrogen fixed while the field was in pease. At the same time the field was rested from the demands of a cropping routine, and provided an important source of feed for the sheep, according to the local rules regarding stinting, which in turn provided dung. Thus a neat cycle of nutrient renewal took place year upon year. The open-field system had evolved in such a way as to be ecologically sustainable. The throughput of crops in the different rotations created a biologically diverse system and the pease field compensated for any shortages of permanent grass, or any tendency to acquire more land under cereal according to temporal economic circumstances. The system minimized losses by maintaining ground cover, and by using a variety of plants it kept nutrients within the system. Recycling, through the actions of the sheep and their digestive system and their natural tendency to tread in their waste, along with the ploughing in of anything left uneaten by the animals, also helped with biodiversity. The principle of farming in nature’s image was practised, and the successful integration of plants and animals helped to ensure that the system remained viable across the centuries.
The impact of domestic forces Seemingly therefore the open-field system was in harmony with sustainable ecological principles while allowing for changes in emphasis at the margin that did not upset the whole system. However, it did not operate in a vacuum. Economic considerations and challenges to equity or fairness had the power to disrupt this ecological balance. In particular there was the impact of large-scale changes in society in general of which the individual villages formed a microcosm. For example, changes in population had an impact on prices and the relative benefits of concentrating on bread foods or the more varied diets offered by a mix of bread and animal products. Yet it was possible for the flexibility of the open-field system to react to such population pressures without initially disrupting what we have described as a sustainable farming system based on open-field management. From around 5.2 million in c. 1650, the population of England declined to about 4.9 million in 1681, and recovered only slowly to reach 5.8 million by 1751. Only in one half decade from 1681 to 1751 did numbers rise by more than 0.5 per cent per annum and in two half decades the population actually fell (1681– 1686 and 1726–1731). On the downturn or during times of relatively stable population the result was cheaper bread for consumers, but farmers found that their incomes were squeezed, especially as corn bounties designed to encourage the export of the grain surplus had only a marginal effect in propping up prices. Grain prices fell steadily from a base of 100 in 1650 to 68 in the mid 1740s with obvious implications for the level of farmers’ incomes. As we shall see later, they reacted by
242 Agricultural Revolutions and Change Table 11.1 Agricultural product price indexes for the main ‘Cash Crops’ 1650–1812 Date
Wheat
Butter
Milk
Beef
Mutton
1650
100
100
100
100
100
1745
68
102
112
103
83
1765
103 (100)
111 (100)
119 (100)
119 (100)
102 (100)
1790
119 (116)
121 (109)
171 (144)
156 (131)
126 (124)
1806
205 (199)
196 (177)
277 (233)
275 (231)
211 (207)
1812
222 (216)
227 (205)
359 (302)
281 (236)
222 (218)
Note: 11-year moving averages, rebased on 1650. Apart from the base in 1650 the years selected are determined by the price of wheat at the maxima, minima, the landmark price when the base price was restored, and when the 200 index barrier was broken. (The index has been rebased in 1765 to show the subsequent relative inflation of prices from the new base.) Source: Adapted from Clark, 2004
attempting to adjust the ecological balance between grain and animal production. From the mid-18th century population began to rise and prices in turn recovered to the original base 100 by 1765, and then advanced to 119 by 1790. After 1750 the growth of population was uninterrupted and provided some boost to demand and the resulting recovery of prices shown in Table 11.1. In 1751 the population was 5.8 million, and by 1771 it was 6.4 million. By the 1790s it had grown to 7.7 million (in 1791) and on to 8.7 million by 1801 (Schofield, 1994, p64). The conjunction of this population change with the outbreak of war in 1793, a war that lasted more or less continuously until 1815, meant that prices took off, reaching an index on our scale of 200 by 1805 and a high point of 222 by 1812. This conjunction of demographic and economic circumstances forced agriculturalists to respond by adjusting the ways they worked the land, yet ideally without upsetting the ecological balance or compromising equitable access to resources. The compliance of the landlords and their stewards in this role was also important as witness their abatement of rents during times of economic distress (Turner et al, 1997, passim). But there were other ways of adjustment. The balance between arable and pasture or meadow varied between areas and between parishes, and altering this balance was a task for the community. At Withern with Woodthorpe in Lincolnshire, this task is recorded in the Field Reeves Book. It is a record of the annual decisions made about local farming (Lincolnshire Archives, Misc Dep 199/1). In March 1792 it was agreed that the occupiers would seed and stint, that is apportion the use of the fields, as agreed by the majority. The administrators of these decisions and rules (the field reeves) were an elected body and it was up to them to order and direct the management of local drainage, the care of the fields, and the regulation of the numbers of stock that were allowed to graze on the fields at designated times of the year. For example, in November 1799 they agreed to sow the stubble field with corn the ‘insuing year owing to the unfavourable state of the fallows in the other field from the excessive wetness of the season’. This was a season
Agricultural Sustainability and Open-Field Farming in England 243
by season communal management that was adjusted to accommodate fluctuating annual conditions. In other places such adjustments became permanent features. For example, at Heath and Reach in Bedfordshire it was decided that the traditional three-field system could only be improved by fallowing every fourth year instead of every three. Therefore in 1814 the system of two crops and a fallow became three crops and a fallow in which the third crop was clover, or what others might see as a cropped fallow. It was also agreed that anyone wishing to sow turnip seed or potatoes in the fallow field could do so (Bedfordshire Archives, BO/1334). In Oxfordshire, the open fields were often broken up into larger numbers of rotational units to get around the rigidities of operating only in a two- or three-field manner. At Kirtlington this adaptability reached new heights when 12 arable divisions replaced the original two fields (Lambert, 1955). Such adjustments helped to maintain the ecological integrity of the soil as well as demonstrating equity of ownership through equity of decision making. We know that in some areas it was possible to modify and adapt the open-field systems to accommodate new crops and new rotations (the examples above and generally in Havinden, 1961). However, such open-field flexibility was by no means certain, and there is no satisfactory way of quantifying the production or consumption of the numerous new crops which were thus cultivated, nor whether they were always first introduced into the open-field system (Thirsk, 1997). For example, both woad and rapeseed (to name only two examples) seem generally to have been grown in areas of old enclosure outside the common fields. In the case of woad, in the Midlands generally but notably in Northamptonshire, it is not clear whether it was introduced into the open fields, rather than the woodland areas. Many parishes also had areas of enclosed land, usually under grass but sometimes in exhausting arable crops such as hemp, flax or hops (Mingay, 1984, p96). Economic considerations forced communities not only to consider new crops but also whether to alter the ratio of arable to grass. During the demographic quietus before 1750, and in the light of the stable or declining crop price profile it encountered and partly determined, there was a countervailing history of higher prices for meat and dairy products, as well as a rising industrial demand for wool and other raw materials derived from agriculture. The conjunction of these factors encouraged a move away from arable production towards grass (Jones, 1967, p8). With relatively stable contemporary wages in association with the decline in basic bread prices (as depicted in the wheat price trend in Table 11.1), the implied increase in purchasing power was spent by switching demand to animals and animal products, the prices of which held up throughout the period (Table 11.1). Grain prices recovered in the third and fourth quarters of the 18th century in response to the early effects of the demographic revolution which we date to this period. Yet adjustments in standards of living which we associate with the richer society that developed and which defied the Malthusian spectre, meant that dietary changes that were already in place could flourish. To that extent there was no reversal of the trend that was in place. In Table 11.1, in parenthesis, we rework the price trend to show that the terms of trade may have turned back towards grain but not sufficiently to
244 Agricultural Revolutions and Change
dampen the enthusiasm for livestock products, the prices for which held up. The terms of trade between arable and pastoral products (wheat relative to butter, milk, beef and mutton in Table 11.1) did not move against pastoral products by 1790 (except butter), nor by 1806 and 1812 (again except for butter). Scholars’ interpretations of the price inflation of this, the French wars period, had been mixed until Hueckel (1976) constructed a series of terms of trade indexes between arable and pastoral products. These more or less confirm the surge of demand for pastoral products that we also identify and to which we return below.
Transformations responding to domestic forces Adjustments in the land use mix were not always in the gift of individuals in communally shared resources such as encountered in open-field agriculture. Instead, local courts of administration, the manor courts, circumscribed by ancient manorial procedures, still operated in the 18th century. According to Tate such control of the open fields and associated commons was never formally transferred from the manor and its courts to other local courts, though an act of 1773 devolved powers to manage the common fields to a three quarters majority in favour of the landowners. There are examples below which post-date 1773 and which suggest that the ceding of power away from the manorial courts was not everywhere recognized (Tate, 1969, pp258–267). Yet regardless of such niceties, it remained the case that the community in some shape or form had to decide on changes it wished to implement, and to accept the risks involved. If, for example, it agreed to abandon all or part of the mixed farming of the common fields in favour of permanent pasture, it had also to recognize the consequences on the ecological balance, the economic rewards, and the equity of resource use. Agricultural communities across the Midlands responded to the economic considerations of the period post-1650 by a series of improvements. We are talking here about constant annual management rather than revolutionary change – changes that were ‘unambitious and quite small in scale’. These consisted of the regulation of commons, partial enclosures, consolidation of scattered holdings, intakes of waste, and conversion of old arable land to grass and the breaking-up and improvement of ancient pastures (Mingay, 1984, p122). The first adjustment within the open fields involved creating new grass or preserving existing grass resources. In the demographic conditions before the third quarter of the 18th century, with the economic or market attractiveness of pastoral products relative to grain products, there was mounting pressure put on grazing resources. This led to overgrazing of stock, which threatened to degrade the communal resources, the commons and the cow pastures. In compensation, parcels of land were laid down in temporary grass leys. Such convertible husbandry was already well established by the 16th century and by the 17th century the division of fields into arable and ley or grass-ground had become common (Beresford, 1949, p92; Hunt, 1957, p270; Hall, 1995, pp20–29, 157–164). It involved intermixing grass leys with the cropped lands or strips in the open fields. On farms
Agricultural Sustainability and Open-Field Farming in England 245
owned by New College Oxford in Hempton in 1624, 24 per cent of the land was in grass leys, in Addlesbury in 1628 it was 16 per cent, and in Shutford in 1653 it was 34 per cent (Havinden, 1961, p74). Pasture shortages by the end of the 17th century led the commoners at Ibstock to convert two lands to grass leys for every yardland held in the Neather Field, specifically to augment the cow pasture (Leicestershire Archives, DE 390/56. A yardland was an old method of describing and crudely measuring an area of land but it varied in precise size even from parish to parish let alone from one county or broad district to another. A rule of thumb suggests that a yardland was about 30 acres or 12 hectares). At Grafton in Northamptonshire in the 1720s and 1730s it was proposed that no more than one-third of the land in the common fields should be under the plough and the rest in grass (Northamptonshire Archives, G3883). At Lubenham in Leicestershire in 1734 four tenants renting from Samuel Wright had on average 36 per cent of their openfield land in grass leys rather than arable crops (Leicestershire Archives, DE 2960). One of the advantages of laying parcels of land down in temporary grass leys is that it improves biodiversity and helps to integrate livestock and crops in a balanced, ecologically sustainable manner. We say this not as a post-Brundtland analytical rationalization of an ancient system, but rather as a recognition that historians have clearly identified a custom and practice in operation that can now be presented in modern terms. Moreover, it stands in contrast to other agricultural systems which were more land abundant than England. We have in mind here the kind of settlement history in 19th-century North America where settlers moved on to new ground once they had exhausted the old ground since that was automatically a way of recovering biodiversity lost through soil exhaustion. In the meantime the exhausted ground took 20 or more years to recover through natural regenerative means. There was a limit to the extent to which such practices could prevail, a limit that was reached many generations ago in England. Instead convertible husbandry became the solution. The second means of adjusting the terms of trade between crops and animals was through piecemeal enclosure of small areas of the open fields, usually in the period under study and for the geography we have identified, for conversion to permanent pasture. Typically this occurred at the edges of parishes remote from the core of arable activity, on land which because of its location may have been starved of manure and the very best husbandlike attention. These old enclosures ranged from bite-sized pieces to very extensive but mostly contiguous stretches of land (Thomas, 1933, p79; Swales, 1937, p245; Turner, 1980, pp137–141; Hall, 1995, p22). Many of these intakes from the communal lands probably began as arable ley grounds located at the fringes of the open fields or in reasonably compact blocks that did not interfere with the general farming of the arable field (Hoskins, 1957, pp160–164). Whatever their origin, these enclosures came to be managed outside the open-field system. At Hallaton, Leicestershire, in 1707, 36 per cent or 796 acres (322 hectares) of the village was enclosed in this fashion leaving the remainder open (Leicestershire Archives, DE 339/340). Out of 932 acres
246 Agricultural Revolutions and Change
(377 hectares) surveyed at Lubenham in 1734, 75 per cent was enclosed (Leicestershire Archives, DE 2960). At Laxton in Nottinghamshire from 1894 acres (767 hectares) which were once open fields, 1143 acres (463 hectares or 60 per cent) were still open in 1736 (Beckett, 1989, p317). Occasionally individual fields were removed from cultivation altogether. At Cotgrave in Nottinghamshire one of the four open fields was turned down to grass in 1717, and the others followed piecemeal until the enclosure legislation of the 1790s simply confirmed that the village was now almost entirely in pasture (Nottingham University Manuscripts Department, MaB). At Orston, also in Nottinghamshire, both in 1730 and in 1753 and piecemeal thereafter, there was conversion to permanent grass from the open-field arable to such an extent that by 1793 only 14 per cent remained in arable. This soon disappeared following the enclosure of that year (Barnes, 1997, pp125– 132). A third method that altered the balance of arable and grass was the enforcement or revision of agreements that restricted grazing rights. The owners of cottages and holdings had rights to graze a given number and type of animal on the commons, and on the crop stubbles after harvest. Permanent commons were usually on poor ground or waste, but that made it even more important that the correct stocking density was maintained with a mixture of types, ages and sexes of animal, to maximize the maintenance of a good grass sward. Though contemporaries were aware that grassland would benefit from careful management, nevertheless commons were often seriously neglected, and even encroached upon. In an attempt to control the situation at Cosgrove in Northamptonshire, the field orders of 1686 required that ‘all those persons that have flocke or flockes upon the green or any other part of the commons or waste shall take them off by the first of February next’ (Northamptonshire Archives, FS70/1). In Leicestershire, the Sheppy Magna manor court in the late 18th and early 19th century disallowed repeated encroachments on the communal wasteland, opened them up and returned them to communal use (Leicestershire Archives, DE 798/1; Turner, 1980, p143). Once the rules were enforced and unauthorized encroachments ended, the equitable access to agrarian resources was restored. The enforcement of stinting agreements and field orders helped to maintain the integrity of the open-field farming system. New and revised agreements bemoaned the neglect and over-stocking that occurred by way of justifying amendments or the enforcement of new stints. Penalties were imposed for failure to comply with the rules, thus restating the importance attached to communal equity in the use of these common resources. Exceeding the agreed stints was effectively the theft of an inequitable share of the forage. At Wigston Magna in Leicestershire in 1707 after a number of disputes over rights to common grazing, it was agreed to reduce the cattle stint from eight to four beasts and the sheep stint from 40 to 24 (Hoskins, 1957, pp238–240). At Castle Donington, also in Leicestershire, grazing resources were in such short supply that in 1737 they were eaten off by early summer. In consequence the cow pasture stint was reduced by 25 per cent and the sheep stint by 50 per cent (Leicestershire Archives, DG8/24). The necessity of
Agricultural Sustainability and Open-Field Farming in England 247
imposing stints was expressed by the preamble to their renewal in 1718 at Little Bowden in Northamptonshire, when both the cattle and sheep stints were reduced by a half (Northamptonshire Archives, TLB/84). Such rules protected the common grazing on both the commons and the arable stubbles, but the frequency of their renewal is suggestive of the pressure to increase animal stocks. At Orston in Northamptonshire the manor court determined the stint annually (Barnes, 1997), and a similar task fell to the field reeve at Withern with Woodthorpe in Lincolnshire (Lincolnshire Archives, 199/1). In an attempt to keep track of the cattle in Billington in Bedfordshire each commoner was required to notify the teller in writing by the end of March of the number of cattle he was keeping on the common. This broke down in 1772 when it was found that ‘… the Commons and Commonable Fields … have been overcharged and burdened with too many cattle to the great injury and prejudice … etc’. In consequence the stint was reduced (Bedfordshire Archives, BO1326). Many agreements specifically prohibited the use of the commons by anyone without grazing rights, a reminder that modern-day ideas regarding commons developed out of specific and relatively narrow land rights. The commoners at Cosgrove in Northamptonshire agreed in 1715 only to rent spare stints on the common land to fellow Cosgrove villagers and not to outsiders (Northamptonshire Archives, YZ7849). At Gilmorton in Leicestershire in 1722 the agreements stipulated that ‘No one shall lett sell give or dispose of his sheep commons from the Feast of St Martin until Ladyday [to persons] not living in Gilmorton but can receive compensation of 1 1/2 d for every sheep common not stocked or stored if notice is given to the constable…’ (Leicestershire Archives, DE66). This is akin to a public good where the definition of ‘public’ is more like what Pretty and Ward refer to in a modern setting as a ‘club’ good (Pretty and Ward, 2001, pp210, 221 note 2). Two equity principles were most abused and thereby tested by stinting regulations and other field orders. The first was the time-honoured egalitarian principle that individuals should not keep more stock on the commons in the summer than they could reasonably feed on their own land in winter. Thus at Ibstock in Leicestershire in 1696 it was agreed that ‘Field masters shall yearly once betwixt Lady Day and midsummer and once between midsummer and Michaelmas drive the fields and take an exact account of every mans stock that no person keep any more cattle than he have commons for in the common fields or pasture’ (Leicestershire Archives, D E 390/56). The second was a clarification of the ownership and stewardship of common community resources. The common cause of tensions was the overstocking of the commons in the face of market pressures (widely discussed in Ault, 1954; Yelling, 1977, pp153–156; Turner, 1980, pp145–149). For the community to regulate itself in the face of such pressures, the local manorial and other courts had to be active, but their powers were gradually eroded more or less by the difficulty of policing the common property. Each time a parcel of land was removed from the communally administered system, everyone else’s entitlement was adversely affected. The more this occurred the more occasions the local courts had
248 Agricultural Revolutions and Change
to intervene, but also the more often their powers were questioned and sometimes ignored. In consequence the local court system collapsed or was forced to accede to local pressures, often because farmers were searching for ways to respond to everyday market forces. The courts were simply not equipped to counter the demand for economic individuality, which could often be achieved only through the formal and legal procedure of enclosure. Barnes has shown how the erosion of power exercised by local courts unfolded in the Nottinghamshire village of Orston (Barnes, 1997).
The Final Breakdown We have stressed the capacity of open-field communities to react to pressures, whether of an ecological, economic or equitable nature, by adjusting farming and yet retaining sustainability. Yet in the longer term the open-field system collapsed. As a system it was, in modern terminology, unsustainable. It was possible to adjust the ecological balance, to lay down areas of arable to grass, to enclose areas of remote arable for permanent pasture, or to alter the stints on the commons, but the degree to which the system was completely flexible and therefore inviolable is open to question. The local ecology may have been firmly established but the system of managing it could not resist external economic considerations, particularly in the form of agricultural commercialization in the face of changing demand. Ultimately something more fundamental was needed, and this was to be enclosure and the parcellation of land into individual properties. At the same time it meant the extinction of common rights. At Wendover in Buckinghamshire in 1777 an act was secured to exchange land in the open fields to create a degree of consolidation of otherwise intermixed land ownership. This was not a full enclosure but rather a consolidation, but it did require the break-up of boundaries and access points between ownership strips and therefore the loss of scattered sheep pastures, since those boundary and access lands were usually grassed over. One of the local courts agreed to let clover and turnips be sown in place of the lost pasture. This arrangement proceeded smoothly for 12 years until one of the farmers turned a flock of sheep onto the clover in May before the agreed time for depasturing. The crop was lost, equity was challenged, and the parishioners proceeded to a formal enclosure through a parliamentary act (James and Malcolm, 1794, p29). This and countless examples like it, and also the variations of it that we have intimated, existed in the 17th and 18th centuries and are real-life examples of Hardin’s theoretical ‘tragedy of the commons’ in which individual and collective utility are sometimes at odds with each other (Hardin, 1968, p1240). In its purest form the open-field system was non-specialized and non-intensive. It was developed in a context of relative community self-sufficiency (which underpinned ecological, economic and equitable considerations). In saying this we recognize that the village was never entirely self-sufficient because taxes and rents left
Agricultural Sustainability and Open-Field Farming in England 249
the community, market goods were bought in, and there were also significant commodity trades, for example in seeds. Nevertheless, it was fundamentally unsuited to and therefore unsustainable in the context of a market economy which emphasized the virtues of regional and local specialization. This is what emerged from the economic conditions of the century or so after 1650 and which in the midland counties of England tended to suit livestock farming and its end products ranging from meat and wool to milk. On the heavy clays of the English midlands the production of turnips, which was increasingly transforming light soil areas such as Norfolk, was inappropriate. In contrast, the increasingly developing exchange economy, which was underpinned by river navigation improvements, canals and turnpike roads, suggested the virtues of increased specialization which in the study area pointed to the advantages of a grass-based agricultural economy. From the 17th century, and probably even earlier in some parts, the pressure built up sufficiently to suggest that the adaptations to the system we have described were inadequate. Enclosure and the ending of common property rights in favour of separate and individual ownership became the order of the day. A rising tide of opinion from the 17th century onwards and culminating in Arthur Young’s invective against open-field agriculture and the ‘Goths and Vandals’ who managed them in the 1760s and 1770s convincingly championed the benefits of farming in severalty (entirely private farming) (Mingay, 1975, p99). While the potential costs deterred (or at least deferred) enclosure, in the end market forces could not easily be resisted whatever the potential threat to the rural community (Mingay, 1984, pp96, 117). In the light of the price trends we have discussed, pastoral farming made economic sense in the period leading up to the mid-18th century, especially on the heavy clays of the study area, the English midland counties. The pressure to convert to pasture inevitably increased the pressure to enclose (Turner, 1980, ch 6). Ecological issues also intruded, particularly the management of animals. Breed management could improve the productivity of a flock or herd by matching breed and use – for example by developing specialized cattle breeds for dairying, or by using early maturing animals in a feeding/fatting system. But communal grazing was a barrier to the improvement of livestock through selective breeding. In addition, disease control became increasingly important as the value of the stock increased, but this was difficult to undertake with communal grazing. We are uncertain of the extent to which communal regulations of stock density of the sort that we have already discussed were on their own sufficient to maintain the quality of stock, though we also have spasmodic indications of specific regulations that were introduced. For example, regulations were put in place at Mountsorrell in Leicestershire, specifically banning sheep with scab and infectious cattle from grazing on the commons (Leicestershire Archives, DE 40/46/3). Within the old system, any change in animal husbandry relied on the efforts of the entire community, including those with little interest in the new ways. Individuals had insufficient daily control of their animals to maintain standards that were relatively easy to achieve on enclosed farms. A system reliant on communal action was no longer
250 Agricultural Revolutions and Change
sustainable. The shift towards specialized and more productive and intensive agriculture was outside the scope of a system originally established and developed to provide the needs of a largely self-sufficient community. It was not sustainable at the higher levels of productivity that could be reached by farming in severalty. The three principles in the sustainability model – ecology, economy and equity – sometimes pulled in opposing directions. Farming in severalty facilitated changes of the sort that open-field agriculture could only introduce slowly and in piecemeal fashion. It was as if the remedies we have discussed above were remedial – meeting crises as and when – rather than inclusive of the changes in population and demand that required more decisive action. That decisive action became enclosure. The open fields were abandoned, not all at a rush, but over a long period, with definable peaks of activity. Our earlier discussion of the study area of contiguous counties indicates both the location and the intensity of enclosure, but it hides the fact that this enclosure took place in two waves of activity. There was a first intensive enclosure in the third quarter of the 18th century in which the trends towards more pastoral activity detectable for 100 years or so was intensified. There was then a lull in activity in the 1780s before a resurgence of enclosure in the 1790s and on to 1815 and a slowdown thereafter. Thus the dismantling of the open fields had been in full flow up to the 1780s and how long the system would have taken to disappear entirely we shall never know, because the whole process took a new turn in 1793 when Britain entered into what turned out to be more than 20 years of (almost) uninterrupted conflict with France. Inevitably, for an island state, the first and most pressing question to arise concerned the security and adequacy of food supplies. This quest tended to compromise environmental stewardship and equitable access to resources. In the 1790s a conjunction of circumstances including bad harvests and the impact of the war produced an inflation of prices (Table 11.1) and this exposed the vulnerability of the national economy. In the years 1771–1793 inclusive, the price of wheat rose above 50 shillings per quarter in only 7 years, and at its worst reached 54.75 shillings in 1790. (There were eight bushels in a quarter, and a bushel weighs some 25kg.) In four other years it was at or below 40 shillings per quarter. It averaged 46.6 shillings per quarter from 1771 to 1789. But from 1794 to 1821 it was always above 50 shillings. In the 1790s it was 57.6 shillings, but for the whole duration of the war it averaged 80.6 shillings per quarter. At its wartime peak the price of wheat stood at 126.5 shillings per quarter in 1812, falling to 65 shillings in 1815 and 44 shillings in 1822. It was not until 1835 that the price of wheat reduced to a level (at 39 shillings per quarter) comparable to the level of the distant generation of the early 1760s (Mitchell and Deane, 1962, pp487–488; Clark, 2004). But this was not just an inflation of grain prices, because as Table 11.1 indicates the inflation was just as strong for animal-derived products. The conjunction of war and demography was very potent on price trends but the enclosures and agricultural improvements that ensued were complicated. In these circumstances the long-term movement we have described towards converting arable land to grassland at first sight seems to fall foul of the new
Agricultural Sustainability and Open-Field Farming in England 251
contemporary contrary pressures to raise arable output during the wartime conflict. Enclosures on the heavy clays of the midland counties continued to feed the desire for more animal products, perhaps not to the same degree as prevailed in earlier decades, but nonetheless the trend was not reversed. Instead, during the war the grain crises for a country now under siege were relieved by enclosure of a different sort. There was the enclosure of the lighter soils, of the sort that occurred on the East Yorkshire and Lincolnshire Wolds, which could benefit in a different way from farming in severalty – not for conversion to pasture but for intensification of the arable (Turner, 1984, pp16–23). There was also a reclamation of otherwise illused land, the commons and upland sheep walks, moors and mosses, all commonly called at the time ‘wasteland’. There may not have been a plough-up campaign to rival the ones witnessed in 1916–1918 or 1939–1944, but there was certainly a good deal of Parliamentary rhetoric along such lines. In 1803 Sir John Sinclair, a Scottish MP and President of the Board of Agriculture, called for an attack on the commons and wastes, and not just the highland ones. ‘Let us not be satisfied with the liberation of Egypt, or the subjugation of Malta, but let us subdue Finchley Common; let us conquer Hounslow Heath, let us compel Epping Forest to submit to the yoke of improvement’ (Turner, 1984, p23). This was intervention by default, but clearly the message suggested that the ecological balance might need to be compromised for the wider equitable crisis, not in this case of the community, but of government and the nation state itself. Sir John and the champions of enclosure could not be sure of the long-term impact of enclosing land that was otherwise used for traditional moorland or commons economy. It may not have compared with the ecological damage imparted by the wartime plough-up of sheep walks in the 20th century, but whether they recognized it or not, contemporaries threatened ecological sustainability by their short-term actions. They can have had few ideas as to the potential long-term damage they were in danger of imposing by enclosing commons and waste and then ploughing them for grain, but in the French wars, as in the 20th-century world wars, sustainability was compromised for reasons of national security. Contemporary estimates suggest that the wheat acreage could have grown from something less than 2 million acres (0.8 million hectares) in the 1790s, to about 2.4 million acres (0.97 million ha) in 1801, and to 3.2 million acres (1.3 million ha) in 1808 (Turner, 1981, pp299–301). We cannot rely too heavily on these figures as they were based on little more than informed guesses, but they point towards a rapid complement to the trend towards grass, which had not been stemmed by the growth of population and grain prices from the 1760s. Furthermore, with spiralling prices as an incentive the old principles of equity were easily abandoned. Almost invariably enclosure began by extinguishing common rights, a gesture which symbolized the move away from the communal and towards the individual. The local communal administration with its policy of upholding common rights, by-laws, stints and other restrictions was swept away on this tide of individuality. Once lines of engagement had been drawn to divide the property and adjudicate on property rights, it meant the end of the communal care. At
252 Agricultural Revolutions and Change
times enclosure was as much about the clarification of those property rights as it was about productivity strategies. Enclosure, whether for extending the grassland or for improving the arable, represented the end of the old order. It brought with it the self-contained, ringfenced farm, which in turn posed a new threat to sustainability. While the community with its local courts controlled farming practice, it also held back the enterprise of the individual. Through the enclosure process itself local legal restrictions operated by the enclosure commissioners ensured that all farmers were fairly treated (Beckett et al, 1998), but after enclosure those same farmers came directly under the control of landlords. At that juncture between community control and landlord control there was in some places and at some times a breathing space in which the accumulated sustainable work of decades or even centuries was put severely at risk. This was no better summed up than by Thomas Davis, a noted contemporary observer of the interface between communal open-field farming and farming in severalty. He said that enclosures made a good farmer better, but a bad farmer worse (Davis, 1811, p46). He meant that the good farmers were already resource managers but within a communal straitjacket, in contrast to the potentially indolent or inefficient farmers who were protected from doing great damage by the collective action embodied in communal management. Left to their own devices, once collective action was removed at enclosure, these farmers lost the plot and their part of the farming environment suffered. Therefore for future agricultural sustainability it was vital that the responsibilities undertaken by the local courts were transferred to the landlord, or more pertinently to his land agent. It is probably not coincidental that the late 18th and early 19th centuries witnessed growing professionalization of estate management. This was symbolized by the emergence of the land agent who replaced the old manorial steward, who had often been a lawyer employed mainly to oversee the operation of the manorial court (Beckett, 1986, p144). All the while there is also the age-old debate over the damage done to a landless sector of society when access to common resources was taken away by this enclosure process (Pretty, 2002, pp29–32).
Summary and Conclusion – Transitions in English Agrarian History If Brundtland is the key definition of sustainability then open-field farming appeared to meet the needs of succeeding generations without compromising those of future generations. It was ecologically balanced, the economic benefits maintained the rural community, and it provided a degree of equitable access to resources. At the same time it was susceptible to adjustment, allowing communities to alter the balance between arable and pasture to reflect the wider economic world. Changing demand conditions constantly impinged on the three-attribute model of ecology, economy and equity, but inbuilt elasticity allowed temporary
Agricultural Sustainability and Open-Field Farming in England 253
and also some permanent adjustments to be made without unbalancing the whole system. But that could not go on forever. The nature of demand developed throughout society with a rise of commercialization in manufacturing, a greater circulation of money, an extension of markets, and a greater variation in the demand for food away from mere survival needs to something more varied. This encouraged agricultural specialization, placed severe strains on traditional openfield agriculture, induced questions and decisions about land use and land access on a big enough scale to threaten the conditions of equity in the community, as well as putting the ecological balance of resources at risk. The resulting removal of collective responsibility at enclosure shifted the burden for sustainability from the community to the individual. Sustainability is always threatened by crises, and sometimes short-term compromises are necessary. But in the longer term contemporaries understood and acted on the basis that agriculture must be sustainable. They may not have used the same terminology, but they understood that farming had to meet the needs of any particular generation without compromising the ability of future rural generations to meet their own needs. This is not some pie in the sky romantic view of the past but a realistic and honest assessment of the workings of the rural village economy. When they looked to make changes they did so cautiously, ensuring at each stage that the economic demands on farming did not compromise the ecological and equity considerations too much. Only under the stress of war were such considerations shuffled to one side. There are surely echoes of the traditional collective rural village economy in modern approaches to biodiversity, sustainability and communities (a play on words deliberately employed from the title of O’Riordan and Stoll-Kleemann, 2003 and further elaborated by O’Riordan in his introduction and partial summary of subsequent chapters, especially pp16–26). Three hundred years ago in England the organization of the open fields more or less ensured that resources were used in a manner which was self-evidently good for the wider environment and community. This has also been illustrated in analyses that have a modern contemporary agenda as well as a historical focus (Skipp, 1978; Pearce et al, 1989; Soule and Piper, 1992; Pretty, 1995; MAFF, 1998). Moreover, the language of collective action has been employed recently to illustrate in other countries and in recent times how equitable solutions in rural communities have met the needs of local development in a sustainable fashion (Pretty and Ward, 2001; and many of the examples in Uphoff, 2002). Our point is that the history of open-field farming in England, and no doubt also in much of western and northern Europe, probably provides a laboratory of similar experiences from which modern analysts might derive some well-developed but perhaps now forgotten solutions. In this context it should not stretch the imagination to suggest that there are lessons to be gained from this passage of history to apply to the recent past, or indeed for application to present and future societies. Communal and quasi ‘public good’ resources can be managed even against the mounting odds posed by demographic and other internal and external pressures (such as war) that impinge upon them. The New Institutional Economics approach to common or
254 Agricultural Revolutions and Change
corporate ownership has opened up new avenues of investigation of those circumstances that have determined the development from common to private forms of ownership and governance (Ostrom, 1990; Baland et al, 1998; Radkau, 2003). What we have offered here is an empirical example of that development but in the context of the modern theory of sustainable resource management.
Acknowledgements We are grateful to the Economic and Social Research Council for their financial support of this project, the long-term intention of which is to offer a framework for examining the experience of farmers over the past 500 years within the context of the sustainability debate. We also thank Professor Greg Clark for the opportunity to use his price indexes ahead of publication. Finally we thank the anonymous referees who encouraged us to rework our ideas into a wider framework.
References Ault, W.A. (1954) Village bye-laws by consent. Speculum 39, 378–394. Baker, A.R.H. and Butlin, R.A. (eds) (1973) Studies of Field Systems in the British Isles. Cambridge: Cambridge University Press. Baland, J-M. and Platteau, J-P. (1998) Division of the commons: A partial assessment of the New Institutional Economics of land rights. American Journal of Agricultural Economics 80, 644–650. Barnes, P. (1997) The adaptation of open-field farming in an east Nottinghamshire parish: Orston, 1641–1793. Transactions of the Thoroton Society 101, 125–132. Beckett, J.V. (1986) The Aristocracy in England. Oxford: Basil Blackwell. Beckett, J.V. (1989) A History of Laxton: England’s Last Open-Field Village. Oxford: Basil Blackwell. Beckett, J.V., Turner, M.E. and Cowell, B. (1998) Farming through enclosure. Rural History 9, 141– 155. Beresford, M.W. (1949) Glebe terriers and open-field Leicestershire. In W.G. Hoskins (ed.) Studies in Leicestershire Agrarian History (pp. 77–126). Leicester: Leicestershire Archaeological Society. Berry, W. (1996) Foreword to W. Jackson, New Roots for Agriculture (new edn). San Francisco: Friends of the Earth. Broad, J. (1980) Alternate husbandry and permanent pasture in the Midlands, 1650–1800. Agricultural History Review 28, 77–89. Butlin, R.A. (1982) The Transformation of Rural England c. 1580–1800. Oxford: University Press. Clark, G. (2004) The price history of English agriculture, 1209–1914. Research in Economic History 22. Conway, G.R. and Pretty, J.N. (1991) Unwelcome Harvest: Agriculture and Pollution. London: Earthscan. Davis, T. (1811) General View of the Agriculture of the County of Wiltshire. London. Evans, L.T. (1998) Feeding the Ten Billion: Plants and Population Growth. Cambridge: Cambridge University Press. Fox, H.S.A. (1981) Approaches to the adoption of the midland system. In T. Rowley (ed.) The Origins of Open-Field Agriculture (pp. 64–111). London: Croom Helm. Gregorich, L.J. (1995) Introduction. In D.F. Acton and L.J. Gregorich (eds) The Health of Our Soils: Toward Sustainable Agriculture in Canada. Ottawa: Centre for Land and Biological Resources Research.
Agricultural Sustainability and Open-Field Farming in England 255 Hall, D. (1995) The Open Fields of Northamptonshire. Northampton: Northamptonshire Record Society. Hardin, G. (1968) The tragedy of the commons. Science 162, 1243–1248. Havinden, M. (1961) Agricultural progress in open-field Oxfordshire. Agricultural History Review 9, 73–83. Heap, B. (1992) In B.J. Marshall (ed.) Sustainable Livestock Farming into the 21st Century. University of Reading: Centre for Agricultural Strategy. Hoskins, W.G. (1949a) The Leicestershire crop returns of 1801. Transactions of the Leicestershire Archaeological Society 24, 127–153. Hoskins, W.G. (1949b) Midland England. London: Batsford. Hoskins, W.G. (1950) The Leicestershire farmer in the sixteenth century. In W.G. Hoskins (ed.) Essays in Leicestershire History. Liverpool: Liverpool University Press. Hoskins, W.G. (1957) The Midland Peasant, the Economic and Social History of a Leicestershire Village. London: Macmillan. Howard, Sir A. (1940) An Agricultural Testament. London: Oxford University Press. Hueckel, G. (1976) Relative prices and supply response in English agriculture during the Napoleonic wars. Economic History Review 29, 401–414. Hunt, H.G. (1957) The chronology of parliamentary enclosure in Leicestershire. Economic History Review 10, 265–272. Jackson, W. (1980, reissued 1996) New Roots for Agriculture. San Francisco: Friends of the Earth. Jackson, W. (1992) Foreword. In J.D. Soule and J.K. Piper (eds) Farming in Nature’s Image: An Ecological Approach to Agriculture. Washington DC: Island Press. James, W. and Malcolm, J. (1794) A General View of the Agriculture of the County of Buckinghamshire. London: Board of Agriculture. Jones, E.L. (1967) Introduction. In E.L. Jones (ed.) Agriculture and Economic Growth in England 1650–1815 (pp. 1–48). London: Methuen. Lambert, A. (1955) The agriculture of Oxfordshire at the end of the eighteenth century. Agricultural History 29, 31–38. Loudon, J.C. (1831) An Encyclopaedia of Agriculture (2nd edn). London. MAFF (1998) Development of a Set of Indicators for Sustainable Agriculture in the United Kingdom: A Consultation Document. London: HMSO. Mannion, A.M. (1995) Agriculture and Environmental Change: Temporal and Spatial Dimensions. Chichester: John Wiley. Marshall, W. (1790) The Rural Economy of the Midland Counties. (Vol. 2). London. Mingay, G.E. (1975) Arthur Young and His Times. London: Macmillan. Mingay, G.E. (1984) The East Midlands. In J. Thirsk (ed.) The Agrarian History of England and Wales, vol. 5 (1640–1750), part I (pp. 89–128). Cambridge: Cambridge University Press. Mitchell, B.R. and Deane, P. (eds) (1962) Abstract of British Historical Statistics. Cambridge: Cambridge University Press. Newman, E.I. and Harvey, P.D.A. (1997) Did soil fertility decline in medieval English farms? Evidence from Cuxham, Oxfordshire, 1320–1340. Agricultural History Review 45, 119–136. Norman, D. et al. (1997) Defining and implementing sustainable agriculture. Kansas Sustainable Agriculture Series. On www at http://www.oznet.ksu.edu/kcsaac/Pubs_kcsaac/ksas1.htm. O’Riordan, T. (2003) Protecting beyond the protected. In T. O’Riordan and S. Stoll-Kleemann (eds) Biodiversity, Sustainability and Human Communities (pp. 3–29). Cambridge: Cambridge University Press. O’Riordan, T. and Stoll-Kleemann, S. (eds) (2003) Biodiversity, Sustainability and Human Communities. Cambridge: Cambridge University Press. Ostrom, F. (1990) Governing the Commons: The Evolution of Institutions for Collective Action. New York: Cambridge University Press. Pannell, D.J. and Schilizzi, S. (1999) Sustainable agriculture: A matter of ecology, equity, economic efficiency or expedience? Journal of Sustainable Agriculture 13 (4), 57–66.
256 Agricultural Revolutions and Change Pearce, D., Markandya, A. and Barbier, E.B. (1989) Blueprint for a Green Economy. London: Earthscan. Pretty, J.N. (1991) Farmers’ extension practice and technology adaptation: Agricultural revolution in 17th–19th century Britain. Agriculture and Human Values VIII, 132–148. Pretty, J.N. (1995) Regenerating Agriculture: Policies and Practice for Sustainability and Self-reliance. London: Earthscan. Pretty, J.N. (2002) Agri-Culture: Reconnecting People, Land and Nature. London: Earthscan. Pretty, J.N. and Ward, H. (2001) Social capital and the environment. World Development 29 (2), 209–227. Radkau, J. (2003) Exceptionalism in European environmental history. Bulletin of the German Historical Institute 33 (Fall), 3–44. Schofield, R.S. (1994) British population change, 1700–1871. In R. Floud and D. McCloskey (eds) The Economic History of Britain since 1700: Volume 1, 1700–1860 (2nd edn), (pp. 60–95). Cambridge: Cambridge University Press. Sen, A. (1981) Poverty and Famines. Oxford: Oxford University Press. Sen, A. (1986) Food, economics and entitlement. Lloyds Bank Review 160 (2), 1–20. Shiel, R.S. (1991) Improving soil productivity in the pre-fertiliser era. In B.M.S. Campbell and M. Overton (eds) Land, Labour and Livestock: Historical Studies in European Agricultural Productivity (pp. 51–77). Manchester: Manchester University Press. Skipp, V. (1978) Crisis and Development: An Ecological Case Study of the Forest of Arden. Cambridge: Cambridge University Press. Soule, J.D. and Piper, J.K. (1992) Farming in Nature’s Image: An Ecological Approach to Agriculture. Washington DC: Island Press. Swales, T.H. (1937 and 1938) The parliamentary enclosures of Lindsey. Architectural and Archaeological Societies of Lincolnshire and Northamptonshire, Reports and Papers 42, 233–274, and new series vol. 2, 85–120. Tate, W.E. (1969) The Parish Chest: A Study of the Records of Parochial Administration in England (3rd edn). Cambridge: Cambridge University Press. Tawney, R.H. (1912) The Agrarian Problem in the Sixteenth Century. London: Longmans. Thirsk, J. (1954) Agrarian history, 1540–1950. In W.G. Hoskins and R.A. McKinley (eds) The Victoria History of the County of Leicester, Vol. II (pp. 199–264). Oxford: Oxford University Press. Thirsk, J. (1997) Alternative Agriculture: A History from the Black Death to the Present Day. Oxford: Oxford University Press. Thomas, H.R. (1933) The enclosure of open fields and commons in Staffordshire. Collections for a History of Staffordshire volume for 1931, 55–99. Turner, M.E. (1980) English Parliamentary Enclosure. Folkestone: Wm Dawson. Turner, M.E. (1981) Arable in England and Wales: Estimates from the 1801 crop returns. Journal of Historical Geography 7, 291–302. Turner, M.E. (1984) Enclosures in Britain 1750–1830. London: Macmillan. Turner, M.E. (1989) Benefits but at cost: The debates about parliamentary enclosure. Research in Economic History (supplement) 5, 49–67. Turner, M.E., Beckett, J.V. and Afton, B. (1997) Agricultural Rent in England, 1690–1914. Cambridge: Cambridge University Press. Uphoff, N. (ed.) (2002) Agroecological Innovations: Increasing Food Production with Participatory Development. London: Earthscan. World Commission on Environment and Development (1987) Our Common Future. Oxford: Oxford University Press. Wrigley, E.A. and Schofield, R.S. (1981) The Population History of England, 1541–1871. London: Edward Arnold. Yelling, J.A. (1977) Common Field and Enclosure in England 1450–1850. London: Macmillan. Young, A. (1771) The Farmer’s Kalendar. London: Robinson and Roberts.
Agricultural Sustainability and Open-Field Farming in England 257
Archives consulted Bedfordshire Archives Office BO/1326 Agreement regarding commons in Billington, Leighton Buzzard, 1772. BO/1334 Field orders for Heath and Reach, Leighton Buzzard, 1814. Leicestershire Archives Office DE 40/46/3. Field regulations at Mountsorrel, 1734–1776. DE 66/2532. Articles for pasturing at Gilmorton, 1722. DE 339/340. From a survey of the Witherley Estate, Hallaton, 1707 and 1714. DE 390/56. Field Regulations at Ibstock, 1696. DE 783/78. Bye-laws of the manor, Gilmorton, 1776. DE 798/1. Court Leet Book, Sheppy Magna, 1755–1867. DE 2960. From a survey of the open fields at Lubenham, 1734. DG 8/24. Reduction of the stints at Castle Donnington, 1737. Lincolnshire Archives Office Misc Dep 199/1. Field Reeves book at Withern with Woodthorpe, 1791–1808. Northamptonshire Archives Office FS70/1. Open field orders at Cosgrove, 1686. G3883. Commentaries on land use at Grafton, 1723–1730. L16. The open-field system at Scaldwell, 1653. TLB/84. Stinting agreement at Little Bowden, 1718. YZ 7849. Annual field orders at Cosgrove, 1715–1716 Nottingham University Manuscripts Department MaB 244/15, 16/11. The Manvers Collection.
12
Farmers’ Extension Practice and Technology Adaptation: Agricultural Revolution in 17th–19th-Century Britain1 Jules Pretty
Introduction In the late 20th century agriculture faces enormous challenges. Production in industrial and green revolution agriculture is now close to or above levels that can be sustained by the natural resource base. Yet the demand for food and non-food products will grow as populations expand, so further increasing the pressure on natural resources. Agriculture expands into hitherto uncultivated forests, grasslands and wetlands; degrades on-farm resources through erosive and environmentally damaging practices; and transfers some of the costs of production off the farm to other sectors of the environment and economy (Barbier, 1989; Pretty, 1990a; Conway and Pretty, 1991). The prospects would appear to be bleak. The growing food requirements will have to be met, at least in part, through improvements to agriculture in the resource-poor regions of the world. But farming households in these regions have poor access to external resources in the form of credit and nutrient and pest control inputs, are poorly served by rural roads and other infrastructure, and are rarely adequately supported by research and extension services. Where extension does reach them, the approach has been to attempt the transfer of technologies proven to work on research stations rather than on farmers’ fields. New technologies rarely spread beyond the large farmers, and the aggregate impact remains small (Mullen, 1989; Russell et al, 1989; Pretty, 1990b). However, in recent years increasing numbers of agricultural development schemes or projects have demonstrated that agricultural production can be improved in resource-poor regions through the adoption of technologies that maximize the use Reprinted from Agriculture and Human Values, VIII, 1991, pp132–148, Farmer’s extension practice and technology adaptation: Agricultural revolution in 17th–19th century Britain, Pretty J. with kind permission from Springer Science and Bussiness Media.
Technology Adaptation: Agricultural Revolution in 17th–19th-Century Britain 259
of on farm resources provided that farming households themselves are fully involved in the generation of technologies, in their extension to other farmers, and in the experimental adaptation to local conditions (Jintrawet et al, 1985; Farrington and Martin, 1987; Chambers et al, 1989; Fujisaka, 1989; Bunch, 1990; Pretty, 1990b). In many locations, small revolutions in institutional support and farming practice are occurring. Returns to investment are rapid; the poor become better off and more secure; the region produces surpluses; and the country as a whole benefits.
Components of a revolution Such a technical and biological revolution also occurred in rural Britain during the 17th to 19th centuries. During a period in which there was no government ministry of agriculture, no national agricultural research or extension institutions, no radio or television, no pesticides or inorganic fertilizers, and poor rural transport infrastructure, aggregate cereal and livestock production increased to unprecedented levels. In the 150 years after 1700, wheat production grew four fold, and barley and oats three fold; the numbers of cattle supplied to markets tripled and sheep doubled (Chartres, 1985; Holderness, 1989; Mingay, 1989; Beckett, 1990). This remarkable achievement was brought about in two ways: the extension, largely by farmers, of new technologies that intensified on-farm resource use; and the promotion of extensification by the conversion of common pastures and woodlands to private farming. New crops offered diversified opportunities to farmers by allowing intensified use of land. Increased fodder supply meant more livestock and so increased supply of manures improved soil fertility. Selective breeding of livestock produced more efficient converters of feed to meat, so permitting slaughter at an earlier age and higher stocking rates. New labour-saving machinery released farmers from the labour-bottlenecks at cereal and hay harvests; and new tools and techniques improved the efficiency of seed sowing. Underfield drainage increased cropping options on marginal land; and irrigation of watermeadows increased the supply of fodder, particularly during the late winter shortage. Complementarities with urban and industrial growth – the British population tripled between 1700 and 1850 – also meant increased soil fertility as agriculture assimilated industrial and human wastes. Coupled with this intensification were the dual enclosing processes of openfield conversion to private farming, and the enclosure of common property natural resources to produce more private farm land. Whether the former had an impact upon agricultural output is controversial; the latter, through the passing of more than 3500 Bills in Parliament, increased aggregate output as more than 650,000 hectares of woods, pastures, marshes and fens between 1730 and 1820 were enclosed (Jones, 1967). Both intensification and extensification resulted in a net benefit to the economy through growth in agricultural production – both yields per hectare and area under cereals roughly doubled between 1700 and 1850 (Turner, 1982, 1984; Overton, 1984a; Allen and O’Grada, 1988; Holderness, 1989; Beckett, 1990). But the costs attendant upon the two strategies differed. Intensification mostly used on-farm resources, absorbed industrial wastes, and did
260 Agricultural Revolutions and Change
not damage the environment; extensification harmed the livelihoods of poor households by removing their rights and access to the common property resources on which they so heavily relied.
Views of innovation and adoption Until the last two decades, orthodoxy has held that the British agricultural revolution began about 1760 and ended in the early 1800s (Ernle, 1912). Credit for progress was given to a few, now famous, innovators: Tull for his corn drill, Townshend for turnips, Coke for the Norfolk Four Course rotation, Bakewell for livestock breeding, and Young for promoting all of these. The conventional view is that, once exposed to these innovations, the majority of farmers adopted them and the revolution occurred. However, claims for innovation rapidly driving production growth have not survived scrutiny. Some have suggested that all improvements began by the 1580s, spread rapidly in the 1600s, and were completed by 1767 (Kerridge, 1967); whilst others suspect there was no major discontinuity, and that gradual change occurred throughout a period beginning at about 1600 and lasting to the 1840s, when further rapid change occurred as a result of increased use of external inputs (Overton 1984b; Thirsk, 1987). What is now clear is that Tull, Townshend, Coke, Bakewell and Young were simply good popularizers rather than innovators. All ‘their’ innovations were being practised by some farmers 50–100 years before they were born (Table 12.1). The lasting fascination for ‘inventors’ has diverted attention away from the process of diffusion and adoption, and it remains to this day a heresy to many agricultural scientists to suggest that farmers have much to say in the process of technology generation, diffusion and adaptation (see Rhoades, 1989). Yet in the British agricultural revolution they were centrally involved in all three. Farmers made diffusion active rather Table 12.1 The first known dates of innovative technologies and techniques and the later popularizers associated with them Innovation
First known
Popularizers and their lifespan
Seed Drill
1600
Jethro Tull (1674–1741)
Turnips
Late 1500s
Charles ‘Turnip’ Townsend (1674–1738); Arthur Young (1741–1820)
Artifical ‘Grasses’ (including 1620–1640 clovers, sainfoin, trefoil, lucerne, rye grass, rib grass, etc.)
Thomas Coke (1754–1842); Townshend; Young
Norfolk Four Course Rotation
late 1600s
Coke; Young
Selective Breeding of Livestock
late 1600s–1700s
Robert Bakewell (1725–1795)
Irrigated Watermeadows
late 1500s
Bakewell; Young
Sources: Bowie, 1987b; Donaldson, 1854; Gamier, 1896; Hartlib, 1646; Jones, 1967; Overton, 1985; Parker, 1975; Young, 1786
Technology Adaptation: Agricultural Revolution in 17th–19th-Century Britain 261
than passive through farmer-to-farmer extension mechanisms; and there is considerable evidence that technologies, once adopted, were the focus of experimentation so as to make the appropriate adaptations to suit local conditions.
Farmer-to-farmer Extension Farmers spread technical knowledge through rural tours and surveys, publications, farmers’ groups and societies, open days and informal training.
Farmer tours, visits and surveys The first systematic attempt to survey farming practice in Britain was undertaken by the Royal Society in 1664. In order to investigate ‘what is known and done already … and … what further improvements may be made in all the practice of husbandry’, a questionnaire of some 50 open-ended enquiries was circulated to farmers throughout Britain (Lennard, 1932; Thirsk, 1985). Only 11 replies survive, and these describe the various ploughs in use; the uses of different mixtures of lime, marl, seasand, seaweed and manures for different soils; the many varieties of cereals; the use of clover, and the preference of farmers for using ‘seed grown in a … soil … at least different from the nature of that ground where they intend to sow it’ (Lennard, 1932). A step forward from this academic exercise was for the principal investigators to make rural visits themselves. The 1700s were an age of global exploration and colonial expansion, and travel itself became a symbol of intellectual growth and moral discovery (Rogers, 1971). Travel became easier too, with improved roads, more comfortable coaches and improved supply of fresh horses at inns. However, even the fastest stagecoaches could travel at only 12–15km/hr, and the smaller parish roads were frequently impassable during winter and in wet conditions (de La Rochefoucauld, 1784; Addy, 1972). In the early part of the 1700s surveyors tended to focus on urban life, particularly the activities of the royal courts and aristocracy, but by the end of the century the focus had shifted to the countryside and to the method of surveying itself. Daniel Defoe toured Britain in the 1720s and wrote of the economic and social conditions he observed (Defoe, 1724). Despite his eye for detail, his focus was at regional rather than farm level and he commonly missed local diversity; parts of Suffolk, for example, were ‘applied chiefly to corn’ or ‘wholly employed in dairies’. In addition, his ‘Tour through the Whole Island’ was probably a compilation of visits made over many years – it lacks, for example, the detail about daily weather conditions that obsesses later tourers. In contrast, Samuel Johnson studied ‘rural salt processing industries whilst his contemporaries studied castles’ (Curley, 1976). Johnson insisted that to know life well, he had to see it first hand, regarding travel as essential ‘to test the principles had from books’ and to
262 Agricultural Revolutions and Change
regulate ‘the imagination by reality, and instead of thinking how things may be, to see them as they are’. Johnson toured Scotland with James Boswell in 1773, Wales in 1774 and made many other short tours that covered most of England (Johnson, 1775; Boswell, 1785; Curley, 1976). But, despite their attention to reporting, neither Johnson nor Boswell were farmers. Farmers began to tour the country to observe and learn from other practitioners, and to record the practices and experiments they found. The principal objective of the rural investigation, as Arthur Young put it, was ‘to display to one part of the kingdom the practice of the other … and to draw forth … spirited examples of good husbandry from obscurity’ (Young, 1769). The most renowned touring farmers were Young and William Cobbett. Young toured first as an individual interested in the activities of other farmers, and later as an official of the Board of Agriculture. Cobbett began his ‘Rural Rides’ the year after Young died. Both established durable reputations on the basis of the knowledge gathered on these tours. But they were not alone as touring farmers: the well documented include Robert Bakewell who toured for 2–3 months every year (Pawson, 1957); George Cully, who also often noted in his letters that his neighbours were away on tour to observe agricultural practice (Culley, 1790; MacDonald, 1977); Boys and Ellman, two Kentish farmers, who travelled 1100km in 27 days in eastern England observing livestock management and cropping practice (Boys and Ellman, 1793); the de La Rochefoucauld brothers who made short tours in Suffolk and Norfolk and longer ones in the Midlands and North (Scarfe, 1988), and Richardson, Redhead and Laing who toured Scotland and western England studying sheep (Richardson, 1793; Redhead and Laing, 1793). As tours became more common attention turned to the approach used for touring, so as to improve learning. Tourers were sensitive to local conditions and the farmers themselves and cautious over claiming too much from their findings. Though Young travelled some 9700km in his first three tours, his concern over possible sampling biases made him cautious about the representativeness of his findings (Young, 1768, 1769, 1771). One condition of reading his reports was that the reader ‘pardon the incorrectness of hasty letters; written from inns, farmhouses and cottages, with accuracy in nothing but the matter of my inquiries … You must not expect the authority of such a journey as mine to be equivalent to a general and comprehensive view of the whole island’ (Young, 1769). However, Young has been criticized for adopting conversational methods of research (Kerridge, in Overton, 1984a) and relying on ‘mere opinion of the prejudiced’ and the ‘bare assertions of guarded, or perchance designing men’ (Marshall, 1808, quoted in Allen and O’Grada, 1988). William Marshall asserted that the tourer gained only a transient view of rural life, understanding ‘a few particulars of practice that may happen to be going on at the time of his tour’ (his emphasis) (Marshall, 1818). Tourers were ‘raw observers’ unless they had a depth of practical knowledge of the area to be surveyed. He believed it was best to live with a wellinformed farmer for at least a year, so as to ‘minutely observe the living practice which surrounds him [the farmer]’ (Marshall, 1818).
Technology Adaptation: Agricultural Revolution in 17th–19th-Century Britain 263
Young was, however, aware of the need to crosscheck by triangulating the information he gathered: ‘I met with some farmers who gave me accounts too improbable to credit … but always repeated my enquiries upon those occasions’ (Young, quoted in Allen and O’Grada, 1988). Young drew attention to the benefits of careful observation: ‘I have seen many men, who view the farms of other people, apparently for no other purpose than to seek opportunity of talking of their own … You walk through a whole farm with such people, without their acquiring one idea … I was once with a party viewing a farm. Two gentlemen … were so diffuse in describing their own farms and management that it was with the greatest difficulty that poor Reynolds (the farmer) could gain the least attention. When … they went, I requested to go back to a crop of his turnip-rooted cabbage, which we had passed without notice, owing to the volubility with which I was so ill entertained. Various particulars I then gained, highly deserving attention. I afterwards met one of those gentlemen in London, and could not but smile at finding that he was perfectly ignorant even of the existence of the plant in question, of which he might have … been informed of every circumstance of its culture if he would for a few minutes, have given attention to the objects before him’ (Young, 1793a). William Cobbett was also determined to find out the ‘real state’ of the countryside. Writing after his first day’s travel from London, his view of observations made from roads are clear. In spite of drizzling rain, he said: ‘It is true that I could have gone to Uphusband by travelling only about 66 miles, and in the space of about eight hours. But, my object was, not to see the inns and turnpike-roads, but to see the country; to see the farmers at home, and to see the labourers in the fields; and to do this you must go either on foot or on horseback’ (his emphases) (Cobbett, 1830). He travelled by horse along the lanes and paths, talking to people, stopping at cottages. He was aware that this behaviour was unconventional: ‘They think you are mad if you express your wish to avoid turnpike roads … I have crossed nearly the whole country from the northwest to the southeast, without going 500 yards on a turnpike road, and, as nearly as I could do it, in a straight line’ (Cobbett, 1830). Bad weather did not stop these tourers from talking to farmers and labourers in the field, who could not themselves stop work just because of the rain. On a wet day in August, Cobbett recorded that ‘I made not the least haste to get out of this rain. I stopped, here and there, as usual, and asked questions about the corn, the hops, and other things’ (Cobbett, 1830). Young was also more concerned with learning from farmers than with physical comfort. On the last day of a short tour of Norfolk, one of his two French colleagues recorded that ‘it rained so much that, to tell the truth, one could hardly think of agriculture’ (de La Rochefoucauld, 1784). But Young stopped at the farm of Mr Toosey, took ‘a hasty walk over his excellently cultivated farm’, and recorded four pages of detailed findings – in which the weather was mentioned not once (Young, 1784a).
264 Agricultural Revolutions and Change
Professional surveyors The professional surveyor also played an important role in the extension of new technologies. They were farmers employed periodically by landlords to survey tenants’ farms in order to establish the conditions, or covenants, of the lease, calculate the financial equivalent of improvements made by tenants, and suggest appropriate rents. The method of surveying was ‘to view every piece of the land contained in each farm’ and record in detail all aspects of farming and land management (Sayer, 1747; Peak, 1799). Sometimes tenants were found to be in breach of covenants: Arthur Biddell recorded in the 1820s that the ‘cropping of field 11 of Mr. Fuller’s farm has been contrary to covenants and good husbandry’, and that ‘a large part of muck which remains on the farm should be laid on Field no 2’ (Biddell, 1828). A valuation by Mr Utton of the estates of Sir Philip Broke said one farm was capable of considerable improvement as ‘it lies extremely well for getting manure from Ipswich, but little or no advantage is taken of it’ (Utton, 1848). By also applying marl and chalk, and adopting the four course system more cereals, turnips and artificial grasses could be grown, and so more livestock kept: ‘Each farm could be greatly benefited by carrying more sheep.’ The landlord was recommended to make arrangements to pay back a sum equivalent to those improvements made but not yet benefited from, so giving each tenant every ‘inducement to … make all (the manures) he can’ (Utton, 1848). Sometimes these reports go further and recommend the tenant visit other farmers to observe the effect of their improvements. Another Suffolk surveyor, Mr Brolter, having recommended the use of clay, marl and ashes, also noted their use was common in the neighbourhood and that the farmer should look himself: ‘these improvements would impart financial benefits, besides it would add to the beauty of the prospects from the house’ (Brolter, 1790).
Books, magazines and newspapers The results of many of these surveys were published in books and journals, so giving farmers elsewhere the opportunity to learn of advances. Farmers also had access to agricultural information in newspapers, magazines and pamphlets. The period of the agricultural revolution saw a remarkable increase in these sources of information: in the period 1550–1600 about 2–10 new books concerning agriculture were published per decade; by 1700 this had grown to 20–50, and by 1800 to 150–400 (Donaldson, 1854; Perkins, 1932; Canney and Knott, 1970; Sullivan, 1983). The quality of writing changed too. Whereas in the 16th–17th centuries authors tended to offer maxims and advice (see for example, Tusser, 1557; Markham, 1631) or to be urban-based lawyers, merchants, court officials and academics (see Donaldson, 1854, passim), books came increasingly to be written by farmers and based upon first-hand observation and experience. The first author to record experiments was Adam Speed (1626), who discussed trials with clover, car-
Technology Adaptation: Agricultural Revolution in 17th–19th-Century Britain 265
rots, turnips and parsnips. In the 1640s Samuel Hartlib published the correspondence of farmers, recording their experiments and improvements with green manuring, lucerne, turnips, flax and clover (Hartlib, 1646; Thirsk, 1985). A Mr Buckner was studying a hundred varieties of grass, the Earl of Southampton the impact of planting thousands of fruit trees in hedges, and a Mr Middleton the keeping of mulberry trees, silkworms and the weaving of silk. The detailed records were of individual improvers who were neither writers nor sometimes even literate. As Joan Thirsk has put it ‘at all times Hartlib was alert to recommend in his papers any names mentioned in his hearing of men and women who wrote nothing …, but were practical improvers’ (Thirsk, 1985). Some authors, such as Jethro Tull (1731), wrote to publicize their ‘inventions’, whilst others toured before they wrote: Edward Lisle (1757) visited farms in Wiltshire, Hampshire and Leicestershire to ask farmers and labourers questions on all aspects of farming practice, ‘how to burn lime, how to improve meadows, what plough was best. He stopped farmers at work in the fields, and asked them why they did certain things; he experimented at home with the early sprouting of barley and oats, and so on’ (Thirsk, 1985). Arthur Young published his first book in 1767. He was always comprehensive, documenting for example more than 500 experiments in the four volumes of the Farmers’ Tour of 1769. He was criticized by some contemporary agricultural writers for including details of both successful and unsuccessful experiments (see Gazley, 1973). He maintained, though, that his books were better because they were founded upon experiments and journeys, and was critical of books that had ‘only the inferior part of the experiments, that is the remarks and conclusions: so that we have only the author’s reflections, instead of that authority which enabled him to reflect; and from which we might draw very different conclusions. Hence arises the difference … the experiment is truth itself, the author’s conclusions, matters of opinion, which we may either agree to, or reject, according to our private notions’ (Young, 1767). By the late 1700s standards were thus higher, the detail greater and books were treated more as basic references (Thirsk, 1985). Another contribution to extension was the introduction of journals devoted entirely to the views and practices of fanners. The Annals of Agriculture appeared in 1784 and continued for 45 volumes until 1815. Although about a quarter of the articles were written by Young himself, the content ranges from reports of experiments, minutes of tours, details of observations, recommendations for new practices, and general discussion on the state of British agriculture and the countryside. This journal was soon followed by other national journals and periodicals, including the Commercial and Agricultural Magazine in 1799, the Farmers Magazine in 1800, British Farmers’ Magazine in 1826, Journal of Agriculture in 1828, the Mark Lane Express in 1832, and the Journal of the Royal Agricultural Society of England in 1840 (Goddard, 1989). As the more practical and experiment-based style became increasingly popular, so farmers could more readily calculate whether an innovation might be relevant to their particular conditions. However, the number of farmers directly reached by these books and journals may not have been large. The circulation of Annals, for example, was of the order
266 Agricultural Revolutions and Change
of several hundred in the early days, rising later to a few thousand. The most successful book was Young’s Farmers’ Kalendar, which was issued in ten editions in his lifetime, the fifth selling out of 2000 copies within a few weeks of its issue in 1804 (Gazley, 1973). The best agricultural newspapers, though, had larger audiences, selling 4000–6000 issues weekly (Goddard, 1989). Local newspapers rarely covered innovations in detail, though the Newcastle Courant, for example, did record the release of ducks into turnip crops to control caterpillar pests, mint in haystacks to keep out mice, and intercropping radishes with turnips to reduce the impact of turnip fly, and carried advertisements for new machinery, new seeds and new drainage techniques (MacDonald, 1977).
Farmers’ groups Farmers’ groups that transferred knowledge by word of mouth or by direct observation were even better than the printed word. These were first established in the 1720s, growing more common over the next century. Some were small with a local focus, others larger and acting at a national level. Most held regular meetings and occasional shows and fairs, and sought to encourage innovation by offering prizes. But the turnover was considerable. Those that tended to succeed were established by groups of local farmers themselves, rather than imposed by outsiders, or had access to outside financial or patronage support. The earliest agricultural society in Europe was the Society of Improvers in the Knowledge of Agriculture in Scotland, established in 1723 (Ramsay, 1879; Handley, 1963). It distributed advice to members, such as on types of manures best suited to their soils, new crops and deep ploughing, but more importantly it encouraged each member to form small associations in their own districts for ‘the diffusion of better methods of farming’ (Handley, 1963). The East Lothian Society, for example, met monthly in a village inn, and grew to have 122 farmer members. The poet Allan Ramsay celebrated the vision of farmers’ clubs by suggesting that improvements would lead to such an increase in productivity that rents could be tripled, ‘without the purches of one acre more’ (Withers, 1989). But the society closed after 20 years when a key figure in its success, Mr Maxwell, died. In 1754 the Edinburgh Society for the Encouragement of Arts, Sciences, Manufactures and Agriculture was established to offer premiums, or prizes, for good practice. In 1756 Mr Walker won the prize for ‘the tenant who should produce the greatest variety of marls and other manures, with a short account of the places where they were found, and the uses to which they were applied’ (Ramsay, 1879). But it closed in the mid 1760s. Societies were most insecure following the ill health, departure or death of a leading figure. Two societies of national importance that did survive were the Society for the Encouragement of Arts, Manufactures and Commerce (later the Royal Society of Arts) and the Highland and Agriculture Society (HAS), established in 1754 and 1763 respectively. Both offered premiums for innovations, and took a systematic view of farming, in which the context of production and the circumstances of each
Technology Adaptation: Agricultural Revolution in 17th–19th-Century Britain 267
farmer were central. Thus in 1772 the former offered prizes to determine the value of carrots, cabbages, turnips and potatoes for fattening livestock. Prizes encouraged experimentation, though they did not always resolve an issue. On sowing lucerne by broadcast or by drilling, Young commented ‘as a sufficient number of experiments has not been published to prove which of these methods is most advantageous, the Society very judiciously leaves it to the cultivator’s private judgement’ (Young, 1767). The HAS may have been more effective in extension as it strongly promoted local associations. In Scotland 60 associations were established by members (Handley, 1963). Some were at village level: the Lunen & Vinney Farming Society of Dunnichen village was established by George Dempster, membership rose to 80, and the society brought yellow turnips and drilling of wheat to their locality. The final meeting was held in 1814, when Dempster was 80 years of age. The HAS itself survived because of the patronage of Sir John Sinclair, chairman of the Board of Agriculture, who gave them an annual grant of £800 per year, so helping them obtain a Royal Charter. Local societies also grew rapidly in England. First were the Manchester, Norfolk, Bath & West and Sussex in the 1760s and 1770s, but by 1820 the total had grown to 50, and by 1840 to more than 400 (Goddard, 1989). The principal interest was again the award of prizes, usually at local shows and typically for new and/or high quality livestock, crops and machines. The Bath & West was particularly innovative, purchasing land to set up on-farm trials for new practices. During the 1830s Farmers’ Clubs became popular in the promotion of improvements and diffusion of information (Fitzgerald, 1968; Goddard, 1989). These clubs held regular discussion meetings, established libraries and arranged visits to wellknown farms. The establishment of the Royal Agricultural Society of England (RASE) in 1838 marked the end of this agricultural revolution in internal resource use. As I shall discuss below, this society signalled the end of an era in which farmers’ knowledge was accepted as best. From the 1840s, scientists off the farm gradually displaced farmers as technology generators, diffusers and experimenters.
Open days and fairs Farmer groups also held occasional open days to publicize new farming practices and breeds of livestock. The most well-known meetings of this period were the ‘sheep shearings’ of the Duke of Bedford and Thomas Coke, at which there were often several hundred people present (Young, 1799, 1803, 1808). Of the 1799 open day at Bedford’s Woburn farm, Young said ‘it was the greatest meeting of the kind ever seen in England … A great assemblage of farmers, breeders and graziers from every part of the kingdom … in which the conversation was entirely agricultural’ (Young, 1799). The open days at Coke’s farm at Holkham ran annually between 1778 and 1821. Prizes were awarded for the best agricultural implements and livestock, information was exchanged on cultivation techniques and the performance of new crops, and ploughing matches were held. Farmers were also able
268 Agricultural Revolutions and Change
to observe the practices on the estate, renowned for its rotation system that could feed 1500 sheep with no resort to permanent pastures or meadows.
Agricultural training In a period that lacked formal agricultural training as well as extension institutions, farmers developed their own informal training networks. It was common, for example, for farmers to send their sons in their late teens or early twenties to spend a year in a progressive region (MacDonald, 1977). George Culley, an improving farmer and stockbreeder, frequently housed 8–10 students, and indicated in his letters that his neighbours did likewise (MacDonald, 1977). In some cases farm workers travelled to learn a specific technique – the first watermeadows in Northumberland were constructed on Culley’s farm in the 1780s following a visit by one of his workers to George Boswell’s farm in Dorset (MacDonald, 1977). Others learnt on the farm: a ploughman at Kelso who learnt how to drill turnips from his employer, who had himself spent 6 years in southern England, then spent 13 years as both ploughman and instructor of apprentices. When he leased his own farm he had an even greater impact on diffusion ‘as a farmer paying rent, and acting at his own risk, had an immediate influence, as to the … rapid diffusion of turnip … husbandry among practical farmers’ (MacDonald, 1977).
A government extension agency Government agricultural policy was so dominated by promoting enclosure that little attention was paid to supporting farmer extension mechanisms. The Board of Agriculture, established in 1794, was charged with ‘making every essential inquiry into the agricultural state, and the means of promoting the internal improvement’ (Young, 1804), but despite Young being Secretary, it was underfunded and had too little support from government. It commissioned surveys for each county, but the surveyors were not necessarily farmers, and the results were patchy. Some were short and poorly written – only 38- and 34-page reports were produced for Shropshire and Rutland (Bishton, 1794; Crutchley, 1794), whilst others were much more comprehensive – 286 pages for Norfolk and 168 pages for Staffordshire (Kent, 1794; Pitt, 1794). New surveys were commissioned, but financial support to the surveyors and for publication was again inadequate. The Board closed in 1822, having succeeded only in sponsoring premiums and lectures, publishing articles and influencing government policy on taxes, weights and measures (Goddard, 1989).
Technology Adaptation: Agricultural Revolution in 17th–19th-Century Britain 269
Technology Adaptation These extension mechanisms brought new knowledge to many more farmers. Yet knowledge of an innovation does not imply adoption. Farmers, once exposed to an innovation, still had to decide whether to adopt according to locally perceived incentives and constraints.
Incentives to adopt The overriding incentives to adopt a new technology relate to the investment required and the perceived rate of return. An innovation requiring no new training or capital investment and bringing returns in the same season would be favoured over one that was costly, risky and producing benefits far in the future. Bringing quick returns for low investment were fodder crops, intensified rotation patterns and manures; livestock breeding was not costly, yet it could take time to produce the desired animal; but new machinery, drainage and irrigation required much greater investment. Changes in prices could affect these perceptions. The increase in value of livestock products relative to cereals in the early 18th century favoured diversification, so increasing fodder and manure production (Beckett, 1990). Greater diversity on the farm also meant lower risk of complete harvest failure. But to adopt new technologies farmers required some security of tenure. Tenant right guaranteed them financial returns for the unexhausted improvements they made, but was only common in southeast and midland England. Thomas Moses, an improving and experimenting farmer of the 1820s–1840s in Lincolnshire, farmed on an annual lease with no covenants, except that he farmed ‘in a tenant-like manner’ (Beastall, 1978). To ensure he would receive full compensation on quitting the lease he recorded details of all improvements – repairs to farm buildings, stables, fences, ditches and roads; the purchases of ploughs and harrows; the planting of trees; and the establishment of a kitchen garden. Short leases, although a disincentive to invest when there was no tenant right, could easily be changed to account for new technological opportunities. There was also a gradual change toward granting of long leases – Coke granted them for 7, 14 and 21 years so as to encourage investment. As James Caird, a later tourer, put it in 1852, ‘the investment of a tenant’s capital in land seldom contemplates an immediate return. He does not anticipate that a large expenditure in cleaning and enriching worn-out land will be all repaid to him in the first crop. He lays the foundation for a series of good crops, which in the aggregate he expects to repay him with interest If he drains, makes fences, or other improvements of a more permanent character, a still longer period is requisite to compensate him’ (Caird, 1852). It has been long assumed that the conversion of open fields to private property farming was in itself an added incentive to adoption of new technologies – potential improvers could not fight the inflexibility of collective decisions that stuck to
270 Agricultural Revolutions and Change
tradition. But open fields did not necessarily prevent innovations, nor enclosure encourage them (see Havinden, 1961; Turner, 1986). Enclosure was not a direct incentive to improve, though it did allow for the rewriting of leases and raising of rents (Beckett, 1990). There remains widespread disagreement over whether productive gains occurred following enclosure – some have suggested output gains of 50–100 per cent (Wordie, 1983), others a modest 10–15 per cent (McCloskey, 1975), and others still that enclosed farms were no better than open (Allen and O’Grada, 1988).
Constraints to nationwide adoption As I have described, there were commonly delays of 100–200 years between invention and widespread adoption. Technologies became common in restricted localities, but did not spread. Yet as rural Britain was so diverse such widespread coverage should not be expected. Kerridge and Thirsk have suggested there were 38 to 48 distinct farming zones in England and Wales, comprising mixtures of subsistence and market-oriented, pastoral, arable, dairying, special livestock enterprises, market gardening, meat rearing, woodland and pasture (Thirsk, 1987; Kerridge, 1967). Before passing from one zone to another technologies required widespread testing and adaptation. As Joan Thirsk put it ‘new agricultural crops and methods could not find their niche within varied farming systems without undergoing a long process of trial and error that could involve many delays and setbacks’ (Thirsk, 1987). But within zones diffusion could be slow if the improvement was costly or risky – after Culley established watermeadows on his farm it took ‘near 20 years before any other person ventured to pursue the practice, and profit by the example. It is now beginning to spread in the neighborhood’ (Bailey and Culley, 1805). If agricultural labourers were against change, their unwillingness could put an end to innovation. This was particularly true for ploughs, drills or threshing machines that reduced or changed the labour requirement of workers who had spent years developing skills (Collins, 1969). New ploughs sent by Sir John Delaval to his estate did not meet with his ploughman’s approval, who suggested the wood was twisted or green (MacDonald, 1977). But given the opportunity of observing the advantages of a new technology, adoption could be rapid. Reapers in Berwickshire in 1790 quickly adopted the scythe as a alternative to the sickle when they were outpaced by imported labourers (MacDonald, 1977). Not all innovations succeeded in eventually being adopted nationwide. Dye crops, such as madder and woad, were experimented with in the 1600s, but did not spread as they represented too great a financial risk; tobacco was cultivated despite a government ban that aimed to encourage cultivation in Virginia, but it too died out, probably because it was too labour-intensive; liquorice was common around Pontefract and Worksop, but did not spread (Thirsk, 1985). The intervention by government in tobacco cultivation was rare – generally it neither directly supported nor hindered the adoption of new technologies.
Technology Adaptation: Agricultural Revolution in 17th–19th-Century Britain 271
Attitudes to experimentation There is considerable evidence to indicate that farmers, once they adopted one of these new technologies, experimented to make the changes necessary for its adaptation to local conditions. They conducted field trials to test the efficacy of various manure and nutrient treatments on soils; they tested corn drills against other methods of seed sowing; they introduced new crops into rotations on some fields, whilst leaving others unchanged; they tested irrigated against dryland meadows; and they tested new methods of pest control. As Caird put it ‘the detail is everywhere varied by the judicious agriculturalist to suit the necessities and advantages of the particular locality’ (Caird, 1852). Farmers were concerned with integrating the results of experiments into their farm economies, and so analysed results to discover which were the most profitable options. To many, experiments were seen as a necessary part of farming. They did not expect to resolve issues once and for all, but rather saw them as part of an adaptive performance in the face of unpredictable climatic and market conditions (see Richards, 1989). Many experiments were conducted first in kitchen gardens where they could be protected and monitored, and if successful then spread to the rest of the farm. In the 1780s a farmer discovered a single very productive ear of wheat in a hedge; he carefully cultivated it for four years in his garden, and by the mid-1790s this variety of ‘Hedge Wheat’ was said to be ‘widespread and superior’ (Goldhawk, 1795). The success of kitchen gardens as sites for experimentation was clear during the 1600s as commercial gardening grew rapidly to supply new vegetable and fruit crops to cities. London became surrounded by market gardens – their area growing from 4000 to 45,000 hectares between 1660 and 1720 (Thick, 1985). Innovative technologies and techniques were pioneered in gardens, such as row cropping of carrots, beans and peas to facilitate hoeing of weeds; new flower, fruit and tree crops brought from abroad; hot beds of still decomposing manure and compost put into long beds one metre high and broad for the cultivation of radishes, mushrooms, cucumber and asparagus; and the use of glass cloches to extend the growing season (Thick, 1985). The practice of continuous experimentation was widespread, and the people who knew best how to conduct them were the farmers themselves. Farmer knowledge was recognized by de La Rochefoucauld on his visit to Suffolk: ‘the knowledge which all these farmers possess is incredible – you must see them to realize how simple farmers can talk for an hour on the principles of their calling and on the reasons underlying their various forms of cultivation’ (de La Rochefoucauld, 1784). Young said that ‘experiment is the rational foundation of all useful knowledge: let everything be tried’ (Young, 1767). He published Experimental Agriculture in 1770, comprising some 900 pages of detailed results of five years of experiments on 120 hectares of various soils. He had begun confidently expecting conclusive answers, but concluded the task in a different mood: ‘I entered upon the following experiments with an ardent hope of reducing every doubtful point to certainty; and I finished them with the chagrin of but poorly answering my own
272 Agricultural Revolutions and Change
expectations. Where I imagined 2 or 3 trials would have proved decisive, 40 have been conducted in vain’ (Young, 1770). Bakewell’s approach to experiment was openminded: ‘I would recommend to you and others who have done me the credit of adopting my opinions to pursue it with unremitting zeal as far as shall be consistent with prudence and common sense, always open to conviction when anything better is advanced’ (Bakewell, 1787, in Pawson, 1957). And Culley, in a letter in 1801, wrote ‘I often say that we have a deal to learn yet. And every wise humble man will learn every year and every day’ (MacDonald, 1977). And yet these considered comments of farmers seem to have been very largely forgotten since the end of the agricultural revolution. They conflict with the predominant view of the agricultural experiment, namely that it is the domain of scientists and takes place solely on the research station or in the university. Orthodoxy holds that scientific agriculture began with the establishment of the RASE in 1838 and Rothamsted Experimental Station in 1843. These have brought immense benefits to agriculture, but have also served to hide the experimental practices of farmers. The result is now a deeply held belief that the first scientific experiments occurred only after the 1840s. A recent history of agricultural science in Britain begins at 1840 (Rossiter, 1975); and two earlier books by E. John Russell, a former director at Rothamsted, suggest that the ‘first experiments’ began in earnest at Rothamsted, before which any experiments were conducted by academics working alone. In neither of his books is the role of farmers mentioned (Russell, 1946, 1966).
Experiments to improve soil fertility Experiments to improve and sustain soil fertility promised quick returns for relatively little investment, and farmers made use of both internal and external resources (Table 12.2). Some had been common for centuries – livestock manures, marling, leaf mould and lime certainly had long been crucial in maintaining soil fertility and physical structure (Pretty, 1990c). Some experiments were designed to test various treatments over time on the same field. Having grown nitrogen-fixing tares (vetch) before wheat and producing ‘excellent crops’ as a result, the Rev. Moseley of Drinkston felt that something further could be done in the three months between the vetch harvest and wheat sowing in order ‘not only to keep the land clean, but to improve the succeeding crop’ (Moseley, in Young, 1813a). He planted buckwheat (Fagopyrum esculentum) and ploughed it in as a green manure. The wheat benefitted, but as it was attacked by rodents on the threshing floor, he conducted the experiment again the following year. This time he harvested 3.3 tonnes from 2.4 hectares, a ‘much larger crop than I expected’. Young commented that ‘many have sown tares; and many have ploughed in buckwheat; and most have given a year to each; but it is the combination of the two that forms the merit … Mr Moseley in this husbandry is original’ (Young, 1813a). Other experiments were designed to compare the relative value of different treatments on the same field. In 1818, Arthur Biddell, a tenant farmer at Playford
Technology Adaptation: Agricultural Revolution in 17th–19th-Century Britain 273 Table 12.2 Technologies for sustaining, restoring or improving soil fertility used during the agricultural revolution From within village community • • • • • • • • • • • • • • • •
Livestock manure Green manure crops Seaweed, ploughed in green Nitrogen-fixing crops Compost heaps of weeds, rushes, bracken, old thatch Fish such as pre-rotted sticklebacks, pilchards, sprats Ashes Peat and turves Pond mud Soot Old clothing and footwear Leaf mould from woodlands Sand Pigeons’ dung Fruit pulp Sawdust
From outside village community • • • • •
Night soil from cities and towns Other refuse from cities and towns Industrial wastes, including pulverized slags, soap, ashes, waste bark from tanneries, shoddy from textile factories Oil cake (from crushed seed of coleseed) Bone meal
Sources: Mingay, 1977; Kerridge, 1967
in Suffolk, described an experiment on a wheat field divided into six small plots (Biddell, 1817–21). The plots were treated with 2lbs of salt, 1 bushel wood ashes, 1 bushel fine cinders, ammonia tar water and tar, and soap boiler’s ashes, with a sixth control having no manure. Unfortunately there is no record of which treatment performed best, though he did record in another memo that all cereal harvested from experimental plots was taken to separate threshing sites so that yields could be measured and compared. In 1823 he described a complex experiment involving treatments for barley cultivation according to sowing method, manure type and freshness of the manure (Biddell, 1821–24). The treatment for each of the 13 sections of the field varied according to sowing technique (drilling or dibbling), manure freshness (straight from the stable door or exposed for a month), manure type (horse manure, sprats), and order of treatment (manuring first or sowing first). He indicated the ‘best corn after the 70 bushels of sprats’. Figure 12.1 is a reproduction of another experiment to compare manuring with ashes, livestock manures and green manuring. Some farmers experimented in order gradually to improve patchy quality fields. Thomas Moses’s experimental approach on his Lincolnshire farm produced
274 Agricultural Revolutions and Change
Source: Arthur Biddell. Day Book No. 2. 1817–1821. ESCRO HA2/A3/2
Figure 12.1 Experimental layout for wheat treated with ashes, livestock manure or composted green tares (vetch) grown on the four-hectare Holly Bush field on the farm of Arthur Biddell at Playford, Suffolk, 1819. Reproduced from Day Book No. 2.
the best yields of cereals and turnips in the region having begun with some of the ‘poorest pieces in the lordship’ (Beastall, 1978). One field of 16 hectares was renowned for its heterogeneous soils – yields were generally poor, but varied widely across the field. He began by applying bones, ash, lime and manures in 1829, and then grazing it for two years; it was then partly underdrained and partly marled; by 1839 a good oat and wheat crop was recorded. In 1840 more marling, manuring and bones produced ‘excellent turnips’, the next year excellent barley and oats too. In 1843 the remainder of the field was underdrained and further marled. In 1845 the consistency of crops was now the same across the whole field, and in 1846 barley yielded at 3.5 tonnes/hectare.
Experiments with rotation patterns Intensification advanced significantly with the introduction of root crops, including turnips, carrots, potatoes and swedes, and true and ‘artificial’ grass mixes, which included some 5–10 new grass species, nitrogen-fixing clovers, trefoils and
Technology Adaptation: Agricultural Revolution in 17th–19th-Century Britain 275
sainfoin and burnet and rib grass.2 The Norfolk Four Course rotation has become a classic model of intensification in the agricultural revolution. The introduction of roots and clovers permitted a change from spring cereal–winter cereal fallow to spring cereal–clover–winter cereal–root crops. Thus the proportion of land devoted to cereals declines from 66 per cent to 50 per cent, but for fodder crops it increases from zero to 50 per cent. But this idealized pattern was rarely adopted without some local experimentation and adaptation. On his 75-hectare farm Biddell continually changed the pattern to suit his needs. Sometimes it closely reflected the Four Course, as in Holly Bush field between 1807–17, but then an extra wheat crop is slipped in after beans in 1810 (Table 12.3). On Paddock field by comparison, wheat is grown in five out of seven years between 1807–13. In the second period the pattern is more varied, as an increasing number of crops are tested. In all he grew 28 different species of crops, with a maximum of 14 in any year. Of the introductions coleseed, flax, lucerne, sainfoin, hemp, wurzel, white and Swedish turnip, and Gold of Pleasure were grown for less than 3 years, and appear to have been rejected as unsuitable; whilst carrot, potato, tares, trefoil, red clover, radish, beetroot, rye grass, swede and mustard were absorbed into the rotation pattern (Biddell, no date). But despite this experimentation he did not greatly vary the proportion of land devoted to each of four classes of crop, namely cereals, roots, legumes and grasses plus miscellaneous vegetable and fibre crops. This impression of local adaptation is further strengthened by the rotation patterns recorded elsewhere in Suffolk – in the County Report Young records 24 different variations in the Four Course rotation (Young, 1813a). Nonetheless, not all farmers were experimental. Two neighbours of Biddell’s followed unvarying patterns: one rotated wheat-ley-barley-clover or beans, with an equal proportion of each crop on his 15 fields; and another kept to an unchanging Four Course pattern involving winter wheat–ley–spring cereal–legume, only very occasionally inserting a crop of peas or rye (Cooper, 1827; Pettite, 1830). Not only did farmers experiment with the type of crops grown, they also carefully analysed profitability. Coke relied solely upon roots and artificial grasses to feed his sheep. Already convinced of the benefit of sainfoin, and wanting a replacement for red clover, he set aside a 12-hectare piece of land in the middle of a large clover and rye grass field to experiment with trefoil, white clover, cow grass, rib grass and burnet. In the first year Coke observed that the sheep voluntarily fed on the new crops. The first two trials were successful and by the third year he had extended the experiment to 90 hectares. Having observed the experiment Young said ‘this is in truth doing justice to the new husbandry, by practising it with a spirit formed to establish it on the unerring dictates of experience’ (Young, 1784a). There were other experiments too. Bakewell repeated for several years an experiment to determine both the best fodder crop and method of harvesting. He sowed five strips in one field with rye grass, red clover, white clover, red/white clover mix and red clover/rye grass mix, and then overlaid these by mowing or grazing by cattle or sheep – the most productive treatment was mowing the red clover/rye grass mix (Pawson, 1957). And Young himself kept permanent experimental grounds
276 Agricultural Revolutions and Change Table 12.3 A Sample of crop rotation patterns on five fields of the farm of Arthur Biddell, Playford, Suffolk for the periods 1807–1817 and 1840–1850 Years 1807 1808 1809 1810 1811 1812 1813 1814 1815 1816 1817
Holly Bush Tu B Cl W Tu B WCl W Be W T
Lollys W Tu B Ta W T B Cl W Be W
Fields Paddock W W w Be W Cl W Ley Cs W Tu/H
1840 1841 1841 1843 1844 1845 1846 1847 1848 1849 1850
W Tu B Ta/Car W Bt B GP W Tu B
Ley W Tu B RCl Rg Tu B Be W Tu
Tf/Tu B WCl W Bt/Car W Tf W Ta Mus W
Key: W = wheat B = barley Be = beans Cl = clover WCl = white clover Luc = lucerne Bt = beet Tf = trefoil Car = carrot
Thistley Be W Tu B Cl W Be W Tu B WC1
Church Field W B Lu/Ta B/Be O Cl W Pot/B W Lu/Be W
W Bt/Pot B Be W Tu B RCl W Tu B
Be W Tf/Tu W RC1 W Bt W Mus W Tu
Cs = coleseed Mus = mustard GP = gold of pleasure (camelina) RCl = red clover Tu = turnips Ta = tares Rg = rye grass Ley = summer ley H = hemp
Source: Biddell, no date. ESCRO HA2B3-4/1
on his farm. As the two touring farmers, Boys and Ellman, recorded in 1793, ‘in Mr Young’s experimental ground are several patches of about a perch each, of many sorts of grasses, amongst which the meadow fescue and Alopecurus pratensis seem the best; timothy tolerably good; peas bad; Avena elatior very strong but coarse’ (Boys and Ellman, 1793).
Technology Adaptation: Agricultural Revolution in 17th–19th-Century Britain 277
It is rather surprising that given all this evidence of experiments with new crops there is relatively little on mixed or multiple cropping. The practice was certainly common in the Middle Ages, with cereals grown together with other cereals and/or legumes (Pretty, 1990c). Sometimes the mixtures were both more productive and less risky than the individual constituents of the mix. Yet limited evidence from early 18th-century probate inventories in Essex does indicate that about a third of all farmers chose to grow various mixes of barley, oats, peas and vetches (Steer, 1950). Farmers did swap seeds to maintain genetic diversity. In Suffolk it was common for farmers on light sandy soils near the coast to swap seed corn with those on heavier soils of central Suffolk, thus avoiding merchants, who were suspected of mixing of seed stocks in their stores (Evans, 1960). In 1821 Biddell planted one field to wheat in four strips, the first with wheat from a Mr Fuller, then a Scotch variety from Mr Elys, the next to a North Country variety, and the last to ‘wheat of my own growth’ (Biddell, 1821–24). Later, in 1823, the wheat grown is his own, Scotch wheat from Mr Branson of Stromland, Kentish Red wheat from Mr Catlins of Battley Abbey, and another red variety from Mr Dicksons of Coddenham (Biddell, 1820–28).
Experiments with sowing techniques Farmers also experimented with methods of seed sowing by comparing broadcasting the seed by hand, dibbling by making holes in the soil into which the requisite number of seeds were dropped, and drilling with newly invented seed drills. The amount of seed and spacing are important because if too little seed is sown then available water, nutrient and light resources are not fully used, and so can be captured by weed plants; but if too much seed is sown the crop plants then compete against each other, and though the weeds are suppressed yields also decline. The seed drill offered efficient weed control by evenly spacing the plants and so reducing seed requirement – for cereals to 5–15 per cent and turnips to 5–10 per cent of that for broadcast or dibbling (Wilkes, 1981). The seed drill was invented in about 1600, and effective designs were patented by many farmers, including Bailey, Cooke, Tull, Young, Amos, Blaikie and Garrett (Wilkes, 1981). But technical shortcomings meant they diffused neither rapidly nor smoothly; there were problems with maintaining an even seed flow, balancing the strength of the machine against weight and the expense of production. Reports to the Board of Agriculture and in Annals of Agriculture suggest that drill husbandry was being widely experimented with at the end of the 18th century, but was only common in parts of Northumberland, Durham, Suffolk and Norfolk. There were still so few machines by the early 1800s that contract drillers became common – Suffolk farmers hired their drills with skilled labourers to farmers in Cumberland and Scotland (Wilkes, 1981). During the agricultural revolution drilling was continually tested against the other techniques, all of which were often practised side by side on the same farm.
278 Agricultural Revolutions and Change Table 12.4 Results of experiments conducted on the farms of Thomas Coke of Holkham and Rev. Dr Hinton of Northwold, Norfolk, 1790s Yield (kg/ha) Drilled
Broadcast
Wheat (at Northwold)
2995
2620
Barley (at Holkham)
2360
2500
Source: Young, 1804
In the County Report for Norfolk, Young records the seed-sowing practices of 44 farmers by name; of whom 21 just drilled, one just broadcast, two just dibbled, and 20 were experimenting with combinations of the three (Young, 1804). The results of experiments varied according to local conditions and crops: for some broadcast was better, whereas for others drilling was best (Table 12.4). Mr Overman of Burnham Deepdale conducted his first drilling experiments with peas in 1790; then in the next year he compared the three techniques; finding the drill to yield 25 per cent more he then drilled all his peas and tried wheat for the first time in the third year (Young, 1804, 1793b). But drilling of barley and oats was not so successful: he tried, stopped, and then tried again. Farmers also finely tuned each sowing technique. Biddell conducted an experiment to ascertain whether holes should be dibbled ‘thick and seeds dropped thin, or holes thin and seeds dropped thick’ (Biddell, 1812–16). As a diagram in his work book indicates more holes, each with fewer seeds, was the most productive treatment (Figure 12.2). And a Mr Harper ascertained the comparative benefits of the different sowing methods, including attendant weeding and other labour costs, by splitting a 4.5-hectare field into 8 strips, and conducting a different treatment for each (Figure 12.3).
Experiments with livestock breeding and management At the same time as these new crops, rotation patterns and methods of sowing were increasing the production of on-farm forage, farmers also experimented with livestock breeding to produce animals capable of more efficient conversion of feed. Robert Bakewell, though not the first selective breeder, was the first to apply precise methods to produce early maturing meat-producing animals that would transmit these properties to offspring with certainty (Pawson, 1957). He aimed to ‘fix the type’ by establishing in his mind a clear picture of the desired animal. By inbreeding, selective culling, careful analysis of food consumption, conversion rates and carcass properties, he developed new breeds of cattle, sheep, pigs and horses. Selecting one or two traits he was able to make great advances, getting beasts to put on weight ‘in roasting places, and not boiling places’ (Pawson, 1957). But there were trade-offs: his cattle had long horns, and the sheep produced little milk and wool.
Technology Adaptation: Agricultural Revolution in 17th–19th-Century Britain 279
Source: Arthur Biddell. Work Book No. 2. 1812–1816. ESCRO HA2/B2/1B
Figure 12.2 Experimental layout to ascertain whether wheat yields are better when ‘holes thick and seeds thin’ or vice versa. Part of Stock Hill Field, farm of Arthur Biddell at Playford, Suffolk, 1813. Previous crop was clover ley. Reproduced from Work Book No. 2.
Although his farm was 180 hectares in size and supported 400 sheep, 150 cattle and 60 horses, it was too small to obtain verifiable results for his breeding. He therefore adopted a system of hiring out the best quality males for a season to other farmers, thus transferring genetic material to another herd. To begin with he was ridiculed, and the first ram commanded fees of only 16 shillings in 1760. But the demand for his animals grew as word spread of their attributes, and by 1784 his best rams were fetching a fee of £105 per season. Bakewell could now study the performance of the progeny of these males in herds and flocks of different genetic mixes. But to ensure that the replications were comparable he set strict conditions on each lease to ensure that feeding was natural and not forced. The effect of this system was to spread and extend new stock, whilst allowing him to conduct and monitor experiments on a nationwide scale. But not all breeders were concerned solely with increased meat output. Sheep flock managers on the Wessex downs wanted economic feeding, mobile sheep that were good ‘manure carriers’ (Bowie, 1990). In this Hampshire Custom system of
280 Agricultural Revolutions and Change
Source: Mr Harper. 1806. Experiments in agriculture. Annals of Agriculture 44, 17–30
Figure 12.3 Experimental layout of a 4.5-hectare field by Mr Harper of Kirkdale, Lancaster, to study the impact of different sowing treatments of wheat on yields and net returns, 1805
management a rapid turnover of lambs was achieved through a system of internal resource maximization. Sheep travelled daily between pasture and arable fields, and were stocked at a rate of 1200 ewes and lambs per hectare at night. Early lambing in January–February based upon the early grass produced in watermeadows meant that fanners could market when prices were high. Rotations of sainfoin, leys, arable and fallow were locally adapted in an ‘infinite number of variations and permutations’ (Bowie, 1990). The sheep were shortwools, hardy and economic feeders, though not maximizers of meat. Flockmasters were continually experimenting with cross-breeding by bringing in rams from distant locations. William Humphrey, for example, hired Southdown rams from Cambridge, and produced large sheep with good flesh, and the strength and hardiness to consume root crops on cold hills (Bowie, 1987a). By comparison, sheep on the physically similar Wolds of Lincolnshire and East Yorkshire were relatively immobile longwools, yielding 3.5–5kg wool per fleece compared with 1.5–2.5kg for the shortwools (Bowie, 1990). Here farmers were oriented towards the rapidly developing northern markets, and relied heavily on external inputs and capital, buying bonemeal fertilizer in particular, and did not value sheep manures so highly. Formal experiments to compare different breeds were also common. The Duke of Bedford compared four groups of 20 Southdown, Leicester, Worcester and Wiltshire sheep over 16 months by feeding them the same amounts of turnips and hay and, assuming the same grass consumption, found the weight gain best in the
Technology Adaptation: Agricultural Revolution in 17th–19th-Century Britain 281
old breeds (Russell, 1986). Over a shorter period, Count Magzie of Silesia reported that sheep fed with potatoes over winter grew much better than those fed oats (Magzie, 1799). Russell has, however, suggested that the results of contemporary trials should be treated with caution, as design and execution varied widely (Russell, 1986).
Experiments with irrigation A significant innovation of the agricultural revolution that improved internal resource use was irrigation. Water was diverted from streams and rivers to irrigate meadows, so producing spring growth some 4–6 weeks ahead of dryland meadows, a reliable hay crop in July, and further growth during the late summer. Although costs for surveying, design and construction were relatively high, the returns to investment were good (Bowie, 1987b). The value of the ‘early bite’ was central to the production of early lambs, and particularly to small farmers for whom ‘even a small watermeadow which will produce an early crop of spring feed at the very time of the greatest pressure … must be more valuable to a poor arable farm than can be imagined’ (Smith, 1806, quoted in Bowie, 1987b). Winter cereal yields also improved, as livestock were no longer fed off young cereal plants at this time. Hay production from good watermeadows was roughly double that of dryland meadows (Bowie, 1987b). Bakewell experimented with irrigation to improve grass yields, constructing channels that eventually reached almost half of his farm, and then tested various ‘proof pieces’, as he called the treatments (Pawson, 1957). In one experiment he divided these into treatments with irrigation, no irrigation, irrigation plus manure, irrigation and no manure, spring water and stream water. He was proud that his livestock were fed exclusively on farm-produced fodder, and that he had invented a further use for these channels, namely the transport, or ‘navigation’, of turnips. At harvest, turnips were flung into the nearest channel and transported up to a mile distant, arriving clean and washed (Pawson, 1957). Other crops, such as carrots and potatoes, were put on specially constructed boats as they did not float. Elsewhere, irrigation was valued for the suspended silt it brought. In eastern Lincolnshire, Yorkshire and Norfolk, water was directed into temporary enclosures, or warps, about 2 metres high and constructed from timber, earth or limestone. As the water drained away, so a 15–40cm layer of fertile silt remained (Beastall, 1978; Young, 1813b). The impact of warping on land value was significant, sandy soil improving from £12 to £150–250 per hectare (Beastall, 1978). With the addition of cattle and horse manures, warping fostered the local diversification of Lincolnshire agriculture to market gardening of carrots, onions, apples, peas, potatoes, flax, hemp and hops. Warping farmers also had ready access to transport to distant urban markets as they were close to large rivers. As with all irrigation systems an ingredient of success is good community cooperation. Warps occasionally broke their banks and flooded neighbours’ land; and watermeadows needed agreements before construction. In the Itchen Valley,
282 Agricultural Revolutions and Change
for example, five farmers agreed not only the collective irrigation of 4.5 hectares of meadows, but also a quota for water allocation based on 7 days and nights each, and operation and management costs for them and their successors (Bowie, 1987b).
Experiments with drainage Farmers also improved their land by experimenting with new methods for draining wet soils. The traditional method had been to plough ridges and furrows, but now farmers began to dig trenches that were filled with stones or plant matter, and to lay tile drains. In the 1820s James Smith of Perthshire, having laid a network of deep drains on 80 hectares, supplemented drainage with a heavy subsoil plough he had invented for the purpose (Watson and Hobbs, 1937). The land was converted from waterlogged to luxuriant, and ‘farmers and landowners came crowding to visit’ (Watson and Hobbs, 1937). Friends and neighbours in the Gargunnock Farmers’ Club copied his method with considerable success. Like irrigation, drainage so improved the value of land that incoming tenants were often willing to pay up to four times the former rent. But drainage did not advance significantly until the invention of a machine to make cylindrical pipes in the 1840s. Government then supported drainage by subsiding drainage costs by about 17 per cent between the 1840s and 1870s (Beckett, 1990).
Experiments with handtools Another target for experimentation was the seasonal peak of labour demand during cereal and hay harvest. Inter-regional labour flows were necessary to meet this constraint, and harvest gangs in England were commonly drawn from Ireland and Scotland and the workforce in the newly industrializing centres, where iron furnaces, forges and mills often closed at harvest as workers returned to the fields (Collins, 1969; Jones, 1967). The opportunity to offset this constraint came with the development of new harvesting tools to replace the sickle. These were the scythe (blade attached to a bow or cradle to assist in the laying-down of the cut), the reap-hook (slightly heavier and broader than the sickle) and the bagging-hook (large, heavy smooth-edge hook with a second hook to tension the cereal), and represented a labour-saving potential of 40 per cent, 15 per cent and 35 per cent respectively (Collins, 1969). The adoption varied by location, and changes to blade and handle design were common.
Experiments with pest control Diverse genetic stock, a diverse agricultural landscape, and multiple cropping would have checked outbreaks of pests and diseases during this period. But there were few explicit experiments on pest and disease control. Thomas Coke saved £60 worth of turnips in one field after he had gathered 400 ducks to control black
Technology Adaptation: Agricultural Revolution in 17th–19th-Century Britain 283
canker caterpillars. ‘In five days they cleared the whole most completely, marching … through the field on the hunt, eyeing the leaves on both sides with great care to devour every one they could see’ (Young, 1784b). In Devon, a farmer wrote of the benefit of fumigating orchards with smoke to reduce pest damage (Gullett, 1786). More common was the treatment of seeds before sowing to reduce fungal or insect attack. In the 1780s, Young steeped wheat seed already black with fungi in various mixtures of water, lime water, wood ashes solution and arsenic and compared the number of smutty ears after a season (Young, 1788). Any treatment of more than 4 hours reduced infection to 1 per cent of that of water or no treatment. Later he describes the benefit of steeping turnip seed in water for 48 hours before sowing to reduce turnip fly damage (Young, 1813a).
Lessons for Sustainable Agricultural Revolutions The successes and failures of the British agricultural revolution give some indications about the preconditions necessary for fostering sustainable agricultural revolutions today. Intensification of on-farm resources increases crop and livestock productivity, and so ensures that agriculture does not pollute or contaminate the environment (Pretty, 1990a; Conway and Pretty, 1991). Increased production based on internal resources increases the need for labour, and so increases the population-supporting capacity of the land. And more innovations mean more options for farmers to diversify, so reducing the risk of physical or economic shocks and stresses threatening their livelihoods. Most importantly, though, farmers fully involved in the process of technology generation, extension and experimental adaptation more readily make improvements. In the British agricultural revolution all this was achieved without explicit support from government. At the same time, however, extensification was being strongly promoted even though it destroyed the common property resources that were essential buffers against adversity for those relying on the provisions of fuel, fodder, food and employment opportunities (Hardy, 1887; Collins, 1989; Jodha, 1991). During the agricultural revolution their value was barely recognized. They were called wastes, and represented to many a symbol of backwardness or underdevelopment. Young called those who opposed enclosure ‘Goths and Vandals’ (Gazley, 1973); John Smyth, a Gloucester landowner, said ‘large commons and wastes burdened a village with beggarly cottages and idle people. They were better enclosed’ (Thirsk, 1985); an Assistant Tithe Commissioner said that the heaths of Suffolk were ‘mere sand encumbered with furze (Ulex europeaus) and fit for nothing but rabbits and sheepwalk’ (Burrell, 1960); and Board of Agriculture reporters said common property resources were ‘the trifling fruits of overstocked and ill-kept lands’ (Humphries, 1990). But after enclosure poor farmers had to destock as fodder sources beyond their farms were no longer available and hay prices rose; and many farmers, given small plots of land in lieu of grazing rights, sold them to larger landowners,
284 Agricultural Revolutions and Change
and ‘the money was drank at the ale house’ (Young, 1791, in Humphries, 1990). Generally those people living in diverse landscapes fared better than those in the monocropped cereal lands. Of the arable lands Cobbett said there were ‘no hedges, no ditches, no commons, no grassy lanes … and the wretched labourer has not a stick of wood, and has not place for a pig or cow to graze. What a difference there is between the faces you see here, and the round, red faces that you see in the wealds and forests’ (Cobbett, 1830). Extensification into uncultivated lands to improve aggregate food production should thus be treated with caution unless there has been full quantification of their economic value to poor people’s livelihoods, and necessary steps taken to offset damage. The success of intensification during the British agricultural revolution would appear to suggest three important strategies for agricultural development of resource-poor lands today: 1
2 3
reform of national and regional research, extension and planning to create a dialogue with farming households, with particular emphasis upon sensitive survey techniques to discover indigenous practices and the promotion of technology generation and adaptation by farmers themselves; national and regional support to farmer-to-farmer extension mechanisms to increase the speed of diffusion; adjustment of national pricing and subsidy policies to support the intensification of on-farm resources so as to increase productivity without damaging the natural resource base.
There do, however, remain many uncertainties. It is still unclear why delays of 100–200 years in diffusion occurred – particularly, what role did the invention of extension mechanisms play? It is also far from clear what role population increase played – did increasing population drive the need to increase food production, or did more people simply mean greater likelihood of passive diffusion? Most historical evidence of experimentation relates to larger tenant and landlord farmers – is this because only larger farmers can afford to take the risks attendant upon experiments and trials, or is the record biased because it is their documents that have survived to this day? To what extent, then, does the small farmer experiment? And lastly, to what extent did the benefits of intensification on resource-poor lands offset the damage caused by extensification and loss of common property resources? Answers to these and related questions would provide us with a more precise and better understanding of the invention, extension and adaptation processes underlying agricultural revolutions.
Technology Adaptation: Agricultural Revolution in 17th–19th-Century Britain 285
Notes 1
2
I am very grateful to E. J. T. Collins, Gavin Bowie, and Robert Rhoades, together with two anonymous referees, for their valuable comments and suggestions, and to Ken Smith for the illustrations. The true grasses include rye grass (Lolium perenne), cocksfoot (Dactylis glomerata), timothy (Phleum pratense), meadow grasses (Poa spp.), meadow foxtail (Alopecurus pratensis), meadow fescue (Festuca pratensis); the artificial grasses were sainfoin (Onobrychis viciifolia), trefoil (Medicago lupilina), white clover (Trifolium repens), red clover (T. repens), cow grass (T. alpestre), rib grass (Plantago lanceolata) and burnet (Poterium polygonum).
References Addy, John. 1972. The Agrarian Revolution. Longman, London. Allen, Robert C. and Cormac O’Grada. 1988. ‘On the road again with Arthur Young: English, Irish, and French agriculture during the Industrial Revolution.’ J. Econ. Hist. 48, 93–116. Bailey, John and George Culley. 1805. A General View of the Agriculture of Northumberland. Board of Agriculture, London. Barbier, Edward. 1989. Economics, Natural-Resource Scarcity & Development. Earthscan Publications Ltd, London. Beastall, T. W. 1978. The Agricultural Revolution in Lincolnshire. Society of Lincolnshire History & Archaeology. Lincoln. Beckett, J. V. 1990. The Agricultural Revolution. Basil Blackwell, Oxford. Biddell, Arthur. 1812–16. Work Book No 2. East Suffolk County Record Office (ESCRO)HA2/B2/1B. Biddell, Arthur. 1817–21. Day Book No 2. ESCROHA2/A3/2. Biddell, Arthur. 1821–24. Day Book No 3. ESCROHA2/A3/3. Biddell, Arthur. 1820–28. Work Book No 4. ESCROHA2/B2/2. Biddell, Arthur. 1828. Report to the Corporation of Ipswich on the State of Mr Fuller’s Farmat Westerfield. ESCROHA2/A2/1/51. Biddell, Arthur. No date. Cropping schedule for Hill Farm, Playford. ESCRO. HA2/B3/1 and HA2/ B4/1. Bishton, J. 1794. A Survey of the County of Shropshire. Board of Agriculture, London. Boswell, James. 1785. ‘A Journal of a Tour to the Hebrides with Samuel Johnson.’ In Pottle, Frederick A. & Charles H. Benett (eds). Boswell’s Journal of a Tour. 1936. William Heinemann Ltd, London. Bowie, Gavin. 1987a. ‘New sheep for old – changes in sheep farming in Hampshire, 1792–1879.’ Agric. Hist. Rev. 35, 15–24. Bowie, Gavin. 1987b. ‘Watermeadows in Wessex – a re-evaluation for the period 1640–1850.’ Agric. Hist. Rev. 35, 151–158. Bowie, Gavin. 1990. Northern wolds & Wessex downlands – contrasts in sheep husbandry & farming practice during the period 1770–1850. Agric. Hist. Rev. 38, 117–126. Boys, J. & Ellman, J. 1793. ‘Agricultural minutes taken during a ride through 13 counties of south and east England in 1792.’ Annals of Agric. 19, 72–144. Brolter, Mr 1790. Flixton Estate Valuation & Observation & Improvements. ESCRO HA12/ E1/5/86. Bunch, Roland. 1990. Low Input Soil Restoration in Honduras: The Cantarranas Farmer-to-Farmer Extension Programme. Gatekeeper Series SA23. International Institute for Environment & Development, London.
286 Agricultural Revolutions and Change Bureell, E. D. R. 1960. An Historical Geography of the Sandlings of Suffolk, 1600 to 1850. MSc Thesis, University of London. Caird, James. 1852. English Agriculture in 1850–51. In G. E. Mingay (ed). 1968. Frank Cass & Co, London. Canney, Margaret & David Knott. 1970. Catalogue of the Goldsmiths’ Library of Economic Literature. Cambridge University Press, Cambridge. Chambers, Robert, Arnold Pacey and Lori Ann Thrupp (eds). 1989. Farmer First. Farmer Innovation & Agricultural Research. Intermediate Technology Publications, London. Chartres, John. 1985. ‘The marketing of agricultural produce.’ In Thirsk J. (ed). The Agrarian History of England & Wales. Vol. V. 1640–1750. II. Agrarian Change. Cambridge University Press, Cambridge. Cobbett, William. 1830. ‘Rural Rides.’ In Woodcock, G. (ed) Penguin Classics, 1967, Penguin Books Ltd., Harmondsworth. Collins, E. J. T. 1969. ‘Harvest technology & labour supply in Britain, 1790–1870.’ Econ. Hist. Rev. 22, 453–473. Collins. E. J. T. 1989. ‘The coppice and underwood trades.’ In Mingay G. E. (ed). The Agrarian History of England & Wales. Vol. VI. 1750–1850. Cambridge University Press, Cambridge. Conway, Gordon R. & Jules N. Pretty. 1991. Unwelcome Harvest. Agriculture & Pollution. Earthscan Publications Ltd, London. Cooper, Benjamin. 1827. Letter to Arthur Biddell. ESCRO, HA2/A2/1/7-8. Crutchley, John 1794. A Survey of the County of Rutland. Board of Agriculture, London. Culley, George. 1790. ‘On cattle.’ Annals of Agric. 14, 180–183. Curley, T. M. 1976. Samuel Johnson and the Age of Travel. University of Georgia Press, Athens. Defoe, Daniel. 1724. ‘A Tour through the Whole Island of Great Britain.’ In Rogers, Pat (ed). Penguin Classics, 1971, Penguin Books Ltd, Harmondsworth. Donaldson, John. 1854. Agricultural Biography: Life and Writing on the British Authors on Agriculture. London. Ernle, Lord. 1912. English Farming. Past & Present. London. Evans, George Ewart. 1960. The Horse in the Furrow. Faber & Faber, London. Farrington, John and Adrienne Martin. 1987. Farmer Participatory Research: A Review of Concepts & Practices. ODI Agric. Admin. Discussion Paper 19. Overseas Development Institute, London. Fitzgerald, Kevin. 1968. Ahead of their Time. A Short History of Farmers’ Clubs, 1842–1967. Heinemann, London. Fujisaka, Sam. 1989. Participation by Farmers, Researchers & Extension Workers in Soil Conservation. Gatekeeper Series SA16. International Institute for Environment and Development, London. Gamier, Russell M. 1896. ‘The introduction of forage crops into Great Britain.’ J. Roy. Agric. Soc. Eng. (3rd series) 7, 77–97. Gazley, John G. 1973. The Life of Arthur Young. 1741–1820. American Philosophical Society, Philadelphia. Goddard, Nicholas. 1989. ‘Agricultural literature & societies.’ In Mingay G.E. (ed). The Agrarian History of England and Wales, Vol VI. 1750–1850, Cambridge University Press, Cambridge. Goldhawk, Thomas. 1795. ‘On Hedge Wheat.’ Annals of Agric. 24, 408–410. Gullett, Christopher. 1786. ‘On the means of preserving apple blossoms & orchards from injury.’ Annals of Agric. 7, 56–61. Handley, J. E. 1963. The Agricultural Revolution in Scotland. Barns, Glasgow Hardy, Thomas. 1887. ‘The Woodlanders.’ In Gibson J. (ed). Penguin Classics, 1981. Penguin Books Ltd. Harmondsworth. Harper, Mr 1806. ‘Experiments in agriculture.’ Annals of Agric. 44, 17–30. Hartlib, Samuel. 1646. Discourse of Husbandry used in Brabant & Flanders, showing the wonderful improvements of land there. London. Havinden, Michael A. 1961. ‘Agricultural progress in open-field Oxfordshire.’ Agric. Hist. Rev. 9, 73–83.
Technology Adaptation: Agricultural Revolution in 17th–19th-Century Britain 287 Holderness, B. A. 1989. ‘Prices, productivity and output.’ In Mingay G.E. (ed). The Agrarian History of England & Wales. Vol. VI. 1750–1850. Cambridge University Press, Cambridge. Humphries, Jane. 1990. ‘Enclosures, common rights, & women: the proletarianization of families in the late eighteenth and early nineteenth centuries.’ J. Econ. Hist. 50, 17–42. Jintrawet, Attachai, Suriya Smutkupt, Chaicharn Wongsamun, Roengsak Katawetin and Vichein Kerdsuk. 1985. Extension Activities for Peanuts after Rice in Ban Sum Jan, Northeast Thailand: A Case Study in Farmer-to-Farmer Extension Methodology. The Farming Systems Research Project, Khon Kaen University, Khon Kaen, Thailand. Jodha, N. S. 1991. Rural Common Property Resources: A Growing Crisis. Gatekeeper Series SA24. International Institute for Environment and Development, London. Johnson, Samuel. 1775. A Journey to the Western Isles of Scotland. Notes by J. D. Fleeman. 1985. Clarendon Press, Oxford. Jones, E. L. (ed). 1967. Agriculture and Economic Growth in England 1650–1815. Methuen & Co, London. Kent, Nathaniel. 1794. A Survey of the County of Norfolk. Board of Agriculture, London. Kerridge, Eric. 1967. The Agricultural Revolution. Allen & Unwin, London. Lennard, R. V. 1932. ‘English agriculture under Charies II: the evidence of the Royal Society’s “Enquiries”.’ Econ. Hist. Rev. IV, 23–45. Lisle, Edward. 1757. Observations in Husbandry. London. MacDonald, Stuart. 1977. ‘The diffusion of knowledge among Northumberland farmers, 1780–1815.’ Agric. Hist. Rev. 29, 30–39. Magzie, Count. 1799. ‘Count Magzie in Silesia.’ Annals of Agric. 33, 303–304. Markham, Gervase. 1631. The English Husbandman. London. Marshall, William. 1818. The Review and Abstract of the County Reports to the Board of Agriculture. David & Charles Reprints, Newton Abbott. McCloskey, Donald N. 1975. ‘The economics of enclosure: a market analysis.’ In Parker W. N. & Jones E. L. (eds). European Peasants & Their Markets. Princeton University Press, New Haven. Mingay, G. E. 1977. The Agricultural Revolution. Adam & Charles Black, London. Mingay, G. E. 1989. The Agrarian History of England and Wales. Vol. VI. 1750–1850. Cambridge University Press. Cambridge. Mullen, Joseph. 1989. ‘Training and visit system in Somalia: contradictions & anomalies.’ J. Internat. Develop. 1, 145–167. Overton, Mark. 1984a. ‘Agricultural productivity in 18th century England: some further speculations.’ Econ. Hist. Rev. (2nd ser) 37, 244–251. Overton, Mark. 1984b. ‘Agricultural revolution? Development of the agrarian economy in early modem England.’ In Baker A. R. N. & Gregory D. (eds). Explorations in Historical Geography. Interpretative Essays. Cambridge University Press, Cambridge. Overton, Mark. 1985. ‘The diffusion of agricultural innovations in early modern England: turnips and clover in Norfolk & Suffolk, 1580–1740.’ Trans. Inst. Br. Geog. 10, 205–221. Parker, R. A. C. 1975. Coke of Norfolk. A Financial & Agricultural Study. 1707–1842. Clarendon Press, Oxford. Pawson, Henry. 1957. Robert Bakewell. Pioneer Livestock Breeder. Crosby Lockwood & Son, London. Peak, Mr 1799. Farm Surveys of 37 Farms. ESCROHA11/C3/6 Perkins. W. Frank. 1932. English & Irish Writers on Agriculture. Chas. T. King, Lymington. Pettite, Mr 1830. Letter to Arthur Biddell. ESCROHA2/A2/l/41. Pitt, William. 1794. A Survey of the County of Staffordshire. Board of Agriculture, London. Pretty, Jules N. 1990a. ‘Agricultural pollution: from costs and causes to sustainable practices.’ In Angell D. J. R., Comer J. D. & Wilkinson M. L. N. (eds). Sustaining Earth: Response to the Environment Threat. Macmillan, London.
288 Agricultural Revolutions and Change Pretty, Jules N. 1990b. Rapid Catchment Analysis for Extension Agents. A report of the 1990 Kericho Training Workshop for Ministry of Agriculture, Kenya. International Institute for Environment and Development, London. Pretty, Jules N. 1990c. ‘Sustainable agriculture in the middle ages: the English manor.’ Agric. Hist. Rev. 38, 1–20. Ramsay, A. 1879. History of Highland & Agricultural Society of Scotland. William Blackwood & Sons, Edinburgh & London. Redhead & Laing, Messrs. 1793. ‘Observations in a sheep tour.’ Annals of Agric. 20, 1–34. Rhoades, Robert. 1989. ‘The role of farmers in the creation of agricultural technology.’ In Chambers, Robert et al (eds). op. cit. Richards, Paul. 1989. ‘Agriculture as a performance.’ In Chambers, Robert et al (eds). op. cit. Richardson, Kerr. 1793. ‘Tour through Scotland examining sheep.’ Annals of Agric. 20, 297–330. de La Rochefoucauld, François. 1784. ‘Diary.’ In Scarfe N. (ed). A Frenchman’s Year in Suffolk. The Boydell Press, Woodbridge. Rogers, Pat. (ed). 1971. Introduction to ‘A Tour through the whole Island of Great Britain’ by Daniel Defoe. Penguin Books Ltd, Harmondsworth. Rossiter, M. W. 1975. The Emergence of Agricultural Science. Yale University Press, New Haven and London. Russell, David B., Raymond L. Ison, Dennis R. Gamble and Ruth K. Williams. 1989. A Critical Review of Rural Extension Theory & Practice. Faculty of Agriculture and Rural Development, University of Western Sydney, Australia. Russell, E. J. 1946. British Agricultural Research: Rothamsted. The British Council, Longmans, Green & Co., London. Russell, E. J. 1966. A History of Agricultural Science in Great Britain, 1620–1954. George Allen & Unwin, London. Russell, Nicholas. 1986. Like Engend’ ring Like: Heredity & Animal Breeding in Early Modern England. Cambridge University Press, Cambridge. Sayer, John. 1747. Valuation of Mr Wynbume’s Estate in Flixton. ESCROHA12/E1/S/110. Scarfe, Norman (ed). 1988. A Frenchman’s Year in Suffolk, 1784. Francois de La Rochefoucauld. The Boydell Press, Woodbridge. Speed, Adam. 1626. Adam out of Eden. London. Steer, F. W. 1950. Farm & Cottage Inventories of Mid-Essex. 1635–1749. Essex County Council, Chelmsford. ERO Public. No 8. Sullivan, Richard J. 1983. English Agriculture, 1500–1850: A Case Study of Long Run Technological Change. D. Phil Thesis, University of Illinois, Urbana. Thick, Malcolm. 1985. ‘Market gardening in England & Wales.’ In Thirsk J. (ed).The Agrarian History of England & Wales. Vol V 1640–1750. II. Agrarian Change. Cambridge University Press, Cambridge. Thirsk, Joan. 1985. ‘Agricultural innovations & their diffusion.’ In Thirsk J. (ed). The Agrarian History of England & Wales. Volume V. 1640–1750. II. Agrarian Change. Cambridge University Press, Cambridge. Thirsk, Joan. 1987. England’s Agricultural Regions & Agrarian History, 1500–1700. Studies in Economic & Social History. Macmillan Education Ltd, Basingstoke. Tull, Jethro. 1731. The Horse Hoeing Husbandry. London. Turner, Michael. 1982. ‘Agricultural productivity in England in the 18th century: evidence from crop yields.’ Econ. Hist. Rev. (2nd Ser) 35, 489–510. Turner, Michael. 1986. ‘English open fields & enclosures: retardation or productivity improvements?’ J. Econ. Hist. 46, 669–692. Turner, Michael. 1984. ‘Agricultural productivity in 18th century England: Further strains of speculation.’ Econ. Hist. Rev. (2nd Ser) 37, 252–257. Tusser, Thomas. 1557. Five Hundred Points of Good Husbandry. London.
Technology Adaptation: Agricultural Revolution in 17th–19th-Century Britain 289 Utton, Mr. 1848. Valuations of Estates of Sir Philip Broke. ESCRO. Watson, J. A. S. & Hobbs M. E. 1937. Great Farmers. Selwyn & Blount, London. Wilkes, Roger. 1981. ‘The diffusion of drill husbandry, 1731–1850.’ In Minchinton W. (ed). Agricultural Improvement: Medieval & Modern. University of Exeter, Exeter. Withers, Charles W. J. 1989. ‘William Cullen’s agricultural lectures & writings and the development of agricultural science in 18th century Scotland.’ Agric. Hist. Rev. 37, 144–156. Wordie, J. R. 1983. ‘The chronology of English enclosure, 1500–1914.’ Econ. Hist. Rev. 36, 483– 505. Young, Arthur. 1767. The Farmers’ Letters to the People of England. 1st edition, London. Young, Arthur. 1768. A Six Weeks’ Tour through the Southern Counties of England & Wales. London. Young, Arthur. 1769. A Six Months Tour through the North of England. 4 Vols. London. Young, Arthur. 1770. Experimental Agriculture. 2 Vols. London. Young, Arthur. 1771. The Farmers’ Tour through the East of England. 4 Vols. London. Young, Arthur. 1784a. ‘A five days tour to Woodbridge.’ Annals of Agric. 2, 105–168. Young, Arthur. 1784b. ‘A minute of husbandry, at Holkham, of Thomas William Coke, Esq.’ Annals of Agric. 2, 353–382. Young, Arthur. 1786. ‘The achievements of Turnip Townshend.’ Annals of Agric. 5, 120–126. Young, Arthur. 1788. ‘Experiment on the smut of wheat.’ Annals of Agric. 10, 231–232. Young, Arthur. 1793a. ‘A sketch drawn from some advice to a young man, how to extract knowledge from viewing the farms of others.’ Annals of Agric. 19, 422–25. Young, Arthur. 1793b. ‘Overman’s Farm.’ Annals of Agric. 19, 451–460. Young, Arthur. 1799. ‘Duke of Bedford’s sheep shearing.’ Annals of Agric. 33, 306–21. Young, Arthur. 1803. ‘Holkham sheep shearing.’ Annals of Agric. 39, 61–66. Young, Arthur. 1804. A General View of the County of Norfolk. 2nd edition. Board of Agriculture. London. Young, Arthur. 1808. ‘Premiums given by the Duke of Bedford at Woburn.’ Annals of Agric. 45, 363–8. Young, Arthur. 1813a. A General View of the County of Suffolk. 3rd edition. Board of Agriculture, London. Young, Arthur. 1813b. A General View of the County of Lincolnshire. 2nd edition. Board of Agriculture, London.
13
Past Successes G. R. Conway
The Japanese have made the dwarfing of wheat an art. The wheat stalk seldom grows longer than 50 to 60 centimeters. The head is short but heavy. No matter how much manure is used, the plant will not grow taller; rather the length of the wheat head is increased. Even on the richest soils, the wheat plants never fall down. US adviser to the Meiji government, 18731
Without the Green Revolution, the numbers of poor and hungry today would be far greater. Thirty-five years ago, according to FAO, there were about 1 billion people in the developing countries who did not get enough to eat, equivalent to 50 per cent of the population, compared to the under 20 per cent today.2 If the proportion had remained unchanged the hungry would be in excess of 2 billion – more than double the current number. The achievement of the Green Revolution was to deliver annual increases in food production which more than kept pace with population growth. Many factors contributed to this success story, but of central importance was the application of modern science and technology to the task of getting crops to yield more. Cereal yields, total cereal production and total food production in the developing countries all more than doubled between 1960 and 1985. Over the same period their population grew by about 75 per cent. As a result, the average daily calorie supply in the developing countries increased by a quarter, from under 2000 calories per person in the early 1960s to about 2500 in the mid-80s, of which 1500 was provided by cereals (Figure 13.1).3 The history of the Green Revolution is well known, but is worth recounting here as a reminder of the power and limitations of innovative technology, and the crucial importance to its success of the economic, social and institutional environment within which it has to operate. A careful analysis of the trends in agricultural productivity in a variety of countries, both developed and developing, suggests there is a point in history when yields begin to take off.4 While agricultural production remains based on tradiReprinted from Conway G R. 1997. Past successes. Chapter 4, in The Doubly Green Revolution. Penguin, London, pp44–65.
Past Successes 291
Figure 13.1 Cereal production, cereal yields and calorie supply in the developing countries, 1961–1986
tional practices, with fewer or no outside inputs, yield gains are modest, of the order of 1 per cent or less per annum. Production grows, barely perceptibly and largely as a result of increases in cropped area, until a critical threshold is reached when a transition to a new basis for production occurs. Much-improved varieties appear, farmers turn to inorganic fertilizers and synthetic pesticides, invest in irrigation and drainage and adopt a range of other new technologies, including the purchase of agricultural machinery.
292 Agricultural Revolutions and Change
From their analyses, Cornelius de Wit and his colleagues of the University of Wageningen in the Netherlands conclude this transition occurs when cereal yields reach about 1700kg/ha. Below the take-off point yield increases are of the order of 17kg/ha per year; afterwards they are 50–85kg/ha. There are, of course, exceptions: some countries (China is an example) experienced take-off from much lower yield levels, others, such as Britain and Japan, produced several spurts of growth with relatively low rates in between. Selection of indigenous rice varieties in Japan, coupled with increased irrigation, resulted in a yield increase between the 1880s and the First World War of about 40kg/ha per year.5 Yields grew more slowly between the wars and then took off again after the Second World War, with annual yield growth of 75kg/ha per year. In most developed countries the take-offs occurred soon after the end of the Second World War. High-yielding varieties, new fertilizer formulations and more effective pesticides came on the market, together with machinery that permitted more timely agricultural operations. Economic incentives, which included guaranteed prices, deficiency payments and other forms of subsidy, made sure the new technologies were widely adopted. Thereafter, growth in production was nearly entirely due to yield increase; in most developed countries the cropped area has declined since 1950. The take-offs in the developing countries mostly occurred at the end of the 1960s as the new varieties produced by the Green Revolution began to be widely adopted. William Gaud, the administrator of USAID, first coined the name ‘Green Revolution’.6 At the time it was an appropriate description of a momentous event. Today ‘Green’ signifies the environment; then the image it conveyed was of a world covered with luxuriant and productive crops – the green swathes of young wheat- and ricefields. It was truly also a revolution in the scale of the transformation it achieved although, as we shall see, it did not go nearly far enough. The origins of the revolution lay in a joint venture, the Office of Special Studies, established by the Mexican Ministry of Agriculture and the Rockefeller Foundation in 1943.7 At the time, Mexican grain yields were very low, maize averaging about a quarter of US yields and wheat yielding less than 800kg/ha, even though most of the wheatland was irrigated. The Office was headed by George Harrar, with Edwin Wellhausen, a maize breeder, Norman Borlaug, a plant pathologist, and William Colwell, a soil scientist. Eventually the office was to have 21 US and 100 Mexican scientists, mostly working at an experiment station at Chapingo on the rain-fed central plateau. Its remit was to improve the yields of the basic food crops, maize, wheat and beans. The research programme concentrated first on maize, the mainstay of the Mexican diet, consumed in the form of the thin, flat, unleavened bread called the tortilla. Mexican agronomists had already discovered that most strains of maize grown in the US were not well adapted to Mexican conditions, so the programme set out to try to duplicate the US achievement of breeding high-yielding, hybrid maizes but using indigenous varieties as a basis. Maize is a cross-pollinating crop, so that the seed collected by the farmer from his or her crop at the end of the season is usually highly variable. More uniform and higher-yielding hybrids can be
Past Successes 293
created by deliberately crossing two distinct lines which have been inbred through several generations by self-pollination. The resulting hybrids combine the best features of both lines and usually have added a certain hybrid vigour.8 At the time the Mexican programme began, about half of the cornland in the US was planted to hybrids. However, the disadvantage of hybrids is that new seed for each season has to be produced by repeating the cross, since the seed gathered at the end of the season from the hybrid crop will have lost the hybrid vigour and become contaminated. An alternative approach, adopted by Edwin Wellhausen, was to grow four or more inbred lines in an isolated field and let them cross naturally. These so-called ‘synthetics’ yielded better than the best existing varieties by 10–25 per cent and the farmers could simply save seed from their best plants from year to year.9 Success came very quickly. In 1948 1400 tons of seed of the improved maize varieties were planted. The new seed, good weather that season and the ready availability of fertilizer resulted in a record harvest and, for the first time since the revolution of 1910, Mexico had no need of imports. By the 1960s over one-third of Mexico’s maizeland was being planted to new high-yielding varieties and maize yields were averaging over 1000kg per hectare. Total production had increased from 2 to 6 million tons. Although maize was the main staple crop, Mexico was importing about a quarter of a million tons of wheat per year. Yields were very poor – ‘most varieties were a hodge-podge of many different types, tall and short, bearded and beardless, early ripening and late ripening. Fields usually ripened so unevenly that it was impossible to harvest them at one time without losing too much over-ripe grain or including too much under-ripe grain in the harvest.’10 In northern and central Mexico the soils had lost most of their fertility. On the newer, well-irrigated lands in the Pacific north-west the soil was generally fertile enough to produce high yields but stem rust was very destructive. Epidemics in three consecutive years, 1939–1941, in Sonora had caused many farmers to reduce their wheatland or stop growing the crop altogether. The wheat programme, under the direction of Norman Borlaug, began by testing over 700 native and imported wheat varieties for rust resistance.11 While some of the imported varieties were both more resistant to rust and higher yielding than the Mexican varieties, they had the disadvantage of late ripening. They needed the longer days of the northern summers to mature. But by crossing the imports with the best Mexican varieties, Borlaug produced, in 1949, four rust-resistant varieties each adapted to a particular ecological region of Mexico. Wheat is a selfpollinating crop, so that crosses have to be made by hand, but once made the new varieties will breed true and farmers can use their harvested seed for the next year’s crop. By 1951 the new varieties were being grown on 70 per cent of the total wheatland and, five years later, Mexico was producing over a million tons of wheat, with an average national yield of 1300kg/ha. Imports of foreign wheat were no longer required. The next step in the wheat programme was to improve yields through greater use of fertilizers. Experiments on properly irrigated soils showed that 140kg/ha of
294 Agricultural Revolutions and Change
nitrogen raised yields more than fourfold. Even on rain-fed soils, yields more than doubled and the addition of phosphate produced five- or sixfold increases. But the traditional varieties had a tendency to grow tall and lodge, that is they fell down under the weight of the luxuriant green growth produced by the extra nutrient uptake, in effect making the grain liable to rot and be less harvestable. The breeders also recognized the need for non-shattering varieties that would hold the grains until they were ripe enough for mechanized harvesting and threshing. And wheats with better milling and baking quality were required, now that Mexico was relying solely on its own wheats and not blending with the stronger, imported varieties. As the quotation at the beginning of this chapter testifies, short-strawed varieties had long existed in Japan. In 1935 the Japanese had produced a new dwarf, Norin 10, by crossing one of their traditional dwarfs with Mediterranean and Russian varieties imported from the US.12 This was spotted by a US agricultural officer working in Japan in 1946 and seeds were sent to Washington State University. Initially the crosses with US wheats resulted in sterile offspring but then a fertile cross was made from which, ten years later, Orville Vogel, of the US Department of Agriculture (USDA), produced a new semi-dwarf variety called Gaines that yielded a world record of over 14 tons/ha. Norman Borlaug heard of Vogel’s work and in 1953 obtained some of his early breeding material to cross with traditional Mexican varieties. By growing two crops a year, a summer crop at Chapingo and a winter crop at a second experimental station in the state of Sonora, lying in the rich, irrigated plain of the Pacific northwest of Mexico, he produced, in record time, two new, superior dwarf-wheat varieties. These were adapted to a wide range of day-length and other environmental factors, and highly responsive to fertilizer applications (Figure 13.2). By 1966 the new varieties were yielding 7 tons/ha. A decade later, virtually all of Mexico’s wheatland was under these varieties and the country’s average yield was close to 3 tons/ha, having quadrupled since 1950 (Figure 13.3). By 1985 total production had increased to 5·5 million tons. Following the success of the new wheat and maize varieties in Latin America, attention turned to the needs of Asia. Over much of Asia the staple diet was, and still is, rice. Unlike wheat, rice is mostly grown by smallholders (on farms of less than 3ha) for home consumption. In the 1950s, over 90 per cent of the rice produced in the world was grown in Asia; national yields averaged between 800 and 1900kg/ha.13 Early in this century, Japan, China and Taiwan had developed a number of new rice varieties which had led to significant increases in production, but the major impact on Asian rice yields came in the 1960s as a result of the skilful efforts of two groups of breeders, working in ignorance of each other, in China and the Philippines. The benefits of scientists being able to pursue clear goals in multidisciplinary teams had convinced those involved in the Mexican programme of the need to create purpose-built research institutes which would attract scientists of the highest calibre. In 1961 the International Rice Research Institute (IRRI) was established at Los Baños in the Philippine province of Luzon as a joint venture
Past Successes 295
Source: B. C. Wright, 1972, Critical requirements of new dwarf wheat for maximum production, in Proceedings of the Second FAO/Rockefeller Foundation International Seminar on Wheat Improvement and Production, March 1968, Beirut, Ford Foundation
Figure 13.2 Responses of new and traditional wheats to fertilizers
Figure 13.3 Growth in wheat yields in Mexico
296 Agricultural Revolutions and Change
between the Philippine government and the Ford and Rockefeller Foundations. This was the first of a family of new research institutes equipped with first-class laboratories and adjoining experimental plots located on good, irrigated land.14 Excellent living conditions and international salaries added to the ability to attract the best scientists from around the world. The Ford Foundation became a partner partly because its community development programme in India, started in 1951, had underlined the importance of agricultural research. The programme, largely run by social scientists, had assumed that improved technology was readily available and needed only a programme of vigorous education for it to be implemented. However, the village extension workers often proved inexperienced in agriculture and, more important, encouragement of increased fertilizer use turned out to be ineffective because the traditional cereal varieties lodged. Forrest Hill, an agricultural economist and vice-president of the foundation, concluded that the foundation had ‘got the cart before the horse’. What was needed, he believed, was innovative agricultural research to support the extension work. The first director of IRRI was Robert Chandler. He assembled a team of rice experts drawn from the US, India, Japan, Taiwan, Ceylon and the Philippines.15 Experience in Mexico with the wheat programme and the knowledge already obtained from breeding programmes in India provided a blueprint for the new rices that were required (Box 13.1). A large collection of rice types was quickly
Box 13.1 A blueprint for the new rice varieties A short, stiff stem (90–110cm), giving resistance to lodging Erect, narrow leaves, resulting in increased efficiency of sunlight utilization High tillering and a grain to straw ratio of 1:1, producing high fertilizer responsiveness Time of flowering insensitive to day-length, giving flexibility in planting date and location Early maturity (less than 130 days), giving increased output per hectare per day Resistance to the most serious pests and diseases: stem borer and rice blast Wide adaptability in Asia Highly nutritious, with a high protein content and a better balance of amino acids High palatability Source: Stakman et al, 1967 (n. 7) and Barker et al, 1985 (n. 13)
Past Successes 297
amassed at Los Baños and of the crosses made in 1962, a particularly promising combination was between the tall, vigorous variety Peta from Indonesia and Deegeo-woo-gen, a short, stiff-strawed variety from Taiwan which contained a single recessive gene for dwarfing. In 1966 the new variety, named IR8, was released for commercial planting in the Philippines. It was immediately successful and, amid considerable publicity, was dubbed the ‘miracle rice’. In parallel with the work at IRRI a very similar breeding programme had been launched at the Academy of Agricultural Sciences in the Chinese province of Guandong.16 Although this was only known much later, the Chinese and Philippine teams were using breeding material containing the same dwarfing gene – the Taiwanese variety Dee-geo-woo-gen had probably originated in southern China. In 1959 the Chinese produced their first successful cross, similar in many respects to IR8, and known as Guang-chai-ai. It was rapidly taken up in the province of Guandong and in Jiangsu, Hunan and Fujian. By 1965, a year prior to the release of IR8, it was being grown on 3·3 million hectares. IR8 combined the seedling vigour of Peta with the short straw of Dee-geowoo-gen. It was, like the new wheats bred in Mexico, highly responsive to fertilizer and essentially insensitive to photoperiod, maturing in 130 days. Under irrigation it yielded 9 tons/ha in the dry season and, on the IRRI farm, when continuously cultivated with a rapid turnaround between crops, produced average annual yields of over 20 tons/ha. In Asian regional trials it outyielded virtually all other varieties, producing from 5–10 tons/ha. There was an immediate impact on Philippine rice production. By 1970, one and a half million hectares, or half of the Philippines’ riceland, was planted to the new varieties and the yield take-off had occurred. The Philippines became selfsufficient in rice production in 1968 and 1969 for the first time in decades, although this was temporarily lost in the early 1970s owing to bad weather and disease outbreaks. A decade later, 75 per cent of the riceland was planted to the new varieties, average yields were over 2000kg/ha and rising at nearly 70kg/ha per year (Figure 13.4). To begin with, the new varieties were distributed somewhat haphazardly. When IR8 was first released, farmers who turned up at IRRI could have 2kg of seed free, provided they left their name and address. The seed spread within a few months to over two-thirds of the provinces of the Philippines. Later, seed was distributed through government agencies and a newly formed Seed Growers Association, composed of private farmers who both grew and marketed the new seed. Standard Oil of New Jersey (ESSO) also established 400 agroservice centres in the Philippines to serve as marketing outlets not only for fertilizer but for seed, pesticides and farm implements.17 Two Mexican farm advisers working in El Salvador had hit on the idea of putting together in one package all the basic inputs a farmer would need to try out a new variety on a small patch of ground. The idea quickly spread to other countries and was tried on a massive scale in the Philippines, where a typical package contained 0·9kg of IR8 seed, 19kg of fertilizer and 2·7kg of insecticide. The packages were
298 Agricultural Revolutions and Change
Figure 13.4 Rice yields in the Philippines, 1961–1985
produced by governments and also sold by fertilizer companies.18 In addition to continuing its programme of food aid, the US aid agency, USAID, began to support fertilizer shipments in the 1960s and to finance rural infrastructure – farm-tomarket roads, irrigation projects and rural electrification. It also funded a large force of technical assistance experts. Contracts were signed with US land-grant colleges to assist institution-building in education, research and extension and to create agricultural universities in the land-grant tradition. One of the most successful partnerships was between Cornell University and the University of the Philippines at Los Banos, next to the IRRI campus. A conscious objective of the Green Revolution, from the beginning, was to produce varieties that could be grown in a wide range of conditions throughout the developing world. To meet this goal, the breeders in Mexico had successfully bred the new wheats to be photoperiod-insensitive, that is, they would flower and produce grain at any time of year, in contrast to traditional varieties which tend to flower at certain seasons, for example when the days are shortening. Provided the temperature was above a certain minimum and there was sufficient water, the new varieties would grow almost anywhere. As early as the 1950s, successful trials of the new Mexican maize and wheat varieties were conducted in Latin America and Asia. The new varieties in India yielded at least a ton more than the local varieties. However, local pests and diseases and location-specific soil-management problems remained major constraints. And the importance of getting the package right was illustrated by an attempt to introduce the Mexican soft wheats to Tunisia, where the farmers are used to growing hard wheats, eaten in the form of couscous.19 In the first year the trials gave average yields of 1·5 tons/ha, three times that of the hard wheat. The early maturity of the soft wheats also meant they could be harvested quickly before the
Past Successes 299
drought set in. But the greatly expanded planting in the third year was a catastrophe, with yields of only 300kg/ha. The seed was of poor quality and, because of a complicated bureaucracy, was distributed too late. The farmers also planted it too deep for fear of drought and failed to keep the weeds down. In the fourth year they reverted to the traditional hard-wheat varieties. To oversee the international effort, a wheat and maize improvement programme was established in 1966 under the umbrella of the International Centre for the Improvement of Maize and Wheat, located at Chapingo in Mexico and known by the initials (from its Spanish name) CIMMYT. The new seeds were mostly exported at a price very little above the world market price. In 1967–1968 Pakistan imported sufficient of the new wheat seeds to plant more than 400,000 hectares. Pakistan and India’s yield take-offs occurred in 1967; subsequent yield increases were about 50kg/ha per year (Figure 13.5). A major impetus for the rapid uptake of the new varieties in South Asia was the two consecutive failures of the monsoon in 1966 and 1967. The US, which was the only country carrying food reserves of any size, had responded by shipping one-fifth of its grain crop to India.20 This degree of dependence was recognized by both sides as being risky and undesirable. In some instances, food-aid agreements had permitted countries to put off serious agricultural development plans, and the large volume of food received had depressed prices and reduced the incentive for farmers to produce more. Then the monsoon failures helped to wipe out the world’s surpluses and prices rose dramatically (rice going from $120 to over $200/ton in 1967). Faced with a food crisis of this magnitude, a number of developing-country leaders quickly recognized the potential of the new varieties. Presidents Ayub of Pakistan and Marcos of the Philippines and Prime Minister Demirel of Turkey took a personal and active part in the promotion of the Green Revolution, and were able to
Figure 13.5 Growth in wheat yields in India and Pakistan
300 Agricultural Revolutions and Change
take some of the credit for its success. The re-election of President Marcos in 1969 owed much to the attainment of self-sufficiency in rice production. The new wheats also proved popular in Argentina, where their early maturity made them appropriate for double-cropping with soybeans.21 And in Egypt wheat yields took off in 1969, initially growing at over 60kg/ha per year but after 1980 at 200kg/ha.22 The hybrid maizes were also successfully introduced into Egypt and into Kenya and Zimbabwe. However, the biggest impact came from their adoption in Latin America. To begin with this was slow because the traditional peasant farmers were reluctant to switch from the open-pollinated varieties which could be retained as seed on the farm for next year’s harvest. However, by the early 1980s half the maize area of Latin America was sown to hybrids and yields had grown by a third since 1960. Chile, in particular, experienced dramatic growth, at over 200kg/ha per year after take-off in 1964. According to Donald Plucknett of the CGIAR this is the highest sustained growth rate that any cereal has so far experienced.23 Average yields in 1985 were approaching 6 tons/ha. The uptake of the new rice varieties was similarly dramatic. Twenty tons of IR8 seed were sent to India in 1966 and a further 5 tons to other Asian and Latin American countries. In Colombia it gave rise to a number of local variants developed by the Centre for Tropical Agriculture (Centro Internacional de Agricultura Tropical – CIAT) which soon replaced the indigenous varieties. By 1985 average yields were approaching 5 tons/ha and rice had become the dominant Colombian food crop.24 Another remarkable transformation occurred in Indonesia, where oil revenues were used to finance the adoption of the new varieties and their accompanying packages. The take-off occurred in 1967, with subsequent rice-yield increases of over 100kg/ha (Figure 13.6).
Figure 13.6 The growth of rice yields in Indonesia
Past Successes 301
Figure 13.7 Growth of rice and wheat yields in China
In China rice yields gained an extra boost from the development of hybrid rice. Rice, like wheat, is self-pollinating but the Chinese developed an inexpensive technique permitting cross-pollination on a large scale. The resulting hybrid rices have the same qualities of hybrid vigour as the hybrid maizes: yields are some 20 per cent, or about a ton, greater than the semi-dwarf rices. The first hybrid rice was distributed in 1974 and within a few years it was being planted on 15 per cent of Chinese riceland. China also introduced new high-yielding wheats from Mexico and crossed them with local varieties. Grain yields grew steadily in the 1970s and then accelerated after 1978, following the break-up of the communes, the re-establishment of the household as the unit of production and the encouragement of local markets (Figure 13.7).25 By the 1980s the Green Revolution and new Chinese varieties were dominating the grain lands of the developing world (Figure 13.8).26 Inevitably, there were many ‘teething problems’ in the early years. Governments were unprepared for the rapid rise in production. The land planted to IR8 in Pakistan increased a hundredfold, to over 400,000 hectares, in only a year. Storage, transport and marketing systems were sometimes overwhelmed. The 1968 Indian wheat harvest was one-third greater than the previous record and schools had to be closed in order to store the grain.27 A huge harvest in Kalimantan, on the island of Borneo, went to waste because there was insufficient transport to get it to the centres of demand in Java. But these were the problems of success and they were quickly overcome. Another early problem was the poor acceptability of some of the new varieties. Even poor, undernourished people retain a pride in eating good-quality grain. There was preference in India and Pakistan for chapatis made from the traditional
302 Agricultural Revolutions and Change
Source: M. Lipton and R. Longhurst, 1989, New Seeds and Poor People, London, Unwin Hyman
Figure 13.8 Proportion of cereal lands under new Green Revolution or Chinese varieties in the early 1980s
white grains rather than the reddish grains of the new varieties, but this problem was soon solved by breeding for white grain colour.28 The grain of the first IRRI rices, such as IR8, was also rejected because it tended to harden excessively after cooking and farmers received a lower price than for the traditional grains. Quality improved with later varieties, but many farmers continued to prefer the traditional taste. In Indonesia the growing of traditional rice varieties was prohibited, a ban sometimes enforced by the destruction of crops in the fields. Farmers responded by cultivating the traditional rices in their home gardens or on the margins of fields growing the new varieties. Other problems were more persistent and less amenable to simple solutions. They often required changes in government policies and the creation of new agencies. Inevitably the solutions created yet further problems. An example was the credit needs of the new technology. Adoption of the high-yielding packages was expensive: in Bangladesh the cost of the necessary inputs was 60 per cent more than for the traditional varieties. Small, subsistence farmers, often tenants or sharecroppers, could only afford the new packages if they borrowed from local moneylenders, invariably at high rates of interest. In the Philippines, where the majority of farmers are tenants, cash was borrowed from the landlords at rates of 60–90 per cent per annum, often producing a permanent state of indebtedness. The government response was to set up an Agricultural Guarantee Loan Fund, established at the Central Bank. This, in turn, supported numerous private rural banks which loaned without collateral and at reasonable interest rates. It was an important factor in determining the very rapid uptake of the new varieties in the Philippines. However, there were drawbacks. Under the traditional feudal system, the tenants provided personal services for the landlord, gathering fuel or lending a hand
Past Successes 303
with house repairs. In return, landlords helped with rice or money at times of economic hardship, providing a degree of protection against the outside world.29 With the advent of the Green Revolution, this relationship became more commercial. Both sides benefited: yields on tenant farms rapidly increased as farmers gained from the landlord’s better access to technical information, machinery and inputs. But the inputs had to be paid for and in bad years there was no longer any latitude. Credit repayments under the government scheme were due on schedule and defaulters were punished. The banks were less accommodating than the landlords. Governments usually intervened directly to assure the supply of inputs. Demand for fertilizers grew rapidly in the early years, sometimes outstripping supply and forcing up prices.30 The response was to fix prices and provide generous subsidies. Under the BIMAS programme in Indonesia, quotas were awarded to licensed importers, prices were fixed and distributors and retailers appointed right down to the cooperatives at village level. By the mid-1980s the subsidy for fertilizers had reached 68 per cent of the world price, for pesticides 40 per cent and for water nearly 90 per cent. Such high levels of subsidy created serious environmental problems. Also because the distribution of subsidized inputs tended to remain in the hands of government or quasi-government agencies, corruption became widespread and, in some situations, institutionalized. This has been most evident in government irrigation schemes.31 Pest and disease outbreaks have been an especially severe consequence of the Green Revolution.32 In some cases the cause-and-effect relationship is simple. Pest populations have grown in response to higher nitrogen applications and diseases have become more prevalent in the microclimate created by the densely leaved, short-strawed wheats and rices. But often it is a combination of factors – higher nutrient levels, narrow genetic stock, uniform continuous planting and the misuse of pesticides – that have created conditions which encourage pest and disease attack. According to some critics of the Green Revolution, the growth in production owed little to the new varieties, and was primarily due to agricultural expansion, arable cultivation moving on to increasingly marginal lands. But the evidence is otherwise: although area increases were important in the 1950s, the subsequent gains were largely derived from increasing yield per hectare. Other commentators claim the growth in production has been due to infrastructural and institutional change rather than the specific technical innovations, pointing to the lack of signs of the impact of the new varieties in the regional data.33 But this is because the individual country take-offs, so clearly indicated in the graphs in this chapter, were staggered and hence are masked when aggregated together. Nevertheless, the yield growth was not solely attributable to the new varieties. They were necessary but not sufficient alone for success. Their potential could only be realized if they were supplied with high quantities of fertilizer and provided with optimal supplies of water. As was soon apparent, the new varieties yielded better than the traditional at any level of fertilizer application, although
304 Agricultural Revolutions and Change
Source: FAO, 1994 [Fertilizer data diskettes], Rome, Food and Agriculture Organization
Figure 13.9 The growth of fertilizer use in the developing countries
without fertilizer they sometimes did worse on poor soils.34 Not surprisingly, average rates of application of nitrogen fertilizers, mostly ammonium sulphate and urea, doubled and redoubled over a very short period (Figure 13.9). Because the new varieties were more exacting in their requirements, good irrigation, by providing a controlled environment for growth, became crucial. Most developing countries have both a dry and a wet growing season. Potentially, dryseason yields are 50–100 per cent greater than in the wet, but the lack of rainfall in the dry season and the high evapotranspiration rates resulting from absence of cloud cover make the crops liable to water stress. Without adequate irrigation, yields tend to be low and variable, whatever the level of fertilizer application. With irrigation and heavy fertilizer application, some of the highest cereal yields in the world have been attained. In south and southeast Asia the irrigated area grew from some 40 million hectares to over 65 million hectares between 1960 and 1980, a growth rate of 2·2 per cent per annum. By 1980 one-third of the rice area was irrigated, producing a rapid increase in the dry-season rice crop. Just how much of the increased cereal production has been due to the availability of the new varieties, how much to increased fertilizer use and how much to the growth of irrigation is a matter of argument. An analysis of the eight countries (Bangladesh, Burma, China, India, Indonesia, Philippines, Sri Lanka and Thailand) responsible for 85 per cent of the Asian rice crop suggested the three factors had a roughly equal contribution. Of the extra 117 million tons produced between 1965 and 1980, 27 million tons were attributable to the new varieties, 29 million tons to increased fertilizer use and 34 million tons to irrigation.35 Inevitably, the need to provide high levels of fertilizer and controlled, irrigated environments meant that some locations were favoured over others.
Past Successes 305
Uptake was fastest and most dramatic in those lands such as Sonora in Mexico, Luzon in the Philippines, the lowlands of Java, and the Punjab of India and Pakistan where irrigation was already well developed and where farmers, often larger than in the rest of the country, had good access to credit, had a greater propensity to take risks and were likely to be rapid adopters. Most important, innovation and adoption there was supported by governments willing and able to make and direct the necessary investments, including the necessary research structure which could take and adapt the new varieties to local conditions. These lands, scattered through Asia and Latin America, became the so-called Green Revolution lands. In summary, the Green Revolution succeeded because it focused on three interrelated actions: • • •
breeding programmes for staple cereals to produce early-maturing, day-lengthinsensitive and high-yielding varieties; the organization and distribution of packages of high-pay-off inputs, such as fertilizers, pesticides and water regulation; implementation of these technical innovations in the most favourable agroclimatic regions and for those classes of farmers with the best expectations of realizing the potential yields.
In many ways this was a triumph for technology, rather than science. The dwarfing genes had been known for decades in China and Japan and most of the breeding techniques were well established. What made the difference was the investment, in China and independently in the rest of the developing world, in institutions and in the organization of delivery of the inputs necessary to make the science productive. The success is undisputed, but it has been a revolution with serious limitations. In particular: • • • •
its impact on the poor has been less than expected; it has not reduced, and in some cases it has encouraged, natural-resource degradation and environmental problems; its geographic impact has been localized; and there are signs of diminishing returns.
Notes 1 2
H Hanson, N E Borlaug and R G Anderson, 1982. Wheat in the Third World, Boulder, CO, Westview Press The basis for determining who is ‘hungry’ has changed over time, and the figure would probably be lower if the current method of determining ‘chronic undernourishment’ was used. See D Grigg, 1993. The World Food Problem (2nd edn), Oxford, Blackwell
306 Agricultural Revolutions and Change 3 4
5
6 7
8 9 10 11 12 13 14 15 16 17 18 19 20 21 22 23 24 25 26
27 28 29
30 31 32
N Alexandratos (ed.), 1995. World Agriculture: Towards 2010, An FAO Study, Chichester (UK), Wiley & Sons C T de Wit, H H van Laar and H van Keulen, 1979. Physiological potential of food production, in J Sneep and A J T Henrickson (eds), Plant Breeding Perspectives, Wageningen (Netherlands), Centre for Agricultural Publishing and Documentation (Publ. No. 118, PUDOC), pp47–82; D L Plucknett, 1993, Science and Agricultural Transformation, Washington DC, International Food Policy Research Institute (Lecture Series) Y Ishizuka, 1969. Engineering for higher yields, in J D Eastin, F A Haskins, C Y Sullivan and C H M van Bavel (eds.), Physiological Aspects of Crop Yield, Madison, W, American Society of Agronomy and Crop Science Society of America, pp15–26; Grigg, op. cit. R F Chandler, 1982. An Adventure in Applied Science: A History of the International Rice Research Institute, Los Banos (Philippines), International Rice Research Institute E C Stakman, R Bradfield and P C Mangelsdorf, 1967. Campaigns against Hunger, Cambridge, MA, Harvard University Press; C de Alcantara Hewitt, 1976. Modernizing Mexican Agriculture: Socioeconomic Implications of Technological Change, 1940–1970, Geneva (Switzerland), UNRISD (Report No. 76.5) W J Lawrence, 1968. Plant Breeding, London, Edward Arnold (Studies in Biology No. 12) Stakman et al., op. cit. ibid. Hanson et al., op. cit. ibid. R Barker, R W Herdt and B Rose, 1985. The Rice Economy of Asia, Washington DC, Resources for the Future W C Baum, 1986. Partners against Hunger: The Consultative Group on International Agricultural Research, Washington DC, World Bank Chandler, op. cit. Barker et al., op. cit. L Brown, 1970. Seeds of Change, New York, NY, Praeger ibid. I Hauri, 1974. Le Projet Céréalier en Tunisie: Études aux Niveaux National et Local, Geneva (Switzerland), United Nations Research Institute for Social Development (Report No. 74.4) Brown, op. cit. Grigg, op. cit. Plucknett, op. cit. ibid. Grigg, op. cit. ibid. D Dalrymple, 1986. Development and Spread of High Yielding Wheat Varieties in Developing Countries, Washington DC, United States Agency for International Development; 1986. Development and Spread of High Yielding Rice Varieties in Developing Countries, Washington DC, United States Agency for International Development Hanson et al., op. cit. ibid. A Pearse, 1980. Seeds of Plenty, Seeds of Want: Social and Economic Implications of the Green Revolution, Oxford, Clarendon Press; G T Castillo, 1975. All in a Grain of Rice, Laguna (Philippines), Southeast Asian Regional Center for Graduate Study and Research in Agriculture Barker et al., op. cit. R Chambers, 1988. Managing Canal Irrigation: Practical Analysis from South Asia, New Delhi (India), Oxford and IBH Publishing Co. R F Smith, 1972. The impact of the Green Revolution on plant protection in tropical and subtropical areas, Bulletin of the Entomological Society of America, 18, 7–14
Past Successes 307 33 T Dyson, 1996. Population and Food: Global Trends and Future Prospects, London, Routledge 34 R Barker, 1978. Yield and fertiliser input, in IRRI, Changes in Rice Farming in Selected Areas of Asia, Los Baños (Philippines), International Rice Research Institute 35 R W Herdt and C Capule, 1983. Adoption, Spread, and Production Impact of Modern Rice Varieties in Asia, Los Baños (Philippines), International Rice Research Institute; P Pinstrup-Anderson and P B R Hazell, 1985. The impact of the Green Revolution and prospects for the future, Food Reviews International, 1, 1–25
14
Soviet Collectivization, Capitalist Dreams J. C. Scott
The master builders of Soviet society were rather more like Niemeyer designing Brasília than Baron Haussmann retrofitting Paris. A combination of defeat in war, economic collapse and a revolution had provided the closest thing to a bulldozed site that a state builder ever gets. The result was a kind of ultrahigh modernism that in its audacity recalled the Utopian aspects of its precursor, the French Revolution. This is not the place, nor am I the most knowledgeable guide, for an extensive discussion of Soviet high modernism.1 What I aim to do, instead, is to emphasize the cultural and aesthetic elements in Soviet high modernism. This will in turn pave the way for an examination of an illuminating point of direct contact between Soviet and American high modernism: the belief in huge, mechanized, industrial farms. In certain vital respects, Soviet high modernism is not a sharp break from Russian absolutism. Ernest Gellner has argued that of the two facets of the Enlightenment – the one asserting the sovereignty of the individual and his interests, the other commending the rational authority of experts – it was the second that spoke to rulers who wanted their ‘backward’ states to catch up. The Enlightenment arrived in Central Europe, he concludes, as a ‘centralizing rather than a liberating force’.2 Strong historical echoes of Leninist high modernism can thus be found in what Richard Stites calls the ‘administrative utopianism’ of the Russian czars and their advisers in the 18th and 19th centuries. This administrative utopianism found expression in a succession of schemes to organize the population (serfs, soldiers, workers, functionaries) into institutions ‘based upon hierarchy, discipline, regimentation, strict order, rational planning, a geometrical environment, and a form of welfarism’.3 Peter the Great’s Saint Petersburg was the urban realization of this vision. The city was laid out according to a strict rectilinear and radial plan on completely new terrain. Its straight boulevards were, by design, twice as wide as the tallest building, which was, naturally, at the geometric centre of the city. The buildings themselves reflected function and hierarchy, as the façade, height and material of each corresponded to the social class of its inhabitants. The city’s physical layout was in fact a legible map of its intended social structure. Reprinted from Scott J C. 1998. Soviet collectivism, capitalist dreams, in Seeing Like a State. Yale University Press, New Haven, pp193–222.
Soviet Collectivization, Capitalist Dreams 309
Saint Petersburg had many counterparts, urban and rural. Under Catherine the Great, Prince Grigory Potemkin established a whole series of model cities (such as Ekaterinoslav) and model rural settlements. The next two czars, Paul and Alexander I, inherited Catherine’s passion for Prussian order and efficiency.4 Their adviser, Alexei Arakcheev, established a model estate on which peasants wore uniforms and followed elaborate instructions on upkeep and maintenance, to the point of carrying ‘punishment books’ inscribed with records of their violations. This estate was made the basis of a far bolder plan for a network of widely scattered, self-sufficient military colonies, which by the late 1820s included 750,000 people. This attempt to create a new Russia, in contrast to the disorder, mobility and flux of a frontier society, quickly succumbed to popular resistance, corruption and inefficiency. Long before the Bolsheviks took power, in any case, the historical landscape was littered with the wreckage of many miscarried experiments in authoritarian social planning. Lenin and his confederates could implement their high-modernist plans starting from nearly zero. The war, the revolution and the subsequent famine had gone a long way toward dissolving the prerevolutionary society, particularly in the cities. A general collapse of industrial production had provoked a vast exodus from the cities and a virtual regression to a barter economy. The ensuing four-year civil war further dissolved existing social ties as well as schooling the hard-pressed Bolsheviks in the methods of ‘war Communism’ – requisitions, martial law, coercion. Working on a levelled social terrain and harbouring high-modernist ambitions in keeping with the distinction of being the pioneers of the first socialist revolution, the Bolsheviks thought big. Nearly everything they planned was on a monumental scale, from cities and individual buildings (the Palace of Soviets) to construction projects (the White Sea Canal) and, later, the great industrial projects of the first Five-Year Plan (Magnitogorsk), not to mention collectivization. Sheila Fitzpatrick has appropriately called this passion for sheer size ‘gigantomania’.5 The economy itself was conceived as a well-ordered machine, where everyone would simply produce goods of the description and quantity specified by the central state’s statistical bureau, as Lenin had foreseen. A transformation of the physical world was not, however, the only item on the Bolshevik agenda. It was a cultural revolution that they sought, the creation of a new person. Members of the secular intelligentsia were the most devoted partisans of this aspect of the revolution. Campaigns to promote atheism and to suppress Christian rituals were pressed in the villages. New ‘revolutionary’ funeral and marriage ceremonies were invented amidst much fanfare, and a ritual of ‘Octobering’ was encouraged as an alternative to baptism.6 Cremation – rational, clean, economical – was promoted. Along with this secularization came enormous and widely popular campaigns to promote education and literacy. Architects and social planners invented new communal living arrangements designed to supersede the bourgeois family pattern. Communal food, laundry and child-care services promised to free women from the traditional division of labour. Housing arrangements were explicitly intended to be ‘social condensers’.
310 Agricultural Revolutions and Change
The ‘new man’ – the Bolshevik specialist, engineer or functionary – came to represent a new code of social ethics, which was sometimes simply called kultura. In keeping with the cult of technology and science, kultura emphasized punctuality, cleanliness, businesslike directness, polite modesty, and good, but never showy, manners.7 It was this understanding of kultura and the party’s passion for the League of Time, with its promotion of time consciousness, efficient work habits and clock-driven routine, that were so brilliantly caricatured in Eugene Zamiatin’s novel We and that later became the inspiration for George Orwell’s 1984. What strikes an outside observer of this revolution in culture and architecture is its emphasis on public form – on getting the visual and aesthetic dimensions of the new world straight. One can perhaps see this best in what Stites calls the ‘festivals of mustering’ organized by the cultural impresario of the early Soviet state, Anatoly Lunacharsky.8 In the outdoor dramas he produced, the revolution was reenacted on a scale that must have seemed as large as the original, with cannons, bands, searchlights, ships on the river, 4000 actors and 35,000 spectators.9 Whereas the actual revolution had all the usual messiness of reality, the reenactment called for military precision, and the various actors were organized by platoon and mobilized with semaphore and field telephones. Like mass exercises, the public spectacle gave a retroactive order, purpose and central direction to the events, which were designed to impress the spectator, not to reflect the historical facts.10 If one can see in Arakcheev’s military colonies an attempt to prefigure, to represent, a wished-for order, then perhaps Lunacharsky’s staged revolution can be seen as a representation of the wished-for relationship between the Bolsheviks and the proletarian crowd. Little effort was spared to see that the ceremony turned out right. When Lunacharsky himself complained that churches were being demolished for the May Day celebrations, Lazar Kaganivich, the city boss of Moscow, replied, ‘And my aesthetics demand that the demonstration processions from the six districts of Moscow should all pour into Red Square at the same time.’11 In architecture, public manners, urban design and public ritual, the emphasis on a visible, rational, disciplined social facade seemed to prevail.12 Stites suggests that there is some inverse relation between this public face of order and purpose and the near anarchy that reigned in society at large: ‘As in the case of all such Utopias, its organizers described it in rational, symmetrical terms, in the mathematical language of planning, control figures, statistics, projections and precise commands. As in the vision of military colonies, which the Utopian plan faintly resembled, its rational facade barely obscured the oceans of misery, disorder, chaos, corruption and whimsicality that went with it.’13 One possible implication of Stites’s assertion is that, in some circumstances, what I call the miniaturization of order may be substituted for the real thing. A facade or a small, easily managed zone of order and conformity may come to be an end in itself; the representation may usurp the reality. Miniatures and small experiments have, of course, an important role in studying larger phenomena. Model aircraft built to scale and wind tunnels are essential steps in the design of new airplanes. But when the two are confused – when, say, the general mistakes the parade ground for the battlefield itself – the consequences are potentially disastrous.
Soviet Collectivization, Capitalist Dreams 311
A Soviet-American Fetish: Industrial Farming Before plunging into a discussion of the practice and logic of Soviet collectivization, we should recognize that the rationalization of farming on a huge, even national, scale was part of a faith shared by social engineers and agricultural planners throughout the world.14 And they were conscious of being engaged in a common endeavour. Like the architects of the Congrès Internationaux d’Architecture Moderne, they kept in touch through journals, professional conferences and exhibitions. The connections were strongest between US agronomists and their Russian colleagues – connections that were not entirely broken even during the Cold War. Working in vastly different economic and political environments, the Russians tended to be envious of the level of capitalization, particularly in mechanization, of US farms while the Americans were envious of the political scope of Soviet planning. The degree to which they were working together to create a new world of large-scale, rational, industrial agriculture can be judged by this brief account of their relationship. The high tide of enthusiasm for applying industrial methods to agriculture in the US stretched roughly from 1910 to the end of the 1930s. Agricultural engineers, a new specialty, were the main carriers of this enthusiasm; influenced by currents in their parent discipline, industrial engineering, and most particularly by the doctrines of the prophet of time–motion studies, Frederick Taylor, they reconceptualized the farm as a ‘food and fiber factory’.15 Taylorist principles of scientifically measuring work processes in order to break them down into simple, repetitive motions that an unskilled worker could learn quickly might work well enough on the factory floor,16 but their application to the variegated and nonrepetitive requirements of growing crops was questionable. Agricultural engineers therefore turned to those aspects of farm operation that might be more easily standardized. They tried to rationalize the layout of farm buildings, to standardize machinery and tools, and to promote the mechanization of major grain crops. The professional instincts of the agricultural engineers led them to try to replicate as much as possible the features of the modern factory. This impelled them to insist on enlarging the scale of the typical small farm so that it could massproduce standard agricultural commodities, mechanize its operation, and thereby, it was thought, greatly reduce the unit cost of production.17 As we shall see later, the industrial model was applicable to some, but not all, of agriculture. It was nonetheless applied indiscriminately as a creed rather than a scientific hypothesis to be examined sceptically. The modernist confidence in huge scale, centralization of production, standardized mass commodities and mechanization was so hegemonic in the leading sector of industry that it became an article of faith that the same principles would work, pari passu, in agriculture. Many efforts were made to put this faith to the test. Perhaps the most audacious was the Thomas Campbell ‘farm’ in Montana, begun – or, perhaps I should say, founded – in 1918.18 It was an industrial farm in more than one respect. Shares were sold by prospectuses describing the enterprise as an ‘industrial opportunity’;
312 Agricultural Revolutions and Change
J. P. Morgan, the financier, helped to raise $2 million from the public. The Montana Farming Corporation was a monster wheat farm of 95,000 acres, much of it leased from four Native American tribes. Despite the private investment, the enterprise would never have gotten off the ground without help and subsidies from the Department of Interior and the USDA. Proclaiming that farming was about 90 per cent engineering and only 10 per cent agriculture, Campbell set about standardizing as much of his operation as possible. He grew wheat and flax, two hardy crops that needed little if any attention between planting and harvest time.19 The land he farmed was the agricultural equivalent of the bulldozed site of Brasília. It was virgin soil, with a natural fertility that would eliminate the need for fertilizer. The topography also vastly simplified matters: it was flat, with no forests, creeks, rocks or ridges that would impede the smooth course of machinery over its surface. In other words, the selection of the simplest, most standardized crops and the leasing of something very close to a blank agricultural space were calculated to favour the application of industrial methods. In the first year Campbell bought 33 tractors, 40 binders, 10 threshing machines, 4 combines and 100 wagons; he employed about 50 men most of the year, but hired as many as 200 during the peak season.20 This is not the place to chronicle the fortunes of the Montana Farming Corporation, and in any event Deborah Fitzgerald has done so splendidly.21 Suffice it to note that a drought in the second year and the elimination of government support for prices the following year led to a collapse that cost J. P. Morgan $1 million. The Campbell farm faced other problems besides weather and prices: soil differences, labour turnover, the difficulty of finding skilled, resourceful workers who would need little supervision. Although the corporation struggled on until Campbell’s death in 1966, it provided no evidence that industrial farms were superior to family farms in efficiency and profitability. The advantages industrial farms did have over smaller producers were of another kind. Their very size gave them an edge in access to credit, political influence (relevant to taxes, support payments and the avoidance of foreclosure) and marketing muscle. What they gave away in agility and quality labour they often made up for in their considerable political and economic clout. Many large industrial farms managed along scientific lines were established in the 1920s and 1930s.22 Some of them were the stepchildren of depression foreclosures that left banks and insurance companies holding many farms they could not sell. Such ‘chain farms’, consisting of as many as 600 farmsteads organized into one integrated operation (one farm to farrow pigs, say, and another to feed them out, along the lines of contemporary ‘contract farming’ for poultry), were quite common, and buying into them was a speculative investment.23 They proved no more competitive to the family farm than did Campbell’s corporation. In fact, they were so highly capitalized that they were vulnerable to unfavourable credit markets and lower farm gate prices, given their high fixed costs in payroll and interest. The family farm could, by contrast, more easily tighten its belt and move into a subsistence mode.
Soviet Collectivization, Capitalist Dreams 313
The most striking proposal designed to reconcile the American small-property regime with huge economies of scale and scientific, centralized management was that of Mordecai Ezekial and Sherman Johnson in 1930. They outlined a ‘national farming corporation’ that would incorporate all farms. It would be vertically integrated and centralized and ‘could move raw farming materials through the individual farms of the country, could establish production goals and quotas, distribute machinery, labor and capital, and move farm products from one region to another for processing and use. Bearing a striking resemblance to the industrial world, this organizational plan was a sort of gigantic conveyor belt’.24 Ezekial was no doubt influenced by his recent tour of Russian collective farms as well as by the plight of the depression-stricken economy. Johnson and Ezekial were hardly alone in calling for centralized industrial farming on a massive scale, not just as a response to economic crisis but as a matter of confidence in an ineluctable highmodernist future. The following expression of that confidence is fairly representative: ‘Collectivization is posed by history and economics. Politically, the small farmer or peasant is a drag on progress. Technically, he is as antiquated as the small machinists who once put automobiles together by hand in little wooden sheds. The Russians have been the first to see this clearly, and to adapt themselves to historical necessity.’25 Behind these admiring references to Russia was less a specifically political ideology than a shared high-modernist faith. That faith was reinforced by something on the order of an improvised, high-modernist exchange programme. A great many Russian agronomists and engineers came to the US, which they regarded as the Mecca of industrial farming. Their tour of US agriculture nearly always included a visit to Campbell’s Montana Farming Corporation and to M. L. Wilson, who in 1928 headed the Department of Agricultural Economics at Montana State University and later became a high-level official in the Department of Agriculture under Henry Wallace. The Russians were so taken with Campbell’s farm that they said they would provide him with 1 million acres if he would come to the Soviet Union and demonstrate his farming methods.26 Traffic in the other direction was just as brisk. The Soviet Union had hired thousands of US technicians and engineers to help in the design of various elements of Soviet industrial production, including the production of tractors and other farm machinery. By 1927, the Soviet Union had also purchased 27,000 American tractors. Many of the American visitors, such as Ezekial, admired Soviet state farms, which by 1930 offered the promise of collectivized agriculture on a massive scale. The Americans were impressed not just by the sheer size of the state farms but also by the fact that technical specialists – agronomists, economists, engineers, statisticians – were, it seemed, developing Russian production along rational, egalitarian lines. The failure of the Western market economy in 1930 reinforced the attractiveness of the Soviet experiment. Visitors travelling in either direction returned to their own country thinking that they had seen the future.27 As Deborah Fitzgerald and Lewis Feuer argue, the attraction that collectivization held for American agricultural modernizers had little to do with a belief in
314 Agricultural Revolutions and Change
Marxism or an affinity for Soviet life.28 ‘Rather it was because the Soviet idea of growing wheat on an industrial scale and in an industrial fashion was similar to US ideas about the direction American agriculture should take.’29 Soviet collectivization represented, to these American viewers, an enormous demonstration project without the political inconveniences of American institutions; ‘that is, the Americans viewed the giant Soviet farms as huge experiment stations on which Americans could try out their most radical ideas for increasing agricultural production, and, in particular, wheat production. Many of the things they wished to learn more about simply could not be tried in America, partly because it would cost too much, partly because no suitable large farmsite was available, and partly because many farmers and farm laborers would be alarmed at the implications of this experimentation.’30 The hope was that the Soviet experiment would be to American industrial agronomy more or less what the Tennessee Valley Authority was to be to American regional planning: a proving ground and a possible model for adoption. Although Campbell did not accept the Soviet offer of a vast demonstration farm, others did. M. L. Wilson, Harold Ware (who had extensive experience in the Soviet Union), and Guy Riggin were invited to plan a huge mechanized wheat farm of some 500,000 acres of virgin land. It would be, Wilson wrote to a friend, the largest mechanized wheat farm in the world. They planned the entire farm layout, labour force, machinery needs, crop rotations and lockstep work schedule in a Chicago hotel room in two weeks in December 1928.31 The fact that they imagined that such a farm could be planned in a Chicago hotel room underlines their presumption that the key issues were abstract, technical interrelationships that were context-free. As Fitzgerald perceptively explains: ‘Even in the U.S., those plans would have been optimistic, actually, because they were based on an unrealistic idealization of nature and human behavior. And insofar as the plans represented what the Americans would do if they had millions of acres of flat land, lots of laborers, and a government commitment to spare no expense in meeting production goals, the plans were designed for an abstract, theoretical kind of place. This agricultural place, which did not correspond to America, Russia, or any other actual location, obeyed the laws of physics and chemistry, recognized no political or ideological stance.’32 The giant sovkhoz, named Verblud, which they established near Rostov-onDon, one thousand miles south of Moscow, comprised 375,000 acres that were to be sown to wheat. As an economic proposition, it was an abject failure, although in the early years it did produce large quantities of wheat. The detailed reasons for the failure are of less interest for our purposes than the fact that most of them could be summarized under the rubric of context. It was the specific context of this specific farm that defeated them. The farm, unlike the plan, was not a hypothecated, generic, abstract farm but an unpredictable, complex and particular farm, with its own unique combination of soils, social structure, administrative culture, weather, political strictures, machinery, roads and the work skills and habits of its employees. As we shall see, it resembled Brasília in being the kind of failure typical
Soviet Collectivization, Capitalist Dreams 315
of ambitious high-modernist schemes for which local knowledge practice, and context are considered irrelevant or at best an annoyance to be circumvented.
Collectivization in Soviet Russia What we have here isn’t a mechanism, it’s people living here. You can’t get them squared around until they get themselves arranged. I used to think of the revolution as a steam engine, but now I see that it’s not. Andrei Platonov, Chevengur The collectivization of Soviet agriculture was an extreme but diagnostic case of authoritarian high-modernist planning. It represented an unprecedented transformation of agrarian life and production, and it was imposed by all the brute force at the state’s disposal. The officials who directed this massive change, moreover, were operating in relative ignorance of the ecological, social and economic arrangements that underwrote the rural economy. They were flying blind. Between early 1930 and 1934, the Soviet state waged a virtual war in the countryside. Realizing that he could not depend on the rural Soviets to ‘liquidate the kulaks’ and collectivize, Stalin dispatched 25,000 battle-tested, urban Communists and proletarians with full powers to requisition grain, arrest resistors and collectivize. He was convinced that the peasantry was trying to bring down the Soviet state. In reply to a personal letter from Mikhail Sholokhov (author of And Quiet Flows the Don) alerting him to the fact that peasants along the Don were on the verge of starvation, Stalin replied, ‘The esteemed grain growers of your district (and not only of your district alone) carried on an “Italian strike” (ital’ianka), sabotage!, and were not loathe to leave the workers and the Red Army without bread. That the sabotage was quiet and outwardly harmless (without bloodshed) does not change the fact that the esteemed grain growers waged what was virtually a “quiet” war against Soviet power. A war of starvation, dear comrade Sholokhov.’33 The human costs of that war are still in dispute, but they were undeniably grievous. Estimates of the death toll alone, as a result of the ‘dekulakization’ and collectivization campaigns and the ensuing famine, range from a ‘modest’ 3 or 4 million to, as some current Soviet figures indicate, more than 20 million. The higher estimates have, if anything, gained more credibility as new archival material has become available. Behind the deaths rose a level of social disruption and violence that often exceeded that of the civil war immediately following the revolution. Millions fled to the cities or to the frontier, the infamous gulag was vastly enlarged, open rebellion and famine raged in much of the countryside, and more than half of the nation’s livestock (and draft power) was slaughtered.34 By 1934, the state had ‘won’ its war with the peasantry. If ever a war earned the designation ‘Pyrrhic victory’, this is the one. The sovkhoz (state farms) and kolkhoz
316 Agricultural Revolutions and Change
(collective farms) failed to deliver on any of the specifically socialist goals envisioned by Lenin, Trotsky, Stalin and most Bolsheviks. They were an evident failure in raising the level of grain production or of producing cheap and abundant foodstuffs for an urban, industrializing workforce. They failed to become the technically efficient and innovative farms that Lenin had anticipated. Even in the realm of electrification, Lenin’s touchstone of modernization, only 1 in 25 collective farms had electricity by the eve of World War II. By no measure had the collectivization of agriculture created ‘new men and women’ in the countryside or abolished the cultural difference between the country and the city. For the next half-century, the yields per hectare of many crops were stagnant or actually inferior to the levels recorded in the 1920s or the levels reached before the Revolution.35 At another level, collectivization was, in a curious state-centric way, a qualified success. Collectivization proved a rough-and-ready instrument for the twin goals of traditional statecraft: appropriation and political control. Though the Soviet kolkhoz may have failed badly at generating huge surpluses of foodstuffs, it served well enough as a means whereby the state could determine cropping patterns, fix real rural wages, appropriate a large share of whatever grain was produced, and politically emasculate the countryside.36 The great achievement, if one can call it that, of the Soviet state in the agricultural sector was to take a social and economic terrain singularly unfavourable to appropriation and control and to create institutional forms and production units far better adapted to monitoring, managing, appropriating and controlling from above. The rural society that the Soviet state inherited (and for a time encouraged) was one in which the allies of the czarist state, the great landlords and the aristocratic officeholders, had been swept away and been replaced by smallholding and middle peasants, artisans, private traders and all sorts of mobile labourers and lumpen elements.37 Confronting a tumultuous, footloose and ‘headless’ (acephalous) rural society which was hard to control and which had few political assets, the Bolsheviks, like the scientific foresters, set about redesigning their environment with a few simple goals in mind. They created, in place of what they had inherited, a new landscape of large, hierarchical, state-managed farms whose cropping patterns and procurement quotas were centrally mandated and whose population was, by law, immobile. The system thus devised served for nearly 60 years as a mechanism for procurement and control at a massive cost in stagnation, waste, demoralization and ecological failure. That collectivized agriculture persisted for 60 years was a tribute less to the plan of the state than to the improvisations, grey markets, bartering and ingenuity that partly compensated for its failures. Just as an ‘informal Brasília’, which had no legitimate place in official plans, arose to make the city viable, so did a set of informal practices lying outside the formal command economy – and often outside Soviet law as well – arise to circumvent some of the colossal waste and inefficiencies built into the system. Collectivized agriculture, in other words, never quite operated according to the hierarchical grid of its production plans and procurements.
Soviet Collectivization, Capitalist Dreams 317
What seems clear, in the brief account that follows, is that collectivization per se cannot be laid solely at the feet of Stalin, though he bore much responsibility for its exceptional speed and brutality.38 A collectivized agriculture was always part of the Bolshevik map of the future, and the great procurement struggles of the late 1920s could hardly have had any other outcome in the context of the decision to pursue forced-draft industrialization. The party’s high-modernist faith in great collectivist schemes survived long after the desperate improvisations of the early 1930s. That faith, which claimed to be both aesthetic and scientific, is clearly visible in a much later agrarian high-modernist dream: namely, Khrushchev’s virgin lands scheme, launched well after Stalin’s death and after his crimes during collectivization had been publicly denounced. What is remarkable is how long these beliefs and structures prevailed, in spite of the evidence of their manifold failings.
Round one: The Bolshevik state and the peasantry It sometimes seems to me that if I could persuade everyone to say ‘systematize’ each time he wanted to say ‘liberate’ and to say ‘mobilization’ every time he wanted to say ‘reform’ or ‘progress’ I would not have to write long books about government–peasant interaction in Russia. George Yaney, The Urge to Mobilize In the particular book quoted above, Yaney was writing about pre-revolutionary Russia, but he could just as easily have been writing about the Bolshevik state. Until 1930, the continuities between the rural policy of the Leninist state and its czarist predecessor are more striking than their differences. There is the same belief in reform from above and in large, modern, mechanized farms as the key to productive agriculture. There is also, alas, the same high level of ignorance about a very complex rural economy coupled, disastrously, with heavy-handed raids on the countryside to seize grain by force. Although the continuities persisted even after the institutional revolution of 1930, what is new about the all-out drive to collectivize is the revolutionary state’s willingness to completely remake the institutional landscape of the agrarian sector, and at whatever cost. The new Bolshevik state faced a rural society that was significantly more opaque, resistant, autonomous and hostile than the one encountered by the czarist bureaucracy. If the czarist officials had provoked massive defiance and evasion in their ‘crude Muscovite tribute-collecting methods’ during World War I,39 there was every reason to suspect that the Bolsheviks would have an even harder time squeezing grain from the countryside. If much of the countryside was hostile to the Bolsheviks, the sentiment was abundantly reciprocated. For Lenin, as we have seen, the Land Decree, which gave to the peasants the land that they had seized, had been a strategic manoeuvre designed to buy rural quiescence while power was consolidated; he had no doubt that peasant smallholdings must eventually be abolished in favour of large,
318 Agricultural Revolutions and Change
socialized farms. For Trotsky, the sooner what he called ‘the Russia of icons and cockroaches’ was transformed and ‘urbanized’, the better. And for many of the newly urbanized, rank-and-file Bolsheviks, the abolition of the ‘dark and backward peasant world’ was a ‘vital part of their own emerging personal and working-class identity’.40 The peasantry was virtually terra incognita to the Bolsheviks. At the time of the revolution, the party had throughout Russia a grand total of 494 ‘peasant’ members (most of them probably rural intelligentsia).41 Most villagers had never seen a Communist, although they may well have heard of the Bolshevik decree confirming peasant ownership of the land that had been seized. The only revolutionary party with any rural following was the Social Revolutionaries, whose populist roots tended to make them unsympathetic to Lenin’s authoritarian outlook. The effects of the revolutionary process itself had rendered rural society more opaque and hence more difficult to tax. There had already been a sweeping seizure of land, dignified, retrospectively, by the inappropriate term ‘land reform’. In fact, after the collapse of the offensive into Austria during the war and the subsequent mass desertions, much of the land of the gentry and church, as well as ‘crown land’, had been absorbed by the peasantry. Rich peasants cultivating independent farmsteads (the ‘separators’ of the Stolypin reforms) were typically forced back into the village allotments, and rural society was in effect radically compressed. The very rich had been dispossessed, and many of the very poor became smallholders for the first time in their lives. According to one set of figures, the number of landless rural labourers in Russia dropped by half, and the average peasant holding increased by 20 per cent (in the Ukraine, by 100 per cent). A total of 248 million acres was confiscated, almost always by local initiative, from large and small landlords and added to peasant holdings, which now averaged about 70 acres per household.42 From the perspective of a tax official or a military procurement unit, the situation was nearly unfathomable. The land-tenure status in each village had changed dramatically. Prior landholding records, if they existed at all, were entirely unreliable as a guide to current land claims. Each village was unique in many respects, and, even if it could in principle have been ‘mapped’, the population’s mobility and military turmoil of the period all but guaranteed that the map would have been made obsolete in six months or sooner. The combination, then, of smallholdings, communal tenure and constant change, both spatial and temporal, operated as an impenetrable barrier to any finely tuned tax system. Two additional consequences of the revolution in the countryside compounded the difficulties of state officials. Before 1917, large peasant farms and landlord enterprises had produced nearly three-quarters of the grain marketed for domestic use and export. It was this sector of the rural economy that had fed the cities. Now it was gone. The bulk of the remaining cultivators were consuming a much larger share of their own yield. They would not surrender this grain without a fight. The new, more egalitarian distribution of land meant that extracting anything like the czarist ‘take’ in grain would bring the Bolsheviks in conflict with the subsistence needs of small and middle peasants.43
Soviet Collectivization, Capitalist Dreams 319
The second and perhaps decisive consequence of the revolution was that it had greatly enhanced the determination and capacity of peasant communities to resist the state. Every revolution creates a temporary power vacuum when the power of the ancien regime has been destroyed but the revolutionary regime has not yet asserted itself throughout the territory. Inasmuch as the Bolsheviks were largely urban and found themselves fighting an extended civil war, the power vacuum in much of the countryside was unusually pronounced. It was the first time, as Orlando Figes reminds us, that the villages, although in straitened circumstances, were free to organize their own affairs.44 As we have seen, the villagers typically forced out or burned out the gentry, seized the land (including rights to common land and forests), and forced the separators back into the communes. The villages tended to behave as autonomous republics, well disposed to the Reds as long as they confirmed the local ‘revolution’, but strongly resistant to forced levies of grain, livestock or men from any quarter. In this situation, the fledgling Bolshevik state, arriving as it often did in the form of military plunder, must have been experienced by the peasantry as a reconquest of the countryside by the state – as a brand of colonization that threatened their newly won autonomy. Given the political atmosphere in rural Russia, even a government having detailed knowledge of the agricultural economy, a local base of support, and a knack for diplomatic tact would have confronted great difficulties. The Bolsheviks lacked all three. A tax system based on income or wealth was possible only with a valid cadastral map and an up-to-date census, neither of which existed. Farm income, moreover, varied greatly with regard to yields and prices from year to year, so any income tax would have had to have been exceptionally sensitive to these conditions in local harvests. Not only did the new state lack the basic information it needed to govern efficiently, it had also largely destroyed the czarist state apparatus of local officials, gentry and specialists in finance and agronomy who had managed, however inadequately, to collect taxes and grain during the war. Above all, the Bolsheviks generally lacked the village-level native trackers who could have helped them to find their way in a hostile and confusing environment. The village Soviets that were supposed to play this role were typically headed by villagers loyal to local interests rather than to the centre. An alternative organ, the Committee of the Rural Poor (kombedy), which purported to represent the rural proletariat in local class struggles, was either successfully coopted by the village or locked in often violent conflict with the village soviet.45 The inscrutability of the mir to most Bolshevik officials was not simply a result of their urban social origins and the admitted complexity of village affairs. It was also the product of a conscious local strategy, one that had demonstrated its protective value in earlier conflicts with the gentry and the state. The local commune had a long history of underreporting its arable land and overreporting its population in order to appear as poor and untaxable as possible.46 As a result of such deception in the census of 1917, the arable land in Russia had been underestimated by about 15 per cent. Now, in addition to the woodland, pastures and open land that the peasantry had earlier converted into cropland without reporting it,
320 Agricultural Revolutions and Change
they had an interest in hiding much of the land they had just seized from the landlords and the gentry. Village committees did, of course, keep records for allocating allotment land, organizing communal plough teams, fixing grazing schedules, and so on, but none of these records was made available either to officials or to the kombedy. A popular saying of the period captures the situation nicely: the peasant ‘owned by decree’ (that is, the Land Decree) but ‘lived secretly’. How did the hard-pressed state find its way in this labyrinth? Where possible, the Bolsheviks did try to establish large state farms or collective farms. Many of these were ‘Potemkin collectives’ designed merely to give cover of legitimacy to existing practices. But where they were not a sham, they revealed the political and administrative attractiveness of a radical simplification of the landholding and taxpaying unit in the countryside. Yaney’s summary of the logic entailed is impeccable. From a technical point of view it was infinitely easier to plough up large units of land without regard for individual claims than it was to identify each family allotment, measure its value in the peasants’ traditional terms, and then painfully transpose it from scattered strips into a consolidated farm. Then, too, a capital city administrator could not help but prefer to supervise and tax large productive units and not have to deal with separate farmers… The collective had a dual appeal to authentic agrarian reformers. They represented a social ideal for rhetorical purposes, and at the same time they seemed to simplify the technical problems of land reform and state control.47
In the turmoil of 1917–1921, not many such agrarian experiments were possible, and those that were attempted generally failed badly. They were, however, a straw in the wind for the full collectivization campaign a decade later. Unable to remake the rural landscape, the Bolsheviks turned to the same methods of forced tribute under martial law that had been used by their czarist predecessors during the war. The term ‘martial law’, however, conveys an orderliness that was absent from actual practice. Armed bands (otriady) – some authorized and others formed spontaneously by hungry townsmen – plundered the countryside during the grain crisis of spring and summer 1918, securing whatever they could. Insofar as grain procurement quotas were set at all, they were ‘purely mechanical accounting figures originating from an unreliable estimate of arable and assuming a good harvest’. They were, from the beginning, ‘fictional and unfulfillable’.48 The procurement of grain looked more like plunder and theft than delivery and purchase. Over 150 distinct uprisings, by one estimate, erupted against the state’s grain seizures. Since the Bolsheviks had, in March 1918, renamed themselves the Communist Party, many of the rebels claimed to be for the Bolsheviks and the Soviets (whom they associated with the Land Decree) and against the Communists. Lenin, referring to the peasant uprisings in Tambov, the Volga and the Ukraine, declared that they posed more of a threat than all the Whites put together. Desperate peasant resistance had in fact all but starved the cities out of existence,49 and in early 1921, the party, for the first time, turned its guns on its own rebellious
Soviet Collectivization, Capitalist Dreams 321
sailors and workers in Kronstadt. At this point the beleaguered party beat a tactical retreat, abandoning War Communism and inaugurating the New Economic Policy (NEP), which condoned free trade and small property. As Figes notes, ‘Having defeated the White Army, backed by eight Western powers, the Bolshevik government surrendered before its own peasants.’50 It was a hollow victory. The deaths from the hunger and epidemics of 1921–1922 nearly equalled the toll claimed by World War I and the civil war combined.
Round two: High modernism and procurement The conjunction of a high-modernist faith in what agriculture should look like in the future and a more immediate crisis of state appropriation helped to spark the all-out drive to collectivization in the winter of 1929–1930. In focusing on just these two issues, we must necessarily leave to others (and they are a multitude) the gripping issues of the human costs of collectivization, the struggle with the ‘right’ opposition led by Bukharin, and whether Stalin intended to liquidate Ukrainian culture as well as many Ukrainians. There is no doubt that Stalin shared Lenin’s faith in industrial agriculture. The aim of collectivization, he said in May 1928, was ‘to transfer from small, backward, and fragmented peasant farms to consolidated, big, public farms, provided with machines, equipped with the data of science, and capable of producing the greatest quantity of grain for the market’.51 This dream had been deferred in 1921. There had been some hope that a gradually expanding collective sector in the 1920s could provide as much as onethird of the country’s grain needs. Instead, the collectivized sector (both the state farms and the collective farms), which absorbed 10 per cent of the labour force, produced a dismal 2.2 per cent of gross farm production.52 When Stalin decided on a crash industrialization programme, it was clear that the existing socialist agricultural sector could not provide either the food for a rapidly growing urban workforce or the grain exports necessary to finance the imported technology needed for industrial growth. The middle and rich peasants, many of them newly prosperous since the New Economic Policy, had the grain he needed. Beginning in 1928, the official requisition policy put the state on a collision course with the peasantry. The mandated delivery price of grain was one-fifth of the market price, and the regime returned to using police methods as peasant resistance stiffened.53 When the procurements faltered, those who refused to deliver what was required (who, along with anyone else opposing collectivization, were called kulaks, regardless of their economic standing) were arrested for deportation or execution, and all their grain, equipment, land and livestock were seized and sold. The orders sent to those directly in charge of grain procurement specified that they were to arrange meetings of poor peasants to make it seem as if the initiative had come from below. It was in the context of this war over grain, and not as a carefully planned policy initiative, that the decision to force ‘total’ (sploshnaia) collectivization was made in late 1929. Scholars who agree on little else are in
322 Agricultural Revolutions and Change
accord on this point: the overriding purpose of collectivization was to ensure the seizure of grain. Fitzpatrick begins her study of the collectives with this assertion: ‘The main purpose of collectivization was to increase state grain procurements and reduce the peasants’ ability to withhold grain from the market. This purpose was obvious to peasants from the start, since the collectivization drive of the winter of 1929–1930 was the culmination of more than two years of bitter struggle between the peasants and the state over grain procurements.’54 Robert Conquest concurs: ‘The collective farms were essentially a chosen mechanism for extracting grain and other products.’55 It appears that this was also how the vast majority of the peasantry saw it, judging from their determined resistance and what we know of their views. The seizure of grain threatened their survival. The peasant depicted in Andrei Platonov’s novel about collectivization sees how the seizure of grain negates the earlier land reform: ‘It’s a sly business. First you hand over the land, and then you take away the grain, right down to the last kernel. You can choke on land like that! The muzhik doesn’t have anything left from the land except the horizon. Who are you fooling?’56 At least as threatening was the loss of what little margin of social and economic autonomy the peasantry had achieved since the revolution. Even poor peasants were afraid of collectivization, because ‘it would involve giving up one’s land and implements and working with other families, under orders, not temporarily, as in the army, but forever – it means the barracks for life.’57 Unable to rely on any significant rural support, Stalin dispatched 25,000 ‘plenipotentiaries’ (party members) from the towns and factories ‘to destroy the peasant commune and replace it by a collective economy subordinate to the state’, whatever the cost.58
Authoritarian high-modernist theory and the practice of serfdom If the move to ‘total’ collectivization was directly animated by the party’s determination to seize the land and the crops sown on it once and for all, it was a determination filtered through a high-modernist lens. Although the Bolsheviks might disagree about means, they did think they knew exactly what modern agriculture should look like in the end; their understanding was as much visual as scientific. Modern agriculture was to be large in scale, the larger the better; it was to be highly mechanized and run hierarchically along scientific, Taylorist principles. Above all, the cultivators were to resemble a highly skilled and disciplined proletariat, not a peasantry. Stalin himself, before practical failures discredited a faith in colossal projects, favoured collective farms (‘grain factories’) of 125,000 to 250,000 acres, as in the American-assisted scheme described earlier.59 The Utopian abstraction of the vision was matched, on the ground, by wildly unrealistic planning. Given a map and a few assumptions about scale and mechanization, a specialist could devise a plan with little reference to local knowledge and conditions. A visiting agricultural official wrote back to Moscow from the Urals in March 1930 to complain that, ‘on the instruction of the Raion Executive
Soviet Collectivization, Capitalist Dreams 323
Committee, twelve agronomists have been sitting for twenty days composing an operational-production plan for the non-existent raion commune without ever leaving their offices or going out into the field’.60 When another bureaucratic monstrosity in Velikie Lukie in the west proved unwieldy, the planners simply reduced the scale without sacrificing abstraction. They divided the 80,000-hectare scheme into 32 equal squares of 2500 hectares each, with one square constituting a kolkhoz. ‘The squares were drawn on a map without any reference to actual villages, settlements, rivers, hills, swamps or other demographic and topological characteristics of the land.’61 Semiotically, we cannot understand this modernist vision of agriculture as an isolated ideological fragment. It is always seen as the negation of the existing rural world. A kolkhoz is meant to replace a mir or village, machines to replace horsedrawn ploughs and hand labour, proletarian workers to replace peasants, scientific agriculture to replace folk tradition and superstition, education to replace ignorance and malokulturnyi, and abundance to replace bare subsistence. Collectivization was meant to spell the end of the peasantry and its way of life. The introduction of a socialist economy entailed a cultural revolution as well; the ‘dark’ narod, the peasants who were perhaps the great remaining, intractable threat to the Bolshevik state, were to be replaced by rational, industrious, de-Christianized, progressivethinking kolkhoz workers.62 The scale of collectivization was intended to efface the peasantry and its institutions, thereby narrowing the gulf between the rural and urban worlds. Underlying the whole plan, of course, was the assumption that the great collective farms would operate like factories in a centralized economy, in this case fulfilling state orders for grain and other agricultural products. As if to drive the point home, the state confiscated roughly 63 per cent of the entire harvest in 1931. From a central planner’s perspective, one great advantage of collectivization is that the state acquired control over how much of each crop was sown. Starting with the state’s needs for grains, meat, dairy products and so on, the state could theoretically build those needs into its instructions to the collective sector. In practice, the sowing plans imposed from above were often wholly unreasonable. The land departments, which prepared the plans, knew little about the crops they were mandating, the inputs needed to grow them locally, or local soil conditions. Nevertheless, they had quotas to fill, and fill them they did. When, in 1935, A. Iakovlev, the head of the Central Committee’s agricultural department, called for collective farms to be managed by ‘permanent cadres’ who ‘genuinely knew their fields’, he implied that the present incumbents did not.63 We catch a glimpse of the disasters from the Great Purges of 1936–1937, when a certain amount of peasant criticism of kolkhoz officials was briefly encouraged in order to detect ‘wreckers’. One kolkhoz was instructed to plough meadows and open land, without which they could not have fed their livestock. Another received sowing orders that doubled the previous acreage allotted for hay fields by taking in private plots and quicksands.64 The planners clearly favoured monoculture and a far-reaching, strict division of labour. Entire regions, and certainly individual kolkhozy, were increasingly specialized, producing only, say, wheat, livestock, cotton or potatoes.65 In the case
324 Agricultural Revolutions and Change
of livestock production, one kolkhoz would produce fodder for beef cattle or hogs while another would raise and breed them. The logic behind kolkhoz and regional specialization was roughly comparable to the logic behind functionally specific urban zones. Specialization reduced the number of variables that agronomists had to consider; it also increased the administrative routinization of work and hence the power and knowledge of central officials. Procurement followed a comparable centralizing logic. Starting with the needs of the plan and a usually unreliable estimate of the harvest, a series of quotas for every oblast, raion and kolkhoz was mechanically derived. Each kolkhoz then claimed that its quota was impossible to fulfil and appealed to have it lowered. Actually meeting a quota, they knew from bitter experience, only raised the ante for the next round of procurements. In this respect collective farmers were in a more precarious situation than industrial workers, who still received their wages and ration cards whether or not the factory met its quota. For the kolkhozniki, however, meeting the quota might mean starvation. Indeed, the great famine of 1933–1934 can only be called a collectivization and procurement famine. Those who were tempted to make trouble risked running afoul of a more grisly quota: the one for kulaks and enemies of the state. For much of the peasantry, the authoritarian labour regime of the kolkhoz seemed not only to jeopardize their subsistence but to revoke many of the freedoms they had won since their emancipation in 1861. They compared collectivization to the serfdom their grandparents remembered. As one early sovkhoz worker put it, ‘The sovkhozy are always forcing the peasants to work; they make the peasants weed their fields. And they don’t even give us bread or water. What will come of all this? It’s like barschina [feudal labour dues] all over again.’66 The peasants began to say that the acronym for the Ail-Union Communist Party – VKP – stood for vtoroe krepostnoe pravo, or ‘second serfdom’.67 The parallel was not a mere figure of speech; the resemblances to serfdom were remarkable.68 The kolkhoz members were required to work on the state’s land at least half-time for wages, in cash or kind, that were derisory. They depended largely on their own small private plots to grow the food they needed (other than grain), although they had little free time to cultivate their gardens.69 The quantity to be delivered and price paid for kolkhoz produce was set by the state. The kolkhozniki owed annual corvée labour dues for roadwork and cartage. They were obliged to hand over quotas of milk, meat, eggs and so on from their private plots. The collective’s officials, like feudal masters, were wont to use kolkhoz labour for their private sidelines and had, in practice if not in law, the arbitrary power to insult, beat or deport the peasants. As they were under serfdom, they were legally immobilized. An internal passport system was reintroduced to clear the cities of ‘undesirable and unproductive residents’ and to make sure that the peasantry did not flee. Laws were passed to deprive the peasantry of the firearms they used for hunting. Finally, the kolkhozniki living outside the village nucleus (khutor dwellers), often on their old farmsteads, were forcibly relocated, beginning in 1939. This last resettlement affected more than half a million peasants.
Soviet Collectivization, Capitalist Dreams 325
The resulting labour rules, property regime and settlement pattern did in fact resemble a cross between plantation or estate agriculture on one hand and feudal servitude on the other. As a vast, state-imposed blueprint for revolutionary change, collectivization was at least as notable for what it destroyed as for what it built. The initial intent of collectivization was not just to crush the resistance of well-to-do peasants and grab their land; it was also to dismantle the social unit through which that resistance was expressed: the mir. The peasant commune had typically been the vehicle for organizing land seizures during the revolution, for orchestrating land use and grazing, for managing local affairs generally, and for opposing procurements.70 The party had every reason to fear that if the collectives were based on the traditional village, they would simply reinforce the basic unit of peasant resistance. Hadn’t the village Soviets quickly escaped the state’s control? Huge collectives, then, had the decided advantage of bypassing village structures altogether. They could be run by a board consisting of cadres and specialists. If the giant kolkhoz was then divided into sections, one specialist could be named manager of each, ‘“like the bailiffs in the old days” [of serfdom] as [one] … report wryly noted’.71 Eventually, except in frontier areas, practical considerations prevailed and a majority of the kolkhozy coincided roughly with the earlier peasant commune and its lands. The kolkhoz was not, however, just window dressing hiding a traditional commune. Almost everything had changed. All the focal points for an autonomous public life had been eliminated. The tavern, rural fairs and markets, the church and the local mill disappeared; in their places stood the kolkhoz office, the public meeting room, and the school. Nonstate public spaces gave way to the state spaces of government agencies, albeit local ones. The concentration, legibility and centralization of social organization and production can be seen in the map of the state farm at Verchnyua Troitsa (Upper Trinity) in Tver Oblast (Figure 14.1).72 Much of the old village has been removed from the centre and relocated on the outskirts (legend reference 11).73 Two-story apartment houses containing 16 flats each have been clustered near the centre (legend references 13, 14, 15; see also Figure 14.2), while the local administration and trade centre, school and community building, all public institutions run by the state, lie close to the centre of the new grid. Even allowing for the exaggerated formalism of the map, the state farm is a far cry from the sprawl and autonomous institutional order of the precollectivized village; a photograph showing the oldstyle housing and a lane illustrates the stark visual contrast (see Figure 14.3). Compared to Haussmann’s retrofitting of the physical geography of Paris to make it legible and to facilitate state domination, the Bolsheviks’ retrofitting of rural Russia was far more thoroughgoing. In place of an opaque and often obstinate mir, it had fashioned a legible kolkhoz. In place of myriad small farms, it had created a single, local economic unit.74 With the establishment of hierarchical state farms, a quasi-autonomous petite bourgeoisie was replaced with dependent employees. In place, therefore, of an agriculture in which planting, harvesting and marketing decisions were in the hands of individual households, the party-state
326 Agricultural Revolutions and Change
1, community centre; 2, monument; 3, hotel; 4, local administration and trade centre; 5, school; 6, kindergarten; 7–8, museums; 9, shop; 10, bathhouse; 11, old wooden house moved from new construction area; 12, old village; 13–15, two- and three-storey houses; 16, garage (private); and 17, agricultural sites (farm, storage, water tower and so on)
Figure 14.1 Plan of the state farm at Verchnyua Troitsa (Upper Trinity) in Tver Oblast
had built a rural economy where all these decisions would be made centrally. In place of a peasantry that was technically independent, it had created a peasantry that was directly dependent on the state for combines and tractors, fertilizer and seeds. In place of a peasant economy whose harvests, income and profits were wellnigh indecipherable, it had created units that were ideal for simple and direct appropriation. In place of a variety of social units with their own unique histories and practices, it had created homologous units of accounting that could all be fitted into a national administrative grid. The logic was not unlike the management scheme at McDonald’s: modular, similarly designed units producing similar products, according to a common formula and work routine. Units can easily be duplicated across the landscape, and the inspectors coming to assess their operations enter legible domains which they can evaluate with a single checklist. Any comprehensive assessment of 60 years of collectivization would require both archival material only now becoming available and abler hands than my own. What must strike even a casual student of collectivization, however, is how it largely failed in each of its high-modernist aims, despite huge investments in machinery, infrastructure and agronomic research. Its successes, paradoxically, were in the domain of traditional statecraft. The state managed to get its hands on enough grain to push rapid industrialization, even while contending with staggering inefficiencies,
Soviet Collectivization, Capitalist Dreams 327
Figure 14.2 At Verchnyua Troitsa, one of the new village’s two-storey houses, each containing 16 flats
stagnant yields and ecological devastation.75 The state also managed, at great human cost, to eliminate the social basis of organized, public opposition from the rural population. On the other hand, the state’s capacity for realizing its vision of large, productive, efficient, scientifically advanced farms growing high-quality products for market was virtually nil. The collectives that the state had created manifested in some ways the facade of modern agriculture without its substance. The farms were highly mechanized (by world standards), and they were managed by officials with degrees in agronomy and engineering. Demonstration farms really did achieve large yields, although often at prohibitive costs.76 But in the end none of this could disguise the many failures of Soviet agriculture. Only three sources of these failures are noted here, because they will concern us later.77 First, having taken from the peasants both their (relative) independence and autonomy as well as their land and grain, the state created a class of essentially unfree labourers who responded with all the forms of foot-dragging and resistance practised by unfree labourers everywhere. Second, the unitary administrative structure and imperatives of central planning created a clumsy machine that was utterly unresponsive to local knowledge or to local conditions. Finally, the Leninist political structure of the Soviet Union gave agriculture officials little or no incentive to adapt to, or negotiate with, its rural subjects. The very capacity of the state to essentially re-enserf rural producers, dismantle their institutions and impose its will, in the crude sense of appropriation,
328 Agricultural Revolutions and Change
Figure 14.3 Houses along a lane in the old village at Verchnyua Troitsa
Soviet Collectivization, Capitalist Dreams 329
goes a long way toward explaining the state’s failure to realize anything but a simulacrum of the high-modernist agriculture that Lenin so prized.
State Landscapes of Control and Appropriation Drawing on the history of Soviet collectivization, I shall now venture a few more frankly speculative ideas about the institutional logic of authoritarian high modernism. Then I shall suggest a way of grasping why such massive social bulldozing may have worked tolerably well for some purposes but failed dismally for others. The headlong drive to collectivization was animated by the short-term goal of seizing enough grain to push rapid industrialization.78 Threats and violence had worked, up to a point, for the harvests of 1928 and 1929, but each annual turn of the screw elicited more evasion and resistance from the peasantry. The bitter fact was that the Soviet state faced an exceptionally diverse population of communebased smallholders whose economic and social affairs were nearly unintelligible to the centre. These circumstances offered some strategic advantages to a peasantry waging a quiet guerrilla war (punctuated by open revolt) against state claims. The state, under the existing property regime, could only look forward to a bruising struggle for grain each year, with no assurance of success. Stalin chose this moment to strike a decisive blow. He imposed a designed and legible rural landscape that would be far more amenable to appropriation, control and central transformation. The social and economic landscape he had in mind was of course the industrial model of advanced agriculture – large, mechanized farms run along factory lines and coordinated by state planning. It was a case of the ‘newest state’ meeting the ‘oldest class’ and attempting to remake it into some reasonable facsimile of a proletariat. Compared to the peasantry, the proletariat was already relatively more legible as a class, and not just because of its central place in Marxist theory. The proletariat s work regimen was regulated by factory hours and by man-made techniques of production. In the case of new industrial projects like the great steel complex at Magnitogorsk, the planners could start virtually from zero, as with Brasília. The peasants, on the other hand, represented a welter of small, individual household enterprises. Their settlement pattern and social organization had a historical logic far deeper than that of the factory floor. One purpose of collectivization was to destroy these economic and social units, which were hostile to state control, and to force the peasantry into an institutional straitjacket of the state’s devising. The new institutional order of collective farms would now be compatible with the state’s purposes of appropriation and directed development. Given the quasi-civil war conditions of the countryside, the solution was as much a product of military occupation and ‘pacification’ as of ‘socialist transformation’.79 It is possible, I believe, to say something more generally about the ‘elective affinity’ between authoritarian high modernism and certain institutional arrangements.80
330 Agricultural Revolutions and Change
What follows is rather crude and provisional, but it will serve as a point of departure. High-modernist ideologies embody a doctrinal preference for certain social arrangements. Authoritarian high-modernist states, on the other hand, take the next step. They attempt, and often succeed, in imposing those preferences on their population. Most of the preferences can be deduced from the criteria of legibility, appropriation and centralization of control. To the degree that the institutional arrangements can be readily monitored and directed from the centre and can be easily taxed (in the broadest sense of taxation), then they are likely to be promoted. The implicit goals behind these comparisons are not unlike the goals of premodern statecraft.81 Legibility, after all, is a prerequisite of appropriation as well as of authoritarian transformation. The difference, and it is a crucial one, lies in the wholly new scale of ambition and intervention entertained by high modernism. The principles of standardization, central control and synoptic legibility to the centre could be applied to many other fields; those noted in the accompanying table are only suggestive. If we were to apply them to education, for example, the most illegible educational system would be completely informal, nonstandardized instruction determined entirely by local mutuality. The most legible educational system would resemble Hippolyte Taine’s description of French education in the 19th century, when ‘the Minister of Education could pride himself, just by looking at his watch, which page of Virgil all schoolboys of the Empire were annotating at that exact moment’.82 A more exhaustive table would replace the dichotomies with more elaborate continua (open commons landholding, for example, is less legible and taxable than closed commons landholding, which in turn is less legible than private freeholding, which is less legible than state ownership). It is no coincidence that the more legible or appropriable form can more readily be converted into a source of rent – either as private property or as the monopoly rent of the state.
The Limits of Authoritarian High Modernism When are high-modernist arrangements likely to work and when are they likely to fail? The abject performance of Soviet agriculture as an efficient producer of foodstuffs was, in retrospect, ‘overdetermined’ by many causes having little to do with high modernism per se: the radically mistaken biological theories of Trofim Lysenko, Stalin’s obsessions, conscription during World War II and the weather. And it is apparent that centralized high-modernist solutions can be the most efficient, equitable and satisfactory for many tasks. Space exploration, the planning of transportation networks, flood control, airplane manufacturing and other endeavours may require huge organizations minutely coordinated by a few experts. The control of epidemics or of pollution requires a centre staffed by experts receiving and digesting standard information from hundreds of reporting units. On the other hand, these methods seem singularly maladroit at such tasks as putting a really good meal on the table or performing surgery. This issue is addressed
• • •
Property regimes
Open commons, communal property Private property Local records
Small property, petite bourgeoisie Small peasant farms Artisanal production Small shops Informal economy, ‘off the books’
Unregulated local naming customs
No state documentation of citizens
•
•
•
Energy
Identification
Cow pats and brushwood gathered locally or local electric generating stations
Decentralized webs and networks
Local customary use, local irrigation societies
•
•
Water
Transportation
•
•
•
•
•
• • •
• • • • •
National system of identification cards, documents or passports
Permanent patronyms
Large generating stations in urban centres
Centralized hubs
Centralized dam, irrigation control
Collective farms State property National cadastral survey
Large property Large farms Factories (proletariat) Large commercial establishments Formal economy, ‘on the books’
Permanent villages, estates and plantations of sedentary peoples Planned grid cities and neighbourhoods: Brasília, Chicago
Legible
• Temporary encampments of hunter-gatherers, nomads, slash-and-burn cultivators, pioneers and gypsies Unplanned cities and neighbourhoods: Bruges in 1500, • medina of Damascus, Faubourg Saint-Antoine, Paris, in 1800
Technical and resource organizations
• • • • •
•
•
Economic units
Settlements
Illegible
Table 14.1 Legibility of social groups, institutions and practices
Soviet Collectivization, Capitalist Dreams 331
332 Agricultural Revolutions and Change
at length in Scott (1998, ch. 8),83 but some valuably suggestive evidence can be gleaned from Soviet agriculture. If we think of particular crops, it is apparent that collective farms were successful at growing some crops, especially the major grains: wheat, rye, oats, barley and maize. They were notably inefficient at turning out other products, especially fruits, vegetables, small livestock, eggs, dairy products and flowers. Most of these crops were supplied from the minuscule private plots of the kolkhoz members, even at the height of collectivization.84 The systematic differences between these two categories of crops helps to explain why their institutional setting might vary. Let us take wheat as an example of what I will call a ‘proletarian crop’ and compare it with red raspberries, which I think of as the ultimate ‘petit-bourgeois crop’. Wheat lends itself to extensive large-scale farming and mechanization. One might say that wheat is to collectivized agriculture what the Norway spruce is to centrally managed, scientific forestry. Once planted, it needs little care until harvest, when a combine can cut and thresh the grain in one operation and then blow it into trucks bound for granaries or into railroad cars. Relatively sturdy in the ground, wheat remains sturdy once harvested. It is relatively easy to store for extended periods with only small losses to spoilage. The red raspberry bush, on the other hand, requires a particular soil to be fruitful; it must be pruned annually; it requires more than one picking, and it is virtually impossible to pick by machine. Once packed, raspberries last only a few days under the best conditions. They will spoil within hours if packed too tightly or if stored at too high a temperature. At virtually every stage the raspberry crop needs delicate handling and speed, or all is lost. Little wonder, then, that fruits and vegetables – petit-bourgeois crops – were typically not grown as kolkhoz crops but rather as side-lines produced by individual households. The collective sector in effect ceded such crops to those who had the personal interest, incentive and horticultural skills to grow them successfully. Such crops can, in principle, be grown by huge centralized enterprises as well, but they must be enterprises that are elaborately attentive to the care of the crops and to the care of the labour that tends them. Even where such crops are grown on large farms, the farms tend to be family enterprises of smaller size than wheat farms and are insistent on a stable, knowledgeable workforce. In these situations, the small family enterprise has, in the terms of neoclassical economics, a comparative advantage. Another way in which wheat production is different from raspberry production is that the growing of wheat involves a modest number of routines that, because the grain is robust, allow some slack or play. The crop will take some abuse. Raspberry growers, because successful cultivation of their crop is complex and the fruit is delicate, must be adaptive, nimble and exceptionally attentive. Successful raspberry growing requires, in other words, a substantial stock of local knowledge and experience.
Soviet Collectivization, Capitalist Dreams 333
Notes 1
2
3 4 5
6 7
8 9
10 11 12
13 14
15 16
17
The best source for a discussion about Soviet high modernism is probably Richard Stites, Revolutionary Dreams: Utopian Vision and Experimental Life in the Russian Revolution (New York: Oxford University Press, 1989). Its generous bibliography appears to cover most of the available sources. This inference, we know, is not a distortion of the doctrines of liberalism. J. S. Mill, whose credentials as a liberal son of the Enlightenment are not in doubt, considered backwardness a sufficient justification for placing authoritarian powers in the hands of a modernizer. See Ernest Gellner, ‘The Struggle to Catch Up,’ Times Literary Supplement, 9 December 1994, p. 14. For a more detailed argument along these lines, see also Jan P. Nederveen Pieterse and Bhikhu Parekh, eds., The Decolonization of the Imagination: Culture, Knowledge, and Power (London: Zed Press, 1995). Stites, Revolutionary Dreams, p19. Engels expressed his disdain for Communist Utopian schemes like these by calling them ‘barracks Communism’. One could say that Catherine the Great, being Prussian born and an avid correspondent with several of the Encylopedists, including Voltaire, came by her mania for rational order honestly. Sheila Fitzpatrick, The Russian Revolution (Oxford: Oxford University Press, 1982), p. 119. The term ‘gigantomania’ was, I believe, also in use in the Soviet Union. The ultimate failure of most of the USSR’s great schemes is in itself an important story, the significance of which was captured epigrammatically by Robert Conquest, who observed that ‘the end of the Cold War can be seen as the defeat of Magnitogorsk by Silicon Valley’ (‘Party in the Dock,’ Times Literary Supplement, 6 November 1992, p. 7). For an industrial, cultural and social history of Magnitogorsk, see Stephen Kotkin, Magnetic Mountain: Stalinism as a Civilization (Berkeley: University of California Press, 1995). An interesting parallel can be seen in the French countryside following the Revolution, when campaigns called for ‘de-Christianization’ and offered associated secular rituals. Stites, Revolutionary Dreams, p. 119. See also Vera Sandomirsky Dunham, In Stalin’s Time: Middle-Class Values in Soviet Fiction (Cambridge: Cambridge University Press, 1976), for how, under Stalin, this austerity was transformed into opulence. Stites, ‘Festivals of the People,’ chap. 4 of Revolutionary Dreams, pp. 79–97. Ibid., p. 95. Through Sergey Eisenstein’s films, these public theatrical reenactments are the visual images that remain embedded in the consciousness of many of those who were not participants in the actual revolution. Composers and filmmakers were also expected to be ‘engineers of the soul’. Quoted in Stites, Revolutionary Dreams, p. 243. Lenin, almost certainly influenced by another of his favourite books, Campanella’s City of the Sun, wanted public sculptures of revolutionaries, complete with inspiring inscriptions, to be erected throughout the city: a propaganda of monuments. See Anatoly Lunacharsky, ‘Lenin and Art,’ International Literature 5 (May 1935): 66–71. Stites, Revolutionary Dreams, p. 242. This entire section is based on chaps. 2, 4 and 6 of a remarkable forthcoming book by Deborah Fitzgerald, Yeoman No More: The Industrialization of American Agriculture, to which I am greatly indebted. The chapter and page numbers that follow refer to the draft manuscript. Ibid., chap. 2, p. 21. As many commentators have emphasized, this redesigning of work processes wrested the control of production from skilled artisans and labourers and placed it in the hands of management, whose ranks and prerogatives grew as the labour force was ‘de-skilled’. Around 1920, much of the market for agricultural machinery made by US manufacturers was not in the United States, where farm sizes were still relatively small, but outside the country, in such places as Canada, Argentina, Australia and Russia, where farms were considerably larger. Fitzgerald, Yeoman No More, chap. 2, p. 31.
334 Agricultural Revolutions and Change 18 For a fascinating and more complete account of the Campbell enterprise, see ‘The Campbell Farm Corporation’, chap. 5, ibid. It’s worth adding here that the economic depression for agriculture in the United States began at the end of World War I, not in 1930. The time was thus ripe for bold experimentation, and cost of buying or leasing land was cheap. 19 Wheat and flax are, in the terminology developed later in this chapter, ‘proletarian’ crops as opposed to ‘petit-bourgeois’ crops. 20 Fitzgerald, Yeoman No More, chap. 4, pp. 15–17. 21 See above, nn. 14 and 18. 22 Another such farm, and one with direct links to New Deal experimentation in the 1930s, was the Fairway Farms Corporation. Founded in 1924 by M. L. Wilson and Henry C. Taylor, both of whom were trained in institutional economics at the University of Wisconsin, the corporation was designed to turn landless farmers into scientific, industrial farmers. The capital for the new enterprise came, through intermediaries, from John D. Rockefeller. ‘Fair Way’ Farms would become the model for many of the New Deal’s more ambitious agricultural programmes as Wilson, Taylor and many of their progressive colleagues in Wisconsin moved to influential positions in Washington under Roosevelt. A more searching account of the connection is in Jess Gilbert and Ellen R. Baker, ‘Wisconsin Economists and New Deal Agricultural Policy: The Legacy of Progressive Professors’ (unpublished paper, 1995). The 1920s were a fertile time for agricultural experimentation, partly because the economic slump for agricultural commodities after World War I prompted policy initiatives designed to alleviate the crisis. 23 Fitzgerald, Yeoman No More, chap. 4, pp. 18–27. For an account of industrial farming in Kansas and its link to the ecological disaster known as the dust bowl, see Donald Worster, Dust Bowl: The Southern Plains in the 1930s (New York: Oxford University Press, 1979). 24 Fitzgerald, Yeoman No More, chap. 4, p. 33. The plan’s outline can be found in Mordecai Ezekial and Sherman Johnson, ‘Corporate Farming: The Way Out?’ New Republic, 4 June 1930, pp. 66–68. 25 Michael Gold, ‘Is the Small Farmer Dying?’ New Republic, 7 October 1931, p. 211, cited in Fitzgerald, Yeoman No More, chap. 2, p. 35. 26 Ibid., chap. 6, p. 13. See also Deborah Fitzgerald, ‘Blinded by Technology: American Agriculture in the Soviet Union, 1928–1932,’ Agricultural History 70, no. 3 (Summer 1996): 459–86. 27 Enthusiastic visitors included the likes of John Dewey, Lincoln Steffens, Rexford Tugwell, Robert LaFollette, Morris Llewellyn Cooke (at the time the foremost exponent of scientific management in the United States), Thurman Arnold, and, of course, Thomas Campbell, who called the Soviet experiment ‘the biggest farming story the world has ever heard’. Typical of the praise for Soviet plans for a progressive, modernized rural life was this appraisal by Belle LaFollette, the wife of Robert LaFollette: ‘If the Soviets could have their way, all land would be cultivated by tractors, all the villages lighted by electricity, each community would have a central house serving for the purpose of school, library, assembly hall, and theatre. They would have every convenience and advantage which they plan for the industrial workers in the city’ (quoted in Lewis S. Feuer, ‘American Travelers to the Soviet Union, 1917–1932: The Formation of a Component of New Deal Ideology,’ American Quarterly 14 [Spring 1962]: 129). See also David Caute, The Fellow Travellers: Intellectual Friends of Communism, rev. edn (New Haven: Yale University Press, 1988). 28 Feuer, ‘American Travelers to the Soviet Union,’ pp. 119–49, cited in Fitzgerald, Yeoman No More, chap. 6, p. 4. 29 Fitzgerald, Yeoman No More, chap. 6, p. 6. 30 Ibid., p. 37. 31 Ibid., p. 14. 32 Ibid., p. 39 (emphasis added). 33 Quoted in Robert Conquest, The Harvest of Sorrow: Soviet Collectivization and the Terror-Famine (New York: Oxford University Press, 1986), p. 232. An even more explicit recognition that this was a ‘war’ appears in this statement by M. M. Khateyevich: ‘A ruthless struggle is going on
Soviet Collectivization, Capitalist Dreams 335
34
35
36
37
38
39 40
41 42 43
44
45
between the peasantry and our regime. It’s a struggle to the death. This year was a test of our strength and their endurance. It took a famine to show them who was master here. It has cost millions of lives, but the collective farm system is here to stay, we’ve won the war’ (quoted in ibid., p. 261). The so-called Great Leap Forward in China was at least as deadly and may be analysed in comparable terms. I have chosen to concentrate on Soviet Russia largely because events there occurred some 30 years before the Great Leap Forward and hence have received much more scholarly attention, especially during the past seven years, when the newly opened Russian archives have greatly expanded our knowledge. For a recent popular account of the Chinese experience, see Jasper Becker, Hungry Ghosts: China’s Secret Famine (London: John Murray, 1996). In cases where yields were high among state farms and show projects, they were typically achieved with such costly inputs of machinery, fertilizers, pesticides and herbicides that the results were economically irrational. For an exceptionally perceptive account of collectivization and its results, see Moshe Lewin, The Making of the Soviet System: Essays in the Social History of Interwar Russia (New York: Pantheon, 1985), especially part 2, pp. 89–188. I use the term ‘lumpen’ here to designate a huge floating population of great variety and shifting occupations. Although Marx and Lenin always used the term scornfully, implying both criminal tendencies and political opportunism, I intend no such denigration. Stalin, it is now believed, was personally responsible for drafting in August 1932 a secret decree branding all those who withheld grain, now declared to be ‘sacred and untouchable’ state property, as ‘enemies of the people’ and ruling that they should be summarily arrested and shot. The same Stalin, at the Second Congress of Outstanding Kolkhozniks in 1935, championed the retaining of adequate private plots: ‘The majority of kolkhozniks want to plant an orchard, cultivate a vegetable garden or keep bees. The kolkhozniks want to live a decent life, and for that this 0.12 hectares is not enough. We need to allocate a quarter to half a hectare, and even as much as one hectare in some districts’ (quoted in Sheila Fitzpatrick, Stalin’s Peasants: Resistance and Survival in the Russian Village After Collectivization [New York: Oxford University Press, 1995], pp. 73, 122). Ibid., p. 432. Orlando Figes, ‘Peasant Aspirations and Bolshevik State-Building in the Countryside, 1917– 1925,’ paper presented at the Program in Agrarian Studies, Yale University, New Haven, 14 April 1995, p. 24. Figes also links these views to socialist tracts that date from at least the 1890s and that pronounced the peasantry doomed by economic progress (p. 28). R. W. Davies, The Socialist Offensive: The Collectivisation of Soviet Agriculture, 1929–1930 (London: Macmillan, 1980), p. 51. Conquest, Harvest of Sorrow, p. 43. Also, the collapse of urban enterprises, which would normally have supplied consumer goods and farm implements to the rural areas, meant that there was less incentive for the peasantry to sell grain in order to make purchases in the market. See Orlando Figes’s remarkably perceptive and detailed book, Peasant Russia, Civil War: The Volga Countryside in Revolution, 1917–1921 (Oxford: Clarendon Press, 1989). Even near revolutions create a similar vacuum. Following the 1905 revolution, it took the czarist government nearly two years to reassert its control over the countryside. The relative unity of the village was itself enhanced by the revolutionary process. The richest landlords had left or been burned out, and the poorest, landless families had typically gotten some land. As a result, the villagers were more socioeconomically similar and therefore more likely to respond similarly to external demands. Since many of the independent farmers were pressured to return to the commune, they were now dependent on the entire village for their household’s allotment of the communal lands. Thus it is not hard to understand why, in those instances where the kombedy was an instrument of Bolshevik policy, it faced determined opposition from the more
336 Agricultural Revolutions and Change
46
47
48 49
50 51 52
53 54 55 56 57 58 59
60 61 62
63 64 65
representative village soviet. ‘One government official from Samara Province claimed, with conscious irony, that the conflicts between the kombedy and the Soviets represented the main form of “class struggle” in the rural areas during this period’ (ibid., p. 197). In the larger villages, some support for Bolshevik agrarian plans could be found among educated youth, schoolteachers and veterans who had become Bolsheviks while serving with the Red Army during World War I or the civil war (and who might have imagined themselves occupying leading roles in the new collective farms). See Figes, ‘Peasant Aspirations and Bolshevik State-Building’. There was also a tendency to hide income from craft, artisanal and trading sidelines as well as ‘garden’ crops. During this same period, it should be added, insufficient resources – manpower, draft animals, manure and seed – meant that some of the arable either could not be planted or could only produce yields that were far lower than usual. Yaney, The Urge to Mobilize, pp. 515–516. For Yaney, the continuity in aspirations from what he terms ‘messianic social agronomists’ under the czarist regime to the Bolshevik collectivizers was striking. In a few cases, they were the same people. Figes, Peasant Russia, Civil War, p. 250. Hunger and flight from the towns had reduced the number of urban industrial workers from 3.6 million in 1917 to no more than 1.5 million in 1920 (Fitzpatrick, The Russian Revolution, p. 85). Figes, Peasant Russia, Civil War, p. 321. Quoted in Fitzpatrick, Stalin’s Peasants, p. 39. In theory, at least, the most ‘advanced’ were the state farms – the proletarian, industrial, collective farms in which workers were paid wages and no private plots were allowed. These farms also received the bulk of state investment in machinery in the early years. For production statistics, see Davies, The Socialist Offensive, p. 6. Ibid., pp. 82–113. Fitzpatrick, Stalin’s Peasants, p. 4. Conquest, Harvest of Sorrow, p. 183. Andrei Platonov, Chevengur, trans. Anthony Olcott (Ann Arbor: Ardis, 1978). M. Hindus, Red Breed (London, 1931), quoted in Davies, The Socialist Offensive, p. 209. Davies, The Socialist Offensive, p. 205. The size of collective farms remained enormous, even by American standards, throughout the Soviet period. Fred Pryor calculates that in 1970 the average state farm comprised more than 100,000 acres, while the average collective farm comprised over 25,000 acres. The state farms were greatly favoured in access to inputs, machinery and other subsidies. See Frederick Pryor, The Red and the Green: The Rise and Fall of Collectivized Agriculture in Marxist Regimes (Princeton: Princeton University Press, 1992), table 7, p. 34. Fitzgerald, Stalin’s Peasants, p. 105. Ibid., pp. 105–106. One imagines that the soils and existing cropping patterns were also ignored. As the Bolsheviks explained, ‘The kolkhozy are the only means by which the peasantry can escape from poverty and darkness’ (Davies, The Socialist Offensive, p. 282). Perhaps the best visual images of the culturally transforming properties of electricity, machinery and collectivization are found in Sergey Eisenstein’s film The General Line, a veritable technological romance set in rural Russia. The film masterfully conveys the Utopian aspirations of high modernism by contrasting the plodding dark narod with his horse and scythe with images of electric cream separators, tractors, mowing machines, engines, skyscrapers, engines and airplanes. Fitzpatrick, Stalin’s Peasants, p. 194. Ibid., pp. 306–309. For an account of how an even more extreme version of regional specialization was imposed on the Chinese countryside, in violation of local soil and climatological conditions, see Ralph Thaxton, Salt of the Earth: The Political Origins of Peasant Protest and Communist Revolution in China (Berkeley: University of California Press, 1997).
Soviet Collectivization, Capitalist Dreams 337 66 Figes, Peasant Russia, Civil War, p. 304. The analogy took concrete form in many of the early revolts against collectivization, during which the peasantry destroyed all the records of labour dues, crop deliveries, debts, and so on, just as they had under serfdom. 67 Conquest, Harvest of Sorrow, p. 152. 68 The resemblances to serfdom are spelled out in some detail in Fitzgerald, Stalin’s Peasants, pp. 128–139. For a careful and informed discussion of serfdom and comparisons to slavery, see Peter Kolchin, Unfree Labor: American Slavery and Russian Serfdom (Cambridge: Harvard University Press, 1987). 69 For an astute account by a Soviet journalist and human rights campaigner in the 1980s, indicating that the basic pattern had not greatly changed, see Lev Timofeev, Soviet Peasants, or The Peasants’ Art of Starving, trans. Jean Alexander and Alexander Zaslavsky, ed. Armando Pitassio and Alexander Zaslavsky (New York: Telos Press, 1985). 70 I am persuaded by the historical accounts that characterize the mir as the peasantry’s adaptation to a gentry and state that treated it as a collective unit for the purposes of taxation, conscription and some forms of servile dues. The periodic redivision of land among the households ensured that all had the means of paying their share of the head taxes, which were levied on the commune collectively. That is, the relative solidarity of the Russian repartitional commune is itself a result of a distinct history of relations with overlords. This claim is perfectly compatible with the fact that such solidarity, once in place, can serve other purposes, including resistance. 71 Fitzgerald, Stalin’s Peasants, p. 106 (emphasis added). 72 I am immensely grateful to my colleague Teodor Shanin and his research teams, who are conducting comparative work on more than 20 collective farms, for making available to me the maps and photographs for this chapter. Particular thanks to Galya Yastrebinskaya and Olga Subbotina for the photograph of the older village of Utkino, founded in 1912 and located 20 miles from the city of Vologda. 73 Notice that the old-style houses that were not moved (legend reference 12) are themselves laid out on roughly equal plots along the main road. I do not know whether there were administrative reasons behind these forms in the 18th century, when the village was founded, or whether the original pioneers themselves laid out the grid. How the older houses that have been relocated were originally disposed is also a mystery. 74 The same logic, of course, applied to industry, in which large units are favoured over small factories or artisanal production. As Jeffrey Sachs has observed: ‘Central planners had no desire to coordinate the activities of hundreds or thousands of small firms in a sector if one large firm could do the job. A standard strategy, therefore, was to create one giant firm wherever possible’ (Poland’s Jump into the Market Economy [Cambridge: Cambridge University Press, 1993]). In the context of the Soviet economy, the largest industrial unit was the huge steel complex at Magnitogorsk. It is now a stunning example of an industrial and ecological ruin. See also Kotkin, Magnetic Mountain. 75 For a more extensive treatment of the ecological effects of Soviet agriculture, see Murray Feshbach, Ecological Disaster: Cleaning Up the Hidden Legacy of the Soviet Regime (New York: 1995), and Ze’ev Wolfson (Boris Komarov), The Geography of Survival: Ecology in the Post-Soviet Era (New York: M. E. Sharpe, 1994). 76 I worked for six weeks in 1990 on a cooperative (ex-collective) farm in East Germany, on the Mecklenburg Plain, not too far from Neubrandenburg. The local officials were exceptionally proud of their world-class yields per hectare in rye and potatoes with high starch content grown for industrial uses. It was clear, however, that as an economic matter, the market cost of the inputs (labour, machinery and fertilizer) needed to produce these yields made this enterprise an inefficient producer by any cost-accounting standard. 77 There is no doubt that a number of bureaucratic ‘pathologies’ amplified the disaster of Soviet collectivization. They include the tendency of administrators to concentrate on specified, quantifiable results (e.g., grain yields, tons of potatoes, tons of pig iron) rather than on quality and the fact
338 Agricultural Revolutions and Change
78
79
80
81 82
83 84
that long chains of specialization and command shielded many officials from the larger consequences of their behaviour. Also, the difficulty of making officials accountable to their clientele, as opposed to their superiors, meant that the pathology of group ‘commandism’, on one hand, or individual corruption and self-serving, on the other, were rampant. High-modernist schemes in revolutionary, authoritarian settings like that of the Soviet Union are thus likely to go off the rails more easily and remain off the rails far longer than in a parliamentary setting. The rush towards collectivization was momentarily halted by Stalin’s famous ‘Dizzy with Success’ speech of March 1930, which prompted many to leave the collectives; however, it was not long before the pace of collectivization resumed. In order to have enough capital for rapid industrialization, 4.8 million tons of grain were exported in 1930 and 5.2 million tons in 1931, helping to set the stage for the famine of the years immediately following. See Lewin, The Making of the Soviet System, p. 156. Compare this with Bakunin’s forecast of what state socialism would amount to: ‘They will concentrate all of the powers of government in strong hands, because the very fact that the people are ignorant necessitates strong, solicitous care by the government. They will create a single state bank, concentrating in its hands all the commercial, industrial, agricultural and even scientific producers, and they will divide the masses of people into two armies – industrial and agricultural armies under the direct command of the State engineers who will constitute the new privileged scientific-political class’ (quoted in W. D. Maximoff, The Political Philosophy of Bakunin: Scientific Anarchism [New York: Free Press, 1953], p. 289). The term ‘elective affinity’ comes from Max Weber’s analysis of the relation between capitalist norms and institutions on one hand and Protestantism on the other. His argument is not one of direct causation but of ‘fit’ and symbiosis. See books 4 and 5 in vol. 2 of Gabriel Ardant, Théorie sociologique de l’impôt (Paris: CEVPEN, 1965). Quoted in Michel Crozier, The Bureaucratic Phenomenon (Chicago: University of Chicago Press, 1964), p. 239. As Abram de Swaan has noted, ‘The nineteenth-century school regime does reveal some unmistakable similarities with the factory regime of that time: standardization, formalization and the imposition of punctuality and discipline were paramount in both’ (In Care of the State, p. 61). Scott J C. 1998. Chapter 8 in Seeing Like a State. New Haven: Yale University Press. For a detailed account of the relationship between the private plot and the collective just prior to 1989, see Timofeev, Soviet Peasants, or The Peasants’ Art of Starving.
15
Alternatives to Slash-and-Burn: Challenge and Approaches of an International Consortium Pedro A. Sanchez, Cheryl A. Palm, Stephen A. Vosti, Thomas P. Tomich and Joyce Kasyoki
The Challenge The world has lost about half of its forests to agriculture and other uses, and 78 per cent of what remains is heavily altered, bearing little resemblance to the original forests (Bryant et al, 1997). About 72 per cent of the original 1450 million ha of tropical forests have been converted to other uses (Myers, 1991; FAO, 1997). Deforestation rates for the humid tropics were estimated to be 6.9 million ha/yr at the end of the 1970s (Lanly, 1982) and doubled to 14.8 million ha/yr by 1991 (Myers, 1993). More recent studies indicate that deforestation rates decreased by about 10 per cent in the 1990s (Durst, 2000). These values are fraught with methodological problems. Achard et al (2002) asserted that previous methods overestimated tropical deforestation rates by as much as 25 per cent. Brazil, the country with the largest area of tropical forests, reports that deforestation rates in the Brazilian Amazon increased by as much as 40 per cent from 2001 to 2002 (INPE, 2003). Despite these limitations, it is obvious that tropical deforestation and subsequent ecosystem degradation continue at alarming rates. They remain a major worldwide concern because of the high levels of plant and animal biodiversity these forests contain, the large carbon (C) stocks stored in them, and the many other ecosystem services tropical forests provide (Myers, 1993; Laurance et al, 1997). Small-scale farmers often are viewed as the primary agents of deforestation (Hauck, 1974), accounting for as much as 96 per cent of forest losses (Amelung and Diehl, 1992). Myers (1994) reported that the aggregate actions of small-scale farmers resulted in greater deforestation than the activities of large-scale operations Reprinted from Slash and Burn Agriculture by Palm C A, Vosti S A, Sanches P A and Ericksen P (eds). Copyright © 2005 Columbia University Press. Reprinted with permission of the publisher.
340 Agricultural Revolutions and Change
and accounted for about 70 per cent of the deforestation in Africa, 50 per cent in Asia, and 30 per cent in Latin America. Although the predominant role played by small-scale farmers has come into question (Geist and Lambin, 2002), they are often part of the deforestation process. Small-scale farmers practising slash-and-burn agriculture clear forests to produce food and make a living for their families. They often have few options other than to continue clearing tropical forests because of the benefits and profits derived from deforestation. In many cases, these farmers are marginalized from society and government support programmes, and often they are migrants escaping from poverty and inequities elsewhere in the country. Any efforts to arrest deforestation must consider this group; in the absence of alternatives they will continue to clear forest to meet their needs for food and income. Early approaches to conserve tropical forests were done at the exclusion of small-scale farmers that depend on the forest for their livelihoods (FAO Staff, 1957). These ‘fence off the forest’ approaches often increased conflicts between conservation and development efforts and ignored the causes of deforestation. The importance of agricultural development for reducing the poverty of the small-scale farmers and the economic development of developing countries is increasingly recognized. Therefore the development and promotion of agricultural systems that reduce poverty must be integrated with strategies to conserve tropical forests and the biodiversity and carbon they house (McNeely and Scherr, 2003). The challenges are to identify alternative systems that meet farmers’ needs and that can reduce pressure to clear more forest or minimize the impacts on biodiversity and other global environmental resources. The Alternatives to Slash and Burn (ASB) consortium was created to address this challenge. This chapter introduces the ASB Programme, an international consortium of researchers and extension groups that was established specifically to investigate the causes and consequences of deforestation by small-scale farmers and to identify land-use systems that enhance both local livelihoods and the environment and the policies and other changes needed to support them. It begins with a description and distinction of shifting cultivation and slash-and-burn practices and continues with a summary of land-use intensification pathways in the tropics. This is followed by the objectives, benchmark site locations, broad methods and activities of the ASB consortium.
Land Use at the Tropical Forest Margins Almost all tropical forests are cleared by similar methods that start with slashing the forest with chainsaws, axes and machetes and burning the felled vegetation after it has dried. In this sense, slash-and-burn is simply a land-clearing technique. The subsequent land-use pathway that follows land clearing differs depending on the different groups of people involved – indigenous forest dwellers, small-scale farmers and large-scale private operators – and the intended use of the land, including the
Alternatives to Slash-and-Burn 341
various types of shifting cultivation, agroforestry, logging, cattle ranching and commercial tree plantations. There is much confusion in the literature regarding the use of the terms shifting cultivation and slash-and-burn agriculture; the following sections distinguish between the different land-use pathways that follow the clearing of tropical forests.
Shifting cultivation or slash-and-burn agriculture? Shifting cultivation is probably the oldest farming system (Nye and Greenland, 1960) and is remarkably similar throughout the humid tropics. Farmers slash and burn a hectare or so of primary or tall secondary forest, grow food crops in polyculture for 1–3 years, and abandon the land to secondary forest fallow regrowth for 20–40 years, then repeat the cycle. This traditional shifting cultivation with short cropping periods and long secondary forest fallow periods is now rare, practised primarily by indigenous communities disconnected from the national economy. It is socially and environmentally sustainable (Thrupp et al, 1997), albeit at low levels of agricultural productivity and human population densities of less than 30 people per square kilometre (Boserup, 1965). Shifting cultivation is known by a variety of terms, referring mostly to cleared fields: swidden (Old English), rai (Sweden), milpa, conuco, roza (Latin America), shamba, chitemene (Africa), jhum (India), kaingin (Philippines), ladang (Indonesia and Malaysia) and many others. Fallows are commonly called bush fallow and jachere in Africa; barbecho, capoeira and purma in Latin America; and belukar and other terms in Indonesia. The concept of fallows in the tropics differs from that used in the temperate zone, where the term fallow normally means leaving the soil bare (Sanchez, 1999). The vegetative fallow phase restores carbon and nutrient stocks in the biomass, improves soil physical properties and suppresses weeds (Nye and Greenland, 1960; Sanchez, 1976; Szott and Palm, 1986). When human population pressures exceed a critical density that varies with agroecological zones and inherent soil fertility, traditional shifting cultivation is replaced by a variety of other agricultural practices that still involve clearing by slash-and-burn methods. We suggest that the loosely used terminology be specified as follows: shifting cultivation refers to the traditional long-fallow rotational system, and slash-and-burn agriculture refers to other farming systems characterized by slash-and-burn clearing, short-term fallows or no fallows at all. These systems include the shortened fallow–food crop systems and the establishment of tree-based systems such as complex agroforests, simple agroforests or monoculture tree crop plantations such as oil palm (Elaeis guineensis Jacquin), coffee (Coffea spp.), rubber (Hevea brasiliensis [Willd. ex A. Juss.] Muell.-Arg.) or pulp and timber species. Slash-and-burn is also the means of establishing pastures that are found throughout the humid forest zone of Latin America. These slash-and-burn systems differ from shifting agriculture in that the crops are interplanted with pastures or tree seedlings, or in some cases the cropping period is omitted. Many of the systems are still rotational to some degree, with occasional slash-and-burn clearing when the productivity of the system declines.
342 Agricultural Revolutions and Change
Land-use intensification pathways The pathway of agricultural intensification depends to some extent on the biophysical environment but is modified by the demographic composition and pressures, production technologies, and natural resource management practices, infrastructure, institutions and policy environment present at the time. The usual pathway begins with the reduction of the fallow period to less than 10 years and more commonly less than 5 years. These short fallows are incapable of accumulating sufficient nutrient stocks in the biomass and suppressing weeds by shading. Unlike shifting cultivation, where soil erosion is seldom a problem, slash-and-burn systems have less vegetative cover and often exposed, compacted soils that increase water run-off and soil erosion rates (Lal et al, 1986). This change in vegetation and soil structure may lead to changes in the hydrologic cycle, with negative consequences downstream (Bruijnzeel, 1990; Tinker et al, 1996). The combined effects of shortened fallows result in systems with declining productivity, depending more and more on less and less fallow biomass. In some cases, the systems reach a point at which the trees are replaced by other, highly degraded systems such as Imperata cylindrica (L.) Beauv grasslands in South-East Asia and West Africa (Garrity, 1997) and degraded pastures in Latin America (Serrāo and Homma, 1993). This pathway of land-use intensification, land degradation and the resulting losses of carbon stocks, nutrients and biodiversity is depicted in the left-hand, declining curve in Figure 15.1, line a. It is important to remember that those and other ecosystem services have been traded for private benefits, including food, feed, fibre and cash. With further increases in population density come increased access to markets and decreased access to forest products. A point may be reached when land degradation begins to be reversed with changes in land tenure institutions that facilitate investments in improved land management. This process was recognized by Boserup (1965) and is sometimes called induced institutional innovation (Hayami and Ruttan, 1985). Land rehabilitation usually is accomplished by replenishing lost plant nutrients; using improved crop germplasm, agronomic practices and soil conservation methods; introducing livestock; and planting more trees. Farmers will invest in improved land management and care for the environment when they have reasonably secure land or tree tenure and if it is profitable compared with other investment options within the context of household constraints and individual time preferences and attitudes toward risk. Examples of soil and land rehabilitation with increasing population pressure are well documented as ‘more people, less erosion’ (Tiffen et al, 1994) and ‘more people, more trees’ (Sanchez et al, 1998). They are accompanied by increasing productivity and profitability. Ecosystem stocks of carbon and nutrients increase and other ecosystems services also return, the level of which depends on the previous state of degradation and on the type of land-use system that is established. Livelihoods may continue to improve as more and more valuable economic products are obtained from the system. The trade-offs between the environmental services and profitability are
Alternatives to Slash-and-Burn 343
Note: Line a represents the usual pattern of land degradation and eventual rehabilitation when the proper policies and institutions are in place, line b represents the continued state of degradation that can occur in the absence of appropriate policies and institutions, and line c represents the desired course where there is little degradation of the resource base yet improved livelihoods are achieved. Source: Sanchez et al, 1998
Figure 15.1 Land-use intensification pathways and changes in stocks of natural capital such as carbon and nutrient stocks, biodiversity and other ecosystem services, with time and increasing population density in the tropics
lower than those in the degraded state. This is the right-hand side of Figure 15.1, line a. In some cases, the policy environment does not provide incentives to rehabilitate these degrading lands (line b in Figure 15.1), and the challenge is to find policy tools that will provide those incentives. Alternative land-use intensification pathways that do not first involve severe land degradation (line c in Figure 15.1) do exist in the form of the complex agroforests that have been developed by indigenous communities (Padoch and de Jong, 1987; Michon and de Foresta, 1996; Duguma et al, 2001). The challenge is, first, to identify and understand barriers to adoption of other systems by smallholders when such systems are superior alternatives in terms of their environmental impacts and sustainability as well as their profitability, food security, riskiness and other measures of acceptability to smallholders. When such superior win–win alternatives exist, the next challenge is to identify means to reduce barriers to adoption by smallholders before land degradation occurs to such an extent that ecosystems
344 Agricultural Revolutions and Change
services are lost. More often, however, there is no single ‘best bet’, but instead there is a range of trade-offs across land-use alternatives regarding environmental and agricultural development objectives.
Who are the small-scale slash-and-burn farmers? The number of people who depend on shifting cultivation for their livelihoods has for decades been estimated at about 250–300 million (Hauck, 1974; Myers, 1994). Recent georeferenced population and farming system data suggest that the numbers are an order of magnitude lower. Dixon et al (2001) report that 37 million people, or 2 per cent of the agricultural population of the tropics, practise some form of shifting cultivation in about 1 billion ha or 22 per cent of the tropical land area. This is the area of influence, but only a small fraction of that is under actual cropping or fallows. These numbers do not include people practising more intense systems in the humid tropics that were originally established by slash-and-burn practices. The number of people involved in these other crop-based, tree-based or pasture-based slash-and-burn systems is several times that of shifting cultivators (Dixon et al, 2001). Deforestation by slash-and-burn farmers is a response to underlying root causes. Population growth is naturally viewed as a main driver of deforestation, and economic growth often is viewed in the same vein. But no direct relationship between deforestation and population growth or economic growth has been found. Myers (1991) noted that whereas the population of forested tropical countries increased by 15–35 per cent in the 1980s, deforestation expanded by 90 per cent during the same period. The recent analysis by Geist and Lambin (2002) shows that in-migration to the forest margins is a much larger factor in deforestation than high internal population growth. Brown and Pearce (1994) obtained inconclusive results when attempting to relate gross domestic product (GDP) growth rates, foreign debt and population growth with deforestation in tropical countries. Rudel and Roper (1997) found that in tropical countries with large forested areas, deforestation increases with increasing GDP, whereas in countries with mainly forest fragments, increasing GDP decreases deforestation. Whereas traditional, indigenous people practise shifting cultivation, many (in some cases most) of the people practising slash-and-burn agriculture are migrants from other parts of their country who seek a better life at the forest margins. In some countries, large numbers of migrants to the forest margins come as part of government-sponsored colonization programmes aimed at transmigrating poor people from densely populated areas to the forest frontier, particularly in Brazil and Indonesia (Hecht and Cockburn, 1989; Kartasubrata, 1991). Others are spontaneous migrants who, acting independently with little or no government support, follow the opening of roads and logging trails. Planned and spontaneous migrations of poor people from crowded regions such as Java, the Andes and north-eastern and southern Brazil have undeniably contributed to deforestation. Opening of roads into primary forests such as the Belém-Brasília, Transamazônica
Alternatives to Slash-and-Burn 345
and São Paulo–Rio Branco in Brazil, the Carretera Marginal de la Selva and the Federico Basadre in Peru, and the Trans-Sumatra and Trans-Gabon highways have provided access to forests to both small-scale farmers and commercial interests. Many of these migrants are unfamiliar with the humid tropics, are largely unaware of the knowledge-intensive practices of indigenous shifting cultivators, and attempt to establish cropping systems that work where they came from (Moran, 1981). People in these situations usually lack alternative employment opportunities; have limited access to markets, credit and information; and often are politically marginalized. These people are a major focus of the ASB consortium.
The ASB Consortium The ASB consortium is an international group of researchers, extension workers and non-government organizations (NGOs) established in February 1992 to investigate the causes and consequences of deforestation by small-scale farmers and to identify land-use systems that enhance local livelihoods and the environment and the policies and other changes needed to support them. The ASB focuses on areas with high rates of deforestation where rapid increases in population density caused primarily by inmigration result in conversion of natural forests and where the environment–livelihood trade-offs are large. The ASB does not focus on shifting cultivation, but in some locations where it did occur, it was included in the comparative analysis. Similarly, larger-scale slash-and-burn operations also were included in some of the comparisons.
State of knowledge A literature review undertaken in 1992 showed much process-based understanding of agricultural practices, empirical understanding of global environmental processes and social processes, some policy research, and almost no multidisciplinary research (Sanchez and Bandy, 1992; Bandy et al, 1993; Sanchez and Hailu, 1996). The biophysical processes of shifting cultivation and slash-and-burn systems have been well understood through decades of long-term, place-based research (Nye and Greenland, 1960; Jurion and Henry, 1969; Sanchez, 1976; Juo and Lal, 1977; Seubert et al, 1977; Serrão et al, 1979; Macintosh et al, 1981; Toky and Ramakrishnan, 1981; Sanchez et al, 1983, 1987; Ramakrishnan, 1984, 1987; Smyth and Bastos, 1984; Von Uexkull, 1984; Alegre and Cassel, 1986, 1996; Sanchez and Benites, 1987; Wade et al, 1988; Kang et al, 1990; Cerri et al, 1991; Palm and Sanchez, 1991; Smyth and Cassel, 1995; Juo and Manu, 1996; Palm et al, 1996). The environmental consequences of slash-and-burn and tropical deforestation on greenhouse gas emissions have been modelled or estimated with limited data on the rates of deforestation, the carbon stored in the forests and subsequent land-use
346 Agricultural Revolutions and Change
systems (Houghton et al, 2000). Much data have been gathered on the effects of tropical deforestation on above-ground biodiversity (Whitmore and Sayer, 1992; Heywood, 1995) and watershed hydrology (Bruijnzeel, 1990; Tinker et al, 1996), but with limited specificity to slash-and-burn agriculture. There were only a few studies on below-ground biodiversity (Lavelle and Pashanasi, 1989). The anthropological aspects of shifting cultivation have been described extensively (Conklin, 1954, 1963; Cowgill, 1962; Padoch and de Jong, 1987; Thrupp et al, 1997), with more recent studies focusing on migrants practising slash-andburn agriculture (Moran, 1981; Colfer et al, 1988; Rhoades and Bidegaray, 1987; Fujisaka et al, 1991). There have been several studies about the economics and policies of deforestation and slash-and-burn practices, focused primarily on Brazil (Mahar, 1988; Binswanger, 1991; Brown and Pearce, 1994; Mahar and Schneider, 1994). What this incomplete literature review showed was an almost total absence of multidisciplinary work. Social and biophysical scientists have seldom worked together on slash-and-burn issues. There was no tradition of joint research and collaboration between economic groups and the environmental community dealing with this issue (Repetto and Gillis, 1988), or between the agricultural, economic and environmental communities. The ASB consortium was established to link the diverse research disciplines and the development community to address jointly the problems of deforestation, unsustainable land use and rural poverty at the humid forest margins.
Inception A United Nations Development Programme (UNDP)-sponsored workshop was held in Porto Velho, Rondônia, Brazil, 16–21 February 1992, attended by 26 environmental policy makers and research leaders from eight tropical countries, five NGOS, six international agricultural research centres, three regional research organizations and six donor agencies (ASB, 1992). Participants concluded that a global effort was needed because the problem and impacts were global and that cross-site comparisons of causes and solutions could provide insights not possible from isolated studies. The participants created the ASB consortium, set the broad basis for collaboration, selected three initial benchmark sites, and formed a governing body to guide the intricate linkages and processes. Two key recommendations of the Rio Earth Summit that was held later in 1992 provided international legitimacy to the ASB consortium. They appear in chapter 11, ‘Combating Deforestation’, of Agenda 21, as follows (Keating, 1993): Limit and aim to halt destructive shifting cultivation by addressing the underlying social and ecological causes. Reduce damage to forests by promoting sustainable management of areas adjacent to the forests.
Alternatives to Slash-and-Burn 347
Goal, hypothesis and objectives The overall goals of the ASB consortium are to help reduce the rate of deforestation caused by slash-and-burn agriculture, rehabilitate degraded lands created by slash-and-burn, and improve the well-being of slash-and-burn farmers by providing economically and ecologically viable alternative land-use practices. The underlying hypothesis at the inception of ASB was that intensification of agricultural systems on already cleared lands and rehabilitation of degraded lands at the humid forest margins would reduce deforestation. Although this hypothesis has since been shown to be too simplistic because the underlying behavioural assumptions were wrong (Angelsen and Kaimowitz, 2001), it provided a framework around which the programme focused its initial research objectives and activities: • •
•
•
Site characterization. Assess the principal socioeconomic and biophysical processes leading to deforestation, including government policy and decision-making patterns of farmers practising slash-and-burn. Environmental and agronomic sustainability studies. Quantify the contribution of slash-and-burn agriculture and alternative land-use practices to global, regional and local environmental changes such as climate change, biodiversity loss and land degradation. Socioeconomic studies and trade-off analysis. Integrated assessment of land-use alternatives to identify appropriate technologies and develop improved production systems that are economically feasible, socially acceptable and environmentally sound alternatives to current slash-and-burn systems or to understand trade-offs between land-use alternatives. Policy research and implementation. Identify policy options and institutional reforms that can facilitate the adoption of the improved systems and the balancing of trade-offs to attain a more desirable mix of outcomes and discourage further deforestation.
Succinctly stated, are there alternative land-use systems to slash-and-burn that reduce deforestation, poverty and global environmental changes such as greenhouse gas emissions and biodiversity loss? What are the type and magnitude of the environmental and livelihood trade-offs for these different systems? And, based on that trade-off analysis, how can the systems be influenced to attain better outcomes for a range of stakeholders, including farmers? The slash-and-burn topic is complex, involving multiple agents, land-use objectives and driving forces (Tomich et al, 1998b). In addition, slash-and-burn is carried out in a diverse array of biophysical, socioeconomic and policy environments. To address the objectives of the ASB consortium requires an understanding of the influence of these multiple factors and environments on the economic viability, sustainability and environmental impacts of the alternatives. From the outset ASB determined four key features to assist in this complex task: a cross-disciplinary
348 Agricultural Revolutions and Change
approach combining biophysical and behavioural sciences, the participation of diverse kinds of institutions, work based at benchmark sites, and common methods to be used at all sites. The benchmark sites and standard protocols are introduced in this chapter.
Cross-disciplinary research and development framework The ASB developed a conceptual framework in which the land-use system adopted by farmers depends on farm households’ objectives; their natural, human, social, technical and financial resources; and the biophysical, social, economic and political constraints to the use of these resources. The effects of these land-use systems for alleviating poverty, conserving resources and reducing deforestation were then assessed along with the impacts of current and alternative policies (Palm et al, 1995; ASB, 1996). An integrated natural resource management (INRM) research framework that was later developed by the international agricultural research centres (Figure 15.2; CIFOR, 2000; Izac and Sanchez, 2001) was based largely on the ASB experience. The various steps in the research process of problem identification, assessment of food and income services, assessment of ecosystem services, trade-off analysis, policy research and implementation, and impact analysis are discussed in the following sections.
Source: Modified from ASB, 1996; CIFOR, 2000; Izac and Sanchez, 2001)
Figure 15.2 The research and development framework used by ASB
Alternatives to Slash-and-Burn 349
Diverse institutions In 2001 the ASB consortium was composed of seven national agricultural research systems, four other national agencies, seven international agricultural research centres, 20 universities and advanced research institutions, and five local and national NGOs. The ASB researchers have organized themselves in an evolving collection of multidisciplinary thematic working groups, including site characterization, biodiversity (above- and below-ground), climate change, agronomic sustainability, sustainable land-use mosaics, farmer concerns, policy and institutional issues, synthesis and linkages, and training and capacity building. A Global Steering Group provides governance to the consortium. It meets yearly and sets overall policy, funding strategy and reporting. A global coordinator with a small global team of two to three staff facilitates operations (Swift and Bandy, 1995).
Benchmark sites A network of benchmark sites was identified to represent large, active areas of deforestation caused by slash-and-burn practices. The sites that were selected provide a range of biophysical and socioeconomic conditions under which slash-andburn occurs and include a land-use intensity gradient from traditional shifting cultivation to intensive continuous cropping and degraded lands. Benchmark sites were also selected based on sufficient infrastructure to conduct the research and development activities. Each benchmark site covers a large area and has a national research station as its physical base, but the bulk of the work is done locally with researchers, NGOs, extension services, farmers and policy makers. Latin America Two areas were selected in the Amazon Basin; they represent areas that have experienced rapid deforestation as a result of government colonization programmes (western Amazon Brazilian benchmark site) and other areas of lower population density and poor infrastructure where population densities are increasing through spontaneous migration from the overcrowded urban and Andean areas (Peruvian benchmark site). The site in the western Brazilian Amazon encompasses two colonization projects, Pedro Peixoto, Acre and Theobroma, Rondônia, and areas along the BR-362 highway. Settlements are all under government sponsorship, with migrants assigned 50- to 100-ha plots, and currently undergoing rapid development. The site headquarters is the Empresa Brasileira de Pesquisa Agropecuária (Embrapa)–Acre research centre, near Rio Branco. The Peruvian benchmark area focuses on Pucallpa and Yurimaguas in the Ucayali and Loreto regions of the Selva Baja. The site is managed from the Center for Forestry Research (CENFOR) of the Instituto Nacional de Investigación Agraria (INIA), working in close cooperation with Consorcio para el Desarrollo Sostenible de Ucayali (CODESU), a group of NGOs, the Ucayali Regional Government, the Instituto de Investigación de la Amazonía Peruana (IIAP), and INIA’s Yurimaguas Experiment Station.
350 Agricultural Revolutions and Change
A third area in Latin America represents the humid and subhumid forests of the Atlantic Coast of Central America and Mexico where encroaching urban areas and slash-and-burn has reduced the extent of the northernmost extension of tropical forests. The benchmark area in the Yucatan in south-east Mexico was managed by Instituto Nacional de Investigación Forestales, Agricolas y Pecuarias (INIFAP). Africa A site in Cameroon represents the equatorial Congo Basin rainforest of Congo– Kinshasa, Congo–Brazzaville, Equatorial Guinea, Gabon, Central African Republic, and Cameroon, where there is low but increasing population density and largely indigenous slash-and-burn agriculture. The site includes a north–south gradient, from rapid, spontaneous colonization around Yaoundé at the north, though an intermediate situation at M’Balmayo, to very low population density at Ebolowa in the southern end, close to the Gabon–Equatorial Guinea border. Site headquarters are at the Institut de Recherche Agricole pour le Développement (IRAD) at Nkolbisson, near Yaoundé, with strong support from the IITA Humid Forest Centre. South-East Asia Sites in South-East Asia represent three quite different forest ecosystems. The Sumatran benchmark area in Indonesia represents the equatorial rainforests of the Indonesian and Malaysian archipelago. Located in Jambi and Lampung provinces, it covers a broad gradient from primary forests in the Jambi area to degraded Imperata grasslands in Lampung Province, including both indigenous farmers and colonization projects as well as large-scale plantations and logging companies. The site is managed from the Central Research Institute for Food Crops (CRIFC) of the Agency for Agricultural Research and Development (AARD) in Bogor, Java. A benchmark area in the Philippines represents the monsoonal forests, where only forest remnants exist on steep mountain slopes and degraded grasslands dominate the landscape. The sites in Claveria and Lantapan in Northern Mindanao, Philippines, are operated by the Philippine Council for Agriculture, Forestry, and Natural Resources Research (PCARRD) together with a number of other organizations. A benchmark area in the Ma Chaem watershed near Chiang Mai, Thailand, represents the extensive area of subtropical hill forests of mainland mountain South-East Asia found in Thailand, Myanmar, Laos, Vietnam and southern China. The site was chosen to extend ASB research into higherelevation areas with broad ranges of slope conditions where issues of land-use management often overlap with issues of watershed management. The benchmark site is managed by Thailand’s Royal Forest Department in close collaboration with Chiang Mai University. All benchmark sites fall within the tropical and subtropical moist broadleaf forest biome (WWF, 2001). To indicate how much the benchmark sites represent other areas in the tropics, regional similarity classes were developed from a set of key physical, environmental determinants of plant growth. The DOMAIN potential
Alternatives to Slash-and-Burn 351
Note: The DOMAIN similarity values are based on elevation, potential evapotranspiration, total annual precipitation, precipitation in the driest month, precipitation range, minimum average monthly temperature and maximum average monthly temperature. Source: Gillison, 2000
Figure 15.3 Map indicating the location and global environmental representativeness of the ASB sites in western Amazon, Indonesia, Thailand, Philippines and Cameroon
mapping procedure developed by Carpenter et al (1993) was used to generate the map shown in Figure 15.3 of matching climate surface values for each of 108 sample locations in ASB’s benchmark sites in Brazil, Indonesia and Cameroon. The various similarity classes indicate the degree to which the ASB sites can be extrapolated over a global surface using the same climate variables. Initial ASB research was concentrated in the Brazil, Cameroon and Indonesian benchmark sites, and these three thus serve as the focus for this chapter, although much progress has also been made in Thailand and Peru.
Research Themes and Methods The ASB integrates a range of geographic sites, spatial and temporal scales, disciplines, and partner institutions. To implement the various steps of the interdisciplinary INRM research framework at the various sites demanded a minimum, common research approach for making cross-site comparisons. Standardized methods were developed for identifying problems and characterizing sites (Figure 15.2, step 1), quantifying the environmental, agronomic and socioeconomic parameters of the different land-use alternatives (steps 2 and 3), assessing the economic and environmental trade-offs (step 4), and researching and implementing policies (step 5). The various methods are described in detail in this section.
352 Agricultural Revolutions and Change
Characterizing sites The first phase of ASB research involved characterizing the benchmark sites. The purpose of the characterization was to describe the biophysical, socioeconomic and policy settings of the sites, define the extent and process of slash-and-burn agriculture in forming land-use patterns, investigate the driving forces for slash-and-burn, develop typologies of slash-and-burn land-use systems that exist across the ASB sites, establish a baseline of information for future impact assessments, and provide regional and global extrapolation domains for research results. The results were used to identify research priorities and develop research protocols for the subsequent steps. Guidelines were developed for characterizing the rates of forest conversion; dominant land-use systems; and the biophysical, socioeconomic and policy environments in which they are found at the regional, benchmark, community and farm and household scales (Palm et al, 1995). Within each benchmark site there are numerous communities that represent a range of demographic conditions and land-use histories that result in different local land-use patterns. The characterization process also included detailed interviews to establish the problems, opportunities, constraints and resources at the community and farm or household scales, the responses to which were important for identifying factors that affect decision making and driving forces of land use and for establishing research agendas for finding sustainable alternatives to slash-and-burn. Remote sensing and geographic information system (GIS) techniques were used to assess rates of deforestation and land-use patterns at the sites. Site characterization results for the first three benchmark sites are documented by Ávila (1994) for Brazil, Ambassa-Kiki and Tiki Manga (1997) for Cameroon, and Gintings et al (1995) and van Noordwijk et al (1995) for Indonesia. Information is also presented in benchmark site reports (Tomich et al, 1998a; Kotto-Same et al, 2000; Lewis et al, 2002). A comparison of some of the key biophysical and socioeconomic conditions shows the broad range encompassed by benchmark sites (Table 15.1). Comparable activities and approaches for Mexico and the Philippines are presented in Haggar et al (2001) and Mercado et al (2001), respectively. Meta–land-use systems A set of meta–land-use systems was identified from the site characterization process that aggregates the broad range of specific land-use systems found in the diverse benchmark sites (ASB, 1996). Such systems were initially identified as ‘best-bet’ and ‘worst-bet’ alternative systems for specific benchmark sites (Tomich et al, 1998b). Meta–land-use systems include forests, complex agroforests, simple agroforests, crop–fallow rotations, continuous food crops, and pastures and grasslands (Table 15.2). This array of land uses covers a gradient often used by biophysical scientists to describe varying levels of disturbance of forest for agriculture (Ruthenberg, 1980; NRC, 1993). General descriptions of these meta–land-use systems and some specific examples are given here.
5–30 1.21
Paleudults, hapludox 3–5 15–250a 6.25
Predominant soils (US Soil Taxonomy)
Population density (people/km2)
Farm size (ha/household)
4–200
Kandiudults
July–August; October–February
Source: Modified from Tomich et al (1998b)
Notes: a Indicates small-scale farms as initially defined for Brazil. b Wage rates are from 1996–1997. c For women and men, respectively.
Agricultural wage (US$/d)
Tropical moist forest; Tropical moist forest; Tropical semideciduous semideciduous moist forest forest forest
Dominant original vegetation
b
June–September
Months dry season (10°) of 63–66°C, annual precipitation is 1006mm. The arable land of the county totals 680,000 mu with an average per capita of 0.85 mu. The soil is predominated by purple soil, which is relatively fertile and suitable for cultivation of different kinds of crops. However, due to a soaring population and irrational use of natural resources, the development of the county has fallen into a vicious circle. In the early 1980s, an integrated survey for diagnosis and design of an ecocounty was carried out. It was discovered that a series of disasters dominated the area: degradation of forest resources; increased soil erosion; degradation of soil fertility; worsening of local climate; shortage of rural energy; and poor economic development. Based on this situation and agroecological principles, the county government established a general framework and concrete measures for construction of an eco-county. In order to implement the development plan, the following measures were thought essential (Figure 18.7): (1) a leading group and special
Figure 18.7 The layout framework for Dazu ecoagriculture construction
448 Modern Agricultural Reforms
working office were established; (2) experimental sites were selected according to area and on the basis of scientific, technical and related decision making; (3) improving the plan and putting it into effect as a general development plan; (4) mobilizing farmers’ participation and creating different ecoagricultural models suitable for prevailing conditions; (5) monitoring the development process and spreading successful experiences; and (6) signing contracts between governments, technicians and farmers. After nine years’ of construction and development in this county, forest coverage has risen, eco-environmental conditions have improved, economic growth has accelerated, and the county has become a model in ecoagricultural construction in China. Major models of ecoagriculture In order to use local natural resources and improve ecological and economic development, many ecoagricultural models have been created and practised: paddy rice, dryland forest, orchard, and pond/reservoir constitute the major types and there are many extensive models developed for different natural and social conditions. 1. Paddy rice–fish model In the total area of 480,000 mu of cultivated fields, 160,000 mu have been developed in this model as: rice–mulberry–fish, rice–rice–fish, and rice–duck–fish models, occupying about 70,000, 12,000 and 1000 mu, respectively (Figures 18.8, 18.9 and 18.10). 2. Paddy rice-vegetables-vegetables/strawberries model At present, this model occupies about 2000 mu of crop fields. It can create relatively high profits but inclusion of fresh strawberries means that it is only suitable for areas with convenient transportation and irrigation, close to markets (Figure 18.11).
Figure 18.8 The model for a rice–mulberry–fish ecosystem
Integrated Farming Systems at Different Scales 449
Figure 18.9 The model for a rice–rice–fish ecosystem
Figure 18.10 The model for a rice–duck–fish ecosystem
Figure 18.11 The model for a rice–vegetable–vegetable/strawberry ecosystem
3. Planting–breeding–biogas model This model includes agriculture, animal husbandry and production of biogas and is a key link and the most popular throughout China, including Dazu.
Benefits analysis In the process of ecoagriculture construction, remarkable ecological, economic and social benefits have been achieved by means of integration of economic development
450 Modern Agricultural Reforms
with environment protection, i.e. by stabilizing food production, adjusting ecological structure, protecting the environment and increasing income. Ecological benefits Through the construction of an ecoagriculture county, forest coverage was raised from 5.7 per cent in 1983 to 19.6 per cent in 1993 and, thus, atmospheric quality was also greatly ameliorated. Soil erosion was controlled, sources of drinking water were managed and improved, and agriculturally disastrous weather was decreased. In low mountain areas, 100,000 mu of bamboo entered the stage of canopy closure, 10 million plants of tung oil tree in the middle and remote mountains began to produce oil, and about 50,000 mu of orchard and 100 million mulberry trees are having positive effects on the environment. Economic benefits Through a nine-year construction period from 1984 to 1993, great progress in the agroeconomy of Dazu County has been made. The financial income was increased from 180.4 million yuan RMB in 1983 to 631.4 million yuan in 1993. Local financial input to agriculture was also enhanced from 1.59 million yuan in 1983 to 4.24 million yuan in 1993. The total income from the countryside reached 1.4 billion yuan, and was raised as much as 5.7 times. In 1993, the total production of food was 455 million kg, an increase of 22.7 per cent. In 1993, 3.988 million tons of fish was caught, which was 2.7 times that of 1983. As regards fruit production, this were 8.198 million kg or 2.7 times more than in 1983. The output of tung tree oil shot up to 2 million kg, 9.7 times more than in 1983. Social benefits Dazu was awarded the honour of Advance Unit of Agroenvironmental Protection by the Ministry of Agriculture, and was one of the approved 51 ecoagriculture counties. Many organizations and people, including many professors, specialists and students from over ten countries, showed their appreciation for these achievements. In addition, the construction of an ecoagriculture county accelerated the exploitation of natural resources and the development of sectors other than agriculture. Consciousness of environmental protection was further strengthened so that the degree of scientific decision making in agriculture was improved.
Perspectives Based on the experiences gained in the pilot counties, the different models should be developed and implemented in accordance with various physical and economic conditions. We have summarized some of the main factors that need to be considered in further construction of eco-counties in all areas of China (Li et al, 1994).
Integrated Farming Systems at Different Scales 451
1. Eastern coast region This region includes the central eastern part of the Liaoning, Beijing–Tianjin– Tanggu area, eastern Shandong, Jiangsu, Zhejiang, Fujian and the delta of the Pearl River basin. These are the most developed areas in China with good conditions for development of industry and agriculture. Conservation of land resources should be the first priority in this region. High-quality, high-efficiency and highyield agriculture should be developed here. The linkage between rural and urban ecosystems should be strengthened. The input of chemical fertilizer should be limited and rational exploitation of marshland should be made in coastal areas. 2. Songnen Plain region Located in north-eastern China, this region includes Heilongjiang, Jilin, the northern part of Liaoning and a small part of Inner Mongolia. It is one of the most important bases of commercial grain and economic crop (e.g. soybeans, sugar beet) production as well as timber and petroleum. In the central and southern part there is little wasteland for reclamation due to a long history of cultivation. Special attention should be paid to developing agroforestry systems to strengthen the commercial base. The northern part of the region was only exploited later and there is still potential for further reclamation. The area has expanses of marshland which require special attention during eco-county construction. 3. Loess Plateau region The most distinguishing feature in northern China is the extensive distribution of loess and loess-like deposits. Such deposits are distributed widely through Shanxi, Shaan’xi and Gansu Provinces, to form the famous Loess Plateau. The most concentrated loess region is in the middle reaches of the Huanghe River. Lack of rain, high temperatures, low humidity and dry winds during the crop growing period greatly affect crop yields. In addition, soil erosion is a serious problem constraining development in this region. About 1600 million tons of silt are carried downstream by the Huanghe each year, of which 90 per cent comes from the Loess Plateau. With the silt, about 30 million tons of nitrogen, phosphorus and potassium are lost. The huge amount of sediment carried downstream silts up the river courses causing flooding. The main task for eco-county construction is to take measures to control soil erosion and prevent degradation of grassland while developing production. A water-saving agriculture system should be established in the course of eco-county construction. 4. Huang-Huai-Hai plain region This region covers the Haihe River plain in the north, the Huanghe River basin in the central part, and the Huaihe River basin in the south. It is one of the most important grain and cotton producing areas in China, with double cropping in its southern part and three crops in two years in the northern part. Inadequate drainage, a high water table, arid climate and strong evapotranspiration have caused salinization and alkalization that have impeded development in the region. The
452 Modern Agricultural Reforms
main task for eco-county construction is integrated manipulation of drought, floods, salinization and alkalization through effective utilization of water resources, rational construction of irrigation and drainage; effective use of straw and residues of crops, as well as the development of multi-layer and multi-component agroanimal husbandry systems. 5. South China red soil hills and low-mountains region This area comprises the southern part of the subtropical zone and the lower reaches of the Changjiang River basin, Hunan, Jiangxi, Zhejiang, the northern part of Zhejiang and southern part of Hubei and Anhui Provinces. The organic matter in soil decomposes and leaches out rapidly. So, in spite of the nutrients accumulating quickly in the red earth, it contains only a small amount of organic matter with a high degree of acidity. It has weak water and fertility preservation capacity and is apt to be washed away or dried out. The main task for construction of an ecocounty is to develop comprehensive models combining various sectors in order to fully use the natural resources and, at the same time, protect soil from erosion, and mitigate environmental degradation. 6. South-west China region This region comprises the southeast of the Qinghai-Tibetan Plateau, west of the Guizhou Plateau, the Sichuan basin, almost all of Yunnan Province and the southwestern part of Sichuan Province. It is influenced by the monsoon from the west and east, the weather is warm and clear in winter with heavy rainfall in summer. The main task for eco-county development is to raise the efficiency of water and land resources through the development of IFS. Special attention should be paid to introducing high-value cash crops and strengthening the linkage between agriculture and the processing industry so as to increase the value of commercial products. 7. North-western region This consists of the Xinjiang Autonomous Region, the western part of the Inner Mongolia Autonomous Region, the Gansu Corridor, the Qilian Mountains and the Chaidamu Basin in Qinghai Province. Located in the central part of the Asian continent, this region receives little precipitation of uneven distribution. For construction of an eco-county, the first priority should be construction of irrigation systems and development of water-saving agriculture. Overall allocation and different combinations of cereal crops, afforestation and grass-planting are particularly important. Appropriate measures to fix sand dunes and control salinity should be incorporated. 8. South China tropical region This region encircles the south of China, i.e. the southern part of Guangdong, the Guangxi plateau and the Tibetan Autonomous Region on the mainland, the island of Haina and part of Taiwan. With its high temperatures, abundant rain, and vast
Integrated Farming Systems at Different Scales 453
expanse of plains and hills, this region is an ideal environment for the development of tropical cash crops. But there are some unfavourable climatic factors for the development of such crops, including occasional low temperatures in winter, seasonal dry spells and strong winds. These can be prevented or alleviated to a certain extent by artificial measures. Protecting the environment, conserving land resource and developing IFS using a combination of agriculture, forestry, aquaculture and animal husbandry, are the goals of eco-county construction. 9. Qinghai–Tibetan Plateau region The Qinghai–Tibetan Plateau is the highest in the world and covers the whole Tibetan Autonomous Region, most of Qinghai Province, the western part of Sichuan Province, north-western part of Yunnan Province, south-western area of Gansu Province and the southern border area of Xinjiang Autonomous Region. This region is characterized by its altitude, vastness, diversity and fragility. However, economic development is somewhat backward. The general aims for construction of an eco-county are to develop the regional economy by reforming the current crop-oriented cultivation to a three-dimensional economy by expanding the proportion of animal husbandry and forestry while strengthening nature conservation.
Construction of Shelterbelt Systems China is a country with fragile ecosystems and suffers various and frequent disasters: north and north-western China is poor in natural resources and suffers frequent natural disasters such as floods, droughts, wind storms and soil erosion, which have caused tremendous threats and damage to agricultural production. In order to prevent and mitigate damage caused by disasters and improve agricultural production, the Chinese government has undertaken macro-scale shelterbelt construction in north-east and north-west China, the upper and middle reaches of the Yangtze River basin, the coastal zone and the plain region, together comprising the four biggest ecological engineering projects in China.
‘Three North’ forest protection engineering Introduction ‘Three North’ includes the north-western, north and north-eastern region of China. This area is characterized by an arid or semi-arid climate. The ‘Three North’ region is not only abundant in natural resources but also rich in national heritage, with a long history. According to historical records, the region was once covered with dense forests, fertile grasslands and farmlands but, due to the wars of successive dynasties and other reasons, the ecological environment deteriorated year after year, causing serious sandstorms and soil erosion. Agriculture production and
454 Modern Agricultural Reforms
animal husbandry were adversely affected and people lived in poverty due to lack of fuel, fodder, fertilizer and timber. It became known as a region with the most harsh environment with the most backward economic conditions in the country. Forest resources and their distribution are influenced by the local environment which affect agriculture, livestock production and economic condition of the society. The Chinese Government has given priority to conservation and development of forest resources. Before 1977, the natural forest area in the ‘Three North’ region was only 16,947,000ha, of which scrub made up 42.6 per cent. The natural forests were distributed in hilly and mountainous areas of the south-east area of the ‘Three North’ region, and the medium and high mountains in the west, beyond the 400mm isohyet including the Tianshan Mountains, Aertai Mountains and Qilian Mountains. In the vast desert and semi-desert area, very little scattered natural secondary forest is present, with trees and shrubs such as Populus euphratica, Haloxylon ammodendron and Tamarix chinesis. The average forest cover of the three provinces was only 1.1–2.2 per cent. Serious destruction of natural resources has resulted in degradation. Drought frequency increased from an average of once in 17 years in the Qing Dynasty (1664–1800) to once every 1.5 years during the period 1950–1975. The ‘Three North’ region is an important area for agricultural and livestock production in China, with rich solar energy resources. The annual accumulated day temperature, with daily temperature above 10°C amounts to 1500–4500°C. The annual frost-free period is 100–180 days. The annual average temperature gradually decreases from south to north and is between 12.1°C and –2.2°C. The north-western part of the region, covering 58 per cent of the total land, belongs to the arid climate zone, with an annual precipitation under 250mm. The southeastern part of the region is in the semi-humid zone with an annual precipitation of 400–600mm. Between them, accounting for 10 per cent of the total land, is the semi-arid zone, with 250–400mm annual rainfall. Most of the rainfall is concentrated in summer, and only 10–15 per cent of rainfall is in spring (Table 18.14). The construction of ‘Three North’ shelterbelt In order to improve the natural environment and social conditions of people of the region and to speed up the development of agriculture, forestry and animal husbandry, the Chinese Government decided to build a protective forest system in the region seriously affected by drought, wind, snow storms and soil erosion. This came to be known as the ‘Three North Protection System’ and has been listed as a key project in the country’s economic construction. Guided by the theory of IFS, the ‘Three North’ shelterbelt system is designed to cover a vast area from 73°30' to 127°50' east and 33°20' to 49°48' north. It starts in Binxin County, Heilongjiang Province in the east to the Uzbel Pass, Xinjiang Autonomous Region in the west; and from the country’s border with Russia in the north to Tianjing, the Fenhe, Weihe, the lower reaches of the Taohe River, the Burhanda and the Kunlun Mountains in the south, which includes 645 counties in 13 provinces, municipalities and autonomous regions, and covers an area of
Integrated Farming Systems at Different Scales 455 Table 18.14 Land distribution of ‘Three North’ region Areas North-eastern China Inner Mongolia and Xinjiang
Farmland
Forestland
Grassland
Others
22.9
16.5
45.4
15.2
2.5
3.2
38.4
55.9
Loess Plateau
29.9
18.5
35.7
15.9
Northern China
26.1
25.3
29.0
19.6
1,600,000km2. Afforestation and shrub-grass cultivation will be carried out in a total area of 20,000,000ha. This programme is to be executed in three phases: first, scheduled from 1989 to 2000, incorporating 12,100,000ha of greening areas; second (2001–2010), 6,000,000ha are to be afforested; and the third (2010–2050) is expected to add another 1,900,000ha forest–grass–shrub plantation. On completion of the three phases of the programme, the forest–grass–grass cover should be 45 per cent in 2050, from 20 per cent in 1988. Farmland and pastures will be protected by shelterbelts; water run-off and soil erosion in the Loess Plateau will be brought under control; and the problem of firewood shortage will be basically solved. All these will lead to a great improvement in the economy and the standard of living of the local people. As in most of the ‘Three North’ area, the shortage of water so seriously hinders tree survival and growth that the key to successful afforestation lies in meeting the desperate need for water. During the implementation of the programme, efforts were centred around fighting drought, as well as soil and water conservation. Technical designs were drawn up in the light of local conditions, e.g. planting the species best suited to the site, integration of trees, shrubs and grasses. Due attention is given to avoid monocultures which may invite plant diseases and insect pests. On the Loess Plateau, where soil erosion is extreme, preference is given to droughtresistant shrubs, conifers and broad-leaved trees such as little-leaf pea-shrub (Caragana microphylla), common seabuckthorn (Hippophae rhamnoides), wild peach (Persica davidiana), oriental arbor-vitae (Biota orientalis), Chinese pine (Pinus tabulaeformis) and black locust (Robinia pseudoacacia). In sandy, wind-blown areas, in addition to using of drought-tolerant species, an emphasis is put on shrub species most resistant to scouring sand, like sacsaoul (Holoxylon ammodendron), Hedysarum scoparium, Hedysarum mongolicum and Callionum mongolicum. In places with relatively favourable water conditions, quick-growing species of a higher quality are planted, e.g. Scots pine, poplar and narrow-leaved oleander (Elaeagnus angustifolia). In planting and maintenance, stress is placed on technical measures for fighting drought, from site preparation before the rainy season, water conservation and soil moisture preservation, to careful planting with strong seedlings and intensive management (Table 18.15). Establishment of shrub plantation is possible in most of the area but is particularly suitable for arid and semi-arid lands. The success rate of shrubs is often twice or three times that of trees. Increase in forest cover through clothing the
456 Modern Agricultural Reforms Table 18.15 Main species used for reafforestation in the Deng kou Experimental Bureau Scientific name TREES Leguminosae Caragana arborescens (Lam.) Elaeagnaceae Elaeagnus angustifolia (L.) Pinaceae Pinus sylvestris (L.) var. mongolica (Litv.) Pinus tabulaeformis (Carr.) Salicaceae Populus bolleana (Lauche)
Common name
Uses and features
Pea tree
Indigenous
Russian olive or narrowleaved marsh willow
Indigenous
Mongolian Scots pine
Indigenous
Table pine, Chinese pine, Flat topped pine
Indigenous to more southern areas of China
Xinjiang poplar
Contorted willow
Used widely in S. America for shelterbelts and in hybridization, indigenous Indigenous, tolerant of heat and salinity with a large natural range Fairly drought tolerant, indigenous Largely ornamental but widely planted in early shelterbelts in China, indigenous Produces fodder for livestock, indigenous Ornamental, indigenous
Mongolian willow
Indigenous
Branchy tamarix
Deciduous, indigenous
Siberian elm
Indigenous
Yellow-horntree
Deciduous, edible nuts and high-grade oil for cooking and machinery use, indigenous
Populus euphratica (Oliver) Diverse-leaved poplar (syn. Populus diversifolia) Populus nigra (L.) var. thevestina (Dode) Populus simonii (Carr.)
Grey bark poplar
Salix matsudana (Koidz) var. pendula (Schneid.) Salix matsudana (Koidz) cv. Tortuosa (Vilmorin) Salix mongolica (Suizev) Tamaricaceae Tamarix chinensis (Lour.) Ulmaceae Ulmus pumila (L.) Sapindanceae Xanthoceras sorbifolia
Pendulous willow
Weeping poplar
SHRUBS and SUB-SHRUBS Leguminosae Ammopiptanthus Mongolian mongolicus (S.H.Cheng) ammopiptanthus
Indigenous
Integrated Farming Systems at Different Scales 457 Table 18.15 (continued) Scientific name Common name Amorpha fruticosa (L.) Shrubby false indigo Astragalus adsurgens (Pall.) Milk-vetch
Caragana korshinskii (Kom.) Caragana microphylla (Lam.) Halimodendron halodendron (Voss.) Hedysarum mongolicum (Turcz.) Hedysarum scoparium (Fisch et May)
Korshink pea shrub
Uses and features Deciduous, SE US Perennial, deep rooted, prostrate shrub, found on dry stony or gravel slopes and bogs, indigenous Indigenous
Little-leaved pea shrub
Indigenous
Saltbush
Very salt tolerant, indigenous
Mongolian sweet vetch
Lespedeza bicolor (Turez)
Shrub lespedeza, bush clover
Suitable for aerial seeding, indigenous Suitable for aerial seeding, produces fodder for livestock, indigenous Deciduous, indigenous
Compositae Artemisia sphaerocephala (Krasch) Artemisia sphaerocephala Polygonaceae Atraphaxis bracteat
Caligonum mongolicum (Turcz.) Chenopodiaceae Haloxylon ammodendron
Elaeagnaceae Hippophae rhamnoides (L.) Zygophyllaceae Nitraria tangutorum (Bobrov.) Zygophyllum xanthoxylon (Maxim.) Tamaricaceae Reaumuria soongarica (Maxim.)
Slender branch sweet vetch
Ordos wormwood Roundhead wormwood
Saltbush
Mongolian broom
Suitable for aerial seeding, indigenous Drought tolerant, suitable for aerial seeding, indigenous Very drought tolerant, deciduous, indigenous to nearby parts of Mongolia Very drought tolerant, indigenous
Saxoul (C.A. May)
Xerophytic pioneer shrub. Uses include fuel, fodder timber for building and roots for medicine
Buckthorn
Deciduous, indigenous
Edible-fruited nitraria
Indigenous
Common beancaper
Edible buds, indigenous
Songory reaumuria, Songory tamarix
Indigenous
458 Modern Agricultural Reforms
mountains will lead to great development of the entire region because it is laboursaving and less costly, and good results can be obtained in the short term. With adequate rainfall (no less than 200mm/year) and careful management, shrubs and some scattered trees provide pleasing views no more than three to five years from planting. Aerial seeding is carried out in some areas with sparse populations. Positive experiences of successful aerial seeding of shrub species has been gained in some places where annual precipitation is limited to 200mm. The funds required for execution of the programme were raised from all possible sources. Private contributions in the form of investment of workdays on an individual or group basis were encouraged. Investment from collectives was taken from the gross revenue of various sectors of agriculture. The government also allocated funds totalling 267,000,000 yuan RMB over seven years. Another 9000 million yuan have been raised from other sources through either state or local channels. The funds from the state and collectives go mainly to planting and nursery activities. There are special plans to govern the use of the state funds which are put into key projects. Preference is given to those who have the best chance of success, and contracts are signed and payments are made by instalments, as requested. From time to time, assessment takes place when rewards and punishment are duly meted out. This approach functions well, guaranteeing proper use of funds and resources. Accomplishments and effects The joint efforts made by people of all nationalities have led to a total of 9,150,000ha being afforested, i.e. 831,800ha each year. In addition, 2,238,000ha of hills and mountains were also used to encourage the growth of forests and grasses, 23,000ha were air-seeded for forests, and 3 billion trees were planted in a scattered manner. In 11 years’ of work remarkable ecological effects and considerable economic returns have been achieved through the development of farming, stock-raising and a diversified economy. In some areas of the region, sandstorms, water loss and soil erosion have been brought under control. The forest shelterbelts have protected 11 million ha of farmland which were frequently hit by sandstorms and dry hot winds, and grain output has thus increased. For instance, the farmland shelterbelts built in the middle and western part have jointly formed a large system of forest networks. Obvious changes have taken place in regional microclimate. According to fixed spot observations made by the Jilin Institute of Forestry Survey and Planning, wind speed was reduced by 23.7 per cent on average; air temperature was raised by 0.63°C; soil surface temperature increased by 3°C; evaporation was reduced by an average of 15.2 per cent; soil water content increased by 18.6 per cent; and relative humidity by 12.6 per cent. About 40 per cent of the planted trees in the shelter belt networks have matured. This has alleviated the shortage of timber, fuelwood, fodder and fertilizer. Grassland of more than 8,800,000ha has been established in desert and semidesert areas of the region, controlling soil desertification, salinization and grassland
Integrated Farming Systems at Different Scales 459
degradation, and grass output has increased by over 20 per cent. In Maowusu and Holqin deserts forest coverage has gone up from 7 per cent and 10 per cent to 16.1 per cent and 18.8 per cent, respectively, since the project started. The ecological environment in the two areas has fundamentally improved. In the Xishui He River valley and Weibei Plateau of Shanxi Province, forest coverage has considerably increased. Water loss and soil erosion have been brought under effective control with quite remarkable economic effect. Over 730,000ha of fuelwood forest produced three million tons of fuelwood per year which, combined with other energy resources, has solved the fuel problem for some five million households in the countryside. The area of economic forest has increased from 826,000 to 1,440,000ha which produced 2,750,000kg of dried and fresh fruits. The forest coverage of 12 cities and counties situated in the upper reaches of the Yellow River in Gansu Province increased from 8.7 per cent in 1977 to 12.3 per cent, and erosion-control area cover more than 300,000ha. In Shanxi Province three main sand-control forest belts have been established along the Great Wall, in the border area with Inner Mongolia and the foothills of the Baiyu Mountains. Since the beginning of the project in 1978, the state and local authorities have invested 2420 million yuan RMB, and a total of 1050 million man-days have been spent by the people and local army units. Outstanding accomplishments have been achieved and the results are remarkable. As far as the entire project is concerned, this is just the first step of a ‘long march’, but it is firmly believed that this great IFS programme, which will benefit both our and future generations, can be brought to a successful completion under the leadership of the Chinese Government.
Shelterbelt systems in the middle and upper reaches of the Yangtze River Basin Introduction The Yangtze River (Changjiang) is the longest river in China, with the widest drainage area and the largest water flow. It originates from the Qinghai–Tibetan Plateau and flows eastward across Xizhang, Qinghai, Yunnan, Sichuan, Hubei, Hunan, Jiangxi, Anhui and Jiangsu Provinces/Autonomous Regions and Shanghai Municipality and enters the Pacific Ocean. The Yangtze River can be divided into three main parts, in accordance with physio-geographical conditions: the upper reaches (from Zhimenda of Qinghai Province to Yichang of Hubei Province), the middle reaches (from Yichang to Hukou of Hubei Province), and the lower reaches (from Hukou to the mouth at Shanghai) (Ren Mei’e et al, 1985). The upper reaches of the Yangtze River lie on the Qinghai–Tibetan Plateau, with an elevation of 4000–5000masl. In the eastern margin of the Qinghai– Tibetan Plateau, all mountain ranges turn south-east or directly north–south, forming the famous Hengduan Mountain system with deep gorges cutting the upper reaches of the Yangtze River. The region which extends from the outer rim of the Qinghai–Tibetan Plateau, eastward to the Wushan Mountains, is mainly
460 Modern Agricultural Reforms Table 18.16 The basic hydrological features in different sections of the Yangtze River Section
Upper reaches
Length (km)
4529
(%) Drainage area (km2) (%) Annual discharge (108m3) (%)
Middle reaches
Lower reaches
927
844
Total 6300
72.0
14.7
13.3
100
100.55
67.74
12.56
180.85
55.6 4543 46.4
37.6 4636 47.3
6.8 615 6.3
100 9794 100
composed of plateau and basins with elevations of 1000–2000m. Eastward from that line and extending to the mouth of the Yangtze River is the third great step. In the lower Yangtze River basin, the third step staircase, there are extensive plains largely below 50m. This region is famous for grain production. The Yangtze River has a vast drainage area of 1.8 × 10⁶km2 and a particularly heavy annual run-off of 9.79 × 10¹¹m3, accounting for 37.2 per cent of the national total. In terms of average flow, the river has a water resources reserve of 2.3 × 10⁸kw, or 42.5 per cent that of the whole country. The average annual flow of the Yangtze River accounts for over 30,000m3/s, or 17 times that of the Huanghe River. Table 18.16 shows the basic features of different sections of the river. In order to relieve the Yangtze River flood problem, large-scale hydrological works have been done since 1949. Dykes along its main stream and its main tributaries have been repaired, raised or strengthened. The Jingjiang flood diversion project, the Hanjiang flood diversion project and other flood-storage projects have been built along its middle reaches, where the area is often hit by unusual floods. Many lakes have been dredged, and this has increased the capability of the Yangtze River to prevent flooding. At the same time, more than 40,000 small reservoirs for irrigation, and over 500 big and medium-sized reservoirs for multi-purpose utilization have been built. Currently, the Three Gorges Project, attracting worldwide attention, is underway, which will play an important role in preventing natural disasters and providing the electric power for economic construction and development of the Yangtze River basin. The climate of the middle and upper reaches of the Yangtze River basins is characterized by a vertical differentiation of climatic zones (Table 18.17). However, most of the areas located between 2000–3000m belong to a subtropical zone with warm winters, cool summers and spring-like weather for all four seasons. Although climatically the region does not have marked contrasts in seasons, it does have notable differences in dry and wet weather. Generally, it is dry from November to April and wet from May to October. The forest vegetation in different sections of the Yangtze Basin varies significantly. In the upper reaches of the Yangtze River, forest vegetation in some areas has maintained its natural structure and the latitudinal differentiation of the vegetation
Integrated Farming Systems at Different Scales 461 Table 18.17 Climatic conditions of the major cities along the Yangtze River City Yushu Changdu
Mean annual temperature (°C)
Annual precipitation (mm)
2.9
480.5
7.5
477.7
Huili
15.1
1130.9
Yibin
18.0
1177.3
Chongqing
18.3
1079.4
Yueyang
17.0
1302.4
Yichang
16.8
1164.1
Wuhan
16.3
1204.5
Jiujiang
17.0
1412.3
Anqing
16.5
1389.2
Wuhu
16.0
1169.8
Nanjing
15.3
1031.3
Shanghai
15.7
1123.7
are distinct, though most areas have suffered human disturbances. On the humid slopes, less than 2500masl, the original forest vegetation features subtropical mixed evergreen–deciduous broadleaf forests. The dominant species are in the genera Quercus, Alnus, Lithocarpus, Liquidambar, Populus, Castanopsis and Cyclobalanopsis. Most of these trees are somewhat cold-resistant evergreens, mixed with some temperate deciduous broadleaf trees. The forests have a complex form with a threelayer structure. The first layer consists of deciduous broadleaf trees, while in the second and third layers are evergreen broadleaf trees. On the forest floor the bamboo, Sinarundinaria chungii, grows. The deciduous broadleaf trees are mainly of the beech family, which reflects the extreme humidity of the local environment. The representative species of evergreen broadleaf trees are Cyclobalanopsis glauca of the beech family, Phoebe bourpei of the laurel family, and Schima superba of the tea family. Between 2500m to 3000m there are mixed coniferous broad-leaved forests. From 3000m to 4000m and even higher is the sub-alpine forest belt, dominated by species of spruce and fir. Alpine scrub, meadows and nival vegetation can be found in areas higher than 4000m. In the Hengduan Mountains are valleys with less precipitation, where the so-called dry and hot valley vegetation occurs. In the middle reaches of the Yangtze River the zonal vegetation is mixed evergreen and deciduous broad-leaved forests, growing on yellowish-brown soil. The natural forests are mainly distributed on mountains and hills. The forests are green all year round and contain an arbour layer, a shrub layer and a herbaceous layer. The trees are mainly in the genera Cyclobalanopsis and Castanopsis of the beech family and associated deciduous trees of beech, walnut and maple. Among the coniferous trees, masson pine (Pinus massoniana) and Chinese fir (Cunninghamia lanceolata) are dominant below 600–800m. Above this, Huangshan pine (Pinus hwangshanensis)
462 Modern Agricultural Reforms
grows. On the low mountains and hills cash tree crops such as chestnut, tung oil trees, Moso bamboo (Phyllostachys pubescens), Chinese sapium, tea trees, lacquer trees and citrus are cultivated. But warm-temperature fruit trees such as persimmons, Chinese chestnuts, pears, peaches and apricots can also be grown in this region. During recent decades many species have been used for afforestation. Besides the endemic species such as Chinese fir, masson pine and Metasequoia glyptostroboides, moso bamboo, Quercus accutissima, Cinnamomum camphora, Castanopsis fargessi and Sassafras tzumu, as well as many other fast-growing species such as Pinus elliottii, Pinus taeda, Chamaecyperis, spp. and Eucalyptus spp. have been introduced for afforestation. In the lower reaches of the Yangtze River are vast low-lying plains. The zonal vegetation is mixed evergreen and deciduous broad-leaved forest, and the zonal soil type is yellowish-brown soil, restricted to low mountains and hills. The extensive plains have been turned into cultivated vegetation and paddy soil. Even on low mountains and hills, original mixed forests were mostly destroyed and have been substituted by secondary growth of shrubs and grasses, and partly planted with masson pine and other economically valuable tree crops, such as tea and fruit trees. The great contrast between the intensively used and densely populated plains and the rather extensively used and sparsely populated slope lands is an outstanding feature of the region.
Main environmental problems Degradation of forest The long history of exploitation, increasing population pressure, the demand for timber and fuelwood, inadequate forest management, illegal use of marginal land, and poor economic development of the region, have led to declining forest cover and timber stocks. For instance, in Sichuan Province, forest cover decreased from 20 per cent in the 1950s to 13 per cent in the 1980s. While forest cover in the Sichuan Basin accounts for only 4 per cent. A similar situation is found in other provinces along the river; in Jiangsu, Anhui and Guizhou Provinces forest cover is only 8 per cent, 13.5 per cent and 15.1 per cent, respectively. So, the water conservation and regulatory role of forests in the Yangtze River has decreased significantly. Degradation of forest quality has also occurred. Many forests in the region are being degraded into low-value, secondary forest through repeated human disturbance, low soil fertility and careless management. In the upper reaches of the Yangtze River there are over 600,000ha of low-value forest, most of them in the Jialing River area and accounting for 60 per cent of the total forest. Pine and cypress are the dominant species of low-value forests (Yang Yupo, 1993). It is an arduous task to improve the current situation of low-value forests and replace them by highyield forests with effective environmental protection.
Integrated Farming Systems at Different Scales 463 Table 18.18 Variation of soil and water erosion areas Region
1957
1987
Increasing
Area (km2) Proportion (%) Area (km2) Proportion (%) Area (km2) Total
(%)
363,790
20.2
739,376
41.0
375,586 103.2
1850
3.8
6100
12.3
4250 229.0
Anhui
13,686
21.3
19,263
30.0
Jiangxi
11,000
6.6
38,360
23.0
Jiangsu
5577
40.7
27,360 248.7
Hunan
55,880
27.6
56,640
27.9
Sichuan
93,380
16.1
382,000
67.3
288,620 309.1
760
1.4
Guizhou
12,816
11.3
35,300
31.2
22,484 175.4
Soil erosion Soil erosion in the Yangtze River Basin is caused by both natural and man-made causes. The natural causes in the Yangtze River watershed include fragile mountain environments, high intensity, long duration rainfall, high stream density, steep stream gradients, mass movements, debris flows and landslides. The causes induced by human activities include deforestation, inappropriate land management practices, road construction in fragile lands, improper water collection, transportation and use of water. According to statistics, the total discharge of the Yangtze River reaches 5.02 × 10⁸ tons per year, or 19.1 per cent of the national total. At present, the water flow of every tributary in the upper reaches is decreasing, but the content of silt is increasing. For example, in Sichuan Province, the average silt content of water flowing in the Three Gorges area was about 5.1 × 10⁸ tons in the 1970s, and increased to 6.8 × 10⁸ tons in the late 1980s. The general status of soil erosion in different provinces of the Yangtze River Basin is given in Table 18.18. Since 1954 natural water bodies in the middle and upper reaches of the Yangtze River have declined by some 12,000km2. For example, the surface area of Poyang Lake has decreased by 36 per cent. In the Dongting Lake area 166,000ha have been reclaimed for farming. Some 10,000ha of land in the Taihu Lake area were also turned into polders between 1969 and 1974. In the Jianghan Plain the number of lakes with a water surface area over 50ha has dropped by 40.36 per cent from the 1950s to the 1980s and the total water surface area shrank by 43.67 per cent (The National Conditions Investigation Group under the Chinese Academy of Sciences, 1992). Construction of protective forests in the upper and middle reaches of the Yangtze River In 1989 the state approved the ‘Overall Plan for the Construction of the Protection Forest System in the Middle and Upper Reaches of the Yangtze River’. The objectives were not only to reduce water and soil loss, but also to improve the ecological environment for agriculture and to accelerate development of the economy in mountain areas. Under the guidelines of IFS, a multipurpose and comprehensive
464 Modern Agricultural Reforms
protective forest system was designed. This system integrates protective forest with cash crops, fuel wood, timber and other forest with specific purpose species. In the general plan of afforestation, arbour trees, shrubs and grass are combined. The coniferous and broad-leaved trees, deep-rooted and shallow-rooted plants, fastgrowing and slow-growing plants, supplement each other to form an integrated system with a great variety of plant species and multiple layers (Investigation and Research Team of Sichuan Forestry Society, 1990). This is a huge forestry ecological engineering project, covering 13 provinces/autonomous regions, 645 counties, and with a total area of 4,06 × 10⁶km2. The total area for afforestation is about 20 × 107ha. It is proposed that the areas of afforestation will consist of 1.21 × 10⁷ha between 1989 and 2000; 1.90 × 10⁶ha between 2011 and 2050. After completion of the project, the forest coverage will be raised to 45 per cent. The Yangtze River protective forest system may be divided into six ecoeconomic zones: the Jingsha River watershed on the western plateau of Yunnan and Sichuan Provinces, the Hanshui River watershed in the Qingling Range– Dabashan mountainous area, the Jialing River watershed in the Sichuan Basin, the Wujiang River watershed on the West Guizhou plateau, the Yangtze Trunk River watershed in mountainous areas of Sichuan and Hubei Provinces, and water systems of Dongting Lake and Poyang Lake in hilly areas of Hunan and Jiangxi Provinces. In the upper reaches of the rivers running across high mountains in western Sichuan Province, north-western Yunnan Province and the highlands of the northern and south-western edges of the Sichuan Basin and Qinling–Dabashan Mountains, special protective forest systems for soil and water conservation, in combination with timber production forests, should be initiated. The forest of multiple purpose use, including soil conservation, fuelwood, economic and shelterbelt forest networks, should be established in hilly areas of the Sichuan Basin. A forest system made up of timber, economic, and soil and water conservation forests should be undertaken in the mountainous areas of the Wujiang watershed. In the Dongting and Poyang Lake region and the lower reaches of the Yangtze River, bank protective and economic forest networks are the key types for protective forest construction. The distribution and layout of different kinds of forests should be based on the concrete conditions. Taking the hilly areas of the middle and upper reaches of the Yangtze River as an example, the general layout of its protective forest system is as follows: water and soil conserving forests on the top of the hills and on the slopes, economic forest belts serving to conserve soil and protect earth banks between farmland, and farmland protection forest networks between hills and in the valleys and plains. This arrangement provides step-like forest protective networks which run from hill tops to valley lands, intercepting water and conserving soil at different levels. This provides a spatial pattern of water and soil conserving forest in hilly areas which combines protective and productive functions in the agroforestry system. In general, gentle slopes of less than 10° gradient and valleys where soil erosion is infrequent are suitable for growing food or cash crops. Slopes of 10–20° gradient
Integrated Farming Systems at Different Scales 465
are suitable for growing economic or cash forest. Accelerated development of cash forest plantations is absolutely necessary in order to mobilize participation to overcome difficulties due to shortage of funds for long-term silvicultural programmes in mountain areas. Economic forests are a special category which are mainly used for non-wood products such as fruits, edible oils, fibres, pharmaceuticals, resins, gums, waxes and many other raw materials for industrial and commercial purposes. In the subtropical area of the lower reaches of the Yangtze River the most widespread species with economic potential are tea oil trees (Camellia oliefera), tung tree (Aleurites fordii, A. montana, Sapium sebiferum), Chinese walnut (Juglans regia), Chinese chestnut (Castanea mollissima), lacquer tree (Rhus verniciflorum), star anise (Illcium verum), eucomia (Eucomia umoides), and citrus fruit groves (Citrus reticulata), Litchi chinenses and Euphorbia longgan. Slopes of more than 20° gradient and hills need tree or scrub species to conserve water and soil. The common species of timber used for soil protection are Pinus massoniana, Pinus elliottii, Cunninghamia lanceolata, Quercus accutissima, Eucalyptus robusta, Sassafras tsumu, Robinia pseudoacacia, Ailanthus altissima, Albizzia julibrin and Paulownia fortunei. In recent years, after overall planning and comprehensive improvement, a number of red earth areas that were low yielding in the past have changed dramatically. In the Yangtze River Basin there are about 60 tree species, 20 shrub species and more than 30 herb species (not including those existing in silviculture environments) used for protective forest construction. Most of these species are indigenous, a few exotics suitable for these areas were also introduced, based on experience and observation in small-scale plots. Community structure and stand density determine forest function. They also affect ecological and economic benefits of the protective forest. Table 18.19 shows the major tree species for reforestation and their planting density in the Yangtze River Basin. Effects of afforestation for environmental protection and regional development 1. Improving the environment Seven years after the implementation of the Yangtze River Protective Forest Project, the environment of the Yangtze River Basin has been improved significantly. It is estimated that 2,707,500ha of multifunctional protective forest have been reforested during the Eighth Five Year Plan period in the upper reaches of the Yangtze River (Lu, 1996). The vegetation cover of the whole Yangtze River Basin has increased over 5 per cent. The proportion of protective forest and mixed forest has increased nearly 100 per cent. Most of the reforested woodland stands have closed and grown well. Shrub and herb layers of stands have developed rapidly. As a consequence, loss of water and soil has been primarily controlled and the area of soil degradation has been greatly reduced (Yang, 1993). In Xingguo County of Jiangxi Province, for example, the area of soil erosion was reduced from 160,000ha to 50,000ha and forest cover has increased 20.8 per cent, as compared with the 1980s. This previously well-known ‘desert area of the southern Yangtze River’ for water
466 Modern Agricultural Reforms Table 18.19 Planting density of main tree species of protective forest in the Yangtze River Basin Species Cupressus funebris
Single-storied forest
Multi-storied forest
D (m)
Stems/ha
D (m)
1.2 × 1.2–1 × 1
6945–10,005
1.8 × 1.8–1 × 1.5 3090–6660
4400–6660
1.5 × 3–1.5 × 2
2220–3330
1.5 × 3–1.5 × 2
2220–3330
Pinus massoniana 1.5 × 1.5 × 1.5 Pinus armandii
1.5 × 1.5–1 × 1.5
4440–6660
Pinus elliottii
2 × 3–2 × 2
1665–2505
Cunningham lanceolata
2 × 2–1.5 × 2
2505–4440
Cryptomeria fortunei
2 × 2–1.5 × 2
2505–4440
Metasequoia glyptostroboides
2 × 3–1.5 × 1.5 1.5 × 2–1 × 1.5
16,665–4440
Larix kaempferi
1.5 × 2–1.5 × 1.5
3330–6660
Quercus acutissima
2 × 3–2 × 2
3330–4440
Q. variabilis
4 × 2–1.5 × 2
1665–2505
Cinnamomun sp.
2 × 2–1.5 × 1.5
1245–3330
Eucalyptus robusta 2.5 × 2.5–2 × 2
2505–4440
Stems/ha
3 × 4–2 × 3 840–1665
Camptotheca acuminata
1.5 × 2–1.5 × 1.5
Sassafras tsumu
2 × 2–1.5 × 1.5
1605–2505
3 × 4–1.5 × 3
1110–3330
Alnus cretnastogyne
4 × 4–3 × 3
3330–4440
5 × 5–3 × 5
825–6720
Melia toosendan
2 × 2–1.5 × 1.5
2505–4440
Populus sp.
1.5 × 1.5–1 × 1.5
630–1110
3 × 3–1.5 × 2.5
Pterocarya stenoptera
1.5 × 2–1 × 1.5
3330–4440
2 × 3–1.5 × 2
1110–2685
Robinia pseudoacacia
2 × 2–1.5 × 1.5
3330–6660
3 × 3–1.5 × 2
1665–3330
Cladrastis wilsonii 3 × 4–2 × 3 Salix babylonica
2 × 2–1.5 × 1.5
Paulownia fortunei 1.5 × 1–1.5 × 1.5
3 × 3–1.5 × 2
405–660
4440–6660
1110–3330
2505–4440 825–1665
Gordonia acuminata
1.5 × 2–1.5 × 1.5
2490–4440
2 × 2–1.5 × 1.5
Betula luminifera
2 × 3–1.5 × 2
4440–6660
2 × 3–1.5 × 2
Ailanthus altissima 2 × 2–1.5 × 1.5 Albizzia julibrissin
4 × 4–3 × 3
Bischoaia javanica 2 × 3–1.5 × 1.5 Ficus lacor
4 × 5–3 × 4
3330–4440
1665–3330
1665–3330
3 × 4–2 × 3
2025–4400
6 × 6–4 × 5
615–1110
2490–4440
270–495
Integrated Farming Systems at Different Scales 467 Table 18.19 (continued) Species
Single-storied forest
Multi-storied forest
D (m)
Stems/ha
Ligustrum lucidum
3 × 4–3 × 3
1665–4440
D (m)
Stems/ha
Phyllostamus pubescens
7 × 7–5 × 5
495–825
Sinocalamus affinis
4 × 4–3 × 3
825–1110
Juglans regia
4 × 5–3 × 3
195–390
6 × 6–4 × 5
Aleurites fordii
8 × 6–6 × 7
615–1110
7 × 8–5 × 6
270–495
Castanea mollissima
6 × 7–5 × 6
495–825
10 × 10–8 × 9
180–330
Litchi chinensis
3 × 4–2.5 × 3
150–240
9 × 9–6 × 7
90–135
Euphorbia lorgan 1.5 × 1.5–0.8 × 0.8 240–330
4 × 5–3 × 4
120–240
4 × 5–4 × 4 495–615
Citrus reticulata
2 × 3–1.5 × 2
825–1335
2 × 3–1 × 2
495–825
Morus alba
2 × 2–1 × 1.5
440–15,630
4 × 5–3 × 3
1665–4995
Fraxinus chinensis
6 × 7–4 × 5
1665–3330
Trachycarpus fortunei
3 × 4–2 × 3
2205–6660
Rhus pyrifolia
l × 1–0.5 × 0.5
204–495
Camellia oleifera
1.5 × 1.5–1 × 1
825–1665
Coriaria sinica, Maxim
2 × 2–1 × 1
10,005–19,995
Amorpha fruticosa 1 × 1.5–0.8 × 1
495–825
4440–10,005
Nerinus indicum
1 × 1–0.7 × 1
825–2130
Rosa roxburghii
1 × 1–0.5 × 0.5
6660–13,245
Miscanthus sinensis
10,005–14,280
Saccharum spowtaneum
10,005–40,020
and soil erosion has become a prosperous and green county (Li et al, 1994). Field observations from watershed management show that protective forests have good effects on water conservation, while improving soil structure and chemical properties (Tang and Guo, 1995; Xiang, 1996). In addition, the crown and understorey layer of protective forest are capable of intercepting precipitation, reducing flow speed of surface run-off, increasing soil penetrability and enhancing water and soil conserving capacity. The protective forests have played a key role in maintaining soil fertility and conserving water and soil.
468 Modern Agricultural Reforms
2. Providing favourable conditions for rural development On the basis of reforestation with protective forest systems and implementing the ecological benefits of these systems, a great number of forest production bases have been established. Considerable economic benefits have been gained in terms of timber, fuelwood and economic forest products, such as medicines, fruit and other non-wood products. During the National Eighth Five Year Plan, more than 600,000ha of economic forests were reforested, and some 8000 township-owned forest farms were established in the middle and upper reaches of the Yangtze River Basin. Small-scale orchards, gardens for cultivation of medicinal plants, tea gardens, mulberry woodlands and bamboo gardens are growing in the area. The forests have improved the environment and microclimate for agricultural development and have promoted development of green industry. The cash income from the forest has reached nearly one-quarter of the farmers’ total income. According to observations and research in the experimental sites distributed in different topographies it was found that, after execution of the project, the forest coverage has increased and the environment of the region has improved significantly. For example, forest coverage has increased from 17.6 per cent to 41.6 per cent in low mountain areas, from 8 per cent to 39.9 per cent in hilly areas and from 12.7 per cent to 24.7 per cent in low hilly areas. Soil erosion has dropped from 4000ton/ha to 2000ton/ha. Considerable economic benefits have also been gained in terms of timber, fuelwood and economic forest products. In Wangchanggou small watershed, Guangyuan City, 33,000 fruit trees have been grown with an expected annual fruit yield of 800,000–1,000,000 yuan RMB. In addition, the blend of forests and grasses in the area supplies sufficient grass to feed between 1000–2000 cattle per year. It is expected that, by the year 2000, adjusting the optimal ratio between agriculture and forestry will likely reach 0.70–0.75 : 0.25–0.30 in hilly areas, and 0.25–0.30 : 0.70–0.75 in mountainous areas. The structural ratio between protective, timber, economic and fuelwood forest will likely attain 0.40– 0.50 : 0.25–0.30 : 0.20–0.25 : 0.05, respectively, in hilly areas. While in the mountainous region, the structural ratio of protection forest will reach 50–60 per cent, timber forest 30–40 per cent and economic forest 10–15 per cent.
Perspectives Although afforestation in the Yangtze River Basin has made preliminary progress in the past several years, there are still many problems to be solved for improving its forestry. 1. Conservation and rational utilization of existing forests The felling of existing forest must be well planned in both local and state-owned forests. The timber felled each year should not exceed the annual increase in timber volume. To take into account the long production cycle of forests, and to compensate for lost forest resources resulting from excessive cutting over a long period in the past, a fixed forest culture fee should be levied on the selling price for
Integrated Farming Systems at Different Scales 469
timber, bamboo and other forest products. Forest culture funds should be used mainly for preparing deforested land for production and for planting new forests. The forest department will conduct scientific research to increase the wood utilization rate and to discover potential uses for tree species that are currently not being used but which may have domestic or commercial potential. (Li Wenhua, 1993) 2. Afforestation and reforestation To plant trees and afforest the country is a basic national policy. In order to fulfil the task effectively it is necessary to continue to carry out the construction of forest systems along the Yangtze River, and to establish timber production bases in the hilly regions. These areas have high precipitation, with good conditions for development of fast-growing trees in short rotation. In addition to afforestation organized by forestry organizations, a voluntary mass afforestation campaign is being encouraged. For example, according to a resolution of the People’s Congress, all Chinese citizens above the age of 11, apart from the old, weak, sick and disabled, are obliged to plant three to five trees every year or provide an equivalent amount of labour by cultivating saplings, tending trees or other afforestation work as a condition of their permit. The locals have to carry out afforestation campaigns around ‘four sides’ (around houses, villages, roads and ditches). In addition to forest plantations, to assist natural regeneration, hillsides should be closed to facilitate reforestation and redevelopment of forest ecosystems. Aerial sowing is especially important in sparsely populated remote areas. The department of forestry will undertake and encourage the development of agroforestry in the region in general, and in the middle and lower reaches of the Yangtze River Basin in particular, where population pressure is particularly acute and cultivated land is scarce. Research programmes should be conducted to identify the optimal planting and cropping patterns under various conditions in order to improve overall productivity and to determine ecological compatibility. 3. Rectifying the existing laws and management systems These include: adjustment of the timber value in accordance with marketing requirements; establishment of a rational subsidy system for forest environmental protection; implementation of a low tax system for ecologically sound and environmental protection-oriented forestry management units and enterprises; establishment and improvement of a system of proper rights on exploitation; repayable use and transfer of forest resources; development of a forestry production insurance system; and accelerating multiple channel fundraising. 4. Improving nature reserve construction A nature reserve is a legally confined area where various important ecosystems and their environment, endangered species and national historical relics are placed under protection and management. The Yangtze River Basin is characterized by its rich biodiversity, unique ecosystems and numerous endemic and endangered species. During the last decades many nature reserves have been established in this
470 Modern Agricultural Reforms
region, mostly located in forest areas. Although significant progress has been made in establishing nature reserves in the region, much work is still to be done in the future and it is important that every nature reserve should have a proper management plan and implement it in situ. 5. Scientific research China will give special attention to forestry research by developing projects to solve the key problems of afforestation, and engage in research on seed multiplication, containerized saplings, vegetative propagation, high-yield tree saplings and dryland afforestation. A quota system and methods for increased forest utilization and regulation of forest reclamation will be established. China will take various measures to improve the maintenance of the ecological values of forests. It is important to establish forest inventory, monitoring and assessing systems for forestry. It is necessary to develop advanced forest utilization and exploitation techniques that minimize the impact on the environment, or have low pollution value, and work to develop and promote non-timber forest products. China will develop comprehensive prevention and control methods for pests and plant diseases, detection and prediction of forest fires, and will research and spread new fire prevention techniques. 6. Training and education In order to mobilize the people’s participation and improve forest management, an important goal will be to develop a forest public education system to make the value and multipurpose usage of forests known to the public. It is important to train forestry professionals and workers, with the emphasis placed on the young and women. China’s Agenda 21 (The Editing Committee, 1994) states that China will set up demonstration project bases and training centres dedicated to the layout of shelterbelts and networks for fast-growing and high-yield forests. Model forest policies and management centres will be established and one prefecture from each province or autonomous region will be selected for setting up demonstration units. China will set up a national training centre for forest resource management and forestry administration. The afforestation engineering of the Yangtze River Basin is not only an ecological rehabilitation project, but also an economic reconstruction process. It closely relates to the long-term interests of people. Therefore, it is important to formulate a series of technical and economic policies for protective forest engineering. 7. Multi-channel fundraising The local people have put their efforts into the afforestation campaign. However, for conducting such big engineering projects with long-term returns, fundamental funds are necessary. The people’s enthusiasm should be encouraged by incentives from the government at various levels. The government has decided to increase investment in forestry from the current 0.14 per cent of GNP to 0.3–0.4 per cent by the year 2010. A multi-channel fundraising system should be encouraged.
Integrated Farming Systems at Different Scales 471
8. International cooperation China has signed several major conventions concerning protection of biodiversity and forest management. Cooperation will be in accordance with the mechanisms of relevant conventions and in accordance with national and local conditions, so as to share benefits and to obtain financial and technical assistance. China will continue to expand international, bilateral and multilateral cooperation, and wishes to enhance exchanges and cooperation in the fields of management, scientific research, technical development and technical transfer, and manpower training. Forestry management in the Yangtze River Basin has not only attached great importance to regional development but also has an important influence on the environment and development of the country as a whole. It is our sincere hope that, with the efforts of the Chinese people and with international cooperation, forestry in the Yangtze River Basin will be developed successfully so that it can bring benefits to meet the needs of the present while not compromising the ability of future generations to meet their own needs.
Other shelterbelt systems The coastal windbreak system The coastline of mainland China is 18,000km long, and the coastal area includes 195 prefectures/cities/counties in 11 coastal provinces and autonomous regions, covering an area of 25.0 million ha, and involves a population about 100 million (Ministry of Forestry of the People’s Republic of China, 1995b; Scientific and Technological Information Center of China, 1991). The coastal area is the major base for the resources of agriculture, forestry, animal husbandry, supplementary production and fishery. But natural disasters befall it frequently and bring unfavourable elements such as strong winds, sandstorms, high tides, droughts, waterlogging, soil salinization and soil erosion. In the 1950s, China had already started to establish a coastal windbreak system with a combined structure of belts, tracts and networks grouped together, mainly to break wind and to fix sand. Among these, the backbone forest belts, as a first line of defence, have a normal width of 100–200m, with a maximum width of 500m. They ran parallel to the coastline, or vertical to the direction of winds, shifting sands and sea waves. As tracts, belts of forests with a high density 4500–6000 plants/ha were established on sand dunes, sandy beaches, sand belts and along the sea coast to fix drifting sand, and their width was usually no less than that of the drifting sand belt. Since the early 1980s, the coastal windbreak has been gradually transformed into an eco-economic type. The shelter windbreak combined well with timber, economic and fuel forest, to provide a coastal windbreak system with multiple functions and high benefits. This gradually developed into a basis for economic forests oriented to forest trade and 6.8 million ha of shelterbelt has been planted, raising forest coverage to 27.2 per cent.
472 Modern Agricultural Reforms
The farmland shelterbelt system in the plains The farmland shelterbelt comprises the majority of China’s shelterbelts. China’s farmland regions include the Sanjiang Plain, the Songliao Plain, the Huanghuai Plain, the North China Plain, the plain in the middle and lower reaches of the Yangtze River and the Pearl River Delta. The total area is 113 million ha in these agricultural regions, covering 993 counties, and contains half of the national total population (Ministry of Forestry of the People’s Republic of China, 1992, 1993, 1995a, 1995b). From the beginning of the 1960s, the afforestation campaign was centred on the greening of the plains, and a farmland forest network was established with a structure of 2–3 rows of trees along canals, irrigation ditches and by roadsides, in accordance with local conditions. So far, one-fifth of China’s crop land has been incorporated under the shelterbelt network. Natural disasters have been effectively controlled, and the stress resistance capability of farmland has been significantly enhanced. China’s farmland shelterbelts are developing into an integrated type of multiple purpose forest.
Recommendations and perspectives In order to achieve long-term sustainability of shelterbelt systems in land use, technical and funding support is critical for its efficient management. The recommendations on technical support, according to different ecological and environmental conditions in various areas, require promotion of the use of high quality planting material, selection of sites for the appropriate species, prevention of forest pests and diseases, and establishment of multi-functional ecological forest systems with combinations of trees with bushes and grasses. Improvement in the composition of tree species and forest types in the shelterbelt systems are needed, increases in the percentage of economic forest and economic tree species should be implemented that will raise the direct value and bring into full play public initiatives for establishing and protecting shelterbelts. Shelterbelt management information and monitoring systems should be set up, as well as a shelterbelt research centre to train technical and operational personnel, speed up the application of research results, and extend nationwide the experience gained in conducting model projects for comprehensive shelterbelt systems. International cooperation and academic exchanges and research should be encouraged, with the introduction of advanced management expertise. On funding support, there should be efforts to increase gradually the direct input from governments at various levels into the development of the ecological forestry programmes. A compensation mechanism should be set up to pay off the ecological benefits according to which those who receive benefits shall pay for them. Financial assistance from enterprises, public institutions, individuals, foreign governments, international organizations and private donors should be sought. In addition, strict enforcement of the forest laws, forest policy and institutional reforms, and adoption of specific regulations and rules to protect and manage shelterbelt systems and prevent illegal destruction should be implemented.
Integrated Farming Systems at Different Scales 473
Shelterbelt management should not only pay attention to long-term ecological and social benefits, but must also consider the immediate economic benefits, and timber, commercial and fuelwood plantations should be important components of a protection forest project. With regard to production structure, diversified economy and integrated development should be encouraged. Projects with immediate benefit should be promoted so as to compensate for those with long-term benefits. It is crucial to improve on a large scale the existing networks of shelterbelts, to introduce tree species with greater stability, to increase economic and landscape trees and to find more uses, and to build a multi-functional integrated forestry, agricultural and ecological system so as to guide farmland ecosystems, agriculture and animal husbandry onto a path of sustainable development. At present, the establishment of China’s shelterbelts is developing into a comprehensive system of ecological types. The research work has developed from qualitative description to quantitative analysis, and from single item to a comprehensive project, integrating vegetation (trees and crops), atmosphere and soils into a complete system. New techniques of remote sensing, micro-meteorology, and simulated ecological experiment are being used for in-depth research to reveal the proper structure, functions and mechanism of agricultural benefits from the shelterbelt systems. All these efforts are aimed at developing shelterbelt systems in China.
References Investigation and Research Team of Sichuan Forestry Society (1990). Research and practice of Sichuan protective forest construction. In Chinese Forestry Society Treatise Collection on Protective Forest Construction in the Upper and Middle Yangtze River. Chinese Forestry Press, Beijing Li Fadi (1993). Research on the features of energy and matter flows of Homestead ecosystem in Hexi corridor. Chinese Journal of Ecology, 12(6), 37–40 (in Chinese with English abstract) Li Wenhua et al (1994). Agroforestry in China. Science Press, Beijing (in Chinese) Li Wenhua (1993). Forests of the Himalayan-Hengduan Mountains and China’s Strategies for their Sustainable Development. ICIMOD, Katmandu, Nepal Lu Bingyou (1996). Rural sustainable development in developing countries: a case study of Xishan village, In Wang Rusong et al. (eds), Research on Hot-spots of Modern Ecology. China Sciences and Technology Press, Beijing, pp. 219–25 Ministry of Forestry of the People’s Republic of China (1992). Forestry Development and Environmental Protection in China. Beijing Ministry of Forestry of the People’s Republic of China (1993). Inventory of National Forest Resources (1989–1993). Beijing Ministry of Forestry of the People’s Republic of China (1995a). Forestry Action Plan for China’s Agenda 21. Beijing Ministry of Forestry of the People’s Republic of China (1995b). Yearbook of Forestry. Beijing Ren Mei’e, Yang Renzang and Bao Haosheng (1985). An Outline of China’s Physical Geography. Foreign Language Press, Beijing Scientific and Technological Information Center of China (1991). Development of Forestry Science and Technology in China. China Science and Technology Press, Beijing
474 Modern Agricultural Reforms Tang Zhongxiang and Guo Yongming (1995). Study on soil conserving capacity under Chinese pine forest in Dagou watershed of the upper reaches of Mingjiang River valley. Bulletin of Soil Agricultural Chemistry, 10(2), 15–20 The Editing Committee (1994). Agenda 21 – White Paper on China’s Population, Environment, and Development in the 21st Century. China Environmental Science Press, Beijing The National Conditions Investigation Group under the Chinese Academy of Sciences (1992). Survival and Development – A Study of China’s Long Term Development. Science Press, Beijing Xiang Chenghua (1996). Comprehensive benefit evaluation of different Forest stand types in hilly area of Sichuan Basin. Journal of Soil Conservation, 2(1), 61–8 Yang Yupo (1993). A general report on silviculture techniques related to forest for headwater and soil and water conservation in the upper reaches of the Yangtze River in Sichuan. In Yang Yupo et al. (eds) Research on the Chuanjiang Protective Forest in the Upper Reaches of the Yangtze River. Science Press, Beijing Yun Zhengming (1989). An Introduction to Rural Homestead Ecology in China. Hebei Science and Technology Press (in Chinese)
19
Agricultural Biotechnology in Southern Africa: A Regional Synthesis Doreen Mnyulwa and Julius Mugwagwa
The Convention on Biological Diversity (CBD) defines biotechnology as ‘any technological application that uses biological systems, living organisms, or derivatives thereof, to make or modify products or processes for specific use’. Defined this way, it clearly emerges that biotechnology is an old science, with many established uses in areas such as agriculture, medicine, forestry, mining, industry and environmental management. The old applications are generally referred to as traditional biotechnology, and in agriculture these have been in use since the advent of the first agricultural practices for improvement of plants, animals and microorganisms (Persley and Siedow, 1999). The application of biotechnology to agriculturally important crop species, for example, has traditionally involved the use of selective breeding to bring about an exchange of genetic material between two parent plants to produce offspring with desired traits such as increased yields, disease resistance, and enhanced product quality. The exchange of genetic material through conventional breeding requires that the two plants being crossed be of the same or closely related species.
The generations of biotechnology The progress and development of biotechnology is generally divided into three broad categories, also referred to as generations of biotechnology. This acknowledges that biotechnology is not a new technology, but rather is a continuum of techniques and approaches that have evolved over time. The first generation. This refers to the phase of biotechnology that was based on empirical practice, with minimum scientific or technological inputs. This phase stretched all the way from 12,000 BC to the early 1900s. Reprinted from Mnyulwa D and Mugwagwa J. 2005. Agricultural biotechnology in Southern Africa, in S W Omano and K von Grebner (eds) Biotechnology, Agriculture and Food Security in Southern Africa. International Food Policy Research Institute and FANRPAN, Washington DC and Harare. Reproduced with permission from the International Food Policy Research Institute, www.ifpri.org. The book from which this chapter comes can be found online at www.ifpri.org/pubs/books/oc46.htm#dl.
476 Modern Agricultural Reforms
The second generation. Developments in fermentation technology, especially during the period between the two world wars, constitute what is generally referred to as the second generation or phase of biotechnology. Major products from this generation were antibiotics such as penicillin and other products such as vitamins and enzymes. Another critical event of this generation, beginning in the 1930s, was the development and use of hybrid crop varieties in the US Corn Belt, which resulted in dramatic yield increases. The third generation (new biotechnology). The third generation or phase of biotechnology, also referred to as the new or modern biotechnology, is the present one. A turning point occurred in 1953 with the discovery at Cambridge University (UK) of the structure of deoxyribonucleic acid (DNA), which is the molecular carrier of stored information. DNA is a long and winding molecule that is made up of a combination of several chemicals. Four related chemicals in DNA, called ‘bases’, are lined up in specific sequences, and these specific sequences represent the information that determines the traits, features, characteristics, abilities and functioning of cells within an organism. The particular segment of DNA that contains information for a particular characteristic or trait is called a gene. In other words, the genes represent information that is passed on from one generation to the next. It is also important to point out that not all segments of DNA represent information that can be or is passed on from one generation to the next. Because DNA is made up of chemicals that are present in cells where many life-maintaining processes are occurring, the DNA needs to ‘protect’ itself, and hence some segments of the DNA serve the purpose of ensuring that the DNA remains intact.
The current status of biotechnology research and use in the SADC region Countries in the Southern African Development Community (SADC) region are employing various forms of biotechnological techniques in their agricultural, environmental management, forestry, medicine and industry efforts, and have been since time immemorial. However, without doubt Africa is the region where biotechnologies are the least developed. There are many different explanations for this situation, but several schools of thought associate it with the perennial economic problems affecting the continent (Sasson, 1993). Figure 19.1 shows the gradient of biotechnologies in terms of complexity and costs. An analysis of the status of biotechnology in the different SADC countries will be presented and discussed based on this gradient. From studies conducted by the Biotechnology Trust of Zimbabwe (BTZ) in 2001 and 2002, and studies by other organizations such as the Rockefeller Foundation and International Service for National Agricultural Research, it can be seen that the main area in which biotechnology techniques are being applied in southern African countries is agriculture, with the major thrust being crop improvement. Techniques such as tissue culture are being applied in almost all the countries,
Agricultural Biotechnology in Southern Africa: A Regional Synthesis 477
Source: Sasson, 1993
Figure 19.1 Gradient of biotechnologies in Southern African Development Community countries in terms of complexity and costs, 1993
mainly because of the less intensive nature of this technique in terms of human and infrastructural resources. Modern biotechnological techniques, which include genetic engineering, are being employed in a few of the countries, namely Malawi, South Africa and Zimbabwe, and to a small extent in Mauritius and Zambia. Of all these countries, only South Africa has reached the commercialization stage insofar as products of genetic engineering are concerned. The rest are still at the laboratory research stage. Tied closely to the issue of research is the development and implementation of regulations to monitor the research and products thereof. Only three countries in the region, namely Malawi, South Africa and Zimbabwe, have legal mechanisms for biosafety, that is, the safe development and application of biotechnology. The rest are still at varying stages in the development of their biosafety systems. All countries of the SADC region are signatories to the Cartagena Biosafety Protocol, an addendum to the CBD, which governs safe trans-boundary movement of living modified organisms, among other provisions for ensuring safety in biotechnology. Table 19.1 gives details on the status of development and use of various biotechnological techniques in the southern African countries.
Angola
Little is known
Little is known
Little is known
Little is known
Little is known
Little is known
Little is known
Little is known
Techniques/category
Tissue culture (TC)
Genetic modification (GM)
Fermentation technology
Marker-assisted selection
Artificial Insemination and embryo transfer
Molecular diagnostics and molecular markers
Biological nitrogen fixation
Manpower training
Little is known
Democratic Republic of Congo
Training is offered in other natural science modules at the University of Botswana
Used mainly through integration of legumes in cropping systems
Used on a limited basis in plant and animal disease diagnosis
Used in livestock breeding
None
Used in the brewing industry
Little is known
Little is known
Little is known
Little is known
Little is known
Little is known
Limited research is being done at the Little is University of Botswana. No field trials known have been approved
Used on a limited basis for root and tuber crops
Botswana
Areas of application
Undergraduate and graduate training is done in natural and agricultural science (National University of Lesotho)
Used for legumes only
None; serological techniques are still being used
None
None
None
None
Used in Irish potato production and micropropagation
Lesotho
Table 19.1 Status of development and use of biotechnology techniques in Southern African Development Community countries, 2002
478 Modern Agricultural Reforms
Used for food and feed production
None
Used for cattle breeding
At the research level for use in animal disease diagnosis and diversity studies
Used for legumes only
Training is done in the natural and agricultural No explicit biotechnology sciences (Bunda College of Agriculture). Most training is offered of the training is theoretical. No explicit biotech courses are offered
Fermentation technology
Marker-assisted selection
Artificial Insemination and embryo transfer
Molecular diagnostics and molecular markers
Biological nitrogen fixation
Manpower training
Used for legumes
Serological techniques are still used for diagnosis
Used on a limited basis
None
Widely used in the brewing industry
Limited training is done in the natural sciences and agriculture (Eduardo Mondlane University)
Used on a limited basis, for legumes
Serological techniques are still being used
None
None
None
GM sugar cane is nearing None field trials. Awaiting adoption of a biosafety framework
At the research level for cassava improvement (virus resistance). Bt cotton trials have been conducted.
Genetic modification (GM)
Mozambique
Used in disease elimination and Used on a limited basis in sugar Used in cassava and Irish micropropagation for cassava, sweet potatoes, cane research potato production, microIrish potatoes and horticultural crops propagation and disease elimination
Tissue culture (TC)
Mauritius
Malawi
Techniques/category
Areas of application
Table 19.1 (continued) Agricultural Biotechnology in Southern Africa: A Regional Synthesis 479
Limited training is done, but University of Namibia is currently pursuing setting up an MSc programme in biotechnology
Manpower training
Little is known
Little is known
Used for legumes only
Little is known
Biological nitrogen fixation
Marker-assisted selection
Little is known
Little is known
None
Fermentation technology
Little is known
Molecular diagnostics Serological techniques are still and molecular being used markers
Used in food processing (smallgrain crops)
Genetic modification (GM)
Seychelles Little is known
Little is known
None
Tissue culture (TC)
Artificial insemination Used in cattle breeding and embryo transfer
Namibia
Used in cassava and Irish potato production, micropropagation and disease elimination
Techniques/category
Specific degree-level training programmes are available at most major universities, with access to state-of-the art resources
Used for soil fertility improvement through legumes and inoculants
Used for plant and animal disease diagnosis
Used in livestock research, breeding, and conservation
Used in maize and small-grains breeding as well as livestock research and development
Used widely in food and beverages as well as in pharmaceutical industries
Most major universities and research institutions (both government and private) have major projects employing GM techniques. Both crops and animals are covered in the research activities. Insect-resistant cotton and maize and herbicide-tolerant cotton and soybeans are already being grown commercially
Active programmes have been developed employing TC techniques for root and tuber crops, ornamental and horticultural crops, and animal vaccine production
South Africa
Areas of application
Table 19.1 (continued)
480 Modern Agricultural Reforms
None
None
Genetic modification (GM)
Fermentation technology Marker-assisted selection Artificial insemination and embryo transfer Molecular diagnostics and molecular markers Biological nitrogen fixation Manpower training Used in plant and animal disease diagnosis
Used in the brewing industry and vaccine production Used in genetic characterization of coconuts, cashews, sweet potatoes, cassava and coffee Used in livestock breeding and conservation
Limited research is being done, e.g. on virus resistance in bananas. There have been no commercial releases, but trials on GM tobacco were conducted in 2002
Areas of application Tanzania Techniques are employed relatively extensively for root and tuber as well as horticultural crops
Used mainly for legumes; used on a limited basis for inoculants Training is done at the Training is done in agricultural and other life undergraduate level in science courses. A BSc degree in biotech was natural sciences recently introduced at Sokoine University. The (University of Swaziland) country is also benefiting from the BIO-EARN (East African Regional Network on Biotechnology and Biosafety) programme
Used for legumes only
Serological techniques are still being used
Used in cattle breeding
None
Swaziland Used in Irish potato production and micropropagation
Techniques/category Tissue culture (TC)
Table 19.1 (continued)
Used for both legumes and inoculants Training is done in the natural, veterinary and agricultural sciences (University of Zambia). No explicit courses are offered in biotech
Used for plant and animal disease diagnosis and diversity studies
Used for cattle breeding
None
Zambia Used in micropropagation and disease elimination for cassava, sweet potatoes, Irish potatoes, mushrooms and planting materials Use limited; still at the research level for cassava improvement (virus resistance). Confined trials of Bt cotton were conducted in 1999/2000 Used for food and feed production
Agricultural Biotechnology in Southern Africa: A Regional Synthesis 481
Used for soil fertility improvement for both legumes and inoculants Specific biotech training programmes have been developed at both undergraduate and graduate levels (University of Zimbabwe, National University of Science and Technology, Africa University)
Biological nitrogen fixation
Manpower training
Source: Mnyulwa and Mugwagwa, 2002
Used for cattle and small-stock breeding
At the research level for improvement of maize for drought resistance and for small-stock improvement
Marker-assisted selection
Used for plant and animal disease diagnosis and diversity studies
Used in food processing, feed and vaccine production
Fermentation technology
Molecular diagnostics and molecular markers
Still at the research level, mainly for use in crop improvement for cowpeas, tobacco, maize and sorghum. Confined trials of Bt maize and cotton have been conducted
Genetic modification (GM)
Artificial insemination and embryo transfer
Used in micropropagation and disease elimination for sweet potatoes, mushrooms, Irish potatoes and horticultural crops
Tissue culture (TC)
Areas of application Zimbabwe
Techniques/category
Table 19.1 (continued)
482 Modern Agricultural Reforms
Agricultural Biotechnology in Southern Africa: A Regional Synthesis 483
Biosafety Systems An analysis of the SADC countries looking at the status of their development and use of policy systems to ensure the safe development and application of modern biotechnology shows that the countries are at different levels. They can be placed into three broad categories: those that have regulations, those that have draft regulations and those that have yet to initiate or are still in the very initial stages of development of such regulations. Table 19.2 summarizes the countries’ status.
Global and regional trends in the production of GMOs Worldwide it is estimated that more than 3 billion people have been consuming GM foods since their commercialization in 1996. The use of GM plant varieties represents the fastest adoption of a new technology according to reports of the International Service for the Acquisition of Agri-Biotech. The total land area devoted to cultivation of GM crops increased from 1.7 million hectares in 1996 to 52.5 million hectares in 2001 (James, 2001). By 1998 some 40 new GM varieties were being cultivated worldwide, mainly in Argentina, Australia, Canada, China, France, Mexico, South Africa, Spain and the US. The area of GM crops in the developing countries has increased over the years from 15 per cent in 1998 to 25 per cent in 2001, of which 22 per cent was planted in Argentina and 3 per cent in China. China is the only country where public researchers funded by the government produced and commercialized GMOs.
Trends in Southern Africa Currently it is only South Africa that has commercialized GM crops. Both the commercial and small-scale farmers are cultivating these. Table 19.3 shows figures on the trends of adoption of GM crops in the Makhathini Flats (Kwazulu-Natal Province), the first smallholder farming area to adopt the GM varieties of cotton. GM white maize has been commercialized (2002/2003 season) in South Africa, and this will cause a number of smallholder farmers to adopt the cultivation of GM crops.
Overview of GM use in the SADC region The use of biotechnology in the medical sciences is generally well accepted. Its use in agriculture is mixed; for example, South Africa is well into the use of GM crops, while the rest of the SADC nations are still behind. Importation policies are not clear, especially because producers from countries like the US do not label GMO products.
There is no biosafety legislation at the moment. The Ministry of Agriculture has initiated discussions on biotechnology and biosafety issues.
It has been reported that GE grain imported by Namibia in 2001 was milled in Angola. Namibia’s draft legislation guarded against contamination of the environment. Angola had and still has no regulations
Status of development and implementation
Use of biosafety system in regulation of work on or use of genetic engineering (GE)
Urgent requirements Regulations, capacity building, public awareness
Angola
Biosafety issue
Development of a legal framework, capacity building, public awareness and participation
As indicated, there are no mechanisms in place to regulate GE and its products. The dependence of the country on agricultural produce from South Africa is a cause for concern.
There is no biosafety legislation in this country. A process to develop a national biosafety framework was initiated in 2002 with funding from the United Nations Environment Programme (UNEP) and the Global Environment Facility (GEF). The National Coordinating Strategy Agency is the national focal point for biosafety.
Botswana
Garnering support from policy makers, development of regulatory framework, capacity building, public awareness
There have not been any official reports of requests to conduct trials or import GM products. Absence of a biosafety system complicates the situation. However, some food products, especially from South Africa, are suspected to be GM.
A biosafety committee was set up in 2001 within the Environmental Protection Unit to initiate drafting of legislation. Very limited capacity for risk assessment
Lesotho
Raising awareness of new legislation among stakeholders, capacity building
An interim committee was consulted in the debate on whether Malawi should import GM food aid or not. Malawi accepted GM maize, with no conditions set.
Has legally binding legislation on biosafety. A national biosafety committee was appointed, though the country has limited capacity for risk assessment.
Malawi
Table 19.2 Status of development and use of biosafety systems in Southern African Development Community countries, April 2003
484 Modern Agricultural Reforms
Officially, no GE products have entered the country. The NBC is tasked with monitoring the registration and movement of GE products in the country. A locally developed GM sugar cane variety is awaiting release.
Regulations, capacity building, public awareness
Status of development and implementation
Use of biosafety system in regulation of work on or use of genetic engineering (GE)
Urgent requirements
Development of regulatory framework, capacity building, public awareness
Has already officially received GM maize under the condition that it has to be milled before distribution to consumers. A framework is still needed to ensure effective monitoring of GM products.
Mozambique Set up a committee within the Ministry of Environment to come up with interim legislation on biosafety. Legislation still being developed.
Mauritius
Has a GMO bill that requires setting up a national biosafety committee (NBC)
Biosafety issue
Finalizing processes for regulation development, capacity building and public awareness
Accepted milled GM maize in 2000. Rejected GM maize in 2002, and instead received food aid in the form of wheat, as per a recommendation by the national biosafety committee.
Has a national biosafety committee (the Namibian Biotechnology Alliance) and draft legislation. Also has very limited capacity for risk assessment.
Namibia
Table 19.2 (continued) Seychelles
Awareness raising, regulations, capacity building
Importations of foodstuffs have been handled under the existing food and food standards regulations
Discussion of biotechnology and biosafety issues has only just started in this country to whose economy agriculture contributes only marginally. The main worry is that the country is a net food importer.
Agricultural Biotechnology in Southern Africa: A Regional Synthesis 485
South Africa
Has had a legally binding GMO Act since 1997; also has the institutional framework to administer the act. The country has a number of both public and private laboratories adequately equipped to do GE work. Has more than 110 plant biotech groups, more than 160 plant biotech projects, and more than 150 trials.
Already has a number of GE research work projects and products on the ground, including commercial cultivation of GM horticultural crops, cotton and maize by smallholder farmers
Review of legislation, public awareness and participation
Biosafety issue
Status of development and implementation
Use of a biosafety system in the regulation of work on or use of GE
Urgent requirements
Obtaining stakeholder support, especially from policy makers, as well as regulation development
Has already officially received GM maize under the condition that it has to be milled before distribution to consumers. Bt cotton and maize are currently being grown by farmers in parts of South Africa bordering Swaziland, and thus there is fear for possible contamination.
Set up a committee within the Environmental Protection Agency to come up with interim legislation on biosafety. Legislation still being developed.
Swaziland
Table 19.2 (continued)
Regulations, resource mobilization, public awareness
Tanzania has been a port of entry for GM maize provided as food aid to some countries in the region. Consignments were handled under the existing phytosanitary regulations.
A national biosafety coordinating committee was set up under the government’s Division of the Environment in November 2002. This activity is taking place under the UNEPGEF project.
Tanzania
486 Modern Agricultural Reforms
Has draft legislation and a national biosafety committee. Limited capacity for risk assessment. Currently in the process of coming up with a national biotechnology strategy.
An interim committee recommended rejection of GM food aid (July 2002). A case of unapproved trial of GM maize was reported in 1999 (personal communication with Monsanto, 2001).
Enactment of legislation, capacity building, public awareness
Status of development and implementation
Use of a biosafety system in the regulation of work on or use of GE
Urgent requirements
Review of current legislation, capacity building, public participation in decision making processes
Two field trials were approved in 2001, for Bt cotton and Bt maize. No commercialization has been approved as yet. Assessed applications for importation of GM maize; importation granted with conditions.
Has a legally binding biosafety system, which includes a biosafety board and its secretariat, as well as biosafety regulations and guidelines. Has some laboratories, which have the capacity to detect genetically modified organisms (GMOs).
Zimbabwe
Source: Based on Mnyulwa and Mungwagwa, 2002, but updated through continuous interaction with partners
Zambia
Biosafety issue
Table 19.2 (continued)
Agricultural Biotechnology in Southern Africa: A Regional Synthesis 487
488 Modern Agricultural Reforms Table 19.3 Season
Percentage of farmers cultivating Bacillus thuringiensis (Bt) cotton
1998/1999
18
1999/2000
60
2000/2001
71
Public Dialogue, Public Awareness and Policy Responses Background Proponents of GM technologies cite several potential benefits that can accrue to society. These benefits include enhanced taste and quality of foods; nutritional enhancement of foods for chronically malnourished populations; reduced maturation times for crops, leading to labour savings; and enhanced tolerance of biotic and abiotic stresses for crops, leading to reduced dependence on herbicides and pesticides. But these perceived benefits are not uncontroversial. As a result of the intense debate and controversy surrounding the development and use of GMOs it is important for countries to engage in wide stakeholder dialogues in order to ensure that people are equipped to make informed choices. The public ought to participate even in the development of frameworks for regulation of GM research and development work. The main reasons for public awareness of and participation in the development of national biosafety frameworks (NBFs) are to promote participatory decision making and involve all sectors of the society, to bridge the differences between various parts of society concerning the safe use of living modified organisms (LMOs), to ensure the use of an inclusive process involving all stakeholders, to share a common vision and purpose, to promote improved decision making based on information, and to promote transparency in the decision making process. It is important to note that the development of NBFs goes beyond the creation of a document. It inevitably encompasses wider issues about the role of biotechnology and requires ongoing participation in biosafety processes after regulations have been developed. The process itself calls for commitment and the creation of an appropriate environment to access participatory mechanisms, capacity building, information dissemination and strategies for involvement of all stakeholders. Participation in biosafety is prescribed in Article 23 of the Cartagena Protocol on Biosafety (United Nations Environment Programme, 2002): Public awareness and participation: 1) Parties to the protocol shall: a) Promote and facilitate public awareness, education and participation concerning the safe transfer, handling and use of living modified organisms in relation
Agricultural Biotechnology in Southern Africa: A Regional Synthesis 489 to the conservation and sustainable use of biological diversity, taking also into account risks to human health. In so doing Parties shall cooperate, as appropriate, with other states and international bodies; b) Endeavour to ensure that public awareness and education encompass access to information on living modified organisms identified in accordance with this Protocol that may be imported. The Parties shall, in accordance with their respective laws and regulations, consult the public in the decision making process regarding the living modified organisms and shall make the results of such decisions available to the public, while respecting the confidential information in accordance with article 21.
Participation is crucial in the analysis of the issues, in decision making and strategic planning, in implementation, and in monitoring and evaluation. Stakeholders can be defined as people from government agencies and the private sector, groups or individuals whose lives and interests could be directly or indirectly affected, and bodies, groups or individuals with particular knowledge that could be called upon. Public awareness was defined by the participants of a UNEP workshop on risk assessment and risk management held in Namibia in 2002 as a process of providing universal access to information (providing balanced information in terms of pros and cons), enlightening the public, and thereby providing for informed participation. Public participation was defined as involving stakeholders (at all levels of society) in decision making processes (giving everyone a chance to express their views) and taking their suggestions into consideration in making a decision. Public awareness and participation are needed for: 1 2 3 4 5 6 7 8 9 10 11 12 13 14 15 16
consensus building on issues that affect people directly or indirectly; ensuring implementation of the decision; building transparency and accountability; facilitating informed participation; achieving a better position from which to take action; facilitating inclusiveness; providing balanced information in terms of pros and cons; harmonizing institutions that provide awareness activities; removing bias; building a sense of ownership and collective responsibility; building stakeholder confidence; bridging the knowledge gap; ensuring sustainability; minimizing conflicts; creating a platform for action; and attracting attention and interest.
490 Modern Agricultural Reforms
Status of public awareness in the SADC region Different countries in the SADC region have sought to promote and facilitate public awareness and participation in the design and implementation of their NBFs. Different tools and approaches have been suggested by various efforts (see United Nations Environment Programme, 2003a). Participants at a UNEP-GEF Namibia workshop on risk assessment, risk management, public awareness and public participation for sub-Saharan Africa held in Namibia in 2002 proposed an action plan for enhancing public awareness and participation in the southern African region (see United Nations Environment Programme, 2003a). It is the responsibility of each party to determine the combination of the proposed tools suitable for their specific situation. In most countries in the region the lack of biosafety frameworks is partially attributed to these countries’ lack of awareness at various levels of the importance of both the technology and the need for biosafety policy. Table 19.4 summarizes the levels of biotechnology awareness in the SADC countries, including the awareness-raising tools and approaches being employed in the different countries.
The challenges of public participation The public awareness levels shown in Table 19.4, together with the efforts to arrive at such levels, are confounded by many factors, some of which are discussed in this section. Commercial confidentiality. One of the major challenges of public participation is defining the limits of confidentiality for the provision of information to the public. A statute on access to information might be needed, or the responsibility for deciding what represents confidential information might be given to the national governments in consultation with the companies concerned. The costs of various levels of participation. These costs need to be planned for and addressed during the planning period. They have to be dealt with in the context of the limited human, infrastructural and financial resources of most of the countries. The diversity of the various developing countries’ farming systems and other cultural and social factors. This diversity makes it difficult to come up with a common framework for the involvement of stakeholders in the decision making processes. High science. How does one simplify highly scientific information to facilitate and increase the comprehension of the concepts by the general public, the majority of whom are illiterate? Challenges exist regarding how to effectively communicate science to a public of such a dynamic background as obtains in most of the developing SADC countries, where stakeholders have different priorities to address and
Agricultural Biotechnology in Southern Africa: A Regional Synthesis 491 Table 19.4 Levels of biotechnology awareness and public awareness strategies in Southern African Development Community countries, March 2003 Country Angola
Levels of biotech awareness Low (assumption)
Strategies used for information dissemination and awareness raising Little is known about strategies
Botswana
Low overall
Democratic Republic of Congo Lesotho
Low (assumption)
Uncoordinated and sporadic activities, mainly announced through newspaper articles and led by scientists and to some extent the consumer movement Little is known about strategies
Malawi
Average among scientists, low among other stakeholders
Mauritius
Low overall
Mozambique
Low, even among scientists
Namibia
Average to low
Seychelles South Africa
Low (assumption) Average among the affluent groups but low among smallholder farmers and general consumers
Swaziland
Low overall
Tanzania
Average to low
Low overall
A few sporadic activities, mainly driven by scientists Discussions in the form of workshops and meetings, mainly coordinated by Bunda College and the National Biosafety Committee. Other tools are mainly sporadic debates and responses via the local press. A few, largely sporadic, activities coordinated by the National Biosafety Committee Still largely uncoordinated and reactive efforts for coordination through the Africa-Bio and Southern African Regional Biosafety programmes Some activities coordinated by the National Biotechnology Alliance, the farmers union, and the consumer movement Little is known about strategies Formal media and informal channels (including websites, leaflets and public debates) sponsored by a number of nongovernmental organizations and companies such as Africa-Bio, Biowatch, SAFeAGE (South African Freeze Alliance on Genetic Engineering), A-Harvest, and Monsanto. Notices of application for trials or release of genetic engineering (GE) products are published in the government gazette to solicit public comments. A few sporadic activities, mainly driven by scientists A few activities, some coordinated by the National Biosafety Committee, some by scientists, and some by the Commission for Science and Technology
492 Modern Agricultural Reforms Table 19.4 (continued) Country
Levels of biotech awareness
Strategies used for information dissemination and awareness raising
Zambia
Average to low among scientists, low among the rest
A few, largely uncoordinated and irregular, activities such as debates and discussions organized by the National Biosafety Committee, the National Farmers Union and the consumer movement
Zimbabwe
Average among the scientists, low among stakeholders
Advertisements in the government gazette soliciting public comments. A number of organizations engage in information dissemination (e.g. the Biotechnology Trust of Zimbabwe, the Biotech Association of Zimbabwe, the Consumer Council, the Pelum Association, COMMUTECH (the Community Technology Development Trust), the Intermediate Technology Development Group, and the biosafety board, among others. The main channels used include workshops, seminars, debates, information brochures, radio and television discussions, etc.
Source: Based on Mnyulwa and Mugwagwa, 2002, but updated through continuous interaction with partners
have to deal with a language barrier (explaining science in local languages is impossible in most cases). It is noted that dialogue requires honesty, openness, transparency and inclusiveness, along with mutual respect and an absence of mistrust. The starting point for dialogue should be the premise that the public has valid views that need to be voiced and understood, taking into account room for variance. Public participation has to be based on access to information, and it is necessary for national governments to facilitate the packaging of information in a way that meets the stakeholders’ needs. External influences. Many such influences affect decisions taken by developing countries on the commercial use, risk assessment, and risk management issues related to LMOs. Trade in GM crops and products will be subjected to the international agreements signed by the member states. The majority of the developing countries, SADC countries included, are parties to the World Trade Organization (WTO), and thus the protocol is supposed to allow free and equitable trade. Yet the following issues need to be taken into account: •
GMOs require special clearance mechanisms to allow developing countries to make a choice – to accept or reject GMO goods and not be bound by the WTO provisions alone.
Agricultural Biotechnology in Southern Africa: A Regional Synthesis 493
•
An exporting country is not liable for damage and environmental pollution due to GMOs.
National laws are needed on labelling both the grain and seed and any blended products. Experience so far has shown that the use of GMOs in developing countries is dictated by trading partners such as the European Union. The murky interface (food aid, politics, science, and regulations). A number of public concerns resulting from the use of modern biotechnology relate to their impact on trade, the environment and health. Says David Dickson of SciDev.Net: ‘On closer inspection, the decision by Zimbabwe and Zambia begins to lose some of its apparent naivety. The real fear officials of these countries are said to have explained to the officers of the World Food Program, is not the health danger that these foods are said to cause. Rather it is that if GM maize seed is planted rather than eaten, there could be “contamination” of local varieties, and this will mean that the agricultural produce of these two countries, including beef fed on the crops, could no longer meet the “GM free” criteria demanded by European Markets’ (www.scidev.net/ archives/editorial/comment28.html). A study by Environment and Development Activities in Zimbabwe after the 1991/1992 drought revealed that about 20 per cent of the smallholder farmers from some selected districts of Zimbabwe had retained the yellow maize grain provided as drought relief to use as seed. So the danger that GM maize grain will find its way into the seed system is real. Most of the developing countries’ positions are compromised by those of their trade partners, whether Europe or America. The conflicting positions of the two major trading partners of most southern African countries has greatly influenced the current positions adopted by the various nations. The US, one of the major suppliers of food relief, has been commercially growing GM crops for the past 5 or 10 years, and they do not segregate or label these products. The political dimension of the debate over southern African hunger and GM maize is that the US appears to be using the current famine as a cover to promote acceptance of a technology ‘enthusiastically embraced by its own corporations, while remaining widely distrusted in Africa’ (Dickson, 2002). The US has shown frustration with African critics of its food offer, and has also shown reluctance to provide funds for processing the maize, conditions that have further fuelled the political dimension. A statement in early 2002 by one US official that ‘beggars cannot be choosers’ has further haunted the humanitarian effort. The absence of regulations for monitoring the movement of GM material in most of the affected countries is another problem. Personal communications with some authorities in Zambia have shown that although the trade, food safety and environmental dimensions have been mentioned, one salient but important dimension has not: that of regulations. The affected parties have feared that lack of a legal framework would frustrate any efforts to ensure monitored and controlled movement of the GM maize once it was released to the population. The situation in Zimbabwe has been different because regulations were in place already, and
494 Modern Agricultural Reforms
Malawi (then) was at an advanced stage in the development of its regulatory framework; hence it has been possible for decisions to accept the GM maize to be made. The situation that has been faced in southern Africa points to the reality that countries have to accept regarding the impact of modern science on society – that it involves a complex of scientific, economic and political factors that cannot easily be reduced to any single dimension (Dickson, 2002).
The Public Awareness Effort in Southern Africa – A SWOT Analysis Below is a strengths, weaknesses, opportunities and threats (SWOT) analysis (Table 19.5) of the public biotechnology awareness effort in southern African countries. This analysis is adapted from results of the UNEP-GEF workshop held in Windhoek, Namibia, in November 2002.
Recommendations Mindful of the situation prevailing in the SADC region with respect to biotechnology, and cognizant of the role that the technology can play in agriculture and food security issues, we recommend that the following needs be addressed.
Development of the capacity to make decisions One critical issue that emerged from the 2002 debate on food security vis-à-vis the use of GM maize as a food aid was that the majority of countries in the SADC region lacked the regulatory and scientific structures necessary to take decisive steps. During the BTZ’s regional consultation on the status of development of biosafety systems in eastern and southern African countries, it emerged as a major sticking point that most countries did not prioritize development of regulatory structures for biosafety, mainly because of the low level of biotechnology research and development activities in their countries. If the lessons drawn from the 2002 GM food aid debate are anything to go by, countries in the region are best advised to put regulatory and scientific monitoring mechanisms in place, because the GM products in the region are not the products of research efforts in the region, but rather are products introduced from elsewhere. The scenario is the same as that for products of most other technologies, but the need for regulations remains critical. The GM debate underlined the fact that in a globalized economy the development of regulations is a necessity, not a luxury. The development of scientific and infrastructural capacity is not an overnight activity. Given the varying levels of capacity and resource endowment in the countries
Agricultural Biotechnology in Southern Africa: A Regional Synthesis 495 Table 19.5 Strengths, weaknesses, opportunities and threats analysis of public awareness and public participation in southern Africa, November 2002 Strengths
High literacy level Political will (many countries in the region have signed the Biosafety Protocol) Common official language, facilitating information dissemination Existing administrative structures Information-sharing structures Existing human resources (biotech specialists, etc.) Relevant legislation and policies
Weaknesses
Limited programmes on and capacity for modern biotechnology Lack of policies on biotechnology and biosafety Ignorance of biotechnology, which impedes the dissemination of information Lack of sustainable funding Science illiteracy
Opportunities
Existing public awareness and participation programmes that can be used to disseminate information, e.g. HIV/AIDS awareness programmes Decentralized system of governance Availability of UNEP-GEF funding Existing subregional programmes (SADC) Innovative financial instruments that could be used to generate additional funds for programmes in the form of taxes, levies and other fees
Threats
Lack of networking among scientists and with other political and civic leaders Lack of communication between scientists and other interest groups such as sociologists, politicians and civil society
Source: United Nations Environment Programme, 2003b
of the region, mechanisms for collaboration and the development of synergistic relationships need to be put in place for countries to be able to pool their resources. Through the SADC and regional as well as national governmental and non-governmental organizations with activities in the areas of agriculture, the environment, and biotechnology and biosafety, activities can be implemented for the development and strengthening of national and regional capacities that will enable informed decision making on GM products. Arrangements for the transfer of technology and expertise should also be entered into with institutions within the region and beyond that can provide such expertise. Individual countries and the region should place an emphasis on developing their own capacity to do the work so they can become self-sufficient in the long run.
496 Modern Agricultural Reforms
The SADC countries should also be cognizant that genetic engineering is building on the achievements of other accepted and established techniques such as tissue culture, molecular biology, fermentation technology and so on. Countries need to develop a capacity for these techniques, not necessarily to use them as a foundation for genetic engineering, but to exploit them and assess whether some of the agricultural production constraints can be solved using such technologies. Examples abound from Colombia, India, Kenya and Zimbabwe, where tissue culture programmes have been successfully implemented to provide sufficient quantities of high-health status planting materials for crops such as bananas, yams, cassava and sweet potatoes.
Identification of regional needs and priorities For the region and individual countries to realize some of the benefits to be derived from the employment of modern biotechnology techniques, they need not only to develop regulatory and scientific capacity, but also to identify needs and priorities for intervention at national and regional levels. Priorities would include targeting crops or animals for the research efforts, along with traits to be researched (drought tolerance would be an obvious choice) and the human and infrastructural capacity needs of the countries and the region. Genetic engineering technologies invariably need substantial financial investment, and the SADC countries would best be advised to invest in areas in which they have sustainable competitive advantages or in areas that address their priority food security needs.
Creation of an enabling environment for research about or use of biotechnology products The development and implementation of regulations is one avenue for creating an enabling environment for biotechnology research and development as well as for the use of products of genetic engineering. The SADC countries need to develop appropriate biosafety systems for monitoring and controlling biotechnology activities in them. Given that the region already has three countries with legal biosafety systems, experience-sharing mechanisms can be put in place and employed so countries can learn from each other about the development and use of such systems. Discussion among policy makers needs to be stepped up so as to garner the necessary political will. For example, in Zambia efforts to put policies in place are thwarted not only by lack of funding and scientific expertise, but also by lack of political will. This certainly is the case in most of the countries of the region. Stakeholders need to develop strategies for ensuring that national governments prioritize policy development and investment in infrastructural and human capacity for biotechnology activities, and at least some measurable capacity for risk assessment and risk management. In a 2001/2002 eastern and southern African study on the status of development and implementation of biosafety systems conducted by the BTZ, one of the major findings to emerge was that the source of
Agricultural Biotechnology in Southern Africa: A Regional Synthesis 497
information most trusted by the lay public was one to which local researchers would have made a contribution. One way to achieve this end is to raise the general level of discourse about biotechnology issues both in the individual countries and at the regional level. With an increased awareness of the potential dangers and benefits of genetic engineering technology, policy makers will be in a better position to see the need to develop the necessary legislative frameworks. Awareness also needs to be raised in the general population of the SADC region because people have a right to know whether they should consume certain products. In addition, transparency and trust need to be developed among the private sector, local researchers, national governments and all stakeholders in the region with respect to the real hazards or benefits presented by genetic engineering technology.
Harmonization of national and regional policies One major lesson from the food aid debacle is that the countries of the SADC region need to harmonize their legislation in order to facilitate smooth movement and transit of food materials. This harmonization should encompass issues such as standards, risk assessment and risk management procedures, prior informed consent requirements, information and documentation requirements and other issues. In essence the harmonized policies should facilitate the development of procedures for approval of the use and movement of products in the region.
Conclusion The SADC countries are at different levels in the development and application of biotechnology as well as systems to govern the use of this technology. This scenario should be exploited to ensure that all countries attain a certain minimum level of technical and regulatory capacity, especially for monitoring the development and use of GM technologies and the products thereof. It is crucial for all the countries in the region to realize that they need each other, especially given the increasingly globalized economy and the fluid nature of national boundaries, as well as the limited capacity to monitor cross-border movement of materials. Adequately equipping the general public, especially farmers, will go a long way toward building self-monitoring and -policing mechanisms that will complement efforts by regulatory authorities to limit the unintended spread of GM products in the environment. An informed society will also influence the national research agenda, thereby ensuring that the constrained research and development resources of countries in the region are used to address priority issues. Little is known about the existing institutional framework within which GMO legislation and regulation are likely to be implemented, especially in rural areas. Several questions therefore remain unanswered. For instance, what roles are played by the national, provincial and local governments in the various countries? What scientific testing infrastructure exists to
498 Modern Agricultural Reforms
implement regulations? What are the existing leadership structures, especially in rural areas? To what extent will uninformed smallholders rely on opinions, information and advice from village-level leaders in making their choices? What problems and opportunities will result from using the rural governance already in place as a coordinating mechanism for spreading information? What is the degree of transparency and accountability in implementing agencies?
Appendix: Tools for Participation, Consultation, Information and Education The following tools have been adapted from United Nations Environment Programme (2003b) and from the author’s workshop notes.
Tools for participation and consultation There are a number of strategies or approaches that can be used to engender public participation in discussion on biotechnology issues. Some of these are as follows. Enabling legal frameworks. Laws on public participation or on rights to information facilitate meaningful public involvement in biosafety decision making. Routine opportunities for public comment. In many countries, applications for regulatory approval are published in a register with opportunities for public comment as a matter of routine. Although this methodology is commonly used in developed countries (for instance, in Canada, the Netherlands and the UK), it may be especially useful in developing countries, where there are usually limited resources to facilitate participation. Multilevel consultations. In some countries, public consultations on different aspects of the biosafety framework have taken place at the national level. For example, consultations were held in Zimbabwe to decide whether to accept GM food aid and, once the decision was made to accept it, how to handle the products. Independent public inquiries. Independent bodies can be designed to facilitate assessment of the risks and benefits of a technology considering broad public interests. These bodies, if well constituted, can target the particular needs of indigenous groups. Independent advisory committees. The authority and credibility of such bodies depend heavily on their independence of the government and the way they are constituted, that is, the extent to which they include the views of non-scientists
Agricultural Biotechnology in Southern Africa: A Regional Synthesis 499
and represent a broad spectrum of stakeholders. These are the tools used by most of the SADC countries, such as Malawi, South Africa and Zimbabwe. In some cases these are complemented by advertisements in either the government gazettes or the local press soliciting comments from the public. Ongoing oversight and evaluation. Stakeholder bodies, such as the African Biotechnology Stakeholders’ Forum, can be set up to review biosafety procedures on an ongoing basis. A bottom-up participatory process. Participatory processes facilitated by credible and experienced non-governmental organizations can help stakeholders at risk of being left out by the government-led consultation processes. Examples include the Citizens Jury facilitated by the Intermediate Technology Development Group in Brazil, India and Zimbabwe. These tools can be used in combination to facilitate the all-inclusive participation of stakeholders in the decision making process. The challenges presented earlier in this chapter hinder such effective participation in most developing countries.
Tools for information and education The identification of information gaps through surveys is a good starting point for any awareness and education initiatives. Information collected through these means would help a country’s government in the development of a public information campaign using the following tools. Informal means of disseminating information. Websites, leaflets, advertisements and telephone helplines can be used to explain biosafety processes and how stakeholders can be involved in information dissemination. These can even be translated into local languages. The BTZ has been using some of these methodologies in disseminating information to the rural poor. The established media. Newspapers, radio and television provide useful routes for informing the public about biotechnology and biosafety regulations. These can be used to educate or inform the public about GMOs. Advertisements can also be used to get feedback on proposed releases of GM products.
References Dickson, D. 2002. African hunger and GM maize. http://www.scidev.net/archives/editorial. James, C. 2001. Preview: Global review of commercialized transgenic crops, 2001. ISAAA Briefs no. 25. Ithaca, NY: International Service for the Acquisition of Agribiotechnology Applications (ISAAA).
500 Modern Agricultural Reforms Mnyulwa, D., and J. T. Mugwagwa. 2002. Agricultural research needs for southern African countries: Towards a regional initiative on need-driven agricultural biotechnology. Harare, Zimbabwe: Biotechnology Trust of Zimbabwe. Persley, G. J., and J. N. Siedow. 1999. Applications of biotechnology to crops: Benefits and risks. CAST Issue Paper 12. Ames, LA, USA: Council for Agricultural Science and Technology. Sasson, A. 1993. Biotechnologies in developing countries: Present and future. Vol. 1, Regional and national survey. Paris: United Nations Educational, Scientific, and Cultural Organization Publishing. United Nations Environment Programme (UNEP). 2002. Cartagena protocol on biosafety. UNEP Website (http://www.unep.org). United Nations Environment Programme (UNEP). 2003a. DFID/UNEP [Department for International Development/United Nations Environment Programme] study on public awareness and participation. UNEP Website (http://www.unep.org). United Nations Environment Programme (UNEP). 2003b. Report of the Regional Workshop on Risk Assessment, Risk Management and Public Participation, Windhoek, Namibia, November. UNEP Website (http://www.unep.org).
20
Sustaining Cultivation M. Bell
‘You’re missing something.’ Dick Thompson and I were sitting at his kitchen table, a well-thumbed copy of the first draft of this book in a stack between us. Dick noted the flash of alarm that passed across my face. ‘I like the book. Don’t get me wrong. I like it a lot. But at least when you’re talking about me, there’s something you’re missing.’ ‘What’s – ’ I started to ask. ‘Get along but don’t go along.’ This is a phrase that Dick says he heard one day when cleaning a hog waterer on his farm, when no one else was around.1 It’s long been his motto, and he repeats it at almost every event he speaks at. I had clean forgotten about it, I suppose because I had never really underlined it in my mind. It seemed to me an interesting but quirky turn of phrase. ‘Get along but don’t go along. It’s what your book’s about.’ He blazed those clear blue eyes at me. I met them for a moment, and then turned away. Then, suddenly, I got it. Finally. Dick saw his meaning land, and his face spread with a three-hundred-acre grin. He was right. Get along but don’t go along is Dick’s way of saying, in just six words, something that has taken me nearer to a hundred thousand to say. The phrase neatly captures the tensions between modernism and postmodernism, difference and engagement, stability and change, that the Practical Farmers of Iowa (PFI) farmers seek to resolve. Get along: Here Dick means both getting along with others and getting along in the world. He means to emphasize the importance of community and dialogue as well as the importance of achieving one’s practical needs, and how these are interconnected.2 Don’t go along: Dick’s point here is not that one should never do what others do, nor that one should, solipsistically, disregard what others have to say. Rather, his point is that one shouldn’t do it just for the sake of getting along. In the terms I have been using in the book, just going along would lead to monologue and monologic power, to the suppression of difference and Reprinted from Farming for US All by Michael Mayerfeld Bell. Copyright © 2004 The Pennsylvania State University. Reprinted by permission of Penn State Press.
502 Modern Agricultural Reforms
Figure 20.1 The view from Highway 71, north of Audubon, Iowa. 2001
of dialogue’s creative power. Dick’s motto instead stresses the value of retaining and encouraging difference as part of getting along, as part of good relations and the achievement of practical outcomes. Falsely treating all our circumstances as the same leads to both alienation and irrelevance. Consensus is not necessary for getting along. Dialogue is, and for dialogue we need to retain a measure of difference if we are to find interest in what others have to say, and thus cultivate new knowledge as we cultivate their interest in and commitment to what we too have to say. Which is just what PFI tries to cultivate. Their vision of sustainable agriculture is that it brings people together in dialogue – bouncing ideas off one another, testing propositions against the practical needs of growing food and feeding people in ways that protect the environment – keeps communities vital, and yields secure incomes. PFI does not offer its members the seductive comfort of final answers. Silver bullets are bullets just the same, no less hazardous for their gleam. PFI gives its members people to talk to and a means for comparing practical circumstances, ever adapting others’ words to their own thoughts and offering their own words back for others to chew over, to reshape in light of their experiences, and to give back to others once again. It is not a process of adoption-diffusion. It is a process of adaption-diffusion. The draw of monologue, of adoption-diffusion, of the Big Ag way should not be underestimated, though. Like the farmer at the wheel of a big green machine, monologue can give those who accept it a feeling of great power, even though the tractor is something that the farmer did not make and could not make, but merely switches on. It is a pleasure of power, not of control. That is to say, it is a borrowed power, an identity on loan. Although it is borrowed, in an uncertain world many feel they can hope for little more.
Sustaining Cultivation 503
Moreover, most farmers find themselves trying to live on borrowed time with this borrowed power. So many acres, so little time. The speeding of the treadmill associated with the Big Ag way is itself a structure of monologue, encouraging farmers to seek the quick answers, the readily available answers, the silver bullets, even if one has a slightly uneasy feeling about the shooters of those bullets. No one can rely on their own experience for everything. We simply don’t have time to reinvent the many wheels of our lives. We all have to rely on what others tell us. It’s inescapable, unless your plan is to stay in bed for the rest of your life. But the problem gets worse and worse the faster the treadmill spins. And given the local intensification of this treadmill through the farmer’s problem, farmers are increasingly less likely to look to their neighbours for answers, lest either party gain an advantage over the other thereby. Instead they turn to the monologic answers that the treadmill itself provides (only sending it spinning all the faster). The Big Ag phenomenology of doing agriculture thus becomes as well a phenomenology of knowing agriculture, of the cultivation of knowledge, of the cultivation of the ignorable, of the cultivation of the self, in this case a largely monologic self. Cultivating oneself within the monologue of Big Ag does not ultimately ease the lives of most farmers, despite its lure of easy answers. The bankers of borrowed power and borrowed time occasionally call in the loans – not every year, and not on every farmer. But there are payments to be made here, even if they are not in the currency of money alone. This is a deeply disorienting experience for those who have little connection with other conversations of life and self. To change metaphors, the structures of agriculture are a tough ride, and a lot of farmers get bucked off. It’s a real shock when it happens – what I have called a phenomenological rupture. When you’re flying through the air, everything you know and do and are comes suddenly into question. Most farmers hit the dirt in a bit of a daze, get up, dust off and see little else to do but to try to get back on the rampaging horse, if they can manage to get a foot in the dangling stirrup and with a mighty heave swing their way back up onto the saddle. And if they can’t … But while you’re flying through the air, if the winds are right, you may hear, at just the right moment, of a safer way to land on the rodeo dirt, and of a whole different way to ride when you dust off and get back up. (Maybe you’ll even hear of a different, gentler horse.) Not every farmer does. But when you’re flying through the air, you listen to the voices in the crowd like you never have before. This moment of phenomenological rupture can actually be a kind of opportunity. So many of the sustainable farmers we interviewed described their decision to change practices as a sudden event. Given the connections between the structures of doing and the structures of knowing, and given the connections of these to the structures of self, there is so much that has to change that very often it needs to be all changed more or less at once – if it is to be changed at all. PFI is one of those voices in the crowd, and it is a voice with a distinctive manner of speaking. It is a dialogic voice. It is a voice that tells you that you don’t have to go along to get along. It is a voice that the farmers of PFI have come, not to adopt as their own, but to adapt to their own.
504 Modern Agricultural Reforms
Farming isn’t easy for the members of PFI either. There is still plenty of bucking with the horses they ride as well. Some PFI members eventually wind up leaving the rodeo of farming too. Despite all the environmental, economic, social and possibly health benefits of what they do, the honest truth is that many of them fail. In fact, several of the PFI farmers that appeared in earlier chapters are no longer farming. Roger. Raelyne. Wendell and Terri. I don’t know of a survey comparing the survival rates of sustainable and conventional farms, but my impression is that it’s much the same for both, although possibly on average sustainable farms survive somewhat longer. Several PFI members I asked about this agreed. If there is a difference in survival rates, it is not so significant that, without a statistical survey, it jumps out at even those closely familiar with the matter.3 Sustainable farmers face several disadvantages in the farming rodeo. To begin with, they often start from a position of financial weakness. As we saw in Bell (2004 Chapter 6), economic factors often act as the phenomenological shock that opens farmers up to the possibility of sustainable farming. Such farmers may find themselves just too banged up financially to regain a secure seat in the saddle, although sustainable practices may enable them to stay ‘in’ farming a few more years. Also, as sustainable farmers tend to farm fewer acres and buy fewer outside inputs, such as machinery and chemicals, ironically they will be more likely to find themselves beholden to banks and merchants, rather than having the banks and merchants equally beholden to them. Because sustainable farmers spend less and borrow less, the balance of beholden-ness is more often tipped against them, making it more probable that the banks and merchants will call in their accounts. Another disadvantage sustainable farmers face is with the structure of agricultural subsidies. The average Iowa farmer does quite nicely in this respect, with that annual subsidy cheque of $22,400 per farm between 1999 and 2001.4 But averages disguise a lot. Some 72 per cent of Iowa’s farm subsidies go to just 20 per cent of the farmers.5 Smaller farmers usually get a much smaller check, and big farmers a bigger one. It might seem obvious that smaller farmers would receive less, but the subsidy system is often defended as the saviour of small farms. Moreover, small farms typically receive lower subsidies per farm acre than big farms, particularly when the small farms produce something other than corn and soybeans, corn and soybeans, and corn and soybeans, the two main subsidized commodities in Iowa. Fewer acres and different products being two of their typical characteristics, sustainable farms tend to lose out substantially on farm subsidies. Take Jon and Heather, for example, small-scale beef farmers. They have been getting about $6000 in annual subsidies recently, less than a third of the average per-farm subsidy rate in Iowa.6 But they have a 320-acre farm, which is near the Iowa average of 344 acres. If they received the Iowa per-acre average, their farm would have averaged about $20,837 in subsidies from 1999 to 2001. Jon and Heather didn’t get that because they mostly grow grass and hay for their organic, free-range beef herd – grass and hay because that’s essential for free-range production and because they want to limit erosion-prone and chemical-hungry crops like corn and soybeans. A few acres of their steepest land are enrolled in the Conservation
Sustaining Cultivation 505
Reserve Program, a government programme for keeping the most erodible land out of row crops. They got about $1000 in annual subsidies for that. And they do grow a few acres of corn, plus some wheat and sorghum, both unusual crops for Iowa. They got about $5000 a year for that. But they missed out on an additional $14,837 a year of support that a more conventional operation of their size would have got. Given that they favour big farms and not agronomic efficiency; given that they encourage overproduction and not soil conservation and environmental protection, in most circumstances; given that they total an awful lot of money devoted to at best dubious outcomes for the public good; given all this, many have long proposed the restructuring of farm subsidies. At the time of this writing, there is considerable hope among those concerned about sustainability that we may have just taken a large step in the right direction with the passage in 2002 (and the partial funding in 2003) of the Conservation Security Program (CSP). This hotly contested title in the 2002 Farm Bill would pay farmers for a whole series of green enhancements to their operations, from building soil-control structures to encouraging wildlife. It’s a manifestation of what some observers of agriculture call ‘multifunctionality’ – the idea that the purpose of agriculture should go beyond the single-minded one of ever-increasing food production. Rather than paying farmers to do only that, through our food expenditures and through the structure of subsidies, we should pay farmers to do some important things that are not directly included in the price of food – things like conserving soil and providing wildlife habitat. The CSP program would pay individual farms up to $45,000 a year to green their operations, based on a tiered system with three levels of enhancements. The CSP, many people hope, is the breakthrough in farm structure that sustainable farmers have been waiting for.7 But others are not so optimistic. The CSP’s structure turns out to be very complex. Many of the small farmers who have looked into it have despaired of keeping up with the paperwork necessary to sign up for the programme and to document compliance with it. Larger farms are more likely to be able to hire outside help to sort through its tangle of rules. Also, at this writing it is not clear that the programme will receive anything like the level of funding that was originally envisioned for it. Although a farm could conceivably get as much as $45,000 a year in support, on a per-acre basis the programme would pay no more than $22.25 an acre, with full implementation at the level of the third tier – considerably less than farmers have been receiving recently for leaving their land in corn. There is also concern about how green some of the practices the CSP will pay for really are, in part because the rules are still up in the air. Although it will probably on the whole encourage greener practices on the farms that are able to cope with its paperwork requirements, it is too soon to say if the CSP will significantly increase survival rates among sustainable farms. Another factor that may depress sustainable farm survival rates comes, paradoxically, from a strength of PFI’s get-along-but-don’t-go-along approach. A farmer who has tried to seat his or her self on the tractor seat of the Big Ag monologue is
506 Modern Agricultural Reforms
also likely to be a farmer with a more unitary understanding of his or her self. The more dialogic self of a more dialogic knowledge cultivation, like PFI’s, is a more multidimensional self, more accustomed to taking others into consideration and thus to envisioning what other selves might be like, including one’s own self. While sustainable farmers may show no less commitment to being a farmer, to getting back on to that horse and to staying on it, they are also possibly more ready to consider other commitments when they find themselves slipping from the saddle once again. With a more open sense of who they are, they may be more ready to accept the outcomes of economic and other structural difficulties because they have come to see their senses of self as less dependent on those structures. They may be more ready to follow a path of self-reinvention, like one male PFI livestock and grain farmer who recently left farming to become a nurse. But many of these points on the survival rates of sustainable farmers are at best informed conjecture. What we do know is that many PFI farms are prospering, perhaps as well as can be expected in such a high-risk, low-return endeavour as farming. We also know that other farmers are not exactly switching to sustainable practices with great alacrity. It is perhaps a steady trend, but it is still a slow one. ‘I’m going to change the question a little bit about issues,’ said Donna, moving on to one of our standard questions. ‘What do you think are the most important issues facing farming today? The important issues facing rural families in America, even the world?’ ‘That’s a tough one. I don’t know where to start.’ Brad paused to collect his thoughts. It was one of those open-ended questions that is so broad one hardly knows what to say at first. ‘One issue revolves around the polarization that’s taking place,’ Brad said finally. ‘Where out in rural America, maybe for all of America, for that matter, the extremes have the loudest voice. Extremes on both sides. In agriculture, it’s the farmers that are getting bigger all the time. It’s the corporate aspects of farming that are getting bigger, especially with hogs now. And then the other side is still those of us that are choosing to farm much differently, and trying to sell our food more directly to the consumer. And so you got that group versus the corporate type of farmer.’ Donna nodded and thought about saying something, but decided to stay quiet and let Brad’s words tumble out more of their own accord. Meanwhile, Brad hesitated, perhaps to consider where he had got to, and perhaps to wonder if he felt right about calling his own side of farming as much of an ‘extreme’ as corporate farming. In any event, he clearly was concerned about monologic interactions between the two sides, each ‘versus’ the other, competing to be the ‘loudest voice’. ‘And then you got the rest,’ he continued. ‘Most of us are still caught in the middle yet, trying to figure out just where in the heck are we going.’ ‘Right,’ said Donna supportively. ‘It’s just such a critical time, I think, for family farm agriculture. ’Cause I think we do have the opportunity to form networks and marketing groups and so forth,
Sustaining Cultivation 507
so that we can survive. But that’s going to have to happen in the next five to ten years, or the opportunities will be gone. Then I think the other, the tremendous hurdle, is education of consumers and citizens in general about the value of farming the way we do.’ In other words, unless the dialogue of practical agriculture widens well beyond its current confines, the cultivation of broad agricultural sustainability is unlikely to come to pass anytime soon. As Brad noted, part of that broadening has to take place among farmers and others in the farming community, such as university researchers, government officials, bankers, agricultural implement dealers, agricultural implement makers, seed suppliers and commodity groups like the Iowa Corn Growers Association. Although Brad rightly worries that there is still much polarization here, much of the success of PFI has been exactly in its ability to invite the participation of others in the farming community into its conversations, into its knowledge cultivation, through the attractions of the group’s dialogic approach. PFI has had the greatest impact on its local state university, Iowa State. It can be no accident that Iowa State in 1989 established the Leopold Center for Sustainable Agriculture, which is widely recognized as one of the nation’s leading research and extension centres in sustainable agriculture. It can be no accident that in the fall of 2001 Iowa State University enrolled students in the nation’s first graduate programme in sustainable agriculture.8 PFI has also made connections with many of Iowa’s traditional agricultural organizations, such as the Iowa Farm Bureau, with which it jointly hosts a series of field days every year to farms that are implementing sustainable practices. At its 2003 annual meeting, PFI hosted a session, led by a rural banker, on the role of bankers in sustainable agriculture. PFI understands what I earlier called the ‘wonderful’ quality of dialogue: that the inclusion of each additional voice in a dialogue encourages consideration of whomever else is missing, leading to the even greater widening of participation. But Brad also pointed to another, equally important dimension of broadening the dialogue of practical agriculture: the ‘tremendous hurdle’, as he put it, of involving those who eat and use what farmers produce in the discussion over what agriculture has become and what it could instead be. To overcome that hurdle, to encourage the broader relevance of agriculture, we will have to consider the arguments for why agriculture is irrelevant. I think we can divide these arguments into three general sorts, what we might call the emptying of agriculture, the swamping of agriculture, and the obsolescence of agriculture. All three of these arguments, I believe, are misleading. The emptying of agriculture is probably the most familiar of the three, and it goes like this. Ours is now an urban world. Some 75 per cent of Americans live in urban areas, and 25 per cent in rural areas, the reverse of how things stood 100 years ago. True, worldwide, some 53 per cent of the human population remains rural.9 Each year, however, the rural percentage drops, as more and more of the human more and more find their fortunes where the real fortunes seem always to be made: in cities. And those who remain in rural areas, particularly in the wealthy countries,
508 Modern Agricultural Reforms
are increasingly apt to take up pursuits similar to those of their city cousins – factory work, retail sales, government services. Moreover, rural people in rich countries and poor increasingly commute to urban areas for work. Hardly any rural people actually still farm, at least in the rich countries. In the US, farmers and farm workers are down to a couple of per cent of the workforce of the entire country.10 Even in Iowa, where agriculture is a larger part of the economy than in any other state, farmers and farm workers account for only about 6 per cent of the employed workforce.11 The swamping of agriculture is a related point, although the direction of the argument runs the other way. It suggests that as people have left farms for the city, the forces of the city have taken over the farms. There is nothing special about agriculture anymore. It is an industry like any other, and a business like any other, too. In the words of the rural sociologist William Friedland, ‘what is now called “agriculture” has become mostly sets of industrial processes physically located in the open air rather than under a roof.’ Agriculture has been ‘transformed beyond recognition,’ Friedland says.12 Increasingly, agriculture is a bad neighbour that local residents protest because of its pollution, just like a factory. And with the coming of ‘pharming’, in which what is grown is not food but bioengineered medicines, agriculture is no longer ‘just like a factory’; it is a factory. There is no room here for any sentiment concerning community ties among rural residents, or between rural and urban residents. Agriculture is just a form of capitalism. Indeed, there is no reason even to call it agriculture anymore, suggests Friedland, as what we think that word means no longer exists. Besides, as the agricultural economist Stephen C. Blank argues in The End of Agriculture in the American Portfolio, we don’t really need agriculture anymore. Agriculture is obsolete. That’s why there’s no money in it, and that’s why farmers are in such decline. Only a few consumers are willing to spend for their food what it would take to provide American farmers with a decent standard of living. ‘In the simplest terms, the production of food and other agricultural products will disappear from the United States because it will become unprofitable to tie up resources in farming and ranching,’ Blank argues. Although ‘many of them will not believe it at the time,’ he continues, many farmers ‘will, in a number of ways, be better off after they make the difficult decision to leave agriculture voluntarily.’ Good riddance to the high labour, high risk, high capital and low profit of farming. ‘We need to strip away the romance and nostalgia surrounding agriculture and see it for what it is: a business,’ Blank writes. ‘We must learn to let go of farming and ranching.’13 We won’t starve. Farmers in developing countries, with their lower wages and lighter environmental regulations, will be able to export plenty of cheap food to us, Blank argues. And as long as there is plenty of edible goo for us to microwave up whenever we require it, why should we care?14 Now, it must be said that there is some truth to these three arguments for the irrelevance of agriculture in the US and other developed countries. More people do live in cities today, almost three-quarters of the developed world. The rural people that remain lead lives that are indeed much the same as those of urban folk, albeit with perhaps a bit more driving (or perhaps not, given the length of some urban commutes). We must admit that much of agriculture, if not most of it,
Sustaining Cultivation 509
hardly seems like farming anymore. To repeat the sociologist Paul Lasley’s phrase, agriculture is increasingly just Ag-ag business, ag chemicals, ag machinery, and perhaps just plain agony for some, given the stress, the struggle, the loss of economic control, the loss of community, the loss of environment, the loss of culture. Also, the US has for many years been the world’s largest food importer.15 We are wealthy enough that we could probably easily import more, if need be. For many, these trends are to be decried and resisted, lest we truly lose the real meaning of agriculture and the close interaction with communities natural and human that it affords and preserves. Indeed, this book might be read as such a decrying and resisting. And in a way it is. But in a way it isn’t, for I believe that some of the concern to save agriculture is misplaced.16 To decry and resist the ‘emptying’, ‘swamping’, or ‘obsolescence’ of agriculture is, in some measure, to accept the terms by which these three visions of the end of the agriculture frame our understandings. And to accept the terms of the end-of-agriculture debate, whether pro or con, is to accept an unhelpful presumption: that agriculture is something that farmers do. As Wendell Berry has written, ‘eating is an agricultural act’.17 To eat is to shape the contours of farmland as effectively as any tractor. What we eat is what we grow. How we eat is how we grow. Why we eat is why we grow, and there are many reasons for eating in addition to attending to the necessary, if generally pleasurable, sustenance of our individual bodies. The pleasures and necessities of eating, as we understand them, may be as much about the connections it makes with other places and other lives as about the filling of the self. Among those connections are connections to the rural places that yield the bulk of what we eat, and to the people who plant the seeds, tend the plants, and harvest the crop. In this sense, there has been no emptying of agriculture. There is just as large a percentage of people involved in agriculture as there has always been: all of us. There may be fewer farmers, but there are no fewer agriculturalists. Indeed, given the increase in the human population, there are substantially more. Nor, in this sense, can we say that agriculture has been swamped by the forces of the city. There is nothing non-agricultural about urban living. Without agriculture, there would be no urban living, and indeed little human living of any kind. Agriculture is indeed in many ways much different from what it once was, but that’s largely because urban life has become part of it, not because urban life has become a source of agriculture’s demise. Nor is agriculture obsolete. If we were to switch to importing all our food, that would not make agriculture any less a part of the American economic portfolio. We would still be eating, paying for it and shaping the lives of farmers and the land thereby. Those farmers and that land would just be that much further away, making our sense of connection to, and understanding of, eating as an agricultural act that much further away in our minds as well. For while it is true, as long as we yet eat and live, that agriculture is not over, nor even close to it, it is also true that most of us no longer feel a part of its conversation.
510 Modern Agricultural Reforms
In short, agriculture has largely become monologic. It speaks to us, not with us, and that goes for farmers as much as eaters. And it speaks to us with one logic: cheap food is all we should ask of agriculture. We don’t want to pay more than we have to for our food, of course. This much is true. But the single-minded focus on producing vast quantities of food in order to feed the world at low cost keeps us from seeing the full connectedness of the agricultural conversation, the connectedness both between people and between people and the earth. Among those connections are the implications of the cheap-food monologue for farmers, in both rich countries and poor. In the US, our agricultural subsidies, as we have seen, encourage ever-increasing production, which has the effect of driving down the prices farmers receive, which in turn leads them to try to stay on the treadmill and solve the farmer’s problem by increasing their production even more. But although this process is often praised for keeping food costs down, it no longer has much impact on what eaters pay. Currently in the US, about 19 cents of every dollar spent on food goes back to farmers – about $123 billion of the $661 billion American consumers spend on food each year.18 Decreasing that percentage even further would have little effect on food prices, as it is now such a minor fraction of the food dollar.19 But it would almost certainly result in fewer farmers on the treadmill. In fact, we are currently awash in food in the US, and in most other industrialized countries. The situation is so bad that, in order to prop up the prices farmers get, so that they don’t all fold at once, we burn corn in our cars in the form of ethanol and we have an aggressive food export policy. In addition to being the world’s biggest food importer, the US is the world’s biggest food exporter. Which is supposed to help feed the world. But as I have discussed, most American agricultural products are too expensive for any but the relatively wealthy in other countries to purchase, the very people who are already eating pretty well. And in circumstances where American food – grain, primarily – does get to poor regions of the world, it tends to depress prices in those areas below what local farmers can make a living on, putting them out of work and making them even poorer. ‘Feeding the world’ with American grain is consequently often just a pretty slogan for commodity dumping. Despite being awash in cheap food at home, there is nonetheless widespread hunger in the US. The US Department of Agriculture categorizes nearly 35 million Americans, including 13 million children, as ‘food insecure’ – approximately 12.5 per cent of the nation in 2002. Approximately 9.4 million live in households that the USDA classifies as ‘hungry’ – about 3 per cent of the nation.20 This hunger persists despite the fact that Americans spend less of their income on food – about 11 per cent – than practically any other industrialized nation. But those are average figures. Poor people need to eat as much as rich people do, and although they cut costs and spend quite a bit less, they still spend a much higher proportion of their income on food. People making between $5000 and $10,000 a year spend about 33 per cent of their after-tax income on food.21 Also, poor people in the US typically face higher food costs, as supermarkets today typically are located in suburban areas, away from where most poor people live.22 The solution
Sustaining Cultivation 511
to hunger is not to increase food production in the US. Rather, it lies in reducing inequality here and abroad, in increasing food production within poor countries, and in protecting the environmental base of food production. Also, most of us don’t need more food. In the US there are perhaps greater health problems from overeating than from undereating, as the recent national discussion of obesity has underscored. We need better food. Given that we don’t pay much for food to begin with; given that farmers don’t get much of what we do pay; given that we currently spend our subsidies mainly to support high production, with relatively less attention to quality production – given all that, better food should be well within the nation’s capabilities, without a significant increase in food costs, if any at all. And we’ve been working on it, perhaps most notably through the recent growth in the production of organic food. Once found mainly in the form of tired-looking, expensive veggies in hippie co-ops, organic food is now big business. Some 39 per cent of US consumers report that they use organic products at least occasionally.23 However, organic products are typically significantly more expensive and generally do not yet deliver on the promise of higher quality food with only a small price increase, or even a price decrease. Nor is organic production necessarily helping very many small farms to stay afloat, as organic increasingly becomes bought up into what the writer Michael Pollan has aptly termed the ‘industrial-organic complex’.24 The point is, as Patricia Allen and Martin Kovach note, organic ‘is simply not enough’.25 Organic agriculture in itself does little to reconnect eaters with the agricultural conversation. In fact, it can be seen as largely a confirmation of their disconnection. What I mean here is that organic food retailing commonly trades on consumers’ growing sense of unease with their disconnection from the agricultural conversation, and their consequent lack of trust in what they eat. Organic certification is narrowly based on production criteria. Buying organic food likely does support environmental protection and probably animal welfare, too, but in itself it has little to do with economic justice and bringing people back into the agricultural conversation. The focus of the organic label and its associated inspection system is on individual consumer health in an untrusting world – on what the sociologist Melanie Dupuis has termed ‘not in my body’ sensibilities – more than reconnecting eaters with a dialogic, practical agriculture.26 We have become used to seeing agriculture as a realm out there in the beyond that we have left behind, physically and culturally. This beyond and behind notion of agriculture envisions it as a space, something that we enter when we leave, or perhaps escape, the sprawling city and the artifice and ambition we sense there. Agriculture now feels distant, something that we rarely see and that little impinges on our daily activities. Agriculture feels like a product line – shall I have the Cortlands or the Fujis or the Granny Smiths? – not a relationship to other humans and the earth. That feeling of the product line is part of the feeling of distance, for disconnection is distance. So why not bring agriculture back home, to everyone’s homes? The pleasures of this connection are what Jack Kloppenburg, John Hendrickson and Steve Stevenson
512 Modern Agricultural Reforms
mean when they speak of ‘foodshed’ thinking. The increasingly globalized food system of today encourages a sense of placeless food. Sure, we might know that in North America oranges come from Florida in the winter and from Brazil in the summer, and it may even say so on the signs in the supermarket produce aisle. But here place is used mainly as a sort of brand. We get little sense of the lives of those who raised, sorted and shipped these oranges. We get little sense of the environmental implications of their methods. They’re just oranges, some cheaper, some more expensive; some sweeter, some a bit more dried out. But thinking of the food we eat as flows in a foodshed, like flows of water in a watershed, gives direction to the movement of food, and thus an origin to food in specific places and in the specific lives lived there. Foodshed thinking makes all food homemade, for it connects us to the home places of what we eat. Foodshed thinking also teaches where we ourselves are. ‘The foodshed is a continuous reminder that we are standing in a particular place; not anywhere, but here,’ write Kloppenburg, Hendrickson and Stevenson.27 It leads to what Thomas Lyson has called ‘civic agriculture’ – a ‘locally-based agricultural and food production system that is tightly linked to a community’s social and economic development’, in Lyson’s words.28 And it is leading to it with a will. Communities across the world, especially in those places where food had become the most placeless, the most monological, are returning to local foods, and the dialogic connections to people and environment that is their sweetest taste. In the United States, we have seen an enormous growth of farmers’ markets, farm stands, pick-your-own, community-supported agriculture (CSA) projects, community gardens, community farms, community kitchens, institutional buying of local products, and smallscale food processing. For example, between 1994 and 2002 the number of farmers’ markets around the country rose from 1755 to more than 3100, a 77 per cent increase.29 There are now more than a thousand CSA, or subscription, farms in the United States, with more than a hundred thousand member households.30 Although they are sometimes threatened by development pressures, the growth of community gardens and community farms has been bringing agriculture right back into the city, making the eaters the growers.31 People are coming to savour the taste of place and the enjoyments of eating locally, eating seasonally, and eating in ways that support local farmers and local communities. The point of local agriculture is not that North Americans need to give up tea, coffee and bananas. The point is that, in a food system in which what we eat may come from thousands of miles away and where the typical food item is handled 33 times from field to supermarket shelf, there is abundant room to cut way back on the ‘middlemen’ so as to give a greater share of the food dollar to farmers, while giving eaters healthier, tastier, more environmentally friendly, communitysupporting and quite possibly even cheaper food.32 And everyone gains a sense of connection, of dialogue between grower and eater. PFI has been among those groups that have in recent years worked hard to provide that connection and dialogue. Through its Field to Family project, PFI has worked to combine issues of equity and sustainability with local eating and local
Sustaining Cultivation 513
sourcing of food. PFI instituted a ‘healthy food voucher’ programme that enabled low-income families to participate in the CSA project the group helps coordinate. PFI has organized local institutions to use local sources of food, such as the campus conference center at Iowa State, which now provides an ‘all-Iowa meal’ option for organizations that use the facility. PFI regularly conducts cooking classes and nutrition classes so that eaters can regain the skills of healthy and efficient home food preparation. PFI started up a farmers’ market in Ames, the city where Iowa State is located and where PFI’s own offices are. PFI started an annual youth summer camp centred on sustainable agriculture and sustainable food, and began a gardening and nutrition programme with the Ames Boys and Girls Club. But perhaps the greatest effort that PFI has made to connect farmers and eaters came in 2002, when its members voted to allow non-farmers to become full voting members of the group. The group still asks people to state on their membership application whether they gain ‘a significant part’ of their income ‘directly from farming in Iowa’. And only those who check this box can serve on the group’s board. So it is still at heart a farmers’ organization. But anyone can join and vote, and half of the group’s roughly 700 members are eaters, not farmers, who have taken up this invitation to engage in the dialogue of what a practical agriculture could look like – this invitation to find a place in the wordshed of the foodshed. The broad sense of connection underlying foodshed thinking allows us to dispense with another unhelpful presumption about agriculture: that its purpose is only to grow food (and fibre and, I suppose, medicine now). We do want agriculture to grow food for us (and fibre and, perhaps, medicine). But growing food is only one dimension of what I would argue is the purpose of agriculture: cultivation – the care and tending of creation, human and non-human, social and ecological. Here I mean cultivation in a way different from but related to how I have used it earlier in this book. Here I mean it not as the relationship between who we are and what we know, as the culture of identity and the identity of culture. I mean cultivation as the culture of the earth, as the husbandry and wifery of life, as farming for us all. Cultivation, then, is a task not only for those people we have long regarded as the agriculturalists. It is a task not only for farmers. It is a task for everyone. I worry, though, that the image of the farm tends to guide our thinking back to a sense of agriculture as the beyond we left behind. There couldn’t be a farm in a city, right? A city couldn’t itself be a farm, could it? There is something jarring to the pattern of our imagination here. Thus I suggest, along with Harriet Friedmann, that we imagine the dominant metaphor of agriculture as that of the garden, the garden writ large, for a garden is something that I believe we are more used to understanding as potentially everywhere, in city and countryside alike.33 We are more used to identifying ourselves as potentially all gardeners than as potentially all farmers. Moreover, there is an intimacy and care associated with gardening, an intimacy and care that Big Ag has, to a
514 Modern Agricultural Reforms
Figure 20.2 Virginia Moser, PFI member, at the CSA farm she operates with her husband, Marion Moser, 1999
large extent, driven out of our image of farming. And indeed most farms today do not feel remotely like gardens. Nor do most of our towns and cities, our schools and neighbourhoods, our workplaces and our public life, at least not much of the time. These too are increasingly a form of Big Ag, farming us all, not farming for us all. So let us put the culture back in agriculture of all forms and in all places. Let cultivation of what Friedmann has termed the ‘gardens of Gaia’ become our understanding of what the rural is and what farming should be – of what we sometimes succeed in and so often fail to attain in actual social and ecological life in both country and city.34 To speak of agriculture, then, in this ideal sense, is to consider the degree to which a state of mind and action brings out, or fails to bring out, the gardener’s capacity of care for creation. Which brings us back to dialogue and sustainability. It is something of a romance, I freely confess, to consider agriculture as cultivation in this largest sense, as care of the earth. But it is a romance that allows us to appreciate how the current structures of production so overwhelm our better intentions for the cultivation of the garden. It is a romance with material consequences. It is a practical romance. But only if we all engage in the conversation of agriculture. For we probably do not all agree about what it means to care for the earth and its ecological and social creation. And that is fine. More than that: it is great – as
Sustaining Cultivation 515
long as we engage our differences and take responsibility for response ability, for difference is creativity’s own unfinalizable wellspring. By coming to imagine agriculture as here and now, wherever we are, and not beyond and behind, we ask for and welcome that engagement. Eaters, growers, purveyors, teachers, builders, doctors, lawyers, bus drivers, factory workers, scientists, even realtors and regulators: we are all potentially agriculturalists in the sense of the gardening of creation. It depends upon our state of mind and action, upon how we contribute to this task that is, thankfully, larger than any of us. This, I believe, is the practical message of Practical Farmers of Iowa: that cultivation in the agricultural sense depends upon an approach to cultivation in the social sense that embraces the creativity of difference, openness and the unfinalizable. A dialogic, practical agriculture requires that we all consider agriculture a central feature of everyone’s lives, worthy of everyone’s care and careful attention. A dialogic, practical agriculture requires that we sustain the broadest possible conversation about agriculture. For what Iowa’s practical farmers are really trying to farm is democracy, the democracy of the people’s good earth. The same is true of practical farmers everywhere. They are all guided by a common insight: that farming for us all, in every field of human endeavour, is only possible when there is farming by us all.
Acknowledgements As I sit down to write these acknowledgements, the autumnal equinox fast approaches and the harvest is on in the Midwest. It’s a time for finishing up, for gathering together, for putting things away, for reflecting on the season past. As day and night near equality, it’s a time for assessing the balance of things. And it’s a time for giving thanks. Harvest and the equinox thus seems to me a very good time to write the acknowledgments for a book long in cultivation, perhaps especially for a book about farming. When the crop is full ripe (or as ripe as it’s going to get), it needs to be gathered together. And so it is with the crop of this book. It is time to finish up. It is time to reflect on the season past and to give thanks for those who have contributed so much to its fruits. A common myth – there can be no other word for it – is that the real farmer farms alone, toiling single-handedly against the elements, and that every farm has only one farmer. He (in the myth it almost always is a he) is the farmer. The others are farm workers, farmhands, farm wives, farm kids. The members of Practical Farmers of Iowa and other sustainable agriculture groups, as this chapter describes, are struggling to overcome this singular understanding of the authorship of a farm, as part of their efforts to create a more dialogic, and thus more practical, agriculture. We need also to struggle against the parallel myth of the single authorship of a book. No author truly works alone. No book truly has just one author. This is particularly true of a book such as this one. Central to whatever fruit this book can be said to offer are the participatory methods with which the underlying
516 Modern Agricultural Reforms
research was conducted. Without Donna Bauer and Sue Jarnagin of Practical Farmers of Iowa and their on-the-ground insights, and without Greg Peter’s master’s thesis work, this book would have been not only less informed, less intelligent, less relevant, less valid and reliable a witness of the conditions of farming today – to the extent it has any of these good qualities – it would have been a whole lot less fun. To them I owe the biggest thanks.
Notes 1
2 3 4
5 6 7 8
9 10
11
12 13 14 15 16
Dick describes this experience as follows in Thompson, Thompson and Thompson (2002, p1–3): ‘Several years ago while cleaning out a hog waterer, Dick heard a voice that said, “Get along but don’t go along.” There was no other person around at the time. This concept is what we are supposed to do. We don’t have to convict or convince anybody, just share when asked. This makes the yoke easier and the burden lighter. This policy has left the door open to go to many land grant universities in the United States and overseas during the last few years.’ This is also in keeping with what I have elsewhere termed the ‘dialogue of solidarities’ (Bell, 1998). Three members I asked said they thought survival rates of sustainable and conventional farms were about the same. A couple thought the rate was slightly higher for sustainable farms. Environmental Working Group (2002) figures, divided by the 96,000 farms the US Agricultural Statistics Service recorded for Iowa in 1999. Anthan (2001) reports considerably higher subsidy figures, but the Environmental Working Group is more reliable. Environmental Working Group (2002). I looked up their subsidy on the internet, courtesy of the Environmental Working Group, www. ewg.org, which has usefully posted the subsidy figures for every farmer in the US. See, for example, the website of the Minnesota Project, a nonprofit Minnesota environmental group, www.mnproject.org/csp/. I make this observation with some caution, as I was myself involved in establishing this programme. Thus readers should take into consideration that I may have some personal interest in promoting its significance. Figure for 1999 (United Nations Population Fund, 1999). The precise figure of Iowa farms that raise livestock, as of the 1997 agricultural census, was 57 per cent (National Agricultural Statistics Service, 1999, Table 2). However, the number is dropping fast. Many thousands of hog farmers gave up during the steep price dip during the winter of 1998–1999, and thus the percentage of Iowa farms with livestock now is probably below 50 per cent. Based on dividing the number of farms in Iowa in 2002 (92,500, according to the Iowa Office of the National Agricultural Statistics Service, 2003) by the size of the employed labour force in the state (1,560,300, according to Iowa Workforce Development, 2003), one gets a higher figure than the slightly less than 5 per cent I earlier derived from Otto, Swenson and Immerman (1997), to which I have added a per cent or so for farm workers. Friedland (2002, pp352, 368). Blank (1998, pp1, 3, 193, 195). I’m adapting a line here from the Iowa State University agricultural economist Mike Duffy (personal communication), who certainly is no fan of food as edible goo. It is also the world’s largest food exporter, a point that Blank does not consider closely. For examples of the Jeffersonian view that I wish to sidestep, see Comstock (1986).
Sustaining Cultivation 517 17 18 19 20 21 22 23 24 25 26 27 28 29 30 31 32 33 34
Berry (1990, p145). Figures for 2000, from USDA Economic Research Service (2003). I thank Mike Duffy for this observation. Nord, Andrews and Carlson (2003). Blisard (2001, table 19). Kaufman et al (1997). Organic Trade Association (2003), citing a Natural Marketing Institute 2002 study. Pollan (2001). Allen and Kovach (2000). Dupuis (2000). Kloppenburg, Hendrickson and Stevenson (1996, p41). Lyson (2000, p42). Lyson (2000, p45), and US Department of Agriculture (2002). Several websites, including several USDA websites, attribute this figure to a 1999 USDA study, but I was not able to locate the original source. In perhaps the most dramatic example of the development of urban agriculture, some neighbourhoods in Cuban cities now raise some 30 per cent of their food locally. See Funes et al (2002). The figure of 33 times is from Kahn and McAlister (1997). Friedmann (2003). Ibid.
References Allen P and Kovach M. 2000. The capitalist composition of organic: The potential of markets in fulfilling the promise of organic agriculture. Agricultural and Human Values 17, 221–232 Anthan G. 2001. Bailouts favour big farmers, congress told. Des Moines Register, 4 February. Accessed 8 February 2001, http://DesMoinesRegister.com/news/stories/c4789013/13700684.html Bell M M. 1998. The dialogue of solidarities, or why the lion spared Androcles. Sociological Focus 31(2), 181–199 Berry W. 1990. The pleasures of eating. In Berry W. What Are People For? North Point Press, San Francisco, CA Blank S C. 1998. The End of Agriculture in the American Portfolio. Quorum Books, Westport, CN Blisard N. 2001. Food Spending in American Households, 1997–98. USDA Statistical Bulletin no 972 Electronic Report from the Economic Research Service. Accessed 12 November 2003, www.ers. usda.gov/publications/sb972 Comstock G (ed). 1986. Is There a Moral Obligation to Save the Family Farm? Iowa State University Press, Ames, IO Dupuis M. 2000. Not in my body: rBGH and the rise of organic milk. Agriculture and Human Values 17, 285–295 Environmental Working Group. 2002. EWG Farm Subsidy Database. Accessed 25 May 2002, http:// gsi.ewg.org/farmbill.acgi$farmbill2?regtype=state&state=1A&submitted=true&whichForm=reg Friedland W H. 2002. Agriculture and rurality: Beginning the final separation? Rural Sociology 67(3), 350–371 Friedmann H. 2003. Eating in the gardens of Gaia: Envisioning polycultural communities. In Adams J (ed). Fighting For the Farm: Rural America Transformed. University of Pennsyvania Press, Philadelphia, 252–273 Funes F, Garcia L, Bourque M, Perez N and Rosset P. 2002. Sustainable Agriculture and Resistance: Transforming Food Production in Cuba. Food First Books, Ockland, CA
518 Modern Agricultural Reforms Iowa Office of the National Agricultural Statistics Service. 2003. Number of Farms, Land in Farms, and Average Farm Size, Iowa by County, 2001–2002. Accessed 20 June 2003, www.nass.usda.gov/ia/ coest/farms01_02.txt Iowa Workforce Development. 2003. Iowa Employment Situation: May 2003. Accessed 20 June 2003, www.iowaworkforce.org/news/XcNewsPlus.asp?cmd=view&articleid=81 Kahn B E and McAlister L. 1997. Grocery Revolution: The New Focus on the Consumer. AddisonWesley, New York Kaufman P R, MacDonald J M, Lutz S M and Smallwood D M. 1997. Do the Poor Pay More for Food? Economic Research Service, US Department of Agriculture, Agricultural Economic Report 759 Kloppenburg J Jr, Hendrickson J and Stevenson G W. 1996. Coming into the foodshed. Agriculture and Human Values 13, 33–42 Lyson T A. 2000. Moving toward civic agriculture. Choices 3, 42–45 National Agricultural Statistics Service. 1999. 1997 Census of Agriculture, Iowa. US Government Printing Office, Washington DC Nord M, Andrews M and Carlson S. 2003. Household Food Security in the United States, 2002. US Department of Agriculture, Food and Rural Economics Division, Economic Research Service. Food Assistance and Nutrition Research Report No 35 Organic Trade Association. 2003. Industry statistics and projected growth. Accessed 24 October 2003, www.ota.com/organic/mt/business.html Otto D, Swenson D and Immerman M. 1997. The Role of Agriculture in the Iowa Economy. Iowa State University, Department of Economics Report. Accessed 26 April 2000, www.econ.iastate.edu/ outreach/agriculture/AgImpactStudy/reports/state.htm Pollan M. 2001. Behind the industrial-organic complex. New York Times Magazine 13 May. Accessed 19 June 2003, www.nytimes.com/2001/05/13/magazine/13ORGANIC.html Thompson D, Thompson S and Thompson R. 2001. Alternatives in Agriculture: 2001 Report. Thompson On-Farm Research, Boone, IO United Nations Population Fund. 1999. State of the World’s Population, 1999. Accessed 18 June 2003, www.unfpa.org/swp/1999/chapter2d.htm US Department of Agriculture. 2002. Farmers Market Facts! Accessed 19 June 2003, www.ams.usda. gov/farmersmarkets/facts.htm USDA Economic Research Service. 2003. Food marketing and price spreads: USDA marketing bill. Accessed 12 November 2003, www.ers.usda.gov/briefing/foodpricespreads/bill/
Index
Compiled by INDEXING SPECIALISTS (UK) Ltd Aborigines 46–7, 53, 76, 98, 148 see also Australia; indigenous peoples above-ground plant studies 358–9, 414 absolutism 186, 308–9 abundance of resources 21 activity transition 119–28 see also sedentarization adaptation human potential 149 technologies 258–89, 391–3 adaptationist approach 53, 58–9 administrative utopianism 308 adoption of innovations 260–1, 269–70, 305, 391–2 see also innovation aestheticism 183–5 affluence 54–5 afforestation 435, 455–7, 465–71 see also forests Africa ASB benchmark sites 350–7 biotechnology 475–500 colonialism 76 deforestation rates 339 field-centred agriculture 406 hunter-gatherers 34, 42, 44, 49, 62, 94, 96 soil and water conservation 377, 379–80, 383–9 see also individual countries Afton, Bethanie 233–57 age–knowledge loss correlation 145–6 Agenda 21, China 219 agricultural engineers 311 Agricultural Research Policy Advisory Committee (ARPAC) 165 agricultural revolutions 8–11, 233–4, 258–89 agricultural society effects 119–20, 128 agriculture etymology 404–5 agro-ecological farming systems 7–8, 12–13, 208–21, 403–4, 423–74 agroforestry 343, 354–6, 405 see also forests agrohydraulics see hydraulic agriculture agronomic sustainability studies 347, 358–61 alcoholism 82, 108–9, 128 alley cropping systems 382
Alternatives to Slash and Burn (ASB) consortium 340, 345–65 Amazon Basin benchmark sites 349 Amazonian language preservation 148 The Americas 93–4 see also Central America; Meso-America; North America; South America; United States ancient China 208–17 Andean area 179, 349 Andrew, Mary Adele 75–6 Angola 478, 484, 491 animal systems/farming 83–5, 223, 406, 412–13, 416–17, 424–5 see also breeding programmes; individual animals; livestock; pastoral farming Annals of Agriculture 265–6 annual cycles see seasonal cycle anthropogenic landscapes 144 anthropology 51–2, 54, 90–2 appropriation 316–18, 321–2, 330 see also land appropriation; procurement aquaculture see fish/fisheries/fishing aqueducts 174–5, 182–3 arable farming see crops; plant foods; vegetable foods Arakcheev, Alexei 309, 310 architecture 183–5, 309–10 Arctic region 32, 111 Argentina 300, 483 Aristotle 76 ARPAC see Agricultural Research Policy Advisory Committee artificial insemination 478–82 ASB see Alternatives to Slash and Burn consortium Ashini, Jena-Pierre 122–3 Asia ASB benchmark sites 350–7 deforestation rates 339 Green Revolution 294, 296–305 hunter-gatherers 31, 34, 42, 44, 62–3 soil and water conservation 377, 380–1, 384, 388–90 see also individual countries assimilation of language 139, 140 astronomy 173–4
520 Sustainable Agriculture and Food Australia colonialism 76 hunter-gatherers 23, 34, 42, 44, 46–7, 53, 63, 98 language preservation 148 soil and water conservation 388 authoritarian high modernism 315, 322–32 awareness, biotechnology 488–98 Aztecs 78, 79 Babel ‘curse’ 140–1 Bakewell, Robert 260, 262, 272, 275, 278–9, 281 band societies 45–6, 48, 53 see also foragers Bantu people 18 Barac, Victor 65 barley 160–1, 238–9 Barnard, Alan 51, 63 bean crops 239–40 Beckett, John 233–57 behavioural ecology 58–9 Bell, Michael 13, 501–16 below-ground plant studies 359, 414 benchmark ASB sites 348, 349–57, 363 ‘benefit of humanity’ argument 150 benefits analysis eco-counties 449–50 eco-villages 438, 440–1 household ecosystems 427–8 Berreman, Gerald 66 best-bet alternatives 360–1 Bickerton, Derek 85 Biddell, Arthur 272–6, 278–9 Big Ag farming 502–3, 505, 513–14 bilingualism 145, 146 binary pairs see dichotomies biocultural diversity 5–6, 136–7 biodiversity see biological diversity biogas systems 13, 427, 429, 436, 439–40, 449 biological approaches 411–17 biological diversity 137–42, 149, 150–3, 339–40, 358–9 biomass 408 biosafety systems 477, 483–97 biotechnology 13, 404, 475–500 Biotechnology Trust of Zimbabwe (BTZ) 476, 495, 497, 500 Blank, Stephen C. 508 Board of Agriculture 268 Boas, Franz 52 Bodley, John 66 boiled drinking water 229 Bolsheviks 309–10, 317–21, 322, 325 books as extension resources 264–6 Borlaug, Norman 292, 293–4 borrowing culture 502–3 Boswell, James 262 Botswana 18, 28–9, 478, 484, 491 see also Kung Bushmen bottom-up participatory processes 499 Boyd Eaton, S. 65 Brazil 339, 344–5, 349, 351–7, 388
bread grain see grain crops breed management 249, 278–81 breeding programmes 478–82 eco-agriculture models 449 experiments 278–81 Green Revolution 292–4, 297, 301–2, 305 homestead gardens 425–7 see also animal systems/farming Britain 258–89 see also England Brody, Hugh 4, 73–106 BTZ see Biotechnology Trust of Zimbabwe building activities see construction activities bunds 384, 386, 389 Burch, Ernest Jr. 58 Burkina Faso 383–4, 388–90, 415 Burnum, Burnum 42 Bushmen 17–39, 87 Calder case 79–80 calendar making 173–4 calorific returns Bushman food 21, 27–8, 29 cereal crops 290–1 field-centred agriculture 407 mongongo nuts 21 see also energy... Cambridge Encyclopedia of Hunters and Gatherers 41, 43, 49, 60–7 Cameroon 350, 351, 352–7 Campbell, Thomas 311–12, 313–14 camps, Bushmen 18–19, 23 Canada 79–82, 99, 107–35 canals 175–7, 182–3, 226–7 see also irrigation techniques cancer 117 canopy-style homestead gardens 424 capacity-building 495–6 capital city construction 180–1, 182–5 capitalism 187, 311–12 carbon stocks 358, 364 caribou meat 113, 114, 116 Cartagena Biosafety Protocol 477, 488–9 cash crop prices 242 cassava 416–17 catchment ponds 415–16 Cato, Marcus Porcius 6–7, 197–207 cattle 200, 246–7 see also pastoral farming CBD see Convention on Biological Diversity Central America 391–2 see also Latin America centralized industrial farming 311–13, 323, 329–30 centres of diversity 6, 160 cereal crops 290–307, 403–4 see also crops CGIAR see Consultative Group on International Agricultural Research Chagga people 170, 172, 177–8, 180 CHAGS see Conferences on Hunting and Gathering Societies
Index 521 ‘chain’ farms 312 change 8–11 see also agricultural revolutions; transformations; transitions cheap-food monologue 510 chemical approach 412–13, 414–15 children 87, 88–90, 127–8 see also young people Chile 300 China agro-ecological farming systems 7–8, 12–13, 208–21, 423–74 biotechnology 483 eco-counties 441–53 eco-villages 431–40 ‘forty centuries’ farmers 222–9 genetic resource conservation programmes 166 Green Revolution 294, 297, 301–2, 305 homestead gardens 423–31 hydraulic agriculture 169–70, 172, 176–81, 184 shelterbelt systems 453–73 choice 141, 148–9 Chomsky, Noam 88–90 chronology of open-field farming 234–5 cities 180–1, 182–5, 308–9 see also urban environments ‘civilization’ 43 classic hunter-gatherer studies 58 climate change 358 climate effects 197, 203–5, 351, 460–1 clover 227 coarse food transformation 223 coastal windbreak systems 471 Cobbett, William 262–3, 284 coercion 376, 396 coevolution 142–4 see also evolution Coke, Thomas 260, 267–9, 275, 278, 282–3 collectivization 10, 313–38 Colombia 300 colonialism 48–9, 66, 76–9, 95, 140 Columbus, Christopher 78 commercial confidentiality 490 common property regimes (CPRs) 45–6 communal agriculture 8–9 etymology 406 extensification 259–60, 283–4 open-field farming 234–5, 237, 244, 246–54 Communist Party 320–1 see also Bolsheviks community language preservation 148 community-supported agriculture (CSA) projects 512–13 comparative studies hunter-gatherers 30–1 hydraulic agriculture 185–7 ‘complete’ conservation technology packages 381–2 complex agroforests 343, 354–6 complex vs. simple hunter-gatherers 48, 52 composting 216 see also manure; wastes
concentration/dispersion of band societies 45, 48 Conference of the Parties (COP), CBD 136 Conferences on Hunting and Gathering Societies (CHAGS) 56–7 confidentiality in biotechnology 490 connectedness 2–3, 110–11, 509–10, 512–13 conquistadores 76–9 consciousness 85 conservation programmes forestry 468–9 genetic resources 161–6 government intervention 1 soil 12, 375–402 water 375–402, 415–16 Conservation Reserve Program 504 Conservation Security Program (CSP) 505 conservation tillage 411 construction activities eco-counties 442–6, 447–53 eco-villages 434–7, 438–40 hydraulic agriculture 168–73, 174–87 nature reserves 469–70 shelterbelt systems 453–73 consultation 395–6, 498–9 Consultative Group on International Agricultural Research (CGIAR) 162, 163 continuous food crop systems 354, 357 contour farming 382, 384, 385–6 ‘contract’ farming 312 control see coercion; political control Convention on Biological Diversity (CBD) 136 Conway, Gordon R. 9–10, 233, 290–307 cooperation 168, 170–2, 471 see also participation COP see Conference of the Parties corn crop rotation 238 leaf blight 164–5 coronary heart disease 117, 120 corvée labour 187 cosmology 46 costs biosafety participation 490 Bushman food 29 see also prices cottage industries 426–7, 431, 445 cotton 483, 488 country food 111–19, 125–6 country life 121–8 see also rural society county-scale integrated farming systems 441–53 courts 244, 247–8, 252 see also legal processes courtyard farming 425–6, 436 CPRs see common property regimes credit schemes 302–3 Cree people 111–12, 115–16, 121, 125, 128 crops ancient Chinese systems 212–13, 216 biotechnology 475–500 conservation programmes 161–6 evolution 159–60
522 Sustainable Agriculture and Food field-centred agriculture 404–12 genetic manipulation 416–17 Green Revolution 290–307, 403–4 innovations 270 latitude relationship 225 meta–land-use systems 354, 356–7 non-chemical protection 412–13 rainfall 225–6 rotation 227–8, 235–6, 238–41, 243, 274–7 Russian collectivization 332 vulnerability 164–5 see also grain crops; plant foods cross-breeding programmes 292–4, 297, 301 cross-disciplinary approaches 347–8 CSA see community-supported agriculture CSP see Conservation Security Program Culley, George 262, 268, 270, 272 cultivation, definition 513–15 cultivation–breeding homestead gardens 425–7 ‘cultural blind spots’ 149–50 cultural diversity 137, 149, 150–3 cultural revolutions 309–10, 323 culture language relationship 86 preserving and restoring 148–9 ‘curse of Babel’ 140–1 czarist Russia 308–9, 316–20 Daly, Richard 4, 41–72 Darwinism 3 Davis Inlet, Labrador 107, 109, 121–2 Davis, Thomas 252 Dazu eco-county 447–53 decision-making capacities 495–6 deconstruction of hunter-gatherers 92 defence structures 177–8, 182–4 Defoe, Daniel 261 deforestation rates 339–40, 344–60 degraded lands ASB consortium 347, 359 eco-villages 432 intensification pathways 342–4 knowledge loss 147 modernization effects 375 population growth 1 United States 378 Yangtze River Basin 462 delayed-return societies 48, 55 demand in open-field farming 252–3 Democratic Republic of Congo 478, 491 demographic factors 23–4, 241–3 see also population density/growth demonstration sites, IFS 446 Deng kou Bureau 456–7 density of population see population density deoxyribonucleic acid (DNA) 476 depression 120 designing eco-villages 434 despotism 168–96 developing countries 111, 290–307, 490 see also individual countries; resource-poor regions
development agencies 393–6 development framework of ASB 346, 348 development of rural society 1–2, 468 diabetes 117, 128 dialogue 502–3, 505–7, 512–13, 514–15 see also participation dichotomies 90–7 diet selectivity 21–3 diffusion of innovations 260–1, 267–8, 270, 284 direct incentives 220 diseases crops 282–3, 303, 412–13 Kung Bushmen 27 physical activity 120 sedentarization consequences 117, 128 dispersion/concentration of band societies 45, 48 dissemination activities 446, 491–2, 499–500 divergence of hunter-gatherers 48–9 diversity biocultural 136–7 biological 137–42, 149–53, 339–40, 358–9 cultural 137, 149–53 developing countries 490 genetic resources 6, 159–60, 164, 166 linguistic 137–42, 149–53 technology adaptation 259, 269 division of labour 168–73, 323–4 DNA discovery 476 Dobe area, Botswana 18, 28–9 see also Kung Bushmen DOMAIN potential mapping 350–1 domestication 159, 241–8 drainage experiments 282 drills for sowing 277–8 drinking water 174–5, 182–3, 229 droughts 28–9 ducks 216, 217, 448–9 Dust Bowl disaster 11, 378 dwarf crop varieties 290, 294–5, 297, 301, 305 dyke-pond system 214–15, 217 dynamic hunter-gatherer interactions 50 Eastern coast region, China 451 eating, act of 509 Eaton, Stanley 65 eco-agriculture models 448–9 eco-counties 441–53 ecological benefits of IFS 440–1, 450 Ecological Demonstrative Rebuilding for Sustainable Settlements (EDRSS) 431 ecologies hunter-gatherers 53–4, 58–9 linguistic 141–2 open-field farming 235–7, 241–4, 248, 251–3 see also agro-ecological farming systems economics benefits of IFS 440–1, 450 deforestation rates 344, 347, 358–61 farm survival rates 504–5 open-field farming 237, 241–4, 248–9, 251– 3 see also fundraising
Index 523 ecosystem homestead gardens 423–31, 440 ecotourism 127 eco-villages 431–40 Edmonton, Canada 81–2 EDRSS see Ecological Demonstrative Rebuilding for Sustainable Settlements education 145, 147, 330, 437, 470, 499–500 see also schooling egalitarianism 45 Egypt 169–71, 174, 176, 180, 184–6, 300 El Niño events 363 electricity 316 embryo transfer 478–82 employment 108, 110, 124, 126 see also labour; working life emptying of agriculture argument 507–8, 509 enclosure 8–9, 235–6, 245–6, 248–52, 259, 270, 283–4 endemic languages 142–3 Endicott, Karen 64 energy analyses 427–8 energy content of food 112–14 see also calorific returns energy expenditure of Innu 122–3 energy integration systems 427 engineering 311–12 see also genetic engineering England 175, 233–57 see also Britain Enlightenment 1–2, 308 environment benefits of hunting lifestyle 107–35 degradation 147 language link 142–4 preserving and restoring 148–9 protecting with afforestation 465–8 Yangtze River problems 462–8 environmental sustainability studies 347, 358– 61 equation revisions 412–17 equipment for farming 197–8, 199, 204 see also mechanization; technologies equity 235, 237–8, 241–4, 247–8, 251–3 erosion of soil 11–12, 377–80, 385–7, 463 Eskimos 30 see also Inuit people estate management 252 ethics 59–60, 235 Ethiopia 383–4 ethnic conflicts 141 ethnobotanical knowledge loss 145–7 Ethnographic Atlas 30–1, 37–8 ethos of foragers 46–7 etymology of agriculture 404–7 Eurasia see North Eurasia Europe 78, 94, 119–20, 174–6, 184–6, 222 see also colonialism; individual countries evolution crops 159–60 human 3 language 86–8 exercise see physical activity transition
experimentation attitudes to 271–2 crop rotation 274–7 drainage 282 handtools 282 irrigation farming 281–2 livestock breeding and management 278– 81 pest control 282–3 prizes for 267 resource-poor regions 258 soil fertility 272–4 Soviet-American farming 314 sowing techniques 277–8, 280 sustainability lessons 284 see also innovation exported foods 510 extension practices 258–89, 378–9 external reviews, ASB 364 ‘extinction of experience’ 144–5 extinctions 136–7, 139–40 see also loss Ezekial, Mordecai 313 fairs 267–8 fallows crop rotation 238, 240–1, 243 definition 341 field-centred agriculture 408 intensification pathways 342 meta–land-use systems 354, 356–7 family planning in China 424 famine, Russian 324 Fan Sheng Zhi Shu (Chinese text) 211, 213 FAO see Food and Agriculture Organization Far East 222–9, 424 see also China; Japan farm acquisition 197–207 farmer-to-farmer extension 261–8 farmer/hunter-gatherer dichotomy 94–7 farmers’ groups 266–7 farming charts 214–15 farmland shelterbelt system 472 fat content of food 112–13, 115, 116–17 feedback, ASB 362–4 feminist anthropology 54 fermentation technology 475, 478–82 Fernandes, Erick 12, 403–22 fertilization techniques eco-counties 446 eco-villages 435–6 experimental 272–4 Far East 222, 226–9 Green Revolution 293–5, 303–5 non-chemical approaches 413–15 feudal system 184, 186–7, 302–3, 322–9 field anthropology 51, 52 field-centred agriculture 404–12 Field to Family project, PFI 512–13 field reeves 242 figs 201 film resources 218
524 Sustainable Agriculture and Food fish/fisheries/fishing ancient China 214–15, 217 eco-agriculture models 448–9 etymology 405 hunter-gatherers 30–2, 37–8 Innu diets 112–14 Fitzgerald, Deborah 312, 313–14 flood control 169–70 Flora (Roman god) 202 flowers 201 Food and Agriculture Organization (FAO) 161–3 food aid providers 494, 495–6 food crop–fallow systems 354, 356–7 see also rotation of crops food policies 125–6 see also policies food production see productivity food relief providers 494, 495–6 foodshed thinking 512–13 foragers 41–72 see also hunter-gatherers Ford Foundation 296 forests 162, 209–10, 339–71, 453–73 see also afforestation; trees fortress construction 177–8, 183–4 ‘forty centuries’ farmers 222–9 forums 363–4 Four Course rotation pattern 275 Fowler, Catherine 64 Frankel, Sir Otto 163 French wars, 1793–1813 244, 250 Frere, John 51 Friedland, William 508 Friedmann, Harriet 513–14 fruit 201, 332, 424, 426, 448–9 see also individual fruits functional analysis 358–9 functional participation 395 fundraising 470 see also economics gardens 212, 271, 405, 423–31, 440, 513–14 gathering 29, 31 see also hunter-gatherers GE see genetic engineering gender issues 48, 54 see also women ‘gene centres’ see ‘centres of diversity’ generational biotechnology 475–6 genetic diversity 6, 159–60, 164, 166 genetic engineering (GE) 477, 484–7, 496 genetic manipulation 416–17 genetic modification (GM) 13, 478–83, 488–96, 498–500 genetic resources 159–67, 277, 279, 403–4, 475 genetic variability 159 geographical factors 142–3, 234–5 The George beer parlour 81–2 germ plasm 163, 164 ‘get-along-but-don’t-go-along’ approach 501–3, 505 ‘giving’ environment 46
global organizations 349, 363–4 global trends, GM foods 483 globalization 140–1, 512 GM see genetic modification gods (Roman) 202–3 government extension agencies 268 government interventions 1, 302–3 government management of agriculture 173, 181, 185–7 government support/incentives 219–20 Gowdy, John 64 graded bunds 384 grain crops Green Revolution 301–2 open-field farming 238–9, 241–3, 250–1 Russian collectivization 318–20, 321–2, 329, 332 see also individual grain crops grammar use 87–8, 90 Grand Shandu Eco-village System (GSES) 433–8 grapes 201 grasslands 243–6, 250–2, 274–5, 354, 357, 458–9 Great Wall of China 178, 181 Greek agriculture 175, 178, 184, 186 Green Revolution 9–10, 12, 290–307, 403–4 Greenland 125 group-based conservation programmes 393–4 GSES see Grand Shandu Eco-village System Guenther, Mathias 65 Gujarat 381, 392–3 gully fields 390 Haiti 382 Hampshire Custom system 279–80 Han Dynasty, China 211, 213 Handbook of North American Indians 55 handtool experiments 282 hard-wired language faculty 87–9 Harlan, Jack R. 6, 159–67 harmonization of policies 497 HAS see Highland and Agriculture Society health benefits of hunting lifestyle 107–35 health problems 116–18, 120, 511 heart disease 117, 120 heavy water works/industry 172–3 hedgerows 382 Hegel, Georg Wilhelm Friedrich 77–8 Hendrickson, John 511–12 Henriksen, G. 121–2 herders 96 high modernism 308–10, 313, 315, 317, 321–32 Highland and Agriculture Society (HAS) 266–7 highways see roads hill farming 204–5 Hill, Forrest 296 Hitchcock, Robert 62, 66 Hobbes, Thomas 42, 78 holistic approach to language 148, 151, 153 homestead gardens 423–31, 440 Homo erectus 86 Homo sapiens 87 Honduras 388, 391–2
Index 525 horticulture 405 see also gardens household units 218–19, 359–60, 423–31 Huang-Huai-Hai plain region, China 451–2 human–environment coevolution 142–4 human potential for diversity 149 human rights 66 humid tropics see tropical regions hunger in United States 510–11 Hunter, Thomas 73–5 hunter-gatherers 3–4, 6, 17–39, 41–72, 95–100 conferences 56–7 dichotomies 91–7 divergences 48–9 historical significance 49–50, 59 land claims 79–81 language 89–90, 96, 99–100 nature relationship 84 research developments 55–6 samples 30–1, 34–5 Spanish colonialism 76–9 studies 50–5, 58–60 see also hunting Hunter’s Support programme 125–6, 129 hunting 29, 31–3, 74, 107–35 see also hunter-gatherers hybrid crops 292–3, 300, 301 hybrid production methods 417–18 hydraulic agriculture 6, 168–96 hydroagriculture 168, 169 hydroelectric generating projects 119 hydrological works 460 Iakovlev, A. 323 IFS see integrated farming systems immediate-return societies 48, 55 impact assessments ASB consortium 362–4 soil and water conservation 387–9 Imperata cylindrica grasslands 357 imported foods 509, 510 INAC see Indian and Northern Affairs Canada Incas 79 incentives integrated farming system 219–20 participation for 395–6 technology adoption 269–70 Inclosure Acts 8–9 see also enclosure; parliamentary enclosures independent biotechnology bodies 499 India Green Revolution 296, 298–302, 305 hydraulic agriculture 169–70, 175, 178–80, 184 soil and water conservation 377, 380–1, 384, 388, 390 Indian Act 107 Indian and Northern Affairs Canada (INAC) survey 116, 118 indigenist perspective 59–60 indigenous peoples biological diversity 136–7, 151, 153 CHAGS conferences 57
human rights 66 land connections 110–11 languages at risk 137–41 soil and water conservation 389–90 tropical forests 343–4 see also hunter-gatherers; individual indigenous groups indirect incentives 220 Indonesia 300, 302–3, 350–7, 363 industry/industrial society 42 20th century 233–4 activity transition 119–20 collectivization 321, 323, 329–30 heavy industry 172–3 hydraulic agriculture 185–7 nutrition transition 111, 116 pollution 118–19 Soviet-American farming 311–15 ‘inextricable links’ cultural and biological diversity 137 language and environment 142–4 linguistic and biological diversity 151–3 information dissemination 491–2, 499–500 see also dissemination activities Ingold, Tim 47, 58, 64 innovation 260–1, 267–70, 284, 305, 342, 391–3 see also experimentation Innu people 4–5, 75–6, 107–35 see also Inuit people inorganic fertilizers 413, 415 INRM see integrated natural resource management institutions ASB consortium 348–9, 363 high modernism 308, 329–32 innovation 342 meaning in hydraulic construction 184–5 soil and water conservation 393–4 integrated farming systems (IFS) 423–74 China 12–13, 208–17 eco-counties 441–53 eco-villages 431–40 homestead gardens 423–31, 440 modern development 217–20 shelterbelt systems 453–73 integrated natural resource management (INRM) 348, 351–64 integrated pest management (IPM) 412–13 integration of hydraulic agriculture 171 intensification of agriculture 259, 274–5, 283–4, 342–4, 416 intensification pathways 342–4 intensive tree–crop systems 354, 356 interactive participation 395–6 intercropping systems 216, 218 international conservation programmes 161–3 international consortiums 340, 345–71 international cooperation 471 International Rice Research Institute (IRRI) 294, 296–7 International Society of Ethnobiology 151 interpersonal violence 48
526 Sustainable Agriculture and Food Inuit people 73–5, 79–81, 87, 89–90, 99, 114–16 see also Eskimos; Innu people Inuktitut language 87, 89 Iowa state, US 13, 501–16 IPM see integrated pest management IR8 rice variety 297, 300, 301–2 Ireland 93 iron deficiency 112 IRRI see International Rice Research Institute irrigation techniques 169, 182–3, 281–2, 304–5, 415–16, 445–6 see also hydraulic agriculture Islamic architecture 184 isuma notion (Inuit) 89–90 Izmir Centre 161–2 Jackson, Wes 233–4 Japan 166, 222–9, 290, 292, 294, 305 Johnson, Samuel 261–2 Johnson, Sherman 313 journals 264–6 junk food 114, 116 see also store food Jupiter (Roman god) 202 Kalahari desert 17, 49 Kelly, Robert L. 49, 58 Kenya 379–80, 382, 385–6, 388 Khoisan languages 88 Khomani San people 98–9 King, F.H. 8, 177, 222–9 kinship models 53 kitchen gardens 271 Kloppenburg, Jack 511–12 knowledge ASB consortium 345–6 experimentation 271 ‘extinction of experience’ 144–5 integrated farming system 217–18 language/environment coevolution 142–4 loss 145–7 soil and water conservation 389–90 kolkhoz (collective farms) 315–16, 323–5 Korea 222–9 kultura 310 Kung Bushmen 17–39 kwashiorkor 27 labour collectivization 323–7 division of 168–73, 323–4 handtool experiments 282 heavy water works/industry 172–3 monoculture 410 power over 187 roads 180 Roman agriculture 198, 199–200 technology adoption 270 temples 181–2 see also employment; working life labouring animals see animal systems/farming Labrador Innu 107–35
land appropriation 75–6, 77, 317–18 see also appropriation land claims 79–81, 98, 99 land connectivity 110–11 Land Decree, Russia 317, 320 land degradation see degraded lands land husbandry 396–7 land preservation/restoration 148–9 land races 160 land tenancy systems 210 land use intensification pathways 342–4 meta systems 352–7 tropical forests 340–5 landscapes 144, 407 language 83–91, 96, 99–100 biosafety participation 493, 500 environment link 142–4 loss 5, 140 preserving and restoring 148–9 resource for nature 136–55 society relationship 80–1 language shift 139 large-scale hydraulic operations 169–70, 177–82 Las Casas, Bartolomé de 77 Latin America ASB benchmark sites 349–50, 352–7 deforestation rates 339, 344–5 Green Revolution 298, 300, 305 see also Central America; individual countries; South America latitude crop systems 225 subsistence relationship 31–2 Leach, Edmund 91, 92 leadership 45, 171–3, 181, 185–7 see also management systems leases 269 Lee, Richard B. 3–4, 17–39, 41–72 legal processes 79–81, 469, 494, 498 see also courts legibility of high modernism 325, 330–1 legumes 227–8 leisure time 24–7, 30 Lenin, Vladimir Ilyich 308–9, 316–18, 320–1, 327, 329 Lesotho 383, 385, 388, 478, 484, 491 Lévi-Strauss, Claude 52, 53, 91, 92 Li Wenhua 7–8, 12–13, 208–21, 423–74 Liebig’s ‘Law of the Minimum’ 240 life expectancy of hunter-gatherers 23–4 linguistic diversity 137–42, 149, 150–3 see also language linguistic ecologies 141–2 linguistically anthropogenic landscapes 144 links see ‘inextricable links’ Lisle, Edward 265 Liuminying eco-village 431, 438–41 livestock farming 278–81, 405–6 see also animal systems/farming; pastoral farming local courts 244, 247–8, 252 local foods 126, 512–13
Index 527 local institutions 393–4 local practices extinction of experience 144–5 maintenance failures 383–5 modernization effects 376 soil and water conservation 380, 389–90 Loess Plateau region, China 451 loss knowledge 145–7 languages 5, 140 see also extinction... lowland farming 204–5 ‘lowtech’ methods 403–4 Lu Shi Chun Qiu (Chinese text) 211 Lunacharsky, Anatoly 310 Lysenko, T.D. 165 Madagascar 416 Maffi, Luisa 5, 136–55 magazines 264–6 maintenance efficiency 224–5, 229 maintenance failures 383–5 maize crops 163, 292–3, 298–300 Malawi biotechnology 477, 479, 484, 491, 494, 499 soil and water conservation 383, 386, 388 Malinowski, Bronislaw 52 mammal hunting 30–1 see also hunting ‘Man the Hunter’ conference 53–4, 57 management systems 173, 181, 185–7, 469–71 see also leadership manipulative participation 394–5 Manitoba, Canada 115–16 manorial courts 244, 247–8, 252 manure 227, 229, 272–3, 406 see also composting marginal peoples 17, 140–1, 340–5 see also minority languages marker-assisted selection 478–82 market economy effects 249 Marshall, William 262 martial law 320 Martini, M.L. 160–1 mathematics 174 Mauritius 477, 479, 485, 491 meadow agriculture 201 meaning in postmodernism 92 meat foods 23, 27–33, 74, 112–16 see also animal systems/farming mechanization 410–12 see also equipment for farming; technologies media 264–6, 500 medical services 109 Medieval Europe 174–6, 184–6 megadiversity countries 142–3 Mensius 210 mental health 118, 120, 124 mercantilist Europe 185–6 mercury poisoning 119 Meso-America 169–70, 175, 178, 179–82 Mesopotamia 169–70, 172, 174
meta–land-use systems 352–7 methane 358 mētis 10 Mexico ASB benchmark sites 350, 352–7 Green Revolution 292–5, 297–8, 301, 305 hydraulic agriculture 169–70, 178, 180, 181–2 soil and water conservation 386, 390 midland counties, England 234–57 migration effects 344–6 mill equipment 199 millets 225–6 ‘mind’ 73–106 Ming Dynasty, China 209, 215–17 miniaturization 310 mining activities 185–6 minority languages 137–41 see also marginal peoples mirs see village communities mixed cropping 277 Mnyulwa, Doreen 13, 475–500 mobility 45, 108 modernism 308–11, 313, 315, 317, 321–32 modernization 1–3, 11–13, 375–81 molecular diagnostics/markers 478–82 Mongolian races 222, 229 see also Far East mongongo nuts 21 monoculture 409–11 monologue of agriculture 502–3, 505, 510 monsoon effects 299 Montana Farming Corporation 312, 313 monumental style 183–4 moose-hunting 74 Morphy, Howard 65 Moseley, Rev. 272 Moser, Virginia 514 Moses, Thomas 273–4 mother-tongue speakers 138–9 mountain farming 197, 204–5 Mozambique 479, 485, 491 Mugwagwa, Julius 13, 475–500 Mukibat technique 416–17 mulberry 212–16, 448 Müller, Max 84 multi-channel fundraising 470 multi-component systems 212, 214 multi-dimensional cultivation 426 multidisciplinary approaches 345, 346 multi-functional agriculture 505 multilingualism 141–2 multi-planting systems 211 multiple cropping 277 music 82 mythology 46–7, 83, 85, 90–1, 202–3 Nambikwara people 91 Namibia 480, 485, 491 national biosafety frameworks (NBFs) 488 national conservation programmes 163–5 national institutions 363
528 Sustainable Agriculture and Food national policies 497 see also policies nationwide technology adoption 270 Native Americans 377, 378–9 see also individual groups nature animal systems 83–4 language as resource for 136–55 modernization interactions 1–3 see also conservation programmes nature reserves 469–70 Navajo people 378–9 navigation canals 175–7, 182–3 NBFs see national biosafety frameworks NEP see New Economic Policy Netsilik Eskimos 30 New Economic Policy (NEP), Russia 321 New Guinea 141–2 New Institutional Economics approach 253–4 New Stone Age 209, 210 Newfoundland, Canada 126 newspapers 264–6 NGOs see non-government organizations Niger 384, 389 ‘nine squares’ land tenancy system 210 nitrogen-fixing techniques 236, 240–1, 478– 82 nitrous oxide 358 no-till systems 411 nomadic life see hunter-gatherers; hunting non-agrarian hydraulic works 174–85 non-chemical approaches crop/animal protection 412–13 soil fertilization 413–15 non-government organizations (NGOs) 345, 346, 349 Nong Zheng Quan Shu (Chinese text) 215– 16 Norfolk Four Course rotation 275 North America colonialism 77 hunter-gatherers 23, 31–2, 35, 37–8, 42, 44, 55, 61, 96 see also Canada; United States North Eurasia 61–2 North-Western region, China 452 Nunavut territory, Canada 99 nutrient balance in households 427, 429 nutrition transition 110–19 nutritional content of food 112–15 obesity epidemic 116–18, 511 observational studies 50–1 obsolescence of agriculture argument 507–9 Occidental absolutism 186 Office of Special Studies 292 Ojibwa people 119 Old World hunter-gatherers 31, 36–7 older Bushmen 24 olives 199, 200–1 ongoing biotechnology consultation 499 open days 267–8
open-field farming 8–9, 233–57 breakdown of system 248–52 domestic forces 241–8 experience of 238–41 intensification 259 simplified sustainability model 235–8 technology adoption 269–70 transformations 244–8 optimal foraging 55 oral traditions 145 organic fertilizers 413, 415 organic food 511 ‘organized society’ land claim test 80–1 Oriental despotism 168–96 Outpost programme (Innu) 126–7, 129 output values, eco-villages 435 overseers (Roman) 198, 199–200 packages conservation technology 381–2 rice farming 297–8 paddy fields 214, 448 see also rice Pakistan 299–302, 305, 390 palace construction 180–1, 182–5 parliamentary enclosures 236 see also Inclosure Acts participation biotechnology 488–95, 498–9 Practical Farmers of Iowa 507 soil and water conservation 384–5, 387–96 typology 394–6 passive participation 394–6 pastoral farming Africa 94 England 241, 243–7, 249–52 field-centred agriculture 406 meta–land-use systems 354, 357 tropical forests 341 see also animal systems/farming; livestock farming pathogens in land races 160 Paulownia intercropping system 218 peasantry, Russia 317–29 pease fields 239–41 Pell, Alice 403–22 Penashue, Elisabeth 75–6 Penashue, Kanikuen 109 Penashue, Mary Adele 112 perennials 405, 408 Persia 178 Peru 176, 178, 185–6, 349, 351 pest control 216–17, 282–3, 303, 412–13 Peterson, Nicolas 59–60, 63 PFI see Practical Farmers of Iowa PFTs see plant functional types phenomenological rupture 503–4 Philip, King of Spain 77 Philippines 294, 296–8, 302–3, 305, 350–7, 389 philosophy, Chinese 208–17 photoperiod-insensitive crops 297
Index 529 physical activity transition 119–28 see also sedentarization Piaroa Indians, Venezuela 145–7 pig pen systems 427, 429 Pinker, Steven 88–90 plains regions, China 451–2, 472 planning activities Grand Shandu Eco-village System 434 Russian collectivization 322–4 plant foods 21–3, 33, 159–67, 358–9, 414–15 see also crops; vegetable foods plant functional types (PFTs) 358–9 planting activities ancient China 211 eco-agriculture models 449 Roman agriculture 198–9, 200–1 seasonal cycle 407 spatial dimensions 409 plastic shed systems 427, 429 ploughs 200, 405, 409 polarization of farming 506–7 policies ASB consortium 347, 361–3 genetic modification 488–94 harmonizing national/regional 497 Innu people 124–9 integrated farming system 218–19 political control 316 political leadership 171–2, 181 pollution 118–19, 436–7 polyculture systems 410–11 population density/growth China 424 deforestation rates 344 Far East 223–5, 424 Green Revolution 290 hunter-gatherers 23 modernization 1 open-field farming 241–2 tropical forests 341–3 positivist science 1–2 postmodernism 92, 376 potato growers 92–4 Potemkin collectives 320 poverty reduction strategies 340 Practical Farmers of Iowa (PFI) 13, 501–7, 512–16 preparatory hydraulic operations 168–70 Pretty, Jules N. 1–13, 107–35, 233, 258–89, 375–402 prices crops 241–3, 250 see also costs primary forests 355 ‘primitive’ agricultural societies 159–60 prizes for experimentation 267 processed foods 111–12, 118 see also store foods processing industries 426–7 see also cottage industries; industry/industrial society procurement 320, 321–2, 324 see also appropriation
productivity eco-counties 445–6 equation revisions 412–17 Green Revolution 290–307, 403–4 hunter-gatherers 29 integrated farming system 218–19 modernization 1 new opportunities 417–18 professional surveyors 264 profitability land-use intensification pathways 342–3 Roman agriculture 203 trade-off analysis 360–2 proletariat class, Russia 329, 332 protective forest systems 463–7 see also shelterbelt systems protective hydraulic operations 168–70, 182–3 protein levels in food 27–8, 112–13, 115 public awareness 488–98 public participation 488–95, 498–9 Pueblo Indians 170, 172, 177, 180 pulses 238, 239–40 pyramids 184 Qi Min Yao Shu (Chinese text) 212–13 Qin Dynasty, China 211–13 Qing Dynasty, China 209, 215–17 Qinghai–Tibetan Plateau region, China 453, 459–60 quality of soil and water 436–7 quantitative measures of subsistence 19 Quebec, Canada 107–8, 115–16, 125–8 quotas 324 Radcliffe-Brown, A.R. 52, 53 rainfall agriculture 168–9, 175, 177, 184 rainfall levels, Far East 225–6 Raion commune 322–3 range size, Kung Bushmen 23 RASE see Royal Agricultural Society of England raspberries 332 rational utilization of forests 468–9 RDAs see recommended daily allowances reciprocity 46 recommendations biotechnology awareness 494 shelterbelt systems 472–3 recommended daily allowances (RDAs) 112, 114 recycling 241, 439 reforestation 469 see also afforestation reforms 11–13 regional development 465–8 regional needs/priorities 496 Regional Plant Introduction Stations 164 regional policy harmonization 497 regional trends, GM foods 483 regulations biotechnology research 497 eco-county agricultural structure 444–5 genetic modification 494
530 Sustainable Agriculture and Food research techniques ASB consortium 348, 351–64 biotechnology 476–82, 497 eco-counties 445–6 forestry 470 reservoirs 174–5, 182–3 resource-conserving technologies 387, 392, 397 see also conservation programmes resource management 234, 253–4 resource-poor regions 258–9, 284 see also developing countries responsibility systems, China 219 reviews, ASB consortium 364 revisionist view 49, 59 revolutions see agricultural revolutions; cultural revolutions; Green Revolution rice eco-agriculture models 448–9 Far East 225–6, 227–8 genetic resources 163, 166 Green Revolution 292, 294, 296–8, 300–4 intensification system 416 ridges, conservation programmes 385–6 Riggin, Guy 314 Rio Earth Summit 346 rituals 90–1, 147 rivers 174–6 roads 178–80, 182–3 Robigus (Roman god) 202 Rockefeller Foundation 292, 296 Roman agriculture 175, 178–9, 197–207 root crops 274–5 rotation of crops 227–8, 235–6, 238–41, 243, 274–7 see also food crop–fallow systems Rothamsted Experimental Station 272 Royal Agricultural Society of England (RASE) 267, 272 rubber 355–6 rural society development 1–2, 468 Russia 315–21, 322–9 transformations 375 United States 507–9 see also country life Russia 308–9, 313, 315–38 see also Soviet Union rye crops 238–9 SADC see Southern African Development Community safety systems, biotechnology 477, 483–97 Sahlins, Marshall 42, 44, 54, 64 Saint Petersburg 308–9 Sampson, H.C. 379 Samson, Colin 4–5, 107–35 San peoples 49–50, 98–9 San Yi principle 211–12 Sanchez, Pedro A. 11, 339–71 saturated fats 112–13, 116–17 ‘savage’ hunter-gatherer image 42–3, 51, 78–9
schooling 108, 127–8, 148 see also education science applications ASB impacts 362–3 biosafety participation 490, 493 diversity support 150–3 eco-counties 445–6 experimentation 272 forestry 470 Green Revolution 290–307 integrated farming system 218 Roman agriculture 203–4 scientific management methods 311–13 Scott, James C. 10, 308–38 SCS see Soil Conservation Service seasonal cycle field-centred agriculture 407–8 hydraulic agriculture 173–4 Innu people 127–8 Kung Bushmen 19–20 Roman agriculture 204–5 security of Bushman life 28–9 sedentarization 107–10, 117, 128–9 see also physical activity transition seed drills 277–8 seed storage 164, 165–6, 277 selective breeding 278–9, 478–82 see also breed... selectivity of Bushman diet 21–3 self, sense of 505–6 self-mobilization 394–5 self-sufficient farming 248–9 Sen, A. 238 Sepulveda, Juan Gines de 76–7 serfdom 322–9 sericulture 213 settled societies 119–20, 210, 245 Seychelles 480, 485, 491 Shah, P. 11, 375–402 Shamanism 47, 83–4 Shandu eco-village 433–8 Shang Dynasty, China 210 sharing ethos of hunter-gatherers 46, 60 sheep 200, 279–81 see also pastoral farming shelterbelt systems 453–73 Sheshatshiu, Labrador 107, 109 shifting cultivation 340–1, 342, 344, 345–6 shrubs 455–8 Siberia 44 silk 213, 216, 228 silt traps 390 simple agroforests 354, 356 simple vs. complex hunter-gatherers 48, 52 simplified model of sustainability 235–8 site characterization, ASB 347, 352–7 slash-and-burn cultivation 11, 209–10, 339–71 slavery 76–7, 187, 198, 210 small-scale farming 339–40, 343–5, 417 Smith, Andrew 64 social benefits of IFS 440–1, 450 Social Darwinism 3
Index 531 social disruption of conservation 386–7 social life of foragers 45–6 social organization, collectivization 325–7, 329–30, 331 social pathologies 108–9 societies (agricultural) 266–7 Society for the Encouragement of Arts, Manufactures and Commerce 266–7 society-language relationship 80–1 socioeconomic studies 347, 358–61 soil agronomic sustainability 359 farm acquisition 197, 200–1, 203, 204 rainfall relationship 225 soil conservation 12, 375–402 Soil Conservation Service (SCS) 378–9, 383 soil erosion 11–12, 377–80, 385–7, 463 soil fertility eco-counties 446 eco-villages 435–6 experiments 272–4 Far East 222, 226–9 Green Revolution 293–5, 303–5 non-chemical approaches 413–15 soil quality, eco-villages 436–7 soil volume 408–9 Sollas, William 51 Songnen Plain region, China 451 songs 82 sound range of languages 87 South Africa biotechnology 13, 477, 480, 483, 486, 488, 491, 499 hunter-gatherers 98–9 see also Southern Africa South America hunter-gatherers 31, 34, 36–7, 42, 44, 50, 61, 96 Spanish colonialism 76–9 see also individual countries; Latin America; Meso-America South Asia 44, 62, 380–1 see also Asia; individual countries; South-East Asia South China 452–3 South-East Asia 44, 63, 350–7 see also Asia; individual countries; South Asia South-West China region 452 Southern Africa 13, 475–500 Southern African Development Community (SADC) 476–98 Soviet Union 10, 44, 57, 165–6, 308–38 sovkhoz see state farms sowing method experiments 277–8, 280 Spanish colonialism 76–9 spatial dimensions of agriculture 408–9 specialization 323–4 see also division of labour Spring–Autumn Dynasty, China 208, 210–11 SRI see system of rice intensification stakeholders, definition 489 Stalin, Joseph 315, 317, 321–2
standard of living in Far East 229 standardization of farming 311–12 Standish, Ralph 79 staple foods, definition 407 state farms 313, 315–16, 320 statecraft, Russia 326–30 see also collectivization; government... Stevenson, Steve 511–12 Steward, Julian 52–3 stinting 246–7 Stites, Richard 308, 310 store foods, Innu 111–15, 118, 126 strawberries 448–9 structuralism 53–4, 90–2 Subarctic region 111, 114–15 subsidies 303, 504–5, 510 subsistence Bushmen 17–20, 29–31 definition 31 foragers 45 latitude relationship 31–2 North America 38 Old World/South America 36–7 sugarcane 217 Sui Dynasty, China 176–7, 181 suicides 108, 109, 124 surplus of food 19, 25 surveys 261–4, 268 survival rates of farms 504–6 sustainability definition 233 lessons for 283–4 simplified model 235–8 swamping of agriculture argument 507, 508–9 Swaziland 481, 486, 491 SWOT analysis 494–8 system of rice intensification (SRI) 416 Taiwan 294, 297 take-off points, yield growth 290–2, 299–301, 303–4 Tang Dynasty, China 211–15 Tanzania 383–4, 386–7, 481, 486, 491 Tasady people 65–6 taxation, Russia 319 Taylor, Frederick 311 TC see tissue culture tea cultivation 228–9, 355–6 technocratic soil conservation model 381 technologies 17th-19th century Britain 259–89 adaptations 258–89, 391–3 ancient China 208–17 coercion with 376 Green Revolution 290–307 new opportunities 403–4 resource-poor regions 258–9 rural development 2 soil and water conservation 377–9, 381–2, 387, 389–93, 397 see also biotechnology TEK see Traditional Ecological Knowledge
532 Sustainable Agriculture and Food Tellus (Roman god) 202 temple construction 181–5 tenant rights 269 terracing 377–9, 383–7 Terralingua organization 150–2 Tezcuco 180, 181–2 Thailand 176, 350–1 Thirsk, Joan 270 Thompson, Dick 501 thought language 85–6 theory of 90–2 see also ‘mind’ ‘Three North’ shelterbelt 453–9 Tian Ren He Yi theory 208 time dimension of agriculture 407–8 time keeping 173–4 time management 228 tissue culture (TC) techniques 476, 478–82, 496 Toba people 50 tobacco cultivation 270 tomb construction 180–1, 182–5 topography of farms 197, 204–5 tours, farmers 261–3, 265 Townsend, Charles 260 tractors 410 trade-off analysis 347, 360–2 Traditional Ecological Knowledge (TEK) 64 training 268, 470, 478–82 trance-dances 27 transformations open-field farming 244–8 rural society 375 transitions nutritional 110–19 physical activity 119–23 trees 405, 424–6, 456, 466–7 see also forests Trickster figure 47 Trigger, David 66 tropical regions deforestation rates 339–40 foragers 44 forests 339–47, 350–1, 355–6, 358– 65 South China 452–3 time dimension 407–8 Trudeau, Pierre Elliott 79 Tshikapisk Foundation 110, 127, 129 Tshiskutamashun project 127 Tull, Jethro 260, 265 Tunisia 298–9 Turkestan 169–70 Turner, Michael 9, 233–57 Turner, Nancy 64 twin studies 89 UK see Britain; England unconscious actions 85 UNDP see United Nations Development Programme
United Nations Food and Agriculture Organization 161–3 World Food Program 28 United Nations Development Programme (UNDP) 346 United States (US) biotechnology 493–4 Far East comparisons 222, 225, 226 genetic resource conservation 163–5 industrial farming 311–15 Iowa sustainable cultivation 501–16 soil erosion 11–12 soil and water conservation 377–9, 383–4 see also North America Uphoff, Norman 403–22 urban environments 97, 507–9 see also cities US see United States US Department of Agriculture (USDA) 164, 510 USSR see Russia; Soviet Union utopianism 308, 322 vanishing resources 159–67 variability of genetic resources 159 variation in humans 149 variety of resources, Bushmen 21 Varro, Marcus Terentius 7, 202–7 Vavilov, N.I. 165–6 vegetable foods 19, 27–30, 114, 332, 448–9 see also plant foods Velikie Lukie scheme 323 Venezuela 145–7 Verblud farm 314–15 Verchnyua Troitsa, Russia 325–8 village communities eco-villages 431–40 experimental soil technologies 273 Innu people 108–9, 122–3, 128 open-field farming 237, 248–9, 253 Russian collectivization 319–20, 325–8 vineyards 201 violence 48 visits, farmer-to-farmer 261–3 vitamins 112–14 Vogel, Orville 294 volume of soil 408–9 vulnerability of crops 164–5 wage labour see employment Wang Zheng Nong Shu (Chinese text) 214–15 Ware, Harold 314 warping farmers 281 Warring States period, China 208, 210–11 ‘wasteland’ 251, 283 wastes soil fertilization 222, 229 treatment 436–7 water conservation 375–402, 415–16 heavy water works 172–3 quality in eco-villages 436–7 see also hydraulic agriculture; rainfall...
Index 533 waterbodies 435, 463 waterholes 18 watersheds 407 Weatherford, Jack 43 weeds 240–1 welfare dependency, Innu 108, 110 Wellhausen, Edwin 292, 293 wells 18 West Zhou Dynasty, China 210 wheat collectivization 332 crop rotation 238–9 experimental technology 272–4, 279–80 Green Revolution 290, 293–5, 298–301 industrial farming 314 ‘wild’ resources 2–3 see also country food wildlife programmes 83–4 Wilson, M.L. 313–14 windbreak system, China 471 Wittfogel, Karl 6, 168–96 woad 243 women 25, 27, 48, 54, 123 see also gender issues Woodburn, James 48, 54–5 woody species 425–6 see also trees working life, Bushmen 24–7, 28–9 see also employment; labour World Food Program, United Nations 28 World Trade Organization (WTO) 493
worldview of foragers 46–7 WTO see World Trade Organization Xia Dynasty, China 209, 210 Xi’an eco-village 432 Xu Guangqi 215–16 Yaney, George 317, 320 Yangtze River Basin 459–71 Yaqui people 147 yardland measure 245 yield growth monoculture 410 new opportunities 403 take-off points 290–2, 299–301, 303–4 Yoeme rituals 147 Young, Arthur 240, 249, 260, 267–8 books 265 experimentation 271–2, 275–8, 283 tours 262–3 young people 24, 116 see also children Young’s Farmers’ Kalendar 266 Yuan Dynasty, China 214–15 Yucheng eco-county 442–6 Zambia 477, 481, 487, 492–3 Zhangxi’s household ecosystem 427–8 Zhong Gongfu 218 Zimbabwe 476–7, 482, 487, 492–5, 497, 499– 500
EARTHSCAN REFERENCE COLLECTIONS
Sustainable Agriculture and Food VOLUME II A G R I C U LT U R E A N D THE ENVIRONMENT ––––––––––––––––––– EDITED BY
Jules Pretty
ear t hscan
Sustainable Agriculture and Food Volume II
EARTHSCAN REFERENCE COLLECTION
Sustainable Agriculture and Food Volume II Agriculture and the Environment
Edited by Jules Pretty
London • Sterling, VA
First published by Earthscan in the UK and USA in 2008 Copyright © Jules Pretty, 2008 All rights reserved ISBN-13: 978-1-84407-408-2 Typeset by Composition and Design Services Printed and bound in the UK by Biddles Ltd, King’s Lynn, Norfolk Cover design by Andrew Corbett For a full list of publications please contact: Earthscan 8–12 Camden High Street London, NW1 0JH, UK Tel: +44 (0)20 7387 8558 Fax: +44 (0)20 7387 8998 Email: [email protected] Web: www.earthscan.co.uk 22883 Quicksilver Drive, Sterling, VA 20166-2012, USA Earthscan publishes in association with the International Institute for Environment and Development A catalogue record for this book is available from the British Library Library of Congress Cataloging-in-Publication Data has been applied for
The paper used for this book is FSC-certified and elemental chlorine-free. FSC (the Forest Stewardship Council) is an international network to promote responsible management of the world’s forests.
Contents VOLUME I HISTORY OF AGRICULTURE AND FOOD
List of Acronyms and Abbreviations Overview to Four Volumes: Sustainable Agriculture and Food Editorial introduction to Volume I
Part I 1 2 3 4 5
6 7 8
9
1
Before Agriculture
What Hunters Do for a Living, or, How to Make Out on Scarce Resources R. B. Lee Foragers and Others R. B. Lee and R. Daly Mind H. Brody Environmental and Health Benefits of Hunting Lifestyles and Diets for the Innu of Labrador C. Samson and J. Pretty Language: A Resource for Nature L. Maffi
Part II
xiii xv
17 41 73 107 136
Early Agriculture
Our Vanishing Genetic Resources J. R. Harlan Oriental Despotism K. Wittfogel Marcus Cato on Agriculture Marcus Porcius Cato Marcus Terentius Varro on Agriculture Marcus Terentius Varro Agroecological Farming Systems in China Li Wenhua
159 168 197 202 208
vi Agriculture and the Environment 10 Farmers of Forty Centuries F. H. King
Part III
222
Agricultural Revolutions and Change
11 Agricultural Sustainability and Open-field Farming in England, c 1650–1830 M. Turner, J. Beckett and B. Afton 12 Farmers’ Extension Practice and Technology Adaptation: Agricultural Revolution in 17th–19th-Century Britain J. Pretty 13 Past Successes G. R. Conway 14 Soviet Collectivization, Capitalist Dreams J. C. Scott 15 Alternatives to Slash-and-Burn: Challenges and Approaches of an International Consortium P. A. Sanchez, C. A. Palm, S. A. Vosti, T. P. Tomich and J. Kasyoki
233 258 290 308 339
Part IV Modern Agricultural Reforms 16 Making Soil and Water Conservation Sustainable: From Coercion and Control to Partnerships and Participation J. Pretty and P. Shah 17 Rethinking Agriculture for New Opportunities E. Fernandes, A. Pell and N. Uphoff 18 Integrated Farming Systems at Different Scales Li Wenhua 19 Agricultural Biotechnology in Southern Africa: A Regional Synthesis D. Mnyulwa and J. Mugwagwa 20 Sustaining Cultivation M. Bell Index
375 403 423 475 501 519
Contents vii
VOLUME II AGRICULTURE AND THE ENVIRONMENT
List of Acronyms and Abbreviations Editorial introduction to Volume II
xiii 1
Part I Agricultural Harm to the Environment 1 2 3 4 5
A Fable for Tomorrow R. Carson Reality Cheques J. Pretty External Costs of Agricultural Production in the United States E. M. Tegtmeier and M. D. Duffy From Pesticides to People: Improving Ecosystem Health in the Northern Andes S. Sherwood, D. Cole, C. Crissman and M. Paredes Incidence of Acute Pesticide Poisoning Among Female and Male Cotton Growers in India F. Mancini, A. H. C. van Bruggen, J. L. S. Jiggins, A. C. Ambatipud and H. Murphy
Part II 6
15 22 53 82 97
Agroecology and Sustainability
The Properties of Agroecosytems G. R. Conway 7 Interdependent Social-Ecological Systems and Adaptive Governance for Ecosystem Services C. Folke, J. Colding, P. Olsson and T. Hahn 8 Agroecology and Agroecosystems S. R. Gliessman 9 Ecological Basis for Low-Toxicity Integrated Pest Management (IPM) in Rice and Vegetables K. Gallagher, P. Ooi, T. Mew, E. Borromeo, P. Kenmore and J.-W. Ketelaar 10 The Farm as Natural Habitat D. L. Jackson
119 139 166 178 201
viii Agriculture and the Environment
Part III
Communities and Social Capital
11 Feminism and Environmental Ethics: A Materialist Perspective M. Mellor 12 Gender and Social Capital: The Importance of Gender Differences for the Maturity and Effectiveness of Natural Resource Management Groups O. Westermann, J. Ashby and J. Pretty 13 Social Capital and the Collective Management of Resources J. Pretty 14 Still Going: Recent Debates on the Goldschmidt Hypothesis L. M. Lobao, M. D. Schulman and L. E. Swanson 15 Social Connectedness in Marginal Rural China: The Case of Farmer Innovation Circles in Zhidan, North Shaanxi W. Bin and J. Pretty
217 234 257 263 274
Part IV Ecological Restoration and Design 16 Ecological Design and Education D. W. Orr 17 Multi-function Agricultural Biodiversity: Pest Management and Other Benefits G. M. Gurr, S. D. Wratten amd J. M. Luna 18 Generating Community Change C. B. Flora and J. L. Flora 19 Issues for More Sustainable Soil System Management N. Uphoff, A. S. Ball, E. C. M. Fernandes, H. Herren, O. Husson, C. Palm, J. Pretty, N. Sanginga and J. E. Thies 20 Farming With the Wild: Foreword and Introduction F. Kirschenmann and D. Imhoff Index
293 318 333 357 372 388
Contents ix
VOLUME III
AGRICULTURE AND FOOD SYSTEMS
List of Acronyms and Abbreviations
xiii
Editorial introduction to Volume III
1
Part I The Global Food System 1 2 3 4
5
The Environmental and Social Costs of Improvement J. Pretty The Performance of Low External Input Technology in Agricultural Development: A Summary of Three Case Studies R. Tripp The Politics of Food: An Introduction M. E. Lien The System of Rice Intensification (SRI): A Challenge for Science, and an Opportunity for Farmer Empowerment Towards Sustainable Agriculture A. Mishra, M. Whitten, J. W. Ketelaar and V. M. Salokhe The Struggle to Govern the Commons T. Dietz, E. Ostrom, and P. C. Stern
Part II 6
15 59 75
88 116
Poverty and Hunger
Words and Ideas: Commitment, Continuity and Irreversibility R. Chambers 7 Well-being and Ill-being: The Good and the Bad Life D. Narayan, R. Chambers, M. K. Shah and P. Petesch 8 Who Will Feed China? L. Brown 9 Introduction to Ecoagriculture J. McNeely and S. Scherr 10 Resource-conserving Agriculture Increases Yields in Developing Countries J. Pretty, A. D. Noble, D. Bossio, J. Dixon, R. E. Hine, F. W. T. Penning de Vries and J. I. L. Morison
137 169 190 203 209
x Agriculture and the Environment
Part III
Diet and Health
11 Whole Diets E. Balfour 12 The Nutrition Transition and its Health Implications in Lower-income Countries B. M. Popkin 13 Diet and Health: Diseases and Food T. Lang and M. Heasman 14 Food Politics: How the Food Industry Influences Nutrition and Health M. Nestle 15 Your Trusted Friends E. Schlosser
225 240 270 314 340
Part IV Localized Food Systems 16 Coming in to the Foodshed J. Kloppenburg, J. Hendrickson and G. W. Stevenson 17 Farm Costs and Food Miles: An Assessment of the Full Cost of the UK Weekly Food Basket J. Pretty, A. S. Ball, T. Lang and J. I. L. Morison 18 French Quality and Ecolabelling Schemes: Do They Also Benefit the Environment? G. Nguyen, T. L. Dobbs, S. K. Bertramsen and B. Legagneux 19 The Growth of Urban Agriculture N. Companioni, Y. O. Hernández, E. Páez and C. Murphy 20 The Quest For Ecological Modernization: Re-spacing Rural Development and Agri-food Studies T. Marsden Index
363 375 398 415 431 451
Contents xi
VOLUME IV POLICIES, PROCESSES AND INSTITUTIONS
List of Acronyms and Abbreviations Editorial introduction to Volume IV
xiii 1
Part I Ethics and Systems Thinking 1 2 3 4 5
The Land Ethic A. Leopold Four Principles of Natural Farming M. Fukuoka Knowing Systems and the Environment R. Bawden Agricultural Sustainability: What It Is and What It Is Not P. B. Thompson Learning and Mislearning R. Chambers
Part II
29 34 52 69
Participatory Processes
6
Reversals, Institutions and Change R. Chambers 7 Participatory Learning for Sustainable Agriculture J. Pretty 8 Past, Present and Future J. D. Van der Ploeg 9 Diversifying Rice-based Systems and Empowering Farmers in Bangladesh Using the Farmer Field School Approach M. Barzman and S. Desilles 10 New Meanings for Old Knowledge: The People’s Biodiversity Registers Programme M. Gadgil, P. R. S. Rao, G. Utkarsh, P. Pramod, A. Chhatre and members of the People’s Biodiversity Initiative
Part III
15
93 109 136 184 194
Governance and Education
11 From Extension to Communication for Innovation C. Leeuwis
217
xii Agriculture and the Environment 12 Use of Communication Media in Changing Rice Farmers’ Pest Management in the Mekong Delta, Vietnam K. L. Heong, M. M. Escalada, N. H. Huan and V. Mai 13 Landcare and Livelihoods: The Promotion and Adoption of Conservation Farming Systems in the Philippine Uplands R. A. Cramb and Z. Culaseno 14 Conserving Communities W. Berry 15 Becoming an Agroecologist Through Action Education G. Lieblin, E. Østergaard and C. Francs
236 261 281 290
Part IV Enabling Policies and Institutions for Sustainable Agricultural and Food Systems 16 A New Practice: Facilitating Sustainable Agriculture N. G. Roling and M. A. E. Wagemakers 17 Subsidies in Watershed Development Projects in India: Distortions and Opportunities J. M. Kerr, N. K. Sanghi and G. Sriramappa 18 Agri-environmental Stewardship Schemes and ‘Multifunctionality’ T. L. Dobbs and J. Pretty 19 Ways Forward? Technical Choices, Intervention Strategies and Policy Options C. Toulmin and I. Scoones 20 Social Visions of Future Sustainable Societies P. Benjamin, J. X. Kasperson, R. E. Kasperson, J. L. Emel and D. E. Rocheleau Index
303 321 337 356 393
430
List of Acronyms and Abbreviations
ABE/GED AAD ACORN APCSA
Adult Basic Education/General Education Development Agro-ecosystem Analysis and Development Association of Community Organizations for Reform Now Ecuadorian Association for the Protection of Crops and Animal Health (now Crop Life Ecuador) BMDC Blue Mound Development Corporation BMSC Blue Mound Store Corporation BPH brown planthopper (of rice) BSE bovine spongiform encephalopathy CAFO concentrated animal feeding operation CAP Common Agricultural Policy (EC) CAS Chinese Academy of Sciences CAST Council for Agricultural Science and Technology CDC Centers for Disease Control and Prevention CDC Community Development Corporation CGIAR Consultative Group on International Agricultural Research CIAT Cantro Internacional de Agricultura Tropical CIP International Potato Center CJD Creutzfeld–Jakob Disease CRP Conservation Reserve Program EA Environment Agency (UK) EEC European Economic Commission ERS Economic Research Service EU-FAO IPM European Union-Food and Agriculture Organisation Integrated Pest Management EU European Union FAO Food and Agriculture Organization (UN) FEMA Federal Emergency Management Agency FFS Farmer Field School FIC farmer innovation circles FSIS Food Safety and Inspection Service HACCP Hazard Analysis and Critical Control Point HCN household communication networks HIC household innovation capacity ICRISAT International Crops Research Institute for the Semi-Arid Tropics
xiv Agriculture and the Environment
IESWTR INIAP IPM IPPM IRRI JFM KFTC LDC LSD LSP MRL NAO NGO NRM OP OPM OTA PPE RCCI RHTs S&S SDWA SESA SOCM SRI SUP TOA ToF UN USACE USDA WED WHO WTAC WTP
Interim Enhanced Surface Water Treatment Rule National Institute of Agricultural Research from Ecuador Integrated Pest Management Integrated Production and Pest Management International Rice Research Institute joint forest management Kentuckians for the Commonwealth less developed country least significant difference Land Stewardship Project maximum residue levels National Audit Office non-governmental organization natural resource management organophosphate organic pest management Office of Technology Assessment personal protective equipment Rural Community College Initiative resource and habitat taboos signs and symptoms Safe Drinking Water Act Ecuadorian Plant and Animal Health Service Save Our Cumberland Mountains System of Rice Intensification safe use of pesticides Trade-off Analysis Training of Facilitators United Nations US Army Corps of Engineers US Department of Agriculture Women, Environment and Development World Health Organization willingness to accept compensation willingness to pay
Editorial Introduction to Volume II Jules Pretty
The Real Costs When we buy or bake our daily bread, do we ever wonder about how much it really costs? We like it when our food is cheap, and complain when prices rise. Indeed, riots over food prices date back at least to Roman times. Governments have long since intervened to keep food cheap in the shops, and tell consumers that policies designed to do exactly this are succeeding. In most industrialized countries, the proportion of the average household budget spent on food has been declining in recent decades. Food is getting cheaper relative to other goods, and many believe that this must benefit everyone as all need to eat food. Food is not cheap. It only appears cheap in the shop because consumers are not encouraged to think of the hidden costs of damage caused to the environment and human health by certain systems of agricultural production. Thus consumers actually pay three times for their food. Once at the till in the shop, a second time through taxes that are used to subsidize farmers or support agricultural development, and a third time to clean up the environmental and health side effects. Food looks cheap because these costs are only accounted for elsewhere in the economy. The real costs are thus not internalized in prices. On the cheapness of food, Donald Worster recognized this in his The Wealth of Nature (1994): ‘the farm experts merely assume, on the basis of marketplace behaviour, that the public wants cheapness above all else. Cheapness, of course, is supposed to require abundance, and abundance is supposed to come from greater economies of scale, more concentrated economic organisation, and more industrialised methods. The entire basis for that assumption collapses if the marketplace is a poor or imperfect reflector of what people want.’ This is not to say that prices in the shop should necessarily rise, as this would penalize the poor over the wealthy. Using taxes to raise money to support agricultural development is also potentially progressive, as the rich pay proportionally more in taxes, and the poor, who spend proportionally more of their budget on food, benefit if prices stay low. But this idea of fairness falters when set against the massive distortions brought about by modern agricultural systems that additionally
2 Agriculture and the Environment
impose large environmental and health costs throughout economies. Other people and institutions pay for these costs, and this is both unfair and inefficient. If it were possible to add up the real costs of producing food, we would find that modern industrialized systems of production perform poorly in comparison with sustainable systems. This is because we permit cost-shifting – the costs of ill health, lost biodiversity and water pollution are transferred away from farmers, and so not paid by those producing the food nor included in the price of the products sold. Until recently, though, we have lacked the methods to put a price on these side effects. When we conceive of agriculture as more than simply a food factory, indeed as a multifunctional activity with many side effects, then the idea that farmers do only one thing must change. Of course, it was not always like this. It is modern agriculture that has brought a narrow view of farming. The rural environment suffers as environmental services are affected, the food we eat is as likely to do as much harm as good, and we still think food is cheap. The external costs and benefits of agriculture raise important policy questions. In particular, should farmers receive public support for the public benefits (environmental and health services) they produce in addition to food? Should those that pollute have to pay for restoring the environment and human health? These two principles are called ‘the provider gets’ and ‘the polluter pays’, and they are important for both industrialized and developing countries. Three categories of policy instruments are available: advisory and institutional measures, regulatory and legal measures, and economic instruments. Effective pollution control and the supply of desired public goods requires a mix of all three approaches, together with integration across sectors. A range of policy reforms could do much to internalize some of these costs and benefits in prices. In practice, as no single solution is likely to suffice, the key issue rests on how policy makers choose an appropriate mix of solutions, how these are integrated, and how farmers, consumers and other stakeholders are involved in the process of reform itself. Attention will therefore need to be paid to the social and institutional processes that both encourage farmers to work and learn together, and result in integrated cross-sectoral partnerships. Policy integration is vital, yet most policies seeking to link agriculture with more environmentally-sensitive management are still highly fragmented. One problem is that many environmental policies have tended only to green the edges of farming. Thus an essentially modernist agriculture remains much as it ever was, but is now light green. Many non-crop habitats have been improved, including hedges, woodlands and wetlands. But the food is still largely produced in a conventional manner. The bigger challenge is to find ways of substantially greening the middle of farming – in the field as well as around the edges. A thriving and sustainable agriculture requires both integrated action by farmers and communities, and integrated action by policy makers and planners. This implies both horizontal integration with better linkages between sectors, and vertical integration with better linkages from the micro to the macro level. Most policy initiatives remain piecemeal, affecting only a small part of farmers’ practices, and so do not yet lead to substantial shifts towards sustainability.
Editorial Introduction to Volume II 3
Part 1: Agricultural Harm to the Environment The first paper is the iconic opening chapter to Rachel Carson’s Silent Spring. It is just two pages in length, and is entitled A Fable for Tomorrow. Written in the early 1960s, and later to influence generations of scientists, consumers and policy makers, it is a story of modern society and the consequences of environmental and social decay. It is told as a fable, which is clever. It does not seek to be analytical or specific to one set of circumstances. The fable generalizes, and so must be inaccurate about certain places. But its very nature captures attention, and shows how Carson was so influential. It starts, ‘there was once a town in the heart of America’, and describes its checkerboard of prosperous farms, with oak and maple and birch, and foxes barking in the hills. Fish swum in the streams that flowed clear and cold out of the hills. But ‘then a strange blight crept over the area, and everything began to change’. Some evil spirit settled on the community, and no one knew why. There was a strange stillness. The birds were silent: ‘it was a spring without voices’. The tragedy is, of course, that ‘the people had done it themselves’ with their adoption of modern agricultural methods. In the second article, an excerpt from the 2002 book, Agri-Culture, Jules Pretty indicates that the real costs of food are much higher than the price paid in the shop. Environmental externalities and the diversion of tax revenue to subsidize agriculture contribute to the real cost. Agriculture, like any economic sector, has both negative and positive side effects, and it is the movement towards a more multifunctional view of agriculture that could result in a better understanding of what contributes to agricultural sustainability. This paper summarizes the first study of the full costs of a national agricultural sector. In the UK, these amounted to some £1.5 billion per year during the 1990s. These external costs are alarming – and should call into question what is meant by efficiency. Increased sustainability in agricultural systems can only happen if these external costs are substantially reduced. In the third paper, Erin Tegtmeier and Michael Duffy analyse the full cost of modern agricultural production in the US. These are of the order of $5.6–16.9 billion per year (in 2002 $), arising from damage to water resources, soils, air, wildlife and biodiversity, and harm to human health. Additional annual costs of $3.7 billion arise from agency costs associated with programmes to address these problems or encourage a transition towards more sustainable systems. Following various partial studies published in the 1990s, this was the first study of the costs of the whole of the agricultural sector in the US. As the authors indicate, ‘many in the US pride themselves on our cheap food. But this study demonstrates that consumers pay for food well beyond the grocery store.’ The fourth article by Steve Sherwood and co-authors is a chapter drawn from the 2005 book, The Pesticide Detox. It focuses on pesticide use and its effects in the highland region of Carchi in the northern Andes. Farmers use a wide range of pesticides, both hazardous and benign, and although local and international businesses indicate that highly toxic products can be used safely, the evidence from the
4 Agriculture and the Environment
ground is different. This study found that poisonings in Carchi are amongst the highest recorded in the world – an annual rate of 171 per 100,000 population for morbidity, and 21 per 100,000 for mortalities. Pesticides were found on family clothing, on food and in children’s bedding. To illustrate these pathways to local people, the researchers added fluorescent dyes to pesticides, and then used UV lights to show their presence. The challenge, now, is to develop new ways of learning about pests and diseases in such rural communities, as well as to develop agricultural practices that reduce dependency on those pesticides that are harmful to humans and the environment. Although some pesticides are known to be harmful to people, there are surprisingly few empirical studies that analyse their effects. At the global level, the World Health Organization (WHO) can only estimate very broadly the number of farmers, families and consumers who might be affected. This paper by Francesca Mancini and colleagues makes an important contribution to knowledge by conducting a season long assessment of acute pesticide poisoning in three villages of Andhra Pradesh in India. An average of 20 pesticide applications are made per season on cotton. Some 323 adverse events were reported amongst both men (who apply the pesticides in the fields) and women (who mix products and refill spray tanks). More than 80 per cent of the events were associated with signs of mild to severe poisoning; and 10 per cent of pesticide application sessions caused three or more neurotoxic symptoms associated with organophosphate products. Although 6 per cent of the spray sessions caused severe neurotoxic effects, no farmers or workers sought medical care. Low income, marginal farmers were more often subjected to severe poisoning than landlords. The paper concludes by indicating that Integrated Pest Management (IPM) methods that reduce the health burden on local people should be pursued.
Part 2: Agroecology and Sustainability Agroecosystems are ecological systems modified by humans to produce food, fibre or other agricultural products. This classic paper by Gordon Conway discusses the boundaries and components of agroecosystems, which can be regarded as true cybernetic systems whose goal is increased social value. Agroecosystems exist in a hierarchy from plant-environment to field, farming system, watershed and so on, and systems theory indicates that the behaviour of higher level systems cannot readily be discovered from a study of lower systems, and vice versa. This paper makes a significant contribution by indicating that agroecosystems have four key properties: productivity, stability, sustainability and equitability. Agricultural development inevitably involves making trade-offs between these properties. The four properties are linked to one another, both within an agroecosystem and between agroecosystems at different levels in a hierarchy. The trade-offs can be seen clearly in the history of agriculture, and this paper describes four key examples: the origins of
Editorial Introduction to Volume II 5
agriculture, involving the domestication of wild cereals to increase stability but not necessarily, at first, to increase productivity; manorial agriculture of the British Middle Ages; modern western agriculture; and the green revolution in Indonesia. The paper ends by suggesting the need for practical analytical tools and development packages that emphasise multidisciplinary approaches, such as agroecosystem analysis. The second article by Carl Folke and colleagues analyses the characteristics of social-ecological systems. They seek to provide a rich understanding of not just human–environment interactions but of how the world we live in actually works and the implications it has for current policies and governance. The chapter emphasizes that the social landscape should be approached as carefully as the ecological in order to clarify features that contribute to the resilience of social-ecological systems. These include vision, leadership and trust; enabling legislation that creates social space for ecosystem management; funds for responding to environmental change and for remedial action; capacity for monitoring and responding to environmental feedback; information flow through social networks; the combination of various sources of information and knowledge; sense-making and arenas of collaborative learning for ecosystem management. Their work illustrates that the interplay between individuals (e.g. leadership, teams, actor groups), the emergence of nested organizational structures, institutional dynamics, and power relations tied together in dynamic social networks are examples of features that seem critical in adaptive governance that allows for ecosystem management and for responding to environmental feedback across scales. They conclude that the existence of transformative capacity is essential in order to create social-ecological systems with the capability to manage ecosystems sustainably for human well-being. Adaptive capacity will be needed to strengthen and sustain such systems in the face of external drivers and events. The third article by Stephen Gliessman is an overview of agroecological approaches to the management of agricultural systems. As he indicates, ‘discussions about sustainable agriculture must go beyond what happens within the fences of any individual farm’. It is the wider environmental, economic and social interactions that are critical. A practising farmer as well distinguished academic, Gliessman draws on a wide range of experience to set out an agroecological perspective to the flows of energy and nutrients in agroecosystems, and identifies the population regulating mechanisms and potential for developing dynamic equilibira. The paper includes a table that summarizes the guiding principles for a process of design of and conversion to sustainable agricultural systems. Comparisons are made between traditional, conventional (or modern) and sustainable systems. This question of redesign is critical if different patterns of agricultural and environmental management are to emerge, patterns that are able to produce both food and important environmental services. In the fourth article, Kevin Gallagher and co-authors describe the ecological and social basis for IPM in rice agroecosystems in Asia. The chapter, drawn from the book The Pesticide Detox, first sets out the specific ecological basis of rice fields,
6 Agriculture and the Environment
and why continued pesticide applications have not resulted in cheap and effective pest control. Pesticides may kill pests in the short term, but they also eliminate natural enemies that exert good ecological control over pests. The idea behind IPM is to put technologies into the hands of farmers and communities, so that they learn to farm with low to zero use of pesticides, yet also do not suffer pest losses. Many tens of thousands of farmer field schools have been held throughout Asia, and these have been highly effective at increasing farmers’ own capabilities and knowledge for ecological management of rice fields. Many countries are now reporting large reductions in pesticide use. In Vietnam, two million farmers have cut pesticide usage from more than three sprays to one per season; in Sri Lanka, 55,000 farmers have reduced usage from three to a half per season; and in Indonesia, one million farmers have cut usage from three sprays to one per season. In no case has reduced pesticide use led to lower rice yields. Amongst these are reports that many farmers are now able to grow rice entirely without pesticides: a quarter of field school trained farmers in Indonesia, a fifth to a third in the Mekong Delta of Vietnam, and three-quarters in parts of the Philippines. In the final article, Dana Jackson of the Land Stewardship Project describes the way that farms can be developed as part of natural habitats. As she says, ‘it’s hard to imagine what it must have looked like when Europeans first settled the midwest, when it was a wilderness with prairie, forest, clean streams and herds of buffalo. Too quickly it became dominated by agriculture.’ The remaining wildlands are preserved and protected in parks and reserves, but that leaves the great majority of land directly shaped by the business of food production. Jackson introduces an alternative vision for this agriculture that is inspired by Aldo Leopold, and which indicates that farming and natural areas should be interspersed, not separated. There are many benefits of thinking differently – the benefits of biodiversity for farming itself, and the effects of more sustainable farming on biodiversity. We must teach, as Jackson says, that ‘the land is one organism’.
Part 3: Communities and Social Capital In the first article, Mary Mellor sets out the case for a deep materialist perspective on feminism and environmental ethics. Unlike some other writers, she does not claim that women have a superior vision, or higher moral authority, but indicates that an ethics that does not take account of the gendered nature of society is doomed to failure, as it will not confront the structure of society and how that structure impacts on the material relationship between humanity and nature. Mellor helpfully summarizes a number of traditions, from feminism and environmental ethics, to eco-feminism, materialist feminism, mediation in human–nature relations, deep materialism, ecological holism, and immanent realism. She argues ‘that the politics of human–nature relations is critical. There is no natural balance in nature, and so any form of sustainable connectedness would need to be created
Editorial Introduction to Volume II 7
through human reason and political action.’ The problem, of course, is how political change can occur. Should it be driven from the top, or does political agency need to come from people and groups who are exploited, marginalized and excluded by the existing social and ecological structures? Mellow indicates that ‘building coalitions and coordinated political action are essential’. The basis for this position is that knowledge about the natural world will always be partial, and so ‘awareness of the radical uncertainty of human immanence should be the starting point of all other knowledge’. Humanity is part of a dynamic iterative ecological process where the whole is always more than the sum of the parts. It is increasingly well-established that social capital is an important factor in building and maintaining collective action, which is in turn fundamental to substantial and long-term changes in natural resource management. Analysis of causal relationships among improved resource management and collective action has hitherto centred on the existence or creation of appropriate institutional and property arrangements, but there is an emerging recognition that relations of trust and common values are important to collective action. In the second paper, Westerman et al contribute to an improved understanding of the gender aspects of social capital manifested in groups for natural resource management. They investigate how gender differentiated social groups differ in their activities and outcomes for natural resource management. Men’s, mixed and women’s groups were analysed in 46 rural programmes in 20 countries of Latin America, Africa and Asia. Significant gender differences were found in relation to group maturity and natural resource management achievements and approaches as well as important differences in experiences of collaboration and capacity to manage conflict. Overall they found that collaboration, solidarity and conflict resolution all increase as women’s presence in groups increases. In addition, norms of reciprocity are more likely to operate in groups where women are present. Similarly, capacity for self-sustaining collective action increased with women’s presence and was significantly higher in the women’s groups. The results demonstrate the importance of gender analysis for collective natural resource management and particularly the role of women for collaboration in and the sustainability of natural resource management groups. In the third article, Jules Pretty sets out the importance of social capital in the collective management of natural resources. The term social capital captures the idea that social bonds and norms are important for people and communities. It emerged as a term following detailed analyses of the effects of social cohesion on regional incomes, civil society and life expectancy. As social capital lowers the transaction costs of working together, it facilitates cooperation. People have the confidence to invest in collective activities, knowing that others will also do so. They are also less likely to engage in unfettered private actions with negative outcomes, such as resource degradation. Four features are important: relations of trust; reciprocity and exchanges; common rules, norms and sanctions; connectedness in networks and groups. Collective resource management programmes that seek to build trust, develop new norms and help form groups have become increasingly common, and are variously described by the terms community-, participatory-,
8 Agriculture and the Environment
joint-, decentralized-, and co-management. They have been effective in several sectors, including watershed, forest, irrigation, pest, wildlife, fishery, farmers’ research, and micro-finance management. Since the early 1990s, some 400,000–500,000 new local groups were established in varying environmental and social contexts, mostly evolving to be of similar small size, typically with 20–30 active members, putting total involvement at some 8–15 million households. The majority show the inclusive characteristics identified as vital for improving community well-being, and evaluations have confirmed that there are positive ecological and economic outcomes, including for watersheds, forests and pest management. A classic study conducted in 1946 by Walter Goldschmidt showed what happens when the social structure in the countryside changes during modernization. He studied the two rural Californian communities of Arvin and Dinuba in the San Joaquin Valley. These were matched for climate, value of agricultural sales, enterprises, reliance on irrigation, and distance from urban areas. The differences were in farm scale: Dinuba was characterized by small family farms and Arvin by large, commercialized farms. There were striking differences between the two communities. In Dinuba, there was a better quality of life, superior public services and facilities, more parks, more shops and retail trade, more diverse businesses, twice the number of organizations for civic improvement and social recreation, and better participation by the public. A study of the same communities in the late 1970s reaffirmed these findings. Recent years have brought severe financial crises for family farmers, as they were squeezed by debt and low prices. Many thousands lost their businesses. Others, though, did not see this as a problem, but as desirable, as small farmers were widely taken to be economically inefficient. But their loss has been a severe loss to rural society. Linda Lobao’s paper shows the importance of the locality that Goldschmidt illustrated. The changing structure of farming has brought about a decline in rural population, increased poverty and income inequality, lower numbers of community services, less democratic participation, decreased retail trade, environmental pollution and greater unemployment. The decline of family farming does not just harm farmers. It hurts the quality of life in the whole of society. Corporate farms are good for productivity, but not much else: ‘this type of farming is very limited in what it can do for a community … we need farms that will be viable in the future, correspond to local needs and remain wedded to the community’. The final paper of this section by Bin Wu and Jules Pretty analyses social connectedness in a marginal rural region of China. Despite remarkable recent achievements, rural poverty still presents significant challenges in China. Poverty is particularly endemic in marginal areas characterized by problems of both poor asset stock (natural, physical and human capital) and the scarcity of capital inflows (e.g. in terms of finance, technology, information and talent). If there is to be a breakthrough for rural development in these marginal areas, then agricultural innovation is widely viewed as a necessary condition. Yet technological innovation is constrained by the difficulties that formal agricultural extension finds in reaching remote and inaccessible areas. This lack of communication and interaction
Editorial Introduction to Volume II 9
between farmers and agricultural professionals constrains the fit between the supply of new technologies and the pressing needs of the rural poor. Hitherto, most attention has been paid to improvement of development assistance and agricultural extension, rather than assessing the development potential of marginal communities themselves. These are dynamic and diverse, with great potential for innovation in both technologies and self-organization. This paper explores the implications of farmer innovation and local self-organization for government and agricultural professionals. The focus is on rural communities of north Shaanxi in China and the phenomenon of ‘farmer innovation circles’. These are informal social systems used by the rural poor for their own technology development and cooperation. The paper explains the theoretical background and analytical framework, then summarizes the features of Zhidan County and methodology used. The distribution of household innovative capacity is then linked to wider innovation circles and household incomes. Overall, the paper shows how innovative capacity is accumulated, and concludes with reflections on the development and policy implications.
Part 4: Ecological Restoration and Design In the first article of this section, David Orr sets out the components and principles of ecological design and education. Ecological designers know one big thing – everything is hitched to everything else. This suggests a need for a blending of nature with human-crafted space, a bringing together of arts, crafts, science and architecture. But this is easy to say, and hard to achieve. We will need to spend more time thinking about how we see the world, and how we learn from it. A number of key principles are set out for a new type of design that recalibrates education with ecology. Nature is not something to be mastered, but a potential tutor and mentor for human actions. But ecological design is deeper than mimicry. It should encourage us to ask what will nature permit us to do? Another key principle is that humans are not infinitely plastic. There are biological and evolutionary constraints that shape our interactions with the world. All design is, of course, inherently political, as it is about both the provision of goods and services, but also the distribution of risks, costs and benefits. Ecological design implies robust economics, an honest assessment of human capabilities, a capacity to understand the lessons of history and past civilizations, and above all offers opportunities of healing. Designers are storytellers that aim to speak to the human spirit, and this is where education must mimic, and tell better stories about the world. In the second article, Geoff Gurr et al indicate that ecological restoration methods must also be technically achievable and socially acceptable and spread over a range of locations. Two key aspects of agricultural biodiversity are analysed: the ways in which agricultural biodiversity may be increased to favour pest management, and the existence of a hierarchy of the types of benefits of increased
10 Agriculture and the Environment
biodiversity. At simple levels, structures in monocultures may be changed with new management practices to benefit natural enemies. At the other extreme, annual and perennial non-crop vegetation may be introduced to affect biodiversity on the farm or even landscape scale. There may be benefits for crop yield and quality, improved sustainability of farms, and broad societal benefits such as for recreation and aesthetics. The potential for ecological restoration of farmland to improve the sustainability of agricultural production whilst conserving biodiversity in farmscapes is high but there is still much to learn, particularly for the most efficient use of agri-environmental schemes to change land use practice. In the third article, Cornelia Butler Flora and Jan Flora, both of Iowa State University, succinctly set out how social capital can be created in post-industrial rural communities. Two processes are occurring: the inside decay, and the incursion from outside as the suburban and disconnected sprawl brings people with different worldviews and values. Those with affluent incomes can ignore investing in social capital, as they can substitute financial capital – yet this simply results in more goods and services being imported from outside and leaves communities struggling. This article indicates that social capital can be horizontal, hierarchical or non-existent – and different patterns define different outcomes for rural communities. Diverse networks that enhance lateral learning can lead to dynamic communities able to develop new and more sustainable models of agriculture. In the mid-1990s, one of the authors of the article by Norman Uphoff et al, speaking to the 15th World Congress of Soil Science, proposed that it was time to move soil science toward a ‘second paradigm’ in order to meet agricultural production needs in the tropics, and indeed in the world more generally. The prevailing paradigm, he noted, focuses primarily on production goals, and little on ecological functions. The new paradigm articulated by Sanchez addressed the particular problems of farmers who are managing marginal lands under a prevailing combination of biophysical and socioeconomic constraints: aluminium toxicity, low nutrient reserves, low water-holding capacity, high phosphorus fixation, steep slopes. For such farmers, the prescriptions of the green revolution, with its reliance on external inputs, were not working. The economic costs and logistical problems involved in procuring fertilizers and agrochemicals were prohibitive, and few of these farmers had access to irrigation, so they were dependent on rainfall with its uncertainties and insufficiencies. External inputs gave little benefit unless the water requirements of the plants and the soil (i.e. the organisms living within it) were met. The emergent ‘second paradigm’ is described in this final chapter of the book Biological Approaches to Sustainable Soil Systems. Its key themes are articulated by Sanchez in this way: ‘Rely more on biological processes by adapting germplasm to adverse soil conditions, enhancing soil biological activity, and optimizing nutrient cycling to minimize external inputs and maximize the efficiency of their use.’ In the final article of this volume, North Dakota farmer Fred Kirshenmann begins by setting out the challenge of farming with the wild. As he says, his relationship with the wild has been fraught with ambiguity. He grew up believing that wildernesses would only exist in enclaves apart from agriculture. Yet this dualistic
Editorial Introduction to Volume II 11
approach to land use is dysfunctional for a variety of reasons. As he says, ‘the environment is constantly being constructed by the organisms (including humans) who live in it’. He goes on to describe the importance of wildness in productive farming, in terms of choice of livestock breeds, habitats for pollinators and crop rotations to eliminate herbicides. In the second part of the article, Dan Imhoff sets out the case for farming with the wild, drawing on a wide range of examples across North America. Industrialized agriculture tends to farm against the wild, and is characterized by huge monoculture fields and massive contained livestock operations. The rethinking needed to farm with the wild is already now beginning to happen – the wild farm pioneers are building alliances and developing new ways to reshape farming and food systems.
References Uphoff, N et al (eds). 2006. Biological Approaches to Sustainable Soil Systems. Taylor and Francis, Boca Raton, FL Worster, D. 1994. The Wealth of Nature: Environmental History and the Ecological Imagination. Oxford University Press, New York
Part I
Agricultural Harm to the Environment
1
A Fable for Tomorrow Rachel Carson
There was once a town in the heart of America where all life seemed to live in harmony with its surroundings. The town lay in the midst of a checkerboard of prosperous farms, with fields of grain and hillsides of orchards where, in spring, white clouds of bloom drifted above the green fields. In autumn, oak and maple and birch set up a blaze of colour that flamed and flickered across a backdrop of pines. Then foxes barked in the hills and deer silently crossed the fields, half hidden in the mists of the autumn mornings. Along the roads, laurel, viburnum and alder, great ferns and wildflowers delighted the traveller’s eye through much of the year. Even in winter the roadsides were places of beauty, where countless birds came to feed on the berries and on the seed heads of the dried weeds rising above the snow. The countryside was, in fact, famous for the abundance and variety of its bird life, and when the flood of migrants was pouring through in spring and autumn people travelled from great distances to observe them. Others came to fish the streams, which flowed clear and cold out of the hills and contained shady pools where trout lay. So it had been from the days many years ago when the first settlers raised their houses, sank their wells and built their barns. Then a strange blight crept over the area and everything began to change. Some evil spell had settled on the community: mysterious maladies swept the flocks of chickens; the cattle and sheep sickened and died. Everywhere was a shadow of death. The farmers spoke of much illness among their families. In the town the doctors had become more and more puzzled by new kinds of sickness appearing among their patients. There had been several sudden and unexplained deaths, not only among adults but even among children, who would be stricken suddenly while at play and die within a few hours. There was a strange stillness. The birds, for example – where had they gone? Many people spoke of them, puzzled and disturbed. The feeding stations in the backyards were deserted. The few birds seen anywhere were moribund; they trem‘A fable for tomorrow’ and ‘The obligation to endure’ from Silent Spring by Rachel Carson. Copyright © 1962 by Rachel L. Carson, renewed 1990 by Roger Christie. Reprinted by permission of Houghton Mifflin Company. All rights reserved. Reproduced by permission of Pollinger Limited and the proprietor.
16 Agricultural Harm to the Environment
bled violently and could not fly. It was a spring without voices. On the mornings that had once throbbed with the dawn chorus of robins, catbirds, doves, jays, wrens and scores of other bird voices there was now no sound; only silence lay over the fields and woods and marsh. On the farms the hens brooded, but no chicks hatched. The farmers complained that they were unable to raise any pigs – the litters were small and the young survived only a few days. The apple trees were coming into bloom but no bees droned among the blossoms, so there was no pollination and there would be no fruit. The roadsides, once so attractive, were now lined with browned and withered vegetation as though swept by fire. These, too, were silent, deserted by all living things. Even the streams were now lifeless. Anglers no longer visited them, for all the fish had died. In the gutters under the eaves and between the shingles of the roofs, a white granular powder still showed a few patches; some weeks before it had fallen like snow upon the roofs and the lawns, the fields and streams. No witchcraft, no enemy action had silenced the rebirth of new life in this stricken world. The people had done it themselves. This town does not actually exist, but it might easily have a thousand counterparts in America or elsewhere in the world. I know of no community that has experienced all the misfortunes I describe. Yet every one of these disasters has actually happened somewhere, and many real communities have already suffered a substantial number of them. A grim spectre has crept upon us almost unnoticed, and this imagined tragedy may easily become a stark reality we all shall know. What has already silenced the voices of spring in countless towns in America? This book is an attempt to explain.
The Obligation to Endure The history of life on earth has been a history of interaction between living things and their surroundings. To a large extent, the physical form and the habits of the Earth’s vegetation and its animal life have been moulded by the environment. Considering the whole span of earthly time, the opposite effect, in which life actually modifies its surroundings, has been relatively slight. Only within the moment of time represented by the present century has one species – man – acquired significant power to alter the nature of his world. During the past quarter century this power has not only increased to one of disturbing magnitude but it has changed in character. The most alarming of all man’s assaults upon the environment is the contamination of air, earth, rivers, and sea with dangerous and even lethal materials. This pollution is for the most part irrecoverable; the chain of evil it initiates not only in the world that must support life but in living tissues is for the most part irreversible. In this now universal contamination of the environment, chemicals are the sinister and little-recognized
A Fable for Tomorrow 17
partners of radiation in changing the very nature of the world – the very nature of its life. Strontium 90, released through nuclear explosions into the air, comes to earth in rain or drifts down as fallout, lodges in soil, enters into the grass or corn or wheat grown there, and in time takes up its abode in the bones of a human being, there to remain until his death. Similarly, chemicals sprayed on croplands or forests or gardens lie long in soil, entering into living organisms, passing from one to another in a chain of poisoning and death. Or they pass mysteriously by underground streams until they emerge and, through the alchemy of air and sunlight, combine into new forms that kill vegetation, sicken cattle, and work unknown harm on those who drink from once-pure wells. As Albert Schweitzer has said, ‘Man can hardly even recognize the devils of his own creation.’ It took hundreds of millions of years to produce the life that now inhabits the earth – aeons of time in which that developing and evolving and diversifying life reached a state of adjustment and balance with its surroundings. The environment, rigorously shaping and directing the life it supported, contained elements that were hostile as well as supporting. Certain rocks gave out dangerous radiation; even within the light of the sun, from which all life draws its energy, there were short-wave radiations with power to injure. Given time – time not in years but in millennia – life adjusts, and a balance has been reached. For time is the essential ingredient; but in the modern world there is no time. The rapidity of change and the speed with which new situations are created follow the impetuous and heedless pace of man rather than the deliberate pace of nature. Radiation is no longer merely the background radiation of rocks, the bombardment of cosmic rays, the ultraviolet of the sun that have existed before there was any life on earth; radiation is now the unnatural creation of man’s tampering with the atom. The chemicals to which life is asked to make its adjustment are no longer merely the calcium and silica and copper and all the rest of the minerals washed out of the rocks and carried in rivers to the sea; they are the synthetic creations of man’s inventive mind, brewed in his laboratories, and having no counterparts in nature. To adjust to these chemicals would require time on the scale that is nature’s; it would require not merely the years of a man’s life but the life of generations. And even this, were it by some miracle possible, would be futile, for the new chemicals come from our laboratories in an endless stream; almost five hundred annually find their way into actual use in the US alone. The figure is staggering and its implications are not easily grasped – five hundred new chemicals to which the bodies of men and animals are required somehow to adapt each year, chemicals totally outside the limits of biologic experience. Among them are many that are used in man’s war against nature. Since the mid 1940s over two hundred basic chemicals have been created for use in killing insects, weeds, rodents and other organisms described in the modern vernacular as ‘pests’; and they are sold under several thousand different brand names. These sprays, dusts and aerosols are now applied almost universally to farms, gardens, forests, and homes – non-selective chemicals that have the power to kill every insect, the ‘good’ and the ‘bad’, to still the song of birds and the leaping of fish
18 Agricultural Harm to the Environment
in the streams, to coat the leaves with a deadly film, and to linger on in soil – all this though the intended target may be only a few weeds or insects. Can anyone believe it is possible to lay down such a barrage of poisons on the surface of the earth without making it unfit for all life? They should not be called ‘insecticides’, but ‘biocides’. The whole process of spraying seems caught up in an endless spiral. Since DDT was released for civilian use, a process of escalation has been going on in which ever more toxic materials must be found. This has happened because insects, in a triumphant vindication of Darwin’s principle of the survival of the fittest, have evolved super races immune to the particular insecticide used, hence a deadlier one has always to be developed – and then a deadlier one than that. It has happened also because, for reasons to be described later, destructive insects often undergo a ‘flareback’, or resurgence, after spraying, in numbers greater than before. Thus the chemical war is never won, and all life is caught in its violent crossfire. Along with the possibility of the extinction of mankind by nuclear war, the central problem of our age has therefore become the contamination of man’s total environment with such substances of incredible potential for harm – substances that accumulate in the tissues of plants and animals and even penetrate the germ cells to shatter or alter the very material of heredity upon which the shape of the future depends. Some would-be architects of our future look towards a time when it will be possible to alter the human germplasm by design. But we may easily be doing so now by inadvertence, for many chemicals, like radiation, bring about gene mutations. It is ironic to think that man might determine his own future by something so seemingly trivial as the choice of an insect spray. All this has been risked – for what? Future historians may well be amazed by our distorted sense of proportion. How could intelligent beings seek to control a few unwanted species by a method that contaminated the entire environment and brought the threat of disease and death even to their own kind? Yet this is precisely what we have done. We have done it, moreover, for reasons that collapse the moment we examine them. We are told that the enormous and expanding use of pesticides is necessary to maintain farm production. Yet is our real problem not one of over-production? Our farms, despite measures to remove acreages from production and to pay farmers not to produce, have yielded such a staggering excess of crops that the American taxpayer in 1962 is paying out more than one billion dollars a year as the total carrying cost of the surplus-food storage programme. And the situation is not helped when one branch of the Agriculture Department tries to reduce production while another states, as it did in 1958, It is believed generally that reduction of crop acreages under provisions of the Soil Bank will stimulate interest in use of chemicals to obtain maximum production on the land retained in crops.
All this is not to say there is no insect problem and no need of control. I am saying, rather, that control must be geared to realities, not to mythical situations, and that
A Fable for Tomorrow 19
the methods employed must be such that they do not destroy us along with the insects. The problem whose attempted solution has brought such a train of disaster in its wake is an accompaniment of our modern way of life. Long before the age of man, insects inhabited the earth – a group of extraordinarily varied and adaptable beings. Over the course of time since man’s advent, a small percentage of the more than half a million species of insects have come into conflict with human welfare in two principal ways: as competitors for the food supply and as carriers of human disease. Disease-carrying insects become important where human beings are crowded together, especially under conditions where sanitation is poor, as in time of natural disaster or war or in situations of extreme poverty and deprivation. Then control of some sort becomes necessary. It is a sobering fact, however, as we shall presently see, that the method of massive chemical control has had only limited success, and also threatens to worsen the very conditions it is intended to curb. Under primitive agricultural conditions the farmer had few insect problems. These arose with the intensification of agriculture – the devotion of immense acreages to a single crop. Such a system set the stage for explosive increases in specific insect populations. Single-crop farming does not take advantage of the principles by which nature works; it is agriculture as an engineer might conceive it to be. Nature has introduced great variety into the landscape, but man has displayed a passion for simplifying it. Thus he undoes the built-in checks and balances by which nature holds the species within bounds. One important natural check is a limit on the amount of suitable habitat for each species. Obviously then, an insect that lives on wheat can build up its population to much higher levels on a farm devoted to wheat than on one in which wheat is intermingled with other crops to which the insect is not adapted. The same thing happens in other situations. A generation or more ago, the towns of large areas of the US lined their streets with the noble elm tree. Now the beauty they hopefully created is threatened with complete destruction as disease sweeps through the elms, carried by a beetle that would have only a limited chance to build up large populations and to spread from tree to tree if the elms were only occasional trees in a richly diversified planting. Another factor in the modern insect problem is one that must be viewed against a background of geologic and human history: the spreading of thousands of different kinds of organisms from their native homes to invade new territories. This worldwide migration has been studied and graphically described by the British ecologist Charles Elton in his recent book The Ecology of Invasions by Animals and Plants (1958). During the Cretaceous Period, some 100 million years ago, flooding seas cut many land bridges between continents and living things found themselves confined in what Elton calls ‘colossal separate nature reserves’. There, isolated from others of their kind, they developed many new species. When some of the land masses were joined again, about 15 million years ago, these species began to move out into new territories – a movement that is not only still in progress but is now receiving considerable assistance from man.
20 Agricultural Harm to the Environment
The importation of plants is the primary agent in the modern spread of species, for animals have almost invariably gone along with the plants, quarantine being a comparatively recent and not completely effective innovation. The United States Office of Plant Introduction alone has introduced almost 200,000 species and varieties of plants from all over the world. Nearly half of the 180 or so major insect enemies of plants in the US are accidental imports from abroad, and most of them have come as hitch-hikers on plants. In new territory, out of reach of the restraining hand of the natural enemies that kept down its numbers in its native land, an invading plant or animal is able to become enormously abundant. Thus it is no accident that our most troublesome insects are introduced species. These invasions, both the naturally occurring and those dependent on human assistance, are likely to continue indefinitely. Quarantine and massive chemical campaigns are only extremely expensive ways of buying time. We are faced, according to Dr Elton, ‘with a life-and-death need not just to find new technological means of suppressing this plant or that animal’; instead we need the basic knowledge of animal populations and their relations to their surroundings that will ‘promote an even balance and damp down the explosive power of outbreaks and new invasions’. Much of the necessary knowledge is now available but we do not use it. We train ecologists in our universities and even employ them in our governmental agencies but we seldom take their advice. We allow the chemical death rain to fall as though there were no alternatives whereas in fact there are many, and our ingenuity could soon discover many more if given opportunity. Have we fallen into a mesmerized state that makes us accept as inevitable that which is inferior or detrimental, as though having lost the will or the vision to demand that which is good? Such thinking, in the words of the ecologist Paul Shepard, idealizes life with only its head out of water, inches above the limits of toleration of the corruption of its own environment... Why should we tolerate a diet of weak poisons, a home in insipid surroundings, a circle of acquaintances who are not quite our enemies, the noise of motors with just enough relief to prevent insanity? Who would want to live in a world which is just not quite fatal?
Yet such a world is pressed upon us. The crusade to create a chemically sterile, insect-free world seems to have engendered a fanatic zeal on the part of many specialists and most of the so-called control agencies. On every hand there is evidence that those engaged in spraying operations exercise a ruthless power. ‘The regulatory entomologists … function as prosecutor, judge and jury, tax assessor and collector and sheriff to enforce their own orders’, said Connecticut entomologist Neely Turner. The most flagrant abuses go unchecked in both state and federal agencies. It is not my contention that chemical insecticides must never be used. I do contend that we have put poisonous and biologically potent chemicals indiscriminately into the hands of persons largely or wholly ignorant of their potentials for
A Fable for Tomorrow 21
harm. We have subjected enormous numbers of people to contact with these poisons, without their consent and often without their knowledge. If the Bill of Rights contains no guarantee that a citizen shall be secure against lethal poisons distributed either by private individuals or by public officials, it is surely only because our forefathers, despite their considerable wisdom and foresight, could conceive of no such problem. I contend, furthermore, that we have allowed these chemicals to be used with little or no advance investigation of their effect on soil, water, wildlife and man himself. Future generations are unlikely to condone our lack of prudent concern for the integrity of the natural world that supports all life. There is still very limited awareness of the nature of the threat. This is an era of specialists, each of whom sees his own problem and is unaware of or intolerant of the larger frame into which it fits. It is also an era dominated by industry, in which the right to make a dollar at whatever cost is seldom challenged. When the public protests, confronted with some obvious evidence of damaging results of pesticide applications, it is fed little tranquillizing pills of half truth. We urgently need an end to these false assurances, to the sugar coating of unpalatable facts. It is the public that is being asked to assume the risks that the insect controllers calculate. The public must decide whether it wishes to continue on the present road, and it can do so only when in full possession of the facts. In the words of Jean Rostand, ‘The obligation to endure gives us the right to know.’
Reference Elton C. 1958. The Ecology of Invasions by Animals and Plants. University of Chicago Press, Chicago, IL
2
Reality Cheques Jules Pretty
The Real Costs of Food When we buy or bake our daily bread, do we ever wonder about how much it really costs? We like it when our food is cheap, and complain when prices rise. Indeed, riots over food prices date back at least to Roman times. Governments have long since intervened to keep food cheap in the shops, and tell us that policies designed to do exactly this are succeeding. In most industrialized countries, the proportion of the average household budget spent on food has been declining in recent decades. Food is getting cheaper relative to other goods, and many believe that this must benefit everyone as we all need to eat food. But we have come to believe a damaging myth. Food is not cheap. It only appears cheap in the shop because we are not encouraged to think of the hidden costs of damage caused to the environment and human health by certain systems of agricultural production. Thus we actually pay three times for our food. Once at the till in the shop, a second time through taxes that are used to subsidize farmers or support agricultural development, and a third time to clean up the environmental and health side effects. Food looks cheap because we count these costs elsewhere in society. As economists put it, the real costs are not internalized in prices.1 This is not to say that prices in the shop should rise, as this would penalize the poor over the wealthy. Using taxes to raise money to support agricultural development is also potentially progressive, as the rich pay proportionally more in taxes, and the poor, who spend proportionally more of their budget on food, benefit if prices stay low. But this idea of fairness falters when set against the massive distortions brought about by modern agricultural systems that additionally impose large environmental and health costs throughout economies. Other people and institutions pay these costs, and this is both unfair and inefficient. If we were able to add up the real costs of producing food, we would find that modern industrialized systems of production perform poorly in comparison with sustainable systems. This is because we permit cost-shifting – the costs of ill health, lost biodiversity Reprinted from Pretty J. 2002. Reality Cheques, in Pretty J. Agri-culture. Earthscan, London.
Reality Cheques 23
and water pollution are transferred away from farmers, and so not paid by those producing the food nor included in the price of the products sold. Until recently, though, we have lacked the methods to put a price on these side effects. When we conceive of agriculture as more than simply a food factory, indeed as a multifunctional activity with many side effects, then this idea that farmers do only one thing must change. Of course, it was not always like this. It is modern agriculture that has brought a narrow view of farming, and it has led us to crisis. The rural environment in industrialized countries suffers, the food we eat is as likely to do as much harm as good, and we still think food is cheap. The following words were written more than 50 years ago, just before the advent of modern industrialized farming. Why is there so much controversy about Britain’s agricultural policy, and why are farmers so disturbed about the future?... After the last war, the people of these islands were anxious to establish food production on a secure basis, yet, in spite of public good will, the farming industry has been through a period of insecurity and chaotic conditions.
These are the opening words to a national enquiry that could have been written about a contemporary crisis. Yet they are by Lord Astor, written in 1945 to introduce the Astor and Rowntree review of agriculture. This enquiry was critical of the replacement of mixed methods with standardized farming. They said, ‘to farm properly you have got to maintain soil fertility; to maintain soil fertility you need a mixed farming system’. They believed that farming would only succeed if it maintained the health of the whole system, beginning in particular with the maintenance of soil fertility: ‘obviously it is not only sound business practice but plain common sense to take steps to maintain the health and fertility of soil’.2 But in the enquiry, some witnesses disagreed, and called for a ‘specialised and mechanised farming’, though interestingly, the farming establishment at the time largely supported the idea of mixed farming. But in the end, the desire for public subsidies to encourage increases in food production took precedence, and these were more easily applied to simplified systems than mixed ones. The 1947 Agriculture Act was the outcome, a giant leap forward for modern, simplified agriculture, and a large step away from farming that valued nature’s assets for farming. Sir George Stapledon, a British scientist knighted for his research on grasslands, was another perceptive scientist well ahead of his time. He too was against monocultures and in favour of diversity, arguing in 1941 that ‘senseless systems of monoculture designed to produce food and other crops at the cheapest possible cost have rendered waste literally millions of acres of once fertile or potentially fertile country’.3 In his final years, just a decade after the 1947 Act, he said: today technology has begun to run riot and amazingly enough perhaps nowhere more so than on the most productive farms... Man is putting all his money on narrow specialisation and on the newly dawned age of technology has backed a wild horse which given its head is bound to get out of control.
24 Agricultural Harm to the Environment
Wise words from eminent politicians and scientists. But lost on the altar of progress. Until now, perhaps, as new ideas on agriculture have begun to emerge and gather credence.
Agriculture’s Unique Multifunctionality We should all now be asking: what is farming for? Clearly, in the first instance, to produce food, and we have become very good at it. A great success, but only if our measures of efficiency are narrow. Agriculture is unique as an economic sector. It does more than just produce food, fibre, oil and timber. It has a profound impact on many aspects of local, national and global economies and ecosystems. These impacts can be either positive or negative. The negative ones are worrying. Pesticides and nutrients leaching from farms have to be removed from drinking water, and these costs are paid by water consumers, not by the polluters. The polluters, therefore, benefit by not paying to clean up the mess they have created, and have no incentive to change behaviour. What also makes agriculture unique is that it affects the very assets on which it relies for success. Agricultural systems at all levels rely for their success on the value of services flowing from the total stock of assets that they control, and five types of asset, natural, social, human, physical and financial capital, are now recognized as being important.4 Natural capital produces nature’s goods and services, and comprises food, both farmed and harvested or caught from the wild, wood and fibre; water supply and regulation; treatment, assimilation and decomposition of wastes; nutrient cycling and fixation; soil formation; biological control of pests; climate regulation; wildlife habitats; storm protection and flood control; carbon sequestration; pollination; and recreation and leisure. Social capital yields a flow of mutually beneficial collective action, contributing to the cohesiveness of people in their societies. The social assets comprising social capital include norms, values and attitudes that predispose people to cooperate; relations of trust, reciprocity and obligations; and common rules and sanctions mutually agreed or handed-down. These are connected and structured in networks and groups. Human capital is the total capability residing in individuals, based on their stock of knowledge skills, health and nutrition. It is enhanced by access to services that provide these, such as schools, medical services and adult training. People’s productivity is increased by their capacity to interact with productive technologies and with other people. Leadership and organizational skills are particularly important in making other resources more valuable. Physical capital is the store of human-made material resources, and comprises buildings, such as housing and factories, market infrastructure, irrigation works, roads and bridges, tools and tractors, communications, and energy and transportation systems, that make labour more productive. Financial capital is more of an accounting concept, as it serves as a facilitating role rather than as a source of productivity in and of itself. It represents accumulated claims on goods and services, built up through financial systems that gather savings and issue credit, such as pensions, remittances, welfare payments, grants and subsidies.
Reality Cheques 25
As agricultural systems shape the very assets on which they rely for inputs, a vital feedback loop occurs from outcomes to inputs. Donald Worster’s three principles for good farming capture this idea. It is farming that makes people healthier, farming that promotes a more just society, and farming that preserves the earth and its networks of life. He says ‘the need for a new agriculture does not absolve us from the moral duty and common-sense advice to farm in an ecologically rational way. Good farming protects the land, even when it uses it.’5 Thus sustainable agricultural systems tend to have a positive effect on natural, social and human capital, whilst unsustainable ones feed back to deplete these assets, leaving less for future generations. For example, an agricultural system that erodes soil whilst producing food externalizes costs that others must bear. But one that sequesters carbon in soils through organic matter accumulation helps to mediate climate change. Similarly, a diverse agricultural system that enhances on-farm wildlife for pest control contributes to wider stocks of biodiversity, whilst simplified modernized systems that eliminate wildlife do not. Agricultural systems that offer labour-absorption opportunities, through resource improvements or value-added activities, can boost economies and help to reverse rural-to-urban migration patterns. Agriculture is, therefore, fundamentally multifunctional. It jointly produces many unique non-food functions that cannot be produced by other economic sectors so efficiently. Clearly, a key policy challenge, for both industrialized and developing countries, is to find ways to maintain and enhance food production. But the key question is: can this be done whilst seeking both to improve the positive side effects and to eliminate the negative ones? It will not be easy, as past agricultural development has tended to ignore both the multifunctionality of agriculture and the pervasive external costs.6 This leads us to a simple and clear definition for sustainable agriculture. It is farming that makes the best use of nature’s goods and services whilst not damaging the environment.7 It does this by integrating natural processes such as nutrient cycling, nitrogen fixation, soil regeneration and natural enemies of pests into food production processes. It also minimizes the use of non-renewable inputs that damage the environment or harm the health of farmers and consumers. It makes better use of the knowledge and skills of farmers, so improving their self-reliance, and it makes productive use of people’s capacities to work together to solve common management problems. Through this, sustainable agriculture also contributes to a range of public goods, such as clean water, wildlife, carbon sequestration in soils, flood protection and landscape quality.
Putting Monetary Values on Externalities Most economic activities affect the environment, either through the use of natural resources as an input or by using the ‘clean’ environment as a sink for pollution. The costs of using the environment in this way are called externalities. As they are side effects of the economic activity, they are external to markets, and so their costs are not part of the prices paid by producers or consumers. When such externalities
26 Agricultural Harm to the Environment
are not included in prices, they distort the market by encouraging activities that are costly to society even if the private benefits are substantial. The types of externalities encountered in the agricultural sector have several features. Their costs are often neglected, and frequently occur with a time lag. They often damage groups whose interests are not represented, and the identity of the producer of the externality is not always known.8 In practice, there is little agreed data on the economic cost of agricultural externalities. This is partly because the costs are highly dispersed and affect many sectors of economies. It is also necessary to know about the value of nature’s goods and services, and what happens when these largely unmarketed goods are lost. As the current system of economic accounting grossly underestimates the current and future value of natural capital, this makes the task even more difficult.9 It is relatively easy, for example, to count the treatment costs following pollution, but much more difficult to value, for example, skylarks singing on a summer’s day, and the costs incurred when they are lost. Several studies have recently put a cost on the negative externalities of agriculture in China, Germany, The Netherlands, the Philippines, the UK and the US.10 When it is possible to make the calculations, our understanding of what is the best or most efficient form of agriculture can change rapidly. In the Philippines, researchers from the International Rice Research Institute (IRRI) found that modern rice cultivation was costly to human health. They investigated the health status of rice farmers exposed to pesticides, and estimated the monetary costs of significantly increased incidence of eye, skin, lung and neurological disorders. By incorporating these into the economics of pest control, they found that modern, high-pesticide systems suffer twice, as with nine pesticide sprays per season they returned less per hectare than the integrated pest management strategies, and cost the most in terms of ill health. Any expected positive production benefits of applying pesticides were overwhelmed by the health costs. Rice production using natural control methods has multifunctionality in contributing positively both to human health as well as sustaining food production.11 At the University of Essex, we recently developed a new framework to study the negative externalities of UK agriculture. This uses seven cost categories to assess negative environmental and health costs – damage to water, air, soil and biodiversity, and damage to human health by pesticides, microorganisms and disease agents. The analysis of damage and monitoring costs counted only external costs, as private costs borne by farmers themselves, such as from increased pest or weed resistance from pesticide overuse, are not included. We conservatively estimated that the external costs of UK agriculture, almost all of which is modernized and industrialized, to be at least £1½–2 billion each year. Another study by Olivia Hartridge and David Pearce has also put the annual costs of modern agriculture in excess of £1 billion.12 These are costs imposed on the rest of society, and effectively a hidden subsidy to the polluters.13 The annual costs arise from damage to the atmosphere (£316 million), to water (£231 million), to biodiversity and landscapes (£126 million), to soils (£96 million) and to human health (£777 million).
Reality Cheques 27
Using a similar framework of analysis, the external costs in the US amount to nearly £13 billion per year.14 How do all these costs arise? Pesticides, nitrogen and phosphorus nutrients, soil, farm wastes and microorganisms escape from farms to pollute ground and surface water. Costs are incurred by water delivery companies, and then passed onto their customers, to remove these contaminants, to pay for restoring watercourses following pollution incidents and eutrophication, and to remove soil from water. Using UK water companies’ returns for both capital and operating expenditure, we estimated annual external costs to be £125 million for the removal of pesticides below legal standards, £16 million for nitrate, £69 million for soil, and £23 million for Cryptosporidium.15 These costs would be much greater if the policy goal were complete removal of all contamination. Agriculture also contributes to atmospheric pollution through the emissions of four gases: methane from livestock, nitrous oxide from fertilizers, ammonia from livestock wastes and some fertilizers, and carbon dioxide from energy and fossil fuel consumption and loss of soil carbon. These in turn contribute to atmospheric warming (methane, nitrous oxide and carbon dioxide), ozone loss in the stratosphere (nitrous oxide), acidification of soils and water (ammonia) and eutrophication (ammonia). The annual cost for these gases is some £310 million.16 A healthy soil is vital for agriculture, but modern farming has accelerated erosion, primarily through the cultivation of winter cereals, the conversion of pasture to arable, the removal of field boundaries and hedgerows, and overstocking of livestock on grasslands. Off-site costs arise when soil carried off farms by water or wind blocks ditches and roads, damages property, induces traffic accidents, increases the risk of floods, and pollutes water through sediments and associated nitrate, phosphate and pesticides. These amount to £14 million per year. Carbon in organic matter in soils is also rapidly lost when pastures are ploughed or when agricultural land is intensively cultivated, and adds another £82 million to the annual external costs. Modern farming has had a severe impact on wildlife in the UK. More than nine-tenths of wildflower-rich meadows have been lost since the 1940s, together with a half of heathland, lowland fens, and valley and basin mires, and a third to a half of ancient lowland woods and hedgerows. Species diversity is also declining in the farmed habitat itself. Increase use of drainage and fertilizers has led to grass monocultures replacing flower-rich meadows, overgrazing of uplands has reduced species diversity, and herbicides have cut diversity in arable fields. Hedgerows were removed at a rate of 18,000 kilometres a year between the mid-1980s and 1990s. Farmland birds have particularly suffered, with the populations of nine species falling by more than a half in the 25 years to 1995.17 The costs of restoring species and habitats under Biodiversity Action Plans were used as a proxy for the costs of wildlife and habitat losses, and together with the costs of replacing hedgerows, stonewalls and bee colonies, bring the annual costs to £126 million. Pesticides can affect workers engaged in their manufacture, transport and disposal, operators who apply them in the field, and the general public. But there is still great uncertainty because of differing risks per product, poor understanding of
28 Agricultural Harm to the Environment
chronic effects, such as in cancer causation, weak monitoring systems, and misdiagnoses by doctors.18 For these reasons, it is very difficult to say exactly how many people are affected by pesticides each year. According to voluntary reporting to government, one to two hundred incidents occur each year in the UK.19 However, a recent government survey of 2000 pesticide users found that 5 per cent reported at least one symptom in the past year and about which they had consulted a doctor, and a further 10 per cent had been affected, mostly by headaches, but had not consulted a doctor, incurring annual costs of about £1 million. Chronic health hazards associated with pesticides are even more difficult to assess. Pesticides are ingested via food and water, and these represent some risk to the public. With current scientific knowledge, it is impossible to state categorically whether or not certain pesticides play a role in cancer causation. Other serious health problems arising from agriculture are foodborne illnesses, antibiotic resistance and BSE-CJD.20 These external costs of UK agriculture are alarming. They should call into question what we mean by efficiency. Farming receives £3 billion of public subsidies each year, yet causes another £1½ billion of costs elsewhere in the economy. If we had no alternatives, then we would have to accept these costs. But, in every case, there are choices. Pesticides do not have to get into water. Indeed, they do not need to be used at all in many farm systems. The pesticide market in the UK is £500 million pounds, yet we pay £120million just to clean them out of drinking water. We do not need farming that damages biodiversity and landscapes; we do not need intensive livestock production that encourages infections and overuse of antibiotics. Not all costs, though, are subject to immediate elimination with sustainable methods of production. Cows will still belch methane, until animal feed scientists find a way of amending ruminant biochemistry to prevent its emission. But it is clear that many of these massive distortions could be removed with some clear thinking, firm policy action and brave action by farmers.21
The Side Effects of Intensive Food Production on Water and Wetlands One problem with the redesign of landscape for modern agriculture is that important natural features and functions are lost. Watercourses and bodies are one of the most tamed and abused features. Wetlands have been drained, rivers straightened or hidden behind levees, aquifers mined, and rivers, lakes and seas polluted, mostly to ensure that productive farmland is protected from harm or excessive costs. Once again, though, the narrow view of the value of farmland for food production above all other uses has caused secondary problems. According to the National Research Council, 47 million hectares of wetlands in the US were drained in the past two centuries, and 85 per cent of inland waters are now artificially controlled. This created new farmland, to the benefit of farmers. But remove the wetlands, and the many valued services they provide are also lost. They are habitats for biodiversity,
Reality Cheques 29
capture nutrients that run off fields, provide flood protection and are important cultural features of the landscape. Donald Worster describes growing up within 30 metres of the already tamed Cow Creek in Kansas: ‘we could not see it from our windows; we could only see the levee’. In the 19th century, as the town had expanded by the river, and the early settlers converted land to wheat cultivation, so the normal and regular flooding of the river started to cause considerable economic damage. Episodes of flooding and continued expenditure on flood protection continued for decades, until a major flood in 1941 finally led the Army Corps of Engineers to construct a series of 4-metrehigh levees: ‘now at long last the good Kansas folk, having vanquished the Indians and the bison and the sandhill cranes and the antelope, had managed to vanquish Cow Creek. Abruptly, it disappeared from their lives.’ This is the alarming part. When valued landscape features have gone, or have been replaced, the everyday experiences of local people will steadily erode old memories. The young will not know, while the old will be troubled, until they pass on too.22 Meanwhile, we all lose. In Europe, river valleys used to contain many water meadows, fields likely to be flooded by overflowing rivers, and so used productively to produce a late winter or early spring crop of grass. More importantly, when the river did flood, water was stored on the meadows, and did not harm housing or other vulnerable areas. But in the drive towards intensification of food production, most of these meadows have been converted to arable fields. At the same time, rivers have been tamed through channelling, field sizes increased, hedgerows removed, and houses built on vulnerable land. Now, when it rains, the consequence is increased flooding to vulnerable areas. It looks as though there has been ‘too much’ rain, but in truth it is largely due to changes in the landscape. In Germany, Rienk van der Ploeg and colleagues have correlated loss of meadows with an increased incidence of inland floods, with 6 of the 12 most extreme events over a century having occurred since 1983. They show that changes in the diversity of use of agricultural land are the main cause. In particular, permanent meadows have been converted to arable fields, some 1½ million hectares since the mid-1960s, which because of surface sealing and compaction are less likely to hold water during winter. Another 4½ million hectares of wetland soils have been drained since the 1940s. Thus when it rains, water contributes more rapidly to river water discharge, so increasing the likelihood of flooding. The cost of two floods in 1993 and 1995 were nearly DM2 billion, and van der Ploeg concludes that the conversion of arable back to permanent meadows would be economically and environmentally beneficial: ‘it must be acknowledged that any further increase in agricultural productivity is likely to cause additional adverse environmental effects. Future farm policy must pay more attention to the environment’.23 Japan provides another example of the wider value of agricultural wetlands, in this case irrigated paddy rice fields. Japan’s very high rainfall is concentrated into a few months on a landscape characterized by a high mountain chain. With a very short flow time to the sea, this means that much of the country is subject to severe flood risk. Paddy rice farming, though, provides an important sink for this water.
30 Agricultural Harm to the Environment
There are more than 2 million hectares of paddy rice in Japan, and each of these hectares holds about 1000 tonnes of water each year. In the Koshigaya City basin, 25 kilometres north of Tokyo, paddy fields close to the city have been steadily converted to residential uses over the past quarter century. But as the area of paddy has declined by about 1000 hectares since the mid-1970s, so the incidence of flooding has increased. Each year, 1000–3000 houses are flooded. In whole watersheds, woods and farms on steep slopes have been identified as having the greatest value in buffering and slowing water flow, and minimizing landslides. Diversity, though, is critical. As Yoshitake Kato and colleagues have put it: traditional villages in rural areas include settlements, paddy fields, crop fields and forested hills or mountains, all as linked landscape. The systems were dependent on all their parts. The decline of farming in the uplands, together with loss of forests, threatens the stability of whole watersheds.24
In China, the 500,000 hectares of wetlands that have been reclaimed for crop production in the past 50 years have meant the loss of flood-water storage capacity of some 50 billion cubic metres, a major reason for the $20 billion flood damage caused in 1998.25 In many agricultural systems, over-intensive use of the land has resulted in sharp declines in soil organic matter and/or increases in soil erosion, some of which in turn threatens the viability of agriculture itself. In South Asia, for example, a quarter of farmland is affected by water erosion, a fifth by wind erosion, and a sixth by salinization and waterlogging.26 Putting a value on wetlands and watercourses, so that we can calculate how much is lost when they are damaged or destroyed, is not a trivial task. Economists have no agreed value for wetlands, though various studies indicate that individual bodies can provide several million dollars of free services to nearby communities for waste assimilation and treatment. A recent US Department of Agriculture study put wetland monetary value at $300,000 per hectare per year. Another way to assess value is to investigate how much people pay to visit wetlands, whether to watch or photograph biodiversity, or indeed to shoot it. In the US, it is estimated that 50 million people each year spend $10 billion observing and photographing wetland flora and fauna, 31 million anglers spend $16 billion on fishing, and 3 million waterfowl hunters spend nearly $700 million annually on shooting it. A recent meta-analysis of economic studies of people’s willingness-to-pay for recreational services of wetlands and watercourses puts the average value in Europe to be £20–25 per person per hectare per year.27 Thus each hectare of wetland converted to another purpose means the loss of at least £20 of value to the public. There are, of course, limitations in these exercises, as monetary values cannot be allocated to all uses. One of the most serious side effects of agriculture is the leaching and run-off of nutrients, and their disruption of water ecosystems. Eutrophication is the term used to describe nutrient enrichment of water that leads to excessive algal growth, disruption of whole food webs, and in the worst cases complete eradication of all life through deoxygenation. The most notorious example is the Gulf of Mexico
Reality Cheques 31
dead-zone, an area of 5000–18,000km2 of sea that has received so much nutrient input that all aquatic life has been killed. The cost of farm overuse of nutrients in the Mississippi basin is thus borne by the fishing families of Louisiana. No one has yet put a cost on these losses, yet if they were internalized in the prices of fertilizers, or the activities of intensive livestock units, we would expect to see much greater care shown about such polluting activities.28 At the University of Essex, we recently conducted a study of the costs of nutrient enrichment of water in the UK.29 Eutrophication affects the value of waterside properties, and reduces the recreational and amenity value of water bodies for water sports, angling and general amenity, for industrial uses, for the tourist industry and for commercial aquaculture, fisheries and shell-fisheries. Additional costs are incurred through a variety of social responses by both statutory and non-statutory agencies. In total, we estimate nutrient enrichment to cost some £150 million per year in the UK.30
Industrialized Agriculture and Foodborne Illnesses Having mostly conquered hunger in industrialized countries, it is a sad irony that food is now a major source of ill health. We eat too much, we eat the wrong mix of foods, and we get ill from foodborne illnesses. In Europe, 10–20 per cent of all people are defined as obese, with a body mass index greater than 30kg per square metre. The World Health Organization estimates that 2–7 per cent of health care costs in Europe arise from obesity, and one American study suggests that a 10 per cent weight loss amongst obese people would increase life expectancy by 2–7 months, and produce lifetime benefits of US$2000–6000 per person.31 Several diseases are strongly linked to unbalanced food consumption, including non-insulin dependent diabetes, the incidence of which is growing rapidly, together with strokes, coronary heart disease and some cancers. Many of these health problems, though, are attributable to the choices consumers make. We could eat five portions of fruit and vegetable per day, thus protecting against many of these problems, but for a variety of reasons we do not. But we cannot choose when it comes to foodborne diseases. The WHO estimates that 130 million people in Europe are affected by foodborne diseases each year, mainly from biological sources, particularly strains of Salmonella, Campylobacter, Listeria and E. coli. Salmonella is the most common pathogen, accounting for up to 90 per cent of cases in some countries. Throughout the world, diarrhoea is the most common symptom of foodborne illness, and is a major cause of death and retardation of growth in infants. There is evidence that cases of Campylobacter and Salmonella poisoning are increasing in Europe, though some of the increases can be explained by better monitoring systems.32 In the US, the incidence of foodborne illness is greater, perhaps because of the greater industrialization of agriculture and, in particular, of livestock raising. According to the government’s Centers for Disease
32 Agricultural Harm to the Environment
Control, 76 million people in the US fall ill each year from foodborne illness, of whom more than 300,000 are hospitalized and 5000 die.33 The costs of foodborne illnesses are massive. For the US, the Institute for Medicine at the National Academy of Sciences, the US Department of Agriculture (USDA) and the World Health Organization estimates them to be between $34 and $110 billion dollars per year. In the UK, the government’s Food Standards Agency estimates that each of the annual 5 million cases of food poisoning costs on average £85 for costs to health services and losses to businesses, putting the annual cost at more than £400 million. These data suggest that one in four Americans and one on ten Britons suffer from food poisoning each year.34 Some of these foodborne illnesses arise from shellfish, others are associated with mass catering or occur in the food processing chain. But it is the initial sources of infection on the farm, combined with the overuse of antibiotics for growth promotion, that is an increasing source of disquiet. The concentration of livestock into factory feedlots, broiler sheds and colossal pig units promotes infection and spread. As the WHO puts it ‘the greatest risk appears to be the production of animal foods. It is from this source that the most serious health threats originate, for instance, Salmonella, Campylobacter, E.coli and Yersinia.’ The pool of infection at the start of the food chain is now very serious. The USDA has found very high levels of microbial infections in US farm animals, particularly in broiler chickens and turkeys. Clostridium has been found in 30–40 per cent of flocks, Campylobacter in nearly 90 per cent, Salmonella in 20–30 per cent, and Staphylococcus in 65 per cent. These levels of infection are matched in some European countries, with more than 90 per cent of pig herds and nearly 50 per cent of cattle in The Netherlands and Denmark contaminated with Campylobacter. At these levels of incidence in animals, it is hardly surprising that illness incidence from meat consumption is so high. Incidence in pigs and cattle is much lower, but still a worrying 3–30 per cent of herds for these four pathogens (Table 2.1). This extraordinary problem, slipping quietly behind a desire for ever-cheaper foods, is worsened by antibiotic resistance brought on by overuse of antibiotics for livestock growth promotion and over-prescription in medicine. Twenty-three thousand tonnes of antibiotics are used in the US each year, of which 11 thousand are given to animals, four-fifths of which is just for growth promotion. In the UK, 1200 tonnes of antibiotics are used each year, 40 per cent of which is for humans, Table 2.1 Incidence of microbial infection in farm animals, US Proportion of individuals with infectious bacteria (%) Broiler chickens
Turkeys
Pigs
Cattle
Clostridium
43
29
10
8
Campylobacter
88
90
32
1
Salmonella
29
19
8
3
Staphylococcus
65
65
16
8
Reality Cheques 33
30 per cent for farm animals, and 30 per cent for domestic pets and horses. Only one-fifth of the antibiotics and other antimicrobials used in modern agriculture are for therapeutic treatment of clinical diseases, with four-fifths for prophylactic use and growth promotion. The Centers for Disease Control say, ‘antimicrobial resistance is a serious clinical and public health problem in the US’, and one estimate from the Institute of Medicine suggests that such resistance costs $30 million per year. A UK House of Lords select committee enquiry was even more alarmed, recently stating, ‘there is a continuing threat to human health from the imprudent use of antibiotics in animals … we may face the dire prospect of revisiting the pre-antibiotic era’.35 In both Europe and North America, the most common forms of antimicrobial resistance are to strains of antibiotics used in treating animals, and these are transferred to human patients. Some antibiotics, such as fluoroquinones and avoparcin, used to treat infections in poultry and as growth promoters, are now associated with dramatic increases in resistant diseases in humans. Fluoroquinone resistance is thought to be the main factor why Campylobacter infections have become so common in The Netherlands. As the WHO puts it, ‘Campylobacter species are now the commonest cause of bacterial gasteroenteritis is developed countries, and cases are predominantly associated with consumption of poultry’.36 There is no such thing as a cheap chicken.
Putting a Monetary Value on Agricultural Landscapes Landscapes are culturally valuable, and the aesthetic value we gain from them owes much to their emergence from agricultural practices. They are, of course, almost impossible to value in monetary terms. However, many proxies can be used, including how much governments are willing to pay farmers to produce certain habitats or landscapes, how often the public visits the countryside, and how much they spend when they get there. In the UK, several studies of agri-environmental policies have sought to put a value on positive environmental and landscape outcomes.37 These schemes have attempted to restore some of the habitat and other positive countryside attributes that were lost during intensification as well as protect those attributes not yet lost. UK agri-environmental schemes have been designed to deliver benefits in several forms, including biodiversity, landscape patterns, water quality, archaeological sites and enhanced access. Benefits may accrue to those in the immediate area of a scheme, to visitors from outside the area and to the public at large. The annual perhousehold benefits, using a variety of valuation methods such as contingent valuation, choice experiments and contingent ranking, vary from £2 to £30 pounds for most Environmentally Sensitive Areas, rising to £140 for the Norfolk Broads and £380 for Scottish machair grasslands. If we take the range of annual benefits per household to be £10–30, and assume that this is representative of the average households’ preferences for all landscapes produced by agriculture, then this suggests
34 Agricultural Harm to the Environment
national benefits of the order of £200–600 million. Expressed on a per hectare basis, this suggests annual benefits of £20–60 per hectare of arable and pasture land in the UK. On the one hand, these are likely to be overestimates, assuming agri-environment schemes have already targeted certain landscapes because of their higher value. On the other hand, they could be substantial underestimates, as they omit to value such benefits as pathogen-free foods, uneroded soils, emission-free agriculture and biodiversity-producing systems, as well as focusing on the outcomes of a scheme rather than the whole landscape. There are too few studies yet to corroborate these data. One study in the UK compared paired organic and nonorganic farms, and concluded that organic agriculture produces £75–125 per hectare of positive externalities each year, with particular benefits for soil health and wildlife.38 As there are 3 million hectares of organic farming in Europe, the annual positive externalities could be £300 million, assuming benefits hold for the many organic farming systems across Europe. Actual visits made to the countryside are another proxy measure of how much we value landscapes. Each year in the UK, day and overnight visitors make some 433 million visit-days to the countryside and another 118 million to the seaside.39 The average spend per day or night varies from nearly £17 for UK day visitors, to £33 for UK overnight visitors, and just over £58 for overseas overnight visitors. This indicates that the 551 million visit-days to the countryside and seaside result in spending of £14 billion per year. This is three and a half times greater than the annual public subsidy of farming, and indicates just how much we value the landscape. If it is clean water that is required, the value of an agricultural landscape can be substantial, as New York State has found out with its support for sustainable agriculture in the 500,000 hectare Catskill-Delaware watershed complex.40 New York City gets 90 per cent of its drinking water from these watersheds, some 6 billion litres a day. In the late 1980s, though, the city was faced with having to construct a filtration facility to meet new drinking water standards, the cost of which would be $5–8 billion, plus another $200–500 million in annual operating costs. A third of the cropland in the watershed would have to be taken out of farming so as to reduce run-off of eroded soil, pesticides, nutrients and bacterial and protozoan pathogens. Instead, the city opted for a collaborative approach with farmers. It supported the establishment of a Watershed Agricultural Council in the early 1990s, a partnership of farmers, government and private organizations with the dual aim of protecting the city’s drinking water supply and sustaining the rural economy. It works on whole farm planning with each farm, tailoring solutions to local conditions to maximize reductions in off-site costs. The first two phases of the programme leading to the 85 per cent target in pollution reduction cost some $100 million, a small proportion of the cost of the filtration plant and its annual costs. Not only do taxpayers benefit from this approach to joint agri-environmental management, but so do farmers, the environment and rural economies.41 The only surprising thing is that these initiatives are still rare.
Reality Cheques 35
Agriculture’s Carbon Dividend The greatest environmental problem we face anywhere in the world is now climate change, provoked by rising levels of anthropogenic greenhouse gases. It threatens to disrupt economies and ecosystems, challenge existing land uses, substantially raise sea levels, and drown coastal lands and even some whole countries. To slow down and eventually to reverse these changes, we need to reduce human-induced emissions of these gases, as well as find ways to capture or lock up carbon from the atmosphere. Sustainable agriculture can make an important contribution to climate change mitigation through both emissions reduction and carbon sequestration, and as the international markets for carbon expand, so sequestered carbon could represent an important new income source for farmers.42 Agricultural systems contribute to carbon emissions through the direct use of fossil fuels in farm operations, the indirect use of embodied energy in inputs that are energy-intensive to manufacture and transport, particularly fertilizers and pesticides, and the cultivation of soils resulting in the loss of soil organic matter. Agriculture is also an accumulator of carbon, offsetting losses when organic matter is accumulated in the soil, or when above-ground woody biomass acts either as a permanent sink or is used as an energy source that substitutes for fossil fuels. Long-term agricultural experiments in both Europe and North America indicate that soil organic matter and soil carbon are lost during intensive cultivation. But both can be increased with sustainable management practices. The greatest dividend comes from conversion of arable to agroforestry as there is a benefit from both increased soil organic matter and the accumulation of above-ground woody biomass. Grasslands within rotations, zero-tillage farming, use of legumes and green manures, and high amendments of straw and manures, also lead to substantial carbon sequestration. There is now good evidence to show that sustainable agricultural systems can lead to the annual accumulation of 300–600kg of carbon per hectare, rising to several tonnes per hectare when trees are intercropped in cropping and grazing systems. Agriculture as an economic sector also contributes to carbon emissions through the consumption of direct and indirect fossil fuel. With the increased use of nitrogen fertilizers, pumped irrigation and mechanical power, accounting for more than 90 per cent of the total energy inputs to farming, industrialized agriculture has become progressively less energy efficient. The difference between sustainable and conventional systems of production is striking. Low-input or organic rice in Bangladesh, China and Latin America is some 15–25 times more energy efficient than irrigated rice grown in the US. For each tonne of cereal or vegetable from industrialized high-input systems in Europe, 3000–10,000MJ of energy are consumed in its production. But for each tonne of cereal or vegetable from sustainable farming, only 500–1000MJ are consumed.43 It is now known that intensive cultivation of cereals leads to reductions in soil organic matter and carbon. But recent years have seen an extraordinary growth in the adoption of ‘conservation tillage’ and ‘zero-tillage’ systems, particularly in the
36 Agricultural Harm to the Environment
Americas. These systems of cultivation maintain a permanent or semi-permanent organic cover on the soil. The function is to protect the soil physically from the action of sun, rain and wind, and to feed soil biota. The result is reduced soil erosion and improved soil organic matter and carbon content. Zero-tillage systems and those using legumes as green manures and/or cover crops contribute to organic matter and carbon accumulation in the soil. Zero-till systems also have an additional benefit of requiring less fossil fuel for machinery passes. Intensive arable with zero-tillage results in the annual accumulation of 300–600kg of carbon per hectare, but with mixed rotations and cover crops can accumulate up to 1300kg of carbon per hectare. The 1997 Kyoto Protocol to the UN Framework Convention on Climate Change established an international policy context for the reduction of carbon emissions and expansion in carbon sinks in order to address climate change. Under the protocol and the 2001 Bonn and Marakesh agreement, the principle of financial and technological transfers to land management projects and initiatives was established. Article 17 permits countries to produce certified emissions reductions, also known as offsets, and emissions reductions units through joint implementation projects. As it is cheaper at the margin for many countries to abate greenhouse gas emissions, such working together for joint implementation is in theory a costeffective mechanism for achieving global targets. But for real impacts on climate change to occur, sinks must become permanent. If lands under conservation tillage are ploughed, then all the gains in soil carbon and organic matter are lost. This poses a big challenge for trading systems, as there is no such thing as a permanent emissions reduction nor a permanently sequestered tonne of carbon. Despite these uncertainties, carbon banks, ‘boards of trade’ and trading systems first emerged during the year 2000. The early carbon trading systems set per tonne credit values mostly in the US$2–10 range, though the real value of each tonne sequestered is much higher. The important policy questions centre on how to establish permanent or indefinite sinks, how to prevent leakage, such as reploughing of zero-tilled fields or deforestation, how to agree measurements, and whether the cost of implementation can be justified through their additional side effects or multifunctionality. We do not yet know how much carbon could be locked up in response to monetary incentives for carbon sequestration. The empirical evidence is relatively sparse, and practical experience even more limited. No agreed system of payment levels has yet been established. Another unresolved issue relates to the location for the greatest carbon returns on investments. Investments in creating sustainable systems in the tropics are likely to be cheaper than in temperate regions, where industrialized agriculture prevails. Such financial transfers from industrialized to developing countries could produce substantial net global benefits as well as benefit poor farmers. At current prices, it is clear that farmers will not become solely carbon farmers. However, systems accumulating carbon are also delivering many other public goods, such as improved biodiversity and clean water from watersheds, and policy makers may also seek to price these so as to increase the total
Reality Cheques 37
payment package. Carbon, therefore, represents an important new source of income for farmers, as well as helping to encourage them to adopt sustainable practices.
Could Better Policies Help? These external costs and benefits of agriculture raise important policy questions. In particular, should farmers receive public support for the public benefits they produce in addition to food? Should those that pollute have to pay for restoring the environment and human health? These two principles are called ‘the provider gets’ and ‘the polluter pays’, and they are important to both industrialized and developing countries. Three categories of policy instruments are available: advisory and institutional measures, regulatory and legal measures, and economic instruments. In practice, effective pollution control and supply of desired public goods requires a mix of all three approaches, together with integration across sectors. Advisory and institutional measures have long formed the backbone of policies to internalize costs and so prevent agricultural pollution. These rely on the voluntary actions of farmers, and are favoured by policy makers because they are cheap and adaptable. Advice is commonly given in the form of codes of good agricultural practice, such as recommended rates of application of pesticides and fertilizer, or measures for soil erosion control. Most governments still employ extension agents to work with farmers on technology development and transfer. A variety of institutional mechanisms can also help to increase social capital and the uptake of more sustainable practices, including encouraging farmers to work together in study groups, investing in extension and advisory services to encourage greater interaction between farmers and extensionists, and encouraging new partnerships between farmers and other rural stakeholders, as regular exchanges and reciprocity increase trust and confidence, and lubricate cooperation. Regulatory and legal measures are also used to internalize external costs. This can be done either by setting emissions standards for the discharge of a pollutant, or by establishing quality standards for the environment receiving the pollutant. Polluters who exceed standards are then subject to penalties. There are many types of standards, such as operating standards to protect workers, production standards to limit levels of contaminants of residues in foods, emissions standards to limit releases or discharges, such as of silage effluents, and environmental quality standards for undesirable pollutants in vulnerable environments, such as pesticides in water. But the problem with such regulations is that most agricultural pollutants are diffuse, or nonpoint, in nature. It is impossible for inspectors to ensure compliance on hundreds of thousands of farms in the way that they can with a small number of factories. Regulations are also used to eliminate certain practices, and include bans on spraying of pesticides close to rivers and on straw-burning in the UK, and the mandatory requirement to complete full nutrient accounts for farms,
38 Agricultural Harm to the Environment
such as in The Netherlands and Switzerland. A final use for regulations is the designation and legal protection of certain habitats and species, which are set at national or international levels. Economic instruments can be used either to ensure that the polluter bears the costs of the pollution damage and the abatement costs incurred in controlling the pollution. They can also be used to reward good behaviour. A variety of economic instruments are available for achieving internalization, including environmental taxes and charges, tradable permits and targeted use of public subsidies and incentives. Environmental taxes seek to shift the burden of taxation away from economic ‘goods’, such as labour, towards environmental ‘bads’, such as waste and pollution. Clearly the market prices for agricultural inputs do not currently reflect the full costs of their use. Environmental taxes or pollution payments, however, seek to internalize some of these costs, so encouraging individuals and businesses to use them more efficiently. Such taxes offer the opportunity of a ‘double dividend’ by cutting environmental damage, particularly from nonpoint sources of pollution, whilst promoting welfare. However, many opponents still believe that environmental taxes stifle economic growth, despite compelling evidence to the contrary.44 There are now a wide range of environmental taxes used by countries in Europe and North America. These include carbon and energy taxes in Belgium, Denmark and Sweden; chlorofluorocarbon taxes in Denmark and the US; sulphur taxes in Denmark, France, Finland and Sweden; nitrogen oxide charges in France and Sweden; leaded and unleaded petrol differentials in all European Union (EU) countries; landfill taxes in Denmark, The Netherlands and the UK; groundwater extraction charges in The Netherlands; and sewage charges in Spain and Sweden. However, environmental taxes have rarely been applied to agriculture, with the notable exception of pesticide taxes in Denmark, Finland, Sweden and in several states of the US; fertilizer taxes in Austria, Finland, Sweden, and again several states of the US; and manure charges in Belgium and The Netherlands.45 The alternative to penalizing farmers through taxation is to encourage them to adopt non-polluting technologies and practices. This can be done by offering direct subsidies for adoption of sustainable technologies, and by removing perverse subsidies that currently encourage polluting activities.46 An important policy principle suggests that it is more efficient to promote practices that do not damage the environment rather than spending on cleaning up after a problem has been created. Many governments provide some direct or indirect public support to their domestic agricultural and rural sectors. Increasingly, payments are being shifted away from being production-linked, such as through price support or direct payments, to being retargeted to support sustainable practices. Generally, though, only small amounts of total budgets have been put aside for environmental improvements though such policies as the US Conservation Reserve Programme, the EU’s agrienvironmental and rural development programmes, and the Australian Landcare programme. Many now believe that all public support for farming should be entirely linked to the provision of public environmental and social goods.
Reality Cheques 39
The Radical Challenge of Integration The substantial external costs of modern agriculture, and the known external benefits of sustainable agricultural systems, pose great challenges for policy makers. A range of policy reforms could do much to internalize some of these costs and benefits in prices. In practice, as no single solution is likely to suffice, the key issue rests on how policy makers choose an appropriate mix of solutions, how these are integrated, and how farmers, consumers and other stakeholders are involved in the process of reform itself. Attention will therefore need to be paid to the social and institutional processes that both encourage farmers to work and learn together, and result in integrated cross-sectoral partnerships. Policy integration is vital, yet most policies seeking to link agriculture with more environmentally-sensitive management are still highly fragmented. The problem is that environmental policies have tended only to green the edges of farming. An essentially modernist agriculture remains much as it ever was, but is now tinged green. Non-crop habitats have been improved, perhaps some hedges, woodlands and wetlands. But the food is largely produced in the conventional manner. The bigger challenge is to find ways of substantially greening the middle of farming – in the field rather than around the edges. A thriving and sustainable agricultural sector requires both integrated action by farmers and communities, and integrated action by policy makers and planners. This implies both horizontal integration with better linkages between sectors, and vertical integration with better linkages from the micro- to macro-level. Most policy initiatives are still piecemeal, affecting only a small part of a individual farmer’s practices, and so not necessarily leading to substantial shifts towards sustainability. The 1990s saw considerable global progress towards the recognition of the need for policies to support sustainable agriculture. In a few countries, this has been translated into supportive and integrated policy frameworks. In most, however, sustainability policies remain at the margins. Only two countries – Cuba and Switzerland, discussed in more detail below – have given explicit national support for sustainable agriculture, putting it at the centre of agricultural development policy. Several countries have given sub-regional support, such as the states of Santa Caterina, Paraná and Rio Grande do Sol in southern Brazil supporting zerotillage and catchment management, and some states in India supporting watershed management or participatory irrigation management. A much larger number have reformed parts of agricultural policies, such as China’s support for integrated ecological demonstration villages, Kenya’s catchment approach to soil conservation, Indonesia’s ban on pesticides and programme for farmer field schools, India’s support for soybean processing and marketing, Bolivia’s regional integration of agricultural and rural policies, Sweden’s support for organic agriculture, Burkina Faso’s land policy, and Sri Lanka and the Philippines’ stipulation that water users’ groups manage irrigation systems. One of the best examples of a carefully designed and integrated programme comes from China. In March 1994, the government published a White Paper to
40 Agricultural Harm to the Environment
set out its plan for implementation of Agenda 21. This put forward ecological farming, known as Shengtai Nongye or agroecological engineering, as the approach to achieve sustainability in agriculture. Pilot projects have been established in some 2000 townships and villages spread across 150 counties. Policy for these ‘ecocounties’ is organized through a cross-ministry partnership, which uses a variety of incentives to encourage adoption of diverse production systems to replace monocultures. These include subsidies and loans, technical assistance, tax exemptions and deductions, security of land tenure, marketing services and linkages to research organizations. These eco-counties contain some 12 million hectares of land, about half of which is cropland, and though only covering a relatively small part of China’s total agricultural land, do illustrate what is possible when policy is coordinated and holistic. An even larger set of countries has seen some progress on agricultural sustainability at project and programme level. However, progress occurs despite, rather than because of, explicit policy support. No agriculture minister is likely to say they are against sustainable agriculture, yet good words remain to be translated into comprehensive policy reforms. Sustainable agricultural systems can be economically, environmentally and socially viable, and at the same time contribute positively to local livelihoods. But without appropriate policy support, they are likely to remain at best localized in extent, and at worst simply wither away. In Europe and North America, most policy analysts and sustainable agriculture organizations now agree that a policy framework that integrates support for farming together with rural development and the environment could create new jobs, protect and improve natural resources, and support rural communities. Such a policy could have many of the elements of the progressive Swiss and Cuban policy reforms made during the 1990s.
Cuba’s National Policy for Sustainable Agriculture At the turn of the century, Cuba was the only developing country with an explicit national policy for sustainable agriculture. To the end of the 1980s, Cuba’s agricultural sector was heavily subsidized by the Soviet bloc. It imported more than half of all calories consumed, and 80–95 per cent of wheat, beans, fertilizer, pesticides and animal feed. It received three times the world price for its sugar. At the time, Cuba had the most scientists per head of population in Latin America, the most tractors per hectare, the second highest grain yields, the lowest infant mortality, the highest number of doctors per head population and the highest secondary school enrolment. But in 1990, trade with the Soviet bloc collapsed, leading to severe shortages in all imports, and restricting farmers’ access to petroleum, fertilizers and pesticides. The government’s response was to declare an ‘Alternative Model’ as the official policy – an agriculture that focuses on technologies that substitute local knowledge,
Reality Cheques 41
skills and resources for the imported inputs. It also emphasizes the diversification of agriculture, oxen to replace tractors, Integrated Pest Management to replace pesticides, and the promotion of better cooperation among farmers both within and between communities. It has taken time to succeed. Calorific availability was 2600 kilocalories per day in 1990, fell disastrously to between 1000–1500 kilocalories per day soon after the transition, leading to severe hunger, but subsequently rose to 2700 kilocalories per day by the end of the 1990s. Two important strands to sustainable agriculture in Cuba have emerged. First intensive organic gardens have been developed in urban areas – self-provisioning gardens in schools and workplaces (autoconsumos), raised container-bed gardens (organoponicos) and intensive community gardens (huertos intensivos). There are now more than 7000 urban gardens, and productivity has grown from 1½kg per square metre to nearly 20kg per square metre. Second, sustainable agriculture is encouraged in rural areas, where the impact of the new policy has already been remarkable. More than 200 village-based and artisanal Centres for the Reproduction of Entomophages and Entomopathogens have been set up for biopesticide manufacture. Each year, they produce 1300 tonnes of B.t. sprays for lepidoptera control, nearly 800 tonnes of Beaveria sprays for beetle control, 200 tonnes of Verticillium for whitefly control and 2800 tonnes of Trichoderma, a natural enemy. Many biological control methods are proving more efficient than pesticides. Cut banana stems baited with honey to attract ants are placed in sweet potato fields, and have led to control of the sweet potato weevil. There are 170 vermicompost centres, the annual production of which has grown from 3 to 93 thousand tonnes. Crop rotations, green manuring, intercropping and soil conservation have all been incorporated into polyculture farming. At the forefront of the transition towards sustainable agriculture has been the Grupo de Agricultura Organica, formerly known as the Asociación Cubanes Agricultural Organica, formed in 1993. GAO brings together farmers, field managers, field experts, researchers and government officials to help spread the idea that organic-based alternatives can produce sufficient food for Cubans. Despite great progress, there remain many difficulties, including proving the success of the alternative system to sceptical farmers, scientists and policy makers, developing new technologies sufficiently quickly to meet emergent problems, coordinating the many actors to work together, the need for continued decentralization of decision making to farmer level, and the appropriate land reform to encourage investment in natural asset-building.47
The Swiss National Policy for Sustainable Agriculture The Swiss Federal Agricultural Law was revised in 1992 to target subsidies towards ecological practices, and then radically amended in 1996 following a national referendum in which 78 per cent of the public voted in favour of change.48 The main
42 Agricultural Harm to the Environment
priority was maintaining important positive side effects of upland livestock farming – in particular open meadows for skiing pistes in winter, but also maintenance of rural mountain communities that are at the root of Swiss culture. Policy now differentiates between three different levels of public support. Tier one provides support for specific biotypes, such as extensive grassland and meadows, high-stem fruit trees and hedges. Tier two supports integrated production with reduced inputs, meeting higher ecological standards than conventional farming, and Tier three provides the most support for organic farming. As the directors of the federal agricultural and environmental offices, Hans Berger and Philippe Roch, have said, ‘in ecological terms, Swiss agriculture is on the road to sustainability. There are encouraging signs that the agricultural reform has already began to have positive effects on nature and the environment.’ Farmers must meet several minimum conditions to receive payments for integrated production, the so-called ‘ecological standard’ of performance. They must provide evidence that nutrient use matches crop demands, with livestock farmers having to sell surplus manures or reduce livestock numbers. Soils must be protected from erosion, and erosive crops, such as maize, can only be cultivated if alternated in rotation with meadows and green manures. At least 7 per cent of the farm must be allocated for species diversity protection through so-called ecological compensation areas, such as unfertilized meadows, hedgerows and orchards. Finally, pesticide use is restricted. A vital element of the policy process is that responsibility to set, administer and monitor is devolved to cantons, farmers’ unions and farm advisors, local bodies and non-government organizations. By the end of the 1990s, 85 per cent of farmland complied with the basic ecological standard, which allows farmers to receive public subsidies. Some 5000 farms are now organic, and all farmers are soon expected to meet the ‘ecological standard’. Pesticide applications have fallen by a third in a decade, phosphate use is down by 60 per cent and nitrogen use by half. The land under semi-natural habitats has expanded during the decade, from 1 to 6 per cent in the plains, and from 7 to 23 per cent in the mountains. There is much to learn from these experiences of Switzerland and Cuba, as these remain the only two countries at the turn of the century who had put sustainable agriculture at the centre of their national policy. It is also true that Switzerland is wealthy and can afford these new payments to farmers for extra services, and that Cuba had no choice – it could not afford to do anything else. It is difficult to draw wide conclusions from these two cases. However, as American farmer and poet Wendell Berry has put it about his own country, ‘I cannot see why a healthful, dependable, ecologically sound farm- and farmer-conserving agricultural economy is not a primary goal of this country.’ Is there the political will in all the remaining 200 or so countries? The options are available, and the net benefits would be substantial. To date, the words have been easy, but the practice much more difficult.
Reality Cheques 43
Concluding comments In this chapter, I have adopted a fairly narrow economic perspective to set out some of the real costs of modern agricultural and food systems. The side effects, or externalities, of food production systems are substantial, yet these do not appear in the price of food. The costs of lost biodiversity, water pollution, soil degradation and ill health in humans are shifted elsewhere in economies and, because they are difficult to identify and measure, they are easily lost. Allocating monetary values to these externalities is only one part of the picture, as these methods are inevitably inexact, but they do illustrate the size of the problem. The term multifunctional, when applied to agriculture, implies a system that does more than just produce food. Agriculture shapes landscapes, water quality, biodiversity and carbon stocks in soils. All of these are important public goods, and represent new income opportunities for farmers. But progress is slow, as policy reforms have lagged behind. There is a need for radical integration of policies to support transitions towards agricultural systems that minimize their external costs and maximize their positive side-effects.
Notes 1
2 3 4
5
6
On the cheapness of food, Donald Worster recognized this about a decade ago: ‘the farm experts merely assume, on the basis of marketplace behaviour, that the public wants cheapness above all else. Cheapness, of course, is supposed to require abundance, and abundance is supposed to come from greater economies of scale, more concentrated economic organisation, and more industrialised methods. The entire basis for that assumption collapses if the marketplace is a poor or imperfect reflector of what people want’ (Worster, 1993, p87). See Astor and Rowntree (1945, p33, p47). For more on George Stapledon, see Conford, 1988, pp192–193, pp196–197. Despite my regular use of these five terms as capitals, I agree with the misgivings that many have. Capital implies an asset, and assets should be looked after, protected and built up. But as a term, capital is problematic for two reasons. It implies measurability and transferability. Because the value of something can be assigned a single monetary value, then it appears to matter not if it is lost, as we could simply allocate the required money to buy another, or transfer it from elsewhere. But we know this must be nonsense. Nature, and its cultural and social meanings, is not so easily replaceable. It is not a commodity, reducible only to monetary values. Nonetheless, as terms, natural capital and social capital have the uses in helping to reshape thinking around basic questions such as what is agriculture for, and what system works best? For further discussions, see Benton, 1998; Bourdieu, 1986; Coleman, 1988, 1990; Putnam, 1995; Costanza et al, 1997 and 1999; Carney, 1998; Flora, 1998; Grootaert, 1998; Ostrom, 1998; Pretty, 1998; Scoones, 1998; Uphoff, 1998; Pretty and Ward, 2001. Worster, 1993, p92. See also Michael Neuman of Texas A&M University, who resolves the concept of sustainability into four very simple and compelling ideas: the rates of consumption, rates of production, rates of accumulation and depletion, and rates of assimilation. See Pretty, 1998; FAO, 1999; Conway and Pretty, 1991; Altieri, 1995; Pingali and Roger, 1995; Conway, 1997.
44 Agricultural Harm to the Environment 7
8
9 10
11 12 13
14
For more on sustainable agriculture definitions and principles, see Altieri, 1995, 1999; Thrupp, 1996; Conway, 1997; Pretty, 1995a, 1998; Drinkwater et al, 1998; Tilman, 1998; Hinchliffe et al, 1999; Zhu et al, 2000; Wolfe, 2000. An externality is any action that affects the welfare of or opportunities available to an individual or group without direct payment or compensation, and may be positive or negative. See Baumol and Oates, 1988; Pearce and Turner, 1990; EEA, 1998; Brouwer, 1999; Pretty et al, 2000. Economists distinguish between ‘technological’ or physical externalities, and ‘pecuniary’, or price effect, externalities. Pecuniary externalities arise, for example, when individuals or firms purchase or sell large enough quantities of a good or service to affect price levels. The change in price levels affects people who are not directly involved in the original transactions, but who now face higher or lower prices as a result of those original transactions. These pecuniary externalities help some groups and hurt others, but they do not necessarily constitute a ‘failure’ of the market economy. An example of a pecuniary externality is the rising cost of housing for local people in rural villages that results from higher-income workers from metropolitan areas moving away from urban cores and bidding up the price of housing in those villages. Pecuniary externalities are a legitimate public concern, and may merit a public policy response. Technological externalities, however, do constitute a form of ‘market failure’. Dumping pesticides sewage into a lake, without payment by the polluter to those who are adversely affected, is a classic example of a technological externality. The market ‘fails’ in this instance, because more pollution occurs than would be the case if the market or other institutions caused the polluter to bear the full costs of its actions. It is technological externalities that are commonly simply termed ‘externalities’ in most environmental literature (see Davis and Kamien, 1972; Common, 1995; Knutson et al, 1998). For more on the value of nature’s goods and services, see Abramovitz, 1997; Costanza et al, 1997 and 1999; Daily, 1997; and the whole issue of Ecological Economics, 1999, volume 25, issue 1. See Pimentel et al, 1992, 1995; Rola and Pingali, 1993; Pingali and Roger, 1995; Evans, 1995; Steiner et al, 1995; Fleischer and Waibel, 1998; Waibel and Fleischer, 1998; Bailey et al, 1999; Norse et al, 2000. The data from these studies are not easily comparable in their original form as different frameworks and methods of assessment have been used. Methodological concerns have also been raised about some studies. Some have noted that several effects could not be assessed in monetary terms, whilst others have appeared to be more arbitrary (e.g. the $2 billion cost of bird deaths in the US is arrived at by multiplying 67 million losses by $30 a bird: see Pimentel et al, 1992). The Davison et al (1996) study on Netherlands agriculture was even more arbitrary. It added an estimate of the costs farmers would incur to reach stated policy objectives, and these were based on predicted yield reductions of 10–25% arising from neither cheap nor preferable technologies, which led to a large overestimate of environmental damage (see Bowles and Webster, 1995; Crosson, 1995; Pearce and Tinch, 1998; van der Bijl and Bleumink, 1997). On the effects of pesticides in rice, see Rola and Pingali, 1993; Pingali and Roger, 1995. Hartridge and Pearce, 2001. See Pretty et al, 2000, 2001. These are likely to be conservative estimates of the real costs. Some costs are known to be substantial underestimates, such as acute and chronic pesticide poisoning of humans, monitoring costs, eutrophication of reservoirs and restoration of all hedgerow losses. Some currently cannot be calculated, such as dredging to maintain navigable water, flood defences, marine eutrophication and poisoning of domestic pets. The costs of returning the environment or human health to pristine conditions were not calculated, and treatment and prevention costs may be underestimates of how much people might be willing to pay to see positive externalities created. The data also do not account for time lags between the cause of a problem and its expression as a cost, as some processes long since stopped may still be causing costs; some current practices may not yet have caused costs, and this study did not include the externalities arising from transporting food from farms to manufacturers, processors, retailers and finally to consumers. See Pretty et al, 2001.
Reality Cheques 45 15 The government’s Office of the Director General of Water Services sets industry price levels each 5 years, which determine both the maximum levels of water bills and specifies investments in water quality treatment. During the 1990s, the water industry undertook pesticide and nitrate removal schemes, resulting in the construction of 120 plants for pesticide removal and 30 for nitrate removal (Ofwat, 1998). Ofwat estimates that water companies will spend a further £600 million between 2000 and 2005 on capital expenditure alone due to continuing deterioration of ‘raw water’ quality due to all factors. Ofwat predicts capital expenditure for pesticides to fall to £88 million per year at the end of the 1990s/early 2000s; and for nitrate to fall to £8.3 m/yr. Although Ofwat has sought to standardize reporting, individual companies report water treatment costs in different ways. Most do distinguish treatment for pesticides, nitrate, Cryptosporidium and several metals (iron, manganese and lead). The remaining treatment costs for phosphorus, soil removal, arsenic and other metals, appear under a category labeled ‘other’. Of the 28 water companies in England and Wales, three report no expenditure on treatment whatsoever; and a further three do not disaggregate treatment costs, with all appearing under ‘other’. Twenty companies report expenditure on removal of pesticides, 11 on nitrates, and 10 on Cryptosporidium. It is impossible to tell from the records whether a stated zero expenditure is actually zero, or whether this has been placed in the ‘other’ category. Using Ofwat and water companies’ returns, we estimate that 50% of expenditure under the ‘other’ category refers to removal of agriculturallyrelated materials. 16 We originally calculated the annual external costs of these gases to be £280 million for methane, £738 million for nitrous oxide, £47 million for carbon dioxide and £48 million for ammonia. But a more appropriate measure would have been to use an accepted policy target for these costs, such as the 25% cut required to meet agreements made in the Kyoto Protocol. This would put the total annual costs at £314 million. 17 DETR, 1998a, 1998b; Pretty, 1998; Campbell et al, 1997; Pain and Pienkowski, 1997; Mason, 1998; Siriwardena et al, 1998; Krebs et al, 1999. 18 Repetto and Baliga, 1996; Pearce and Tinch, 1998; HSE, 1998a, 1998b; Pretty, 1998. 19 Fatalities from pesticides at work in Europe and North America are rare – one a decade in the UK, and eight a decade in California. In the UK, a variety of institutions collect mortality and morbidity data, but in California, where there is the most comprehensive reporting system in the world, official records show that 1200–2000 farmers, farmworkers and the general public are poisoned each year (see CDFA, passim; Pretty, 1998). There appears to be greater risk from pesticides in the home and garden where children are most likely to suffer. In Britain, 600–1000 people need hospital treatment each year from home poisoning. 20 On food poisoning in the UK, see PHL, 1999; Evans et al, 1998; Wall et al, 1996. For a study of foodborne illnesses in Sweden, see Lindqvist et al, 2001. When BSE was first identified in late 1986, research confirmed that it was a member of a group of transmissible diseases occurring in animals and humans. It appeared simultaneously in several places in the UK, and has since occurred in native born cattle in other countries. By mid-2001, more than 180,000 cases had been confirmed in the UK, the epidemic having reached a peak in 1992. The link between bovine spongiform encephalopathy (BSE) and variant Creutzfeldt-Jakob Disease (CJD) in humans was confirmed in 1996, and 100 deaths from CJD have occurred to 2001. The annual external costs of BSE were £600 million at the end of the 1990s. See NAO, 1998; WHO, 2001. By mid-2001, there had been 181,000 cases of BSE reported in the UK, 648 in Ireland, 564 in Portugal, 381 in Switzerland, 323 in France, 81 in Germany, 46 in Spain and 34 in Belgium. For more on the important lessons of BSE, see Lobstein et al, 2001; Millstone and van Zwanenberg, 2001. 21 For an excellent review of food crises and the need for new thinking in food systems, see Lang et al, 2001. Also see Waltner-Toews and Lang, 2000. 22 Donald Worster (1993, p18) points out that this was not, of course, the end of the story. Control through the levees did not stop conflicts between farmers wanting water for irrigation, and others wanting to provide waterfowl with a habitat. Nor did they stop pesticides and nutrients running
46 Agricultural Harm to the Environment
23
24 25 26 27
28 29
30
31 32 33
34 35 36 37 38 39
40 41 42 43 44
off the fields. Nor did they stop the emergence livestock feedlots with their massive production of animal wastes. On the effects of changes in the German landscape on flooding, see van der Ploeg et al, 1999, 2000. Vo-Tong Xuan, Rector of Angiang University in Vietnam notes similar problems in the Mekong Delta, where farmers have switched from one crop of floating rice per year to three short duration crops of modern varieties, which has led to an occurrence of floods on an annual basis. On the effects of landscape, in particular paddy rice, on water control in Japan, see Minami et al, 1998; Kato et al, 1997; OECD, 2000. On the externalities of Chinese agriculture, see Cai et al, 1999; Norse et al, 2000. FAO, 2000. On the values of wetlands, see Heimlich et al, 1998. For a study of eutrophication costs, see Pretty et al, 2001a, A Preliminary Assessment of the Environmental Damage Costs of Eutrophication of Fresh Waters in England and Wales. See also Postel and Carpenter, 1997 Ewel, 1997. For a study showing that the costs of creating wetlands is less than for constructing treatment plants, see Gren, 1995. See Keeny and Muller, 2000. We distinguished between value-loss costs arising from the reduced value of clean or non-eutrophic (nutrient-enriched) water, and the direct costs incurred in responding to eutrophication plus the costs of changing behaviour and practices to meet legal obligations. Value-loss costs, by definition, represent a loss of existing value, rather than an increase in costs, and are divided into two categories: use values and non-use values. Use values are associated with private benefits gained from actual use (or consumption) of ecosystem services, and can include private sector uses (e.g. agriculture, industry), recreation benefits (e.g. fishing, water sports, bird watching), education benefits, and general amenity benefits. Non-use values are of three types: option values, bequest values and existence values. See Pretty et al, 2001; also Mason, 1996; Environment Agency, 1998. Total fertilizer consumption (N, P and K) for the world was 138 million tonnes in the year 2000, comprising 83mt of nitrogen, 32mt of phosphate, and 22mt of potassium. Nitrogen consumption in western Europe was 17mt, in North America 21mt, in South Asia 21mt, in the Russian states 38mt and in China 38mt. World consumption of all fertilizer has grown from 30mt in 1960 (when nitrogen consumption was 11mt, phosphate 11mt and potassium 8mt). Data from the International Fertilizer Industry Association, Paris. WHO, 1998, Obesity. Preventing and Managing the Global Epidemic. Also see Oster et al, 1999. See WHO, 2001. For details of foodborne illnesses, see CDC, 2001; Kaeferstein et al, 1997; Mead et al, 1999. For USDA data on microbial infections in farm animals, see USDA, at www.usda.fsis.usda.gov. For costs of antibiotic resistance, see National Institute of Allergy and Infectious Diseases, at www3. niaid.nih.gov. For Centers for Disease Control, see CDC, at www.cdc.gov. See Buzby and Robert, 1997; WHO, 2001. For more on antibiotics and the emergence of resistance, see Harrison and Lederberg, 1998; Wise et al, 1998; House of Lords, 1999. See Havelaar et al, 2000; WHO, 2001; FAO, 2001. See Willis et al, 1993; Foster et al, 1997; Stewart et al, 1997; Hanley et al, 1998. See Cobb et al, 1998. Data is from the Countryside Agency and English Tourism Council surveys – 1968 million day and tourist-days were spent in the UK in 1998, of which 433 million were to the countryside, 118 million to the seaside and 1299 million to towns. IATP, 1998. Watershed Agricultural Council. Catskill/Delaware Watershed Complex, at iatp.org/watersheds. Pretty and Ball, 2001 See Pretty and Ball, 2001; Swingland et al, 2002 Growing empirical evidence on the costs of compliance with environmental regulations and taxes suggest that there has been little or no impact on the overall competitiveness of businesses or
Reality Cheques 47
45 46 47 48
countries, with some indications that they have increased efficiency and employment. See EEA, 1996, 1999; Smith and Piacentino, 1996; Ekins, 1999; OECD, 1997a; Jarass and Obermair, 1997; Rayement et al, 1998; DETR, 1999; Ribaudo et al, 1999. See Ekins, 1999, for comprehensive review of environmental taxes. See Myers, 1998; Potter, 1998; Dumke and Dobbs, 1999; Hanley and Oglethorpe, 1999. For more on Cuba, see Rosset, 1997, 1998; Funes, 2001. Swiss Agency for Environment, Forests and Landscape and Federal Office of Agriculture, 1999, 2000. Also see Dubois et al, 2000.
References Abramovitz J. 1997. Valuing nature’s services. In Brown L, Flavin C and French H (eds). State of the World. Worldwatch Institute, Washington DC Altieri M A. 1995. Agroecology: The Science of Sustainable Agriculture. Westview Press, Boulder, CO Altieri M A. 1999. Enhancing the Productivity of Latin American Traditional Peasant Farming Systems Through an Agro-ecological Approach. Paper for Conference on Sustainable Agriculture: New Paradigms and Old Practices? Bellagio Conference Centre, Italy, 26–30 April 1999 Astor, Viscount and Rowntree B S. 1945. Mixed Farming and Muddled Thinking: An Analysis of Current Agricultural Policy. Macdonald and Co, London Bailey A P, Rehman T, Park J, Keatunge J D H and Trainter R B. 1999. Towards a method for the economic evaluation of environmental indicators for UK integrated arable farming systems. Agriculture, Ecosystems and Environment 72, 145–158 Baumol W J and Oates W E. 1988 The Theory of Environmental Policy. Cambridge University Press, Cambridge Benton T. 1998 Sustainable development and the accumulation of capital: Reconciling the irreconcilable? In Dobson A (ed). Fairness and Futurity. Oxford University Press, Oxford Bourdieu P. 1986. The forms of capital. In Richardson J (ed). Handbook of Theory and Research for the Sociology of Education. Greenwood Press, Westport, CN Bowles R and Webster J. 1995. Some problems associated with the analysis of the costs and benefits of pesticides. Crop Protection 14(7), 593–600 Brouwer R. 1999. Market Integration of Agricultural Externalities: A Rapid Assessment Across EU Countries. Report for European Environment Agency, Copenhagen Buzby J C and Robert T. 1997. Economic costs and trade implications of microbial foodborne illness. World Health Statistics Quarterly 50(1–2), 57–66 California Department of Food and Agriculture. 1972-current. Summary of Illnesses and Injuries Reported by Californian Physicians as Potentially Related to Pesticides, 1972-current. Sacramento, CA Campbell L H, Avery M L, Donald P, Evans A D, Green R E and Wilson J D. 1997. A Review of the Indirect Effects of Pesticides on Birds. Report No 227. Joint Nature Conservation Committee, Peterborough Carney D. 1998. Sustainable Rural Livelihoods. Department for International Development, London CDC. 2001. Preliminary foodnet data on the incidence of foodborne illnesses. MMWR Weekly 50(13), 241–246 Cobb D, Feber R, Hopkins A and Stockdale L. 1998. Organic Farming Study. Global Environmental Change Programme Briefing 17, University of Sussex, Falmer Coleman J. 1988. Social capital and the creation of human capital. American Journal of Sociology 94, supplement S95–S120 Coleman J. 1990. Foundations of Social Theory. Harvard University Press, Harvard, MA Common M. 1995. Sustainability and Policy. Cambridge University Press, Cambridge
48 Agricultural Harm to the Environment Conford P (ed). 1988. The Organic Tradition: An Anthology of Writing on Organic Farming. Green Books, Bideford, Devon Conway G R. 1997. The Doubly Green Revolution. Penguin, London Conway G R and Pretty J N. 1991. Unwelcome Harvest: Agriculture and Pollution. Earthscan, London Costanza R, d’Arge R, de Groot R, Farber S, Grasso M, Hannon B, Limburg K, Naeem S, O’Neil R V, Paruelo J, Raskin R G, Sutton P and van den Belt M. 1997 and 1999. The value of the world’s ecosystem services and natural capital. Nature 387, 253–260; also in Ecological Economics 25(1), 3–15 Countryside Agency. 2001. The State of the Countryside 2001. Countryside Agency, Cheltenham Crosson P. 1995. Soil erosion estimates and costs. Science 269, 461–464 Daily G (ed). 1997. Nature’s Services: Societal Dependence on Natural Ecosystems. Island Press, Washington DC Davis O and Kamien M. 1972. Externalities, information, and alternative collective action. In Dorfman R and Dorfman N (eds). Economics of the Environment: Selected Readings. W W Norton and Co, New York, 69–87 Davison M D, van Soest J P, de Wit G and De Boo W. 1996. Financiële waardering van de milieuschade door de Nederlandse landbouw – een benadering op basis van de preventiekosten. [Financial valuation of environmental hazard from Dutch agriculture – an approximation based on prevention costs]. Centre for Energy Conservation and Clean Technology (CE), Delft, The Netherlands DETR. 1998a. The Environment in Your Pocket. www.environment.detr.gov.uk/des20/pocket/env24. htm DETR. 1998b. Digest of Environmental Statistics No 20. UK Emissions of Greenhouse Gases, www. environment.detr.gov.uk/des20/chapter1/ DETR. 1999. Design of a Tax or Charge Scales for Pesticides. DETR (now DEFRA), London Drinkwater L E, Wagoner P and Sarrantonio M. 1998 Legume-based cropping systems have reduced carbon and nitrogen losses. Nature 396, 262–265 Dubois D, Fried P M, Deracuasaz B and Lehman H. 2000. Evolution and instruments for the implementation of a program for whole farm environmental management in Switzerland. OECD Workshop on Adoption of Technologies for Sustainable Farming Systems, The Netherlands, July 2000. OECD, Paris COM/AGR/CA/ENV/EPOC (2000) 65 Dumke L M and Dobbs T L. 1999. Historical Evolution of Crop Systems in Eastern South Dakota: Economic Influences. Economics Research Report 99-2. South Dakota State University, Brookings Ecological Economics. 1999. 25(1). Special issue devoted to Costanza et al (1997) paper, with 12 responses (Ayres; Daly; El Serafy; Herendeen; Hueting et al; Norgaard and Bode; Opschoor; Pimentel; Rees; Templet; Toman; and Turner et al), and a reply from Costanza et al European Environment Agency (EEA). 1996. Environmental Taxes: Implementation and Environmental Effectiveness. Environmental Issues Series No 1. EEA, Copenhagen EEA. 1998. Europe’s Environment: The Second Assessment. Report and Statistical Compendium. EEA, Copenhagen EEA. 1999. Annual European Community Greenhouse Gas Inventory 1990–1996. Technical Report No 19, EEA, Copenhagen Ekins P. 1999. European environmental taxes and charges: Recent experience, issues and trends. Ecological Economics 31, 39–62 Environment Agency (EA). 1998. Aquatic Eutrophication in England and Wales: A Proposed Management Strategy. EA, Bristol Evans H S, Madden P, Douglas C, Adak G K, O’Brien S J, Djuretic T, Wall P G and Stanwell-Smith R. 1998. General outbreaks of infectious disease in England and Wales 1995–1996. Communicable Disease and Public Health 1(3), 165–171 Evans R. 1995. Soil Erosion and Land Use: Towards a Sustainable Policy. Cambridge Environmental Initiative, University of Cambridge, Cambridge
Reality Cheques 49 Ewel K C. 1997. Water quality improvement in wetlands. In Daily G (ed). Nature’s Services: Societal Dependence on Natural Ecosystems. Island Press, Washington DC FAO. 1999. The Future of Our Land. FAO, Rome FAO. 2000. Agriculture: Towards 2015/30. Global Perspective Studies Unit, FAO, Rome FAO. 2001. Animal Agriculture in the EU. Some Elements for a Way Forward. Animal Production and Health Division, FAO, Rome Fleischer G and Waibel H. 1998. Externalities by Pesticide Use in Germany. Paper presented to Expert Meeting: The Externalities of Agriculture: What do we Know? EEA, Copenhagen, May 1998 Flora J L. 1998. Social capital and communities of place. Rural Sociology 63(4), 481–506 Foster V, Bateman I J and Harley D. 1997. Real and hypothetical willingness to pay for environmental preservation: A non-experimental comparison. Journal of Agricultural Economics 48(1), 123– 138 Funes F. 2001. Cuba and Sustainable Agriculture. Paper presented to St James’s Palace conference: Reducing Poverty with Sustainable Agriculture, 15 January Gren I M. 1995 Costs and benefits of restoring wetlands: Two Swedish case studies. Ecological Engineering 4, 153–162 Grootaert C. 1998. Social Capital: The Missing Link. World Bank Social Capital Initiative Working Paper No 5, Washington DC Hanley N and Oglethorpe D. 1999. Toward Policies on Externalities from Agriculture: An Analysis for the European Union. Paper presented at American Agricultural Economics Association Annual Meeting, Nashville, Tennessee Hanley N, MacMillan D, Wright R E, Bullock C, Simpson I, Parrison D and Crabtree R. 1998. Contingent valuation versus choice experiments: Estimating the benefits of environmentally sensitive areas in Scotland. Journal of Agricultural Economics 49(1), 1–15 Harrison P F and Lederberg J (eds). 1998. Antimicrobial Resistance: Issues and Options. National Academy Press, Washington DC Hartridge O and Pearce D. 2001. Is UK Agriculture Sustainable? Environmentally Adjusted Economic Accounts. CSERGE, University College, London Havelaar A M, de Wit M A S, van Kuningeveld R and van Kempen E. 2000. Health burden in the Netherlands due to infection with thermophilic Campylobacter species. Epidemiological Infection 125, 505–522 Health and Safety Executive (HSE). 1998a. Pesticides Incidents Report 1997/8. HSE, Sudbury HSE. 1998b. Pesticide Users and their Health: Results of HSE’s 1996/7 Feasibility Study. www.open.gov. uk/hse/hsehome.htm Heimlich R E, Wiebe K D, Claasen R, Gadsby D and House R M. 1998. Wetlands and Agriculture: Private Interests and Public Benefits. Resource Economics Division. Economic Research Service, USDA. Agricultural Economics Report No 765. USDA, Washington DC Hinchcliffe F, Thompson J, Pretty J, Guijt I and Shah P (eds). 1999. Fertile Ground: The Impacts of Participatory Watershed Development. IT Publications, London House of Lords Select Committee on the European Communities. 1999. EC Regulation of Genetic Modification in Agriculture. HMSO, London IATP. 1998. Farmer-managed watershed program. www.iatp.org Jarass L and Obermair G M. 1997. More Jobs, Less Tax Evasion, Cleaner Environment. Universität Regensburg, Germany. www.suk.fh-wiesbaden.de/personen/jarass/manuskript5.html Kaeferstein F K, Motarjeni Y and Bettcher D W. 1997. Foodborne disease control. Emerging Infectious Diseases 3, 503–516 Kato Y, Yokohari M and Brown R D. 1997. Integration and visualisation of the ecological value of rural landscapes in maintaining the physical environment of Japan. Landscape and Urban Planning 39, 69–82 Keeny D and Muller M. 2000. Nitrogen and the Upper Mississippi River. Institute of Agriculture and Trade Policy, Minneapolis
50 Agricultural Harm to the Environment Knutson R, Penn J and Flinchbaugh B. 1998. Agricultural and Food Policy, Fourth edition. Prentice Hall, Upper Saddle River, NJ Krebs J R, Wilson J D, Bradbury R B and Siriwardena G M. 1999. The second silent spring? Nature 400, 611–612 Lang T, Barling D and Caraher M. 2001. Food, social policy and the environment: Towards a new model. Social Policy and Administration 35(5), 538–558 Lobstein T, Millstone E, Lang T and van Zwanenberg P. 2001. The Lessons of Phillips. Questions the UK Government Should be Asking in Response to Lord Phillips’ Inquiry into BSE. Centre for Food Policy, Thames Valley University, London Mason C F. 1996. Biology of Freshwater Pollution. 3rd edition. Addison, Wesley Longman, Harlow Mason C F. 1998. Habitats of the song thrush Turdus philomelos in a largely arable landscape. Journal of Zoology, London 244, 89–93 Mead P S, Slutsker L and Dietz V. 1999. Food related illness and death in the US. Emerging Infectious Diseases 5, 607–625 Millstone E and van Zwanenberg P. 2001. Politics of expert advice: From the early history of the BSE saga. Science and Public Policy 28(2), 99–112 Minami K, Seino H, Iwama H and Nishio M. 1998. Agricultural Land Conservation. OECD Workshop on Agri-Environmental Indicators. York, 22–25 September. OECD, Paris COM/AGR/ CA./ENV/EPOC (98) 78 Myers N. 1998. Lifting the veil on perverse subsidies. Nature 392, 327–328 National Audit Office (NAO). 1998. BSE: The Cost of a Crisis. NAO, London Norse D, Li Ji and Zhang Zheng. 2000. Environmental Costs of Rice Production in China: Lessons from Hunan and Hubei. Aileen Press, Bethesda, MD OECD. 2000. Environmental Indicators for Agriculture: Methods and Results. The Stocktaking Report – Land Conservation. OECD, Paris COM/AGRI/CA./ENV/EPOC (99) 128/REV1 Ofwat. 1992–1998. Annual Returns from Water Companies – Water Compliances and Expenditure Reports. Office of Water Services, Birmingham Oster G, Thompson D, Edelsberg J, Bird A P and Colditz G A. 1999. Lifetime health and economic benefits of weight loss among obese people. American Journal of Public Health 89, 1536–1542 Ostrom E. 1998. Social Capital: A Fad or Fundamental Concept? Centre for the Study of Institutions, Population and Environmental Change, Indiana University Pain D J and Pienkowski M W (eds). 1997 Farming and Birds in Europe. Academic Press Ltd, London Pearce D and Tinch R. 1998. The true price of pesticides. In Vorley W and Keeney D (eds). Bugs in the System. Earthscan, London Pearce D W and Turner R H. 1990. Economics of Natural Resources and the Environment. Harvester Wheatsheaf, New York PHL. 1999. Public Health Laboratory Service – facts and figures. www. phls.co.uk/facts/ Pimentel D, Acguay H, Biltonen M, Rice P, Silva M, Nelson J, Lipner V, Giordano S, Harowitz A and D’Amore M. 1992. Environmental and economic cost of pesticide use. Bioscience, 42(10), 750–760 Pimentel D, Harvey C, Resosudarmo P, Sinclair K, Kunz D, McNair M, Crist S, Shpritz L, Fitton L, Saffouri R and Blair R. 1995. Environmental and economic costs of soil erosion and conservation benefits. Science 267, 1117–1123 Pingali P L and Roger P A. 1995. Impact of Pesticides on Farmers’ Health and the Rice Environment. Kluwer Academic Press, The Netherlands Postel S and Carpenter S. 1997. Freshwater ecosystem services. In Daily G (ed). Nature’s Services: Societal Dependence on Natural Ecosystems. Island Press, Washington DC Potter C. 1998. Against the Grain: Agri-Environmental Reform in the USA and European Union. CAB International, Wallingford Pretty J N. 1998. The Living Land: Agriculture, Food and Community Regeneration in Rural Europe. Earthscan, London
Reality Cheques 51 Pretty J N and Ball A. 2001. Agricultural Influences on Emissions and Sequestration of Carbon and Emerging Trading Options. CES Occasional Paper 2001–03, University of Essex, Colchester Pretty J N and Ward H. 2001. Social capital and the environment. World Development 29(2), 209–227 Pretty J N, Brett C, Gee D, Hine R, Mason C F, Morison J I L, Raven H, Rayment M and van der Bijl G. 2000. An assessment of the total external costs of UK agriculture. Agricultural Systems 65(2), 113–136 Pretty J N, Brett C, Gee D, Hine R, Mason C, Morison J, Rayment M, van der Bijl G and Dobbs T. 2001. Policy challenges and priorities for internalising the externalities of modern agriculture. Journal of Environmental Planning and Management 44(2), 263–283 Pretty J N, Mason C F, Newell D B and Hine R E. 2001. A Preliminary Assessment of the Environmental Damage Costs of the Eutrophication of Fresh Waters in England and Wales. Report prepared for the Environment Agency, London Putnam R. 1995. Bowling alone: America’s declining social capital. Journal of Democracy 6(1), 65–78 Rayement M, Bartram H and Curtoys J. 1998. Pesticide Taxes: A Discussion Paper. Royal Society for the Protection of Birds, Sandy, Beds Repetto R and Baliga S S. 1996. Pesticides and the Immune System: The Public Health Risks. WRI, Washington DC Ribaudo M O, Horan R D and Smith M E. 1999. Economics of Water Quality Protection from Nonpoint Sources: Theory and Practice. Agricultural Economic Report Rola A and Pingali P. 1993. Pesticides, Rice Productivity and Farmers – An Economic Assessment. IRRI, Manila and WRI, Washington DC Rosset P. 1997. Alternative agriculture and crisis in Cuba. IEEE Technology and Society Magazine 16(2), 19–26 Rosset P. 1998. Alternative agriculture works: The case of Cuba. Monthly Review 50(3), 137–146 Scoones I. 1998. Sustainable Rural Livelihoods: A Framework for Analysis. IDS Discussion Paper, 72, University of Sussex, Falmer Siriwardena G M, Ballie S R, Buckland G T, Fewster R M, Marchant J H and Wilson J D. 1998. Trends in the abundance of farmland birds: A quantitative comparison of smoothed Common Birds Census indices. Journal of Applied Ecology 35, 24–43 Smith S and Piacentino D. 1996. Environmental Taxation and Fiscal Reform: Analysis of Implementation Issues. Final Report EV5V-CT894-0370, DGXI, Brussels Steiner R, McLaughlin L, Faeth P and Janke R. 1995. Incorporating externality costs in productivity measures: A case study using US agriculture. In Barbett V, Payne R and Steiner R (eds). Agricultural Sustainability: Environmental and Statistical Considerations. John Wiley, NY, 209–230 Stewart L, Hanley N and Simpson I. 1997. Economic Valuation of the Agri-Environment Schemes in the UK. Report to HM Treasury and the Ministry of Agriculture, Fisheries and Food. Environmental Economics Group, University of Stirling, Stirling Swingland I, Bettelheim E, Grace J, Prance G and Saunders L (eds). 2002. Carbon, biodiversity, conservation and income. Transactions of the Royal Society (Series A: Mathematical, Physical and Engineering Sciences), in press Swiss Agency for Environment, Forests and Landscape. 1999. The Environment in Switzerland: Agriculture, Forestry, Fisheries and Hunting. www.admin.ch/buwal/e/themen/partner/landwirt/ ek21u00.pdf Swiss Agency for Environment, Forests and Landscape and Federal Office of Agriculture. 2000. Swiss Agriculture on Its Way to Sustainability. SAEFL and FOA, Basel Thrupp L A. 1996. Partnerships for Sustainable Agriculture. World Resources Institute, Washington DC Tilman D. 1998. The greening of the green revolution. Nature 396, 211–212 Uphoff N. 1998. Understanding social capital: Learning from the analysis and experience of participation. In Dasgupta P and Serageldin I (eds). Social Capital: A Multiperspective Approach. World Bank, Washington DC
52 Agricultural Harm to the Environment van der Bijl G and Bleumink J A. 1997. Naar een Milieubalans van de Agrarische Sector [Towards an Environmental Balance of the Agricultural Sector]. Centre for Agriculture and Environment (CLM), Utrecht van der Ploeg R R, Ehlers W and Sieker F. 1999. Floods and other possible adverse effects of meadowland area decline in former West Germany. Naturwissenschaften 86, 313–319 van der Ploeg R R, Hemsmeyer D and Bachmann J. 2000. Postwar changes in landuse in former West Germany and the increasing number of inland floods. In Marsalek et al (eds). Flood Issues in Contemporary Water Management. Kluwer Academic Publications, The Netherlands, 115–123 Waibel H and Fleischer G. 1998. Kosten und Nutzen des chemischen Pflanzenschutzes in der Deutsen Landwirtschaft aus Gesamtwirtschaftlicher Sicht. Vauk-Verlag, Kiel Wall P G, de Louvais J, Gilbert R J and Rowe B. 1996. Food poisoning: Notifications, laboratory reports and outbreaks – where do the statistics come from and what do they mean? Communicable Disease Report 6(7), R94–100 Waltner-Toews D and Lang T. 2000. A new conceptual base for food and agricultural policy. Global Change and Human Health 1(2), 2–16 World Health Organization (WHO). 1998. Obesity. Preventing and Managing the Global Epidemic. WHO Technical Report 894. WHO, Geneva WHO. 2001. Food and Health in Europe. A Basis for Action. Regional Office for Europe, WHO, Copenhagen Willis K, Garrod G and Saunders C. 1993. Valuation of the South Downs and Somerset Levels Environmentally Sensitive Areas. Centre for Rural Economy, University of Newcastle upon Tyne Wise R, Hart T, Cars O, Streulens M, Helmuth R, Huovinen P and Sprenger M. 1998. Antimicrobial resistance. British Medical Journal 317, 609–610 Wolfe M. 2000. Crop strength through diversity. Nature 406, 681–682 Worster D. 1993. The Wealth of Nature: Environmental History and the Ecological Imagination. Oxford University Press, New York Zhu Y, Chen H, Fen J, Wang Y, Li Y, Zhen J, Fan J, Yang S, Hu L, Leaung H, Meng T W, Teng A S, Wang Z and Mundt C C. 2000. Genetic diversity and disease control in rice. Nature 406, 718– 722
3
External Costs of Agricultural Production in the United States Erin M. Tegtmeier and Michael D. Duffy
Introduction All agricultural practices impact the environment. Industrial agriculture is increasingly being recognized for its negative consequences on the environment, public health and rural communities. Soil loss and erosion reduce crop yields and impair natural and manmade water systems (Atwood, 1994; Clark et al, 1985; Crosson, 1986; Evans, 1996; Holmes, 1988; Pimentel et al, 1995). Runoff of agricultural chemicals from farm fields contaminates groundwater and disrupts aquatic ecosystems (Conway and Pretty, 1991; Pimentel et al, 1992; Pretty et al, 2003; USDA, 2000d; Waibel and Fleischer, 1998). Monocropping and feedlot livestock production threaten diversity and may increase foodborne pathogens and antibiotic resistance in humans, as well as pest resistance to chemical controls (Altieri, 1995; Iowa State University and The University of Iowa Study Group, 2002; National Research Council, 1989). The health of rural communities is affected negatively by declining community involvement and increased division of social classes (Bollman and Bryden, 1997; Flora et al, 2002). The costs of impacts are external to agricultural systems and markets for products. They are borne by society at large. Assessing the monetary costs of such impacts aids in fully identifying their consequences. Cost estimates can inform and guide policy makers, researchers, consumers and agricultural producers and may encourage a closer look at the impacts of industrial agriculture. According to Western neoclassical economics, well-defined property rights ensure that an owner benefits exclusively from use of property and wholly incurs the costs of use. However, in many circumstances, costs are borne by those who are not decision makers. Impacts of agriculture involve costs to individuals and communities who are not making decisions about production methods. These consequences indicate when property rights are not well defined and they represent Reprinted from Tegtmeier E and Duffy A. 2004. The external costs of agricultural production in the United States. Int. J. Agric. Sust. 2(1), 155–175, Earthscan, London.
54 Agricultural Harm to the Environment
market failures, which lead to economic inefficiencies. In an unregulated situation, a polluter will weigh the private costs and benefits of an action, producing too much pollution with too little cleanup or producing too much product at too low a price (Miranowski and Carlson, 1993; Samuelson and Nordhaus, 1995). Because these effects occur outside the marketplace, they are called externalities. ‘Negative’ externalities occur when costs are imposed; ‘positive’ externalities occur when others gain benefits without charge. To identify forces resulting in externalities and actions that may mitigate their effects, economists distinguish types of externalities. They can be broadly classified by the nature of their consumption (public vs private) and by their effects on resource allocation (pecuniary vs technological). An externality is ‘consumed’ by those affected by it. Many externalities have the characteristic of a public good (or bad) where consumption by one individual does not reduce the good’s availability to others nor the utility of consumption received by others (Baumol and Oates, 1988). For example, polluted air or scenic views are experienced in this way. They are public and undepletable and are not exchanged in the marketplace where each consumer can be charged for use. A private externality, however, is depletable. If an individual dumps trash onto another’s property, this affects only the victim (Baumol and Oates, 1988). Externalities that affect public goods are of greater policy interest because there are fewer ‘defensive activities’ available to victims. Externalities also are differentiated by whether the competitive marketplace can adjust to their effects. In the context of agriculture, soil erosion is a technological externality, whereas the decline of rural communities as a consequence of the character and structure of large, industrial farms is considered pecuniary. Research has described declines in purchases from local businesses, increases in crime and civil court cases and decreased property values (Flora et al, 2002). These effects, although undesirable, are not results of market failure in the neoclassical sense. They are, rather, results of the market responding to changes in supply and demand. Economists and policy makers rely on valuation, or the process of assigning economic value, to apply the concept of externalities. A monetary metric provides a base for comparisons to aid in policy decisions. Externalities, however, often are highly complex and difficult to delineate. Even though assumptions are necessary, economists continue to refine techniques and view valuation as a way of revealing problems with the status quo. A key assumption underlying valuation is that economic value of an object or service is derived through a function that contributes to human well-being and can be measured by ‘establishing the link between that function and some service flow valued by people’ (Freeman, 1998, p305). Measurement is based on the concepts of willingness to pay (WTP) for the improvement of an object or service or willingness to accept compensation (WTAC) for its deterioration (Farber et al, 2002; Hanley et al, 1997). Valuation approaches generally fall into two categories: direct survey methods and indirect methods (Hanley et al, 1997; Zilberman and Marra, 1993). Survey techniques seek to measure individual preferences for improvement
External Costs of Agricultural Production in the United States 55
in a situation or loss of well-being associated with a condition. Indirect valuation methods observe behaviour in related markets and use such data as proxies. In all valuation efforts, sufficient and reliable data are a concern. People who are surveyed often do not have well-defined preferences to which they can assign value or they simply may not be familiar with the services provided by an environmental resource (Hanley et al, 1997). Also, value for many resources is composed of both use values and non-use values that may be particularly difficult to delineate (Hanley et al, 1997). Non-use values include existence value (the value of knowing a thing merely exists, regardless of intent to use) and option value (the value of preserving a resource for possible future use). We continue to learn about the intricacies of ecosystems on a societal level, but critical data that would strengthen current indirect valuation projects often are not available. Also, environmental externalities, especially those associated with agriculture, frequently have broad spatial and temporal effects, adding to the complexity of valuation efforts.
Study Framework This study assembles available valuation data to arrive at an aggregate, national figure for particular external costs of agricultural production in the US. We focus on technological externalities with public goods characteristics. A literature review revealed data on such externalities in three broad damage categories: • • •
natural resources (composed of water, soil and air subcategories); wildlife and ecosystem biodiversity; human health (composed of pathogen and pesticide subcategories).
A study on the total external costs of agriculture in the UK (Pretty et al, 2000) guided our work. Pretty et al compiled data from various datasets and studies to estimate costs, categorized by damages to natural capital and human health. They calculated costs of £208 per hectare of arable land and permanent pasture. This figure is higher than the cost per cropland hectare for the US reported here. The difference, in part, may be due to the inclusion of costs of the BSE (bovine spongiform encephalopathy or ‘mad cow’) crisis and the difference in agricultural land area. Also, the UK study included costs to public agencies for monitoring and administering environmental and public health programmes associated with agriculture. We collected programme costs in the form of agency budgets, but decided not to incorporate them into our total cost figure. This is not meant to diminish the research and conclusions of Pretty et al. But, considering the available data for direct costs, we feel that using programme costs as proxies could be viewed as double counting. And, as Pretty et al acknowledge, such activities may be necessary for any type of agricultural production. However, programme costs would likely decrease if agriculture were more environmentally benign.
56 Agricultural Harm to the Environment
Other studies on agricultural cost accounting in the UK include Adger and Whitby (1991, 1993) and Hartridge and Pearce (2001). Estimates can be found for other European countries as well: Denmark (Schou, 1996), France (Bonnieux et al, 1998; le Goffe, 2000; Piot-Lepetit et al, 1997) and Italy (Tiezzi, 1999). A discussion on integrating agricultural externalities for a number of countries in the EU can be found in Brouwer (1999). For the US, work has been done by Faeth and Repetto (1991), Hrubovcak et al (2000), Smith (1992) and Steiner et al (1995). The study by Steiner et al is the most comparable to our research in that it compiles available data on national estimates of agricultural externalities. Our analysis relies on some of the same sources, indicating how the lack of current, available data limits investigation. Steiner et al (1995, p210) also acknowledge that external costs ideally should be calculated on a ‘location-specific basis – which currently is impossible because of a lack of information’. We subsequently have found a dearth of local or regional data to qualify the national figures. Steiner et al focused on externalities caused by pesticides, fertilisers and soil erosion and included regulatory programme costs. As reported in 1987–1990 dollars, these costs total $1.3–3.6 billion, $12–33 million and $5.8–20.3 billion, respectively. In effect, we update their study and add information on the treatment of surface water for microbial pathogens, human health costs caused by foodborne pathogens and greenhouse gas emissions. We also attempt to identify, within the scope of the damage categories, a total cost figure attributable to agriculture and a cost figure per cropland hectare.
Methods Previous studies that assign values to specific impacts of agriculture in the US form the basis of our analysis. Cost estimates are revised and updated to reflect changes in conditions and the Consumer Price Index. Final figures are in 2002 dollars. Two points in the methodology call for further clarification. We used the Consumer Price Index as opposed to one of the other indices available because we felt that the impact of externalities would be more directly felt by consumers than producers. A second point concerns the changes in technology or production practices that may have occurred since the original estimates were made. In our calculations of damages due to soil erosion, we deflate some of the estimates by a multiplier to address the subsequent decrease in soil erosion. However, this methodology does not fully account for the changes. There really is not a clean way to make such adjustments. This issue points to the need for more updated estimates. Cost estimates are classified according to production type (crop or livestock) and area-based external cost figures for crop production are also calculated. Agricultural land use areas reported by the US Department of Agriculture (USDA, 2000b) are used. Of 184.1 million hectares of cropland in the US, approximately
External Costs of Agricultural Production in the United States 57
15.3 million are idled each year. The remaining 168.8 million hectares is used for area-based calculations. The external cost of crop production within each damage category is divided by 168.8 million hectares to arrive at cost per hectare figures. Area-based figures are not calculated for those external costs associated with livestock production, considering that production practices and the land areas they affect vary greatly and depend on the animal being raised. Table 3.1 presents our resulting national tally. Table 3.2 summarizes programme budgets of agencies associated with agricultural activities. Following the tables, each damage category is further described with calculation details.
Results (1) Damage to water resources Impacts on water resources are gauged by the costs of treatment necessary to control major pollutants associated with agricultural production (microbial pathogens, nitrate and pesticides). (1a) Treatment for microbial pathogens Microorganisms in livestock waste can cause several diseases and human health problems. Cryptosporidium and Giardia are waterborne, disease-causing parasites (USDA, 2000e). They are found in beef herds and Cryptosporidium may be prevalent among dairy operations (Juranek, 1995; USDA, 1994, 2000d). Cryptosporidium oocysts have been found in 67–97 per cent of surface water sampled in the US according to the Centers for Disease Control and Prevention (CDC, 1996). The Interim Enhanced Surface Water Treatment Rule is one of the EPA’s latest rulings on microbial protection addressing Cryptosporidium and continuing requirements for Giardia and viruses. According to the EPA’s Office of Water, the total annualized national cost for implementing this rule is $307 million (USEPA, 1998a). There are three potential sources of both Giardia and Cryptosporidium: wildlife, domestic livestock and humans (Pell, 1997). From this, we assume that livestock causes one-third, or approximately 35 per cent, of the damages associated with these pathogens. Applying 35 per cent to $307 million, $107.5 million of the national cost to meet the ruling may be due to livestock production. Updated from 1998 to 2002 dollars, the cost is $118.6 million. (1b) Treatment for nitrate Nitrate, a compound of nitrogen, can leach into groundwater sources or be carried by soil particles into surface waters via runoff. Agricultural sources of nitrate include fertilizers, livestock waste and mineralization of crop residues. Agricultural regions have been shown to be highly vulnerable to nitrate contamination of surface and groundwater (USDA, 2000d). Nitrate impairs aquatic ecosystems and is
58 Agricultural Harm to the Environment Table 3.1 Selected annual external cost of US agricultural production (2002, million $) 1 la lb lc 2 2a 2b 2c 2d 2e 2f 2g 2h 3 3a 3b
4 4a 4b 4c 4d 4e 5 5a 5b 6 6a
a
Damage categories Damage to water resources Treatment of surface water for microbial pathogens Facility infrastructure needs for nitrate treatment Facility infrastructure needs for pesticide treatment Category 1 Subtotal Damage to soil resources Cost to water industry Cost to replace lost capacity of reservoirs Water conveyance costs Flood damages Damages to recreational activities Cost to navigation: shipping damages, dredging Instream impacts: commercial fisheries, preservation values Off-stream impacts: industrial users, steam power plants Category 2 Subtotal Damage to air resources Cost of greenhouse gas emissions from cropland Cost of greenhouse gas emissions from livestock production Category 3 Subtotal Damage to wildlife and ecosystem biodiversity Honeybee and pollination losses from pesticide use Loss of beneficial predators by pesticide applications Fish kills due to pesticides Fish kills due to manure spills Bird kills due to pesticides Category 4 Subtotal Damage to human health – pathogens Cost of illnesses caused by common foodborne pathogens Cost to industry to comply with HACCP rule Category 5 Subtotal Damage to human health – pesticides Pesticide poisonings and related illnesses Category 6 Subtotal TOTALS:
Costs
C/La
118.6 188.9 111.9 419.4
L C C
277–831.1 241.8–6044.5 268–790 190–548.8 540.1–3183.7 304–338.6 224.2–1218.3
C C C C C C C
197.6–439.7 C 2242.7–13,394.7 283.8 166.7
C L
450.5 409.8 666.8 21.9–51.1 11.9 34.5 1144.9–1174.1
C C C L C
375.7
L
40.7–65.8 416.4–441.5
L
1009.0 C 1009.0 5682.9–16,889.2 (£3256.3–9677.5 million)
C/L, refers to production type that is main cause of impact: crop or livestock.
External Costs of Agricultural Production in the United States 59 Table 3.2 Associated costs – agency budgets (millions $)a Damage categories
Costs
C/Lb
153.2
C&L
1
Damage to water resources
1d
USEPA FY2003 budget requests for Nonpoint Source Programme and state grants (USEPA, 1997b, 2001a, 2002d)
4
Damage to wildlife and ecosystem biodiversity
4f
USEPA FY2003 budget for Reduce Public and Ecosystem Risk from Pesticides goal (USEPA, 2002d)
21.9
C
4g
USDA FY2003 budget for Natural Resources Conservation Service (USDA, 2002b)
1260.0
C&L
4h
USDA FY2003 budget for Farm Service Agency Conservation Programmes (USDA, 2002b)
1968.0
C&L
Category 4 Subtotal 3249.9 5
Damage to human health – pathogens
5c
USDA Food Safety and Inspection Service FY2003 budget (USDA, 2002b)
27.2
L
5d
FDA Food Safety Initiative FY2002 estimated budget (FDA, 2002)
8.4
L
5e
USDA ARS FY1999 budget for food safety, pathogen preharvest research (USDA, 2002a)
21.2
C&L
5f
USDA APHIS FY2003 budget for Plant & Animal Health Monitoring (USDA, 2002b)
143.0
C&L
5g
USDA AMS FY2003 budget for Microbiological Data Programme (USDA, 2002b)
1.5
C
6
Damage to human health – pesticides
6b
EPA Safe Food Programme FY2003 budget request (USEPA, 2002a, 2002d)
86.7
C
6c
USEPA FY2003 budget for Reduce Public and Ecosystem Risk from Pesticides goal (USEPA, 2002d)
27.7
C
6d
USDA AMS FY2003 budget for Pesticide Data Programme (USDA, 2002b)
15.0
C
Category 5 Subtotal 201.3
Category 6 Subtotal 129.4 TOTAL: 3733.8 (£2139.5 million) a b
Contact authors for calculation information on programme costs. C/L, refers to production type that is main cause of impact: crop, livestock or both.
a human health concern. It can be converted to nitrite in the gastrointestinal tract and may prevent the proper transport of oxygen in the bloodstream, causing methemoglobinaemia, or ‘blue-baby syndrome’ in infants (USDA, 2000d).
60 Agricultural Harm to the Environment
Human activities have doubled the amount of nitrogen in our ecosystems since the 1970s through atmospheric deposition of nitrogen compounds (USEPA, 2002b). Fossil fuel combustion is the primary source of nitrogen oxides (NOx). Transportation-related sources (engines in vehicles) account for 53 per cent of these emissions, totalling 10–11 million tonnes of NOx, and large, stationary utility and industrial boilers account for 45 per cent (USEPA, 2002b). Emissions of ammonia (NH3) from livestock and fertilized croplands contribute to atmospheric deposition of ammonium (NH4) (Vitousek et al, 1997, as cited in Lawrence et al, 1999). Because ammonium is highly water-soluble, it tends to be deposited closer to emission sources than nitrogen oxides. The EPA estimated, in 1995 dollars, a total investment of $200 million was needed immediately for water treatment facilities to meet federal nitrate standards. Also, an estimated $3.3 billion is needed over 20 years to replace and maintain water system infrastructure to meet surface water, coliform and nitrate standards (USEPA, 1997a). Considering the additional cost for infrastructure maintenance, we use $200 million as an annual cost. Pretty et al estimated that 80 per cent of nitrate pollution is due to agriculture. We apply this same percentage to $200 million. In 2002 dollars, the facilities cost is $188.9 million per year. For comparison, Crutchfield et al (1997) employed WTP survey methods to estimate the value placed on reducing nitrates in drinking water for households in four regions in the US. Estimates were $314–351 million per year. Water treatment costs for nitrate are associated mostly with background levels of inorganic nitrogen from fertilizers. Catastrophic manure spills occur intermittently and are not considered here. Many farmers, but not all who should, appropriately credit nitrogen applied to cropland via manure. (1c) Treatment for pesticides Pesticides from agriculture enter surface and groundwater systems through runoff and leachate and pose risks to aquatic and human health. Approximately 447 million kilograms of active ingredients from pesticides are currently used in crop production in the US (Gianessi and Marcelli, 2000) and a number of studies have detected pesticides in water supplies (USDA, 2000d). The EPA estimated a total need of $400 million, in 1995 dollars, for treatment facilities to meet Safe Drinking Water Act (SDWA) regulations for pesticides and other chemicals (USEPA, 1997a). Approximately 30 per cent of the chemicals listed are pesticides (USEPA, 1998b). Also, agriculture’s share of national, conventional pesticide usage is 79 per cent (USEPA, 1999a). So, the $400 million figure is revised using multipliers of 30 per cent and 79 per cent. Updated to 2002 dollars, the annual cost is $111.9 million. This figure does not account for many unregulated pesticides.
External Costs of Agricultural Production in the United States 61
Category 1 summary Total damage to water resources due to agricultural production, according to available research, is calculated to be $419.4 million per year. Crop or livestock production is associated with these costs as follows:
• •
Livestock – treatment for microbial pathogens ($118.6 million); Crop – infrastructure needs for treatment of nitrate and pesticides ($300.8 million).
Using the above cost totals and 168.8 million hectares of cropland, water resources are impacted by cropland at a level of $1.78 per hectare annually. This is not a complete review of all impacts on water by agricultural production. Of note, the multifaceted impacts of agricultural chemicals and sedimentation on aquatic ecosystems are not included here. The next subsection on soil resources addresses effects of sedimentation on water treatment, storage and conveyance systems. Valuation also is included for fish kills due to pesticides in Subsection 4. However, these do not fully address structural disturbances to habitats and the food chain of aquatic environments.
(2) Damage to soil resources Agriculture practices result in soil erosion through tillage, cultivation and land left bare after harvest. After such disturbances, wind and water carry soil particles off the land. In 1997, average annual soil erosion due to water from cropland and land in the Conservation Reserve Program (CRP) was 969 million tonnes, with approximately 958 million tonnes coming off cropland. Erosion due to wind in that same year was 762 million tonnes (USDA, 2000c). Conservation efforts since 1982 have reduced soil erosion by 38 per cent on cropland and CRP land combined (USDA, 2001b), with the composition of the combined land use changing as cropland has been enrolled in the CRP. Still, agriculture remains the single largest contributor to soil erosion. To date, external costs of waterborne erosion have been studied and quantified more than those of windborne erosion. Thus, the costs that follow reflect damages due to waterborne erosion only. Because soil erosion greatly affects the condition and use of surface waters, the following costs support the need for integrated land and water policies. Erosion reduces soil fertility, organic matter and water-holding capacity and negatively affects productivity. Environmental externalities may result with increases of fertilizer and pesticide use to counteract these effects. On-farm costs of lost productivity due to soil erosion are not included here, assuming the majority of these costs are borne by the producer. Although this is not entirely true, it is beyond the scope of this study to identify on-site effects that have off-site impacts. Some estimates of annual on-farm costs due to soil loss include $500–600 million (Crosson, 1986), $500 million to $1.2 billion (Colacicco et al, 1989) and $27 billion (Pimentel et al, 1995).
62 Agricultural Harm to the Environment
(2a) Cost to water industry Sediment causes turbidity in water supplies and transports toxic materials, including fertilizer and pesticide residues that are bound to clay and silt particles. According to Holmes (1988), sediment contributes 88 per cent of total nitrogen and 86 per cent of total phosphorus to the nation’s waterways. Annual costs of supplying water are based on Holmes’ method, using a range of treatment costs multiplied by national surface water withdrawals. Updated to 2002 dollars, Holmes’ treatment costs are $26.38–78.22 per million litres. Similarly, the EPA’s Office of Water (2001c) claims that the cost to treat and deliver drinking water is approximately $527.8 per million litres, 15 per cent of which goes to treatment. According to these figures, treatment costs $79.17 per million litres. In 1995, water withdrawn for public supply was estimated at 152.174 billion litres per day, of which 63 per cent (approximately 95.87 billion litres per day) was from surface water sources (USGS, 1998). Holmes (1988) estimated that cropland contributes 30 per cent of total suspended solids. Therefore, costs attributed to agriculture are calculated using 30 per cent of the estimate of 95.87 billion litres per day at a cost of $26.38–79.17 per million litres. Our numbers, $277–831.1 million, are likely to be conservative because treatment of groundwater sources and erosion from pastureland are not considered. However, there may be some overlap between these costs and those to meet nitrate water standards as discussed previously. (2b) Lost capacity of reservoirs Reservoir capacity lost to sedimentation poses a complex problem. Many existing reservoirs are irreplaceable because of unique site characteristics. Dredging is almost prohibitively expensive at a minimum cost of $2.50 per cubic metre. Additionally, there are few disposal sites for dredged material. Alternative energy sources may partially alleviate the need for reservoirs for energy production, but, in terms of water storage, the problem remains (Morris and Fan, 1998). Although building new reservoirs may not be the realistic solution, this impact is calculated in terms of construction costs to provide some valuation of the problem. Crowder’s model (1987) for assessing the cost of reservoir sedimentation is updated. Total national water storage capacity is 627.6 billion cubic metres (Graf, 1993; Morris and Fan, 1998). Crowder (1987) reported that 0.22 per cent of the nation’s water storage capacity is lost annually. Atwood (1994, as cited in USDA, 1995) examined survey records of reservoirs and lakes and found an average storage loss of 5 per cent from sediment depletion. Construction costs for new capacity from 1963 to 1981 were $243.40–567.70 per thousand cubic metres (Crowder, 1987). Updating the median from 1981 to 2002 dollars yields $802.60 per thousand cubic metres. Total costs are calculated using 0.2–5 per cent loss of total national capacity (627.6 billion cubic metres) at the $802.60 per thousand cubic metres replacement
External Costs of Agricultural Production in the United States 63
value. According to Crowder’s analysis, 24 per cent of sediment is from cropland. Reflecting this percentage, final total costs are $241.8–6044.5 million. (2c) Cost to water conveyance systems Roadside ditches and irrigation canals become clogged and require sediment removal and maintenance to prevent local flooding. A cost range of $268–790 million is calculated by updating Ribaudo’s (1989) figures for these categories and allotting 50 per cent for the contribution of sediment from cropland (Clark et al, 1985). Subcategories 2d to 2h These estimates are based primarily on the work of Clark et al (1985) who calculated total erosion effects and applied a multiplier for the percentage due to cropland appropriate to each category. However, erosion from cropland has decreased by 38 per cent since this work (USDA, 2001b). To reflect this improvement, the cropland erosion for each category is multiplied by 62 per cent and updated to 2002 dollars. (2d) Flood damages Sediment contributes heavily to floods and flood damages by increasing water volumes and heights and settling on property once floodwaters have abated. Figuring the percentage of flood damages that are due to sediment, as well as the percentage of sediment that is due to agricultural practices, is highly speculative, as indicated by the range of estimates. The estimate by Clark et al of flood damages due to cropland erosion, but not including loss of life, is revised by the method discussed above to yield a range of $184.5–548.8 million. Ribaudo (1989) reported a cost range of $653–1546 million in 1986 dollars for annual damages due to soil erosion. Using 32 per cent due to cropland, as per Clark et al (1985) and updating to 2002 dollars, the revised range is $343–812 million, but this does not account for decreased erosion rates since the late 1980s. The Federal Emergency Management Agency (FEMA) reports dollars and lives lost for billion-dollar weather disasters from 1980 to 1997 (FEMA, 2002). Average annual damages are estimated at $6.4 billion in 2002 dollars and 30 lives lost. Numerous studies have arrived at different estimates for the value of a life. An EPA document (1999b) reviews 26 studies and calculates a mean value for avoiding one statistical death to be $5.9 million. The annual cost of floods increases to $6.6 billion when using this valuation for each of the 30 lives lost. Applying percentages of flood damages due to sedimentation (9–22 per cent) and sedimentation due to cropland (32 per cent) as per Clark et al (1985), $190–465 million of this $6.6 billion could be attributable to agriculture. This last estimate calculated from FEMA data falls within the revised range of Clark et al. High and low range estimates are eliminated as potential outliers. Also, the high end of the valuation based on Ribaudo (1989) may be dropped, considering
64 Agricultural Harm to the Environment
the revision does not account for the subsequent decrease in cropland erosion. So, the range of $190–548.8 million is used in the national tally. (2e) Cost to recreational activities As sediment builds up in lakes and rivers, surface water recreation, including fishing, decreases. Freeman (1982) determined the costs of water pollution that affect recreation. Clark et al used these cost figures and applied a proportion due to sediment as calculated by Vaughan and Russell (1982). Not included were the costs of accidental deaths and injuries caused by increased turbidity. The range revised to 2002 dollars is $540.1–3183.7 million. (2f) Cost to navigation Sediment from erosion collects in navigational channels causing groundings and delays, reliance on smaller vessels and lighter loads, and damage to engines due to sand, pollution and algae. To assess value in this category, Clark et al (1985) included only commercial shipping damages from inland groundings ($20–100 million) and costs for dredging by the US Army Corps of Engineers (USACE), which we update. Accidents and fuel or cargo spills also cause injuries and deaths and damage to public health and the environment; however, these have not been assessed here. According to the Navigation Data Center (USACE, 2003), the FY2002 cost for dredging navigational channels by the Army Corps and its contractors was $922.9 million. Commercial shipping damages, according to Clark et al, are revised and added to an estimate of national dredging costs. Taking 32 per cent of the result to account for sedimentation from cropland (Clark et al, 1985), the final costs to navigation due to agricultural activities are approximately $304–338.6 million. (2g) Other in-stream costs: Commercial fisheries and preservation values Clark et al uses Freeman’s (1982) estimates of benefits to commercial fisheries and preservation values that could be gained by controlling water pollution from all sources. Preservation values are non-user values, and, in this case, cleaner water provides non-users with aesthetic and ecological benefits and options for future use. As revised, these annual figures are $224.2–1218.3 million. Sediment, with its associated contaminants and algal blooms, negatively impacts waterfront property values. A study of lakeside properties in Ohio (Bejranonda et al, 1999) figured benefits to annual rental rates of $23.22–115.90 per ac-ft ($1.88–9.40 per 100 cubic metres) were accrued by reducing the rate of sediment inflow. However, impacts of sediment on property values are not included in the tally because these values cannot be applied nationally and no other sources were found.
External Costs of Agricultural Production in the United States 65
(2h) Other off-stream costs: Municipal and industrial users Municipal and industrial users, including steam power plants, experience increased operational costs associated with dissolved minerals and salts remaining in water received from water treatment suppliers. To avoid scale and algae build-up in water and boiling systems, water needs to be demineralized and treated. Again using revised calculations of Clark et al, these costs are estimated at $197.6–439.7 million. Category 2 summary According to this research, total damage to soil resources due to agricultural production is calculated to be $2242.7–13394.7 million per year. Although waterborne erosion is considerable on western rangelands, our sources focused on cropland erosion, which is associated with all of these costs. Using the above cost totals and 168.8 million hectares of cropland, soil resources are impacted by crop production at a level of $13.29–79.35 per hectare annually. The external cost of the eroded soil itself can be calculated by dividing the total damages due to cropland by 958 million tonnes of erosion from cropland each year. These costs range from $2.34–13.98 per tonne of eroded soil. The damage totals for impacts on soil resources are among the highest for categories covered in this study. Perhaps, this is because a great deal of research exists on soil erosion from agriculture, which has been a long-term concern. Also, the direct effects of soil erosion may be simpler to track and analyse than damages to other categories.
(3) Damage to air resources Agriculture damages air resources through: • • • • •
particulate matter released by soil erosion; volatilization of ammonia (NH3) from urea and manure fertilizers; emissions of nitric oxide (NO) and nitrous oxide (N2O) from fertilizer applications, field burning and soil denitrification; hazardous pollutants from manure storage at concentrated animal feeding operations (CAFOs) (Thorne, 2002); emissions of methane (CH4) from enteric fermentation and eructation (belching) of ruminant livestock and manure storage (Cavigelli et al, 1998; USEPA, 2003).
Some of these releases are greenhouse gases, which interact with the environment and affect human and ecological health. They cause climate change through atmospheric warming, aggravate pulmonary and respiratory functioning, degrade building materials and contribute to the acidification and eutrophication of water resources. Greenhouse gas emissions from agricultural sources in 2001 totalled 474.9 million tonnes carbon dioxide equivalents, which represents approximately 7 per cent of
66 Agricultural Harm to the Environment
total greenhouse gas emissions in the US, including 70 per cent of all nitrous oxide emissions from anthropogenic activities and 25 per cent of total CH4 emissions (USEPA, 2003). The net impact of agriculture is lessened by the up take of carbon by agricultural soils, and policy efforts are underway to promote practices that will increase this carbon sequestration. Agricultural soils provided a sink for 15.2 million tonnes carbon dioxide equivalents in 2001 (USEPA, 2003). Two sources of valuation for greenhouse gases provide a range of estimates. A study by Titus (1992) considers impacts of climate change to the US, including effects on agricultural production, increases in energy consumption, sea level rise, heat-related deaths and change in forest biomass. The study calculates that a doubling of CO2 (and equivalents) could cost $37–351 billion per year (1992 dollars). Also, the marginal cost of climate change from burning one gallon of gasoline is calculated at $0.16–0.36, at a 3 per cent discount rate. This translates to $20–50 per tonne carbon dioxide equivalents (2002 dollars). The Chicago Climate Exchange enables member corporations, municipalities and other institutions to trade greenhouse gas credits in an effort to ‘determine the most cost-effective means of reducing overall emissions’ (Chicago Climate Exchange, 2004). Members who have reduced emissions receive credits, which can be sold to other members. The final market price for 2003 carbon dioxide equivalents closed at $0.98 per tonne. This is much lower than the range calculated in the Titus study. This is not surprising because the trading price is what companies are willing to pay for emission reductions and does not necessarily reflect health and environmental externalities. Also, participation in the Exchange is strictly voluntary. However, in the interest of being conservative, we use $0.98 per tonne carbon dioxide equivalents. As discussed, net emissions from agriculture in 2001 were 459.7 million tonnes carbon dioxide equivalents, according to the US Emissions Inventory (USEPA, 2003). Total damage from agriculture is then calculated at $450.5 million. EPA emission data suggest that 63 per cent of this cost is from crop production ($283.8 million) and 37 per cent is from livestock sources ($166.7 million), as follows: • •
Crop – soil management, burning crop residues and rice cultivation; Livestock – enteric fermentation and manure management.
Using the above cost totals and 168.8 million hectares of cropland, air resources are impacted by cropland at a level of $1.68 per hectare annually.
(4) Damage to wildlife and ecosystem biodiversity These costs involve impacts to bird, fish and insect populations, which, in turn, influence ecosystem biodiversity. With approximately 447 million kilograms of active ingredients used in agricultural production (Gianessi and Marcelli, 2000), pesticides affect ecosystem balance.
External Costs of Agricultural Production in the United States 67
Our primary valuation source is a study on the environmental impacts of pesticides by Pimentel et al (1992). We acknowledge that since this research was done formulations and application methods of some pesticides have changed to reduce toxicity. For example, the use of granular carbofuran has been severely restricted since 1994 (Pesticide Management Education Program, 1991). The EPA estimated in the 1980s that granular carbofuran killed one to two million birds each year. In spite of this, the restrictions continue to be challenged as evidenced by the recent emergency use request of rice growers in Louisiana. The EPA initially approved use of granular carbofuran on 4050 hectares, but this was reduced to 1010 hectares after public comments were received (American Bird Conservancy, 2002; National Coalition Against the Misuse of Pesticides, 2002). Aside from the effects of pesticide use, we do include one calculation to value fish killed by manure spills. But, other known environmental stressors associated with agriculture are not represented here. These include inorganic fertilizer runoff and its impact on aquatic ecosystems and the suppression of biodiversity by monocultural practices. Again, impacts on natural ecosystems are difficult to track and analyse and valuation studies are few. Our coverage of this category is far from comprehensive. (4a) Honeybee and pollination losses Pollinators, especially honeybees, are fundamental to ecosystem and agricultural stability. Various studies have attempted to value the agricultural services of pollinators. Southwick and Southwick (1992) estimated $1.6–5.7 billion in total annual benefit to agricultural consumers in the US from honeybee pollination. Morse and Calderone (2000) claim the annual value of honeybee pollination to be $14.6 billion, in terms of increased yields and product quality. For our purposes, the more conservative economic impact of pesticide use on honeybees as calculated by Pimentel et al (1992) is used. Their estimate of $319.6 million is figured in terms of colony losses, reduced honey production and crop pollination and the cost of bee rentals. Assuming original reporting in 1992 dollars, the annual figure is $409.8 million in 2002 dollars. (4b) Loss of beneficial predators Most pesticide applications not only affect the primary crop pest, but also natural enemies of the pest. As the population of beneficial insects drops, outbreaks of secondary pests occur, which in turn lead farmers to apply more pesticide. The cost of these additional applications and crop losses associated with secondary pests is $666.8 million, updating the figure as per Pimentel et al (1992). Although these costs could be considered on-site, they are included because the invertebrate loss due to broad-spectrum pesticides affects not only crop production, but also the ecosystem as a whole. In addition, pesticides may harm microorganisms. The number and activity of microorganisms in the soil are measures of soil and ecosystem health, as they break down organic matter and cycle nutrients.
68 Agricultural Harm to the Environment
(4c) Fish kills due to pesticides Pesticides contaminate aquatic environments, poisoning fish and damaging their food sources and habitat. It is difficult to calculate losses in severe fish kill events and low-level poisonings are often not detected. Pimentel et al (1992) use EPA data to estimate 6–14 million fish deaths per year due to pesticides and values of freshwater fish from the American Fisheries Society (1982), reflecting commercial hatchery production costs of various fish species. We calculate the average of these values, omitting sturgeon and paddlefish over 38 centimetres long, at $1.67 per fish in 1980 dollars, or $3.65 in 2002 dollars. These numbers yield a damage range of $21.9–51.1 million. (4d) Fish kills due to manure spills Manure spills, leaks and dumping by animal feeding operations into surface waters also cause damage to aquatic environments and can be partially valued by the number of fish killed in documented events. A report by the Clean Water Network (2000) records information on feedlot spills and associated fish kills in ten states from 1995 to 1998. Most of the data were collected from state agency databases and reports. More than 13 million fish were killed in over 200 documented manure pollution events. This does not reflect the effects of smaller spills and cumulative impacts and, of course, is not a national count. However, because a high number of animal feeding operations are located in the states included in this report, these numbers are used as a rough proxy for a national estimate. Thirteen million is divided by four years and multiplied by the value of $3.65 per fish given earlier. The estimated annual cost is conservatively set at $11.9 million. (4e) Bird kills due to pesticides Birds exposed to pesticides may be poisoned directly or may ingest pesticide residues with prey and seeds. Pesticides affect the life cycle and reproductive ability of birds and their habitats. Toxicity is difficult to quantify, however, considering avian risk assessments customarily test only one to three bird species; the total number of bird species globally is estimated at 10,000, and over 800 species occur in the US and Canada (Mineau et al, 2001). Pimentel et al (1992) figure approximately 672 million birds are directly exposed to pesticides on cropland and that 10 per cent of these birds die. The study provides values for a bird’s life ranging from $0.40 to $216 to $800. These figures reflect, respectively, cost per bird for bird watching, hunting costs per bird felled and the cost of rearing and releasing a bird to the wild. The higher figures may be considered inappropriate because they are associated with species not as directly affected by agricultural pesticides. By updating the lowest, most conservative valuation to $0.51 per bird death, the cost of bird kills due to pesticides is $34.5 million. This total does not address life cycle and reproductive damages due to poisonings.
External Costs of Agricultural Production in the United States 69
Category 4 summary Total annual damage to wildlife and ecosystem biodiversity due to agricultural production, according to this research, is calculated to be $1144.9–1174.1 million. Pesticide use for crop production is associated with all of the costs, except for fish kills due to manure spills from livestock operations. These external costs can be split as follows: $1133–1162.2 million in damages due to crop production and $11.9 million due to livestock production. Considering the impacts in terms of pesticide use, each kilogram of active ingredient, of 447 million kilograms applied, generates approximately $2.55 in external costs. Using the above cost totals and 168.8 million hectares of cropland, crop production’s injuries to biodiversity cost $6.71–6.89 per hectare annually. The external costs calculated here are substantial and suggest the need for a comprehensive examination of pesticide products and application methods. To curb manure spills, regulations for manure handling at animal feeding operations should continue to be reviewed and enforced and the promotion of other options for livestock finishing should be considered.
(5) Damage to human health: Pathogens According to the Centers for Disease Control and Prevention (CDC), more than 250 food-transmitted diseases cause an estimated 76 million illnesses, 325,000 hospitalizations and 5200 deaths annually in the US (CDC, 2002). A Council for Agricultural Science and Technology (CAST) task force estimated microbial foodborne disease cases to number 6.5–33 million annually, with deaths possibly as high as 9000 (CAST, 1994). Estimates for this category include costs of illnesses associated with foodborne pathogens and costs to the food industry to comply with pathogen reduction regulations. Data are not readily available for other societal costs, such as those incurred by the public health sector or from antibiotic resistance in humans. A recent CAFO air quality study in Iowa describes antibiotic resistance as ‘a health threat of great concern’ (Iowa State University and The University of Iowa Study Group, 2002, pp1–11). Costs of illnesses associated with waterborne pathogens are not included because states should have implemented the Interim Enhanced Surface Water Treatment Rule (IESWTR) by 1 January 2002. The avoidance benefit of the IESWTR for Giardia spp. and Cryptosporidium parvum infections due to agriculture is estimated to be between $628 million and $1 billion annually (USEPA, 1997c, 1998a). (5a) Cost of foodborne illnesses Most microbial contamination stems from the processing and packaging of animal products. According to a USDA web page (2000a), ‘Simple changes in food processing and handling practices can eliminate at least 90 per cent of foodborne illnesses.’ This suggests that 10 per cent of foodborne pathogen contamination
70 Agricultural Harm to the Environment
arises from production and meal preparation. Zero contamination is not realistic and other entry points for contamination may not be identified, so we estimate that 3 per cent of the health costs in this category are attributable to agricultural production unless otherwise noted. Pathogens causing illness may be bacterial, parasitic, fungal or viral. Cost studies by the USDA’s Economic Research Service (ERS) have focused on common bacterial agents found in meat, eggs and dairy products. Other food sources include some vegetables, fruits, juices and seafood. The ERS estimates the annual costs for five bacterial pathogens at $6.9 billion in 2000 dollars (USDA, 2001c). These pathogens are Campylobacter spp., Salmonella, E. coli O157:H7, E. coli non-O157 STEC and Listeria monocytogenes. In addition to these, Buzby et al (1997) provide damage estimates for the bacteria Clostridium perfringens and Staphylococcus aureus and the parasite Toxoplasma gondii totalling $4.5 billion (1995 dollars). Updating these figures and attributing 3 per cent of the totals to agricultural production, the estimate for the costs of illnesses and deaths from these common pathogens is $375.7 million annually. This is conservative given that unidentified agents cause the majority of illnesses, and estimates have been calculated only for the common, known pathogens. The CDC (Mead et al, 1999) estimates that 82 per cent of foodborne illnesses and 65 per cent of deaths are caused by unknown pathogens. Also, many illnesses go unreported or are not diagnosed as food-related. Furthermore, these costs include only the impacts on households, in terms of lost productivity and income, medical costs and premature death. Household costs not valued include pain and disability, travel costs for medical care, loss of work time for caregivers and chronic health complications. (5b) Cost to industry to comply with HACCP rule In 1997, USDA’s Food Safety and Inspection Service (FSIS) issued the first stage of the Pathogen Reduction/Hazard Analysis and Critical Control Point (HACCP) systems rule to meet targets for microbial pathogen reduction. FSIS cites industry costs for meat and poultry plants to comply with HACCP regulations that range from $1.3–2.1 billion in year 2000 dollars (USDA, 2001a). These estimates are based on four scenarios of different pathogen control percentages and interest rates. The estimate for costs due to agricultural production is $40.7–65.8 million, which is 3 per cent of the range of industry costs and updated to 2002 dollars. Costs of complying with HACCP may be considered health costs internalized by the food processing industry, but this 3 per cent is viewed as a cost caused by agricultural production practices, which is externalized beyond the farm gate to processors and consumers. Category 5 summary According to this research, damage to human health from foodborne pathogens due to livestock production is calculated at $416.4–441.5 million per year. Although contamination often originates during processing and preparation, livestock health and production methods contribute to a large number of illnesses and should be
External Costs of Agricultural Production in the United States 71
evaluated to fully address food safety issues. Growing evidence that antibiotic use in livestock increases the resistance of foodborne pathogens reinforces the need to further explore the role of production in this health threat (Iowa State University and The University of Iowa Study Group, 2002).
(6) Damage to human health: Pesticides Pesticides endanger human health through direct exposure, release into the environment and residues on food. Exposure to pesticides, depending on toxicity and quantity, can cause poisoning, eye damage, respiratory ailments, disruption of the endocrine system (USEPA, 2002c), birth defects, nerve damage, cancer and other effects that may develop over time (USEPA, 2001c). Of particular concern are pesticides that act as endocrine disruptors: The endocrine system consists of a set of glands and the hormones they produce that help guide the development, growth, reproduction, and behavior of animals including human beings... EPA is concerned about the growing body of evidence that some manmade chemicals may be interfering with normal endocrine system functioning in humans and other animals. (USEPA, 1997d)
Detectable levels of pesticides have been found on approximately 35 per cent of purchased food in the US (Pimentel et al, 1992). Farm workers who handle and apply pesticides face distinct risks. More than 58,000 unintentional poisonings by agricultural pesticides were reported to the American Association of Poison Control Centers in 2002 (Watson et al, 2003). (6a) Pesticide poisonings Very little research has been done to identify and quantify health impacts of pesticides on a national scale for the US. Studies in the Philippines and Ecuador document health effects and calculate reduction in farmer productivity caused by pesticide use (Antle et al, 1998; Antle and Pingali, 1994; Cole et al, 2000; Crissman et al, 1994; Rola and Pingali, 1993). These results, however, are not transferable to agriculture in the US, considering differences in farmer training and production methods. Here, we rely on Pimentel et al (1992), who calculate the costs of pesticide poisonings and deaths based on hospitalizations, outpatient treatment, loss of work and fatalities due to accidental poisonings and treatment costs for pesticide-induced cancers. Their estimate of $787 million ($1009 million in 2002 dollars) is based, in part, on speculation regarding the incidence of illness and death. However, it could be regarded as conservative considering the number of poisonings reported to control centres. Also, the estimate does not include unreported or misdiagnosed illnesses or costs of chronic ailments, other than cancer, associated with pesticide exposure. In addition, detection techniques are not available for the majority of pesticides used in the US and their health effects have not been determined (Pimentel et al, 1992).
72 Agricultural Harm to the Environment
Part of this valuation may be considered double-counting with the water treatment costs in Subsection 1c. However, water treatment processes do not prevent all waterborne exposure and associated illnesses. Category 6 summary The cost to human health from pesticides used in crop production is $1009 million annually. Using this valuation and 168.8 million hectares of cropland, human health is affected by pesticide applications on cropland at a level of $5.98 per hectare annually. In terms of pesticide use, the impact to human health translates to $2.26 per kilogram active ingredient. This is a substantial external cost. The damages reported here and in Subsections 1 and 4 call for increased scrutiny of the human and environmental effects of chemical use in agricultural production. In 2002, farmers spent $8.2 billion on pesticides in the US (USDA, 2004). But, this retail cost reflects less than 80 per cent of the actual cost of pesticide use, when considering the $2253.9–2283.1 million in damages to water resources, wildlife and ecosystem biodiversity and human health calculated here.
Summary Agricultural production in the US negatively impacts water, soil, air, wildlife and human health at an estimated cost of $5.7–16.9 billion (£3.3–9.7 billion) per year. This is the aggregate cost range from the studies reviewed. The breakdown of these costs by production type, as indicated in Table 3.1, is $4969.3–16,150.5 million per year of impacts due to crop production and $713.6–738.7 million due to livestock production. With the estimate of 168.8 million hectares of cropland in the US, total external cost per cropland hectare is calculated at $29.44–95.68 (£16.87– 54.82), as shown in Table 3.3 by damage category. These figures offer a broad, preliminary view of how the externalities of agriculture encumber society. And yet, these numbers are conservative, considering we are limited by the complexities of assigning monetary values to environmental and health impacts and the lack of related data. Table 3.3 Annual external costs of crop production per hectare Damage category
Cost
Water resources
$1.78
Soil resources
$13.29–79.35
Air resources
$1.68
Biodiversity
$6.71–6.89
Human health – pesticides
$5.98
Totals
$29.44–95.68 (£16.87–54.82)
External Costs of Agricultural Production in the United States 73
Comparing our findings with a more comprehensive list of agricultural externalities illustrates the incomplete nature of our national tally. For this we turn to social and natural resource accounting efforts, which attempt to incorporate human and environmental capital assets and flows into traditional income and product measures. These assets are not priced in the current market economy and require valuation to be included in social accounts. We refer the reader to other sources for further information on systems of accounts: • • • •
System of National Accounts (Commission of the European Communities et al, 1993); Handbook of National Accounting: Integrated Environmental and Economic Accounting (United Nations et al, 2003); A System of Economic Accounts for Food and Agriculture (Food and Agriculture Organization, 1996); Environmental Indicators for Agriculture (Organisation for Economic Co-operation and Development, 2001).
The environmental indicators listed in Table 3.4 are a combination of those provided in Environmental Indicators for Agriculture and Cabe and Johnson (1990), as well as others we have suggested. Please refer to these sources for further explanation of indicators. Also shown in Table 3.4 are the categories for which we have identified national valuation data. Table 3.4 Agri-environmental indicators Indicator
National valuation data for the US
Nutrient use: balance, efficiency, human health risks
Water treatment for nitrates
Pesticide use and risks
Water treatment Hospitalizations, outpatient treatment, loss of work, fatalities due to accidental poisonings and treatment costs for pesticide-induced cancers
Water use: intensity, efficiency, stress Human health risks of production: Water treatment for microbial pathogens antibiotic use, waterborne and foodborne Some household costs for illnesses caused pathogens by common foodborne pathogens Cost to industry to comply with HACCP rule Soil erosion by water
For cropland erosion only:
Commercial fisheries
X
Flood damage
X
Industrial users
X
Preservation values
X
Recreation
X
74 Agricultural Harm to the Environment Table 3.4 (continued) Indicator
National valuation data for the US
Salinity Transportation/navigation
X
Water conveyance
X
Water storage
X
Water treatment
X
Soil erosion by wind Human health Soiling Visibility Ground and surface water quality: risks and state
Water treatment for pathogens, nitrates, pesticides
Land conservation Water retaining capacity Off-farm sediment flow/soil retaining capacity Greenhouse gas emissions
X
Biodiversity Genetic diversity Species diversity: wild, non-native
Impacts to honeybees, beneficial predators, fish, birds
Ecosystem diversity Wildlife habitats Intensively farmed agricultural habitats Semi-natural agricultural habitats Uncultivated natural habitats Habitat matrix Aquatic habitats Landscapes Structure Environmental features, land-use patterns Man-made objects/cultural features Management Costs and benefits
Clearly, further research is needed on external costs of agriculture, including detailed studies in each impact category, by geographical region and by production type. Comparative valuation studies also would be instructive, i.e. examinations of
External Costs of Agricultural Production in the United States 75
grazing vs feedlot production of livestock or monocropping vs diverse cropping systems. In comparing production methods, trade-offs should be taken into account. For instance, lower pesticide use often requires increased tillage and possibly causes more soil erosion. Also of interest would be an examination of positive, or beneficial, externalities provided by agriculture, i.e. carbon sequestration, wildlife habitat and aesthetics. Pricing these services may open the door to policy decisions that compensate producers for such ‘products’.
Conclusion Many in the US pride themselves on our ‘cheap’ food. But, this study demonstrates that consumers pay for food well beyond the grocery store checkout. We pay for food in our utility bills and taxes and in our declining environmental and personal health. These costs total, conservatively, $5.7–16.9 billion (£3.3–9.7 billion) each year. We also support at least $3.7 billion (£2.1 billion) annually in efforts to regulate the present system and mitigate damages. Additional public costs of agricultural production in the US include direct subsidies and other support mechanisms for farmers. These are not included in our final tally but must be considered in the true cost of food. What can be done? By using ‘ecological’ or ‘sustainable’ methods, some agricultural producers claim to be internalizing many of these external costs. However, the market and policy structure in which most producers operate offers narrow return margins and discourages changes in production methods. Considering this, the partial estimate of damage costs presented here promotes responsible, creative policy actions to acknowledge and internalize the externalities of production practices that are generally accepted and widespread. Furthermore, the estimates presented in this chapter are conservative for reasons beyond the need for more valuation data. Many industrial agricultural practices present us with environmental risks that have unknown potential consequences. Potentialities are difficult to define because effects are diffuse in time and location. Some of these risks have been acknowledged scientifically but not necessarily politically, i.e. ecosystem behaviour in a mono-cropped environment, antibiotic resistance in humans, loss of pollinators. Political intention is required to reassess and reform agricultural policy. Programmes that highlight sustainable methods rather than destructive, risky practices would be a start in internalizing the true costs of the present system.
References Adger, W.N. and Whitby, M.C. 1991. National accounts and environmental degradation: Accounting for the impact of agriculture and forestry on environmental quality. European Economic Review 35, 629–641.
76 Agricultural Harm to the Environment Adger, W.N. and Whitby, M.C. 1993. Natural-resource accounting in the land-use sector: Theory and practice. European Review of Agricultural Economics 20, 77–97. Altieri, M. 1995. Agroecology: The Science of Sustainable Agriculture. Boulder, CO: Westview Press. American Bird Conservancy. 2002. News release: Conservation groups prevent use of eagle-killing pesticide. July 29. http://www.abcbirds.org/media/releases/carbofuran_victory_release.htm [December 20, 2003]. American Fisheries Society. 1982. Monetary Values of Freshwater Fish and Fish-kill Counting Guidelines. Special publication No. 13. Bethesda, MD: American Fisheries Society. Antle, J.M., Cole, D.C. and Crissman, C.C. 1998. Further evidence on pesticides, productivity and farmer health: Potato production in Ecuador. Agricultural Economics 18, 199–207. Antle, J.M. and Pingali, P. 1994. Pesticides, productivity, and farmer health: A Philippine case study. American Journal of Agricultural Economics 76, 418–430. Atwood, J. 1994. RCA Reservoir Sediment Data Reports 1–5. Washington DC: Soil Conservation Service. Baumol, W.J. and Oates, W.E. 1988. The Theory of Environmental Policy. Cambridge: Cambridge University Press. Bejranonda, S., Hitzhusen, F.J. and Hite, D. 1999. Agricultural sedimentation impacts on lakeside property values. Agricultural and Resource Economics Review 28 (2), 208–218. Bollman, R.A. and Bryden, J.M. (eds). 1997. Rural Employment: An International Perspective. Wallingford: CAB International. Bonnieux, F., Rainelli, P. and Vermersch, D. 1998. Estimating the supply of environmental benefits by agriculture: A French case study. Environmental and Resource Economics 11, 135–153. Brouwer, R. 1999. Market Integration of Agricultural Externalities: A Rapid Assessment Across EU Countries. Copenhagen: European Environment Agency. Buzby, J.C., Roberts, T. and Allos, B.M. 1997. Estimated annual costs of Campylobacter-associated Guillain-Barré Syndrome. Agricultural Economic Report No. 756. Washington DC: USDA, Economic Research Service. Cabe, R. and Johnson, S.R. 1990. Natural resource accounting systems and environmental policy modeling. Journal of Soil and Water Conservation, 533–539. Cavigelli, M.A., Deming, S.R., Probyn, L.K. and Harwood, R.R. (eds). 1998. Michigan Field Crop Ecology: Managing Biological Processes for Productivity and Environmental Quality. Extension Bulletin E-2646. East Lansing, MI: Michigan State University. Centers for Disease Control and Prevention. 1996. Surveillance for Waterborne-Disease Outbreaks – United States, 1993–1994. 45(SS-1). Atlanta, Georgia: Centers for Disease Control and Prevention. http:// www.cdc.gov/epo/mmwr/preview/mmwrhtml/00040818.htm [December 20, 2003]. Centers for Disease Control and Prevention. 2002. Disease information – Foodborne infections. http://www.cdc.gov/ncidod/dbmd/diseaseinfo/foodborneinfections_t.htm [December 20, 2003]. Chicago Climate Exchange. 2004. http://www.chicagoclimatex.com/ [February 10, 2004]. Clark, E.H. II, Haverkamp, J.A. and Chapman, W. 1985. Eroding Soils: The Off-farm Impacts. Washington DC: The Conservation Foundation. Clean Water Network, the Izaak Walton League of America, and the Natural Resources Defense Council. 2000. Spills and Kills: Manure Pollution and America’s Livestock Feedlots. Washington DC: Clean Water Network. http://www.cwn.org [December 20, 2003]. Colacicco, D., Osborn, T. and Alt, K. 1989. Economic damage from soil erosion. Journal of Soil and Water Conservation 44, 35–39. Cole, D.C., Carpio, F. and León, N. 2000. Economic burden of illness from pesticide poisonings in highland Ecuador. Pan American journal of Public Health 8 (3), 196–201. Commission of the European Communities, International Monetary Fund, Organisation for Economic Co-operation and Development, United Nations and World Bank. 1993. System of National Accounts. http://unstats.un.org/unsd/sna1993/introduction.asp [April 29, 2004].
External Costs of Agricultural Production in the United States 77 Conway, G.R. and Pretty, J.N. 1991. Unwelcome Harvest: Agriculture and Pollution. London: Earthscan. Council for Agricultural Science and Technology. 1994. Foodborne Pathogens: Risks and Consequences. Task Force Report No. 122. Washington DC: Council for Agricultural Science and Technology. Crissman, C.C., Cole, D.C. and Carpio, F. 1994. Pesticide use and farm worker health in Ecuadorian potato production. American Journal of Agricultural Economics 76, 593–597. Crosson, P. 1986. Soil erosion and policy issues. In T. Phipps, P. Crosson and K. Price (eds). Agriculture and the Environment (pp35–73). Washington DC: Resources for the Future. Crowder, B.M. 1987. Economic costs of reservoir sedimentation: A regional approach to estimating cropland erosion damage. Journal of Soil and Water Conservation 42 (3), 194–197. Crutchfield, S.R., Cooper, J.C. and Hellerstein, D. 1997. Benefits of Safer Drinking Water: The Value of Nitrate Reduction. Agricultural Economic Report No. 752. Washington DC: USDA, Economic Research Service. Evans, R. 1996. Soil Erosion and Its Impact in England and Wales. London: Friends of the Earth Trust. Faeth, P. and Repetto, R. 1991. Paying the Farm Bill: U.S. Agricultural Policy and the Transition to Sustainable Agriculture. Washington DC: World Resources Institute. Farber, S.C., Costanza, R. and Wilson, M.A. 2002. Economic and ecological concepts for valuing ecosystem services. Ecological Economics 41, 375–392. Federal Emergency Management Agency. 2002. Resources for parents & teachers. http://www.fema. gov/kids/98wdgen.htm [December 20, 2003]. Flora, J.L., Hodne, C.J., Goudy, W., Osterberg, D., Kliebenstein, J., Thu, K.M. and Marquez, S.P. 2002. Social and community impacts. In Iowa State University and The University of Iowa Study Group, Iowa Concentrated Animal Feeding Operations Air Quality Study. Iowa City, Iowa: Environmental Health Sciences Research Center. http://www.public-health.uiowa.edu/ehsrc/CAFOstudy. htm [December 20, 2003]. Food and Agriculture Organization of the United Nations. 1996. A System of Economic Accounts for Food and Agriculture. http://www.fao.org/docrep/W0010E/W0010E00.htm [April 29, 2004]. Food and Drug Administration. 2002. Budget information. http://www.fda.gov/oc/oms/of/ budget/2002/CJ2002/HTML/CFSAN.htm [December 20, 2003]. Freeman, A.M., III. 1982. Air and Water Pollution Control: A Benefit–Cost Assessment. New York: John Wiley and Sons. Freeman, A.M., III. 1998. On valuing the services and functions of ecosystems. In A.M. Freeman (ed.) The Economic Approach to Environmental Policy: The Selected Essays of A. Myrick Freeman III. Cheltenham, UK and Northampton, MA: Edward Elgar. Gianessi, L.P. and Marcelli, M.B. 2000. Pesticide Use in U.S. Crop Production: 1997. Washington DC: National Center for Food and Agricultural Policy. http://www.ncfap.org/ncfap/nationalsummary 1997.pdf [December 20, 2003]. Graf, W.L. 1993. Landscapes, commodities, and ecosystems: The relationship between policy and science for American rivers. In Sustaining our Water Resources. Washington DC: National Academy Press. Hanley, N., Shogren, J.F. and White, B. 1997. Environmental Economics in Theory and Practice. New York and Oxford: Oxford University Press. Hartridge, O. and Pearce, D.W. 2001. Is UK Agriculture Sustainable? Environmentally Adjusted Economic Accounts for UK Agriculture. London: CSERGE-Economics, University College London. Holmes, T. 1988. The offsite impact of soil erosion on the water treatment industry. Land Economics 64 (4), 356–366. Hrubovcak, J., LeBlanc, M. and Eakin, B.K. 2000. Agriculture, natural resources and environmental accounting. Environmental and Resource Economics 17, 145–162. Iowa State University and The University of Iowa Study Group. 2002. Iowa Concentrated Animal Feeding Operations Air Quality Study. Iowa City, Iowa: Environmental Health Sciences Research Center. http://www.public-health.uiowa.edu/ehsrc/CAFOstudy.htm [December 20, 2003].
78 Agricultural Harm to the Environment Juranek, D. 1995. Cryptosporidiosis: Source of infection and guidelines for prevention. Clinical Infectious Diseases 21, 57–61. Lawrence, G.B., Goolsby, D.A. and Battaglin, W.A. 1999. Atmospheric Deposition of Nitrogen in the Mississippi River Basin. Proceedings of the U.S. Geological Survey Toxic Substances Hydrology Program technical meeting, Charleston, SC, March 8–12. http://toxics.usgs.gov/pubs/wri994018/Volume2/sectionC/2413_Lawrence/index.html [December 2, 2003]. le Goffe, P. 2000. Hedonic pricing of agriculture and forestry externalities. Environmental and Resource Economics 15, 397–401. Mead, P.S., Slutsker, L., Dietz, V., McCaig, L.F., Bresee, J.S., Shapiro, C, Griffin, P.M. and Tauxe, R.V. 1999. Food-related Illness and Death in the United States-Synopses. Atlanta, GA: Centers for Disease Control and Prevention. http://www.cdc.gov/ncidod/eid/vol5no5/mead.htm#Figure%201 [December 20, 2003]. Mineau, P., Baril, A., Collins, B.T., Duffe, J., Joerman, G. and Luttik, R. 2001. Pesticide acute toxicity reference values for birds. Reviews of Environmental Contamination and Toxicology 170, 13–74. Miranowski, J.A. and Carlson, G.A. 1993. Agriculture resource economics: An overview. In G.A. Carlson, D. Zilberman and J.A. Miranowski (eds). Agricultural and Environmental Resource Economics. Oxford: Oxford University Press. Morris, G.L. and Fan, J. 1998. Reservoir Sedimentation Handbook: Design and Management of Dams, Reservoirs, and Watersheds for Sustainable Uses. New York: McGraw-Hill. Morse, R.A. and Calderone, N.W. 2000. The value of honey bees as pollinators of U.S. crops in 2000. http://bee.airoot.com/beeculture/pollination2000/pgl.html [December 20, 2003]. National Coalition Against the Misuse of Pesticides. 2002. News release: EPA allows use of banned insecticide, deadly to birds, on 10,000 acres, will decide whether to allow the program to go forward this week. July 3. http://www.beyondpesticides.org/WATCHDOG/media/carbofuran_07_ 03_02.htm [December 20, 2003]. National Research Council, Board on Agriculture, Committee on the Role of Alternative Farming Methods in Modern Production Agriculture. 1989. Alternative Agriculture. Washington DC: National Academy Press. Organisation for Economic Co-operation and Development. 2001. Environmental Indicators for Agriculture. http://www.oecd.org/dataoecd/0/9/1916629.pdf [April 29, 2004]. Pell, A.N. 1997. Manure and microbes: Public and animal health problem? Journal of Dairy Science 80, 2673–2681. Pesticide Management Education Program at Cornell University. 1991. News release: Carbofuran phased out under settlement agreement 5/91. May 14. http://pmep.cce.cornell.edu/profiles/ insect-mite/cadusafos-cyromazine/carbofuran/gran-carbo-dec.html [December 20, 2003]. Pimentel, D., Acquay, H., Biltonen, M., Rice, P., Silva, M., Nelson, J., Lipner, V., Giordano, S., Horowitz, A. and D’Arnor, M. 1992. Environmental and economic costs of pesticide use. BioScience 42 (10), 750–760. Pimentel, D., Harvey, C, Resosudarmo, P., Sinclair, K., Kurz, D., McNair, M., Crist, S., Shpritz, L., Fitton, L., Saffouri, R. and Blair, R. 1995. Environmental and economic costs of soil erosion and conservation benefits. Science 267, 1117–1123. Piot-Lepetit, I., Vermersch, D. and Weaver, R.D. 1997. Agriculture’s environmental externalities: DEA evidence for French agriculture. Applied Economics 29 (3), 331–338. Pretty, J.N., Brett, C, Gee, D., Hine, R.E., Mason, C.F., Morison, J.I.L., Raven, H., Rayment, M.D. and van der Bijl, G. 2000. An assessment of the total external costs of UK agriculture. Agricultural Systems 65, 113–136. Pretty, J.N., Mason, C.F., Nedwell, D.B., Hine, R.E., Leaf, S. and Dils, R. 2003. Environmental costs of freshwater eutrophication in England and Wales. Environmental Science & Technology 37 (2), 201–208. Ribaudo, M.O. 1989. Water Quality Benefits from the Conservation Reserve Program. Agricultural Economic Report No. 606. Washington DC: USDA, Economic Research Service.
External Costs of Agricultural Production in the United States 79 Rola, A. and Pingali, P. 1993. Pesticides, Rice Productivity, and Farmers’ Health: An Economic Assessment. Manila: International Rice Research Institute. Samuelson, P.A. and Nordhaus, W.D. 1995. Economics. New York: McGraw-Hill. Schou, J.S. 1996. Indirect regulation of externalities: The case of Danish agriculture. European Environment 6 (5), 162–167. Smith, V.K. 1992. Environmental costing for agriculture: Will it be standard fare in the Farm Bill of 2000? American Journal of Agricultural Economics 74 (5), 1076–1088. Southwick, E.E. and Southwick, L., Jr. 1992. Estimating the economic value of honeybees (Hymenoptera Apidae) as agricultural pollinators in the United States. Economic Entomology 85 (3), 621– 633. Steiner, R.A., McLaughlin, L., Faeth, P. and Janke, R.R. 1995. Incorporating externality costs into productivity measures: A case study using U.S. agriculture. In V. Barnett, R. Payne and R. Steiner (eds). Agricultural Sustainability: Economic, Environmental and Statistical Considerations. New York: John Wiley & Sons. Thorne, P.S. 2002. Air quality issues. In Iowa State University and The University of Iowa Study Group. Iowa Concentrated Animal Feeding Operations Air Quality Study. Iowa City, Iowa: Environmental Health Sciences Research Center. http://www.public-health.uiowa.edu/ehsrc/CAFOstudy. htm [December 20, 2003]. Tiezzi, S. 1999. External effects of agricultural production in Italy and environmental accounting. Environmental and Resource Economics 13, 459–472. Titus, J.G. 1992. The costs of climate change to the United States. In S.K. Majumdar, L.S. Kalkstein, B. Yarnal, E.W. Miller and L.M. Rosenfeld (eds). Global Climate Change: Implications, Challenges, and Mitigation Measures. East Stroudsburg, PA: Pennsylvania Academy of Sciences. http:// yosemite.epa.gov/oar/globalwarming.nsf/content/ResourceCenterPublicationsSLR_US_Costs. html [December 2, 2003]. United Nations, European Commission, International Monetary Fund, Organisation for Economic Co-operation and Development and World Bank. 2003. Handbook of National Accounting: Integrated Environmental and Economic Accounting. http://unstats.un.org/unsd/environment/seea2003. htm [April 29, 2004]. US Army Corp of Engineers, Navigation Data Center, Dredging Program. 2003. FY2002 analysis of dredging costs. http://www.iwr.usace.army.mil/ndc/dredge/dredge.htm [December 20, 2003]. US Department of Agriculture, Animal and Plant Health Inspection Service. 1994. Cryptosporidium and Giardia in Beef Calves. National Animal Health-Monitoring System report. Washington DC: USDA. US Department of Agriculture, Natural Resources Conservation Service. 1995. RCA III, Sedimentation in Irrigation Water Bodies, Reservoirs, Canals, and Ditches. Working Paper No. 5. Washington DC: USDA. http://www.nrcs.usda.gov/technical/land/pubs/wp05text.html [December 20, 2003]. US Department of Agriculture. 2000a. Cleaning up our act: Food safety is everybody’s business. http:// www.reeusda.gov/success/impactOO/safe-food.htm [December 20, 2003]. US Department of Agriculture, Economic Research Service. 2000b. Land use. In Economic Research Service, Agricultural Resources and Environmental Indicators. Washington DC: USDA. US Department of Agriculture, Natural Resources Conservation Service. 2000c. National Resources Inventory, 1997. Washington DC: USDA. http://www.nrcs.usda.gov/technical/land/meta/ m5112.html [December 20, 2003]. US Department of Agriculture, Economic Research Service. 2000d. Water quality impacts of agriculture. In Agricultural Resources and Environmental Indicators. Washington DC: USDA. US Department of Agriculture, Natural Resources Conservation Service. 2000e. Waterborne Pathogen Information Sheet – Principal Pathogens of Concern, Cryptosporidium and Giardia. Washington DC: USDA. http://wvlc.uwaterloo.ca/biology447/modules/module8/SludgeDisposal/Pathogen_ information_Sheet-CryptosporidiumandGiardia.pdf [December 20, 2003].
80 Agricultural Harm to the Environment US Department of Agriculture, Economic Research Service. 2001a. Briefing room – Government food safety policies: features. http://www.ers.usda.gov/briefing/FoodSafetyPolicy/features.htm [December 20, 2003]. US Department of Agriculture, Natural Resources Conservation Service. 2001b. National resources inventory highlights. http://www.nrcs.usda.gov/technical/land/pubs/97highlights.pdf [December 20, 2003]. US Department of Agriculture, Economic Research Service. 2001c. Research emphasis – Food safety: features. http://www.ers.usda.gov/Emphases/SafeFood/features.htm [December 20, 2003]. US Department of Agriculture. 2002a. Action plan. http://www.nps.ars.usda.gov [December 20, 2003]. US Department of Agriculture. 2002b. FY2003 budget summary. http://www.usda.gov/agency/obpa/ Budget-Summary/2003 [December 20, 2003]. US Department of Agriculture, Economic Research Service. 2004. Farm income data. http://www.ers. usda.gov/Data/FarmIncome/finfidmu.htm [February 12, 2004]. US Environmental Protection Agency. 1997a. Drinking Water Infrastructure Needs Survey: First Report to Congress. EPA 812-R-97-001. Washington DC: USEPA. US Environmental Protection Agency, Office of Wetlands, Oceans and Watersheds. 1997b. Managing Nonpoint Source Pollution from Agriculture. Pointer No. 6. EPA841-F-96-004F. Washington DC: USEPA. http://www.epa.gov/OWOW/NPS/facts/point6.htm [December 20, 2003]. US Environmental Protection Agency. 1997c. National primary drinking water regulations: Interim enhanced surface water treatment rule notice of data availability-proposed rule. Federal Register November 3, 59486–59557. Washington DC: Office of the Federal Register, National Archives and Records Administration. US Environmental Protection Agency. 1997d. Potential of chemicals to affect the endocrine system. http://www.epa.gov/pesticides/factsheets/3file.htm [December 20, 2003]. US Environmental Protection Agency, Office of Water. 1998a. Interim Enhanced Surface Water Treatment Rule. EPA 815-F-99-009. Washington DC: USEPA. http://www.epa.gov/safewater/mdbp/ ieswtr.html [December 20, 2003]. US Environmental Protection Agency, Office of Water. 1998b. Small System Compliance Technology List for the Non-microbial Contaminants Regulated before 1996. EPA 815-R-98-002. Washington DC: USEPA. http://www.epa.gov/safewater/standard/tlstnm.pdf [December 20, 2003]. US Environmental Protection Agency, Biological and Economic Analysis Division, Office of Pesticide Programs. 1999a. Pesticide Industry Sales and Usage: 1996 and 1997 Market Estimates Report. 733R-99-001. Washington DC: USEPA. http://www.epa.gov/oppbeadl/pestsales/[December 20, 2003]. US Environmental Protection Agency, Office of Atmospheric Programs. 1999b. Regulatory Impact Analysis for the Final Section 126 Petition Rule. Washington DC: USEPA. http://www.epa.gov/ttn/ ecas/regdata/126fn0.pdf [December 20, 2003]. US Environmental Protection Agency, Office of Wetlands, Oceans and Watersheds. 2001a. Nonpoint Source Pollution: The Nation’s Largest Water Quality Problem. Pointer No. 1. EPA841-F-96-004A. Washington DC: USEPA. http://www.epa.gov/OWOW/NPS/facts/point1.htm [December 20, 2003]. US Environmental Protection Agency. 2001b. Pesticides and food: Health problems pesticides may pose. http://www.epa.gov/pesticides/food/risks.htm [December 20, 2003]. US Environmental Protection Agency, Office of Water. 2001c. Where does my drinking water come from? http://www.epa.gov/OGWDW/wot/wheredoes.html [December 20, 2003]. US Environmental Protection Agency. 2002a. Food Quality Protection Act (FQPA) background. http://www.epa.gov/opppsps1/fqpa/backgrnd.htm [December 20, 2003]. US Environmental Protection Agency, Clean Air Market Programs. 2002b. Nitrogen: Multiple and Regional Impacts. EPA-430-R-01-006. Washington DC: USEPA. http://www.epa.gov/air-markets/ articles/nitrogen.pdf [December 2, 2003].
External Costs of Agricultural Production in the United States 81 US Environmental Protection Agency. 2002c. Pesticide effects. http://www.epa.gov/ebtpages/pestpes ticideeffects.html [December 20, 2003]. US Environmental Protection Agency. 2002d. Summary of the EPA’s budget, FY2003. http://www. epa.gov/ocfo/budget/2003/2003bib.pdf [December 20, 2003]. US Environmental Protection Agency. 2003. Inventory of U.S. Greenhouse Gas Emissions and Sinks: 1990–2001. EPA 430-R-03-004. Washington DC: USEPA. http://yosemite.epa.gov/oar/global warming.nsf/content/ResourceCenterPublicationsGHGEmissionsUSEmissionsInventory2003. html [December 2, 2003]. US Geological Survey. 1998. Estimated Use of Water in the United States in 1995. Circular 1200. Washington DC: Government Printing Office. http://water.usgs.gov/watuse/pdf1995/html/ [December 20, 2003]. Vaughan, W.J. and Russell, C.S. 1982. Freshwater Recreational Fishing – The National Benefits of Water Pollution Control. Prepared for Resources for the Future. Baltimore, MD: Johns Hopkins University Press. Vitousek, P.M., Aber, J.D., Howarth, R.W., Likens, G.E. 1997. Human alternation of the global nitrogen cycle – sources and consequences. Ecological Applications 7, 737–750. Waibel, H. and Fleischer, G. 1998. Kosten und Nutzen des chemischen Pflanzenschutzes in der deutschen Landwirtschaft aus gesamtwirtschaftlicher Sicht (Social Costs and Benefits of Chemical Pesticide Use in German Agriculture). Kiel: Wissenschaftsverlag Vauk. http://www.ifgb.unihannover.de/ ppp/publications.htm [December 3, 2003]. Watson, W.A., Litovitz, T.L., Rodgers, G.C., Klein-Schwartz, W., Youniss, J., Rutherfoord-Rose, S., Borys, D. and May, M.E. 2003. 2002 Annual Report of the American Association of Poison Control Centers Toxic Exposure Surveillance System. The American Journal of Emergency Medicine 21 (5), 353–421. http://www.aapcc.org [December 2, 2003]. Zilberman, D. and Marra, M. 1993. Agricultural externalities. In G.A. Carlson, D. Zilberman and J.A. Miranowski (eds). Agricultural and Environmental Resource Economics. Oxford: Oxford University Press.
4 From Pesticides to People: Improving Ecosystem Health in the Northern Andes Stephen Sherwood, Donald Cole, Charles Crissman and Myriam Paredes
Introduction Since the early 1990s, a number of national and international organizations have been working with communities in Carchi, Ecuador’s northernmost province, on projects to assess the role and effects of pesticide use in potato production and to reduce its adverse impacts. These are INIAP (National Institute of Agricultural Research from Ecuador), CIP (International Potato Center), Montana State University (US), McMaster University and University of Toronto (Canada), Wageningen University (The Netherlands), and the FAO’s (Food and Agriculture Organization) Global Integrated Pest Management (IPM) Facility. These projects have provided quantitative assessments of community-wide pesticide use and its adverse effects. Through system modelling and implementation of different alternatives, we have demonstrated the effectiveness of different methods to lessen pesticide dependency and thereby improve ecosystem health. Meanwhile, the principal approach to risk reduction of the national pesticide industry continues to be farmer education through ‘Safe Use’ campaigns, despite the safe use of highly toxic chemicals under the social and environmental conditions of developing countries being an unreachable ideal. These conflicting perspectives and the continued systematic poisoning of many rural people in Carchi have motivated a call for international action (Sherwood et al, 2002). The project members have worked with interested stakeholders to inform the policy debate on pesticide use at both the provincial and national levels. Our position has evolved to include the reduction of pesticide exposure risk through a combination of hazard removal (in particular, the elimination of highly toxic pesticides from the market), the development of alternative practices and ecological Reprinted from Sherwood S, Cole D, Crissman C and Paredes M. 2005. Transforming potato systems in the Andes, in Pretty J (ed). The Pesticide Detox. Earthscan, London.
From Pesticides to People 83
education. The experience reported here has led us to conclude that more knowledge-based and socially oriented interventions are needed. These must be aimed at political changes for enabling new farmer learning and organizational capacity, differentiated markets and increased participation of the most affected parties in policy formulation and implementation. Such measures involve issues of power that must be squarely faced in order to foster continued transformation of potato production in the Andes towards sustainability.
Potato Farming in Carchi The highland region of Carchi is part of a very productive agricultural region, the Andean highlands throughout Northern Ecuador, Colombia and Venezuela. Situated near the equator, the region receives adequate sunlight throughout the year which, coupled with evenly distributed rainfall, means that farmers can continuously cultivate their land. As a result, the province is one of Ecuador’s most important producers of staple foods, with farmers producing nearly 40 per cent of the national potato crop on only 25 per cent of the area dedicated to potato (Herrera, 1999). Carchi is a good example of the spread of industrialized agricultural technologies in the Americas during the Green Revolution that began in the 1960s. A combination of traditional sharecropping, land reform, market access and highvalue crops provided the basis for rural economic development (Barsky, 1984). Furthermore, as a result of new revenues from the oil boom of the 1970s, the Ecuadorian government improved transportation and communication infrastructure in Carchi, and the emerging agricultural products industry was quick to capitalize on the availability of new markets. A typical small farm in Carchi is owned by an individual farm household and consists of several separate, scattered plots with an average area of about six hectares (Barrera et al, 1998). Not surprisingly, agricultural modernization underwent a local transformation. In Carchi, mechanized, agrochemical and market-oriented production technologies are mixed with traditional practices, such as sharecropping arrangements, payments in kind, or planting in wachu rozado (a pre-Colombian limited tillage system) (Paredes, 2001). Over the last half-century, farming in Carchi has evolved towards a market-oriented potato-pasture system dependent on external inputs. Between 1954 and 1974 potato production increased by about 40 per cent and worker productivity by 33 per cent (Barsky, 1984). Until recently, the potato growing area in the province continued to increase, and yields have grown from about 12t/ha in 1974 to about 21t/ha today, a remarkable three times the national average (Crissman et al, 1998a). To confront high price variability in potato (by factors of 5–20 in recent years), farmers have applied a strategy of playing the ‘lottery’, which involves continual production while gambling for high prices at harvest to recover overall investment. Nevertheless, the dollarization of the Ecuadorian Sucre in 2000 led to triple digit inflation
84 Agricultural Harm to the Environment
and over 200 per cent increase in agricultural labour and input costs over three years (World Development Index, 2003). Meanwhile, open trade with neighbouring Colombia and Peru has permitted the import of cheaper commodities. As a result of a trend towards increased input costs and lower potato prices, in 2003 Carchense farmers responded by decreasing the area planted in potato from about 15,000ha in previous years to less than 7000ha. It remains to be seen how farmers ultimately will compensate for the loss of competitiveness brought about by dollarization. Carchi farmers of today rely on insecticides to control the tuber-boring larva of the Andean weevil (Premnotrypes vorax) and a variety of foliage damaging insects. They also rely on fungicides to control late blight (Phytophtera infestans). One economic study of pesticides in potato production in Carchi confirmed that farmers used the products efficiently (Crissman et al, 1994), and later attempts during the 1990s by an environmental non-governmental organization (NGO) to produce pesticide-free potatoes in Carchi failed (Frolich et al, 2000). After 40 years inorganic fertilizers and pesticides appear to have become an essential part of the social and environmental fabric of the region (Paredes, 2001).
Pesticide Use and Returns Our 1990s study of pesticide use found that farmers applied 38 different commercial fungicide formulations (Crissman et al, 1998a). Among the fungicides used, there were 24 active ingredients. The class of dithiocarbamate contact-type fungicides were the most popular among Carchi farmers, with mancozeb contributing more than 80 per cent by weight of all fungicide active ingredients used. The dithiocarbamate family of fungicides has recently been under scrutiny in the Northern Andes due to suspected reproductive (Restrepo et al, 1990b) and mutagenic effects in human cells (Paz-y-Mino et al, 2002). Similar concerns have been raised in Europe and the US (USEPA, 1992; Lander et al, 2000). Farmers use three of the four main groups of insecticides in 28 different commercial products. Although organochlorine insecticides can be found in Ecuador, farmers in Carchi did not use them. The carbamate group was represented only by carbofuran, but this was the single most heavily used insecticide – exclusively for control of the Andean weevil. Carbofuran was used in its liquid formulation, even though it is restricted in North America and Europe due to the ease of absorption of the liquid and the high acute toxicity of its active ingredient. Another 18 different active ingredients from the organophosphate and pyrethroid groups were employed to control foliage pests, though only four were used on more than 10 per cent of plots. Here the OP methamidophos, also restricted in North America due to its high acute toxicity, was the clear favourite. Carbofuran and methamidophos, both classified as highly toxic (1b) insecticides by the WHO, respectively made up 47 per cent and 43 per cent of all insecticides used (by weight of active ingredient applied). In sum, 90 per cent of the insecticides applied in Carchi were highly toxic. A later survey by Barrera et al (1998) found no significant shifts in the products used by farmers.
From Pesticides to People 85
Most insecticides and fungicides come as liquids or wettable powders and are applied by mixing with water and using a backpack sprayer. Given the costs associated with spraying, farmers usually combine several products together in mixtures known locally as cocktails, applying all on a single pass through the field. On average, each parcel receives more than seven applications with 2.5 insecticides and/or fungicides in each application (Crissman et al, 1998a). Some farmers reported as many as seven products in a single concoction. On many occasions different commercial products were mixed containing the same active ingredient or different active ingredients intended for the same type of control. Women and very young children typically did not apply pesticides: among the 2250 applications that we documented, women made only four. Product and application costs together account for about one-third of all production costs among the small and medium producers in the region. The benefit to yields (and revenues) from using pesticides exceeded the additional costs of using them (including only direct production costs such as inputs and labour but not the costs of externalities). Nevertheless, Crissman et al (1998a) found that farmers lost money in four of ten harvests, largely due to potato price fluctuations and price increases in industrial technologies, particularly mechanized land preparation, fertilizers and pesticides, that combined can represent 60 per cent of overall production outlays. Unforeseen ecological consequences on natural pest control mechanisms, in particular parasitoids and predators in the case of insect pests and selective pressure on Phytophtora infestans in the case of disease, raises further questions about the real returns on pesticides (Frolich et al, 2000). As we shall see, long-term profitability of pesticide use is even more questionable when associated human health costs to applicators and their families are taken into account.
Pesticide Exposure and Health Effects Based on survey, observational and interview data, the majority of pesticides are bought by commercial names. Only a small minority of farmers reported receiving information on pesticide hazards and safe practices from vendors (Espinosa et al, 2003). Pesticide storage is usually relatively brief (days to weeks) but occurs close to farmhouses because of fear of robbery. Farmers usually mix pesticides in large barrels without gloves, resulting in considerable dermal exposure (Merino and Cole, 2003). Farmers and, on larger farms, day labourers apply pesticides using backpack sprayers on hilly terrain. Few use personal protective equipment (PPE) for a variety of reasons, including social pressure (e.g. masculinity has become tied to the ability to withstand pesticide intoxications), and the limited availability and high cost of equipment. As a result, pesticide exposure is high. During pesticide applications, most farmers wet their skin, in particular the back (73 per cent of respondents) and hands (87 per cent) (Espinosa et al, 2003). Field exposure trials using patch-monitoring techniques showed that considerable dermal deposition
86 Agricultural Harm to the Environment
occurred on legs during foliage applications on mature crops (Cole et al, 1998b). Other studies have shown that additional field exposure occurs in the field during snack and meal breaks, when hand washing rarely occurs (Paredes, 2001). Family members are also exposed to pesticides in their households and in their work through a multitude of contamination pathways. Excess mixed product may be applied to other tuber crops, thrown away with containers in the field, or applied around the house. Clothing worn during application is often stored and used repeatedly before washing. Contaminated clothing is usually washed in the same area as family clothing, though in a separate wash. Extent of personal wash up varies but is usually insufficient to remove all active ingredients from both the hands of the applicator and the equipment. Separate locked storage facilities for application equipment and clothing are also uncommon. Swab methods have found pesticide residues on a variety of household surfaces and farm family clothing (Merino and Cole, 2003). Pesticide poisonings in Carchi are among the highest recorded in developing countries (Cole et al, 2000). In active poisoning surveillance, though there were some suicides and accidental exposures, most reported poisonings were of applicators. While the extensive use of fungicides causes dermatitis, conjunctivitis and associated skin problems (Cole et al, 1997a), we focused our attention on neurobehavioural disorders caused by highly toxic methamidophos and carbofuran. The results were startling. The health team applied a WHO recommended battery of tests to determine the effects on peripheral and central nervous system functions (Cole et al, 1998a, 1997b). The results showed high proportions of the at-risk population affected, both farmers and their family members. Average scores for farm members were a standard deviation below the control sample, the non-pesticide population from the town. Over 60 per cent of rural people were affected and women, although not commonly active in field agriculture, were nearly as affected as field workers. Alarmingly, both Mera-Orcés (2001) and Paredes (2001) found that poisonings and deaths among young children were common in rural communities. Contamination resulted in considerable health impacts that ranged from subclinical neurotoxicity (Cole et al, 1997a, 1998a), poisonings with and without treatment (Crissman et al, 1994) to hospitalizations and deaths (Cole et al, 2000). In summary, human health effects included poisonings (at a rate of 171/100,000 rural population), dermatitis (48 per cent of applicators), pigmentation disorders (25 per cent of applicators), and neurotoxicity (peripheral nerve damage, abnormal deep tendon reflexes and coordination difficulties). Mortality due to pesticide poisoning is among the highest reported anywhere in the world (21/100,000 rural population). These health impacts were predominantly in peri-urban and rural settings. This high incidence of poisoning may not be because the situation is particularly bad in Carchi, but because researchers sought systematically to record and document it. Acute pesticide poisonings led to significant financial burdens on individual families and the public health system (Cole et al, 2000). At the then current
From Pesticides to People 87
exchange rates, median costs associated with pesticide poisonings were estimated as follows: public health care direct costs of $9.85/case; private health costs of $8.33/case; and lost time indirect costs for about six worker days of $8.33/agricultural worker. All of these were over five times the daily agricultural wage of about $1.50 at the time (1992). Antle et al (1998a) showed that the use of some products adversely affects farmer decision making capacity to a level that would justify worker disability payments in other countries. Neither group of researchers included financial valuation of the deaths associated with pesticide poisonings nor the effects of pesticides on quality of life, both of which would substantially increase the overall economic burden of illness estimates.
A Myth – the Highly Toxics can be Safely Used Following the research results, limitations in the pesticide industry’s safe use of pesticides (SUP) campaign became apparent. In a letter to the research team, the Ecuadorian Association for the Protection of Crops and Animal Health (APCSA, now called Crop Life Ecuador) noted that an important assumption of SUP was that exposure occurred because of ‘a lack of awareness concerning the safe use and handling of [pesticide] products’. Although our Carchi survey showed a low percentage of women in farm families had received any training on pesticides (14 per cent), most male farmers (86 per cent) had received some training on pesticide safety practices. Furthermore, labels are supposed to be an important part of the ‘hazard communication process’ of salesmen. Yet our work in Carchi indicated that farm members often could not decipher the complex warnings and instructions provided on most pesticide labels. Although 87 per cent of the population in our project area was functionally literate, over 90 per cent could not explain the meaning of the coloured bands on pesticide containers indicating pesticide toxicity. Most believed that toxicity was best ascertained through the odour of products, potentially important for organophosphates with sulphur groups but not generalizable to all products that are impregnated by formulators for marketing purposes. Hence even the universal, seemingly simple toxicity warning system of coloured bands on labels has not entered the local knowledge system. If industry is seriously concerned about informing farmers of the toxicity of its products, it should better match warning approaches to current perceptions of risk, such as considering using toxicity-related odour indicators. In addition, the SUP campaign’s focus on pesticides and PPE is misguided. Farmers regard PPE as uncomfortable and ‘suffocating’ in humid warm weather, leading to the classic problem of compliance associated with individually oriented exposure reduction approaches (Murray and Taylor, 2000). Examination of the components of the classic industrial hygiene hierarchy of controls (Table 4.1) shows PPE to be among the least effective controls and suggests that the industry
88 Agricultural Harm to the Environment Table 4.1 Hierarchy of controls for reducing pesticide exposure Most effective 1 Eliminate more highly toxic products, e.g. carbofuran and methamidophos 2 Substitute less toxic, equally effective alternatives 3 Reduce use through improved equipment, e.g. low volume spray nozzles 4 Isolate people from the hazard, e.g. locked separate pesticide storage 5 Label products and train applicators in safe handling 6 Promote use of personal protection equipment 7 Institute administrative controls, e.g. rotating applicators Least effective Source: Adapted from Plog et al, 1996
strategy of prioritizing PPE is similar to locking the stable after the horse has bolted. Our research has shown the ineffectiveness of product labelling (point 5). Isolation (point 4) is difficult in open environments such as field agriculture where farming infrastructure and housing are closely connected and some contamination of the household is virtually inevitable, particularly in poorer households. Priority should be given to other more effective strategies of exposure reduction, beginning with point 1: eliminating the most toxic products from the work and living environments. Likewise, this is the highest priority of the Integrated Production and Pest Management (IPPM) 2015 initiative. INIAP, the Ecuadorian agricultural research institute, is prepared to declare that alternative technologies exist for the Andean weevil and foliage pests and that highly toxic pesticides are not necessary for potato production and other highland crops in Ecuador (Gustavo Vera, INIAP Director General of Research, personal communication). Meanwhile, pesticide industry representatives have privately acknowledged that they understand that highly toxic pesticides eventually will need to be removed from the market. Nevertheless, the Ecuadorian Plant and Animal Health Service (SESA) and Crop Life Ecuador have taken the position that they will continue to support the distribution and sale of WHO Class I products in Ecuador until the products are no longer profitable or that it is no longer politically viable to do so. One seven-year study by Novartis (now Syngenta) found that SUP interventions in Latin America, Africa and Asia were expensive and largely ineffective, particularly with smallholders (Atkin and Leisinger, 2000). The authors argue that ‘the economics of using pesticides appeared to be more important to [small farmers] than the possible health risks’ (p121). The most highly toxic products are the cheapest on the market in Carchi, largely because the patents on these early generation products have expired, permitting free access to chemical formulas and competition, and because farmers have come to accept the personal costs associated with poisonings.
From Pesticides to People 89
Policies and Trade-offs Pesticide use in agricultural production conveys the benefit of reducing losses due to pests and disease. That same use, however, can cause adverse environmental and health impacts. Previously, we cited a study that showed that pesticide use by farmers was efficient from a narrow farm production perspective. Nevertheless, that study examined pesticide use solely from the perspective of reducing crop losses. If the adverse health and environmental effects were also included in the analysis, the results would be different. Integrated assessment is one method for solving this analytical problem. The Carchi research team devised an innovative approach to integrated assessment called the Trade-off Analysis (TOA) method (Antle et al, 1998b; Stoorvogel et al, 2004). The TOA method is an interactive process to define, analyse and interpret results relevant to policy analysis. At its heart is a set of linked economic, biophysical and health models inside a user shell called the TOA Model. Based on actual dynamic data sets from the field, we used simulations in the TOA method to examine policy options for reducing pesticide exposure in Carchi. The policy options we explored were a combination of taxes or subsidies on pesticides, price increases or declines in potatoes, technology changes with IPM, and the use of personal protective equipment. We examined the results in terms of farm income, leaching of pesticides to groundwater and health risks from pesticide exposure. Normally, policy and technology changes produce trade-offs – as one factor improves, the other factor worsens. Our analysis of pesticide taxes and potato price changes produced such a result. As taxes decrease and potato prices increase, farmers plant more of their farm with potatoes and tend to use more pesticide per hectare. Thus a scenario of pesticide subsidies and potato price increases produce growth in income and increases in groundwater contamination and health risks from pesticide exposure. With the addition of technology change to these price changes, the integrated analysis produced by the TOA model showed that a combination of IPM and protective clothing could produce a win–win outcome throughout the range of price changes: neurobehavioural impairment and environmental contamination decreased while agricultural incomes increased or held steady (Antle et al, 1998c; Crissman et al, 2003).
Transforming Awareness and Practice: The Experience of EcoSalud The unexpected severity of pesticide-related health problems and the potential to promote win–win solutions motivated the research team to search for ways to identify and break the pervasive cycle of exposure for the at-risk population in
90 Agricultural Harm to the Environment
Carchi. The EcoSystem Approaches to Human Health Program of IDRC (www. idrc.ca/ecohealth) offered that opportunity through support to a project called EcoSalud (salud means health in Spanish). The EcoSystem Approaches to Human Health Program was established on the understanding that ecosystem management affects human health in multiple ways and that a holistic, gender-sensitive, participatory approach to identification and remediation of the problem is the most effective manner to achieve improvements (Forget and Lebel, 2001). The EcoSalud project in Carchi was essentially an impact assessment project designed to contribute directly to ecosystem improvements through the agricultural research process. The aims were to improve the welfare of the direct beneficiaries through enhanced neurobehavioural function brought about by reduced pesticide exposure, and to improve the well-being of indirect beneficiaries through farming innovation. The project design called for before-and-after measurements of a sample population that changed its behaviour as result of the intervention. Consistent with IDRC’s EcoSystem Health paradigm, the intervention was designed to be gender sensitive and increasingly farmer- and community-led. EcoSalud started by informing members of three rural communities of past research results on pesticide exposure and health impacts. To illustrate pesticide exposure pathways, we used a non-toxic fluorescent powder that glowed under ultraviolet light as a tracer (Fenske et al, 1986). Working with volunteers in each community, we added the tracer powder to the liquid in backpack sprayers and asked farmers to apply as normal. At night we returned with ultraviolet lights and video cameras to identify the exposure pathways. During video presentations, community members were astonished to see the tracer not only on the hands and face of applicators, but also on young children who played in fields after pesticide applications. We also found traces on clothing and throughout the house, such as around wash areas, on beds and even on the kitchen table. Perhaps more than other activities, the participatory tracer study inspired people to take action themselves. People, in particular mothers, began to speak out at community meetings. The terms el remedio (the treatment) and el veneno (the poison) were often used interchangeably when referring to pesticides. Spouses explained that the need to buy food and pay for their children’s education when work options were limited led to an acceptance of the seemingly less important risks of pesticides. They explained that applicators often prided themselves on their ability to withstand exposure to pesticides. As one young girl recounted (in Paredes, 2001): One time, my sister Nancy came home very pale and said that she thought she had been poisoned. I remembered that the pesticide company agricultural engineers had spoken about this, so I washed her with lots of soap on her back, arms and face. She said she felt dizzy, so I helped her vomit. After this she became more resistant to pesticides and now she can even apply pesticides with our father.
Despite stories such as this, many women became concerned about the health impacts of pesticides on their families. During one workshop, a women’s group
From Pesticides to People 91
asked for disposable cameras to document pesticide abuse. Children were sent to spy on their fathers and brothers and take photos of them handling pesticides carelessly or washing sprayers in creeks. Their presentations led to lively discussions. The results of individual family studies showed that poisonings caused chronic illhealth for men and their spouses, and ultimately jeopardized household financial and social stability. Concern about the overall family vulnerability was apparent during community meetings, when women exchanged harsh words with their husbands over their agricultural practices that resulted in personal and household exposure to toxic chemicals. The men responded that they could not grow crops without pesticides and that the safer products were the most expensive. Communities called for help. INIAP’s researchers and extensionists in Carchi had gained considerable experience with farmer participatory methodologies for technology development, including community-led varietal development of late blight disease resistant potatoes. We know that such approaches can play an important role in enabling farmers to acquire new knowledge, skills and attitudes needed for improving their agriculture. INIAP built on existing relationships with Carchi communities to run Farmer Field Schools (FFSs), a methodology recently introduced to the Andes. In part, FFSs attempt to strengthen the position of farmers to counterbalance the messages from pesticide salespeople. As one FFS graduate said (in Paredes, 2001): Prior to the Field School coming here, we used to go to the pesticide shops to ask what we should apply for a problem. Then the shopkeepers wanted to sell us the pesticides that they could not sell to others, and they even changed the expiry date of the old products. Now we know what we need and we do not accept what the shopkeepers want to give us.
FFS have sought to challenge the most common of IPM paradigms that centres on pesticide applications based on economic thresholds and transfer of single element technologies within a framework of continuing pesticide use (Gallagher, 2000). In contrast, FFS programmes propose group environmental learning on the principles of crop health and ecosystem management as an alternative to reliance on curative measures to control pests. As a FFS graduate in Carchi noted (in Paredes, 2001): When we talk about the insects [in the FFS] we learn that with the pesticides we kill everything, and I always make a joke about inviting all the good insects to come out of the field before we apply pesticides. Of course, it is a poison, and we kill everything. We destroy nature when we do not have another option for producing potatoes.
In practice, the FFS methodology has broadened technical content beyond common understanding of IPM to a more holistic approach for improving plant and soil health. The FFS methodology adapts to the diverse practical crop needs of farmers, be they production, storage or commercialization. FFS ultimately aspires
92 Agricultural Harm to the Environment
to catalyse the innovative capacity of farmers, as exemplified by how a graduate has improved cut foliage insect traps tested in his FFS (in Paredes, 2001): I always put out the traps for the Andean weevil, even if I plant 100 [bags of seed] because it decreases the number of adults. It is advantageous because we do not need to buy much of that poison Furadan. But I do use them differently. After ploughing, I transplant live potato plants from another field, then I do not need to change the dead plants every eight days.
In an iterative fashion, FFS participants conduct learning experiments on comparative (conventional vs IPM) small plots (about 2500m2) to fill knowledge gaps and to identify opportunities for reducing external inputs while improving production and overall productivity. After two seasons, initial evaluation results in three communities were impressive. Through the use of alternative technologies, such as Andean weevil traps, late blight resistant potato varieties, specific and low toxicity pesticides, and careful monitoring before spraying, farmers were able to decrease pesticide sprays from 12 in conventional plots to seven in IPM plots while maintaining or increasing production (Barrera et al, 2001). The amount of active ingredient of fungicide applied for late blight decreased by 50 per cent, while insecticides used for the Andean weevil and leafminer fly (Liriomysa quadrata), that had commonly received the highly toxic carbofuran and methamidophos, decreased by 75 per cent and 40 per cent respectively. Average yields for both conventional and IPM plots were unchanged at about 19t/ha but net returns increased as farmers were spending less on pesticides. FFS participants identified how to maintain the same level of potato production with half the outlay in pesticides and fertilizers, decreasing the production costs from about $104 to $80 per tonne. Because of the number of farmers involved in FFS test plots, it was difficult to assess labour demands in the economic analysis. Nonetheless, farmers felt that the increased time for scouting and using certain alternative technologies, such as the insect traps, would be compensated by decreased pesticide application costs, not to mention decreased medical care visits. A recent ex-post study that INIAP will publish in early 2004 has confirmed this trend at the level of individual farms of FFS graduates in Carchi (Barrera et al, in press). In addition to the intensive six-month FFS experience, EcoSalud staff visited individual households to discuss pesticide safety strategies such as improved storage of pesticides, PPE, use of low volume nozzles that achieve better coverage with less pesticide, and more consistent hygienic practices. Based on widespread disinterest in PPE, we were surprised when participants began to request help in finding high quality personal protective equipment, that they said was unavailable at the dozens of local agrochemical vendors. EcoSalud staff found high quality PPE (mask, gloves, overalls and pants) through health and safety companies in the capital city, costing $34 per set, the equivalent of over a week’s labour at the time. The project agreed to grant interest free, two-month credit towards the purchase price
From Pesticides to People 93
to those interested in buying the gear. Remarkably, 46 of the 66 participating families in three communities purchased complete packages of equipment. A number of farmers rented their equipment to others in the community in order to recuperate costs. Follow-up health studies are not complete, but anecdotal evidence is promising. As the wife of one FFS graduate who previously complained of severe headaches and tunnel vision due to extensive use of carbofuran and metamidophos said: Carlos no longer has headaches after working in the fields. He used to return home [from applying pesticides] and could hardly keep his eyes open from the pain. After the Field School and buying the protective equipment, he is a far easier person to live with (personal communication, farm family, Santa Martha de Cuba).
Complementary projects have supported follow-up activities in Northern Ecuador and elsewhere, including the production of FFS training materials (Pumisacho and Sherwood, 2000; Sherwood and Pumisacho, in press), the training of nearly 100 FFS facilitators in Carchi and nearby Imbabura, the transition of FFS to smallenterprise production groups and the establishment of farmer-to-farmer organization and capacity building. Concurrently, over 250 facilitators have been trained nationwide and hundreds of FFS have been completed. Recently, Ecuador’s Ministry of Agriculture decided to include FFS as an integral part of its burgeoning national Food Security Program. Furthermore, in part due to the successful experience in Carchi, FFS methodology has subsequently spread to Peru, Bolivia and Colombia as well as El Salvador, Honduras and Nicaragua, where over 1500 FFS had been conducted by mid 2003 (LEISA, 2003).
Concluding Comments Much conventional thinking in agricultural development places emphasis on scientific understanding, technology transfer, farming practice transformation and market linkages as the means to better futures. Consequently, the focus of research and interventions tends to be on the crops, the bugs and the pesticides, rather than the people who design, chose and manage practices. Recent experiences of rural development and community health, however, argue for a different approach (see for example, Uphoff et al, 1998; Norgaard, 1994; Latour, 1998; Röling, 2000). Of course, technologies can play an important role in enabling change, but the root causes of the ecosystem crisis such as in Carchi appear to be fundamentally conceptual and social in nature, that is, people sourced and dependent. There is a general need for organizing agriculture around the development opportunities found in the field and in communities (van der Ploeg, 1994). Experience with people-centred and discovery-based approaches has shown promise at local levels, but ultimately such approaches do not address structural power issues
94 Agricultural Harm to the Environment
behind complex, multi-stakeholder, socio-environmental issues, such as pesticide sales, spread and use. The search for innovative practice less dependent on agrochemical markets needs to focus on the diversity of farming and the socio-technical networks that enable more socially and ecologically viable alternatives. Progress in this area would require a new degree of political commitment from governments to support localized farming diversity and the change of preconceived, externally designed interventions towards more flexible, locally driven initiatives. In addition, local organizations representing the most affected people must aim to influence policy formulation and implementation. Our modern explanations are ultimately embedded in subtle mechanisms of social control that can lead to destructive human activity. The social and ecosystem crises common to modernity, evident in the people-pest-pesticide crises in the Northern Andes, are not just a question of knowledge, technology, resource use and distribution, or access to markets. Experience in Carchi demonstrates that approaches to science, technology and society are value-laden and rooted in power relationships among the diverse actors – such as farmers, researchers, industry representatives and government officials – that can drive farming practice inconsistent with public interest and the integrity of ecosystems. Solutions will only be successful if they break with past thinking and more effectively empower communities and broader civil society to mobilize enlightened activity for more socially and environmentally acceptable outcomes.
References Antle J M, Capalbo S M and Crissman C C. 1998a. Tradeoffs in policy analysis: Conceptual foundations and disciplinary integration. In Crissman C C, Antle J M and Capalbo S M (eds). Economic, Environmental and Health Tradeoffs in Agriculture: Pesticides and the Sustainability of Andean Potato Production. International Potato Center, Lima; Kluwer Academic Press, Boston, pp21–40 Antle J M, Capalbo S M, Cole D C, Crissman C C and Wagenet R J. 1998b. Integrated simulation model and analysis of economic, environmental and health tradeoffs in the Carchi potato–pasture production system. In Crissman C C, Antle J M and Capalbo S M (eds). Economic, Environmental and Health Tradeoffs in Agriculture: Pesticides and the Sustainability of Andean Potato Production. International Potato Center, Lima; Kluwer Academic Press, Boston, pp243–268 Antle J M, Cole D C and Crissman C C. 1998c. Further evidence on pesticides, productivity and farmer health: Potato production in Ecuador. Agricultural Economics 18, 199–207 Atkin J and Leisinger K M (eds). 2000. Safe and Effective Use of Crop Protection Products in Developing Countries. Novartis Foundation for Sustainable Development, Switzerland Barrera V H, Norton G and Ortiz O. 1998. Manejo de las principales plagas y enfermedades de la papa por los agricultores en la provincia del Carchi, Ecuador. INIAP (National Agricultural Research Institute), Quito, Ecuador Barrera V, Escudero L, Norton G and Sherwood S. 2001. Validación y difusión de modelos de manejo integrado de plagas y enfermedades en el cultivo de papa: Una experiencia de capacitación participativa en la provincia de Carchi, Ecuador. Revista INIAP 16, 26–28
From Pesticides to People 95 Barsky O. 1984. Acumulación Campesina en el Ecuador: Los productores de papa del Carchi. Colección de Investigaciones, No 1. Facultad Latinoamericana de Ciencias Sociales, Quito, Ecuador Cole D C, Carpio F, Julian J and León N. 1997a. Dermatitis in Ecuadorian farm workers. Contact Dermatitis (Environmental and Occupational Dermatitis) 37, 1–8 Cole D C, Carpio F, Julian J, León N, Carbotte R and De Almeida H. 1997b. Neurobehavioral outcomes among farm and non-farm rural Ecuadorians. Neurotoxicol Teratology 19(4), 277–286 Cole D C, Carpio F, Jullian J and León N. 1998a. Assessment of peripheral nerve function in an Ecuadorean rural population exposed to pesticides. Journal of Toxicology and Environmental Health 55(2), 77–91 Cole D C, Carpio F, Julian J and León N. 1998b. Health impacts of pesticide use in Carchi farm populations. In Crissman C C, Antle J M and Capalbo S M (eds). Economic, Environmental and Health Tradeoffs in Agriculture: Pesticides and the Sustainability of Andean Potato Production. International Potato Center, Lima; Kluwer Academic Publishers, Dordrecht/Boston/London, 209– 230 Cole D C, Carpio F and León N. 2000. Economic burden of illness from pesticide poisonings in highland Ecuador. Pan American Review of Public Health 8(3), 196–201 Crissman, C C, Cole D C and Carpio F. 1994. Pesticide use and farm worker health in Ecuadorian potato production. American Journal of Agricultural Economics 76, 593– 597 Crissman C C, Antle J M and Capalbo S M (eds). 1998a. Economic, Environmental and Health Tradeoffs in Agriculture: Pesticides and the Sustainability of Andean Potato Production. International Potato Center, Lima; Kluwer Academic Press, Boston Crissman C C, Espinosa P, Ducrot C E H, Cole D C and Carpio F. 1998b. The case study site: Physical, health and potato farming systems in Carchi Province. In Crissman C C, Antle J M and Capalbo S M (eds). Economic, Environmental and Health Tradeoffs in Agriculture: Pesticides and the Sustainability of Andean Potato Production. International Potato Center, Lima; Kluwer Academic Press, Boston, 85–120 Crissman C C, Yanggen D, Antle J, Cole D, Stoorvogel J, Barrera V H, Espinosa P and Bowen W. 2003. Relaciones de intercambio existentes entre agricultura, medio ambiente y salud humana con el uso de plaguicidas. In Yanggen D, Crissman C C and Espinosa P (eds). Los Plaguicidas: Impactos en producción, salud y medio ambiente en Carchi, Ecuador. CIP, INIAP, Ediciones AbyaYala, Quito, Ecuador, 146–162 Espinosa P, Crissman C C, Mera-Orcés V, Paredes M and Basantes L. 2003. Conocimientos, actitudes y practicas de manejo de plaguicidas por familias productoras de papa en Carchi. In Yanggen D, Crissman C C and Espinosa P (eds). Los Plaguicidas. Impactos en producción, salud y medio ambiente en Carchi, Ecuador. CIP, INIAP, Ediciones Abya-Yala, Quito, Ecuador, pp25–48 Fenske R, Wong S, Leffingwell J and Spear R. 1986. A video imaging technique for assessing dermal exposure II. Fluorescent tracer testing. American Industrial Hygiene Association Journal 47, 771–775 Forget G and Lebel J. 2001. An ecosystem approach to human health. International Journal of Occupational and Environmental Health 7 (2), S1–S38 Frolich L M, Sherwood S, Hemphil A and Guevara E. 2000. Eco-papas: Through potato conservation towards agroecology. ILEA Newsletter. December, 44–45 Gallagher K D. 2000. Community study programmes for integrated production and pest management: Farmer Field Schools. In FAO, Human Resources in Agricultural and Rural Development, Rome, pp60–67 Herrera M. 1999. Estudio del subsector de la papa en Ecuador. INIAP PNRT-Papa. Quito, Ecuador Lander B F, Knudsen L E, Gamborg M O, Jarventaus H and Norppa H. 2000. Chromosome aberrations in pesticide-exposed greenhouse workers. Scandinavian Journal of Work, Environment & Health, 26(5), 436–442 Latour B. 1998. To modernize or to ecologize? That’s the question. In Castree N and Willems-Braun B (eds). Remaking Reality: Nature at the Millennium. Routledge, London and New York, 221– 242
96 Agricultural Harm to the Environment LEISA. 2003. Aprendiendo con las ECAs. LEISA: Revista de Agroecología Junio 19(1), 87 Mera-Orcés V. 2001. The sociological dimensions of pesticide use and health risks of potato production in Carchi, Ecuador. Paper prepared for the Open Meeting of the Human Dimensions of Global Environmental Change Research Community. Rio de Janeiro, Brazil, 6–8 October Merino R and Cole D C. 2003. Presencia de plaguicidas en el trabajo agrícola, en los productos de consumo, y en el hogar. In Yanggen D, Crissman C C and Espinosa P (eds). Los Plaguicidas. Impactos en producción, salud y medio ambiente en Carchi, Ecuador. CIP, INIAP, Ediciones AbyaYala, Quito, Ecuador, 71–93 Murray D L and Taylor P L. 2000. Claim no easy victories: evaluating the pesticide industry’s global safe use campaign. World Development 28(10), 1735–1749 Paredes M. 2001. We are like the fingers of the same hand: Peasants’ heterogeneity at the interface with technology and project intervention in Carchi, Ecuador. MSc thesis. Wageningen, The Netherlands: Wageningen University Paz-y-Mino C, Bustamente G, Sanchez M E and Leone P E. 2002. Cytogenetic monitoring in a population occupationally exposed to pesticides in Ecuador. Environmental Health Perspectives 110, 1077–1080 Plog B A, Niland J, Quinlan P J and Plogg H (eds). 1996. Fundamentals of Industrial Hygiene. 4th ed. National Safety Council, Ithaca, NY Pumisacho M and Sherwood S (eds). 2000. Herramientas de Aprendizaje para Facilitadores. Manejo Integrado del Cultivo de Papa. INIAP and CIP, Quito, Ecuador Restrepo M, Munoz N, Day N E, Parra J E, de Romero L and Nguyen-Dinh X. 1990a. Prevalence of adverse reproductive outcomes in a population occupationally exposed to pesticides in Colombia. Scandinavian Journal of Work Environment and Health 16, 232–238 Restrepo M, Munoz N, Day N, Parra J E, Hernandez C, Blettner M and Giraldo A. 1990b. Birth defects among children born to a population occupationally exposed to pesticides in Colombia. Scandinavian Journal of Work Environment and Health 16, 239–246 Röling, N. 2000. Gateway to the global garden: Beta-gamma science for dealing with ecological rationality. Eighth annual Hopper Lecture. University of Guelph, Canada, 24 October. www.uoguelph. ca/cip Sherwood S and Pumisacho M. In press. Guia Metodológica de Escuelas de Campo de Agricultores. INIAP-CIP-FAO-WN, World Neighbours, Jardines de San Juan, Guatemala Sherwood, S, Crissman C and Cole D. 2002. Pesticide Exposure and Poisonings in the Northern Andes: A Call for International Action. Pesticide Action Network UK. Spring edition Stoorvogel J J, Antle J M, Crissman C C and Bowen W. 2004. The tradeoff analysis model: Integrated bio-physical and economic modeling of agricultural production systems. Agricultural Systems 80(1), 43–66 Uphoff N, Esman M J and Krishna A. 1998. Reasons for Success: Learning From Instructive Experiences in Rural Development. Kumarian Press, West Hartford, CN USEPA. 1992. Ethylene bisdithiocarbamates (EBDCs); Notice of intent to cancel and conclusion of Special Review. Federal Register 57(41), 7434–7539 van der Ploeg J D. 1994. Styles of farming: An introductory note on concepts and methodology. In van der Ploeg J D and Long A (eds). Born from Within: Practice and Perspectives of Endogenous Rural Development. Assen: Van Gorcum, 7–31 World Development Index. 2003. World Bank, Washington DC. An online database available at www.worldbank.org, accessed 6 January 2004
5
Incidence of Acute Pesticide Poisoning Among Female and Male Cotton Growers In India Franceses Mancini, Ariena H. C. van Bruggen, Janice L. S. Jiggins, Arun C. Ambatipud and Helen Murphy
Introduction Agriculture in South India is primarily a subsistence production system that involves 127 million cultivators and 107 million agricultural labourers. Crop productivity in the rainfed area, which includes more than 70 per cent of the cultivated land, is low and unpredictable (Department of Agriculture, 2002). The majority of the population is rural (74.3 per cent, Census 2001) and 34.7 per cent live below the international poverty level (World Bank, 2003). During the Green Revolution, high yielding varieties of various crops were introduced into the farming systems to increase productivity. These varieties were significantly more susceptible to plant pests and diseases and, subsequently, the use of pesticides became more intense, increasing from 2330 kton during 1950–51 to 54,773 kton in 1990–91 (Directorate of Plant Protection, 2002, personal communication). Pesticides are largely applied to protect commercial crops. Cotton cultivation alone uses more than 60 per cent of the national consumption. The consequences of such indiscriminate use of pesticides have recently become a matter of public concern in India, following the publication of alarming information about the levels of pesticide residues in drinking water and soft drinks (CSE, 2003). Beside the consumers’ risks stands the documented hazard to producers, who are directly exposed to chemical substances (Kishi et al, 1995; Murphy et al, 1999; Wesseling et al, 2001; Kunstadter et al, 2001). Agricultural labourers and Reprinted from Mancini F, van Bruggen A H C, Jiggins J L S, Ambatipud A C and Murphy H. 2006. Incidence of acute pesticide poisoning among female and male cotton growers in India. International Journal of Occupational and Environmental Health 11(3), pp221–232 [In Mancini F. 2006. Impact of IPM Farmer Field Schools on Health, Farming Systems, the Environment, and Livelihoods of Cotton Growers in Southern India. PhD thesis, Wageningen University, Chapter 2, pp9–26.] Reproduced with permission.
98 Agricultural Harm to the Environment
farmers work in a highly unsafe occupational environment. The pesticides used largely belong to WHO category I and II (Highly Hazardous and Moderate Hazardous). Chemical products such as Aldicarb, Dieldrin and Paraquat that are banned in developed countries are still registered in India. Protective measures and equipment for safe handling and spraying of the pesticides are far from being adopted. Instead, people work barefoot, barehanded, wearing only short-sleeved cotton tee shirts and traditional sarongs (lungi). During an average spraying session, a farmer is directly exposed to pesticides for three to four hours at a time through leaking spray equipment, dripping plants and wind drift. Concentrated chemical products are mixed with water with bare hands. Farmer risky behaviour is not necessarily explained by a lack of awareness. On the contrary, farmers’ level of knowledge on the health hazards of pesticides – even though partial and inexact – is in many cases higher than expected (Aragon et al, 2001; Clarke et al, 1997; Eisemon and Nyamete, 1990; Kishi, 2002). Training does little to change hazardous use of pesticides. For example, a programme conducted by Novartis to train farmers in the safe handling and use of pesticides in the Coimbatore District of Tamil Nadu, India, in 1992 failed to achieve substantial and sustainable changes in farmers’ practices. Not only is protective equipment expensive, unavailable and cumbersome to use, but in the extreme hot weather conditions of the tropics protective gear is rarely used (Kishi et al, 1995). Therefore, educating farmers about the safe use of pesticides alone does not seem to be a viable solution to eliminate occupational risks. To date, studies have focused on the adverse health effects occurring among people applying chemical products. However, the focus should also extend to those who play supportive roles in the pesticide applications: women and children. In India, the production of cotton is female-labour-intensive. Extremely time-consuming operations such as weeding are often performed by women and children during the peak of the spraying season when there are high residue levels in the fields. Other key female tasks are pesticide mixing with water and refilling the sprayers’ tanks (Mancini, unpublished). Pesticides are largely applied by low-income groups of people, marginal farmers and landless workers. Associated malnutrition and infectious diseases in these populations makes them more vulnerable to poisoning (London and Rother, 2000; WHO, 1990). The need to generate information about the social and gender implications of pesticide application has been well documented and recommended in a review of the health impacts of pesticides complied by Kishi (2005). This study was engendered by the need to document the serious human health consequences of the indiscriminate use of pesticides on cotton in India. The intent was to focus on less-visible, but much exposed subjects: women and marginal farmers. Women perform secondary activities that have often been neglected in studies dealing with direct exposure. Marginal farmers are often engaged in professional spraying and therefore prone to continuous exposure.
Incidence of Acute Pesticide Poisoning Among Cotton Growers in India 99
Materials and Methods Study objectives In 2003, the European Union Food and Agriculture Organization, Integrated Pest Management (EU-FAO IPM) Programme for Cotton in Asia designed a participatory project that aimed to assess the frequency and severity of acute pesticide poisoning among cotton growers in Andhra Pradesh. For the last three years the programme has been operative in the state educating farmers in sustainable alternatives to pesticide use in Farmer Field Schools (FFSs). As part of the regular FFS curriculum, farmers were taught of the adverse effects of pesticides on human health and the environment. The assessment was conceived as a season-long special activity to be undertaken in three villages that had IPM1 Farmer Field Schools.2 The initiative aimed to measure the health effects of pesticide exposure in real time through direct farmers’ documentation. Because previous studies focused on male farmers who apply chemical products, this study concentrated on women as respondents (for themselves and for their male relatives). This surveillance activity assisted farmers in generating information on: • • •
the frequencies and severities of acute pesticide poisoning occurring among male and female cotton farmers; the exposure of women performing supportive roles during spray operations; the vulnerability of low-income groups involved in pesticide application.
A second part of the assessment undertaken in 2004 in the same villages measured actual changes occurring in the health of the respondents, as a result of the participation in the cotton IPM FFS. Monitoring continued for several months, using the same reporting method as the study reported here. The data will be analysed against the baseline survey collected in 2003. This paper represents the first part of the assessment conducted to estimate the effects on cotton growers’ health of a chemical-based plant protection system.
Study area The study was conducted in three cotton-growing villages. They were purposely selected immediately after the commencement of the FFS – on the basis of a high female (over 50 per cent) and marginal (< 1ha) farmer (55 per cent) participation predetermined by the FFS farmer selection process and the community’s interest in the monitoring activity. The EU-FAO IPM Programme adopted the strategy of conducting one FFS per village, regardless of the village size. Therefore, there were 25 trained farmers per village, of which some were women. All the women who had participated in the FFS in the three villages joined the self-monitoring. Two of the villages (Sairedapalli and Srinagar) were located in Warangal District and one (Darpalli) in Mahaboobnagar District, Andhra Pradesh.
100 Agricultural Harm to the Environment
Andhra Pradesh is one of the nine major cotton-producing states of India. The rural population is 73 per cent of the total. Cotton is grown on 1.02 million hectares. The industrial production of cottonseed is also concentrated in the state. According to the 2001 census, Mahaboobnagar and Warangal districts have a total population of 3,077,050 and 2,818,832, respectively. Cotton is grown as the main crop during the rainy season (Karif ) on 121,260ha in Warangal and 22,697ha in Mahbubnagar. Darpalli is a small village populated by marginal native farmers (721 inhabitants). The area under cotton was 45 hectares. The level of education among the people was found to be very low (in 1997, 70 per cent of the rural people in the state were not literate). In contrast, migrant communities, who moved from the state coastal area in search of fertile lands to cultivate, mainly inhabited Srinigar and Sairedapalli villages. The villages had respectively 3108 and 1038 inhabitants; the area under cotton was 500ha and 122ha. Those villages could be considered better off in that they had more education and wealth.
Training of enumerators and farmers The study involved three FFS facilitators trained by the EU-FAO IPM Programme for Cotton in Asia in season-long (six months) residential Training of Facilitators (ToF) on IPM. In addition to the technical knowledge, the ToF provides a solid background about adult non-formal education and enables facilitators to conduct Participatory Action Research with farmers. In order to coach the self-health monitoring, three FFS facilitators were also taught how to identify the signs and symptoms of acute pesticide poisoning. Emphasis was given to the need for establishing clear correlations between illness and exposure to pesticides. Minor adaptations to the specific study requirements were made to the reporting format and method developed by Murphy et al (1999, 2002). During the initial FFS sessions, three facilitators trained the farmers who had volunteered to participate in the monitoring. The forms to be used were field tested with 20 respondents to correct for any potential misunderstandings of the reporting procedures as well as misconceptions about the signs and symptoms. During the four months of the assessment, the project staff provided constant coaching to the farmers and the facilitators. A mid-season review meeting was also organized two months from the start. A simple analysis of the forms was done together with the farmers at the end of the season in a final workshop.
Period and procedure The actual reporting started in the second month of the cotton-growing season when pesticides are first applied to the young plants, in August 2003, and lasted until December 2003. Women farmers (n = 50) attending the FFSs, organized in their respective villages, filled in health-monitoring forms after potential exposure to a variety of pesticides. In addition to self-reporting their own signs and symptoms of
Incidence of Acute Pesticide Poisoning Among Cotton Growers in India 101
acute poisoning, the women each interviewed one male family member (n = 47) who had applied pesticides. Respondents were asked to fill in a form after every potential pesticide exposure regardless of whether or not they had experienced an adverse effect. Forms were filled in as a result of any of the following circumstances: • • •
spraying pesticides in the field; mixing chemical solution and refilling spray tanks; working in field sprayed within the same day.
Only the signs and symptoms that occurred during the working session or within 24 hours after exposure were recorded. At each FFS meeting the forms were reviewed.
Format The reporting format was pictorial to facilitate participation among those who were not literate (Figure 5.1). Facilitators provided the necessary assistance to review the forms throughout the monitoring. The form allows for the reporting of the following: • • • • • • • •
a list of 18 signs and symptoms (S&S) of acute pesticide poisoning (see Table 5.2);3 type of chemical products used; quantity of chemical products used (ml formulated product/Lt water); hours spent in performing the operation; hours extra-respite taken due to illness; number of sick days not worked as a consequence of the illness; use of medical treatments and home-made remedies; operation performed.
The following socioeconomic parameters were collected in separate interviews from each respondent: Age, Gender, Formal education, Landholding, Profession and Income level. A total of 97 farmers, 50 women and 47 men, participated in the self-health monitoring (Table 5.1). All the women participating in the FFSs in the Table 5.1 Distribution of respondents among the village Women (respondents)
Men (indirect reporting)
Total
Darpalli
25
23
48
Sairedapalli
14
14
28
Srinagar
11
10
21
Total
50
47
97
102 Agricultural Harm to the Environment
three villages were involved in the self-monitoring. As a result of the purposive selection of the villages, the sample included 70 per cent of small farmers (75 per cent root degeneration at the time when flooded rice plants commence flowering (Kar et al, 1974), i.e. at a time when peak root activity is required by plants to achieve higher yield. Also, the lower oxygen concentration in the rhizosphere and continuous soil submergence results in more
94 The Global Food System
accumulation of carbon dioxide around the roots which speeds up the root senescence.
Impact of Root Activity on Plant Physiology and Yield The details of how a healthy root system influences the physiology of the ‘visible’ plant, especially how it affects yield, are discussed here. For the purposes of discussion, indicators for root health are defined as root mass and respiration rate. In general, factors listed as responsible for increasing the physiological efficiency of rice plants include: canopy architecture (Takeda et al, 1984); single leaf photosynthetic activity (Park and Ota, 1969; Hayami, 1983); root activity and root quantity (Lee, 1980; Jiang et al, 1985); and plant adaptability to pure stands or monoculture (Donald, 1968, 1981; Ishi et al, 1986). All these factors are closely dependent on root activity since higher α′ -naphthylamine-oxidizing activity of roots is correlated with higher chlorophyll content of the leaves, slower leaf senescence (Ota and Lee, 1970; Youn and Ota, 1973), and more erect standing leaves. These important findings reflect the causality in the relationship between above-ground and under-ground plant parts. Similarly, Jiang et al (1985) suggested that if root activity is kept high during the ripening period, leaf blades will maintain their upright posture; and they will also age more slowly, delaying both withering and declining photosynthetic activity. In addition, they also found that when root activity is high, the photosynthetic rate does not decline so much in the afternoon. Therefore, these authors concluded that keeping root activity high is very important to maintain the functioning of the source, i.e. higher photosynthetic efficiency of the leaves during the ripening period. The conundrum was how to do just that since HYT was based on the supposition that higher yields were dependent on higher plant densities, leaving little scope to reduce the root activityinhibiting effects of shading. A partial solution was suggested by Matsushima (1973) – intermittent irrigation at later growth stages to stimulate root activity. Based on Matsushima’s suggestion, Tsuno and Wang (1988) concluded that drained field conditions could induce higher root activity by enhancing root respiration and root revitalization, resulting in greater leaf area, higher photosynthesis activity and higher yield. Recently, these finding have been complemented by another two major findings, i.e. high root activity contributes to a higher photosynthetic rate (Osaki et al, 1997), and the growth of shoots is very much dependent on root growth (Nikolaos et al, 2000). Another valuable clue regarding the importance of root growth derives from the suggestion of Xuan et al (1989) that root quantity, as well as root activity, are both required for raising yield. This suggestion came after the discovery by Terashima et al (1988) that a super high-yielding cultivar has larger root systems compared to other indigenous cultivars.
The System of Rice Intensification (SRI) 95
In general terms, a larger root surface area is associated with higher cation exchange capacity, and thus more nutrient uptake becomes possible. Further, greater root quantity also correlates with drought tolerance. Several research groups have shown that, in the case of drying soil, water deficits first appear near the surface and then progress to the deeper layers; increased depth of rooting is common under these conditions (Proffitt et al, 1985; Newell and Wilhelm, 1987). Thus, root systems can be enhanced (deepened) by lowering soil moisture status, during the vegetative stage, providing a buffer against drought conditions. This finding is in agreement with earlier findings (e.g., O’Toole and Chang, 1979; Yoshida and Hasegawa, 1982) that those cultivars which are characterized by higher ratios of deep root weight to the weight of the above-ground plant parts have a higher drought-tolerance score. The force required to pull up rice seedlings from the paddy soil is correlated with root weight, root branching, and thick root number (O’Toole and Soemartono, 1981). Based on the relationship between root abundance and drought tolerance, Ros et al (2003) recently proposed seedling selection with higher shoot/root ratios as a means of increasing drought tolerance and yield. Thus there is abundant evidence to confirm the crucial role of the ‘hidden half ’ plant parts in co-determining grain yield; this becomes all the more important when the crop needs to be managed under limited soil moisture conditions. However, despite these supporting facts, the importance of root activity in relation to yield has been given limited attention in rice research. One of the reasons for this oversight might be the dramatic success of the ‘Green Revolution’ which eclipsed, by and large, almost all traditional cultural practices in Asia, including HYT-based techniques. Perhaps it was also a case of out of sight, out of mind! Only recently the ‘half told’ story of rice roots resurfaced when SRI practice became more widely known, when rice plants showed more vigorous root growth irrespective of cultivar species under SRI management. This indicates that the cultural practices recommended in SRI have an influence on root quantity and root activity and so provide the basis for reviewing basic management practices of SRI which might have an influence on root activity and quantity.
SRI Management and its Relation to Root Quantity and Activity Growing seedlings in well-drained nursery beds with fewer seeds, and transplanting at the 2–3 leaf stage (germination and early seedling growth) Although rice plants are ‘semi-aquatic’ and seeds germinate well in water (unlike true aquatic plants, the germination of rice is not inhibited by lack of oxygen), this does not mean that rice is an aquatic plant that grows better under submerged
96 The Global Food System
Note: Where M = mesocotyl, C = coleoptile, R = root, L = leaf. Equivalent values are shown between pF and percent scale: e.g. 2.69 is equivalent to 50% moisture content in the medium (vermiculite). Source: Takahashi, 1978.
Figure 4.1 Relationship between seedling growth and moisture content in a culture medium
conditions. Many studies have examined the germination pattern of rice seeds under submerged conditions (Yokoi, 1898; Sasaki, 1926; Takei, 1941; Takahashi, 1978). These researchers have concluded that low oxygen tension in water caused elongation of coleoptiles and the prevention of radicle growth at initial stages. When Takahashi (1978) looked at the growth pattern of seedlings under different levels of moisture content in the media (Figure 4.1), he found that the elongated growth of the mesocotyl took preference over that of the coleoptile until near pF 2.4 (the forces necessary for plants to extract water from the soil for their use); then, as the pF was further lowered, coleoptiles growth occurred preferentially. No growth of the mesocotyl occurred under saturated condition. Takahashi (1978) reported that at lower oxygen tension in the water (as with hypoxic condition) compared to the atmosphere, several metabolites including carbon dioxide are accumulated in the surrounding root media and adversely affect seedling growth.
The System of Rice Intensification (SRI) 97
Similarly, Kordon (1974a, 1974b) reported that the primary and adventitious root growth was prevented by less oxygen in the root media. Ros et al (2003) also showed that increased competition for nutrients at higher seed rates in the nursery bed reduced seedling vigour after transplanting. Based on these two facts it may be assumed that the SRI practice of maintaining well-drained soil in an SRI seed bed helps roots to grow at the very early seedling stage. At the same time, less inter-plant competition due to reduced seedling density helps seedlings access more growth-promoting nutrients, leading to healthier seedlings. Thus SRI seedlings are heavier and sturdier compared to seedlings grown in conventional nursery beds (Stoop, 2005). Transplanting rice seedlings at a younger stage has been supported by many researchers (Ota, 1975; Yamamoto et al, 1995; Horie et al, 2005). This practice captures the benefit of the early phyllochron1 stages (less than four leaves) having higher potential to produce more tillers/plant (Katayama, 1951). However, in the SRI method, special attention has also been given to careful uprooting and then gently transplanting seedlings immediately into the field with minimal root loss so as to minimize transplanting trauma. This practice makes an important contribution to subsequent root vigour and activity and hence to overall yield performance, compared to conventional management practices. In addition, SRI practice also suggests that the seed sac along with the soil attached to the seedling should be kept intact while uprooting to ensure that the endosperm is still attached, so that there is maximum sustained nutrition of the young plant. In general, uprooting causes stress to the seedling which could be minimized when the endosperm remains attached (Sakai and Yoshida, 1957; Ota, 1975; Hoshikawa et al, 1995). In conventional management practice, it has been reported that around 40–60 per cent of the root remains in the soil during pulling up from the nursery. Pruning up to 60 per cent of the root during transplanting significantly decreased subsequent root and shoot dry matter (Ros et al, 1998). This suggests that a considerable loss of roots at the seedling stage affects seedling vigour and hence yield. Therefore, it may be suggested that SRI practices lead to increased shoot and root dry matter by protecting root systems during transplanting. SRI practices lead farmers to give greater attention to the conditions of growing, uprooting, storing, transporting and planting seedlings; and the effects that these practices have on plant development and yield. One important factor that influences plant morphogenesis, and which has a profound influence on the formation of roots and shoots and their relative growth, is the level of cytokinin in the plant. As a phytohormone that is mainly synthesized in the roots, cytokinin has a significant effect on tiller bud formation (John et al, 1993; Bangerth et al, 2000); it mobilizes plant nutrients (Li et al, 1992), delays leaf senescence, regulates chloroplast development, and determines sink–source relationships (Hutchinson and Kieber, 2002). Therefore, it may be assumed that SRI plants, at the seedling stage, that have more root quantity compared to conventionally grown rice seedlings, also have a greater supply of cytokinins. The implication of this for tiller development is
98 The Global Food System
discussed later. In addition, higher root quantity should enhance both nutrient and water-absorbing functions. This assumption is in agreement with the finding of Hanada (1976) where tiller bud formation was promoted by the application of kinetin to the rice roots at the five leaf stage. In summary, careful transplanting at the 2–3 leaf stage should yield improved results as seedlings enjoy the benefit of both endosperm nutrition and of newly formed roots. However, careful and early transplanting requires increased skill, and hence labour; but once farmers realize that there is a set of options to evaluate in growing and transplanting seedlings that will have an impact on production and yield without heavy demands for costly inputs, rigid traditional practices will be seen in a new light.
Transplanting single seedlings with wider spacing Plants grown with wider spacing have more area of soil around them to draw nutrients from. Such plants also have better access to solar radiation for better photosynthesis. Hence they perform better as individual plants. Consequently, there should be no mystery about why SRI plants invariably perform better than conventionally managed rice in terms of yield per plant. The reason for the deviation of this linearity in the case of grain yield per plot is that the yield is not entirely dependent on the performance of the individual plant. It is also a function of the total number of panicles per plot and on the other key yield-contributing parameters, number of filled grains per panicle and grain weight. Clearly, spacing is critical in modifying the components that influence final yield. In this regard, Takeda and Hirota (1971) showed that grain yield was unchanged between planting densities from 10 to 100 hills per m2. There is significant interaction between varieties and spacing. Generally, longduration varieties do better with wider spacing than short-duration varieties (Baloch et al, 2002). This is in agreement with the recent finding of Stoop (2005) who suggested that long-duration varieties will perform better under SRI management practice. These responses support the hypothesis (Kira et al, 1953) that, with increasing planting density, biomass yield reaches a ceiling value that is limited by the supply of resources. The supply of resources mainly depends on the root system activity. So, it can be suggested that wider spacing allows roots to grow profusely along with production of more tillers per plant. Under SRI management it can be suggested that early transplanting provides a longer vegetative growth period, and single seedling per hill reduces competition and helps to minimize the shading effect on lower leaves. This helps lower leaves to remain photosynthetically active, for much longer; and, in turn, root activity remains higher for a longer period due to the plant’s enhanced supply of oxygen and carbohydrates to the roots (Tanaka, 1958; Horie et al, 2005). Further, higher root activity, in turn, supplies cytokinins to the lower leaves, delaying senescence and helping to maintain photosynthetic efficiency of the plant at later growth stages. This outcome has been confirmed by a recent research finding where single
The System of Rice Intensification (SRI) 99
seedling per hill had higher yield compared to three seedlings per hill (San-oh et al, 2006). In addition, they reported that plants with one seedling/hill had greater numbers of crown roots, root length density and cytokinin content compared to plants with three seedlings/hill. The photosynthetic rate at later growth stages was significantly higher in single seedling/hill compared to three seedlings/hill. However, single seedling/hill may be justified with the concept that the yieldcontributing parameter within the plant can be modified by manipulating intrahill interactions; still, inter-hill and row spacing need to be adjusted according to varietal characteristics (plant height, leaf area index, leaf posture and plant canopy area) to achieve optimum plant population per plot to realize higher yield potential under SRI management practices. Once again, farmers are well placed to experiment with spacing and its relation with varieties and crop yield. Increased spacing with younger seedlings runs counter to the traditional experiences of rice farmers and is one aspect of SRI that is approached with much scepticism by farmers who are experimenting with SRI concepts for the first time, with even more scepticism from neighbouring farmers. However, the impact of these practices on plant growth is sufficiently spectacular that neighbouring farmers start asking, ‘what variety are you using?’ Regardless of the eventual merits of SRI, it stimulates self-development and increased ownership by farmers of their production processes.
Intermittent irrigation In recent years, the main aim of developing intermittent irrigation of rice has been to save water. It was reported that 25–50 per cent of water used could be saved by this method without any adverse effect on rice yield (Ramamoorthy et al, 1993; Tajima, 1995). In contrast, it has also been reported that intermittent irrigation increased water consumption and water stress, decreased leaf area index, induced early senescence and decreased the rate of photosynthesis and net assimilation rate (Lu et al, 2000). Recently, Belder et al (2005) have found that in aerobic rice culture, crop growth and yield was limited by water deficits and not by nitrogen deficiency. However, it was also found that growth is not harmed when plants are exposed to limited water conditions during their vegetative stage (Boonjung and Fukai, 1996). These authors concluded that the plant adopts osmotic adjustment at the vegetative stage which constitutes the most noticeable mechanism of dehydration tolerance in the rice plant (Steponkus et al, 1980). But, any drought stress at later stages in plants which are not exposed to such drying treatment can cause great loss, especially when plants are in the early reproductive phase (Kobata and Takami, 1981). Interestingly, in HYT, intermittent irrigation served a different purpose. According to the HYT theory, the so-called ‘broken irrigation’ method was used to control tillering, improve soil conditions and to maximize efficiency at harvest by changing the sink–source relationship. The ‘broken irrigation’ method entailed the following procedure: after flooding the field, water intake was cut so as to let the
100 The Global Food System
water level go down gradually until the soil surface appeared, the field surface was exposed to air for three to five days, and then flooded again. These findings indicate that intermittent drying in the vegetative stage may not only induce root growth into deeper soil layers but could also help the plant to develop xeromorphic characteristics. Intermittent drying also improves soil, stimulates tiller development and alters sink–source relationships. These findings are very illuminating for current rice production situations where various efforts are focusing on producing more food with less water. In relation to root activity, it has been found that the three yield-improving components, that is, tiller development, soil condition and sink–source relations, have a close relation with cytokinin production which is regulated by root activity. It is greatly regulated by environmental conditions such as nitrogen availability, soil moisture condition, root mass, etc. Another phytohormone which is closely linked to nitrogen status of soil and may vary with the intermittent irrigation is auxin. Evidence exists that indicates that auxin induces lateral root formation while cytokinin helps in their elongation (Debi et al, 2005). The hypothesis that cytokinin concentration is regulated by N (Kuiper et al, 1988) is supported by the positive relationship between N supply and cytokinin production (Mercier et al, 1997). It has also been indicated that production of cytokinin, as well as biomass, is stimulated by a mixed N source (NO3– : NH4+ ratio 1:1) (Wang and Below, 1996; Briones et al, 2003) rather than any single source. This statement is in agreement with the finding, reported by Kronzucker et al, (1999), that rice yields can be 40–60 per cent higher for any given amount of nitrogen taken up if the N is equally divided in forms between ammonium (NH4) and nitrate (NO3), rather than being entirely absorbed as ammonium. This synergistic mode of uptake is still poorly understood, but has been reported repeatedly in the literature (Ta and Ohira, 1981; Ta et al, 1981; Smiciklas and Below, 1992). Interestingly, hybrid rice cultivars, which tend to have higher root activity and quantity compared to traditional cultivars, are also more responsive to mixed sources of nitrogen (Luo et al, 1993). A second important factor which influences cytokinin is soil nitrogen. The status and availability of soil N are dependent on the soil’s aerobic/anaerobic environment. This influences the rate of N mineralization resulting from microbial decomposition of organic matter. In this context, it is reported that microbial decomposition responds to soil water content and to intermittent drying. The latter kills off a large portion of soil microbes, thereby releasing N for plant uptake during rewetting cycles (Birch, 1958; Bottner, 1985; Kieft et al, 1987). These findings indicate that soil nitrogen status may be enhanced, in terms of maintaining a balanced ratio of NO3– : NH4+ nutrition to enhance root-available nitrogen. These, in turn, regulate cytokinin, and therefore, root activity. NO3– increases the auxin:cytokinin balance required for tiller and biomass production, while urea and NH4+ shift this ratio in favour of cytokinin (Mercier et al, 1997), probably delaying root senescence at later growth stages. This is important in the context of SRI management practices where, after intermittent irrigation, shallow flooding has
The System of Rice Intensification (SRI) 101
been recommended during the reproductive stage. This late flooding practice allows NH4 to dominate, hence favouring cytokinin production. A third component that affects cytokinin content is the root mass. It has been indicated that quantitative root growth is higher in high-yielding cultivars (Kim et al, 1985; Harada et al, 1988). These cultivars transport larger amounts of cytokinin to the above-ground parts of the plant during the ripening stage. This has the effect of suppressing a decline in rubisco content (Ookawa et al, 2004), resulting in a higher rate of grain filling and delayed senescence of the plant. Since higher root mass is a greater supplier of cytokinin compared to fewer roots, there is evidence to indicate that intermittent irrigation may increase root mass during vegetative stages (Matsuki and Katsutani, 1940; Baba, 1977) and stimulates more root activity, and hence more cytokinin content. This favourable outcome can be achieved by maintaining higher rates of cytokinin production at a later growth stage, first by following intermittent irrigation during vegetative stage and then by maintaining shallow flooding during the reproductive phase. Clearly, this is not possible under completely flooded conditions because of the lesser quantity of roots and minimal root activity since, under continuously flooded conditions, over 75 per cent of roots degenerate by the time plants are entering their reproductive phase. (Kar et al, 1974). This adaptive trait could be exploited to manage rice crops under limited water conditions without compromising grain yield. This could also be why farmers claim that they experience better yield with SRI practice compared to conventional production methods under drought conditions.
Application of compost The fourth management practice of SRI is compost application. In general, plant root growth is greatly affected by the soil environment and, in this context, the effect of organic manure on soil is well known. The incorporation of organic manure into soil can bring beneficial effects to root growth by improving the physical and chemical environments in which roots grow (Sidiras et al, 2001; Yang et al, 2004). These non-biological aspects of the soil create a productive biological environment by stimulating root growth-promoting bacteria (Timmusk, 2003). In addition, the effectiveness of organic manure in improving root growth and nutrient uptake by rice plants is significantly different under different water regimes. For example, continuous water logging significantly decreases root growth (Sahrawat, 2000), whereas under intermittent irrigation, the incorporation of organic matter improves root morphological characteristics and root activity of rice plants. It has the effect of increasing root density, active absorption area, root oxidation ability and nutrient uptake (Yang et al, 2004). There are immense benefits from compost application in rice farming given that compost improves the soil’s physical, chemical and biological properties. And, therefore, it is not surprising that SRI recommends application of compost. However, the question of compost availability for large areas needs to be addressed.
102 The Global Food System
First, it is clearly stated that application of compost in SRI practice is optional (http://ciifad.cornell.edu/sri/proc1/sri_03.pdf ), even though some proponents of organic production present SRI otherwise (Schiller, 2004). This flexibility indicates that the observed positive SRI responses are not entirely based on organic fertilizer as it is assumed by some SRI critics (Sinclair and Cassman, 2004). However, in the past, agricultural utilization of organic materials was the common traditional practice in Asia when rice was produced and consumed locally. But, more recently, widespread introduction of chemical fertilizers together with the high costs of labour and transport of organic manure, plus diminished availability of biomass in some or many places, has led to a decline in the use of organic materials in cropping systems. At the same time, intensification of crop production and urban concentration have led to a large increase in the production of agricultural waste in many regions of the world. As with other grain crops, rice production is now more akin to an open-cycle extractive industry, driven by externally supplied synthetic inputs with nutrients being transported to urban concentrations, ultimately ending up as displaced pollutants. And in the absence of effective recycling procedures, the remaining crop residues are often mismanaged, leading to further nutrient loss. The promotion of compost application in SRI serves two purposes: for farmers, it draws attention to the vital importance of soil structure and biology in growing a healthy crop sustainably; and for governments, it highlights the need to address the bigger question of returning nutrients to the rice paddy from the urban concentrations once the grain has been consumed and discarded as human waste. SRI advocates argue that the more extensive root systems of SRI plants and the improved soil structure and biology, induced by compost applications, provide access to a much larger pool of nutrients (Uphoff, 2003). To the extent that these claims are valid, they only provide a breathing space until agricultural production systems return to the closed cycle practised with traditional rice production.
Moving Ahead from HYT to SRI It has been revealed that SRI management practices for rice production in Asia have strong linkages with the previous cultural practices such as HYT. Of course, SRI-inspired farmers appreciate the considerable savings in labour and seed costs, if they can reduce seedling density without compromising on yield. But why is SRI proving more successful in spreading than HYT, whose success was limited to a few farms where farmers could access large amounts of compost? Matsushima (1973) suggested that in adopting HYT for high yield, the first step is to prepare a large ‘container’ and second is to fill this container with rice. By ‘container’ he means the number of spikelets per square metre, and the content of the container is the percentage of ripened grains. For the first step he suggested that there should be dense planting to secure the maximum number of tillers per
The System of Rice Intensification (SRI) 103
square metre, and hence in turn the greatest number of grains per square metre. To achieve this, he suggested that the plant should absorb as much as nitrogen as possible without compromising plant health. Since lodging – and thus reduced photosynthesis capacity – at a later stage was the major constraint, he also added that improvement should also be made in the light-receiving efficiency of the rice crop. For this, he suggested revitalizing the roots by intermittent irrigation at later growth stages to increase root longevity. The idea was that this would prevent lodging and improve the physical condition of the plants by restricting their nitrogen absorption during the middle growth period while it will also help to maintain root function at later growth stages. However, it proved extremely difficult for the growers to properly manage high plant density rice crops without lodging. And hence, just as there were a number of successful cases, there were various studies reporting failure also. Failures in securing sufficient number of grains per unit area explained most of the disappointing results (Kumura, 1989). This occurred mainly because of the unfavourable growth of the crops during the early growth period where plants were not able to absorb as much nitrogen as is required for achieving sufficient grains per unit area. It was based on the fact that the number of grains per square metre is in direct proportion to the amount of nitrogen absorbed by the rice plants per square metre during the late spikelet differentiation stage, and so a higher number of grains could not be achieved unless the plant is made to absorb much nitrogen. Therefore, without efficient promotion of root growth in early growth periods, high yields could not be realized. The latter provides a basis to support the SRI view that seedling vigour with healthy roots is important, and why sparse planting is needed along with intermittent irrigation during the vegetative period in order to realize the high yield potential of the rice plant. The above presented review on root activity and quantity provides enough evidence to suggest that the physiological efficiency of the plant is improved by enhancing cytokinin activity, first by increasing root quantity and activity; second, by increasing root longevity; and third, by regulating available soil nitrogen status.
An Integrated Model of High-yielding Rice Plants Under SRI Management Practices The above review and interpretation allow us to propose the following integrated SRI model of the rice plant with appropriate emphasis on optimal root activity (Figure 4.2).
104 The Global Food System
Note: All variables are shown as functions (f) of the variables that drive them. (AVN = available nitrogen, AWD = alternate wet and dry).
Figure 4.2 Integrated model of the high-yielding rice plant under SRI management practices
The System of Rice Intensification (SRI) 105
Younger seedlings with higher root–shoot ratio encourage root–shoot growth along with higher rates of cytokinin synthesis A most important crop production objective during the early growth period is to secure the optimum number of tillers per square metre. Tiller production and panicle development (at later growth stage) is related to cytokinin synthesis in the root along with the number of phyllochrons of growth completed.
Transplanting single seedling per hill further enhances root growth and root activity when grown with AWD during the vegetative period To realize the full potential of tiller development, it is necessary to improve the light-receiving efficiency of the plant, prevent lodging and to improve the physical condition of the plant. This could be enhanced by further root growth and activity (1) by minimizing inter-plant competition and (2) by reducing leaf area density which will ensure more erect and upstanding leaves without any shading effect. At the same time, AWD will encourage root growth into deeper layers of soil. This will maximize the roots’ surface area for better nutrient uptake. Greater root length will also minimize water stress should the plant be exposed to drought conditions during any period of crop growth.
AWD enhances microbial response and regulates the most available nitrogen forms in the rhizosphere AWD should balance the NO3:NH4 ratio in the rhizosphere with higher root length density for higher biomass production and should also regulate cytokininauxin production for better tiller development. This effect could be further enhanced when the soil has sufficient organic matter to reduce leaching loss of NO3 along with higher root growth at deeper layers of soil.
Shallow flooding during the post-anthesis period maintains higher cytokinin content with higher root activity Cytokinins are high nitrogen-demanding compounds so cytokinin production increases sharply during high root nitrogen events which could be induced by supplying the NH4 form of nitrogen by shallow flooding during the grain-filling stage. This would be better realized with higher root surface area and higher cation exchange capacity as high root nitrogen events result from increased root absorption of nitrogen from the soil as well as mobilization of stored nitrogen in the rhizosphere.
106 The Global Food System
Higher root growth and activity increase physiological efficiency of the rice plant Prolonged photosynthetic efficiency of the lower leaves could be maintained by avoiding shading between plants and by keeping root activity high during later growth stages. In turn, the photosynthetically active lower leaves would provide sugar as well as oxygen to maintain high activity of the roots during the later growth period.
Discussion There is sufficient documented evidence to suggest that integration of the four key management practices of SRI could produce better on-farm yields compared to conventional production methods through improving the physiological efficiency of the rice plant. Therefore, one can challenge the contrary argument of McDonald et al (2006) that there is no correlation between these four practices and the physiological efficiency of the rice plant. Further, a careful review of the existing agronomic literature confirms that SRI practices have a sound scientific base (Horie et al, 2005). High-yielding varieties (HYVs) and hybrid cultivars which are highly responsive to chemical fertilizers can have a clear place in SRI. Anthofer (2004) suggested that modern varieties also respond positively to SRI practices. SRI-grown plants show higher root growth (Stoop, 2005), but, interestingly both HYVs and hybrid rice do have higher root growth and activity compared to traditional varieties (Harada et al, 1988; Ookawa et al, 2004). These issues need to be addressed and investigated by systematic research focusing on varietal responses to SRI practices, particularly on root growth and its relation to yield. Further, it seems reasonable to infer from a wide body of relevant research that all four SRI management practices have synergistic effects on root growth. However, a greater opportunity for productivity gains exists by using just the two major components that have attracted the greatest interest of thousands of farmers in Cambodia (Anthofer, 2004), i.e. using less seed and less water by planting single seedlings per hill with wider spacing and intermittent irrigation. In this context, giving emphasis to growing and transplanting vigorous seedlings singly is more pertinent than simply recommending planting single seedlings. Seedling vigour with minimal root disturbance needs to be taken into consideration along with seedling age in order to realize higher yield potential. Little differences in yield were found between SRI and conventional management practices in the three Chinese trials that Sheehy et al (2004) reported. This is an important finding since in both practices single seedlings were transplanted. Fortunately, there is now evidence that a single seedling per hill increased yield compared to three seedlings per hill. This effect was due to higher root growth and root activity which delayed
The System of Rice Intensification (SRI) 107
senescence and increased the rate of photosynthesis at later growth stages (San-oh et al, 2006). Further Sheehy et al (2004) reported fewer panicles per square metre in SRI than with conventional production methods. This accords with our claim that hill spacing needs to be decided according to varietal characteristics, most notably tillering capacity. This factor may be one of the reasons for yield variation observed under SRI practices either at the same or different locations. The second major component that many farmers can adopt is water management according to SRI principles. It is evident from the literature that AWD, or intermittent irrigation, is already a component of water management practices of Asian rice-growing countries such as China, Japan and Korea. AWD is currently being evaluated and promoted among rice farmers producing in water-limited environments (Bouman and Tuong, 2001). But, in general, traditional practices focus on intermittent irrigation at later growth stages (Matsushima, 1973; Sheehy et al, 2004), while SRI recommends AWD at the vegetative stage. Certainly, in the latter case, due to a temporary drying effect at early growth stages, plants would develop with osmotic adjustment and develop more roots at a deeper soil layer. This root induction practice at the early vegetative stage may be useful for plants grown under limited water conditions such as aerobic rice cultivation where water stress has been found to be a more limiting factor than any other stress. It has been found that under these situations, water stress reduces crop nitrogen demand (Belder et al, 2005) and hence yield is significantly reduced. However, temporary drying through intermittent irrigation also affects soil nitrogen status by changing nitrification–denitrification and/or ammonia volatilization processes. This can lead to more nitrogen loss compared to completely flooded conditions, especially in soils with low organic matter. Research opportunities lie in the measurement of redox potential at increased depths in the soil. This information may explain the pathway of nitrogen transformation processes in situations where deep root systems might get an advantage of transformed nitrogen (ammonium form) in the deeper soil layer, i.e. under a reduced soil environment. Moreover, if the AWD/intermittent irrigation practice at the vegetative stage is integrated with the split dose of nitrogen at crucial growth stages, this may overcome many limitations of aerobic rice culture and intermittent irrigation practice. Apart from this, changing the soil status from aerobic to anaerobic by practising AFD (alternate flooding and drying naturally) three–four times during the vegetative stage can improve plant type, light-receiving ability and resistance to lodging, along with root health. But again it is important to consider when and how long the intermittent irrigation should be applied to save water as well as increase yield since rice root–shoot responses and their physiology also differ at the genetic level along with environmental factors. Certainly, these scientific considerations of SRI principles and related research questions offer opportunities for further studies. Reported cases where SRI plants performed no better than best management practices, as claimed by critics of SRI, cannot be ignored (Sheehy et al, 2004; Latif
108 The Global Food System
et al, 2005). In this context, we note that Stoop and Kassam (2005) contend that neither SRI advocates nor its critics have a complete understanding of the biophysical basis of the relatively higher yields. It is noted that (e.g. McDonald et al, 2006) there is a wide yield gap between farmer’s practice and best management practice. However, realization of the ‘on-farm management issues’, by both groups, is the most important outcome from the current debate on ‘SRI’. The ‘miracle’ is not so much that SRI practices can lead to exceptional yield performances – we believe this is explicable from the existing literature – but that the process of investigating ‘SRI’ encourages farmers and researchers to think seriously, and as partners, about how to grow a healthy crop sustainably. The phenomenon of SRI should help the research community reach the millions of small farmers in developing countries to meet the future rice demand. We need a new paradigm in technology generation and transfer, and SRI seems to be promoting this outcome. The primary focus and challenges of the past were mainly to increase food production; but the present scenario is quite different. The challenges are multifold where food production has to be increased by countering other challenges such as global warming, water scarcity, soil fertility degradation and misuse and overuse of farm chemicals. At the same time, social changes and a growing concern for the environment have brought about a recognition of the ‘multifunctionality’ concept (Molden et al, 2000). The quality and quantity of all the products embracing ‘multifunctionality’ depends on how the farmers treat them with confidence and appreciation. Modern agricultural research often focuses more on increasing productivity per se and ignores social externalities; it is largely built on technologies that maximize biological uniformity and ignores the natural ecosystem. Certainly, this approach is not optimal for managing sustainable production systems. Hence it demands a paradigm shift in technology development and adoption. Millions of smallholder farms in developing countries where SRI is showing promise reflect the importance of involving farmers in such activities. This requires a participatory approach to knowledge creation and innovation such as Farmers Field Schools (FFS) to empower farmers as experts in growing healthy crops efficiently in an economic and sustainable manner (Whitten and Settle, 1998). The success to date of the ‘SRI movement’ where it competes with the best available technology justifies applying these cooperative approaches for mitigating food demand without relying too heavily on imported technology
Conclusion The combination of cultural practices recommended in SRI increases the physiological efficiency of rice plants through enhanced root activity and provides many alternatives to enhance resource-use efficiency. There is a sound basis in the existing literature which allows us to put SRI in scientific purview; but the practical
The System of Rice Intensification (SRI) 109
constraints in managing a favourable interaction of the plant–soil environment should not be underestimated. However, these constraints could be minimized if SRI is used as a heuristic vehicle for linking rice research with participatory farmer empowerment programmes. The SRI movement should be seen as a unique opportunity to integrate science with the society for sustainable development. Moreover, SRI should be seen as a means of enhancing system productivity and not merely as a vehicle for increasing yield.
Note 1
Phyllochron – a periodicity in plant growth expressed as the number of days to complete a unit of growth which produces one or more phytomer (the unit of plant growth in gramineae species, consisting of a leaf and subtending internode with a tiller bud at its base) (Stoop, 2005).
References Aimi R and Fuzimaki K. 1959. Cell-physiology studies on the function of roots. (II) The tissue distribution of a- NA oxidizing activity root in relation to the TTC reducting activity in rice plants. Proc. Crop Sci. Soc. Japan 28, 205–207 Anthofer J. 2004. The Potential of the System of Rice Intensification (SRI) for Poverty Reduction in Cambodia. In International Agricultural Research for Development. Berlin, October 5-7. Online document at URL: www.tropentag.de/2004/proceedings/node179.html Arashi K and Nitta H. 1955. Studies on the lysigenous intercellular space as the ventilating system in the culm of rice and some other graminaceous plants. Proc. Crop Sci. Soc. Japan 24, 78–81 Arikado H. 1955. Studies on the development of the ventilating system in relation to tolerance against excess-moisture injury to various crop plants. 6. Ecological and anatomical response of barley and some forage plants to flooding treatments. Proc. Crop Sci. Soc. Japan 23, 53–58 Arikado H. 1975. Development of aerenchyma and excess-moisture tolerance in the crops. Special Res. Bull. of Mie Univ. 1–149 Baba I. 1977. Effects of water stress on the physiology and the growth of paddy rice plants in relation to the generation of ethylene. Japan. Jour. Crop Sci. 46(1)., 171–172 Balasubramanian V, Rajendran R, Ravi V, Chellaiah N, Castro E, Chandrasekaran B, Jayaraj T, and Ramanathan S. 2004. Integrated Crop Management and Modified Mat Nursery for Enhancing Yield and Profitability in Transplanted Rice systems of Asia. In 39th All India Rice Research Group Meeting, Indian Agricultural Research Institute, New Delhi, India Baloch A W, Soomro A M, Javed M A, Ahmed M, Bughio H R, Bughio M S, and Mastoi N N. 2002. Optimum Plant Density for High Yield in Rice (Oryza sativa L.). Asian Journal of Plant Sciences 1 (1), 25–27 Bangerth F, Li C J, and Gruber J. 2000. Mutual interaction of auxin and cytokinins in regulating correlative dominance. Plant Growth Regulation 32, 205–217 Barclay A. 2004. The Whole Way. In Rice Today. International Rice Research Institute, 3, 3 Belder P, Bouman B A M, Spiertz J H J, Lu G, and Quilang E J P. 2002. Water use of alternately submerged and nonsubmerged irrigated lowland rice. In I. B. A. M. B. e. a. (eds)., Water-Wise Rice Production pp51–61. IRRI, Los Baños: Philippines
110 The Global Food System Belder P, Bouman B A M, Spiertz J H J, Peng S, Castan A R, and Visperas R M. 2005. Crop performance, nitrogen and water use in flooded and aerobic rice. Plant and Soil 273, 167–182 Birch H F. 1958. The effect of soil drying on humus decomposition and nitrogen. Plant and Soil 10, 9–31 Boonjung H, and Fukai S. 1996. Effects of soil water deficit at different growth stages on rice growth and yield under upland conditions. 1. Growth during drought. Field Crops Research 48, 37– 45 Bottner P. 1985. Response of microbial biomass to alternate moist and dry conditions in a soil incubated with 14C- and 15N-labeled plant material. Soil Biology & Biochemistry 17, 329–337 Bouman B A M and Tuong T P. 2001. Field water management to save water and increase its productivity in irrigated lowland rice. Agricultural Water Management 49, 11–30 Briones A M, Okabe S, Umemiya Y, Ramsing N-B, Reichardt W, and Okuyama H. 2003. Ammonium-oxidizing bacteria on root biofilms and their possible contribution to N use efficiency of different rice cultivars. Plant and Soil 250, 335–348 Debi B R, Taketa S and Ichii M. 2005. Cytokinin inhibits lateral root formation but stimulates lateral root elongation in rice (Oryza sativa). Journal of Plant Physiology 162, 507–515 Dobermann A. 2004. A critical assessment of the system of rice intensification (SRI). Agricultural Systems 79(3), 261–281 Donald C M. 1968. The breeding of crop ideotypes. Eyphytica 17, 385–403 Donald C M. 1981. Competitive plants, communal plants and yield in wheat crops. Cambridge Univ. Press, London FAO 2004. Online document at URL www.fao.org/rice2004/en/world.htm Gallagher K, Ooi P A, Mew T, Borromeo E, Kenmore P E, and Ketelaar J W. 2005. Ecological Basis for Low-Toxicity Integrated Pest Management in Rice and Vegetables. In Pretty J (ed.). The Pesticide Detox: Towards a More Sustainable Agriculture. pp116–134. Earthscan, London Hanada K. 1976. Studies on branching habits in crop plants. 9. Growth of tiller buds and apical buds of rice plants in the agra medium as affected by concentration of kinetin and gibberelin. Proceedings of Crop Science Society of Japan 45, 523–527 Harada T, Keo S R, and Yamazaki K. 1988. Lateral root mass formation in the Japonica-Indica hybrids of rice plants. Japan. Jour. Crop. Sci 57 (Suppl.2), 169–170 Hayami K. 1983. Studies on the photosynthetical and ecological characteristics of high-yielding rice varieties with a high fertilizer response. 3. Chance of high yielding varieties with a high fertilizer response with respect to the distribution, respiration and nutrient absorption of their roots. Bull. Tohoku Nat. Agri. Exp. Sta. 68, 45–68 Horie T, Shiraiwa T, Homma K, Maeda Y, and Yoshida H. 2005. Can yields of lowland rice resume the increases that they showed in the 1980s? Plant Production Science 8, 251–272 Hoshikawa K, Sasaki R, and Hasebe K. 1995. Development and rooting capacity of rice nurseling seedlings grown under different raising conditions. Jpn. J. Crop Sci. 64, 328–332 Hutchinson C E, and Kieber J J. 2002. Cytokinin signaling in Arabidopsis. Plant Cell. 14, S47–S59 Ishi R, Matsuzaki A, Li W J, Kariya K, Machida H, Kumura A, and Tsunoda K. 1986. Comparative studies on varietals differences of rice yield. 2. Varietal comparison of potential maximum yield in a isolated plant. Japan. Jour. Crop. Sci. 55 (Suppl.2), 81–82 Jiang C Z, Hirasawa T, and Ishihara K. 1985. Eco-physiological characteristics of two rice cultivars, photosynthetic rate, water conductive resistance and interrelationship between above and underground parts. Japan. Jour. Crop. Sci. 57, 132–138 John P C L, Zhang K, Dong C, Diederich L, and Wrightman F. 1993. p34cdc2 related proteins in control of cell cycle progression, the switch between division and differentiation in tissue development, and stimulation of division by auxin and cytokinin. Australian Journal of Plant Physiology 20, 503– 526 Kar S V, Varade S B, Subramanyam T K, and Ghildyal B P. 1974. Nature and growth pattern of rice root system under submerged and unsaturated conditions. Riso (Italy). 23, 173–179.
The System of Rice Intensification (SRI) 111 Katayama T. 1951. Studies on tillering of rice and barley plant (Ine mugi no bungetsu kenkyu). Yokendo, Tokyo Kieft L T, Soroker E, and Firestone M K. 1987. Microbial biomass response to a rapid increase in water potential when a dry soil is wetted. Soil Biology & Biochemistry 19, 119–126 Kim B H, Oritani T, and Inoue J. 1985. Comparisons of the elongation of the seminal roots between Japonica-Indica hybrid type rice cultivars through the root apex culture method. Japan. Jour. Crop. Sci. 54, 240–241 Kira T, Ogawa H, and Sakazaki N. 1953. Intraspecific competition among higher plants I. Competition-yield-density interrelationship in regularly dispersed population. J. Inst. Poly, D4, 1– 16 Kobata T, and Takami S. 1981. Effects of water stress during the early ripening period on the grain growth dry matter partitioning and grain yield in rice (Oryza sativa L.) Japan. Jour. Crop Sci. 50, 536– 545 Koma Y S. 2002. Experiences with the system of rice intensification in Cambodia. In Uphoff N, Fernandes C M, Longping Y, Jiming P, Rafaralahy S, and Rabenandrasana J. (eds). Assessment of the system of rice intensification (SRI). Proceedings of an International Conference, Sanya, China, April 1–4, 2002, CIIFAD, Cornell, US, 83–85 Kordon H A. 1974a. Patterns of shoot and root growth in rice seedlings germinating under water. Journal of Applied Ecology 11, 685–690 Kordon H A. 1974b. The rice shoot in relation to oxygen supply and root growth in seedlings germinating under water. New Phytology, 73, 695–697 Kronzucker H J, Siddique M Y, Glass A D M, and Kirk G J D. 1999. Nitrate-ammonium synergism in rice. A subcellular flux analysis. Plant Physiology 119, 1041–1045 Kuiper D, Schuit J, and Kuiper P J C. 1988. Effects of internal and external cytokinin concentrations on root growth and shoot to root ratio of Plantago major spp. pleiosperma at different nutrient conditions. Plant and Soil 111, 231–236 Kumura A. 1989. Progress in rice cultivation in Japan viewed from source-sink relationships. Carbonnitrogen interaction in crop production. In JSPS Japan–US Science Program Report Latif M A, Islam M R, Ali M Y, and Saleque M A. 2005. Validation of the system of rice intensification (SRI) in Bangladesh. Field Crops Research 93, 281–292 Lee J H. 1980. Studies on the relationship between wilting in rice cultivars and their physiological and morphological characteristics. 2. Histilogical analysis of the occurrence of wilting in a cultivar Yushin. Korean Journal. Crop Science 25, 6–14 Li Y., Hagen G, and Guilfoyle T J. 1992. Altered morphology in transgenic tobacco plants that overproduce cytokinins in specific tissues and organs. Development Biology 153, 386–395 Lu J., Ookawa T, and Hirasawa T. 2000. The effects of irrigation regimes on the water use, dry matter production and physiological responses of paddy rice. Plant and Soil 223, 207–216 Luo A C, Xu J M, and Yang X. 1993. Effects of nitrogen (NH4 NO3) supply on absorption of ammonium and nitrate by conventional and hybrid rice during reproductive growth. Plant & Soil 155/156, 395–398 Matsuki G and Katsutani S. 1940. Some chemical investigations on the drought damage. 1. Soil moisture and plant growth. J. Sci. Soil Manure, Japan 14, 279–288 Matsushima S. 1973. Technology for improving rice cultivation. In K K Takane Matsuo, Ryuichi Ishii, Kuni Ishihara and Hirosi Hirata (eds). Science of the Rice Plant Vol. 2, pp737–766. Ministry of Agriculture, Forestry and Fisheries, Tokyo, Japan McDonald A J, Hobbs P R, and Riha S J. 2006. Does the system of rice intensification outperform the conventional best management practices? A synopsis of the empirical record. Field Crop Res. 96(1), 31–36 Mercier H, Kerbauy B G, Sotta B, and Miginiac E. 1997. Effects of NO3, – NH4 and urea nutrition on endogenous levels of IAA and four cytokinins in two epiphytic bromeliads. Plant, Cell & Environment 20, 387–392
112 The Global Food System Mitsui S, and Tensho K. 1952. Dynamic studies on the nutrient uptake by crop plants. 3. The reducing power of roots of growing plants as revealed by nitrite formation in the nutrient solution. J. Sci. Soil Manure, Japan 22, 301–307 Molden D, Rijsberman Matsuno Y, and Amerashinghe U. 2000. Increasing water productivity: A requirement for food and environment security. Dialogue on Water for Food and Environmental Security. Colombo, Sri Lanka pp1–19 Newell R L, and Wilhelm W W. 1987. Conservation tillage and irrigation effects on corn root development. Agronomy Journal 79, 160–165 Nikolaos N, Koukou M A, and Karagiannidis N. 2000. Effects of various rootstocks on xylem exudates cytokinin content, nutrient uptake and growth patterns of grapevine Vitis vinifera L. cv. Thompson seedless. Agronomie 20, 363–373 O’Toole J C, and Chang T T. 1979. Drought resistance in cereals – Rice: A case study. In H Mussell and R C Staples (eds). Stress Physiology on Crop Plants pp373–405. Willey Interscience, New York O’Toole J C, and Soemartono M. 1981. Evaluation of simple technique for characterizing rice root systems in relation to drought resistance. Euphytica 30, 283–290 Ookawa T, Naruka Y, Sayama A, and Hirasawa T. 2004. Cytokinin affects the leaf levels of ribulose-1, 5- bisphosphate carboxylase/oxygenas and the accumulation and partitioning of nitrogen in paddy rice at hte ripening stage. In 4th International Crop Science Congress, pp1–6 Osaki M, Shinano T, Matsumoto M, Zheng T, and Tadano T. 1997. A root–shoot interaction hypothesis for high productivity of field crops. Soil Sci. Plant Nutr. 43, 1079–1084 Ota Y. 1975. Site condition and rice crop ecology. In Nogyo Gijutsu Taikei Field Crop 1, Nobunkyo, Tokyo, 259–275 Ota Y, and Lee J H 1970. The role of a root system of the rice plant in relation to the physiological and morphological characteristics of its aerial parts. 1. Interrelationships of the aerial part and root characteristics in rice cultivars with different plant types. In Proceeding of Crop Science Society Vol 39, pp496–499, Japan Papademetriou M K, Dent F J, and Herath E M. (eds). 2000. Bridging the rice yield gap in the AsiaPacific region. FAO, RAP Publication 2000/16, Rome Park L, and Ota Y. 1969. Cultivar differences of the physiological activity in rice roots and its relationship with other characteristics. 2. Relationship between physiological root activities and top characteristics. Proceedings Crop Science Society Japan 38 (Suppl.1), 171–172 (J) Pretty J. 2002. Agri-Culture Reconnecting People, Land and Nature. Jules Pretty (ed) Earthscan, London Proffitt A P B, Berliner P R, and Oosterhuis D M. 1985. A comparative study of root distribution and water extraction efficiency by wheat grown under high- and low-frequency irrigation. Agron. Journal 77, 655–662 Puard M, Couchat P, and Lasceve G. 1986. Importance de l’oxygenation des racines du riz (Oryza sativa) en culture inondee. L’Agronomie Tropicale 44(2), 119–123 Ramamoorthy K, Selvarao K V, and Chinnaswami K N. 1993. Varietal response of rice to different water regimes. Indian Journal of Agronomy 38, 468–469 Richmond A E, and Lang A. 1957. Effects of kinetin on protein content and survival of detached Xanthium leaves. Science 125, 650–651 Ros C, White P F, and Bell R W. 1998. Field survey on nursery and mainfield fertiliser management. Cambodian J. Agriculture 1, 22–33 Ros C, Bell R W, and White P F. 2003. Seedling vigour and the early growth of transplanted rice (Oryza sativa). Plant and Soil 252, 325–337 Sahrawat K L. 2000. Elemental composition of the rice plant as affected by iron toxicity under field conditions. Commun. Soil Sci. Plant Anal. 132, 2819–2827 Sakai H, and Yoshida T. 1957. Studies on conditions inducing murenae incidence of rice plants. 1. α′ – naphtylamine oxidizing power of roots. Bull. Hokkaido Nat. Agri. Exp. Sta. 72, 82–91
The System of Rice Intensification (SRI) 113 San-oh Y, Sugiyama T, Yoshita D, Ookawa T, and Hirasawa T. 2006. The effect of planting pattern on the rate of photosynthesis and related processes during ripening in rice plants. Field Crops Research 96(1), 113–124. Online, document at URL www.sciencedirect.com/science/article/B6T6M-4GJVB5Y-3/2/40d071b98845e8b6b76334ea31fd4662 Sasaki T. 1926. On the abnormal germination of rice seeds with a restricted supply of the air (Prelim. repot). J. Sci.Agri.Soc. 288, 461–469 Schuller J M. 2004. System of Rice Intensification (SRI), suitability for lowland rice production in the Lao P D R. An evaluation report supported by FAO. Unpublished paper Sheehy J E, Sinclair T R, and Cassman K G. 2005. Curiosities, nonsense, non-science and SRI. Field Crops Research 91, 355–356 Sheehy J E, Peng S, Dobermann A, Mitchell P L, Ferrer A, Yang J, Zou Y, Zhong X, and Huang J. 2004. Fantastic yields in the system of rice intensification: Fact or fallacy? Field Crops Research 881, 1–8 Shoji S, and Kanno H. 1994. Use of polyolefin-coated fertilizers for increasing fertilizer efficiency and reducing nitrate leaching and nitrous oxide emissions. Fertilizer Research 39, 147–152 Shu-Qing C, Rong-Xian Z, Wei L, Zhi-Rui D, and Qi-Ming Z. 2004. The Involvement of cytokinin and abscisic acid levels in roots in the regulation of photosynthesis function in flag leves during grain filling in super high-yielding rice Oryza sativa. J. Agronomy & Crop Science 190, 73–80 Sidiras N, Bilalis D, and Vavoulidou E. 2001. Effect of tillage and fertilization on some selected physical properties of soil 0-30 (cm depth). and on the root growth dynamic of winter barley (Hordeum vulgare cv. Niki). J. Agron. Crop Sci 187, 167–176 Sinclair T R. 2004. Agronomic UFOs waste valuable scientific resources. Rice Today July–September 42 Sinclair T R, and Cassman K G. 2004. Agronomic UFOs. Field Crops Research 88, 9–10 Smiciklas K D, and Below F E. 1992. Role of cytokinin in enhanced productivity of maize supplied with NH4+ and NO3-. Plant and Soil 142, 307–313 Steponkus P L, Cutler J C, and O’ Toole J C. 1980. Adaptation to water deficit on rice, In Turner N C and Kramer J. (eds). Adaptation of Plants to Water and High Temperature Stress pp401–418. Wiley Interscience: New York Stoop W A. 2005. The System of Rice Intensification (SRI): Results from exploratory field research in Ivory Coast – Research needs and prospects for adaptation to diverse production systems of resource-poor farmers. Online document at URL http://ciifad.cornell.edu/sri/ Stoop W A, and Kassam A H. 2005. The SRI controversy: A response. Field Crops Research 91, 357– 360 Stoop W A, Uphoff N, and Kassam A H. 2002. A review of agricultural research issues raised by the System of Rice Intensification (SRI) from Madagascar: Opportunities for improving farming systems for resource-poor farmers. Agricultural Systems 71, 249–274 Surridge C. 2004. Feast or Famine? Nature 428, 360–361 Ta T C, and Ohira K. 1981. Effects of various environmental and medium conditions on the response of Indica and Japonica rice plants to ammonium and nitrate nitrogen. Soil Sci. Plant Nutrition 27, 347–355 Ta T C, Tsutsumi M, and Kurihara K. 1981. Comparative study on the response of Indica and Japonica rice plants to ammonium and nitrate nitrogen. Soil Sci. Plant Nutrition 27, 83–92 Tajima K. 1995. Occurrence and mechanism of drought damage. In Matsuo T, Kumazawa K, Ishii R, Isihara K and Hirata H. (eds). In Science of the Rice Plant. 2. Physiology pp838–849. Food and Agriculture Policy Research Center, Tokyo Takahashi N. 1978. The adaptive importance of mesocotyl and coleoptile growth in rice plants under different moisture regimes. Australian Journal of Plant Physiology 5, 511–517 Takeda T, and Hirota O. 1971. Relationship between spacing and grain yield of rice plant. Proceedings Crop Science Society Japan 40, 381–385
114 The Global Food System Takeda T, Oka M, Uchimura K, and Agata W. 1984. Studies on the dry matter and grain production of rice cultivars in the warm area of Japan. 3. Comparision of the grain production between Japanese and new Korean cultivars. Japnese Journal of Crop Science 53, 28–34 Takei K. 1941. Oxygen requirements in young roots of the germinated rice seeds. Agriculture & Horticulture 16, 675–676 Tanaka A. 1958. Studies on the characteristics of physiological functions of the leaf at a definite position on a stem of the rice plant.10. Accumulation of carbohydrate in the leaf at a definite position. J. Sci.Soil Manure, Japan 29, 291–294 Terashima K, Shimoda H, Takanashi J, and Nishiyama I. 1988. Morphology and functions of rice roots. 5. Difference between semi-dwarf Indica and Japonica varieties in the increasing process of root mass. Japan. Jour. Crop Sci. 57(1), 25–26 Timmusk S. 2003. Mechanisms of Action of the Plant Growth Promoting Bacterium Paeni bacillus plymyxa., PhD thesis, Acta Universitatis, Upsaliansis Tsuno Y, and Wang Y. L. 1988. Analyses on factors causing cultivar differences in the ripening process of rice cultivars. Japan. Jour. Crop. Sci. 57, 119–131 Tsuno Y, and Yamaguchi T. 1987. Relationship between the respiratory rate of the roots and the temperature modulated photosynthesis in the rice plants, an analysis on the factors affecting the respiratory rate of roots. Japan. Journal. Crop. Science 56, 536–546 Uphoff N. 2003. Higher yields with fewer external inputs? The System of Rice Intensification and potential contributions to agricultural sustainability. International Journal of Agricultural Sustainability 1(1), 38–50 Wang X T, and Below F E. 1996. Cytokinins in enhanced growth and tillering of wheat induced by mixed nitrogen source. Crop Science 36, 121–126 Whitten M J, and Settle W H. 1998. The role of the small-scale farmer in preserving the link between biodiversity and sustainable agriculture. In Chou C H and Kwang-Tsao Shao (eds). Frontiers in Biology: The Challenges of Biodiversity, Biotechnology and Sustainable Agriculture pp187–207. Proceedings of 26th AGM, International Union of Biological Sciences, Taiwan 17–23 November 1997, Academia Sinica, Taipei Wopereis M C S, Bouman B A M, Kropff M J, ten Berge H F M, and Maligaya A R. 1994. Water use efficiency in flooded rice fields. I. Validation of the soil-water balance model SAWAH. Agric. Water Managment 26, 277–289 Xuan S-N, Koenuma Y, and Ishii R. 1989. Studies on the characteristics of grain and dry matter production and photosynthesis in F1 hybrid rice cultivars. 4. The specificity in dry matter production and photosynthesis in F1 hybrid rice cultivars, compared with ordinary cultivars. Japan. Jour. Crop Sci. 58(2), 93–94 Yamada N, and Iyama J. 1953. Studies on the respiration of crop plants. 2. Changes in the respiration rate associated with the growth of rice plants. Proc. Crop Sci. Soc. Japan 21, 195–196 Yamada N, and Ota Y. 1958. Studies on the respiration of crop plants. 8. Effects of hydrogen-sulfide and lower fatty acid on the respiration of roots in rice plants. Proc. Crop Sci. Soc. Japan 27, 155– 160 Yamada N, Murata Y, Osada A, and Iyama J. 1954.. Studies on the respiration of crop plants. 5. The respiration rate in rice plants. Under transplanting or direct seeding culture. Proc. Crop Sci. Soc. Japan 22, 55–56 Yamamoto Y, Ikejiri A, and Nitta Y. 1995. Characteristics of rooting and leaf emergence rate, early growth and heading date of rice seedlings with different plant age in leaf number. Japan. Jour. Crop Sci. 64, 556–564 Yang C, Yang L, Yang Y, and Ouyang Z. 2004. Rice root growth and nutrient uptake as influenced by organic manure in continuously and alternately flooded paddy soils. Agricultural Water Management 70, 67–81 Yokoi T. 1898. On the development of the plumule and radicle of rice seed with various quantities of water in the germination medium. Bull. Coll. Agri. Imp. Univ. 3, 482–487
The System of Rice Intensification (SRI) 115 Yoshida S, and Hasegawa S. 1982. The rice root system: Its development and function. In IRRI (ed.). Drought Resistance in Crops with Emphasis on Rice pp97–114. Los Banos Youn K B, and Ota Y. 1973. Relationships between the leaf senescence index and the root activity of rice plants. Proc. Crop Sci. Soc. Japan 42, 13–17
5
The Struggle to Govern the Commons Thomas Dietz, Elinor Ostrom and Paul C. Stern
In 1968, Garrett Hardin1 drew attention to two human factors that drive environmental change. The first factor is the increasing demand for natural resources and environmental services, stemming from growth in human population and per capita resource consumption. The second factor is the way in which humans organize themselves to extract resources from the environment and eject effluents into it – what social scientists refer to as institutional arrangements. Hardin’s work has been highly influential2 but has long been aptly criticized as oversimplified.3–6 Hardin’s oversimplification was twofold: he claimed that only two state-established institutional arrangements – centralized government and private property – could sustain commons over the long run, and he presumed that resource users were trapped in a commons dilemma, unable to create solutions.7–9 He missed the point that many social groups, including the herders on the commons that provided the metaphor for his analysis, have struggled successfully against threats of resource degradation by developing and maintaining self-governing institutions.3,10–14 Although these institutions have not always succeeded, neither have Hardin’s preferred alternatives of private or state ownership. In the absence of effective governance institutions at the appropriate scale, natural resources and the environment are in peril from increasing human population, consumption and deployment of advanced technologies for resource use, all of which have reached unprecedented levels. For example, it is estimated that ‘the global ocean has lost more than 90% of large predatory fishes’ with an 80 per cent decline typically occurring ‘within 15 years of industrialized exploitation’.15 The threat of massive ecosystem degradation results from an interplay among ocean ecologies, fishing technologies and inadequate governance. Inshore fisheries are similarly degraded where they are open access or governed by top-down national regimes, leaving local and regional officials and users without sufficient autonomy and understanding to design effective institutions.16,17 For example, the degraded inshore ground fishery in Maine is governed by top-down Reprinted from Dietz T, Ostrom E and Stern P C. 2006. The struggle to govern the commons. In Kennedy D (ed) Science Magazine: State of the Planet 2006–07. AAAS, Washington DC (first appeared in Science 302 (2003), 1907–1912). Reprinted with permission from AAAS.
The Struggle to Govern the Commons 117
Source: See note 167
Figure 5.1 Comparison of landings of groundfish (gadoids, solid line) and lobster (dashed line) in Maine from 1980 to 2002, measured in millions of kilograms of groundfish and lobsters landed per year. International fishing in these waters ended with the extended jurisdiction that occurred in 1977
rules based on models that were not credible to users. As a result, compliance has been relatively low and there has been strong resistance to strengthening existing restrictions. This is in marked contrast to the Maine lobster fishery, which has been governed by formal and informal user institutions that have strongly influenced state-level rules that restrict fishing. The result has been credible rules with very high levels of compliance.18–20 A comparison of the landings of groundfish and lobster since 1980 is shown in Figure 5.1. The rules and high levels of compliance related to lobster appear to have prevented the destruction of this fishery but probably are not responsible for the sharp rise in abundance and landings after 1986. Resources at broader scales have also been successfully protected through appropriate international governance regimes such as the Montreal Protocol on stratospheric ozone and the International Commission for the Protection of the Rhine Agreements.21–25 Figure 5.2 compares the trajectory of atmospheric concentrations of ozone-depleting substances (ODS) with that of carbon dioxide since 1982. The Montreal Protocol, the centrepiece of the international agreements on ozone depletion, was signed in 1987. Before then, ODS concentrations were increasing faster than those of CO2; the increases slowed by the early 1990s and the concentration appears to have stabilized in recent years. The international treaty regime to reduce the anthropogenic impact on stratospheric ozone is widely considered an example of a successful effort to protect the global commons. In contrast, international efforts to reduce greenhouse gas concentrations have not yet had an impact. Knowledge from an emerging science of human–environment interactions, sometimes called human ecology or the ‘second environmental science’,26,27 is revealing which characteristics of institutions facilitate and which undermine sustainable
118 The Global Food System
Note: ppt = parts per trillion; ppm = parts per million. Source: Data are from note 169
Figure 5.2 Atmospheric concentration of CO2 (solid line, right scale) and three principal ODS (dashed line, left scale). The ODS are chlorofluorocarbons (CFCs) 11, 12 and 113 and were weighted based on their ozone-depleting potential168
use of environmental resources under particular conditions.6,28 We know most about small-scale ecologies and institutions whose many successes and failures have been studied for years. Researchers are now developing a knowledge base for broader-scale systems. In this chapter, we address what science has learned about governing the commons, how adaptive governance can be implemented and why it is always a struggle.29
Why a Struggle? Devising ways to sustain the Earth’s ability to support diverse life, including a reasonable quality of life for humans, involves making tough decisions under uncertainty, complexity and substantial biophysical constraints as well as conflicting human values and interests (Box 5.1). Devising effective governance systems is akin to a co-evolutionary race. A set of rules crafted to fit one set of socio-ecological conditions can erode as social, economic and technological developments increase the potential for human damage to ecosystems and even to the biosphere itself. Furthermore, humans devise ways of evading governance rules. Thus, successful commons governance requires that rules evolve. Effective commons governance is easier to achieve when (i) the resources and use of the resources by humans can be monitored, and the information can be verified and understood at relatively low cost (e.g. trees are easier to monitor than fish, and lakes are easier to monitor than rivers);30 (ii) rates of change in resources, resource-user populations, technology, and economic and social conditions are
The Struggle to Govern the Commons 119
Box 5.1 Fish moved by warming waters Mason Inman Climate change has fish populations on the move. In Europe’s intensively fished North Sea, the warming waters over the past quarter-century have driven fish populations northward and deeper, according to a study by conservation ecologist John D. Reynolds of the University of East Anglia in Norwich, UK, and his colleagues. Such warming could hamper the revival of overfished species and disrupt ecosystems, they assert. The warming is expected to continue in the North Sea, and although fish species living to the south will likely move north and replace departing ones, the forecast for the region’s fisheries will depend on whether the species that succeed are marketable. ‘This is another clear indication that warming is playing a role’ in ocean ecosystems, says physical oceanographer Ken Drinkwater of the Institute of Marine Research in Bergen, Norway. Although there have been many studies looking at the effects of climate change on marine species, ‘no one has looked in detail at changes in distributions of commercial and noncommercial species’, says fish biologist Paul Hart of the University of Leicester in the UK. Similar climate-induced shifts in fish populations, he adds, might happen in other temperate seas, including those around Europe and much of the US. The study used extensive records of fishing catches made by research vessels between 1977 and 2001, a period during which the North Sea’s waters warmed by 1˚C at the sea floor. Reynolds’s team cast a wide net, compiling data on the sea’s 36 most common bottom-dwelling fish. They found that two-thirds of the populations moved toward cooler waters – either going north or to deeper waters, or both. ‘We saw shifts in both commercial and noncommercial species, and across a broad set of species’, says conservation ecologist Allison Perry of the University of East Anglia. The fish species whose distribution have shifted tend to be smaller and mature earlier, she and her colleagues noted. Source: Science, Vol. 308, no 5724–5937, 13 May 2005
moderate;31–33 (iii) communities maintain frequent face-to-face communication and dense social networks – sometimes called social capital – that increase the potential for trust, allow people to express and see emotional reactions to distrust, and lower the cost of monitoring behaviour and inducing rule compliance;34–37 (iv) outsiders can be excluded at relatively low cost from using the resource (new entrants add to the harvesting pressure and typically lack understanding of the rules); and (v) users support effective monitoring and rule enforcement.38–40 Few settings in the world are characterized by all of these conditions. The challenge is to devise institutional arrangements that help to establish such conditions or, as we discuss below, meet the main challenges of governance in the absence of ideal conditions.6,41,42
120 The Global Food System
Selective Pressures Many subsistence societies present favourable conditions for the evolution of effective self-governing resource institutions.13 There are hundreds of documented examples of long-term sustainable resource use in such communities as well as in more economically advanced communities with effective, local, self-governing rights, but there are also many failures.6,11,43–45 As human communities have expanded, the selective pressures on environmental governance institutions increasingly have come from outside influences. Commerce has become regional, national and global, and institutions at all of these levels have been created to enable and regulate trade, transportation, competition and conflict.46,47 These institutions shape environmental impact, even if they are not designed with that intent. They also provide mechanisms for environmental governance (e.g. national laws) and part of the social context for local efforts at environmental governance. Broaderscale governance may authorize local control, help it, hinder it or override it.48–53 Now, every local place is strongly influenced by global dynamics.49,54–58 The most important contemporary environmental challenges involve systems that are intrinsically global (e.g. climate change) or are tightly linked to global pressures (e.g. timber production for the world market) and that require governance at levels from the global all the way down to the local.49,59,60 These situations often feature environmental outcomes spatially distant from their causes and hardto-monitor, broader-scale economic incentives that may not be closely aligned with the condition of local ecosystems. Also, differences in power within user groups or across scales allow some to ignore rules of commons use or to reshape the rules in their own interest, such as when global markets reshape demand for local resources (e.g. forests) in ways that swamp the ability of locally evolved institutions to regulate their use.61–63 The store of governance tools and ways to modify and combine them is far greater than often is recognized.6,64–66 Global and national environmental policy frequently ignores community-based governance and traditional tools, such as informal communication and sanctioning, but these tools can have significant impact.64,67 Further, no single, broad type of ownership – government, private or community – uniformly succeeds or fails to halt major resource deterioration, as shown for forests in multiple countries.68
Requirements of Adaptive Governance in Complex Systems Providing information Environmental governance depends on good, trustworthy information about stocks, flows and processes within the resource systems being governed, as well as about the human–environment interactions that affect those systems. This information must
The Struggle to Govern the Commons 121
be congruent in scale with environmental events and decisions.49,69 Highly aggregated information may ignore or average out local information that is important in identifying future problems and developing solutions. For example, in 2002, a moratorium on all fishing for northern cod was declared by the Canadian government after a collapse of this valuable fishery. An earlier near-collapse had led Canada to declare a 200-mile zone of exclusive fisheries jurisdiction in 1977.70,71 There was considerable optimism during the 1980s that the stocks, as estimated by fishery scientists, were rebuilding. Consequently, generous total catch limits were established for northern cod and other groundfish, the number of licensed fishers was allowed to increase considerably and substantial government subsidies were allocated for new vessels.72 What went wrong? There were a variety of information-related problems, including that fisheries managers (i) treated all northern cod as a single stock instead of recognizing distinct populations with different characteristics, (ii) ignored the variability of year classes of northern cod, (iii) focused on offshore-fishery landing data rather than inshore data to ‘tune’ the stock assessment, and (iv) ignored inshore fishers who were catching ever-smaller fish and doubted the validity of stock assessments.72–74 This experience illustrates the need to collect and model both local and aggregated information about resource conditions and to use it in making policy at the appropriate scales. Information also must be congruent with decision makers’ needs in terms of timing, content and form of presentation.75–77 Informational systems that simultaneously meet high scientific standards and serve ongoing needs of decision makers and users are particularly useful. Information must not overload the capacity of users to assimilate it. Systems that adequately characterize environmental conditions or human activities with summary indicators – such as prices for products or emission permits, or certification of good environmental performance – can provide valuable signals as long as they are attentive to local as well as aggregate conditions.78–80 Effective governance requires not only factual information about the state of the environment and human actions but also information about uncertainty and values. Scientific understanding of coupled human–biophysical systems will always be uncertain because of inherent unpredictability in the systems and because the science is never complete.81 Decision makers need information that characterizes the types and magnitudes of this uncertainty, as well as the nature and extent of scientific ignorance and disagreement.82 Also, because every environmental decision requires trade-offs, knowledge is needed about individual and social values and about the effects of decisions on various valued outcomes. For many environmental systems, local and easily captured values (e.g. the market value of lumber) have to be balanced against global, diffuse and hard-to-capture values (e.g. biodiversity and the capability of humans and ecosystems to adapt to unexpected events). Finding ways to measure and monitor the outcomes for such varied values in the face of globalization is a major informational challenge for governance.
122 The Global Food System
Dealing with conflict Sharp differences in power and in values across interested parties make conflict inherent in environmental choices. Indeed, conflict resolution may be as important a motivation for designing resource institutions as is concern with the resources themselves.83 People bring varying perspectives, interests and fundamental philosophies to problems of environmental governance;76,84–86 their conflicts, if they do not escalate to the point of dysfunction, can spark learning and change.87,88 For example, a broadly participatory process was used to examine alternative strategies for regulating the Mississippi River and its tributaries.89 A dynamic model was constructed with continuous input by the Corps of Engineers, the Fish and Wildlife Service, local landowners, environmental groups and academics from multiple disciplines. After extensive model development and testing against past historical data, most stakeholders had high confidence in the explanatory power of the model. Consensus was reached over alternative governance options, and the resulting policies generated far less conflict than had existed at the outset.90 Delegating authority to environmental ministries does not always resolve conflicts satisfactorily, so governments are experimenting with various governance approaches to complement managerial ones. These range from ballots and polls, where engagement is passive and participants interact minimally, to adversarial processes that allow parties to redress grievances through formal legal procedures. They also include various experiments with intense interaction and deliberation aimed at negotiating decisions or allowing parties in potential conflict to provide structured input to them through participatory processes.91–95
Inducing rule compliance Effective governance requires that the rules of resource use are generally followed, with reasonable standards for tolerating modest violations. It is generally most effective to impose modest sanctions on first offenders and gradually increase the severity of sanctions for those who do not learn from their first or second encounter.40,96 Community-based institutions often use informal strategies for achieving compliance that rely on participants’ commitment to rules and subtle social sanctions. Whether enforcement mechanisms are formal or informal, those who impose them must be seen as effective and legitimate by resource users or resistance and evasion will overwhelm the commons governance strategy. Much environmental regulation in complex societies has been ‘command and control’. Governments require or prohibit specific actions or technologies, with fines or jail terms possible to punish rule breakers. If sufficient resources are made available for monitoring and enforcement, such approaches are effective. But when governments lack the will or resources to protect ‘protected areas’ such as parks,97–99 when major environmental damage comes from hard-to-detect ‘nonpoint sources’, and when the need is to encourage innovation in behaviours or technologies rather
The Struggle to Govern the Commons 123
than to require or prohibit familiar ones, command and control approaches are less effective. They are also economically inefficient in many circumstances.100–102 Financial instruments can provide incentives to achieve compliance with environmental rules. In recent years, market-based systems of tradable environmental allowances (TEAs) that define a limit to environmental withdrawals or emissions and permit free trade of allocated allowances under those limits have become popular.78,101,103 TEAs are one of the bases for the Kyoto agreement on climate change. Economic theory and experience in some settings suggest that these mechanisms have substantial advantages over command and control.104–107 TEAs have exhibited good environmental performance and economic efficiency in the US Sulfur Dioxide Allowance Market intended to reduce the prevalence of acid rain108,109 and the Lead Phasedown Program aimed at reducing the level of lead emissions.110 Crucial variables that differentiate these highly successful programmes from less successful ones, such as chlorofluorocarbon production quota trading and the early EPA emission trading programmes, include (i) the level of predictability of the stocks and flows, (ii) the number of users or producers who are regulated, (iii) the heterogeneity of the regulated users, and (iv) dearly defined and fully exchangeable permits.111 TEAs, like all institutional arrangements, have notable limitations. TEA regimes tend to leave unprotected those resources not specifically covered by trading rules. For example, fish species caught as by-catch are often not covered.112 These regimes also tend to suffer when monitoring is difficult. For example, under the Kyoto Protocol, the question of whether geologically sequestered carbon will remain sequestered is difficult to answer. Problems can also occur with the initial allocation of allowances, especially when historic users, who may be called on to change their behaviour most, have disproportionate power over allocation decisions.78,113 TEAs and community-based systems appear to have opposite strengths and weaknesses,113 suggesting that institutions that combine aspects of both systems may work better than either approach alone. For example, the fisheries tradable permit system in New Zealand has added co-management institutions to complement the market institutions.103,114 Voluntary approaches and those based on information disclosure have only begun to receive careful scientific attention as supplements to other tools.64,79,115–118 Success appears to depend on the existence of incentives that benefit leaders in volunteering over laggards and on the simultaneous use of other strategies, particularly ones that create incentives for compliance.79,118–120 Difficulties of sanctioning pose major problems for international agreements.121–123
Providing infrastructure The importance of physical and technological infrastructure is often ignored. Infrastructure, including technology, determines the degree to which a commons can be exploited. The extent and quality of water systems determine how
124 The Global Food System
they distribute water, for example, and fishing technology has a decisive influence on the size of the catch. Infrastructure also determines the extent to which waste can be reduced in resource use, and the degree to which resource conditions and the behaviour of human users can be effectively monitored. Indeed, the ability to choose institutional arrangements depends in part on infrastructure. In the absence of barbed-wire fences, for example, enforcing private property rights on grazing lands is expensive, but with barbed wire fences, it is relatively cheap.124 Effective communication and transportation technologies are also of immense importance. Fishers who observe an unauthorized boat or harvesting technology can use a radio or cellular phone to alert others to illegal actions.125 Infrastructure also affects the links between local commons and regional and global systems. Good roads can provide food in bad times but can also open local resources to global markets, creating demand for resources that cannot be used locally.126 Institutional infrastructure is also important, including research, social capital and multi-level rules, to coordinate between local and broader levels of governance.49,127,128
Be prepared for change Institutions must be designed to allow for adaptation because some current understanding is likely to be wrong, the required level of organization can shift, and biophysical and social systems change. Fixed rules are likely to fail because they place too much confidence in the current state of knowledge, whereas systems that guard against the low-probability, high-consequence possibilities and allow for change may be suboptimal in the short run but prove wiser in the long run. This is a principal lesson of adaptive governance research.29,32,129
An Illustration of the Challenge of Inducing Rule Compliance Meeting these requirements is always a challenge. We illustrate by focusing on the problem of inducing rule compliance and comparing the experience of four national parks, three different biological communities and a buffer zone contained within a single, large and very famous biosphere reserve – the Maya Biosphere Reserve (MBR) in Guatemala.130 MBR (Figure 5.3) was created in 1990 by government decree to protect the remaining areas of pristine ecosystems in northern Guatemala.131 The region saw a marked advance of the agricultural frontier in the 1980s resulting from an aggressive policy of the central government to provide land to farmers from the south.132 MBR occupies over 21,000km2, equivalent to 19 per cent of the Guatemalan territory, and represents the second-largest tract of tropical forest in the Western Hemisphere, after the Amazon.133 Much of the territory within the reserve has been seriously deforested and converted to agriculture
The Struggle to Govern the Commons 125
and other uses. Figure 5.3 shows examples of several governance strategies and outcomes within MBR,134 but we concentrate here on two protected areas that have interesting institutional differences. Tikal National Park is one of few protected areas in Guatemala to receive the full support of the government. The revenue from entry fees paid by tourists covers the entire budget for the park plus a surplus that goes to the Ministry of Culture and Sports. Directors of the park are held accountable by high-level officials for the successful protection of this source of government revenue. The park has permanent administrative and support staff, paid guards and local residents hired to prevent forest fires. Although Tikal National Park is in better shape than many other parks,135 it faces multiple threats, especially from bordering communities in the form of forest fires ignited to transform the land for agricultural and livestock purposes and illegal extraction of forest products.136 The dark grey colour of the park in Figure 5.3 shows the areas of stable forest.
Source: Composite constructed by Glen Green, Edwin Castellanos and Victor Hugo Ramos.
Figure 5.3 This figure shows land-cover change and the numerous zones of the Maya Biosphere Reserve in northern Guatemala. The composite shows a uniform, dark grey colour within Tikal, indicative of stable forest cover. El Mirador-Rio Azul National Park and Naachtun-Dos Laguna Biotope are also stable, due to inaccessibility. The other four potected areas have experienced extensive inroads of deforestation shown in light grey and white. Official designation as a protected area is not sufficient unless substantial investments are made in maintaining and enforcing boundaries
126 The Global Food System
Laguna del Tigre National Park and Biotope are managed by two different conservation agencies and include the largest protected wetland in Central America. The principal threats are human settlement and immigration, encroaching agriculture and livestock, oil prospecting and drilling, construction of roads and other infrastructures, and lawlessness (e.g. intentional setting of forest fires and drug trafficking and plantations). Like Tikal, Laguna del Tigre has been designated for the highest possible level of government protection. However, land speculation inside and outside the park and biotope, fuelled by cattle ranchers, corrupt politicians, and other officials, has pushed illegal settlers deeper into the reserve, where they clear tree cover to establish new agricultural plots and homesteads. Numerous light gray patches within the park and biotope in Figure 5.3 reveal forest clearing.137 Oversight in Laguna del Tigre has been weak. The small and underpaid group of park rangers is unable to enforce the mandates assigned to them to protect the park from human settlements, illegal harvesting and forest fires, and to sanction those who do not comply. It has not been unusual for people accused of violating conservation laws to threaten park officials to the point where the latter are afraid to enforce the law. The Guatemalan cases illustrate that legally protecting threatened areas does not ensure rule compliance, especially when non-compliance is easy or profitable. Further illustrations of the roles of institutions in forest protection are discussed in Science supplemental online materials68 and in a new book.138
Strategies for Meeting the Requirements of Adaptive Governance The general principles for robust governance institutions for localized resources (Figure 5.4) are well established as a result of multiple empirical studies.13,40,139–148 Many of these also appear to be applicable to regional and global resources,149 although they are less well tested at those levels. Three of them seem to be particularly relevant for problems at broader scales.
Analytic deliberation Well-structured dialogue involving scientists, resource users and interested publics, and informed by analysis of key information about environmental and human– environment systems, appears critical. Such analytic deliberation76,150–152 provides improved information and the trust in it that is essential for information to be used effectively, builds social capital, and can allow for change and deal with inevitable conflicts well enough to produce consensus on governance rules. The negotiated 1994 US regulation on disinfectant by-products in water that reached an interim consensus, including a decision to collect new information and reconsider the rule on that basis,76 is an excellent example of this approach.
The Struggle to Govern the Commons 127
Figure 5.4 General principles for robust governance of environmental resources (left and right columns) and the governance requirements they help meet (centre column).13,170 Each principle is relevant for meeting several requirements. Arrows indicate some of the most likely connections between principles and requirements. Principles in the right column may be particularly relevant for global and regional problems
Nesting Institutional arrangements must be complex, redundant and nested in many layers.33,153,154 Simple strategies for governing the world’s resources that rely exclusively on imposed markets or one-level, centralized command and control and that eliminate apparent redundancies in the name of efficiency have been tried and have failed. Catastrophic failures often have resulted when central governments have exerted sole authority over resources. Examples include the massive environmental degradation and impoverishment of local people in Indonesian Borneo;97 the increased rate of loss and fragmentation of high-quality habitat that occurred after creating the Wolong Nature Reserve in China;155 and the closing of the northern cod fishery along the eastern coast of Canada, which is partly attributable to the excessive quotas granted by the Canadian government.72 Governance should employ mixtures of institutional types (e.g. government bureaus as well as markets and community self-governance) that employ a variety of decision rules (about
128 The Global Food System
when and what resources should be harvested by whom) to change incentives, increase information, monitor use and induce compliance.6,64,119 Innovative rule evaders can have more trouble with a multiplicity of rules than with a single type of rule.
Conclusion Is it possible to govern such critical commons as the oceans and the climate? We remain guardedly optimistic. Thirty-five years ago it seemed that the ‘tragedy of the commons’ was inevitable everywhere not owned privately or by a government. Systematic multidisciplinary research has, however, shown that a wide diversity of adaptive governance systems have been effective stewards of many resources. Sustained research coupled with an explicit view of national and international policies as experiments can yield the scientific knowledge necessary to design appropriate adaptive institutions. Sound science is necessary for commons governance, but not sufficient. Too many strategies for governance of local commons are designed in capital cities or by donor agencies in ignorance of the state of the science and local conditions. The results are often tragic, but at least these tragedies are local. As the human footprint on Earth enlarges,156 humanity is challenged to develop and deploy understanding of broad-scale commons governance quickly enough to avoid the broad-scale tragedies that will otherwise ensue.172
References and Notes 1 2
3 4 5 6
7 8 9
G. Hardin, Science 162, 1243 (1968). See (6, 157). It was the paper most frequently cited as having the greatest career impact in a recent survey of biologists (158). A search performed by L. Wisen on 22 and 23 October 2003 on the Workshop Library Common-Pool Resources database (159) revealed that, before Hardin’s paper, only 19 articles had been written in English-language academic literature with a specific reference to ‘commons’, ‘common-pool resources’, or ‘common property’ in the title. Since then, attention to the commons has grown rapidly. Since 1968, a total of over 2300 articles in that database contain a specific reference to one of these three terms in the title. B. J. McCay, J. M. Acheson, The Question of the Commons: The Culture and Ecology of Communal Resources (Univ. of Arizona Press, Tucson, 1987). P. Dasgupta, Proc. Br. Acad. 90, 165 (1996). D. Feeny, F. Berkes, B. McCay, J. Acheson, Hum. Ecol. 18, 1 (1990). Committee on the Human Dimensions of Global Change, National Research Council, The Drama of the Commons, E. Ostrom et al, eds. (National Academy Press, Washington DC, 2002). J. Platt, Am. Psychol. 28, 642 (1973). J. G. Cross, M. J. Guyer, Social Traps (Univ. of Michigan Press, Ann Arbor, 1980). R. Costanza, Bioscience 37, 407 (1987).
The Struggle to Govern the Commons 129 10 R. McC. Netting, Balancing on an Alp: Ecological Change and Continuity in a Swiss Mountain Community (Cambridge Univ. Press, Cambridge, 1981). 11 National Research Council, Proceedings of the Conference on Common Property Resource Management (National Academy Press, Washington DC, 1986). 12 J.-M. Baland, J.-P. Platteau, Halting Degradation of Natural Resources: Is There a Role for Rural Communities? (Clarendon Press, Oxford, 1996). 13 E. Ostrom, Governing the Commons: The Evolution of Institutions for Collective Action (Cambridge Univ. Press, New York, 1990). 14 E. Ostrom, Understanding Institutional Diversity (Princeton University Press, Princeton, NJ, 2005). 15 R. A. Myers, B. Worm, Nature 423, 280 (2003). 16 A. C. Finlayson, Fishing for Truth: A Sociological Analysis of Northern Cod Stock Assessments from 1987 to 1990 (Institute of Social and Economic Research, Memorial Univ. of Newfoundland, St. Johns, Newfoundland, 1994). 17 S. Hanna, in Northern Waters: Management Issues and Practice, D. Symes, ed. (Blackwell, London, 1998), pp25–35. 18 J. Acheson, Capturing the Commons: Devising Institutions to Manage the Maine Lobster Industry (Univ. Press of New England, Hanover, NH, 2003). 19 J. A. Wilson, P. Kleban, J. Acheson, M. Metcalfe, Mar. Policy 18, 291 (1994). 20 J. Wilson, pers. comm. 21 S. Weiner, J. Maxwell, in Dimensions of Managing Chlorine in the Environment, report of the MIT/Norwegian Chlorine Policy Study (MIT, Cambridge, MA, 1993). 22 U. Weber, UNESCO Courier, June 2000, p9. 23 M. Verweij, Transboundary Environmental Problems and Cultural Theory: The Protection of the Rhine and the Great Lakes (Palgrave, New York, 2000). 24 C. Dieperink, Water Int. 25, 347 (2000). 25 E. Parson, Protecting the Ozone Layer: Science and Strategy (Oxford Univ. Press, New York, 2003). 26 E. Ostrom, C. D. Becker, Annu. Rev. Ecol. Syst. 26, 113 (1995). 27 P. C. Stern, Science 260, 1897 (1993). 28 E. Ostrom, J. Burger, C. B. Field, R. B. Norgaard, D. Policansky, Science 284, 278 (1999). 29 We refer to adaptive governance rather than adaptive management (32, 129) because the idea of governance conveys the difficulty of control, the need to proceed in the face of substantial uncertainty, and the importance of dealing with diversity and reconciling conflict among people and groups who differ in values, interests, perspectives, power and the kinds of information they bring to situations (150, 160–163). Effective environmental governance requires an understanding of both environmental systems and human–environment interactions (27, 84, 164, 165). 30 E. Schlager, W. Blomquist, S. Y. Tang, Land Econ. 70, 294 (1994). 31 J. H. Brander, M. S. Taylor, Am. Econ. Rev. 88, 119 (1998). 32 L. H. Gunderson, C. S. Holling, Panarchy: Understanding Transformations in Human and Natural Systems (Island Press, Washington DC, 2001). 33 M. Janssen, Complexity and Ecosystem Management (Elgar, Cheltenham, UK, 2002). 34 R. Putnam, Bowling Alone: The Collapse and Revival of American Community (Simon and Schuster, New York, 2001). 35 A. Bebbington, Geogr. J. 163, 189 (1997). 36 R. Frank, Passions Within Reason: The Strategic Role of the Emotions (Norton, New York, 1988). 37 J. Pretty, Science 302, 1912 (2003). 38 J. Burger, E. Ostrom, R. B. Norgaard, D. Policansky, B. D. Goldstein, eds., Protecting the Commons: A Framework for Resource Management in the Americas (Island Press, Washington DC, 2001). 39 C. Gibson, J. Williams, E. Ostrom, in preparation. World Dev. 33, 273 (2005).
130 The Global Food System 40 M. S. Weinstein, Georgetown Int. Environ. Law Rev. 12, 375 (2000). 41 R. Meinzen-Dick, K. V. Raju, A. Gulati, World Dev. 30, 649 (2002). 42 E. L. Miles et al, eds., Environmental Regime Effectiveness: Confronting Theory with Evidence (MIT Press, Cambridge, MA, 2001). 43 C. Gibson, M. McKean, E. Ostrom, eds., People and Forests (MIT Press, Cambridge, MA, 2000). 44 S. Krech III, The Ecological Indian: Myth and History (Norton, New York, 1999). 45 For relevant bibliographies, see (159, 166). 46 D. C. North, Structure and Change in Economic History (North, New York, 1981). 47 R. Robertson, Globalization: Social Theory and Global Culture (Sage, London, 1992). 48 O. R. Young, ed., The Effectiveness of International Environmental Regimes (MIT Press, Cambridge, MA, 1999). 49 O. R. Young, The Institutional Dimensions of Environmental Change: Fit, Interplay, and Scale (MIT Press, Cambridge, MA, 2002). 50 R. Keohane, E. Ostrom, eds., Local Commons and Global Interdependence (Sage, London, 1995). 51 J. S. Lansing, Priests and Programmers: Technologies of Power in the Engineered Landscape of Bali (Princeton Univ. Press, Princeton, NJ, 1991). 52 J. Wunsch, D. Olowu, eds., The Failure of the Centralized State (Institute for Contemporary Studies Press, San Francisco, CA, 1995). 53 N. Dolöak, E. Ostrom, eds., The Commons in the New Millennium: Challenges and Adaptation (MIT Press, Cambridge, MA, 2003). 54 Association of American Geographers Global Change and Local Places Research Group, Global Change and Local Places: Estimating, Understanding, and Reducing Greenhouse Gases (Cambridge Univ. Press, Cambridge, 2003). 55 S. Karlsson, thesis, Linköping University, Sweden (2000). 56 R. Keohane, M. A. Levy, eds., Institutions for Environmental Aid (MIT Press, Cambridge, MA, 1996). 57 O. S. Stokke, Governing High Seas Fisheries: The Interplay of Global and Regional Regimes (Oxford Univ. Press, London, 2001). 58 A. Underdal, K. Hanf, eds., International Environmental Agreements and Domestic Politics: The Case of Acid Rain (Ashgate, Aldershot, England, 1998). 59 W. Clark, R. Munn, eds., Sustainable Development of the Biosphere (Cambridge Univ. Press, New York, 1986). 60 B. L. Turner II et al., Global Environ. Change 1, 14 (1991). 61 T. Dietz, T. R. Burns, Acta Sociol. 35, 187 (1992). 62 T. Dietz, E. A. Rosa, in Handbook of Environmental Sociology, R. E. Dunlap, W. Michelson, eds. (Greenwood Press, Westport, CT, 2002), pp370–406. 63 A. P. Vayda, in Ecology in Practice, F. di Castri et al, eds. (Tycooly, Dublin, 1984). 64 Committee on the Human Dimensions of Global Change, National Research Council, New Tools for Environmental Protection: Education, Information, and Voluntary Measures, T. Dietz, P. C. Stern, eds. (National Academy Press, Washington DC, 2002). 65 M. Auer, Policy Sci. 33, 155 (2000). 66 D. H. Cole, Pollution and Property: Comparing Ownership Institutions for Environmental Protection (Cambridge Univ. Press, Cambridge, 2002). 67 F. Berkes, J. Colding, C. Folke, eds., Navigating Social-Ecological Systems: Building Resilience for Complexity and Change (Cambridge Univ. Press, Cambridge, 2003). 68 Supporting Online Material in T. Dietz, E. Ostrom, P. C. Stern, Science 302, 1907 (2003); available at www.sciencemag.org/cgi/content/full/302/5652/1907/DC1. 69 K. J. Willis, R. J. Whittaker, Science 295, 1245 (2002). 70 Kirby Task Force on Atlantic Fisheries, Navigating Troubled Waters: A New Policy for the Atlantic Fisheries (Department of Fisheries and Oceans, Ottawa, 1982). 71 G. Barrett, A. Davis, J. Can. Stud. 19, 125 (1984).
The Struggle to Govern the Commons 131 72 A. C. Finlayson, B. McCay, in Linking Social and Ecological Systems, F. Berkes, C. Folke, eds. (Cambridge Univ. Press, Cambridge, 1998), pp311–338. 73 J. A. Wilson, R. Townsend, P. Kleban, S. McKay, J. French, Ocean Shoreline Manage 13, 179 (1990). 74 C. Martin, Fisheries 20, 6 (1995). 75 Committee on Risk Perception and Communication, National Research Council, Improving Risk Communication (National Academy Press, Washington DC 1989). 76 Committee on Risk Characterization and Commission on Behavioral and Social Sciences and Education, National Research Council, Understanding Risk: Informing Decisions in a Democratic Society, P. C. Stern, H. V. Fineberg, eds. (National Academy Press, Washington DC, 1996). 77 Panel on Human Dimensions of Seasonal-to-Interannual Climate Variability, Committee on the Human Dimensions of Global Change, National Research Council, Making Climate Forecasts Matter, P. C. Stern, W. E. Easterling, eds. (National Academy Press, Washington DC, 1999). 78 T. Tietenberg, in The Drama of the Commons, Committee on the Human Dimensions of Global Change, National Research Council, E. Ostrom et al, eds. (National Academy Press, Washington DC, 2002), pp233–257. 79 T. Tietenberg, D. Wheeler, in Frontiers of Environmental Economics, H. Folmer, H. Landis Gabel, S. Gerking, A. Rose, eds. (Elgar, Cheltenham, UK, 2001), pp85–120. 80 J. Thøgerson, in New Tools for Environmental Protection: Education, Information, and Voluntary Measures, T. Dietz, P. C. Stern, eds. (National Academy Press, Washington DC, 2002), pp83– 104. 81 J. A. Wilson, in The Drama of the Commons, Committee on the Human Dimensions of Global Change, National Research Council, E. Ostrom et al, eds. (National Academy Press, Washington DC, 2002), pp327–360. 82 R. Moss, S. H. Schneider, in Guidance Papers on the Cross-Cutting Issues of the Third Assessment Report of the IPCC, R. Pachauri, T. Taniguchi, K. Tanaka, eds. (World Meteorological Organization, Geneva, Switzerland, 2000), pp33–51. 83 B. J. McCay, in The Drama of the Commons, Committee on the Human Dimensions of Global Change, National Research Council, E. Ostrom et al, eds. (National Academy Press, Washington DC, 2002), pp361–402. 84 Board on Sustainable Development, National Research Council, Our Common Journey: A Transition Toward Sustainability (National Academy Press, Washington DC, 1999). 85 Committee on Noneconomic and Economic Value of Biodiversity, National Research Council, Perspectives on Biodiversity: Valuing Its Role in an Everchanging World (National Academy Press, Washington DC, 1999). 86 W. M. Adams, D. Brockington, J. Dyson, B. Vira, Science 302, 1915 (2003). 87 P. C. Stern, Policy Sci. 24, 99 (1991). 88 V. Ostrom, Public Choice 77, 163 (1993). 89 R. Costanza, M. Ruth, in Institutions, Ecosystems, and Sustainability, R. Costanza, B. S. Low, E. Ostrom, J. Wilson, eds. (Lewis Publishers, Boca Raton, FL, 2001), pp169–178. 90 F. H. Sklar, M. L. White, R. Costanza, The Coastal Ecological Landscape Spatial Simulation (CELSS) Model (U.S. Fish and Wildlife Service, Washington DC, 1989). 91 O. Renn, T. Webler, P. Wiedemann, eds., Fairness and Competence in Citizen Participation: Evaluating Models for Environmental Discourse (Kluwer Academic Publishers, Dordrecht, The Netherlands, 1995). 92 R. Gregory, T. McDaniels, D. Fields, J. Policy Anal. Manage. 20, 415 (2001). 93 T. C. Beierle, J. Cayford, Democracy in Practice: Public Participation in Environmental Decisions (Resources for the Future, Washington DC, 2002). 94 W. Leach, N. Pelkey, P. Sabatier, J. Policy Anal. Manage. 21, 645 (2002). 95 R. O’Leary, L. B. Bingham, eds., The Promise and Performance of Environmental Conflict Resolution (Resources for the Future, Washington DC, 2003).
132 The Global Food System 96 E. Ostrom, R. Gardner, J. Walker, eds., Rules, Games, and Common-Pool Resources (Univ. of Michigan Press, Ann Arbor, 1994). 97 L. M. Curran, S. N. Trigg, A. K. McDonald, D. Astiani, Y. M. Hardiono, P. Siregar, I. Caniago, E. Kasischke, Science, 303, 1000 (2004). 98 J. Liu et al, Science 300, 1240 (2003). 99 R. W. Sussman, G. M. Green, L. K. Sussman, Hum. Ecol. 22, 333 (1994). 100 F. Berkes, C. Folke, eds., Linking Social and Ecological Systems: Management Practices and Social Mechanisms (Cambridge Univ. Press, Cambridge, 1998). 101 G. M. Heal, Valuing the Future: Economic Theory and Sustainability (Colombia Univ. Press, New York, 1998). 102 B. G. Colby, in The Handbook of Environmental Economics, D. Bromley, ed. (Blackwell Publishers, Oxford, 1995), pp475–502. 103 T. Yandle, C. M. Dewees, in The Commons in the New Millennium: Challenges and Adaptation, N. Dolöak, E. Ostrom, eds. (MIT Press, Cambridge, MA, 2003), pp101–128. 104 G. Libecap, Contracting for Property Rights (Cambridge Univ. Press, Cambridge, 1990). 105 R. D. Lile, D. R. Bohi, D. Burtraw, An Assessment of the EPA’s SO2 Emission Allowance Tracking System (Resources for the Future, Washington DC, 1996). 106 R. N. Stavins, J. Econ. Perspect. 12, 133 (1998). 107 J. E. Wilen, J. Environ. Econ. Manage. 39, 309 (2000). 108 A. D. Ellerman, R. Schmalensee, P. L. Joskow, J. P. Montero, E. M. Bailey, Emissions Trading Under the U.S. Acid Rain Program (MIT Center for Energy and Environmental Policy Research, Cambridge, MA, 1997). 109 E. M. Bailey, ‘Allowance trading activity and state regulatory rulings’ (Working Paper 98-005, MIT Emissions Trading, Cambridge, MA, 1998). 110 B. D. Nussbaum, in Climate Change: Designing a Tradeable Permit System (OECD, Paris, 1992), pp22–34. 111 N. Dolšak, thesis, Indiana University, Bloomington, IN (2000). 112 S. L. Hsu, J. E. Wilen, Ecol. Law Q. 24, 799 (1997). 113 C. Rose, in The Drama of the Commons, Committee on the Human Dimensions of Global Change, National Research Council, E. Ostrom et al, eds. (National Academy Press, Washington DC, 2002), pp233–257. 114 E. Pinkerton, Co-operative Management of Local Fisheries (Univ. of British Columbia Press, Vancouver, 1989). 115 A. Prakash, Bus. Strategy Environ. 10, 286 (2001). 116 J. Nash, in New Tools for Environmental Protection: Education, Information and Voluntary Measures, T. Dietz, P. C. Stern, eds. (National Academy Press, Washington DC, 2002), pp235–252. 117 J. A. Aragón-Correa, S. Sharma, Acad. Manage. Rev. 28, 71 (2003). 118 A. Randall, in New Tools for Environmental Protection: Education, Information and Voluntary Measures, T. Dietz, P. C. Stern, eds. (National Academy Press, Washington DC, 2002), pp311– 318. 119 G. T. Gardner, P. C. Stern, Environmental Problems and Human Behavior (Allyn and Bacon, Needham Heights, MA, 1996). 120 P. C. Stern, J. Consum. Policy 22, 461 (1999). 121 S. Hanna, C. Folke, K.-G. Mäler, Rights to Nature (Island Press, Washington DC, 1996). 122 E. Weiss, H. Jacobson, eds., Engaging Countries: Strengthening Compliance with International Environmental Agreements (MIT Press, Cambridge, MA, 1998). 123 A. Underdal, The Politics of International Environmental Management (Kluwer Academic Publishers, Dordrecht, The Netherlands, 1998). 124 A. Krell, The Devil’s Rope: A Cultural History of Barbed Wire (Reaktion, London, 2002). 125 S. Singleton, Constructing Cooperation: The Evolution of Institutions of Comanagement (Univ. of Michigan Press, Ann Arbor, 1998).
The Struggle to Govern the Commons 133 126 E. Moran, ed., The Ecosystem Approach in Anthropology: From Concept to Practice (Univ. of Michigan Press, Ann Arbor, 1990). 127 M. Janssen, J. M. Anderies, E. Ostrom, paper presented at the Workshop on Resiliency and Change in Ecological Systems, Santa Fe Institute, Santa Fe, NM, 25 to 27 October 2003. 128 T. Princen, Global Environ. Polit. 3, 33 (2003). 129 K. Lee, Compass and Gyroscope (Island Press, Washington DC, 1993). 130 Text in this illustration was adapted from text drafted by Lilian Marquez-Barrientos and Edwin Castellanos (68). 131 G. G. Stuart, Nat. Geogr. Mag. 182, 94 (1992). 132 E. G. Katz, Land Econ. 76, 114 (2000). 133 S. Elias, Petén y los retos para el desarrollo sostenible in encuentro internacional de investigadores: nuevas perspectivas de desarrollo sostenible en Petén (Facultad Latinoamericana de Ciencias Sociales, Guatemala City, Guatemala, 2000). 134 Figure 5.3 was produced and interpreted by a group of scholars associated with the Center for the Study of Institutions, Population, and Environmental Change at Indiana University. 135 S. A. Sader, D. J. Hayes, J. A. Hepinstal, M. Coan, C. Soza, Int. J Remote Sensing, 22, 1937 (2001). 136 ParksWatch, Tikal National Park, www.parkswatch.org/parkprofile.php?l=eng&country=gua&pa rk=tinp&page=con 137 A recent report in U.S. News & World Report (171) strongly verifies the satellite data and illuminates the causes of continuing deforestation in the Laguna del Tigre National Park since the most recent satellite image in Figure 5.3, taken in 2000. The reporter wrote: ‘Since the end of the civil war in 1996 desperately poor farmers and rich cattle ranchers have been pouring into this vast, virgin rain forest. In the past five years, more than 5000 homesteaders have illegally built homes and set fires to clear the land for corn and cattle. In 2003, [Dr David] Freidel’s first year of excavation here [at the “El Peru” archaeological site], the flames got so close – about 2 miles away – that he had to pull workers off the ruins to dig fire lines to save the camp… The ground fires have so far burned an estimated 40 per cent of the park, which is supposed to protect a lake that is one of the most important wetlands in the world’ (online at www.usnews.com/usnews/culture/ articles/050627/27profile_3.htm). 138 E. F. Moran, E. Ostrom, eds., Seeing the Forest and the Trees: Human-Environment Interactions in Forest Ecosystems (MIT Press, Cambridge, MA, 2005). 139 C. L. Abernathy, H. Sally, J. Appl. Irrig. Stud. 35, 177 (2000). 140 A. Agrawal, in The Drama of the Commons, Committee on the Human Dimensions of Global Change, National Research Council, E. Ostrom et al, eds. (National Academy Press, Washington DC, 2002), pp41–85. 141 P. Coop, D. Brunckhorst, Aust. J. Environ. Manage. 6, 48 (1999). 142 D. S. Crook, A. M. Jones, Mt. Res. Dev. 19, 79 (1999). 143 D. J. Merrey, in Irrigation Management Transfer, S. H. Johnson, D. L. Vermillion, J. A. Sagardoy, eds. (International Irrigation Management Institute, Colombo, Sri Lanka and the Food and Agriculture Organization, Rome, 1995). 144 C. E. Morrow, R. W. Hull, World Dev. 24, 1641 (1996). 145 T. Nilsson, thesis, Royal Institute of Technology, Stockholm, Sweden (2001). 146 N. Polman, L. Slangen, in Environmental Co-operation and Institutional Change, K. Hagedorn, ed. (Elgar, Northampton, MA, 2002). 147 A. Sarker, T. Itoh, Agric. Water Manage. 48 (no. 8), 9 (2001). 148 C. Tucker, Praxis 15, 47 (1999). 149 R. Costanza et al, Science 281, 198 (1998). 150 T. Dietz, P. C. Stern, Bioscience 48, 441 (1998). 151 E. Rosa, A. M. McWright, O. Renn, ‘The risk society: Theoretical frames and state management challenges’ (Dept. of Sociology, Washington State Univ., Pullman, WA, 2003).
134 The Global Food System 152 National Research Council, Panel on Social and Behavioral Science Research Priorities for Environmental Decision Making, Decision Making for the Environment: Social and Behavioral Science Research Priorities, G. B. Brewer, P. C. Stern, eds. (National Academy Press, Washington DC, 2005). 153 S. Levin, Fragile Dominion: Complexity and the Commons (Perseus Books, Reading, MA, 1999). 154 B. Low, E. Ostrom, C. Simon, J. Wilson, in Navigating Social-Ecological Systems: Building Resilience for Complexity and Change, F. Berkes, J. Colding, C. Folke, eds. (Cambridge Univ. Press, New York, 2003), pp83–114. 155 J. Liu et al, Science 292, 98 (2001). 156 R. York, E. A. Rosa, T. Dietz, Am. Sociol. Rev. 68, 279 (2003). 157 G. Hardin, Science 280, 682 (1998). 158 G. W. Barrett, K. E. Mabry, Bioscience 52 (no. 28), 2 (2002). 159 C. Hess, The Comprehensive Bibliography of the Commons, database available online at www.indiana. edu/_iascp/Iforms/searchcpr.html 160 V. Ostrom, The Meaning of Democracy and the Vulnerability of Democracies (Univ. of Michigan Press, Ann Arbor, 1997). 161 M. McGinnis, ed., Polycentric Governance and Development: Readings from the Workshop in Political Theory and Policy Analysis (Univ. of Michigan Press, Ann Arbor, 1999). 162 M. McGinnis, ed., Polycentric Games and Institutions: Readings from the Workshop in Political Theory and Policy Analysis (Univ. of Michigan Press, Ann Arbor, 2000). 163 T. Dietz, Hum. Ecol. Rev. 10, 60 (2003). 164 R. Costanza, B. S. Low, E. Ostrom, J. Wilson, eds., Institutions, Ecosystems, and Sustainability (Lewis Publishers, New York, 2001). 165 Committee on the Human Dimensions of Global Change, National Research Council, Global Environmental Change: Understanding the Human Dimensions, P. C. Stern, O. R. Young, D. Druckman, eds. (National Academy Press, Washington DC, 1992). 166 C. Hess, A Comprehensive Bibliography of Common-Pool Resources (CD-ROM, Workshop in Political Theory and Policy Analysis, Indiana Univ., Bloomington, 1999). 167 Groundfish data were compiled by D. Gilbert (Maine Department of Marine Resources) with data from the National Marine Fisheries Service. Lobster data were compiled by C. Wilson (Maine Department of Marine Resources). J. Wilson (University of Maine) worked with the authors in the preparation of this figure. 168 United Nations Environment Programme, Production and Consumption of Ozone Depleting Substances, 1986–1998 (United Nations Environment Programme Ozone Secretariat, Nairobi, Kenya, 1999). 169 World Resources Institute, World Resources 2002–2004: Earth Trends Data CD (World Resources Institute, Washington DC, 2003). 170 P. C. Stern, T. Dietz, E. Ostrom, Environ. Pract. 4, 61 (2002). 171 K. Clark, U.S. News & World Report, 27 June 2005, pp54–57 (available online at www.usnews. com/usnews/culture/articles/050627/27profile_3.htm) 172 We thank R. Andrews, G. Daily, J. Hoehn, K. Lee, S. Levin, G. Libecap, V. Ruttan, T. Tietenberg, J. Wilson, and O. Young for their comments on earlier drafts; and G. Laasby, P. Lezotte, C. Liang, and L. Wisen for providing assistance and J. Broderick for her extensive editing assistance. Supported in part by NSF grants BCS-9906253 and SBR-9521918, NASA grant NASW-01008, the Ford Foundation and the MacArthur Foundation.
Part II
Poverty and Hunger
6
Words and Ideas: Commitment, Continuity and Irreversibility R. Chambers
All words are pegs to hang ideas on (Henry Ward Beecher, 1887). Part 1 presents writing on settlement schemes in tropical Africa from the late 1960s and early 1970s. Part 2 reviews subsequent developments with settlement schemes, and then explores and develops wider contemporary meanings, relevance and applications for three words and ideas from the earlier experience: commitment, continuity and irreversibility.
Part I: Learning from Experience In the 1950s and 1960s, settlement schemes were conspicuous in tropical Africa. Many of them were politically committing and effectively irreversible. Once settlers had been introduced they were difficult to abandon. Schemes considered failures became robust dependent survivors. Many arguments could be mustered to justify continuing support, although this was often at high financial cost to governments. The Perkerra Irrigation Scheme in Kenya was one such project which by almost any criteria should never have been started, and once started, not continued. It performed disastrously but became increasingly difficult to abandon. In project appraisal, the political irreversibility of commitment is a neglected aspect of risk, and varies by type of project.
Introduction: Settlement schemes in tropical Africa (2004) In the sub-Saharan Africa of decolonization and early national independence, much prominence was given to agricultural settlement schemes. They seemed to promise win–win solutions to political demands, perceived pressures of population, and the need to produce more from the land. With many origins, taking many forms, having high political priority, and being bounded and visible, they were attractive to Reprinted from Chambers R. 2005. Words and ideas: Commitment, continuity and irreversibility. In Chambers R. Ideas for Development, Earthscan, London.
138 Poverty and Hunger
researchers. I was one of those who succumbed to the temptations they presented. I started my research on the fragile and vulnerable Perkerra Irrigation Settlement in Kenya, and then concentrated on its stronger sibling, Mwea. The Mwea Irrigation Settlement had several advantages. It was by most criteria more successful; it had a stable water supply and in irrigated rice a reliable crop and a protected market; it was better organized; it had a high profile and was frequently visited, being a convenient distance from Nairobi for VIPs;1 and, for the indolent PhD student it had the advantage of being well documented, with time series tables which could (I hasten to add, with due acknowledgement) be transposed easily to make a thesis look good, at least to any examiner too pressed for time to look deeply. Many researchers were attracted to Mwea, and the managers were so interested and articulate that we were able to combine to produce a book with 13 chapters and 529 pages (Chambers and Moris, 1973).2 In parallel, numerous studies of settlement schemes were undertaken in other countries, especially Sudan, Zimbabwe (Southern Rhodesia as it was), Zambia (Northern Rhodesia as it was), Tanzania, Uganda, Nigeria and Ghana. These provided a wonderful collection for comparisons. Much of what was learnt is now of mainly historical interest. However, analysis at the time pointed to three neglected angles or themes which were important then and remain important and still relatively neglected: commitment, continuity and irreversibility. The two extracts of studies from this period, which follow, raise practical questions not only about projects, but also about policies and programmes promoted and pursued by lenders, donors and governments in the 2000s.
Conclusions from Settlement Schemes in Tropical Africa (1969) Risks and irreversibility of commitment3 A neglected aspect of evaluation, which has far wider application than merely to settlement schemes, concerns the relationship between risks and irreversibility of commitment. Settlement schemes, especially those that are more complex in system and costly in capital, are high-risk undertakings. They share with non-settlement approaches to agricultural development the uncertainties of innovations, weather, pests and markets, and the disruptions of rapid turnovers in senior staff. In addition, however, they have to face other serious risks and difficulties which do not have to be borne in non-settlement situations. The land on which settlement takes place may be available for settlement for the simple reason that it is marginal or unsuitable for cultivation. The locations of many settlement schemes, often with poor communications and far from the services of urban centres, raise costs and the difficulties of management. There is a danger that both organizational and productive effectiveness will be restrained by the inbuilt incompatibilities of complex schemes, by the cancelling out of managerial and settler efforts, in the games of enforcing and beating the system. Moreover, adaptations of schemes to ensure
Words and Ideas: Commitment, Continuity and Irreversibility 139
the continued presence and participation of settlers may have to be made through increased payouts or through services which, at best, reduce revenue to government and, at worst, add to a loss. In addition, where government withdrawal is intended, there is a high risk that it will take longer than expected. At the point at which implementation of a settlement scheme or programme is considered, all these factors, all of them implying economic risks, should be weighed. But these risks do not present the complete picture. Wherever a government starts a programme or project the actual risks are compounded by the extent to which the commitment to maintain the programme or project is irreversible. The process of commitment can be lengthy, subtle and insidious. It begins with an opportunity and a vision. These may arise from a disturbance in the relationships of men4 and land, or the perception of unoccupied land: the Mwea (in Kenya), inviting development after the Kenya Land Commission’s recommendations; the bush of South Busoga (in Uganda) after its evacuation in the first decade of this century; the narrow strip of uncultivated land on the edge of the Rift Valley at Upper Kitete (in Tanzania); the cleared bush of Kongwa, Urambo and Nachingwea after the Groundnut Scheme fiasco (in Tanzania). Or the opportunity may be provided by a resettlement operation which presents a captive population which can be directed into a new agricultural system: the displacement of Halfawis by the Aswan Dam, (in Sudan) was exploited through resettlement on the controlled irrigation scheme at Khasm-el-Girba; and the evacuees from the Volta Lake were thought to provide ‘a unique opportunity to wean an appreciable proportion of Ghana’s farmers from the wasteful, fragmented, and shifting system of agriculture to a settled and improved pattern of farming’.5 The opportunity attracts and nourishes the idea of a scheme. In such conditions a personal commitment can develop in a man of vision like Simon Alvord in Rhodesia or Chief Akin Deko in Nigeria. Funds are obtained for surveys: the surveys that are carried out are themselves committing. Where their findings are marginal, as was the United Nations Special Fund survey of the proposed Tana Irrigation Project in Kenya,6 further investigations are called for. It becomes increasingly difficult to turn back. Once funds have been made available for a substantive scheme, the successive activities of planning, construction, settlement and production draw after them deeper and deeper personal, departmental and political commitments. The establishment of settlers sets a seal on commitment at a higher level, making abandonment extremely difficult and the use of protective political arguments extremely easy. The full repertoire of defences to ensure scheme or programme survival can now be brought into play. Moreover, officials and politicians in circumstances such as these may regard government funds as fair game, as an ecological feature to be exploited much as a river might be tapped for irrigation water. The risks involved in the original initiation of a project are now more obvious: risks not merely that it would fail, but that having failed it would survive as a parasite that could not be shaken off or killed. The issues involved in a decision to terminate a scheme are, of course, not simple. Those responsible for the decisions may not even agree about whether the
140 Poverty and Hunger
amount of money already sunk in a project is a relevant consideration. Attitudes and ideas are sufficiently confused and contradictory for irrational elements to have free play. It is extremely difficult, for example, to see the large quantities of fine onions grown on the Perkerra Scheme in Kenya, and to compare the green irrigated fields with the surrounding desert, and at the same time to sustain a conviction that the scheme should be abandoned. Running water through channels and onto dry land, growing abundant crops where there was only bare soil and barren bush before, and enabling people to enjoy a level of prosperity they have never previously known, appear inherently and incontrovertibly good. It is Isaiah’s vision: The wilderness and the solitary place shall be glad for them; and the desert shall rejoice, and blossom as the rose (The Bible).
To suggest closure seems ignoble and destructive, an affront to the aspirations and achievements of the human spirit. If a neutral visitor can have this feeling, it may be expected all the more in those whose lives and work are bound up in a scheme. Yet the power of this emotion multiplies the risks of starting projects of this sort through making it exceptionally difficult to close them down however uneconomic they may prove. There is, indeed, a strain of Utopianism in most complex settlement schemes. Often there is an idealized view of the human situation that settlement will create. In colonial times this was often the stabilized African, fixed and controlled on a piece of land. Since independence, it has varied: in West Africa it has been an urban farmer; in Kenya, a sturdy yeoman; in Tanzania, a cooperative worker. Another Utopian aspect is the frequency with which stresses and breakdowns are not anticipated: as Apthorpe (1966, p23) has pointed out, provision is often lacking either for failure of the social system or for mechanical repairs. Again, it is very common for the targets for land preparation, settlement, production and withdrawal to be wildly optimistic and for achievements to fall far short of them. These features are partly explicable in terms of the self-delusion of men who are transported by a vision. When an ideal is pursued by a whole community, as in some communal economy schemes, it may make a scheme feasible through the sacrifices the participants are prepared to accept; but when the vision is only in the mind of the initiator, as it has been with most complex settlement schemes, the effects are often a sequence of unrealistic estimates, uneconomic measures and personal commitments which comprise part of the risks of the project. Resisting temptation7 Since all these disadvantages have applied in the past they can be expected to continue to apply in the future, and should be taken into account in assessing proposals for settlement schemes and similar agricultural projects. It is not enough to carry out evaluations8 which consider only those economic factors which can be quantified; it is necessary also to include administrative factors and the probable motivations and behaviour of the actors involved. Allowance has to be made, for
Words and Ideas: Commitment, Continuity and Irreversibility 141
example, for the expected patterns of settler and managerial behaviour, for departmentalism, for staff discontinuities and for the inbuilt incompatibilities of scheme systems. Moreover, comparisons with alternative approaches to agricultural development should take into account the high opportunity costs of trained staff and the expected ease or difficulty of abandoning a project or programme if it proves uneconomic. When all this is done the case against high capital and complex settlement schemes becomes stronger than when only conventional cost–benefit criteria are used. While this does not mean that such schemes should be ruled out altogether, it does mean that they should be approached with greater care and understanding. Where a settlement scheme is unavoidable, and where there is a choice of type to be adopted, there is much to be said on organizational grounds for the simplest type of scheme that is compatible with the circumstances of settlement. The simpler approaches are relatively undemanding of scarce administrative and technical capacity, and engage it for shorter periods. They involve relatively low risk and low commitment. Moreover, schemes with individual holdings exploit the drives of property ownership and individual incentive which can make productive the labour which is the most abundant unused resource in much of the third world. The simpler schemes also require intermediate levels of organization corresponding with the intermediate technology which may also be appropriate. If the beginning is ambitious, a complex organization may collapse and find equilibrium at a lower level; but if the beginning is modest, a more complex technology and organization can grow up organically and gradually. For example, the tractors appearing on Chesa in Rhodesia and on the Kenya Million-Acre Schemes as a result of settler initiative represent a self-sustaining upward movement in which productivity may increase without heavy government investment or commitment. If such developments are to be possible, it is important that advisory and technical services be available when needed, and even more important that the system of land tenure adopted should allow for future flexibility in farm size. Given such flexibility, it is usually safer and sounder to develop piecemeal from an existing base, whether this is farmers already on their land or settlers, already on a scheme, than to attempt radical transformation in one long step. Settlement schemes, particularly those which are complex in system, will remain temptations. Because of their creative possibilities, they will continue to find energetic and enthusiastic sponsors. Because of their visibility, clear boundaries, organizational coherence and Utopian overtones, they will no doubt continue to attract successive colonization – by administrators who negotiate their emergence, constructors who build them, agriculturalists who manage them, settlers who populate them, and in their wake foreign aid personnel and research students9 in various capacities – all of whom will find satisfaction in occupying a bounded and identifiable territory. What is vital is not that such schemes should be avoided on principle, but that those who act in these situations should appreciate what is happening. It is especially important that those who make development decisions should understand themselves well enough to be able to compensate in their acts
142 Poverty and Hunger
of judgement for the strong pull of the psychological attractions of such schemes, and should be able to see clearly the risks they entail and the benefits that might accrue from alternative uses of the resources involved. Exceptional restraint and imagination are needed among politicians and civil servants if the lure of the big scheme is to be neutralized so that a balanced and realistic assessment can be made. Perhaps it is fortunate that so many African politicians and civil servants possess and farm their own land. While this may be a distraction it may also satisfy desires for property and territory, so that they are less prone than their expatriate predecessors to seek such satisfaction through their work. It may in the long term enable them to take more balanced views of policy and to appreciate more fully the alternatives that exist. Certainly it is important to recognize that the choices are neither clearcut nor easy. It is not enough, as was done in Kenya before independence (Government of Kenya, 1962, p1), to quote Gulliver’s report of the views of the King of Brobdignag: And he gave it for his opinion, that whoever could make two ears of corn or two blades of grass to grow upon a spot of ground where only one grew before, would deserve better of mankind, and do more essential service to his country than the whole race of politicians put together (Swift, 1726, Chapter 7).
For the issues are less simple: they include whether, with the same resources, many more ears of corn, or many more blades of grass, might not be grown in other ways or in other places; and whether those politicians and civil servants who make major policy decisions have the freedom, the insight and the courage to choose those other ways or places, however unspectacular they may be.
Learning from project pathology: The case of Perkerra10 Introduction (2004) The Perkerra Irrigation Scheme in Kenya was launched precipitously in 1952 during the Mau Mau Emergency. It was known that there had been a proposal for irrigation on the Perkerra river, but the 1936 exploratory report could not be found. Detainees were placed in camps on the site and employed on road building and preparing works and fields for irrigation. From the start, capital and recurrent costs were high and revenue negligible. Tenants were settled but many left. Areas irrigated consistently fell far short of those targeted. Agricultural and marketing problems were intractable. In 1959 with just over 100 settler families, it was decided to close the scheme down. The decision was then reversed and changed to running on a care and maintenance basis for three years. By 1962 closure had become more difficult. The scheme was instead expanded to try to make it less of a recurrent burden on government. By 1967, with over 500 settler families, commitment had become even harder to reverse, and the scheme continued, with cross-subsidies from an economically successful sister scheme in another Province, the Mwea Irrigation Settlement.
Words and Ideas: Commitment, Continuity and Irreversibility 143
Lessons from Perkerra (1973) Many lessons could be culled from the Perkerra experience. Only some of the more obvious and important will be mentioned here. In the first place, the high costs and risks of hasty development with inadequate surveys are abundantly clear. To embark upon a major irrigation project with little knowledge of river flows and with what limited knowledge there is indicating unreliability; without any assurance that a cash crop can be grown and marketed; without experience of tenants’ performance; and without any pilot project – these are to court disaster. Moreover, one effect of such ignorance is to encourage overinvestment in unprofitable directions which have then to be abandoned: the 430 acres of basin irrigation which were overrun by nutgrass, and the extensive cultivation, before adequate trials had been carried out, of tomatoes, groundnuts and even onions. When, as has occurred at Perkerra, most of the experimental work is carried out not on a research station but with tenants on their plots the risks of failure are multiplied by the dangers of tenant dissatisfaction, of loss of confidence in the management, of absenteeism and ultimately of permanent departure from the scheme. Second, when a complex project requiring a favourable coincidence of several interdependent factors begins to run into trouble, difficulties tend to compound one another. On Perkerra, lack of water has sometimes limited the acreage that can be irrigated, in turn limiting returns to tenants and revenue to the scheme, increasing the dependence of the scheme on subsidy and aggravating the problems of tenant management. Unstable onion prices have affected tenant and staff morale as well as revenue. Evictions and other disciplinary measures to secure effective tenant performance may be partly self-defeating by reducing the tenants’ sense of security on a scheme and encouraging them to spend more time and energy on their off-scheme activities. Such chain reactions as these make heavy demands both on managerial skill and patience and on the financial resources of a parent organization. Where a scheme has, like Perkerra, a generally unfavourable physical environment and narrow technical limits of tolerance, able management may reduce or cushion some of these reactions but is unlikely always to overcome them. In these circumstances, financial support of various forms becomes the variable that is easiest to manipulate, with the result that a scheme is maintained but at a heavy cost to the rest of the economy. A third lesson emerges from the process of creeping commitment to the scheme, starting with the first ideas of replacing the indigenous irrigation which had been destroyed (by a flood in 1919), leading to preliminary surveys and then to a situation in which the idea of irrigation was at large and ready to be seized on whenever an opportunity presented itself. There was never any meeting or moment at which a decision to implement the Scheme was clearly taken. Even the siting of the camp at Marigat was only partly associated with the possibility of irrigation. But the very presence and use of the labour; the posting in of staff; the allocation of funds; the physical developments such as building the camp, construction of the weir, and land preparation; the deepening enthusiasms of individual officials and
144 Poverty and Hunger
the increasing involvement of departmental interests; the visits of VIPs to inspect progress; the selection, induction and management of tenants; the growing and marketing of crops – all these in multiple ways progressively secured the scheme as a permanent entity and strengthened its capacity to survive. It became increasingly difficult to close it down. To abandon the scheme would have meant to accept failure, to write off heavy government expenditure, and to have to resettle tenants, transfer staff and save a number of faces. It was always easier and involved less immediate acceptance of responsibility to allow the scheme to continue. The chance in 1962 when the tenants could have been resettled in the former European highlands was allowed to slip, and by 1968, with some 500 tenants to varying degrees dependent on the scheme, closure had become politically and humanly difficult even to contemplate. A fourth observation is that the true costs of a project like Perkerra may usually be greater than their apparent costs. To evaluate any scheme is, of course, a complex operation with several quantifiable and many unquantifiable factors to be taken into account; and, to be sure, even with Perkerra there have been hidden benefits – learning on the part of the tenants, including their introduction to a cash economy; experience gained by government officials; investment of incomes generated by the scheme; indirect government revenue; and seasonal employment, among others. But schemes which are heavily committing in terms of capital expenditure, departmental and individual involvement, and political interest and support tend to receive a perverse protection: the levels of external support and of tolerance in evaluation vary inversely with their economic performance. Except in stringent economic evaluations, ‘success’ for a scheme like Perkerra is defined in less exacting terms than for an economically more viable scheme such as Mwea. Protective standards of assessment and hidden subsidies are easily combined to give a false impression of favourable economic performance. Moreover, a scheme such as Perkerra has to be evaluated not just in isolation but in terms of benefits forgone from alternative uses of the resources involved – especially capital, managerial competence and effort, and labour. Had the sum of over £500,000 and the human resources invested in Perkerra by 1968 been used in other ways, the results might have been substantial benefits instead of continuing indefinite liabilities. These four lessons – the costs and risks of haste and ignorance; the compounding of problems in complex projects; the irreversibility of the creep of commitment; and the high true costs of poor projects – combine in a criterion applicable to choices in agricultural development. The Perkerra Irrigation Scheme, with its requirement from the start of complex and continuing organization involving government support, can be contrasted as a policy with the implications of an incident in the history of the scheme. In 1961 the manager noted that ‘A tenant was given a sample of Taboran maize seed which ripened about four weeks earlier than the local variety and yielded at a rate of 11 bags per acre. The tenant concerned was besieged by others wanting seed to plant.’ This was, of course, an event on an irrigation scheme, but the implications are wider and apply to non-irrigated agriculture. The contrast here is between on the one hand a major project like Perkerra
Words and Ideas: Commitment, Continuity and Irreversibility 145
which requires ongoing government involvement, and on the other programmes like the introduction of a new seed variety which can be one-shot efforts. In a major project the risks and liabilities are shouldered by government: if the project succeeds, government is obliged to continue to service and manage it; if it fails, it may prove politically and administratively impossible to abandon it. In the oneshot programme, however, the risks and liabilities are accepted by the individual farmers: if the innovation succeeds, it is propagated without further government intervention; if it fails, it is quickly and easily abandoned by the farmers without additional cost or administration for government. There are, of course, a great many other considerations which bear on policy choices; but capital and administrative capacity are typically scarce resources to be used sparingly; and in choosing between alternative approaches to agricultural development there is a case, other things being equal, for preferring those which are cheap, simple, administration sparing and easy to withdraw from to those which are expensive, complex, administration intensive and committing. It is not enough merely to be aware of these considerations; there must also be a climate and machinery in government to make sure that they are taken into account. In British colonial government in East Africa in the 1950s there was a relative absence of economic criteria in official thinking and a readiness to support the initiative of officers at the local level when they promoted projects. There was sympathetic backing in the Kenya central government for the vision and enthusiasm of the civil servants at provincial and district level who energetically launched the Perkerra Irrigation Scheme. Entrepreneurial capacity of the sort which they demonstrated is certainly an asset to a government, but as the Perkerra story shows it can be dangerous unless it is controlled. What is needed is a powerful and perceptive presence in governments which, while not stifling local initiatives, ensures that schemes as unpromising as Perkerra are never begun; for it is far easier to prevent a bad project than, once it has been started, to close it down.
Part 2: Developments, Concepts and Discourse (2004) The legacy of Perkerra and its need for subsidies has continued into the 21st century. After the 1960s, agricultural settlement projects became less favoured in most parts of the world. Big dams and other projects were increasingly recognized to have high human costs in the many who were displaced, dispossessed and inadequately compensated. Champions within the World Bank and internationally networking activists made lenders, donors and, to a lesser degree, governments, more aware of human costs and more reluctant to fund dams and other projects which displaced people. Commitment to projects and continuity of aid agency and developing country government staff, created conditions for innovation, learning and changes in practices and policies. In the 1990s, as aid agencies and governments shifted their priorities to
146 Poverty and Hunger
programmes and policy, there were human and ethical costs as projects were abandoned. With the new priority to influence policy so continuity, partnerships, relationships, understanding and trust became and remain more important than ever. Irreversibility is neglected in conventional economics compared to risk and uncertainty. The precautionary principle in environmental and other decision making recognizes irreversibility, but it remains underdeveloped as a practical concept. Far more attention should be paid to human activities like quarrying and mining, which are controllable but have effects that are irreversible. Commitment, continuity and irreversibility are Cinderella words and concepts, which merit more analysis and prominence in development discourse and practice.
Agricultural settlement in decline: Twists in the tale After the 1960s, agricultural settlement schemes became less common and less conspicuous. In Africa, their problems and costs, the less land available and political factors combined to reduce their popularity and prevalence. In Zimbabwe, although earlier settlements had been quite successful, the greed and intransigence of the later political leadership prevented an orderly programme that might have served equity and peace by transferring land from European to African farmers, as had been achieved during the 1960s in Kenya. More generally, the withdrawal of the state from administered development such as settlement schemes has been so widespread and so comprehensive that we find ourselves now, in the 21st century, looking back on the 1960s as another world. Legacies of earlier irreversibility have, though, lingered on, with twists in their tails and tales. The Perkerra Irrigation Scheme has survived. For a long time it was probably still a costly recurrent liability.11 Reportedly its performance improved somewhat in the 1990s with diversification of crops, and contracts from the Kenya Seed Company for growing hybrid maize seed. A research station was established at Perkerra, jointly under Horticulture Research International and the Kenya Agricultural Research Institute. The irrigated area remained low. Papaya and maize were grown on 350 hectares out of the 2350 hectares designated for irrigation. Perkerra was reported to perform relatively well compared with other irrigation schemes such as Hola, West Kano and Bunyala, which were ‘virtually dead’ (Akumu, 2002). But the vulnerability and financial dependence of the scheme continued.12 In December 2002, floods in the Perkerra River destroyed the weir and 259 houses. ‘The embankment of the water reservoir which used to flow through the canal to the scheme, and which was built way back in 1954, collapsed under pressure from the waters’ (Njeru, 2003). So the history of vulnerability to flash river flows, which in 1919 broke the sill of rock on which the Njemps built their brushwood weir for irrigation, was repeated in 2002. For reconstruction the NIB (National Irrigation Board) was to put in US$20,00013 and the United Nations Development Fund Kenya, US$100,000.14 It remains to reflect on the relative ease and low cost of closure in 1959 and for a few following years when there was the option of resettlement in the (as they were) ‘White Highlands’, and
Words and Ideas: Commitment, Continuity and Irreversibility 147
then on the continuing costs of rehabilitating and maintaining the scheme. For each generation of government officers, and for local politicians, the easier course was always to keep it going. Moreover, commitment can hardly have been diminished by the scheme’s location in the constituency of Daniel arap Moi, the longtime powerful President of Kenya. The opportunity cost of the funds devoted annually to maintaining the project must have been high, indeed. The history of the rice-growing Mwea Irrigation Settlement is a contrast. From its inception, it was economically more viable. But, increasingly, during the 1990s farmers’ incomes were hit by dues deducted by the management, heavy charges for milling and marketing, and competition from cheap rice imports with liberalization. The centralized administration, seen in earlier days as a strength of the Mwea scheme (Giglioli, 1973; Veen, 1973), gave scope for much resented corruption. Cross-subsidization also took place from Mwea to Perkerra and other schemes. In 1998, farmers rebelled and took over the management, milling and marketing. The next year two young men were shot dead in a confrontation with police (Kenya Human Rights Commission, 2000). In 2003, negotiations were in progress to establish a new relationship between the Mwea settlers and the NIB. Interestingly, the very continuity of the draconian rules and centralized organization of the scheme can be seen as a factor leading to the Mwea rebellion, and its end, for a time, as an administered scheme. The lack of democracy, accountability and transparency, earlier thought to be a strength, had become a liability. Worldwide, administered agricultural settlement schemes became rare during the 1980s and 1990s. There were fewer resources, less land and the state was in retreat. In India, large- and medium-scale irrigation did not settle farmers, but supplied water to farmers on the land that they already farmed. In Israel, the idealistic and communal organization of the kibbutzim eventually came to an end. Elsewhere, the state disengaged where it could from responsibilities to settlers. Some exceptions to these trends do, though, stand out, ranging from the tightly administered to the near chaotic. For example, on Palestinian land, the closely protected, notoriously illegal Israeli settlements were precisely intended to be irreversible forms of appropriation and colonization, excluding Palestinians from their land. In Sri Lanka, in a humane but closely administered tradition, the Mahaweli Development Authority continued to settle families on newly irrigated land and to provide a high level of special services. In southern Africa, there were limited programmes of buying out large European farmers and settling African smallholders. In Ethiopia, despite the bad record of earlier population transfer and resettlement, the early 2000s saw renewed attempts to resettle people from the highlands to the lowlands. At the chaotic extreme, in Zimbabwe, self-settlement of self-designated freedom fighters took place on commercial farms from 2001 onwards, carried out by force and with disastrous economic consequences.15 In their different extreme ways, the Israeli and Zimbabwean governments pursued or permitted settlement with gross disrespect for human rights and legality.
148 Poverty and Hunger
As for refugees, in 2003 there were, in the world, some 20 million persons identified by the UNHCR (United Nations High Commissioner for Refugees) as ‘people of concern’ (UNHCR, 2003). Of these, 12 million were refugees. The remainder included internally displaced persons, stateless persons, asylum seekers and returnees. Refugees were concentrated especially in Africa, Thailand, Iran and Pakistan. Earlier, during the 1970s and 1980s, hundreds of thousands of refugees had been established on agricultural settlements, notably in Tanzania at Mpanda and Ulyankulu. But during the early 21st century, almost all refugees were either dispersed among host populations or held and supported in camps. New agricultural small farming settlement projects for refugees and displaced people followed the global trend and had become rare.
‘Oustees’, rights and ease of exit The retreat from agricultural settlement during the 1970s and 1980s was paralleled by neglect by governments of responsibilities for people displaced by dams, roads and other infrastructure projects. In 1994 and subsequently, those displaced were estimated to number worldwide about 10 million a year (World Bank, 1994; Mehta, 2002). With dams, the word ‘oustee’ came to be used. Earlier, during the 1960s, Nuba and others who lost homes and livelihoods to Lake Nasser, created by the Aswan Dam in Sudan, were given the option of resettlement on the new irrigation project of Khasm-el-Girba; and some 80,000-odd people displaced by the Volta Dam in Ghana were offered resettlement in new communities, which a majority of them took up (Chambers, 1970). But no such responsibilities were similarly discharged in India on any scale, despite the building of many dams and the displacement of hundreds of thousands of marginal and politically impotent poor people. Over four decades in India, 20 million people were displaced by development programmes and forced into involuntary resettlement. Seventy-five per cent of them were without ‘rehabilitation’, and the vast majority were impoverished by the process (Cernea, 1997). Michael Cernea and his colleagues at the World Bank, and Thayer Scudder and others outside it, showed how damaging displacement was to lives and livelihoods, how widely ignored were the rights and interests of those displaced and how much more numerous they often were than was acknowledged in project documents. As a vigorous and committed group, they were instrumental in drawing up and gaining agreement for the World Bank’s policy on involuntary resettlement, issued in 1980. This major step forward was influential both inside and outside lending and donor agencies, though less so with governments. At the same time, internationally networking activists made lenders, donors and, to a lesser degree, governments, more aware of the human costs of dams and other projects that displaced people and more cautious about funding them (Brown and Fox, 2001). Evaluation and research have improved understanding of involuntary resettlement and of what could and should be done (e.g. Cernea 1997, 1999; Picciotto et al, 2001). The World Bank code, international networking and lobbying by civil society, the new human rights agenda, and predictable
Words and Ideas: Commitment, Continuity and Irreversibility 149
protests and adverse publicity have increasingly combined to discourage lenders and donors from supporting big projects that displace many people. The Sardar Sarovar Dam in India, and the Narmada River project of which it was a part, is a case in point. It developed into a high-profile saga with dramatic civil disobedience. The Indian Central and State Governments failed to meet World Bank requirements for compensation and resettlement of the people who were to be displaced. When a distinguished international panel laid bare misinformation and abuse (Morse and Berger, 1992), the World Bank withdrew its support. The Indian Government pressed ahead on its own, facing a long and high-profile campaign of protest led by Medha Patkar and supported by the novelist and activist Arundhati Roy (Roy, 2002). Other withdrawals of international aid followed for other dams. The UK government backed off from supporting the Pergau Dam in Malaysia when the World Development Movement brought a case against it and a UK court ruled that it was illegal. In 2001, in the face of strong criticism, it also withdrew support from the Ilisu Dam in Turkey, which would have displaced a large Kurdish population and inundated historical sites. Meanwhile, the World Commission on Dams (WCD, 2000; Imhof et al, 2002) set new standards for inclusiveness and consultation, having among its members both Medha Patkar, who as an activist had been on hunger strikes in protest against the Narmada project, and Goran Lindahl, the chief executive of one of the world’s largest engineering firms (Dubash et al, 2001, p1). The WCD’s remarkable consensus report presents a new policy framework that gives prominence to the rights of people adversely affected by dams (WCD, 2000, p240ff ). In this new climate, international funders, though less so governments (as India’s Narmada and China’s Three Gorges projects illustrate) have become more circumspect in keeping open options for exit from such projects. With the earlier settlement schemes in Africa, irreversibility of commitment was linked to political and moral responsibility to those who had been settled. After a phase of neglect, such obligations are now again more extensively recognized and accepted. Commitments have become more public and open to scrutiny, more frequently debated and less firm. High-profile opposition has made it easier for funders to withdraw support. The irreversibility found in earlier projects is now less common because of greater awareness of the consequences of displacement and the opposition that new projects provoke.
Commitment, continuity and creativity Changes in commitment can be understood in the context of the well-recognized changes in development policies and practices of both national governments and aid agencies. To summarize these in broad brush terms, during the 1950s and 1960s, infrastructure projects were prominent – for example, industrial plants, harbours, roads, railways, telecommunications, airports and irrigation projects. The 1970s became
150 Poverty and Hunger
a heyday for area-based initiatives, including Integrated Rural Development Projects promoted and supported by the World Bank (World Bank, 1988). These did not have settlers, only small farmers or pastoralists already on the land; so when many failed, as they did especially in Africa, they were easier to abandon. Unlike Perkerra, they passed into history on the ground, leaving a legacy of disillusion, debts and staff housing. In aid policies during the 1980s and 1990s, structural adjustment programmes became prominent, required by lenders for the repayment of debts. And the 1990s were marked by shifts towards sector programmes and direct budget support, debt relief, good governance, participation and human rights policies proclaimed as pro-poor. As the new century came in, lenders and donors were abandoning field projects and focusing on policy. Some big projects, though, if well surveyed, fairly administered and then irreversibly implemented, are needed and justified. I was probably wrong, on an International Labour Organization mission to Sri Lanka in 1978, to muster arguments against the Accelerated Mahaweli Development Project to increase hydropower and irrigation and to brand it Sri Lanka’s Concorde.16 And who now would wish to argue that it would have been better not to have built the Volta Dam or the Aswan Dam? Some big projects are right. Some are not. And much depends upon how well and fairly they are undertaken. All of this may be quite well accepted. Perhaps less explored is the changing significance of dimensions of commitment and continuity and their implications for practice. In what follows, much of the focus is on aid agencies, and their priorities, activities and relations with governments; but much also applies to governments themselves. Let us follow the historical sequence and start with projects. Commitment and continuity with projects For exploring the relevance of irreversibility and commitment, especially with projects, insights come from Albert Hirschman’s classic Development Projects Observed (Hirschman, 1967). From a study of 11 World Bank-supported projects, all of which had serious problems, Hirschman put forward his hypothesis of the ‘Hiding Hand’. This was the principle that those proposing and planning projects habitually underestimate the difficulties that will be encountered, but that this may be just as well, since they also habitually underestimate the creativity that can be mustered to overcome them. With hindsight, the Perkerra experience suggests that Hirschman may himself have made an underestimate – of the costs of ‘creativity’, for these can include recurrent costs of staff, subsidies and protection, additional infrastructure and the pre-emption of scarce administrative capacity. Still, in Hirschman’s view, too little commitment and too easy withdrawal could mean premature abandonment before there was time to learn and improve. This, he argued, was a weakness of agricultural projects, which were easier to abandon than, say, electric power or railways. Irreversibility, in his view, could be an asset because of the creativity it stimulated and the learning to which it gave rise. Hirschman’s thesis about commitment, continuity, learning and creativity is borne out by the RIPS (Rural Integrated Project Support) Programme in Lindi
Words and Ideas: Commitment, Continuity and Irreversibility 151
and Mtwara Regions in Tanzania (Freling, 1998; Groves, 2004). Finland supported a programme there for some 20 years, much of it installing water supplies. By all accounts, these were a substantial failure. Accepting failure and abandoning the project would have been easy to justify. But the Tanzanian Government and the Finns did not give up. They hung in and tried again. There was then a continuity of involvement and commitment of key individuals on both the Finnish and the Tanzanian sides, which fostered a good spirit of long-term trust, understanding and partnership.17 In 1993, an Indian trainer, Kamal Kar, introduced participatory rural appraisal (PRA) through a series of workshops (Johansson, 2000). Participatory approaches gained strong support from the two regional commissioners, Colonel Nsa Kaisi and Colonel Anatoli Tarimo (and, subsequently, his successor A. Y. Mgumia). Implications for institutionalization and bureaucratic change were recognized (Kar et al, 1998; Swantz, 1998). The programme was transformed. Innovations multiplied (Freling, 1998). To take but one example, participatory media were developed (de Waal, 2000) through a village radio network and through participatory video. These enabled people to make claims and supported mediation between competing or conflicting stakeholders. Participatory video was used in reforming a fish market, forcing officials to use the correct procedures and leading to the person who was ‘eating’ the tax collected being transferred elsewhere (Nyamachumbe, 2000). It also played a key part in the turbulent process of ending the dynamiting of coral to catch fish (Swantz et al, 2001). Another innovation was to introduce PRA with participatory planning and action in most of the communities in the two regions. The results of this community-level participation were so successful that, through a sequence of national workshops, it influenced Tanzaniawide policy. Results included a permanent secretaries’ two-day retreat on participation (MRALG, 1999) and a later one for regional administrative secretaries. Throughout the 1990s, the donor agency and the Tanzania government were colearners and co-beneficiaries. Had they given up after the earlier 20 years of failure, the positive lessons from pioneering participation would never have been learnt and national policies and practices would not have been influenced. The Sida-supported Mountain Rural Development Programme in Vietnam is another striking illustration. Sida had a long-standing relationship with Vietnam as the only Western donor who hung in with support through the 1960s and 1970s. A sequence of projects, initially a pulp mill, then for forestry and farm forestry, and subsequently rural development, involved long continuities of staff and relationships. Edwin Shanks and Bui Dinh Toai noted in a paper they wrote for a conference in 2000 that their combined experience was 16 years, having worked on the project since 1993 and 1991, respectively. They also observed that ‘due to the relative stability of staffing structures in Viet Nam, many of our colleagues still working on the programme at province and district levels were also involved from the very beginning’ (Shanks and Toai, 2000, p23). It is difficult to imagine that the slow, patient and successful introduction and co-evolution of participatory approaches to government agencies in that project could possibly have been achieved without this continuity and sustained commitment.
152 Poverty and Hunger
With aid agencies shifting to sector support and policy influence, development projects were being abandoned during the early 2000s. In Uganda, between one financial year and the next, DFID’s (the UK Department for International Development’s) ratio of project-to-programme funds shifted with astonishing abruptness from 5:2 to 2:5, without a significant change in total.18 Ironically, this was at a time when, in my view, lenders, donors and governments were getting better at learning from projects. But as and when these were terminated, governments and aid agencies lost the precious opportunities they had had for innovation and colearning. With one project in Tanzania, local-level staff had devoted years to project preparation and negotiation only to find that they had been led up the garden path and there would be no project (Groves, 2004). With another in Brazil, after relationships with NGOs (non-governmental organizations) and communities had been built up over three years, people’s time and energy had been invested, and enthusiasm and expectations had been raised, a decision was taken in DFID to withdraw, leading to much anger, anguish and disillusionment. The hidden costs of such abandonment can be incalculable. Local people who have engaged in participatory planning and have been led to expect support are left in the lurch and reconfirmed in their resentment and cynicism about government. Field staff are seen to have misled their clients; they are made to look foolish, if not duplicitous, and are furious, embittered and demotivated. Decent and perceptive aid agency staff, too, are demoralized, embarrassed and ashamed, but do not have to face the people on the ground. Centrally isolated office-bound policy makers in northern capital cities may be blithely or wilfully19 unaware of the distant damage they have done. All too often, abandoning projects was unethical and anti-poor. With experience from western India comes David Mosse’s (2003, 2005) fascinating, perceptive and subtle analysis of the IBRFP (Indo-British Rain-fed Farming Project) with which he was closely involved until 1998, and which he revisited and reviewed three years later in 2001. Despite his early criticisms, and despite managerially exacting contradictions in the project, he shows that much had been achieved, not least through participatory seed breeding and selection. This was a core project innovation that challenged the prevailing regulatory frameworks and bureaucratic practice of Indian agricultural research (Witcombe et al, 1996), with huge implications for policy and practice. The project had also ‘brought a version of “development” more meaningful than any previous to Bhil tribal communities excluded from even the most basic state services’ (ibid, p24). However, by 2001 it had fallen from favour in DFID and was threatened with closure, not because it was failing but because projects had become unfashionable. As Mosse (2003) puts it: Project practice seemed to me unchanged – meaningful engagements between staff and villagers still produced important local benefits even under conditions of severe drought. But a fundamental change had occurred, not in the project but in donor policy … DFID’s India programme had become reorganized around the funding of state-wide government programmes, sectoral reform and donor–government partnerships. Unable
Words and Ideas: Commitment, Continuity and Irreversibility 153 to articulate this policy, the IBRFP project began to lose its support and, consequently, its reality. It bore new policy labels of exclusion: ‘enclave project’, ‘niche project’, ‘replicable model’, ‘parallel [to the state] structure’, ‘sectoral, downstream, micro-managed project’. IBRFP had suddenly become the flared trousers20 of the DFID wardrobe.
In abandoning projects, lenders and donors have succumbed to a tragic pathology. Notwithstanding the common view of colonialism, I found, in the late colonial settlement projects that I studied in Africa, a strong commitment of local-level administrators to ‘their’ projects and to the settlers. Administrators on the ground were face to face with the realities. To varying degrees, subsequent political representation also provided commitment and support to local projects. It is only now, with lenders, donors and policy makers interacting and influencing one another more and more, insulated in their capital city cocoons, that projects can more easily be abandoned. RIPS in Tanzania, the project in Brazil, and IBRFP in India all provoke sad reflection on the costs of abandoning projects: staff demoralized, people disillusioned, government discredited, ‘money down the drain’, benefits to the poor forgone, and opportunities lost for ground-truthing, learning, innovation and capacity-building. In our brave new 21st century of aid, for many poor people, projects have not proved irreversible enough. Commitment and continuity with policy This view gains new relevance with the dominant development aid policies of the new century. There are signs of a new consistency in two domains: in rhetoric, extolling partnership, country ownership and policies that are pro-poor; and in targets, with the international and now MDGs (Millennium Development Goals) set for achievement by 2015. Sector programmes may, perhaps, not demand as much long-term commitment as projects. But whether for projects or for sector support, inconstancy is a feature of much aid. In this, agencies differ. United States Agency for International Development (USAID), for example, stands out for its short-term swings of policy and vocabulary, and its relative unreliability.21 Overall, the shift from projects to sector programmes and policy influence may have meant a move for aid agencies from the grounded, bounded and stable to the more nebulous, permeable and inconstant. With projects, failures were harder to hide. There were reasons to hang in there and try to make them work. With sector support, failures by lenders, donors and governments may, perhaps, tend to be less embarrassingly conspicuous and responsibility less attributable. More actors are involved. The scale is wider. The impacts are further away. So responsibility and accountability are more diffuse. Both political risk and institutional commitment have diminished. In consequence, it may be easier to exit and to deny responsibility. The new dangers implied may not be well recognized by lenders, donors and recipients. The dangers include, as Albert Hirschman might note were he to revisit the aid scene, that less long-term commitment and less continuity mean less creativity and less learning.
154 Poverty and Hunger
Personal continuity, motivation and effectiveness With the shift of emphasis in aid from projects to sector programmes and policy influence, and with the language of partnership and ownership, so relationships and continuity have become ever more important (Eyben, 2004; Groves and Hinton, 2004). Good relationships are fostered by continuity of aid agency staff in country and in post. Continuity also provides incentives and opportunities for vital learning. How can a foreigner be engaged in sensible policy dialogue without knowing and understanding a country? A crucial aspect of continuity is people staying in the same post, place or sector, gaining experience and developing good working relationships. Quite exceptionally for an Indian Administrative Service officer, Syed Hashim Ali was left in charge of irrigation command area development in Andhra Pradesh for seven years, from 1974 to 1981. Through this continuity and his personal commitment, much learning took place and he was able to make and oversee major shifts and improvements in policy and practice. Continuity in linking field experience with policy can also be important. E. G. Giglioli’s experience as manager of the Mwea Irrigation Settlement was crucial to the insights and authority that he later brought to the establishment and management of the NIB in Kenya (Chambers and Moris, 1973). Partnerships in the Philippines and in Uganda show how continuity and longstanding relationships can be the foundation for major changes. Over some ten years in the Philippines, Benjamin Bagadion of the National Irrigation Administration and Frances Korten of the Ford Foundation worked together with a stable network of colleagues. During this time they were instrumental in gradually transforming much irrigation policy and practice (Bagadion and Korten, 1989). In Uganda, the UPPAP (Uganda Participatory Poverty Assessment Process) was promoted and supported by an alliance of champions in both donor and recipient organizations working closely together over a number of years (Yates and Okello, 2002, pp90, 93; Kakande, 2004). It continues as an innovative programme that has given poor people’s priorities policy clout and has also influenced PPAs (participatory poverty assessments) in other countries. In my judgement, neither the Philippine irrigation reforms nor UPPAP could have occurred without the relationships, trust and shared purpose, which could evolve because the main actors remained for some years in their posts and organizations. Without that continuity, the loss would have been not just national, to the Philippines or to Uganda: irrigation management in the Philippines has probably been more influential worldwide than in any other country, and UPPAP experience has influenced many other PPAs. The loss would have been international, to many countries and to our understanding of how to do better in development. Expected and actual continuity in post has profound effects on motivation, behaviour and learning, whether in government, INGOs (international nongovernmental organizations) or aid organizations. Over time relationships can go beyond mutual respect and collegiality and flower into friendship.22 Three conditions that help are long journeys together by car or train, mild hardships in the
Words and Ideas: Commitment, Continuity and Irreversibility 155
field and a shared vision. Continuity in post and relationships rise in some places and decline in others. In INGOs, in some countries, there is an impression that staff are switching organizations with greater frequency, treating them as stepping stones more than as places in which to stay and work for a matter of years. But those who do hang in gain types of experience denied to those who hop about. World Neighbours, one of the most innovative INGOs, has staff members with over 20 years’ service. In recruiting it looks for people whose careers have shown ‘stick-to-itiveness’ – that is, who have stuck to the same job or organization for a substantial time (Jethro Pettit, pers. comm.). The behaviour of those who expect short spells is predictable. If foreigners, they lack incentives to learn a local language or to take pains to understand local people and conditions, or to take a long view. If energetic and committed, they are liable to be tempted to go for actions with quick effects, neglecting those that need longer-term negotiation and support. For aid agency staff, ‘It is difficult to learn and to assume a long-term vision in a local donor community. Each individual is operating in a short time frame related to average residence of three years in any country and she wants to see herself as having “made a difference”’ (Eyben, 2003, p28). In their haste, staff make mistakes from avoidable ignorance. Not having to stay long enough to deal with intractable problems, they do not have to muster Albert Hirschman’s creativity in overcoming them. Moving on soon, they are not there when the chicken comes home to roost. There is little incentive to develop more than superficial relationships, and as Rosalind Eyben has argued and shown, relationships matter for supporting change in favour of poor people (Eyben, 2004). Opportunities to learn and change are missed. These are among the costs of staff moves in the restructurings endemic, if not epidemic, in some aid agencies. Uncertainty and transfers impede other changes. In ActionAid in the UK, the introduction of the new radical ALPS (Accountability, Learning and Planning System) became increasingly difficult when ‘staff were coming and going at all levels’ as part of a massive restructuring process (David and Mancini, 2004, pp17–18). Individual and organizational learning are hampered. Lack of continuity means that by the time lessons can be learnt from what works and what does not, and how mistakes can be mitigated, staff have moved on. After reviewing the history of a donor-supported development programme in Kenya, Samuel Musyoki (2003, p166) concluded: ‘The staff turnover in bilateral programmes is very high and there is a tendency of the new management to erase history and create a new knowledge base.’ Just as the benefits of continuity are habitually underestimated, so too are the costs of premature transfers. A successful incumbent in almost any responsible post, whether in a government, national NGO or aid agency, tends to achieve more in a third year than in the first two together, and again more in a fourth year than a third, by which time much has been learnt, and relationships and understandings have had time to mature. Diminishing returns set in, if at all, after five or six years or more. The importance of continuity is also indicated in the reactions of developing country nationals, whether in governments or NGOs, to foreign staff, and whether
156 Poverty and Hunger
this is at local or central levels. They resent the short time that those in aid agencies spend in one place. No sooner have they got to know and developed a working relationship with one person than they leave, another takes over and they have to start all over again. Relationships are fractured and understandings are undermined. In the words (October 2003) of a developing country national about USAID ‘When we negotiated there was a very good person. Then the boss changed and was very bureaucratic and she left.’ Such discontinuities occur with nationals working in INGOs as well as with foreigners. ActionAid’s community development workers in The Gambia ‘have, on average, been moved every one or two years, with the attendant need to familiarize themselves with a new area, to build trust and sometimes even to learn a new language before they could start to perform to a reasonable standard’ (Howes, 2002, p114). When some ActionAid staff in India were concerned that their local NGO partners would resent their relatively high salaries, they were surprised that there was no objection as long as they stayed in the same place for a decent length of time. Then they could get to know one another and develop mutual understanding. Salaries were unimportant compared with continuity and longer-term relationships (Amar Jyoti, pers. comm.). In sum, the costs of lack of staff continuity are unseen, unaccounted for, incalculable and often unnecessary. At the same time, continuity is not a simple thing, always to be maximized. From the point of view of a foreign agency, a danger is perceived of out-posted staff ‘going native’, becoming personally, professionally and emotionally too close and too attached to a country and people. When staff fail it can be right to transfer them. When they move they learn new things. But with the focus of aid on policy, it matters more than ever for aid agency staff to understand local conditions.23 The costs of lack of continuity, always high, have risen further. Only three years in a post looks too low. The proximate costs of early transfers are relationships broken, trust undermined, demotivation and learning forgone. The wider effects are bad for poor people through errors of judgement and what is then done and not done. Responsible commitment and continuity can, then, be seen to matter now more than ever. They are a moral imperative where poor people have been led to invest their time and energy in expectation of support. They are a practical condition for constructive relationships, trust and learning. Understanding and optimizing commitment, continuity and their synergies should be high on the agenda for development in the 21st century.
Irreversibility When a word lodges in the mind, it surfaces in different contexts. So it has been for me with ‘irreversibility’ since writing my thesis.24 What began with seeing how commitment to settlement schemes could be irreversible, as with Perkerra, led to thinking of and seeing irreversibility in other domains, including economic decision making and environmental change.
Words and Ideas: Commitment, Continuity and Irreversibility 157
To sharpen the issues, consider extreme and tragic forms of irreversibility. Perhaps the best known is the extinction of species. A world without the tiger, white rhinoceros or panda would be profoundly diminished. Nor is this a question of only such iconic species, but of a great range that are endangered. The irreversibility and uncertain risks of GM (genetically modified) crops are another case. Less recognized is the destruction of rocks. A stark tragedy is the destruction through quarrying of rocks near Delhi and in and near Hyderabad.25 These were formed billions of years ago and have weathered over geological time. Apart from intrinsic worth, they have (or had before being destroyed) cultural, aesthetic, ecological, recreational and spiritual value to us humans, giving experiences of place and beauty, sustaining a diversity of life, and providing for the recreation and fulfilment of rock-climbing. Their destruction is utterly irrevocable. Trees that are cut can be replanted. Even soil that erodes can be replaced. But with rocks, restoration is not an option. Once blasted and removed, they are gone. Forever. With a dreadful finality. Reflecting on these biological and physical examples, if we are to assure options and resources for future generations, irreversibility simply has to be a key concept embedded in our thinking and informing our decisions and actions and nonactions. It is then striking that it is not significant in mainstream economic thinking. Much attention is paid to risk – ‘the probability or probability distribution of an event or the product of the magnitude of an event and the probability of its occurrence’ (Alcamo et al, 2003, p214) and uncertainty, the condition of not being known or predictable, where the probability distribution is not known (Devereux, 2001, p508), and each has a considerable literature. But irreversibility is less well developed and less frequently mentioned as a concept. Two standard economics textbooks – Economics (Begg et al, 2003) and Economic Development (Todaro and Smith, 2003) – include risk in their glossaries; but neither mentions irreversibility. Not only is irreversibility little considered, but conventional economic practice systematically undervalues it. First, discounting gives low or negligible present values to distant future benefits or costs (Chambers and Conway, 1992, pp18–19). Present value has, however, often been taken as a basis for decisions. To correct this, Zhao and Zilberman (1999) have proposed a new concept of irreversibility cost, and point out that discounting may encourage a pattern of developing now and restoring later. This applies, for example, with the high costs of decommissioning nuclear power stations, which in present value terms were very low at the time of deciding to build them. Irreversibility traps a project or society into having to pay such costs. Second, substitutability is invoked, with the idea that technological development will find substitutes for resources or services that are depleted, damaged or destroyed. In this view, depletion and degradation of ecological capital are not irreversible in the sense that they can largely be overcome by the accumulation of knowledge and of manufactured and human capital.26 However, even if technological substitutes exist or are found, their cost is typically high, limiting access to
158 Poverty and Hunger
those who are more affluent and putting them beyond the reach of communities and people who are less well off. Third, non-renewable natural capital resources, like rocks, minerals, oil or gas, are not normally given intrinsic value in economic assessments. When they are irreversibly exploited they appear in themselves costless. To be sure, there are the costs of land, licences and royalties, and of extraction, processing and bringing into use; and sometimes costs are attributed to loss of amenity and physical and ecological damage. But non-renewable natural resources are not given an inherent capital value. So they come out on the wrong side of the ledger as benefits when, unless recycled, they are more strictly costs in the form of irreversible losses. Fourth, the cultural, aesthetic, ecological, recreational and spiritual values threatened or diminished by irreversible ‘development’ cannot be measured in money; yet they are deep elements in the quality of human life and experience. Attempts to measure some of them in cash equivalents appear crude. What is the dollar value of being able to watch a bird or climb a rock, now and for future generations? Some may justify giving these a cash value as a short-term expedient in order to talk to hard-core economists in their own terms. In my view, responsible imagination and reflection on stewardship of the heritage of countless future generations will always be better and should carry more weight. The effects of these biases and neglect are pervasive. Take even the report of the World Commission on Dams (WCD, 2000). Though a remarkable achievement and tour de force, it does not give irreversibility as much prominence as the concept would seem to merit. For irreversibility applies both to structures and their impacts and to decision processes. Despite siltation, earthquakes and other hazards, dam structures and their immediate impacts are large and irreversible. As for decision making, the central values that run through the report are equity, efficiency, participatory decision making, sustainability and accountability. Irreversibility is mainly addressed indirectly, by presenting five key decision points in planning and project development. Although the last of its seven criticisms of cost–benefit analysis is ignoring ‘the effect of uncertainty and irreversibility of investment’, the report does not make irreversibility a central issue (WCD, 2000, ppxxiii, 181, 263). Over the past decade, and offsetting such biases and neglect, some economists have given more attention to irreversibility and related concepts. Faucheux and Froger (1995), for example, examine decision making in the conditions of uncertainty, irreversibility and complexity, which they say characterize most environmental problems. Zhao and Zilberman (1999) distinguish between technical irreversibility, when technologies to mitigate negative impacts do not exist, and economic irreversibility, when ‘it is not optimal to restore the development even though technologies exist to do so’ (ibid, p560). This is because of the level of what they call irreversibility costs or restoration costs. Faucheux and Hue (2001) in their article ‘From irreversibility to participation: Towards a participatory foresight for the governance of collective environmental risks’ move the discussion into the social realm, stressing the need for vigilance and describing experiments with forms of participatory ‘social foresights’ – which articulate ‘demand’ as signalled in the
Words and Ideas: Commitment, Continuity and Irreversibility 159
views of citizens. These include public inquiries, citizens’ panels, citizens’ juries, consensus meetings and mediation. Issues around irreversibility became clearer in 2002 in discussions about concepts for the MA (Millennium Ecosystem Assessment). The MA is an ambitious project to understand better the relationships between ecosystems, ecosystem services and human well-being. Members of the multidisciplinary group of 51 authors met four times to evolve the conceptual framework27 published as Ecosystems and Human Well-being: A framework for assessment (Alcamo et al, 2003). This defines concepts relevant to this discussion (ibid, pp208–216). Irreversibility is ‘the quality of being impossible or difficult to restore, or return to, a former condition’. Reversibility is related to resilience – ‘the capacity of a system to tolerate impacts of drivers without irreversible change in its outputs or structure’. Thresholds are ‘a point or level at which new properties emerge in an ecological, economic or other system, invalidating predictions based on mathematical relationships that apply at lower levels… Thresholds at which irreversible changes occur are especially of concern to decision makers.’ In the MA’s conceptual framework, values are seen to bear heavily on decision making where thresholds and irreversibility are or may be involved. In the process of evolving the framework, values were much debated, both as intrinsic – the value of someone or something in and for itself, irrespective of its utility for someone else, and as ecosystem services to human well-being, classified as provisioning, regulation and cultural. Cultural values were recognized as spiritual and religious, recreation and ecotourism, aesthetic, inspirational, education, sense of place and cultural heritage (Alcamo et al, 2003, p5). A recurrent theme was keeping options open for future generations. For this, option value was defined as: … the value of preserving the option to use services in the future either by oneself (option value) or by others or heirs (bequest value). Quasi-option value represents the value of avoiding irreversible decisions until new information reveals whether certain ecosystem services have values society is not currently aware of (Alcamo et al, p213)
The precautionary principle, embodied as Article 15 of the Rio Declaration (United Nations, 1992, p3; see also Harremoës et al, 2002) applies here. This is the management concept stating that in cases: … where there are threats of serious or irreversible damage, lack of full scientific certainty shall not be used as a reason for postponing cost-effective measures to prevent environmental degradation.
Despite all of this, and the way it underlies much of the precautionary principle, irreversibility remains an underdeveloped concept.28 Further steps are needed to distinguish types, degrees and sequences of reversibility and irreversibility. One approach is to classify changes as clusters according to two dimensions: causes,
160 Poverty and Hunger
Source: Developed in discussions with Christopher Chambers and Jenny Chambers
Figure 6.1 Clusters of environmental change by types of cause and irreversibility
polarized between primarily human and totally physical; and adverse effects, polarized between reversible and irreversible (as in Figure 6.1). In the north-east of the figure are irreversible large-scale events beyond our control, most of the effects of which are irreversible – earthquakes, meteor impacts and volcanic eruptions. In the east are tsunamis and extreme weather events such as tornadoes, hurricanes, floods and droughts that are uncontrollable, but where there is more scope for mitigating adverse effects. In the south-east is seasonal weather, uncontrollable but often with reversible adverse effects. In the south-west is renewable groundwater extraction, and above it deforestation and fisheries depletion, which are less reversible, at least in the shorter term.29 While these are all vitally important, and so often demand urgent and sustained intervention, it is the remaining areas that merit the closest and most intense attention: the north-west with mining, oil and gas extraction, quarrying and species extinction – controllable but irreversible; and the north and centre with climate and ocean circulation change, and soil erosion and siltation. These are areas where human agency is a major cause and adverse effects are irreversible in the medium and long term or forever. It is in these areas that long-term future options are closed off through human action, and that the precautionary principle applies, and should be made to apply, with most force.
Words and Ideas: Commitment, Continuity and Irreversibility 161
To take the rocks example, the short-term gain from blasting the rocks near Delhi or Hyderabad for building contributes to current livelihoods and GDP (gross domestic product), but is at the cost of cultural, aesthetic, recreational and spiritual experiences of future generations forever. And these generations, let us hope, will be billions of people over thousands, if not millions, of years. To destroy such rocks manifests an extreme of blinkered and myopic philistinism. As articulated, the precautionary principle does not fit, and is too weak for this context. There is no lack of certainty. And the term cost-effective leads us astray for two reasons: first, we are concerned with incommensurable values not susceptible to economic calculus; and second, discounting overvalues the clear short-term economic gains and ignores millennia of future benefits. To offset this weakness, much depends upon social and ecological responsibility, access to information, the exercise of imagination, and commitment to the democratic representation of future generations who, we must hope, will dramatically outnumber us, giving their interests a very high weighting. Any broader formulation of the precautionary principle risks a comprehensiveness that could be used to support a conservationism that would discriminate against today’s poor people. Nothing that follows should undermine the moral and practical case for participatory conservation (see, for example, Ghimire and Pimbert, 1997). The concern has to be a balance of the social and environmental, of values and actions, and of the present and future. Each of us might wish to think through and elaborate our own version of a revised precautionary principle. Here is mine: In the interests of poor people, future generations and the planet, where there are threats or certainty of serious or irreversible environmental damage or loss, neither lack of full scientific knowledge nor short-term economic gain shall be used as a reason for postponing preventive action that is socially and ecologically responsible. The more irreversible the damage or loss, the greater the urgency and the higher the cost justified to prevent it.
This formulation is a provocation for reflection, not final words, and surely for debate. Not least, there are questions of what is damage and what is social and ecological responsibility. There will also always be trade-offs. But this at least can be concluded: irreversibility is a practical concept; it needs more analysis and elaboration; and it should have more weight in decisions and actions. In understanding and applying it, the key is, perhaps, to struggle, and to struggle in every context and in every generation, and to act in ways which are responsible, socially and ecologically, both for the present and the future.
Cinderella concepts and criteria In the contexts reviewed above – of settlement schemes and other bounded projects, of staff motivation and performance, and of the environment – ideas of commitment,
162 Poverty and Hunger
continuity and irreversibility manifest themselves in different forms, with different implications. What stands out in common is that they have been relatively neglected as concepts and as criteria for weighing choices, for deciding what to do and for evaluation. As the restless search for novelty in development impels us to learn and use new words, concepts and criteria, old ones are buried and forgotten. This is the more so with these three since at no time have they enjoyed much popularity in development. They have been marginalized even more by the new prominence of the words which refer to power and relationships: empowerment, ownership, partnership, participation, accountability and transparency. Commitment, continuity and irreversibility have become more than ever Cinderellas, unrecognized and overlooked.30 Yet, as I have argued, they are fundamental to good development practice. Most surprising is the neglect of continuity of staff in post. It is easy to measure, which makes it odd that it is so rarely done. Part of the explanation may be that it is so often determined by personnel or human resource departments that are out of touch with field realities, or by central people in senior posts, or by politicians, or by combinations of these. One transfer can generate a chain of other transfers, multiplying its costs. The bad effects of one transfer can then be immense, though unseen, unmeasured and unrecognized. Too long in a post can also be bad, with loss of freshness and excitement; and there is a positive side to transfers – they can give a new clean start, re-energize and broaden experience. But all too often time in post is too short. The neglect of commitment is less surprising. It is more abstract and not amenable to measurement. It is to be optimized, not maximized. Its dimensions are diverse: they can be personal – with commitment to, for example, an ideal, a cause or a relationship; or organizational – with commitment to a programme, project, a group of people or a mission; or political – with commitment to a programme or policy. Commitment is also contextual, evolutionary and difficult to forecast. As for irreversibility, in economics it has been overshadowed by preoccupations with risk, uncertainty and sustainability. It has not been incorporated significantly into economic analysis. It is difficult to quantify and it confronts and contradicts conclusions that come from discounting. Nor is it always bad: as with continuity, more of it can be better or worse, depending upon the case. If factors like these explain why it has been such a marginal concept, the case is strengthened for offsetting them, developing it further as a concept and giving it more prominence. Questions of commitment, continuity and irreversibility are relevant to much decision making and action. The issues they raise differ by context. It is tempting, then, to dismiss them as too vague and variable to be of much use. But there is a paradox here. For the very diversity of their meanings makes them versatile in their applications. The lesson is not to pass them by, but to define and apply them, context by context. They should be part of any checklist of criteria for review in formulating policies, making decisions and taking action. They deserve to be brought out of the shadows into the light closer to centre stage. Given more weight
Words and Ideas: Commitment, Continuity and Irreversibility 163
in development, and applied again and again, they should prevent or reduce damage from errors and, at the same time, ensure that more good things are done.
Notes 1
2
3 4
5 6
7 8 9 10
11
12 13
Mwea was so frequently visited by VIPs, researchers, school parties, women’s groups, government officials and others that the manager told me he spent 45 per cent of his time on public relations. This led to the recruitment of a deputy manager for whom this was his major work. The recent history of Mwea has been turbulent. During the late 1990s, farmers increasingly protested against the National Irrigation Board’s corrupt management and high service charges. In January 1999, two young men were killed by police in a demonstration. The farmers took over the scheme to run it themselves (Kenya Human Rights Commission, 2000). This evidently failed, and, in January 2003, negotiations between the farmers’ cooperative and the National Irrigation Board led to the formation of a committee to oversee the scheme (Daily Nation, 27 and 29 January 2003). This section is from Chambers (1969, pp257–262). A few details of evidence have been edited out, together with a paragraph on Perkerra. I struggled with my wish to change ‘men’ to ‘people’; but have left the male-biased word, which was in the original. It situates the piece historically. This was before the gender-awareness revolution. That said, Jon Moris and Jane Hanger, the authors of the much-cited and influential Chapter H, ‘Women and the household economy’, in the Mwea collection (Chambers and Moris, 1973, pp209–244) deserve credit for showing how markedly settlement conditions made things worse for women, leading, for example, to a high rate of divorce. Nicholas, in Volta Resettlement Symposium Papers p86, subsequently edited and republished in Chambers, 1970. Interim report of a United Nations Special Fund survey of the lower Tana Basin in Kenya, as reported in East African Standard (Nairobi), 17 November 1965, and Daily Nation (Nairobi), 17 November 1965. Despite a long sequence of adverse appraisals, the project (named Bura) was eventually implemented and must rank as one of the economically most disastrous settlement projects ever. The heading in the original text was ‘Concluding’. The word now would be appraisals. Evaluations are ex post, appraisal ex ante, but this distinction was not yet a convention in the late 1960s. Mea culpa. This section is taken from the final pages of Chapter M ‘The Perkerra Irrigation Scheme: A contrasting case’, in Chambers and Moris (1973, pp344–364). I would like to thank the past and present officials of the Kenya government who have helped me with the research for this case study. I am especially indebted to E. G. Giglioli, J. G. Stemf, S. G. Sandford and R. E. Wainwright for comments on an earlier version. Responsibility for what is written here is, however, entirely mine and should not be attributed to any other person or to any organization. Attempts to obtain accounts or details of how Perkerra was financed have not been successful. There are reasons to infer that the cross-subsidization through the National Irrigation Board using surpluses from the more viable Mwea Irrigation Settlement continued until 1998, when the Mwea farmers rebelled; but I have been unable to substantiate this with direct, authoritative or numerical information. According to one report, which remains unconfirmed, the Perkerra staff went unpaid for six months when the Mwea settlers rebelled and cross-subsidization of Perkerra from Mwea ended. This equates to 1.5 million Kenyan shillings.
164 Poverty and Hunger 14 Daily Nation, 21 March 2003, http://www.nationmedia.com. This may have subsumed the earlier US$20,000 pledged by the National Irrigation Board. 15 This is not to justify the gross inequalities of landholdings in Zimbabwe. The government, however, chose not to take up aided programmes of settlement of the sort that had been so successful in Kenya. There were numerous reports of how farm labourers suffered and lost when land was seized. 16 In October 2003, Concorde had its historic last flight. The Mahaweli project is still alive, extensive and, to the best of my knowledge, well. 17 A contributory factor reflecting continuity of relationships may have been that the Tanzanian President was a Finnophile. The only place in Tanzania with a sauna bath was, and to the best of my knowledge remains, Mtwara. Though its construction provoked a divisive ideological debate among Finnish expatriates, it could hardly have been a political liability when it was patronized, as it was, by the president. 18 Statistics for DFID aid to Uganda compiled by Lister and Nyamagusira (2003) from www.DFID. gov.uk/sid for 1999/2001 and 2000/2001, respectively, give project aid dropping from UK£41.467 million to UK£17.686 million, and programme aid rising from UK£17 million to UK£45 million. The possibility must be recognized that part of this dramatic contrast may have been the result of a change in accounting. 19 To be wilfully unaware is to decide not to know or not to take steps to know, when it is apparent that there is something discordant to understand. Most people do this from time to time. I certainly do. 20 Hanging in and patience can bridge gaps until fashions come back in again. My grandmother’s long skirts were for long a legacy of the past, but became avant garde fashion when hemlines dropped again, and casual observation suggests that, in 2003, for some young women at least, flared trousers have come back. Those aided projects that survive may in due course find themselves part of a wave of the future. 21 USAID’s lack of long-term commitment and tendency to lurch from one priority and language to another is a commonplace development experience, has done much hidden damage and deserves a special study. An example is its policies towards family planning. In Jordan, for example, support to a project was withheld after field preparations had begun. ‘In such situations, with expectations raised at the local level, organizational credibility is diminished, and time and energy must be spent to regain the trust of partners in the field’ (bint Talal, 2003, p190). 22 I owe the word friendship to Norman Uphoff, who frequently stresses it in Gal Oya (Uphoff, 1992), and to Elmer Ferrer at the Community-based Coastal Resources Management Festival, held at Subic Bay in the Philippines in June 2003, who eloquently stressed how friendship had been fostered by people from different backgrounds and organizations staying together for a long time, working with a common cause. 23 Rosalind Eyben (pers. comm.) has pointed out that: ‘Interestingly, the FCO [Foreign and Commonwealth Office of the UK government] now has “anchors”, so although someone is only posted for three to four years at any time to a particular country, they do go back again later on and possibly for a third time, as well, during their career. Diplomats appreciate the importance of local knowledge much more than do aid staff.’ 24 While courting my wife Jenny, I was in Bihar when she had an excellent job offer that would have put us in different continents for two years. Forced to communicate by cable with few words, I pleaded with her to ‘minimize irreversibility commitment’. To my great good fortune, though not necessarily hers, it worked. 25 I write this with passion, anguish and guilt. One of the biggest, most selfish errors of my life was to spend many of the Sundays during three and a half years living in New Delhi rock-climbing on endangered rocks at Damdama and Dhauj, instead of devoting my time to saving them and their environments for future generations. The finest rocks are still, but precariously, intact at the time of writing (2004); but at Dhauj outlying rocks have been mindlessly quarried and destroyed for-
Words and Ideas: Commitment, Continuity and Irreversibility 165
26 27
28 29
30
ever. In Hyderabad a vigorous Society to Save Rocks has done great work; but to my knowledge there is no equivalent in Delhi, or, indeed, in any other city in the world. For a discussion of substitutability and well-being, see Alcamo et al (2003, pp79–81). I was lucky to be involved both in drafting the chapter on human well-being and in plenary discussions across the whole range of subjects. This was one of the most stimulating and mindopening experiences of my life. I will be grateful to anyone who can contradict or qualify the assertion that irreversibility remains underdeveloped as a concept. Caution is needed here in distinguishing cases. Some groundwater can be renewed in an almost linear manner. However, restoration to a former condition implies a reversibility that is not characteristic of ecological systems. Depletion, as through overfishing, may take an ecosystem below a threshold of resilience, so that ‘recovery’ is very slow or follows a pathway to a different species composition and community structure. In Newfoundland fishery, the failure of cod to recover quickly is an illustration of this (David Schoeman, pers. comm.). The Cinderella analogy works as a metaphor for exclusion by those with power and influence. Her ugly sisters did this to Cinderella. Ugly in this sense myself, I was responsible for excluding ‘continuity of staff in their posts’ from the prescriptions of an IDS (Institute of Development Studies) policy briefing paper on power, procedures and relationships (Chambers et al, 2001), as I recollect murmuring that continuity was ‘old hat’.
References Akumu, W. (2002) ‘Farmers want a more efficient irrigation board’, The Nation (Nairobi), 13 December, drawing upon a report of the Kenya Institute of Public Policy Analysis and Research Alcamo, J. et al (2003) Ecosystems and Human Wellbeing: A Framework for Assessment, Report of the Conceptual Framework Working Group of the Millennium Ecosystem Assessment, Island Press, Washington DC, and Covelo, London Apthorpe, R. (1966) ‘A survey of land settlement schemes and rural development in East Africa’, East African Institute of Social Research Conference Papers, January, no 352 Bagadion, B. and F. Korten (eds) (1989) Transforming a Bureaucracy: The Experience of the Philippine National Irrigation Administration, Kumarian Press, West Hartford, CT Begg, D., S. Fischer and R. Dornbusch (2003) Economics, seventh edition, McGraw-Hill, London bint Talal, B. (2003) Rethinking an NGO: Development, Donors and Civil Society in Jordan, I.B. Taurus, London, New York Brown, L. D. and J. Fox (2001) ‘Transnational civil society coalitions and the World Bank: Lessons from project and policy influence campaigns’ in Edwards and Gaventa (eds) Global Citizen Action, Lynne Rienner Publishers, Boulder, CO, pp43–58 Cernea, M. (1997) ‘The risks and reconstruction model for resettling displaced populations’, World Development, vol 25(10), pp1569–1587 Cernea, M. (ed) (1999) The Economics of Involuntary Resettlement: Questions and Challenges, The World Bank, Washington DC Chambers, R. (1969) Settlement Schemes in Tropical Africa: A Study of Organizations and Development, Routledge and Kegan Paul, London Chambers, R. (ed) (1970) The Volta Resettlement Experience, Pall Mall Press, London Chambers, R. and G. Conway (1992) Sustainable Rural Livelihoods: Practical Concepts for the 21st Century, IDS Discussion Paper 296, IDS Sussex, UK Chambers, R. and J. Moris (eds) (1973) Mwea: An Irrigated Rice Settlement in Kenya, Weltforum Verlag, Munchen
166 Poverty and Hunger Chambers, R., J. Pettit and P. Scott-Villiers (2001) The New Dynamics of Aid: Power, Procedures and Relationships, IDS Policy Briefing, no 15 David, R. and A. Mancini (2004) Going Against the Flow: The Struggle To Make Organisational Systems Part of the Solution rather than Part of the Problem – The Case of ActionAid’s Accountability, Learning and Planning System, Lessons for Change Series No 8, IDS, Sussex de Waal, D. (2000) ‘The development of participatory media in southern Tanzania’, Forests, Trees and People Newsletter, vol 40/41, pp14–18 Devereux, S. (2001) ‘Livelihood insecurity and social protection: A re-emerging issue in rural development’ in C. Ashley and S. Maxwell (eds) Rethinking Rural Development: Development Policy Review, Theme Issue, vol 19(4), December, pp507–519 Dubash, N. K., M. Dupar, S. Kothari and T. Lissue (2001) A Watershed in Governance? An Independent Assessment of the World Commission on Dams, World Resources Institute, Lokayan and Lawyers’ Environmental Action Team, Washington DC Eyben, R. (2003) Donors as Political Actors: Fighting the Thirty Years War in Bolivia, Working Paper 183, IDS, Sussex, April Eyben, R. (2004) Relationships Matter for Supporting Change in Favour of Poor People, Lessons for Change Series, No 8, IDS, Sussex Faucheux, S. and C. Hue (2001) ‘From irreversibility to participation: Towards a participatory foresight for the governance of collective environmental risks’, Journal of Hazardous Materials, vol 86, pp223–243 Faucheux, S. and G. Froger (1995) ‘Decision-making under environmental uncertainty’, Ecological Economics, vol 15, pp29–42 Freling, D. (ed) (1998) Paths for Change: Experiences in Participation and Democratisation in Lindi and Mtwara Regions, Tanzania, Oy Finnagro Ab, Finland Ghimire, K. B. and M. P. Pimbert (eds) (1997) Social Change and Conservation: Environmental Politics and Impacts of National Parks and Protected Areas, Earthscan, London Giglioli, E. G. (1973) ‘The national organisation of irrigation’ in R. Chambers and J. Moris (eds) Mwea: An Irrigated Rice Settlement in Kenya, Weltforum Verlag, Munchen, pp163–183 GOK (Government of Kenya) (1962) African Land Development in Kenya 1946–1962, Ministry of Agriculture, Animal Husbandry and Water Resources, Government of Kenya, Nairobi Groves, L. (2004) ‘Questioning, learning and “cutting edge” agendas: Some thoughts from Tanzania’ in L. Groves and R. Hinton (eds) Inclusive Aid: Power and Relationships in International Development, Earthscan, London Groves, L. and R. Hinton (eds) (2004) Inclusive Aid: Power and Relationships in International Development, Earthscan, London, pp76–86 Harremoës, P., D. Gee, M. MacGarvin, A. Stirling, J. Keys, B. Wynne and S. Guedes Vaz, (eds) (2002) The Precautionary Principle in the 20th Century: Late Lessons from Early Warnings, Earthscan, London Hirschman, A. O. (1967) Development Projects Observed, The Brookings Institution, Howes, M. (2002) ‘ActionAid The Gambia’ in D. Brown, M. Howes, K. Hussein, C. Longley and K. Swindell (eds) Participation in Practice: Case Studies from the Gambia, ODI, London, pp75–121 Imhof, A., S. Wong and P. Bosshard (2002) Citizens’ Guide to the World Commission on Dams, International Rivers Network, Berkeley, CA, US IMM (Integrated Marine Management), ICM (Integrated Coastal Management) and FIRM (Foundation Integrated Rural Management) (2000) Sustainable Coastal Livelihoods Newsletter, vol 1(1), IMM, University of Exeter, UK, ICM, Kakinada, Andhra Pradesh, and FIRM, U Kothapalli Mandal, East Godavari District, Andhra Pradesh Johansson, L. (2000) ‘Participatory video and PRA: Acknowledging the politics of empowerment’, Forests,Trees and People Newsletter, vol 40/41, pp21–23 Kakande, M. (2004) ‘The donor–government–citizen frame as seen by a government participant’ in L. Groves and R. Hinton (eds) Inclusive Aid: Power and Relationships in International Development, Earthscan, London, pp87–96
Words and Ideas: Commitment, Continuity and Irreversibility 167 Kar, K., J. Adkins and T. Lundstrom (1998) ‘Institutionalisation of participation’ in D. Freling (ed) Paths for Change: Experiences in Participation and Democratisation in Lindi and Mtwara Regions,Tanzania, Oy Finnagro Ab, Finland Kenya Human Rights Commission (2000) Dying to be Free: The Struggle for Rights in Mwea, Kenya Human Rights Commission, Nairobi Lister, S. and W. Nyamugasira (2003) ‘Design contradictions in the “new architecture of aid”? Reflections from Uganda on the roles of civil society organisations’, Development Policy Review, vol 21 (1), pp93–106 Mehta, L. (2002) ‘The World Commission on Dams + eighteen months’, Science and Public Affairs, June, pp24–25 Morse, B. and T. Berger (1992) Sardar Sarovar, Report of the Independent Review, Resource Futures International (RFI) Inc, Ottawa, Canada Mosse, D. (2003) ‘The making and marketing of participatory development’ in P. van Ufford and A. Kumar Giri (eds) A Moral Critique of Development: In Search of Global Responsibilities, Routledge, London, pp 43–75 Mosse, D. (2005) Cultivating Development: An Ethnography of Aid Policy and Practice, Pluto Press, London and Sterling, VA MRALG (Ministry of Regional Administration and Local Government), Tanzania (1999) Whose Priorities in Policy Making? Reflections from the Permanent Secretaries’ Retreat on Participation in Tanzania, Tarangire, Arusha, 10–11 February 1999, MRALG, Tanzania Musyoki, S. (2003) ‘Can bilateral programmes become learning organisations?’ in L. Roper, J. Pettit and D. Eade (eds) Development and the Learning Organisation: Essays from Development in Practice, Oxfam, Oxford, pp152–168 Njeru, M. (2003) ‘Baringo cries out as famine bites’, Daily Nation on the web, www.nationmedia. com, 25 February Nyamachumbe, F. (2000) ‘Utambie wananchi – Tell the people! Participatory evaluation and video, the case of the Kilwa fish market in Southern Tanzania’, interview withVenera Knippel, Forests, Trees and People Newsletter, vol 40/41, pp19–20 Picciotto, R., W. van Wicklin and E. Rice (eds) (2001) Involuntary Resettlement: Comparative Perspectives, Transaction Publishers, New Brunswick, US, and London, UK Roy, A. (2002) The Algebra of Infinite Justice, Flamingo, London Shanks, E. and B. Dinh Toai (2000) Field Based Learning and Training in Participatory Approaches to Rural Development: A Decade of Experience in PRA from the Vietnam Sweden Cooperation Programme and the Challenge for Formal Education, Research and Donor Organisations, Resource paper for the Workshop on Changing Learning and Education in Forestry, Vietnam Swantz, M.-L. (1998) ‘PRA requires change in the bureaucratic system’, in D. Freling (ed) Paths for Change: Experiences in Participation and Democratisation in Lindi and Mtwara Regions,Tanzania, Oy Finnagro Ab, Finland, pp108–109 Swantz, M.-L., E. Ndedya and M. S. Masaiganah (2001) ‘Participatory action research in southern Tanzania, with special reference to women’ in P. Reason and H. Bradbury (eds) (2001) Handbook of Action Research: Participative Inquiry and Practice, Sage Publications, London, Thousand Oaks, CA, and New Delhi, pp386–395 Swift, J. (1935, first published 1726) Gulliver’s Travels, Oxford University Press, Oxford Todaro, M. P. and S. C. Smith (2003) Economic Development, eighth edition, Addison Wesley, Boston UN (1992) The Rio Declaration on Environment and Development, United Nations, New York UNHCR (Office of the UN High Commissioner for Refugees) (2003) Global Appeal 2000, Office of the UN High Commissioner for Refugees, Geneva Uphoff, N. (1992) Learning from Gal Oya: Possibilities for Participatory Development and Post-Newtonian Social Science, Cornell University Press, Ithaca and London (paperback edition, Intermediate Technology Publications, London 1996)
168 Poverty and Hunger Veen, J. J. (1973) ‘The production system’ in R. Chambers and J. Moris (eds) Mwea: An Irrigated Rice Settlement in Kenya, Weltforum Verlag, Munchen, pp99–131 WCD (World Commission on Dams) (2000) Dams and Development: A New Framework for Decisionmaking, Report of the World Commission on Dams, Earthscan, London Witcombe, J. R., A. Joshi and B. R. Stharpit (1996) ‘Farmer participatory crop improvement 1.Varietal selection and breeding methods and their impact on biodiversity’, Experimental Agriculture, vol 32, pp445–460 World Bank (1988) Rural Development: The World Bank Experience 1965–1986, Operations Evaluation Department, World Bank, Washington DC World Bank (1994) Resettlement and Development: The Bankwide Review of Projects Involving Involuntary Resettlement, 1986–1993, Environment Department, World Bank, Washington DC Yates, J. and L. Okello (2002) ‘Learning from Uganda’s efforts to learn from the poor: Reflections and lessons from the Uganda Participatory Poverty Assessment Project’ in K. Brock and R. McGee (eds) Knowing Poverty: Critical Reflections on Participatory Research and Policy, Earthscan, London, pp69–98 Zhao, J. and D. Zilberman (1999) ‘Irreversibility and restoration in natural resource development’, Oxford Economic Papers, vol 51, pp559–573
7
Well-being and Ill-being: The Good and the Bad Life D. Narayan, R. Chambers, M. K. Shah and P. Petesch
Well-being is Multidimensional A better life for me is to be healthy, peaceful and to live in love without hunger. Love is more than anything. Money has no value in the absence of love. A 26-year-old woman, Dibdibe Wajtu, Ethiopia
The starting question posed by the researchers to the small group discussions with poor women and poor men is, ‘How do you define well-being or a good quality of life, and ill-being or a bad quality of life?’ From these discussions emerge local people’s own terminology and definitions of well-being, deprivation, ill-being, vulnerability and poverty. The terms well-being and ill-being were chosen for their open-ended breadth, so that poor people would feel free to express whatever they felt about a good life and a bad life. ‘We are trying to present a new way of seeing well-being’, notes a researcher. It is the way poor people see it themselves. Poor people’s ideas of a good quality of life are multidimensional. As explored in Part I of this chapter, they cluster around the following themes: material wellbeing, physical well-being, social well-being, security, and freedom of choice and action. All of these combine pervasively in states of mind as well as body, in personal psychological experiences of well-being. Much of ill-being was described as the opposite of these. Part II examines these dimensions in turn: material deprivation; physical ill-being; bad social relations; vulnerability, worry and fear, low selfconfidence; and powerlessness, helplessness and frustration. Part III describes the psychological dimensions of well-being and ill-being. In describing the conditions of their lives, poor children especially express resentment. Reprinted from Narayan D, Chambers R, Shah M K and Petesch P. 2000. Wellbeing and illbeing: The good and the bad life. In Narayan D et al (eds) Voices of the Poor: Crying Out for Change. Oxford University Press, Oxford, chapter 2, pp21–43. By permission of Oxford University Press, Inc.
170 Poverty and Hunger
Part I. Well-being: The Good Life How poor people put it Ideas of well-being are strikingly similar across the range of participants. Despite differences of detail, and contexts that are diverse, complex and nuanced, the commonalities stand out. The same dimensions and aspects of well-being are repeatedly expressed, across continents, countries and cultures, in cities, towns and rural areas alike. And they are expressed by different people – women and men, young and old, children and adults. For women in Tabe Ere in rural Ghana well-being means security: being protected by God, having children to give you security in old age, having a peaceful mind (tieru villa), patience (kanyir, meaning not holding a grudge against anyone), and plenty of rain. To have most, if not all, of the necessary basics of life is umoyo uwemi and umoyo wabwino, well-being as described by different groups in Malawi. These basics include certain assets, adequate food, decent medical care, constant and regular sources of income, nice clothes, good bedding, a house that does not leak, a toilet, a bathroom, a kitchen, healthy bodies, couples being respectful of each other, being God-fearing, having well-behaved children who are not selfish and having peace of mind. For those in Khaliajuri in rural Bangladesh having a good quality of life means having employment for the whole year, a good house, four or five cows, a fishing net, good clothes to put on, food to eat to one’s heart’s content and being able to protect one’s house from flood erosion. Middle-aged women say that for a good quality of life there should be a male member of the household earning money, a son for every mother and no husbands pursuing polygamy. A participant from Renggarasi in rural Indonesia considers a person to be living well who can secure his family’s needs with produce from his livestock and who is able to help others who need material and non-material things or advice. In Nigeria well-being is described by different people as being a responsible person who has a pleasurable life, peace of mind, security and independence, and who is popular with the people, is able to marry easily, is able to educate children, is able to patronize private clinics and schools, and who has money, land, a house and good clothes. In Bulgaria the major distinctive feature of well-being is stable employment, which means having money as well as security. The National Synthesis Report notes that the family is another important aspect, along with being able to socialize and being in harmony with oneself. The wealthy, seen as those who have and flaunt money and power, do not necessarily have the respect and security that the community considers essential parts of well-being. In the Kyrgyz Republic, ‘informants understand well-being as good life and wealth; however, they do not think that well-being is limited to these tangible components, and believe that well-being is impossible without tolerance, peace,
Well-being and Ill-being: The Good and the Bad Life 171
family and children. The informants think that the basis of well-being is good health, peace in the family and in the society; in their opinion, wealth, which is an important component of well-being, can only be gained if these conditions are present.’ From the Kyrgyz Republic it is also reported that most of the informants define well-being as ‘stability on a household and society level and ability to satisfy one’s material and spiritual needs’. In Barrio Las Pascuas in urban Bolivia, a group of youths say that those who have a good life are ‘those who do not lack food’, and those ‘who are not worried every day about what they are going to do tomorrow to get food for their children. They have secure work, and if the husband does not work, the wife does.’ In Nuestra Señora de Guadalupe in another part of urban Bolivia young men say that, besides having adequate food and work, well-being is to be friendly and to have friends, to have the support of family and society, and ‘to be patient, and above all happy’.
Materially, enough for a good life is not a lot I would like to live simply. I don’t like houses with too much inside. To have a bit more comfort. Nothing big … I would like a simple house … not big, or luxurious … a simple house with a floor. A 21-year-old man, Esmeraldas, Ecuador
It is perhaps part of the human condition to aspire not for the moon, but for imaginable improvements. Participants were clear that enough materially for a good life for them was not excessive or unrealistic (see Box 7.1). They hope for moderate, not extravagant, improvements. They do not see substantial wealth as necessary for well-being. Rather, they express the material dimension of life in terms of having enough for a reasonable level of living. And the material is only one dimension among others. It is not just that poor people’s material aspirations are modest. It is also that the worse off they are, the more a small improvement means. A little then means a lot. This may apply especially with women who so frequently have so little. For women in two Malawi rural sites part of a good life is having adequate utensils, especially pails for drawing water and a rack for drying plates. To a discussion of well-being in Bangladesh, a group of older women add, ‘Those who could pass time for the prayer of God after taking a full meal and could sleep on a bamboomade platform live a good quality of life.’ None of this justifies modest ambitions in development, accepting the horizons of poor people where these are limited, or restraining efforts to help them and to help them help themselves. To the contrary, it hugely reinforces the case for giving overwhelming priority to their well-being as they envisage it. Gains by poor people should come first. When the objective is to enhance the well-being to which poor people aspire, the benefits from small changes can be large indeed.
172 Poverty and Hunger
Box 7.1 The good life, caring for children To be well is when you have money, and you have a family and children. You need to have savings in order to be able to support your children till later on in life. A young man, Bulgaria A good life is to have enough food and clothing for my children. To educate them to be self-reliant when we get retired. A man, Mitti Kolo, Ethiopia The rich manage to send their children to school and also … to take their children to the clinic. A man, Musanya, Zambia To be well means to see your grandchildren happy, well-dressed and to know that your children have settled down; to be able to give them food and money when-ever they come to see you, and not to ask them for help and money. An old woman from rural Bulgaria
Material well-being: having enough
But at least for each child to have a bed, a pair of shoes, a canopy over their heads, two sheets – not to sleep like we do on the ground. Ana Maria, a poor woman, Esmeraldas, Ecuador
A poor person is a person who does not own anything that provides him with a permanent source of living. If a person has a permanent source of income, he will not ask for other people’s assistance. A poor woman from Sidkia, Egypt
Three aspects of material well-being that are repeatedly mentioned are food, assets and work. Food Adequate food is a universal need. In Malawi hunger is ranked as the number one problem by nearly every discussion group in the three urban and seven rural communities participating in the study. Elsewhere – across the range of countries – enough to eat every day is again and again stressed as a feature of well-being. In
Well-being and Ill-being: The Good and the Bad Life 173
contexts as different as Bangladesh, Bulgaria and Zambia well-being included being able to have three meals a day, all year round. Food security too is a critical component, with the number of months of food security given frequently as a criterion for ranking well-being, particularly in Vietnam. Assets For those living in rural areas secure tenure of adequate resources, especially land, is another nearly universal criterion of well-being. This often includes ownership of livestock. In urban areas the parallel needs are savings and capital, and access to consumer goods. In urban Ghana well-being is identified with capital to start a business. The need for housing – as well as furniture, utensils and tools – is also a virtually universal aspect of well-being and sometimes poor people describe a ‘house that should not let in the rain’. Work Work to gain a livelihood is a nearly universal aspiration among participants. Money itself is mentioned less frequently than one might expect and, when mentioned, it is implied by other aspects of well-being such as the ability to find paid work to obtain money, to buy clothes and to pay for health treatment and school expenses. A poor man in Thompson Pen in Jamaica says, ‘Work makes all the difference in the world. I feel bad, miserable, sick, and can’t take doing nothing. My wife, at 78, is still working. My dream is a little work to make ends meet.’ In rural areas work takes many forms; it is usually agricultural and linked with land. In urban areas it means a steady job, which is stressed again and again by those who are without work or who are striving to make a livelihood through casual labour or informal and illegal activities. Whether it is Malawi, where one idea of well-being is both husband and wife working, or Russia, where participants stress the importance of wages that are regularly paid, the desire is for productive work to provide an adequate and secure livelihood. Bodily well-being: being and appearing well Material well-being is rarely mentioned without other critical aspects of a good life. These include the bodily well-being of health and appearance, as well as a good physical environment. Almost everywhere, health and access to health services – whether informal or formal – are important. A healthy and strong body is seen as crucial to wellbeing – not just for a sense of physical well-being in itself, but as a precondition for being able to work. A person who is sick and weak cannot work or cannot work well. For some, especially for girls and young women, the importance of appearance – of both body and clothing – comes through forcefully. Quality of skin is often referred to. In Muchinka in rural Zambia the bodies of the better off are said to ‘look well’. For urban poor people in Jamaica criteria for well-being include ‘skin tone looks balanced’ and ‘looking well fed’. In Gowainghat, Bangladesh
174 Poverty and Hunger
clothes, oil for the hair and soap are important to young women. Across cultures and contexts being able to dress well and appear well is repeatedly stated as part of a good quality of life. The third dimension of physical well-being is physical environment, with well-being in Accompong, Jamaica associated with, for example, ‘the fresh air in the hills of Cockpit County’. The aspect of physical environment, however, is more often used in a negative context and is described, for example, as the bad experiences of living in ‘the places of the poor’. Social well-being Social well-being includes care and well-being of children; self-respect and dignity; and peace and good relations within the family, community and country. Being able to care for, bring up, marry and settle children In Nigeria, of the 48 aspects of well-being identified, no fewer than eight of them refer to children. Having happy and healthy children, feeding them, clothing them, being able to take them for treatment when sick, and being able to send them to school and pay school bills are common concerns strongly expressed. In Bangladesh households that are financially well off are those that can afford clothes and education for their children. To be able to marry and settle children is a frequent aspiration. In Malawi and Uzbekistan wedding ceremonies conducted in good style are important. In Ampenan Utara, Indonesia one of the criteria for differentiating well-being groups is the ability to meet the costs of children’s weddings: the top group has no problem; the second group can meet the cost; the third has to become indebted to meet the costs; and the issue for the bottom group is simply not mentioned. Landless women in Dorapalli in India identify a major impact of poverty as ‘difficulty in marrying girl children’. In Eil-bil-ille, Somaliland the well off are those who can afford marriage-related costs and who always marry at an early age. Self-respect and dignity Self-respect and dignity, as described by poor people, means being able to live without being a burden to others; living without extending one’s hand; living without being subservient to anybody; and being able to bury dead family members decently. In Nigeria this includes being listened to, being popular and being able to fulfil social obligations and to help others. Peace, harmony and good relations in the family and the community Many poor people consider the absence of conflicts essential for family and social well-being. In Ghana this is expressed as unity in the household or community. In Uzbekistan it means peace and calm in the family, in the country and in one’s own community. Good relations extend to social cohesion and support, and to helping one another. In Vietnam near Ha Tinh poor people state their priorities as being able
Well-being and Ill-being: The Good and the Bad Life 175
to ‘encourage people to visit, support and give presents (show feelings in general) to households dealing with crises and during the holidays’. Security Security includes predictability and safety in life and confidence in the future. Civil peace A group of elderly residents of Ak Kiya in the Kyrgyz Republic comment, ‘Among all well-being criteria, peace is the most important one. Now there is war in Yugoslavia and in other countries. God willing, it would not happen here. As they say, “be hungry but live in peace”.’ Even in contexts without recent experience of civil conflict or war, such as this one in the Kyrgyz Republic, civil peace was often ranked high. Peace – the absence of war, violence and disorder – is the most important component of well-being for those living in the context of recent war or disorder. A physically safe and secure environment Well-being means not being vulnerable to physical disasters, threats and discomforts that are so typical of the places of poor people. These included floods in urban Argentina and rural Bangladesh, wild animals in Sri Lanka and India, water pollution from industry in Bulgaria, the disaster from the Aral Sea in Uzbekistan, and air pollution from industry in Olmalyq, Uzbekistan. These are named among many other physical, often seasonal, threats. Personal physical security ‘Here we live with our door open’, report participants in rural Argentina. A man in Jamaica says that ‘this is a ghetto community, but you don’t have any violence; you can walk (around) here any hour of the night and no one is going to harm you’. Again in Jamaica, the relaxed atmosphere and the high level of personal safety in the countryside are valued. Lawfulness and access to justice Refugees in a Russian city who survived the horror of a civil war and genocide and who were objects of constant abuses describe ‘peace’ and ‘the absence of constant fear’ as the main prerequisites of a good life. Lawfulness and access to justice are widely seen as aspects of well-being, particularly in Nigeria. Security from persecution by the police and other powers that be is a priority for many, especially for urban vendors. Security in old age Particularly for older people, security and support in old age are a primary concern. An old woman in Khaliajuri, Bangladesh says that, for a good quality of life, a son must not sever the family bond after marriage and he must provide food to his mother.
176 Poverty and Hunger
Confidence in the future The good life is also frequently defined as being able to look forward to the future. Especially in countries like Bosnia and Herzegovina and Russia that have experienced recent national traumas participants value being able to have confidence in a stable and predictable future. They say that they once had this, but that it is now only experienced by a few rich people. Freedom of choice and action The research team from Brazil puts it like this: People tended to equate poverty with powerlessness and impotence, and to relate wellbeing to security and a sense of control of their lives. A woman from the community of Borborema established a connection between power and control, and well-being. She argued, ‘The rich one is someone who says, “I am going to do it”, and does it.’ The poor, in contrast, do not fulfil their wishes or develop their capacities.
Freedom of choice and action extends to having the means to help others. Being able to be a good person is a feature of the good life that poor people often highlight. A young man in Isla Trinitaria, Ecuador wants to be able to buy clothes for his sisters. In Malawi a good characteristic of one high category of well-being was to love everyone and help others when they have problems. Well-being is quite frequently linked with moral responsibility, with having the wherewithal to help others, and with having enough money to be able to give to charity or a religious organization. What people say they wish to be able to do covers a huge range: to gain education and skills; to have mobility and the means to travel; and to have time for rest, recreation and being with people – among others. Underlying all of these – and the material, physical, social and security dimensions – is a fundamental aspiration. Participants in many contexts say that they want to be able to make choices, to decide to do basic things without constraint, to live in a predictable environment and have some control over what happens.
Diversity by context and person For all of these commonalities, there are differences of aspiration and of concepts of well-being. They vary by continental region, by rural and urban areas, by livelihood, by age and by gender. The contrasts are perhaps not surprising, but listing a few of those that are more striking can make and illustrate the point without any attempt to be comprehensive: •
In Eastern Europe, Central Asia, Bulgaria, the Kyrgyz Republic, Russia and Uzbekistan, well-being is frequently defined nostalgically as the ‘normal’ condition, meaning before the end of communism. In Russia well-being criteria are taken from the past and not the present.
Well-being and Ill-being: The Good and the Bad Life 177
• • •
•
•
•
Among pastoralists, whether Somalis in Somaliland or Kalmyks in Russia, well-being is often intimately linked with animals. Poor rural people emphasize land and livestock, farming capital and inputs for livelihood activities, and being able to farm on one’s own. Poor urban people repeatedly emphasize employment, a job, infrastructure, housing, security of tenure and physical security. They sometimes have higher material aspirations for consumption goods than rural people. In one urban site in Malawi participants say that well-being entails leading a European (Western) life (moyo wachizungu), having houses to rent out to others, having decent and well-paying jobs and having very good houses with electricity. Women tend more often than men to mention peace in the family; good social relations in the community; adequate and nutritious food; good drinking water; being able to bring up children in good conditions, keep them healthy, and sending them to school; and not being maltreated in the family. Men tend more often to mention material productive goods, and time to relax. There are exceptions to these generalizations, and there is a danger of overstereotyping gendered priorities and values, especially at a time when change in gender roles in many places is rapid. The views of some poor children were asked. In Chittagong, Bangladesh, according to children, well-being means having neat and clean surroundings, with facilities for education, being able to play freely, living in a building, having good food (fish, meat, vegetables, etc.), going every morning to madrasa (traditional Muslim school), and everybody living in harmony. Peace and harmony in the family and in society are important to children.
Wealth and well-being are different In discussions on criteria for a good life, the researchers report: • • •
‘The group of young people underscored the need to have a family, to feel supported and understood.’ – According to a youth group in Barrio Universitarios, Bolivia In Bulgaria, ‘wealth and well-being are not identical, for the rich have money but don’t have security, nor are they respected by the community. Ill-being is, however, identical with poverty: this is “our situation”.’ In Russia, ‘the life of the well-to-do people was never called a “good life”. Ultimately, when both the younger and older participants talked about the wellto-do people, they would never call their life a “good” one.’
Good living or well-being in Zambia, ‘can mean being liked, but also can make others jealous and bring hatred and death’. Participants repeatedly distinguish between wealth and well-being. Those who are wealthy are by no means always in the top category for well-being. For example, a widow who is rich might not be put in the top well-being category because widowhood is a bad condition.
178 Poverty and Hunger
The wealthy can be generous and good, but often they are seen in a bad light. A 54-year-old man from Kok Yangak in the Kyrgyz Republic says: One can make a fortune, but if it has negative effects for the rest of the community, such wealth gives just an illusion of well-being, because it does not do any good for people. If somebody’s well-being is based on the ill-being of others, it is not a true well-being. There are rich people in the village. They made their fortune by selling alcohol and vodka. The community does not like these people, because their prosperity is only possible due to the growing problem of alcoholism in the village.
In contrast, poverty and non-material well-being can sometimes be found together. In rural Accompong in Jamaica the researchers write that ‘the lives of all citizens are impacted by this peace within the neighbourhood. Despite hard times and obvious poverty among most of the households an open welcome and hospitality to visitors and strangers to the community gives a distinct feeling of well-being and a good quality of life.’
Part II. Ill-being: The Bad Life The family was housed in a thatched hut and there was no way that they could have two square meals a day. The lunch would be finished by munching some sugarcane. Once in a while they would taste ‘sattu’ (made of flour), pulses, and potatoes, etc., but for special occasions only. During the rains the water used to pour down the thatched roof and the family would go to seek cover in the corners to avoid getting wet. Their clothing would be of coarse material and they would content themselves with one or two pairs of clothes for a year. The wages then used to be paid as 1kg of grain per day. After three years of marriage, unable to bear the harassment of the mother-in-law, both Nagina Devi and her husband separated from her. A poor mother, Manjhar, India
Ill-being and the bad life bring with them different sorts of bad experience. These are many and interwoven. Some correspond to the opposites of the clusters of well-being: lack and want are material; hunger, pain, discomfort, exhaustion and poverty of time are physical; bad personal relations, exclusion, rejection, abuse, isolation and loneliness are social; vulnerability and fear relate to insecurity; and helplessness, frustration and anger reflect powerlessness. It is also striking, though, how much of the bad life they miss, for there are others that flow from and feed them: loss, anguish, grief, humiliation, shame, and persistent anxiety, worry and mental distress. Box 7.2 features selections from poor people’s definitions and criteria of ill-being.
Well-being and Ill-being: The Good and the Bad Life 179
Box 7.2 Expressions of ill-being The words and expressions used for the bad life are naturally different in different language groups, countries and continents. A selection gives a sense of the range. Ill-being and well-being have close equivalents in Spanish-speaking Latin America – malestar and bienestar. Malestar is a common word in Spanish, meaning a sense of unease or discomfort, which can be physical, social or psychological. It is not a synonym for poverty (pobreza). In urban Argentina, the words situatión crítica (critical condition), vida complicada (a complicated life) and malaria (situation where everything has gone wrong, total scarcity) are also used. In Bolivia, tristeza (sadness), the opposite of felicidad (happiness), is used for illbeing, based on pictures of a sad face and a happy face, to which participants were invited to react. In Malawi, ukavu means a state of constant deprivation. It is explained that households described in this group lack peace of mind because they are always worried about how to make ends meet. In most ukavu households, couples quarrel and fight a lot because they desire good lifestyles (umoyo uwemi), but they lack the means. ‘It is not surprising that most men from these households are drunkards because they drink to forget home problems.’ Women from Mbwadzulu village in Malawi say that they consider it ill-being when ‘people sit on the floor … people going to their gardens without taking any food … they have no latrines; they cook under the sun [have no kitchen], have no pit latrines, no change house [bathing place outside the house, constructed from grass] and no plate drying rack’. In Buroa, Somaliland extreme ill-being is defined as the experience of war and famine. In India, the word dukhi (and in Bangladesh asukhi), the opposite of sukhi, is close to ill-being, unhappiness, a bad condition of life in terms of experience, whether material, social or psychological. In Chittagong, Bangladesh, ill-being is asukhi (unhappy) or kharap abstha (bad condition), the opposite of bhalo abstha (good condition). In Bulgaria, one aspect of ill-being is a pervasive sense of loss, of moving backward in time to an earlier century – from cultivation by tractors to having to cultivate by hand, from buying soap and bread to having to make and bake your own. This is described as going wild (podivyavane), being obliged to work in a manner considered humiliating, uncivilized and inefficient.
180 Poverty and Hunger
Box 7.3 The Bad Life in Ethiopia The following are literal translations of phrases used by poor men and women in Ethiopia to express their state of ill-being. ‘We are left tied like straw’ ‘Our life is empty; we are empty-handed’ ‘Living by scratching like a chicken’ ‘What is life when there is no friend or food’ ‘Life has made us ill’ ‘We are skinny’ ‘We are deprived and pale’ ‘We are above the dead and below the living’ ‘Hunger is a hyena’ ‘The poor is falling, the rich is growing’ ‘A life that cannot go beyond food’ ‘We simply watch those who eat’ ‘Difficulties have made us crazy’ ‘We sold everything we had and have become shelter-seekers’ ‘It is [like] sitting and dying alive’ ‘My relatives despise me and I cannot find them’ ‘Life is like sweeping ash’ ‘From hand to mouth’ ‘A life that is like being flogged’ ‘A life that makes you look older than your age’ ‘Just a sip and no more drop is left’ ‘If one is full, the other will not be full’ ‘Always calf, never to be bull’ ‘We have become empty like a hive’
The multidimensionality of ill-being As with well-being, participants describe ill-being as multidimensional. The most frequently mentioned dimensions of ill-being correspond closely to dimensions of well-being. The bad life is marked by many bad conditions, experiences and feelings. Box 7.3 illustrates the range of expressions that poor men and women from Ethiopia used to describe the bad life. Material lack and want Food The most frequently mentioned want or lack is food. In every country poor families report that they miss meals. They often only eat once a day and sometimes have nothing for days on end. A saying in Ethiopia is, ‘If one eats breakfast, there is no supper.’ Hunger is highly seasonal in rural areas. In urban Russia it peaks towards the end of the month, before pay, when there can be days with an absolute lack of food. In many rural areas the poorest people rely on wild foods. Provision of food for children is a constant worry for parents, who themselves stint and
Well-being and Ill-being: The Good and the Bad Life 181
starve. A mother in Nuevas Brisas del Mar, Ecuador says, ‘In the last two years our children leave for the school without having coffee. Sometimes I have some money but if I fix them some breakfast there is not enough for lunch.’ Urban starvation is less dramatic or obvious than that in rural areas, but poor people in Jamaica say it is more prevalent. In urban areas in countries that have undergone severe restructuring crises, study teams were shocked to learn of a quiet, hidden urban starvation. Some who starve are too proud and decent to beg or steal. In Ivanovo, Russia, ‘a woman told us that sometimes she did not have food for several days and was only drinking hot water and lying in bed so as not to spend energy’. In Ethiopia a 30-year-old married man in Kebele 10 says, ‘We eat when we have, and we go to bed hungry when we don’t.’ Livelihood, assets and money Uncertainty of livelihood sources and employment is virtually universal. Returns to work are low. Casual labour is both uncertain and badly paid. Insecurity from lack of assets and money is often mentioned, but more often implied. Money is needed for access to many services, especially health, education and transport; for bribes and fines; for daily necessities and often subsistence; for social occasions; and for clothing. Poor, ragged, second-hand and worn clothing is repeatedly given as a mark of being badly off. High-interest debt is common. Many needs and wants trace back to the lack of money. Housing and shelter Virtually everywhere, shelter and housing are a source of discomfort and distress. Shacks, huts, houses or tenements are small. Many people crowd into small spaces. Possessions are insecure. Huts and shanties leak and flood, fall down, blow down, burn down or are knocked down. People have to stand when the ground gets wet. Dirt, filth and refuse are always there. Urban sanitation is often non-existent or disgustingly bad. Sewers – where they exist – sometimes overflow and flood into huts, and health suffers as a result. Physical ill-being Hunger, pain and discomfort The physical ill-being of hunger and sickness, and the pain, stress and suffering they bring, are a common theme. Women in a group in Nigeria do not have sufficient breast milk to feed their babies. In Bedsa, Egypt an older man says, ‘Lack of work worries me. My children are hungry and I tell them the rice is cooking, until they fall asleep from hunger.’ In Ethiopia there is ‘burning hunger’ and ‘fire of hunger’. Poor people are more often sick and injured, and are often sick for longer, and treated, if at all, later than the non-poor. The reasons are many. Sickness itself is a frequent cause of suffering and impoverishment, leading to physical weakness, dependence and disability. Finally, poor people live in discomfort, in unhygienic, dangerous, dirty, badly serviced and often polluted environments where they are vulnerable to many physical shocks, stresses and afflictions.
182 Poverty and Hunger
Exhaustion and poverty of time The sheer exhaustion and lack of energy many poor people experience is easily overlooked. For many, their body is their main or only asset. It is uninsured. Shortage of food and sickness not only causes pain, but also weakens and devalues the asset. Those short of food are badly stressed by hard work. There are ‘lazy’ poor people, but inactivity is often conservation of energy. Poor people are often described as tired, exhausted and worn out. The increasing burdens of their expanded roles are driving many women deeper and deeper into physical exhaustion. These burdens also expose them to ‘time poverty’, meaning that they have little or no time to rest, reflect, enjoy social life, take part in community activities or spend time in spiritual activities. Whereas men are often increasingly out of work, women are under more pressure. Bad social relations: exclusion, rejection, isolation and loneliness Exclusion takes many forms. Ignorance of or lack of fluency in a dominant majority language can be excluding. Minority groups around the world share the linguistic exclusion of women in Guadalupe, Bolivia who do not participate in public community activities because they feel embarrassed to speak their native language, Quechua. Denial of education can be excluding. The parents of Um Mohamed, a girl in El Gawaber, Egypt, forced her to leave school: ‘They sentenced me to death when they did that.’ In Brazil there is exclusion when parents try to enrol their children in public schools and are unable to find places for them. Rejection is associated with poverty in many ways. The extremely poor are often rejected, even by those who are also poor. Two other forms of rejection are the abandonment of children and of old people. The feelings of rejection, isolation and loneliness are most often cruelly inflicted on those who suffer most in other ways. Loneliness and lack of social support are no longer an uncommon experience of poor people generally, particularly the elderly. Those with little social support are described as being ‘poor in people’. In rural Bulgaria, an old woman says, ‘Young people have nothing to do here. You can’t imagine how I feel, as lonely as the dawn, but I was the first to prompt them to move to the city. I would have felt even worse watching them waste their lives here.’ Old men in Mbamoi, Nigeria say, ‘We poor men have no friends. Our friend is the ground.’ This isolation is most acute for those who are very poor indeed and for those who are too weak to be able or to wish to assert themselves, especially the old. In Nuevas Brisas del Mar in urban Ecuador, where the team shared a meal with participants, an old man who had been present for three days and had hardly taken part at all was identified as ‘the voice of those without voice, the voice of hunger’. Self-exclusion occurs when inclusion is seen as dangerous or bad, and is a cost of a violent or abusive environment. Says a woman in Dock Sud, Argentina, ‘Now I am with my grandson. He is seven and the teachers in kindergarten tell me I have to let him be with other boys, but what for? To be a drug addict when he grows up? Here there are kids that are eight years old who do drugs, and after that they start
Well-being and Ill-being: The Good and the Bad Life 183
to rob. No, I’d rather see him alone, isolated, like they say in school, but I’d rather have him at home with me; I take care of him.’ Self-exclusion also occurs for reasons of shame. A poor person may not be invited to a wedding. If invited, a poor person may decide not to go because of being unable to appear and behave appropriately. Many of the self-excluded are the ‘invisible poor’, especially the ‘new poor’ who will not confess that they are poor. In a city in Bulgaria a poor man comments, ‘There was a man in our apartment building. A silent, shy fellow, always very neatly dressed. They found him dead in his apartment. The doctor said that he had become so feeble that he died of a common cold; they found just a piece of stale bread in his flat. It’s a pity we never spoke with him. He had dignity, that fellow.’ Insecurity, vulnerability, worry and fear
There’s great insecurity now. You can’t make any plans. For all I know, tomorrow I might be told that we’ll be laid off for a couple of months or that the factory is to shut down. We work three days a week even now, and you’re in for a surprise every day. Participant, discussion group of men and women, Kalofer, Bulgaria
I am going to be poor and even hungry if I cannot labour in the coming years due to old age. A resident, Ha Tinh, Vietnam
Insecurity and vulnerability are deeply embedded in the bad life. Insecurity comes through exposure to mishaps, stresses and risks – to dangers in the physical environment, in society, in the economy and in the administration and legal systems. Vulnerability comes because poor people are defenseless against damaging loss. Together these generate worry and fear: of natural disaster, of violence and theft, of loss of livelihood, of dispossession from land or shelter, of persecution by the police and powers that be, of debt, of sickness, of social ostracism, of the suffering and death of loved ones, of hunger and of destitution in old age. Lack of confidence is frequently mentioned as a result of poverty. In Bosnia and Herzegovina, the inability to find a job makes people feel worthless to themselves and their families. Powerlessness, helplessness, frustration and anger Again and again, powerlessness seems to be at the core of the bad life. In Russia it is articulated as a complete sense of political impotence. More generally, powerlessness is described as the inability to control what happens, the inability to plan for the future, and the imperative of focusing on the present. In Zawyet Sultan, Egypt the condition known as el-ghalban and ma’doom el hal, words used for the poorest,
184 Poverty and Hunger
mean helplessness and having no control over sources of one’s living and therefore no control over one’s destiny. Time horizons are then short. Young people in Kalofer, Bulgaria say, ‘Each day is unpredictable – you can’t make any plans, don’t know what you’re in for tomorrow.’ The sense of impotence is compounded when the future is seen as getting worse. Urban youth in Esmeraldas, Ecuador are reported as saying, ‘You can’t think of the future because you can only see how to survive in the present.’ The report continues to say that everybody in the group agrees that in the future there is only going to be more poverty. At this stage the facilitators had to stop the meeting because the youth got fed up. Poor people want to be able to take the long view, but they cannot. Having to live ‘hand to mouth’ is not a choice, but an immensely frustrating necessity. The experience is daily anxiety, and having to eat the moment they receive food or money. Worry about the future, especially the future of children, coexists with concerns for the immediate present. According to the report of an interview with a woman in Pedda Kothapalli, India, ‘She is worried about the future of her children and the struggles they have to face once they grow up. Her immediate concern is to which house she should go for a loan of some food grains for their food that day.’
Part III. Psychological Experience of Well-being and Ill-being The experience of well-being and ill-being is inextricably psychological. The dimensions of good and bad quality of life contribute to and are part of good and bad states of mind and being.
The experience of well-being: peace of mind, happiness and harmony Being well means not to worry about your children, to know that they have settled down; to have a house and livestock and not to wake up at night when the dog starts barking; to know that you can sell your output; to sit and chat with friends and neighbours. That’s what a man wants. A poor man, Bulgaria
Interwoven with other dimensions of well-being – material, bodily, social, security, and freedom to choose and act – is psychological well-being. This is variously expressed as happiness, harmony, peace, freedom from anxiety and peace of mind. From Novi Gorodok, Russia comes, ‘Well-being is a life free from daily worries
Well-being and Ill-being: The Good and the Bad Life 185
about lack of money’; from Gowainghat, Bangladesh, ‘to have a life free from anxiety’; from Nova Califórnia, Brazil that quality of life is ‘not having to go through so many rough spots’ and ‘when there is cohesion, no quarrels, no hard feelings, happiness, in peace with life’; from Nigeria, ‘well-being is found in those that have peace of mind, living peacefully. It is to be filled with joy and happiness. It is found in peace and harmony in the mind and in the community.’ For many, too, a spiritual life and religious observance are woven in with other aspects of well-being. Poverty itself could get in the way. An old woman in Bower Bank, Jamaica says, ‘I got up this morning and all I want to do is read my Bible, but I share a room with my son and my grandchildren and all they do is make noise, I can’t even get a little peace and quiet.’ In Padamukti, Indonesia being able to make the pilgrimage to Mecca means much, as does having sholeh (dutiful and respectful) children who will look after their parents in old age and pray for them after they are dead. In Chittagong, Bangladesh part of well-being is ‘always [being] able to perform religious activities properly’. For older women in Cassava Piece, Jamaica, their church gives them a spiritual uplift and physical support. The importance to poor people of their sacred place – holy tree, stone, lake, ground, church, mosque, temple or pagoda – is repeatedly evident from their comparisons of institutions in which these frequently ranked high, if not highest.
The experience of ill-being: humiliation, shame, anguish and grief Experiences of ill-being can be seen to combine and to compound each other in bad states of mind and being. Some connections stand out strongly. It is striking how often participants raise aspects of mental distress when describing the effects of poverty. Women in Tabe Ere, Ghana, for example, connect poverty, anxiety, begging, shame, isolation and frustration. They explain that poverty creates ‘too much pressure on individuals and often renders a person mad with worry and anxiety’. Begging is seen as a degrading activity, which brings about insult and disgrace to the family. This results in shyness within the community that in turn leads to frustration in life. Participants in different countries speak of mental stress and breakdown, depression, madness and suicide, together the antithesis of the well-being of peace of mind. Humiliation, shame and stigma The stigma of poverty is a recurring theme. As a consequence, poor people often try to conceal their poverty to avoid humiliation and shame. One deeply felt deprivation is not being able to do what is customary in the society. Frequently cited, for example, is not being able to entertain visitors or enjoy social life. In Malawi, there is shame from not having toilets for visitors, or money to buy a coffin for burying a relative. In Beisheke in the Kyrgyz Republic, an elderly village man says, ‘In the Soviet times we had no idea what poverty was about, we were equally wealthy, and now we feel humiliated because we cannot
186 Poverty and Hunger
afford to receive guests in our houses, or visit friends and relatives. It was for that reason that we could not invite you [the study team] to our house when we first met.’ Poor people sometimes feel shame and anger in accepting or having to accept alms or special treatment. In India this does not appear to apply to programmes that give poor people well-recognized rights, like the government ration shops. Similarly in Viyalagoda, Sri Lanka those who are poorer say it is a great help that their children are getting school books and uniforms: earlier their uniforms had been yellowish in colour after several washings and they were ashamed. Now their children can sit together with others without any shame. By giving books and uniforms instead of money, the government has done a great thing. By contrast, in Novy Gorodok, Russia even the most needy are humiliated to take poor quality goods provided for them by the welfare office. One participant commented, ‘[The food] is spoiled, and at prices higher than in the shops. I took a sack of flour once, and there were worms.’ Sexual abuse, with its physical violence as well as humiliation, is a greater threat for those in poverty, especially for women, given the places in which they live. In Dock Sud, Argentina most rapes are not reported because of shame. The same applies with sexual abuse, harassment and exploitation. In Bulgaria, a participant in a discussion group of women says, ‘Only young girls aged under 20 or 22 can find a job. If they are 25 or older, nobody wants them. I can do the job of a waitress perfectly well, but the boss wanted somebody who’d do another job for him just as well.’ Poor people often experience humiliation in their encounters with officials and those delivering services. In Chittagong, Bangladesh discussion groups report that ‘thana [administrative unit between the village and district level] officials are corrupt, unaccountable “to anyone” for their dishonest acts and only show “special respect” to the rich’. Colour prejudice is mentioned in Brazil and Ecuador. Appearances and clothes, as well as being an important part of physical wellbeing, are mentioned as important for self-respect and, conversely, they can be a source of shame. In Etropole, Bulgaria ‘people who cannot afford warm clothes for the winter go to work. Then they come back and stay at home under a pile of blankets, shivering with cold. They don’t go out. They are ashamed to meet other people. If they run into a friend and are invited for a drink they must refuse. So they would rather not go out at all.’ In the Kyrgyz Republic a middle-aged woman says, ‘My daughter came from school crying. Somebody at school called her a beggar, because she was wearing the jacket that we received as humanitarian aid. She refused to go to school.’ Anguish, loss and grief Anguish, loss and grief are implicit in so many life histories of poor people, and these speak through the pages of the case studies. Sickness and death are very frequent. Anguish, when loved ones are sick and treatment is known but cannot be afforded, is found in all societies, and not only among poor people. For many
Well-being and Ill-being: The Good and the Bad Life 187
participants, though, this experience is common, acute and agonizing, and for many it comes more and more often. Especially in Africa, the rising incidence of HIV/AIDS and malaria has combined with shrinking access to affordable treatment. Psychological ill-being is marked where there has been a sharp decline in the levels of living and well-being, and where people from former middle classes have become impoverished. This is most notable among the former middle classes in Bosnia and Herzegovina, Bulgaria, the Kyrgyz Republic, Russia and Uzbekistan who are now the ‘new poor’. The Bosnia and Herzegovina National Report speaks of ‘psychological ill health’ in all the communities. In one, the psychological effects of economic misery are listed as ‘one’s psychological health, distancing oneself or withdrawing from others, tensions between people, irritability, insecurity, apathy, nervousness, monotony, and dissatisfaction’. The burden of war and civil disturbance for those caught up in them is expressed in Bosnia and Herzegovina, for example, in Bijeljina, especially by anguished women whose husbands and sons were fighting. The trauma of refugees and others who have suffered from violence is an extreme form of mental distress. Instant impoverishment often combines with fear and the anguish of loss, especially when family members are at risk or have been killed. Just how terrible the effects can be is expressed by one older woman in Bijeljina: ‘I had to send a husband and two sons to the front lines and wait for them to return – or not. I did not think about eating, sleeping, dressing or anything. I would lie down and awake in tears. What have we lived to experience?’ For her, spiritual poverty is more devastating than her material poverty: ‘You can never recover from spiritual impoverishment.’ In the former Soviet region, participants express a profound sense of loss regarding their earlier level of living, when they had guaranteed jobs, free education and health care, social safety nets and recreation. Nostalgia is too weak a word to describe what they feel. At the same time, as with other loss and bereavement, they know it has gone forever. ‘Those who don’t feel sorry about the collapse of the Soviet Union have no heart, but those who think that it may be restored have no brain’, says an elderly man in the Kyrgyz Republic. Bald figures of life expectancy do not show what they mean in human terms. The horrors, separations and losses in war and civil disorder have become the commonplaces of journalism and television. The avoidable loss of loved ones in the quiet crisis of poverty is on a much larger scale, but unseen. The experience is worse when the bereaved are denied the last rites, grieving and consolation, which are customary and due in their society, because of the simple fact of their own poverty. The ill-being of children Parents are again and again preoccupied with securing a good life for their children. So the children’s own experience and view of the bad life have a double importance: for themselves as children and for adults as their parents and guardians.
188 Poverty and Hunger Table 7.1 Dislikes and fears of children in Ho Chi Minh City, Vietman Girls
Boys
•
•
• • • • • • • • • • • • • • • • • • • • • •
Having to drop out of school, special classes closing down My forthcoming school exams Fighting in the community Homeless people being cold during storms Drug addiction in the neighbourhood Gambling Loan sharks Leaking roofs in the neighbourhood Flooding of the neighbourhood and houses A dirty and polluted neighbourhood That our house might collapse Friends being too poor to afford new clothes Neighbourhood children dropping out of school and working hard Drunken men beating up their wives and children Quarrelling between my mother and father That my mother works too hard That my family might break up Having no money to buy rice Having no money to pay for rent or medical treatment Having nobody to look after me if my parents are sick Being robbed, break-ins and theft Having our house and neighbourhood cleared away The rich looking down on the poor people
• • • • • • • • • • • • • • • • • • • • • • • •
Sickness of teacher, causing class to close down Failing to move up a grade; having to repeat a class Sniffing heroin, drug addiction, young drug addicts stealing and robbing Gambling Fighting and quarrelling in the community Robbery, especially of dogs Street accidents happening to children Neighbourhood fires A dirty and polluted neighbourhood Prostitution among young people in the community Spread of AIDS Sickness of my family members or mother Fights and conflict between my mother and father Divorce of my parents; family splitting up My mother running off with another man Sale of our house to repay a debt Having our house demolished and cleared away Having a roof that leaks Having no house of our own; having to share a room with other families Having no money Being unable to get a job Rich people scolding the poor people they hire Richer families not allowing us to watch their TV Rich people living in luxury, not helping poor people Richer people looking down at us
In Ho Chi Minh City, Vietnamese children summarize their feelings about the consequences of being poor as deprivation and resentment (see Table 7.1). They resent that they cannot go to school or to the school they want, and that their parents have neither the time nor the money to take them on outings. Boys and girls over ten resent being scolded because of indebtedness and the failure to repay loans. The boys say that everyone in the family is working, but there is still not
Well-being and Ill-being: The Good and the Bad Life 189
enough to eat; that they have to accept beatings from others and can do nothing in return; and that they are always blamed when something is stolen. Boys under ten cannot have a birthday party like other children. Girls under ten are teased by richer children because they are poor. And girls over ten resent having to agree with richer people and act as their inferiors, even if what they [the rich people] say is wrong. The vivid directness of what girls and boys see and experience as the bad life is revealing. The Ho Chi Minh City report concludes that ‘what the young emphasize more than any other group … is the effect of poverty on the family itself. They see poor families as tense, conflictual and subject to break-down.’ It is perhaps no surprise that family harmony matters much to children, but worthy of note that they see a link between poverty and bad relations in the family. Also, both girls and boys mention the behaviour of the rich, and being looked on badly and being treated badly by them – something that adults, perhaps through prudence, mention only occasionally. For their part, the parents’ pain when they cannot provide for and look after their children is shown to be a big part of adult ill-being. In Muynak, Uzbekistan in the extreme of distress, there is an ultimate way out: ‘There are families who do not eat and drink in three days. People die of hunger. For example, Ayagan was a good guy. He could not provide his family with food, his children cried and then he shot himself.’
Reflections In understanding what a good experience of life is, there is perhaps no end, no final answer. But if development is to enhance the well-being of poor people in their own terms, there is much to reflect on in what they say. The discussions in Ethiopia generated the list of dire statements in Box 7.3. Yet one of the team leaders in Ethiopia, on approaching a very poor, remote community, heard singing and dancing. This can jolt us into recognizing that there are many good things, each in its own culture, which contribute to well-being: not only singing, dancing and music, but also festivals, ceremonies and celebrations; good things in their seasons; love, kindness and sacrifice; and religious and spiritual practices and experiences. But to many of those who are most deprived, these fulfillments are diminished or denied. The overarching questions are then whether, where and why human wellbeing is being enhanced or eroded; whether for many millions the singing and dancing are dying or renewing; whether the conditions for material, bodily, social, mental and spiritual well-being are improving or getting worse; and above all how to enable poor people to gain for themselves more of the good life to which they aspire.
8
Who Will Feed China? L. Brown
Overview: The Wake-up Call We often hear that the entire world cannot reasonably aspire to the US standard of living or that we cannot keep adding 90 million people a year indefinitely. Most people accept these propositions. Intuitively, they realize that there are constraints, that expanding human demand will eventually collide with the Earth’s natural limits. Yet, little is said about what will actually limit the growth in human demands. Increasingly, it looks as though our ability to expand food production fast enough will be one of the earlier constraints to emerge. This is most immediately evident with oceanic fisheries, nearly all of which are being pushed to the limit and beyond by human demand. Water scarcity is now holding back growth in food production on every continent. Agronomic limits on the capacity of available crop varieties to use additional fertilizer effectively are also slowing growth in food production. Against this backdrop, China may soon emerge as an importer of massive quantities of grain – quantities so large that they could trigger unprecedented rises in world food prices. If it does, everyone will feel the effect, whether at supermarket checkout counters or in village markets. Price rises, already under way for seafood, will spread to rice, where production is constrained by the scarcity of water as well as land, and then to wheat and other food staples. For the first time in history, the environmental collision between expanding human demand for food and some of the Earth’s natural limits will have an economic effect that will be felt around the world. It will be tempting to blame China for the likely rise in food prices, because its demand for food is exceeding the carrying capacity of its land and water resources, putting excessive demand on exportable supplies from countries that are living within their carrying capacities. But China is only one of scores of countries in this situation. It just happens to be the largest and, by an accident of history, the one that tips the world balance from surplus to scarcity. Analysts of the world food supply/demand balance have recognized that the demand for food in China would climb dramatically as industrialization accelerated Reprinted from Brown L. 2002. Who will Feed China? Earthscan, London. Chapters 1 and 2, pp23–43.
Who Will Feed China? 191
and incomes rose. They have also assumed that rapid growth in food production in China would continue indefinitely. But on this latter front, a closer look at what happens when a country is already densely populated before it industrializes leads to a very different conclusion. In this situation, rapid industrialization inevitably leads to a heavy loss of cropland, which can override any rises in land productivity and lead to an absolute decline in food production. Historically, there appear to be only three other countries that were densely populated in agronomic terms before industrializing – Japan, South Korea and Taiwan. The common experience of these three gives a sense of what to expect as industrialization proceeds in China. For instance, the conversion of grainland to other uses, combined with a decline in multiple cropping in these countries over the last few decades, has cost Japan 52 per cent of its grain harvested area, South Korea 46 per cent and Taiwan 42 per cent.1 As cropland losses accelerated, they soon exceeded rises in land productivity, leading to steady declines in output. In Japan, grain production has fallen 32 per cent from its peak in 1960. For both South Korea and Taiwan, output has dropped 24 per cent since 1977, the year when, by coincidence, production peaked in both countries. If China’s rapid industrialization continues, it can expect a similar decline.2 While production was falling, rising affluence was driving up the overall demand for grain. As a result, by 1994, the three countries were collectively importing 71 per cent of their grain. (See Figure 8.1.)3 Exactly the same forces are at work in China as its transformation from an agricultural to an industrial society progresses at a breakneck pace. Its 1990 area of grainland per person of 0.08ha is the same as that of Japan in 1950, making China one of the world’s most densely populated countries in agronomic terms. If China is
Source: See endnote 3.
Figure 8.1 Combined grain production, consumption and trade for Japan, South Korea and Taiwan, 1950–1994
192 Poverty and Hunger
to avoid the decline in production that occurred in Japan, it must either be more effective in protecting its cropland (which will not be easy, given Japan’s outstanding record) or it must raise grain yield per hectare faster during the next few decades than Japan has in the last few – an equally daunting task, considering the Japanese performance and the fact that China’s current yields are already quite high by international standards.4 Building the thousands of factories, warehouses and access roads that are an integral part of the industrialization process means sacrificing cropland. The modernization of transportation also takes land. Cars and trucks – with sales of 1.3 million in 1992 expected to approach 3 million a year by the decade’s end – will claim a vast area of cropland for roads and parking lots. The combination of continually expanding population and a shrinking cropland base will further reduce the already small area of cropland per person.5 At issue is how much cropland will be lost and how fast. Rapid industrialization is already taking a toll, as grain area has dropped from 90.8 million hectares in 1990 to an estimated 85.7 million in 1994. This annual drop of 1.26 million hectares, or 1.4 per cent – remarkably similar to the loss rates of China’s three smaller neighbours in their industrialization heyday – is likely to endure as long as rapid economic growth continues.6 China faces another threat to its food production that its three smaller neighbours did not. Along with the continuing disappearance of farmland, it is also confronted by an extensive diversion of irrigation water to non-farm uses – an acute concern in a country where half the cropland is irrigated and nearly fourfifths of the grain harvest comes from irrigated land. With large areas of north China now experiencing water deficits, existing demand is being met partly by depleting aquifers. Satisfying much of the growing urban and industrial demand for water in the arid northern half of the country will depend on diversions from irrigation.7 That China’s grain production might fall in absolute terms comes as a surprise to many. This is not the result of agricultural failure but of industrial success. Indeed, China’s record in agriculture is an exceptional one. Between 1950 and 1994, grain production increased nearly fourfold – a phenomenal achievement. After the agricultural reforms in 1978, output climbed in six years from scarcely 200 million tons to 300 million tons. With this surge, China moved ahead of the US to become the world’s leading grain producer. (See Figure 8.2.)8 Another way of evaluating China’s agricultural record is to compare it with that of India, the world’s second most populous country. Per capita grain production in China, which was already somewhat higher than in India, climbed sharply after agricultural reforms were launched in 1978, opening an impressive margin over its Asian neighbor. (See Figure 8.3.)9 Between 1978 and 1984, China did what many analysts thought was impossible: in just six years, it raised annual grain production from roughly 200kg per person to nearly 300kg. At 200kg, almost all grain is needed to maintain a minimal level of physical activity; an additional 100kg a year opens the way for convert-
Who Will Feed China? 193
Source: See endnote 8.
Figure 8.2 Grain production, US and China, 1950–1994
Source: See endnote 9.
Figure 8.3 Grain production per person, China and India, 1950–1994
ing some grain into pork, poultry and eggs. The immediate challenge facing China is not averting starvation, for it has established a wide margin between its current consumption level of 300kg and the subsistence level. Rather, the challenge is to maintain price stability in the face of soaring demand for food, driven by unprecedented advances in income.10 While China’s food production capacity is starting to erode as a result of its breathtaking pace of industrialization, its demand for food is surging. The country is
194 Poverty and Hunger
projected to add 490 million people between 1990 and 2030, swelling its population to 1.6 billion – the equivalent of adding four Japans. Because China’s population is so large, even a slow rate of growth means huge absolute increases. Yet these increases are only the beginning of the story.11 Even as population expands, incomes are rising at an unprecedented rate. Economic growth of 13 per cent in 1992 and again in 1993, of 11 per cent in 1994, and of an estimated 10 per cent in 1995 adds up to a phenomenal 56 per cent expansion of the Chinese economy in just four years. Never before have incomes for so many people risen so quickly.12 This rapid economic expansion promises to push demand for food up at a record rate. When Western Europe, North America and Japan began establishing modern consumer economies after World War II, they were home to some 340 million, 190 million and 100 million people, respectively. By contrast, China is entering the same stage with a population of 1.2 billion and an economy that is expanding twice as fast. If its rapid economic growth continues, China could within the next decade overtake the US as the world’s largest economy.13 Past experience has not prepared us well for assessing the scale of China’s future food demand. Multiplying 1.2 billion times anything is a lot. Two more beers per person in China would take the entire Norwegian grain harvest. And if the Chinese were to consume seafood at the same rate as the Japanese do, China would need the annual world fish catch. As incomes rise, one of the first things that low-income people do is diversify their diets, shifting from a monotonous fare in which a starchy staple, such as rice, supplies 70 per cent or more of calories to one that includes meat, milk and eggs. As consumption of pork, beef, poultry, eggs, milk and other livestock products increases along with income, grain requirements rise rapidly.14 In neighbouring Japan, the soaring demand for grain driven by prosperity combined with the heavy loss of cropland since mid-century pushed dependence on grain imports to 72 per cent of total grain consumption in 1994. These same forces are now at work in China. It is one thing for a nation of 120 million people to turn to the world market for most of its grain. But if a nation of 1.2 billion moves in this direction, it will quickly overwhelm the export capacity of the US and other countries, driving food prices upward everywhere.15 The first signs of a growing imbalance between the demand and supply for grain in China became evident in early 1994. In February, grain prices in China’s 35 major cities had jumped 41 per cent over the same month in 1993. In March, driven by panic buying and hoarding, the rise continued unabated. In response, the government released 2.5 million tons of grain from stocks to check the runaway increase in prices. This calmed food markets, but only temporarily. By October, grain prices were 60 per cent higher than a year earlier. More grain reserves were released, and the government banned trading in rice futures on the Shanghai Commodity Exchange. Speculators were driving futures prices upward, leading to panic among urban consumers. The 1994 inflation rate of 24 per cent – the worst since modern China was created in 1949 – was largely the result of rising food prices.16
Who Will Feed China? 195
Resisting the import of grain throughout most of 1994, Beijing let prices rise as much as possible to encourage farmers to stay on the land. In recent years an estimated 120 million people, mostly from the interior provinces, have left the land and moved to cities in search of high-paying jobs. This rootless, floating population, roughly the size of Japan’s, wants to be part of the economic revolution. As a potential source of political instability, these migrants are a matter of deep concern in Beijing. The government is trying to maintain a delicate balance, letting the price of grain rise enough to keep farmers on the land but not so much that it creates urban unrest that could lead to political upheaval.17 Leaders in Beijing are also trying to deal with massive unemployment and underemployment, with much of the latter masked by villagers eking out a meager existence on tiny plots of marginal land. Creating enough jobs to employ productively an estimated 800 million workers depends on maintaining double-digit or near double-digit rates of economic growth. The government opened the country up to foreign investment in part because it was the only way to get the capital and technology needed to achieve this vital goal.18 If China holds together as a country and if its rapid modernization continues, it will almost certainly follow the pattern of Japan, South Korea and Taiwan, importing more and more grain. Its import needs may soon far exceed the exportable supply of grain at recent prices, converting the world grain economy from a buyer’s market to a seller’s market. Instead of exporters competing for markets that never seem large enough, which has been the case for most of the last half-century, importers will be fighting for supplies of grain that never seem adequate.19 In an integrated world economy, China’s rising food prices will become the world’s rising food prices. China’s land scarcity will become everyone’s land scarcity. And water scarcity in China will affect the entire world. In short, China’s emergence as a massive grain importer will be the wake-up call that will signal trouble in the relationship between ourselves, now numbering 5.7 billion, and the natural systems and resources on which we depend. It may well force a redefinition of security, a recognition that food scarcity and the associated economic instability are far greater threats to security than military aggression is. The chapters that follow analyse this transformation, explaining why and how it is likely to come about.20
Another Half-billion As Chinese leaders analysed future population, land and water trends some 20 years ago, they realized that they had to choose between the reproductive rights of the current generation and the survival rights of the next generation. What separates the government in Beijing from those in many other countries is that it is desperately trying to protect the options of the next generation, politically difficult
196 Poverty and Hunger
Source: See endnote 21.
Figure 8.4 Population of China, 1950–94, with projections to 2050
though that may be. This farsightedness and the political courage of the government of China deserve recognition. In 1982, China’s population reached 1 billion, making it the first member of an exclusive club. By 2017, its population is projected to reach 1.5 billion – equal to the world’s entire population in 1900. Its demographic growth is then expected to slow and its population to peak at 1.66 billion in 2045, after which it should start to decline slowly. (See Figure 8.4.)21 Looked at in terms of the last four decades and the next four, the magnitude of China’s population growth becomes clear. From 1950 to 1990, China added 571 million people. From 1990 to 2030, it is projected to add 490 million more. This anticipated addition reflects an impressive slowing in the rate of population growth, but it is still nearly a half-billion people. Stated otherwise, during the next four decades China will be adding an average of roughly 12 million people to the world annually.22 Many people think of Asia and Europe as having similar population densities, but in reality Asia has many more people per hectare of grainland than Europe does. The grainland per person in China today is roughly half that in France and it is inherently less fertile. The other difference is that Europe’s population has stopped growing. Now that the growth in grain use per person that accompanied rising incomes has also come to an end, the demands made by the region’s population on its land and water resources have stabilized. Europe is living well within its food production capability or, in ecological terms, its food carrying capacity. Indeed, it is producing a modest grain surplus.23 In geographic area, China and the US are essentially the same size. The big difference is that the western half of China is largely inhospitable to human habita-
Who Will Feed China? 197
tion. Lacking basic life-supporting soil and water resources, it contains only a small percentage of the country’s people. For China, where the opportunity for bringing new land under cultivation is limited by water scarcity, population growth has a double-edged effect. First, it is shrinking the cropland area per person, as a fixed area is divided among an ever larger number of people. At the same time, the new citizens bring demands for living space, which in turn generates pressure to convert cropland to residential purposes. Simply housing an additional 490 million people in the next 40 years will require an enormous area, some of which will be cropland.24 There is a certain fascination with the demographic trends and issues of China partly because of its sheer size. In addition, the chaos of the Great Leap Forward and the arithmetic of the resulting famine that was long concealed from the outside world have intensified interest in China’s demographic history. In the late 1950s, during the Great Leap Forward, millions of farmers were diverted to large construction projects, including roads, huge earthen dams and backyard steel furnaces. This movement of labour from agriculture led to massive food shortages. Official records now show that 30 million Chinese starved to death during 1959–1961. The demographic effect of the famine, however, extended far beyond these deaths.25 In populations that are near starvation, the frequency of intercourse decreases, sharply reducing the number of possible pregnancies. Beyond this, severely malnourished women cease ovulating, thus further reducing the number of pregnancies. Women who do conceive when they are severely malnourished often miscarry.26 During the heart of the famine in 1960, the number of deaths in China actually exceeded the number of births. The birth rate fell to 21 per 1000 population
Source: See endnote 27.
Figure 8.5 Crude birth and death rates in China, 1950–1994
198 Poverty and Hunger
Source: See endnote 28.
Figure 8.6 Annual addition to world population, 1950–1994
while the death rate climbed to 25 per 1000, leading to a decline in China’s population for one year. (See Figure 8.5.)27 The drop was so steep that it markedly affected the number of people added to world population. (See Figure 8.6.) Between 1950 and 1957, that number was increasing steadily, climbing from 39 million to 57 million. It then began to drop, reaching a low of 41 million in 1960. As China recovered from the famine, the annual addition climbed sharply to 70 million in 1962, recovering the trend that had existed before the famine.28 The Great Famine of 1959–1961 left an indelible imprint on China’s national psyche. John Bermingham, president of the Colorado Population Coalition, observes that ‘just as an American generation was seared by the Great Depression and a German generation by runaway inflation, the Chinese have had a generation seared by famine’. These analogies help us understand the effect of the Chinese famine, but the latter was more traumatic simply because it was life-threatening for such a vast number of people.29 Like many governments, China was slow to recognize the population threat. Socialist ideology made it easy to dismiss the problem. As demographer Michael Teitelbaum notes, ‘For Marx, the fact that people were producers as well as consumers meant that the resource limits emphasized by the classical economists could arise under capitalism, but not under socialism.’30 A quarter-century after the communist takeover in 1949, the government began to recognize population growth as a matter of concern. This occurred as part of the post-Mao reassessment in which projections of China’s population growth were made. Much to the dismay of officials, based on an assumption of two children per couple, China could expect to add the better part of 1 billion people, adding the equivalent of an India to its existing population.31
Who Will Feed China? 199
As analysts attempted to calculate the consequences of population increase for cropland and water supply per person, and the availability of capital for creation of jobs, they realized that this was not a viable proposition. They were then confronted with one of the most politically difficult challenges for any government: the need to shift to a one-child family. China faces some unique and difficult demographic issues. In contrast to Europe, there is no meaningful emigration safety valve. For countries such as England, Ireland, Germany, Italy and Spain, mounting population pressure during their early development translated into a steady flow of migrants, many of them bound for the New World. Today, there are more people of Irish extraction in the US than in Ireland. Similarly, there are more Spanish descendants in Latin America than in Spain. Indeed, the New World is populated largely with the demographic overflow of Europe.32 The mounting population pressures in China today are occurring in a world far different from that of a century or two ago. No sparsely settled, habitable areas still exist. No country or group of countries wants to entertain the idea of absorbing 12 million Chinese each year. Trying to put the brakes on population growth in China has not been easy. The government in Beijing, like those in many other developing countries, waited too long before implementing a meaningful effort to reduce family size. Faced with a trade-off between smaller families in the present or deteriorating living conditions in the future as population pressures mounted, Chinese leaders opted in 1979 for the one couple/one child policy. This policy, which explicitly reflects the interests of future generations, has run into heavy resistance. One source of difficulty has been a strong preference for male children, a desire so powerful, particularly in rural areas, that it has led to widespread female infanticide. In each annual cohort, males outnumber females until age 64; thereafter, females outnumber males. The conflict between local officials trying to implement this policy and couples intent on having more than one child has led, not surprisingly, to charges of coercion. It illustrates all too well the political conflicts that can develop within a society that is overrunning its human carrying capacity.33 Implementing the one-child-family policy has become more difficult in recent years. Job seekers migrating from countryside to city can more easily evade official monitoring of family size. Some families are becoming so affluent that they can readily pay the stiff penalty for having additional children. Moving quickly from a situation of rapid population growth to one of population stability has proved to be politically challenging to say the least.34 Nevertheless, it is possible to consider a scenario that would stabilize population size in China well below the 1.66 billion peak projected for 2045. The 1990 population pyramid, which gives the size of various age groups in the population, shows two age groups that are unusually small. (See Figure 8.7.) The first group, those who are 30–34 years of age, was reduced by the famine of 1959–1961. The second, smaller group – those 10–14 years of age – shows the effect of family plan-
200 Poverty and Hunger
Source: See endnote 35.
Figure 8.7 Age pyramid of China’s population, 1990
ning programmes adopted in the mid-1970s and the echo effect of the smaller numbers born during the famine reaching reproductive age. If China can sustain its one-child-family programme when the people born between 1975 and 1986 reach childbearing age, its population size could stabilize sooner rather than later, and far short of the projected 1.66 billion.35 In 1993, the Population Reference Bureau (PRB) pointed out that China had succeeded in lowering its fertility below replacement level – that is, the total number of children per woman was 2 or fewer. This was achieved within two decades of launching family planning programmes.36 Carl Haub, senior demographer at PRB, noted that the birth rate was 21.1 per 1000 population in 1990 and that it dropped to 19.7 in 1991 and to 18.2 in 1992. Since then the decline has continued, reaching 17.7 in 1994. This reduced China’s population growth rate to 1.1 per cent, roughly the same as that of the US. The drop in China’s population growth rate from 2.7 per cent in 1970 to 1.1 per cent in 1994 has played a key role in lowering the global population growth rate during that time from 2.1 per cent to 1.6 per cent.37 Recognizing the urgency of stabilizing population size, China’s President and Communist Party chief, Jiang Zemin, renewed the call for one couple/one child in March 1995. Concern with the environmental, economic and social effects of continuing population growth in China runs deep. President Jiang pointed out that ‘the rapid increase in a big population base has a direct bearing on the problems of food, of jobs, of education, of resource destruction, of environmental protection and an imbalanced ecology.’ Increasingly, Chinese leaders are becoming aware of the environmental consequences of the combined effect of population growth and rising affluence that their country is experiencing.38
Who Will Feed China? 201
Notes Overview: The Wake-up Call 1 2 3 4
5
6 7
8 9 10 11
12 13 14 15 16
17 18 19 20
US Department of Agriculture (USDA), Economic Research Service (ERS), ‘Production, Supply, and Demand View’ (electronic database), Washington DC, November 1994. Ibid. Figure 8.1 from ibid., with 1950–1959 figures from USDA, ERS, ‘World Grain Database’ (unpublished printout), Washington DC, April 1989. USDA, op. cit. note 1; USDA, op. cit. note 3; US Bureau of the Census, as published in Francis Urban and Ray Nightingale, World Population by Country and Region, 1950–90 and Projections to 2050 (Washington DC: USDA, ERS, 1993). Patrick E. Tyler, ‘China Planning People’s Car to Put Masses Behind Wheel’, New York Times, 22 September 1994; Nicholas D. Kristof and Sheryl WuDunn, China Wakes (New York: Random House, 1994). USDA, op. cit. note 1, with updates from USDA, ERS, ‘World Agriculture Production’, Washington DC, March 1995. Irrigated area from USDA, ERS, ‘China Situation and Outlook Series’, Washington DC, July 1993, and from UN Food and Agriculture Organization (FAO), Production Yearbooks (Rome: various years); Professor Xu Zhifang, President, Chinese National Committee on Irrigation and Drainage, speech for the World Water Council-Interim Founding Committee, Montreal Canada, 31 March 1995. Figure 8.2 from USDA, op. cit. note 1, and from USDA, op. cit. note 3. Figure 8.3 from USDA, op. cit. note 1, from USDA, op. cit. note 3, and from Bureau of the Census, op. cit. note 4. Per capita figures from USDA, op. cit. note 1, and Bureau of the Census, op. cit. note 4. Bureau of the Census, op. cit. note 4; population of Beijing from United Nations, Estimates and Projections of Urban, Rural, and City Populations 1950–2025: The 1982 Assessment (New York: 1985). Kristof and WuDunn, op. cit. note 5; International Monetary Fund, World Economic Outlook October 1994 (Washington DC: 1994). Bureau of the Census, op. cit. note 4. FAO, Food Balance Sheet 1988 (Rome: 1989). USDA, op. cit. note 1; Bureau of the Census, op. cit. note 4. Sheila Tefft, ‘A Shrinking Rice Bowl in China: Rising Food Prices Spur Unease’, Christian Science Monitor, 19 January 1995; Gao Anming, ‘Experts Note Reasons for Hikes in Grain Prices’, China Daily, 6 January 1995; Martin Wolf, ‘Zooming in on the Threat of Inflation’, Financial Times, 7 November 1994; ‘China to Buy More Wheat, Corn From US, Traders Say’, Journal of Commerce, 19 January 1995; ‘China Restricts Trading in Shanghai Rice Futures’, Journal of Commerce, 26 October 1994; Joseph Kahn, ‘China Fails to Curb Its Runaway Growth’, Wall Street Journal, 3 January 1995. World Bank, China: Strategies for Reducing Poverty in the 1990s (Washington DC: 1992). Peter Hannam, ‘China Seen Facing Choice: Inflation or Unemployment’, Journal of Commerce, 27 September 1994. USDA, ‘Grain: World Markets and Trade’, Washington DC, various issues. Population Reference Bureau, 1994 World Population Data Sheet (Washington DC: 1994).
202 Poverty and Hunger
Another Half-billion 21 Figure 8.4 from US Bureau of the Census, as published in Francis Urban and Ray Nightingale, World Population by Country and Region, 1950–90 and Projections to 2050 (Washington DC: US Department of Agriculture (USDA), Economic Research Service (ERS), 1993); 1900 world population from United Nations, The Future Growth of World Population (Rome: 1958). 22 Bureau of the Census, op. cit. note 21. 23 Grainland per capita calculated with population from Bureau of the Census, op. cit. note 21, and grain area from USDA, ERS, ‘Production, Supply, and Demand View’ (electronic database), Washington DC, November 1994; grain trade data from ibid. 24 Population from Bureau of the Census, op. cit, note 21. 25 Susan Cotts Watkins and Jane Menken, ‘Famines in Historical Perspective’, Population and Development Review, December 1985. 26 Ibid. 27 Figure 8.5 from United Nations, Monthly Bulletin of Statistics, February 1994. 28 Figure 8.6 from US Bureau of the Census, Center for International Research, Suitland, MD, pers. comm., 6 February 1995. 29 John R. Bermingham, ‘China’s Population Puzzle’, Colorado Population Coalition, Denver, CO, Fall 1994. 30 Michael S. Teitelbaum, ‘The Population Threat’, Foreign Affairs, Winter 1992/93. 31 India’s population from Bureau of the Census, op. cit. note 21. 32 Aaron Segal, An Atlas of International Migration (London: Hanz Zell Publishers, 1993). 33 Zha Ruichuan and Qiao Xiachun, ‘A Study of the Age Structure of China’s Population’, China Population Today, December 1992; Steve Mufson, ‘Chinese Leader Presses for “One Couple, One Child’’’, Washington Post, 21 March 1995. 34 Mufson, op. cit. note 33. 35 Population projection from Bureau of the Census, op. cit. note 21; Figure 8.7 from Zha and Qiao, op. cit. note 33. 36 Carl Haub, ‘China’s Fertility Drop Lowers World Growth Rate’, Population Today, June 1993. 37 Ibid.; Carl Haub, Population Reference Bureau, Washington DC, pers. comm., 19 April 1995. 38 Jiang quoted in Mufson, op. cit. note 33.
9
Introduction to Ecoagriculture J. McNeely and S. Scherr
The Challenge: Agricultural Intensification, Rural Poverty and Biodiversity Many ecologists fear that the world is poised on the brink of the largest wave of wild species extinctions since the dinosaurs disappeared 65 million years ago. If current trends continue, we could lose or greatly reduce populations of 25 per cent of the world’s species by the middle of this century. Since global awareness of this crisis emerged in the late 1970s, conservationists have focused on protecting endangered species and endangered habitats primarily through the establishment of protected areas. Nearly 10 per cent of the Earth’s land is now officially protected, and land purchases to create private reserves are expanding such areas. Agricultural production areas, by contrast, have been largely ignored by conservationists. These areas were assumed to have habitat conditions so radically modified from their original state that their potential contribution to biodiversity conservation could only be marginal. Permanent croplands were estimated in the early 1980s to account for only 12 per cent of global land area, so conservation efforts were understandably focused elsewhere (apart from widespread efforts to limit farmland conversion). Part I [of Ecoagriculture] draws on new global data to argue that in this new century food and fibre production – both that produced by agriculture (domesticated crops, livestock, trees and fish) and harvested from natural systems (forests, grasslands and fisheries) has come to be the dominant influence on rural habitats outside the arctic, boreal, high mountain and desert ecoregions. Growing human populations, increasing demand for food and fibre products, and growing concern about rural poverty mean that agricultural output must necessarily expand for at least several more decades until the rate of human population growth begins to stabilize, or even begins to decline (as it already has in some eastern European countries). Adequate growth in supply is by no means assured, especially in areas where productivity is limited by poor soils, difficult climates and insufficient water. Reprinted from Ecoagriculture by Jeffrey A McNeely and Sara J Scherr. Copyright © 2003 Island Press. Reproduced by permission of Island Press, Washington DC.
204 Poverty and Hunger
Indeed, the World Bank says that billions of people are at risk of serious food insecurity and deepening poverty. Future economic development in the poorest and most biodiversity-rich countries will depend heavily on agriculture and natural resource management that continue to enhance productivity and adapt to changing conditions. Agriculture will remain economically and socially important. Even industrialized countries cannot reasonably expect to save biodiversity at the expense of agricultural output and incomes, much less the developing countries of the tropics. Rather, the challenge is to conserve biodiversity while maintaining or increasing agricultural production. Protected areas will remain a critical element of any conservation strategy, but this book [Ecoagriculture] stresses that it is essential to focus greater conservation effort on the large areas under agricultural use. During the 20th century we humans witnessed momentous economic, social and technological changes. New technologies such as automobiles, airplanes, container ships, telephones and computers profoundly affected our way of life, enabling us to escape reliance on local ecosystems and become part of a global economy. Radio, movies and television transformed the way we related to one another and to the world. Public health systems and education became much more widespread, and material wealth – even in the poorest of countries – reached levels inconceivable at the beginning of the century. Our population more than quadrupled, from 1.4 billion in 1900 to more than 6 billion in 2000. As a species, we had a very good century in many ways. Our 20th-century prosperity was fuelled in part by a constantly growing supply of food, enabling us not only to feed a rapidly growing population, but also to amass food surpluses on a scale never before reached. Based on improved seeds, widespread use of agricultural chemicals, modern farm machinery and better transportation systems, agricultural production soared. In the past decade alone, production of cereal crops increased by 17 per cent, roots and tubers by 13 per cent, meat by 46 per cent and marine fish by 17 per cent (World Resources Institute, 2002). With such impressive gains on so many fronts, why should we worry about the 21st century? First, although more people are consuming more food than ever before, inequity is increasing as well: some parts of the world suffer from growing overconsumption while others go hungry. The World Bank estimates that some 800 million people remain undernourished, in large part because they cannot access the food that is produced. That number is likely to grow because the world’s population increases by 75–85 million people each year. Some experts suggest that in 30 years we will need at least 50–60 per cent more food than we produce now, in order to meet global food demand and enjoy at least a modest degree of greater affluence. If that food is to be accessible to the rural poor, then much of it must be produced where they live, and in ways that increase both their consumption and income. Yet food-producing systems throughout the world are already stressed by eroding soils, declining freshwater reserves, declining fish populations, deforestation, desertification, natural disasters and global climate change. These and various
Introduction to Ecoagriculture 205
other factors are making it increasingly difficult to maintain, much less increase, food production in many areas of the world. What is more, the impressive gains for our species have often come at the expense of other species with whom we share our planet. The main victim of our affluence has been wild biodiversity – the non-domesticated portion of our planet’s wealth of genes, species and ecosystems. Agricultural production has converted highly diverse natural ecosystems into greatly oversimplified ecosystems, led to pollution of soils and waterways, and hastened the spread of invasive alien species. According to Heywood and Watson (1995), ‘over-whelming evidence leads to the conclusion that modern commercial agriculture has had a direct negative impact on biodiversity at all levels: ecosystem, species, and genetic; and on natural and domestic diversity’. While major investments continue to improve agricultural productivity in centres of surplus commercial production, the needs of the rural poor tend to be ignored. As a result, the poor struggle to survive, managing their resources to meet immediate needs rather than invest in a more secure future. Many of these poor people live in areas remote from modern agricultural development but close to habitats supporting the greatest wild biodiversity. Often they have little choice but to exploit these habitats for survival. Without urgent action to develop the right kind of agriculture, wild biodiversity will be further threatened. The resulting destruction of natural habitats will deprive both local people and the global community of important benefits such as food, fodder, fuel, construction materials, medicines and genetic resources, as well as services such as watershed protection, clean air and water, protection against floods and storms, soil formation and even human inspiration. These threats to biodiversity pose a major dilemma for modern society. On the one hand, modern intensive agriculture has made it possible for the expanding human population to eat more food. On the other hand, agriculture is now spreading into the remotest parts of the world, often in destructive forms that further reduce wild biodiversity and undermine the sustainability of the global food production system. At the same time, reducing biodiversity and simplifying ecosystems can undermine local livelihoods by destabilizing ecosystem services. Recent mud slides in several Latin American countries, floods in Bangladesh and droughts in southern Africa are all ‘natural’ phenomena made into a disaster for local people due at least in part to loss of biodiversity. This situation has led many in the environmental community and the general public to promote the establishment of protected areas where human use – in particular agricultural use – is supposed to be greatly restricted. While such management measures clearly are needed to preserve many types of wild biodiversity, they face many challenges. Some centres of the greatest or most valued wild biodiversity are being surrounded by areas of intensive agricultural production and high rural population densities. In some areas, large human populations preclude the establishment of extensive reserves, so the protected areas tend to be too small to support viable populations of the species they are designed to protect. In these human-dominated ecosystems, conservation action in isolated protected areas is doomed to fail, unless
206 Poverty and Hunger
fundamental changes also take place in the adjacent agricultural landscape. Moreover, some types of wild biodiversity, such as some species of birds and butterflies, actually thrive best in farmed and populated landscapes. Farming is a practice that extends at least 10,000 years back into human history, and many species of plants and animals have evolved in concert with the development of agriculture. Some species of large mammals (especially wild cattle in Asia) may even depend on shifting cultivation (Wharton, 1968). Aggressive efforts to conserve wild biodiversity have sometimes reduced the livelihood security of rural people, especially the poor in developing countries (Pimbert and Toledo, 1994). But this need not be the case (McNeely, 1999). Rural populations historically have established conservation practices to protect environmental services important to their own food production, water supply and spiritual values (see, for example, Western and Wright, 1994; Singh et al, 2000). Examples show that managing biodiversity through a combination of conservation measures and improved and diversified agricultural systems can increase incomes and household nutrition, reduce livelihood risks and provide collateral benefits such as increased freshwater reserves and fewer mud slides after heavy rains. Thus new models for biodiversity conservation need to be developed, involving effective links among the fields of farmers, the pastures of ranchers, the managed forests of foresters and the protected areas managed especially for wild biodiversity. Conservation options are available besides just ‘locking away’ resources on which the poor depend for their survival and assets that low-income countries could use to promote development and national food security. Agricultural landscapes can be designed more creatively to take the needs of local people into account while pursuing biodiversity objectives.
Ecoagriculture A central challenge of the 21st century, then, is to achieve biodiversity conservation and agricultural production goals at the same time – and, in many cases, in the same space. In this book [Ecoagriculture] the management of landscapes for both the production of food and the conservation of ecosystem services, in particular wild biodiversity, is referred to as ecoagriculture. For a start, improved natural resource management and technological breakthroughs in agriculture and resource use is essential to enhance our ability to manage biodiversity well. Genetic improvements in the major agricultural crops that feed the world will continue to be essential for maintaining and increasing productivity. But a much wider range of genetic, technological, environmental management and policy innovations must be developed to support wild biodiversity in the world’s bread baskets and rice bowls as well as in the extensive areas where food production is more difficult. Diverse approaches to make agriculture more sustainable, while also more productive, are flowering around the world; many of these reduce the negative effects
Introduction to Ecoagriculture 207
of farming on wild species and habitats. Such approaches need to be integrated more intentionally with conservation objectives, particularly in biodiversity ‘hotspots’ (Myers, 1988) and areas where the livelihood of the poor depends on ecosystem rehabilitation. New approaches to agricultural production must be developed that complement natural environments, enhance ecosystem functions and improve rural livelihoods. While trade-offs between agricultural productivity and biodiversity conservation often seem stark, some surprising and exciting opportunities exist for complementarity. Local farmers and institutions, such as universities and agricultural research centres, are leading the way through active experimentation and adaptation of existing knowledge. But more targeted research on ecoagriculture is needed, and such research must be considered a global priority if major advances are to occur. Environmental and agricultural researchers must learn to work closely together to resolve existing conflicts between natural biodiversity and agricultural production in different ecoregions and under different management systems. This book examines some of the current linkages between wild biodiversity and agriculture. It suggests strategies for improving agriculture while maintaining or enhancing wild biodiversity, assesses dozens of systems where this is already being done and describes how research and policy action can contribute to conserving wild biodiversity. The book is structured in three parts. The first part describes the challenge of reconciling conservation and agricultural goals in areas important for both. The second part discusses the ecoagriculture approach and presents diverse case studies illustrating key strategies. The third part explores how policies, markets and institutions can be reshaped to support ecoagriculture in areas that are hotspots for both biodiversity and food security. The emphasis here is on tropical regions of the developing world, where increased agricultural productivity is most vital for food security, poverty reduction and sustainable development, and where so much of the world’s wild biodiversity is threatened. But the book also highlights lessons learned in developed countries (for example, California Wilderness Coalition, 2002) where these are of wider relevance. While profitable ecoagriculture systems can and must be developed for large-scale commercial farming enterprises that are operating in areas of threatened biodiversity, most examples in this book emphasize strategies for smallscale, low-income farmers involved in commercial or subsistence production. The biodiversity of domesticated crop and livestock species, and the complex of wild species that directly support agriculture (such as wild pollinators), is also critically important to future prosperity and is also suffering from numerous threats. This book will address how increased agricultural diversity can enhance habitat for wild species, and how strategies to enhance wild biodiversity can build on the beneficial effects of many wild species for agricultural production and sustainability. However, it will not address the topic of genetic diversity of domesticated agricultural species, which has recently begun to receive wide attention from ministries of agriculture and the many agencies that support them (Gemmill, 2002).
208 Poverty and Hunger
As the distinguished British ecologist Norman Myers pointed out, ‘It is in the common interest of both agriculture and the natural world that a mutually supportive relationship be developed between them. Production of food need not destroy the wild ecosystems of the world and their wealth of biological diversity. And preservation of wild ecosystems does not pose a threat to humanity feeding itself. In fact, just the opposite is true. Sensible use of nature, which includes substantially increased nature conservation efforts, is essential to feed the planet… Nature equals food. Without wild places, we cannot hope to have food on our tables’ (Myers, 1987). And without healthy agriculture, we cannot expect nature to prosper.
References California Wilderness Coalition. 2002. Wild Harvest: Farming for Wildlife and Profitability. A report on Private Land Stewardship. California Wilderness Coalition, endorsed by Wild Farm Alliance, Defenders of Wildlife, Community Alliance With Family Farmers and California Sustainable Agriculture Working Group, July Gemmill B. 2002. Managing Agricultural Resources for Biodiversity Conservation: A Guide to Best Practices. Produced with the support of the UNEP/UNDP GEF Biodiversity Planning Support Programme. Environment Liaison Centre International, Nairobi. Draft Heywood V H and Watson R T (eds). 1995. Global Biodiversity Assessment. Cambridge University Press, Cambridge McNeely J A. 1999. Mobilizing Broader Support for Asia’s Biodiversity: How Civil Society Can Contribute to Protected Area Management. Asian Development Bank, Manila Myers N. 1987. Tackling Mass Extinction of Species: A Great Creative Challenge. The Horace M. Allbright Lecture in Conservation. University of California, Berkeley Myers N. 1988. Threatened Biotas: ‘Hotspots’ in Tropical Forests. Environmentalist 8(3), 1–20 Pimbert M P and Toledo V. 1994. Indigenous People and Biodiversity Conservation: Myth or Reality? EthnoEcologia 2(3), 1–96 Singh S, Sankaran V, Mander H and Worah S. 2000. Strengthening Conservation Cultures: Local Communities and Biodiversity Conservation. UNESCO, Paris Western D and Wright R M (eds). 1994. Natural Connections: Perspectives in Community-based Conservation. Island Press, Washington DC Wharton C. 1968. Man, Fire, and Wild Cattle in Southeast Asia. Proceedings of the Annual Tall Timbers Fire Ecology Conference 7, 107–167 World Resources Institute (WRI). 2002. World Resources 2001–2002. World Resources Institute, Washington DC
10
Resource-conserving Agriculture Increases Yields in Developing Countries J. Pretty, A. D. Noble, D. Bossio, J. Dixon, R. E. Hine, F. W. T. Penning de Vries, and J. I. L. Morison
Introduction What is the best way to increase agricultural productivity in developing countries that still, despite efforts over several decades, have some 800 million people short of food? The question is controversial, with widely varying positions about the types of inputs and technologies likely to be effective (McNeely and Scherr, 2003; Smil, 2000; Tilman et al, 2002; Trewevas, 2002). Great technological progress in the past half century has not been reflected in major reductions in hunger and poverty in developing countries. However, many novel initiatives have emerged that are demonstrating that agriculture in poor countries can be greatly improved. Here we evaluate how farmers in 286 projects in 57 countries have improved food crop productivity since the early- to mid-1990s, and at the same time increased both water use efficiency and carbon sequestration and reduced pesticide use. These initiatives also offer the prospects of resource conserving agriculture both reducing adverse effects on the environment and contributing to climate change mitigation. In the past 40 years, per capita world food production has grown by 17 per cent, with average per capita food consumption in 2003 of 2780kcal day–1 (FAO, 2005), where a majority of the chronically hungry are small farmers who produce much of what they eat. Yet consumption in 33 poor countries is still less than 2200kcal day–1. Food demand will both grow and shift in the coming decades, as: (i) population growth increases absolute demand for food; (ii) economic growth increases people’s purchasing power; (iii) growing urbanization encourages people to adopt new diets; and (iv) climate change threatens both land and water resources. Increased food supply is a necessary though not sufficient condition for eliminating hunger and poverty. What is important is who produces the food, has access Reprinted with permission from Environ. Sci. Technol. 2006, 40(4), 1114–1119. Copyright 2006 American Chemical Society.
210 Poverty and Hunger
to the technology and knowledge to produce it, and has the purchasing power to acquire it. The great success of industrialized agriculture in recent decades has masked significant negative externalities, with environmental and health problems increasingly well documented and costed, including in Ecuador, China, Germany, the Philippines, the UK and the US (Crissman et al, 1998; Norse et al, 2001; Pingali and Roger, 1995; Pretty et al, 2000; Tegtmeier and Duffy, 2004; Waibel et al, 1999). There are also growing concerns that such systems may not reduce food poverty. Poor farmers need low-cost and readily available technologies and practices to increase local food production and to raise their income. At the same time, land and water degradation is increasingly posing a threat to food security and the livelihoods of rural people who often live on degradation-prone lands (Uphoff, 2002). The idea of agricultural sustainability centres on food production that makes the best use of nature’s goods and services whilst not damaging these assets. Many different terms have come to be used to imply greater sustainability in some agricultural systems over prevailing ones (both pre-industrial and industrialized) (National Research Council, 2000). Agricultural sustainability in all cases, however, emphasizes the potential benefits that arise from making the best use of both good genotypes of crops and animals and their ecological management. Agricultural sustainability does not, therefore, mean ruling out any technologies or practices on ideological grounds (e.g. genetically modified crops, organic practice) – provided they improve productivity for farmers and do not harm the environment (Conway, 1997; National Research Council, 2000; Nuffield Council on Bioethics, 2004; Pretty, 2002; Uphoff, 2002). In this research, we concentrate on projects that have made use of a variety of packages of resource-conserving technologies and practices. These include: 1 2 3 4 5 6 7
Integrated Pest Management, which uses ecosystem resilience and diversity for pest, disease and weed control and seeks only to use pesticides when other options are ineffective. Integrated nutrient management, which seeks both to balance the need to fix nitrogen within farm systems with the need to import inorganic and organic sources of nutrients and to reduce nutrient losses through erosion control. Conservation tillage, which reduces the amount of tillage, sometime to zero, so that soil can be conserved and available moisture used more efficiently. Agroforestry, which incorporates multifunctional trees into agricultural systems and collective management of nearby forest resources. Aquaculture, which incorporates fish, shrimps and other aquatic resources into farm systems, such as into irrigated rice fields and fish ponds, and so leads to increases in protein production. Water harvesting in dryland areas, which can mean formerly abandoned and degraded lands can be cultivated and additional crops grown on small patches of irrigated land owing to better rain water retention. Livestock integration into farming systems, such as dairy cattle and poultry, including using zero-grazing.
Resource-conserving Agriculture Increases Yields in Developing Countries 211
Here we show the extent to which recent successful interventions focusing on agricultural sustainability (sometimes called bright spots, see Scherr and Yadav, 1996) have increased total food crop productivity in developing regions. Our questions are: 1 2
To what extent can farmers increase per hectare and per farm food production by using low-cost and locally-available technologies and inputs? What impacts do such methods have on environmental goods and services (in particular using the water use efficiency, carbon sequestration and pesticide use as proxies to indicate changes in adverse effects on the environment)?
Methodology We used both questionnaires and published reports of projects to assess adoption of sustainable agriculture and changes over time. As in earlier research (Pretty et al, 2003), data were triangulated from several sources and cross-checked by external reviewers and regional experts. This study involves analysis of projects sampled once in time (n = 218) and those sampled twice over a four-year period to assess temporal changes (n = 68). Not all proposed cases were accepted for the data set, and rejections were based on a strict set of criteria (Pretty et al, 2003). As this was a purposive sample of ‘best practice’ initiatives, the findings are not representative of all developing country farms. We used a novel typology of farming systems developed by FAO for the World Bank to classify these projects (Dixon and Gulliver, 2001) into eight broad categories based on the following social, economic and biophysical criteria: 1 2
the available natural resource base, including water, land, grazing areas and forest; climate and altitude; landscape, including slope; farm size, tenure and organizations; and access to services including markets; the dominant patterns of farm activities and household livelihoods, including field crops, livestock, trees, aquaculture, hunting and gathering, processing and off-farm activities; and the main technologies used, which determine the intensity of production and integration of crops, livestock and other activities.
Table 10.1 contains a summary of the global land area and population located in these eight major farm system categories. On average, these sustain 2.28 people per cultivated hectare of land (range 0.5–5.5). A total of 72 farming subsystems have been identified across the developing regions, some of which comprised similar systems occurring on different continents (e.g. wetland rice systems in East Asia/ Pacific and in South Asia). In our study, system categories 2–5 are well-represented,
212 Poverty and Hunger Table 10.1 Summary of FAO–World Bank farming system categories in developing regions and number of project entries for this study FAO farm system category
1. Smallholder irrigated 2. Wetland rice
Number of subsystems
1
Land Cultivated Agricultural Agricultural No. area area population population project (M ha) (M ha) (M) per entries cultivated for each hectare category 219
15
30
2.0
16
3
330
155
860
5.5
55
3. Smallholder rainfed humid
11
2013
160
400
2.5
95
4. Smallholder rainfed highland
10
842
150
520
3.5
40
5. Smallholder rainfed dry/cold
19
3478
231
490
2.1
43
6. Dualistic mixed
16
3116
414
190
0.5
20
60
5.5
2
40
na
15
2.28
286
7. Coastal artisanal
4
8. Urban-based and kitchen garden
6
na
na
72
10068
1136
Total
70
11
2590
Source: from Dixon and Gilliver, 2001; na = not available
with 40–95 projects in each. System categories 1, 6 and 8 have 15–20 projects and category 7 has only two.
Extent of agricultural sustainability and impacts on yields Table 10.2 contains a summary of the location and extent of the 286 agricultural sustainability projects across the eight categories of farming systems in 57 countries. In all, some 12.6 million (M) farmers on 37 M hectares were engaged in transitions towards agricultural sustainability in these 286 projects. This is just over 3 per cent of the total cultivated area shown in Table 10.1. The largest number of farmers was in wetland rice-based systems, mainly in Asia (category 2), and the largest area was in dualistic mixed systems, mainly in southern Latin America (category 6). We were able to show that agricultural sustainability is spreading to more farmers and hectares. In the 68 randomly re-sampled projects from the original study, there was a 53.6 per cent increase over the four years in the number of farmers and 44.6 per cent in the number of hectares. These resurveyed projects comprised 60 per cent of the farmers and 43.7 per cent of the hectares in the original sample of 208 projects (Pretty et al, 2003). In the earlier study, we reported that 89 projects
Resource-conserving Agriculture Increases Yields in Developing Countries 213 Table 10.2 Summary of adoption and impact of agricultural sustainability technologies and practices on 286 projects in 57 countries FAO farm system category 1. Smallholder irrigated
Number of farmers adopting 177,287
Number of hectares under sustainable agriculture 357,940
Average % increase in crop yields 129.8 (±21.5)
2. Wetland rice
8,711,236
7,007,564
22.3 (±2.8)
3. Smallholder rainfed humid
1,704,958
1,081,071
102.2 (±9.0)
4. Smallholder rainfed highland
401,699
725,535
107.3 (±14.7)
5. Smallholder rainfed dry/cold
604,804
737,896
99.2 (±12.5)
6. Dualistic mixed
537,311
26,846,750
76.5 (±12.6)
7. Coastal artisanal
220,000
160,000
62.0 (±20.0)
8. Urban-based and kitchen garden
207,479
36,147
146.0 (±32.9)
12,564,774
36,952,903
All projects
79.2 (±4.5)
Notes: Yield data from 360 crop project combinations; reported as % increase (thus a 100% increase is a doubling of yields). Standard errors in brackets.
for which there was reliable yield data showed increases in per hectare food production. For the 360 reliable yield comparisons from 198 projects that we now have, the mean relative increase was 79 per cent across the very wide variety of systems and crop types. However, there was a wide spread in results (Figure 10.1). While 25 per cent of projects reported relative yields > 2.0 (i.e. 100 per cent increase), half of all the projects had yield increases of between 18 per cent and 100 per cent. The geometric mean is a better indicator of the average for such data with a positive skew, but this still shows a 64 per cent increase in yield. However, the average hides large and statistically significant differences between the main crops (Figures 10.2 and 10.3). In nearly all cases there was an increase in yield with the project. Only in rice were there three reports where yields decreased and the increase in rice was the lowest (mean = 1.35), although it constituted a third of all the crop data. Cotton showed a similarly small mean yield increase. The mean (2.84) and spread was largest in cassava and sweet potato crops, although the sample is small. Soybean and groundnut showed mean increases of about 50 per cent. Maize, millet and sorghum, potatoes and the other legumes group (beans, pigeon peas, cowpea, chickpea) all showed mean yield increases of > 100 per cent, significantly higher than for cotton, rice and groundnut (p < 0.05). For most of the main field crops that are well represented in the survey, those with
214 Poverty and Hunger
Notes: n = 360, mean = 1.79, s.d. 0.91, median = 1.50, geometric mean = 1.64.
Figure 10.1 Histogram of change in crop yield after or with project, compared to before or without project
Notes: Bold lines within boxes indicate median value, box limits indicate interquartile range (i.e. 50% of values lie within the box), whiskers indicate highest and lowest, excluding outliers (O, 1.5 to 3 × box length distance away from edge of box) or extremes (*, > 3 × box length). ‘Other’ group consists of sugar cane (n = 2), quinoa (1), oats (2).
Figure 10.2 ‘Box and whisker plot’ of change in crop yield after or with project, compared to before or without project
Resource-conserving Agriculture Increases Yields in Developing Countries 215
Notes: Vertical lines indicate ± s.e.m. ‘Other’ group consists of sugar cane (n = 2), quinoa (1), oats (2).
Figure 10.3 Mean changes in crop yield after or with project, compared with before or without project
low yields before intervention often showed larger relative improvements, either because of growth limiting environments, or perhaps reduced investment in developing these crops, although potato showed large increases across the range (Figure 10.4). Though many technologies and practices were used in these projects, three types of technical improvement are likely to have played substantial roles in food production increases: 1 2 3
more efficient water use in both dryland and irrigated farming; improvements in organic matter accumulation in soils and carbon sequestration; pest, weed and disease control emphasizing in-field biodiversity and reduced pesticide (insecticide, herbicide and fungicide) use.
Impacts on farm water use efficiency Widespread appreciation of the ‘global water crisis’ recognizes that scarcity of clean water is affecting food production and conservation of ecosystems. By 2025 it is predicted that most developing countries will face either physical or economic water scarcity (International Water Management Institute, 2000). Water diverted from rivers increased six-fold between 1900 and 1995 (Shiklomanov, 1999), far
216 Poverty and Hunger
Note: Only field crops with n > 9 shown.
Figure 10.4 Relationship between relative changes in crop yield after (or with project) to yield before or (without project)
outpacing population growth. Increasing demand for fresh water now threatens the integrity of many aquatic ecosystems and their associated environmental services (Costanza et al, 1997). As agriculture accounts for 70 per cent of current water withdrawals from rivers, so improving the productivity of water use in agriculture is a growing challenge. The potential for increasing food production while maintaining water-related ecosystem services rests on the capacity to increase water productivity (WP), i.e. by realizing more kg of food per unit of water. Sustainable agricultural practices may do this by: (i) removing limitations on productivity by enhancing soil fertility; (ii) reducing soil evaporation through conservation tillage; (iii) using more water efficient varieties; (iv) reducing water losses to unrecoverable sinks; (v) boosting productivity by supplemental irrigation in rainfed systems; and (vi) inducing microclimatic changes to reduce crop water requirements (Kijne et al, 2003). We calculated changes in WP for field crops in 144 projects from the data set (Table 10.3) based on reported crop yields and average potential evapotranspiration (ETp), for each project location during the relevant growing season. Actual evapotranspiration (ETa) was assumed to equal 80 per cent of ETp, and ETa to remain a constant at different levels of productivity. WP gains were high in rainfed systems and moderate in irrigated systems, and were in agreement with other studies reporting ranges of WP (Kijne et al, 2003). The very large increase for the vegetables and fruits is probably an overestimate as
Resource-conserving Agriculture Increases Yields in Developing Countries 217 Table 10.3 Summary of changes in water productivity by major crop type arising from adoption of sustainable agricultural technologies and practices in 144 projects Crops
Irrigated Rice (n = 18) Cotton (n = 8) Rainfed Cereals (n = 80) Legumes (n = 19) Roots and tubers (n = 14) Urban and kitchen gardens Vegetables and fruits (n = 5)
Water % Increase Water productivity Water productivity before intervention after intervention productivity gain in WP (kg food m–3 (kg food m–3 (kg food m–3 water ETa) water ETa) water ETa) 1.03 (±0.22) 0.17 (±0.04)
1.19 (±0.12) 0.22 (±0.05)
0.16 (±0.04) 0.05 (±0.02)
15.5% 29.4%
0.47 (±0.06) 0.43 (±0.07)
0.80 (±0.09) 0.87 (±0.16)
0.33 (±0.05) 0.44 (±0.11)
70.2% 102.3%
2.79 (±0.73)
5.79 (±1.08)
3.00 (±0.65)
107.5%
0.83 (±0.29)
2.96 (±0.97)
2.13 (±0.71)
256.6%
Note: Standard errors in brackets.
we did not adjust ETp for new crops or lengthened cropping periods. Variability was high due to the wide variety of practices represented in the data set, but do indicate that gains in WP are possible through the adoption of sustainable farming technologies in a variety of crops and farm systems. Our results, and others (Agarwal and Narain, 1997; Rockström and Falkenmark, 2000), demonstrate that the greatest opportunity for improvement in water productivity is in rainfed agriculture. Better farm management, including supplemental irrigation and fertility management, can significantly reduce uncertainty and thus avoid chronic low productivity and crop failure that are characteristic of many rainfed systems.
Impacts on carbon sequestration The 1997 Kyoto Protocol to the UN Framework Convention on Climate Change established an international policy context for the reduction of carbon emissions and increases in carbon sinks in order to address the global challenge of anthropogenic interference with the climate system. It is clear that both emission reductions and sink growth will be necessary for the mitigation of current climate change trends (IPCC, 2001; Lal et al, 2004; Swingland, 2003). Carbon sequestration is defined as the capture and secure storage of carbon that would otherwise be emitted to or remain in the atmosphere (Watson et al, 2000). One of the actions farmers can take is to increase carbon sinks in soil organic matter and above-ground biomass. We calculated the potential annual contributions
218 Poverty and Hunger Table 10.4 Summary of potential carbon sequestered in soils and above-ground biomass in the 286 projects FAO farm system category 1. Smallholder irrigated
Carbon sequestered per hectare (t C ha–1 y–1) 0.15 (±0.012)
Total carbon sequestered (Mt C y–1) 0.011
Carbon sequestered per household (t C y–1) 0.06
2. Wetland rice
0.34 (±0.035)
2.530
0.29
3. Smallholder rainfed humid
0.46 (±0.034)
0.340
0.20
4. Smallholder rainfed highland
0.36 (±0.022)
0.230
0.56
5. Smallholder rainfed dry/cold
0.26 (±0.035)
0.200
0.32
6. Dualistic mixed
0.32 (±0.023)
8.030
14.95
7. Coastal artisanal
0.20 (±0.001)
0.032
0.15
8. Urban-based and kitchen garden
0.24 (±0.061)
0.015
0.07
Total
0.35 (±0.016)
11.380
0.91
Note: Standard errors in brackets.
being made in these 286 projects to carbon sink increases in soils and trees, using established carbon audit methods (Pretty et al, 2002) (Table 10.4). As the focus is on what sustainable methods can do to increase quantities of soil and above-ground carbon, we did not take account existing stocks of carbon. Soil carbon sequestration is corrected for climate, as rates are higher in humid compared with dry zones, and generally higher in temperate rather than tropical areas (Lal et al, 2004; Watson et al, 2000). These projects were potentially sequestering 11.4 Mt C y–1 on 37 M ha. If scaled up, assuming that 25 per cent of the areas under the different farming system categories globally (Table 10.1) adopted these same sustainability initiatives, this would result in sequestration of 100 (±4) Mt C y–1. The average gain was 0.35 (±0.016) t C ha–1 y–1, and an average gain per household of 0.91 t C y–1. The per hectare gains vary from 0.15 (±0.012) t C ha–1 y–1 for smallholder irrigated systems (category 1) to 0.46 (±0.034) t C ha–1 y–1 for category 3 systems. For most systems, per households gains were in the range 0.05–0.5 t C y–1, with the much larger farms of southern Latin America using zero-tillage achieving the most at 14.9 t C y–1. Such gains in carbon may offer new opportunities for income generation under carbon trading schemes.
Resource-conserving Agriculture Increases Yields in Developing Countries 219
Impacts on pesticide use Integrated Pest Management (IPM) programmes are beginning to show how pesticide use can be reduced and modified without yield penalties in a variety of farm systems, such as in irrigated rice in Asia (Eveleens, 2004) and rainfed maize in Africa (Khan et al, 1997). In principle, there are four possible trajectories an agricultural system can take if IPM is being introduced: 1 2 3 4
both pesticide use and yields increase (A); pesticide use increases but yields decline (B); both pesticide use and yields fall (C); pesticide use declines, but yields increase (D).
The conventional wisdom is that pesticide use and yields are positively correlated, and so only trajectories moving into A and C are likely (Knutson et al, 1990; Schmitz, 2001). A change into sector B would be against economic rationale, as farmers’ profits would invariably fall and behaviour change. A shift into sector D would indicate that current pesticide use has negative yield effects. This could be possible with an excessive use of herbicides or when pesticides cause outbreaks of secondary pests (Kenmore et al, 1984). We analysed the 62 IPM initiatives in 21 developing countries in the data set (Figure 10.5). The evidence on pesticide use is derived from data on both the number of sprays per hectare and the amount of active ingredient per hectare. There is only one case in sector B reported in recent literature (Feder et al, 2004), and so this was not included. Sector A contains ten projects where pesticide use increased. These are mainly in zero-tillage and conservation agriculture systems, where reduced tillage creates benefits for soil health and reduces off-site pollution and flooding costs. These
Notes: A: n = 10; C: n = 5; D: n = 47.
Figure 10.5 Changes in pesticide use and yields in 62 projects
220 Poverty and Hunger
systems usually require increased use of herbicides for weed control (de Freitas, 1999), though there are examples of organic zero-tillage systems (Petersen et al, 2000). The five cases in sector C show a 4.2 per cent (±5.0) decline in yields with a 93.3 per cent (±6.7) fall in pesticide use. Most cases, however, are in category D where pesticide use declined by 70.8 per cent (±3.9) and yields increased by 41.6 per cent (±10.5). While pesticide reduction is to be expected, as farmers substitute pesticides with information, the cause of yield increases induced by IPM are complex. It is likely that farmers who receive good quality field training will not only improve their pest management skills but also become more efficient in other agronomic and ecological management practices. They are also likely to invest cash saved from pesticides in other inputs such as higher quality seeds and fertilizers. This analysis indicates a considerable potential for avoiding environmental costs.
Discussion It is uncertain whether progress towards agricultural sustainability, delivering benefits at the scale occurring in these projects, will result in enough food to meet the future food needs in developing countries after continued population growth, urbanization and the dietary transition to meat-rich diets (Delgado et al, 1999). Even the substantial increases reported here may not be enough. However, more widespread adoption of these resource conserving technologies, combined with other innovations in crop and livestock genotypes, would contribute to increased agricultural productivity (Nuffield Council on Bioethics, 2004; Trewevas, 2002), particularly as evidence indicates that productivity can grow in many farming systems as social and human capital assets also grow (Pretty, 2003). Our findings also show that poor households benefit substantially. But improving agricultural sustainability will not alone solve all food poverty problems. The challenge is to find ways to improve all farmers’ access to productive technologies and practices that are also resource conserving. The critical priority is now international, national and local policy and institutional reforms (Dasgupta, 1998) designed to benefit both food security and income growth at national and household levels, whilst improving the supply of critical technologies that improve the supply of environmental goods and services.
Acknowledgements We are grateful to all project staff and scientists who made data available on projects, to earlier comments and suggestions from researchers involved in the IWMI Bright Spots research programme, to Noel Aloysius for input for some of the research, to David Tilman for comments on an earlier manuscript, and to two
Resource-conserving Agriculture Increases Yields in Developing Countries 221
referees for their helpful comments. The research was funded by the UK Department for International Development. The views expressed in this paper are those of the authors and do not necessarily reflect the policies of their organizations.
Supporting information See Dixon and Gulliver (2001) for full details of the classification system developed by FAO. This separates farming systems into eight types (irrigated; wetland rice based; smallholder rainfed humid; smallholder rainfed highland; smallholder rainfed dry/cold; dualistic; coastal artisanal fishing; urban-based) for six regions of the world (sub-Saharan Africa; Middle East and North Africa; Europe and Central Asia; South Asia; East Asia and Pacific; Latin America and Caribbean).
References Agarwal A and Narain S. 1997. Dying Wisdom. Thomson Press, Faridabad Conway G R. 1997. The Doubly Green Revolution. Penguin, London Costanza R, d’Arge R, de Groot R, Farber S, Grasso M, Hannon B, Limburg K, Naeem S, O’Neil R V, Parvelo J, Raskin R G, Sutton P and van den Belt, M. 1997. The value of the world’s ecosystem services and natural capital. Nature 387, 253–260 Crissman C C, Antle J M and Capalbo S M. (eds). 1998. Economic, Environmental and Health Tradeoffs in Agriculture. CIP, Lima & Kluwer, Boston Dasgupta P. 1998. The economics of food. In Waterlow J C, Armstrong D G, Fowden L and Riley R. (eds). Feeding the World Population of More Than Eight Billion People, Oxford University Press, New York and Oxford de Freitas H. 1999. Transforming microcatchments in Santa Caterina, Brazil. In Hinchcliffe F, Thompson J, Pretty J, Guijt I and Shah P. (eds). Fertile Ground. IT Publications, London Delgado C, Rosegrant M, Steinfield H, Ehui S and Courbois C. 1999. Livestock to 2020: The Next Food Revolution. IFPRI, Washington DC Dixon J and Gulliver A with Gibbon D. 2001. Farming Systems and Poverty. FAO, Rome Eveleens K. 2004. The History of IPM in Asia. FAO, Rome FAO. 2005. FAOSTAT database. Rome Feder G, Murgai R and Quizon J B. 2004. Sending farmers back to school: The impact of Farmer Field Schools in Indonesia. Review of Agricultural Economics 26(1), 45–62 International Water Management Institute. 2000. World Water Scenarios Analyses, ed. Rijsberman F. Earthscan, London IPCC. 2001. Climate Change 2001: Impacts, Adaptation and Vulnerability. Intergovernmental Panel on Climate Change, Geneva Kenmore P E, Carino F O, Perez C A, Dyck V A and Gutierrez A P. 1984. Population regulation of the rice brown plant hopper (Nilaparvata lugens Stal) within rice fields in the Philippines. J. Plant Protection Tropics 1(1), 19–37 Khan Z R, Ampong-Nyarkko K, Chiliswa P, Hassanali A, Kimani S, Lwande W, Overholt W A, Pickett J A, Smart L E, Wadhams L J and Woodcock M. 1997. Intercropping increases parasitism of pests. Nature 388, 631–632
222 Poverty and Hunger Kijne J W, Barker R and Molden D. (eds). 2003. Water Productivity in Agriculture: Limits and Opportunities for Improvement. CABI Publishing, Wallingford, UK Knutson R D, Taylor C R, Penson J B and Smith E S. 1990. Economic Impacts of Reduced Chemical Use. Knutson & Assoc, College Station, TX Lal R, Griffin M, Apt J, Lave L and Morgan M G. 2004. Managing soil carbon. Science 304, 393 McNeely J A and Scherr S J. 2003. Ecoagriculture. Island Press, Washington DC National Research Council. 2000. Our Common Journey. National Academy Press, Washington DC Norse D, Li Ji, Jin Leshan and Zhang Zheng. 2001. Environmental Costs of Rice Production in China. Aileen Press, Bethesda Nuffield Council on Bioethics. 2004. The Use of Genetically Modified Crops in Developing Countries. London Petersen P, Tardin J M and Marochi F. 2000, Participatory development of no-tillage systems without herbicides for family farming Environ. Dev. Sust. 1, 235–252 Pingali P L and Roger P A. 1995. Impact of Pesticides on Farmers’ Health and the Rice Environment. Kluwer, Dordrecht Pretty J, Ball A S, Li Xiaoyun and Ravindranath N H. 2002. The role of sustainable agriculture and renewable resource management in reducing greenhouse gas emissions and increasing sinks in China and India, Phil. Trans. Roy. Soc. Series A 360, 1741–1761 Pretty J, Brett C, Gee D, Hine R, Mason C F, Morison J I L, Raven H, Rayment M and van der Bijl G. 2000. An assessment of the total external costs of UK agriculture Agricultural Systems 65(2), 113–136 Pretty J, Morison J I L and Hine R E. 2003. Reducing food poverty by increasing agricultural sustainability in developing countries. Agric. Ecosys. Environ. 95(1), 217–234 Pretty J. 2002. Agri-Culture: Reconnecting People, Land and Nature. Earthscan, London Pretty J. 2003. Social capital and the collective management of resources Science 302, 1912–1915 Rockström J and Falkenmark M. 2000. Semiarid crop production from a hydrological perspective – gap between potential and actual yields. Critical Rev. Plant Science 19(4), 319–346 Scherr S J and Yadav S. 1996. Land Degradation in the Developing World. IFPRI, Washington DC Schmitz P M. 2001. Overview of cost–benefit assessment. In OECD workshop on the Economics of Pesticide Risk Reduction in Agriculture. OECD, Paris Shiklomanov L A. 1999. World Water Resources: An Appraisal for the 21st Century. UNESCO, Paris Smil V. 2000. Feeding the World. MIT Press, Cambridge MA Swingland I. (ed). 2003. Carbon and Biodiversity. Earthscan, London Tegtmeier E M and Duffy M D. 2004. External costs of agricultural production in the US. Int. J. Agric. Sust. 2, 1–20 Tilman D, Cassman K G, Matson P A, Naylor R and Polasky S. 2002. Agricultural sustainability and intensive production practices, Nature 418, 671–677 Trewevas A. 2002. Malthus foiled again and again. Nature 418, 668–670 Uphoff N. 2002. Agroecological Innovations. Earthscan, London Waibel H, Fleischer G and Becker H. 1999. The economic benefits of pesticides: A case study from Germany, Agrarwirtschaft 48 H.6, S.219–230 Watson R T, Noble I R, Bolin B, Ravindranath N H, Verardo D J and Dokken D J (eds). 2000. IPCC Special Report on Land Use, Land-Use Change and Forestry. IPCC Secretariat, Geneva
Part III
Diet and Health
11
Whole Diets E. Balfour
In the Introduction to his book, The Wheel of Health,1 Dr Wrench makes this thought-provoking statement: ‘After debating the question – Why disease? Why not health? – again and again with my fellow students, I slowly, before I qualified, came to a further question – Why was it that as students we were always presented with sick or convalescent people for our teaching and never with the ultra healthy? Why were we only taught disease: why was it presumed that we knew all about health in its fullness? The teaching was wholly one-sided. Moreover, the basis of our teaching upon disease was pathology, namely, the appearance of that which is dead from disease.’ This view, that the professional attitude to sickness is one-sided is shared by the compilers of the PEP Report (1936) on the British Health Services. The authors express it as follows: Health means more than not being ill. A new attitude is needed, involving not so much a departure from the old as a more thorough grasp of the different elements in health policy. Many people are at any given moment suffering from defects, injuries or sickness so pronounced as to make them unable to carry on ordinary occupations and leisure activities. These are the ‘cases’ with which a large part of the organized health services mainly deal. But in addition there are far larger numbers of people suffering temporarily or permanently from less acute defects, injuries, or inadequacies, which are not sufficient to unfit them for work or play, and may not even be noticed at all, but nevertheless suffice to place them in an unnecessarily weak position for creating and maintaining good physique, energy, happiness, or resistance to disease... No contemporary health policy can be considered adequate which does not deal with the second group as well as the first... While efforts at effecting the cure of diseases cannot be relaxed, efforts at prevention of ill health can and must be increased. The aspect of raising standards of nutrition and of fitness should be given much prominence. Health must come first: the mere state of not being ill must be recognized as an unacceptable substitute, too often tolerated or even regarded as normal. We must, moreover, face the fact that while immense study has been lavished on disease no one has intensively studied and analysed health,2 and our Reprinted from Balfour E. 1943. Whole diets, in Balfour E. The Living Soil, Faber and Faber, London. Chapter 7, pp161–179.
226 Diet and Health ignorance of the subject is still so deep that we can hardly claim scientifically to know what health is.
The theory which I have endeavoured to expound in this book [The Living Soil] is that the only true conception of health is one of wholeness, dependent upon both the continuity and the completeness of the cycle of life. I shall make no attempt to discuss the philosophical aspect of this conception, I am concerned only with presenting certain evidence suggesting that it is biologically sound. For the sake of clarity in this presentation, the argument has been divided into two parts. The first states that the determining factor in health is food, and the second suggests that the health-giving property of food is dependent on the way it is grown, prepared and consumed. There is always an inherent danger in making arbitrary divisions where no true division exists, but in the present case this could hardly be avoided. The risk of failing to see the wood for the trees must sometimes be taken in order to discover how large a number of trees go to make a wood. In the previous chapters [of The Living Soil] – to pursue the same analogy – I have invited you to examine some of the trees. In this chapter I want you to take a look at the wood as a whole. This, research has, so far, largely failed to do. Research workers in chemistry, biology, mycology, botany, veterinary science and medicine, have for too long been working in watertight compartments, each busily dissecting his own tree, until in the process the wood has become so sadly dismembered it is small wonder that we sometimes cease to be aware of its existence. It may be objected that I have followed their example of fragmentation in laying so much stress on the role of the fungus in nutrition. In so far as this accusation is well founded, my defence is that this is the link in the life cycle which is most frequently omitted, but which is at the same time the easiest to restore. In emphasizing its importance, however, I have never intended to suggest that it forms other than a part, however important in itself, of the complete cycle of nutrition and health which is wholeness. McCarrison in the Cantor Lectures states: ‘The diet of the Sikhs is only healthpromoting so long as it is consumed in its entirety’, and as Dr Wrench points out, with their whole diet these people ‘have preserved the wholeness of their health, a thing which we have failed to do’. In the writings of the scientific experts on nutrition, there are very numerous part-diet experiments based on synthetic or specially made-up diets, omitting or cutting down the quantity of one or more of the factors which compose a diet. One scientist will cut down the quantity of protein given and watch the effect of this upon animals; another will cut down the fats and note the resulting sicknesses; another will give vegetable or irradiated vegetable fats in places of customary animal fats; another will give a diet in which vitamin A is defective, B is defective, C is defective, and so on. The experiments are skilfully devised and carried out with consumate technique. They lead to a mass of knowledge about proteins as things in themselves; fats as things
Whole Diets 227 in themselves; vitamins as things in themselves; but whether these can be things in themselves and are not really relative to a host of other conditions in nutrition is as yet scarcely considered... Our health or wholeness has fragmented no less than our diet. A swarm of specialists have with the invention of science settled on the fragments to study them. A great deal is found out about each several disease; there is a huge, unmanageable accumulation of knowledge, and this and that disease is checked or overcome. But our wholeness has not been restored to us. On the contrary, it is fragmented into a great number of diseases and still more ailments. We have lost wholeness, and we have got in its place its fragmentation with a multiplexity of methods, officially blessed and otherwise, dealing with the fragments in their severally.
This fragmentation has resulted, among other things, in a host of contradictory views among dietitians, each one of the different diets advocated possessing a company of followers ready to argue its exclusive merits with almost religious fervour. Thus you have the vegetarian; the fruitarian; those who never eat proteins and starch at the same meal; and those who stew all their foods together in the same pot; those that say you must drink before meals; others that believe in drinking after meals; those that drink between meals, and besides all these, and many more, there is the vast majority that eat what they want when they want it (or can get it) and drink when they are thirsty. This majority is given to labelling all the others as faddists, and indeed there does not seem to be a very noticeable difference in health between any of these groups. No wonder then, that the average person is apt to be a little sceptical when he is told that health depends on diet. What then should be the reply to the would-be seeker after health who asks: ‘What shall I eat that I may be whole?’ For an answer let us go to those people from whom Dr Wrench, in his student days, felt instinctively that such knowledge should be sought, namely the ultrahealthy. Not the occasional individual of whom one says that he is ‘abnormally healthy’ (a revealing adverb) but to whole groups of people to whom a state of full health is normal. Five such groups exist, or have existed, about which a good deal of statistical data is available. We will examine these in turn, noting how they live and what they eat, and see if we can discover among them a common factor of which it permissible to say – here lies the secret of health. We will take first the people of Hunza, a small native state in the extreme northernmost part of India attached to the Gilgit Agency. The origin of these people is somewhat of a mystery. Both in physical characteristics and language they differ from their neighbours, and indeed from all the other peoples of the Indian subcontinent. Only one thing seems certain, that they have inhabited their valley since the extremely distant past. The massive stone walls, the building of which must have preceded their admirable terraced agriculture, have a parallel only in the masonry left by the Peruvian civilization which preceded the Inca conquest.
228 Diet and Health
The Hunza valley is a gorge running east and west cleft in a towering mountain range. It is arid in summer and bitterly cold in winter, but owing to the system of irrigation, it is extremely fertile and an immense variety of fruits and vegetables are cultivated by these industrious people. Something of their superb health and stamina has already been indicated in Chapter 2 [of The Living Soil]. All travellers passing through their valley speak of their outstanding physique, courage and good humour. McCarrison, who for some time was Medical Officer to the Gilgit Agency, has said of them: These people are unsurpassed by any Indian race in perfection of physique. They are long lived, vigorous in youth and age, capable of great endurance and enjoy a remarkable freedom from disease in general. During the period of my association with these people I never saw a case of asthenic dyspepsia, of gastric or duodenal ulcer, of appendicitis, of mucous colitis, of cancer... Among these people the ‘abdomen over-sensitive’ to nerve impressions, to fatigue, anxiety, or cold was unknown. The consciousness of the existence of this part of their anatomy was, as a rule, related solely to the feeling of hunger. Indeed, their buoyant abdominal health has, since my return to the West, provided a remarkable contrast with the dyspeptic and colonic lamentations of our highly civilized communities.
They are admirable cultivators: far famed as such and ‘conspicuously ahead of all their neighbours in brain and sinew’ stated Shomberg. Their big irrigation conduit, the Berber, is ‘famous everywhere in Central Asia...’ Amongst the peoples of the Agency not only are they ‘as tillers of the soil quite in a class apart, they alone – and this always strikes me as truly remarkable – are good craftsmen.’ As carpenters and masons, as gunsmiths, ironworkers, or even as goldsmiths; as engineers for roads, bridges or canals, the Hunza men are outstanding.
The Hunza are favoured in their fertile valley, but their perfect health cannot be put down to the locality in which they live, for next door to them is another, and equally fertile, valley, also running east and west and separated from Hunza only by a 20,000-foot mountain wall. In this valley live the Ishkomanis. These people, ‘though living under apparently like conditions to their neighbours, were poor, undersized, undernourished creatures. There was plenty of land and water, but the Ishkomanis were too indolent to cultivate it with thoroughness; and the possibility of bad harvests was not enough to overcome their sloth… “They had no masons or carpenters or craftsmen in their country. Many of them showed signs of disease.”’ We can thus rule out climate as the secret of the Hunza health. Now, let us look at their mode of life and their diet. For ten months of the year they can be said to live in the open air, for men, women and children work in the fields. They remain mainly indoors during the period of severe winter storms, but their houses are better, and better ventilated than those of their neighbours, their sanitation is
Whole Diets 229
also better and follows the ‘immemorial custom of the Far East’. Unusual care is also taken to protect their drinking water by storing it in separate covered cisterns. Their diet is a very varied one. It consists of wheat, barley, buckwheat, and small grains; leafy green vegetables; potatoes (introduced half a century ago), other root vegetables; peas and beans, gram or chick pea, and other pulses; fresh milk and buttermilk or lassi; clarified butter and cheese; fruit, chiefly apricots and mulberries, fresh and sun-dried; meat on rare occasions; and sometimes wine made from grapes. Their children are breast fed up to three years, it being considered unjust to the living child for its lactation to be interrupted by a maternal pregnancy. The Hunza do not take tea, rice, sugar or eggs. Chickens in a confined area destroy crops and are not kept.
Except for the wider range of small grains and the very occasional meat, this closely resembles any European lacto-vegetarian diet, and, at first sight, seems to support the view so widely held by nutrition experts, McCarrison among them, that of all diets the lacto-vegetarian is the healthiest. That it is a good diet is incontestable; it will, however, presently be shown that there are other peoples whose health and stamina is equal to that of the Hunza whose diet is the very opposite of theirs. The Hunza foods then are not unlike our own, but there are important differences in the normal methods of preparation and cooking. Both we and the Hunza are great bread-eaters, and both prefer wheat bread, but the Hunza wheat is eaten freshly ground, and the unleavened bread made with it invariably contains the whole of the grain, with its vital germ and its protective skin, both of which are removed in the process of milling white flour. Dr Wrench, writing on the properties of skin in general, points out that skin does not protect only in a mechanical way as a mere covering, but in a living way. All skins ‘can regrow themselves if injured, and beneath and within them they store substances upon which they can call to strengthen their efforts’. The value of bran, the skin of wheat, is well known to all stock feeders. All carnivorous animals relish the skins of their prey. The Greenlanders, Wrench points out, eat the skin of the narwhal: ‘The Chinese and other peoples also eat the skins of animals and birds. Everything living has a skin of some sort to protect it. It protects it by its extra toughness, but also if microbes and other minute enemies do attack, it is there on the frontier that the battle is waged. In and near the skin are marshalled the protective forces. Any creature that eats the skin of vegetable, fruit, or animal, also eats these protective materials marshalled on the frontier, and may benefit in its own protection thereby. Whether such a pretty hypothesis is true or not, there are suggestions that skins possess a peculiar value… The skin and adjacent part of the potato is the best part, as the Irish know. So also is it the case with the carrot, and, it is said, with young marrows, cucumbers, gherkins, artichokes, radishes, and celery. There is, therefore, a little evidence for the hypothesis.’
230 Diet and Health
A fondness for skin is an outstanding feature of the Hunza, they do not peel their vegetables, or wash and soak them to the extent we do. Vegetables play a great part in their diet and are very commonly eaten raw. ‘They are fond of raw green corn, young leaves, carrots, turnips, and, as it were to exaggerate their veneration for freshness, they sprout their pulses and eat them and their first green. This eating of sprouting pulse or gram is widespread in northern India, and undoubtedly within it there is a health which there is not in the pulse itself.’ Fuel in Hunza is scarce, and when they do cook their vegetables they are boiled in covered pots as is the usual habit in this country. ‘But the process is more comparable to our way of steaming and cooking in their own juice. Very little water is added. When this has been used up more is added. The water in which the vegetables are cooked is drunk either with the vegetables or later. The point is that it is part of the food. It is not thrown away.’ This taking of vegetable water is obviously sensible, for many of the valuable mineral salts which vegetables contain pass into the water in which they are cooked, particularly if the vegetables are peeled before cooking. ‘There is abundant evidence from the scientists of the loss that occurs through the throwing away of vegetable water of phosphorus, calcium, iron, iodine, sulphur, etc. Quite a considerable proportion of the pharmacopoeia seems to have arisen owing to this waste. Quite a considerable number of the doctors’ prescriptions and patent medicines may be due to the need to replace the salts of the food in those who suffer from this loss. The similarity of the medicines and the lost salts is too close for one not to be profoundly suspicious that the methods of cooking cause or contribute to the subsequent need of the medicines.’ The Hunza drink milk in considerable quantity, they drink it whole and they boil the fat from it to form clarified butter or ghee, which they spread on their bread and also use for cooking. They drink the buttermilk which remains, and both this and their whole milk they preserve in hot weather by souring. Meat is a ‘rare pleasure’, most of their livestock being dairy animals. They rarely eat meat more than once in ten days, and often only about once a month. When they do, they eat all that is edible in the carcass and stew it together with their vegetables and pounded wheat. But ranking above all the foregoing in the Hunza diet is fruit. ‘“The Hunza are great fruit eaters, especially of apricots and mulberries. They use apricots and mulberries in both the fresh and dry state, drying sufficient of their rich harvest of them for use throughout the autumn and winter months.” (McCarrison.) They eat the fruit fresh in season, cracking the stones and eating the kernels as well. Otherwise they take them, particularly sun-dried apricots, and eat them as they are, or rub them in water to form a thick liquid called chamus. Dried mulberries they put into cakes as we do sultanas. They do not cook their fruits. “Fruit is really the Hunza staple. It is eaten with bread, far more so than vegetables, as it is more abundant.”’ (Schomberg.) ‘“Even the animals,” said Durand, “take the fruit diet, and you see donkeys, cows and goats eating the fallen mulberries. The very dogs feed on them, and our fox-terriers took to the fruit regimen most kindly and became quite connoisseurs.”’ They ferment some of their fruit juices and on festive occasions drink their own home-made wine.
Whole Diets 231
So far the main differences between the Hunza diet and our own seems to be that the Hunza foods are all natural foods, they are eaten fresher than ours, and they are consumed whole, but there is one more difference, the most fundamental of all, and this lies in the way in which these foods are grown. In their system of agriculture which has been continued ‘century after century’ the chief factors in their plant food have been two. Firstly, there is the continuous slight renewal of the soil by a sprinkling of the black glacier-ground sand, which is brought to the fields by the aqueducts. Secondly, there is the direct preparation by man of food for the plants, given in the form of manure. The Hunza, in their manuring, use everything that they can return to the soil. They carefully collect the cattle manure and store it in the byres. They collect all vegetable parts and pieces that will not serve as food to either man or beast, including such fallen leaves as the cattle will not eat, and mix them with the dung and urine in the byres. They use the human sewage after keeping it for six months. They take silt from special recesses built in their irrigating channels. They collect the ashes of their fires. All these they mix together and make into a compost. They also spread alkaline earth from the hills on their vegetable fields on days when the fields are watered.
O. F. Cook of the Bureau of Plant Industry of the US Department of Agriculture has written: ‘Agriculture is not a lost art, but it must be reckoned as one of those which reached a remarkable development in the remote past and afterwards declined.’ As an example he cites the system of the ancient Peruvians which enabled them to support large populations in places ‘where modern farmers would be helpless’.3 Travellers who have visited both Peru and the North-West Indian Provinces have been struck by the resemblance between the stone aqueducts and mammoth walls that support the terraced fields of both areas. Describing those of Hunza the late Lord Conway wrote: The path that leads up to Baltit4 is bordered on either side by a wall of dry cyclopean masonry the undressed component parts of which are very large and excellently fitted together … a monumental piece of simple engineering … the valley between the cliffs and the edge of the river’s gorge is covered with terraced fields… The cultivated area of the oasis is some five square miles in extent. When it is remembered that the individual fields average as many as twenty to the acre, it will be seen what a stupendous mass of work was involved in the building of these walls and the collection of earth to fill them. The walls have every appearance of great antiquity, and alone suffice to prove the long existence in this remote valley of an organized and industrious community… To build these fields was the smaller part of the difficulties that husbandmen had to face in Hunza. The fields also had to be irrigated. For this purpose there was but one perennial supply of water – the torrent from the Ultar glacier. The spout of that glacier, as has been stated, lies deep in a rock-bound gorge, whose sides are for a space perpendicular cliffs. The torrent had to be tapped, and a canal of sufficient volume to irrigate
232 Diet and Health so large an area had to be carried across the face of one of these precipices. The Alps contain no Wasserleitung which for volume and boldness of position can be compared to the Hunza canal. It is a wonderful work for such toolless people as the Hunzakats to have accomplished, and it must have been done many centuries ago and maintained ever since, for it is the life-blood of the valley.
Thus it can be seen that the Hunza appear to form a direct link between the present day and that ‘remote past’ in which agriculture reached such a ‘remarkable development’. They are a people perhaps as ancient as the Incas, but who, unlike the Incas, have survived, and in their survival have preserved their ancient lore, and in the preservation of that lore have preserved the wholeness of their health and that of their crops and livestock, which Dr Wrench tells us is on a par with their own. The blight which Western civilization usually casts on such people, has so far escaped them. Whether it will continue to do so is another matter. Since they have come under British suzerainty their population has increased from about six thousand to fourteen thousand, and this has resulted in a shortage of food in the preharvest period: Colonel D. L. Lorimer, who was Political Agent at Gilgit, 1920–4, and revisited the Hunza and lived amongst them at Alibad, 1933–4, four miles from the capital, Baltit, told me that not only did they seem smaller to him at his second visit, but that the children appeared under-nourished for the weeks preceding the first summer harvests half-way through June; and, moreover, that the children suffered at that time of the year from impetigo, or sores of the skin, all of which vanished when the more abundant food came.
A sign, incidentally, that it is not by virtue of their race, or habitat, or housing, that they are normally immune from bodily ailments. We will now go from Latitude 37 to the northern and Arctic regions: from the lacto-vegetarian diet of the Hunza to the carcass diet of the islanders of Faroe, Iceland and Greenland. Early records of these peoples show them to have been every whit as healthy as the Hunza, yet these people are, or were, almost entirely carnivorous. These Danish possessions are three isolated lands from which no Western civilized person would expect to glean wisdom. But, as we have already seen in the case of food and health, isolation locks up the most valuable secrets. The peoples of these three lands, living either near or actually within the Arctic Circle, offer in three degrees, from Faroe to Greenland, an increasingly animal-fish-bird diet. It must not be called a meat diet; that is inaccurate as will be seen. It was largely a diet from the sea, and with the great health of the sea, a ‘soil’ outside the realms of terrestrial man. The diet of the Faroe Islanders, when they were more isolated than now, was given in a book published by the Edinburgh Cabinet Library in 1840. It was mainly a wholecarcass diet of animal, bird and fish. The islanders ate not merely meat, but everything
Whole Diets 233 that could be eaten. There was no such thing as offal. They also made the carcasses gamey by hanging for weeks and even months. In addition to their whole-carcass food they had barley meal, unleavened barley bread, a few vegetables such as cabbages, parsnips and carrots. They drank milk, beer, and, on festive occasions, brandy. But the main food was animal, bird and fish. The islanders numbered a few thousands, were of the same origin as the Icelanders, and were, ‘in general, remarkably intelligent. They are extremely healthy, and live to a great age, and an old man of ninety-three years lately rowed the governor’s boat nearly ten miles.’ One danger they incurred was an epidemic catarrhal fever, such as we call influenza, which ‘prevails after the arrival of the ships from Denmark in the spring’, after the winter’s scarcity. It spreads rapidly and was sometimes fatal. Otherwise, ‘but few diseases are prevalent amongst them’. The inhabitants of Iceland offer a similar and even more interesting picture of carcass diet. McCollum and Simmonds, in The Newer Knowledge of Nutrition (1929) summarize the chief facts. ‘This island was settled in the 9th century by colonists from Ireland and Scandinavia, who took with them cattle, sheep and horses. Their diet was practically carnivorous in nature for several hundred years. Martin Behaim (quoted by Burton), writing of Iceland about 1500, stated: “In Iceland are found men of eighty years who have never tasted bread. In this country no corn is grown, and in lieu, fish is eaten.”’ Burton, quoting Pearse, states that rickets and caries of the teeth were almost unknown in Iceland in earlier times… The health conditions were good and dental caries was unknown until after 1850. Stefansson exhumed 96 skulls from a cemetery dating from the 9th to the 13th centuries and presented them to Harvard University. They have been described by Hooton (1918), who found no evidence of caries in any of them. There were but three to four defective teeth in the entire series, and these had suffered mechanical injury. During the last half century caries has steadily increased in Iceland. Modern Iceland had not the isolation of the period which Burton described. There had been a great advance in civilization and population. Fifty per cent of the people now live in towns or trading stations. There are four agricultural schools. Potatoes, turnips, and rhubarb are cultivated. Iceland imports the trade foods, such as flour, sugar, preserved fruits and tinned foods. Caries has become common, as have many other ailments.
That this regrettable decline in health cannot be attributed to the change from country to town life, is proved by a remarkable experiment carried out in Denmark itself during World War I. The blockade, following the entry of the USA into the war, put the Danes in a very serious position. Professor Mikkel Hindhede, Superintendent of the State Institute of Food Research, was made Food Adviser to the Danish Government to deal with it. The problem that faced him was this; Denmark had a population of 3,500,000 human beings and 5,000,000 domestic animals. She was accustomed to import grains from the US for both. There was now a shortage of grain foods.
234 Diet and Health In this crisis Hindhede decided that a drastic reduction in the livestock must be made. So some four-fifths of the pigs were killed and about one-sixth of the cattle. Their grain food was given to the Danes, and it was given … as wholemeal bread with the extra coarse bran that is not put into ordinary wholemeal bread, incorporated. In addition to this bread, or Kleiebrot, which was made official for the whole country, the Danes ate porridge, green vegetables, potatoes and other root vegetables, milk, butter, and fruit. No grain or potatoes were allowed for the distillation of spirits, so there were no spirits. Half the previous quantity of beer was permitted. As some pigs were left, the people on the farms got meat; the people in the cities – 40 per cent of the population – got very little meat. Only the rich could afford beef. The food regulations were begun in March 1917 and were made stringent from October 1917 to October 1918. The result of this enforced national diet was a remarkable lowering of the deathrate. The deathrate, which had been 12.5 in 1914, now fell to 10.4 per thousand, ‘which is the lowest mortality figure that has been registered in any European country at any time’. (Hindhede.) Hindhede puts this impressive result in another way. Taking the average from 1900 to 1916 as 160, in the October to October year it was 66. Even in men over 65 the figure fell to 76. Hindhede attributes this extraordinarily rapid and marked change to two things: (1) less meat, (2) less alcohol. He regards the bran as having largely filled the gap of the scanty or absent meat, bran having a good proportion of vegetable meat or protein. He regards the experiment as a triumph for his previous teaching. ‘The reader knows,’ he writes in the Deutsche Medizinische Wochenschrift of March 1920, ‘how sharply I have emphasized the advantages of a lacto-vegetarian diet. I am not in principle a vegetarian, but I believe I have shown that a diet containing a large amount of meat and eggs is dangerous to health.’
And yet we have only to turn to another Danish possession (ironically enough) to find a refutation of this rather narrow view. The north-west coast of Greenland, where the Polar Eskimos live, is within the Arctic Circle. It is the most isolated and the least affected by civilization of these three possessions of Denmark. Some attempts at gardening have been introduced by the Danes, but previously the only vegetable food the Eskimos got was from the profuse but, in species, limited vegetation of the Arctic summer. Otherwise they lived mainly on sea animals and sea birds. There was no offal. They ate everything that could be eaten. When it was frozen they often ate it raw. The thick, heavy skin of the narwhal is particularly favoured. The millions of sea birds which visit their coast supply a winter store of meat and eggs. The Eskimos are also exceptionally healthy. ‘The fact that the Eskimos of this polar tribe have such excellent physique, hair, and teeth, and such superb health without any trace of scurvy, rickets, or other evidence of malnutrition,’ write McCollum and Simmonds, ‘is interesting in the light of their restricted and simple diet.’
Whole Diets 235 It is also interesting as a counterweight to Hindhede and other nutritionists who plump for the excellent lacto-vegetarian diet. There are other excellent diets, and the whole-carcass one of the Polar Eskimos is one of them.
From the far north our next jump is to the Island of Tristan da Cunha in the South Atlantic. The people of this island are people of our own race living on the products of sea and soil, most of them have perfect teeth which last them all their lives… Mr James R. A. Moore, LDS, RCS (Eng), visited the island in 1932 and again in 1937. In 1932 he examined 156 persons and 183 in 1937. Of the 3181 permanent teeth in the former year, there were 74 carious and of the 3906 in the latter year there were 179 carious. He speaks of the physique of the people as being good. They are well set up, clean and well nourished. The children are breast fed and are not weaned until at least one year old. Fish and potatoes are the staple diet, meat occasionally, milk and butter sufficient. Eggs form a big item of the island diet and are mainly Mollyhawk and penguin. Vegetables are not plentiful, but beetroot, lettuce, beans and onions are now being grown. Imported flour and sugar are regarded as luxuries, but they have been brought in to a greater extent latterly, which may account for the tendency of the teeth to deteriorate. The fat in adequate amount is provided by rendering down the carcasses of young Mollyhawks and petrels and is used extensively for frying. Sea water is evaporated to provide salt.5
It will be seen that the people of this island, also noted for their sound health,6 have a more varied diet than that of the Eskimo, though like them much of it is derived from the sea. Eggs form a large part of their diet – one of the items condemned by Hindhede. It is worth noting that a marked difference exists between the methods of cooking adopted by the Tristan Islanders and the Hunza, for whereas the latter cook everything together in one pot, the people of Tristan never partake of more than one kind of food at the same time. For our fourth example of a (once) superlatively healthy race, we must go to the North American Indian of the pioneer days. Observation of these people since they have been forced to live in reservations has been very carefully recorded. All who observed the Indians in their primitive state agree that most of them were exceptional specimens of physical development. With few exceptions, however, during two generations, they have deteriorated physically. The reason for this is apparently brought to light by a consideration of the kind of food to which they have restricted themselves since they have lived on reservations. There is no group of people with a higher incidence of tuberculosis than the noncitizen Indian. As wards of the Government they have been provided with money and land, but have in general shown little interest in agriculture. They have lived in idleness,
236 Diet and Health and have derived their food supplies from the agency stores. In addition to muscle cuts of meat they have, therefore, taken large amounts of milled cereal products, syrup, molasses, sugar and canned foods, such as peas, corn and tomatoes. In other words, they have come to subsist essentially upon a milled cereal, sugar, tuber and meat diet. On such a regimen their teeth have rapidly become inferior and badly decayed. They suffer much from rheumatism and other troubles which result from local infections. Faulty dietary habits are in great measure to be incriminated for their susceptibility to tuberculosis. Other classes of Indians, who have become successful farmers, have not deteriorated as a result of contact with civilization, except in so far as they have suffered from alcohol and venereal infections. The non-citizen Indian has suffered, not because of contact with civilization, but because he has been forced into dietary habits which are faulty. (McCollum and Simmonds.)
In the days of their prime these people subsisted mainly on the wild game of virgin forest and prairie, regions in which the law of return operated fully. For the last example I go back to the continent of Asia, to the people of rural China. Their diet is nearer to that of the Hunza than to any of the other examples we have looked at. Fruit, vegetables and sprouted grain are staples of both diets, but unlike the Hunza the principal cereal of the Chinese is rice, not wheat, and they also eat meat, birds, fish and eggs. They are in addition, as is well known, great tea drinkers. In common with the other four groups they eat the whole carcass and the whole grain or vegetable. In the matter of preparation they resemble the Hunza in that everything is eaten together. But are we justified in claiming that they are healthy? Sooner or later all advocates of organic farming cite the Chinese, going so far as to call them the fathers of good husbandry. Their authority for doing so is almost always Professor King’s famous book, Farmers of Forty Centuries. The critics of the ‘organic school’, however, challenge the accuracy of King’s report. They say that he was only in the country for a few weeks, that the Chinese people as a whole have an abnormally high death rate, and that the whole country is riddled with disease, most of which is sewage borne because the peasants fail to compost their human wastes. I have made great efforts to check these two opposing views. The truth seems to lie in the statement from Lord Northbourne’s Look to the Land, that ‘China presents remarkable contrasts between the best and the worst’. It is a vast country. Undoubtedly conditions are very bad indeed in some areas, particularly in the overcrowded cities, both as regards health and sewage disposal. But there seems equally little doubt that in certain rural areas composting of a very high order, amounting to a fine art, has been practised for centuries. But, however the overall picture should be painted, one fact seems indisputable, namely, that through the operation of the closed cycle (i.e. without the importation of chemical fertilizers) the soil of China has – despite periodic floods and famines – supported a huge population and a high culture for a period of 4000 years. For this reason, I feel
Whole Diets 237
quite justified, after having drawn attention to the other side of the picture, in once more quoting King. He was, after all, Chief of the Division of Soil Management in the US Department of Agriculture, and as such a qualified observer, recording facts as he found them. The references to the ‘Medical Testament’ contain an admirable summary of King’s findings, and it is from that document that the following account is taken. King frequently inserts into his pages the cheerful, vigorous and healthy appearance of the Chinese lower classes, the Shanghai coolies, ‘fully the equal of large Americans in frame, but without surplus flesh’; ‘their great endurance’, ‘both sexes are agile, wiry, and strong’ (Hong Kong); ‘lithe, sinewy forms, bright eyes and cheerful faces, particularly among the women, young and old’ (Canton); ‘everywhere we went in China the labouring people appeared healthy and contented, and showed clearly that they were well nourished’. Cheerfulness is, indeed, common to those peasantries who follow the old agricultural ways. The average of seven Chinese holdings … indicates a maintenance capacity of 1783 people, 212 cattle or donkeys and 399 swine – 1995 consumers and 399 rough food transformers per square mile of farmland. These statements for China represent strictly rural populations. The rural population of the US in 1900 was placed at 61 per square mile of improved farm land and there were 30 horses and mules… They [the Chinese] have long realized that much time is required to transform organic matter into forms available for plant food, and, although they are the heaviest users in the world, the largest portion of this organic matter is predigested with soil or subsoil before it is applied to the fields. This is at an enormous cost of human time and labour, but it practically lengthens their growing season and enables them to adopt a system of multiple cropping which would not otherwise be possible. By planting in hills and rows with intertillage it is very common to see three crops growing upon the same field at one time, but in different stages of maturity – one nearly ready to harvest, one just coming up, and the third at the stage when it is drawing most heavily on the soil.
This disposes of the theory that increased production and heavy cropping have been responsible in this country for our diseases in crops. The Chinese have been cropping in this way for 40 centuries. The Chinese manure or compost is made of everything that can be collected which once got its life from the soil, directly or indirectly. They are mixed together until they form a black friable substance which is readily spread upon the fields. King describes a number of different processes he saw in different parts of China. One he describes as being carried out in compost pits at the edge of a canal, a process entailing ‘tremendous labour of body and amount of forethought’. For months before his visit men had brought waste from the stables of Shanghai, a distance of 15 miles by water. This they had deposited upon the canal bank between layers of thin mud dipped from the canal, corresponding to silt collected in and taken from the recesses in the Hunza aqueducts, and left to ferment. The eight men at King’s visit had nearly filled the compost pit with this stable refuse and
238 Diet and Health canal silt. The pit was in a field in which clover, with its peculiar power of taking nitrogen from the air, was in blossom. This was to be cut and piled to a height of five to eight feet upon the compost in the pit, and also saturated layer by layer with canal mud. It would then be allowed to ferment 20 to 30 days, until the juices set free had been absorbed by the winter compost beneath and until the time that the adjacent land had been made ready for the coming crop. The compost would then be distributed by the men over the field. At another time he saw a compost pit within a village in which had been placed all the manure and waste of the households and streets, all stubble and waste roughage of the fields, all ashes not to be applied directly, mixed up with some soil. Sufficient water was added to keep the contents of the pit saturated and to promote their fermentation. All fibres of organic material have to be broken down, which may require working and reworking, with frequent additions of water and stirring for aeration. Finally the mixture becomes a rich complete fertilizer. It is then allowed to dry and is finely pulverized before it is spread upon the land. Every foot of land, says King, is made to provide food, fuel, or fabric. ‘The wastes of the body, of fuel and fabric, are taken back to the field; before doing so they are housed against waste from weather, intelligently compounded and patiently worked at through one, three or even six months, in order to bring them into the most efficient form to serve as manure for the soil or as feed for the crop.’
These then are the five peoples7 which either still enjoy an exceptional measure of health, or else until very recently have done so. What have they in common? Not race, for the groups include white, brown, red and yellow races. Not climate – there could hardly be greater contrasts than between the plains and hills of rural China or the prairies of North America and the precipitous mountain crags of the northern provinces of India, or than between the frozen north and the luxuriant warmth of Tristan da Cunha. Not diet – in the ordinary sense – for these range from the lacto-vegetarian diet of the Hunza to the almost purely carnivorous diet of the Eskimo, with almost every variant in between. Not methods of preparing their food either, for though there are certain resemblances – as between Hunza and Chinese for example – no methods are common to all five. In fact it seems clear that it is not in kind at all that we must look for our common factor, but in quality. All five groups have good air to breathe, but that cannot by itself be the secret of their health, or our own hill and country dwellers would have health to compare with theirs, which, unfortunately, they have not. The only discernible common factor, other than good air, seems to be that the diets of all five groups are ‘whole’ diets in the full sense of the word. That is to say: (a) every edible part contained in the diet is consumed; (b) in every case the foods are grown by a system of returning all the wastes of the entire community to the soil in which they are produced. For the sea, too, is a ‘soil’ in this sense, supporting
Whole Diets 239
its teeming population by means of the rule of return – the everlasting cycle of life and decay; (c) all the foods are natural unprocessed foods; and (d) the diets start before life begins; the parent is as healthy as the child. There is a complete and continuous transference of health from a fertile soil, through plant and/or animal to man, and back to the soil again. The whole carcass, the whole grain, the whole fruit or vegetable, these things fresh from their source, and that source a fertile soil. Herein appears to lie the secret. If this be true, then the answer to our question, put at the beginning of this chapter, would appear to be that any diet is a health-promoting diet so long as it conforms to these three rules, and the first of these is a fertile soil. The importance of the method of culture of food is primary, radical, and fundamental in the matter of health. It exceeds all other aspects of nutrition – if, that is, one separates any aspect of what is a whole.
In the case of diets based on agriculture, such a view brings us back again to humus farming. [It also served to emphasize the need for further investigation, and so led to the establishment of the Haughley Experiment.]
Notes 1 2
3 4 5 6 7
Unless otherwise stated, all quotations in this chapter are taken from this book. When Dr Wrench wrote this, he was clearly unaware of the intensive study of health carried out by Drs G. Scott-Williamson and Innes Pearse known as ‘The Peckham Experiment’, and the definition of health that resulted from it. (See Part II, also new introduction to Part I.) So far, however, this extremely important and inspired piece of research remains the only investigation of its kind ever to have been undertaken. ‘Staircase Farms of the Ancients’, National Geographic Magazine, May 1916. The capital of Hunza. Ref. to ‘Medical Testament’. For further information on health conditions in Tristan da Cunha see Erling Christophersen, Tristan da Cunha, English translation published by Cassell, London, 1940. It appears that to this list should be added the people of Prince Edward Island. See report by Dr Enid Charles in the Canadian Journal of Economics and Political Science, VIII, 1942.
12
The Nutrition Transition and its Health Implications in Lower-income Countries Barry M. Popkin
Human history is characterized by a series of changes in diet and nutritional status. This pace of change has quickened considerably over the last three centuries.1,2 Before that, major changes in diet and nutritional status occurred infrequently and one could argue that there were relatively few changes in diet for the first several million years of existence of the human race. This article focuses mainly on current stages in the nutrition transition. The concept of transitions or movement from one state or condition to another is used to capture the dynamic nature of diet, particularly large shifts in its overall structure. Many of the same factors that explain shifts in diet also explain those in physical activity and body composition. This work is based on the premise that the transition to the age of degenerative diseases is avoidable and that an understanding of the patterns and sources of change will serve as a basis for future interventions at the population level to lead to more healthful transitions. A similar concept of transitions is embodied in the theory of the demographic transition – the shift from a pattern of high fertility and mortality (typical of less developed countries decades ago and of 18th-century Europe) to one of low fertility and mortality (typical of modern industrialized nations today). Even more directly relevant is the concept of the epidemiological transition, which focuses on changes in patterns of disease and causes of mortality. As first conceptualized by Omran,3 the epidemiological transition moves from a pattern of a high prevalence of infectious diseases and malnutrition to one in which chronic and degenerative diseases predominate. Accompanying this progression from an earlier stage of pestilence, famine and poor environmental sanitation to the later stage of chronic and degenerative diseases strongly associated with life-style, is a major shift in age-specific mortality patterns and life expectancy. Both of these concepts of transitions share a focus on how populations move from one stage or condition to the next. There have been large changes over time in diet and physical activity, especially their structure and overall composition. These changes are reflected in nutritional Reprinted from Popkin B. 1998. The nutrition transition and its health implications in lower-income countries. Public Health Nutrition 1(1), 5–21.
The Nutrition Transition and its Health Implications in Lower-income Countries 241
outcomes such as stature and body composition. Furthermore, these changes are paralleled by changes in life-style and health status, as well as by major demographic and socioeconomic changes. For example, during the early stages of human evolution (from about 3 million to about 10 thousand years ago), human subsistence was based primarily on a pattern of gathering, scavenging and hunting. The diet these early humans consumed was varied, low in fat and high in fibre. Physical activity levels were high. In consequence, early Homo sapien hunter-gatherers tended to be taller and more robust, and suffered fewer nutritional deficiencies than humans who lived in settled communities during the period of early agriculture. These early agriculturalists’ diet was much simpler and subject to tremendous fluctuations. After 10–12 thousand years of this second stage, the Industrial Revolution and a second agricultural revolution led to a considerable reduction of problems of famine, large shifts in diet and increased stature. This period was followed by a marked shift to the high-fat, refined carbohydrate, low-fibre diet which marks most high-income societies today. Also, an increase in obesity and all the degenerative diseases of Omran’s final stage occurred. There is some indication that a new stage of behavioural change related to the reaction to man-made diseases is occurring in selected populations. These five periods are: • • • • •
the age of collecting food; the age of famine; the age of receding famine; the age of degenerative diseases; the age of behavioural change.
For this article, I focus mainly on the periods that relate to the circumstances most lower- and middle-income countries face – that is, a period where famine has receded and degenerative diseases are rapidly emerging. The theory of the nutrition transition posits that these changes or stages relate to the complex interplay of changes in patterns of agricultural, health and socioeconomic factors, among others (for further detail see Popkin1,2). For this article, the major issues that are considered are demographic and economic changes. The emergence in the last quarter of the 20th century of obesity as an epidemic among higher-income countries is acknowledged and has been of great concern in these countries. While the specific effects of the shifts in the patterns of diet and activity vary from population to population, both are important. We now face the emergence of obesity as a worldwide phenomenon affecting the rich and middle-income people alike in middle-income countries and also affecting countries previously considered to be poor. This emergence and prevalence of obesity, with all its related health complications, is felt to have major health complications. I note later in the article that this obesity epidemic has been linked in low- and middle-income countries with a rapid increase in the prevalence, as well as earlier age for the onset, of non-insulin-dependent diabetes mellitus (NIDDM). Other well-known complications of excess adiposity which are not discussed include coronary heart disease, many cancers and a large proportion of disabling osteoarthritis.
242 Diet and Health
The attention given by the food and nutrition communities in countries such as China, Brazil and many lower-income countries has focused on problems of under-nutrition but information is presented here to indicate an emerging paradigm with obesity being the dominant problem or with an ever-increasing obesity problem coexisting with one of dietary deficit. Furthermore, these rapid shifts in obesity, caused by shifts in diet and activity, are linked with rapid increases in NIDDM and other related chronic diseases. This increase is found in countries whose populations are more genetically susceptible and in other nations. This combination of very rapid shifts in diet and activity and the emergence at very early stages of economic improvement of high rates of chronic disease forces us to focus attention on this topic. After a brief introduction to the data and measures, the article first introduces the major underlying social and demographic changes, then the dietary and physical activity changes, followed by a discussion of the evidence of the obesity epidemic and NIDDM as it relates to this transition.
Methods Data Data came from a large number of sources, mainly nationally representative or large nationwide surveys. In addition I use national data sets such as food balance sheets and national income accounts. A thorough presentation is made of the China Health and Nutrition Survey (CHNS), an ongoing, longitudinal survey of eight provinces in China. A multistage, random, cluster sampling procedure was used to draw the sample from each province. Additional detail on the research design of this survey is presented elsewhere.5 For some of the information on obesity patterns and trends, the focus is mainly on larger and more representative samples of adults. Our selection criteria for presenting data from other surveys was size, sampling design and geographic area. If a study was representative of a region or country, it was always used. If it came from a region with few studies and did not fit the criteria of national representativeness, I used it if the sample size was large and it seemed reasonably representative. Note that I use the term region only to fit a cluster of countries and not an area within a country. National food consumption data came from the Food and Agriculture Organization of the United Nations (FAO) food balance sheets for the period 1962– 1990, now available in the FAOSTAT database.6 Data on food availability are combined to express in percentage terms daily energy from macronutrients, with the official estimates of gross national product (GNP), as established by the World Bank.
The Nutrition Transition and its Health Implications in Lower-income Countries 243
Measures For the national food consumption and economic pattern analysis, GNP per capita was expressed in 1993 American dollars to allow for an easier comparison of the results. Regression analyses were used to relate dietary data (the proportion of energy from vegetable and animal fats, carbohydrates, caloric sweeteners and protein) for those countries for which full sets of data were available in 1962 and in 1990 to the logarithm of per capita GNP. This research used all countries for which both sets of data were available – 98 in 1962 and 133 in 1990. These results were not changed when looking only at a set of countries with full sets of data in both 1962 and 1990. The regression analysis also included an urbanization variable. Although GNP and the extent of urbanization were closely linked before World War II, this is clearly no longer the case and many lower-income countries now experience very high rates of urbanization. Throughout the text the term lower income is used to describe a quite heterogeneous group of nations. In addition, the term less and more developed nation is used in this article interchangeably with lower income. In the regression analyses, the percentage of energy from each macronutrient was regressed on GNP per capita, the proportion of the population residing in urban areas that year, and an interaction term between GNP per capita and the proportion of urban residents. All variables in this regression were highly significant. Body mass index (BMI) is the standard population-based measure of overweight and obesity status. For adults, the cut-offs used to delineate obesity are less than 18.5 for thinness (chronic energy deficiency), 18.5 to 24.99 for normal, 25.0–29.99 for overweight grade I, 30.0–39.99 for overweight grade II, and 40.0 and above for overweight grade III.7 For this article, grades II and III are combined.
Factors Underlying the Nutrition Transition It is useful to consider demographics and economics, two of the propositions that affect diet and activity which are changing very rapidly.
Proposition 1: Major shifts in population growth, age structure and spatial distribution are closely associated with nutritional trends and dietary change No attempt is made here to address all aspects of this proposition but rather to focus in some detail on one of the most powerful sets of shifts linked with demographic change – rapid urbanization. Evidence indicates a most pronounced association of urbanization with the shifts in diet and activity and body composition. People living in urban areas consume diets distinctly different from those of their rural counterparts. City dwellers have led the movement from the pattern of
244 Diet and Health
famine to the patterns of receding famine and the rise of degenerative disease. Compared with rural diets, urban diets show trends toward consumption of the following: • • • • • •
superior grains (e.g. rice or wheat, rather than corn or millet); more milled and polished grains (e.g. rice, wheat); food higher in fat; more animal products; more sugar; more food either prepared away from the home or processed.
The potential impact of urbanization on diet structure is shown by this regression model. The model used FAO food balance sheets and World Bank economic indicators data for 1990. The regression relating GNP per capita to the outcomes of energy from each food source includes as a covariate the proportion of residents residing in urban areas and an interaction between the proportion urban and GNP per capita. For the purposes of clarification of the impact of shifts in urbanization, the results of those regressions were used to predict (simulate) the diet structure with the proportion of urban residents worldwide at either 25 or 75 per cent. As shown in Figures 12.1 and 12.2, for higher rates of urbanization, the simulation developed from our model predicts a substantial increase in the consumption of sweeteners and fats. The clear implication is that a shift from 25 to 75 per cent
Source: Food balance data from the FAOUN; GNP data from the World Bank; regression work by UNC-CH
Figure 12.1 Relationship between the proportion of energy from each food source and gross national product per capita with the proportion of the population residing in urban areas placed at 25 per cent, 1990
The Nutrition Transition and its Health Implications in Lower-income Countries 245
Source: Food balance data from the FAOUN; GNP data from the World Bank; regression work by UNC-CH
Figure 12.2 Relationship between the proportion of energy from each food source and gross national product per capita with the proportion of the population residing in urban areas placed at 75 per cent, 1990
urban population in very low-income countries would be associated with an added four percentage points total energy from fat and an additional 12 percentage points energy from sweeteners. When analysis is undertaken at the country level, it is clear that these contrasts between urban and rural eating patterns are more marked in lower-income than in higher-income countries. In higher-income countries, market penetration into rural areas is common, and nationally integrated food distribution systems exist. Nevertheless, higher-income countries show important urban–rural differences in eating patterns, especially in consumption of food prepared away from home8 and responsiveness to information and the influences of mass media. Even in higherincome countries, large differences between urban and suburban food and labour markets, in combination with other factors related to residence, result in distinct dietary and nutritional status patterns. Key factors responsible for urban–rural differences in dietary intake and resulting differences in nutritional status include: • • •
better transportation and marketing systems in urban areas that provide greater availability of food during periods of seasonal shortage; greater penetration of marketing activities of the processed commercial food sector into the denser urban markets; greater heterogeneity of urban populations with respect to dietary pattern;
246 Diet and Health
• • •
different occupational patterns, characterized in urban areas of reduced compatibility of jobs with home food preparation and child and elder care; different household structures related to a wide range of economic and social factors; different disease and health service use patterns.
(For a more detailed review of dietary aspects of urbanization, see Popkin and Bisgrove.9) Key dimensions of world urbanization Several major demographic shifts began in the post-World War II period and continue unabated and have even accelerated in some regions. One is the vast increase in the proportion of persons who reside in urban areas. A second is urban agglomeration. A third is the shift of poverty toward the urban areas, particularly toward squatter and slum areas. Proportion living in cities Urban growth was relatively modest before the Industrial Revolution. Rapid urban development first occurred in the higher-income countries; now, lower-income countries are undergoing even more rapid urbanization. In the last half of the 20th century, urbanization resulting from migration and natural increase has become a dominant factor in all regions and shows no signs of abating. The proportion of persons living in urban areas in developed and developing countries has changed significantly since 1950. Table 12.1 shows that the higher-income world is comprised predominantly of urban residents today which is not the case for the less developed and poorest least developed countries.10 Nevertheless, by 2025 urban residency will be the common form of residence throughout all but the poorest African countries. The continuation of the migration of rural residents to urban areas more than offsets the much lower urban fertility rate and leads to the quite different patterns of growth in urban and rural areas. Table 12.2 shows that these patterns accelerate in the next century. Table 12.1 Urban population, 1970, 1994 and 2025 Urban population (millions)
Urban share (percentage)
Region
1970
1994
2025
1970
1994
2025
World
1353
2521
5065
36.6
44.8
61.1
676
1653
4025
25.1
37
57
38
122
506
12.6
21.9
43.5
677
868
1040
67.5
74.7
84
Less developed regions Least developed countries More developed regions
Source: United Nations: Population Division, 1995
10
The Nutrition Transition and its Health Implications in Lower-income Countries 247 Table 12.2 Average annual growth rate of urban and rural population, less developed regions (percentage) Region
1965–70
1990–95
2020–25
Less developed region urban rural
3.58 2.18
3.51 0.96
2.33 –0.28
Africa urban rural
4.64 1.98
4.38 2.03
3.34 0.72
Asia urban rural
3.28 2.34
3.68 0.81
2.31 –0.57
Latin America urban rural
3.97 0.81
Oceania urban rural
7.26 1.62
2.6 –0.2
1.26 –0.61
3.13 1.9
3.32 0.22
Source: United Nations: Population Division, 199510
Concentrated population growth Urban growth, particularly in lower-income countries, has been skewed towards a few larger cities, often called urban conglomerates. These cities of 5–27 million dominate many countries and are growing much faster in the less developed than in the more developed regions of the world. Nevertheless, in the lower-income world, more than half of the urban residents reside in smaller and medium sized cities with populations less than 500,000.10 As is seen in Table 12.3, the most explosive growth of these mega-cities is in Asia. Table 12.3 Mega-cities, number 1970–2015 Region
1970
1994
2000
2015
World
11
22
25
33
Less developed region
5
16
19
27
Africa
0
2
2
3
Asia
2
10
12
19
Latin America
3
4
5
5
6
6
6
6
More developed regions
Note: Mega-cities have 8 or more million residents. Source: United Nations: Population Division, 199510
248 Diet and Health
Shift in the proportion of poor to the cities Concomitant with increased concentration of the population in urban areas is a dramatic shift in the proportion of poor people living in cities. In absolute and relative terms, the majority of the poor of the lower-income world live in cities. By the year 2000, it is estimated that 57 per cent of the poor will live in urban areas.9,11 Estimates of the distribution of the poor are rare. The one used by the World Bank was the subject of extensive research. While it is old, it is felt to be more carefully prepared than many more current projections. However, it is estimated that a majority will reside in dense slums or makeshift dense squatter settlements. At the same time a disproportionate share of the upper income and upper-middle income population also lives in urban areas. Migration An important dimension of urban growth is its associated pattern of migration. Migration from rural areas to cities (and to a lesser extent from small to larger cities) and international migration have affected diet profoundly. For example, populations of Samoans who moved to San Francisco, Polynesians and Maori who moved to New Zealand, Japanese who moved to the US and Yemenite Jews who moved to Israel all showed large changes in diet, followed by large increases in dietrelated chronic diseases.12–15 In other research, a national survey of American adolescents examines the effects of generation of birth in the US. In this work, first-generation Americans are defined as those born outside the US. It was found that there is more than a doubling of obesity of Asian-American and Hispanic adolescents between the firstgeneration and second-generation Americans (those born in the US). With about 3400 Hispanics and over 2000 Asian-Americans in the nationally representative sample, the likelihood of being obese increased from 23.2 to 32.6 per cent among Hispanics going from the first to second generation and 10.7 to 24.6 per cent for Asian-Americans. The 85th percentile reference7 was used for obesity.16 As discussed below in reference to the Barker metabolic programming hypothesis,17,18 it is possible that the increased obesity in these immigrants is explained partially by fetal and infant nutrition insults: however, we feel that there is potential for an independent environmental component which may explain this American experience.
Proposition 2: Changes in income, patterns of work and leisure activities and related socioeconomic shifts lead to changes in women’s roles and shifts in dietary and activity patterns A major change in economic structure associated with the nutrition transition is the shift away from a pre-industrial agrarian economy and towards increasing industrialization. This transformation then accelerates; the service sector grows
The Nutrition Transition and its Health Implications in Lower-income Countries 249
Source: World Bank, 53 countries, over a 23-year period
Figure 12.3 Shifts in the distribition of occupation, 1972–1995
rapidly, industrial production is dominated by capital-intensive processes and time-allocation patterns change dramatically. Associated socioeconomic changes especially important in the nutrition transition phenomenon are (a) changes in the role of women (especially with respect to patterns of time allocation); (b) changes in income patterns; (c) changes in household food-preparation technology; (d) changes in food production and processing technology; and (e) changes in family and household composition. The sectoral distribution of the labour force towards industry and service has accelerated around the world. Figure 12.3 presents data on this pattern for higherand lower-income countries. It shows for all lower-income countries a pronounced move away from agriculture and towards manufacturing and service employment. As has often been shown, the most labour-intensive agricultural work requires the greatest amount of energy expenditure. One of the most inexorable shifts with modernization and industrialization is the reduced use of human energy to produce more capital-intensive manufacturing and goods and services. The result is obviously a marked shift in activity patterns at work, a trend particularly associated with our shift into increasingly capital-intensive production and increasingly sedentary manufacturing, service and commercial work. This within-occupation shift in energy expenditure cannot readily be shown with national data. It requires individual level information. Unfortunately, few longitudinal studies attempt to measure physical activity and energy expenditures. One quite simple measure of overall activity has been collected in each survey from 16,000 Chinese as part of the CHNS. Table 12.4 shows the shifts in the proportion of Chinese adults involved in low levels of physical activity at work. In particular, urban residents in all income groups were more likely in 1993 to have adopted a more sedentary activity pattern. Elsewhere,
250 Diet and Health Table 12.4 Distribution of physical activity of Chinese aged 20–45 years, by thirds of household income and residence, CHNS 1989, 1991 and 1993 Household income per capita thirds Low 1989
1991
Middle
High
1993 1989 1991 1993 1989 1991 1993
Urban residence lowest level activity
23.7b,** 34.3b 42.6 35.5* 45.4 42.8 44.5* 58.3 55.5a
middle level activity
49.6b,* 30.1
highest level activity
26.7
b
30.2 46.1* 39.7a 40.6 48.0* 34.5 32.0a
35.6 * 27.2 18.4 14.9 16.6 b,
7.5
7.2 12.5a,*
Rural residence lowest level activity (%)
15.3*
3.9b
middle level activity (%) 22.2b,** 5.3b highest level activity (%) 62.5 ** 90.8 b,
b
4.8b 16.2* 12.3 12.6 23.7a 24.8 19.8 7.9b 28.9* 14.1 13.3 35.2* 24
26.8*
87.3b 54.9* 73.6 74.1 41.1* 51.2 53.4
a
The proportion differs significantly from middle- and high-income groups within same year (P < 0.05). b The proportion differs significantly among three income groups within same year (P < 0.05). * The proportion differs significantly from corresponding value in other 2 years (P < 0.05). ** The proportion differs significantly from corresponding value among the 3 years (P < 0.05).
this is linked with significant increases in BMI and obesity.19 In contrast, this pattern was not seen in the rural areas. In fact, rural residents, particularly low-income ones, showed a significant change from low and moderate activity patterns towards a high physical activity pattern and related to that, an increase in chronic energy deficiency measured by a BMI below 18.5. Related to the effect of industrialization and modernization on market production is a similar shift in time allocation and physical effort in home and leisure activities. Since the discovery of fire, a key thrust in the continuing development of household technology for processing and storing food has been to save time and enhance the quality of life. In the last century, the evolution of household technology seems to have accelerated. In food-preparation technology, recent developments include efficient ways to prepare and store food (canning, refrigeration, freezing, radiation treatment, packaging, etc.); food processing with tools such as electric mixers and food processors; and cooking with pressure cookers, cookware made with improved metals and alloys, metal stoves using various fossil fuels, and microwave ovens. These food-preparation technologies, together with home electrification, washing machines and clothes dryers, vacuum cleaners, piped water, and so forth have transformed home production from a time-consuming, often back-breaking, full-time occupation for peasant or working-class women. Although home production still requires time and energy, purchased technology where accessible can help save time for those who engage in home production activities. One way to see how these household technologies have made transformations in a society is to
The Nutrition Transition and its Health Implications in Lower-income Countries 251
examine the studies of the introduction of electricity to agricultural societies, which show large, rapid transitions in the use of time, the roles of various household members and other social factors.20 Herrin’s classic study on the impact of electrification on the lives of families in poorer regions has demonstrated the profound shift in the use of time related to the use of electricity. Possibly an even more astounding shift has come in leisure activities. In the past, leisure activities for children often meant active play, but leisure today may mean a quite sedentary activity such as watching television or playing a computer game. Documentation of such patterns across the lower-income world is not available in terms of time spent and the shift in activities. This area needs greater focus. Income patterns Income is an important element in the nutrition transition because it measures control over the flow of goods and services. In other words, income allows one to purchase goods or services that can affect diet and activity, and nutritional status. Three key issues relating income to nutrition are (a) the effect of income changes on dietary structure; (b) the effect of income changes on the amount of energy, protein and fat consumed; and (c) the effect of change in the structure of the economy, particularly the change to commercial agriculture on the nutritional status and diet of subsistence agriculturalists. The effect of income in purchasing the assets and technologies that in turn affect time use, diet and activity patterns noted above, is equally important but not discussed here. As Figures 12.1 and 12.2 show, increasing income is strongly associated with changes in the proportion of energy in the diet from various sources. What has been shown more recently, however, is that the strength of the income and dietary fat relationships have been somewhat uncoupled at the national level. Figure 12.4 presents a regression of the proportion of total, vegetable and animal fat on GNP. The results show a strong flattening of the relationship and a shift towards much higher consumption of dietary fat among poor nations than was previously known. In other words, lower-income countries are now able to afford the types of higherfat diets that previously were accessible only to middle-income countries. These relationships between income and diet noted in Figures 12.2 and 12.3 have an important culture-specific component. The responsiveness of dietary total energy, total and saturated fat, and other macro- and micro-nutrients to income change depends upon the nature of the demand for particular foods and by overall eating patterns. For example, in the Philippines, the coconut palm is a major source of cooking oil, and income increases are associated with increased awayfrom-home consumption of foods that are frequently fried; thus, saturated fat and total fat consumption are highly responsive to income increases, particularly those accruing to women.21,22 Similarly, in China, pork consumption is highly responsive to increases in income, which thus result in large increases in the proportion of energy from fat.5,23,24 In contrast, where income increases are spent on more elaborate packaging and processing or higher quality of specific foods, rather than
252 Diet and Health
Source: Regressions run with food balance data from FAOUN; GNP data from the World Bank
Figure 12.4 Relationship between the percentage of energy from fat and GNP per capita, 1962 and 1990
larger quantities of food or shifts in the types of foods, changes in income will have less effect on dietary structure. A related point is that while the GNP–fat intake relationship has flattened, it is shown elsewhere that there remain in all countries important relationships between income and fat consumption at the individual and household level.25 A second apparent relationship between income and diet is that as income increases (beyond the point where total food energy needs are met), people spend more per food item,26 partly to obtain higher quality. As many authors have shown, food demand is much more price- and income-elastic among the poor than among higher-income groups.26,27 Changes in diet with increased income also relate to the reduced time needed to consume higher quality and higher priced goods that have undergone more processing before purchase.28 Income has been and will continue to be an important identifier of groups at risk of either nutritional deficiency or nutritional excess. Income and more complex measures of socioeconomic status that incorporate other dimensions of social and economic well-being, such as education, asset ownership, occupation and various more qualitative measures of ‘status’, are useful in identifying problems of deficit in all societies and problems of excess associated with the pattern of degenerative disease. For lower-income countries, a crucial dimension of the relationship between socioeconomic status and nutrition is the distribution of chronic disease risk factors
The Nutrition Transition and its Health Implications in Lower-income Countries 253
by income group. In higher-income countries, the poor are far more likely to suffer from obesity, NIDDM, coronary heart disease (CHD), and other chronic diseases.29,30 This has not been found in lower-income countries, although this pattern is slowly changing. For instance, a recent World Bank study on adult health in Brazil31 indicates that where income constraints among the poor are not too severe, many risk factors for cardiovascular disease will likely be greater among the poor than among the rich. This inverse income-obesity relationship is beginning to be found in larger sub-population groups in Brazil2 and in other Latin American countries.32 Within the next 10–20 years, in most of Latin America and many parts of Asia, obesity and NIDDM will become problems of poverty. There are already indications that this is occurring in South Africa.33 The rapid increases in obesity found in lower-income countries are discussed below together with the consequences of this change.
Intermediate Factors: Diet and Physical Activity While nutrition researchers have typically focused on the study of diet, it is no longer the only issue of concern. Diet and physical activity are intertwined, and interactions between energy intakes and expenditures are amenable to intervention. It may very well be that the rapid reduction in physical activity rather than diet explains as much or more of the increased obesity facing lower and transitional income countries. Research is needed to quantify the relative impact of each set of factors.
Physical activity As noted above, the remarkable shifts in occupations and in travel to work along with changes in the nature of home production and leisure activity have had profound effects on activity patterns throughout the world. Few studies have measured this shift in activity and energy expenditures. One quite simple measure of overall activity has been collected in each survey from 16,000 Chinese as part of the CHNS. It has been reported elsewhere that a remarkable shift in activity patterns for adult Chinese occurred between 1989 and 1993 as shown in Table 12.4.2
Structure of diet Most researchers have focused on the shift from diets high in complex carbohydrates and fibre to those with a higher proportion of fats, saturated fats and sweeteners. But underlying these broad patterns are major shifts in the type of staples selected, and in the overall diversity of the diet. In most countries one of the first shifts is from lower quality or inferior staples to those deemed to be of higher quality.
254 Diet and Health
In one country lower quality might be millet, in another it might be sorghum or cassava. This shift is accompanied or followed rapidly by the decline in the proportion of energy from these basic staples. The work undertaken to date on this nutrition transition seems to show remarkable congruity in the broad shifts in diet and in the ever-increasing shift towards higher-fat diets in all regions of the world. Little has been done systematically to lay out the role of the array of socioeconomic, technological and other factors that explain this shift. The best work has been done on the role of urban residence (e.g. the work of Bourne et al34,35) and its relationship to eating habits. The shifts in the proportion of energy from fat, protein and carbohydrates provide some sense of the broader shift. At the country and individual level, studies have been conducted in China5 and Brazil36 to provide examples and present information from a selected set of food groups from China to highlight the food shifts. As shown in Table 12.5, there is a marked shift away from grains and tubers towards fats, meat and eggs amongst other things. In addition, there are marked differences in the diets of lower-, middle- and higher-income thirds in this country with a much smaller income distribution than is found in many countries. Table 12.5(a) presents the average intake for each food for low-, middle- and upper-income adults in 1989 and then presents the change for these adults over a four-year period. Table 12.5(b) presents the proportion who consume each of these foods and the shift in the proportion (percentage points) who consumed them between 1989 and 1993. Essentially this table shows that lower-income adults consume more carbohydrates and vegetables and less meat, eggs and oils. Moreover, over time there is a pronounced trend towards a reduced consumption of grains, tubers and corn products, and an increase in consumption of meat and meat products, eggs and oils. Table 12.5(b) shows that while per capita intake is changing markedly towards higher intake of fats, eggs and meats, a greater proportion of individuals is consuming many grain and vegetable products. In this table, a food grouping system is used that was developed to separate the Chinese food composition table into 33 distinct food groups. Then the number consumed by each person is added up to present mean intake and the proportion with high and low numbers of food groups consumed. It is noteworthy that there is a marked increase in diversity of the Chinese diet, but the total amount consumed of many starchy staples and other higher fibre and nutrient-rich plant-based foods is being rapidly reduced. It is essential not to ignore the benefits of this shift. The new Chinese diet is more diverse and linked to reduced under-nutrition. This trend towards a more diverse diet is seen systematically in most countries in Asia, Africa and Latin America. The diet of grains and tubers mixed with small amounts of condiments, possibly a few legumes and a small amount of meat/fish/poultry is clearly not the diet desired by the population. Using our China-UNC-CH food grouping system of 40 groups, with alcohol and condiments removed, the shift towards a more diverse diet is seen by examining the move from a very low diversity to a highly diversified diet in Table 12.6. Over time, the proportion of Chinese of all income groups who
11.7 133.0
Tofu
Tofu products
Starchy roots
2.2 7.1
Organ meats
Eggs and egg products 12.9
2.2
Meat products
Plant oils
4.2
Poultry and game
3.8 29.1
High-fat red meat/dishes
318.7
Low-fat red meat/dishes
Other vegetables
78.8
23.0
Legumes
Carotene-rich vegetables
29.7 12.7
Coarse grains
69.4
176.2
Wheat flour
Fresh and dried corn
317.0
Whole steamed/boiled rice
1989 (g/capita/day)
12.6
2.8
–0.2
–0.7
–0.6
2.0
2.2
–55.6
–2.6
–77.5
–1.2
–3.2
–1.3
–14.7
–38.4
5.6
–40.4
Change from 1989 to 1993
Bottom third
15.5
9.2
3.3
2.1
6.4
44.6
6.1
264.4
82.6
63.0
13.1
28.5
10.9
10.6
28.0
145.4
322.2
1989 (g/capita/day)
16.1
6.0
0.5
0.7
3.0
5.3
5.2
–1.9
9.9
–27.4
1.3
–6.0
–2.5
–2.9
–9.8
–39.7
–10.6
Change from 1989 to 1993
Middle third
17.3
16.3
4.3
3.4
7.9
53.8
8.9
230.3
73.4
41.8
16.9
23.7
12.1
6.6
20.4
151.2
287.3
19.2
4.2
0.2
–0.1
4.6
17.1
10.2
7.7
12.7
–13.6
–0.6
1.3
–2.2
2.2
–10.3
–72.5
–10.3
Change from 1989 to 1993
High third 1989 (g/capita/day)
Table 12.5(a) Changes in Chinese food consumption categorized by income group
The Nutrition Transition and its Health Implications in Lower-income Countries 255
Middle third
High third
92.3
Carotene-rich vegetables
Other vegetables
56.6
Plant oils
4.4
Organ meats 14.9
3.8
Meat products
Eggs and egg products
5.8
Poultry and game
6.6
42.4
Starchy roots
36.8
38.6
Tofu products
High-fat red meat/dishes
22.0
Tofu
Low-fat red meat/dishes
18.9 25.5
Legumes
31.2 12.9
Coarse grains
Wheat flour
Fresh and dried corn
72.4 45.7
Whole steamed/boiled rice
30.6
7.8
–0.4
–0.0
0.8
7.0
2.5
4.0
6.0
–0.5
2.1
1.1
–3.6
–2.7
–9.5
–0.8
1.3
63.3
24.5
7.7
4.3
10.0
57.5
13.2
92.7
56.1
34.6
28.0
34.1
18.7
9.7
17.6
57.5
84.3
24.3
10.1
1.4
1.1
3.8
3.5
3.9
3.2
3.9
–1.8
3.3
–0.0
–3.9
–1.0
–3.1
–18.4
2.5
69.7
40.9
11.0
6.9
14.1
69.1
18.6
95.7
60.3
32.7
35.7
33.3
19.6
9.4
16.1
67.6
90.7
19.7
3.7
0.4
–0.3
5.8
6.7
8.5
1.2
8.9
–3.0
0.4
3.3
–4.9
1.2
–5.3
–30.2
0.9
1989 Change in % from 1989 Change in % from 1989 Change in % from (% consuming) 1989 to 1993 (% consuming) 1989 to 1993 (% consuming) 1989 to 1993
Bottom third
Table 12.5(b) Changes in the proportion of Chinese consuming each food group categorized by income group
256 Diet and Health
The Nutrition Transition and its Health Implications in Lower-income Countries 257 Table 12.6 Diversity in the Chinese diet: the number of food groups consumed by Chinese adults aged 20–45 years, CHNS 1989–1993 Income thirds Year
Low
Medium
High
Total
1989 Sample size
1892
1889
1834
5615
Mean score Score < 5(%) Score > 10 (%) 1991 Sample size Mean score Score < 5(%) Score > 10 (%) 1993 Sample size
6.5
7.7
9
7.7
17.1
6.8
3.5
9.2
4.4 1855
12.1 1918
29.6 1839
15.2 5612
7.4
8.1
9.6
8.2
10.7
6.6
1.8
6.4
5.9 1749
17.8 1814
35.2 1680
19.5 5243
Mean score
7.3
8.5
9.7
8.5
Score < 5(%)
6.6
2.8
1.2
3.5
Score > 10 (%)
9
21.8
36
22
Note: The range of diversity scores is 1–33.
consume very few food groups (five was selected) has declined while those who consume more than ten increases.
Body Composition One consequence of this nutrition transition has been a decline in under-nutrition accompanied with a most rapid increase in obesity. In all age groups, there is evidence of a rapid increase in obesity and also an array of dietary excess and body composition-related health outcomes such as glucose intolerance and diabetes. Monteiro et al36,37 (also Monteiro, forthcoming38) has documented this shift away from undernutrition most clearly for Brazil.
Programming – a potential link David Barker and colleagues at the University of Southampton17,18 have brought into the mainstream the notion of metabolic programming: that early insults operating at a critical period in development result in long-term changes in the structure or function of an organism. In the case of obesity, the hypothesis is that fetal growth retardation results in metabolic changes that are adaptive under nutritionally stressful circumstances in utero. A similar argument can be made for postnatal growth retardation manifested as stunting. As the child grows, the metabolic
258 Diet and Health
efficiencies that served well in conditions of under-nutrition become maladaptive with over-nutrition, leading to the development of abnormal lipid profiles, altered glucose and insulin metabolism, and obesity. One reason why the programming hypothesis is so powerful for health relates to its effects on the distribution of obesity. There appears to be the potential for increased visceral adiposity. That is, the literature that has linked metabolic programming with obesity has also shown a greater likelihood of increased waist–hip ratio and other measures of visceral or abdominal obesity. A separate literature has demonstrated that increased visceral adiposity is linked with NIDDM, CHD and stroke.39 In other work, four nationally representative samples of children (or a nationwide one for China) show that indeed there is potential that this hypothesis represents a critical link between the foetal and infant insults associated with underdevelopment and the transition towards a lower activity/higher-fat diet associated with the nutrition transition.40 In fact, without this transition in diet and activity it would not be possible for the biological effects associated with metabolic programming to lead to abnormal lipid profiles or obesity. The high level of child obesity in China, Russia and South Africa in comparison with National Health and Nutritional Examination Survey (NHANES) III is discussed elsewhere.40 The really solid causal work on this metabolic programming relationship and any mechanisms that might explain it or Barker’s hypothesis is either in process or remains to be undertaken. If this most significant relationship, often termed the programming effect, is as important as the early descriptive results indicate, then this represents an ominous warning regarding infant health. Lowincome countries with high fetal and infant malnutrition rates, must make particularly rapid programme and policy shifts to address these additional undesirable consequences of the nutrition transition.41 As issues of obesity and later NIDDM are presented below, it is important for the reader to be aware of this hypothesis and its potential for explaining, among other issues, the higher NIDDM levels found in newer urban residents in black South Africa and the parts of the increases in NIDDM elsewhere in Latin America, Asia and Africa.
Prevalence in Lower- and Middle-income Countries Limited information is presented on obesity patterns and trends in lower-income countries. The focus is on a few cases and the reader is directed to a more thorough review for more detail. Data from Asia and Latin America for adults are presented in Figures 12.5 and 12.6. We look at three measures of obesity, grade I, grades II and above, and the total of all grades. The ages for these data vary slightly but generally are presented for age 20 years and above.
The Nutrition Transition and its Health Implications in Lower-income Countries 259
Figure 12.5 Obesity patterns in Latin America
Figure 12.6 Obesity patterns in Asia
Latin America When looking at grades I and II and above obesity measures for Latin America, levels of obesity in the 30 and higher range are found in Brazil, Mexico and Cuba. The range is lower in other South American countries but there is no nationally representative survey for most countries. In Brazil and Cuba, women have higher levels of overweight and obesity than men but this is reversed in one survey in Mexico conducted in 1995. There are few data available in terms of large-scale surveys in the Caribbean; however, other studies and the Cuban data presented here indicate that the Caribbean nations have very high levels of obesity.42
260 Diet and Health
Asia There is still much less obesity in the largest two countries in Asia, China and India, but levels are higher in other countries. For instance, total grade I and above levels are between 25 and 30 per cent for Malaysia, and 13 and 19 per cent for the Philippines. The exceptions are the Central Asian countries such as Kyrgyzstan that were members of the Soviet Union prior to 1992. Grade I overweight status is currently the major problem in Asia except for Malaysia. There is no clear gender pattern to levels of obesity in Asia.
Trends There are a small number of lower- and middle-income countries for which we have excellent data on trends in body composition. Nationally representative or large nationwide data sets are available for Brazil in Latin America; China and India in Asia; Mauritius in Africa; Nauru and Western Samoa in the South Pacific; and Russia. These provide some sense of trends in adult obesity. Figure 12.7 shows the trends for the few countries for which there are nationally representative data. We created ten-year changes in the percentage points of obesity for each. Much greater detail of these obesity patterns and trends are presented elsewhere.43
Brazil Monteiro and his colleagues36 have shown that during a 15-year period, the proportion of grade II and above overweight adult males almost doubled (5.7–9.6 per cent). For females of reproductive age the proportion of grade II obesity increased
Figure 12.7 Obesity trends: the percentage point increase in obesity prevalence per ten-year period
The Nutrition Transition and its Health Implications in Lower-income Countries 261
by 230 per cent over a 21-year period. Interestingly, it was shown that the ratio between the underweight and overweight prevalence, a measure of the relative importance of each problem in the population, was dramatically affected between 1974 and 1989. In the case of all adults, the ratio was even reversed: in 1974, underweight exceeded overweight by 1.5 times while in 1989 those overweight exceeded the underweight by more than twice. These increases in the frequency of overweight occur for all incomes and both sexes, but they tend to be far more important among the poorest families.36
China The shifts in diet, physical activity and overweight status in China are among the most rapid ever documented. The level of overweight status in China among adults is still low but the marked shifts in diet and activity and grade I overweight lead one to believe that major increases in grades I and II overweight will occur. These changes are much greater among urban residents of all income backgrounds and among middle- and higher-income rural residents.19 In China we are able to explore the trends by income group for the 1989–1993 period and have found that the rate of increase among the urban and rural lowest income third is the greatest. The rates of increase based on national nutrition surveys in China in 1982– 1992 indicate a moderate rate of increase; however, this hides the more rapid shifts in diet, activity and obesity seen in the last few years.44 The increase in the prevalence of 5.2 percentage points of grade I overweight during this ten-year period in urban areas is considerable. During the more recent period, the CHNS data for 1989–1993 show that there has been a consistent increase in obesity in urban and rural areas among adults. The CHNS 1989 survey results for this age group fit exactly in the middle of these results. Grade I and above obesity increased from 9.7 per cent in 1982 to 14.9 per cent between 1982 and 1993.
India Unlike China, far fewer data are available for India. Information is available only for women of child-bearing age which indicates a small increase over the 19 years but a more rapid increase of 4.2 percentage points during the 1989–1994 period.
Russia Russia has one of the highest rates of mortality related to CHD in the world. Despite shifts towards a lower-fat diet in the post-reform period, there is evidence of an increase in adult obesity. Data have been collected for seven rounds of the nationally representative Russian Longitudinal Monitoring Survey and there is over time a consistent increase in adult and also elderly obesity.43 Figure 12.8 presents information on trends in body composition in Russia. The remarkable
262 Diet and Health
Figure 12.8 Obesity trends in Russia, 1992–1996
point to note is that the effects of the economic hardship in Russia have not been seen in the obesity trends. In 1996 the grade II obesity of females showed a decline. A much higher rate of increase in prevalence of obesity was found among grade II and above obesity for Russian females. Overall, the increase in total obesity is over five percentage points per ten-year period for Russia but future directions of this trend are less clear because the economy is in such flux.
The Health Implications: NIDDM and Related Conditions A range of changes in health are accompanying the nutrition transition. As noted above, foremost is the reduction of infant mortality – and related to that is undernutrition. Wasting is being rapidly reduced in many countries and rates of stunting are also being lowered though recent information indicates that the rate of change has slowed considerably in the last few years.45 At the same time, many adverse changes are taking place. The positive effects are not addressed here – effects that must not be lost nor minimized. Rather the focus is on the other side of the coin – the negative health effects which represent the most lasting and costly side effect of the nutrition transition. There is a growing literature that documents rapid increases in NIDDM in many lower-income countries.33,46,47 Other work indicates that many of the cardiovascular conditions related to NIDDM such as hypertension, dyslipidaemia and atherosclerosis are documented as increasing rapidly. The epidemiological prevalence data are spotty but indicate serious and high levels of these conditions, in particular NIDDM. NIDDM comprises 85 per cent or more of all diabetes cases. Recently, a most provocative cancer study has laid a strong basis for linking the
The Nutrition Transition and its Health Implications in Lower-income Countries 263
diet, activity and body composition trends discussed above to the likelihood of increased rates of prevalence for a larger number of cancers.48 A related clinical and epidemiological literature highlights the importance of the same factors noted as being central to the nutrition transition – diet shifts, reduced physical activity and obesity – as also being critical determinants of NIDDM.49–52 More recently this same literature has clarified the potential role for genetics and regional adiposity as they interact with these other factors. Diet is the least understood determinant of NIDDM. A clear literature has shown that in terms of mechanisms and epidemiology, obesity and activity are closely linked to NIDDM. Several reviews lay out the case for these factors. Zimmet and his colleagues have been particularly earnest in exploring these issues at the population level in a number of lower-income and transitional societies.51,52 Some basic characteristics of NIDDM may provide a clear basis for linking key components of the nutrition transition – increases in obesity and reductions in activity – to the rapid increases in NIDDM in lower-income countries.
Obesity It is clear that obesity, and more particularly upper-body regional distribution of the body fat, is a key parameter in the aetiology of NIDDM. A vast literature has shown significant direct obesity relationships with NIDDM and the animal literature backs up this relationship. The work on abdominal obesity and its effects is more recent, but appears to be promising in more precisely explaining the role that body composition plays. To the extent this abdominal obesity relationship holds, the metabolic programming hypothesis becomes that much more important in showing a link between foetal and infant nutritional insults and their relationship to adiposity in the upper body area. Law et al (see Barker17), in a follow-up study of British men, found abdominal fatness in adults to be associated with reduced foetal growth, manifested by low birthweight (LBW), and in particular LBW relative to placental weight. In a study of American white people and Hispanics, Valdez et al53 found that the odds of expressing a syndrome consisting of dyslipidaemia, hypertension, unfavourable fat distribution and NIDDM were 1.72 times higher for the lowest compared to the middle third of birthweight. In addition, there is a strong relative risk linking weight increases with diabetes. The odds of getting diabetes are considerable with a weight gain of 5–8kg for adults and they increase as weight gain goes up.54
Physical activity It is understood that exercise affects insulin sensitivity such that heavy activity reduces the likelihood for a given level of obesity that a person will display the signs that allow him/her to be categorized as having NIDDM. In other words, physical activity lowers the serum insulin level or appears to do so. Zimmet reviews these relationships and notes other critical studies on this topic.51,52
264 Diet and Health
Interactions of obesity and activity Activity and obesity appear to interact but also to have separate effects. For example studies show that for each level of BMI or waist–hip ratio, there is an activity effect in terms of serum insulin level.
Genetic component Zimmet and others who have focused on this issue as it relates to lower-income countries have felt that the highest genetic susceptibility was for Pacific Islanders, American-Indians, Mexican-Americans and other Hispanics, and Asian-Indians. Those with modest genetic susceptibility include Africans, Japanese and Chinese.51,52 The age of onset of NIDDM is much lower for these populations and for a given level of obesity and waist–hip ratio it appears that the prevalence is higher. For instance, while the diagnosis is usually made after the age of 50 years, in these populations it is made much earlier. Some of the articles that document the obesity increase, in particular those for Mauritius and the Pacific Islands and also for urban black South Africa also have shown a comparable rapid increase in the incidence of NIDDM and the biological precursors, higher glucose intolerance.33,46,47 O’Dea and colleagues55 and also Galanis and colleagues56 have explored the same issues in depth among Australian Aborigines and other South Pacific groups and have provided careful documentation of this linkage of the transition with NIDDM. Evidence from dozens of smaller studies in China, the Western Pacific, South Africa, urban areas in many other countries, and other countries point clearly to an incipient major increase in cardiovascular disease in all of these countries.47,57–59
Discussion and Implications The nutrition transition addresses a broad range of socioeconomic and demographic shifts that bring rapid changes in diet and physical activity levels to most regions of the world. The changes are occurring most rapidly as is shown by the shifts in the distribution of the population, income and occupation patterns. The diet changes, most specifically the shifts towards the higher fat and meat/reduced carbohydrate and fibre diet, is also a shift towards a more diverse and pleasurable diet. The activity patterns also represent a shift away from onerous, difficult labourintensive activities. Thus, these dietary and physical activity shifts are desirable in many ways. Yet they carry with them many onerous nutritional and health effects. It is this paradox and complexity which makes it most difficult to understand ways to arrest the negative aspects of the nutrition transition. It is also clear that we must view the causes of obesity as environmental rather than personal or genetic.
The Nutrition Transition and its Health Implications in Lower-income Countries 265
We must be aware of the weak database on which this work relies. Documentation at the individual and household level of this transition exists in only a few countries. These countries, such as China, indicate a marked shift away from traditional coarse grains and towards refined grains and then towards meat, eggs and fats. They also indicate a strong propensity for increased income to be linked with increased dietary diversity and increased consumption of these higher fat ‘Western diets’. Similarly they show marked changes in activity and obesity. Soon they will show the even more marked increases in CHD and NIDDM as others have shown in these countries. Yet, evidence for the shifts in physical activity is mainly indirect. The few studies that have monitored these trends have linked them to increased obesity but far more is needed in the way of research on this topic. This lack of research is a major gap, as are studies that collect both diet and activity data. There is evidence that trends in obesity are not limited to one region, country or racial/ethnic group. The overall levels that are found in selected countries such as Mexico, South Africa, Malaysia, and nations of the Western Pacific are indicative of major public health problems. That these changes appear to be occurring across so many countries lends weight to the need to understand the underlying environmental causes related both to shifts in diet and activity rather than focusing attention solely on genetic causes of obesity. It also opens up the possibility that international studies can help to clarify the causes for these patterns. It is likely that the rate of increase in obesity and NIDDM will increase rapidly, if the Barker metabolic programming hypothesis is correct. Stunting levels are very high in most lower-income countries. It is not unusual for 15–35 per cent of children to be stunted.40 High rates of intrauterine growth retardation and LBW also exist. To the extent that fetal and infant insults, later combined with reduced activity and increased diet, lead to obesity and NIDDM, the African, Asian and Latin American regions might see rapid increases in the health complications associated with the nutrition transition. The challenge is to devise ways to improve the lives of our citizens – that is to give people the more varied and tasty diets they want and less burdensome work – but also to prevent obesity, NIDDM, CHD and the other major diseases of civilizations. But we have few examples of countries that have been able to tackle these issues at the national level. Elsewhere I have summarized some of these issues. Milio has studied these trends most systematically.60–62 The Scandinavian countries are unique in attempting to redirect their diets and health with prevention at the national level and they have done this with mixed success. Lower-income countries are only beginning to discuss and consider options for dealing with obesity. So long as poverty and hunger affect portions of the population, at the international and national level, the public and politicians are more likely to address that problem than they are to consider obesity. This means that not only are we trying to redirect popular changes in diet and activity, but we are also attempting to fight them during a time when public attention is focused on these problems of poverty and dietary deficit. Our solutions must not adversely affect the undernourished. At the same time we must begin to develop an array of large-scale options that
266 Diet and Health
national governments can implement. As with any other epidemic, we must focus much of our energy on environmental solutions.
Acknowledgements Preparation of this article was supported in part by grants from the American National Institutes of Health (R01-HD30880). The author thanks Xuguang Guo for assistance with the China data, Colleen Doak for assistance with the obesity patterns, Tom Swasey for work on the graphics, Lynn Igoe for editorial assistance, and Frances Dancy for administrative assistance. Credit is also given to collaborators on the China Health and Nutrition Survey, in particular Drs Ge Keyou and Zhai Fengying, Institute of Nutrition and Food Hygiene, Chinese Academy of Preventive Medicine and on the Russian Longitudinal Monitoring Survey, Dr Alexander Baturin, Institute of Nutrition, Russian Academy of Medical Sciences.
References 1 2
Popkin B M. 1993. Nutritional patterns and transitions. Popul. Devel. Rev. 19: 138–57 Popkin B M. 1994. The nutrition transition in low-income countries, an emerging crisis. Nutr. Rev. 52: 285–98 3 Omran A R. 1971. The epidemiologic transition, a theory of the epidemiology of population change. Milbank Mem. Fund Q. 49: 509–38 4 Webster’s Third New International Dictionary of the English Language Unabridged. Encyclopedia Britannica Series. 1966. Chicago: Benton & G C Merriam 5 Popkin B M, Ge K, Zhai F, Guo X, Ma H, Zohoori N. 1993. The nutrition transition in China: a cross-sectional analysis. Eur. J. Clin. Nutr. 47: 333–46 6 FAOSTAT.PC. 1996. Food Balance Sheets 1961–94. Rome: Food and Agriculture Organization of the United Nations 7 WHO Expert Committee. 1995. Physical Status: the Use and Interpretation of Anthropometry: Report of a WHO Expert Committee. WHO Technical Report Series 854. Geneva: World Health Organization 8 Haines P S, Hungerford D W, Popkin B M, Guilkey D K. 1992. Eating patterns and energy and nutrient intakes of US women. J. Am. Diet. Assoc. 92: 698–704, 707 9 Popkin B M, Bisgrove E Z. 1988. Urbanization and nutrition in low-income countries. Food Nutr. Bull. 10: 3–23 10 United Nations, Department for Economic and Social Information and Policy Analysis, Population Division. 1995. World Urbanization Prospects: the 1994 Revision: Estimates and Projections of Urban and Rural Populations and of Urban Agglomerations. New York: Population Division, Department for Economic and Social Information and Policy Analysis, United Nations 11 Churchill A A. 1980. Shelter, Poverty and Basic Needs Series. Washington DC: World Bank 12 Marmot M G, Syme S L, Kagan A, Hiroo K, Rhoads G. 1975. Epidemiologic studies of CHD and stroke in Japanese men living in Japan, Hawaii, and California: prevalence of coronary and hypertensive heart disease and associated risk factors. Am. J. Epidemiol. 102: 514–25
The Nutrition Transition and its Health Implications in Lower-income Countries 267 13 Prior I, Tasman-Jones C. 1981. New Zealand Maori and Pacific Polynesians. In: Trowell H C, Burkitt D P, eds. Western Diseases: Their Emergence and Prevention. Cambridge, MA: Harvard University Press 14 Toor M, Katchalsky A, Agmon J, Allalouf D. 1957. Serum-lipid and atherosclerosis among Yemenite immigrants in Israel. Lancet i: 1270–3 15 Worth R M, Kato H, Rhoads G G, Kagan K, Syme S L. 1975. Epidemiologic studies of coronary heart disease and stroke in Japanese men living in Japan, Hawaii and California: mortality. Am. J. Epidemiol. 102: 481–90 16 Popkin B M, Udry J R. 1998. Adolescent obesity in the United States: the national longitudinal study of adolescent health. J. Nutr. 128 17 Barker D J P. 1992. Fetal and Infant Origins of Adult Disease. London: British Medical Journal 18 Barker D J P. 1994. Mothers, Babies and Disease in Later Life. London: BMJ Publishing 19 Popkin B M, Paeratakul S, Zhai F, Ge K. 1995. Dietary and environmental correlates of obesity in a population study in China. Obesity Res. 3: 135S–43S 20 Herrin A N. 1979. Rural electrification and fertility change in the Southern Philippines. Popul. Dev. Rev. 5: 61–86 21 Bisgrove E Z. 1991. Work and income as determinants of urban Filipino women’s nutrient intake from commercially prepared and home prepared food. PhD dissertation, Chapel Hill, University of North Carolina 22 Bisgrove E Z, Popkin B M. 1996. Does women’s work improve their nutrition: evidence from the urban Philippines. Soc. Sci. Med. 43: 1475–88 23 Chen C M. 1991. Dietary guidelines for food and agriculture planning in China. In: Proceedings of International Symposium on Food Nutrition and Social Economic Development. Beijing: Chinese Academy of Preventive Medicine 40–8 24 Ma H, Popkin B M. 1995. Income and food consumption behavior in China: a structural shift analysis. Food Nutr. Bull. 16: 155–65 25 Drewnowski A, Popkin B M. 1997. The nutrition transition: new trends in the global diet. Nutr. Rev. 55: 31–43 26 Chaudri R, Timmer C P. 1986. The Impact of Changing Affluence on Diet and Demand Patterns for Agricultural Commodities. World Bank Staff Working Papers 785. Washington DC: World Bank 27 Timmer C P, Falcon W P, Pearson S R. 1984. Food Policy Analysis. Baltimore: Johns Hopkins University Press 28 Mincer J. 1963. Market prices, opportunity costs, and income effects. In: Christ C F, Friedman M, Goodman L A, et al, eds. Measurement in Economics. Stanford, CA: Stanford University Press 29 Brunner E J, Marmot M G, White I R, et al. 1993. Gender and employment grade differences in blood cholesterol, apolipoproteins and haemostatic factors in the Whitehall II study. Atherosclerosis 102: 195–207 30 Sobal J, Stunkard A. 1989. Socioeconomic status and obesity: a review of the literature. Psychol. Bull. 105: 260–75 31 Briscoe, J. 1990. Brazil. The New Challenge of Adult Health. A World Bank Country Study. Washington DC: World Bank 32 Duncan B B, Schmidt M I, Achutti A C, Polanczyk C A, Benia L B, Maia A A G. 1993. Socioeconomic distribution of noncommunicable disease risk factors in urban Brazil: the case of Porto Alegre. Bull. PAHO 27: 337–49 33 Levitt N S, Katzenellenbogen J M, Bradshaw D, Hoffman M N, Bonnici F. 1993. The prevalence and identification of risk factors for NIDDM in urban Africans in Cape Town, South Africa. Diabetes Care 16: 601–7 34 Bourne L T, Langenhoven M L, Steyn K, Jooste P L, Laubscher J A, Van Der Vyver E. 1993. Nutrient intake in the urban African population of the Cape Peninsula, South Africa: the BRISK Study. Cent. Afr. Med. J. 39: 238–47
268 Diet and Health 35 Bourne L T, Langenhoven M L, Steyn K, Jooste P L, Nesamvuni A E, Laubscher J A. 1994. The food and meal pattern in the urban African population of the Cape Peninsula, South Africa: the BRISK Study. Cent. Afr. Med. J. 40: 140–8 36 Monteiro C A, Mondini L, de Souza A L M, Popkin B M. 1995. The nutrition transition in Brazil. Eur. J. Clin. Nutr. 49: 105–13 37 Monteiro C A, Benicio M H D’A, Iunes R F, Gouveia N C, Taddei J A A C, Cardoso M A A. 1992. Nutritional status of Brazilian children: trends from 1975 to 1989. Bull. WHO 70: 657–66 38 Monteiro C A. The Changing Nature of Nutritional Disorders in the Developing Countries: the Case of Brazil. Proceedings of the International Congress of Nutrition. Montreal: Canadian Federation of Biological Sciences, forthcoming 39 Bjorntorp P. 1993. Visceral obesity: a ‘civilization syndrome’. Obesity Res. 1: 206–22 40 Popkin B M, Richards M K, Monteiro C A. 1996. Stunting is associated with overweight in children of four nations that are undergoing the nutrition transition. J. Nutr. 126: 3009– 16 41 Popkin B M, Richards M K, Adair L S. Stunting is associated with child obesity: dynamic relationships. In: Johnston F E, Zemel B S, Eveleth P B, eds. Human Growth and Development, 1998: Proceedings of the Eighth International Congress of Auxology Philadelphia: Smith-Gordon, forthcoming 42 Forrester T, Wilks R, Bennett F, et al. 1996. Obesity in the Caribbean. In: Chadwick D J, Cardew G, eds. The Origins and Consequences of Obesity. Ciba Foundation Symposium 201. Chichester, Wiley, 17–31 43 Popkin B M. 1997. The obesity epidemic is a worldwide phenomenon: trends in transitional societies. Unpublished manuscript, Carolina Population Center, the University of North Carolina at Chapel Hill 44 Ge K, Weisell R, Guo X, et al. 1994. The body mass index of Chinese adults in the 1980s. Eur. J. Clin. Nutr. 48: S148–S154 45 United Nations Administrative Committee on Coordination, Subcommittee on Nutrition. 1996. Update on the Nutrition Situation 1996: Summary of Results for the Third Report on the World Nutrition Situation. Geneva: ACC/SCN 46 Hodge A M, Dowse G K, Gareeboo H, Tuomilehto J, Alberti K G M M, Zimmet P Z. 1996. Incidence, increasing prevalence, and predictors of change in obesity and fat distribution over 5 years in the rapidly developing population of Mauritius. Int. J. Obesity 20: 137–46 47 Hodge A M, Dowse G K, Toelupe P, Collins V R, Zimmet P Z. 1997. The association of modernization with dyslipidaemia and changes in lipid levels in the Polynesian population of Western Samoa. Int. J. Epidemiol. 26: 297–306 48 World Cancer Research Fund in association with American Institute for Cancer Research. 1997. Food, Nutrition and the Prevention of Cancer: a Global Perspective. Washington DC: American Institute for Cancer Research 49 Beaglehole R. 1992. Cardiovascular disease in developing countries: an epidemic that can be prevented. Br. Med. J. 305: 1170–1 50 Byers T, Marshall J. 1995. The emergence of chronic diseases in developing countries. SCN News 13: 14–19 51 Zimmet P Z. 1991. Kelly West Lecture. Challenges in diabetes epidemiology – from west to the rest. Diabetes Care 15: 232–52 52 Zimmet P Z, McCarty D J, de Courten M P. 1997. The global epidemiology of non-insulin-dependent diabetes mellitus and the metabolic syndrome. J. Diabet. Comp. 11: 60–8 53 Valdez R, Athens M A, Thompson G H, Bradshaw B S, Stern M P. 1994. Birthweight and adult health outcomes in a biethnic population in the USA. Diabetologia 37: 624 54 Ford E S, Williamson D F, Liu S. 1997. Weight change and diabetes incidence: findings from a national cohort of US adults. Am. J. Epidemiol. 146: 214–22
The Nutrition Transition and its Health Implications in Lower-income Countries 269 55 O’Dea K, Patel M, Kubisch D, Hopper J, Traianedes, K. 1993. Obesity, diabetes, and hyperlipidemia in a Central Australian Aboriginal community with a long history of acculturation. Diabetes Care 16: 1004–10 56 Galanis D J, Sobal J, McGarvey S T, Pelletier D L, Bausserman L. 1995. Ten-year changes in the obesity, abdominal adiposity, and serum lipoprotein cholesterol measures of western Samoan men. J. Clin. Epidemiol. 48: 1485–93 57 Chadha S L, Radhakrishnan S, Ramachandran K, Kaul U, Gopinath N. 1990. Epidemiological study of coronary heart disease in urban population of Delhi. Indian J. Med. Res. 92: 424–30 58 INCLEN Multicentre Collaborative Group. 1992. Risk factors for cardiovascular disease in the developing world. A multicentre collaborative study in the International Clinical Epidemiology Network (INCLEN). J. Clin. Epidemiol. 45: 841–7 59 Steyn K, Jooste P L, Bourne L T, et al. 1991. Risk factors for coronary heart disease in the black population of the Cape Peninsula. The BRISK study. S. Afr. Med. J. 79: 480–5 60 Milio N. 1990. Nutrition Policy for Food-Rich Countries: a Strategic Analysis. Baltimore: the Johns Hopkins University Press 61 Milio N. 1989. Nutrition and health: patterns and policy perspectives in food-rich countries. Soc. Sci. Med. 29: 413–23 62 Milio N. 1991. Toward healthy longevity: lessons in food and nutrition policy development from Finland and Norway. Scand. J. Soc. Med. 19: 209–17
13
Diet and Health: Diseases and Food Tim Lang and Michael Heasman
Let Reason rule in man, and he dares not trespass against his fellow-creature, but will do as he would be done unto. For Reason tells him, is thy neighbour hungry and naked today, do thou feed him and clothe him, it may be thy case tomorrow, and then he will be ready to help thee. Gerrard Winstanley, English Leveller, 1609–16761
Core Arguments The Productionist paradigm is critically flawed in respect of human health. Half a century ago it responded to issues then seen as critical but which now require radical revision. While successfully raising the caloric value of the world food supply, it has failed to address the issue of quality, and as a result, there is now a worldwide legacy of externalized ill health costs. The world’s human health profile is now very mixed. Within the same populations, in both developed and developing countries, there exists diet-related disease due both to under- and over-consumption. The pattern of diet that 30 years ago was associated with the affluent West is increasingly appearing in the developing countries, in a phenomenon known as the ‘nutrition transition’: while the incidence of certain diet-related diseases has decreased, such as heart disease in the West, others are increasing, particularly diabetes and obesity worldwide, and heart disease in the developing world. Massive global inequities in income and expectations contribute to this double burden of disease, and current policies are failing to address it.
Introduction One of the key Food Wars is over the impact of the modern diet on human health. In the last quarter of the 20th century, nutrition moved from the sidelines of public Reprinted from Lang T and Heasman M. 2004. Diet and health: Diseases and food, in Lang T and Heasman M. Food Wars, Earthscan, London.
Diet and Health: Diseases and Food 271
health to being central to the marketing of foodstuffs, and major public health campaigns urged consumers to improve their diets. This human health dimension is central to our critique of the Productionist paradigm in two respects. First, even though global food production has increased to meet caloric needs, its nutritional content may be less than desirable. Second, food distribution remains deficient: nearly a billion people remain malnourished. In this chapter, we explore the relationship between diet and the range of disease and illnesses that are associated with food choices. We discuss, too, the existence of gross inequalities within and between countries in the form of food poverty amidst food abundance and wealth. In late 2002 and 2003, a wave of new public health reports reminded the world that diet is a major factor in the causes of death and morbidity. Although deeply unpalatable to some sections of the food industry, these reports were sober reminders of the enormity and scale of the public health crisis. The joint WHO and FAO’s 2003 report on diet, nutrition and the prevention of chronic diseases drew attention to high prevalence of diseases which could be prevented by better nutrition, including:2 • • • • • •
obesity; diabetes; cardiovascular diseases; cancers; osteoporosis and bone fractures; dental disease.
Of course, these diseases are not solely exacerbated by poor diet but also by lack of physical activity. In truth, this report was only reiterating the story of nutrition’s impact on public health that had been rehearsed for many years, and the evidence for which was judged to be remarkably sound, but as Dr Gro-Harlem Brundtland, then the Director-General of the WHO, stated in the report: ‘What is new is that we are laying down the foundation for a global policy response.’ To this end, the WHO set up an international consultation dialogue to prepare its global strategy on diet, physical activity and health, scheduled to be launched in 2004. By international agency standards, this relatively speedy shift from evidence to policy making indicates the real urgency of the problem. The draft strategy was launched ahead of schedule in December 2003.3 Already by 2002, the WHO had produced a major review of the national burdens that such diseases cause. Of the top ten risk factors associated with noncommunicable diseases, food and drink contribute to eight (with the two remaining – tobacco and unsafe sex – not associated with diet and food intake):4 • • •
blood pressure; cholesterol; underweight;
272 Diet and Health
• • • • •
fruit and vegetable intake; high body mass index; physical inactivity; alcohol; unsafe water, sanitation and hygiene.
In the 2003 World Cancer Report, the most comprehensive global examination of the disease to date, the WHO stated that cancer rates could further increase by 50 per cent to 15 million new cases in 2020.5 To stem the rise of this toll, the WHO and the International Agency for Research on Cancer (the IARC) argued that three issues in particular need to be tackled: • •
Tobacco consumption (still the most important immediate avoidable risk to health). Healthy life-style and diet, in particular the frequent consumption of fruit and vegetables and the taking of physical activity; early detection and screening of diseases to allow prevention and cure.
In addition to these UN reports, the International Association for the Study of Obesity (the IASO) revised its figures of the global obesity pandemic: it estimates that 1.7 billion people are overweight or obese, a 50 per cent increase on previous estimates. The IASO’s International Obesity Task Force stated that the revised figures meant that most governments were simply ignoring one of the biggest risks to world population health.6 These reports testify to an extensive body of research and evidence from diverse sources around the world of the link between food availability, consumption styles and specific patterns of disease and illness. Table 13.1 confirms some of the dietrelated causes of death throughout the world. Good health and longevity were intended to result from ensured sufficiency of supply; at the beginning of the 21st century, far from diet-related ill health being banished from the policy agenda, it appears to be experiencing a renewed crisis. Under the old Productionist paradigm, the main focus was under-nutrition. Yet at the end of the 20th century, with diseases such as heart disease, cancers, diabetes and obesity rampant worldwide, not just in the affluent West, a new focus must be placed on diet and inappropriate eating. In this chapter, we begin to explore wider societal changes which impose progress in this regard through demographic shifts, maldistribution of and poor access to food, and spiralling healthcare costs. These factors add weight to our argument that the Productionist paradigm is beyond its own sell-by date. Policy making is failing to address the causes of these food-related health problems and too often resorts to only palliative measures. This is partly because the Productionist paradigm’s approach to health narrows the framework for considering alternative solutions: by being centred on striving to increase output, it has taken only a medicalized, rather than a socially determined, view of health.
Diet and Health: Diseases and Food 273 Table 13.1 Some major diet-related diseases Problem
Extent/comment
Low birthweights
30 million infants born in developing countries each year with low birthweight: by 2000, 11.9 per cent of all newborns in developing countries (11.7 million infants)
Child undernutrition
150 million underweight preschool children: in 2000, 32.5 per cent of children under 5 years in developing countries stunted, amounting to 182 million preschool children. Problem linked to mental impairment. Vitamin A deficiency affects 140–250 million schoolchildren; in 1995, 11.6 million deaths among children under 5 years old in developing countries
Anaemia
Prevalent in schoolchildren; maternal anaemia pandemic in some countries
Adult chronic diseases
These include adult-onset diabetes, heart disease and hypertension, all accentuated by early childhood under-nutrition
Obesity
A risk factor for some chronic diseases (see above), especially adult-onset diabetes.7 Overweight rising rapidly in all regions of the world
Underweight
In 2000, an estimated 26.7 per cent of preschool children in developing countries.
Infectious diseases
Still the world’s major killers but incidence worsened by poor nutrition; particularly affects developing countries
Vitamin A deficiency
Severe vitamin A deficiency on the decline in all regions, but subclinical vitamin A deficiency still affects between 140 and 250 million preschool children in developing countries, and is associated with high rates of morbidity and mortality
Source: Adapted from ACC/SCN 20008
Could the proponents of Productionism have anticipated the scale of these most recent health concerns? To some extent, they could not. Even excessive intake of fats as causing ill health might have been something of a shock for the Productionist paradigm, as it was almost heretical to argue that too much of a nutrient could be harmful to health.9 Part of the problem here was the essential paternalism of the paradigm which assumed total knowledge of all variables needed to make good food policy: governments and companies could be trusted to look after the public health; the consumers’ role was to select products to create their own balanced diets. Recent history, however, has shown that governments and the food supply chain failed to adapt to new scientific knowledge in relation to food and health. Nationally and internationally, the influence of health scientists on public policy has been minimal. Consumerism triumphed. To some extent, too, the public health world has colluded in its own marginalization from ‘live’ policy making by its fixation with deficiency diseases: for example, on programmes of food fortification or on protein shortages which could be made up by increased meat and dairy production. Despite a successful worldwide campaign to increase intake of folic acid following the discovery of its
274 Diet and Health
connection with spina bifida (neural tube defect syndrome), the overall impact of nutritional science in policy making has been negligible. Its response to the current epidemic of heart disease has been ‘health education’ – advice, leaflets and exhortations to change behaviour – explaining it as caused by modern life-styles, rather than by preventable dietary deficiencies. Almost as soon as the Productionist paradigm was put in place worldwide in the last half of the 20th century, global campaigns were needed to address the increase in degenerative diseases. However, the necessary policy instruments were not in place to tackle the health impact of long-term shifts in diet. The UN bodies which noted the evidence of new patterns of ill health were merely intergovernmental bodies who lacked any administrative power and influence to act on the global and national level. Commercial interests, on the other hand, had no such limits and could pursue their global ambitions, selling foods and a lifestyle around the world without regard to their consequences, and being able to defend their actions as being in the public interest. Instead, the developed world now must confront one of the most challenging food and health disasters ever to face humankind: an epidemic of obesity with little prospect of an end in sight and the prospect of a new wave of diet-related diseases in its wake. It has little in its armoury with which to combat the causes of obesity, now affecting significant numbers of children and with even graver implications for future population health. Health education is ineffective; consumerism is part of the problem, but politically it is nearly sacrosanct. Meanwhile, hunger and insufficiency continue, ironically, to prevail. As a 1995 FAO review of the global picture starkly put it: ‘[H]unger … persists in developing countries at a time when global food production has evolved to a stage when sufficient food is produced to meet the needs of every person on the planet.’10 Overconsumption and under-consumption coexist. There is gross inequality of global distribution and availability of food energy. The same review asserted that Western Europe, for example, has in theory 3500 kilocalories (kcal) available per person per day and North America has 3600, while sub-Saharan Africa has 2100 and India has 2200. By 2015 the FAO calculates that 6 per cent of the world’s population (462 million people) will be living in countries with under 2200kcal available per person. And by 2030, in the most optimistic scenario, in sub-Saharan Africa 15 per cent of the population will be undernourished. Numbers of the undernourished look set only to decline much more slowly than suggested by targets, for example those of the World Food Summit of 1996.11 The transnational nature of these patterns of diet-related disease demands public policy attention. The enormity of this human health problem cannot be overemphasized. Diseases associated with deficient diet account for 60 per cent of years of life lost in the established market economies.12 Scientists categorize diseases into two broad groups: communicable (carried from person to person or via some intermediary factor; these include diseases such as malaria, food poisoning, SARS); non-communicable (acquired by life-style or other mismatch between humans and their environment, such as cardiovascular disease and cancers). Table 13.2 indicates that in the developed world, deaths
Diet and Health: Diseases and Food 275 Table 13.2 Number of deaths by WHO regions, estimates for 2002 (thousands) Africa Western Europe The Pacific Americas
Eastern South- Total Mediterranean East worldAsia wide
Infectious & parasitic diseases
5787
794
212
394
959
2968
11,114
Cardiovascular diseases
1136
3817
4857
1927
1080
3911
16,728
410
2315
1822
1115
272
1160
7094
1071
511
273
228
365
1393
3841
Perinatal and maternal causes
585
371
69
192
371
1183
2771
Injuries
747
1231
803
540
391
1267
4979
Cancers Respiratory infectionsa
Note: a This does NOT include respiratory diseases; includes upper and lower respiratory infections and otitis media. Source: WHO, Shaping the Future, World Health Report, Geneva, 2003, calculated from Annex Table 2
through infectious and parasitic diseases are very low compared to developing countries, while diet-related non-communicable diseases like coronary heart disease and cancers are high in both developed and developing worlds. Degenerative disease rates are already high in the developing world. Figure 13.1 gives the leading causes of mortality by age to give another view of the global disease patterns. The WHO and the FAO reports stress that world health in general is in transition with non-communicable diseases now taking a higher toll than communicable
Source: WHO, World Health Report 2003
Figure 13.1 Leading causes of mortality, by age, 2002
276 Diet and Health
Source: WHO, Evidence, Information and Policy, 2000
Figure 13.2 Anticipated shift in global burden of disease 1990–2020, by disease group in developing countries (WHO)
diseases. Figure 13.2 shows the WHO prognosis of how the rates of non-communicable disease are expected to rise. Factors in this health transition include diet, demographic change (such as an ageing population) and cultural factors related to globalization.
The Nutrition Transition In a series of papers, Professor Barry Popkin and his colleagues have argued that there is what they term a ‘nutrition transition’ occurring in the developing world, associated primarily with rising wealth.13,14 The thesis, which has been extensively supported by country and regional studies,15 argues simply that diet-related ill health previously associated with the affluent West is now becoming increasingly manifest in developing countries.16,17 The ‘nutrition transition’ suggests shifts in diet from one pattern to another: for example, from a restricted diet to one that is high in saturated fat, sugar and refined foods, and low in fibre. This transition is associated with two other historic processes of change: the demographic and epidemiological transitions. Demographically, world populations have shifted from patterns of high fertility and high mortality to patterns of low fertility and low mortality. In the epidemiological transition, there is a shift from a pattern of disease characterized by infections, malnutrition and episodic famine to a pattern of disease with a high rate of the chronic and degenerative diseases. This change of disease pattern is associated with a shift from rural to urban and industrial life-style. WHO researchers have noted that changes in dietary patterns can be driven not just by rising income and affluence but also by the immiseration that accompanies
Diet and Health: Diseases and Food 277
others’ rising wealth;18 low income countries are experiencing the effects of the transition but cannot afford to deal with them.19 Popkin argues that, while the nutrition transition brings greater variety of foods to people who previously had narrow diets, the resulting health problems from the shift in diet should not be traded off against the culinary and experiential gains. Consumers might enjoy the new variety of foods that greater wealth offers but they are often unaware of the risk of disease that can follow. The implications of the nutrition transition now ought to exercise the minds of global as well national policy makers: certainly health policy specialists are concerned at the rise of degenerative diseases in lowand middle-income countries.20,21 Nutrition may have recently become a key notion in modern dietary thinking but it only echoes the insights of an earlier generation of researchers which included nutrition and public health pioneers such as Professors Trowell and Burkitt, whose observations from the 1950s to the 1980s led them to question ‘whether Western influence in Africa, Asia, Central and South America and the Far East is unnecessarily imposing our diseases on other populations who are presently relatively free of them’.22 Trowell and Burkitt, both with long medical experience in Africa, could easily explain the variation in infectious diseases, but not the variation in rates of non-infectious diseases such as heart disease between countries at different economic levels of wealth and development. In Africa in the post-World War II period, they witnessed the rise of key indicators for diseases such as heart disease and high blood pressure in peoples who had previously had little experience of them.23 The dietary transition is swift. An FAC study of very undernourished Chinese people (living on 1480kcal per day) shows that they derive three-quarters of their energy intake from starchy staples such as rice, while better-fed Chinese (living on 2500kcal per day) are able to reduce their energy intake from such staples and to diversify their food sources (see Figures 13.3 and 13.4 which compare the diets of undernourished and well-nourished people in China). Popkin has shown how this same process occurs in both urban and rural populations in developing countries with rising incomes. Figures 13.5 and 13.6 show
Source: National Survey of Income and Expenditure of Urban Households. Government of China, 1990; FAO, State of Food Insecurity, 2000; www.fao.org
Figure 13.3 Diet of a well-nourished Chinese adult (2500kcal/person/day)
278 Diet and Health
Source: National Survey of Income and Expenditure of Urban Households, Government of China, 1990; www.fao.org
Figure 13.4 Diet of an undernourished Chinese adult (1480kcal/person/day)
Source: FAO/World Bank/Popkin, B (1998) ‘The nutrition transition and its health implications on lower income countries’, Public Health Nutrition, 1, 5–21
Figure 13.5 Relationship between the proportion of energy from each food source and GNP per capita, with the proportion of the urban population at 25 per cent, 1990
the relationship between per capita income and what predominantly rural and predominantly urban populations eat as both get wealthier:24 both eat more meats and fats, and reduce carbohydrate, as a proportion of their overall diet. But there
Diet and Health: Diseases and Food 279
Source: FAO/World Bank/Popkin, B (1998) ‘The nutrition transition and its health implications on lower income countries’, Public Health Nutrition, 1, 5–21
Figure 13.6 Relationship between the proportion of energy from each food source and GNP per capita, with the proportion of the urban population at 75 per cent, 1990
still remain differences between urban and rural populations, probably due to their different levels of activity, access to dietary ingredients and cultural mores.25 The more urban population also consumes more added sugars as it gets wealthier, whereas the rural population consumes less. Popkin and his colleagues’ point is that changing economic circumstances markedly shape the mix of nutrients in the diet and that life-style factors – such as the degree of urbanization26 and changing labour patterns – have a major effect on health. The transition is occurring in areas that usually receive little food policy attention. A study by the WHO has reported that in the Middle East changing diets and life-styles are now resulting in changing patterns of both mortality and morbidity there too.27 Dietary and health changes can be rapid. In Saudi Arabia, for instance, meat consumption doubled and fat consumption tripled between the mid-1970s and the early 1990s; in Jordan, there has, in the same timescale, been a sharp rise in deaths from cardiovascular disease. These problems compound older Middle-Eastern health problems such as protein-energy malnutrition, especially among children. In China, the national health profile began to follow a more Western pattern of diet-related disease as the population gradually urbanized,28 coinciding with an increase in degenerative diseases. Consumption of legumes such as soyabean was replaced by animal protein in the form of meat. One expert
280 Diet and Health
nutritional review of this problem concluded that exhorting the Chinese people to consume more soy when they were voting with their purses to eat more meat would be ineffective ‘in the context of an increasingly free and global market’.29 Such studies can suggest that the battle to prevent Western diseases in the developing world appears already to have been lost. If the nutrition transition is weakening health in China, the world’s most populous and fastest economically growing nation, which has 22 per cent of the world’s population but only 7 per cent of its land, what chance is there for diet-related health improvements throughout the developing world? As populations become richer, they substitute cereal foods for higher-value protein foods such as milk, dairy products and meat, increased consumption of which is associated with Westernization of ill health. Relatively better-off populations also consume a greater number of non-staple foods and have a more varied, if not healthier, diet.30 Thus we have the modern nutritional paradox: in the same low-income country there may be ill health caused by both malnutrition and overnutrition; in the same rural area of a poor country both obesity and underweight can coexist. In policy terms the challenge is whether India, China, Latin America or Africa, for example, can afford the technical fixes that the West can resort to in order to improve diet-related health:31 coronary bypass operations; continuous drug regimes; expensive drugs and foods with presumed health-enhancing benefits;32 and subscriptions to gyms and leisure centres. The affluent middle classes in the developed world might be able to afford such fixes but the vast numbers in the developing world certainly will not. Technical fixes are not societal solutions. It could be argued that the increase in degenerative diseases is the inevitable down-side of economic progress. The problem for policy making is how to differentiate between protecting the already protective elements of traditional, indigenous diets such as legumes, fruit and vegetables, and opening up more varied food markets, which is deemed to be good economic policy. In practice, too few policy makers in the developing world have been prepared to fight to keep ‘good’ elements of national and local diets or to constrain the flow of Western-style foods and drinks into their countries lest they infringe support for trade liberalization. Thus, in stark terms, trade and economic policies have triumphed over health interests. US-style fast foods – the ‘burgerization’ of food cultures – have been hailed as modernity. We must now expose the production, marketing and prices of fast food,34,35 their nutritional value and their impact on health.36
Three Categories of Malnutrition: Underfed, Overfed, and Badly Fed More than 2 billion people in the world today have their lives blighted by nutritional inadequacy. On one hand, half of this number do not have enough to eat;
Diet and Health: Diseases and Food 281 Table 13.3 Types and effects of malnutrition Type of malnutrition
Nutritional effect
No. of people affected globally (× billion)
Hunger
deficiency of calories and protein
at least 1.2
Micronutrient deficiency
deficiency of vitamins and minerals
2.0–3.5
Over-consumption
excess of calories, often accompanied by deficiency of vitamins and minerals
at least 1.2–1.7
Source: Gardner and Halweil (2000), based on WHO, IFPRI, ACC/SCN data33
on the other hand, a growing army of people exhibit the symptoms of overfeeding and obesity. In both cases, the international communities are floundering for solutions, and malnutrition results, as indicated by Table 13.3. Figure 13.7 highlights the role of the mother in infant health. Even before conception, the mother’s own nutrition is vital.37 It is now understood that children who are born with a low birthweight are at increased risk of developing heart disease and that good nourishment of the foetus is key. That nutrition affects disease patterns and life expectancy is now well documented.38
Source: ACC/SCN (2000) Nutrition through the Life Cycle: 4th Report on the World Nutrition Situation. UN Administrative Committee on Co-ordination Subcommittee on Nutrition, New York, p8
Figure 13.7 Life cycle – the proposed causal links
282 Diet and Health
Source: State of Food Insecurity in the World 2000, available at www.fao org/DOCREP/ X8200E/x8200e03.htm#P0_0
Figure 13.8 Number of undernourished by region, 1996–1998 (millions)
One of the particularly tragic consequences of undernourishment is its impact on the worlds children. UNICEF calculates that 800 million children worldwide suffer malnutrition at any given time (Figure 13.8 gives the FAO’s estimated locations of these millions. Table 13.4 then gives the sobering projections for 2015 and 2030.) High proportions of Asian and African mothers are undernourished, largely due to seasonal food shortages, especially in Africa. About 243 million adults in developing countries are deemed to be severely undernourished.39 This type of adult under-nutrition can impair work capacity and lower resistance to infection. Against a rapid growth in world population, well-informed observers agree that greater food production is needed for the future.40–43 One estimate suggests that by 2020 there will be 1 billion young people growing up with impaired mental Table 13.4 Projected trends in undernourishment by region, 1996–2030 1996–98
2015
2030
1996–98
Per cent of population
2015
2030
Millions of people
Sub-Saharan Africa
34
22
15
186
184
165
Near East/North Africa
10
8
6
36
38
35
Latin America and the Caribbean
11
7
5
55
45
32
China and India
16
7
3
348
195
98
Other Asia
19
10
5
166
114
70
Developing countries
18
10
6
791
576
400
Source: FAO (2000) Agriculture: Towards 2015/30, Technical Interim Report, April, Rome, FAO, www.fao.org
Diet and Health: Diseases and Food 283
development due to poor nutrition. At a conservative estimate, this means there will be 40 million young people added to the total each year.44
The Obesity Epidemic As early as 1948, there were medical international groups researching the incidence of obesity in various countries.45 There were official reports at country level by the early 1980s,46 and there has also been a commercial and consumer response to obesity for even longer.47 But the grip of international obesity was in fact confirmed by the WHO’s Task Force on Obesity in 1998. Today, overweight and obesity are key risk factors for chronic and non-communicable diseases.48 In developing countries obesity is more common amongst people of higher socioeconomic status and in those living in urban communities. In more affluent countries, it is associated with lower socioeconomic status, especially amongst women and rural communities.49 Historically and biologically, weight gain and fat storage have been indicators of health and prosperity. Only the rich could afford to get fat. By 2000, the WHO was expressing alarm that more than 300 million people were defined as obese, with 750 million overweight, i.e. pre-obese: over a billion people deemed overweight or obese globally.50 But by 2003, this figure had been radically revised upwards when the IASO calculated that up to 1.7 billion people were now overweight or obese. The new figures were in part due to more accurate statistics but also to the recalculation of obesity benchmarks, which acknowledged rising obesity in Asia.51 Particularly worrying is that extreme degrees of obesity are rising even faster than the overall epidemic: in 2003, 6.3 per cent of US women, that is 1 in 16, were morbidly obese, with a body mass index of 40 or more. Obesity is defined as an excessively high amount of body fat or adipose tissue in relation to lean body mass. Standards can be determined in several ways, notably by calculating population averages or by a mathematical formula known as ‘body mass index’ (BMI),52 a simple index of weight-for-height: a person’s weight (in kilos) divided by the square of the height in metres (kg/m2). BMI provides, in the words of the WHO, ‘the most useful, albeit crude, population-level measure of obesity’. A personal BMI of between 25 and 29.9 is considered overweight; ‘obesity’ means a BMI of 30 and above; a personal BMI of less than 17 is considered underweight. There is some argument about whether the definition of overweight (a BMI within the 25–29.9 range) should be lowered from 25 to 23, in which case tens of millions more people would be considered overweight, and such an unofficial reclassification has led to the disparity between current world obesity figures. BMI levels are a useful predictor of risk from degenerative diseases. Unutilized food energy is stored as fat. Currently, the US National Institutes of Health consider that all adults (aged 18 years or older) who have a BMI of 25 or more are at
284 Diet and Health
risk from premature death and disability as a consequence of overweight and obesity.53 Men are at risk who have a waist measurement greater than 40 inches (102cm); women are at risk who have a waist measurement greater than 35 inches (88cm). Whilst height is obviously also taken into consideration, we should regard these measurements as key health benchmarks. Figure 13.9 shows how, in a remarkably short time, the rate of obesity within countries is rising. In the UK, for instance, between 1980 and 2000, obesity trebled from 7 per cent of the population to 21 per cent.54 Particularly alarming is that the ‘North Americanization’ of obesity is spreading down Latin America.55 Figure 13.10 illustrates the level of obesity in comparison to underweight in developed and developing countries. In many countries, levels of obesity are double what they were 15 years ago.56 In Peru, Tunisia, Colombia, Brazil, Costa Rica, Cuba, Chile, Mexico and Ghana, for example, overweight adults outnumber those who are thin. Even Ethiopia and India, traditionally beset by under-nutrition57 and starvation now have the added burden of an emerging obesity problem. The trend to obesity is occurring in countries with different economic profiles, from the Asian ‘Tiger’ economies to the oil-rich Middle East.58 Rising obesity rates among children are particularly troubling to health professionals, as this trend suggests massive problems of degenerative disease for the future. In Jamaica and Chile, for instance, one in ten children is obese; in Japan, a country historically with a very low incidence of fat in its diet and with a low incidence of
Source: OECD Health Data 2002, available at www.oecd.org/pdf/M00031000/M00031130.pdf
Figure 13.9 Obesity in adult population across OECD countries
Diet and Health: Diseases and Food 285
Source: WHO, Nutrition for Health and Development: A Global Agenda for Combating Malnutrition. 2000, available at www.who.inVnut/dbj3mLhtrn
Figure 13.10 Global population affected by underweight and obesity in adults, by level of development, 2000
obesity, the frequency of obesity in schoolchildren has increased from 5 per cent to 9 per cent for girls and 10 per cent for boys in 1996.59 (Table 13.5 summarizes the rapid rise in obesity as measured by comparing initial surveys with follow-up worldwide studies. The final column of the table shows how obesity is becoming out of control in developed and developing countries alike.) Even in Australia, obesity rose 3.4-fold for boys and 4.6-fold for girls between 1985 and 1995; in Egypt, 3.9-fold between 1978 and 1996; in Morocco, 2.5-fold in just five years, from 1987 to 1992; in Scotland by 2.3-fold for boys and 1.8-fold for girls between 1984 and 1994. A child’s weight can be thrown off balance by a daily consumption of only one sugar-sweetened soft drink of 120kcals; over ten years, this intake would turn into 50kg of excess growth. Although their review also fully acknowledged the role of genetics, the authors pointed to pressures on children’s diets from advertisements to help explain the rapidity of consumption and obesity changes.60 Health education seems to be powerless before this rising tide of obesity. On the island of Mauritius, for instance, a study which examined adults over a period of five years found that, despite a national programme promoting healthy eating and increased physical activity, obesity levels had increased dramatically:61 men with a BMI above 25 increased from 26.1 per cent to 35.7 per cent and for women the figure grew from 37.9 per cent to 47.7 per cent during the five-year study. The government of Mauritius concluded that a National Nutrition Policy and National Plan of Action on Nutrition was needed.62 Even in the US, the homeland of fast food, President George W. Bush was so alarmed by the obesity crisis that in 2002 he launched a national debate. He has long had good reason for concern,63 as even
286 Diet and Health
as far back as 1986, the economic costs of illness associated with overweight in the US were estimated to be $39 billion; today the estimated cost of obesity and overweight is about $117 billion.64 The rise in US obesity is dramatic: between 1991 and 2001, adult obesity increased by 74 per cent. The percentage of US children and adolescents who are defined as overweight has more than doubled since the early 1970s, and about 13 per cent of children and adolescents are now seriously overweight.65 These general US figures disguise marked differences between ethnic groups and income levels: according to the Centers for Disease Control and Prevention, 27 per cent of black and about 21 per cent of Hispanics of all ages are considered obese – that is, a third overweight – compared with a still worrying but lower 17 per cent among whites.66 The poor are more obese than the more affluent within the US. The price of food is a key driver of obesity: saturated fats from dairy and meat and hydrogenated (trans) fats are relatively cheap.67 The connection between overweight and health risk is alarmingly highlighted by the following list of the physical ailments that an overweight population (with a BMI higher than 25) is at risk of:68 • • • • • • • • • • • • • • • • • • • •
high blood pressure, hypertension; high blood cholesterol, dyslipidemia; type-II (non-insulin-dependent) diabetes; insulin resistance, glucose intolerance; hyperinsulinaemia; coronary heart disease; angina pectoris; congestive heart failure; stroke; gallstones; cholescystitis and cholelithiasis; gout; osteoarthritis; obstructive sleep apnea and respiratory problems; some types of cancer (such as endometrial, breast, prostate and colon); complications of pregnancy; poor female reproductive health (such as menstrual irregularities, infertility and irregular ovulation); bladder control problems (such as stress incontinence); uric acid nephrolithiasis; psychological disorders (such as depression, eating disorders, distorted body image and low self-esteem).
There is a vocal position – particularly articulated in the US – arguing that the critique of obesity is an infringement of personal liberty and ‘size-ist’, making cultural value statements. If someone wants to be fat and is content and loved by others, goes this argument, what does it matter? The list of health problems given
Index of measurement
BMI=95th percentile
Age-adjusted BMI cut-off linked to adult value of 30kg/m2
Age-adjusted BMI cut-off linked to adult value of 30kg/m2
Age-adjusted BMI cut-off linked to adult value of 25kg/m2
>120% of standard weight
Weight-for-height >2 SD from median
Age-adjusted BMI cut-off linked to adult value of 30kg/m2
Weight-for-height >2 SD from median
Weight-for-height >2 SD from median
Age-adjusted BMI cut-off linked to adult value of 25 kg/m2
Weight-for-height >2 SD from median
Weight-for-height >2 SD from median
Country
USAb
Englandb
Scotlandc
Chinad
Japane
Egyptf
Australiag
Ghanaf
Moroccof
Brazild
Chileh
Costa Ricaf
0–6 (1982) 1982 (2.3%) 1–7 (1996)
1985 (4.6%)
1974 (4.9%) 1974 (3.7%)
6–9 10–18 0–6
1987 (2.7%)
0–5
1988 (0.5%)
1985 (1.4% boys; 1.2% girls)
7–15 0–3
1978 (2.2%)
1970 (2 SD from median
Haitig
0–5
Age of children 1978 (0.8%)
Date of firs study (% obesity) 1994/95 (2.8%)
Up 3.5-fold
Date of second study Growth of obesity incidence (% obesity) from first to second study
Sources: a Ebbeling, C. B., Pawlak, D. B. and Ludwig, D. S. (2002) Childhood obesity: Public health crisis, common sense cure, The Lancet, vol 360, 10 August, pp473–482; b National Center for Health Statistics (1999) Prevalence of overweight among children and adolescents: United States, 1999–2000, available at www.cdc.gov/nchs/products/pubs/pubd/hestats/overweight99.htm (accessed 29 January 2002); c Chinn, S. and Rona, R. J. (2001) Prevalence and trends in overweight and obesity in three cross-sectional studies of British children, 1974–1994, BMJ, vol 322, pp24–26; d Wang, Y., Monteiro, C. and Popkin, B. M. (2002) Trends of obesity and underweight in older children and adolescents in the US, Brazil, China, and Russia, American Journal of Clinical Nutrition, vol 75, pp971–977; e Murata, M. (2000) Secular trends in growth and changes in eating patterns of Japanese children, American Journal of Clinical Nutrition, vol 72 (suppl), ppl379S–1383S; f deOnis, M. and Blossner, M. (2000) Prevalence and trends of overweight among preschool children in developing countries, American Journal of Clinical Nutrition, vol 72, pp1032–1039; g Magarey, A. M., Daniels, L. A. and Boulton,T. J. C. (2001) Prevalence of overweight and obesity in Australian children and adolescents: Reassessment of 1985 and 1995 data against new standard international definitions, Medical Journal of Australia, vol 174, pp561–564; h Filozof, C., Gonzalez, C., Sereday, M., Mazza, C. and Braguinsky, J. (2001) Obesity prevalence and trends in Latin American countries, Obesity Review, vol 2, pp99–106
Index of measurement
Country
Table 13.5 (continued)
Diet and Health: Diseases and Food 289
above is surely an answer to this position. The costs of what is presented as an ‘individual’ problem are, in fact, society wide. The ill health that results is paid for either in direct costs or in a societal drag – lost opportunities, inequalities and lost efficiencies. This is why policy makers have to get to grips with obesity and the world’s weight problem. Both obesity and overweight are preventable. At present the debate about obesity is divided about which of three broad strategies of action is the best to address. One strand argues that it is a problem caused by over-consumption (diet and the types of food) and oversupply; another that it is lack of physical activity; and the third that there might be a matter of genetic predisposition. Certainly, the emphasis has to be on changing the environmental determinants that allow obesity to happen. A pioneering analysis by Australian researchers in the mid-1990s proposed that the obesity pandemic could only be explained in ‘ecological’ terms: Professors Garry Egger and Boyd Swinburn set out environmental determinants such as transport, pricing and supply; they claimed that environmental factors were so powerful in upsetting energy balances that obesity could be viewed as ‘a normal response to an abnormal environment’.69 So finely balanced are caloric intake and physical activity than even slight alterations in their levels can lead to weight gain. Swinburn and Egger assert that no amount of individual exhortation will reduce worldwide obesity;70,71 transport, neighbourhood layout, home environments, fiscal policies and other alterations of supply chains must be tackled instead.
Calculating the Burden of Diet-related Disease During the 1990s, world attention was given to calculating the costs of what has been called the ‘burden of disease’. Five of the ten leading causes of death in the world’s most economically advanced country, the US, were, by the 1980s, dietrelated: coronary heart disease, some types of cancer, stroke, diabetes mellitus and atherosclerosis. Another three – cirrhosis of the liver, accidents and suicides – were associated with excessive alcohol intake.72 Together these diseases were accounting for nearly 1.5 million of the 2.1 million annual deaths in the US. Only two categories in the top ten – chronic obstructive lung disease and pneumonia and influenza – had no food connection. In a 1990s study published by the World Bank, The Global Burden of Disease,73 the authors Murray and Lopez gave a detailed review of causes of mortality in eight regions of the world. Ischaemic heart disease accounted for 6.26 million deaths. Of these, 2.7 million were in established market economies and formerly socialist economies of Europe; 3.6 million were in developing countries (out of 50.5 million deaths from all causes in 1990). Stroke was the next most common cause of death (4.38 million deaths, almost 3 million in developing countries), closely followed by acute respiratory infections (4.3 million, 3.9 million in developing
290 Diet and Health
countries). Other leading causes of death include diarrhoeal disease (almost totally occurring in developing countries), chronic obstructive pulmonary disease, tuberculosis, measles, low birthweight, road-traffic accidents and lung cancer, with only diarrhoea and low birthweight having a diet-related aetiology. They also calculated that cancers caused about 6 million deaths in 1990. About 2.4 million cancer deaths occurred in established market economies and former socialist economies of Europe. By 1990, therefore, there were already 50 per cent more cancer deaths in less developed countries than in developed countries. For their analysis, Murray and Lopez created a new index they called the DALY, standing for the ‘disability adjusted life year’. A DALY is the sum of life years lost owing to premature death, and years lived with disability (adjusted for severity). It is thus a measure of both death and disability (both mortality and morbidity). The top ten DALYs in all developing regions combined already included ischaemic heart disease and cerebovascular disease. Murray and Lopez’s report concluded: ‘Clearly, the focus of research and debate about health policy in developing regions should address the current challenges presented by the epidemiological transition now, rather than several decades hence.’ Table 13.6 gives their original breakdown for the world of the DALYs by main disease, present and anticipated. The authors anticipated that the greatest increase in cardiovascular disease-related DALYs would occur in developing countries, up from 8.3 per cent in 1990 to 13.8 per cent in 2020 – a rising burden of disease for those countries which could least afford it. The corresponding increase in developed countries’ DALYs associated with non-communicable diseases was calculated to be only relatively slight, rising from 20.4 per cent to 22.0 per cent. (The developed world already had a high base rate of DALYs from diet-related disease.) (Interestingly, there is hardly any movement Table 13.6 DALYs lost by cause for the developed and developing countries, 1990 and 2020 Cause
Developed 1990 (%)
Developing 1990 (%)
2020 (%)
7.8
4.3
48.7
22.2
20.4
22.0
8.3
13.8
Coronary heart disease
9.9
11.2
2.5
5.2
Stroke
5.9
6.2
2.4
4.2
Infectious diseases Cardiovascular disease
Diabetes Cancer
2020 (%)
1.9
1.5
0.7
0.7
13.7
16.8
4.0
9.0
Neuropsychiatric disorders
22.0
21.8
9.0
13.7
Injuries
14.5
13.0
15.2
21.1
Source: Murray, C. J. L and Lopez, A. D. (1996) The Global Burden of Disease: A Comprehensive Assessment of Mortality and Disability from Diseases. Injuries and Risk Factors in 1990 and Projected to 2020. Harvard University Press on behalf of the World Bank and WHO, Cambridge, MA
Diet and Health: Diseases and Food 291 Table 13.7 DALYs lost by selected causes for the EU and Australia around 1995 Cause
EU %
Australia %
Smoking
9.0
9.5
Alcohol consumption
8.4
2.1
Diet and physical activity
8.3
16.4
Overweight
3.7
2.4
Low fruit and vegetable intake
3.5
2.7
High saturated fat intake
1.1
2.6
Physical inactivity
1.4
6.8
Sources: National Institute of Public Health, Stockholm (1997).74
in diabetes figures for developing countries and a fall for developed countries, yet it should be noted that diabetes figures are in fact rising rapidly worldwide. The newness of this diet-related epidemic might have been too late for Murray and Lopez’s 1990 data.) One purpose of the DALY method is to enable policy makers to estimate the relative risk of major factors for health. Table 13.7 gives the Swedish National Institute of Public Health’s summary of the calculated impacts of smoking, alcohol, diet and physical activity for key DALYs in the EU and Australia. Again, the diet-related disease toll is very high. Smoking, as was noted at the start of this chapter, is a major contributory factor in heart disease but the dietary factors, when separated, were almost as great. The DALY approach was extended in the ‘World Health Report 2002’ which was based on a series of massive multi-country studies designed to test and refine the methodology. Figure 13.11 details risk factors by level of development. The results, however, merely deepened the insights from the earlier study. If anything, the burden of diet-related disease and of lack of physical activity received even higher profile. Special studies on the impact of lack of fruit and vegetables in the diet showed great impact. The WHO–FAO 2003 report underlined how a variety of diseases, from heart disease to diabetes, were all associated with the same dietary pattern: over-consumption, excess fat, under-consumption of fruit and vegetables and excess added sugar and salt.75
The Financial Costs In 2001, the Commission on Macroeconomics and Health, created by the WHO, argued that there were mutual benefits to be had from improved health and for the economy, particularly for those in low-income countries.76 Table 13.8 shows how general health care costs are rising rapidly in many developed economies; in the developing world, the costs of health care for degenerative diseases are now also
292 Diet and Health
Source: The World Health Report 2002
Figure 13.11 Burden of disease attributable to ten selected leading risk factors by level of development and type of affected outcome
Diet and Health: Diseases and Food 293 Table 13.8 Growth of expediture on health, 1990–2000 Real per capita growth rates, 1990–2000 (%)
Health spending as per cent of GDP
Health spending
GDP
1990
1998
2000
Australia
3.1
2.4
7.8
8.5
8.3
Austria
3.1
1.8
7.1
8.0
8.0
Belgium
3.5
1.8
7.4
8.5
8.7
Canada
1.8
1.7
9.0
9.1
9.1
Czech Republic
3.9
0.1
5.0
7.1
7.2
Denmark
1.7
1.9
8.5
8.4
8.3
Finland
0.1
1.8
7.9
6.9
6.6
France
2.3
1.4
8.6
9.3
9.5
Germany
2.2
0.2
8.7
10.6
10.6
Greece
2.8
1.9
7.5
8.7
8.3
Hungary
2.0
2.7
7.1
6.9
6.8
Iceland
2.9
1.6
7.9
8.3
8.9
a
Ireland
6.6
6.4
6.6
6.8
6.7
Italy
1.4
1.4
8.0
7.7
8.1
Japan
3.9
1.1
5.9
7.1
7.8
Korea
7.4
5.1
4.8
5.1
5.9
Luxembourgb
3.7
4.5
6.1
5.8
6.0
Mexico
3.7
1.6
4.4
5.3
5.4
Netherlands
2.4
2.3
8.0
8.1
8.1
New Zealand
2.9
1.5
6.9
7.9
8.0
Norway
3.5
2.8
7.8
8.5
7.5
Poland
4.8
3.5
5.3
6.4
6.2
5.3
2.4
6.2
8.3
8.2
b
Portugal Slovak Republic
—
4.0
—
5.9
5.9
Spain
3.9
2.4
6.6
7.6
7.7
Switzerland
2.5
0.2
8.5
10.6
10.7
UK
3.8
1.9
6.0
6.8
7.3
US
3.2
2.3
11.9
12.9
13.0
OECD Averagec,d
3.3
2.2
7.2
8.0
8.0
EU Average
3.1
2.3
7.4
8.0
8.0
Notes: No recent estimates are available for Sweden and Turkey. a Hungary: 1991–2000; b Luxembourg and Poland: 1990–1999; c OECD averages exclude the Slovak Republic because of missing 1990 estimates; d Unweighted averages. Source: OECD (2002) Health Data 2002, available at www.oecd.org/pdf/M00031000/ M0Q031130.pdf (pq)
294 Diet and Health Table 13.9 Economic costs of diet- and exercise-related health problems, US Disease
Direct costs US$ billion (medical expenditures)
Indirect costs US$ billion (productivity losses)
Total costs US$ billion
Heart disease
97.9
77.4
175.3
Stroke
28.3
15.0
43.3
Arthritis
20.9
62.9
83.8
Osteoporosis
n.a.
14.9
14.9
Breast cancer
8.3
7.8
16.1
Colon cancer
8.1
n.a.
8.1
Prostate cancer
5.9
n.a.
5.9
Gall bladder disease
6.7
0.6
7.3
Diabetes
45.0
55.0
100.0
Obesity
55.7
51.4
107.1 Total = 561.8
Note: Costs are expressed in constant 1998 dollars, using the Consumer Price Index. Source: National Institutes of Health (1998) and Wolf and Colditz (1998)77
looming as a serious concern. The growth of health expenditure is sometimes higher than the growth of gross domestic product (GDP). Table 13.9 gives a breakdown of the direct and indirect costs for a number of key diet-related diseases in the US; these costs are immense, even for such a rich society. Health ministries, it appears, are locked in a model which tends to be curative rather than preventative. The UK health care system, for instance, costs £68 billion for around 60 million people, costs that are anticipated to rise to between £154 billion ($231 billion) and £184 billion ($276 billion) by 2022–2023 in 2002 prices.78 In other words, at constant prices, UK health care costs are doubling. In the context of diet-related disease, the direct and indirect financial tolls of ill health could offer opportunities for positive policy intervention through a health-enhancing food supply chain. An estimate for the UK by the Oxford University British Heart Foundation Health Promotion Research Group has calculated that coronary heart disease (CHD) – constituting about half of all cases of cardiovascular disease – costs the UK £10 billion per annum. These costs are made up of £1.6 billion in direct costs (primarily to the taxpayer through the costs of treatment by the NHS) and £8.4 billion in indirect costs to industry, and to society as a whole, through loss of productivity due to death and disability.79 (This is probably an underestimate of the direct costs to the UK’s National Health Service as these costs do not include the cancer treatment costs.) A report chaired in 2002 by Derek Wanless, a former head of the NatWest Bank, for the Chancellor of the Exchequer produced not dissimilar calculations.80
Diet and Health: Diseases and Food 295
It estimated that costs for the health service will rise alarmingly if targets are not met to reduce CHD and cancers. CHD treatment costs (drugs like statins and surgical techniques like revascularization) would add an additional £2.4 billion per annum by 2010–2011, doubling CHD expenditure. Such calculations remind us of the multi-headed nature of ill health. Smoking, diet, physical activity, genetics, environment and socioeconomic background all have direct health outcomes. Wanless and his team were convinced by US scientific work that high cholesterol – ‘which is mainly due to diet’ – accounts for 43 per cent of CHD incidence, compared to 20 per cent for smoking. This sort of evidence shows that the poor diet has such far-reaching financial implications that it warrants higher political attention. This case was confirmed by a second Wanless study arguing for the economic value of facing the public health costs of poor diet, life-style and education.81 However, for the last quarter of a century policy attention has been directed to cutting costs, not by altering the food supply chain, but by such policies as contracting out services and by privatization. In the UK, less than £5 million a year is spent on food-related health education. Meanwhile, drug companies and surgeons only offer expensive but highly sophisticated solutions when the patient is already sick. Indeed, drug treatments can be hugely expensive. A trial on over 20,000 UK people with high risks for heart disease showed that giving patients a type of drug known as statins reduced the risk of a first coronary attack by 25 per cent but would cost £1 ($1.5) per patient per day.82 Currently, 1.8 million people are prescribed statins, costing UK£750 million a year. Taking statins for three years can reduce the risk of a heart attack by up to a third.
Coronary Heart Disease (CHD) Since 1999, the WHO has attributed 30 per cent of all annual global deaths – that is, of 15 million people – to cardiovascular disease.83,84 The majority of those deaths are in low- and middle-income countries. In 1998, 86 per cent of DALYs were lost to cardiovascular disease (CVD) worldwide. The main risk factors for heart disease are high blood pressure, smoking and lipid concentrations (cholesterol levels). Others include age, sex, family history and the presence of diabetes. WHO recommendations for reducing CVD include:85 • • • • • •
regular physical activity; linoleic acid; fish and fish oils; vegetables and fruits, including berries; potassium; low to moderate alcohol intake.
296 Diet and Health
The WHO judges that there is convincing evidence for the increasing risks from: • • • • •
myristic and palmitic acid; trans-fatty acids; high sodium intake; overweight; high alcohol intake.
In regard to CHD, public health policy has tended to focus on two things: health education as prevention, and improved medical treatment through drug, hospital and surgical care. It has also urged behavioural change, in particular a reduction of total fat intake and especially of saturated fats (mainly from animal meat and dairy fats). This health promotion policy has had an effect: rates of heart disease are declining in most affluent Western countries, after years of steady increase since the immediate post-World War II period (see Tables 13.10 and 13.11).86 The global picture is more complex, however.87 For example, the steep rise in CHD in the newly independent countries of Eastern Europe (such as Belarus, Azerbaijan and Hungary) is worrying. Leaving the strictures of the Soviet era means only that already high rates of CHD have risen further. Even in countries considered to have a healthy diet, like Greece and Japan, social change is being accompanied by changing patterns of diet-related disease: Greece’s CHD and obesity rates are rising as it changes to a more Northern European diet high in animal fats, following entry to the EU and increased tourism. Death rates from CHD may have dropped in the US and Finland, but it should be remembered that their morbidity and costs are still high, as was shown by the Global Burden of Disease studies. Table 13.10 Age-standardized deaths per 100,000 population from CHD selected countries, 1968–1996: men Men
1968
1978
1988
1998
Finland
718
664
477
340
UK
517
546
434
297
Austria
327
349
262
226
US
694
504
292
224
Australia
674
409
315
202
Canada
543
457
296
200
a
Italy
230
249
172
150
Belgiuma
345
313
184
147
Spain
99
165
146
125
France
152
154
118
92
Japan
92
74
52
58
Note: a latest statistics for 1994.
Diet and Health: Diseases and Food 297 Table 13.11 Age-standardized deaths per 100,000 population from CHD selected countries, 1968–1996: women Women
1968
1978
1988
1996
UK
175
182
156
107
Finland
204
177
141
93
US
273
185
119
92
Austria
120
119
84
81
Australia
268
186
117
73
Canada
198
155
100
72
111
100
61
46
87
82
51
43
Belgium
a
Italya Spain
33
46
39
34
France
49
44
30
22
Japan
45
99
21
21
Note: a latest statistics for 1994. Source: British Heart Foundation from WHO country statistics
This complexity keeps epidemiologists busy around the world, but the rapidity of change should bring little surprise. In 1981 Trowell summarized the emergence of CHD amongst East Africans: in the 1930s, he reported, autopsies had shown zero CHD in East Africa, and only one case among 2994 autopsies conducted in Makere University Medical School over the period 1931–1946. However, by the 1960s CHD in this region was emerging as a major rather than peripheral health problem.88 In China, between 1991 and 1995,89 CHD accounted for 15 per cent of all deaths. Cholesterol levels here, compared to those found in Western populations, were low but were increasing rapidly among the urban populations where a more affluent lifestyle was being adopted. Daily intake of meat, eggs and cooking oil had increased while intake of legumes and cereals had decreased. A reduction in the consumption of Western fast foods was also recommended as were increasing physical activity levels, an urging which could be applied to many urbanizing developing countries.
Food-related Cancers Since the 1980s, dietary factors have been thought to account for around 30 per cent of cancers in Western countries, making diet second only to tobacco as a preventable cause of cancer;90 in developing countries diet accounted for around 20 per cent.91 Table 13.12 gives the 1997 review of food-cancer research by the World Cancer Research Fund. An updated report is due out in 2006.
8
1
2
13
—
Oesophagus
Lung
Stomach
Pancreas
Gallbladder
c
200
1015
1320
480
190
b
↑ oesophagus
↑ alcohol
—
↓ Vegetables & fruits ↑ Smoking ↑ meat, animal fat
↑ salted foods
↑ salt
↓ refrigeration
↓ Vegetables & fruits ↑ H. pylori
↓ Vegetables & fruits ↑ Smoking ↑ Occupation
↑ Barrett’s
↑ deficient diets
↓ Vegetables & fruits ↑ Smoking
↑ EBVb
↑ betela
↓ Vegetables & fruits ↑ Smoking ↑ alcohol
14
↑ alcohola
↓ Vegetables & fruitsa ? Smokinga
Larynx
575
Non-dietary risk factors (established)
↑ salted fish
5
Dietary factors (convincing or probable)
Nasopharynx
Mouth and pharynx
Global Global ranking incidence (incidence) (1000s)
33
66
20
50
33
33
Low estimate (%)
50
75
33
75
50
50
66
670
254
240
63
190
100
761
436
360
95
288
Low estimate High estimate (1000s) (1000s)
Preventable by diet High estimate (%)
Table 13.12 Cancers preventable by dietary means
3
15
16
Breast
Ovary
Endometrium
7
4
Colon, rectum
Cervix
6
Liver
525
170
190
910
875
540
Global Global ranking incidence (incidence) (1000s)
↑ Smoking
↑ MBV and HCV
Non-dietary risk factors (established)
↑ S. sinensis
↑ Alcohol
↑ Genes
↑ Rapid early growth
↓ Vegetables & fruits
↑ Obesity
—
↑ Alcohol
↑ Obesity
↑ HPV
↓ Reproductive
↑ Oestrogens
↑ OCs
↓ Reproductive
↑ Genes
↑ Early menarche ↑ Radiation
↓ Reproductive
↓ Vegetables
↓ NSAIDs
↑ Ulcerative colitis
↑ Meat
↓ Physical activity ↑ Genes
↓ Vegetables
↑ Alcohol ↑ contaminated food
Dietary factors (convincing or probable)
10
25
10
33
66
33
Low estimate (%)
Table 13.12 (continued)
20
50
20
50
75
66
High estimate (%)
53
43
19
300
578
178
105
85
38
455
656
356
Low estimate High estimate (1000s) (1000s)
Preventable by diet
17
11
Kidney
Bladder
10,320
—
310
165
100d
400
↑ Smoking
—
↑ Obesity ↑ Phenacetin ↑ Smoking ↑ Occupation ↑ S. haematobium
↑ Smoking
10
10
20
10
20 33
10 25
20
10
29.3%
3022
236
31
41
10
40
40.6%
4187
236
62
54
20
80
Non-dietary risk Preventable by diet factors Low High Low estimate High estimate (established) estimate (%) estimate (%) (1000s) (1000s)
↑ Iodine deficiency ↑ Radiation
↑ Meat or meat fat or dairy fat
Dietary factors (convincing or probable)
Source: Table 9.1.2 in World Cancer Research Fund (1997), Food Nutrition and the Prevention of Cancer: A Global Perspective. Washington DC: World Cancer Research Fund/American Institute for Cancer Research. Reproduced by permission
Notes: Included as ‘dietary factors’ in this table are various foods, nutrients, alcoholic drinks, body weight and physical activity. The panel has estimated the extent to which specific cancers or cancer in general are preventable by the dietary and associated factors described in this report. The figures suggested are ranges consistent with current scientific knowledge, and take established non-dietary risk factors, notably the use of tobacco, specific infections and occupational exposures to carcinogens, into account. The arrows represent either decreasing risk (↓) or increasing risk (↑). Figures on global ranking and incidence: Parkin et al (1993); WHO (1997). A mouth and pharynx; also chewing tobacco; b nasopharynx; c reliable worldwide data are not collected by IARC for this site; d conservative estimate based on the IARC (1993).
Total (1996)
2355
—
Thyroid
Other
9
Prostate
Global Global ranking incidence (incidence) (1000s)
Table 13.12 (continued)
Diet and Health: Diseases and Food 301
The annual WHO World Health Report has shown that cancers are increasing worldwide,92 and the 2003 World Cancer Report suggested that, like obesity, rising cancer rates are preventable. By virtue of steadily ageing populations, cancer could further increase by 50 per cent to 15 million new cases a year by 2020. In 2000, 6.2 million people died of cancer worldwide (12.5 per cent of all deaths), but 22.4 million were living with cancer. In the South, cancers of the oesophagus, liver and cervix are more common, while in the North, there is a predominance of cancers of the lung, colon, pancreas and breast. The most significant cause of death among men is lung cancer and among women breast cancer, but certain life-style changes, such as to diet or smoking habits, would alter these patterns. Some cancers are closely associated with diets centred on well-cooked red meats, animal proteins and saturated fats in large quantities, with a daily routine that takes in little physical activity.93 Indeed, many cancers could be prevented by modifying dietary habits to include more fruits, vegetables, high-fibre cereals, fats and oils derived from vegetables, nuts, seeds and fish, and by limiting the intake of animal fats derived from meat, milk and dairy products.94,95 A number of published studies show that an increase in antioxidant nutrients such as beta-carotene, vitamins C and E, zinc and selenium could also decrease the risk of certain cancers and there seems to be strong evidence that eating a diet rich in fresh fruit and vegetables will reduce the risk of stomach cancer.96 Yet the nutrition transition is being driven in a different direction – towards a diet actually higher in processed foods and animal fats, key food industries within the Productionist paradigm.
Diabetes The incidence of type II diabetes is, alarmingly, on the increase. This form of diabetes was formerly known as non-insulin-dependent diabetes mellitus, occurring when the body is unable to respond to the insulin produced by the pancreas; it accounts for around 90 per cent of cases worldwide. In Type I diabetes (formerly known as insulin-dependent), the pancreas fails to produce the insulin which is essential for survival; this form develops most frequently in children and adolescents, but is now being increasingly noted later in life.97 It is anticipated that cases of type II diabetes will rise coming years (see Table 13.13): the WHO anticipates a doubling in the number of cases from 150 million in 1997 to 300 million in 2025, with the greatest number of new cases being in China and India.98 Diabetes is the fourth main cause of death in most developed countries. Research demonstrates the association between excessive weight gain, central adiposity (fat around the waist) and the development of type II diabetes. Diabetics are two to four times more likely to develop cardiovascular diseases than others, and a stroke is twice as common in people with diabetes and high blood pressure as it is for those with high blood pressure alone. In 2000, India recorded 32.7 million diabetics, China
302 Diet and Health Table 13.13 Prevalence of diabetes worldwide 2000 Africa
2030
Projected growth
7020,553
18,244,638
160
Mediterranean
15,189,760
43,483,842
186
Americas
33,014,823
66,828,417
102
European
33,380,754
48,411,977
45
SE Asia
45,810,544
122,023,693
166
Western Pacific
36,138,079
71,685,158
98
171,000,000
366,000,000
114
Total
Source: WHO (2004) Diabetes Action Programme. Geneva, World Health Organization, available at www.who.int/diabetes/facts/worid_figures/en/
22.6 million and the US 15.3 million, while Brazil recorded only 3.3 million and Italy 3.1 million. In 2000, the five countries with the highest diabetes prevalence in the adult population only were Papua New Guinea (15.5 per cent), Mauritius (15 per cent), Bahrain (14.8 per cent), Mexico (14.2 per cent) and Trinidad & Tobago (14.1 per cent).99,100 Such disparate statistics reflect a transition from traditional diet and from an activity-based life-style to a more sedentary one. By 2025, the prevalence of diabetes is anticipated to triple in Africa, the Eastern Mediterranean, the Middle East and South Asia. It is expected to double in the Americas and the Western Pacific and to almost double in Europe. In India, incidence is much higher in urban than rural populations:101 in urban Chennai (Madras), for example, cases of diabetes rose by 40 per cent in 1988–1994. Incidence is rising among male urban dwellers of South India compared to the rural male population. In addition to diabetes mellitus, the prevalence of NIDDM increased dramatically within the urban populations of India within just a decade.102 In Thailand, also, NIDDM is more pronounced amongst females in the urban population than it is in the rural population,103 whilst in the rural environment, incidence of NIDDM amongst males is higher. In the UK, Professor David Barker and colleagues have shown that adult diabetes is associated with low birthweight,104 while studies in India suggest that poor interuterine growth, combined with obesity later in life is associated with insulin resistance, diabetes and increased cardiovascular risk.105 Once again, a single disease seems attributable to a pattern of poor nutrition related to the life cycle, and is one whose costs are externalized onto society as a whole and health care in particular. Devastating complications of diabetes, such as blindness, kidney failure and heart disease, are imposing a huge financial burden: in some countries 5–10 per cent of national health budgets.
Diet and Health: Diseases and Food 303
Food Safety and Foodborne Diseases Whilst attention to such non-communicable diseases is of vital importance, food safety, foodborne diseases and other communicable diseases remain uppermost within food and public health policy, partly due to consumer campaigns about risks and to heightened media awareness of poor food processing standards. Food safety problems include risks from:106 • • • • • •
veterinary drug and pesticide residues; food additives; pathogens (i.e. illness-causing bacteria, viruses, parasites, fungi and their toxins); environmental toxins such as heavy metals (e.g. lead and mercury); persistent organic pollutants such as dioxins; unconventional agents such as prions associated with BSE.
In particular, companies have had to respond to new public awareness about food safety issues, and new regimes of traceability have been implemented to enable companies to track food ingredients in order to eliminate subsequent legal or insurance liability consequences. In this respect, food companies are anxious to present themselves as guardians of the public health.107 The attention food safety receives is predictably higher in affluent countries when, on the evidence, the burden of ill health is far greater in the developing world, due to lack of investment and infrastructure, including drains, housing, water supplies and food control systems. The World Health Report 2002 pointed out that, in developing countries, water supply and general sanitation remain the fourth highest health-risk factor, after underweight, unsafe sex and blood pressure.108 In developing countries which are building their food export markets, there is too often a bipolar structure, with higher standards for foods for export to affluent countries than for domestic markets. There ought to be a cascading down into internal markets of these higher standards.109 Environmental risks to health are a significant problem on the global scale and, in Western countries in the 1990s, new strains of deadly bacteria such as E. coli 0157 captured policy attention, an estimated 30 per cent of people having suffered a bout of foodborne disease annually. The US, for instance, reports an annual 76 million cases, resulting in 325,000 hospitalizations and 5000 deaths.110 The WHO estimates that 2.1 million children die every year from the diarrhoeal diseases caused by contaminated water and food,111,112 asserting that each year worldwide there are ‘thousands of millions’ of cases of foodborne disease.113 In early industrializing countries, a grand era of engineering made dramatic health improvements in public health. Part of that investment included the introduction of effective monitoring and hygiene practice systems, such as the establishment of local authority laboratories and training, the packaging of foods and processes such as milk pasteurization. Today, public health proponents are actively
304 Diet and Health
trying to promote a ‘second wave’ of food safety intervention but this time using a risk-reduction management system known as Hazards Analysis Critical Control Point (HACCP), an approach designed to build safety awareness and control of potential points of hygiene breakdown into food handling and management systems. HACCP also encourages the creation of a ‘paper’ trail to enable tracking along the production process, essential in order to obviate errors and enable learning. Breakdowns in food safety have in the past led to major political and business crises, with governments under attack and new bodies responsible for food safety being set up in many countries. As food supply chains become more complex and as the scale of production, distribution and mass catering increases, so the chances for problems associated with food contamination rise; mass production breakdowns in food safety spread contamination and pathogens widely. An outbreak of Salmonellosis in the US in 1994, for example, affected an estimated 224,000 people.114 Listeria monocytogenes has a fatality rate of 30 per cent, a fact that seriously dented UK public confidence in the ‘cook-chill’ and ‘oven-ready’ foods of the late 1980s. Cross-border trade in agricultural and food products, as well as international pacts have brought food safely to the fore.115 The Director-General of the WHO, in a speech on food safety to the UN Codex Alimentarius Commission, said: ‘globalisation of the world’s food supply also means globalisation of public health concerns’.116 Crises over BSE, Salmonellosis and E. coli. for example, had had a significant political impact throughout both the UK and EU, for instance,117 and many countries have experienced a fast rise in incidences of Salmonellosis and Campylobacter infections since the 1980s, both bacteria being associated with meat and meat products. Despite countries such as Denmark and Sweden having strict policies governing the extermination of flocks and herds found to be carrying Salmonella, the incidence continues through the contamination of feedstuffs, and in Denmark in 1998 the percentage of positive flocks with Campylobacter was 47.1 per cent. Thus, in many developed countries with good monitoring systems, the incidence of foodborne disease has in fact risen during the era of the Productionist paradigm: in West Germany cases of infectious S. enteritis rose from 11 per 100,000 head of population in 1963 to 193 per 100,000 in 1990;118 in England and Wales formal notifications of the same disease rose from 14,253 cases in 1982 to 86,528 in 2000. These cases resulted in millions of days lost from work but, fortunately, relatively few deaths. Bacteria fill gaps left by nature, evolving new strains; but they are constantly evolving even as science combats existing strains. The new food processes and systems of distribution ushered in by the food technology revolution of the second half of the 20th century provided many opportunities for bacteria to develop and colonize new niches. The incidence of Salmonella in the UK, for example, first rose, and then, following good monitoring, hygiene intervention and political pressure, fell right back – in two decades. Table 13.14 gives a list from the WHO of some of the pathogenic organisms that are associated with food and food hygiene: viruses, bacteria, trematodes
Diet and Health: Diseases and Food 305 Table 13.14 Some pathogenic organisms associated with public health, which may be transmitted through food Bacteria
Protozoa
Bacillus cereus
Cryptosporidium spp
Brucella spp
Entamoeba histolyica
Campylobacter jejuni and coli
Giardia lamblia
Clostridium botulinum
Toxoplasma gondii
Clostridium perfringens Escherichia coli (pathogenic strains)
Trematodes (flukeworms)
Listeria monocytogenes
Fascioia hepatica
Mycobacterium bovis
Opistorchis felineus
Salmonella typhi and paratyphi Salmonella (non-typhi) spp
Cestodes (tapeworms)
Shigella spp
Diphyllobotrium latum
Staphylococcus aureus
Echinococcus spp
Vibrio cholerae
Taenia solium and saginata
Vibrio parahaemolyticus Vibrio fulnificus Yersinia enterocolitica
Nematodes (roundworms) Anisakis spp Ascaris lumbricoides
Viruses
Trichinella spiralis
Hepatitis A
Trichuris trichiura
Norwalk agents Poliovirus Rotavirus Source: WHO European Centre for Health and Environment, Rome, 2000
(flukeworms), cestodes (tapeworms) and nematodes (roundworms), the last three all small worms that can be found either in soil, fish or meats. The first two are concerns in global food trade particularly. In the case of bacteria such as Listeria monocytogenes, only 657 cases were reported throughout the EU in 1998;119 in the same period, deaths from cardiovascular disease in the EU totalled 1.5 million, 42 per cent of all deaths,120 while, in 1990, diarrhoeal diseases accounted for 11,000 years of life (DALYs) lost out of a total of 22.7 million in Europe; in the same year, cardiovascular disease accounted for 7 million, diabetes for 371,000 and cancer of the colon and rectum for 593,000,121 and five times as many years of life were lost due to drug addiction than to diarrhoeal diseases. Despite a low health burden in the developed world, the financial costs of food poisoning can be significant. Estimates in the US suggest that the diseases caused
306 Diet and Health
by major pathogens cost up to $35 billion each year in medical costs and lost productivity.122 Policy makers must be concerned about both foodborne illness and degenerative diseases, the latter of which do not as yet receive sufficient political attention.
Food Poverty in the Western World Most public health concern about food poverty rightly centres on the developing world, but it is also important to recognize that the impact of food poverty is significant in the developed world. The new era of globalization has unleashed a reconfiguration of social divisions both between and within countries; these social divisions are particularly marked in societies such as the UK and the US which have pursued neoliberal economic policies. Indeed, one review of EU food and health policies estimated that food poverty was far higher in the UK than any other EU country,123 where inequalities in income and health widened under the Conservative government of 1979–1997. The proportion of people earning less than half the average income grew124 and the bottom tenth of society experienced a real, not just relative, decline in income and an increase in social health distinctions. This was the converse of the post-World War II years of Keynesian social democratic policies during which inequalities narrowed: lower UK socioeconomic groups now experience a greater incidence of premature and low birthweight babies, and of heart disease, stroke and some cancers in adults. Risk factors such as bottle-feeding, smoking, physical inactivity, obesity, hypertension, and poor diet were clustered in the lower socioeconomic groups125 whose diet traditionally derives from cheap energy forms such as meat products, full-cream milk, fats, sugars, preserves, potatoes and cereals with little reliance on vegetables, fruit and wholemeal bread. Essential nutrients such as calcium, iron, magnesium, folate and vitamin C are more likely to be ingested by the higher socioeconomic groups:126,127 their greater purchasing power creates a market for healthier foods such as skimmed milk, wholemeal bread, fruit and other low-fat options. Similarly, in the US, hunger has been a persistent cause of concern for decades and rising during the 1990s when the Census Bureau calculated that 11 million Americans lived in households which were ‘food insecure’ with a further 23 million living in households which were ‘food insecure without hunger’ (in other words at risk of hunger).128 Other US surveys of the time estimated that at least 4 million children aged under 12 were hungry and an additional 9.6 million were at risk of hunger during at least one month of the year. Despite political criticisms of these surveys, further research suggested that even self-reported hunger, at least by adults, is a valid indication of low intakes of required nutrients. It should be noted that, ironically, the US spent over US$25 billion on federal and state programmes to provide extra food for its 25 million citizens in need of nutritional support.129
Diet and Health: Diseases and Food 307
Implications for Policy This chapter has sketched the bare bones of a highly complex global picture of diet-related health. Over the last half-century, epidemiologists have generated many facts, figures and arguments about the role of food in the creation and prevention of ill health, linking what humans eat with their patterns of disease. They raise a number of important questions: how much of a risk does poor diet pose? What proportion of the known incidence of key diseases like cancer, heart disease, diabetes and microbiological poisoning can be attributed to the food supply? What levels of certainty can be applied to the many studies that have been produced? Is diet a bigger factor than, say, tobacco or genetics? For policy makers, the uncomfortable fact is that the pattern of diet-related diseases summarized in this chapter appears to be closely associated with the Productionist paradigm. Whilst the paradigm had as its objective the need to produce enough to feed people, its harvest of ill health was mainly sown in the name of economic development. Yet the public health message is clear: if diet is inappropriate or inadequate, population ill health will follow. Diet is one of the most alterable factors in human health, but despite strong evidence for intervention, public policy has only implemented lesser measures such as labelling and health education while the supply chain remains legitimized to produce the ingredients of heart disease, cancer, obesity and their diet-related degenerative diseases. In making these tough assertions, we are aware that to piece together all food research evidence is immensely complex: more research is always needed; scientific understanding inevitably advances and is refined along the way. But surely, there is enough evidence for action. Certainly there is no shortage of reports and studies with which to inform policy. Calling for more research ought not to be an excuse for policy inaction. Policy procrastination is merely poor political prioritization. Policy attention needs to shift from the overwhelming focus, enshrined in the Productionist paradigm, on under-consumption and under-supply to a new focus on the relationship between the oversupply of certain foodstuffs, excessive marketing and malconsumption, and do so simultaneously within and between countries. Historically, there has been too much focus on public education as the main driver of health delivery; the diet and health messages, while welcome, have not always had the widespread or long-lasting effect that current data suggests is needed. While there have been reductions, for example, in coronary heart disease mortality rates in affluent societies, this is not universally true, and health education as framed in the West may not be universally appropriate. The food supply chain itself must be reframed and must target wider, more health-appropriate goals. Even rich countries are struggling to provide and fund equitable solutions to problems caused by diet: drugs and surgery, designer health foods, scientific research and public health education. But for developing countries, the majority of humanity, who have even fewer resources and weaker health care infrastructure, the picture is even more desperate. At the heart of the food policy challenge is the
308 Diet and Health
need to reinforce the notion of entitlement to food. While the 1948 Universal Declaration of Human Rights asserted the right to food for health for all, even into the new millennium the call is still not being adequately met, and, for humanity’s sake, it must now be pursued with more vigour.
Notes and References 1 2 3 4 5 6 7 8
9 10 11 12 13 14 15 16 17 18 19 20 21
Cited in Hill, C. 1975. The World Turned Upside Down: Radical Ideas During the English Revolution, Penguin, Harmondsworth, p391 WHO & FAO. 2003. Diet, Nutrition and the Prevention of Chronic Diseases. Technical Report Series 916, World Health Organization, Geneva; Food and Agriculture Organization, Rome WHO. 2003. Draft Global Strategy on Diet, Physical Activity and Health, World Health Organization, Geneva. Available at www.who.int/hpr/gs.strategy.document WHO. 2002. World Health Report 2002, World Health Organization, Geneva WHO. 2003. World Cancer Report, World Health Organization/International Agency for Research on Cancer, Geneva IOTF. 2003. Call for International Obesity Review as Overweight Numbers Reach 1.7 Billion, press release, International Obesity Task Force/International Association for the Study of Obesity, London WHO. 1998. Obesity: Preventing and Managing the Global Epidemic: Report of a WHO Consultation on Obesity, World Health Organization, Geneva Commission on the Nutrition Challenges of the Twenty-first Century. 2000. Ending Malnutrition by 2020: An Agenda for Change in the Millennium. Final Report to the ACC/SCN, Food and Nutrition Bulletin, vol 21, no 3, September. United Nations University Press, New York, p19ff Ewin, J. 2001. Fine Wines and Fish Oils: The Life of Hugh Macdonald Sinclair, Oxford University Press, Oxford Alexandratos, N. (ed) 1995. World Agriculture: Towards 2010: A FAO study, John Wiley & Son, Chichester Burinsma, J. (ed) 2003. World Agriculture: Towards 2015/2030, Food and Agriculture Organization, Rome; Earthscan, London, p5 Murray, C. J. L. and Lopez, A, D. 1996. Global Burden of Disease, World Health Organization, Geneva Popkin, B. M. 1999. ‘Urbanization, lifestyle changes and the nutrition transition’, World Development, vol 27, no 11, pp1905–1916 Cabellero, B. and Popkin, B. (eds) 2002. The Nutrition Transition, Elsevier, New York Popkin, B. M. 2001. ‘An overview on the nutrition transition and its health implication: The Bellagio meeting’, Public Health Nutrition, vol 5 (1A), pp93–103 Popkin, B. M. 1994. ‘The nutrition transition in low-income countries: An emerging crisis’, Nutrition Reviews, vol 52, pp285–298 Drewnoski, A. and Popkin, B. 1997. ‘The nutrition transition: New trends in the Globalisation’, Nutrition Reviews, vol 155, pp31–43 Pena, M. and Bacallao, J. (eds) 2000. Obesity and Poverty: A New Public Health Challenge, Pan American Health Organization, (WHO), Washington DC Popkin, B. M. 1997. ‘The nutrition transition in new income countries: An emerging crisis’, Nutrition Reviews, vol 52, no 19, pp285–298 WHO. 2002. The World Health Report 2002: Reducing Risks, Promoting Healthy Life, WHO, Geneva Lenfant, C. 2001. ‘Can we prevent cardiovascular diseases in low- and middle-income countries?’ Bulletin of the World Health Organization, vol 9, no 10, pp980–982
Diet and Health: Diseases and Food 309 22 Robson, J. 1981. ‘Foreword’ in Trowell, H. and Burkitt, D. (eds) Western Diseases: Their Emergence and Prevention, Edward Arnold, London 23 Trowell, H. and Burkitt, D. (eds) 1981. Western Diseases: Their Emergence and Prevention, Edward Arnold, London 24 Popkin, B. M. 1998. ‘The nutrition transition and its health implications in lower income Countries’, Public Health Nutrition, vol 1, pp5–21 25 Cabellero, B. and Popkin, B. (eds) 2002. The Nutrition Transition. Elsevier, New York 26 IFPRI. 2002. Living in the City: Challenges and Options for the Urban Poor, International Food Policy Research Institute, Washington DC 27 Verster, A. 1996. ‘Nutrition in transition: The case of the Eastern Mediterranean Region’ in Pietinen, P., Nishlda, C. and Khaltaev, N. (eds) Nutrition and Quality of Life: Health Issues for the 21st century, World Health Organization, Geneva, pp57–65 28 Chen, J., Campbell, T. C., Li, J. and Peto, R. 1990. Diet, Lifestyle and Mortality in China: Study of the Characteristics of 65 Counties, Oxford University Press, Oxford 29 Geissler, C. 1999. ‘China; the soybean-pork dilemma’, Proceedings of the Nutrition Society, vol 58, pp345–353 30 Dowler, E. and Pryer, J. 1998. ‘Relationship of diet and nutritional status’, in Encyclopaedia of Nutrition, Academic Press, New York 31 Lang, T. 1997. ‘The public health impact of globalisation of food trade’, in Shetty, P. and McPherson, K. (eds) Diet, Nutrition and Chronic Disease: Lessons from Contrasting Worlds, John Wiley and Sons, Chichester 32 Pan Lang, T. 2001. ‘Trade, public health and food’, in McKee, M., Garner, P. and Stott, R. (eds) International Co-operation in Health, Oxford University Press, Oxford 33 Heasman, M. and Mellentin, J. 1999. ‘Responding to the functional food revolution’, Consumer Policy Review, vol 19, pp152–159 34 Schlosser, E. 2001. Fast Food Nation: The Dark Side of the All-American Meal, HarperCollins, New York 35 Vidal, J. 1997. McLibel: Burger Culture on Trial, Macmillan, London 36 Gardner, G. and Harwell, B. 2000. ‘Underfed and overfed: The global epidemic of malnutrition’, Worldwatch paper 150, Worldwatch Institute, Washington DC 37 Barker, D. J. P. (ed) 1992. Fetal and Infant Origins of Adult Disease, British Medical Journal, London 38 Barker, D. J. P. 2001. ‘Cutting edge’, THES, 1 June, p22 Commission on the Nutrition Challenges of the 21st Century (2000) ‘Ending malnutrition by 2020: An agenda for change in the millennium. Final report to the ACC/SCN’, Food and Nutrition Bulletin, vol 21, p3, Supplement, September. United Nations University Press, New York, p19 39 Pinstrup-Anderson, P. 2001. Achieving Sustainable Food Security for All: Required Policy Action, International Food Policy Research Institute, Washington DC 40 See the Projections in FAO. 2000. The State of Food Insecurity in the World, Food and Agriculture Organization, Rome, ppv, 6 41 Smil, V. 2000. Feeding the World: A Challenge for the 21st Century, MIT Press, Cambridge, MA 42 Dyson, T. 1996. Population and Food: Global Trends and Future Prospects, Routledge, London 43 ACC/SCN. 2000. Nutrition through the Life Cycle: 4th Report on The World Nutrition Situation, United Nations Administrative Committee on Co-ordination Sub-Committee on Nutrition (ACC/SCN), New York, p8 44 International Association for the Study of Obesity. 2003. Obesity Newsletter, October, IASO, London 45 Royal College of Physicians of London. 1983. ‘Obesity. A report of the Royal College of Physicians’, Journal of the Royal College of Physicians of London, vol 17, no 1, pp5–65 46 Stearns, P. 1997. Fat History: Bodies and Beauty in the Modern West, New York University Press, New York
310 Diet and Health 47 WHO. 1998. Obesity: Preventing and Managing the Global Epidemic: Report of a WHO Consultation on Obesity, World Health Organization WHO/NUT/NCD/98.1, Geneva, pi 48 Pena, M. and Bacallao, J. (eds) 2000. Obesity and Poverty: A New Public Health Challenge, Pan American Health Organization (WHO), Washington DC 49 WHO. 2000. Nutrition for Health and Development: A Global Agenda For Combating Malnutrition, World Health Organization, Geneva. Available at www.who.int/nut/dbjDmi.htm 50 IOTF. 2003. ‘Call for international obesity review as overweight numbers reach 1.7 billion’, press release. International Obesity Task Force/International Association for the Study of Obesity, London 51 Centre for Disease Control. 2002. www.cdc.gov/nccdphp/dnpa/obesity/basics.htm 52 National Institutes of Health. 1998. Clinical Guidelines on the Identification. Evaluation, and Treatment of Overweight and Obesity in Adults, Department of Health and Human Services, Bethesda, MD; National Institutes of Health; National Heart, Lung and Blood Institute www. nhlbi.nih.gov/guidelines/obesity/ob_home.htm 53 OECD Health data, www.oecd.org/pdf/M00031000/M00031130.pdfpg.5 54 Pena, M. and Bacallao, J. (eds) 2000. Obesity and Poverty: A New Public Health Challenge, PAHO Scientific Publication, Washington DC, no 576 55 WHO. 1998. Obesity: Preventing and Managing the Global Epidemic: Report of a WHO Consultation on Obesity, World Health Organization WHO/NUT/NCD/98.1, Geneva 56 Vepa, S. et al 2002. Food Insecurity Atlas of India, MS Swaminathan Research Foundation and UN World Food Programme, Chennai 57 Verster, A. 1996. ‘Nutrition in transition: The case of the Eastern Mediterranean Region’ in Pietinen, P., Nishida, C. and Khaltaev, N. (eds) Nutrition and Quality of Life: Health Issues for the 21st century, World Health Organization, Geneva, pp57–65 58 Murata, M. 2000. ‘Secular trends in growth and changes in eating patterns of Japanese children’, American Journal of Clinical Nutrition, vol 72 (suppl), pp1379S–1383S 59 Ebbeling, C. B., Pawlak, D. B. and Ludwig, D. S. 2002. ‘Childhood obesity: Public health crisis, common sense cure’, The Lancet, vol 360, 10 August, pp437–482 60 Hodge, A. M., Dowse, G. K., Gareeboo, H. and Tuomilehto, J. et al 1996. ‘Incidence, increasing prevalence and predictors of change in obesity and fat distribution over 5 years in the rapidly developing population of Mauritius’, International Journal of Obesity & Related Metabolic Disorders, vol 20, no 2, pp137–146 61 Chitson, P. 1995. ‘Integrated intervention programmes for combating diet-related chronic diseases’ in Pietinen, P., Nishida, C. and Khaltaev, N. (eds) Proceedings of the 2nd WHO Symposium on Health Issues for the 21st Century: Nutrition and Quality of Life. Kobe, Japan, 24–26 November 1993, World Health Organization, Geneva, pp269–287 62 Kuczmarski, R. et al 1994. ‘Increasing prevalence of overweight among US adults’, JAMA, vol 272, no 3, pp205–211 63 CDC. 2002. Physical Activity and Good Nutrition: Essential Elements to Prevent Chronic Diseases and Obesity 2002, Department of Health and Human Services, Centers for Disease Control and Prevention, Atlanta 64 Centre for Disease Control. 2002. www.cdc.gov/nccdphp/dnpa/obesity/basics.htm 65 Barboza, D. 2000. ‘Rampant obesity, a debilitating reality for the urban poor’, New York Times, 26 December, D5 66 Nestle, M. 2002. Food Politics, University of California Press, Berkeley, CA 67 Stunkard, A. J. and Wadden, T. A. (eds) 1993. Obesity: Theory and Therapy, Raven Press, New York 68 Egger, G. and Swinburn, B. 1997. ‘An “ecological” approach to the obesity pandemic’, British Medical Journal, vol 315, pp477–480 69 Swinburn, B., Egger, G. and Raza, F. 1999. ‘Dissecting obesogenic environments: The development and application of a framework for identifying and prioritizing environmental interventions for obesity’, Preventive Medicine, vol 29, pp563–570
Diet and Health: Diseases and Food 311 70 Swinburn, B. and Egger, G. 2002. ‘Preventive strategies against weight gain and obesity’, Obesity Reviews, vol 13, pp289–301 71 US Department of Health and Human Services. 1988. The Surgeon-General’s Report on Nutrition and Health, Report 88-50210, DHHS, Washington DC, pp2–6 72 Murray, C. J. L. and Lopez, A. D. 1997. ‘Mortality by cause for eight regions of the world: Global burden of disease study’, The Lancet, vol 349, 3 May, pp1269–1276, 1347–1352, 1436–1442, 1498–1504 73 Murray, C. J. L. and Lopez, A. D. (eds) 1996. The Global Burden of Disease: A Comprehensive Assessment of Mortality and Disability from Diseases. Injuries and Risk Factors in 1990 and Projected to 2020, Harvard School of Public Health on behalf of the World Health Organization and the World Bank, Cambridge, MA 74 National Institute of Public Health, Stockholm. 1997. Determinants of the Burden of Disease in the European Union, NIPH, Stockholm; Mathers, E., Vos, T. and Stevenson, C. (1999) The Burden of Disease and Injury in Australia, AIHW, Canberra, 1999 (Catalogue No PHE-17) 75 WHO and FAO. 2003. Diet, Nutrition and the Prevention of Chronic Diseases. Technical Report Series 916, World Health Organization; Rome, Food and Agriculture Organization, Geneva 76 Commission on Macroeconomics and Health. 2001. Macroeconomics and Health; Investing in Health for Economic Development, World Health Organization, Geneva 77 Cited in Kenkel, D. S. and Manning, W. 1999. ‘Economic evaluation of nutrition policy or there’s no such thing as a free lunch’, Food Policy, vol 24, pp145–162 78 Wanless, D. 2002. Securing Our Future Health: Taking a Long-Term View. Final Report, H M Treasury, London, April 79 Maniadakis, N. and Rayner, M. 1998. Coronary Heart Disease Statistics: Economics Supplement, British Heart Foundation, London, www.heartstats.org 80 Wanless, D. 2002. Securing Our Future Health: Taking a Long-Term View. Final Report, H M Treasury, London, April 81 Wanless, D. 2004. Securing Good Health for the Whole Population, Final Report, H M Treasury, London, 25 February 82 Heart Protection Study Collaborative Group. 2002. ‘MRC/BHF Heart Protection Study of cholesterol lowering with simvastatin in 20,536 high-risk individuals: A randomised placebo-controlled trial’, The Lancet, vol 360, pp7–22 83 WHO. 1999. World Health Report 1999, World Health Organization, Geneva 84 WHO. 2002. World Health Report 2002, World Health Organization, Geneva 85 WHO. 2003. Diet, Nutrition and the Prevention of Chronic Diseases, Technical Series 916. World Health Organization Geneva 86 Dobson, A. J, Evans, A., Ferrario, M., Kuulasmaa, K. A. et al 1998. ‘Changes in estimated coronary risk in the 1980s: Data from 38 populations in the WHO MONICA Project. World Health Organization. Monitoring trends and determinants in cardiovascular diseases’, Annals of Medicine, vol 30, no 2, pp199–205 87 Rayner, M. 2000. ‘Impact of nutrition on health’, in Sussex, J. (ed) Improving Population Health in Industrialised Nations, Office of Health Economics, London, pp24–40 88 Trowell, H. 1981. ‘Hypertension, obesity, diabetes mellitus and coronary heart disease’, in Trowell, H. and Burkitt, D. (eds) Western Diseases: Their Emergence and Prevention, Edward Arnold, London 89 Zhou, B. 1998. ‘Diet and cardiovascular disease in China in diet’, in Shetty, P. and Gopalan, C. (eds) Nutrition and Chronic Disease: An Asian Perspective, Smith-Gordon, London 90 Doll, R. and Peto, R. 1981. ‘The causes of cancer: Quantitative estimates of avoidable risks of cancer in the United States today’, Journal of the National Cancer Institute, vol 66, pp1191–1308 91 Miller, A. B. 2001. Diet in Cancer Prevention, World Health Organization, Geneva, available at www.who.int/ncd/ 92 WHO. 1999. World Health Report 1999, World Health Organization, Geneva
312 Diet and Health 93 Zheng, W., Sellers, T. A., Doyle, T. J., Kushi, L. H., Potter, J. D. and Folsom, A. R. 1995. ‘Retinol, antioxidant vitamins, cancers of the upper digestive tract in a prospective cohort study of postmenopausal women’, American Journal of Epidemiology, vol 142, pp955–960 94 World Cancer Research Fund/American Institute for Cancer Research. 1997. Food, Nutrition and the Prevention of Cancer: A Global Perspective, AICR, Washington DC 95 WHO. 2003. World Cancer Report. World Health Organization/International Agency for Research on Cancer, Geneva, pp62–67 96 World Cancer Research Fund/American Institute for Cancer Research. 1997. Food, Nutrition and the Prevention of Cancer: A Global Perspective, AICR, Washington DC 97 WHO. 2002. Diabetes Mellitus Factsheet 138, April update, World Health Organization, Geneva 98 WHO and FAO. 2003. Diet, Nutrition and the Prevention of Chronic Diseases. Technical Report Series 916, World Health Organization, Geneva; Food and Agriculture Organization, Rome, p72 99 International Diabetes Federation. 2000. Diabetes Atlas 2000, International Diabetes Federation, Brussels 100 International Diabetes Federation, www.idf.org 101 Yajnik, C. S. 1998. ‘Diabetes in Indians: Small at birth or big as adults or both?’, in Shetty, P. and Gopalan, C. (eds) Nutrition and Chronic Disease: An Asian Perspective, Smith-Gordon, London 102 Ramachandran, A. 1998. ‘Epidemiology of non-insulin-dependent diabetes mellitus in India’, in Shetty, P. and Gopalan, C. (eds) Diet, Nutrition and Chronic Disease: An Asian Perspective, SmithGordon, London 103 Vannasaeng, S. 1998. ‘Current status and measures of control for diabetes mellitus in Thailand’, in Shetty, P. and Gopalan, C. (eds) Diet, Nutrition and Chronic Disease: An Asian Perspective, Smith-Gordon, London 104 Barker, D. J. P. (ed) 1992. Fetal and Infant Origins of Adult Disease, British Medical Journal, London 105 Yajnik, C. S. 1998. ‘Diabetes in Indians: Small at birth or big as adults or both?’, in Shetty, P. and Gopalan, C. (eds) Diet, Nutrition and Chronic Disease: An Asian Perspective, Smith-Gordon, London 106 Buzby, J. 2001. ‘Effects of food safety perceptions on food demand and global trade’ in Regmi, A. (ed) Changing Structure of Global Food Consumption and Trade, US Department of Agriculture, Washington DC, Agriculture and Trade Report WRS-01-1 107 Nestle, M. 2003. Safe Food: Bacteria, Biotechnology and Bioterrorism, University of California Press, Berkeley, CA 108 WHO. 2002. World Health Report 2002, World Health Organization, Geneva 109 Barling, D. and Lang, T. 2003. Codex. The European Union and Developing Countries: An Analysis of Developments in International Food Standards Setting, Report to the Department for International Development. City University Institute of Health Sciences, London 110 WHO. 2002. Food Safety and Foodborne Illness, WHO Information Fact Sheet 237, World Health Organization, Geneva, January 111 WHO. 2002. Food Safety – A Worldwide Public Health Issue, World Health Organization, Geneva, www.who.int/fsf/fctshtfs.htm 112 Buzby, J. 2001. ‘Effects of food safety perceptions on food demand and global trade’, in Regmi, A (ed) Changing Structure of Global Food Consumption and Trade, US Department of Agriculture, Washington DC, Agriculture and Trade Report WRS-01-1 113 Brundtland, G. H. 2001. Speech to 24th Session of Codex Alimentarius Commission, Geneva, 2 July, WHO, Geneva 114 WHO. 2002. Food Safety and Foodborne Illness, WHO Information Fact Sheet 237, World Health Organization, Geneva, January 115 WHO. 2002. Food Safety, Agenda item 12.3, 53rd World Health Assembly, WHO, 20 May 116 Brundtland, G. H. 2001. Speech to 24th Session of Codex Alimentarius Commission, Geneva 2 July, World Health Organization, Geneva
Diet and Health: Diseases and Food 313 117 Phillips, The Lord of Worth Matravers, Bridgeman, J. and Ferguson-Smith, M. 2000. The BSE Inquiry: Report: Evidence and Supporting Papers of the Inquiry into the Emergence and Identification of Bovine Spongiform Encephalopathy (BSE) and Variant Creutzfeldt-Jakob Disease (VCJD) and the Action Taken in Response to it up to 20 March 1996, 16 vols, The Stationery Office, London 118 WHO. 2002. Food Safety – A Worldwide Public Health Issue, Geneva, available at www.who.int/ tsf/fctshfis.htm 119 DG SANCO. 2000. Trends and Sources of Zoonotic Agents in Animals. Feedstuff. Food and Man in the European Union in 1998, European Commission Part 1, Brussels. Prepared by the Community Reference Laboratory on the Epidemiology of Zoonoses, BgVV, Berlin, Germany 120 Rayner, M. and Peterson, S. 2000. European Cardiovascular Disease Statistics 2000, BHF Health Promotion Research Group, University of Oxford, Oxford 121 Data from Murray and Lopez, National Institute of Public Health (Sweden) and WHO, compiled in Rayner, M. and Peterson, S. 2000. European Cardiovascular Disease Statistics 2000, BHF Health Promotion Research Group, University of Oxford, Oxford 122 WHO. 2002. Food Safety and Foodborne Illness, WHO Information Fact Sheet 237, World Health Organization, Geneva, January 123 Scholte, J. A. 2000. Globalization: A Critical Introduction, Harper Collins, London 124 Lang, T. 1999. ‘Food and nutrition: The relationship between nutrition and public health’, in Weil, O., McKee, M., Brodin, M. and Oberle, D. (eds) Priorities for Public Health Action in the European Union, Societe Franchise de Sante Publique, Paris, Vandoeuvre-Les-Nancy & London 125 Acheson, D. 1999. Independent Inquiry into Inequalities in Health: Report, The Stationery Office, London 126 James, W. P. T., Nelson, M., Ralph, A. and Leather, S. 1997. ‘Socioeconomic determinants of health: The contribution of nutrition to inequalities in health’, British Medical Journal, vol 314, no 7093, pp1545–1549 127 Leather, S. 1996. The Making of Modern Malnutrition, Caroline Walker Trust, London 128 LIPT. 1996. Low Income, Food, Nutrition and Health: Strategies for Improvement. A report by the Low Income Project Team for the Nutrition Task Force. Department of Health, London 129 Eisinger, P. K. 1998. Towards an End to Hunger in America, Brookings Institute Press, Washington DC
14
Food Politics: How the Food Industry Influences Nutrition and Health M. Nestle
Introduction: The Food Industry and ‘Eat More’ This chapter is from a book about how the food industry influences what we eat and, therefore, our health. That diet affects health is beyond question. The food industry has given us a food supply so plentiful, so varied, so inexpensive and so devoid of dependence on geography or season that all but the very poorest of Americans can obtain enough energy and nutrients to meet biological needs. Indeed, the US food supply is so abundant that it contains enough to feed everyone in the country nearly twice over – even after exports are considered. The overly abundant food supply, combined with a society so affluent that most people can afford to buy more food than they need, sets the stage for competition. The food industry must compete fiercely for every dollar spent on food, and food companies expend extraordinary resources to develop and market products that will sell, regardless of their effect on nutritional status or waistlines. To satisfy stockholders, food companies must convince people to eat more of their products or to eat their products instead of those of competitors. They do so through advertising and public relations, of course, but also by working tirelessly to convince government officials, nutrition professionals and the media that their products promote health – or at least do no harm. Much of this work is a virtually invisible part of contemporary culture that attracts only occasional notice. This book exposes the ways in which food companies use political processes – entirely conventional and nearly always legal – to obtain government and professional support for the sale of their products. Its twofold purpose is to illuminate the extent to which the food industry determines what people eat and to generate much wider discussion of the food industry’s marketing methods and use of the political system. Reprinted from Nestle M. 2002. Food politics: How the Food Industry Influences Nutrition and Health. University of California Press, Berkeley. Introductory Chapter, pp1–28. Copyright 2002 by the Regents of the University of California.
Food Politics: How the Food Industry Influences Nutrition and Health 315
In my 25 years as a nutrition educator, I have found that food industry practices are discussed only rarely. The reasons for this omission are not difficult to understand. Most of us believe that we choose foods for reasons of personal taste, convenience and cost; we deny that we can be manipulated by advertising or other marketing practices. Nutrition scientists and practitioners typically believe that food companies are genuinely interested in improving health. They think it makes sense to work with the industry to help people improve their diets, and most are outraged by suggestions that food industry sponsorship of research or programmes might influence what they do or say. Most food company officials maintain that any food product can be included in a balanced, varied and moderate diet; they say that their companies are helping to promote good health when they fund the activities of nutrition professionals. Most officials of federal agriculture and health agencies understand that their units are headed by political appointees whose concerns reflect those of the political party in power and whose actions must be acceptable to Congress. Members of Congress, in turn, must be sensitive to the concerns of corporations that help fund their campaigns. In this political system, the actions of food companies are normal, legal, and thoroughly analogous to the workings of any other major industry – tobacco, for example – in influencing health experts, federal agencies, and Congress.1 Promoting food raises more complicated issues than promoting tobacco, however, in that food is required for life and causes problems only when consumed inappropriately. As this book will demonstrate, the primary mission of food companies, like that of tobacco companies, is to sell products. Food companies are not health or social service agencies, and nutrition becomes a factor in corporate thinking only when it can help sell food. The ethical choices involved in such thinking are considered all too rarely. Early in the 20th century, when the principal causes of death and disability among Americans were infectious diseases related in part to inadequate intake of calories and nutrients, the goals of health officials, nutritionists and the food industry were identical – to encourage people to eat more of all kinds of food. Throughout that century, improvements in the US economy affected the way we eat in important ways: we obtained access to foods of greater variety, our diets improved and nutrient deficiencies gradually declined. The principal nutritional problems among Americans shifted to those of over-nutrition – eating too much food or too much of certain kinds of food. Overeating causes its own set of health problems; it deranges metabolism, makes people overweight and increases the likelihood of ‘chronic’ diseases – coronary heart disease, certain cancers, diabetes, hypertension, stroke and others – that now are leading causes of illness and death in any overfed population. People may believe that the effects of diet on chronic disease are less important than those of cigarette smoking, but each contributes to about one-fifth of annual deaths in the US. Addressing cigarette smoking requires only a single change in behaviour: don’t smoke. But because people must eat to survive, advice about dietary improvements is much more complicated: eat this food instead of that food, or eat less. As this book explains, the ‘eat less’ message is at the root of much of the controversy over nutrition advice. It directly conflicts with food industry demands
316 Diet and Health
that people eat more of their products. Thus food companies work hard to oppose and undermine ‘eat less’ messages. I first became aware of the food industry as an influence on government nutrition policies and on the opinions of nutrition experts when I moved to Washington DC, in 1986 to work for the Public Health Service. My job was to manage the editorial production of the first – and as yet only – Surgeon General’s Report on Nutrition and Health, which appeared as a 700-page book in the summer of 1988.2 This report was an ambitious government effort to summarize the entire body of research linking dietary factors such as fat, saturated fat, cholesterol, salt, sugar and alcohol to leading chronic diseases. My first day on the job, I was given the rules: no matter what the research indicated, the report could not recommend ‘eat less meat’ as a way to reduce intake of saturated fat, nor could it suggest restrictions on intake of any other category of food. In the industry-friendly climate of the Reagan administration, the producers of foods that might be affected by such advice would complain to their beneficiaries in Congress, and the report would never be published. This scenario was no paranoid fantasy; federal health officials had endured a decade of almost constant congressional interference with their dietary recommendations. As I discuss in Part I, agency officials had learned to avoid such interference by resorting to euphemisms, focusing recommendations on nutrients rather than on the foods that contain them and giving a positive spin to any restrictive advice about food. Whereas ‘eat less beef’ called the industry to arms, ‘eat less saturated fat’ did not. ‘Eat less sugar’ sent sugar producers right to Congress, but that industry could live with ‘choose a diet moderate in sugar’. When released in 1988, the Surgeon General’s Report recommended ‘choose lean meats’ and suggested limitations on sugar intake only for people particularly vulnerable to dental cavities. Subsequent disputes have only reinforced sensitivities to political expediency when formulating advice about diet and health. Political expediency explains in part why no subsequent Surgeon General’s Report has appeared, even though Congress passed a law in 1990 requiring that one be issued biannually. After ten years of working to develop a Surgeon General’s Report on Dietary Fat and Health – surely needed to help people understand the endless debates about the relative health consequences of eating saturated, monounsaturated, trans-saturated and total fat – the government abandoned the project, ostensibly because the science base had become increasingly complex and equivocal. A more compelling reason must have been lack of interest in completing such a report in the election year of 2000. Authoritative recommendations about fat intake would have had to include some ‘eat less’ advice if for no other reason than because fat is so concentrated in calories – it contains 9 calories per gram, compared to 4 each for protein or carbohydrate3 – and obesity is a major health concern. Because saturated fat and trans-saturated fat raise risks for heart disease, and the principal sources of such fats in American diets are meat, dairy, cooking fats, and fried, fast and processed foods, ‘eat less’ advice would provoke the producers and sellers of these foods to complain to their friends in Congress. Since 1988, in my role as chair of an academic department of nutrition, a member of federal advisory committees, a speaker at public and professional meetings, a
Food Politics: How the Food Industry Influences Nutrition and Health 317
frequent commentator on nutrition issues to the press, and (on occasion) a consultant to food companies, I have become increasingly convinced that many of the nutritional problems of Americans – not least of them obesity – can be traced to the food industry’s imperative to encourage people to eat more in order to generate sales and increase income in a highly competitive marketplace. Ambiguous dietary advice is only one result of this imperative. As I explain in Part II, the industry also devotes enormous financial and other resources to lobbying Congress and federal agencies, forming partnerships and alliances with professional nutrition organizations, funding research on food and nutrition, publicizing the results of selected research studies favourable to industry, sponsoring professional journals and conferences, and making sure that influential groups – federal officials, researchers, doctors, nurses, school teachers and the media – are aware of the benefits of their products. Later sections of the book describe the ways in which such actions affect food issues of particular public interest and debate. Part III reviews the most egregious example of food company marketing practices: the deliberate use of young children as sales targets and the conversion of schools into vehicles for selling ‘junk’ foods high in calories but low in nutritional value. Part IV explains how the supplement industry manipulated the political process to achieve a sales environment virtually free of government oversight of the content, safety and advertising claims for its products. In Part V, I describe how the food industry markets ‘junk’ foods as health foods by adding nutrients and calling them ‘functional’ foods or ‘nutraceuticals’. The concluding chapter summarizes the significance of the issues raised by these examples and offers some options for choosing a healthful diet in an overabundant food system. Finally, the Appendix introduces some terms and concepts used in the field of nutrition and discusses issues that help explain why nutrition research is so controversial and so often misunderstood. Before plunging into these accounts, some context may prove useful. This introduction addresses the principal questions that bear on the matters discussed in this book: What are we supposed to eat to stay healthy? Does diet really matter? Is there a significant gap between what we are supposed to eat and what we do eat? The answers to these questions constitute a basis for examining the central concern of this book: Does the food industry have anything to do with poor dietary practices? As a background for addressing that question, this introduction provides some fundamental facts about today’s food industry and its marketing philosophies and strategies, and also points to some common themes that appear throughout the book.
What is a ‘Healthy’ Diet? To promote health as effectively as possible, diets must achieve balance: they must provide enough energy (calories) and vitamins, minerals and other essential nutrients to prevent deficiencies and support normal metabolism. At the same time, they must not include excessive amounts of these and other nutritional factors that might promote development of chronic diseases. Fortunately, the optimal range of intake
318 Diet and Health
of most dietary components is quite broad. It is obvious that people throughout the world eat many different foods and follow many different dietary patterns, many of which promote excellent health and longevity. As with other behavioural factors that affect health, diet interacts with individual genetic variation as well as with cultural, economic and geographical factors that affect infant survival and adult longevity. On a population basis, the balance between getting enough of the right kinds of nutrients and avoiding too much of the wrong kinds is best achieved by diets that include large proportions of energy from plant foods – fruits, vegetables and grains. The longest-lived populations in the world, such as some in Asia and the Mediterranean, traditionally eat diets that are largely plant-based. Such diets tend to be relatively low in calories but high in vitamins, minerals, fibre and other components of plants (phytochemicals) that – acting together – protect against disease. Dietary patterns that best promote health derive most energy from plant foods, considerably less from foods of animal origin (meat, dairy, eggs) and even less from foods high in animal fats and sugars. The Food Guide Pyramid of the US Department of Agriculture (USDA) is meant to depict a plant-based diet that promotes optimal health (see Figure 14.1).
Figure 14.1 The 1992 USDA Food Guide Pyramid recommends a hierarchical – and therefore controversial – dietary pattern based mainly on foods of plant origin
Food Politics: How the Food Industry Influences Nutrition and Health 319
Does Diet Matter? In addition to consuming largely plant-based diets, people in long-lived populations are physically active and burn up any excess calories they obtain from food. An active life-style helps mitigate the harmful effects of overeating, but the evidence for the importance of diet in health also is overwhelming. Disease by chronic disease, scientists consistently have demonstrated the health benefits of diets rich in fruit and vegetables, limited in foods and fats of animal origin and balanced in calories. Comprehensive reports in the late 1980s from the US and Europe documented the evidence available at that time and subsequent research has only strengthened those conclusions.4 Health experts suggest conservatively that the combination of poor diet, sedentary life-style and excessive alcohol consumption contributes to about 400,000 of the 2,000,000 or so annual deaths in the US – about the same number and proportion affected by cigarette smoking. Women who follow dietary recommendations display half the rates of coronary heart disease observed among women who eat poor diets, and those who also are active and do not smoke cigarettes have less than one-fifth the risk. The diet-related medical costs for just six health conditions – coronary heart disease, cancer, stroke, diabetes, hypertension and obesity – exceeded $70 billion in 1995. Some authorities believe that just a 1 per cent reduction in intake of saturated fat across the population would prevent more than 30,000 cases of coronary heart disease annually and save more than a billion dollars in health care costs. Such estimates indicate that even small dietary changes can produce large benefits when their effects are multiplied over an entire population.5 Conditions that can be prevented by eating better diets have roots in childhood. Rates of obesity are now so high among American children that many exhibit metabolic abnormalities formerly seen only in adults. The high blood sugar due to ‘adult-onset’ (insulin-resistant type II) diabetes, the high blood cholesterol and the high blood pressure now observed in younger and younger children constitute a national scandal. Such conditions increase the risk of coronary heart disease, cancer, stroke and diabetes later in life. From the late 1970s to the early 1990s, the prevalence of overweight nearly doubled – from 8 per cent to 14 per cent among children aged 6–11 and from 6 per cent to 12 per cent among adolescents. The proportion of overweight adults rose from 25 per cent to 35 per cent in those years. Just between 1991 and 1998, the rate of adult obesity increased from 12 per cent to nearly 18 per cent. Obesity contributes to increased health care costs, thereby becoming an issue for everyone, overweight or not.6 The cause of overweight is an excess of calories consumed over calories burned off in activity. People gain weight because they eat too many calories or are too inactive for the calories they eat. Genetics affects this balance, of course, because heredity predisposes some people to gain weight more easily than others, but genetic changes in a population occur too slowly to account for the sharp increase in weight gain over such a short time period. The precise relationship between the diet side and the activity side of the weight ‘equation’ is uncertain and still under
320 Diet and Health
investigation, in part because we lack accurate methods for assessing the activity levels of populations. People seem to be spending more time at sedentary activities such as watching television and staring at computer screens, and the number of hours spent watching television is one of the best predictors of overweight, but surveys do not report enough of a decrease in activity levels to account for the current rising rates of obesity.7 This gap leaves overeating as the most probable cause of excessive weight gain.
Do Americans Overeat? Overweight itself constitutes ample evidence that many Americans consume more calories than they burn off, but other sources of information also confirm the idea that people are eating too much food. The calories provided by the US food supply increased from 3,300 per capita in 1970 to 3,800 in the late 1990s, an increase of 500 per day. These supply figures tend to overestimate amounts of food actually consumed because they do not account for wastage, but they do give some indication of trends. Surveys that ask about actual dietary intake tend to underestimate caloric intake, because people find it difficult to remember dietary details but easier to give answers that seem to please investigators. Even so, dietary intake surveys also indicate that people are eating more than they were in the 1970s. Then, people reported eating an average of about 1800 calories per day. By 1996 they reported 2000 calories per day. No matter how unrealistically low these figures may be and how imprecise the sources of data, all suggest a trend toward caloric intakes that exceed average levels of caloric expenditure.8 In addition to revealing how much people are eating, food supply and dietary intake surveys indicate changes in food habits over time. The increase in calories reflects an increase in consumption of all major food groups: more vegetables and more fruit (desirable), but also more meat and dairy foods, and more foods high in fat and sugar (less desirable). The most pronounced change is in beverage consumption. The supply of whole milk fell from 25.5 gallons per capita per year in 1970 to just 8.5 gallons in 1997. The supply of low-fat milk rose from 5.8 to 15.5 gallons during the same time, but that of soft drinks rose from 24.3 to 53 gallons. To reduce fat intake, people replaced whole milk with lower-fat varieties (same nutrients, fewer calories), but they undermined this beneficial change by increasing consumption of soft drinks (sugar calories, no nutrients). Despite the introduction of artificial sweeteners, the supply of calorie-laden sweeteners – sugars, corn sweeteners and honey – has gone up. Because of the inconsistencies in data, the trend in fat intake is harder to discern. Fat in the food supply increased by 25 per cent from 1970 to the late 1990s, but dietary intake surveys do not find people to be eating more of it. Although USDA nutritionists conclude that Americans are eating less fat, they also observe that people are eating more food outside the home, where foods are higher in fat and calories.9
Food Politics: How the Food Industry Influences Nutrition and Health 321
Source: Courtesy National Cattlemen’s Beef Association
Figure 14.2 This ‘food consumption’ pyramid compares the average number of servings consumed per day by the US population in the mid-1990s to the servings recommended by the Food Guide Pyramid
In comparison to the Pyramid, American diets clearly are out of balance, as shown in Figure 14.2. Top-heavy as it is, this illustration underestimates the discrepancy between recommended and actual servings. For one thing, the USDA’s serving estimates are based on self-reports of dietary intake, but people tend to underreport the intake of foods considered undesirable and to overestimate the consumption of ‘healthy’ foods. For another, the USDA calculates numbers of servings by adding up the individual components of mixed dishes and assigning them to the appropriate Pyramid categories. This means that the flour in cookies is assigned to the grain category, the apples in pies to the fruit group, and the potatoes in chips to the vegetable group. This method may yield more precise information about nutrient intake, but it makes high-calorie, low-nutrient foods appear as better nutritional choices than they may be. The assignment of the tomatoes in ketchup to the vegetable group only reinforces the absurdity of the USDA’s famous attempt during the Reagan administration to count ketchup as a vegetable in the federal school lunch programme.10 The comparison hides other unwelcome observations. USDA nutritionists report that the average consumption of whole-grain foods is just one serving per
322 Diet and Health
day, well below recommended levels. And although the number of vegetable servings appears close to recommendations, half the servings come from just three foods: iceberg lettuce, potatoes (frozen, fresh and those used for chips and fries) and canned tomatoes. When fried potatoes are excluded from the count, vegetable servings fall below three per day. Even though the consumption of reduced-fat dairy products has doubled since 1970, half the dairy servings still come from high-fat, high-calorie cheese and whole milk. Servings of added fats are at least one-third higher than they should be and servings of caloric sweeteners are half again as high. From such observations, we can conclude that the increased calories in American diets come from eating more food in general, but especially more of foods high in fat (meat, dairy, fried foods, grain dishes with added fat), sugar (soft drinks, juice drinks, desserts), and salt (snack foods).11 It can hardly be a coincidence that these are just the foods that are most profitable to the food industry and that it most vigorously promotes.
The US Food Industry This book uses the term food industry to refer to companies that produce, process, manufacture, sell and serve foods, beverages and dietary supplements. In a larger sense, the term encompasses the entire collection of enterprises involved in the production and consumption of food and beverages: producers and processors of food crops and animals (agribusiness); companies that make and sell fertilizer, pesticides, seeds and feed; those that provide machinery, labour, real estate and financial services to farmers; and others that transport, store, distribute, export, process and market foods after they leave the farm. It also includes the food service sector – food carts, vending machines, restaurants, bars, fast food outlets, schools, hospitals, prisons and workplaces – and associated suppliers of equipment and serving materials. This vast ‘food-and-fiber’ system generates a trillion dollars or more in sales every year, accounts for 13 per cent of the US gross national product (GNP) and employs 17 per cent of the country’s labour force. Of the $800 billion or so a year that the public spends directly on food and drink, alcoholic beverages account for about $90 billion and the rest is distributed among retail food enterprises (54 per cent) and food service (46 per cent).12 The US food industry is the remarkably successful result of 20th-century trends that led from small farms to giant corporations, from a society that cooked at home to one that buys nearly half its meals prepared and consumed elsewhere, and from a diet based on ‘whole’ foods grown locally to one based largely on foods that have been processed in some way and transported long distances. These changes created a farm system that is much less labour-intensive and far more efficient and specialized. In 1900, 40 per cent of the population lived on farms, but today no more than 2 per cent do. Just since 1960, the number of farms has declined from about 3.2 million to 1.9 million, but their average size has increased
Food Politics: How the Food Industry Influences Nutrition and Health 323
by 40 per cent and their productivity by 82 per cent. Most farms today raise just a single commodity such as cattle, chickens, pigs, corn, wheat or soybeans. Many are part of a system of ‘vertical’ integration: ownership by one corporation of all stages of production and marketing. Chickens constitute an especially clear example. In the mid-1950s, chickens were raised in small flocks by many farmers; today, most are ‘factory-farmed’ in massive numbers under contract to a few large companies.13 Economic pressures force food and beverage companies to expand to tremendous size. In 2000, seven US companies – Philip Morris, ConAgra, Mars, IBP, Sara Lee, Heinz and Tyson Foods – ranked among the ten largest food companies in the world. Nestlé (Switzerland) ranked first, Unilever (UK/Netherlands) third, and Danone (France) sixth. Other US companies such as Coca-Cola, McDonald’s, PepsiCo, Procter & Gamble and Roche (vitamins) ranked among the top 100 companies worldwide. In the US alone, just three companies – Philip Morris (Kraft Foods, Miller Brewing), ConAgra and RJR-Nabisco – accounted for nearly 20 per cent of all food expenditures in 1997. Table 14.1 lists the ten leading producers of packaged food products in the US in 2000, along with their annual sales and advertising budgets. The largest companies generated more than $30 billion each in annual sales, placing great pressure on smaller companies to merge. Such pressures also apply to supermarkets. Mergers among food and cigarette companies merit special interest. As described in Table 14.2, two of the four leading US cigarette companies, R. J. Reynolds and Philip Morris, bought – and sometimes swapped – food and beverage companies in manoeuvres designed to protect stockholders’ investments against tobacco liability lawsuits. The increasing consumption of food outside the home also has implications for the food industry – and for health. Table 14.3 lists the leading US food service companies by category: fast foods, restaurant chains, contract corporations and hotel operations. The highest-selling food service chains are sandwich houses and fast food chains. First among them is McDonald’s; its 12,804 US outlets brought in $19.6 billion in 2000 sales, more than twice as much as its nearest competitor. The greater efficiency, specialization and size of agriculture and food product manufacture have led to one of the great unspoken secrets about the American food system: over-abundance. As already noted, the US food supply – plus imports less exports – provides a daily average of 3800 calories per capita. This level is nearly twice the amount needed to meet the energy requirements of most women, one-third more than that needed by most men and much higher than that needed by babies, young children and the sedentary elderly. Even if, as the USDA estimates, 1100 of those calories might be wasted (as spoiled fruit, for example, or as oil for frying potatoes), the excess calories are a major problem for the food industry: they force competition. Even people who overindulge can eat only so much food, and choosing one food means rejecting others. Over-abundance alone is sufficient to explain why the annual growth rate of the American food industry is only a percentage point or two and why it has poked along at that low level for many years. It also explains why food companies compete so strenuously for consumer food dollars,
324 Diet and Health Table 14.1 Sales and advertising expenditures for the ten leading producers of packaged food products in the US Company and examples Nestlé Carnation foods Lean Cuisine Butterfinger candy Unilever/Bestfoods * Unilever Lipton’s tea beverages Wish-Bone salad dressing Bestfoods Thomas’ English muffins Skippy peanut butter Philip Morris Kraft Foods, Inc. Jell-O desserts Altoids mints Pepsico Pepsi and Diet Pepsi Lay’s potato chips Tropicana fruit juices Groupe Danone H.J. Heinz Nabisco Kellogg Cereals Eggo frozen waffles General Mills* Cereals Fruit-by-the-Foot snacks Campbell Soup Soups Pepperidge Farm
Food sales [total sales], 1999 ($ billions) 34.9 [49.4]
Advertising, US, 1998 ($ millions) 534.4 31.1 16.4 11.2
32.4 [55.3]
27.8 [78.6]
11.6 [18.7]
9.8 [14.2] 9.3 8.4 7.7
6.7
6.2
1015.0 41.8 15.2 202.5 9.5 4.0 2049.3 146.1 65.6 10.1 1263.4 145.2 55.8 23.3 * 214.5 225.7 448.5 278.7 34.3 597.9 296.7 10.3 336.8 108.0 37.2
* In 2000, Unilever purchased Bestfoods soon after acquiring Ben & Jerry’s and Slim-Fast. General Mills bought the Pillsbury division of Diageo, making the combined company the fifth largest of US foodmakers, with $12.2 billion in annual sales. Danone was not among the top 200 US advertisers in 1998 because the company’s principal markets are in Europe. Principal Sources: Endicott RC. 44th annual 100 leading national advertisers. Advertising Age September 27, 1999: 51–546. Hays CL. New York Times June 7, 2000: C1, C8. Thompson S. Advertising Age June 12, 2000: 4
Food Politics: How the Food Industry Influences Nutrition and Health 325 Table 14.2 Cigarette companies’ ownership of food and beverage companies: chronology 1969
Philip Morris, Inc. acquires 53% of Miller Brewing.
1970
Philip Morris buys the remaining 47% of Miller Brewing.
1978
Philip Morris acquires 97% of Seven-Up.
1985
R.J. Reynolds buys Nabisco Foods for $4.9 billion, creating RJR-Nabisco, a public company. Philip Morris buys General Foods for $5.6 billion.
1986
Philip Morris sells Seven-Up to PepsiCo.
1988
Philip Morris buys Kraft, Inc. for $13.6 billion. RJR-Nabisco announces plans to ‘go private’; offers to buy outstanding public shares for $17 billion.
1989
The investment firm Kohlberg Kravis Roberts leverages a buyout of RJRNabisco for $24.9 billion, leaving the private company with $20 billion in debt. Philip Morris combines Kraft and General Foods to form Kraft General Foods.
1990
Philip Morris acquires Jacobs Suchard, a Swiss coffee and confectionary company, for $4.1 billion.
1991
Kohlberg Kravis Roberts sells stocks in RJR-Nabisco to the public. The bestseller Barbarians at the Gate (New York: HarperCollins, 1991) describes the takeover events.
1993
Kraft General Foods (Philip Morris) buys Nabisco ready-to-eat cereals from RJR-Nabisco for $448 million.
1995
Kraft General Foods reorganizes into Kraft Foods, Inc. In an effort to shore up stock prices, RJR-Nabisco becomes a holding company for R. J. Reynolds (tobacco) and Nabisco Holdings (food); sells 19% of shares in Nabisco Holdings to the public.
1996
Philip Morris buys shares of Brazil’s leading chocolate company, Industrias de Chocolate Lacta, S.A.; Kraft Foods acquires Taco Bell.
1999
RJR-Nabisco sells its international tobacco business; separates and renames its domestic tobacco (R. J. Reynolds Tobacco Holdings) and food businesses (Nabisco Group Holdings). This action leaves Nabisco Group Holdings with 81% of Nabisco as its sole asset (Nabisco Holdings has the remainder), only $1 billion in debt, but with uncertain liability for tobacco lawsuits. Philip Morris said to be interested in buying Nabisco; acquires Philadelphia cream cheese; reports revenues exceeding $78 billion.
2000
Philip Morris buys Nabisco Holdings for $14.9 billion, creating a company that earned combined revenues of $34.9 billion and profits of $5.5 billion in 1999. This purchase leaves R.J. Reynolds Tobacco Holdings with $1.5 billion in cash and the tobacco liability.
Principal Sources: Philip Morris Companies, Inc. Online: www.kraftfoods.com/. Accessed 24 February, 1999. Hays CL. New York Times 10 March 1999: A1, C8, and 2 July 2000: C7
why they work so hard to create a sales-friendly regulatory and political climate, and why they are so defensive about the slightest suggestion that their products might raise health or safety risks.
326 Diet and Health Table 14.3 Where Americans eat: the top two US food service chain companies in 2000 sales, by category and number of units Chain category
2000 sales, ($ Millions)
Number of units, US
McDonald’s
19,573
12,804
Burger King
8695
8064
Pizza Hut
5000
7927
Domino’s
2647
4818
KFC (Kentucky Fried Chicken)
4400
5364
Chick-fil-A
1082
1958
Golden Corral
968
452
Ryan’s Family Steak House
745
324
Denny’s
2137
1753
International House of Pancakes
1199
925
Applebee’s Neighborhood
2625
1251
Red Lobster
2105
629
Aramark Global
4136
2907
LSG/Sky Chefs
1476
103
1045
248
953
228
Sandwich
Pizza
Chicken
Grill Buffet
Family
Dinner-House
Contract
Hotel Food Service Marriott Hilton
Source: Liddle AJ. Nation’s Restaurant News 25 July 2001: 57–132
Marketing Imperatives To sell their products, companies appeal to the reasons why people choose to eat one food rather than another. These reasons are numerous, complex and not always understood, mainly because we select diets within the context of the social, economic and cultural environment in which we live. When food or money is scarce, people do not have the luxury of choice; for much of the world’s population, the first consideration is getting enough food to meet biological needs for energy and nutrients. It is one of the great ironies of nutrition that the traditional plant-based diets consumed by the poor in many countries, some of which are
Food Politics: How the Food Industry Influences Nutrition and Health 327
among the world’s finest cuisines, are ideally suited to meeting nutritional needs as long as caloric intake is adequate. Once people raised on such foods survive the hazards of infancy, their diets (and their active life-styles) support an adulthood relatively free of chronic disease until late in life.14 Also ironic is that once people become better off, they are observed to enter a ‘nutrition transition’ in which they abandon traditional plant-based diets and begin eating more meat, fat and processed foods. The result is a sharp increase in obesity and related chronic diseases. In 2000 the number of overweight people in the world for the first time matched the number of undernourished people – 1.1 billion each. Even in an industrialized country such as France, dietary changes can be seen to produce rapid increases in the prevalence of chronic disease. In the early 1960s, the French diet contained just 25 per cent of calories from fat, but the proportion now approaches 40 per cent as a result of increased intake of meat, dairy and processed foods. Despite contentions that the French are protected from heart disease by their wine consumption (a phenomenon known as the French Paradox), they are getting fatter by the day and experiencing increased rates of diabetes and other health consequences of overeating and overweight. The nutrition transition reflects both taste preferences and economics. Food animals raised in feedlots eat grains, which makes meat more expensive to produce and converts it into a marker of prosperity. Once people have access to meat, they usually do not return to eating plant-based diets unless they are forced to do so by economic reversal or are convinced to do so for reasons of religion, culture or health.15 Humans do not innately know how to select a nutritious diet; we survived in evolution because nutritious foods were readily available for us to hunt or gather. In an economy of over-abundance, food companies can sell products only to people who want to buy them. Whether consumer demands drive food sales or the industry creates such demands is a matter of debate, but much industry effort goes into trying to figure out what the public ‘wants’ and how to meet such ‘needs’. Nearly all research on this issue yields the same conclusion. When food is plentiful and people can afford to buy it, basic biological needs become less compelling and the principal determinant of food choice is personal preference. In turn, personal preferences may be influenced by religion and other cultural factors, as well as by considerations of convenience, price and nutritional value. To sell food in an economy of abundant food choices, companies must worry about those other determinants much more than about the nutritional value of their products – unless the nutrient content helps to entice buyers.16 Thus the food industry’s marketing imperatives principally concern four factors: taste, cost, convenience and (as we shall see) public confusion.
Taste: make foods sweet, fat and salty Adults prefer foods that taste, look and smell good, are familiar and provide variety, but these preferences are influenced strongly by family and ethnic background, level of education, income, age and gender. When asked, most of us say we choose
328 Diet and Health
foods because we like them, by which we mean the way we respond to their flavour, smell, sight and texture. Most of us prefer sweet foods and those that are ‘energy-dense’ (high in calories, fat and sugar), and we like the taste of salt. The universality of such preferences suggests some physiologic basis for all of them, but the research is most convincing for sweetness. Ripe fruit is innately sweet and appealing, but many of us can and do learn to enjoy the complex and sometimes bitter taste of vegetables. Whether a taste for meat is innate or acquired can be debated, but many people like to eat steak, hamburgers and fried chicken, along with desserts, soft drinks and salty snacks. Such preferences drive the development of new food products as well as the menus in restaurants.
Cost: add value but keep prices low One result of over-abundance is pressure to add value to foods through processing. The producers of raw foods receive only a fraction of the price that consumers pay at the supermarket. In 1998, for example, an average of 20 per cent of retail cost – the ‘farm value’ of the food – was returned to its producers. This percentage, which has been declining for years, is unequally distributed. Producers of eggs, beef and chicken receive 50 per cent to 60 per cent of retail cost, whereas producers of vegetables receive as little as 5 per cent. Once foods get to the supermarket, the proportion represented by the farm value declines further in proportion to the extent of processing. The farm value of frozen peas is 13 per cent, of canned tomatoes 9 per cent, of oatmeal 7 per cent and of corn syrup just 4 per cent.17 As shown in Figure 14.3, the remaining 80 per cent of the food dollar goes for labour, packaging, advertising and other such value-enhancing activities. Conversion
Source: USDA FoodReview 2000; 23(3): 27–30
Figure 14.3 The distribution of the US food dollar: 80% of food expenditures go to categories other than the ‘farm value’ of the food itself
Food Politics: How the Food Industry Influences Nutrition and Health 329
of potatoes (cheap) to potato chips (expensive) to those fried in artificial fats or coated in soybean flour or herbal supplements (even more expensive) is an example of how value is added to basic food commodities. Added value explains why the cost of the corn in Kellogg’s Corn Flakes is less than 10 per cent of the retail price. With this kind of pricing distribution, food companies are more likely to focus on developing addedvalue products than to promote consumption of fresh fruits and vegetables, particularly because opportunities for adding value to such foods are limited. Marketers can add value to fruits and vegetables by selling them frozen, canned or pre-cut, but even the most successful of such products – pre-packaged and branded ‘baby’ carrots, salad mixes and precut fruit – raise consumer concerns about freshness and price. Despite the focus on adding value, over-abundance keeps food costs low compared to those anywhere else in the world, and this is due only in part to our high average income. The average American pays less than 10 per cent of income for food. People in low-income countries like Tanzania pay more than 70 per cent of income for food and those in middle-income countries like the Philippines up to 55 per cent but even people in high-income countries like Japan pay as much as 20 per cent. Americans, however, strongly resist price increases. In the US, lower prices stimulate sales, especially the sale of higher-cost items; price is a more important factor in the consumer’s choice of steak than of ground beef. Cost is so important a factor in food choice that economists are able to calculate the effect of a change in price on nutrient intake. They estimate that a decline in the price of meat, for example, causes the average intake of calcium and iron to rise but also increases the consumption of calories, fat, saturated fat and cholesterol.18 A more important reason for low food prices is that the government subsidizes food production in ways that are rarely evident. The most visible subsidies are price supports for sugar and milk, but taxpayers also support production quotas, market quotas, import restrictions, deficiency payments, lower tax rates, low-cost land leases, land management, water rights and marketing and promotion programmes for major food commodities. The total cost of agricultural subsidies rose rapidly at the end of the 20th century from about $18 billion in 1996 to $28 billion in 2000. As we shall see in Part II, the large agricultural corporations that most benefit from federal subsidies spare no effort to persuade Congress and the administration to continue and increase this largesse.19
Convenience: make eating fast Convenience is a principal factor driving the development of value-added products. The demographic causes of demands for convenience are well understood. In the last quarter of the 20th century, the proportion of women with children who entered the work force greatly expanded, and many people began to work longer hours to make ends meet. In 1900, women accounted for 21 per cent of the labour force and married women for less than 6 per cent but by 1999, women – married or not – accounted for more than 60 per cent. The structure of American families changed once there was no longer a housewife who stayed home and cooked.
330 Diet and Health
Working women were unable or unwilling to spend as much time grocery shopping, cooking and cleaning up after meals.20 Societal changes easily explain why nearly half of all meals are consumed outside the home, a quarter of them as fast food and the practice of snacking nearly doubled from the mid-1980s to the mid-1990s. They explain the food industry’s development of pre-packaged sandwiches, salads, entrees and desserts, as well as such innovations as ‘power’ bars, yogurt and pasta in tubes, pre-packaged cereal in a bowl, salad bars, hot-food bars, take-out chicken, supermarket ‘home meal replacements’, McDonald’s shaker salads, chips pre-packaged with dips and foods designed to be eaten directly from the package. Whether these ‘hyper-convenient’ products will outlast the competition remains to be seen, but survival is more likely to depend on taste and price than on nutrient content. Many of these products are high in calories, fat, sugar or salt but are marketed as nutritious because they contain added vitamins. Nutritionists and traditionalists may lament such developments, because convenience overrides not only considerations of health but also the social and cultural meanings of meals and mealtimes. Many food products relegate cooking to a lowpriority chore and encourage trends toward one-dish meals, fewer side dishes, fewer ingredients, larger portions to create leftovers, almost nothing cooked ‘from scratch’ and home-delivered meals ordered by phone, fax or Internet. Interpreting the meaning of these developments no doubt will occupy sociologists and anthropologists for decades. In the meantime, convenience adds value to foods and stimulates the food industry to create even more products that can be consumed quickly and with minimal preparation.
Confusion: keep the public puzzled Many people find it difficult to put nutrition advice into practice, not least because they view the advice as ephemeral – changing from one day to the next. This view is particularly unfortunate because advice to eat more fruits and vegetables and to avoid overweight as a means to promote health has remained constant for half a century. Confusion about nutrition is quite understandable, however. People obtain information about diet and health from the media – newspapers, magazines, television, radio and more recently the Internet. These outlets get much of their information from research publications, experts and the public relations representatives of food and beverage companies. Media outlets require news and reporters are partial to breakthroughs, simple take-home lessons and controversies. A story about the benefits of single nutrients can be entertaining, but ‘eat your veggies’ is old news. It is more interesting to read about a study ‘proving’ that calcium does or does not prevent bone loss than a report that patiently explains the other factors – nutrients, foods, drinks, exercise – that might influence calcium balance in the body. Although foods contain hundreds of nutrients and other components that influence health, and although people eat diets that contain dozens of different foods, reporters rarely discuss study results in their broader dietary
Food Politics: How the Food Industry Influences Nutrition and Health 331
context.21 News outlets are not alone in focusing on single nutrients or foods; researchers also do so. It is easier to study the effects of vitamin E on heart disease risk than it is to try to explain how current dietary patterns are associated with declining rates of coronary heart disease. Research on the effects of single nutrients is more likely to be funded and the results are more likely to garner headlines, especially if they conflict with previous studies. In the meantime, basic dietary advice remains the same – constant, but dull. Newspaper sales and research grants may benefit from confusion over dietary advice, but the greatest beneficiary of public confusion is the food industry. Virtually every food and beverage product is represented by a trade association or public relations firm whose job it is to promote a positive image of that item among consumers, professionals and the media. These groups – and their lobbyists – can take advantage of the results of single-nutrient research to claim that products containing the beneficial nutrient promote health and to demand the right to make that claim on package labels. If people are confused about nutrition, they will be more likely to accept such claims at face value. It is in the interest of food companies to have people believe that there is no such thing as a ‘good’ food (except when it is theirs); that there is no such thing as a ‘bad’ food (especially not theirs); that all foods (especially theirs) can be incorporated into healthful diets; and that balance, variety and moderation are the keys to healthful diets – which means that no advice to restrict intake of their particular product is appropriate. The Pyramid, however, clearly indicates that some foods are better than others from the standpoint of health.
Promoting ‘Eat More’ In a competitive food marketplace, food companies must satisfy stockholders by encouraging more people to eat more of their products. They seek new audiences among children, among members of minority groups or internationally. They expand sales to existing as well as new audiences through advertising but also by developing new products designed to respond to consumer ‘demands’. In recent years, they have embraced a new strategy: increasing the sizes of food portions. Advertising, new products, and larger portions all contribute to a food environment that promotes eating more, not less.
Advertise, advertise, advertise Advertising operates so far below the consciousness of everyone – the public, most nutritionists I know and survey researchers – that it hardly ever gets mentioned as an influence on food choice. The subliminal nature of food and beverage advertising is a tribute to its ubiquity, as well as to the sophistication of the agencies that produce it. Extraordinary amounts of money and talent go into this effort. Food and food service companies spend more than $11 billion annually on direct media
332 Diet and Health
advertising in magazines, newspapers, radio, television and billboards. Some examples of expenditures by specific companies are given in Table 14.1. In 1999 McDonald’s spent $627.2 million, Burger King $403.6 million, Taco Bell $206.5 million and Coke and Diet Coke $174.4 million on direct media advertising. Even small products have impressive advertising budgets, as illustrated by expenditures of $117 million for Wrigley’s chewing gum and nearly $80 million for M&M candies.22 For every dollar spent that ‘measured’ way, the companies spend another two dollars on discount incentives – for example, coupons for consumers and ‘slotting fees’ for retailers to ensure space on supermarket shelves. In total, food companies spent more than $33 billion annually at the turn of the century to advertise and promote their products to the public. Most of this astronomical sum is used to promote the most highly processed, elaborately packaged and fast foods. Nearly 70 per cent of food advertising is for convenience foods, candy and snacks, alcoholic beverages, soft drinks and desserts, whereas just 2.2 per cent is for fruits, vegetables, grains or beans.23 Figure 14.4 illustrates the disproportionate distribu-
Source: Courtesy Elizabeth Pivonka, ©Produce for Better Health Foundation, Wilmington, DE
Figure 14.4 The Produce for Better Health Foundation, a government–industry partnership to promote consumption of fruits and vegetables, created this ‘food marketing’ pyramid to illustrate the disproportionate expenditure of advertising dollars in comparison to dietary recommendations
Food Politics: How the Food Industry Influences Nutrition and Health 333
tion of marketing expenditures relative to dietary recommendations. Although the costs of marketing may appear huge, they amount to just a small fraction of sales. Advertising costs for any single, nationally distributed food product far exceed (often by 10–50 times) federal expenditures for promotion of the Pyramid or to encourage people to eat more fruit and vegetables. Of the more than $300 million that the USDA spends annually on nutrition education, most goes for research projects, the educational components of agricultural extension and other activities that target relatively few people. Despite protestations by marketers that advertising is a minor element in food choice and that the ubiquity of advertising dilutes its impact, they continue to use it to sell products. Successful campaigns are carefully researched, targeted to specific groups and repeated frequently. Advertising promotes the sales of specific food products and in proportion to the amount spent, as shown for commodities such as milk, cheese, grapefruit juice and orange juice. Food sales increase with the intensity, repetition and visibility of the advertising message.24 Promotion of nutritional advantages (low-fat, no cholesterol, highfibre, calcium-added) increases sales, as does the use of health claims (lowers cholesterol, prevents cancer). Cigarette company-owned food advertisers are particularly adept at using charity to sell food products, as shown in Figure 14.5. Advertising sells food to children, a phenomenon well understood by advertisers of tobacco and beer. Advertisers deliberately promote food brands among children and more active demands for advertised foods.
Introduce new products To food and beverage companies, added value and convenience are driving forces for new-product development. Whether the industry creates new products in response to consumer demand or generates demand by creating the products is difficult to untangle; most likely, both interact. Regardless, new-product introductions have increased greatly since the mid-1980s when there were fewer than 6000 annually. In the peak year of 1995, manufacturers introduced 16,900 food and beverage products but the number has since declined. All told, 116,000 packaged foods and beverages have been introduced since 1990, and these joined a marketplace that now contains 320,000 items competing for supermarket shelf space large enough to hold just 50,000.12 The glut of food products means that only the most highly promoted products will succeed; even these may encounter difficulties if they do not taste good, raise questions about health or safety or cost too much. In 1998, manufacturers introduced slightly more than 11,000 new products (Table 14.4). More than two-thirds of those products are condiments, candy and snacks, baked goods, soft drinks and dairy products (cheese products and ice cream novelties) – foods largely allocated to the top of the Pyramid. Slightly more than one-fourth are ‘nutritionally enhanced’ so that they can be marketed as low in fat, cholesterol, salt or sugar or as higher in fibre, calcium or vitamins. Some such
334 Diet and Health
Figure 14.5 This Philip Morris advertisement for its philanthropic food donations appeared in Walking, a health and fitness magazine aimed at young women, in October 2000. No advertisements for cigarettes appear in the magazine. Philip Morris owns Kraft Foods and Miller Beer
products, among them no-fat cookies, vitamin-enriched cereals and calciumfortified juice drinks, contain so much sugar that they belong at the top of the Pyramid. Developing such foods has only one purpose: to attract sales.
Food Politics: How the Food Industry Influences Nutrition and Health 335 Table 14.4 Major categories of the 11,037 new food products introduced in 1998 Product category
Number of new products
Candy, gum, snacks
2065
Condiments
1994
Beverages
1547
Bakery foods
1178
Dairy foods
940
Processed meats
728
Entrees, pre-prepared
678
Fruits and vegetables
375
Soups
299
Desserts
117
Pet foods
105
Breakfast cereals
84
Baby foods
35
Source: Gallo AE. FoodReview 1999; 22(3): 27–29
Serve larger portions ‘Eat more’ marketing methods extend beyond billboards and television commercials; they also include substantial increases in the sizes of food packages and restaurant portions. When the Pyramid recommends 6–11 grain servings, these amounts seem impossibly large with reference to restaurant, fast or take-out foods. The Pyramid serving numbers, however, refer to portion size standards defined by the USDA: a standard grain serving is one slice of white bread, one ounce of readyto-eat cereals or muffins, or one-half cup of rice or pasta. Therefore, a single bakery muffin weighing 7 ounces, or one medium container of movie-theatre popcorn (16 cups), easily meets or exceeds a day’s grain allowances. Larger servings of course contain more calories. The largest movie-theatre soft drink contains 800 calories if not too diluted with ice. Larger portions can contribute to weight gain unless people compensate with diet and exercise. From an industry standpoint, however, larger portions make good marketing sense. The cost of food is low relative to labour and other factors that add value. Large portions attract customers who flock to all-you-can-eat restaurants and order double-scoop ice cream cones because the relative prices discourage the choice of smaller portions. It does not require much mathematical skill to understand that the larger portions of McDonald’s french fries are a better buy than the ‘small’ when they are 40 per cent cheaper per ounce.25 Taken together, advertising, convenience, larger portions and (as we shall see) the added nutrients in foods otherwise high in fat, sugar and salt all contribute to an environment that promotes ‘eat more’. Because dietary advice affects sales, food companies also conduct systematic, pervasive and unrelenting – but far less apparent –
336 Diet and Health
campaigns to convince government officials, health organizations and nutrition professionals that their products are healthful or harmless, to undermine any suggestion to the contrary, and to ensure that federal dietary guidelines and food guides will help promote sales.
Issues and Themes Over-abundant food and its consequences occur in the context of increasing centralization and globalization of the food industry and of altered patterns of work, welfare and government. The food system is only one aspect of society, but it is unusual in its universality: everyone eats. Because food affects lives as well as livelihoods, the situations discussed in this book generate substantial attention from the industry and the government, as well as from advocates, nutrition and health professionals, the media and the public at large. In this book’s discussions of specific topics and incidents, several themes occur. Some of these themes touch on matters central to the functioning of democratic institutions and are worth noting as they emerge in the chapters that follow. One such theme is the ‘paradox of plenty’, the term used by historian Harvey Levenstein to refer to the social consequences of food over-abundance, among them the sharp disparities in diet and health between rich and poor.26 Wealthier people usually are healthier and they choose better diets. They also tend to avoid smoking cigarettes, to drink alcohol in moderation if at all and to be better educated and more physically active. Health habits tend to cluster in patterns, making it difficult to tease out the effects of diet from that of any other behavioural factor. Most paradoxical in the presence of food over-abundance is that large numbers of people in the US and elsewhere do not have enough to eat. The economic expansion of the 20th century differentially favoured people whose income was higher than average and provided much smaller gains for the poor. As noted earlier, when people in developing countries go through a ‘nutrition transition’, they increase the intake of meat, fat and processed foods, gain weight and develop risk factors for diseases of over-consumption. In the US, low-income groups seem to have about the same nutrient intake as people who are better off, but they choose diets higher in calories, fat, meat and sugar, and they display higher rates of obesity and chronic diseases. The income gap between rich and poor can be explained by the functioning of economic and related educational systems. The gaps in diet and health are economically based, but they also derive in part from the social status attached to certain kinds of food – meat for the poor and health foods for the rich, for example. Food and beverage companies reinforce this gap when they seek new marketing opportunities among minority groups or in low-income neighbourhoods. The alcoholic beverage industry is especially adept in marketing to ‘disenfranchised’ groups.27 A second theme is the conflict between scientific and other kinds of belief systems. Although most scientists view scientific methods – testing hypotheses by
Food Politics: How the Food Industry Influences Nutrition and Health 337
controlled experiments – as inherently valid and truthful, we shall see that many people regard science as just one of a number of belief systems of equal validity and importance. Religious beliefs, concerns about animal rights and views of the fundamental nature of society, for example, influence the way people think about food. So do vested interests. Like any other kind of science, nutrition science is more a matter of probabilities than of absolutes and is, therefore, subject to interpretation. Interpretation, in turn, depends on point of view. Government agencies invoke science as a basis for regulatory decisions. Food and supplement companies invoke science to oppose regulations and dietary advice that might adversely affect sales. Advocates invoke science to question the safety of products perceived as undesirable. In contrast, scientists and food producers, who might benefit from promoting research results, nutritional benefits or safety, tend to view other-thanscientific points of view as inherently irrational. Debates about food issues that affect broad aspects of society often focus on scientific proof of safety whether or not safety constitutes the ‘real’ issue, largely because alternative belief systems cannot be validated by scientific methods.28 The third theme constitutes this book’s central thesis: diet is a political issue. Because dietary advice affects food sales, and because companies demand a favourable regulatory environment for their products, dietary practices raise political issues that cut right to the heart of democratic institutions. Nearly all of the situations discussed in this book involve struggles over who decides what people should eat and whether a given food is ‘healthy’. As a result, they inevitably involve struggles over the way government balances corporate against public interests. Such struggles are fundamental to the functioning of the American political system. They are revealed whenever a company attacks its critics as ‘food police’ or justifies self-interested actions as a defence of freedom of choice or exclusion of ‘Big Brother’ government from personal decisions. They are expressed whenever food companies use financial relationships with members of Congress, political leaders and nutrition and health experts to weaken the regulatory ability of federal agencies and whenever they go to court to block unfavourable regulatory decisions. Despite the overwhelmingly greater resources of food companies in defending their own interests we shall see that consumer advocates sometimes can be highly effective in convincing Congress, federal agencies and the courts to take action in the public interest. On that optimistic note, let’s begin by tracing the history of federal dietary advice to the public and the ways in which such advice has been influenced by the actions of the food industry.
Notes and References 1 2
Kluger R. Ashes to Ashes: America’s Hundred-Year Cigarette War, the Public Health, and the Unabashed Triumph of Philip Morris. New York, NY: Alfred A. Knopf, 1996. DHHS. The Surgeon General’s Report on Nutrition and Health. Washington DC 1988.
338 Diet and Health 3
4
5
6
7
8
9 10
11 12
13
14
15
Calories measure the energy value of food. Food package labels – and this book – use the erroneous but commonly understood ‘calories’ instead of the correct unit, kilocalories (kcal). A kilocalorie (in this book, calorie) is the amount of energy required to raise the temperature of a litre of water 1° centigrade. In the metric system, energy is measured in joules; 1 kcal = 4.2 kilojoules (kJ). Food and Nutrition Board. Diet and Health: Implications for Reducing Chronic Disease Risk. Washington DC: National Academy Press, 1989. James WPT. Healthy Nutrition: Preventing NutritionRelated Diseases in Europe. Copenhagen: World Health Organization, 1988. World Cancer Research Fund. Food, Nutrition and the Prevention of Cancer: A Global Perspective. Washington DC: American Institute for Cancer Research, 1997. McGinnis JM, Foege WH. Actual causes of death in the United States. JAMA 1993; 270: 2207– 2212. Stampfer MJ, Hu FB, Manson JE, et al. Primary prevention of coronary heart disease in women through diet and lifestyle. N Engl J Med 2000; 343: 16–22. Frazão E. High costs of poor eating patterns in the United States. In: Frazão E, ed. America’s Eating Habits: Changes & Consequences. Washington DC: USDA, 1999: 5–32. Troiano RP, Flegal KM, Kuczmarski RJ, et al. Overweight prevalence and trends for children and adolescents. Archives of Pediatric and Adolescent Medicine 1995; 149: 1085–1091. Mokdad AH, Serdula MK, Dietz WH, et al. The spread of the obesity epidemic in the United States, 1991– 1998. JAMA 1999; 282: 1519–1522. Must A, Spadano J, Coakley EH, et al. The disease burden associated with overweight and obesity. JAMA 1999; 282: 1523–1529. Overweight and obesity are defined in relation to the Body Mass Index (BMI): body weight in kilograms divided by height in metres squared (kg/m2). Overweight is defined as a BMI at or above the 85th percentile in a national survey conducted in 1976–1980, or a BMI of 25 or above. Obesity is defined as a BMI of 30 or above. Physical activity trends – United States, 1990–1998. JAMA 2001; 285; 1835. Anderson RE, Crespo CJ, Bartlett SJ, et al. Relationship of physical activity and television watching with body weight and level of fatness among children. JAMA 1998; 279: 938–942. Putnam JJ, Allshouse JE. Food Consumption, Prices, and Expenditures, 1970–1997. Washington DC: USDA, 1999. USDA. Data Tables: Results from USDA’s 1994–1996 Continuing Survey of Food Intakes by Individuals and 1994–1996 Diet and Health Knowledge Survey, 1997. Online: www.barc.usda.gov/bhnrc/foodsurvey/. Accessed 23 May 2001. Lin B-H, Guthrie J, Frazão E. Nutrient contribution of food away from home. In: Frazão E, ed. America’s Eating Habits: Changes & Consequences. Washington DC: USDA, 1999: 71–95. Food Surveys Research Group. Pyramid Servings Data: Results from USDA’s 1995 and 1996 Continuing Survey of Food Intakes by Individuals. Beltsville, MD: USDA Agricultural Research Service, 1997. Kantor LS. A dietary assessment of the U.S. food supply. Family Economics and Nutrition Review 1999; 12: 51–54. Lipton KL, Edmondson W, Manchester A. The Food and Fiber System: Contributing to the U.S. and World Economies. Washington DC: USDA Economic Research Service, 1998. Gallo AE. The Food Marketing System in 1996. Washington DC: USDA Economic Research Service, 1998. Beale CL. A century of population growth and change. FoodReview 2000; 23(1): 16–22. Sommer JE, Hoppe RA, Green RC, Korb PJ. Structural and Financial Characteristics of U.S. Farms, 1995: 20th Annual Family Farm Report to Congress. Washington DC: USDA, 1998. Online: www.ers. usda.gov/publications. Accessed 23 May 2001. Nestle M, Wing R, Birch L, et al. Behavioral and social influences on food choice. Nutrition Reviews 1998; 56: S50–S74. Nestle M, ed. Mediterranean diets: science and policy implications. Am J Clin Nutr 1995; 61(suppl): 1313S–1427S. Popkin BM. The nutrition transition and its health implications in lower-income countries. Public Health Nutrition 1998; 1(1): 5–21. Gardner G, Halwell B. Underfed and Overfed: The Global Epidemic of Malnutrition. Washington DC: Worldwatch Institute, 2000. See: http://apps.fao. org.
Food Politics: How the Food Industry Influences Nutrition and Health 339 16 Glanz K, Basil M, Maibach E, et al. Why Americans eat what they do: taste, nutrition cost, convenience, and weight. J Am Diet Assoc 1998; 98: 1118–1126. 17 Dunham D. Food Costs … From Farm to Retail in 1993. Washington DC: USDA Economic Research Service, 1994. 18 Meade B, Rosen S. Income and diet differences greatly affect food spending around the globe. FoodReview 1996; 19(3): 39–44. Huang KS. Prices and incomes affect nutrients consumed. FoodReview 1998: 21(2): 11–15. 19 Egan T. Failing farmers learn to profit from federal aid. New York Times 24 December 2000: A1, A20. 20 Zizza C, Siega-Riz AM, Popkin BM. Significant increase in young adults’ snacking between 1977–1978 and 1994–1996 represents a cause for concern! Preventive Medicine 2001; 32: 303– 310. Bowers DE. Cooking trends echo changing roles of women. FoodReview 2000; 23(1): 23–29. 21 Shim Y, Variyam JN, Blaylock J. Many Americans falsely optimistic about their diets. FoodReview 2000; 23(1): 44–50. Hackman EM, Moe GL. Evaluation of newspaper reports of nutrition-related research. J Am Diet Assoc 1999; 99: 1564–1566. 22 Endicott RC. Top 100 megabrands. Advertising Age 17 July 2000: S1–S18. 23 Gallo AE. Food advertising in the United States. In: Frazão E, ed. America’s Eating Habits: Changes & Consequences. Washington DC: USDA, 1999: 173–180. 24 Novelli WD. Applying social marketing to health promotion and disease prevention. In: Glanz K, Lewis FM, Rimer BK, eds. Health Behavior and Health Education: Theory, Research, and Practice. San Francisco: Jossey-Bass, 1990: 341–369. Blisard N. Advertising and what we eat: the case of dairy products. In: Frazão E, ed. America’s Eating Habits: Changes & Consequences. Washington DC: USDA, 1999: 181–188. Enyinda CI, Ogbuehi AO. An empirical analysis of retail pricing and multimedia advertising effects on sales performance. J Food Products Marketing 1997; 4: 3–16. 25 Young LR, Nestle M. Portion sizes in dietary assessment: issues and policy implications. Nutrition Reviews 1995; 53: 149–158. Hogbin MB, Hess MA. Public confusion over food portions and servings. J Am Diet Assoc 1999; 99: 1209–1211. 26 Levenstein H. Paradox of Plenty: A Social History of Eating in Modern America. Oxford: Oxford University Press, 1993. 27 Wilde PE, McNamara PE, Ranney CK. The effect of income and food programs on dietary quality: a seemingly unrelated regression analysis with error components. Am J Agricultural Economics 1999; 81: 959–971. Alaniz ML, Wilkes C. Pro-drinking messages and message environments for young adults: the case of alcohol industry advertising in African American, Latino, and Native American communities. J Public Health Policy 1998; 19: 447–472. 28 Salter L. Mandated Science: Science and Scientists in the Making of Standards. Dordrecht: Kluwer Academic Publishers, 1988. Irwin A, Wynne B. Introduction. In: Irwin A, Wynne B, eds. Misunderstanding Science? The Public Reconstruction of Science and Technology. Cambridge: Cambridge University Press, 1996: 1–18.
15
Your Trusted Friends E. Schlosser
Before entering the Ray A. Kroc Museum, you have to walk through McStore. Both sit on the ground floor of McDonald’s corporate headquarters, located at One McDonald’s Plaza in Oak Brook, Illinois. The headquarters building has oval windows and a grey concrete facade – a look that must have seemed space-age when the building opened three decades ago. Now it seems stolid and drab, an architectural relic of the Nixon era. It resembles the American embassy compounds that always used to attract anti-war protesters, student demonstrators, flag burners. The eightyacre campus of Hamburger University, McDonald’s managerial training centre, is a short drive from headquarters. Shuttle buses constantly go back and forth between the campus and McDonald’s Plaza, ferrying clean-cut young men and women in khakis who’ve come to study for their ‘Degree in Hamburgerology’. The course lasts two weeks and trains a few thousand managers, executives and franchisees each year. Students from out of town stay at the Hyatt on the McDonald’s campus. Most of the classes are devoted to personnel issues, teaching lessons in teamwork and employee motivation, promoting ‘a common McDonald’s language’ and ‘a common McDonald’s culture’. Three flagpoles stand in front of McDonald’s Plaza, the heart of the hamburger empire. One flies the Stars and Stripes, another flies the Illinois state flag and the third flies a bright red flag with golden arches. You can buy bean-bag McBurglar dolls at McStore, telephones shaped like french fries, ties, clocks, key chains, golf bags and duffel bags, jewellery, baby clothes, lunch boxes, mouse pads, leather jackets, postcards, toy trucks and much more, all of it bearing the stamp of McDonald’s. You can buy T-shirts decorated with a new version of the American flag. The fifty white stars have been replaced by a pair of golden arches. At the back of McStore, past the footsteps of Ronald McDonald stenciled on the floor, past the shelves of dishes and glassware, a bronze bust of Ray Kroc marks the entrance to his museum. Kroc was the founder of the McDonald’s Corporation, and his philosophy of QSC and V – Quality, Service, Cleanliness and Value – still guide Reprinted from ‘Your trusted friends’ from Fast Food Nation: The Dark Side of the All-American Meal by Eric Schlosser, 2002, London and New York, Chapter 2, pp31–57. Reproduced by permission of Penguin Books Ltd. Reprinted by permission of Houghton Mifflin Company. All rights reserved.
Your Trusted Friends 341
it. The man immortalized in bronze is balding and middle-aged, with smooth cheeks and an intense look in his eyes. A glass display case nearby holds plaques, awards and letters of praise. ‘One of the high-lights of my sixty-first birthday celebration’, President Richard Nixon wrote in 1974, ‘was when Tricia suggested we needed a “break” on our drive to Palm Springs, and we turned in at McDonald’s. I had heard for years from our girls that the “Big Mac” was really something special, and while I’ve often credited Mrs. Nixon with making the best hamburgers in the world, we are both convinced that McDonald’s runs a close second... The next time the cook has a night off we will know where to go for fast service, cheerful hospitality – and probably one of the best food buys in America.’ Other glass cases contain artifacts of Kroc’s life, mementos of his long years of struggle and his twilight as a billionaire. The museum is small and dimly lit, displaying each object with reverence. The day I visited, the place was empty and still. It didn’t feel like a traditional museum, where objects are coolly numbered, catalogued and described. It felt more like a shrine. Many of the exhibits at the Ray A. Kroc Museum incorporate neat technological tricks. Dioramas appear and then disappear when certain buttons are pushed. The voices of Kroc’s friends and coworkers – one of them identified as a McDonald’s ‘vice president of individuality’ – boom from speakers at the appropriate cue. Darkened glass cases are suddenly illuminated from within, revealing their contents. An artwork on the wall, when viewed from the left, displays an image of Ray Kroc. Viewed from the right, it shows the letters QSC and V. The museum does not have a life-size, Audio-Animatronic version of McDonald’s founder telling jokes and anecdotes. But one wouldn’t be out of place. An interactive exhibit called ‘Talk to Ray’ shows video clips of Kroc appearing on the Phil Donahue Show, being interviewed by Tom Snyder and chatting with Reverend Robert Schuller at the altar of Orange County’s Crystal Cathedral. ‘Talk to Ray’ permits the viewer to ask Kroc as many as thirty-six predetermined questions about various subjects; old videos of Kroc supply the answers. The exhibit wasn’t working properly the day of my visit. Ray wouldn’t take my questions and so I just listened to him repeating the same speeches. The Disneyesque tone of the museum reflects, among other things, many of the similarities between the McDonald’s Corporation and the Walt Disney Company. It also reflects the similar paths of the two men who founded these corporate giants. Ray Kroc and Walt Disney were both from Illinois; they were born a year apart, Disney in 1901, Kroc in 1902; they knew each other as young men, serving together in the same World War I ambulance corps; and they both fled the Midwest and settled in southern California, where they played central roles in the creation of new American industries. The film critic Richard Schickel has described Disney’s powerful inner need ‘to order, control, and keep clean any environment he inhabited’. The same could easily be said about Ray Kroc, whose obsession with cleanliness and control became one of the hallmarks of his restaurant chain. Kroc cleaned the holes in his mop wringer with a toothbrush. Kroc and Disney both dropped out of high school and later added the trappings of formal education to their companies. The training school for Disney’s theme-park employees was named Disneyland University. More importantly, the two men
342 Diet and Health
shared the same vision of America, the same optimistic faith in technology, the same conservative political views. They were charismatic figures who provided an overall corporate vision and grasped the public mood, relying on others to handle the creative and financial details. Walt Disney neither wrote, nor drew the animated classics that bore his name. Ray Kroc’s attempts to add new dishes to McDonald’s menu – such as Kolacky, a Bohemian pastry and the Hulaburger, a sandwich featuring grilled pineapple and cheese – were unsuccessful. Both men, however, knew how to find and motivate the right talent. While Disney was much more famous and achieved success sooner, Kroc may have been more influential. His company inspired more imitators, wielded more power over the American economy – and spawned a mascot even more famous than Mickey Mouse. Despite all their success as businessmen and entrepreneurs, as cultural figures and advocates for a particular brand of Americanism, perhaps the most significant achievement of these two men lay elsewhere. Walt Disney and Ray Kroc were masterful salesmen. They perfected the art of selling things to children. And their success led many others to aim marketing efforts at kids, turning America’s youngest consumers into a demographic group that is now avidly studied, analysed and targeted by the world’s largest corporations.
Walt and Ray Ray Kroc took the McDonald brothers’ Speedee Service System and spread it nationwide, creating a fast food empire. Although he founded a company that came to symbolize corporate America, Kroc was never a buttoned-down corporate type. He was a former jazz musician who’d played at speakeasies – and at a bordello, on at least one occasion – during Prohibition. He was a charming, funny and indefatigable travelling salesman who endured many years of disappointment, a Willy Loman who finally managed to hit it big in his early sixties. Kroc grew up in Oak Park, Illinois, not far from Chicago. His father worked for Western Union. As a high school freshman, Ray Kroc discovered the joys of selling while employed at his uncle’s soda fountain. ‘That was where I learned you could influence people with a smile and enthusiasm’, Kroc recalled in his autobiography, Grinding It Out, ‘and sell them a sundae when what they’d come for was a cup of coffee.’ Over the years, Kroc sold coffee beans, sheet music, paper cups, Florida real estate, powdered instant beverages called ‘Malt-a-Plenty’ and ‘Shake-a-Plenty’, a gadget that could dispense whipped cream or shaving lather, square ice cream scoops and a collapsible table-and-bench combination called ‘Fold-a-Nook’ that retreated into the wall like a Murphy bed. The main problem with square scoops of ice cream, he found, was that they slid off the plate when you tried to eat them. Kroc used the same basic technique to sell all these things: he tailored his pitch to fit the buyer’s tastes. Despite one setback after another, he kept at it, always convinced that success was just around the corner. ‘If you believe in it, and you believe in it hard’, Kroc later told audiences, ‘it’s impossible to fail. I don’t care what it is – you can get it!’
Your Trusted Friends 343
Ray Kroc was selling milk-shake mixers in 1954 when he first visited the new McDonald’s Self-Service Restaurant in San Bernardino. The McDonald brothers were two of his best customers. The Multimixer unit that Kroc sold could make five milk shakes at once. He wondered why the McDonald brothers needed eight of the machines. Kroc had visited a lot of restaurant kitchens, out on the road, demonstrating the Multimixer – and had never seen anything like the McDonald’s Speedee Service System. ‘When I saw it’, he later wrote, ‘I felt like some latter-day Newton who’d just had an Idaho potato caromed off his skull.’ He looked at the restaurant ‘through the eyes of a salesman’ and envisioned putting a McDonald’s at busy intersections all across the land. Richard and ‘Mac’ McDonald were less ambitious. They were clearing $100,000 a year in profits from the restaurant, a huge sum in those days. They already owned a big house and three Cadillacs. They didn’t like to travel. They’d recently refused an offer from the Carnation Milk Company, which thought that opening more McDonald’s would increase the sales of milk shakes. Nevertheless, Kroc convinced the brothers to sell him the right to franchise McDonald’s nationwide. The two could stay at home, while Kroc travelled the country, making them even richer. A deal was signed. Years later Richard McDonald described his first memory of Kroc, a moment that would soon lead to the birth of the world’s biggest restaurant chain: ‘This little fellow comes in, with a high voice, and says, “hi”.’ After finalizing the agreement with the McDonald brothers, Kroc sent a letter to Walt Disney. In 1917 the two men had both lied about their ages to join the Red Cross and see battle in Europe. A long time had clearly passed since their last conversation. ‘Dear Walt’, the letter said. ‘I feel somewhat presumptuous addressing you in this way yet I feel sure you would not want me to address you any other way. My name is Ray A. Kroc... I look over the Company A picture we had taken at Sound Beach, Conn., many times and recall a lot of pleasant memories.’ After the warm-up came the pitch: ‘I have very recently taken over the national franchise of the McDonald’s system. I would like to inquire if there may be an opportunity for a McDonald’s in your Disneyland Development.’ Walt Disney sent Kroc a cordial reply and forwarded his proposal to an executive in charge of the theme park’s concessions. Disneyland was still under construction, its opening was eagerly awaited by millions of American children, and Kroc may have had high hopes. According to one account, Disney’s company asked Kroc to raise the price of McDonald’s french fries from ten cents to fifteen cents; Disney would keep the extra nickel as payment for granting the concession; and the story ends with Ray Kroc refusing to gouge his loyal customers. The account seems highly unlikely, a belated effort by someone at McDonald’s to put the best spin on a sales pitch that went nowhere. When Disneyland opened in July of 1955 – an event that Ronald Reagan co-hosted for ABC – it had food stands run by Welch’s, Stouffer’s and Aunt Jemima’s, but no McDonald’s. Kroc was not yet in their league. His recollection of Walt Disney as a young man, briefly mentioned in Grinding It Out, is not entirely flattering. ‘He was regarded as a strange duck’,
344 Diet and Health
Kroc wrote of Disney, ‘because whenever we had time off and went out on the town to chase girls, he stayed in camp drawing pictures.’ Whatever feelings existed between the two men, Walt Disney proved in many respects to be a role model for Ray Kroc. Disney’s success had come much more quickly. At the age of 21 he’d left the Midwest and opened his own movie studio in Los Angeles. He was famous before turning 30. In The Magic Kingdom (1997) Steven Watts describes Walt Disney’s efforts to apply the techniques of mass production to Hollywood moviemaking. He greatly admired Henry Ford and introduced an assembly line and a rigorous division of labour at the Disney Studio, which was soon depicted as a ‘fun factory’. Instead of drawing entire scenes, artists were given narrowly defined tasks, meticulously sketching and inking Disney characters while supervisors watched them and timed how long it took them to complete each cel. During the 1930s the production system at the studio was organized to function like that of an automobile plant. ‘Hundreds of young people were being trained and fitted’, Disney explained, ‘into a machine for the manufacture of entertainment.’ The working conditions at Disney’s factory, however, were not always fun. In 1941 hundreds of Disney animators went on strike, expressing support for the Screen Cartoonists Guild. The other major cartoon studios in Hollywood had already signed agreements with the union. Disney’s father was an ardent socialist, and Disney’s films had long expressed a populist celebration of the common man. But Walt’s response to the strike betrayed a different political sensibility. He fired employees who were sympathetic to the union, allowed private guards to rough up workers on the picket line, tried to impose a phony company union, brought in an organized crime figure from Chicago to rig a settlement and placed a full-page ad in Variety that accused leaders of the Screen Cartoonists Guild of being communists. The strike finally ended when Disney acceded to the union’s demands. The experience left him feeling embittered. Convinced that communist agents had been responsible for his troubles, Disney subsequently appeared as a friendly witness before the House Un-American Activities Committee, served as a secret informer for the FBI and strongly supported the Hollywood blacklist. During the height of labour tension at his studio, Disney had made a speech to a group of employees, arguing that the solution to their problems rested not with a labour union, but with a good day’s work. ‘Don’t forget this’, Disney told them, ‘it’s the law of the universe that the strong shall survive and the weak must fall by the way, and I don’t give a damn what idealistic plan is cooked up, nothing can change that.’ Decades later, Ray Kroc used similar language to outline his own political philosophy. Kroc’s years on the road as a travelling salesman – carrying his own order forms and sample books, knocking on doors, facing each new customer alone and having countless doors slammed in his face – no doubt influenced his view of humanity. ‘Look, it is ridiculous to call this an industry’, Kroc told a reporter in 1972, dismissing any high-minded analysis of the fast food business. ‘This is not. This is rat eat rat, dog eat dog. I’ll kill’em, and I’m going to kill’em before they kill me. You’re talking about the American way of survival of the fittest.’
Your Trusted Friends 345
While Disney backed right-wing groups and produced campaign ads for the Republican Party, Kroc remained aloof from electoral politics – with one notable exception. In 1972, Kroc gave $250,000 to President Nixon’s re-election campaign, breaking the gift into smaller donations, funnelling the money through various state and local Republican committees. Nixon had every reason to like McDonald’s, long before tasting one of its hamburgers. Kroc had never met the president; the gift did not stem from any personal friendship or fondness. That year the fast food industry was lobbying Congress and the White House to pass new legislation – known as the ‘McDonald’s bill’ – that would allow employers to pay 16- and 17-year-old kids wages 20 per cent lower than the minimum wage. Around the time of Kroc’s $250,000 donation, McDonald’s crew members earned about $1.60 an hour. The sub-minimum wage proposal would reduce some wages to $1.28 an hour. The Nixon administration supported the McDonald’s bill and permitted McDonald’s to raise the price of its Quarter Pounders, despite the mandatory wage and price controls restricting other fast food chains. The size and the timing of Kroc’s political contribution sparked Democratic accusations of influence peddling. Outraged by the charges, Kroc later called his critics ‘sons of bitches’. The uproar left him wary of backing political candidates. Nevertheless, Kroc retained a soft spot for Calvin Coolidge, whose thoughts on hard work and self-reliance were prominently displayed at McDonald’s corporate headquarters.
Better Living Despite a passionate opposition to socialism and to any government meddling with free enterprise, Walt Disney relied on federal funds in the 1940s to keep his business afloat. The animators’ strike had left the Disney Studio in a precarious financial condition. Disney began to seek government contracts – and those contracts were soon responsible for 90 per cent of his studio’s output. During World War II, Walt Disney produced scores of military training and propaganda films, including Food Will Win the War, High-Level Precision Bombing and A Few Quick Facts About Venereal Disease. After the war, Disney continued to work closely with top military officials and military contractors, becoming America’s most popular exponent of Cold War science. For audiences living in fear of nuclear annihilation, Walt Disney became a source of reassurance, making the latest technical advances seem marvellous and exciting. His faith in the goodness of American technology was succinctly expressed by the title of a film that the Disney Studio produced for Westinghouse Electric: The Dawn of Better Living. Disney’s passion for science found expression in ‘Tomorrowland’, the name given to a section of his theme park and to segments of his weekly television show. Tomorrowland encompassed everything from space travel to the household appliances of the future, depicting progress as a relentless march toward greater convenience for consumers. And yet, from the very beginning, there was a
346 Diet and Health
dark side to this Tomorrowland. It celebrated technology without moral qualms. Some of the science it espoused later proved to be not so benign – and some of the scientists it promoted were unusual role models for the nation’s children. In the mid-1950s Wernher von Braun co-hosted and helped produce a series of Disney television shows on space exploration. ‘Man in Space’ and the other Tomorrowland episodes on the topic were enormously popular and fuelled public support for an American space programme. At the time, von Braun was the US Army’s leading rocket scientist. He had served in the same capacity for the German army during World War II. He had been an early and enthusiastic member of the Nazi party, as well as a major in the SS. At least 20,000 slave labourers, many of them Allied prisoners of war, died at Dora-Nordhausen, the factory where von Braun’s rockets were built. Less than ten years after the liberation of Dora-Nordhausen, von Braun was giving orders to Disney animators and designing a ride at Disneyland called Rocket to the Moon. Heinz Haber, another key Tomorrowland adviser – and eventually the chief scientific consultant to Walt Disney Productions – spent much of World War II conducting research on high-speed, high-altitude flight for the Luftwaffe Institute for Aviation Medicine. In order to assess the risks faced by German air force pilots, the institute performed experiments on hundreds of inmates at the Dachau concentration camp near Munich. The inmates who survived these experiments were usually killed and then dissected. Haber left Germany after the war and shared his knowledge of aviation medicine with the US Army Air Force. He later co-hosted Disney’s ‘Man in Space’ with von Braun. When the Eisenhower administration asked Walt Disney to produce a show championing the civilian use of nuclear power, Heinz Haber was given the assignment. He hosted the Disney broadcast called ‘Our Friend the Atom’ and wrote a popular children’s book with the same title, both of which made nuclear fission seem fun, instead of terrifying. ‘Our Friend the Atom’ was sponsored by General Dynamics, a manufacturer of nuclear reactors. The company also financed the atomic submarine ride at Disneyland’s Tomorrowland. The future heralded at Disneyland was one in which every aspect of American life had a corporate sponsor. Walt Disney was the most beloved children’s entertainer in the country. He had unrivalled access to impressionable young minds – and other corporations, with other agendas to sell, were eager to come along for the ride. Monsanto built Disneyland’s House of the Future, which was made of plastic. General Electric backed the Carousel of Progress, which featured an AudioAnimatronic housewife, standing in her futuristic kitchen, singing about ‘a great big beautiful tomorrow’. Richfield Oil offered Utopian fantasies about cars and a ride aptly named Autopia. ‘Here you leave Today’, said the plaque at the entrance to Disneyland, ‘and enter the world of Yesterday, Tomorrow, and Fantasy.’ At first, Disneyland offered visitors an extraordinary feeling of escape; people had never seen anything like it. The great irony, of course, is that Disney’s suburban, corporate world of Tomorrow would soon become the Anaheim of Today. Within a decade of its opening, Disneyland was no longer set amid a rural idyll of orange groves, it was stuck in the middle of cheap motels, traffic jams on the Santa
Your Trusted Friends 347
Ana freeway, fast food joints and industrial parks. Walt Disney frequently slept at his small apartment above the firehouse in Disneyland’s Main Street, US. By the early 1960s, the hard realities of Today were more and more difficult to ignore, and Disney began dreaming of bigger things, of Disney World, a place even farther removed from the forces he’d helped to unleash, a fantasy that could be even more thoroughly controlled. Among other cultural innovations, Walt Disney pioneered the marketing strategy now known as ‘synergy’. During the 1930s, he signed licensing agreements with dozens of firms, granting them the right to use Mickey Mouse on their products and in their ads. In 1938 Snow White proved a turning point in film marketing: Disney had signed 70 licensing deals prior to the film’s release. Snow White toys, books, clothes, snacks and records were already for sale when the film opened. Disney later used television to achieve a degree of synergy beyond anything that anyone had previously dared. His first television broadcast, One Hour in Wonderland (1950), culminated in a promotion for the upcoming Disney film Alice in Wonderland. His first television series, Disneyland (1954), provided weekly updates on the construction work at his theme park. ABC, which broadcast the show, owned a large financial stake in the Anaheim venture. Disneyland’s other major investor, Western Printing and Lithography, printed Disney books such as The Walt Disney Story of Our Friend the Atom. In the guise of televised entertainment, episodes of Disneyland were often thinly disguised infomercials, promoting films, books, toys, an amusement park – and, most of all, Disney himself, the living, breathing incarnation of a brand, the man who neatly tied all the other commodities together into one cheerful, friendly, patriotic idea. Ray Kroc could only dream, during McDonald’s tough early years, of having such marketing tools at his disposal. He was forced to rely instead on his wits, his charisma and his instinct for promotion. Kroc believed completely in whatever he sold and pitched McDonald’s franchises with an almost religious fervour. He also knew a few things about publicity, having auditioned talent for a Chicago radio station in the 1920s and performed in nightclubs for years. Kroc hired a publicity firm led by a gag writer and a former MGM road manager to get McDonald’s into the news. Children would be the new restaurant chain’s target customers. The McDonald brothers had aimed for a family crowd and now Kroc improved and refined their marketing strategy. He’d picked the right moment. America was in the middle of a baby boom; the number of children had soared in the decade after World War II. Kroc wanted to create a safe, clean, all-American place for kids. The McDonald’s franchise agreement required every new restaurant to fly the Stars and Stripes. Kroc understood that how he sold food was just as important as how the food tasted. He liked to tell people that he was really in show business, not the restaurant business. Promoting McDonald’s to children was a clever, pragmatic decision. ‘A child who loves our TV commercials’, Kroc explained, ‘and brings her grandparents to a McDonald’s gives us two more customers.’ The McDonald’s Corporation’s first mascot was Speedee, a winking little chef with a hamburger for a head. The character was later renamed Archie McDonald. Speedy was the name of Alka-Seltzer’s mascot, and it seemed unwise to imply any
348 Diet and Health
connection between the two brands. In 1960, Oscar Goldstein, a McDonald’s franchisee in Washington DC, decided to sponsor Bozo’s Circus, a local children’s television show. Bozo’s appearance at a McDonald’s restaurant drew large crowds. When the local NBC station cancelled Bozo’s Circus in 1963, Goldstein hired its star – Willard Scott, later the weatherman on NBC’s Today show – to invent a new clown who could make restaurant appearances. An ad agency designed the outfit, Scott came up with the name Ronald McDonald and a star was born. Two years later the McDonald’s Corporation introduced Ronald McDonald to the rest of the US through a major ad campaign. But Willard Scott no longer played the part. He was deemed too overweight; McDonald’s wanted someone thinner to sell its burgers, shakes and fries. The late-1960s expansion of the McDonald’s restaurant chain coincided with declining fortunes at the Walt Disney Company. Disney was no longer alive and his vision of America embodied just about everything that kids of the 1960s were rebelling against. Although McDonald’s was hardly a promoter of whole foods and psychedelia, it had the great advantage of seeming new – and there was something trippy about Ronald McDonald, his clothes and his friends. As McDonald’s mascot began to rival Mickey Mouse in name recognition, Kroc made plans to create his own Disneyland. He was a highly competitive man who liked, whenever possible, to settle the score. ‘If they were drowning to death’, Kroc once said about his business rivals, ‘I would put a hose in their mouth.’ He planned to buy 1500 acres of land northeast of Los Angeles and build a new amusement park there. The park, tentatively called Western World, would have a cowboy theme. Other McDonald’s executives opposed the idea, worried that Western World would divert funds from the restaurant business and lose millions. Kroc offered to option the land with his own money, but finally listened to his close advisers and scrapped the plan. The McDonald’s Corporation later considered buying Astro World in Houston. Instead of investing in a large theme park, the company pursued a more decentralized approach. It built small Playlands and McDonaldlands all over the US. The fantasy world of McDonaldland borrowed a good deal from Walt Disney’s Magic Kingdom. Don Ament, who gave McDonaldland its distinctive look, was a former Disney set designer. Richard and Robert Sherman – who had written and composed, among other things, all the songs in Disney’s Mary Poppins, Disneyland’s ‘It’s a Great, Big, Beautiful Tomorrow’ and ‘It’s a Small World, After All’ – were enlisted for the first McDonaldland commercials. Ronald McDonald, Mayor McCheese and the other characters in the ads made McDonald’s seem like more than just another place to eat. McDonaldland – with its hamburger patch, apple pie trees and Filet-O-Fish fountain – had one crucial thing in common with Disneyland. Almost everything in it was for sale. McDonald’s soon loomed large in the imagination of toddlers, the intended audience for the ads. The restaurant chain evoked a series of pleasing images in a youngster’s mind: bright colours, a playground, a toy, a clown, a drink with a straw, little pieces of food wrapped up like a present. Kroc had succeeded, like his old Red Cross comrade, at selling something intangible to children, along with their fries.
Your Trusted Friends 349
Kid Kustomers Twenty-five years ago, only a handful of American companies directed their marketing at children – Disney, McDonald’s, candy makers, toy makers, manufacturers of breakfast cereal. Today children are being targeted by phone companies, oil companies and automobile companies, as well as clothing stores and restaurant chains. The explosion in children’s advertising occurred during the 1980s. Many working parents, feeling guilty about spending less time with their kids, started spending more money on them. One marketing expert has called the 1980s ‘the decade of the child consumer’. After largely ignoring children for years, Madison Avenue began to scrutinize and pursue them. Major ad agencies now have children’s divisions and a variety of marketing firms focus solely on kids. These groups tend to have sweet-sounding names: Small Talk, Kid Connection, Kid2Kid, the Gepetto Group, Just Kids, Inc. At least three industry publications – Youth Market Alert, Selling to Kids and Marketing to Kids Report – cover the latest ad campaigns and market research. The growth in children’s advertising has been driven by efforts to increase not just current, but also future, consumption. Hoping that nostalgic childhood memories of a brand will lead to a lifetime of purchases, companies now plan ‘cradle-to-grave’ advertising strategies. They have come to believe what Ray Kroc and Walt Disney realized long ago – a person’s ‘brand loyalty’ may begin as early as the age of two. Indeed, market research has found that children often recognize a brand logo before they can recognize their own name. The discontinued Joe Camel ad campaign, which used a hip cartoon character to sell cigarettes, showed how easily children can be influenced by the right corporate mascot. A 1991 study published in the Journal of the American Medical Association found that nearly all of America’s six-year-olds could identify Joe Camel, who was just as familiar to them as Mickey Mouse. Another study found that onethird of the cigarettes illegally sold to minors were Camels. More recently, a marketing firm conducted a survey in shopping malls across the country, asking children to describe their favorite TV ads. According to the CME KidCom Ad Traction Study II, released at the 1999 Kids’ Marketing Conference in San Antonio, Texas, the Taco Bell commercials featuring a talking chihuahua were the most popular fast food ads. The kids in the survey also liked Pepsi and Nike commercials, but their favourite television ad was for Budweiser. The bulk of the advertising directed at children today has an immediate goal. ‘It’s not just getting kids to whine’, one marketer explained in Selling to Kids, ‘it’s giving them a specific reason to ask for the product.’ Years ago sociologist Vance Packard described children as ‘surrogate salesmen’ who had to persuade other people, usually their parents, to buy what they wanted. Marketers now use different terms to explain the intended response to their ads – such as ‘leverage’, ‘the nudge factor’, ‘pester power’. The aim of most children’s advertising is straightforward: get kids to nag their parents and nag them well. James U. McNeal, a professor of marketing at Texas A&M University, is considered America’s leading authority on marketing to children. In his book Kids As Cus-
350 Diet and Health
tomers (1992), McNeal provides marketers with a thorough analysis of ‘children’s requesting styles and appeals’. He classifies juvenile nagging tactics into seven major categories. A pleading nag is one accompanied by repetitions of words like ‘please’ or ‘mom, mom, mom’. A persistent nag involves constant requests for the coveted product and may include the phrase ‘I’m gonna ask just one more time’. Forceful nags are extremely pushy and may include subtle threats, like ‘Well, then, I’ll go and ask Dad’. Demonstrative nags are the most high-risk, often characterized by full-blown tantrums in public places, breath holding, tears, a refusal to leave the store. Sugarcoated nags promise affection in return for a purchase and may rely on seemingly heartfelt declarations like ‘You’re the best dad in the world’. Threatening nags are youthful forms of blackmail, vows of eternal hatred and of running away if something isn’t bought. Pity nags claim the child will be heartbroken, teased or socially stunted if the parent refuses to buy a certain item. ‘All of these appeals and styles may be used in combination’, McNeal’s research has discovered, ‘but kids tend to stick to one or two of each that prove most effective … for their own parents.’ McNeal never advocates turning children into screaming, breath-holding monsters. He has been studying ‘Kid Kustomers’ for more than 30 years and believes in a more traditional marketing approach. ‘The key is getting children to see a firm … in much the same way as [they see] mom or dad, grandma or grandpa’, McNeal argues. ‘Likewise, if a company can ally itself with universal values such as patriotism, national defense, and good health, it is likely to nurture belief in it among children.’ Before trying to affect children’s behaviour, advertisers have to learn about their tastes. Today’s market researchers not only conduct surveys of children in shopping malls, they also organize focus groups for kids as young as two or three. They analyse children’s artwork, hire children to run focus groups, stage slumber parties and then question children into the night. They send cultural anthropologists into homes, stores, fast food restaurants and other places where kids like to gather, quietly and surreptitiously observing the behaviour of prospective customers. They study the academic literature on child development, seeking insights from the work of theorists such as Erik Erikson and Jean Piaget. They study the fantasy lives of young children, then apply the findings in advertisements and product designs. Dan S. Acuff – the president of Youth Market System Consulting and the author of What Kids Buy and Why (1997) – stresses the importance of dream research. Studies suggest that until the age of six, roughly 80 per cent of children’s dreams are about animals. Rounded, soft creatures like Barney, Disney’s animated characters and the Teletubbies therefore have an obvious appeal to young children. The Character Lab, a division of Youth Market System Consulting, uses a proprietary technique called Character Appeal Quadrant Analysis to help companies develop new mascots. The technique purports to create imaginary characters who perfectly fit the targeted age group’s level of cognitive and neurological development. Children’s clubs have for years been considered an effective means of targeting ads and collecting demographic information; the clubs appeal to a child’s
Your Trusted Friends 351
fundamental need for status and belonging. Disney’s Mickey Mouse Club, formed in 1930, was one of the trailblazers. During the 1980s and 1990s, children’s clubs proliferated, as corporations used them to solicit the names, addresses, zip codes and personal comments of young customers. ‘Marketing messages sent through a club not only can be personalized’, James McNeal advises, ‘they can be tailored for a certain age or geographical group.’ A well-designed and well-run children’s club can be extremely good for business. According to one Burger King executive, the creation of a Burger King Kids Club in 1991 increased the sales of children’s meals as much as 300 per cent. The Internet has become another powerful tool for assembling data about children. In 1998 a federal investigation of websites aimed at children found that 89 per cent requested personal information from kids; only 1 per cent required that children obtain parental approval before supplying the information. A character on the McDonald’s website told children that Ronald McDonald was ‘the ultimate authority in everything’. The site encouraged kids to send Ronald an email revealing their favourite menu item at McDonald’s, their favourite book, their favourite sports team – and their name. Fast food websites no longer ask children to provide personal information without first gaining parental approval; to do so is now a violation of federal law, thanks to the Children’s Online Privacy Protection Act, which took effect in April of 2000. Despite the growing importance of the Internet, television remains the primary medium for children’s advertising. The effects of these TV ads have long been a subject of controversy. In 1978, the Federal Trade Commission (FTC) tried to ban all television ads directed at children seven years old or younger. Many studies had found that young children often could not tell the difference between television programming and television advertising. They also could not comprehend the real purpose of commercials and trusted that advertising claims were true. Michael Pertschuk, the head of the FTC, argued that children need to be shielded from advertising that preys upon their immaturity. ‘They cannot protect themselves’, he said, ‘against adults who exploit their present-mindedness.’ The FTC’s proposed ban was supported by the American Academy of Pediatrics, the National Congress of Parents and Teachers, the Consumers Union and the Child Welfare League, among others. But it was attacked by the National Association of Broadcasters, the Toy Manufacturers of America and the Association of National Advertisers. The industry groups lobbied Congress to prevent any restrictions on children’s ads and sued in federal court to block Pertschuk from participating in future FTC meetings on the subject. In April of 1981, three months after the inauguration of President Ronald Reagan, an FTC staff report argued that a ban on ads aimed at children would be impractical, effectively killing the proposal. ‘We are delighted by the FTC’s reasonable recommendation’, said the head of the National Association of Broadcasters. The Saturday morning children’s ads that caused angry debates 20 years ago now seem almost quaint. Far from being banned, TV advertising aimed at kids is now broadcast 24 hours a day, closed-captioned and in stereo. Nickelodeon, the
352 Diet and Health
Disney Channel, the Cartoon Network and the other children’s cable networks are now responsible for about 80 per cent of all television viewing by kids. None of these networks existed before 1979. The typical American child now spends about 21 hours a week watching television – roughly one and a half months of TV every year. That does not include the time children spend in front of a screen watching videos, playing video games or using the computer. Outside of school, the typical American child spends more time watching television than doing any other activity except sleeping. During the course of a year, he or she watches more than 30,000 TV commercials. Even the nation’s youngest children are watching a great deal of television. About one-quarter of American children between the ages of two and five have a TV in their room.
Perfect Synergy Although the fast food chains annually spend about $3 billion on television advertising, their marketing efforts directed at children extend far beyond such conventional ads. The McDonald’s Corporation now operates more than 8000 playgrounds at its restaurants in the US. Burger King has more than 2000. A manufacturer of ‘playlands’ explains why fast food operators build these largely plastic structures: ‘Playlands bring in children, who bring in parents, who bring in money.’ As American cities and towns spend less money on children’s recreation, fast food restaurants have become gathering spaces for families with young children. Every month about 90 per cent of American children between the ages of three and nine visit a McDonald’s. The seesaws, slides and pits full of plastic balls have proven to be an effective lure. ‘But when it gets down to brass tacks’, a Brandweek article on fast food notes, ‘the key to attracting kids is toys, toys, toys.’ The fast food industry has forged promotional links with the nation’s leading toy manufacturers, giving away simple toys with children’s meals and selling more elaborate ones at a discount. The major toy crazes of recent years – including Pokémon cards, Cabbage Patch Kids and Tamogotchis – have been abetted by fast food promotions. A successful promotion easily doubles or triples the weekly sales volume of children’s meals. The chains often distribute numerous versions of a toy, encouraging repeat visits by small children and adult collectors who hope to obtain complete sets. In 1999 McDonald’s distributed 80 different types of Furby. According to a publication called Tomart’s Price Guide to McDonald’s Happy Meal Collectibles, some fast food giveaways are now worth hundreds of dollars. Rod Taylor, a Brandweek columnist, called McDonald’s 1997 Teenie Beanie Baby giveaway one of the most successful promotions in the history of American advertising. At the time McDonald’s sold about 10 million Happy Meals in a typical week. Over the course of ten days in April of 1997, by including a Teenie Beanie Baby with each purchase, McDonald’s sold about 100 million Happy Meals. Rarely has a marketing effort achieved such an extraordinary rate of sales
Your Trusted Friends 353
among its intended consumers. Happy Meals are marketed to children between the ages of three and nine; within ten days about four Teenie Beanie Baby Happy Meals were sold for every American child in that age group. Not all of those Happy Meals were purchased for children. Many adult collectors bought Teenie Beanie Baby Happy Meals, kept the dolls and threw away the food. The competition for young customers has led the fast food chains to form marketing alliances not just with toy companies, but with sports leagues and Hollywood studios. McDonald’s has staged promotions with the National Basketball Association and the Olympics. Pizza Hut, Taco Bell and KFC signed a three-year deal with the NCAA. Wendy’s has linked with the National Hockey League. Burger King and Nickelodeon, Denny’s and Major League Baseball, McDonald’s and the Fox Kids Network have all formed partnerships that mix advertisements for fast food with children’s entertainment. Burger King has sold chicken nuggets shaped like Teletubbies. McDonald’s now has its own line of children’s videos starring Ronald McDonald. The Wacky Adventures of Ronald McDonald is being produced by Klasky-Csupo, the company that makes Rugrats and The Simpsons. The videos feature the McDonaldland characters and sell for $3.49. ‘We see this as a great opportunity’, a McDonald’s executive said in a press release, ‘to create a more meaningful relationship between Ronald and kids.’ All of these cross-promotions have strengthened the ties between Hollywood and the fast food industry. In the past few years, the major studios have started to recruit fast food executives. Susan Frank, a former director of national marketing for McDonald’s, later became a marketing executive at the Fox Kids Network. She now runs a new family-oriented cable network jointly owned by Hallmark Entertainment and the Jim Henson Company, creator of the Muppets. Ken Snelgrove, who for many years worked as a marketer for Burger King and McDonald’s, now works at MGM. Brad Ball, a former senior vice president of marketing at McDonald’s, is now the head of marketing for Warner Brothers. Not long after being hired, Ball told the Hollywood Reporter that there was little difference between selling films and selling hamburgers. John Cywinski, the former head of marketing at Burger King, became the head of marketing for Walt Disney’s film division in 1996, then left the job to work for McDonald’s. Forty years after Bozo’s first promotional appearance at a McDonald’s, amid all the marketing deals, giveaways and executive swaps, America’s fast food culture has become indistinguishable from the popular culture of its children. In May of 1996, the Walt Disney Company signed a ten-year global marketing agreement with the McDonald’s Corporation. By linking with a fast food company, a Hollywood studio typically gains anywhere from $25 million to $45 million in additional advertising for a film, often doubling its ad budget. These licensing deals are usually negotiated on a per-film basis; the 1996 agreement with Disney gave McDonald’s exclusive rights to that studio’s output of films and videos. Some industry observers thought Disney benefited more from the deal, gaining a steady source of marketing funds. According to the terms of the agreement, Disney characters could never be depicted sitting in a McDonald’s restaurant or
354 Diet and Health
eating any of the chain’s food. In the early 1980s, the McDonald’s Corporation had turned away offers to buy Disney; a decade later, McDonald’s executives sounded a bit defensive about having given Disney greater control over how their joint promotions would be run. ‘A lot of people can’t get used to the fact that two big global brands with this kind of credibility can forge this kind of working relationship’, a McDonald’s executive told a reporter. ‘It’s about their theme parks, their next movie, their characters, their videos… It’s bigger than a hamburger. It’s about the integration of our two brands, long term.’ The life’s work of Walt Disney and Ray Kroc had come full circle, uniting in perfect synergy. McDonald’s began to sell its hamburgers and french fries at Disney’s theme parks. The ethos of McDonaldland and of Disneyland, never far apart, have finally become one. Now you can buy a Happy Meal at the Happiest Place on Earth.
The Brand Essence The best insight into the thinking of fast food marketers comes from their own words. Confidential documents from a recent McDonald’s advertising campaign give a clear sense of how the restaurant chain views its customers. The McDonald’s Corporation was facing a long list of problems. ‘Sales are decreasing’, one memo noted. ‘People are telling us Burger King and Wendy’s are doing a better job of giving … better food at the best price’, another warned. Consumer research indicated that future sales in some key areas were at risk. ‘More customers are telling us’, an executive wrote, ‘that McDonald’s is a big company that just wants to sell … sell as much as it can.’ An emotional connection to McDonald’s that customers had formed ‘as toddlers’ was now eroding. The new radio and television advertising had to make people feel that McDonald’s still cared about them. It had to link the McDonald’s of today to the one people loved in the past. ‘The challenge of the campaign’, wrote Ray Bergold, the chain’s top marketing executive, ‘is to make customers believe that McDonald’s is their “Trusted Friend.’’’ According to these documents, the marketing alliances with other brands were intended to create positive feelings about McDonald’s, making consumers associate one thing they liked with another. Ads would link the company’s french fries ‘to the excitement and fanaticism people feel about the NBA’. The feelings of pride inspired by the Olympics would be used in ads to help launch a new hamburger with more meat than the Big Mac. The link with the Walt Disney Company was considered by far the most important, designed to ‘enhance perceptions of Brand McDonald’s’. A memo sought to explain the underlying psychology behind many visits to McDonald’s: parents took their children to McDonald’s because they ‘want the kids to love them … it makes them feel like a good parent’. Purchasing something from Disney was the ‘ultimate’ way to make kids happy, but it was too expensive to do every day. The advertising needed to capitalize on these feelings,
Your Trusted Friends 355
letting parents know that ‘ONLY MCDONALD’S MAKES IT EASY TO GET A BIT OF DISNEY MAGIC’. The ads aimed at ‘minivan parents’ would carry an unspoken message about taking your children to McDonald’s: ‘It’s an easy way to feel like a good parent.’ The fundamental goal of the ‘My McDonald’s’ campaign that stemmed from these proposals was to make a customer feel that McDonald’s ‘cares about me’ and ‘knows about me’. A corporate memo introducing the campaign explained: ‘The essence McDonald’s is embracing is “Trusted Friend” … “Trusted Friend” captures all the goodwill and the unique emotional connection customers have with the McDonald’s experience … [Our goal is to make] customers believe McDonald’s is their “Trusted Friend.” Note: this should be done without using the words “Trusted Friend”… Every commercial [should be] honest … Every message will be in good taste and feel like it comes from a trusted friend.’ The words ‘trusted friend’ were never to be mentioned in the ads because doing so might prematurely ‘wear out a brand essence’ that could prove valuable in the future for use among different national, ethnic and age groups. Despite McDonald’s faith in its trusted friends, the opening page of this memo said in bold red letters: ‘ANY UNAUTHORIZED USE OR COPYING OF THIS MATERIAL MAY LEAD TO CIVIL OR CRIMINAL PROSECUTION.’
McTeachers and Coke Dudes Not satisfied with marketing to children through playgrounds, toys, cartoons, movies, videos, charities and amusement parks, through contests, sweepstakes, games and clubs, via television, radio, magazines and the Internet, fast food chains are now gaining access to the last advertising-free outposts of American life. In 1993 District 11 in Colorado Springs started a nationwide trend, becoming the first public school district in the US to place ads for Burger King in its hallways and on the sides of its school buses. Like other school systems in Colorado, District 11 faced revenue shortfalls, thanks to growing enrolments and voter hostility to tax increases for education. The initial Burger King and King Sooper ad contracts were a disappointment for the district, gaining it just $37,500 a year – little more than $1 per student. In 1996, school administrators decided to seek negotiating help from a professional, hiring Dan DeRose, president of DD Marketing, Inc., of Pueblo, Colorado. DeRose assembled special advertising packages for corporate sponsors. For $12,000, a company got five school-bus ads, hallway ads in all 52 of the district’s schools, ads in their school newspapers, a stadium banner, ads over the stadium’s public-address system during games and free tickets to high school sporting events. Within a year, DeRose had nearly tripled District 11’s ad revenues. But his greatest success was still to come. In August of 1997, DeRose brokered a ten-year deal that made Coca-Cola the district’s exclusive beverage supplier, bringing the schools up to $11 million during the life of the contract (minus DD Marketing’s
356 Diet and Health
fee). The deal also provided free use of a 1998 Chevy Cavalier to a District 11 high school senior, chosen by lottery, who had good grades and a perfect attendance record. District 11’s marketing efforts were soon imitated by other school districts in Colorado, by districts in Pueblo, Fort Collins, Denver and Cherry Creek. Administrators in Colorado Springs did not come up with the idea of using corporate sponsorship to cover shortfalls in a school district’s budget. But they took it to a whole new level, packaging it, systematizing it, leading the way. Hundreds of public school districts across the US are now adopting or considering similar arrangements. Children spend about seven hours a day, 150 days a year, in school. Those hours have in the past been largely free of advertising, promotion and market research – a source of frustration to many companies. Today the nation’s fast food chains are marketing their products in public schools through conventional ad campaigns, classroom teaching materials and lunchroom franchises, as well as a number of unorthodox means. The proponents of advertising in the schools argue that it is necessary to prevent further cutbacks; opponents contend that schoolchildren are becoming a captive audience for marketers, compelled by law to attend school and then forced to look at ads as a means of paying for their own education. America’s schools now loom as a potential gold mine for companies in search of young customers. ‘Discover your own river of revenue at the schoolhouse gates’, urged a brochure at the 1997 Kids Power Marketing Conference. ‘Whether it’s first-graders learning to read or teenagers shopping for their first car, we can guarantee an introduction of your product and your company to these students in the traditional setting of the classroom.’ DD Marketing, with offices in Colorado Springs and Pueblo, has emerged as perhaps the nation’s foremost negotiator of ad contracts for schools. Dan DeRose began his career as the founder of the Minor League Football System, serving in the late 1980s as both a team owner and a player. In 1991, he became athletic director at the University of Southern Colorado in Pueblo. During his first year, he raised $250,000 from corporate sponsors for the school’s teams. Before long he was raising millions of dollars to build campus sports facilities. He was good at getting money out of big corporations and formed DD Marketing to use this skill on behalf of schools and nonprofits. Beverage companies and athletic shoe companies had long supported college sports programmes and during the 1980s began to put up the money for new high school scoreboards. Dan DeRose saw marketing opportunities that were still untapped. After negotiating his first Colorado Springs package deal in 1996, he went to work for the Grapevine-Colleyville School District in Texas. The district would never have sought advertising, its deputy superintendent told the Houston Chronicle, ‘if it weren’t for the acute need for funds’. DeRose started to solicit ads not only for the district’s hallways, stadiums and buses, but also for its rooftops – so that passengers flying in or out of the nearby Dallas–Forth Worth airport could see them – and for its voicemail systems. ‘You’ve reached GrapevineColleyville school district, proud partner of Dr Pepper’, was a message that DeRose
Your Trusted Friends 357
proposed. Although some people in the district were sceptical about the wild ideas of this marketer from Colorado, DeRose negotiated a $3.4 million dollar exclusive deal between the Grapevine-Colleyville School District and Dr Pepper in June of 1997. And Dr Pepper ads soon appeared on school rooftops. Dan DeRose tells reporters that his work brings money to school districts that badly need it. By pitting one beverage company against another in bidding wars for exclusive deals, he’s raised the prices being offered to schools. ‘In Kansas City they were getting 67 cents a kid before’, he told one reporter, ‘and now they’re getting $27.’ The major beverage companies do not like DeRose and prefer not to deal with him. He views their hostility as a mark of success. He doesn’t think that advertising in the schools will corrupt the nation’s children and has little tolerance for critics of the trend. ‘There are critics to penicillin’, he told the Fresno Bee. In the three years following his groundbreaking contract for School District 11 in Colorado Springs, Dan DeRose negotiated agreements for 17 universities and 60 public school systems across the US, everywhere from Greenville, North Carolina, to Newark, New Jersey. His 1997 deal with a school district in Derby, Kansas, included the commitment to open a Pepsi GeneratioNext Resource Center at an elementary school. Thus far, DeRose has been responsible for school and university beverage deals worth more than $200 million. He typically accepts no money upfront, then charges schools a commission that takes between 25 and 35 per cent of the deal’s total revenues. The nation’s three major beverage manufacturers are now spending large sums to increase the amount of soda that American children consume. Coca-Cola, Pepsi and Cadbury-Schweppes (the maker of Dr Pepper) control 90.3 per cent of the US market, but have been hurt by declining sales in Asia. Americans already drink soda at an annual rate of about 56 gallons per person – that’s nearly 600 12-ounce cans of soda per person. Coca-Cola has set itself the goal of raising consumption of its products in the US by at least 25 per cent a year. The adult market is stagnant; selling more soda to kids has become one of the easiest ways to meet sales projections. ‘Influencing elementary school students is very important to soft drink marketers’, an article in the January 1999 issue of Beverage Industry explained, ‘because children are still establishing their tastes and habits.’ Eight-year-olds are considered ideal customers; they have about 65 years of purchasing in front of them. ‘Entering the schools makes perfect sense’, the trade journal concluded. The fast food chains also benefit enormously when children drink more soda. The chicken nuggets, hamburgers and other main courses sold at fast food restaurants usually have the lowest profit margins. Soda has by far the highest. ‘We at McDonald’s are thankful’, a top executive once told the New York Times, ‘that people like drinks with their sandwiches.’ Today McDonald’s sells more Coca-Cola than anyone else in the world. The fast food chains purchase Coca-Cola syrup for about $4.25 a gallon. A medium Coke that sells for $1.29 contains roughly 9 cents’ worth of syrup. Buying a large Coke for $1.49 instead, as the cute girl behind the counter always suggests, will add another 3 cents’ worth of syrup – and another 17 cents in pure profit for McDonald’s.
358 Diet and Health
‘Liquid Candy’, a 1999 study by the Center for Science in the Public Interest, describes who is not benefiting from the beverage industry’s latest marketing efforts: the nation’s children. In 1978, the typical teenage boy in the US drank about 7 ounces of soda every day; today he drinks nearly three times that amount, deriving 9 per cent of his daily caloric intake from soft drinks. Soda consumption among teenaged girls has doubled within the same period, reaching an average of 12 ounces a day. A significant number of teenage boys are now drinking five or more cans of soda every day. Each can contains the equivalent of about ten teaspoons of sugar. Coke, Pepsi, Mountain Dew and Dr Pepper also contain caffeine. These sodas provide empty calories and have replaced far more nutritious beverages in the American diet. Excessive soda consumption in childhood can lead to calcium deficiencies and a greater likelihood of bone fractures. Twenty years ago, teenage boys in the US drank twice as much milk as soda; now they drink twice as much soda as milk. Soft-drink consumption has also become commonplace among American toddlers. About one-fifth of the nation’s one- and two-year-olds now drink soda. ‘In one of the most despicable marketing gambits’, Michael Jacobson, the author of ‘Liquid Candy’ reports, ‘Pepsi, Dr Pepper and Seven-Up encourage feeding soft drinks to babies by licensing their logos to a major maker of baby bottles, Munchkin Bottling, Inc.’ A 1997 study published in the Journal of Dentistry for Children found that many infants were indeed being fed soda in those bottles. The school marketing efforts of the large soda companies have not gone entirely unopposed. Administrators in San Francisco and Seattle have refused to allow any advertising in their schools. ‘It’s our responsibility to make it clear that schools are here to serve children, not commercial interests’, declared a member of the San Francisco Board of Education. Individual protests have occurred as well. In March of 1998, 1200 students at Greenbrier High School in Evans, Georgia, assembled in the school parking lot, many of them wearing red and white clothing, to spell out the word ‘Coke’. It was Coke in Education Day at the school, and a dozen Coca-Cola executives had come for the occasion. Greenbrier High was hoping for a $500 prize, which had been offered to the local high school that came up with the best marketing plan for Coca-Cola discount cards. As part of the festivities, Coke executives had lectured the students on economics and helped them bake a Coca-Cola cake. A photographer was hoisted above the parking lot by a crane, ready to record the human C-O-K-E for posterity. When the photographer started to take pictures, Mike Cameron – a Greenbrier senior, standing amid the letter C – suddenly revealed a T-shirt that said ‘Pepsi’. His act of defiance soon received nationwide publicity, as did the fact that he was immediately suspended from school. The principal said Cameron could have been suspended for a week for the prank, but removed him from classes for just a day. ‘I don’t consider this a prank’, Mike Cameron told the Washington Post. ‘I like to be an individual. That’s the way I am.’ Most school advertising campaigns are more subtle than Greenbrier High’s Coke in Education Day. The spiralling cost of textbooks has led thousands of American school districts to use corporate-sponsored teaching materials. A 1998
Your Trusted Friends 359
study of these teaching materials by the Consumers Union found that 80 per cent were biased, providing students with incomplete or slanted information that favoured the sponsor’s products and views. Procter & Gamble’s Decision Earth programme taught that clear-cut logging was actually good for the environment; teaching aids distributed by the Exxon Education Foundation said that fossil fuels created few environmental problems and that alternative sources of energy were too expensive; a study guide sponsored by the American Coal Foundation dismissed fears of a greenhouse effect, claiming that ‘the earth could benefit rather than be harmed from increased carbon dioxide’. The Consumers Union found Pizza Hut’s Book It! Program – which awards a free Personal Pan Pizza to children who reach targeted reading levels – to be ‘highly commercial’. About 20 million elementary school students participated in Book It! during the 1999–2000 school year; Pizza Hut recently expanded the programme to include a million preschoolers. Lifetime Learning Systems is the nation’s largest marketer and producer of corporate-sponsored teaching aids. The group claims that its publications are used by more than 60 million students every year. ‘Now you can enter the classroom through custom-made learning materials created with your specific marketing objectives in mind’, Lifetime Learning said in one of its pitches to corporate sponsors. ‘Through these materials, your product or point of view becomes the focus of discussions in the classroom’, it said in another, ‘… the centerpiece in a dynamic process that generates long-term awareness and lasting attitudinal change.’ The tax cuts that are hampering America’s schools have proved to be a marketing bonanza for companies like Exxon, Pizza Hut and McDonald’s. The money that these corporations spend on their ‘educational’ materials is fully tax-deductible. The fast food chains run ads on Channel One, the commercial television network whose programming is now shown in classrooms, almost every school day, to 8 million of the nation’s middle, junior and high school students – a teen audience 50 times larger than that of MTV. The fast food chains place ads with Star Broadcasting, a Minnesota company that pipes Top 40 radio into school hallways, lounges and cafeterias. And the chains now promote their food by selling school lunches, accepting a lower profit margin in order to create brand loyalty. At least 20 school districts in the US have their own Subway franchises; an additional 1500 districts have Subway delivery contracts; and nine operate Subway sandwich carts. Taco Bell products are sold in about 4500 school cafeterias. Pizza Hut, Domino’s and McDonald’s are now selling food in the nation’s schools. The American School Food Service Association estimates that about 30 per cent of the public high schools in the US offer branded fast food. Elementary schools in Fort Collins, Colorado, now serve food from Pizza Hut, McDonald’s and Subway on special lunch days. ‘We try to be more like the fast food places where these kids are hanging out’, a Colorado school administrator told the Denver Post. ‘We want kids to think school lunch is a cool thing, the cafeteria a cool place, that we’re “with it”, that we’re not institutional…’ The new corporate partnerships often put school officials in an awkward position. The Coca-Cola deal that DD Marketing negotiated for Colorado Springs
360 Diet and Health
School District 11 was not as lucrative as it first seemed. The contract specified annual sales quotas. School District 11 was obligated to sell at least 70,000 cases of Coca-Cola products a year, within the first three years of the contract, or it would face reduced payments by Coke. During the 1997–1998 school year, the district’s elementary, middle and high schools sold only 21,000 cases of Coca-Cola products. Cara DeGette, the news editor of the Colorado Springs Independent, a weekly newspaper, obtained a memorandum sent to school principals by John Bushey, a District 11 administrator. On 28, September 1998, at the start of the new school year, Bushey warned the principals that beverage sales were falling short of projections and that as a result school revenues might be affected. Allow students to bring Coke products into the classrooms, he suggested; move Coke machines to places where they would be accessible to students all day. ‘Research shows that vendor purchases are closely linked to availability’, Bushey wrote. ‘Location, location, location is the key.’ If the principals felt uncomfortable allowing kids to drink Coca-Cola during class, he recommended letting them drink the fruit juices, teas and bottled waters also sold in the Coke machines. At the end of the memo, John Bushey signed his name and then identified himself as ‘the Coke dude’. Bushey left Colorado Springs in 2000 and moved to Florida. He is now the principal of the high school in Celebration, a planned community run by The Celebration Company, a subsidiary of Disney.
Part IV
Localized Food Systems
16
Coming in to the Foodshed Jack Kloppenburg, Jr, John Hendrickson and G. W. Stevenson
For virtually everyone in the North and for many in the South, to eat is to participate in a truly global food system. In any supermarket here in Madison, Wisconsin, we can find tomatoes from Mexico, grapes from Chile, lettuce from California, apples from New Zealand. And, in what we take to be an indicator of a developing slippage between the terms ‘sustainable’ and ‘organic’, we can even buy organic blackberries from Guatemala (which may be organically produced, but in all likelihood are not sustainably produced if sustainable is understood to encompass more than on-farm production practices and any reasonable element of social justice). We cannot, however, count on finding Wisconsin-grown tomatoes, grapes, lettuce, strawberries or apples in any supermarket in Madison, even when those crops are in season locally. That food in the US travels an average of 1300 miles and changes hands half a dozen times before it is consumed (The Packer, 1992) is deeply problematic. What is eaten by the great majority of North Americans comes from a global everywhere, yet from nowhere they know in particular. The distance from which their food comes represents their separation from the knowledge of how and by whom what they consume is produced, processed and transported. If the production, processing and transport of what they eat is destructive of the land and of human community – as it very often is – how can they understand the implications of their own participation in the global food system when those processes are located elsewhere and so are obscured from them? How can they act responsibly and effectively for change if they do not understand how the food system works and their own role within it? Recognizing the ecological and social destructiveness of the globally based food system, a variety of analysts have suggested an alternative founded on respect for the integrity of specific socio-geographic places (Herrin and Gussow, 1989; Kneen, 1989; Berry, 1992; Crouch, 1993; Dahlberg, 1993; Friedmann, 1993; Gussow, 1993). Counterposed to the global food system in such analyses are self-reliant Reprinted from Kloppenburg J, Hendrickson J and Stevenson G W. 1996. Coming in to the foodshed. In Vitek W and Jackson W (eds). Rooted in the Land: Essays on Community and Place. Yale University Press, Haven and London, pp113–123.
364 Localized Food Systems
locally or regionally based food systems comprising diversified farms that use sustainable practices to supply fresher, more nutritious foodstuffs to small-scale processors and consumers to whom producers are linked by the bonds of community as well as economy. The landscape is understood as part of that community, and human activity is shaped to conform to knowledge and experience of what the natural characteristics of that place do or do not permit. We find this vision of people living well and responsibly with one another and with the land on which they are placed to be deeply appealing. In our effort to work toward realization of that vision, we have found the notion of the foodshed to be particularly useful in helping us to analyse the existing food system, to imagine the shapes an alternative might take and to guide our actions. It is our purpose in this essay to elaborate and extend that concept and to share out initial understandings of its utility. The term ‘foodshed’ was coined as early as 1929 (Hedden, 1929), but we were introduced to it by an encounter with the article ‘Urban foodsheds’, written by Arthur Getz (1991). The idea of a foodshed immediately triggered a wide range of unexpected insights and evocative associations. The intrinsic appeal the term had and continues to have for us derives in part from its relation to the rich and well-established concept of the watershed. How better to grasp the shape and the unity of something as complex as a food system than to graphically imagine the flow of food into a particular place? Moreover, the replacement of ‘water’ with ‘food’ does something very important: it connects the cultural (‘food’) to the natural (‘shed’). The term ‘foodshed’ thus becomes a unifying and organizing metaphor for conceptual development that starts from a premise of the unity of place and people, of nature and society. The most attractive attribute of the idea of the foodshed is that it provides a bridge from thinking to doing, from theory to action. Thinking in terms of foodsheds implies development of what we might call foodshed analysis, the posing of particular kinds of questions and the gathering of particular types of information or data. And foodshed analysis ought in turn to foster change. Not only can its results be used to educate, but we believe that the foodshed – no less than Gary Snyder’s watershed – is a place for organizing. In this unstable postmodern world, the foodshed can be one vehicle through which we reassemble our fragmented identities, reestablish community and become native not only to a place but to each other. In expanding on these points we will depart from Getz’s usage in one significant way. Getz defines the foodshed as ‘the area that is defined by a structure of supply’ and notes that ‘our most rudimentary map of a foodshed might cover the globe’ (Getz, 1991, p26). We want to establish an analytic and normative distinction between the global food system that exists now and the multiplicity of local foodsheds that we hope will characterize the future. Since we give the term ‘foodshed’ this normative meaning, ‘global foodshed’ is for us an oxymoron. Within the existing food system there already exist alternative and oppositionalist elements that could be the building blocks for developing foodsheds: food policy councils, community-supported agriculture, farmers’ markets, sustainable farmers, alternative consumers. We will use the term ‘foodshed’ to refer to the elements and properties of that preferred, emergent alternative.
Coming in to the Foodshed 365
A Foodshed in a Moral Economy Where are we now? We are embedded in a global food system structured around a market economy that is geared to the proliferation of commodities and the destruction of the local. We are faced with transnational agribusinesses whose desire to extend and consolidate their global reach implies the homogenization of our food, our communities and our landscapes. We live in a world in which we are ever more distant from one another and from the land, so we are increasingly less responsible to one another and to the land. Where do we go from here? How can we come home again? There can be no definitive blueprint for the construction of some preferred future Accordingly, we offer the foodshed not as a manifesto but as a conceptual vocabulary not as a doctrine but as a set of principles. Below we set out five principles that seem particularly important to us. We do not claim that these are either exhaustive or particularly original. We have drawn inspiration and insight from a wide variety of people whom we consider to be engaged – whether they know it or not – in foodshed work. We invite others to join in that work.
Moral Economy A foodshed will be embedded in a moral economy that envelops and conditions market forces. The global food system operates according to allegedly ‘natural’ rules of efficiency, utility maximization, competitiveness and calculated self-interest. The historical extension of market relations has deeply eroded the obligations of mutuality, reciprocity and equity that ought to characterize all elements of human interaction. Food production today is organized largely with the objective of producing a profit rather than with the purpose of feeding people. But human society has been and should remain more than a marketplace. E. P. Thompson (1966, p203) describes a ‘moral economy’ as exchange ‘justified in relation to social or moral sanctions, as opposed to the operation of free market forces’. Wendell Berry (1993, p14) points to similar ethical precepts when he writes of the need for ‘social and ecological standards’ to guide us toward the aims of human freedom, pleasure and longevity. The term ‘moral economy’ resonates for us and we use it here as a provisional shorthand phrase for the re-embedding of food production primarily within human needs rather than within the economist’s narrow ‘effective demand’ (demand backed by ability to pay). Adopting the perspective of the moral economy challenges us to view food as more than a commodity to be exchanged through a set of impersonal market relationships or a bundle of nutrients required to keep our bodies functioning. It permits us to see the centrality of food to human life as a powerful template around which to build non-market or extra-market relationships among persons, social groups and institutions who have been distanced from one another. The production
366 Localized Food Systems
and consumption of food could be the basis for the reinvigoration of familial, community and civic culture. We are all too well aware of the difficulty that will be involved in realizing this most fundamental principle of the foodshed. Nevertheless, we are encouraged by such innovations as community-supported agriculture (CSA) – ‘partnerships of mutual commitment’ between farmers and consumers (Van En and Roth, 1993). In CSA we have a concrete example of economic exchanges conditioned by pleasure, friendship, aesthetics, affection, loyalty, justice and reciprocity in addition to the factors of cost (not price) and quality.
The Commensal Community CSA also serves as an illustration of our expectation that the moral economy of a foodshed will be shaped and expressed principally through communities. In The Left Hand of Darkness novelist, Ursula Le Guin (1969), imagines a society whose basic social unit is the Commensal Hearth. The word ‘commensal’ (from the Latin mensa, table) refers to those who eat together, and the word ‘commensalism’ is used in ecology to designate a relationship between two kinds of organisms in which one obtains food from the other without damaging it. We imagine foodsheds as commensal communities that encompass sustainable relationships both between people (those who eat together) and between people and the land (obtaining food without damage). In human terms, building the commensal community means establishment or recovery of social linkages beyond atomistic market relations through the production, exchange, processing and consumption of food. Such social construction will occur among producers, between producers and consumers, and among consumers. Witness the recent proliferation of small-scale cooperative and collective production and marketing strategies implemented by farmers to meet growing consumer interest in organic, locally grown, non-industrial food. Other examples of such non-market cooperation from the upper Midwest include the mutual assistance commitments made within associations of small-scale producers of specialty cheeses, and the information and technology exchange that occurs through networks of farmers experimenting with the rotational grazing of dairy animals as an alternative to conventional, capital-intensive, confinement milk production systems (Hassanein and Kloppenburg, 1994). With respect to new relationships between producers and consumers, emerging cooperative linkages between fresh vegetable growers and neighbourhood restaurants and consumer coops parallel the birth of CSA and the revitalization of farmers’ markets (Waters, 1990; Hendrickson, 1994). Among consumers themselves, buying clubs, community gardens and changing patterns of food purchase reflect growing concern with the social, economic, ethical, environmental, health and cultural implications of how they eat. While concrete precursors of what could conceivably become commensal communities are now visible, commitment to a moral economy requires that we work to
Coming in to the Foodshed 367
make those communities as inclusive as possible. The sustainable agriculture movement has so far tended to be ‘farm-centric’ (Allen and Sach, 1991, p587) ‘and has not yet seriously engaged issues of race, class, and gender even within – much less outside – rural areas’. Hunger in the city is indeed an agricultural issue (Ashman et al, 1993; Clancy, 1993). The commensal community should confront and address the need not just for equitable access to food but also for broader participation in decision making by marginalized or disempowered groups. That progress is possible is evidenced by the activities of the Hartford Food System, which has made a priority of linking farmers directly to low-income consumers (Winne, 1994) and by initiatives to foster the acceptance of food stamps at farmers’ markets. The ‘food policy councils’ now being created in a variety of US and Canadian cities are indicators of the plausibility of addressing foodshed issues by relating food affairs to other fundamental community dimensions such as economic development and nutrition and public health (Dahlberg, 1993; Toronto Food Policy Council, 1993). Finally, the standards of a commensal community require respect and affection for the land and for other species. It is through food that humanity’s most intimate and essential connections to the Earth and to other creatures are expressed and consummated. In the commensal community, production, processing, distribution, consumption and waste disposal will be organized so as to protect and, where necessary, to regenerate the natural resource base. Responsible stewardship will involve sustainable cropping and humane livestock practices, reduced use of nonrenewable energy sources and a commitment to recycling and reuse.
Self-protection, Secession and Succession The dominant dynamics of the global food system actively erode both moral economy and community. We agree with those who believe that this destructiveness is an inherent property of that system and that what is needed is fundamental transformation rather than simple reform (Allen and Sachs, 1991; Orr, 1992; Berry, 1993; Friedmann, 1993). Still, given the current dominance of the existing world food economy, people working toward foodshed objectives will need to carve out insulated spaces in which to maintain or create alternatives that will eventually bring substantive change. In opposition to the extension of the market system, there have always been examples of what Friedmann (1993, p218) calls ‘movement(s) of self-protection’. From the Luddites of 19th century Britain to the Zapatistas of contemporary Chiapas, we have seen continuous refusal to submit without contest to the dictates of the globalizing food system. At the margins of consumer society and in the interstices between McDonald’s and Monsanto and Philip Morris are all manner of alternative producers and eaters – Amish, vegetarians, rotational graziers, seed savers, food coop members, perennial polyculturists, bioregionalists, home gardeners, biodynamicists – who are producing and reproducing a rich set of alternative agrofood possibilities.
368 Localized Food Systems
What these diverse people and groups share is that their activities and commitments involve various degrees of disengagement from the existing food system and especially from the narrow commodity and market relations on which it is based. We follow Berry (1993, pp17–18) and Orr (1992, p73) in our conviction that a fundamental principle of the foodshed is the need for ‘secession’. This principle is based on a strategic preference for withdrawing from and/or creating alternatives to the dominant system rather than challenging it directly. Certainly, in many circumstances direct opposition to elements of the global food economy is appropriate and necessary (the situation in Chiapas, or the current manipulation of the Green Bay Cheese Exchange by food corporations such as Kraft and Pizza Hut). A primary strategy of the secession principle is ‘slowly hollowing out’ (Orr, 1992, p73) the structures of the global food system by reorganizing our own social and productive capacities. This is essentially what grazier groups are engaged in as they rediscover their own, indigenous capacity for producing the knowledge they need to be ‘grass farmers’, and as they withdraw from the agribusiness firms and agricultural scientists who have been doing their thinking for them (Hassanein and Kloppenburg, 1994). A second and corollary point is that of ‘succession’, or the conscious and incremental transfer of resources and human commitments from old food-associated relationships and forms to new ones. Neither people nor institutions are generally willing or prepared to embrace radical change. The succession principle finds expression in a strategy of ‘slowly moving over’ from the food system to the foodshed. Food presents people with hundreds of small opportunities to take increasingly important steps away from the global market economy and toward the moral economy. An example is the consumer who decides not to purchase milk produced using recombinant bovine growth hormone (rBGH). While the motivation for that initial, simple step may be narrowly based on personal health considerations, the potential is there for making further connections. Once the link between rBGH and Monsanto is made, the consumer may become aware of the corporate/ chemical/food link more generally and begin moving a progressively higher percentage of the household food budget into purchases from alternative food sources. Similarly, restaurants or schools may be encouraged to purchase more of their food supplies from local producer cooperatives as these foodshed alternatives generate capacity.
Proximity (Locality and Regionality) We see certain key spatial components to the secession and succession dynamics as characterizing the foodshed. If mitigation of the deleterious effects of distancing is the central challenge posed by the operation of the global food system, then greater attention to proximity – to that which is relatively near – should be an appropriate response. But apart from the principle of relative proximity, it is not clear precisely
Coming in to the Foodshed 369
where the revised boundaries ought to be drawn. The limits of a foodshed will be a function of the shapes of multiple sets of boundaries; that is, of the aggregated boundaries of the climatic features, plant communities, soil types, ethnicities, cultural traditions, culinary patterns and the like, of which foodsheds are composed. Hence we identify proximity rather than locality or regionality per se as a fundamental principle of the foodshed. Though their precise boundaries will rarely be sharply defined, we insist that foodsheds are socially, economically, ethically and physically embedded in particular places. We do not, however, imagine foodsheds as isolated, parochial entities. While they might be – in Marge Piercy’s (1976) term – as ‘ownfed’ as possible, we see them as self-reliant rather than self-sufficient. Self-reliance implies the reduction of dependence on other places but does not deny the desirability or necessity of external trade relationships (Friedmann, 1993, p228; Gussow, 1993, p14). For too long, however, trade in the global food economy has meant farmers selling lowvalue commodities to distant markets and processors and the subsequent reimportation of finished food products at high prices. In the foodshed, efforts would be made to increase the level of local and intra-regional food production, processing and distribution and so to retain economic value and jobs. Since economic concentration is a prime engine of distancing, secessionist and successionist alternatives ought to be built around small and mid-sized enterprises (dairies, cheese factories, smithies, greenhouses, canneries, restaurants, specialty markets) capable of responding affirmatively to the opportunities and responsibilities of the emergent commensal community. The self-reliance associated with proximity is closely linked to both social and environmental sustainability. A community that depends on its human neighbours, neighbouring lands and native species to supply the majority of its needs must ensure that the social and natural resources it utilizes to fulfil those needs remain healthy. A consequence of proximate self-reliance is that social welfare, soil and water conservation, and energy efficiency become issues of immediate practical concern. For example, it is difficult for most city dwellers to be concerned about preserving farmland unless the destruction of farmland directly affects their food supply, or unless they know and care for the paving over of the land. Awareness of and affection for one’s place can forestall the ethical distancing so characteristic of the global food system. In the foodshed, collective responsibility for stewardship of people and of the land becomes a necessity rather than an optional virtue.
Nature as Measure We understand the foodshed to be a socio-geographic space – human activity embedded in the natural integument of a particular place. That human activity is necessarily constrained in various ways by the characteristics of the place in question.
370 Localized Food Systems
Ignoring those natural constraints or overriding them with technology is one of the besetting sins of the global food system, the ecological destructiveness of which is now unambiguously apparent even to its apologists. In the foodshed, natural conditions would be taken not as an obstacle to be overcome but as a measure of limits to be respected. While restraints on human activity will indeed often be required, to interpret natural parameters in terms of ‘deficiency’ rather than ‘capacity’ is to fail to transcend the conventional industrial mindset. Nature may be understood not just as a set of limits but as an exemplar of the possible, as an almanac of potential models for human conduct and action (Jackson, 1980; Orr, 1992, p33; Quinn, 1993). For example, from the perspective of the foodshed, one answer to Berry’s (1987, p146) query, ‘What will nature help us do here?’ points toward the development of regional palates based on ‘moving diets’ of locally and seasonally available food. Who knows what lessons nature may offer us should we free ourselves to see its ‘capacity’? These opportunities are by no means obvious. They must be discovered in intimate, extended conversation with the land. By acting with respect and affection for the natural world, we may begin to produce and eat in harmony with and within the rhythms and patterns of the places in which we live. Ironically, much foodshed analysis will necessarily involve examination and explication of the structure and dynamics of the existing global food system. That food system exists and is a powerful and dominating structure indeed. Secession – even for so solitary a group as the Amish – can now be only partial and contingent. Emergent elements of what might become foodsheds are presently embedded in and often constrained by the rules, interests and operations of regional and global actors and institutions. Aldo Leopold (1970, p137) suggested that we need to learn to ‘think like a mountain’; that is, to think ecologically, to engage the hidden and unlooked-for connections among the elements of a system or between different levels of a system. Until and unless we know where we are in the larger social and political ecology of the global food system, we may not be able to move effectively toward realization of a foodshed locally. We do not necessarily have to accept the demands of the global food system, but we must understand and realistically address the constraints it imposes if we are to identify the space it permits for secessionist activities or simple self-protection. Foodshed analysis will not eschew engagement with issues at the national or even the global level. It will ask that this extra-local investigation serve the objective of framing the prospects for successfully implementing concrete initiatives or changes within a particular socio-geographic place. Foodshed analysis will involve investigation of the existing food system in order to inform strategic decisions regarding opportunities for self-protection and secession. Such analysis should include the identification, celebration and study of existing and emergent alternatives to the food system. Ultimately foodshed work should seek to link such elements in a system of mutual support and integration, with the objective of fostering emergence of a truly alternative system: the foodshed. While as a general
Coming in to the Foodshed 371
rule it is advisable to think and act as proximately as we can, we must recognize that the appropriate and necessary locus of both thought and action in the foodshed may sometimes be regional, national or even global. Concretely, what would foodshed analysis entail? In simplest terms, it means answering Getz’s basic question, ‘Where is our food coming from and how is it getting to us?’ For us, a substantial part of the appeal of the term ‘foodshed’ has to do with the graphic imagery it evokes: streams of foodstuffs running into a particular locality, their flow mediated by the features of both natural and social geography. Measuring the flow and direction of these tributaries and documenting the many quantitative and qualitative transformations that food undergoes as it moves through time and space toward consumption is the central methodological task of foodshed analysis. What unit of analysis is appropriate for such study; what, after all, are the boundaries of a foodshed? What kinds of data or information ought to be collected? Answers to these questions will vary as a function of who is engaging in the analysis and what their objectives and resources are. The foodshed is not a determinate thing; foodshed analysis will be similarly variable. It may involve collection of data on local exports of corn or the capacity of the local landfill, on the distribution of edible plant species or the patterns of human hunger, on the organization of harvest festivals or the composition of the county board, on the content of school lunch menus or the forage preferences of diary cows. Foodshed analysis will not be constructed to conform to some predetermined theoretical and methodological framework, but will be constituted by the concrete activities of those who seek to learn about the food system in order to change it. Many such projects have been completed or are under way at a variety of levels. The Cornucopia Project, organized by Rodale Press in Pennsylvania in the 1980s, chose states as its unit of analysis and emphasized collection of aggregate state-level data suited to the project’s objective of raising the general public’s awareness of the vulnerabilities of the national food system through state-specific reports and publicity (Rodale, 1982; Rural Wisconsin Cornucopia Task Force, 1982). Also at the state level, several studies by nutritionists have been undertaken in order to explore the parameters and implications for human health of sustainable, regional diets (Herrin and Gussow, 1989; Hamm, 1993). Using cities as their socio-geographic framework, a variety of ‘food policy councils’ have been created to address issues of sustainability and equity in the food system (Hartford Food System, 1991; Dahlberg, 1993; Toronto Food Policy Council, 1993). The students and staff at several colleges have taken their own institutions as the basic unit of analysis and explored the rationale and mechanisms for getting commitments from their colleges to buy local food (Bakko and Woodwell, 1992; Valen, 1992). Local food projects at Hendrix College in Arkansas and Saint Olaf and Carleton colleges in Minnesota were successful in reorienting food purchasing patterns to more proximate sources. The degree of resolution characteristic of the lens of foodshed analysis can become very fine grained indeed. One of the most impressive and revealing analyses we have encountered is a self-study
372 Localized Food Systems
of a personal foodshed – ‘from gut to ground’ (Peterson, 1994) – that explores individual consumption and its implications for personal responsibility in the global food system. An example of foodshed analysis that focuses on the urban poor is an initiative undertaken under the auspices of the Southern California Interfaith Hunger Coalition (IHC). The IHC’s report, Seeds of Change: Strategies for Food Security for the Inner City, is an ambitious and finely realized effort to take an ‘integrated, wholesystems approach’ to assessing the need and prospects for reforming the existing food system in a specific and delimited place (Ashman et al, 1993). The IHC document is also of interest because the research and analysis for the report was undertaken largely by students and faculty from the University of California at Los Angeles. Much criticism has been directed toward universities (especially toward the land-grant colleges) for their subservience to industrial interests and their failure to orient knowledge production to local or regional needs. Seeds of Change is striking evidence that academics can work effectively with advocacy groups oriented to transformation of the food system. Although few of those whose efforts we have described think of what they do as ‘foodshed analysis’, we feel they are moving in directions similar to ours. To the extent that these diverse projects and undertakings are complementary, they constitute a rich set of conceptual and methodological resources for thinking about and assessing the nature and structure of the global food system in which we are now embedded, and for helping us to consider how and where we can realistically expect to make changes.
Radical Reformism It is apparent to increasing numbers of people that fundamental changes are needed in the global food system. Of course, we see that the question of food is simply a specific case of the general failure of late capitalism, or post-industrialism or postmodernism or whatever you wish to call this period of intense commodification and of accelerating distancing from one another and from the Earth. We could equally well be calling for fundamental changes in the global health system, the global industrial system, the global political system, the global monetary system or the global labour system. Ultimately, what sustainability requires of us is change in global society as a whole. We need the recovery and reconstitution of community generally, not simply in relation to food. Although we may strive to think like mountains, we must act as human beings. To start the global task to which we are called, we need a specific place to begin, a specific place to stand, a specific place to initiate the small, reformist changes that we can only hope may some day become radically transformative. We start with food. Given the centrality of food in our lives and its capacity to connect us materially and spiritually to one another and to the Earth, we believe
Coming in to the Foodshed 373
that it is an appropriate place to begin. We offer the term ‘foodshed’ to encompass the physical, biological, social and intellectual components of the multidimensional space in which we live and eat. We understand the foodshed as a framework for both thought and action. If our use of the term has any virtue, perhaps it is to help people see the relatedness of apparently disparate elements, and to perceive the complementarity of different but parallel initiatives for change. We also think it useful to make a semantic distinction between where we are now and where we wish to be in the future. Thinking and acting in terms of the foodshed is an indication of our commitment to work not simply to reform the food system but to transcend that system entirely. And while a system can be anywhere, the foodshed is a continuous reminder that we are standing in a specific place; not anywhere, but here. We need to keep place firmly in our minds and beneath our feet as we talk and walk our way toward a transformed future. Because the path is long and because we must build it as we go – the foodshed offers a project, not a blueprint – our actions will be ‘slow small adjustments in response to questions asked by a particular place’ (Berry, 1990, p121). We share Orr’s (1992, p1) hope for ‘a rejuvenation of civic culture and the rise of an ecologically literate and ecologically competent citizenry who understand global issues, but who also know how to live well in their places’. If we are to become native to our places, the foodshed is one way of envisioning that beloved country.
References Allen, P. L. and Sach, C. E. 1991. ‘The social side of sustainability’, Science as Culture, 2(13): 569– 590 Ashman, L., de la Vega, J., Dohan, M., Fisher, A., Hippler, R. and Romain, B. 1993. Seeds of Change: Strategies for Food Security in the Inner City, Interfaith Hunger Coalition, Los Angeles Bakko, E. B. and Woodwell, J. C. 1992. ‘The campus and the biosphere initiative at Carleton and Saint Olaf Colleges’, in Egan, D. J. and Orr, D. W. (eds) The Campus and Environmental Responsibility, Jossey-Bass Publishers, San Franscisco Berry, W. 1987. Home Economics, North Point Press, San Francisco Berry, W. 1990. What Are People For? North Point Press, San Francisco, CA Berry, W. 1992. ‘Conservation is good work’, Amicus Journal, Winter, pp33–36 Berry, W. 1993. Sex, Economy, Freedom and Community, Pantheon Books, New York Clancy, K. L. 1993. ‘Sustainable agriculture and domestic hunger: Rethinking a link between production and consumption’, in Allen, P. (ed) Food for the Future, John Wiley, New York Crouch, M. 1993. ‘Eating our teachers: Local food, local knowledge’, Raise the Stakes, Winter, pp5–6 Dahlberg, K. 1993. ‘Regenerative food systems: Broadening the scope and agenda of sustainability’, in Allen, P. (ed) Food for the Future, John Wiley, New York Friedmann, H. 1993. ‘After Midas’s feast: Alternative food regimes for the future’, in Allen, P. (ed) Food for the Future, John Wiley, New York, pp213–233 Getz, A. 1991. ‘Urban foodsheds’, Permaculture Activist, 24: 26–27 Gussow, J. D. 1993. ‘But what can I eat in March?’, Natural Farmer, Spring, pp14–15 Hamm, M. W. 1993. ‘The potential for a localized food supply in New Jersey’, presented at the conference on Environment, Culture and Food Equity, Pennsylvania State University, 3–6 June
374 Localized Food Systems Hartford Food System 1991. ‘Solutions to hunger in Hartford: Rebuilding our local food system, 1991 action guide’, Hartford Food System, Hartford Hassanein, N. and Kloppenburg, J., Jr 1994. ‘Where the grass grows again: Knowledge exchange in the sustainable agriculture movement’, unpublished Hedden, W. P. 1929. How Great Cities Are Fed, D. C. Heath, Boston Hendrickson, J. 1994. ‘Community supported agriculture’, Direct Marketing, no 41, University of Wisconsin, Madison – Extension Herrin, M. and Gussow, J. D. 1989. ‘Designing a sustainable regional diet’, Journal of Nutrition Education, December, pp270–275 Jackson, W. 1980. New Roots for Agriculture, Friends of the Earth, San Francisco Kneen, B. 1989. From Land to Mouth: Understanding the Food System, NC Press, Toronto Le Guin, U. K. 1969. The Left Hand of Darkness, Ace Books, New York Leopold, A. 1949, reprint 1970. A Sand County Almanac, Ballantine Books, New York Packer, The 1992. ‘From grower to consumer: An elaborate odyssey’, The Packer, 13 June, p11 Orr, D. 1992. Ecological Literacy: Education and the Transition to a Postmodern World. State University of New York Press, Albany, NY Peterson, R. 1994. ‘From gut to ground: A personal case study of a foodshed’, unpublished Piercy, M. 1976. Woman on the Edge of Time, Fawcett-Crest, New York Quinn, D. 1993. Ishmael, Bantam Books, New York Rodale, R. 1982. The Cornucopia Papers, Rodale Press, Emmaus Rural Wisconsin Cornucopia Task Force 1982. The Wisconsin Cornucopia Project: Toward a Sustainable Food and Agriculture System, Rural Wisconsin Cornucopia Task Force, Madison Thompson, E. P. 1966. The Making of the English Working Class, Vintage Books, New York Toronto Food Policy Council 1993. Developing a Food System Which is Just and Environmentally Sustainable, Toronto Valen, G. L. 1992. ‘Hendrix College local food project’, in Egan, D. J. and Orr, D. W. (eds) The Campus and Environmental Responsibility, Jossey-Bass Publishers, San Franscisco Van En, R. and Roth, C. 1993. ‘Community supported agriculture’, University of Massachusetts Cooperative Extension System, Amherst Waters, A. 1990. ‘The farm–restaurant connection’, in Clark, R. (ed) Our Sustainable Table, North Point Press, San Francisco Winne, M. 1994. ‘Community food planning: An idea whose time has come’, Seedling, 1–4: 8
17
Farm Costs and Food Miles: An Assessment of the Full Cost of the UK Weekly Food Basket J. Pretty, A. S. Ball, T. Lang and J. I. L. Morison
Evaluating Farm and Food Systems in Industrialized Countries Recent years have seen growing concern about the sustainability of agricultural and food systems and the unintended side effects that can be imposed on environment and human health (Conway and Pretty, 1991; Pretty, 1995, 2002; NRC, 2000; Uphoff, 2002; Lang and Heasman, 2004). There are many perspectives on what constitutes sustainability and how it can be applied equally across agricultural contexts (Naess, 1992; Dobson, 1999; Pretty et al, 2003a). As a result, a variety of analytical approaches have been developed, including energy accounting (Leach, 1976; Cormack and Metcalfe, 2000; Carlsson-Kanyama et al, 2003), economic valuation of non-marketed goods and services (Pearce and Turner, 1990; Daily, 1997; Costanza et al, 1997; Pretty et al, 2000, 2001), ecological footprints (Rees, 2003), carbon accounting (Smith and Smith, 2000; Lal et al, 2004) and the use of indicators for sustainability (Lewis et al, 1997; Bailey et al, 1999; OECD, 1998; MAFF, 2000; Caporali et al, 2003). Most of these approaches have focused on environmental impacts up to the farm gate and have not assessed the additional environmental effects of transporting foodstuffs via processing to retail outlets and then to the point of consumption. Evidence is mounting that these farm to plate transport costs, or ‘food miles’ (Raven and Lang, 1995; Subak, 1999; Jones, 2001; Pirog et al, 2001; Garnett, 2003; Stephens et al, 2003), could be substantial. In addition, there is growing interest in local and regionalized food supply systems and the potential social and environmental benefits they could bring (Marsden et al, 2000; Cowell and Parkinson, 2003; Morris and Buller, 2003; Sage, 2003; Winter, 2003). Reprinted from Food Policy, 30(1), Pretty J, Lang T, Morison J, Ball A S. 2005. Farm costs and food miles: An assessment of the full cost of the UK weekly foods basket, pp1–20. Copyright Elsevier (2005).
376 Localized Food Systems
In this study, we assess the full cost of the UK weekly food basket by analysing the environmental costs to the farm gate for each major food commodity and the additional environmental costs of transporting foods to retail outlets and then to consumers’ homes, and the cost of disposal of wastes. We then develop various production and transport scenarios to assess the best cost-avoidance options, and indicate where policy priorities should lie in the light of the findings. The externalities arising from farm and food systems point to some important policy priorities for industrialized countries in Europe, North America and the OECD, where there are many similarities in both farm technologies and distribution systems for food. Important drivers that may differ from country to country include the quality and types of food eaten (as costs vary greatly according to commodity), the amount of farm inputs used that result in external costs, the average distance travelled by food from farm to plate and the proportion of foods imported that impose externalities in other countries, thereby effectively exporting costs (Lang and Heasman, 2004). Some of these costs could be avoided with the adoption of more sustainable farming and food distribution systems. The external benefits of agricultural systems include a wide range of unpriced goods and services, such as recreation and amenity value of landscapes, water holding capacity, carbon sequestration, wildlife and biodiversity and contributions to rural economies and communities (Bollman and Bryden, 1997; Pretty, 2002, 2004; Renwick et al, 2002; Dobbs, 2004). We do not address here the contributions that agricultural and land use systems make to positive externalities and so do not seek to make any cost–benefit comparisons. There is a danger that this will appear to bias our analysis against modern agriculture. These positive side effects are known to be substantial: for example, some 550 million day-visits are made to the countryside each year by urban people who derive value and pleasure from the farmed landscape. However, no study has yet put an aggregate value on the positive externalities. In this study, we therefore do not make any judgement about the comparative differences in contribution that conventional and organic farms make to positive externalities.
Environmental Costs to the Farm Gate The environmental costs of farming have been recently assessed for the UK (Pretty et al, 2000, 2001; Hartridge and Pearce, 2001; EA, 2002), Germany (Waibel et al, 1999) and the US (Subak, 1999; Tegtmeier and Duffy, 2004). For this study, earlier data on UK farm externalities (Pretty et al, 2000, 2001; Hartridge and Pearce, 2001; EA, 2002) were reassessed by incorporating new data on eutrophication, greenhouse gas costs, energy embodied in inputs and BSE (Renwick et al, 2002; Pretty et al, 2003b; Defra, 2004). The methods used in these studies are largely costbased rather than demand-based and involve the use of replacement costs (e.g. hedgerows, wetlands), substitute goods (e.g. bottled water), loss of earnings (e.g. due to ill-health) and clean-up costs (e.g. removal of pesticides and nitrate from drinking
Farm Costs and Food Miles 377
water). Demand-based methods using willingness to pay (or be compensated) have tended to be used in studies to put a value on landscapes (Hanley et al, 1998). One problem with all such studies is the difficulty of baselines and absolute costs. For example, if there were no livestock, then methane costs would be very much reduced. But if there were no agriculture, then there would still be an amenity value arising from the landscape. Thus these costs of agriculture are relative to an artificial baseline of zero. For our purposes here, the comparison between different agricultural systems (conventional and organic) provides an escape from this artificiality. The UK studies indicate that total agricultural environmental and health costs are some £1514 million (M) for the year 2000 (35 per cent lower than originally calculated in Pretty et al, 2000). Some costs remain impossible to assess, such as antibiotic resistance arising from prophylactic use in livestock systems and the chronic health effects of pesticides, and these are not included. In Table 17.1, we compare the external costs of the current agricultural system with those that would arise were the whole of the UK farmed with organic production systems. The choice of this scenario is not because organic is the only form of agricultural system that is more sustainable than current practices, but because it has a well-defined system of standards (EC Regulation 2092/91; FAO/WHO, Table 17.1 The negative externalities of UK agriculture (year 2000) Source of adverse effects
Actual costs from Scenario: costs as if current agriculture whole of UK was (£M yr–1) organic (£M yr–1)
Pesticides in water
143.2
0.0
Nitrate, phosphate, soil and Cryptosporidium in water
112.1
53.7
Eutrophication of surface water
79.1
19.8
Monitoring of water systems and advice
13.1
13.1
Methane, nitrous oxide, ammonia emissions to atmosphere
421.1
172.7
Direct and indirect carbon dioxide emissions to atmosphere
102.7
32.0
59.0
24.0
Off-site soils erosion and organic matter losses from soils Losses of biodiversity and landscape values
150.3
19.3
Adverse effects to human health from pesticides
1.2
0.0
Adverse effects to human health from micro-organisms and BSE
432.6
50.4
£1514.4
£384.9
Totals
Sources: Adapted from Pretty et al, 2000; Hartridge and Pearce, 2001; EA, 2002
378 Localized Food Systems
2001; IFOAM, 2000). Organic agriculture is a defined and certified system of agricultural production that seeks to promote and enhance ecosystem health whilst minimizing adverse effects on natural resources. It is seen not just as a modification of existing conventional practices, but as a restructuring of whole farm systems (Lampkin and Padel, 1994; FiBL, 2000; Scialabba and Hattam, 2002; Caporali et al, 2003; Reganold, 2004). In 2003, there were 4104 organic farms in the UK covering some 741,000ha (Defra, 2003). We used standard organic protocols to estimate the contribution that would be made to total costs by each of the ten sectors listed in Table 17.1. Pesticide costs arising from drinking water contamination and adverse effects on human health are assumed to fall to zero under an organic farming regime, as are any costs associated with BSE. Most of the other sectors would see declines in costs compared with conventional farming, but not to zero. Our assumptions on these are as follows: 1 2
3 4 5
for drinking water, nitrate costs are assumed to fall by 20 per cent, phosphate and soil losses by 75 per cent, zoonoses by 20 per cent, eutrophication by 75 per cent, with monitoring costs remaining the same; for gaseous emissions, methane costs from livestock are assumed to fall by 5 per cent, ammonia by 25 per cent, nitrous oxide by 80 per cent, carbon dioxide from fuel use remains the same and indirect emissions through reduced use of fertilizers and pesticides by 88 per cent; for soil costs, off-site damage is assumed to fall by 20 per cent and carbon dioxide losses in organic matter by 75 per cent; for biodiversity and landscape losses, costs are assumed to fall by 75 per cent for wildlife and by 90 per cent for hedgerows losses, though remain the same for bee colonies; for micro-organisms and disease-agents, costs are assumed to fall by 75 per cent.
We estimated that a complete switch to organic agriculture could lead to cost-avoidance (i.e. benefits compared with current agricultural systems) of £1129M yr–1. These aggregate costs were used to calculate the costs for each of the 12 major arable, horticulture and livestock food commodities produced in the UK (cereals, potatoes, oil seed rape, sugar beet, fruit, vegetables, beef/veal, pork, poultry, mutton/lamb, milk and eggs). We assessed 19 categories of environmental costs for each of these 12 commodities and calculated the relative contribution of each commodity to each cost category. In some cases, there is only one source for a problem (e.g. BSE from cattle); in others, there are multiple sources (e.g. nitrate from crops and livestock systems). We used various Defra data sets on area devoted to each commodity, on animal numbers, on input-use and on emissions to calculate these proportional contributions from each commodity (mean values taken for 1999–2001). In the UK, there are 4.89M ha of arable and 6.67M ha of grassland (not including rough and hill grazing).
Farm Costs and Food Miles 379
The basis for the allocations of each of the categories of negative externalities to the 12 crop and livestock commodities were as follows (see Pretty et al, 2000, 2001 for full details and references for each category): 1 2 3 4 5 6 7
8 9 10
11 12 13 14 15 16 17
Of all pesticide costs, 80 per cent were allocated in proportion to area of each arable crop and the remaining 20 per cent evenly spread across all livestock categories. Nitrate costs were allocated in proportion to area of each crop commodity and grassland for livestock. Phosphate and soil erosion costs were allocated mainly to arable crops (91 per cent), with an allocation to pigs for leaching (9 per cent). One third of Cryptosporidium costs were allocated to each of milk, beef and sheep, as the pathogen does not occur in pigs or poultry. Eutrophication costs were allocated in proportion to area of crops and grassland. Monitoring costs were allocated in proportion to area of all crops and grass. Some 89 per cent of agricultural methane emissions arise from enteric animals (75 per cent from cattle, 25 per cent from sheep), while the remaining 11 per cent arises from manures of all animals (costs are equally allocated); and thus milk is calculated to contribute 35 per cent to methane costs, beef/veal 35 per cent, mutton/lamb 25 per cent, and pork and poultry 2.5 per cent each. Ammonia costs arising from livestock wastes were allocated 20 per cent each to milk, beef, pork, poultry and sheep. Nitrous oxide costs were allocated in proportion to area of crops and grassland. Carbon emitted from fossil fuel use (mostly for vehicles) was in proportion to area of crops and grassland, with costs adjusted up (double their proportional contribution) for pigs, poultry and eggs (owing to energy used in housing) and down by half for sheep (which are mostly outdoors). Indirect energy costs arising from the manufacture of pesticides and fertilizers were allocated in proportion to the areas of crops and grassland. Off-site soil erosion costs were allocated in proportion to the areas of crops and grass. Organic matter carbon losses were allocated in proportion to just arable area (it is assumed that losses from grassland are negligible). Biodiversity and wildlife costs were allocated in proportion to the area of crops and grassland. Costs arising from losses of landscape features were allocated in proportion to area, with greater losses of hedgerows assumed to occur in arable rather than under beef/sheep. Bee colony losses were proportional to just arable area. The costs arising from acute pesticide adverse effects were allocated to 50 per cent for sheep dips, 40 per cent for cereals and the remainder spread amongst remaining crops.
380 Localized Food Systems
18 Some 75 per cent of the costs to consumers from outbreaks are assumed to arise after the farm gate, and of the remaining quarter pathogenic outbreaks in food, some 90 per cent are from livestock produce and 5 per cent each from fruit and vegetables. 19 BSE and new variant CJD costs were allocated to cattle alone. The total costs arising from the cultivation and raising of each of the 12 commodities are shown in Table 17.2, together with the unit costs per kg, litre or dozen eggs using average UK production data for 1998–2001 (Table 17.2). The same series of calculations are shown for an organic production scenario. On a per kg basis, livestock produce imposes the greatest costs: beef/veal 64.8p kg–1, mutton/lamb 43.6p kg–1, pork 12.8p kg–1, poultry 5.68p kg–1. Oil seed rape imposes the highest costs for arable and horticultural produce (3.45p kg–1), followed by cereals (1.72p kg–1), fruit (1.44p kg–1), vegetables (0.61p kg–1), potatoes (0.42p kg–1) and sugar beet (0.22p kg–1). Some of these external costs are a significant proportion of the price received for commodities. For example, the 1.72p kg–1 external cost for cereals represents a value of 17.7 per cent of the average UK price of wheat in the first half of 2004; the 3.96p dozen eggs–1 is 6.3 per cent of average Table 17.2 External costs to the farm gate for 12 food commodities grown and raised in the UK Produce
External costs from conventional agriculture
Scenario: as if whole of UK was organic
Proportional change in external Total external Unit external Total external Unit external costs from cost costs cost cost –1 –1 –1 –1 conventional to (£ M yr ) (p kg ) (£ M yr ) (p kg ) organic (%)
Cereals
377.5
1.72
71.1
0.32
–18.6
Potato
28.2
0.42
3.5
0.05
–11.9
Oil seed rape
49.9
3.54
9.7
0.69
–19.5
Sugar beet
20.6
0.22
3.7
0.04
–18.2
4.6
1.44
0.8
0.25
–17.4
17.6
0.61
3.0
0.10
–16.4
Fruit Vegetables Beef/veal
441.9
64.79
82.5
12.09
–18.7
Pork
127.3
12.81
37.6
3.79
–29.6
87.5
5.68
29.4
1.91
–33.6
157.8
43.57
59.0
16.30
–37.6
Poultry Mutton/lamb
–1
–1
(p litre ) Milk
171.2
1.22
(p litre ) 73.3
(p dozen eggs–1) Eggs
30.3
3.96
0.52
–42.6
(p dozen eggs–1) 11.3
1.44
–36.4
Farm Costs and Food Miles 381
2003–2004 UK price; and the 0.42p kg–1 external cost for potatoes is 3.0 per cent of the average 2003–2004 UK price (Defra, 2004). With these unit costs for food commodities, it is now possible to reassess the full costs of each of the components of the weekly UK food basket.
The Weekly Food Basket The National Food Survey (NFS) and the Food Expenditure Survey (FES) (combined in 2003 as the Expenditure Food Survey) record data on weekly consumption and expenditure for each item of food in the average domestic food basket (Defra, 2002a, 2002b). On average, each person in the UK consumes in the home 10.02kg of food wk–1 and this costs £17.26 wk–1 (average for 1999–2000). In addition, individuals spend £7.53 wk–1 on eating out (an average of three times per week), bringing the total weekly expenditure to £24.79 (eating out is 30 per cent of food expenditure) for 11.68kg of food (see Table 17.3). These data are obviously aggregate commodity costs for the whole of the UK and its food system. There will, however, be geographic and income-group variations according to choice of food consumed and expenditure. The average weekly food basket in Scotland is 4.4 per cent less than the UK average, 6.8 per cent less in Wales, 1.2 per cent less in Northern Ireland and 0.8 per cent more in England. The most expensive two regions of England are London at £19.53 (+10.7 per cent) and the South East at £20.35 (15.4 per cent), and the least expensive are Yorkshire and Humberside at £16.08 (–9.1 per cent) and the North East at £16.13 (–8.6 per cent). Households earning >£725 gross wk–1 spend £22.03 (+24.9 per cent), while those earning £180–375 spend 10.6 per cent less and those on 0.05). The rice leaf folder and other leaf-feeding insects remained the main targets,
Use of Communication Media in Changing Rice Farmers’ Pest Management 245
Figure 12.2 Rice farmers’ insecticide applications in different crop stages in Tan Tru and Tan Thanh districts, Long An province, in August 1994 just before the introduction of the media materials, 18 months after in February 1996 and 31 months after in March 1997
accounting for 44 per cent, 52 per cent and 53 per cent of farmers’ applications in the 1994 pretest, 1996 post-test and 1997 post-test, respectively (Table 12.3). Farmers’ targets in the 12 districts were also the same, with 40 per cent of the sprays used for rice leaf folder control. The types of insecticides and farmers’ belief that insecticides can be harmful to health (Table 12.5) have also remained relatively unchanged. Methamidophos, monocrotophos and methyl parathion [all Table 12.3 The main pest targets of farmers’ insecticide sprays Percentage of sprays In study sites, Tan Tru and Tan Thanh pretest Targets
post-test
August 1994 February 1996
March 1997
In 12 districts
Rice leaf folders
33.4
37.0
43.8
39.5
Other leaf feeding insects
10.2
14.7
9.0
12.1
Stem borers
10.1
25.9
8.0
22.4
Thrips
14.0
6.1
8.5
5.5
Brown plant hoppers
28.0
7.6
12.4
11.5
Others
43
8.7
8.3
9.0
246 Governance and Education Table 12.4 Main insecticides (in percentage of sprays) of rice farmers in Long An Province WHO classification
In study sites, Tan Tru and Tan Thanh pretest August 1994
post-test February 1996
March 1997
In 12 districts
Organophosphates Monocrotophos
1b
6.8
9.7
6.1
4.2
Diazinon
1I
1.6
5.6
1.1
9.2
Methyl parathion
la
12.1
7.2
3.4
3.4
Methamidophos
1b
28.9
31.1
31.4
25.0
Lindane
1I
0.0
0.3
0.2
0.5
Endosulfan
1I
4.0
0.5
0.1
2.5
1I
16.5
9.5
9.6
10.1
MIPC (isoprocarb)
1I
2.7
0.0
1.6
0.0
Carbofuran
1h
0.1
0.2
1.1
0.4
Cypermethrin
1I
0.1
1.8
7.8
5.7
Dehamethrin
1I
5.7
6.1
8.8
2.8
Lambda cyhalothrin
–
2.9
9.0
8.7
9.8
Cartap
–
0.0
10.0
7.4
10.7
Buprofezin
V
7.8
2.6
5.1
2.5
Organochlorines
Carbamates BPMC (fenocarb)
Pyrethroids
Others
WHO category I pesticides (CIRAD, 1991)] accounted for 48 per cent of the sprays in the 1994 pretest and 1996 post-test (Table 12.4). In the 12 districts outside the study sites, these three WHO category I insecticides constituted 33 per cent of the sprays used.
Changes in farmers’ beliefs The belief index reduced significantly from 11.25 (±0.18 at 95 per cent CL) in the 1994 pretest to 8.22 (±0.27 at 95 per cent CL) in the 1996 post-test and 7.62 (±0.24 at 95 per cent CL) in the 1997 post-test. The higher belief index in the pretest meant that more farmers had non-preferred beliefs. In the 12 districts, the belief index was found to be 8.11 (±0.85 at 95 per cent CL). Table 12.5 shows changes in farmers’ beliefs in the three statements related to the rice leaf folder problem to the two statements relating to insecticide use. Except for the statement
Use of Communication Media in Changing Rice Farmers’ Pest Management 247 Table 12.5 Comparison of responses to belief statements by farmers of Tan Tru and Tan Thanh districts pretest in 1994, post-tests in 1996 and 1997, and farmers of the other 12 districts in Long An province Percentage of farmers who agreed to the statements pretest
post-tests
1994
1996
1997
12 districts
39.0
35.6
29.7a
32.0
–
87.3
82.1b
86.5a
27.2c
52.9
68.3a
58.9a
Spraying insecticides can harm human health
–
96.7
97.5
97.2
Spraying insecticides contaminates the environment
–
63.5
78.0a
80.7a
Applying insecticides in the first 40 DAS is a waste
–
81.3
88.9a
79.5a
Applying insecticides in the first 40 DAS can cause more pests
–
70.9
74.9b
69.6a
Leaf folders in the first 40 DAS can cause severe damage
66.1c
27.2
24.0
25.7a
Leaf folders in the first 40 DAS will cause yield loss
69.8c
26.2
24.8
26.1b
Spraying in the first 40 DAS for leaf folder control is necessary
–
31.0
24.8b
27.0a
Spraying insecticides for leaf folders has to be done in early season
77.2c
21.6
23.2
25.3
Rice crops can recover from early-season leaf damages by pests
–
86.9
92.2b
83.2a
Applying insecticides will increase yields Insecticides will harm natural enemies Killing natural enemies can cause more pest problems
Critical values of chi-square tests at d.f. = 2, P = 0.05. 5.99 and P ≈ 0.01. 9.21. Significant differences at P = 0.01 and P = 0.05 probability levels, respectively, from post-test 1996. c Significant differences at P = 0.01 probability levels, respectively, between pretest (1994) and post-test (1996).
a,b
‘Applying insecticides will increase yields’, farmer responses to the four other statements were significantly changed. In the 12 districts, similar farmer responses were obtained (Table 12.5), implying that although the campaign was launched in the study sites, it had significantly influenced farmers in other districts quite distant from the sites. In the 1997 post-test, responses to the seven additional belief statements were significantly different from that of the 1996 post-test, implying that
248 Governance and Education
farmers had developed stronger beliefs that spraying insecticides in the first 40 DAS was unnecessary and a waste of money, affected health and contaminated the environment (Table 12.5). Similarly, in the 12 districts outside the study sites, the farmers’ responses to these statements were also significantly changed.
Benefits from not spraying in the early season In the post-tests, farmers were asked an open-ended question as to the benefits for not spraying insecticides in the first 40 DAS. Savings in costs (insecticide and labour) were cited by 89 per cent of the farmers, followed by reducing health risks (25 per cent), less pollution to the environment (17 per cent) and protection of natural predators (12 per cent). These benefits were displayed in the poster placed in various public places. Most of the farmers (97 per cent) said that they will continue not using insecticides in the first 40 DAS in the next season.
Relationship between belief index and insecticide use Farmers’ insecticide use frequencies were highly correlated with the belief index values in all three surveys, pretest (Pearson 0.109, p < 0.05), post-test 1996 (Pearson, 0.414, p < 0.01) and post-test 1997 (Pearson. 0.285, p < 0.01). These positive relationships imply that individual fanners with high belief indices had a higher tendency to spray insecticides (Table 12.6). Similarly, the correlation in the posttest of the 12 districts in Long An province was also significant (Pearson, 0.36, p < 0.01).
Farmer-to-farmer spread and multiplier effects In the 1996 post-test, about 77 per cent of the farmers who were aware of the media materials (n = 400) said that they discussed the message content with members of his or her household, and 67 per cent discussed it with other farmers. Persons with whom the information was discussed included the spouses (57 per cent), the sons and daughters (31 per cent), children (19 per cent), siblings (12 per cent) and other relations (16 per cent). Some farmers recalled communicating the inforTable 12.6 Regression analyses of farmers’ insecticide spray frequency and belief index Constant B
Intercept
Monitoring surveys
Value
95% CL
Value
95% CL
F value
P
Pretest 1994
0.075
±0.055
3.020
±0.625
7.376
0.007
Post-test 1996
0.175
±0.036
0.116
±0.313
91.688
< 0.001
Post-test 1997
0.130
±0.034
0.797
±0.283
54.396
< 0.001
In 12 districts
0.142
±0.019
0.434
±0.167
209.804
< 0.001
Use of Communication Media in Changing Rice Farmers’ Pest Management 249
mation from the media to more than ten persons (33 per cent), whereas most said that they had spoken to five or less persons (44 per cent). The most common situations where the information was discussed were in the field (36 per cent), in the coffee shops (24 per cent) and at dinner parties (24 per cent). The media approach in the project sites in Long An province stimulated other provincial governments in the Mekong Delta to launch their own programmes using the approach. Between September 1994 and March 1997, 15 provincial governments initiated their own programmes, spending about US$151,000, distributed 340,000 leaflets, 35,000 posters, organized 1390 demonstration plots and broadcast the radio drama about 1550 times. In addition, a total of 356,600 farmers were invited to participate in testing whether early season spraying for leaf folder control was necessary. In 1996, a post-test survey of 1499 farmers in the 12 districts of Long An province, besides the study sites, was conducted by the Provincial Plant Protection Department to evaluate the spread effect. About 82 per cent of the 1449 farmers interviewed said that they had heard about the heuristic, and 64 per cent said that they had tried it. Of those who tried, 77 per cent said they had stopped spraying in the first 40 DAS. The spray frequency (Figure 12.3) showed that about 20 per cent of the farmers had not applied any insecticides, and most farmers (59 per cent) applied one or two sprays each season (average 1.6). About 37 per cent of the farmers applied their first sprays in the first four weeks, 50 per cent in the second
Figure 12.3 Insecticide spray frequencies of rice farmers in 12 districts in Long An province in September 1996, n = 1449
250 Governance and Education
four weeks and the remaining 13 per cent after the ninth week. Using farmers’ responses to the same five belief statements as in the pretest and the two post-tests, the belief index of farmers in the 12 districts was found to be 8.11 (±0.08 at 95 per cent CL), which was significantly lower than that of the pretest but not significantly different from the 1996 post-test in the study sites. It is evident that the communication media introduced into the two study districts have influenced farmers’ pest management beliefs and practices in the whole of Long An.
Farmer field schools During the study period, a training programme using the FFS approach (Useem et al, 1992; Matteson et al, 1994) was implemented in the province. Table 12.7 shows the number of farmers who were trained by FFS. At the end of 1994, the FFS reached 467 farmers or 2.2 per cent of the households in study sites, whereas the media reached 97 per cent of the population. By the end of 1996, the number of farmers trained in Long An was 7451, accounting for 3.5 per cent of the total farmer households in Long An province. The 1996 post-test survey of 12 districts in Long An province showed that the media reached 82 per cent of the farmer households. The number of farmers trained in the study sites was 1827 or 8.7 per cent. In the 1996 post-test, there were 112 farmers in our sample who had been to the FFS. We regrouped the data and compared the responses of FFS trained farmers and those who had not attended the training. Table 12.8 shows details of the comparison of some of the attributes. FFS trained farmers sprayed less but not significantly lower than untrained farmers, and there were more FFS trained farmers who did not spray any insecticides. The belief index of FFS trained farmers was also lower, although not significantly different, and the proportion of farmers who applied their first insecticide sprays in the first four weeks after sowing was also lower. There was, however, little difference in spray targets as the proportions of sprays for the control of leaf feeding insects was similar. The types of insecticides used also did not differ. Table 12.9 shows farmers’ responses to the belief statements. In all cases, the responses of the FFS-trained farmers and the untrained farmers were not significantly Table 12.7 Number of farmers who had attended FFS during the period 1994–1996 in the study sites, Tan Tru and Tan Thanh and in the province of Long An 1994
1995
1996
Total
Tan Tru
297
235
262
794
Tan Thanh
170
289
574
1033
Total in study sites
467
524
836
1827
Percentage of household population
2.2
2.5
4.0
8.7
Whole province of Long An
1909
2064
3478
7451
Percentage of household population
0.91
0.98
1.66
3.55
Use of Communication Media in Changing Rice Farmers’ Pest Management 251 Table 12.8 A comparison of farmers who were trained through Farmer Field Schools (FFS) and untrained farmers in the 1996 post-test survey in Tan Tru and Tan Thanh districts, Long An province Attributes Number of insecticide sprays per farmer
FFS trained farmers n = 112 Mean
1.43
1.60
Mode
1
1
SD
1.24
1.19
Percentage who did not spray insecticides Belief index
Mean 95% CL
Percentage of farmers’ sprays targeted at:
25.9 7.99
18.3 8.29
7.49–8.49
7.98–8.61
rice leaf folders
27.3
39.3
other leaf feeders
20.3
13.1
stem borers
28.1
25.4
brown plant hoppers Percentage of farmers’ sprays that were:
Untrained farmers n = 338
6.3
7.9
methamidophos
27.8
32.9
methyl parathion
9.3
6.9
monocrotophos
6.7
10.8
deltamethrin
7.7
5.9
24.1
38.8
Percentage of farmer who applied first sprays in first 4 weeks
different. For instance, fewer FFS trained farmers believed that insecticides would increase yields (28.6 per cent and 38.0 per cent), leaf folders in the early crop stages could cause yield loss (21.4 per cent and 27.8 per cent), and spraying during the early crop season would be necessary (25.0 per cent and 32.9 per cent). This implied that the FFS training further reinforced farmers’ beliefs that leaf folders were not important problems and that spraying was unnecessary.
Insecticide costs and sales in Long An province The costs of the commonly used insecticides have not changed significantly over the study period (Table 12.10). The sales volume records of five retailers showed that the proportion of insecticide sales declined from 37 per cent of total sales in 1994 to 21 per cent in 1997.
252 Governance and Education Table 12.9 Comparison of responses to belief statements by farmer field school (FFS) trained and untrained farmers in Tan Tru and Tan Thanh districts, Long An province Percentage of farmers who agreed to the statements FFS trained farmers
Untrained farmers
Chi-square
Applying insecticides will increase yields
28.6
38.0
5.33
Insecticides will harm natural enemies
89.2
87.0
0.38
Killing natural enemies can cause more pest problems
40.2
34.6
2.14
Spraying insecticides can harm human health
97.3
96.4
0.69
Spraying insecticides contaminates the environment
63.4
63.5
0.34
Applying insecticides in the first 40 DAS is a waste
85.7
79.9
2.15
Applying insecticides in the first 40 DAS can cause more pests
69.6
71.3
0.49
Leaf folders in the first 40 DAS can cause severe damage
21.4
29.1
2.49
Leaf folders in the first 40 DAS will cause yield loss
21.4
27.8
1.79
Spraying in the first 40 DAS for leaf folder control is necessary
25.0
32.9
2.96
Spraying insecticides for leaf folders has to be done early in the season
17.1
23.1
5.95
Rice crops can recover from early season damage by pests
92.0
85.2
4.77
Note: Critical values of chi-squared at d.f. = 2, P = 0.05, 5.99 and P = 0.01, 9.21.
Discussion There are strengths and weaknesses in indigenous farmer knowledge as observed among Honduran farmers (Bentley, 1989), and farmers’ beliefs in pests and their perceptions of the potential damage and losses are examples of such weaknesses. Rice farmers in Asia generally overestimate losses due to highly visible pest damage, such as the rice leaf folder (Heong et al, 1994) and stem borers (Lazaro et al, 1993). In Honduras, Bentley (1989) found that farmers were worried about Diabrotica beetles, which are large and colourful but not important pests. In insecticide use, farmers’ perceived benefits seem to be much higher than the actual benefits. Since perceptions, rather than the economic rational, determine the decisions of farmers, changing these perceptions may reduce the perceived benefits and
Use of Communication Media in Changing Rice Farmers’ Pest Management 253 Table 12.10 Prices of some common insecticides used by farmers between 1994 and 1997 in Long An province and mean percentage sales volumes of five retailers Application rates (g ai ha–1)
1994
1995
1996
1997
Monocrotophos (US$ per 500cc bottle)
500
1.60
1.65
1.90
Banned
Methyl parathion (US$ per 500cc bottle)
500
1.45
1.18
1.36
Banned
Methamidophos (US$ per 480cc bottle)
500
2.20
2.30
2.30
2.30
Deltamethrin (US$ per 100cc bottle)
12.5
1.20
1.28
1.30
1.30
Alpha cypermethrin (US$ per 100cc bottle)
20
0.90
0.85
0.90
1.00
Lambda cyhalothrin (US$ per 250cc bottle)
7.5
3.70
3.80
3.90
4.00
BPMC (US$ per 500cc bottle)
500
1.00
1.14
1.36
1.45
Diazinon granules 10% (US$ per kg)
1000
0.77
0.84
0.93
1.02
Mean percentage of total sales in insecticides SD
36.6
30.6
24.2
21.4
3.6
3.0
5.2
4.2
intentions to spray. By using the conflict approach, farmers in the Philippines were motivated to stop their early season spraying (Heong and Escalada, 1997a). Using communication materials, farmers in the study sites were similarly motivated and reduced their insecticide sprays by 47 per cent, from 3.35 to 1.76 sprays per season. This reduction seems to be attributed to the change in beliefs as indicated by the reduction in the belief index from 11.3 to 7.6. The direct relationships between number sprays and the belief index further support this conclusion. Farmers’ insecticide spraying in the early crop stages had clearly reduced. Before the introduction of the communication materials, about 60 per cent, 82 per cent and 84 per cent of the farmers applied insecticides during the early and late tillering and booting stages, respectively. Eighteen months after introduction, farmers’ spraying during these stages had significantly reduced to 25 per cent, 41 per cent and 55 per cent, respectively. Further reductions to 0 per cent, 19 per cent and 30 per cent were observed 31 months after introduction. As the content of the communication campaign was to motivate farmers to reduce early season spraying, this reduction in early season spraying implied that the campaign had affected farmers’ insecticide use. At the heading and maturing stages, there were initial reductions in farmers using insecticides, and spraying was increased although not significantly higher than in the pretest. This increase was also reflected in the
254 Governance and Education
increase in mean number of sprays per season, from 1.55 to 1.76. In the 12 districts, the mean number of sprays was 1.58 at about 25 months after launching in Long An. Since these two surveys were done in different crop seasons, the general reduction in the number of insecticides in the whole province of Long An province reflected the effect of the media and not seasonal differences. Although there appeared to be a substantial perception change in a large proportion of farmers, the rice leaf folders and other leaf feeding insects remained the targets of those farmers who were spraying. These sprays were used later, implying that farmers were still worried about the leaf feeders, particularly leaf folders, that infest crops at the later crop stages. While the communication materials were introduced, IPM training programmes through the FFS approach were also implemented in the study sites. In September 1994, when the media project started, there were 467 FFS trained farmers in the project sites. When the first post-test was conducted in February 1996, there were 991 FFS trained farmers, and in March 1997, the number increased to 1827. These accounted for 2.2 per cent, 4.7 per cent and 8.7 per cent of the farmer households in the study sites at the time when the surveys were conducted. When we conducted post-tests in 1996 and 1997, most of the FFS trained farmers had been exposed to the media materials. The general reduction in insecticide use and farmers’ perception change might be due to one or both of these interventions. In the study sites, the reduction in insecticide sprays, especially in the early crop stages, and the change in perception, were widespread, even among farmers who had not attended FFS. The relatively small proportion of farmers exposed to FFS (< 10 per cent) may not be able to account for these changes over a large proportion of the farmers in the study area. Similar changes were also observed among farmers in other districts of Long An province, where only 3.5 per cent of the farmer households had attended FFS. We found that FFS trained farmers sprayed less insecticides and had lower belief index scores, although these were not significantly lower than those farmers who had not attended the FFS. In response to the belief statements, more FFS trained farmers had preferred responses than untrained farmers. As farmers in Long An were exposed to the media campaign before attending the FFS, the training further reinforced the perception change initiated by the media. In the study sites, the media materials were distributed only for one season in 1994, and their effects on farmers’ perceptions and practices were sustained for 31 months. Another 15 provincial governments adopted the same approach and extended the campaign to the whole of the Mekong Delta, with an estimated farm household population of about 2 million. It is evident that the new information had diffused to a large population and had reduced the uncertainty of farmers’ attitudes toward not using insecticides. The media materials provided information aimed at reducing uncertainty, and this effect was evident from the significant reduction in the belief index. The information was aimed at reducing insecticide use in the early crop stages and a significant reduction in farmers’ insecticide spraying during these crop stages was observed.
Use of Communication Media in Changing Rice Farmers’ Pest Management 255
The adoption rate of an innovation depends on its characteristics (Rogers, 1995). In this case, the innovation has high relative advantages in terms of savings in chemical and labour costs. The innovation is also testable. The campaign emphasized this, and its benefits are also observable. Initially, the innovation was in conflict with farmers’ perceptions. However, since it was presented together with an evaluation method and related information, it served as an important incentive to change perceptions (Heong and Escalada, 1997a). Such a change may be further reinforced and sustained by more frequent mass media and training programmes. Since the approach was easy and inexpensive to adopt, it stimulated 15 provincial governments to establish their own programmes with provincial funds extending the campaign’s reach to the entire Mekong Delta. The post-test survey of 12 districts carried out in September 1996 showed that a large proportion (82 per cent) of the farmer households (about 2 million) had been reached, and many had ceased their insecticide spraying for leaf folder control in the early crop stages. In these provinces, the approach appears to be part of the agricultural technicians’ routine tasks (or ‘routinized’). It is evident that to enhance adoption, the innovation, besides being attractive to its potential adopters, will also need to be attractive to its potential implementers. Mass media channels are relatively more important at the knowledge stage in the innovation-decision process (Rogers, 1995). They can reach a large audience rapidly, create knowledge and spread information, and these can lead to changes in some weakly held attitudes. Spraying insecticides at the early crop stages, though very common among farmers, may be a weakly held attitude. To change more strongly held attitudes, like insecticide spraying at other times of crop growth for high yields, might require interpersonal channels, like face-to-face exchange means. The information on the leaflets and posters encouraging farmers to contact the Plant Protection Department to learn more about pest management was primarily aimed at facilitating this process. Discontinuance, a decision to reject an innovation after having previously adopted it (Rogers, 1995), among the adopters is a high possibility. This is especially so because negative messages about the innovation will continue to circulate, through both the mass media and interpersonal networks. Although the results of this study seem to show that insecticide spraying during the early crop stages has been reduced, it is difficult to expect one campaign to sustain the adoption of the innovation. For this cessation of early season spraying to continue, there is a need to provide the same information frequently or similar information framed differently. In addition, there is a need to monitor changes and develop programmes to fully institutionalize and ‘routinize’ into ongoing practices and value systems of adopters.
256 Governance and Education
Acknowledgements The work was supported by the Rice IPM Network coordinated by IRRI and financed by the Swiss Agency for Development and Cooperation (SDC). We are grateful to many persons who have assisted in this project. In particular, we thank Madam Tran Thi Sua, the Vice Chairperson of the Peoples’ Committee of Long An province, the former Vice Minister of Agriculture of Viet Nam, Mr Le van The, Mr Nguyen Son Nam, Director of Agriculture in Long An province and Madam Do Thi Ngoc and Mr Tran Huu Khuong, the former and present Directors of Plant Protection Department in Long An Province, who provided support and additional resources; Madam Tran Thi Mai Phuong, the Vice Director of the Plant Protection Department in Long An province, Mr Nguyen Chi Thien, Chief of Plant Protection Station in Tan Tru District, Mr Nguyen Van Vu, Chief of Plant Protection Station in Tan Thanh District, who helped organize the surveys; the students who served as enumerators and the farmers in the project sites who had responded to our questions. In addition, we thank Ms Amor Lazaro, for her assistance in processing the huge data sets; Mr Pham Minh Sang, who assisted in the translation, Ms Carolyn Dedolph and Ms Hermie Rapusas, who helped in the material design workshop.
Appendix Radio drama script used in the broadcasts in Long An province Scene: Early one morning in the rice field of Uncle Hai with Uncle Nam, his neighbour passing by carrying a knapsack sprayer Uncle Nam: Hey Uncle Hai! Why don’t we have some coffee instead of visiting your field so early in the morning? Uncle Hai: Oh, I am watching some friendly insects attacking the worms. How about you? What are you spraying for? Uncle Nam: My God! My crop is just 10 days old, but there are so many thrips. It looks terrible. So I have to spray it now. Ah, you just mentioned friendly insects. What are they? Uncle Hai: Take your time. Put down your sprayer and I will tell you what they are.
Uncle (in Vietnamese, Bac) is used as a sign of respect when addressing a senior person in Vietnam.
Use of Communication Media in Changing Rice Farmers’ Pest Management 257 Uncle Nam: Uh! Uh! I am very worried about my crop. How can I take my time? I will only stay for a short while. Uncle Hai: Don’t worry about thrips. Look at my field. There are lots of thrips there too. Sit down and I will tell you something interesting. Uncle Nam: Okay. I will sit down. Uncle Hai: You don’t see any flies in my field, do you? Uncle Nam: There are spiders. Everybody knows that. Uncle Hai: And what about that insect on the leaf? Uncle Nam: Quit joking with me. Even children know that it is a dragonfly. Uncle Hai: Ay! It’s that easy. I’ve just answered your questions. Those are the friendly insects. And now do you know why they are called friendly insects? Uncle Nam: No. Why? Uncle Hai: Because they live in the rice fields. Sometimes farmers think they are harmful but they really don’t feed on the rice plants. Instead, they are looking for brown plant hoppers, leaf folders, stem borers, army worms and case worms to eat. They are farmers’ friends because they eat these bad insects. So you don’t have to spray to get a good crop. Uncle Nam: A good crop without spraying? You are joking with me again. What does your crop look like without insecticides? Uncle Hai: Ay! Ay! Do you remember my last crop? I got more than 30 gia per cong. You can ask my neighbours to confirm that I did not spray any insecticides. Uncle Nam: Uhhhhh. It sounds ridiculous. I would like to know why. Uncle Hai: Okay. Do you remember the situation in my field last season? The rice leaf folder damages looked very serious, but I did not spray. And I still got a good crop. Now look at my field. There are thrips and leaf folders as well, but I shall still not spray. Uncle Nam: Really?? Uncle Hai: Sure!! During the first 40 days after sowing, rice plants can recover from leaf removal by leaf folders. If you spray, you will waste money and sometimes you will suffer from brown plant hopper damages. Uncle Nam: What a surprise!! It is hard to imagine. Uncle Hai: It takes some time to explain the details. You have to buy me a drink. Mr Ha, the local agricultural technician joins the two farmers. Mr Ha: Hey!! What are you talking about? I just heard ‘buying a drink’. Is there something interesting??
258 Governance and Education Uncle Hai: Uh! Uh! By the way, Mr Ha, can you tell us about testing whether early season insecticide spraying is needed in the field? You advised me about the experiment last season. Uncle Nam: Well. Mr Ha, please tell me about it, and I can also try it in my field. Uncle Hai: Oh, it is very easy. Mr Ha: Yes. It takes some time to describe this, but the experiment is easy to perform. Now how many cong of field do you have? How old is your crop? Are you going to spray right now? Uncle Nam: I have 5 cong. My crop is 10 days old. I am going to spray this morning for thrips and leaf folders. Mr Ha: Well. It is good that you have not sprayed yet. If you want to try, you can divide your field into two parts. Do not spray one part of 2 or 3 cong. Spray the rest as normal. At harvest, we can compare the yields of these parts. You may find that there is no difference in yields. Uncle Nam: Two or 3 cong? That is too big. What if something goes wrong? Mr Ha: I assure you that there will be no yield difference. If you are still worried, use one cong as the unsprayed plot. I am afraid you might be sorry for unnecessarily spending money in insecticides and spraying. Uncle Nam: Are you sure? Okay, I will follow your advice and try the experiment. Uncle Hai: Come on Uncle Nam! I am sure. I have grown two crops without spraying in the first 40 days and have no yield loss. I save money and work and also have no hopper problems. Uncle Nam: Well, I will try.
References Adhikarya, R. 1994. Strategic Extension Campaign – A Participatory-oriented Method of Agricultural Extension. FAO of the United Nations, Rome, Italy Bentley, J. W. 1989. What farmers don’t know can’t help them: The strengths and weaknesses of indigenous technical knowledge in Honduras. Agric. Hum. Values 6, 25–31 Campbell, D. T. and Stanley. J. C. 1973. Experimental and Quasi-Experimental Designs for Research. Rand McNally College Publishing, Chicago, IL CIRAD (International Co-operation Centre in Agronomic Research for Development) 1991. Regional Agro-Pesticide Index. Volume 1: Asia, 3rd edn. CIRAD. Montpellier. France Cuc, N. S. 1995. Agriculture of Vietnam 1945–1995. Statistical Publishing House, Hanoi, Vietnam Einhorn, H. J. and Hogarth, R. M. 1981. Behavioral decision theory: Processes of judgment and choice. Annu. Rev. Psychol. 32, 53–88 Eiser, J. R. 1986. Social Psychology: Attitudes, Cognition and Social Behavior. Cambridge University Press, Cambridge
Use of Communication Media in Changing Rice Farmers’ Pest Management 259 Escalada, M. M. and Kenmore, P. E. 1988. Communicating integrated pest control to rice farmers at the village level. In Pesticide Management and Integrated Pest Management in Southeast Asia, P. S. Term and K. L. Heong (eds). Consortium for International Crop Protection, College Park. MD, pp221–228 Fabellar, L. T., Fabellar, N. and Heong, K. L. 1994. Simulating rice leaf folder feeding effects on yield using MACROS. Int. Rice Res. Newslett. 19, 7–8 Festinger, L. 1957. A Theory of Cognitive Dissonance. Stanford University Press, Stanford, CA Gou, Y. 1990. Larval Parasitization of Rice Leaf Folders (Lepidoptera: Pyralidae) under Field and Laboratory Conditions. Ph.D. thesis, University of the Philippines, Los Banos, Philippines Heong, K. L. 1990. Feeding rates of the rice leaf folder, Chaphalocrocis medinalis (Lepidoptera: Pyralidae), on the different plant stages. J. Agric. Entomol. 72, 81–90 Heong, K. L., Escalada, M. M. and Mai, V. 1994. An analysis of insecticide use in rice: Case studies in the Philippines and Vietnam. Int. J. Pest Manage. 40, 173–178 Heong, K. L., Escalada, M. M. and Lazaro, A. A. 1995a. Misuse of pesticides among rice farmers in Leyte, Philippines. In Impact of Pesticides on Farmers’ Health and the Rice Environment, P. L. Pingali and P. A. Roger (eds). Kluwer Academic. Norweil, MA. pp97–108 Heong, K. L., Thu Cuc, N. T., Binh, N., Fujisaka, S. and Bottrell, D. G. 1995b. Reducing early season insecticide applications through farmers’ experiments in Vietnam. In Vietnam and IRRI: A Partnership in Rice Research, G. L. Denning and V. T. Xuan (eds). International Rice Research Institute, Los Banos. Philippines and Ministry of Agriculture and Food Industry, Hanoi, Vietnam, pp217–222 Heong, K. L. and Escalada, M. M. 1997a. Perception change in rice pest management: A case study of farmers’ evaluation of conflict information. J. Appl. Commun. 81(2), 3–17 Heong, K. L. and Escalada, M. M. (eds). 1997b. Pest Management of Rice Farmers in Asia. International Rice Research Institute. Los Banos, Philippines. Heong, K. L. and Schoenly, K. G. 1998. Impact of insecticides on pest-natural enemy assemblages in tropical rice ecosystems. In Ecotoxicology: Pesticides and Beneficial Organisms, P. J. Haskell and P. McEwen (eds). Chapman and Hall, London, pp381–404 Ho, N. K. 1996. Introducing integrated weed management in Malaysia. In Herbicides in Asian rice: Transitions in Weed Management, R. Naylor (ed.). Stanford University, California and International Rice Research Institute, Los Baños, Philippines, pp167–182 Kahneman, D. and Tversky, A. 1973. On psychology of prediction. Psychol. Rev. 80, 237–251 Kotler, P. and Roberto. E. L. 1989. Social Marketing – Strategies for Changing Public Behavior. The Free Press, Macmillan, New York de Kraker, J. 1996. The Potential of Natural Enemies to Suppress Rice Leaf Folder Populations. Ph.D. thesis, Wageningen Agricultural University, The Netherlands Lazaro, A. A., Rubia, E. G., Almazan, L. P. and Heong, K. L. 1993. Farmers’ estimates of percent whiteheads (WH). Int. Rice Res. Newslett. 18, 4 Lim, G. S. and Heong, K. L. 1984. The role of insecticides in rice integrated pest management. In Judicious and Efficient Use of Insecticides on Rice. International Rice Research Institute, Los Banos, Philippines, pp19–40 Mai, V., Huan, N. II., Heong, K. L., Escalada, M. M. and Lazaro, A. A. 1997. Rice farmers’ pest management perceptions and practices in Long An province, Vietnam. In Pest Management of Rice Farmers in Asia, K. L. Heong and M. M. Escalada (eds). International Rice Research Institute, Los Banos. Philippines, pp215–226 Manoff, R. K. 1985. Social Marketing: New Imperatives for Public Health. Praeger, New York Matteson, P. C., Gallagher, K. D. and Kenmore, P. E. 1994. Extension of integrated pest management for planthoppers in Asian irrigated rice: Empowering the user. In Planthoppers: Their Ecology and Management, R. F. Denno and T. J. Perfect (eds). Chapman & Hall, New York, pp656–685 Neuman, W. L. 1991. Social Research Methods: Qualitative and Quantitative Approaches. Allyn & Bacon, Boston, MA
260 Governance and Education Payne, J. W., Bettmanm, J. R. and Johnson, E. J. 1992. Behavioral decision research: A constructive processing perspective. Annu. Rev. Psychol. 43, 87–131 Pfuhl, E. H. 1988. Radio based communication campigns: A strategy for training farmers in IPM in the Philippines. In Pesticide Management and Integrated Pest Management in Southeast Asia, P. S. Teng and K. L. Heong (eds). Consortium for International Crop Protection, College Park, MD, pp251–256 Rapusas, H. R., Dedolph, C, Escalada, M. M. and Heong, K. L. 1994. Workshop Report: Message Design for a Campaign to Encourage Farmers’ Participation in Experimenting with Stopping Early Insecticide Spraying in Vietnam. International Rice Research Institute, Los Baños, Philippines (unpublished report) Rice, R. E. and Paisley, W. J. 1981. Public Communication Campaigns. Sage, Beverly Hills, CA Rogers, E. M. 1995. Diffusion of Innovations, 4th edn. The Free Press, New York Rola, A. C. and Pingali, P. L. 1993. Pesticides, Rice Productivity and Farmers’ Health: An Economic Assessment. International Rice Research Institute, Los Baños, Philippines Rombach, M. C. and Gallagher, K. D. 1994. The brown plant hopper: Promises, problems and prospects. In Biology and Management of Rice Insects, E. A. Heinrichs (ed.). Wiley Eastern, New Dehli, India, pp693–712 Rossiter, M. W. 1975. The Emergence of Agricultural Sciences. Yale University Press, New Haven, CT SAS. 1985. SAS (Statistical Analysis System) Users’ Guide Version 5 Edition. SAS Institute, Cary, NC Schramm, W. 1973. Men, Messages and Media: A Look at Human Communication. Harper & Row, New York Shepard, B. M., Justo, H. D., Rubia, E. G. and Estano, D. B. 1990. Response of the rice plant to damage by the rice whorl maggot, Hydriella philippina Ferino (Diptera: Ephydridae). J. Plant Protect. Tropics 7, 173–177 Slovic, P., Fishhoff, B. and Liechtenstein, S. 1977. Behavioral decision theory. Annu. Rev. Psychal. 28, 1–39 SPSS. 1997. SPSS (Statistical Package for Social Sciences) SPSS Base 7.5 for Windows. User’s Guide. SPSS, Chicago, IL Stone, R. 1992. Researcher score victory over pesticides and pests in Asia. Science 256, 1272–1273 Tversky, A. and Kahnemann, D. 1974. Judgement under uncertainty: Heuristics and biases. Science 185, 1124–1131 Useem, M., Setti, L. and Pincus, J. 1992. The science of Javanese management: Organizational alignment in an Indonesian development programme. Public Admin. Dev. 12, 447–471 Van de Fliert, E. and Matteson, P. C. 1990. Rice integrated pest control training needs identified through a farmer survey in Sri Lanka. J. Plant Protect. Tropics 7, 15–26 Viajante, V. D. and Heinrichs, E. A. 1986. Rice growth and yield as affected by the whorl maggot, Hydriella philippina Ferino (Diptera: Ephydridae). Crop Protect. 5, 176–181 Waibel, H. 1986. The Economics of Integrated Pest Control in Irrigated Rice. Springer, Berlin Way, M. J. and Heong, K. L. 1994. The role of biodiversity in the dynamics and management of insect pests of tropical irrigated rice – a review. Bull. Entomol. Res. 84, 567–587
13
Landcare and Livelihoods: The Promotion and Adoption of Conservation Farming Systems in the Philippine Uplands R. A. Cramb and Z. Culasero
Introduction Agricultural land degradation in the densely populated, steeply sloping upland regions of the Philippines has been recognized as a major environmental problem in the past three decades, with significant on-site and off-site impacts (Cramb, 1998). Conservation farming systems have been developed, such as the widely promoted Sloping Agricultural Land Technology (SALT), based on contour hedgerows of shrub legumes, but sustained uptake by farmers has been limited (Cramb, 2000; Cramb et al, 1999, 2000). In recent years, interest has focused on the potential of the landcare approach to enhance the development, dissemination and adoption of appropriate conservation farming measures (Mercado et al, 2001). Landcare emerged in the mid-1980s in Australia and in the late-1990s in the Philippines as an important strategy for developing collective action at the local level to deal with problems of agricultural land degradation. The landcare approach centres on the formation of community landcare groups, supported to varying degrees through partnerships with government and non-government agencies. Campbell defines a community landcare group as ‘a group of people concerned about land degradation problems, who are interested in working together to do something positive for the long-term health of the land’ (1994, p31). Such groups identify problems at the local level and mobilize information, community effort and finances to help improve the management of their soil, water, vegetation and other natural resources. It is widely held that this is a more effective strategy for Reprinted from Cramb R A and Culasero Z. 2003. Landcare and livelihoods: The promotion and adoption of conservation farming systems in the Philippine Uplands. Int. J. Agric. Sust. 1(2), 141–154, Earthscan, London.
262 Governance and Education
Figure 13.1 Location of principal landcare sites in Mindanao, Southern Philippines
achieving adoption of sustainable farming practices than strategies involving government regulation or the top-down transfer of technology. This paper reports some of the results of a participatory evaluation of the Landcare Programme in Mindanao in the Southern Philippines (Figure 13.1). The evaluation study was undertaken in the final phase of a four-year action research project (1999–2003) funded by the Australian Centre for International Agricultural Research (ACIAR). The focus of this paper is Barangay Ned, part of Lake Sebu Municipality in the province of South Cotabato in Southern Mindanao. The Landcare Programme in Barangay Ned is of particular interest because it has been faced with extremely difficult conditions, has received minimal outside support, and thus indicates perhaps the basic requirements for achieving an accelerated impact on upland farming systems in the Philippines. The sustainable rural livelihoods approach was used in this study as a framework to understand, explain and evaluate the impacts of the Ned Landcare Programme.
Landcare and Livelihoods 263
Background The Landcare Programme in the Philippines Independently of the Australian Landcare Programme, landcare in the Philippines grew out of efforts to promote soil conservation innovations among farmers in the upland municipality of Claveria in Northern Mindanao (Arcenas, 2002; Sabio, 2002). The Department of Agriculture (DA) began promoting contour hedgerows of shrub legumes in the early 1980s, in the form of the SALT package. In 1987, the International Rice Research Institute (IRRI) in collaboration with the DA initiated a farmer-to-farmer training programme in Claveria to enhance adoption. By 1992 up to 80 farmers had adopted the technology. The International Centre for Research in Agroforestry (ICRAF) took over the IRRI research site in Claveria in 1993 and proceeded to conduct field trials on contour hedgerow systems. In 1996 ICRAF identified a low-cost farmer adaptation of contour hedgerows – the use of natural vegetative strips (NVS) as an alternative to the more complex and labour-intensive method of establishing and maintaining hedgerows of shrub legumes or forage grasses (Arcenas, 2002; Mercado et al, 2001; Sabio, 2002; Stark, 2000). A three-person extension team, comprising a farmer who had adopted NVS, a DA extension agent and an ICRAF technician, was formed to promote the NVS technology. The team worked initially with individual farmers in various villages (barangay), but the interest was such that group sessions were organized, involving 20–25 participants. At one of these group-training sessions in 1996, 20 farmer leaders, at the suggestion of one of the facilitators, decided to form a farmer organization to promote the NVS contour hedgerow system within the Claveria community. The organization was named the Claveria Land Care Association (CLCA). The Landcare Programme in Claveria developed into a triangular partnership between the CLCA (a people’s organization, working collectively to encourage conservation farming among its members), ICRAF (an international non-government organization, providing technical and logistic support and facilitation) and local government units (providing public resources and official support for the Association). As a result of this partnership, by early 2000 the CLCA had grown to include 16 chapters, 105 sub-chapters, and about 800 individual farmer members. Adoption of NVS technology also increased dramatically, from about 75ha in 1996 to more than 300ha in 1999. Arcenas (2002) reports that all partners credited the farmer-based group extension approach of the CLCA as the principal factor in this increased level of interest and adoption. The success of Landcare in Claveria encouraged ICRAF in 1998 to introduce the approach at its Central Mindanao field site in the Municipality of Lantapan in Bukidnon (Figure 13.1), and to seek external funding both to support the programme and to evaluate its potential as a model for community-based natural resource management throughout the Philippine uplands. Operational funding was obtained from the Spanish Agency for International Cooperation (AECI). As
264 Governance and Education
mentioned above, the ACIAR funded an action research project from 1999 to 2003 to augment and help evaluate the ongoing Landcare Programme in these and other sites.
The ACIAR Landcare Project The ACIAR Landcare Project helped support the Landcare Programme in and around the Claveria and Lantapan sites, as well as a third site in Southern Mindanao – Barangay Ned (Figure 13.1). Previous projects implemented in Barangay Ned by the Southeast Asian Regional Centre for Graduate Study and Research in Agriculture (SEARCA) had sought to develop and promote conservation farming technologies, partly through the formation of farmer work groups. Hence this site was readily included in the Landcare Programme, with SEARCA as the facilitating organization, providing a further opportunity to test the replicability of the landcare approach as it had evolved in Claveria. The principal aim of the ACIAR Landcare Project was to test the effectiveness of the landcare approach as a tool to enhance the adoption of conservation practices suited to the needs of upland farming communities in the Philippines. As in Australia (Campbell, 1994; Cary and Webb, 2000; Lockie and Vanclay, 1997), ‘the landcare approach’ in the Philippines means many things, making evaluation difficult. In the ACIAR project, the impact of landcare was to be evaluated in terms of: (1) the adoption of conservation practices (and the effect of these practices on natural resources); and (2) the relevance of the approach as a model for local and regional extension services. That is, the project was interested in the adoption of both landcare technologies and landcare processes and institutions (notably the formation and development of landcare groups and networks). These impacts were seen to be critical to the achievement of the longer-term outcomes of rural poverty reduction and environmental conservation – in short, sustainable rural livelihoods.
Methods The sustainable rural livelihoods framework A major methodological advance in rural development research in recent years has been the recognition that rural households are not necessarily focused exclusively on increasing crop or livestock production and incomes (let alone on resource conservation), but undertake a range of activities, both on- and off-farm, depending on the resources to which they have access and the livelihood strategies they are able to pursue at any given time (Chambers, 1987; Chambers and Conway, 1992). This ‘sustainable rural livelihoods’ approach is now widely advocated as a framework for evaluating and developing policies and programmes at the micro level,
Landcare and Livelihoods 265
particularly in terms of poverty reduction (Ellis, 2000; Scoones, 1998). While not inconsistent with a farming systems approach, it goes beyond the focus on agricultural production technology typical of much farming systems research (Ellis and Biggs, 2001). A livelihood is a means of earning a living. Within the livelihoods approach, ‘a livelihood comprises the assets (natural, physical, human, financial, and social capital), the activities, and the access to these (mediated by institutions and social relations) that together determine the living gained by the individual or household’ (Ellis, 2000, p10). This emphasis on assets, activities and access provides a convenient framework within which to develop an understanding of the complex and dynamic realities of rural households. Ellis (2000) places less emphasis on the sustainability dimension because of what he sees as its inherent vagueness, but Scoones considers that ‘a livelihood is sustainable when it can cope with and recover from stresses and shocks and maintain or enhance its capabilities and assets both now and in the future, while not undermining the natural resource base’ (1998, p5). Scoones outlines the essential components of livelihoods analysis as follows: The key question to be asked in the analysis of sustainable livelihoods is – Given a particular context (of policy setting, politics, history, agroecology and socio-economic conditions), what combination of livelihood resources (different types of ‘capital’) result in the ability to follow what combination of livelihood strategies (agricultural intensification [or] extensification, livelihood diversification, migration) with what outcomes? (Scoones, 1998, p3)
Ellis (2000) gives particular emphasis to the widespread strategy of rural livelihood diversification, which he defines as ‘the process by which rural households construct an increasingly diverse portfolio of activities and assets in order to survive and to improve their standard of living’ (Ellis, 2000, p15). Diversification includes on-farm diversification (as measured by the range of crop, livestock and other natural resource-based activities undertaken) as well as diversification away from own-account farming to include off-farm and non-farm activities in the household’s portfolio. The potential outcomes of these and other livelihood strategies are grouped by Ellis (2000) into: (1) livelihood security (income level, income stability, seasonality, risk); and (2) environmental sustainability (soil and land quality, water, forests, biodiversity). The livelihoods framework has the advantage of placing the adoption of landcare practices and the formation of landcare groups within the context of the livelihood resources and strategies of farm households and local communities, thus explicitly linking farming systems change, rural development and natural resource management. In particular, the landcare approach can be seen as promoting sustainable rural livelihoods primarily through investment in human and social capital. While the notion of human capital is well established, social capital is a relatively new concept, hence it warrants a brief discussion here. Woolcock (1998) and
266 Governance and Education
Woolcock and Narayan (2000, p226) define social capital succinctly as ‘the norms and networks that enable people to act collectively’. They make the useful distinction between ‘integration’ or ‘bonding social capital’, i.e. the intra-community ties that enable poor people in a village setting to ‘get by’ (e.g. monitoring of property rights, labour exchange, emergency assistance, rotating savings groups, provision of communal facilities) and ‘linkage’ or ‘bridging social capital’, i.e. the extracommunity networks that enable individuals and groups to tap outside sources of information, support and resources, not just enabling them to ‘get by’ but to ‘get ahead’ (e.g. links to traders and financiers, extension agents, NGOs). For development to proceed, Woolcock and Narayan (2000) suggest there is a need, not only to mobilize bonding social capital, but also to develop new linkages, or bridging social capital, opening up new opportunities for individuals and communities. The dilemma is that the formation of this latter type of social capital may well undermine the former type over time, because group success both increases demands on existing social bonds and encourages individuals within the community to pursue a greater diversity of linkages and activities. Pretty (2003) and Pretty and Ward (2001) have documented the growth of social capital as evidenced by group activity in a wide range of natural resource management sectors, including watershed management, irrigation, micro-finance, forest management, integrated pest management and farmer experimentation. The relationship between social capital and soil conservation is examined by Cramb (2004).
Sources of data The study in Barangay Ned was based on four main sources of data: (1) project reports and statistics; (2) interviews with project staff and other key informants; (3) two questionnaire surveys; and (4) nine case studies of community landcare groups (Cramb and Culasero, 2003). The first survey was conducted in mid-2001. The questionnaire was administered by local, trained enumerators to a stratified random sample of 313 farmers from 18 sitio (sub-villages), representing approximately 11 per cent of the total number of farm-households in Ned. A follow-up survey was conducted in the third quarter of 2002, using the same sample as for the 2001 survey, although only 310 of the original 313 respondents could be contacted. As well as repeating questions about the extent of adoption, the second questionnaire included questions about landcare membership and farmers’ perceptions of changes in key aspects of their farming operations since the adoption of conservation measures. Case studies of nine community landcare groups were undertaken. The groups were selected based on their relative accessibility and their reported level of activity. The case studies were based on focus group discussions and key informant interviews, conducted from August to October 2002. There were 21 participants in focus group discussions and 60 key informants, including 51 landcare members, 8 local government officials and the Landcare Facilitator for Ned. A flexible schedule of open-ended questions was used to probe the informants about their perceptions
Landcare and Livelihoods 267
of Landcare, the history of their group, the factors promoting and inhibiting participation in the group, the development and current status of group activities, the benefits or impacts of these activities and the prospects for the future. For the sake of brevity, only the first three sources of data are drawn upon directly in the following section. Nevertheless, the results of the case studies were broadly consistent with the findings from the project interviews and the household surveys, and help to inform the overall discussion below. A full report of the evaluation study can be found in Cramb and Culasero (2003).
Results The context of rural livelihoods in Barangay Ned Barangay Ned, though part of Lake Sebu Muncipality, is an atypical barangay, given its size and relative isolation from the municipal centre, and is on the way to becoming a municipality in its own right. It encompasses an area of over 41,000ha, comprising the Ned Settlement Area (22,000ha) and the Tasaday Reservation (19,000ha) (a forest reserve created in 1972, ostensibly to protect a small ‘stoneage’ tribe). In 2000 it had a total population of nearly 15,000, grouped into 30 sitio. The population density in the settlement area averaged around 65 persons per square km, but was higher in the northern half of the area, which had primitive road access. Barangay Ned was established in 1962, but poor accessibility and lack of security hindered development until the early 1980s. It was originally part of the T’boli homelands but various logging concessions were granted from the 1960s and, from the 1980s, Ilonggo and other settlers moved in an acquired logged-over and other land, leaving the T’boli in the minority. In the 1990s the Department of Agrarian Reform (DAR) allocated titles to 5575 beneficiaries occupying 16,700ha, or 75 per cent of the settlement area. DAR also took responsibility for coordinating rural development in Ned, and contracted SEARCA in 1992 to implement the Ned Agro-Industrial Development Project (NAIDP), which included a component promoting conservation farming. However, support for T’boli swidden farmers was limited, leaving many of them feeling alienated from the agrarian reform process. The climate in Ned is characterized by abundant rainfall (averaging 2200mm) uniformly distributed throughout the year, high levels of humidity and cloudiness, and moderate temperatures (averaging 21°C) due to an average elevation of 900m. Hence continuous cultivation is feasible and a wide range of crops suited to tropical and subtropical environments can be grown. The terrain is rolling to mountainous, with dominant slopes of 12–40 per cent The soils are predominantly neutral to acidic sandy-loams with a clay B horizon, of low to moderate fertility, and highly susceptible to erosion. Permanent cropland accounts for about 14,000ha
268 Governance and Education
(64 per cent of the settlement area), including maize (8000ha), upland rice (2000ha), and other crops (4000ha). Grassland accounts for about 2750ha (12 per cent), and forest land (mainly degraded forest with small pockets of primary forest) for perhaps 4500ha (20 per cent). Sitio Kibang, site of the DAR office in the northern part of Barangay Ned, is located roughly 110km from Koronadal, the capital of South Cotabato, and just over 60km from Isulan in Sultan Kudarat, the nearest major market centre (Figure 13.1). Access is via a former logging road, which becomes impassable after heavy rain. Large trucks, jeepneys and motorcycles ply this route, but transportation is limited to motorcycles when road conditions deteriorate. Maize, the main commodity produced, is sold to the few private traders in Kibang or directly to Isulan, where prices are 30–40 per cent higher. Likewise, fertilizer, the main farm input used, is purchased from local traders or in Isulan, with a similar price differential. The margins largely reflect the high transport costs. There are six functioning cooperatives in the northern sitio, three of which deal with farm produce as well as consumables. Traders provide short-term seasonal credit for farm inputs, at interest rates of 5–25 per cent per month, as well as for consumption needs. Larger and longer-term capital requirements are often financed by mortgaging land. Employment is largely confined to agriculture, whether on- or off-farm; there is little non-farm employment in the barangay. Farm size averages just over 3ha. While most farmers have titles to their land (Certificates of Land Ownership Award or CLOA) issued by DAR in the 1990s, the tenure situation is complex and dynamic. Despite a ten-year restriction on the sale of CLOA, informal transactions have taken place and are accepted in the community. Some landowners have rented part or all of their land to tenants under a share-cropping arrangement. In other cases the land is mortgaged, with the mortgagee, the mortgagor or a tenant farming the land. Hence a significant proportion of farmers are not owner-operators. Though shifting cultivation of rice was once dominant, by the 1990s the farming systems of both indigenous and migrant farmers involved continuous cultivation of maize and (to a lesser degree) upland rice. Use of hybrid maize seed and inorganic fertilizer was increasing. The typical cropping pattern involves two croppings per year, with upland rice or maize cultivated in the first cropping and maize in the second. Maize is mainly cultivated for sale, while upland rice is mainly for home consumption, though maize is also consumed as a staple. Neither maize nor upland rice cultivation involved the use of soil conservation measures until NAIDP’s introduction of contour hedgerows or SALT in the mid1990s, which over 100 farmers had at least partially adopted. An on-farm research project within NAIDP (funded by ACIAR) also contributed to awareness of improved practices for steeplands. This project worked with farmer-cooperators to test a range of potentially high-value field crops (e.g. garlic, ginger and crucifers) and tree crops (e.g. coffee, mangosteen, durian and rambutan), integrated into three conservation farming options. The Mindanao Baptist Rural Life Centre (MBRLC) established a presence in some of the more remote sitio and also promoted adoption of SALT.
Landcare and Livelihoods 269
The difficult marketing environment had limited agricultural diversification. Taro, peanuts and beans were cultivated to a limited extent. Bananas were grown extensively, but only for the local market. Limited development of bunded rice fields had occurred along stream margins. Tree crops such as coffee, cocoa and fruit trees had been planted on a limited scale. Many households raised carabao, horses and chickens, while pigs and goats were raised by a smaller number of households. Barangay Ned thus provided a formidable challenge for the Landcare Programme. On the one hand, the site imposed severe limitations. The rural landscape had undergone rapid transformation due to the combined effects of shifting cultivation, logging and land clearance, exposing the soil to severe degradation. Increasing population density and isolation from markets dictated a farming system based on continuous cultivation of cereals, especially maize, which served as the only cash crop and increasingly as a substitute staple for rice. Farmers were poor, with little education, mostly lacking in experience of this upland environment, and not highly organized, relying on face-to-face contacts in small clan groupings and local neighbourhoods for support. Though aware of soil erosion, they lacked the knowledge and means to combat it. On the other hand, the site’s considerable agricultural potential, the dynamism characteristic of a frontier settler society, and the relative lack of previous intervention by agencies providing agricultural research and extension, meant the Landcare Programme could expect to generate a positive response among farmers.
The Ned Landcare Programme The Landcare Programme was well placed to build on the conservation farming component of the NAIDP and the on-farm research of the earlier ACIAR project. As the implementing agency for both projects, SEARCA could provide institutional continuity for the Landcare Programme, including first-hand awareness of the successes and failures of the previous efforts. Most important, the Landcare Facilitator had five years experience working for the ACIAR on-farm research project, developing and testing new farming practices with farmers and researchers. Thus the legacy of the two previous projects was that: (1) the Facilitator had considerable locally validated technical expertise, as well as credibility in the farming community; (2) there was already a pool of farmers around Kibang who had adopted contour hedgerows, experimented with alternative annual and perennial crops, and learned the benefits of working and learning together in small groups; and (3) there was experience in working with part-time, paid farmer-trainers. As part of the larger ACIAR Landcare Project, the Ned Landcare Programme brought two new emphases – the promotion of NVS as a simpler, lower-cost alternative to legume hedgerows and the formation of community landcare groups (as well as a Landcare Association and Landcare Advisory Group). Apart from the
270 Governance and Education
emphasis on groups, the Landcare Programme was primarily a programme of extension and training in technical aspects of farm development, including conservation measures and the establishment of new crops. Initially the Programme emphasized the ‘high-value’ field crops that the earlier ACIAR project had tested, but as problems of pest management and marketing emerged, and as previously planted fruit trees began to bear, the emphasis shifted to perennials – first coffee, then increasingly durian and other fruit trees. Farmers’ interest in acquiring planting materials and technical knowledge for crop diversification was used as the ‘entry point’ to encourage both adoption of conservation measures and membership of landcare groups. This strategy was highly successful – many landcare groups were formed and most landcare members established contour barriers on their farms. There was rapid formation of landcare groups over the first three years of the Landcare Programme, but at a declining rate (Figure 13.2). By 2002 there were 39 groups with 366 members, roughly 10 per cent of farm households in Ned. Whereas the Landcare Facilitator had initiated most of the groups formed in the first 12–18 months of the project, the appointment of part-time farmer-facilitators in mid-2000 meant that they took most responsibility for forming and supporting groups from that time, working as intermediaries between the Landcare Facilitator and the groups. Farmers also formed groups on their own, and in some cases helped neighbouring groups to get established. The growth in total landcare membership followed a similar path to the total number of groups, meaning there was no overall growth in the size of groups. Larger sitio-level groups tended to break up into smaller purok-level groups (a purok is a hamlet), reducing the costs to members of participation in meetings and group work, though some of these groups lacked leadership and lost momentum. Security problems in the south of the barangay disrupted some groups. There was a steady rate of adoption of contour barriers by landcare group members – about 50ha a year. In most cases group activities (such as meetings and group work) declined once most members had been helped to implement contour
Figure 13.2 Number of landcare groups and members in Ned
Landcare and Livelihoods 271
barriers. The ongoing interest in fruit tree production was largely met through establishment of individual rather than group nurseries, though landcare membership provided access to group training events and assistance from facilitators. However, a few groups had developed sufficient momentum to move beyond the initial focus on conservation farming, developing their own projects to meet the needs of members, e.g. for cheaper farm inputs and medicines. The training provided to landcare groups appeared to decline over time, which may have been one reason for the general decline in group activity. The training was mainly technical, dealing with contour farming, vegetable production, and propagation and establishment of perennials, though there was an increase in the number of training events dealing with group organization and facilitation. The Ned Landcare Association (NLCA), formed in 1999, comprised the leader of each landcare group as well as the Landcare Facilitator and staff of DAR and MBRLC. It was an active association, no doubt helped by the involvement of the Facilitator. It met quarterly to exchange information, planned and organized barangay-wide landcare activities and took initiatives on behalf of the landcare groups, securing grants and loans for nursery materials and seeds. A Landcare Advisory Group was established but probably added little to the informal linkages developed by the Landcare Facilitator. Linkages with local government units (LGU) were relatively weak. Officers of the Barangay Council gave little attention to Landcare, though more recently there were moves by landcare leaders to get representation on the council, and the Landcare Association had secured a grant from the council. As Barangay Ned was remote from the municipal LGU, the mayor and other officials knew little about the Landcare Programme. Other institutions provided minimal support, though the MBRLC collaborated closely with the Landcare Programme.
Impacts of the programme Based on the household survey, over a third of farmers in Barangay Ned (38 per cent) had adopted conservation measures (vegetative barriers, physical barriers and/or tree planting), affecting about 16 per cent of the total cultivated area (Table 13.1). As conservation measures were adopted preferentially on steeply sloping land, the impact of adoption on the catchment as a whole would have been greater than the figure of 16 per cent suggests. In most cases the adopted measures were considered effective in controlling erosion and had been maintained or expanded. Further expansion of vegetative or physical barriers on adopters’ farms was slow, but expansion of tree planting, especially fruit trees, was underway. There was evidence that diffusion of conservation practices to additional farmers was still occurring. The primary reasons for adopting (or planning to adopt) conservation measures were to control erosion and restore soil fertility. Prospective adopters were also hoping to receive benefits from the Landcare Programme, especially fruit tree seedlings. The main reasons given for not yet adopting were the lack of time or interest,
272 Governance and Education
the perceived difficulty of maintaining contour hedgerows and lack of ownership rights to the land. A statistical comparison between adopters and non-adopters suggested that age, education, gender, place of origin, farming experience in the region, availability of family labour for farm work, engagement in off-farm employment and accessibility to the market centre and to extension personnel were not in themselves major factors in the adoption decision (Table 13.2). Non-adopters seemed as aware of soil erosion as adopters. Farmers with larger farms who owned part or all of their farms were significantly more likely to be adopters (Table 13.2), though the relationship between farm size, tenure and adoption was complex and dynamic. The main difference between adopters and non-adopters was that more of the former had acquired knowledge of conservation measures, mostly within the previous eight years (Table 13.3; Figure 13.3). This had occurred primarily through practical, farmer-led training events arranged by SEARCA and other agencies (both before and during the Landcare Programme), and secondarily through observation of neighbour’s farms where conservation measures had been implemented (Table 13.4). Farmers’ perceptions of trends within their farming operations gave some insight into the impact of adopting conservation measures. Adoption was associated with relatively favourable net trends in maize yield (though not farming operations gave some insight into the necessarily in total maize output), soil loss, soil impact of adopting conservation measures, fertility, use of fertilizer, forage supply and the planting of fruit trees. However, adoption was also associated with an increased workload for men and did not yet result in a clear trend in farm cash income. The Landcare Programme was widely known and about 25 per cent of the farmers surveyed were members of a landcare group. Landcare membership was positively associated with adoption (51 per cent of adopters were landcare members compared with only 8 per cent of non-adopters; Table 13.5). However, membership in itself was neither necessary nor sufficient to induce adoption of
Figure 13.3 Growth in knowledge of soil conservation measures among survey farmers in Barangay Ned to 2001
Landcare and Livelihoods 273 Table 13.1 Extent of adoption of conservation measures in Barangay Ned, 2002 Conservation measure(s) adopted
Tree Vegetative Physical VB and/ planting barriers (VB) barriers (PB) or PB (TP)
No. of adopters
84
% Total farmers in sample
29
99
32
VB, PB and/or TP 119
27.1
9.4
31.9
10.3
38.4
Average farm size of adopters (ha)
3.8
3.8
3.8
3.6
3.8
Area of adopted measure – mean (ha)
1.3
1.0
1.4
0.8
1.4
Area of adopted measure – range (ha)
0.25–5.0
0.1–3.0
Area of adopted measure as % of adopters’ farms
34.8
26.7
36.6
22.9
36.8
Area of adopted measure as % of total farm area in sample
10.5
2.8
13.3
2.5
15.8
0.25–5.0 0.25–3.0 0.25–8.0
Table 13.2 Characteristics of farm households in Barangay Ned, by adoption category, 2001 Characteristic Mean age of household head (years)
Adopters Non-adopters (n = 106) (n = 207)
Total (n = 313)
42.5
38.9
40.1
Mean education of household head (years)
6.9
6.0
6.3
Mean residence of household head (years)
13.9
12.5
13.0
Indigenous to area (T’boli) (%)
15.1
18.8
17.6
1.9
1.9
1.9
on-farm work only (%)
77.4
75.4
76.0
off-farm work only (%)
0.0
1.0
0.6
Female-headed households (%) Occupation of household head
both on-and off-farm work (%)
22.6
22.2
22.4
Mean no. of household members
5.5
5.2
5.3
Mean no. of farm workers
2.6
2.5
2.6
Mean area of farm (ha)*
3.5
3.0
3.2
owner-operator (%)
61.3
48.3
52.7
non-owner (%)
16.0
34.8
28.4
mixed tenure (%)
22.6
16.9
18.9
Tenure status*
Note: * Indicates means or proportions for adopters and non-adopters were significantly different at the 5 per cent level.
274 Governance and Education Table 13.3 Knowledge of conservation measures reported by farmers in Barangay Ned, by adoption category, 2001 Conservation measures
Hedgerows*
Adopters (n = 106)
Non-adopters (n = 207)
Total (n = 313)
No.
%
No.
%
No.
%
71
67.0
49
23.7
120
38.3
Natural vegetative strips*
30
28.3
15
7.3
45
14.4
Contour ploughing*
11
10.4
9
4.4
20
6.4
Bench terraces*
9
8.5
1
0.5
10
3.2
Contour bunds*
12
11.3
3
1.5
15
4.8
Contour fencing
4
3.8
2
1.0
6
1.9
Contour composting
3
2.8
2
1.0
5
1.6
Drainage canals
2
1.9
2
1.0
4
1.3
Soil traps
3
2.8
0
0.0
3
1.0
Minimum tillage
2
1.9
0
0.0
2
0.6
Rockwalls
1
0.9
0
0.0
1
0.3
Contour canals
0
0.0
0
0.0
0
0.0
Other field measures
3
2.8
0
0.0
3
1.0
Planting trees*
33
31.1
18
8.7
51
16.3
Any measure*
105
99.1
75
36.2
180
57.5
Note: * Indicates proportions for adopters and non-adopters were significantly different at the 5 per cent level.
Table 13.4 Source of knowledge about conservation measures reported by farmers in Barangay Ned, by adoption category, 2001 Source of knowledge about conservation measures
Adopters (n = 106)
Non-adopters (n = 207)
Total (n = 313)
No.
%
No.
%
No.
%
56
52.8
30
14.5
86
27.5
Observation of other farms
43
40.6
36
17.4
79
25.2
Parents
10
9.4
10
4.8
20
6.4
Seminar/training
Farm leader Organized cross-farm visit Another farmer’s advice
8
7.6
5
2.4
13
4.2
10
9.4
1
0.5
11
3.5
2
1.9
5
2.4
7
2.2
Demonstration plot
2
1.9
2
1.0
4
1.3
Other
9
8.5
5
2.4
14
4.5
Landcare and Livelihoods 275 Table 13.5 Landcare membership status, by adoption category, 2002 Landcare membership status
Adopters No.
%
Non-adopters No.
%
Total No.
%
Current member*
61
51.3
16
8.4
77
24.8
Former member
15
12.6
20
10.5
35
11.3
Current or former member*
76
63.9
36
18.9
112
36.1
Never a member
38
31.9
107
56.0
145
46.8
No answer Total
5
4.2
48
25.1
53
17.1
119
100.0
191
100.0
310
100.0
Note: * Indicates proportions for adopters and non-adopters were significantly different at the 5 per cent level.
conservation practices – almost half the adopters were not landcare members and over 20 per cent of landcare members were not adopters. This suggests that extension and training, and observation of neighbouring farms, were more influential in encouraging farmers to adopt conservation measures than landcare membership per se. Landcare members were more likely to have participated in formal training and cross-farm visits, however, in some cases this would have preceded rather than followed the formation or joining of a landcare group. The main reasons given for joining a landcare group were economic – to learn about farm technologies and receive benefits such as tree seedlings. Secondary reasons were social in nature – to have a group of friends and attend meetings. Where problems were encountered they centred on misunderstandings, poor communication, lack of participation and disunity within the group, all related to lack of leadership or regular contact with a facilitator. In some cases this had led to members dropping out or the group disbanding. Non-members generally felt they were too busy to join or that there was no point as they were not landowners.
Discussion In this section, the facts of the Landcare Programme in Ned as summarized above are analysed and interpreted explicitly from a sustainable livelihoods perspective. At the outset the farming community in Ned was severely lacking in access to livelihood resources, including physical, financial, human and social capital (especially bridging social capital), and as a consequence was rapidly depleting its natural capital. The dominant livelihood strategies from the early 1980s had been, first, migration into the Ned Settlement Area, followed by ‘extensification’ through land clearing, then intensification of the farming system, with very little opportunity for on- or off-farm diversification. For indigenous farmers, the opening up of their lands to logging and settlement had also necessitated a strategy of agricultural
276 Governance and Education
intensification. The main institution mediating access to resources had been DAR, allocating equal-sized lots to agrarian reform beneficiaries. However, informal land and capital markets developed, leading to a rapidly growing inequality in access to land. The result was differential livelihood outcomes for different classes of farm household, especially owners and tenants. Though outcomes varied, for many households livelihood security was not assured and environmental sustainability was also under threat. Hence there was a ready interest in the Landcare Programme’s twin emphasis on soil conservation and developing new livelihood activities. Building on previous project experience in Ned, the Landcare Programme became an important new element in the farmers’ institutional environment, particularly in the form of the resident Landcare Facilitator, whose commitment, skills and local reputation were crucial to the Programme’s success. As described above, the Programme targeted: (1) the training of farmers in soil conservation (especially NVS) and agroforestry, with a high degree of involvement of farmer-adopters in the training process; and (2) the formation of landcare groups, linked in a landcare association. In other words, the Programme focused on building human capital (in the form of knowledge and skills to implement soil conservation measures and other farm improvements) and social capital (in the form of improved communication and cooperation through local landcare groups, linked in a barangaywide landcare association). The Programme provided little in the form of financial capital, though planting materials were an important input. In evaluating the Programme it is important to assess the relative importance of these different forms of capital investment and their interrelationships. The evidence suggests that the enhancement of human capital was the key to the rapid adoption of soil conservation measures. While adoption was positively associated with farm size and ownership, the main distinguishing feature of adopters was their exposure to training. The practical, farmer-to-farmer nature of this training was the key to its effectiveness, combined with the relative simplicity and effectiveness of the contour farming technology promoted. While soil conservation was a primary focus of landcare training activities, farmers were at least as interested in accessing new livelihood opportunities, principally through planting fruit and timber species in their contoured farms. Linking adoption of conservation measures to these new opportunities was an effective strategy. On the face of it, the building of social capital was of secondary importance. Though formation of landcare groups assisted members to learn about and implement conservation practices, many adopters were not landcare members and not all landcare members were adopters. Those farmers who joined landcare groups did so primarily to access training, technical advice and assistance (e.g. with planting materials), that is, to augment their human and, to some degree, their financial capital. While a few landcare groups developed a dynamism of their own, identifying new needs and organizing activities to meet those needs, most groups became less active once members had been assisted to contour their farms. Some groups disbanded because of internal conflicts or external changes. The personal qualities of the group leader were a key factor in maintaining and expanding the group’s
Landcare and Livelihoods 277
activities, along with the degree of contact and support from landcare facilitators (including farmer-facilitators). Nevertheless, some members of apparently defunct groups suggested that because group members were close neighbours or kin, they could readily reactivate the group if there was a perceived need, suggesting that their social capital had not been eroded and, in fact, existed independently of the formation or demise of their landcare group. Moreover, the Landcare Association, working on behalf of the local groups and in conjunction with the Landcare Facilitator, was influential in organizing training and accessing outside resources, e.g. from local and provincial government, as well as bringing together and supporting local group leaders who would otherwise have been very isolated (in particular, farm leaders from remote T’boli settlements). The key to understanding these developments lies in the distinction between bonding and bridging social capital, mentioned above. Typically, there was already a high level of bonding social capital in the local communities where landcare groups were formed – hence the ease of group formation. Forming a landcare group was a reflection of this initial stock of social capital rather than a means of generating greater local-level integration. For example, implementing contour barriers through small work groups was a natural extension of the system of labour exchange already in place in both indigenous and immigrant communities. The persistence of a group both reflected and reinforced the degree of trust and cooperation in these pre-existing social bonds. However, forming or joining a landcare group also meant linking to a much wider network than provided by the local community. Hence it can be viewed primarily as an investment in bridging social capital. The bridges included horizontal linkages with progressive farmers in other localities through the municipalwide landcare association, as well as vertical linkages with SEARCA and other outside agencies. (Some writers now make a conceptual distinction between such horizontal extra-community ties, which they term ‘bridging social capital’, and vertical ties, termed ‘linking social capital’.) This dimension of landcare clearly augmented the stock of social capital in ways that provided significant benefits, both to members and non-members of community landcare groups (note that many farmers learned the new conservation practices directly from their neighbours). Hence the decline of local group activity often merely reflected a declining immediate need for that kind of activity (contouring, nursery establishment) but not a declining interest in the bridging social capital provided by the landcare network. In some respects, the development of this bridging social capital actually undermined the bonding social capital encapsulated in the local groups, as predicted by Woolcock (1998). In particular, as members gained knowledge and experience in nursery management through the communal landcare nurseries, some preferred to develop private nurseries and pursue commercial outlets for their planting materials (a phenomenon that had occurred earlier in the landcare sites at Claveria and Lantapan). However, such individuals still valued the links to the Landcare Facilitator and the Association.
278 Governance and Education
Ongoing investment to maintain and expand the stock of bridging social capital was clearly needed. In particular, the support of LGUs at the barangay and municipal levels that was evident in the Claveria Landcare Programme was not found to the same degree in Ned. This did not appear to have hindered landcare activities in the short term and may in fact have encouraged the Association leaders to organize, including the mobilization of political support. However, the presence of a strong facilitating institution (SEARCA) had been essential, offsetting the immediate need for partnership with LGUs. In the longer term, stronger links with an array of government and non-government agencies would be needed to sustain the Landcare Programme in Ned. It can be concluded that the Landcare Programme had made a significant investment in livelihood resources, notably human and social capital, with the investment in social capital providing the necessary linkages for the adaptive research and farmer-to-farmer training activities that led to the growth of human capital. However, the outcomes of the Landcare Programme for both livelihood security and environmental sustainability were not as easy to establish. There was clear evidence that adoption of the recommended conservation practices had a significant impact on reducing soil erosion, hence on maintaining farmers’ natural capital. The catchment-wide impacts remain to be investigated. Although these wider impacts are likely to have been positive, with only 16 per cent of the total cultivated area under conservation measures, the total impact is unclear. The impact on farm incomes was not obvious in the short term and was likely to be primarily a function of the changed cropping practices implemented on the contoured farms, that is, the diversification of livelihood activities. Farm budgets suggest that the expansion of tree crops will ultimately lead to a quantum jump in farm incomes, relative to merely maintaining maize yields. The full realization of these livelihood benefits will depend to a large degree on continuing investment in physical capital in the form of improved transport infrastructure, something that is beyond the scope of the Landcare Programme.
Conclusion The study found that the Landcare Programme in Barangay Ned has been associated with rapid adoption of simple conservation farming practices, especially natural vegetative strips, and the rapid formation of local landcare groups and a barangay-wide landcare association. Such rapid adoption has not often been observed in the Philippine uplands. Using a sustainable rural livelihoods framework for the evaluation study helped to place these phenomena within the context of the agroecological and institutional changes that had been taking place in the preceding two decades, and the evolving livelihood strategies of rural households in Ned, particularly their interest in on-farm diversification to augment their meagre cash incomes. The most important effect of the Landcare Programme was to
Landcare and Livelihoods 279
enhance the human capital of the farming population through practical, farmerled training and extension, enabling farmers to incorporate soil conservation and agroforestry technologies in their farming systems, with desirable outcomes both for livelihood security and environmental sustainability. The social capital formed through the Programme, particularly the bridging social capital in the form of the Ned Landcare Association and its networks, was crucial to the growth in human capital. Nevertheless, ongoing investment was required to maintain and expand the stock of social capital for the longer term success of the Programme, including its capacity to be scaled up to embrace other localities. The larger message from the study is that the promotion of conservation farming systems in fragile and impoverished upland environments requires an approach that embraces sustainable rural livelihoods, both for farm households and local communities, rather than narrowly focusing on the transfer of technology or the imposition of environmental regulations. While the availability of simple, welladapted conservation practices is a key starting point, programme interventions such as the Landcare Programme that invest in human and social capital – thus building the capacity of farmers and farming communities to identify and pursue sustainable livelihood strategies – are essential to achieving the twin goals of rural development and environmental conservation. However, such farmer-led approaches still require ongoing partnerships with adequately resourced facilitating agencies, whether local government units or non-government organizations, or (preferably) both.
Acknowledgements We are grateful to Emily Garcia, Art Gomez, Lorena Loma and Eldon Ruiz of SEARCA for assistance and advice in conducting the study reported in this paper. The study was funded by the Australian Centre for International Agricultural Research (ACIAR). Thanks to David Swete-Kelly, Meine van Noordwijk, the editor and reviewers for comments on the draft paper. An earlier version of the paper was presented at the Australian Farming Systems Conference, Toowoomba, Queensland, 7–11 September 2003.
References Arcenas A. 2002. Farmer-led soil conservation initiative in a developing country setting: The case of the Claveria Land Care Association in Claveria, Misamis Oriental, Philippines. PhD dissertation, Michigan State University Campbell A. 1994. Landcare: Communities Shaping the Land and the Future. Sydney: Allen and Unwin Cary J. and Webb T. 2000. Community Landcare, the National Landcare Program and the Landcare Movement: The Social Dimensions of Landcare. Canberra: Bureau of Rural Sciences
280 Governance and Education Chambers R. 1987. Sustainable Livelihoods, Environment and Development: Putting Poor Rural People First. IDS Discussion Paper 240. Brighton: Institute of Development Studies, University of Sussex Chambers R. and Conway G. R. 1992. Sustainable Rural Livelihoods: Practical Concepts for the 21st Century. IDS Discussion Paper 296. Brighton: Institute of Development Studies, University of Sussex Cramb R. A. 1998. Environment and development in the Philippine uplands: The problem of agricultural land degradation. Asian Studies Review 22, 289–308 Cramb R. A. (ed.) 2000. Soil Conservation Technologies for Smallholder Farming Systems in the Philippine Uplands: A Socio-Economic Evaluation. ACIAR Monograph No. 78. Canberra: Australian Centre for International Agricultural Research Cramb R. A. 2004. Social capital and soil conservation: Evidence from the Philippines. Contributed Paper, 48th Annual Conference of the Australian Agricultural and Resource Economics Society, Melbourne, 10–13 February 2004 Cramb R. A. and Culasero Z. 2003. Landcare in the Philippines: An Evaluation of the Landcare Program in South Cotabato. Draft Report. Brisbane: School of Natural and Rural Systems Management, University of Queensland Cramb R. A., Garcia J. N. M., Gerrits R. V. and Saguiguit G. C. 1999. Smallholder adoption of soil conservation technologies: Evidence from upland projects in the Philippines. Land Degradation and Development 10, 405–423 Cramb R. A., Garcia J. N. M., Gerrits R. V. and Saguiguit G. C. 2000. Conservation farming projects in the Philippine uplands: Rhetoric and reality. World Development 28, 911–928 Ellis F. 2000. Rural Livelihoods and Diversity in Developing Countries. Oxford: Oxford University Press Ellis F. and Biggs S. 2001. Evolving themes in rural development, 1950s–2000s. Development Policy Review 19, 437–448 Lockie S. and Vanclay F. (eds) 1997. Critical Landcare. Wagga Wagga: Centre for Rural Social Research, Charles Sturt University Mercado A. R., Patindol M. and Garrity D. P. 2001. The landcare experience in the Philippines: Technical and institutional innovations for conservation farming. Development in Practice 11, 495– 508 Pretty J. 2003. Social capital and the collective management of resources. Science 302, 1912–1914 Pretty J. and Ward H. 2001. Social capital and the environment. World Development 29, 209–227 Sabio E. A. 2002. Social capital and transformative learning: Linkages and dynamics in inter-organisational relations within the landcare approach in the Philippines. PhD dissertation, Cornell University Scoones I. 1998. Sustainable Rural Livelihoods: A Framework for Analysis. IDS Working Paper 72. Brighton: Institute of Development Studies, University of Sussex Stark M. 2000. Soil Management Strategies to Sustain Continuous Crop Production between Vegetative Contour Strips on Humid Tropical Hillsides: Technology Development and Dissemination based on Farmers’ Adaptive Field Experimentation in the Philippines. Bogor: Southeast Asia Regional Research Program, International Centre for Research in Agroforestry Woolcock M. 1998. Social capital and economic development: Toward a theoretical synthesis and policy framework. Theory and Society 27, 151–208 Woolcock M. and Narayan D. 2000. Social capital: Implications for development theory, research, and policy. World Bank Research Observer 15, 225–249
14
Conserving Communities Wendell Berry
In October of 1993, the New York Times announced that the United States Census Bureau would ‘no longer count the number of Americans who live on farms’. In explaining the decision, the Times provided some figures as troubling as they were unsurprising. Between 1910 and 1920, we had 32 million farmers living on farms – about a third of our population. By 1950, this population had declined, but our farm population was still 23 million. By 1991, the number was only 4.6 million, less than 2 per cent of the national population. That is, our farm population had declined by an average of almost half a million people a year for 41 years. Also, by 1991, 32 per cent of our farm managers and 86 per cent of our farm workers did not live on the land they farmed. These figures describe a catastrophe that is now virtually complete. They announce that we no longer have an agricultural class that is, or that can require itself to be, recognized by the government; we no longer have a ‘farm vote’ that is going to be of much concern to politicians. American farmers, who over the years have wondered whether or not they counted, may now put their minds at rest: they do not count. They have become statistically insignificant. We must not fail to appreciate that this statistical insignificance of farmers is the successful outcome of a national purpose and a national programme. It is the result of great effort and of principles rigorously applied. It has been achieved with the help of expensive advice from university and government experts, by the tireless agitation and exertion of the agribusiness corporations, and by the renowned advantages of competition – of our farmers among themselves and with farmers of other countries. As a result, millions of country people have been liberated from farming, landownership, self-employment and other idiocies of rural life. But what has happened to our agricultural communities is not exceptional any more than it is accidental. This is simply the way a large, exploitive, absentee economy works. For example, here is a New York Times News Service report on ‘rape-and-run’ logging in Montana: Reprinted from Berry W. 1996. Conserving communities. In Vitek W and Jackson W (eds) Rooted in the Land: Essays on Community and Place. Yale University Press, New Haven and London. pp76–84.
282 Governance and Education Throughout the 1980s, the Champion International Corp. went on a tree-cutting binge in Montana, leveling entire forests at a rate that had not been seen since the cut-and-run logging days of the last century. Now the hangover has arrived. After liquidating much of its valuable timber in the Big Sky country, Champion is quitting Montana, leaving behind hundreds of unemployed mill workers, towns staggered by despair and more than 1,000 square miles of heavily logged land.
The article goes on to speak of the revival of ‘a century-old complaint about large, distant corporations exploiting Montana for its natural resources and then leaving after the land is exhausted’. And it quotes a Champion spokesman, Tucker Hill, who said: ‘We are very sympathetic to those people and very sad. But I don’t think you can hold a company’s feet to the fire for everything they did over the last twenty years.’ If you doubt that exhaustion is the calculated result of such economic enterprise, you might consider the example of the mountain counties of eastern Kentucky from which, over the last three-quarters of a century, enormous wealth has been extracted by the coal companies, leaving the land wrecked and the people poor. The same kind of thing is now happening in banking. In the county next to mine an independent local bank was recently taken over by a large out-of-state bank. Suddenly some of the local farmers and small-business people, who had been borrowing money from that bank for 20 years and whose credit records were good, were refused credit because they did not meet the requirements of a computer in a distant city. Old and once-valued customers now find that they are known by category rather than character. The directors and officers of the large bank clearly have reduced their economic thinking to one very simple question: ‘Would we rather make one big loan or many small ones?’ Or to put it only a little differently: ‘Would we rather support one larger enterprise or many small ones?’ And they have chosen the large over the small. This economic prejudice against the small has, of course, done immense damage for a long time to small or family-sized businesses in city and country alike. But this prejudice has often overlapped with an industrial prejudice against anything rural and against the land itself, and this prejudice has resulted in damages that are not only extensive but also long-lasting or permanent. As we all know, we have much to answer for in our use of this continent from the beginning, but in the last half-century we have added to our desecrations of nature a deliberate destruction of our rural communities. The statistics I cited at the beginning are incontrovertible evidence of this. But so is the condition of our farms and forests and rural towns. If you have eyes to see, you can see that there is a limit beyond which machines and chemicals cannot replace people; there is a limit beyond which mechanical or economic efficiency cannot replace care. I am talking here about the common experience, the common fate, of rural communities in our country for a long time. It has also been, and it will increasingly be, the common fate of rural communities in other countries. The message
Conserving Communities 283
is plain enough, and we have ignored it for too long: the great, centralized economic entities of our time do not come into rural places in order to improve them by ‘creating jobs’. They come to take as much of value as they can take, as cheaply and as quickly as they can take it. They are interested in ‘job creation’ only so long as the jobs can be done more cheaply by humans than by machines. They are not interested in the good health – economic or natural or human – of any place on this Earth. And if you should undertake to appeal or complain to one of these great corporations on behalf of your community, you would discover something most remarkable: you would find that these organizations are organized expressly for the evasion of responsibility. They are structures in which, as my brother says, ‘the buck never stops’. The buck is processed up the hierarchy until finally it is passed to ‘the shareholders’, who characteristically are too widely dispersed, too poorly informed and too unconcerned to be responsible for anything. The ideal of the modern corporation is to be (in terms of its own advantage) anywhere and (in terms of local accountability) nowhere. The message to country people, in other words, is this: Don’t expect favours from your enemies. And that message has a corollary that is just as plain and just as much ignored: the governmental and educational institutions from which rural people should by right have received help have not helped. Rather than striving to preserve the rural communities and economies and an adequate rural population, these institutions have consistently aided, abetted and justified the destruction of every part of rural life. They have eagerly served the superstition that all technological innovation is good. They have said repeatedly that the failure of farm families, rural businesses and rural communities is merely the result of progress and efficiency and is good for everybody. We are now pretty obviously facing the possibility of a world that the supranational corporations, and the governments and educational systems that serve them, will control entirely for their own enrichment – and, incidentally and inescapably, for the impoverishment of all the rest of us. This will be a world in which the cultures that preserve nature and rural life will simply be disallowed. It will be, as our experience already suggests, a postagricultural world. But as we now begin to see, you cannot have a postagricultural world that is not also postdemocratic, postreligious, postnatural – in other words, it will be posthuman, contrary to the best that we have meant by ‘humanity’. In their dealings with the countryside and its people, the promotors of the socalled global economy are following a set of principles that can be stated as follows. They believe that a farm or a forest is or ought to be the same as a factory; that care is only minimally necessary in the use of the land; that affection is not necessary at all; that for all practical purposes a machine is as good as a human; that the industrial standards of production, efficiency and profitability are the only standards that are necessary; that the topsoil is lifeless and inert; that soil biology is safely replaceable by soil chemistry; that the nature or ecology of any given place is irrelevant to the use of it; that there is no value in human community or neighbourhood; and that technological innovation will produce only benign results.
284 Governance and Education
These people see nothing odd or difficult about unlimited economic growth or unlimited consumption in a limited world. They believe that knowledge is property and is power, and that it ought to be. They believe that education is job training. They think that the summit of human achievement is a high-paying job that involves no work. Their public boast is that they are making a society in which everybody will be a ‘winner’ – but their private aim has been to reduce radically the number of people who, by the measure of our historical ideals, might be thought successful: the independent, the self-employed, the owners of small businesses or small usable properties, those who work at home. The argument for joining the new international trade agreements has been that there is going to be a one-world economy, and we must participate or be left behind – though, obviously, the existence of a one-world economy depends on the willingness of all the world to join. The theory is that under the rule of international, supposedly free, trade products will naturally flow from the places where they can be best produced to the places where they are most needed. This theory assumes the long-term safety and sustainability of massive international transport, for which there are no guarantees, just as there are no guarantees that products will be produced in the best way or to the advantage of the workers who produce them or that they will reach or can be afforded by the people who need them. There are other unanswered questions about the global economy, two of which are paramount: How can any nation or region justify the destruction of a local productive capacity for the sake of foreign trade? and How can people who have demonstrated their inability to run national economies without inflation, usury, unemployment and ecological devastation now claim that they can do a better job in running a global economy? American agriculture has demonstrated by its own ruination that you cannot solve economic problems just by increasing scale and, moreover, that increasing scale is almost certain to cause other problems – ecological, social and cultural. We can’t go on too much longer, maybe, without considering the likelihood that we humans are not intelligent enough to work on the scale to which we have been tempted by our technological abilities. Some such recognition is undoubtedly implicit in American conservatives’ long-standing objection to a big central government. And so it has been odd to see many of these same conservatives pushing for the establishment of a supranational economy that would inevitably function as a government far bigger and more centralized than any dreamed of before. Long experience has made it clear – as we might say to the liberals – that to be free we must limit the size of government and we must have some sort of home rule. But it is just as clear – as we might say to the conservatives – that it is foolish to complain about big government if we do not do everything we can to support strong local communities and strong community economies. But in helping us to confront, understand and oppose the principles of the global economy, the old political alignments have become virtually useless. Communists and capitalists are alike in their contempt for country people, country life and country places. They have exploited the countryside with equal greed and
Conserving Communities 285
disregard. They are alike even in their plea that it is right to damage the present in order to make ‘a better future’. The dialogue of Democrats and Republicans or of liberals and conservatives is likewise useless to us. Neither party is interested in farmers or in farming or in the good care of the land or in the quality of food. Nor are they interested in taking the best care of our forests. The leaders of these parties are equally subservient to the supranational corporations. Of this the North American Free Trade Agreement and the new revisions to the General Agreement on Tariffs and Trade are proof. Moreover, the old opposition of country and city, which was never useful, is now more useless than ever. It is, in fact, damaging to everybody involved, as is the opposition of producers and consumers. These are not differences but divisions that ought not to exist because they are to a considerable extent artificial. The so-called urban economy had been just as hard on urban communities as it has been on rural ones. All these conventional affiliations are now meaningless, useful only to those in a position to profit from public bewilderment. A new political scheme of opposed parties, however, is beginning to take form. This is essentially a two-party system, and it divides over the fundamental issue of community. One of these parties holds that community has no value; the other holds that it does. One is the party of the global economy; the other I would call simply the party of local community. The global party is large, though not populous, immensely powerful and wealthy, selfaware, purposeful and tightly organized. The community party is only now becoming aware of itself; it is widely scattered, highly diverse, small though potentially numerous, weak though latently powerful and poor though by no means without resources. We know pretty well the makeup of the party of the global economy, but who are the members of the party of local community? They are people who take a generous and neighbourly view of self-preservation; they do not believe that they can survive and flourish by the rule of dog eat dog; they do not believe that they can succeed by defeating or destroying or selling or using up everything but themselves. They doubt that good solutions can be produced by violence. They want to preserve the precious things of nature and of human culture and pass them on to their children. They want the world’s fields and forests to be productive; they do not want them to be destroyed for the sake of production. They know you cannot be a democrat (small d) or a conservationist and at the same time a proponent of the supranational corporate economy. They believe – they know from their experience – that the neighbourhood, the local community, is the proper place and frame of reference for responsible work. They see that no commonwealth or community of interest can be defined by greed. They know that things connect – that farming, for example, is connected to nature, and food to farming, and health to food – and they want to preserve the connections. They know that a healthy local community cannot be replaced by a market or an entertainment industry or an information highway. They know that contrary to all the unmeaning and unmeant political talk about ‘job creation’, work ought not to be merely a bone thrown to the otherwise unemployed. They know that work ought to be necessary; it ought to be
286 Governance and Education
good; it ought to be satisfying and dignifying to the people who do it, and genuinely useful and pleasing to the people for whom it is done. The party of local community, then, is a real party with a real platform and an agenda of real and doable work. And it has, we might add, a respectable history in the hundreds of efforts, over several decades, to preserve local nature or local health or to sell local products to local consumers. Now such efforts appear to be coming into their own, attracting interest and energy in a way they have not done before. People are seeing more clearly all the time the connections between conservation and economics. They are seeing that a community’s health is largely determined by the way it makes its living. The natural membership of the community party consists of small farmers, ranchers and market gardeners, worried consumers, owners and employees of small shops, stores, community banks and other small businesses, self-employed people, religious people and conservationists. The aims of this party really are only two: the preservation of ecological diversity and integrity, and the renewal, on sound cultural and ecological principles, of local economies and local communities. So now we must ask how a sustainable local community (which is to say a sustainable local economy) might function. I am going to suggest a set of rules that I think such a community would have to follow. And I hasten to say that I do not consider these rules to be predictions; I am not interested in foretelling the future. If these rules have any validity, it is because they apply now. If the members of a local community want their community to cohere, to flourish and to last, these are some things they would do: 1 2 3 4 5 6 7 8 9
Always ask of any proposed change or innovation: What will this do to our community? How will this affect our common wealth? Always include local nature – the land, the water, the air, the native creatures – within the membership of the community. Always ask how local needs might be supplied from local sources, including the mutual help of neighbours. Always supply local needs first. (And only then think of exporting, first to nearby cities and then to others.) Understand the unsoundness of the industrial doctrine of ‘labour saving’ if that implies poor work, unemployment or any kind of pollution or contamination. Develop properly scaled value-adding industries for local products to ensure that the community does not become merely a colony of the national or global economy. Develop small-scale industries and businesses to support the local farm and/or forest economy. Strive to produce as much of the community’s own energy as possible. Strive to increase earnings (in whatever form) within the community and decrease expenditures outside the community.
Conserving Communities 287
10 Make sure that money paid into the local economy circulates within the community for as long as possible before it is paid out. 11 Make the community able to invest in itself by maintaining its properties, keeping itself clean (without dirtying some other place), caring for its old people, teaching its children. 12 See that the old and the young take care of one another. The young must learn from the old, not necessarily and not always in school. There must be no institutionalized ‘child care’ and ‘homes for the aged’. The community knows and remembers itself by the association of old and young. 13 Account for costs now conventionally hidden or ‘externalized’. Whenever possible, these costs must be debited against monetary income. 14 Look into the possible uses of local currency, community-funded loan programmes, systems of barter and the like. 15 Always be aware of the economic value of neighbourly acts. In our time the costs of living are greatly increased by the loss of neighbourhood, leaving people to face their calamities alone. 16 As a rural community, always be acquainted with, and complexly connected with, community-minded people in nearby towns and cities. 17 Formulate an economy that will always be more cooperative than competitive, for a sustainable rural economy is dependent on urban consumers loyal to local products. These rules are derived from Western political and religious traditions, from the promptings of ecologists and certain agriculturists and from common sense. They may seem radical, but only because the modern national and global economies have been formed in almost perfect disregard of community and ecological interests. A community economy is not an economy in which well-placed persons can make a ‘killing’. It is not a killer economy. It is an economy whose aim is generosity and a well-distributed and safeguarded abundance. If it seems unusual to hope and work for such an economy, then we must remember that a willingness to put the community ahead of profit is hardly unprecedented among community businesspeople and local banks. How might we begin to build a decentralized system of durable local economies? Gradually, I hope. We have had enough of violent or sudden changes imposed by predatory interests outside our communities. In many places, the obvious way to begin the work I am talking about is with the development of a local food economy. Such a start is attractive because it does not have to be big or costly, it requires nobody’s permission and it can ultimately involve everybody. It does not require us to beg for mercy from our exploiters or to look for help where consistently we have failed to find it. By ‘local food economy’ I mean simply an economy in which local consumers buy as much of their food as possible from local producers and in which local producers produce as much as they can for the local market. Several conditions now favour the growth of local food economies. On the one hand, the costs associated with our present highly centralized food system are
288 Governance and Education
going to increase. Growers in the Central Valley of California, for example, can no longer depend on an unlimited supply of cheap water for irrigation. Transportation costs can only go up. Biotechnology, variety patenting and other agribusiness innovations are intended not to help farmers or consumers but to extend and prolong corporate control of the food economy; they will increase the cost of food, both economically and ecologically. On the other hand, consumers are increasingly worried about the quality and purity of their food, and so they would like to buy from responsible growers close to home. They would like to know where their food comes from and how it is produced. They are increasingly aware that the larger and more centralized the food economy becomes, the more vulnerable it will be to natural or economic catastrophe, to political or military disruption and to bad agricultural practice. For all these reasons, and others, we need urgently to develop local food economies wherever they are possible. Local food economies would improve the quality of food. They would increase consumer influence over production; consumers would become participatory members in their own food economy. They would help to ensure a sustainable, dependable supply of food. By reducing some of the costs associated with long supply lines and large corporate suppliers (such as packaging, transportation and advertising), they would reduce the cost of food at the same time that they would increase income to growers. They would tend to improve farming practices and increase employment in agriculture. They would tend to reduce the size of farms and increase the number of owners. Of course, no food economy can be, or ought to be, only local. But the orientation of agriculture to local needs, local possibilities and local limits is indispensable to the health of both land and people, and undoubtedly to the health of democratic liberties as well. For many of the same reasons, we need also to develop local forest economies, of which the aim would be the survival and enduring good health of both our forests and their dependent local communities. We need to preserve the native diversity of our forests as we use them. As in agriculture, we need local, small-scale, non-polluting industries (sawmills, woodworking shops and so on) to add value to local forest products, as well as local supporting industries for the local forest economy. Just as support for sustainable agriculture should come most logically from consumers who consciously wish to keep eating, so support for sustainable forestry might logically come from loggers, mill workers and other employees of the forest economy who consciously wish to keep working. But many people have a direct interest in the good use of our forests: farmers and ranchers with woodlots, all who depend on the good health of forested watersheds, the makers of wood products, conservationists and others. What we have before us, if we want our communities to survive, is the building of an adversary economy, a system of local or community economies within, and to protect against, the would-be global economy. To do this, we must somehow learn to reverse the flow of the siphon that has for so long been drawing
Conserving Communities 289
resources, money, talent and people out of our countryside with very little if any return, and often with a return only of pollution, impoverishment and ruin. We must figure out new ways to fund, at affordable rates, the development of healthy local economies. We must find ways to suggest economically – for finally no other suggestion will be effective – that the work, the talents and the interest of our young people are needed at home. Our whole society has much to gain from the development of local land-based economies. They would carry us far toward the ecological and cultural ideal of local adaptation. They would encourage the formation of adequate local cultures (and this would be authentic multiculturalism). They would introduce into agriculture and forestry a sort of spontaneous and natural quality control, for neither consumers nor workers would want to see the local economy destroy itself by abusing or exhausting its sources. And they would complete at last the task of gaining freedom from colonial economics, begun by our ancestors more than 200 years ago.
15
Becoming an Agroecologist Through Action Education Geir Lieblein, Edvin Østergaard and Charles Francis
Introduction Education in agroecology (Francis et al, 2003), agricultural systems and sustainable agriculture can provide students with a broad curriculum that deals with the interaction among production, economic, environmental and social dimensions of farming and food systems. Courses in agroecology and organic farming are becoming more prevalent on university campuses in the Nordic region, Europe, US and elsewhere (Sriskandarajah et al, 2005). Yet we observe that in most programmes and courses the teaching methods have departed little from a strong emphasis on transmitting information through lectures, some discussion and library readings, and periodic trips to farms that often turn into lectures in the field. The predominance of lectures and narrowly focused courses are used in many agriculture and food system curricula as an accepted and even expected approach to education that fits into the comfort zones of both teacher and student. The majority of university teachers are specialists in research disciplines in science where they did graduate study, and few have experienced formal courses in educational history and theory. They are unfamiliar with the tenets of John Dewey’s admonition that learning should not be authoritarian, but should begin with the experience of the individual students (Dewey, 1916). Even teachers in agriculture who are not versed in the education literature will identify with Mezirow’s (2000) thesis that the way in which we build understanding around a specific context often reflects our initial assumptions. We have more difficulty dealing with his conclusion that there are no fixed truths nor definitive knowledge, though a growing appreciation of the complexity of farming and food systems is leading us as agricultural scientists in that direction. Mezirow’s transformation theory helps us understand how important it is to become aware of our assumptions and expectations, and to adjust those to the students or farmers we Reprinted from Lieblein G, Østergaard E and Francis C. 2004. Becoming an agroecologist through action education, Int. J. Agric. Sust. 2(3), 147–153, Earthscan, London.
Becoming an Agroecologist Through Action Education 291
work with in the educational arena. Mezirow emphasized the need to critically reflect on the assumptions and beliefs that shape practice, and proposed that such reflection can transform our knowledge. We can then appreciate how these assumptions can filter our experiences as well as our awareness and understanding of what we observe, much as Kuhn (1962) describes the adherence to a dominant paradigm in each field of study. Boud et al (1993) emphasize the importance of how learning occurs in many places, and how this shapes our total experience and our lives. We learn to deal with complexities of systems, our own and others’ personal commitments and the emotions and feelings that help shape each ‘learning landscape’. In line with John Dewey, Boud and colleagues emphasize that (1) experience is the foundation for learning, (2) learners actively construct their experience, (3) the process is inherently holistic, (4) learning is socially and culturally constructed, and (5) the entire educational process is strongly influenced by the socio-emotional context in which it occurs. We have taken these lessons to heart in design of the Nordic region programme in Agroecology (Francis et al, 2001; Lieblein et al, 1999, 2001a, 2001b) and an Agroecosystems Analysis course in the US Midwest (Wiedenhoeft et al, 2003) that both feature action and participation-based learning. An allied term used for education that moves students onto the farm and into the community to deal with people and challenges in real-life situations is ‘service learning’ (Benson and Harkavy, 2000; Pollack, 1999), where students go beyond observation and become proactive in community change. In the Nordic and Midwest programmes, teachers and students share the responsibility for learning. Faculty act as guides or learning leaders to organize an educational environment or ‘learning landscape’ where it is conducive and safe to explore and discover. The field is broadened from focus on the teacher to also encompass the students and their experiences. Maximum attention is placed on the process of learning, or learning how to learn, rather than on the specific content that is transitory and often outdated by the time it reaches the classroom. In addition to the knowledge goals that are the focus of most university programmes, we bring attention to the skills and attitudes that people have toward the material, and to their potential for visioning into the future. Our primary goal is to nurture the development of autonomous graduates who are prepared to deal with complexity and change, rather than continuing to focus on the curriculum and on what we can prepare and present in the confines of the classroom. As organizers of this learning landscape, we can prepare the next generation of agroecologists to deal effectively with a rapidly changing and undefined future. In this article we use action learning in its broadest sense: learning through action (McGill and Beaty, 2001). Action learning draws upon the works of Reg Revans (1998), who coined the term, as well as on experiential learning (Dewey, 1916; Kolb, 1984) and critical reflection (Mezirow, 2000). Through action learning, students and teachers learn with and from each other by working together to improve real situations, and by reflecting on their own experiences (McGill and Beaty, 2001).
292 Governance and Education
From Teaching to Learning One important reason for students to come to the university is to learn something they did not know. There are many dedicated teachers with broad appreciation of what is important, yet some topics may be chosen because they are the research specialties of teachers with narrow research or personal interests. We generally call ourselves teachers, and we really focus on doing teaching very well. Every university has teaching appointments, teaching evaluations and teaching awards. There is an implicit assumption that when we teach, someone will learn. In fact some of us have learned the importance of agroecology and the whole farm and food systems from within the conventional educational structures and integrated this with unique experiences achieved by farmers and others in the world outside academia. Our Nordic and Midwest agroecology groups strongly believe that we can make more progress through an explicit focus on students and on their learning rather than by fine-tuning classroom methods or the improved organization of a curriculum to fit our time-honoured beliefs in the importance of a certain list of basic and applied courses. This shift is in accordance with the direction of current pedagogical discourses and didactical thinking (Bawden et al, 2000; McGill and Beaty, 2001). ‘Just in time education’ is a concept that we are exploring for the sequencing of courses in the university curriculum (Salomonsson et al, 2005). Instructors and advisors in the Swedish Agricultural University observed that many students were postponing a required first-year chemistry class until their fourth or even fifth year of study. Careful questioning of students about why they made this decision revealed that many were unsure of how and why they were studying chemistry, except that it was a requirement. Other students were ready for the course in their first year, but many did not understand the context nor had they experienced the need for that information. During their fourth or fifth years, these latter students realized the need for such a course, and it was ‘just in time’ for them to take it at this stage. When the focus is on learning, we provide opportunities for students to enrol in courses that they find the most purposeful. This does not eliminate the need for thoughtful advising by teachers, who can guide students through the learning landscape to find those courses that will best help them gain the experience and skills that they will need to meet their individual long-term objectives.
Focus on Action Learning Learning through action and for action is a perspective which is drawn out of Dewey’s experience-based learning. According to Dewey, education and upbringing of children is life, and life itself is human growth and development: ‘Since growth is the characteristic of life, education is all one with growing; it has no end
Becoming an Agroecologist Through Action Education 293
beyond itself ’ (Dewey, 1916). His basic idea, learning by doing and reflecting, points at our experiences and activities in the world as starting points for learning. Reflective practice, which is so important for professional development, is, however, not an automatic result of experience, since doing does not necessarily lead to learning. It is then the task of the teacher to intentionally facilitate for a situation where learning based on lived experience can take place (van Manen, 1990). It is the task of the teacher to create a genuine situation for experience, which means that the learning of theoretical knowledge has to build on the students’ own experience. The basic principle of action learning is that learning and acting in the world is one and the same thing. As Argyris and Schön (1974, p4) state, ‘all human beings, not only professional practitioners, need to become competent in taking action and simultaneously reflect on this action to learn from it’. Learning is thus a process of reflecting on actions in the world, as they appear in one’s own experience. In recent years several other pedagogical methods have risen from these basic ideas of Dewey, as experiential learning (Bawden et al, 2000; Kolb, 1984) and problem-based learning (Barrows, 1985, 1986). According to situated learning (Lave and Wenger, 1990), learning as it normally occurs is a function of the activity, context and culture in which it is situated. The theory of situated learning states that in order to achieve a good learning situation, knowledge needs to be present in a socially and culturally authentic context. In accordance with the findings of Pfeffer (1998), we have observed over many years of dealing with students in the university that there is often a larger gap between knowledge and action than there is between ignorance and knowledge. This is not to endorse ignorance nor to minimize the importance of students expanding their knowledge base, but rather to achieve a compromise that shifts the balance away from total reliance on gaining knowledge to a new balance that puts emphasis on applications. Students may have knowledge and skills, but not an understanding of how to apply the knowledge to real life situations. Most education programmes are designed to add more knowledge and a few specialized skills to what students have already acquired from prior schooling. To be sure, it is important to know how to take soil samples or to recognize weeds in the field, as well as understand how to translate soil analyses or weed counts into recommendations for soil-fertility additives or methods of weed control. But we find that this is not sufficient. Bringing to attention attitudes toward the environment, and the rural clients with whom we work, is essential in putting knowledge to work. As teachers we obviously display our values, our attitudes and our passions about certain topics to the students, and this is one of the joys of teaching. But this is quite different than only teaching about our own attitudes or forcing a specific point of view. Rather it demonstrates the importance of recognizing attitudes and values as part of education and it is therefore essential for each student to examine their own. This step can bring them closer to action, because they experience that actions made to better the human situation are necessarily grounded in values and attitudes, and that their own actions have a similar grounding.
294 Governance and Education
Another important dimension of education is learning the power of visioning. In the quest for sustainable development, it is not enough to have knowledge and abilities to review the past and analyse the present. In addition, it is vital to have competencies in designing the future. Visionary thinking has a key role in building future-oriented competencies. In accordance with Parker (1990, pp1–2), we see visions as: powerful mental images of what we want to create in the future. They reflect what we care about the most, and are harmonious with our values and sense of purpose. Visions are the product of insight, values and imagination, they are the head and the heart working together.
According to Senge (1990), shared vision at its simplest level is the answer to the question, ‘What do we want to create?’ Visionary thinking, introduced through a three-day seminar for the MSc students, has played a key role in our agroecological education at the Norwegian University for Life Sciences over the past six years. Students value this approach, since developing a coherent view of a potential and desirable future enables them to integrate their diverse case experiences. It also allows them to use the creative sides of their personalities, establishing a bridge from analysing the past and present to start thinking about actions to move from the present to the future desired situation (Lieblein et al, 2001).
Key Characteristics of Agroecological Education Real life phenomena as the foundation for learning In contrast to a conventional course where the first lecture describes the history and foundation of that discipline, in the agroecology courses real life phenomena are established as the starting point for the learning process. Rather than agroecological theory having primary value, we immerse students in practical phenomena at the farming and food system levels, and let these phenomena determine what theory is necessary and relevant. We place high value on incorporating students’ lived experiences (van Manen, 1990), and reject the mystification of the experiences of everyday life. We think that real life phenomena provide the necessary foundation for inter- and trans-disciplinary activities, because they provide a common language between and among the traditional disciplines. Inductive learning is therefore the preferred basic mode of learning. Agroecology as such is not only a specific body of theory, but it also involves a meaningful way of dealing with complex phenomena in farming and food systems, with the goal to improve those systems. Through such an understanding of agroecology, its two related dimensions become clear: agroecology as a set of theories and as a set of abilities.
Becoming an Agroecologist Through Action Education 295
Inclusion of divergent modes of learning We further explicitly introduce the divergent mode of thinking and sharing experience early in the learning process. The process of convergence has been overemphasized as an analytical approach within academia, as opposed to a more innovative, divergent and unstructured mode of thinking and creating meaning. The balance between these two modes of thinking needs to be restored, and the interface between the two needs to be encouraged and expanded. In line with this we critically and creatively need to consider the whole range of possible pedagogical interventions to be able to meet the diverse needs of students, who come with different learning styles and different personal and cultural experiences.
Students as the focus of education One key principle in our planning and implementing the agroecology courses is that the student is placed in the centre of the activities. In other words, rather than looking at agroecology as a subject matter or discipline, we are concerned about the agroecologist. Thus, the primary goal is not to understand or analyse the agroecosystem, but rather to develop oneself as someone who puts agroecology into practice. More than a discussion about what is the necessary theory to cover is the exploration of what knowledge, skills, attitudes and capacities for visioning we consider important for the agroecologist to have to become an agent of change for sustainable development.
Explicit recognition of student contributions In line with placing the student in the centre of the programme, we are geared towards learning activities that celebrate and build on contributions from individual students. In this process, ‘the inside of the individual is brought out’, rather than a one-way information transmission that assumes that the mind of the student is an empty vessel to be filled with theory, ‘bringing the outside in’. We see this as an important prerequisite for developing the proactive capacities of students, to enable them to become agents of change. Examples of activities in the courses to build these skills are developing rich pictures of complex situations, mind mapping, dialogue, creative problem solving and visionary thinking. These are all activities driven by students and guided by teachers.
New Roles in Education Systems- and action-oriented learning implies new roles for all involved in the education of agroecologists. As already stated, the main challenge is to link the subject matter of agroecology, with its interdisciplinary and holistic character, to
296 Governance and Education
the students’ learning. Our approach, in accordance with action learning and experiential learning, has been to start with the experiences of the students, but not in a fundamentalist sense. As such we see the merging interest in action learning as a reaction to the traditional teaching and theory-based education. This swings the pendulum to the opposite extreme from where the focus is on the theories of the teacher. This has been a necessary shift of focus in education, but the sole application of experiences as a basis for learning has its limitations, and if pursued too far it becomes fundamentalist. The problem is that not all learning is based on our experiences: we also learn from others in a social setting (Bandura, 1977), from the culture in which we are embedded (Lave and Wenger, 1990), but also from theory that may come through a good lecture or a good book. The challenge is to blend many different approaches to meet the needs of many different students. Also, in a strict phenomenological sense, the diversity of real life phenomena needs to be met by a diversity of learning modes. It has been important for us not to go completely from the traditional theory-based teaching to the new practice-based experiences in one large leap, but to widen the field of learning for the students. They should be able to go deep into theory and then deep into practice. When the focus shifts from teacher to student all parties involved have to find their new roles within the educational system. Lieblein and Østergaard (2001) have called this a ‘pedagogy of no mercy’, because the feedback becomes especially clear and explicit. The real challenge in a ‘pedagogy of no mercy’ is that changing from lecturing to improving the students’ learning implies losing the control of the learning situation. Through this process the teachers’ role changes; the teachers still have the responsibility for the overall learning process, as learning leaders, but also become co-learners together with the students. The students are no longer receivers of knowledge, but have a new role as learners, and their learning involves more than cognition. What the students experience also involves notions, emotions and attitudes. Their learning becomes competency oriented, involving knowledge, skills, attitudes and potential for visioning. Their goals are no longer to uncover answers already known by the teachers or written in textbooks; instead, teachers and students will engage in a joint process to learn about complex real life situations (Francis et al, 2001). The shift from knowledge to competency orientation also implies the shift from a focus on agroecology to the process of becoming an agroecologist. The focus on knowledge is very often connected to the input– output model of knowledge transfer. The competency orientation must on the other hand be related to developing and improving skills through a mutual relation – between the students, between the students and the stakeholders ‘out there’ and between the students and the teachers. In this process the roles of theory and practice also change: practice is no longer just used as an example of theories lectured in the classroom, but is used as the starting point for learning. And theory is no longer the focal part of the education, but is seen as something that should support the learners in their development.
Becoming an Agroecologist Through Action Education 297
Focus on Becoming an Agroecologist Students embrace a certain field of study because they are motivated, hopefully even passionate, about learning new things and putting them into action. Whatever we do in designing the educational landscape should serve to promote and fulfil that passion, rather than stifling it. An example from classical medical schools is appropriate. The conventional curriculum involved heavy first- and second-year courses in anatomy, learning the Latin names of hundreds of muscles and bones, and this often served as a screening tool to eliminate many who were not capable of, or interested in, such rote learning. Successful memorizers became the specialists who dominate today’s medical profession. Some students dropped out because they were bored with material that was important, to be sure, but far from the contacts with real patients that they anticipated. The courses did not fulfill their desire to help people that generated their passion in the first place. The University of Tromsø in Norway and the Oregon Health Sciences Hospital in the US pioneered the mentoring approach that put medical students into white coats with name badges and stethoscopes right from the first week in school. They took patient histories, made preliminary diagnoses and shadowed mentor doctors for one day each week, thus reinforcing their passion for dealing with people in need. This new and practical approach prevented the unnecessary early screening out of some of the best future doctors with a strong social conscience who may not have been the top academic students based on memorizing bones and muscle names. These potential future caring physicians often despaired of ever seeing patients, and it is likely that we have lost many candidates who could have become the best general practitioners. The new system seems to be working, and it is spreading to other medical schools. So rather than focus on the time-honoured curriculum, continuing to teach courses in the sequence in which they have always been taught to all students, we should focus on what we want to achieve – a well prepared, knowledgeable, confident graduate in agroecology. We can focus on students and on learning, rather than on teachers and on teaching. We can design learning landscapes and environments that put the joy of discovery into learning, and can put shared responsibility for learning on teachers and students. The schedule and content of classes can include learning skills and new knowledge as well as clarification of attitudes toward the material and potential for visioning the future wanted situation (Schneider et al, 2005). The strategy described here for planning educational experiences in agroecology is completely focused on who will complete the course of study, how they will put knowledge into action and what they will do when they leave the programme. We call this action education. Students observe and evaluate, and join the faculty in visiting farms, interviewing farmers and families and learning the broad context of the farm situation. The skilled agroecologists graduating from the programme will:
298 Governance and Education
• • • • •
Have knowledge of farming and food systems. Be able to handle complexity and change. Be able to link theory to real life situations. Be good communicators and facilitators. Be autonomous learners.
These competencies are not only vital for dealing with agroecological issues. They are key qualifications (Kämäräinen et al, 2002), which implies that they are transferable; the achieved skills are not limited to an agroecological context, but can be practiced in other parts of life. Agroecology and sustainable agriculture are good places for training these skills. Such skills will be vital to proactively deal with the challenges of specialization, high technology and use of non-renewable resources in modern society in the quest for a sustainable development.
References Argyris C. and Schön D. A. 1974. Theory in Practice: Increasing Professional Effectiveness. San Francisco: Jossey-Bass Bandura A. 1977. Social Learning Theory. Englewoods Cliffs, NJ: Prentice Hall Barrows H. S. 1985. How to Design a Problem-Based Curriculum for the Preclinical Years. New York: Springer Barrows H. S. 1986. A taxonomy of problem-based learning methods. Medical Education 20, 481–486 Bawden R. J., Packham R., Macadam R. and McKenzie B. 2000. Back to the future: Reflections from Hawkesbury. In M. Cerf, D. Gibbon, B. Hubert, R. Ison, J. Jiggins, M. Paine, J. Proost and N. Röling (eds) Cow up a Tree: Knowing and Learning for Change in Agriculture – Case Studies from Industrialised Countries, Paris: INRA Benson L. and Harkavy I. 2000. Integrating the American system of higher, secondary, and primary education to develop civic responsibility. In T. Erlich (ed.) Civic Responsibility and Higher Education (pp174–196). Phoenix: Oryx Press Boud D., Cohen R. and Walker D. (eds). 1993. Using Learning Experience. Berkshire, UK: Open University Press, McGraw-Hill. Dewey J. 1916. Democracy and Education. New York: Macmillan Francis C. A., Lieblein G., Helenius H., Salomonsson L., Olsen H. and Porter J. 2001. Challenges in designing ecological agriculture education: A Nordic perspective on change. American Journal of Alternative Agriculture 16(2), 89–95 Francis C., Lieblein G., Gliessman S., Breland T. A., Creamer N., Harwood R., Salomonsson L., Helenius J., Rickerl D., Salvador R., Wiedenhoeft M., Simmons S., Allen P., Altieri M., Flora C. and Poincelot R. 2003. Agroecology: The ecology of food systems. Journal of Sustainable Agriculture 22(3), 99–118 Kämäräinen P., Attwell G. and Brown A. (eds) 2002. Transformation of Learning in Education and Training: Key Qualifications Revisited (Cedefop Reference Series; 37). Luxembourg: Office for Official Publications of the European Communities Kolb D. 1984. Experiential Learning. Experience as the Source of Learning and Development. New Jersey: Prentice-Hall Kuhn T. S. 1962. The Structure of Scientific Revolutions (3rd edn). Chicago, IL: University of Chicago Press
Becoming an Agroecologist Through Action Education 299 Lave J. and Wenger E. 1990. Situated Learning: Legitimate Periperal Participation. Cambridge: Cambridge University Press Lieblein G. and Østergaard E. 2001. Shifting focus – experiences from the first NOVA MSc in a agroecology. Dept. Horticulture and Crop Sciences, Program for Pedagogics, Agricultural University of Norway (NLH), Norway. 19 pp Lieblein G., Francis C. A., Salomonsson L. and Sriskandarajah N. 1999. Ecological agriculture research: Increasing competence through PhD courses. Journal of Agricultural Education and Extension 6(1), 31–46 Lieblein G., Francis C. and King J. 2000a. Conceptual framework for structuring future agricultural colleges and universities. Journal of Agricultural Education Extension 6, 213–222 Lieblein G., Francis C., Barth Eide W., Torjusen H., Solberg S., Salomonsson L., Lund V., Ekblad G., Persson P., Helenius J., Loiva M., Sepannen Kahiluoto H., Porter J., Olsen H., Sriskandarajah N., Mikk M. and Flora C. 2000b. Future education in ecological agriculture and food systems: A student-faculty evaluation and planning process. Journal of Sustainable Agriculture 16(4), 49–69 Lieblein G., Francis C. A. and Torjusen H. 2001. Future interconnections among ecological farmers, processors, marketers, and consumers in Hedmark County, Norway: Creating shared vision. Human Ecology Review 8(1), 61–72 McGill I. and Beaty L. 2001. Action Learning. London: Kogan Page McKeachie W. 1986. Teaching Tips: A Guidebook for the Beginning College Teacher. Boston, MA: D.C. Heath Mezirow J. (ed.) 2000. Learning as Transformation: Critical Perspectives on a Theory in Progress. San Francisco: Jossey-Bass Parker M. 1990. Creating Shared Vision. Oak Park, IL: DIALOG International Ltd Pfeffer J. 1998. The Human Equation: Building Profits by Putting People First. Boston: Harvard Business School Press Pollack S. 1999. Early connections between service and education. In T. K. Stanton, D. E. Giles and N. I. Cruz (eds) Service-Learning: A Movement’s Pioneers Reflect on its Origins, Practice, and Future (pp12–32). San Francisco: Jossey-Bass Revans R. 1998. ABC of Action Learning. London: Lemos and Crane Salomonsson L., Francis C., Lieblein G. and Furugren B. 2005. Just in time education. NACTA Journal (in review) Schneider M., Colglazier A., Beutler R., Pollard C. and Francis C. 2005. Discovering the whole: Multiple paths to systems learning. NACTA Journal (in press) Senge P. M. 1990. The Fifth Discipline: The Art and Practice of the Learning Organization. New York: Doubleday Silberman M. 1996. Active learning: 101 Strategies to Teach Any Subject. Boston, MA: Allyn and Bacon Sriskandarajah N., Francis C., Salomonsson L., Kahiluoto H., Lieblein G., Breland T. A., Geber U. and Helenius J. 2005. Education and training in ecological agriculture: Nordic region and U.S.A. In A. Taji and P. Kristiansen (eds) Organic Agriculture: A Global Perspective. Collingwood, Victoria: CSIRO Publishing (in press) van Manen M. 1990. Researching Lived Experience. Human Science for an Action Sensitive Pedagogy. New York: State University of New York Press Wiedenhoeft M., Simmons S., Salvador R., McAndrews G., Francis C., King J. and Hole D. 2003. Agroecosystems analysis from the grass roots: A multidimensional experiential learning course. Journal of Natural Resources and Life Science Education 32, 73–79
Part IV
Enabling Policies and Institutions for Sustainable Agricultural and Food Systems
16
A New Practice: Facilitating Sustainable Agriculture Niels G. Röling and M. Annemarie E. Wagemakers
When Greenland Became White How did our ancestors manage their environment? A green history of the world (Ponting, 1991) and the first conference on how pre-industrial civilizations coped with climate change (Pain, 1994) offer plausible insights. One case study presented at the conference concerns the medieval Norse settlements in Greenland. Their agriculture prospered during the 12th century. In 1127, they sent a live polar bear to the Nordic King and received a bishop in return. But by 1500, Greenland had become white, and the only people still living there were the Inuit seal hunters. All that remains of the Norse communities are the ruins of their churches. A comparative analysis of the strategies of the communities of the two peoples for coping with the Small Ice Age reveals that the Norsemen were more concerned with providing for their bishops and building churches than with changing their way of life or agriculture to accommodate the harsher climate. They persisted in trying to graze their cattle on increasingly poor grassland. The Inuit, however, adapted and developed their hunting and fishing in ways that allowed them to survive through the increasing cold. Though it seems, at first, that the demise of the Greenlanders was caused by climate change, closer scrutiny reveals that the climate was not the only factor. By the time the temperature had plummeted in the 1370s, the productivity of the land was falling because of overgrazing and soil erosion. But while the Inuit adopted appropriate technologies of hunting and fishing, the Norse farmers – constrained by their rigidly ordered society and Christian culture – tried to maintain the way of life they were used to. They failed (Pain, 1994). Reprinted from Röling N G and Wagemakers M A E, A new Practice: Facilitating sustainable agriculture. In Röling N G and Wagemakers M A E (eds) Facilitating Sustainable Agriculture © Cambridge University Press 1998.
304 Enabling Policies and Institutions for Sustainable Agricultural and Food Systems
From this, and other cases presented during the conference, the following conclusions emerge: •
• •
•
It is not so much climate change that causes problems, but entrenched modes of adapting to change. ‘The ability and willingness of society to respond to changing conditions are the crucial conditions in determining whether it survives’ (Pain, 1994). Such responsiveness depends on individual and collective choices, which are, of necessity, shaped by the past. This makes us vulnerable to discontinuous events for which there are no historical precedents. The development and use of knowledge is our main mechanism for survival in conditions of rapid change. That is, adaptation to changing conditions depends on perceiving and interpreting the signs of impending change, and on the timely development of knowledge, technology and organization in reaction to those signs. Thus, the adaptative response also demands creativity and inventiveness and a capacity for collective learning and innovation. By virtue of their privileged position, the elites who have a formal or social mandate to provide leadership are often shut off from direct or even indirect experience of the signs of change. They have the power to maintain their lifestyles and the way things are when it is no longer prudent to do so.
Are we like the Norsemen on Greenland?
About this Book The question could imply that this book is about the Apocalypse, but nothing would be further from the truth. This book is about developing appropriate responses to environmental uncertainty and discontinuity. If anything, its authors are possibly too optimistic in their expectation that it is not beyond human society to make the adaptations that now appear necessary. That does not mean, of course, that we are convinced that meaningful and timely change will come about, but we hope that this book will increase the likelihood that it will. The more specific aims of the book are to ‘capture a new practice’; that is, to examine a number of cases of attempts to make farming more sustainable in conditions of uncertainty. Second, the contributors tease out the lessons of emerging practice with respect to the kinds of learning, facilitation, supporting institutions and conducive policy contexts that are required. The book’s central questions therefore are: can we learn our way to a more sustainable agriculture? And if so, what does it take? The case studies suggest that the answer to the first question is ‘Yes’!, but also, that it will take a transformation of our epistemology, our technological and organizational practices, our ways of learning, our institutional frameworks and our policies. Such transformations do not come easy, and the question ‘Are we
A New Practice: Facilitating Sustainable Agriculture 305
Norsemen on Greenland?’ remains unanswered now that we have finished the book, but we have become a little clearer about the effort that needs to be made and we feel heartened by that understanding.
A Social Science Perspective This book approaches sustainable farming from the point of view of social science. Hence its central focus is the human actor, and not the biophysical processes occurring in the agroecosystem (see Box 16.1). As you will see later, this has important implications for the way we define sustainability. It also means that this book does not deal in detail with the agronomic or other practices that are needed for using Box 16.1 The area of discourse of this book 1 2 3 4 farm ↔ farmer ↔ facilitator ↔ etc. The relationship between farmer and farm (1) is that of a human being dealing with biophysical resources and processes. Natural science supports the technologies and interventions used by the farmer to make the biophysical environment yield desired outcomes. These ‘technical’ aspects do not constitute the area of discourse of this book. But change in relationship 1 is only possible if the farmer him/herself engages in learning (2). The learning process lies at the heart of this book. As we shall see, the transformation to sustainable agriculture requires a fundamental change in learning processes. These turn out to be very different from the well-established processes of adoption of add-on innovations, in the ‘more of the same’ fashion, which occur when the farmer tries to improve conventional farm management. Learning can be facilitated (relationship 3). The facilitation of learning is also a core subject of the book. Most of the contributors, including the editors, are engaged in extension and innovation studies. That is, they are interested in fostering voluntary change in behaviour through communication, and in innovation as an outcome of social interaction (e.g. Röling, 1988). Other perspectives on innovation, for example, as a process induced by changes in relative factor prices (Ruttan and Hayami, 1984) are not dealt with, although we recognize that changed relative factor prices might well motivate innovative interaction. The case studies reaffirm the proposition that learning and facilitation occur in specific institutional frameworks and policy contexts (relationship 4), and that the nature of these frameworks and contexts is of crucial importance for the transformation of farming. Moreover, the cases illustrate how the institutional and policy changes required for scaling-up successes achieved on a pilot scale cause strife and conflict for which appropriate communication and negotiation strategies and methodologies are needed.
306 Enabling Policies and Institutions for Sustainable Agricultural and Food Systems
natural resources in a more sustainable manner. A great deal of information is available on that issue (e.g. Howard, 1943; National Science Council, 1989; Reijntjes et al, 1992; Pretty, 1995). Jiggins and De Zeeuw (1992) provide pioneering information on Participatory Technology Development (PTD) for sustainable farming, while Pretty’s (1995) authoritative book on regenerating agriculture provides a wealth of information on its feasibility and the conditions for transformation. We do not limit ourselves to the field or farm level, but explicitly also take into consideration larger-scale agroecosystems, such as water catchments, which need to be managed in their own right in order to allow sustainable management at the field and farm levels. Since this book assumes that the transformation to sustainable farming is social as much as agronomic and ecological (Vartdall, 1995), we shall examine these agroecosystems by looking at innovation processes at levels of social aggregation concomitant with the scale of the agroecosystem. The contributors to the book bring along a wide range of experience assembled during widely different life times, from widely different contexts, which allows examination of the transition to sustainable agriculture from widely different perspectives, at different levels and along different dimensions (Box 16.2). Box 16.2 Profile of the contributors Campbell and Wagemans are senior policy makers in government, while Woodhill plays the same role in an environmental voluntary organization. All three also undertake consultancies in other parts of the world. Fisk, Hesterman and Thorburn work for the W.K. Kellogg Foundation (WKKF) in various capacities. WKKF is a philanthropic foundation which supports learning in and about agriculture and rural development. Boerma, Hamilton, Roux, Van de Fliert and Van Weperen play professional roles as consultants, project leaders or implementors. Aarts, Gerber, Koutsouris, Papadopoulos, Proost, Van de Fliert (who has two jobs) and Wagemakers work for universities as lecturers and researchers; Somers is a researcher in a research institute. Blum, Castillo, Hoffmann, Pretty, Röling and Van Woerkum are university professors who hold (or held, Castillo is emeritus professor) chairs in departments of extension studies of one kind or another. Jiggins holds a chair in the field of human ecology. Hesterman has worked as a professor in crop and soil science. All undertake consultancies in various parts of the world.
A New Practice: Facilitating Sustainable Agriculture 307
Sustainable Agriculture Productivity equity, sustainability and stability have been identified as key goals of agricultural policy (Conway, 1994). But they are not necessarily mutually consistent. Conway speaks of ‘trade-offs’ among them, especially between the economic and ecological. This book is weighted heavily towards ecological imperatives. Maintaining or enhancing the natural resource base is the precondition for a sustainably productive agriculture. Box 16.3 outlines the main aspects we shall examine. These aspects relate systemically to one another, in that change in one aspect necessarily affects the others. For example, the learning required for effectively practising Integrated Pest Management can apparently not be achieved by the transfer-of-technology (TOT) mode of extension. It requires a new approach to facilitation (Matteson et al, 1992), which in turn has important implications for institutional support. We come back to the five dimensions in the last chapter, where we examine models of innovation which are suitable for understanding the transformation to sustainable farming. We shall not define sustainability solely in terms of the carrying capacity or other ‘hard’ characteristics of an agroecosystem. We use a social science definition (Box 16.4) that, as our cases show, proves to be eminently practical. We borrowed the definition from the ‘Hawkesbury pioneers’, a small band of agriculturalists at the University of Western Sydney in New South Wales (Sriskandarajah et al, 1989; Bawden and Packam, 1991; Woodhill, 1993; Ison, 1994). The definition in Box 16.4 incorporates elements which focus on the hard properties of a farm or an agroecosystem. Yet we suspect that our seemingly relativist definition will irritate those who want to use scientific definitions to identify the limits beyond which use of natural resources should not go (Korthals, 1994).
Box 16.3 Five interlocking dimensions of the transformation to sustainable farming •
agricultural practices, both at the farm and higher system levels;
•
learning those practices;
•
facilitating that learning;
•
institutional frameworks that support such facilitation, comprising markets, science, extension, networks of innovation etc.;
•
conducive policy frameworks, including regulations, subsidies etc.; and especially:
•
the management of change from conventional to sustainable agriculture along each of the dimensions.
308 Enabling Policies and Institutions for Sustainable Agricultural and Food Systems
Box 16.4 Sustainability defined Sustainability is an emergent property of a ‘soft system’ (Woodhill and Röling, this volume). It is the outcome of the collective decision making that arises from interaction among stakeholders. Stakeholders are identified here as natural resource users and managers. A natural resource can be considered at the field, farm or higher level of aggregation, including watersheds, landscapes, agroecological regions, lakes and rivers and, ultimately, the Earth itself. The formulation of sustainability in this manner implies that the definition is part of the problem that stakeholders have to resolve (Pretty, 1995). That is, securing agreement on what people shall take sustainability to mean for a given environment, is half the job of getting there.
None the less, our definition, as this book shows, has proven robust because it fits so well the outcomes of research on the interface between people and their environment. It also serves our immediate purpose of illuminating the facilitation of sustainable agriculture. Our definition is consistent with Wouter de Groot’s (1992) ‘problem-in-context framework for the analysis, explanation and solution of environmental problems’ (Box 16.5). A problem is here defined as an undesirable difference between ‘wants’ or norms, and ‘gets’ or impacts. According to De Groot, an environmental problem is an undesirable difference between the environmental impacts of human activity and environmental norms. Solving environmental problems thus requires changing human activity to fit the norms, and vice versa. The problem-in-context framework provides for an integration of environmental sciences and the derivation of norms for human activity. Box 16.5 De Groot’s ‘Problem in Contex Model’ of environmental problems (simplified adaptation of De Groot, 1992).
A New Practice: Facilitating Sustainable Agriculture 309
Is it Immoral to be Concerned About the Health of Natural Resources? The term ‘sustainable agriculture’ implies regenerative practices which optimally use locally available resources and natural processes, such as nutrient recycling; build on biodiversity; regenerate and develop natural resources; and limit the use of external inputs of agrochemicals, minerals and non-renewable energy. Regenerative agriculture requires that, where used, such external inputs are used efficiently so that emissions can be recycled and absorbed (Pretty, 1995), renewable resources are regeared and non-renewable resource use generates optimal productivity. Defined in this way, regenerative agriculture, in terms of yield, at present tends to be slightly less productive than high-input agriculture in industrial countries, and approximately as productive as such agriculture in ‘Green Revolution’ areas. On presently available evidence, state-of-the-art regenerative practices would increase significantly productivity in the rainfed, complex and resource poor areas in developing countries which have so far not benefitted from high external input technologies and are usually heavily degraded (Pretty, 1995). The question then arises whether, from a global point of view, regenerative agriculture can deliver the output required to meet aggregate demands. The trend line extrapolation of growth in the world’s population to more than 8 billion in 2025, an increase of over 2.5 billion in the next 30 years, has led many authors to emphasize the need to double productivity per hectare of available farm land (McCalla, 1994; CGIAR, 1995; Tansey and Worsely, 1995). The productivity deemed possible under regenerative agriculture and the doubling of productivity per hectare of available land required by 2025 seem contradictory. Indeed, one expert claims that promoting a form of agriculture which uses no artificial fertilizers or chemical pesticides is immoral because it undermines global food security (quoted from Rabbinge in WUB 17, 11 May 1995). It suffices in this introductory chapter to highlight the irreducible uncertainty about what lies ahead over the next two or three decades. On the one hand, while there is at present ample grain available in global food markets to feed the world’s present population, many millions continue to go to bed hungry. This has to do with the fact that surplus production is not directly related to the relief of chronic hunger. Many of those who are hungry have neither the means to produce sufficient to feed themselves, nor the money to buy it. The issues of inequity and distribution are likely to remain present into the foreseeable future, at any level of grain production, or population growth or environmental change. On the other hand, although present estimates of production potential indicate adequate capacity to meet the food needs in aggregate of up to twice as many people as are alive today, such estimates are by their very nature conditional, and hedged around by assumptions about what might happen in other sectors. For example, estimates of the future adequacy of water supplies to agriculture are dependent on considerations such as demands for water from industrial, recreational and domestic
310 Enabling Policies and Institutions for Sustainable Agricultural and Food Systems
users, the rate at which water loss is controlled, the efficiency of water use and the rate at which water-winning and water storage technology is introduced. Further food output scenarios also are strongly affected by assumptions made about the outcome of political negotiations concerning acceptable levels of environmental pollution, degradation and waste, questimates concerning the mobilization of political will to invest in the health of soil amelioration measures, which would open up hitherto unusable areas to cultivation, as well as price relationships, market developments and changes in consumer preferences. In addition, the introduction of factory-based production of meat muscle (already foreshadowed in the UK Government’s technology foresight programme) could relieve much of the pressure of livestock farming on grasslands, for example, while an acceleration of the already observable shift towards more vegetarian diets in Northern consumer markets (e.g. Kleiner, 1996) would markedly change food demand forecasts. The likelihood of rapid change in global temperature and rainfall patterns adds further uncertainty. Conversely, continued reliance on high-energy input, chemical-dependent, intensive farming as the sole or even the main source of global surplus would appear to be environmentally foolhardy, and increasingly unacceptable politically as the wider consequences to human health, ecosystem and valued landscapes become apparent.
‘Making the Flip’ Historically, the number of people and their ‘wants’ have grown, and uses of natural resources to satisfy them have been developed, regardless of the longer-term consequences for the environment (Ponting, 1991). In this book, we consider the alternative, indeed the necessity, of ‘making the flip’: • • •
conserving, even enhancing, the natural resource base upon which all agriculture ultimately, and indeed human survival, depends; the resultant negotiations involved in the transformation of wants to accommodate the emergent understanding of the natural resource imperative; the kinds of agriculture which then results from such a reversal of attitudes, approaches and behaviour.
The book illustrates the social energy which is created as people and institutions begin to engage in accommodation of ‘wants’ to ‘effects’. The evidence suggests explicitly that the way to capture the potential for productivity, which is realizable by paying heed to the health of natural resources, is to work with and support the creativity, diversity and serendipity which emerges from a process of social learning. In agriculture, the process requires that farmers become experts, instead of ‘users’, ‘receivers’ or ‘adopters’ of other specialists’ wisdom and technologies. They must learn to apply general ecological principles to their own locality and time-specific
A New Practice: Facilitating Sustainable Agriculture 311
situations. They must be able to manage complex agroecosystem systems as businesses in competitive markets. But, as ecosystems do not stop at farm boundaries, local communities and wider consortia of interest groups and resource users also need to engage in learning how to manage landscapes and resources. Societies have to develop, and adjust to, trade-offs among potentially competing interests. We still have a long way to go in that respect. On the whole, a wasteful way of life has so far remained politically non-negotiable.
The Prevalent Paradigm for Thinking About Innovation The current ways of thinking about the processes of innovation are embedded in a particular epistemology, that is in ways or methods for knowing on the basis of knowledge which hitherto has remained largely unchallenged. The prevalent view of agricultural science is that it deals with ‘things’, which are as they are, which can be objectively known through research, and about which science can formulate generalizable ‘truths’. These objectively verifiable propositions underpin the efforts made to influence agricultural performance. The goals of such intervention are taken to be unambiguous and not of scientific interest. The focus is on the ‘best technical means’ for achieving any stated goal. Box 16.6 presents typical statements which are informed by this so-called realist–positivist epistemology.
Box 16.6 Illustrative realist–positivist statements •
Reality exists independently of the human observer.
•
Through scientific research we can build objective, true knowledge (generalizations) about that reality.
•
Scientists discover and lay bare the naked truth, lift the veil hiding it, and reveal its secrets.
•
The goal of science is to add to the store of human knowledge.
•
Scientific research is the source of innovation.
•
Technology is applied science.
•
Development results from the transfer of the results of science to users.
•
Problems can be solved by experts. In fact, we do not have to worry too much about the future. Science will find an answer.
•
Social science is not really a science: it has not resulted in any true generalizations and cannot be used to send a man to the moon.
312 Enabling Policies and Institutions for Sustainable Agricultural and Food Systems
The realist–positivist epistemology is a coherent and internally consistent paradigm which most agricultural professionals have drilled into them, or absorb during their training, whether it is technical or social, and whether it is at an academic, polytechnic or secondary level institute. But it is an epistemology which is increasingly incompatible with the search for a sustainable society. Kuhn (1970) has opened our eyes to the notion of coherent and internally consistent paradigms which shift as the number of plausible knowledge claims which are in conflict with them increases. We then move from a period of ‘normal science’ during which people agree on the fundamental premises and occupy themselves with questions within the paradigm, into a period of ‘post-normal’ science, during which the paradigm itself is contested. An increasing number of knowledge claims which are inconsistent with the realist–positivist paradigm (Box 16.7) arise in current debates about agriculture and the environment.
Box 16.7 Some claims at odds with the realist–positivist paradigm •
Agriculture has multiple goals which are not mutually compatible. Hence the assumption of unambiguous goals and the focus on ‘best technical means’ is becoming irrelevant. The need for arbitration among contested goals is becoming one of the key challenges in dealing with our natural resources.
•
Decisions about the use of natural resources are less and less a question of expertise or the province of specialist institutions, and more and more determined by negotiation and agreement among stakeholders. The focus shifts from result to process. The problems we are faced with have less to do with instrumental problems, i.e. people–thing problems, and increasingly to do with people–people relationships, i.e. social problems. This has important implications for agricultural science which has so far profiled itself as a biophysical and technical activity.
•
In the conventional paradigm, innovation is seen to originate in science and to be realized through the transfer and adoption of the results of science (the linear model or transfer-of-technology (TOT) model). But it is increasingly clear that, in practice, innovation emerges from interaction among various ‘actors’, i.e. among people and collectivities as role playing and sense making beings. Each one contributes to the final outcome (e.g. Kline and Rosenberg, 1986; Engel, 1995). Local knowledge, business ingenuity, farmer experimentation and inventiveness are as important as expert knowledge and the role of specialized actors such as scientists and farm advisors.
•
Agricultural development is conventionally seen as driven by technological change. However, few would now disagree that price changes, improved institutional support (reducing transaction costs), conducive policy contexts, value shifts and social organization can be necessary conditions for, and sometimes the stimulus of, innovation.
A New Practice: Facilitating Sustainable Agriculture 313
The erosion of realist–positivism as a universally trusted epistemology appears to be associated with other important societal changes. For one, the trust in experts and specialized institutions is waning. A recent survey found, for example, that British respondents do not trust the information about biotechnology which they get from scientists, business corporations or the Department of Trade and Industry. They prefer to trust organizations such as Greenpeace (Tate, 1995). The erosion of trust also appears to be related to uncertainty about issues for which the stakes are high, such as global food security which was touched upon in the section ‘Is it Immoral to be Concerned About the Health of Natural Resources?’ and ‘Making the Flip’. Funtowicz and Ravetz (1990, 1994) argue that we have entered a period of ‘post-normal science’ in the sense of Kuhn (1970) because ‘normal science’ cannot deal with conditions of high uncertainty. The development of reliable grounds for knowing must proceed in part along other lines. Selfappointed activists emerge, who become formidably well informed across discipline boundaries about a subject or situation which threatens their values or livelihood. Decision fora include speech-makers and citizens, as well as scientists or specialists, and ‘facts’ encompass people’s values and express cultural meaning. The final arbiters of reliable knowledge are ‘extended peer communities’ made up of a much wider membership than the conventional narrow professional elites or restricted political circles. Funtowicz and Ravetz (1994) speak of the ‘democratization of science’; that is, a widely shared process of learning and informed public debate about goals, and not just means, seems the only acceptable way to deal with high uncertainty when the stakes are high and the consequences of getting it wrong are potentially catastrophic. This observation is reminiscent of Habermas’ (1984, 1985) argument that society can overcome the momentum of what we have constructed in the past – and thus prevent the Norsemen on Greenland scenario – only by reaching consensus about what action to take next; that is, not on the basis of controlling things (instrumental rationality), nor on the basis of beating competitors or opponents (strategic rationality), but on the basis of shared learning, collaboration and the development of consensus about the action to take (communicative rationality).
Constructionism Constructionism is the name given to the epistemology which supports the learning processes described in this book. If everyone agrees about the goals, we can afford to worry about the best technical means of securing those goals. If everyone agrees about the facts, we can speak of objective truth. ‘Objective’ knowledge has, therefore, by no means become outdated or unneeded. But, if these conditions do not hold, we have to stretch the positivist epistemology and embrace constructionism. Reality no longer appears as a ‘given’ but as something actively ‘constructed’
314 Enabling Policies and Institutions for Sustainable Agricultural and Food Systems
Box 16.8 Constructionism and quantum physics Niels Bohr did not believe in the Newtonian clockwork universe (which was the conventional perspective early this century). ‘There is no quantum world. What exists is a quantum physical description. It would be mistaken, therefore, to believe that it is the task of physics to find out what nature is. Physics occupies itself with what we can say about nature’ (quoted in NRC/Handelsblad, 18 May 1995). Another quantum physicist, David Bohm, said: ‘It is not the task of science to increase the store of knowledge, but to formulate fresh perspectives’ (1993). Some researchers and analysts reject constructionism because of its apparent relativism (Röling, 1995). If it is people who construct reality, there must be multiple realities. What the one has constructed can be deconstructed by someone else. Everything can be true.
by people. There are three main strands in constructionist thinking (Knorr-Cetina, 1995). In the first place, reality is said to be socially constructed (Berger and Luckmann, 1967). It is created in the discourse of, and negotiations among, people as social actors. Socially negotiated agreements become experienced as ‘objective’ truth. Berger and Luckmann concern themselves with the mechanisms by which objective social order emerges from interaction. Second, convincing empirical analysis of ‘fact production’ in natural science laboratories by, e.g. Knorr-Cetina herself (1981); Collins (1985, 1992) and Latour (1987) has focused attention on epistemic practices and human construction in the very area we used to think of as given natural reality (Box 16.8). Third, biological research into the ‘observing organism’ (Maturana and Varela, 1987) has demonstrated that the environment external to the observer, be it a frog or a person, does not project itself objectively on to the nervous system. Perception is accomplished by the brain, and the brain is an informationally closed system that reconstructs an external environment only from environmental ‘triggers’, memory and interaction with itself. We explicitly reject such an interpretation of constructionism. There is an environment. If an organism loses touch with it, or, as Maturana and Varela (1987) put it, if the structural coupling between organism and environment is broken, the organism cannot survive. But the ‘constructions’ appropriate for survival are not fixed or self-evident, nor is their interpretation unambiguous. They have selectively evolved, are culturally conditioned, continue to be actively created, or learned experientially on the basis of trial and error, or vicariously on the basis of communication. In this scheme of things, science has a role to play. It is engaged in the active construction of reality. But its impact is not based on the predictive power of its generalizations, however, but on the extent to which it affects other people’s reality construction. Social actor network theory (Latour, 1987; Callon and Law, 1989) takes this a bit further. It claims that the impact of scientific results is based on the extent to which the laboratory conditions, which gave rise to the results, are replicated in
A New Practice: Facilitating Sustainable Agriculture 315
society. These conditions are the outcome of the efforts of people who have an interest in creating and maintaining them. That is, ‘social actor networks’ are necessary to maintain these conditions. Changing the conditions, for example, as a result of trying to reduce the use of chemical inputs in agriculture, invariably leads to resistance as actors’ interests are affected (e.g. Aarts and Van Woerkum; Hamilton). The transformation to sustainable agriculture is not politically neutral. What about the impact of social science? As we have seen earlier, from a positivist point of view, social science has little to contribute, but from a constructionist view, the contributions are assessed in different terms. All forms of knowledge which claim the ‘science label’, social science included, are seen as special cases of social reality construction. The scientist actively constructs a fresh perspective on reality and this, in turn, affects the way others see it. Giddens (1987) has called this ‘the double hermeneutic’. The behaviour of celestial bodies such as the sun and the Earth presumably remain the same, whether people think the sun circles around the Earth or vice versa, but people and societies do change their behaviour in the light of what science has to say about celestial movements. This also holds for the social sciences. Economics, for example, has been quite effective during the past few decades in making us believe that we are largely driven by maximization of monetary values and that society must be organized to allow the unhindered operation of market mechanisms. The impact of constructionist thinking becomes abundantly clear if we consider what it implies for the professional field of most of the contributors to this book: extension studies (Box 16.9) (Leeuwis, 1993). Within the realist–positivist epistemology, extension is looked upon as a necessary delivery mechanism of the results of scientific research. We do not need to repeat the criticism of that perspective here (Freire, 1972; Chambers, 1983; Kline and Rosenberg, 1986; Röling, 1988; Long and Van der Ploeg, 1989). Within the constructionist epistemology, extension is a means for socially (re-)constructing agrarian reality through communication and information sharing activities. More generously and truly constructionally, extension can be seen as a societal mechanism for facilitating social learning of appropriate responses to changing circumstance. It is easy to see from this perspective how the transformation of agriculture implies an active social reconstruction of what our natural resources mean to our survival, and how to use them to support our continuing livelihood. It is equally easy to see that the transformation cannot be accomplished only on the basis of positivist science, elite expertise and on transfer of technology to farmers.
Soft Systems Thinking Finally, it is necessary to say by way of introduction that we accept systems thinking as a necessary holistic approach to complex issues such as the sustainability of agroecosystems. Such issues cannot be understood by examining only the parts in
316 Enabling Policies and Institutions for Sustainable Agricultural and Food Systems
Box 16.9 Extension Although literally hundreds of thousands of people in the world earn their living as professional extensionists, the area of endeavour remains murky and difficult to explain. One reason is the diversity of perspectives with which extension is construed and which are often based on differences in basic assumptions about agricultural development, the role of science and so forth. The word ‘extension’ originally refers to extending scientific education beyond the walls of school or university (Van den Ban and Hawkins, 1988, 1996). Often the word ‘extension education’ has therefore been used. This idea is close to the French concept of ‘vulgarization’, making accessible scientific or other elevated thoughts to the ‘vulgus’ or ordinary people. Consistent with this notion is the emphasis on technology transfer from scientific research to farmer users (the TOT model) as the central mandate of extension. But, other concepts are being used which reflect an entirely different perspective. Thus farm advisory workers, or, in German, ‘Beraters’, have less of an educational or transfer and more of a consultant role. Words such as ‘mobilizer’ or ‘facilitator’, which try to avoid the implication of external imposition, go even further. Extension, as a practice, is underpinned by a body of knowledge and accumulated experience which has, at one time, been called ‘extension science’ (Röling, 1988), but which perhaps can be better labelled as ‘extension communication and innovation studies’ to reflect a more constructionist perspective on science. Many of the contributors to this book are engaged in such studies (Box 16.2). But, extension and innovation studies cannot be considered a discipline. Innovation, including the transition to sustainable agriculture, cannot be understood by focusing only on extension communication, but requires taking account of intentionality, culture, power, technology development, institutions, policies and, of course, epistemology.
isolation, nor the whole as a mere aggregation of parts. Tasks such as ecosystem management require that the emergent properties of systems as wholes are taken into account (e.g. Hurthubise, 1984). ‘System performance must therefore be judged not simply in terms of how each part works separately, but in terms of how the parts fit together and relate to each other, and in terms of how the system relates to its environment and to other systems in that environment’ (Dillon, 1976). Constructionism has deeply affected the thinking about systems which emerged from biology and other ‘hard’ sciences and was later applied in engineering. Checkland (1981; Checkland and Scholes, 1990) distinguishes between ‘hard’ and ‘soft’ systems. The former are treated as if they really exist. Their boundaries and goals are assumed to be given. Analysis and problem solving focus on goalseeking and the best technical means to reach a goal. Such hard system thinking can be usefully applied to natural systems, such as plants, or designed systems, such as computers.
A New Practice: Facilitating Sustainable Agriculture 317
Soft systems are deliberate social constructs, that is, they exist only to the extent that people agree on their goals, their boundaries, their membership and their usefulness. The crucial assumption is that system goals are not given but contested and that system boundaries are negotiated. The necessary condition for a soft system to exist is agreement among its members on its goals. A soft system may also be defined as a human activity system, e.g. an organization, a task force or the stakeholders in an agroecosystem who have been forced by environmental problems to exert joint agency at the level of social aggregation commensurate with the agroecosystem. Thus the agroecosystem is a subsystem of a human activity system, and its sustainability is an emergent property of that soft system. In this perspective, hard systems are subsumed by soft systems, just as scientific research is a special approach to the social construction of reality. A special application of soft systems thinking is represented in what are called agricultural knowledge and information systems (AKIS) (Röling, 1988, Röling, 1990; Röling and Engel, 1991; Engel, 1995). AKIS can be used in a number of ways: •
• •
empirically to discover how social actors in agriculture, such as scientists, advisers, farmers, but also seed suppliers, credit banks and so on, are linked together in the creation, adaptation, sharing, storage and application of knowledge and information; normatively, as a mental construct, to design ideal links and flows; analytically to guide interventions to ensure that the actors do, in practice, interact in ways that give rise to desired emergent properties, such as innovation. System boundaries can be drawn widely, to achieve goals such as a competitive and productive and/or indeed a sustainable agriculture, or narrowly to achieve goals such as the production of x-litres of milk per cow.
Peter Checkland’s real achievement is the development of a soft systems methodology (SSM), which allows a group of actors who are faced with a shared problem to engage in a collective learning process in order to design a human activity system that can help solve the problem through collective action. SSM has been tested extensively over a period of more than 15 years, but especially in corporate environments. At a workshop with Checkland and some of the present contributors, it was noted that sustainability problems are more complex than corporate ones with respect to the social dilemmas which arise between individual and collective interests (Ostrom, 1990, 1991, 1992; Koelen and Röling, 1994; Maarleveld, 1996) and hence require more preliminary exploration (Leeuwis, 1993).
318 Enabling Policies and Institutions for Sustainable Agricultural and Food Systems
References Bawden, R.J. and Packam, R. 1991. Systems praxis in the education of the agricultural systems practitioner. Richmond (NSW): University of Western Sidney-Hawkesbury. Paper presented at the 1991 Annual Meeting of the International Society for Systems Sciences. Östersund, Sweden Berger, P.L. and Luckman, T. 1967. The Social Construction of Reality. A Treatise in the Sociology of Knowledge. Garden City: Doubleday and Middlesex: Anchor Books Bohm, D. 1993. ‘Last words of a quantum heretic’, interview with John Morgan, New Scientist, 137 (1862), 27 February, 42 Callon, M. and Law, J. 1989. On the construction of socio-technical networks: content and context revisited. Knowledge in Society: Studies in the Sociology of Science Past and Present, 8, 57–83. JAI Press Campbell, A. 1994. Landcare. Communities Shaping the Land and the Future. St Leonards (Australia): Allan and Unwin CGIAR. 1995. A Vision for CGIAR: Sustainable Agriculture for a food secure world. Ministerial-level meeting, Lucerne, Switzerland, 9–10 February 1995. Background Documents on Major Issues, pp41–76. Washington: CGIAR Secretariat Chambers, R. 1983. Rural Development: Putting the Last First. London: Longman Checkland, P. 1981. Systems Thinking, Systems Practice. Chichester: John Wiley Checkland, P. and Scholes, J. 1990. Soft Systems Methodology in Action. Chichester: John Wiley Collins, H.M. 1985, 1992. Changing Order: Replication and Induction in Scientific Practice. Chicago: Chicago University Press Conway, G.R. 1994. Sustainability in agricultural development: trade-offs between productivity, stability and equitability. Journal for Farming Systems Research-Extension, 4(2), 1–14 De Groot, W.T. 1992. Environmental Science Theory: Concepts and Methods in a One-world Problemoriented Paradigm. Amsterdam: University of Leyden, published doctoral dissertation. Amsterdam: Elsevier Dillon, J.D. 1976. The economics of systems research. Agricultural Systems, 1, 5–22 Engel, P. 1995. Facilitating Innovation: An Action-oriented Approach and Participatory Methodology to Improve Innovative Social Practice in Agriculture. Wageningen: Agricultural University, published doctoral dissertation. Commercial version in press from Royal Tropical Institute, Amsterdam Freire, P. 1972. The Pedagogy of the Oppressed (transl. M.B. Ramos). Harmondsworth: Penguin Funtowicz, S.O. and Ravetz, J.R. 1990. Global Environmental Issues and the Emergence of Second Order Science. Luxemburg: Commission for the European Community, DG Telecommunications, Information Industries and Innovation. CD-NA 12803 EN C, Report EUR 12803 EN Funtowicz, S.O. and Ravetz, J.R. 1994. The worth of a songbird; ecological economics as a post-normal science. Ecological Economics, 10, 197–207 Giddens, A. 1987. Social Theory and Modern Sociology. Cambridge: Polity Press Habermas, J. 1984. The Theory of Communicative Action. Vol.1: Reason and the Rationalisation of Society. Boston: Beacon Press Habermas, J. 1985. The Theory of Communicative Action. Vol. 2: Lifeworld and System. A Critique of Functionalist Reason. Boston: Beacon Press Hamilton, N.A. 1995. Learning to Learn with Farmers. A Case Study of an Adult Learning Extension Project Conducted in Queensland, 1990–1995. Wageningen: Agricultural University, published doctoral dissertation Howard, Sir A. 1943, 1947. An Agricultural Testament. London: Oxford University Press Hurthubise, R. 1984. Managing Information Systems: Concepts and Tools. Hartford (CT): Kumarian Press Ison, R. 1994. Designing Learning Systems: How can Systems Approaches be Applied in the Training of Research Workers and Development Actors? Synthesis paper for Workshop 6 on Formation and Training of 21 submitted contributions to that subject for the International Symposium on Systems
A New Practice: Facilitating Sustainable Agriculture 319 Oriented Research in Agriculture and Rural Development, Montpellier, France, 21–25 November 1994 Jiggins, J.L.S. and De Zeeuw, H. 1992. Participatory technology development in practice: process and methods. In Farming for the Future. An Introduction to Low-External Input and Sustainable Agriculture, ed. C. Reijntjes, B. Haverkort and A. Waters-Bayer, pp135–62. London: Macmillan and Leusden: ILEIA Kleiner, K. 1996. Life, liberty and the pursuit of vegetables. New Scientist, 149 (2012), January 13, 5 Kline, S. and Rosenberg, N. 1986. An overview of innovation. In The Positive Sum Strategy. Harnessing Technology for Economic Growth, ed. R. Landau and N. Rosenberg, pp275–306. Washington DC: National Academic Press Knorr-Cetina, K. 1981. The Manufacture of Knowledge: An Essay on the Constructivist and Contextual Nature of Science. Oxford: Pergamon Knorr-Cetina, K. 1995. Theoretical constructionism. On the nesting of knowledge structures into social structures. Paper presented at the Annual Meeting of the American Sociological Association, Washington, 19–23 August 1995 and at the Annual Meeting of the Society for Social Studies of Science, Charlottesville, VA, Plenary on Theoretical Foundations and Achievements in Science Studies. 17–22 October 1995. Submitted to Sociological Theory Koelen, M. and Röling, N. 1994. Sociale Dilemmas. In Basisboek Voorlichtingskunde, ed. N.G. Röling, D. Kuiper and R. Janmaat, pp58–74. Meppel: Boom Korthals, M. 1994. Duurzaamheid en Democratie. Sociaal-filosofische Beschouwingen over Milieubeleid, Wetenschap en Technologie. Meppel: Boom Kuhn, T.S. 1970. The Structure of Scientific Revolutions. 2nd edn. Chicago: University of Chicago Press Latour, B. 1987. Science in Action. Cambridge MA: Harvard University Press Leeuwis, C. 1993. Of Computers, Myths and Modelling. The Social Construction of Diversity, Knowledge, Information and Communication Technologies in Dutch Agriculture and Agricultural Extension. Wageningen: Agricultural University. Wageningse Sociologische Reeks, published doctoral dissertation Long, N. and van der Ploeg, J.D. 1989. Demythologising planned intervention. Sociologia Ruralis, 29(3/4), 226–49 Maarleveld, M. 1996. Improving participation and cooperation at the local level: lessons from economics and psychology. Paper presented at the 9th Conference of the International Social Conservation Organization (ISCO), Towards sustainable landuse, Furthering cooperation between people and institutions, 26–30 August 1966, Bonn, Germany Matteson, P., Gallagher, K.D. and Kenmore, RE. 1992. Extension and integrated pest management for planthoppers in Asian irrigated rice. In Ecology and Management of Plant Hoppers, ed. R.F. Denno and T.J. Perfect, pp57. London: Chapman and Hall Maturana, H.R. and Varela, F.J. 1987, 1992. The Tree of Knowledge, the Biological Roots of Human Understanding. Boston MA: Shambala Publications McCalla, A.F. 1994. Agriculture and Food Needs to 2025: Why We Should be Concerned. Sir John Crawford Memorial Lecture. International Centres Week, 27 October 1994. Washington DC: World Bank, CGIAR Secretariat National Science Council 1989. Alternative Agriculture. Washington: National Academy Press Ostrom, E. 1990, 1991, 1992. Governing the Commons. The Evolution of Institutions for Collective Action. New York: Cambridge University Press Pain, S. 1994. ‘Rigid’ cultures caught out by climate change. New Scientist, 5 March 1994 Ponting, C. 1991. A Green History of the World. London: Sinclair-Stevenson Ltd Pretty, J. 1995. Regenerating Agriculture. Policies and Practice for Sustainability and Self-Reliance, p20. London: Earthscan Reijntjes, C., Haverkort, B. and Waters-Bayer, A. 1992. Farming for the Future. An Introduction to LowExternal Input and Sustainable Agriculture. London: Macmillan and Leusden: ILEIA
320 Enabling Policies and Institutions for Sustainable Agricultural and Food Systems Rogers, E.M. 1961, 1972, 1983. Diffusion of Innovations. New York: Free Press Röling, N. 1988. Extension science. In Information Systems in Agricultural Development. Cambridge: Cambridge University Press Röling, N. 1990. The agricultural research-technology transfer interface: a knowledge system perspective. In Making the Link. Agricultural Research and Technology Transfer in Developing Countries, ed. D. Kaimowitz, pp1–42. Boulder, Co: Westview Press, Special Studies in Agricultural Science and Technology Röling, N. 1995. Naar een Interactieve Landbouwwetenschap. Wageningen: Agricultural University. Inaugural Address at the occasion of his installment as Extraordinary Professor of Agricultural Knowledge Systems in Developing Countries Röling, N. and Engel, P.G.H. 1991. The development of the concept of agricultural knowledge and information systems (AKIS): implications for extension. In Agricultural Extension: Worldwide Institutional Evolution and Forces for Change, ed. W.M. Rivera and D.J. Gustafson, pp125–38. Amsterdam: Elsevier Science Publishers Ruttan, V. and Hayami, Y. 1984. Toward a theory of induced institutional innovation. The Journal of Development Studies, 20(4), 203–23 Sriskanadarajah, N., Bawden, R.J. and Packam, R.G. 1989. System agriculture: a paradigm for sustainability. Paper presented at the Ninth Annual Farming Systems Research/Extension Symposium, University of Arkansas, Fayetteville, Arkansas, USA, 9–11 October 1989. AFSRE Newsletter, 2(3), 1–5, 1991 Tansey, G. and Worsley, T. 1995. The Food System, A Guide. London: Earthscan Tate, J. 1995. Statement as Member of Panel. Wageningen: International Congress, Agrarian Questions, International Agricultural Centre, 22–24 May 1995. Public discussion on: ‘The Social Shaping of Bio-science: Public Participation in Debates about Biotechnology’, organized by P. Richards, Chair of Joint Wageningen/London Group on Technology and Agrarian Development Van den Ban, A.W. and Hawkins, S. 1988, 1996. Agricultural Extension. London: Longman van de Fliert, E. 1993. Integrated Pest Management. Farmer Field Schools Generate Sustainable Practices: A Case Study in Central Java Evaluating IPM Training, WU Papers 93–3. Wageningen: Agricultural University, published doctoral dissertation Vartdall, B. 1995. Farmers’ approaches to ecological agriculture. IFOAM Ecology and Farming, May 1995: pp20–2 Woodhill, J. 1993. Science and the facilitation of social learning: a systems perspective. Paper for the 37th Annual Meeting of the International Society for the Systems Sciences, University of Western Sydney
17
Subsidies in Watershed Development Projects in India: Distortions and Opportunities John M. Kerr, N. K. Sanghi and G. Sriramappa
Development is increasingly understood to be a process whereby people learn to take charge of their own lives and solve their own problems. Helping people solve their problems by giving them things and doing things for them makes them more dependent and less willing to solve their own problems. This cannot be called development; on the contrary, it is the very opposite of development (Bunch, 1982).
Heavy subsidies are a standard component of virtually all agricultural and rural development projects in India. It is difficult to find examples of government or non-governmental projects that do not include substantial funding from the sponsoring agency. Such funding can take several forms: helping to pay for labour, agricultural inputs, machinery services or technical expertise. Sometimes assistance is provided to help rural people carry out work on their own, and sometimes the work is done for them. This chapter discusses the effects of subsidies on watershed development projects, particularly in India, although the arguments presented are relevant throughout the world. In this chapter we do not argue against government support for agriculture and poverty alleviation. Rather, we aim to show that some unintended, negative consequences of heavy subsidies in watershed management programmes actually undermine watershed development objectives. The cause of the problem is that often watershed subsidies are intended simultaneously to support improved land management and rural employment generation. This is a lot to demand of a single policy intervention. We argue that watershed programmes could be more successful if these subsidies were reduced or eliminated, and the objectives of support for agriculture and poverty alleviation were achieved through alternative means. We conclude by suggesting alternative approaches that avoid subsidies or minimize their potentially destructive impacts. Reprinted from Kerr J M, Sanghi N K and Sriramappa G. 1999. Subsidies in watershed development projects in India: Distortions and opportunities. In Hinchcliffe F et al (eds) Fertile Ground. IT Publications, London. Chapter 14, pp178–193.
322 Enabling Policies and Institutions for Sustainable Agricultural and Food Systems
Government Support for Agriculture and Human Welfare Subsidies and payments to rural people have a long history in India. Employment generation for famine relief, for example, dates back several centuries. In contemporary times, many state governments sponsor employment programmes that provide important welfare benefits. Whether for constructing irrigation canals or promoting watershed development, employment generation can easily be built into a range of rural development projects and produce tangible benefits, such as combating hunger and stabilizing rural income. Subsidies are also often seen as a useful way to convince farmers to try something that subsequently they will adopt with their own resources. This faith in the ‘demonstration effect’ is common among agricultural researchers worldwide, who believe that the technologies they develop will be adopted if farmers are shown their merits. The success of the Green Revolution contributed to this sentiment in India. In the Green Revolution, scientists’ discoveries on agricultural research stations led farmers literally to replace traditional farming systems, resulting in spectacular productivity increases. Agricultural demonstrations in India take several forms. Those conducted on farmers’ fields normally involve subsidies. Researchers often select a farmer who receives free inputs if he donates a field to be used as a demonstration plot. Researchers then select a technical model to test on the plot. On a larger scale, watershed programmes often supply farmers with partially or fully subsidized inputs in exchange for allowing watershed works to be implemented in their fields, or to demonstrate to farmers the complementary effects of improved inputs and cultivation practices. Some soil and water conservation (SWC) projects in India operate in areas where agriculture imposes external costs, or externalities, in downstream locations. The classic case is when erosion on farm land leads to siltation of reservoirs or other downstream infrastructure, decreasing their lifespan at a high cost to the national economy. Several publications of the Central Soil and Water Conservation Research and Training Institute in Dehra Dun display a photograph of a bridge in the Dun Valley that was nearly engulfed by half a century of upstream erosion (CSWCRTI, 1989). Images such as this leave a powerful impression of the need for government to help pay for erosion control measures on farms, even though such externalities are not present in every case. Subsidies were also built into early SWC programmes because of official perceptions that farmers were ignorant and would manage their land properly only under coercion or persuasion. In some cases officials designed programmes that forced farmers to comply. But farmers resisted compulsory programmes; often destroying measures introduced against their wishes after the soil conservation officials leave (Fernandez, 1993). Today, many people view compulsory programmes as unacceptably authoritarian in nature. They seek another way to encourage farmers to adopt soil conservation
Subsidies in Watershed Development Projects in India 323
practices. Paying farmers for work done on their fields offers a more socially acceptable way to try to achieve conservation objectives. In recent years subsidies have assumed great political importance. This is partly because India, unlike many other developing countries, is a functioning democracy. The rural vote is always hotly contested in Indian elections, with politicians often resorting to vote-buying schemes such as loan forgiveness and a wide range of subsidies to attract the rural constituency.1 The combined result of these efforts to create employment, demonstrate technology, combat externalities, guide ‘ignorant’ farmers and gain political influence, is that most people in India do not question subsidies for agricultural development projects. Farmers have learned from experience that they may always expect subsidies, and the rest of society accepts – apparently without question – the idea that it should share the cost of measures intended to help farmers. There is little debate about why these subsidies are justified or what objectives they achieve. Here we argue that subsidies can hinder attempts to increase agricultural productivity and conserve natural resources.
When are Subsidies Appropriate and When are they not? Economic policies should be used to accomplish objectives that the free market does not achieve on its own. For example, they are needed when the market sends signals to people to produce, consume or invest in ways that are economically optimal for the individual but not economically optimal for society as a whole. In the language of economics, under these circumstances the private costs and returns of an activity do not equal the social costs and returns. This situation is referred to as a market failure (Box 17.1). A policy intervention such as a tax, subsidy or a change in the laws that govern the market, can correct the market failure by realigning private and social returns of the economic activity in question. Direct government intervention can also be used to provide goods and services that the market does not provide. Policy makers have many possible economic tools for correcting market failures. These include granting subsidies, levying taxes, assigning and specifying property rights, improving credit and insurance markets and many others. The important point is that subsidies are just one of many policy tools. Depending on the market failure at hand, a subsidy may or may not be the most appropriate policy tool. In economic terms, introducing a subsidy is justified if two broad conditions apply: • •
There must be a market failure (see Box 17.1). A subsidy must be the best way to correct the market failure, i.e. the one that solves the problem as directly and inexpensively as possible, with minimal side effects.
324 Enabling Policies and Institutions for Sustainable Agricultural and Food Systems
Box 17.1 Types of market failure Examples of market failure, when market prices signal people to carry out activities that are not in society’s economic interests, abound in natural resource management and have a variety of causes. Gadgil (1992) describes how forest product firms with short-term concessionary rights to forest land over-harvested forests because they had no stake in their future productivity. Similarly, farmers collectively over-exploit groundwater in semi-arid regions because there are no property rights governing access to groundwater, and because electricity price subsidies encourage overuse (Kerr et al, 1997). Village irrigation tanks are poorly managed because traditional institutions for collective action have deteriorated. Pender (1993) found that many poor farmers wished to invest in wells but could not do so due to credit constraints. Farmers in dryland conditions apply less than optimal amounts of fertilizer because of the risk that their investment will be wasted if rainfall is insufficient. In all of these cases of market failure – externalities, short time horizons, unspecified property rights, credit constraints, risk, and others – the market fails to encourage the best pattern of natural resource management, and some policy intervention is needed to make the market work better.
A policy tool that is not directly targeted to the cause of a problem might fail to solve it, or even worsen it (Box 17.2). A subsidy should address the causes of problems, not their symptoms. A subsidy is an appropriate tool, for example, if the problem is that farmers do not invest in watershed development because the benefits go to the national economy but not to the investing farmer. In this case a subsidy can raise private returns to match social returns. On the other hand, if the problem is that a farmer cannot invest in planting trees or digging a well because he lacks access to credit, the policy should be to provide credit. A subsidy might encourage the investment in trees or wells, but it is wasteful because a less expensive policy could have achieved the same objective. Box 17.2 The consequences of poorly targeted policy In India and several other countries, policy makers alarmed by the loss of tree cover introduced laws against cutting and marketing trees, on both public and private land. On private land this legislation had a serious side effect: farmers planted fewer trees because they feared that they would not be able to sell them (Chambers et al, 1989a; Murray, 1994). The policy that was chosen was not direct enough in addressing the problem of deforestation on public land. It also had the side effect of discouraging farmers from increasing tree cover on private land. A better policy would have helped farmers plant trees and market tree products while controlling the problem of logging in public forests.
Subsidies in Watershed Development Projects in India 325
In other words, in some cases subsidies are the best policy tool, but in other cases they are not. And they have four major drawbacks: 1 2 3 4
They cannot be extended to everyone, because funds are limited. They are wasteful in cases where another policy could be used to accomplish the desired objectives. They may be difficult to remove once put in place. They may cause unwanted side effects.
How Subsidies Affect Incentives As stated above, a subsidy is a payment or service that raises the net private returns from an activity; an incentive is something that motivates or stimulates a person to act.2 Financial subsidies are intended to increase financial incentives, but other types of incentives can be social, moral, psychological or political. There are different types of subsidies and these have different effects on a range of incentives or motivations.
Financial subsidies Most people think of finance when they think of subsidies. The intention of a financial subsidy is to raise the incentive for people to pursue the subsidized activity. Subsidizing production of oilseeds encourages farmers to plant more of them, and subsidizing construction of contour bunds encourages farmers to build them. The economics of subsidies appears to be very simple: by making the subsidized item less expensive or more remunerative, more people will be willing to pay for more of it. Paradoxically, financial subsidies can reduce financial incentives for people to invest their resources in subsidized activities. If a soil conservation programme subsidizes construction of conservation ditches in one village, for example, then farmers in a neighbouring village who are considering investing in conservation ditches have an incentive to postpone the investment in the hope that the programme will soon operate in their village as well. The farmer whose conservation ditch was subsidized this year has an incentive to postpone repairing or rebuilding it in the hope that a future conservation programme will pay for it. Numerous SWC programmes throughout the world have faced this experience. Subsidies also discriminate against products and practices that are not subsidized. If a subsidy reduces the cost of a commodity or technology or a certain way of doing things, it creates a disincentive to use substitute products or technologies. Electricity subsidies, for example, can reduce the incentive to search for alternatives such as solar-powered pumps. Over time, this can impede scientific progress and stifle indigenous knowledge because it reduces payoffs for innovating and
326 Enabling Policies and Institutions for Sustainable Agricultural and Food Systems
finding less expensive, more efficient ways to do things. In the case of watershed management, subsidies for certain conservation techniques reduce incentives to try other, less expensive ones. Financial subsidies also create opportunities for corruption because they put officials and influential beneficiaries in a position to mismanage funds and other programme benefits. In a worldwide review of food-for-work programmes, corruption occurred more often than not (Jackson, 1982).
Psychological and moral disincentives Financial subsidies risk causing even more damage to psychological, social or moral incentives than to financial incentives. The experiences of innumerable agricultural development projects around the world demonstrate the psychological effects of cash and kind subsidies. Too often, villagers who receive free machines, irrigation wells or other items do not maintain or manage them properly. They value the services of free items, but they do not treat them as they would treat something they paid for themselves. These free items, or giveaways, never seem to last as long as comparable items purchased by farmers with their own money. If the machine breaks, they look to the agency that provided it to repair or replace it. Rural development agencies everywhere are now finding it difficult to operate without subsidies because villagers accustomed to giveaways act as though they are morally entitled to handouts, but not morally responsible for trying to solve their own problems. In this sense financial subsidies create disincentives that retard development.
Subsidized services Development projects that provide services rather than funds offer another form of subsidy. Some subsidized services play an important role in the economic development and well-being of any country, and their potential benefits should not be discounted. Education is the best example. In rural development efforts, assistance that enables people to do things they could not (or believe they could not) do, can have a powerful, beneficial effect. Not surprisingly, however, subsidized services that are not carefully designed can have the same negative effects on incentives as financial subsidies. For example, if a project relies on outside technical experts to perform such activities as maintaining accounts, managing marketing efforts, or organizing and mobilizing people to perform some work that benefits the community, these activities are likely to cease once the project has ended. Instead of working for themselves, villagers wait for outsiders to do things for them as they have become accustomed to relying on someone else to do the work, and hence have not developed the necessary skills. In the extreme case, external agencies even discourage villagers from thinking for themselves, suggesting solutions to villagers’ problems and offering to subsidize them. This leads villagers to say, ‘Tell us what we need’, instead of, ‘We
Subsidies in Watershed Development Projects in India 327
need this. What do we need to do to achieve it?’ (Barbara Adolph, ICRISAT, personal communication). The key principle here, then, is that subsidized technical assistance should be targeted as much as possible towards helping people do things for themselves as opposed to doing things for them. This is an obvious and often-quoted principle, but it is easy to forget. Sometimes the line between the two is fine, and to avoid crossing it requires great effort. This is because it is usually easier to do something for people than to teach them to do it themselves.
How Subsidies can Undermine Watershed Management Projects Many Indian government SWC programmes operate through heavily subsidized SWC packages. In these programmes, farmers have little say in the choice of technologies to be used on their fields, but they receive benefits ranging from several days of employment to free fertilizer, seeds and other inputs. The people responsible for implementing the work have little or no say in the project design, and they are evaluated by government auditors on the basis of the level of expenditure and the area covered by the physical structures they construct (government watershed officials, personal communication).3 This approach and its results are very similar to those of the compulsory programmes of old. Many farmers adopt the technology not because they like it, but to obtain free inputs or employment. Sometimes the implementing agency, under pressure to achieve quantitative targets, convinces any resisting farmers to accept the work by increasing the subsidy payment (government watershed official, personal communication). In this way all parties are satisfied: farmers receive substantial benefits and officials achieve their quotas. The drawback is that farmers’ fields are littered with mechanical structures or vegetative barriers that they do not necessarily want. The structures are removed or left to deteriorate once the project staff depart.
Subsidized technology Scientists and project managers who are confident in the technologies they develop often design top-down projects with minimal input from farmers. But even if a technology is scientifically sound, it may not suit the needs of farmers, who often have multiple objectives and constraints that cause their preferences to differ from those of scientists (Kerr and Sanghi, 1992; Chambers et al, 1989b; Pimbert, 1991).4 But if subsidies are high enough – often in India they reach 75 per cent, 90 per cent, or even 100 per cent – then farmers might accept them for reasons unrelated to the characteristics of the technology. Experience shows that farmers are very particular when it comes to accepting new agricultural technology, particularly in unproductive, risky dryland environments.
328 Enabling Policies and Institutions for Sustainable Agricultural and Food Systems
Box 17.3 Subsidized technology in Indian soil and water conservation Many soil and water conservation programmes in India subsidize certain pre-approved technologies such as earthen bunds or vegetative barriers. These subsidies make farmers more likely to accept subsidized techniques and less likely to search for less expensive alternative conservation measures. In this way, subsidies inhibit farmers’ creativity and slow the development of indigenous knowledge. An extreme example of this problem is found in hilly, rocky parts of India where the soil is very shallow. One watershed programme operating in such an area subsidized the use of vegetative bunds but not stone bunds; another programme in a similar agro-climatic region subsidized earthen bunds but not stone bunds. In the former case the vegetative barriers could not grow because the stony soil prevented the roots from penetrating. In the latter case, the soil was so shallow that removing it to build earthen bunds would have seriously damaged agricultural productivity. In both of these areas there was a rich tradition of farmers’ own investments in indigenous SWC measures, particularly stone bunds and enclosure walls. In the former area, the project subsidized labour for planting cactus hedges so heavily that it became a highly profitable activity. Farmers responded by planting cactuses next to their existing stone walls. The cactuses served as no more than decoration, but they met the farmers’ primary objective of earning subsidy payments.
Achieving progress in agricultural development in these areas means understanding the subtle factors that contribute to farmers’ decisions. Scientists and project managers should encourage farmers to test new technologies and consider how to adapt them to suit their needs. Clearly, the complicated task of sorting out the many determinants of farmers’ acceptance of new technologies becomes even more difficult when large subsidies tilt the balance in favour of adoption (Box 17.3). Of course, the decision to adopt under these circumstances is likely to be reversed once subsidies are removed, and farmers’ suspicions that scientists and programme managers do not understand their needs will be reinforced. The problem becomes more damaging once farmers become accustomed to heavily subsidized projects that deliver unsuitable technology. In this case farmers anticipate the benefits of subsidies but do not expect anything else of value. In India, many farmers do not take government projects seriously, and they are upset if they do not receive giveaways (Sanghi, 1987). Under these circumstances, heavily subsidized projects are doomed before they begin. Moreover, new projects that attempt to operate without financial subsidies are not welcome: farmers evaluate them in advance on the basis of what giveaways they offer rather than on their merits (Bunch, 1982; Valdes, 1994).
Subsidized inputs In some watershed projects and on-farm research demonstrations, farmers who adopt SWC practices receive free inputs, such as seeds and fertilizer. The idea
Subsidies in Watershed Development Projects in India 329
behind these giveaways is to demonstrate that improved inputs in combination with SWC measures will result in high yields. Some farmers, however, accept the inputs but then sell them or use them on their irrigated plots rather than on dryland watershed plots (Y. Mohan Rao, ICRISAT, personal communication). As a result, the project fails to achieve the desired demonstration effect, and project officials and scientists obtain no information about farmers’ reactions to the technology that might suggest ways to make it more acceptable to them.
Subsidized labour Some projects subsidize labour devoted to watershed works. In both government and NGO projects, 90 per cent or 100 per cent labour subsidies are common. In fact these subsidies exceed 100 per cent, because they use the legal minimum daily wage of Rs. 22, whereas the market wage in the dry season falls to below Rs. 20 in many rural areas. Therefore 90 per cent of the legal minimum wage actually can be more than the market wage. Not surprisingly, many people eagerly participate in these programmes regardless of what they think of the technology. Formal and informal surveys (Box 17.4) of farmers in various watersheds find that they perceive employment to be the most important project benefit (ICRISAT data, 1994, unpublished).
Subsidies and replicability Development agencies often list replicability in non-project areas among the objectives of their work. Official documents for large Indian watershed development projects, for example, cite replicability as an important objective (World Bank, 1990; Government of India, 1991). The same documents go on to explain that the projects cover 50 per cent to 100 per cent of the cost of the technologies that they introduce, with farmers contributing whatever is left. These documents contain little or no discussion of the relationship between subsidies and replicability. They
Box 17.4 Do rural people want conservation measures or employment? A group of researchers carried out an informal survey of soil conservation practices in a village in Maharashtra. One of the researchers was from the government and the rest were from elsewhere. When the villagers met the government researcher, they uniformly praised the large government soil conservation programme undertaken 15 years earlier and expressed satisfaction with the contour bunds that it introduced. On the second day of the survey the government official was not present, and the villagers admitted that they did not like the contour bunds but would happily accept them as a means of gaining lean season employment. Once again, subsidies obstructed officials and researchers from gaining information that could help them to improve technologies and project design. Source: Personal communication with farmers
330 Enabling Policies and Institutions for Sustainable Agricultural and Food Systems
justify subsidies as supporting the demonstration effect, but there is no serious discussion of how subsidies will be phased out. For true replicability, however, phasing out subsidies is critical because funds are not available to provide them except in a limited area and for a limited period. Because subsidies cannot be made available to everyone – certainly not to all of India’s hundreds of millions of farmers – it is probably better not to introduce them in the first place. A watershed project initiated without subsidies obviously faces a more accurate test of replicability than any project supported by subsidies.
Paying for participation Participatory watershed projects are intended to overcome the problems faced by top-down projects. Participatory planning between farmers and watershed officials is expected to ensure that the technologies selected are both technically sound and acceptable to farmers. Experience shows that this approach is very sound, but if it includes high subsidies, especially subsidies for labour, participation actually can worsen the problem of encouraging farmers to accept useless technology. Two examples illustrate this point (Box 17.5). These two examples are probably replicated on a daily basis in heavily subsidized, participatory projects in India. The essence of the problem is that subsidies distort incentives so that farmers select the technology made most attractive by the giveaway rather than the one they think is best on its own merits. Project officials too trusting of farmers’ wisdom are likely to be fooled in such cases.
Box 17.5 The consequences of subsidized participation A programme in Andhra Pradesh aimed to encourage farmers to build bunds on their land. The project paid the farmers to carry out the work on their own land and allowed them to choose their own technology. Two soil scientists visiting the project in 1993 noticed that on some fields earthen bunds were far larger than necessary, and that they actually did more harm than good by taking scarce topsoil from the field. They also noticed that a large stone structure on the boundary of one field served no apparent purpose. Further investigation suggested that the lure of guaranteed employment led the farmers to build large bunds regardless of their purpose. The second case concerns a participatory watershed planning exercise held in a drought-prone area of Andhra Pradesh. Under the project, villagers were to be hired to carry out work jointly planned by villagers and project officials. When the villagers were asked to present their plan, they said that enlarging the massive irrigation tank bund was their top priority, even though the tank had filled only three times in the previous ten years. Subsequent investigation revealed that the farmers did not really think that the bund needed to be raised, but they knew that such a large project would employ them throughout the dry season, relieving them from having to migrate to Hyderabad or Madras.
Subsidies in Watershed Development Projects in India 331
True participation means working together towards a common objective. This will not be possible if the very design of projects creates incentives to mislead and deceive. Subsidies can create such incentives.
Promoting Watershed Development Without an Overreliance on Subsidies If subsidies, particularly high subsidies that create employment or target specific inputs or technologies, can create so many problems in watershed development projects, what should be done? First, subsidies should be avoided where there is no obvious justification. Second, where subsidies are justified they should be designed and implemented in such a way as to minimize distortions to incentives.
Designing subsidies with minimal distortions to incentives In India, high subsidies in watershed programmes are a fact of life, and it will be difficult to remove or greatly reduce them immediately. This is partly because of a ‘culture’ of high subsidies where no one questions their usefulness, but also because high subsidies are written into national legislation that will not be changed overnight. This means that it is very important to devise ways to reduce the harmful impact of subsidies on watershed programmes. One way to reduce the harmful effect of subsidies is to require matching labour contributions by landowners on whose land conservation structures are built. The idea is as follows. Farmers may choose their own conservation technology and must build half of a given structure with their own labour (either family or hired). They may then request the conservation programme to construct the second half, according to the design specified by the farmer. The conservation programme would hire the workers under the programme to do so; these workers would be paid only after the farmer certifies that the work is acceptable to him. This approach has several advantages. First, it helps ensure that the technology suits the farmer’s wishes and is built according to standards that satisfy him. Second, the farmer never receives any payment, reducing the chances that he will participate in the programme for unexpected reasons. This approach also offers the important side benefits of helping to organize landless workers and teaching them skills that will increase their self-sufficiency. In particular, labourers may form an association to provide conservation construction services. Payments from the watershed project would be made directly to the association and distributed to its members. Assistance could be provided to the association to develop their business skills and perhaps develop spin-off activities such as revolving credit programmes. More generally, this idea follows the principle of using rural development programmes as leverage to create benefits for disadvantaged groups such as the poor, lower castes and women.
332 Enabling Policies and Institutions for Sustainable Agricultural and Food Systems
Contributing an input or a technology to a group of families instead of to an individual family is an important step in this direction, particularly if one family’s receipt of benefits depends on other families’ adherence to agreements made under the programme. This is a well-known principle that contributes to the success of Bangladesh’s Grameen Bank, where loans are made to groups of five people, and if one of them does not repay, all five lose access to further credit. Another variation on this principle is known in India as rotational credit, in which loans are provided in sequence to different people in a group. Under this system, the second loan is made only after the first is repaid and so on. Such schemes could be devised under subsidized watershed programmes in India. However, it is preferable to avoid subsidies entirely where they are not justified economically, rather than try to cope with strategic behaviour by those who receive subsidies. The rest of this section suggests ways to promote watershed development with no subsidies at all.
Institutional innovation to manage local externalities As stated above, subsidies for watershed management are justified when its private and social returns diverge. Recent evidence from numerous tropical countries, however, suggests that in most cases the benefits of soil and water conservation practices accrue mainly to the farmer who adopts them. The externalities that do exist are usually highly localized: soil erosion in most places does not deposit silt in downstream hydroelectric dams, but rather in neighbouring farms or ponds within the same microwatershed. Similarly, the low application rates of pesticides and fertilizer mean that run-off of poisonous chemicals is not a major problem. If there are no externalities then there is no argument in favour of subsidies; if externalities are small then only small subsidies are justified. In this case, if anyone should pay upstream farmers to adopt soil conservation it is their downstream neighbours, not taxpayers at large. The idea of ‘payments’ by one group of farmers to another is not as revolutionary as it first sounds. In fact, it is an old and well-known idea among economists (Coase, 1960). ‘Payment’ need not mean cash or even kind transactions, but rather some kind of formal or informal compensation mechanism from one group to another (Box 17.6). Such arrangements are sometimes found in common property resource management systems, whereby a group that benefits from a collective management arrangement secures cooperation from a group that does not. If watershed externalities tend to be small and localized, two principles emerge. First, watershed managers should begin by assuming that there is no need for financial subsidies. If subsidies are justified they may be offered, but justification should not be assumed. Second, external assistance should focus on helping people organize themselves to solve their own problems, and to facilitate access to credit, secure tenure and other factors needed to guide private incentives toward socially productive activities.
Subsidies in Watershed Development Projects in India 333
Box 17.6 Spreading the benefits of natural resource management A classic example from India is the famous Sukhomajri watershed project, in which landless families received rights to irrigation water in exchange for protecting the irrigation tank catchment area. These families could then sell their water share or use it on leased land (Patel-Weynand, 1997). More recently, the National Tree Growers’ Co-operative has adopted a similar approach, giving all households a share in the returns to protecting trees in common forests. Another example from India concerns current efforts in Andhra Pradesh to convert irrigation tanks to percolation tanks (Gangi Reddy et al, 1994). Under certain circumstances there can be substantial benefits from tank conversion, but they are not evenly distributed, so possibly some people who stand to lose have an incentive to sabotage the effort. Success in tank conversion projects therefore requires organizing all the people affected by the tank to ensure that the benefits are distributed in a way that satisfies all of them. No external finance is needed.
Supporting community organizations Informal village groups can potentially serve as a focal point for efforts to resolve local disputes and mobilize farmers into action. Experience in India suggests that participation in local groups can build villagers’ confidence to work collectively, to establish thrift funds to generate capital, to consider new investment opportunities, and generally to become more active (James Mascarenhas, OUTREACH, personal communication; Parthasarathy, 1994). Active local groups can stimulate psychological incentives that previously were stifled by cultural or political constraints. These potential strengths of local groups have nothing to do with external finance. In fact, they present an alternative, more sustainable way to improve the welfare of rural people. Farmer-to-farmer extension is an offshoot of community organization. Once villagers organize, skilled farmers can serve as extension agents to spread information to their neighbours. They may have more credibility than traditional extension workers because they face the same circumstances as the people they serve. Farmer-to-farmer extension has had favourable results in many countries. Two principles from these experiences are worth highlighting. First, every community is different, so there can be no single blueprint for designing community organizations. Second, external funds donated to community organizations should be forthcoming only to groups that have already established themselves and demonstrated that they are serious. The funds should be small and should support the costs of organizing, gathering information and spreading awareness; they should not finance giveaways.
334 Enabling Policies and Institutions for Sustainable Agricultural and Food Systems
Conclusions In summary, there are good reasons to believe that subsidies are undermining Indian watershed development efforts. This is especially so where subsidies are very high and are tied to employment or to specific technologies that require subsequent maintenance to be useful. In many watershed programmes, subsidies lead farmers to adopt SWC techniques with no intention of maintaining them, and they make it difficult for researchers and project managers to learn what practices farmers accept or do not accept. Many people in India believe that watershed development should he subsidized simply because so many Indian farmers are very poor and need assistance. However, projects in many countries with similarly poor farmers have removed or substantially reduced subsidies, with favourable results. These countries include Kenya, Lesotho, Niger, Haiti, Cape Verde, the Dominican Republic and the Philippines, to name a few (Lutz et al, 1994; IFAD, 1992; Critchley, 1991; Fujisaka, 1989). In some cases they found that removing subsidies made no difference; in others they found that it improved efforts to encourage conservation. Programmes under SPEECH in Tamil Nadu, Oxfam in Andhra Pradesh, and others have shown that this approach can work in India as well. Evidence from around the world suggests that farmers will invest in conservation practices when it is profitable for them to do so (Lutz et al, 1994; Tiffen et al, 1994). This suggests that farmers do not need subsidies so much as they need less expensive, more profitable technologies; policies that encourage them to take a long-term perspective in caring for their land, greater awareness of the costs of degradation, and encouragement to organize themselves to invest in conservation (Pretty, 1995). Even if these enabling conditions are created, there will remain poor people who need assistance to improve their livelihoods. But poor people can be helped in other ways that waste less money and do not distort incentives to invest in conserving natural resources. There is no need to tie poverty relief measures to natural resource conservation efforts. Likewise, there are alternative ways for the government to support rain-fed agriculture. Gulati (1990) found that Indian agriculture is subject to net taxation even though many inputs are heavily subsidized. This is because price and trade policies reduce output prices and inhibit demand by more than enough to overcome the benefits to farmers of input subsidies. One obvious way to promote investment in more productive agriculture, therefore, is to alter price policies to raise farmers’ profits. Reducing subsidies substantially will be difficult in India. Farmers are accustomed to high subsidies and will oppose efforts to remove them. Also, projects that try to reduce subsidies unilaterally will face difficulties if nearby projects continue to offer large giveaways. For these reasons, removing or substantially reducing subsidies will be very challenging. A concerted effort is needed to eliminate the giveaway mentality if conservation efforts are to have long-lasting and widespread success.
Subsidies in Watershed Development Projects in India 335
Acknowledgements John Pender, Chris Reij, Roland Bunch, Jules Pretty, David Seckler, Barbara Adolf, Doug Clark, Tim Kelley and JK Kiara all offered helpful comments on this paper.
Notes 1
2 3 4
This situation is similar to that in Europe, North America and Japan, where subsidies are politically important and often cause major distortions to the economy. In non-democratic societies, subsidies are politically important where leaders fear being forcibly removed from office rather than voted out. Sometimes subsidy and incentive are used synonymously, but not here. Most of the watershed projects referred to in this paper are deliberately left unnamed. Kerr and Sanghi (1992) explain in detail how differences in Indian farmers’ and scientists’ priorities cause them to prefer very different approaches to soil and water conservation.
References Bunch, R. 1982. Two Ears of Corn. World Neighbors, Oklahoma City. Bunch, R. 1990. Low input soil restoration in Honduras: the Cantarranas farmer-to-farmer extension programme. Gatekeeper Series 23. IED, London. Campbell, C.A. 1994. Landcare: Communities Shaping the Land and the Future. St. Leonards, NSW, Australia: Allen and Unwin. Central Soil and Water Conservation Research and Training Institute (CSWCRTI). 1989. CSWCRTI: an Introduction. CSWCRTI, Dehra Dun, India. Chambers, R., Saxena, N.C. and Shah, T. 1989a. To the Hands of the Poor: Water and Trees. Oxford & IBH Publishing Co. Pvt. Ltd., New Delhi, and Intermediate Technology Publications, London. Chambers, R., Pacey, A. and Thrupp, L-A. (eds.) 1989b. Farmer First: Farmer innovation and agricultural research. Intermediate Technology Publications, London. Coase, R.H. 1960. The problem of social cost. Journal of Law and Economics 3:1–44. Critchley, W. 1991. Looking After our Land: Soil and Water Conservation in Dryland Africa. Oxfam. Oxford, UK. Fernandez, A.P. 1991. The MYRADA Experience: alternate management systems for savings and credit of the rural poor. MYRADA, Bangalore. Fernandez, A.P. 1993. The MYRADA Experience: the interventions of a voluntary agency in the emergence and growth of people’s institutions for sustained and equitable management of micro-watersheds. MYRADA, Bangalore. Fujisaka, S. 1989. The need to build upon farmer practice and knowledge: reminders from selected upland conservation projects and policies. Agroforestry Systems 9: 141–53. Gadgil, M. 1992. ‘State Subsidies and Resource Use in a Dual Society.’ in The Price of Forests. Centre for Science and Environment, New Delhi. Gangi Reddy, P., Sriramappa, G., Katyal, J.C., Sanghi, N.K. and Kerr, J.M. 1994. Converting irrigation tanks into percolation tanks in South India: a case study of social organization leading to equitable development. Paper prepared for New Horizons: The economic, social and environ-
336 Enabling Policies and Institutions for Sustainable Agricultural and Food Systems mental impacts of participatory watershed development, Nov 28–Dec 2, Bangalore, India. IIED, London. Government of India. 1991. National Watershed Development Project for Rainfed Areas (NWDPRA): Guidelines. 2nd Edition. Ministry of Agriculture, New Delhi. Gulati, A. 1990. Fertilizer subsidy: is the cultivator ‘net-subsidized’? Indian Journal of Agricultural Economics 45 (1) 1–11. IFAD, 1992. Soil and Water Conservation in sub-Saharan Africa: Towards sustainable production by the rural poor. IFAD, Amsterdam. Jackson, T., with Eade, D. 1982. Against the Grain. Oxfam, Oxford. Kerr, J.M., Chandrakanth, M.G. and Deshpande, R.S. 1997. Economics of ground-water management in Karnataka. In: Kerr, J.M., Marothia, D.K., Singh, K., Ramasamy, C. and Bentley, W.R. (eds.) 1997. Natural Resource Economics: Concepts and Applications to India. Oxford and IBH. New Delhi. Kerr, J.M. and Sanghi, N.K. 1992. Indigenous soil and water conservation in India’s semi-arid tropics. Gatekeeper Series 34. IIED, London. Lutz, E., Pagiola, S. and Reiche, C. (eds.) 1994. Economic and institutional analyses of soil conservation projects in Central America and the Caribbean. World Bank Environment Paper 8. World Bank, Washington DC. Murray, G. 1994. Technoeconomic, organizational, and ideational factors as determinants of soil conservation in the Dominican Republic. In: Lutz, E., Pagiola, S. and Reiche, C. (eds.) 1994. Economic and institutional analyses of soil conservation projects in Central America and the Caribbean. World Bank Environment Paper 8. World Bank, Washington DC. Parthasarathy, G. 1994. Economic Impact of Women’s Thrift and Credit Societies in Cuddapha District, Andhra Pradesh. Institute of Development and Planning Studies, Visakhapatnam, India. Patel-Weynand, T. 1997. Sukhomajri and Nada: managing common property resources at the village level. In: Kerr, J.M., Marothia, D.K., Singh, K., Ramasamy, C. and Bentley, W.R. (eds.) 1997. Natural Resource Economics: Concepts and Applications to India. Oxford and IBH. New Delhi. Pender, J. 1993. Farmers’ irrigation investments in the presence of credit constraints: theory and evidence from South India. Brigham Young University, Department of Economics Working Paper No. 93-16. Provo, Utah, USA. Pender, J. and Kerr, J. 1996. Determinants of farmers’ indigenous soil and water conservation practices in India’s semi-arid tropics. EPTD Discussion Paper. IFPRI, Washington DC. Pimbert, M. 1991. Designing integrated pest management for sustainable and productive futures. Gatekeeper Series 29. IIED, London. Pretty, J.N. 1995. Regenerating Agriculture: Policies and Practice for Sustainability and Self-reliance. Earthscan, London; National Academy Press, Washington DC; Vikas Publishers and ACTIONAID, Bangalore. Sanghi, N.K. 1987. ‘Participation of farmers as co-research workers: some case studies in dryland agriculture’. Paper presented to IDS Workshop on Farmers and Agricultural Research: Complementary Methods. Institute of Development Studies, Sussex, UK. Tiffen, M., Mortimore, M. and Gichuki, F. 1994. More People, Less Erosion: Environmental recovery in Kenya. John Wiley and Sons, Chichester. Valdes, A. 1994. Economic analysis of soil conservation in Honduras. In: Lutz, E., Pagiola, S. and Reiche, C. (eds.) 1994. Economic and institutional analyses of soil conservation projects in Central America and the Caribbean. World Bank Environment Paper 8. World Bank, Washington DC. World Bank. 1990. Staff Appraisal Report, India: Integrated Watershed Development (Plains) Project. World Bank, Washington DC.
18
Agri-environmental Stewardship Schemes and ‘Multifunctionality’ Thomas L. Dobbs and Jules N. Pretty
Agricultural policy makers on both sides of the Atlantic face new choices about farming and the environment. Member states of the European Union (EU) are shaping policies to implement the Agenda 2000 reforms of the Common Agricultural Policy (CAP), and these reforms are strongly influenced by the concept of multifunctionality. The Rural Development Regulation, designed as a second pillar of the CAP, allows EU member states to shift up to 20 per cent of their CAP funds to rural development and agri-environmental programmes. This could bring a major expansion of environmental stewardship programmes in Europe as EU members redirect funds from commodity support to environmental and rural development objectives. The United Kingdom, for example, shifted 2.5 per cent of all direct payments to farmers under CAP commodity regimes to rural development and agri-environment initiatives in 2001, and plans call for the proportion to rise gradually to 4.5 per cent in 2005 and 2006 (Ministry of Agriculture, Fisheries and Food; Policy Commission on the Future of Farming and Food). The United Kingdom’s Policy Commission on the Future of Farming and Food recently recommended an increase to 10 per cent starting in 2004, and that serious consideration be given to increasing the proportion to the maximum 20 per cent ‘if substantial CAP reform is not delivered in 2006–07’ (Policy Commission on the Future of Farming and Food, p77).1 Although the US government enacted new federal ‘farm’ legislation for the years 2002–2007, which greatly expands programmes and funding for conservation (USDA, 2002), debates about agricultural and related environmental policies also continue in the United States. We draw on our recent review of agri-environmental programmes in the United Kingdom (Dobbs and Pretty) to examine key issues associated with a major expansion of stewardship payment programmes on both sides of the Atlantic. We describe the evolution of agricultural and agri-environmental policies in the United Kingdom and the concept of multifunctionality now driving European dialogue Reprinted from Dobbs T and Pretty J, Agri-environmental stewardship schemes and ‘multifunctionality’. Review of Agricultural Economics 26(2), 220–237, Blackwell, Oxford, 2004.
338 Enabling Policies and Institutions for Sustainable Agricultural and Food Systems
on the next generation of agricultural and environmental policies. Drawing on the United Kingdom experience, we also examine three key issues associated with possible major expansions of stewardship payment programmes: (1) the compatibility of production support and stewardship support; (2) balancing stewardship payments and environmental compliance; and (3) the compatibility of World Trade Organization (WTO) rules with stewardship schemes.2 We conclude with a discussion of implications of the UK experience for US agri-environmental policies.
Evolution of Agricultural and Agri-Environmental Policies in the United Kingdom The roots of current agricultural policy in the United Kingdom go back to the 1930s. Like the United States, agriculture in the United Kingdom entered a depressed condition following the collapse of farm prices after World War I, and it remained so as the industrial world sunk into depression in the 1930s. Price supports for many agricultural products had been put in place by 1932. As the likelihood of United Kingdom involvement in the European conflict grew in the late 1930s, it was apparent that the United Kingdom could be blockaded and food supplies threatened. Consequently, there was a massive effort to intensify agricultural production. Plans, incentives and mandates were put in place for farmers to convert pastures to crop production. Although price controls were in effect during the war, support prices were raised to help provide the money needed to intensify production. Farmers who failed sufficiently to comply with the intensification plans mandated for their farms could be, and sometimes were, evicted. The various policies and initiatives began a major transformation of agriculture in the United Kingdom (Potter; Wormell). The United Kingdom determined that agriculture would not be allowed to collapse again, as it had after World War I. The principal objectives of the 1947 Agriculture Act were to increase food production and combat the chronic balance of payments deficit. In this and subsequent Acts, the United Kingdom government recommitted itself to an intensified and modern agriculture. Policy instruments included plowing grants, price subsidies for crop and livestock products, grants for field drainage and hedgerow removal and subsidies for fertilizers (Pretty, 1998). Similar policies were put in place elsewhere in Europe, and the policies began to take on greater uniformity with initiation of the CAP by the then Common Market in 1958. Much of the United Kingdom’s domestic agricultural support was conditioned by the CAP following entrance into the European Community in 1973. Like US agricultural support policies, the CAP was effective in stimulating food and fibre production. However, this abundance came at increasingly high budgetary and environmental cost. In recognition of the mounting problems with modern, intensive agriculture, policy reforms started in Europe in the mid-1980s. The Environmentally Sensitive Areas scheme was the first agri-environmental programme in the EU, launched in the United Kingdom in 1986. The next major UK agri-environmental programme
Agri-environmental Stewardship Schemes and ‘Multifunctionality’ 339
was the Countryside Stewardship Scheme, established in 1991. The 1992 Mac-Sharry CAP reforms began to weaken the links between production and farm income support, and were followed with financial assistance packages to UK farmers to convert to organic agriculture or accomplish a variety of environmental outcomes.
Multifunctionality Building on the experiences of the 1980s and 1990s, EU member states are now shaping a new generation of agri-environmental policies based upon the concept of multifunctionality (Organisation for Economic Co-operation and Development). Agriculture is inherently multifunctional – it does more than just produce food, fibre, oil and timber (Food and Agriculture Organization, Whitby). It has many functions or purposes, thereby potentially producing a wide range of outputs or services. Agriculture that depletes organic matter or erodes soil while producing food externalizes costs that others in society must bear; but one that sequesters carbon in soils through organic matter accumulation contributes to both the global good by mediating climate change and the private good by enhancing soil health (Pretty et al, 2000, 2002). Similarly, a diverse agricultural system that protects and enhances on-farm wildlife for pest and disease control contributes to wider stocks of biodiversity, while simplified modernized systems that eliminate wildlife do not (Costanza et al, Doran and Werner, Pretty et al, 2001, Pretty, 2002). Multifunctionality suggests agriculture can deliver valued nonfood functions that cannot be produced by other economic sectors. Much of the apparently ‘natural’ biodiversity in Europe is the result of centuries of farming, and agriculture has created and shaped the landscape and countryside. There are many other positive side effects of agriculture, including values derived from aesthetic appreciation; recreation and amenities; water accumulation and supply; nutrient recycling and fixation; wildlife, including agriculturally beneficial organisms; and storm protection and flood control. The idea that agriculture provides these other types of goods and services is not new, of course, and, in itself, is not controversial. The controversies surround how this concept is translated into policies. Several major challenges face policy makers in restructuring agricultural support based on the multifunctionality perspective. With multifunctionality centre-stage in EU agricultural policy discussions, support to farmers increasingly will be tied to stewardship and other social objectives, rather than to food and fibre production. Admittedly, agricultural policies have frequently served several public policy objectives. Figure 18.1 illustrates how different agricultural policies rest along intersecting continuums. Some policies serve primarily to support food and fibre production objectives, some support primarily stewardship (environmental) objectives and others support particular social objectives. In addition, some may support a combination of two or all three of these objectives. The challenge to multifunctionalists that we focus on in this article is how to make the transition from production (top of the triangle in Figure 18.1) to stewardship policies (lower right-hand corner).
340 Enabling Policies and Institutions for Sustainable Agricultural and Food Systems
Figure 18.1 Location of agricultural/rural support according to production, stewardship and social objectives
In addressing this challenge, consider exactly what kinds of policies tend to be clustered in the different corners of Figure 18.1. Major examples are listed in Table 18.1. Various kinds of grain and oilseed price supports used in the EU and the United States during the last half of the 20th century clearly served primarily to increase food and fibre production. In the United Kingdom, a number of those policies initially were intended to increase production of food commodities, but they also had the social objective of supporting farm incomes. In the United States, price support policies initiated in the 1930s were intended primarily to achieve social objectives of maintaining farm income and a family farm structure of agriculture. However, because the support mechanisms were so closely tied to crop production, these policies are represented by small boxes close to the production support corner of Figure 18.1. In other words, de facto, the policies tended to support an objective that increasingly was not a priority in industrialized societies in the late 20th century. Livestock headage payments in the EU also have been explicitly tied to levels of production. The US deficiency payment policy of the 1980s and early 1990s,
Agri-environmental Stewardship Schemes and ‘Multifunctionality’ 341 Table 18.1 Typology of public policies/schemes according to objective with which they are most closely associated Production support
Stewardship support
Social support
Support for non-farm activities
Price supports
Organic Farming Schemea Fully decoupled income support payments
Livestock headage payments
Tir Gofala
Beginning ‘smallfarmer’ loans
Deficiency payments
Arable Stewardship Schemea
‘Capping’ price or income support by farm size or income
Education in rural areas
Crop insurance
Norfolk Area Land Management Initiativea
Support for farmers’ markets
Rural health care
Income insurance
Countryside Stewardship Schemea
Support for rural infrastructure
Environmentally Sensitive Areas Schemea Area payments
Countryside Premium Schemea Integrated farming schemesa Nitrate Sensitive Area Schemea Conservation Compliance
Note: a UK schemes.
based on the differences between target and market prices of various commodities, had the social objective of supporting farmers’ incomes but was still closely tied to production. Therefore, we consider that policy also to have been more closely tied to the partially outmoded production objective than to the actually intended social objective of increasing farmers’ incomes. US crop insurance schemes in the 1980s and 1990s, and income insurance schemes piloted in the late 1990s, represent some movement along the continuum from production support toward social support. However, unless very carefully designed, they risk being tied primarily to levels of production of particular commodities. The EU’s area payments, under the Arable Area Payments Scheme, are less tied to production than have been its price support policies. However, they still tend to be closer to the production end of the triangle in Figure 18.1 than to social or stewardship support. We have examined a range of UK policies of the 1980s and 1990s that are closer to the stewardship support corner of the triangle (Figure 18.1 and Table 18.1). The Organic Farming Scheme and its predecessor, the Organic Aid Scheme, were
342 Enabling Policies and Institutions for Sustainable Agricultural and Food Systems
clearly tied to particular stewardship farming systems, as were other schemes in the United Kingdom, including Tir Gofal in Wales. As we read down the stewardship support column in Table 18.1, some policies listed also have social or production elements. Conservation compliance, as incorporated in farm policy in the United States since the mid-1980s, is designed to support stewardship objectives. Commodity program benefits are conditioned on environmental performance on highly erodible cropland (Heimlich and Claassen). Most farmers have come into compliance by altering particular production practices, rather than by substantially altering their farming systems.3 Therefore, we might think of the conservation compliance policy as being somewhere on the continuum between production and stewardship (Figure 18.1). Transatlantic policy dialogue about multifunctionality is hindered by the often-differing European and North American values with respect to agricultural landscape and habitat.4 Europeans value the managed landscape that has evolved over the centuries, whereas many North Americans place high value on ‘wild’, non-agricultural settings. There are also differences in the values put on the types of animal and plant biodiversity. Birds for hunting are highly valued in the United States, for example, whereas a wide variety of farmland bird species are valued for viewing in the United Kingdom. The basic concept of multifunctionality is the same on both sides of the Atlantic, although it manifests itself differently. Appreciation of ‘traditional’ farm and ranch landscapes, especially those near urban areas, is likely to grow in the United States (Hellerstein et al). Support for rural development that is more broadly based than on-farm activities alone is an important element in the emerging EU multifunctionality debate. These ‘non-farm’ rural development activities are represented by the space outside the triangle but within the circle in Figure 18.1. A few broad examples of such activities are listed in the last column of Table 18.1. The first example consists of government support for communications, waste treatment and other kinds of physical infrastructure that make living and operating non-farm businesses in rural areas attractive and affordable. Non-farm businesses include ones related to agriculture, such as food processing operations. The other two examples listed consist of support for human and social capital related to education and health care in rural areas. The focus on multifunctionality, or multiple objectives related to agriculture, is not an attempt to refute the economic notion that some policy tools may be more efficient than others in achieving different objectives or goals (Claassen et al). On the contrary, a multifunctionality approach calls for policy to be much more explicit about what we want from agriculture than has usually been the case. By so doing, analysts can more clearly identify policy tools and scenarios likely to result in either complementarity or competitiveness between agriculture’s different functions. Rather than examine the entire range of relevant policy tools, we focus in this article on positive incentive policies in the form of ‘stewardship payments’. This type of policy tool is intended primarily to enhance agriculture’s performance with
Agri-environmental Stewardship Schemes and ‘Multifunctionality’ 343
respect to positive environmental functions, but it also can have intended or unintended effects on production and social functions. Other potential policy tools designed primarily for environmental functions, such as environmental taxes and regulations, have been extensively analysed elsewhere (e.g. Pretty et al, 2001; Ribaudo et al).
Issues Emerging from the UK Experience Several issues emerge from examining the UK experience, and its growing emphasis on multifunctionality, that have bearing on proposals and plans to substantially expand stewardship payment programmes in Europe and the United States.
Compatibility of production support and stewardship support Much remains to be done to completely decouple income support for farmers from production. Although there have been significant first steps in decoupling under the EU’s CAP, strong incentives remain for farmers in the United Kingdom’s main arable areas to continue farming intensively. UK agri-environmental schemes often have not been financially attractive to highly productive, intensive arable farms (Potter; Baldock and Mitchell). Cobb et al indicate that organic farming systems have tended to be disadvantaged relative to conventional systems in the United Kingdom because the clover/grass leys that are typical in organic rotations did not qualify for CAP arable area payments. If the ley was grazed or put up for hay or silage, it did not qualify as set-aside.5 Bailey et al also found that eliminating or decoupling government support payments and eliminating set-aside requirements would enhance the profitability of ‘integrated’ crop systems relative to ‘conventional’ systems in the United Kingdom. Farmers in the United Kingdom’s arable regions still benefit too much from production-related CAP supports to take up the higher tiers of agri-environmental schemes, and to diversify with crop rotations. Well-intended calls for stronger safety nets in the United Kingdom tend to venture onto a slippery slope toward the area of production support. In an otherwise generally excellent discussion of policy options for UK agriculture, a report of the Royal Agricultural Society of England (RASE) justified the need for a stronger safety net, but it was vague about how such a system would be constituted. The report stated, ‘any safety net should set a floor or minimum price, but is by definition coupled to production’ (Royal Agricultural Society of England, p17). Authors of the RASE report suggested the possibility of using crop and revenue insurance schemes like those being tried in the United States, to strengthen the safety net for UK farmers as conventional CAP price supports are phased out. However, these schemes can inadvertently encourage overly specialized production systems
344 Enabling Policies and Institutions for Sustainable Agricultural and Food Systems
if coverage is too narrow or premium subsidies are too high for particular crop or livestock enterprises. Subsidized crop insurance tends to result in expansion of cropland area (Wu). Cautions about the potential distorting effects of governmentbacked insurance schemes are noted in the USDA’s policy statement, Food and Agricultural Policy: Taking Stock for the New Century (USDA, 2001). Potter and Goodwin stress that merely abandoning production supports is unlikely to accomplish the range of stewardship objectives desired in Europe. It could, indeed, lead to less intensive production (at least after a time), thereby reducing negative externalities related to inorganic fertilizer and pesticide use. However, the overall effects on the range of features that Europeans desire in their managed agricultural landscapes are less clear. Most of the beauty and biodiversity of landscapes in the United Kingdom and elsewhere in continental Europe depend on the continuation of active farming. It is restoration or maintenance of a certain kind of farming that is desired in Europe. Liberalization of farm policy, by itself, could ‘wipe out much of the human capital necessary for the effective conservation of the European countryside’ (Potter and Goodwin, p291). Stated another way, decoupling of subsidy payments from specific crop and livestock commodities is a necessary, but not sufficient, condition for achieving landscape-based environmental objectives. Stewardship programmes are required to counterbalance some of the economically depressing effects that more market-oriented farm policies could have on European agriculture.
Balancing stewardship payments and environmental compliance A critical issue facing policy makers is how to specify which environmental standards should be required without directly compensating farmers and which they should be compensated for achieving. A threefold categorization is useful in thinking about this issue (Dwyer et al). The base category consists of farming practices covered by regulations, such as restrictions on pesticide applications near waterways or on nutrient applications in the United Kingdom’s Nitrate Vulnerable Zones (NVZs). The next category consists of good practices that go beyond regulatory requirements, but for which there are no agri-environmental payment programmes. Examples in England include ‘retaining traditional field boundaries, or maintaining green cover over winter on erodible soils’ (Dwyer et al, p32). The third category contains practices providing environmental services covered by incentive-based compensation schemes. Cross-compliance requirements for farmers receiving CAP production support payments could be applied to practices in either of the first two categories. The debate about which farming practices belong in each category is both philosophical and economic. In essence, this is a debate about whether various agricultural practices that might be carried out for environmental purposes should be viewed as (1) avoidance of negative externalities or (2) production of positive externalities or public goods. What is the baseline, above which agriculture is
Agri-environmental Stewardship Schemes and ‘Multifunctionality’ 345
providing positive environmental externalities and below which agriculture is harming the environment (producing negative externalities)? The answer in any given situation has important implications for public policy. Bromley and Hutchinson stress that this question cannot be answered objectively. The answer is inherently political, being based on public perceptions and political processes specific to time and place that determine property rights and who should provide and pay for particular environmental or social goods from agriculture. An evolution of thinking on this question is illustrated by UK policy regarding nitrate contamination of water by agriculture. For a number of years during the 1990s, the United Kingdom implemented a Nitrate Sensitive Areas (NSAs) scheme that centred on payments to farmers for reducing or eliminating nitrate contamination. This voluntary scheme had similar features to the former Water Quality Incentive Program (WQIP) and the current Environmental Quality Incentives Program (EQIP) in the United States. Although the NSA scheme seemingly was successful (Lord et al), it is being phased out in favour of the NVZ programme. The NVZ programme is a mandatory action programme of measures for controlling nitrate concentration in surface and groundwater in vulnerable areas. Thus, the emphasis has shifted from voluntary to mandatory measures. This implies that nitrate contamination is now viewed as a negative externality, in contrast to the earlier implied view that avoidance of nitrate contamination constitutes provision of a positive externality (clean water). United Kingdom environmental groups have argued that some environmental conditions should be attached to the CAP support payments farmers receive, i.e. that there should be cross-compliance (Potter and Goodwin; Royal Agricultural Society of England). The UK government has been considering new cross-compliance measures (Performance and Innovation Unit; Ministry of Agriculture, Fisheries and Food; Policy Commission on the Future of Farming and Food). Environmental cross-compliance in the United Kingdom currently exists in the following: (a) The receipt of all headage payments for beef and sheep under the Sheep Annual Premium Scheme (SAPS), Beef Special Premium Scheme (BSPS), Suckler Cow Premium Scheme (SCPS), Extensification Premium and Hill Livestock Compensatory Allowances under the Less Favoured Area (LFA) scheme, is conditional on not causing significant overgrazing of the land used by livestock upon which these payments are claimed. (b) The receipt of Arable Area Payments, including set-aside payments, has been made conditional on farmers obeying certain conditions for the management of set-aside land … to protect habitats and species in cropped landscapes. Conditions include the retention of traditional field boundaries adjoining set-aside land, and restrictions on the timing of certain operations on the land, including ploughing and spraying, in order to minimize damage to ground-nesting birds and other species which may breed or feed in set-aside fields (Dwyer et al, pp25–26).
346 Enabling Policies and Institutions for Sustainable Agricultural and Food Systems
Dwyer et al recommended that the UK government consider several additional cross-compliance measures. One would reinforce key environmental regulations with cross-compliance conditions, such as regulations related to hedgerow and groundwater protection. A second measure would make it a general duty for farmers to observe major codes of good agricultural practice already in place in the United Kingdom. The third measure would require that farmers draw up a specified whole-farm plan. This might consist of a whole-farm conservation plan or report similar to those of the Farming and Wildlife Advisory Group in England and Scotland. The intent, however, at this stage, would not be to require farmers to implement all the plans’ suggested actions. Finally, Dwyer et al recommended consideration of a cross-compliance measure requiring margins of specified widths around all fields eligible for Arable Area Payments. As long as CAP support payments remain high, cross-compliance measures effectively serve as regulations for most farms eligible for payments. Therefore, environmental services resulting from cross-compliance are obtained with substantially less government budgetary cost than through expanded stewardship payment programmes. However, if and when production-related support payments dramatically decline or disappear in the EU, cross-compliance loses much or all of its leverage. Therefore, long-range agri-environmental planning must be based on a collective vision of which environmental conditions or outputs should be obtained through regulations and which ones should be purchased from farmers through stewardship payments. That collective vision will emerge from interpretations and applications of the multifunctionality concept. It is quite possible, and not necessarily inconsistent, to simultaneously move in two different directions. One, exemplified by the current UK direction for nitrate externalities, requires farmers to avoid practices that clearly have adverse effects on society. The policy mix in such a polluter-pays approach could include a combination of regulations and taxes on practices and inputs that cause public harm. The other direction, which has dominated in Europe, is to pay farmers for adopting practices that produce public goods and positive externalities – the socalled provider-gets principle. With this perspective, producing wildlife habitats or scenic vistas is considered to be producing a good, rather than avoiding a bad. The multifunctionality concept provides a rationale for public compensation, rather than regulation, at least some of the time. Whether a particular agricultural practice or system is viewed as producing a good or preventing a bad is clearly a matter of perspective. In the real world of policy, we are likely to see public support for paying farmers to do some things that are good for the environment, while public sentiment insists on uncompensated regulations to prevent certain practices or systems considered bad for the environment (e.g. see Policy Commission on the Future of Farming and Food).
Agri-environmental Stewardship Schemes and ‘Multifunctionality’ 347
Compatibility of world trade organization rules with stewardship schemes As European governments shift more of their agricultural support to agri-environmental schemes, increasingly complicated issues of compatibility with WTO rules are emerging. Some in the US agricultural industry, for example, have felt that multifunctionality may be merely a protectionist ploy to continue EU subsidies under the guise of environmental protection. European economists, however, have begun systematically to examine the conditions under which stewardship payments – configured within a multifunctionality framework – may be consistent with economic efficiency criteria and what this may imply for world trade rules. The Uruguay Round ‘Agreement on Agricultural Trade’ set out a series of decoupled payments that are considered compatible with WTO rules. This zone of compatibility is the so-called ‘Green Box’. Payments for environmental programmes are among those that fall in the Green Box (Swinbank). However, it is not entirely clear which policies the WTO will consider to be in the Green Box as Europe advances new policies under the multifunctionality banner. Figure 18.1 seeks to bring clarity to this issue. An agri-environmental policy that is fully decoupled from production support would be in the lower right-hand corner. Such a policy would advance society’s environmental goals – say, by producing positive externalities or reducing negative ones – without also increasing production. Stewardship payment schemes that provide incentives to restore hedgerows and increase field margins are good examples. Some other agri-environmental policies are likely to be more controversial with respect to Green Box classification. There is considerable concern in Europe that the movement toward free trade, with farmers having to depend on world market prices, could ‘lead to environmental decline as farmers abandon unprofitable marginal land’ (Latacz-Lohmann and Hodge, p43). The European idea of managed countryside is one in which, over some range, the joint production of food and environmental goods is largely complementary, rather than competitive. If agricultural support falls too low, it may no longer be economically viable for farms in some areas to produce either conventional agricultural commodities or the kinds of rural landscape and habitats European societies value (Cahill; LataczLohmann and Hodge; Swinbank). In such a situation, does an agri-environmental scheme designed to maintain multifunctional agriculture, in the Cotswold region of the west of England, for example, fall inside or outside the WTO’s Green Box? A number of agri-environmental schemes in Europe may be like this – towards the stewardship support corner of Figure 18.1, but part way up the continuum running to production support. ‘New World’ trade negotiators tend to favour wilderness landscapes for environmental enhancement, and joint production is generally not an issue with those landscapes; ‘Old World’ (European) negotiators, however, place more value on lived-in, working rural landscapes (Latacz-Lohmann and Hodge). Ervin and Mullarkey et al stress the importance of using policy instruments that minimize trade distorting effects when efforts are made to sustain or enhance
348 Enabling Policies and Institutions for Sustainable Agricultural and Food Systems
agriculture’s positive environmental functions. For example, simply maintaining an area in agricultural production may provide the desired agricultural landscape, while a higher level of crop and livestock production in that landscape may produce no additional environmental amenity (in fact, it may even decrease the amenity value) but it is more trade distorting. In fact, poorly designed agri-environmental programmes could inadvertently even bring more land into commodity production (Heimlich and Claassen). Latacz-Lohmann and Hodge suggest a number of ways for determining which kinds of agri-environmental policies legitimately belong in the Green Box. In essence, these suggestions call for policies that focus primarily on stewardship support while limiting, to the extent possible, trade-distorting commodity production and price effects. Payments should be coupled to stewardship and decoupled from production, even though, in practice, stewardship payments will sometimes cause production to be higher than it would be otherwise. A related issue is how additionality is to be interpreted. A provision of the Uruguay Round Agreement on Agriculture limits agri-environmental payments to the extra costs of complying with government programmes (Latacz-Lohmann and Hodge). The UK Treasury also has insisted on additionality. Except in the Environmentally Sensitive Areas, simply maintaining habitat is not considered sufficient to qualify for agri-environmental payments. There must be additional public benefits beyond what is already provided by the farmer without payment. This results in troublesome contradictions: farmers who had previously removed hedgerows would be paid to restore them, but those who had maintained hedgerows at their own expense would not qualify for additional payments (Royal Agricultural Society of England). Similar contradictions plague US conservation policy. As Claassen et al (p37) indicate in their analysis of alternative agri-environmental payment approaches for the United States, if ‘bad actors’ can receive payments for modest environmental improvements while ‘good actors’ are excluded, farmers ‘will be discouraged from taking any unsubsidized action that improves environmental performance’. This issue will need to be addressed if agri-environmental policy is going to take centre stage. In our view, fairness and consistency require that all farmers are equally eligible for payments for providing particular environmental services, even if they already had been providing the services without compensation. This position does not imply that every environmental service or externality-avoidance merits compensation. It simply means that if one farmer is eligible for compensation to begin providing a service, every other farmer (in like areas and circumstances) already providing the service also would be eligible.6 Therefore, additionality would be interpreted with respect to normal farming practices, not with respect to particular farms. This approach would involve specification of ‘reference levels’ similar to those described by Claassen et al: Reference levels could vary with soil type and topography, geographic region, or all of these factors. While a reference level is not an environmental baseline – it would not be
Agri-environmental Stewardship Schemes and ‘Multifunctionality’ 349 specific to a particular farm or field – it would reflect the cropping patterns and production management or conservation practices generally in place under homogeneous soil and climate conditions. (Claassen et al, p35)
For example, if agri-environmental programmes provide payments for farmers in designated regions to use organic practices or utilize forage or green manure legume-based crop rotations, all farmers in those regions would be eligible for payments, including those who already had been farming with such systems. If this position is ruled incompatible with additionality interpretations of the WTO or other governing bodies, then those interpretations will need to be rethought. Latacz-Lohmann and Hodge suggest that Green Box criteria need to allow farmers to be paid for providing non-market environmental benefits above some reference level. If that principle is accepted, there would seem to be no valid basis for the WTO to distinguish between farmers who were already providing such benefits and those who begin providing the benefits following the initiation of a stewardship payment scheme. An agri-environmental policy that qualifies farmers for payments who already are carrying out eligible practices or meeting established environmental criteria does not necessarily make life easy for policy makers and agri-environmental agencies. First, of course, are the budgetary implications. Making everyone eligible would be expected to add to the short run expense of providing a particular set of public environmental services. However, in the long run, government costs might not be greater, because farmers would come to see that bad environmental behaviour is not rewarded or, conversely, good environmental behaviour is not penalized. Second, establishing what is normal and what are like circumstances is not easy, in practice. Normal rotations for one set of farms in a local area, for example, may vary from what is normal for other farms in the same vicinity because of subtle differences in biophysical circumstances. There are substantial administrative costs in taking all of these circumstances into account to establish and implement agri-environmental programme eligibility criteria. Using eligibility criteria derived from comparisons of what is additional relative to normal farming practices is feasible, but not without difficulty. Agri-environmental issues are on the agenda for the new round of WTO negotiations that was approved in Doha, Qatar in November 2001. Even under current WTO rules, policies to support environmental objectives in agriculture are allowed if they are only ‘minimally trade distorting’ (Normile, p80). How much is minimal is likely to be contested.
Implications for US Policies In spite of some differences in perspective, ‘the European Union and the United States are coming closer together in the policy issues that they will have to address’
350 Enabling Policies and Institutions for Sustainable Agricultural and Food Systems
(Blandford, p17). Further, substantial policy reforms are required on both sides of the Atlantic to accomplish shared goals. This means that European and North American policy makers must be willing to learn from the past and from one another as they develop new directions for agri-environmental policy. There was much discussion and debate about the scope and form of conservation and agri-environmental programmes in the process of developing the latest US ‘farm bill’, the Farm Security and Rural Investment Act of 2002. This Act authorizes a ten-year expenditure plan for the US agricultural sector that calls for an 80 per cent increase in spending on conservation and environmental programmes (compared with a baseline projection under previous programmes and policies) (USDA, 2002). However, production-related price and income supports also have been continued and expanded, with expenditure increases over ten years expected to be nearly four times the amount of conservation expenditure increases.7 It seems evident from experiences on both sides of the Atlantic that for agrienvironmental policies to be fully effective, the decoupling of income supports from production must be completed. Such a decoupling clearly did not come about in the United States’s 2002 farm bill. If anything, there was some recoupling, in that a new system of counter-cyclical payments tied to target prices and updated base acres and crop yields was established (USDA, 2002). This support mechanism is very similar to the old target price/deficiency payment mechanism done away with in the 1996 farm bill. Even under the 1996 farm bill – with its planting flexibility provisions, as well as conservation compliance provisions going back to the 1985 farm bill – Corn Belt farmers remained too tied to production-related supports to diversify out of the narrow and inherently chemical-intensive corn-soybean rotation. Between 1996 and 2000, soybean acreage increased in several Corn Belt States, while corn acreage stayed about the same or decreased slightly (Commission on 21st Century Production Agriculture). Some land shifted from continuous corn production to the corn-soybean rotation, but there was little shift to more diverse rotations incorporating forage or green manure legumes.8 Although many Corn Belt farmers have adopted ‘best management practices’ intended to reduce environmental damages, they had little impact on inorganic fertilizer and pesticide loadings (Caswell et al). Since the structure of agriculture has evolved over the last several decades toward larger farms and fewer market outlets for forages and other products of diverse crop rotations (Dobbs and Dumke; Dumke and Dobbs), decoupling alone may be insufficient to bring about much increase in diversity and reduction in chemical intensity – unless, perhaps, one is thinking in decades, instead of years. This is true in both England’s East Anglia and the American Corn Belt. The continuation of major production-related supports under both the EU CAP and US farm bills makes it much more expensive and difficult for agri-environmental programmes to be effective. At the same time, it must be recognized that dramatic reductions in, or actual elimination of, price or income supports in the United States could result in the sacrifice of some environmental gains achieved as a result of conservation compliance if
Agri-environmental Stewardship Schemes and ‘Multifunctionality’ 351
there is not sufficient expansion of regulations or stewardship payments (or both). The evolution of UK agri-environmental policies toward nitrate contamination illustrates the kind of decisions that will need to be made if there is less US reliance on conservation compliance in the future. As described previously in this article, that evolution implied a more clear delineation of which kinds of agricultural externalities will, for policy purposes, be considered subject to the polluter-pays principle (in this UK case, nitrate contamination) and which ones will be subject to the provider-gets principle. If conservation compliance were to lose its leverage in fostering the kinds of basic soil conservation and wetland protection called for in US farm bills since 1985, it would be necessary to decide if the former compliance levels really are baselines, subject to uncompensated regulations, or if they are to be maintained by expanded stewardship payment programmes. The most significant expansion in stewardship payment programme funding in the 2002 US farm bill is for the EQIP, but the most significant new programme form is the Conservation Security Program (CSP). This programme has features similar to some of those that have existed in UK agri-environmental programmes, with different payment ‘tiers’ based on the nature and scope of environmental practice or system changes. Unlike the Conservation Reserve Program, which takes land out of conventional crop and livestock production in order to focus exclusively on environmental goods, the CSP is designed for working lands. The CSP constitutes an attempt to foster multifunctionality by leaving land in crop and livestock production and providing stewardship payments for the use of practices and systems intended to reduce negative environmental externalities or, conversely, increase positive ones. Tier I of the CSP, the lowest tier in terms of conservation requirements and payment rates, focuses primarily on individual practices. Tier II, with payment rates higher than those for Tier I, requires enrolled farmers to deal with ‘at least one significant resource of concern for the entire agricultural operation’ (Conservation Security Program, pp6–7). The highest payment rates are for Tier III, which requires application of a ‘resource management system that meets the appropriate nondegradation standard for all resources of concern of the entire agricultural operation’ (Conservation Security Program, p7). Based on the UK experience with tiered agri-environmental schemes, one of the major challenges to US policy makers will be to induce farmers in the more productive agricultural areas into the higher tiers, especially, in this case, Tier III. Given the continuation of high price and income supports tied directly or indirectly to narrow, intensive crop systems, it is likely to prove either difficult or very expensive to induce participation in whole-farm resource management plans that actually involve very much change in farmers’ systems. Changes involving resource conserving crop rotations (listed among the CSP’s eligible conservation practices) could prove especially difficult to induce. Although the whole-farm orientation of the CSP’s Tier II and (especially) Tier III represents an European-like broadening of US agri-environmental policy, the legislative language implies a more narrow multifunctionality orientation than
352 Enabling Policies and Institutions for Sustainable Agricultural and Food Systems
some of the latest European agri-environmental schemes (Conservation Security Program). The CSP could be used to foster bird habitat and biological diversity, as in UK agri-environmental schemes; eligible practices include fish and wildlife habitat conservation, restoration and management. However, rural landscape priorities, which have been central to major UK agri-environmental schemes, are not particularly evident in other types of conservation practices (nutrient management, integrated pest management, water conservation and water quality management, energy conservation measures, contour farming etc.) listed as appropriate for CSP contracts. Moreover, the legislative language does not suggest much emphasis on promoting regional social and economic objectives, as do recently introduced European schemes like England’s Land Management Initiatives (Countryside Agency) and France’s Contrat Territoriale d’Exploitation (CTE, or Territorial Contract of Farming) (Dwyer, 1999, 2000). Such an emphasis does not seem precluded, though, as enhanced CSP payments are allowed if participating farmers ‘address local conservation priorities’ or participate in ‘a watershed or regional resource conservation plan that involves at least 75 per cent of producers in a targeted area’ (Conservation Security Program, p10). If the CSP were to evolve in the direction of a much broader multifunctionality, it would be valuable for US policy analysts to monitor lessons learned during implementation of relatively new schemes like the Norfolk Area Land Management Initiative, which combines regional and whole-farm planning in the east of England.
Acknowledgements The research on which this article is based was initiated while Thomas Dobbs was a Fulbright Scholar at the University of Essex’s Centre for Environment and Society, in England, in 2000. In addition to support from a Fulbright Scholar grant, research support has been provided by South Dakota State University’s Agricultural Experiment Station. This article has benefited from a number of constructive suggestions made by the RAE’s editors and anonymous reviewers. Of course, we remain responsible for interpretations and opinions expressed in the final version of the article.
Notes 1
These percentages are shifts of funds from traditional production-type CAP supports to rural development and agri-environmental programmes, and do not represent the total percentage of the agricultural budget devoted to rural development and agri-environmental programmes. At the present time, the second CAP pillar – covering rural development and agri-environmental measures – commands only around 10 per cent of the overall EU CAP budget (Baldock and Bennett).
Agri-environmental Stewardship Schemes and ‘Multifunctionality’ 353 2
3 4 5
6
7
8
See Dobbs and Pretty for a more complete discussion of issues associated with the UK experience, including: opportunities for programmes to contribute jointly to social and stewardship objectives; capitalization of scheme benefits into land values; and how to gain from bottom-up planning and subsidiarity. See Dobbs for a distinction between changes in farming practices and changes in farming systems. Bromley refers to these as amenities and habitat. Based on perceived benefits to the environment, organic agriculture has been aggressively promoted under the United Kingdom’s Organic Farming Scheme. Preliminary case study evidence reported by O’Riordan and Cobb supports the existence of at least some of those perceived benefits, relative to ‘conventional’ agriculture. This does not imply that farmers in all regions of a country would necessarily qualify for given environmental practices or performance. For example, farmers utilizing a particular agricultural practice or system might qualify for incentive payments in a watershed threatened by soil erosion, but not qualify in another watershed or region of the same country if it is not so threatened. That is a separate issue of ‘spatial targeting’ (Claassen et al). Preliminary estimates by the Food and Agricultural Policy Research Institute (FAPRI) indicated that net outlays on commodity programmes could increase by $49.7 billion over ten years (compared with a baseline with previous farm bill provisions), and the projected increase was $13.2 billion for conservation programmes (United States Senate Committee on Agriculture, Nutrition & Forestry). It has long been known that cropping systems that include regular rotation of forage and green manure legumes contribute greatly to the creation of the soil’s natural capital (Balfour; Daily; Doran and Werner; Peterson et al; Power; Pretty, 1998, 2002).
References Bailey A.P., T. Rehman, J. Park, C.M. Yates, and R.B. Tranter. ‘Integrated Arable Farming Systems – The Future of Sustainable Farming Systems?’ Paper presented at Agricultural Economics Society annual conference, Manchester, UK, 14–17 April 2000 Baldock, D., and H. Bennett. ‘Trends in Agricultural Policies since 1960.’ Paper prepared for Highlevel Pan-European Conference on Agriculture and Biodiversity: Towards Integrating Biological and Landscape Diversity for Sustainable Agriculture in Europe, 5–7 June 2002, Paris Baldock, D., and K. Mitchell. Farming and Wildlife. A WWW-UK Report by the Institute for European Environmental Policy, London, 1998 Balfour, E.B. The Living Soil. Faber and Faber, London, 1943 Blandford, D. ‘Oceans Apart? European and U.S. Agricultural Policy Concerns are Converging.’ EuroChoices Premier Issue (2001): 17–22 Bromley, D.W. ‘Environmental Benefits of Agriculture: Concepts.’ Environmental Benefits from Agriculture: Issues and Policies (Helsinki Seminar), pp1–19. Organisation for Economic Co-operation and Development, Paris, 1997 Cahill, C. ‘The Multifunctionality of Agriculture: What Does It Mean?’ EuroChoices Premier Issue (2001): 36–41 Caswell, M., K. Fuglie, C. Ingram, S. Jans, and C. Kascak. Adoption of Agricultural Production Practices: Lessons Learned from the U.S. Department of Agriculture Area Studies Project. ERS Agr. Econ. Rep. 792, US Department of Agriculture, Washington DC, January 2001 Claassen, R., et al. Agri-Environmental Policy at the Crossroads: Guideposts on a Changing Landscape. ERS Agr. Econ. Rep. 794, US Department of Agriculture, Washington DC, January 2001
354 Enabling Policies and Institutions for Sustainable Agricultural and Food Systems Cobb, D., et al. ‘Integrating the Environmental and Economic Consequences of Converting to Organic Agriculture: Evidence from a Case Study.’ Land Use Policy 16(1999): 207–22 Commission on 21st Century Production Agriculture. Directions for Future Policy: The Role of Government in Support of Production Agriculture. Report to the President and Congress. Washington DC, January 2001 Conservation Security Program. Conservation Security and Farmland Protection, Farm Security and Rural Investment Act of 2002 (Chapter 2A). Washington DC, 2002 Costanza, R., J. Cumberland, H. Daly, R. Goodland, and R. Norgaard. An Introduction to Ecological Economics. St. Lucian Press, Boca Rotan, FL (for International Society for Ecological Economics), 1997 Countryside Agency. Tomorrow’s Countryside – 2020 Vision. UK Government, Cheltenham, UK, 2000 Daily, G., ed. Nature’s Services: Societal Dependence on Natural Ecosystems. Island Press, Washington DC, 1997 Dobbs, T.L. ‘Profitability Comparisons: Are Emerging Results Conflicting or Are They Beginning to Form Patterns?’ Sustainable Agriculture: Conceptual and Methodological Issues. Proceedings of an Organized Symposium at the AAEA annual meeting, San Diego CA, pp33–40. Coop. Agr. Res. Program, Tennessee State University, Nashville TN, August 1994 Dobbs. T.L., and L.M. Dumke. ‘Implications of “Freedom to Farm” for Crop System Diversity in the Western Corn Belt and Northern Great Plains.’ Econ. Staff Pap. 99–103, South Dakota State University, October 1999 Dobbs, T., and J. Pretty. ‘Future Directions for Joint Agricultural-Environmental Policies: Implications of the United Kingdom Experience for Europe and the United States.’ Econ. Res. Rep. 2001–1, South Dakota State University, and Centre for Env. and Society Occasional Pap. 2001–5, University of Essex, August 2001 Doran, J., and M. Werner. ‘Management and Soil Biology.’ Sustainable Agriculture in Temperate Zones. C.A. Francis, C.B. Flora, and L.D. King, eds., pp205–30. Wiley, New York, 1990 Dumke, L.M., and T.L. Dobbs. ‘Historical Evolution of Crop Systems in Eastern South Dakota: Economic Influences.’ Econ. Res. Rep. 99–2, South Dakota State University, July 1999 Dwyer, J. ‘Summary of Seminar on the French Approach to Rural Development, 14 December 1999, Senate House, London University, UK.’ Unpublished, Institute for European Environmental Policy, London, 1999 Dwyer, J. The Implementation of Regulation 1257/1999 in the Member States. Unpublished note of a Seminar held in Brussels, hosted by the British countryside agencies – Countryside Agency, English Nature, Countryside Council for Wales and Scottish Natural Heritage, 10 April 2000 Dwyer, J., D. Baldock, and S. Einschutz. Cross-compliance and the Common Agricultural Policy. A Report by the Institute for European Environmental Policy to the Department of the Environment, Transport and the Regions, London, 2000 Ervin, D.E. ‘Toward GATT-proofing Environmental Programmes for Agriculture.’ J. World Trade 33(1999): 63–82 Food and Agricultural Organization. The Multifunctional Character of Land. Rome, 1999 Heimlich, R.E., and R. Claassen. ‘Conservation Choices for a New Millennium.’ Choices 14(1999): 45–8 Hellerstein, D. et al. Farmland Protection: The Role of Public Preferences for Rural Amenities. ERS Agr. Econ. Rep. 815, US Department of Agriculture, Washington DC, November 2002 Hutchinson, W.G. ‘Environmental Benefits of Agriculture: Evaluation Methods to Measure and Monitor Change.’ Environmental Benefits from Agriculture: Issues and Policies (Helsinki Seminar), pp66–76. Organisation for Economic Co-operation and Development, Paris, 1997 Latacz-Lohmann, U., and I. Hodge. ‘“Multifunctionality” and “Free Trade”: Conflict or Harmony?’ EuroChoices Premier Issue (2001): 42–7 Lord, E.I., P.A. Johnson, and J.R. Archer. ‘Nitrate Sensitive Areas: A Study of Large Scale Control of Nitrate Loss in England.’ Soil Use Manage. 15(1999): 201–7
Agri-environmental Stewardship Schemes and ‘Multifunctionality’ 355 Ministry of Agriculture, Fisheries and Food. UK Government, London, 1999 Mullarkey, D., J. Cooper, and D. Skully. ‘‘‘Multifunctionality” and Agriculture: Do Mixed Goals Distort Trade?’ Choices 16(2001): 31–4 Normile, M.A. ‘Multifunctionality: Options for Agricultural Reform.’ Agricultural Policy Reform in the WTO – The Road Ahead. M.E. Burfisher, ed., pp80–1. ERS Agr. Econ. Rep. 802, US Department of Agriculture, Washington DC, May 2001 Organisation for Economic Co-operation and Development. Multifunctionality: Towards an Analytical Framework. Paris, 2001 O’Riordan, T., and D. Cobb. ‘Assessing the Consequences of Converting to Organic Agriculture.’ J. Agr. Econ. 52(2001): 22–35 Performance and Innovation Unit. Rural Economies. UK Government, Cabinet Office, London, 1999 Peterson, C., L. Drinkwater, and P. Wagoner. The Rodale Institute Farming Systems Trial: The First 15 Years. Rodale Institute, Kutztown, PA, 2000 Policy Commission on the Future of Farming and Food. Farming & Food: A Sustainable Future. Report to the Department of Environment, Food and Rural Affairs, London, January 2002 Potter, C. Against the Grain: Agri-Environmental Reform in the United States and the European Union. CAB International, Wallingford, Oxon, UK, and New York, 1998 Potter, C., and P. Goodwin. ‘Agricultural Liberalization in the European Union: An Analysis of the Implications for Nature Conservation.’ J. Rural Studies 14(1998): 287–98 Power, J.F. ‘Legumes and Crop Rotations.’ Sustainable Agriculture in Temperate Zones. C.A. Francis, C.B. Flora, and L.D. King, eds., pp178–204. Wiley, New York, 1990 Pretty, J.N. The Living Land. Earthscan, London, 1998 Pretty, J.N. Agri-Culture: Reconnecting People, Land and Nature. Earthscan, London, 2002 Pretty, J.N., A.S. Ball, Li Xiaoyun, and N.H. Ravidranath. ‘The Role of Sustainable Agriculture and Renewable Resource Management in Reducing Greenhouse Gas Emissions and Increasing Sinks in China and India.’ Philos. Trans. Roy. Soc. London A 360(2002): 1741–61 Pretty, J.N., et al. ‘An Assessment of the Total External Costs of UK Agriculture.’ Agr. Syst. 65(2000): 113–36 Pretty, J., et al. ‘Policy Challenges and Priorities for Internalizing the Externalities of Agriculture.’ J. Env. Planning Manage. 44(2001): 263–83 Ribaudo, M.O., R.D. Horan, and M.E. Smith. Economics of Water Quality Protection from Nonpoint Sources: Theory and Practice. ERS Agr. Econ. Rep. 782, US Department of Agriculture, Washington DC, November 1999 Royal Agricultural Society of England. Routes to Rural Prosperity – Farmland Management Strategies for the UK. Stoneleigh Park, Warwickshire, England, 2000 Swinbank, A. ‘Ethics, Trade and the WTO.’ Paper presented at Agricultural Economics Society annual conference, Manchester, UK, 14–17 April 2000 US Department of Agriculture (USDA). Food and Agricultural Policy: Taking Stock for the New Century. Washington DC, September 2001 US Department of Agriculture (USDA). The 2002 Farm Bill: Provisions and Economic Implications. Economic Research Service, Washington DC, 2002 United States Senate Committee on Agriculture, Nutrition & Forestry. ‘Farm Security and Rural Investment Act of 2002: Preliminary FAPRI Analysis.’ Washington DC, 6 May 2002 Whitby, M. ‘Challenges and Options for the Agri-environment: Presidential Address.’ J. Agr. Econ. 51(2000): 317–32 Wormell, P. Essex Farming: 1900–2000. Abberton Books, Colchester, UK, 1999 Wu, J. ‘Crop Insurance Acreage Decisions, and Nonpoint-source Pollution.’ Amer. J. Agri. Econ. 81(1999): 305–20
19
Ways Forward? Technical Choices, Intervention Strategies and Policy Options Camilla Toulmin and Ian Scoones
Introduction This book has emphasized the importance of taking local contexts seriously. The case studies have revealed the importance of dynamics and diversity in all farming settings across all three countries. Some of the key findings are summarized below. •
•
•
Farmers have criteria for classifying soils, such as their workability, inherent fertility, suitability for certain crops, responsiveness to particular inputs and water-holding capacity. Farmers actively manage their soils in ways that build on these characteristics with the aim, over time, of thus improving their value for crop production. Africa’s farming systems are highly diverse. This diversity is an important feature at all scales. At household level, farmers manage this diversity by different land use practices, choice of crop and input levels. Diversity at the level of the village landscape is exploited through use, for example, of low-lying areas (variously known in the study areas as bas fonds, vleis, dambos), for moisture-loving crops, upland sands for millets and groundnuts, and gravelly slopes for grazing and woodland. Farmers value such diversity since it provides greater protection against the risk of crop failure. Diversity at national level is seen in the differential development of areas considered of high and low potential, infrastructural investment and ease of access to important markets. Farming systems are dynamic, responding to a range of internal and external pressures. Reliance on data from nutrient balances provides only a snapshot at one point in time, from which the direction and evolution of the farming system in question are hard to determine. There is no single pathway being followed by all farmers in a given site, but rather an array of directions being
Reprinted from Toulmin C and Scoones I. 2001. Ways forward? Technical choices, intervention strategies and policy options. In Scoones I (ed) Dynamics and Diversity, Earthscan, London, pp176–208.
Ways Forward? Technical Choices, Intervention Strategies and Policy Options 357
•
•
•
taken depending on their circumstances. Farmers are constantly seeking new strategies as problems arise or new opportunities develop. Farmers’ management of soil nutrients depends on a range of socioeconomic factors. Access to livestock, labour, credit and markets are of particular importance in explaining which farmers are best able to maintain and improve the fertility of their soils. The household remains central to the management of the farm and the mobilization of resources, such as labour and capital. However, other social institutions are also of great value in enabling farmers to negotiate access to obtain resources such as draft power, transport and credit. Such institutions also help farmers protect themselves from risk by the development of social networks through which help can be sought in times of need. Data on nutrient balances demonstrate a mixed pattern of accumulation and depletion, depending on plot, farmer and location. Overall, cash-crop land receives the major share of both mineral and organic fertilizers applied. Land sown to lower-value crops, such as coarse grains, shows a consistently negative nutrient balance. However, due to rotation of crops, cereal yields can often benefit from residual fertility stemming from the previous year. Location of plots is also important, with land close to the settlement or cattle pen receiving most nutrient inputs. Farmers in all sites have been affected by recent policy changes, such as structural adjustment, devaluation and land tenure reforms, as well as exogenous events such as drought. Such changes have brought about major shifts in returns to different crops, as well as the liberalization of crop marketing. Farmers are clearly responsive to such positive changes, which implies that governments have a range of measures by which to influence farmers’ decision making. This range of policy options is discussed in more detail below.
Given this diversity of local contexts and the complex dynamics of soil-fertility change, what is the most appropriate way to identify options by which to support more sustainable soil management by smallholders in Africa’s more marginal farming areas? Such options must combine different elements: technical choices, strategies for intervention and a range of policy measures. The remainder of the chapter sets out to explore this question. First, the particular incentives – operating at a range of scales from the household to the village to the national context – for farmers to invest in soil-fertility management are discussed. These factors condition the range of technical choices that farmers make. The following section looks at the variety of ways farmers can and do manage their soil fertility and the implications this has for intervention strategies by governments, donors and others. The success of such strategies are seen to be affected by agroecological conditions, household and community-level institutional arrangements, and national policies in a range of areas. It is these policy themes which are then picked up in the following section, when issues of devaluation and structural adjustment, credit, rural infrastructure, research and extension services, and land and tenure reform and decentralization are discussed. A wide range of policies, therefore, are seen to affect
358 Enabling Policies and Institutions for Sustainable Agricultural and Food Systems
soil-fertility management. But how should initiatives directed towards soil-fertility issues be directed? The final section looks at the options, and suggests a strategy which recognizes the multiple dimensions of soil-fertility management, and a process which establishes a more open learning, adaptive process for the design, monitoring and evaluation of policy measures.
Diversity of Agroecological Setting and Farmer Practice The conditions faced by farmers in sub-Saharan Africa are remarkably diverse. The research sites were chosen to investigate the significance of such diversity for farmer practice. Thus, the sites selected spanned a long transect in Mali from irrigated Tissana and millet-based Siguiné to M’Péresso in the cotton belt, from highland to lowland farming villages in Wolayta, southern Ethiopia, and from high potential Mangwende to Chivi in the low potential region of Zimbabwe. This diversity across the continent and within the different countries studied is mirrored at village level. The options available to poor farmers are much more constrained than those available to richer farmers who have easier access to labour, land, livestock, credit and cash. This theme of diversity can be taken further to farm level, where the management of soils within the farm varies very considerably between parts of the farm. Typically, certain fields tend to receive far greater concentrations of labour and nutrient inputs, while others are more extensively managed. Thus, in Zimbabwe, homefields close to the settlement receive most attention while outfields have limited applications; in Ethiopia, the darkoa plots supporting dense stands of enset receive regular supplies of manure and household waste, while further afield maize crops on the shoka plot have to make do with little or no amendments to the soil. Similarly, in land-extensive dryland sites in Mali, the soforo infields around the village are often black with dung by the end of the dry season and offer well-fertilized conditions for crops of maize and millet. By contrast, the large, shifting outfields, or kongoforo, produce a harvest for four or five years before being abandoned to fallow and occasional grazing. Where cotton has become important, the availability of chemical fertilizer modifies this pattern and enables more permanent cultivation of larger bush fields. This diversity at different scales has very important implications for how best to support improved farmer management of soil fertility. There are no simple messages regarding appropriate ways to manage Africa’s soils. While depletion or ‘mining’ of nutrients may constitute a problem for certain fields, there are others which are accumulating nutrients. The research has helped identify the locations in which soil-fertility management has become a key issue. Villages such as Siguiné in Mali can still manage a system of fallowing and nutrient transfers from grazing in crop land and thereby maintain grain yields, albeit at low levels. For them, low and erratic rainfall and uncertain prices are at least as much constraints on assuring food security as the fertility of their soils. The sites in Ethiopia demonstrate a relatively efficient system of managing and recycling of biomass and nutrients, although
Ways Forward? Technical Choices, Intervention Strategies and Policy Options 359
these are tightly constrained by limited access to markets, poor veterinary services and the high cost of mineral fertilizer. In Zimbabwe, the two locations demonstrated marked differences in terms of their productivity and market access. Mangwende is in a relatively high-potential area, with reasonable rainfall although poor soils, and is well connected to markets in Harare and Chitungwiza. By contrast, Chivi is in a semi-arid zone where frequent droughts reduce productive potential. Although there are good road connections to Masvingo to the north and South Africa to the south, there are fewer market opportunities. The research on differences in soil-fertility management between socioeconomic groups has helped identify households for which soil-nutrient decline constitutes a serious problem. Poorer households in all sites faced particular difficulties in maintaining the productivity of their farmland, due to very limited supplies of livestock dung and poor access to credit and inorganic fertilizer. Such difficulties are a reflection of their limited assets and capacity to mobilize resources more generally. Poor farmers in Dilaba, Mali and Chivi, Zimbabwe were additionally constrained by the disappearance of fallow land and lack of access to credit. This diversity has major implications for design of technical options, extension approaches and policy frameworks for improving soil-fertility management.
Farmers’ Concern for Soil-Fertility Management: The Broader Context As the case studies have shown, the capacity of different farmers to invest in improving soil-fertility management depends on a range of factors which operate at different levels. For the household, these factors include access to labour, livestock, land, capital and cash. In all sites, better-off farmers were much better able to invest in larger-scale use of organic and inorganic sources of nutrients. For example, in some sites, having some means of transport, such as a cart, is also critically important in allowing large quantities of biomass to be moved to and from homestead, kraal and crop lands. But there was also great diversity in how such inputs are used, since farmers do not spread them universally across all fields and crops. Instead, nutrients tend to be focused on smaller plots of land where higher-value crops (such as vegetables) are grown. In addition, rotation of land spreads fertility inputs over a series of years. For cotton farmers in southern Mali, nutrient inputs were positive for cotton in the year in which cotton is cultivated, but if account is taken of the subsequent two years of rotation with maize, millet, and sorghum, then over three years there is a net outflow of nutrients. Nutrient losses are much more significant on fields where lesser-value crops are grown and which are not a high priority for farmers. However, even here, farmers often make very effective use of the very limited quantities of nutrients available through careful placing and timing of such inputs in relation to rainfall and crop development. In all sites, farmers were experimenting with very small additions of mineral fertilizer at sowing or
360 Enabling Policies and Institutions for Sustainable Agricultural and Food Systems
weeding time to gain some benefit at limited cost. At the village level, issues include the range of soils available, the overall pressure on farm land and its availability, access to grazing and forage resources, and the importance of labour flows between households, as well as location in relation to markets. At the national level, factors of relevance relate to macro-economic policy, input–output prices, access to credit, institutions and legislation regarding land tenure and its management, approaches to research and extension policy, marketing and infrastructural investment. Our research approach used a range of methods to discuss the importance of such factors at farm-household, village and national levels. Interviews with farmers regarding family histories and changes in soil-fertility management practices have brought out the combined importance of changes at household level (such as access to labour, livestock assets and off-farm income sources), and broader economic and institutional factors (such as major shifts in prices following devaluation, and land tenure reorganization). This interplay of household, village and macro-level factors helps explain the differences in performance between different farmers at the time of the research. However, it was also clear from the family and village histories that farmers’ strategies are dynamic and continually adapting to a range of new problems, as well as the opening up of better opportunities both in agriculture and elsewhere. In some cases, major events such as drought in Zimbabwe have caused significant changes to the farming system due to reduced supplies of manure following heavy cattle losses. In others, a coincidence of good fortune at family level and the development of profitable options for crop production can enable particular farmers to improve their situation greatly. Thus, for example, the growth of horticulture in the Mangwende site in Zimbabwe has been the result of the growth of urban demand for vegetables and fruit in Harare. Those who have access to wetland areas, labour and reliable transport are able to cash in on this new market. Equally, some farmers in the irrigated rice village of Tissana, Mali were able to gain a large allocation of land within the scheme, because they had a large number of family members at the moment of land allocation. Such land has become increasingly valuable with the growth in vegetable gardening and marketing. At the same time, the research also demonstrates that maintaining and improving the fertility of their soils is only one among a range of objectives which farmers are pursuing. Farmers are faced with many important choices relating to their farm enterprise, other economic activities and domestic commitments. The decision by farmers to invest effort and capital in improving the soils and productivity of their farmland will depend, in part, on pressures to do so, the perception that changes are necessary and the lack of other options. But it will also depend on their confidence that the returns will be worth it. Soil degradation and nutrient losses are unlikely to prompt changes in farmer behaviour until and unless they perceive clear benefits from doing so. Exploiting soil capital is a rational strategy for farmers to pursue where the nutrients remain to be tapped and where clearing new land for such purposes is cheaper and easier than investing in purchase of inorganic inputs, or in the considerable
Ways Forward? Technical Choices, Intervention Strategies and Policy Options 361
amount of labour needed to recycle biomass through manuring and composting systems. Such extensive strategies are clearly apparent in Siguiné, Mali. Farmers are likely to moderate such ‘soil mining’ where they see declining yields and where they depend on this land for future harvests. Cotton farmers in M’Peresso, Mali are starting to engage in much more intensive nutrient management, following similar patterns as those in the more nutrient scarce sites of Ethiopia and Zimbabwe studied here. Efforts to ‘recapitalize Africa’s soils’ and to replenish soil fertility need to take into account the broad-based nature of the farm household enterprise. This means that farmers have to weigh up the advantages of investing further effort in improved soil management in comparison with the much broader range of decisions they face, such as the gains from allocating labour to migration, more time spent on trading activities and the need to allocate resources for a forthcoming wedding. This finding points to the importance of setting soil-fertility management within a broader livelihoods approach (Carney, 1998; Scoones, 1998), a theme picked up later in this chapter.
Technological Choices If the ultimate goal of intervention in soil-fertility management is to increase useful outputs for improving livelihoods, there are a variety of routes to do so, each with differing technological choices. Table 19.1 identifies four clusters of technological options. One focuses directly on the soil resource, by attempting to improve Table 19.1 Technology choices for managing stocks and flows of nutrients Managing stocks
Managing external flows
Managing internal flows
Increasing nutrient stocks
Increasing nutrient inputs
Decreasing nutrient outputs
Increasing nutrient use efficiency
P – Recapitalization through rock phosphate or other P additions
Inorganic fertilizer
Erosion control
Composting; residue recycling
N – Organic matter build-up
Manure/urine
Reduce leaching N-fixation (legumes) (mulching, deep capture through Fallowing, green agroforestry, tillage manure, systems) agroforestry etc
Water management
Biomass import (leaf litter etc)
Fertility input combinations
Source: Scoones and Toulmin, 1999
Reduce volatilization (manure/urine management)
Crop choice and management
Input placement and synchronization
362 Enabling Policies and Institutions for Sustainable Agricultural and Food Systems
the capital stock, and thereby the service flows derived from it. The other three focus more on the flows themselves, either reducing losses, increasing inputs or improving efficiencies of nutrient use. An approach aimed at increasing inputs and reducing outputs suggests a set of interventions, ranging from fertilizer application or soil conservation measures, through a range of biological management approaches, involving agroforestry, green manure production, legume use and so on. The details of such technologies are well known, and many combinations have been tested in field settings across Africa.1 To different degrees, all options are evident in the different case study sites. Depending on the agroecology of the site, the asset base of the farmer and the institutional and policy context, different options have been picked up and used, singly or in combination. A number of common elements can be found in the current research and extension activities being pursued in each of the countries studied. In most sites, extension recommendations are dominated by inorganic fertilizer recommendations. Where organic amendments are part of the extension package, they often recommend unfeasibly high levels of application rates.2 In some sites, particularly as a result of NGO and research projects, a wider range of technologies for increasing nutrient inputs have been tested. For example, all sites have had composting pits tried out, alongside a range of agroforestry options. However, in most cases a simple transfer of technical design to a range of farmer settings has resulted in limited uptake. Thus, for example, in the lowland Ethiopian site, the multiple pit composting system recommended by the Ministry of Agriculture was quickly abandoned in favour of a simpler technology. Similarly, the alley farming techniques which had been promoted were also rejected by farmers, in favour of planting trees in homesteads and along field boundaries. In southern Mali, by contrast, considerable effort has been made by researchers and extension workers over recent years to help farmers develop organic fertilizer production through a variety of means, including composting, which provides organic materials for farmers with few or no livestock. In this way, research has aimed to address the obvious differences in assets and constraints faced by poorer and richer households. Direct investment in the capital stock of a soil through recapitalization is an approach which has recently been widely advocated (Sanchez et al, 1997). In terms of technologies, this may involve the application of rock phosphate to enhance phosphorous stocks and the use of nitrogen-enriched fallows for nitrogen recapitalization. This has seen little application in the case study sites, although rock phosphate options are being explored in both Mali and Zimbabwe. However, the degree to which such additions may act to recapitalize natural capital or act as a cheap supplementary amendment (perhaps in combination with organic sources) is unclear. For most farmers, such technical solutions are not part of their current repertoire. Their means of increasing capital stocks has rather been through the painstaking, labour-intensive process of continuous fertilization and cultivation. This, as the case studies have shown, takes place largely in gardens and homefield sites where the large bulk of organic matter is placed. For other plots, the options
Ways Forward? Technical Choices, Intervention Strategies and Policy Options 363
for recapitalization are limited due to limited resources, so that farmers can only hope, at best, to maintain crop yield at a fairly low level. All sites have experienced various attempts at soil erosion control. In many cases a top-down approach to technical design and implementation has resulted in a great deal of resentment. While farmers readily recognize the importance of stemming nutrient losses through erosion control, the imposition of fixed contour bunds or terraces has not been widely welcomed. Thus, for example, in Zimbabwe, the colonial attempts at soil erosion control became a focus for nationalist opposition during the liberation war of the 1970s, and in Ethiopia, after the fall of the Derg, many farmers dug up their terraces and replaced them with more flexibly designed and less land-consuming alternatives. In the cotton zone in Mali, the CMDT in collaboration with researchers have incorporated soil-erosion control as a central part of their support to cotton farmers in Mali Sud (Hijkoop et al, 1991). This has had considerable success in reducing erosion losses and protecting the income streams of cotton farmers. More sensitive approaches to land husbandry and soil conservation have emerged in the last decade, which draw more explicitly on farmers’ own techniques for managing soils. These often combine the management of soil, water and nutrients in combination, rather than isolating soil erosion as the main issue (see examples in Reij et al, 1996). Combining physical with biological conservation measures and changes in tillage practice perhaps offers the most promising route for tailored interventions in this area. For example, in Zimbabwe research on conservation tillage has been combined with more conventional approaches to soil conservation and newer approaches to agroforestry and biomass management on-farm to come up with a variety of technical options. Improving the efficiency with which nutrients are used is less often considered when choosing among a range of technological options, but is nevertheless vitally important (Nordwijk, 1998). For instance, application efficiency is sensitive to changes in the mix of inputs applied, where they are placed in relation to the plant, and timing of application in relation to moisture availability and plant requirements at different stages of growth (Woomer and Swift, 1994). A decline or improvement in use efficiency may make big differences in useful output, without any change in inputs, outputs or nutrient stock levels, and so can help to offset the effect of a decline in available nutrients and depletion of stocks for a period. For example, work in Zimbabwe has shown that a very limited amount of fertilizer input, perhaps combined with small amounts of manure, if placed in a particular way and at a time which maximizes uptake efficiency, can produce very significant yield responses, possibly far higher than a general application of an input in a blanket manner (Piha, 1993). This suite of technological options for improving stocks and managing the flows of nutrients can be applied in a variety of ways. Four different intervention strategies can be pursued, either singly or in combination (Scoones and Toulmin, 1999).
364 Enabling Policies and Institutions for Sustainable Agricultural and Food Systems
1 2 3 4
One-time soil recapitalization strategy, especially of phosphorous using rock phosphate. High external-input strategy, based on the use of inorganic fertilizer packages. Low external-input strategy, based principally on the use of locally available organic resources. An integrated soil-fertility management strategy, making use of a range of high and low external-input technologies in combination.
A variety of conditions make any one or combination of such strategies more likely in any particular setting (Table 19.2). These include agroecological factors (such as soil type or biomass availability/productivity), household level conditions (such as labour or cash availability), and broader policy conditions (relating to prices, markets, credit, infrastructure and extension support). The diversity of soils, cropping patterns and management practices within a single farm holding and the dynamic nature of soil-fertility and farming-system change sets a challenge for researchers and policy makers. Diversity of strategy at farmer level implies an approach to intervention which is highly localized and involves farmers in identifying, monitoring and evaluating different interventions for improving systems for soil-fertility management. This requires a flexible and responsive policy environment to support processes of technological innovation and investment in soil-fertility management. Table 19.2 indicates that a number of policy areas influence the likelihood of adoption of different options for soil-fertility management. It is to these issues which we now turn.
Impacts of Policy on Farmer Practice Farmers in all three countries studied have been affected by a range of policy measures which have influenced crop choice, input use and broader livelihood strategies. Table 19.3 summarizes the range of policy interventions and their impact in the study areas. Five broad policy areas were identified in the case study research as having particularly significant impacts on soil-fertility management: structural adjustment (relating particularly to input–output pricing and marketing); credit; rural infrastructure; research and extension services; and land and tenure reform and decentralization. These are discussed in more detail below.
Devaluation and structural adjustment In each of the three countries, there have been considerable changes in macroeconomic conditions and broader policies, linked most particularly to programmes of structural adjustment which have shifted substantially the terms of trade and incentives faced by farmers. However, the timing and nature of changes wrought
Appropriate for P limited soils, less so when N limited. na
Soil type and limiting nutrients
Biomass availability
High
Yes
Need for good High infrastructural/market links for input supply Yes
Input importation; transport; implementation logistics; farmer and area targeting
Potentially negative environmental or health impacts
Intervention focus
Source: Scoones and Toulmin, 1999
Low
Low
Farmers’ skill levels required – requirements for extension support
Low
Financial costs – credit or subsidy requirements
Mixed strategy: integrated nutrient management
No
Low
Medium
Low
High
High
Local experimentation; researcher–farmer participation; skills training; ‘field schools’
Limited
Medium
High
Variable
Variable
Variable
Most effective for N limited Any soils, through build up of organic matter
Low external inputs (especially organic matter management)
Soil testing; fertilizer Appropriate technology manufacture, blending; development; training demonstration plots; input prices and markets
High
High initial input High
Labour requirements
na
Any: fertilizer mix can be adapted to particular soil and plant needs
Recapitalization of nutrient High external inputs stocks (one-time) (especially inorganic fertilizers)
Key conditions
Table 19.2 Key conditions for four intervention strategies
Liberalization and devaluation from 1991; subsidies on fertilizers removed 1997. Currency devaluation from early 1990s.
Well-established informal markets; fertilizers sold through regional trading companies and private suppliers from mid-1990s.
Marketing
Policy context
Input–output pricing
Limited growth of private sector marketing, with negative impacts on prices for farmers. Reliance on extension or project supply of inputs through credit programmes.
Real prices of both inputs and outputs increased, although profitability of inputs use constrained.
Policy impacts
Ethiopia Policy context
Abolition of state cereal board, liberalization of cereal markets, including rice. Private input supply outside cotton growing area.
Structural adjustment from 1982 onwards, removal of subsidies for fertilizer and other inputs, abolition of credit programmes. Restructuring of CMDT Office du Niger. Devaluation of CFA, 1994. Growth in private trade, cereals and vegetables increased opportunities for farmers. Cotton remains a government monopoly through CMDT.
Liberalization of cereal markets, input prices up, food price increases, loss of access to credit.
Policy impacts
Mali
Effective privatization of marketing boards, and encouragement of private trade.
Growth of private trading has had positive impacts in the higher potential areas, but less so in lower potential sites where profit margins are lower. Here, growth of contract arrangements has occurred.
Prices of inputs and outputs have risen, with price ratios remaining approximately similar. High value crops (e.g. vegetables, some cash crops) have become more profitable.
Policy impacts
Zimbabwe Liberalization from 1991, with removal of all subsidies. Regular devaluations of Zimbabwe dollar since 1991.
Policy context
Table 19.3 Impacts of policy on soils management in Ethiopia, Mali and Zimbabwe
Range of informal credit options; bank credit limited; agricultural input credit focused on package programme.
Poor road infrastructure, but significant investments since 1991.
Rural infrastructure
Policy context
Credit
Improved transport and marketing opportunities for remoter areas.
Formal credit largely inappropriate for poorer farmers; package programme results in increased debt burden for poorer farmers and in marginal areas.
Policy impacts
Ethiopia Policy context
Gradual extension and upgrading of main road network. Little improvement in feeder roads.
Formal credit available only to cotton farmers through village associations. No more credit provided by Office du Niger.
Farmers near main roads face much cheaper transport to markets, many others rely on carts, donkeys, walking.
Cotton farmers continue to gain credit for input purchase. Rice farmers rely on private sector. Cereal farmers access informal sources, off-farm cash and NGO credit funds.
Policy impacts
Mali
Table 19.3 (continued)
Policy impacts
Since independence in 1980, major investments in rural road building.
Transportation and marketing is now easier, although costs have increased due to fuel price increases caused by devaluation.
From early 1980s, Credit a major limited availability constraint for many of formal credit. farmers.
Policy context
Zimbabwe
Research and extension services
Much research inappropriate for poorer farmers, with resulting limited impact. Focus of extension service on package programme also excludes many.
Policy impacts
Ethiopia
Research service undergoing reform, although current focus on limited technical options; extension dominated by package programme.
Policy context Considerable impacts from research and extension for rice and cotton. Increasing attention to diversity of farmer strategies and messages. Very limited impacts of research for dryland cereals.
Policy impacts
Mali Government research on agriculture under reform. Funding cut and shift to greater client orientation. Main focus has been raising yields of cotton and rice, from technical standpoint. Low potential areas receive no systematic attention, though occasional NGO projects.
Policy context
Table 19.3 (continued)
Research has had limited impact on farmer strategies. The impact of a reduction in extension provision is unclear. Emergence of project-funded research and extension activities has had important, but limited, effects in certain areas.
Policy impacts
Zimbabwe Research and extension switched emphasis to the smallholder sector following independence. However, significant budget cuts and a continued narrow technical focus have limited the ability of government services to respond to farmer needs.
Policy context
Land tenure
Land owned by the state; no changes in formal land tenure regime expected.
Policy context Variable perceptions of land tenure security, although from late 1980s growing evidence of land-based investments. Various forms of land exchange, tenancy, share cropping etc persist.
Policy impacts
Ethiopia Policy context Land taken as national asset postindependence, with free access for all. Current land tenure reforms allocate responsibilities to rural councils, who may attribute powers of management to village-level structures. Putting land to good use the basis for acquiring rights.
Lack of clarity regarding powers to manage and control access, most marked for common property grazing, woodland, unfarmed areas. Fairly secure tenure farmland through customary systems. Relations unclear between communes rurales (CRs) and village-level structures.
Policy impacts
Mali
Table 19.3 (continued)
Policy context All communal lands remain state property, with rights to distribution now held by rural district councils and local traditional authorities, and recently land councils.
De facto land tenure involves a high level of security in communal areas. Recent emergence of an (illegal) land market in some areas, as well as land invasions.
Policy impacts
Zimbabwe
Opportunities for tailored regional programmes and policies, although limited capacities and continued influence of national directives undermine options.
Regionalization a central policy thrust.
Decentralization
Policy impacts Uncertainty over future intentions results in insecurity.
In past forced resettlement and villagization carried out; currently some discussion of further land reorganization.
Land reform and resettlement
Policy context
Ethiopia Policy context
Process of preparation over last 5 years, elections held May 1999. Heavy donor pressure, political control and service delivery the main reasons for decentralization.
Uncertainty regarding rights and roles of CRs and village-level structures.
Too early to judge. Clarity needed regarding CPR management, rights and roles of CRs and villagelevel structures.
Future tensions and confusion likely between powers of CRs and customary structures at village level.
Policy impacts
Mali
Table 19.3 (continued)
Policy context
Decentralization to rural district councils has been ongoing since the 1980s. Lower level development committees at village and ward level were established.
Land reform has been a central pillar of postindependence policy, but until 2000–2001 limited progress had been made.
Much of the process of decentralization has involved deconcentration, with resulting reductions in services offered at local level. Village and district authorities have relatively little authority and influence.
Land reform and resettlement has had limited impact on farmers in most communal areas.
Policy impacts
Zimbabwe
Ways Forward? Technical Choices, Intervention Strategies and Policy Options 371
by such measures have differed considerably between countries, as have some of the impacts. For example, Mali was one of the first countries in Africa to engage in structural adjustment from 1982 onwards, whereas Ethiopia has only recently begun to cut back on fertilizer subsidies. Overall, structural adjustment measures have led to the rising cost and reduced availability of chemical fertilizer, cutbacks in extension services and changes to crop marketing structures. However, while some farmers (such as those engaged in cash cropping, and those who depend on extension advice) have felt the impacts of such changes fairly immediately, others have been less closely affected because of their greater autonomy. In Zimbabwe, the Economic Structural Adjustment Programme (ESAP) was introduced in 1991, resulting in changes to marketing, provision of services and input–output prices. These have brought about a major shift in use of inputs and choice of crops, leading to diversification and modifications to land use management (Government of Zimbabwe, 1998). The impact of ESAP was particularly harsh since its implementation coincided with the severe drought of 1991–1992, during which a high proportion of livestock died. Hence, for example, farmers in the drier area of Chivi lost 60 per cent of their cattle holdings, drastically cutting the availability of manure for maintenance of soil fertility. As a result, Chivi farmers have greatly reduced capacity to maintain soil fertility and must concentrate the limited amounts available on their most important crops. The liberalization of grain marketing means that farmers are no longer obliged to sell their maize at a fixed price to the Grain Marketing Board, which now just sets a floor price at which it can constitute essential stocks in case of future shortage (FSRU, 1998). As a result, farmers are exposed to potential gains, but also risks associated with the private trading sector. Private traders are now starting to engage in provision of inputs to farmers for particular crops, thereby establishing an alternative input and marketing channel. Contracts with traders are of greater importance in the higherpotential Mangwende for cotton and vegetables, but, even in Chivi, some farmers are now regularly growing peppers and other vegetables for purchase by traders. In general, less grain is now being grown, with farmers resorting to vegetable gardening which has higher returns per hectare (FSRU, 1998). Limited nutrient inputs are focused on gardens in homefields, or those being established along river banks. With fewer livestock available, there has been a return for many to hoe agriculture, and greater attention paid to incorporation of plant matter within ridge and mounding systems. Zimbabwean farmers’ perceptions of the ESAP are mixed, as might be expected, depending on their access to resources and the opportunities they can gain from changes in prices and markets. In Chivi, farmers’ perceptions are universally negative: Those who are richer get richer, and those who are poor become poorer... ESAP is like AIDS – it kills you slowly, but surely... farmers cannot benefit fully from market liberalization because the markets fix prices at levels which are disappointingly low... (FSRU, 1998, p458)
372 Enabling Policies and Institutions for Sustainable Agricultural and Food Systems
In Mangwende, there is more of a contrast in view, given the higher level of agricultural potential and marketing opportunities available: ESAP is about encouraging people to work hard to build wealth... removal of price controls and competition amongst businesses can be beneficial if it leads to reduced input prices and better producer prices, as is happening with cotton... ESAP means a more difficult life for farmers because input prices are rising faster than producer prices... (ibid)
In Ethiopia, the impacts of structural adjustment on fertilizer prices are only now starting to feed through to farmers, for whom fertilizer prices have risen significantly in real terms (Croppenstedt et al, 1998). For farmers in Wolayta, these changes have rendered even more inaccessible their access to purchased inputs which has been in steady regression since the closure of the WADU project in 1981 and the withdrawal of credit-based fertilizer support. In the last few years, the Ethiopian government has been strongly promoting and extending the fertilizer package developed with the SG-2000 programme. This may provide the possibility of accessing assured supplies of inorganic inputs at reasonable cost for better-off farmers with sufficient land and good market access. However the SG-2000 package raises serious concerns when spread to poorer farmers and drier, risk-prone areas. In Mali, structural reforms were begun in the mid-1980s and included liberalization of cereal prices and the abolition of fertilizer credit schemes. Many farmers in the dry cereal-producing areas had never had easy access to such inputs since they were not in an area considered a priority for rural development interventions. However, farmers in Dilaba did have the opportunity to tap into project-supported credit and chemical fertilizers during the 1980s. For rice and cotton farmers, structural adjustment and devaluation of the CFA franc have had a much greater impact because of their engagement in market activities. Devaluation of the CFA franc in 1994 has had a largely positive effect on farmers in Mali. Prior to 1994, cotton farmers were facing stagnant prices and rising input prices. The CMDT had limited processing capacity and had established a quota system to keep a ceiling on cotton production. The devaluation coincided with rising world market prices for cotton, such that very substantial benefits could be gained from expanding area under this crop. With the CMDT investing in new ginning capacity, and a lifting of quotas, the area under cotton has grown from 200,000ha in 1993 to nearly 500,000ha in 1996 (Jeune Afrique, 1998). While input levels in the first year after the devaluation were somewhat depressed, subsequently farmers re-established former practices. Thus, for example, average net returns per hectare of cotton rose by a factor of 3 to 5 over the period 1993–1996 (Giraudy and Niang, 1996). Prices have also risen for cereals, particularly maize, given high levels of demand from the neighbouring Ivory Coast. Not only the larger, better-equipped farmers, but also the poorer small-farm households have been able to take advantage of these opportunities and expand the area cultivated, gaining a substantial increase in income per hectare because of the large hike in
Ways Forward? Technical Choices, Intervention Strategies and Policy Options 373
cotton prices paid to farmers. In the irrigated rice zone of the Office du Niger, devaluation has also brought about increased demand for domestically produced rice, since imported Thai rice has become more expensive. As a result, farmers have seen a rise in returns averaging 10–35 per cent per hectare, despite an increase in input prices (Breman and Sissoko, 1998). Those farming households with livestock holdings have also done well following devaluation, given rising prices and increased demand from coastal West African states. Structural adjustment has brought other changes to certain farming areas of Mali, particularly those covered by the CMDT and the Office du Niger. The Malian government has been required to privatize certain functions formerly carried out by these parastatal organizations, such as provision of veterinary services. The rapid withdrawal from veterinary service provision in 1995 led to heavy cattle losses from disease and damaging impacts on work oxen numbers in the CMDT zone. The CMDT has also been forced to become more transparent in terms of its pricing policy, and the share of cotton profits to be received by each of the three parties – farmers, the state and the CMDT. The programme to restructure the Office de Niger has brought changes in the responsibilities and rights of tenant farmers, providing improved security of tenure, and greater freedom over crop choice and where to market crops. Contract farming of certain vegetables (such as tomatoes for canning) is also now starting to develop in the irrigated lands of the Office du Niger, with traders providing access to credit, inputs, markets and technical advice.
Credit Throughout sub-Saharan Africa, farmers have limited access to formal financial systems through which to gain access to credit and in which they can invest their savings. The establishment of such systems faces serious constraints which include low levels of income, poor infrastructure, high transaction costs and limited collateral with which to hedge against risks of default (de Groote, 1995). As a result, savings at village level are frequently held in the form of livestock, and farmers rely heavily on informal sources of credit from neighbours and family and earnings from migration and off-farm activities for purchase of equipment and farm inputs. In the research sites, systems to gain access to credit have been undergoing change as a result of structural adjustment and other measures. Across the study sites, only in the CMDT area of southern Mali is such access more or less assured, though even here the CMDT has passed on responsibility for managing the loans to the National Agricultural Development Bank. In all other sites, while projects may occasionally set up and supply credit to a limited area, in most places farmers must rely increasingly on their own resources or on private sector loans, usually associated with cropping under contract to a commercial buyer. Thus, for example, for rice farmers in Mali, credit is no longer supplied by the Office du Niger, and farmers must rely on private sources with which to purchase inputs and equipment. In the southern Ethiopia research sites, most farmers
374 Enabling Policies and Institutions for Sustainable Agricultural and Food Systems
rely on informal networks through which to gain access to loans. Bank credit is in very short supply and dominated by a few suppliers requiring significant collateral arrangements. Agricultural credit is otherwise limited to the extension programme which offers a fixed package of inputs on credit to farmers with strict systems for repayment. Poorer farmers are in particular difficulties as a result, having very limited networks for raising cash while being unable to make effective use of the credit package. As a result, rising levels of default and debt are affecting the poorer and more marginal farmers in the area. In Zimbabwe, formal credit was offered to all communal area farmers on reasonable terms in the 1980s through the Agricultural Finance Corporation. However, default levels, particularly in drought-prone areas such as Chivi, were very high and the facility has been withdrawn. Today, getting access to credit from government or private bank sources is increasingly difficult, in part because of the stringent conditions applied. Informal lending and savings arrangements are therefore the primary way by which farmers raise cash.
Rural infrastructure Easy access to markets can provide a major spur to farmers to intensify agricultural production and investment in land improvement (Tiffen et al, 1994). Such effects stem from the impact of a broader array of demands for goods and services, and reduced transport costs bringing better margins on input and output prices. In southern Ethiopia, the challenges set by the mountainous landscape to road building, combined with low levels of investment, have meant that rural infrastructure is poorly developed. However, since 1991, major improvements to the main road through the study area has brought shorter journey times and more assured access throughout the year. This has been particularly important for the lowland study site where, in the past, travel times to the main market town of Soddo were considerable. Today a greater range of motorized transport opportunities exist at much lower costs. Nevertheless, much transport to market continues to be done by foot and donkey, with people often trekking for many hours to reach a market. The profusion of markets, occurring on a daily basis (and sometimes with day, evening and even night markets), is a characteristic of the Ethiopian rural economy. Such markets give traders the opportunity to make small margins by selling and buying in different places. This source of off-farm income is particularly significant for women. With the increasing access, larger market centres such as Soddo have become more important, sometimes displacing smaller, local markets. This has a number of consequences. For those purchasing and selling goods, improved infrastructure has reduced transport costs with the result that both consumers and producers benefit. However, the reduction in trading opportunities in the smaller markets may have impacts on women’s livelihood options, as it is often men, with access to cash, who can afford the transport costs to the larger market centres, with the result that trading activities become concentrated among those with capital assets. In Mali, maintenance and improvement of the principal roads from Bamako to Sikasso, Segou and the north-east of the country takes up the major share of the
Ways Forward? Technical Choices, Intervention Strategies and Policy Options 375
roads budget, with very little done to improve feeder roads away from the main arteries. In the CMDT zone there is assured transport for the collection of cotton and delivery of inputs. For Tissana and Siguiné, the large market town of Niono is relatively close and provides many opportunities to diversify crops and income sources. Even in areas much further from markets, people often walk very considerable distances to market. But these distances limit the kind of crop which can be grown for sale, since it must withstand the heat and jolting during the journey, as well as increasing the time and costs involved. In Zimbabwe in the 20 years since independence there have been major investments in road building, including roads within the communal areas, making transport and marketing considerably easier. There has been a resultant growth in bus and lorry traffic in the communal areas, with competition between operators driving prices down, although this effect has been offset to some extent by higher fuel costs stemming from currency devaluation. There are some differences in the level of rural road infrastructure between the study areas, with Mangwende being particularly well served with good connections to Harare and Marondera. Farmers regularly hire transport in groups for the transport of their produce. For vegetables in particular, timely delivery is key in order to gain the highest prices. In Chivi, the road networks have significantly improved in recent years. However, the distance to major market towns is larger than in Mangwende, with Masvingo being the most important. The road to South Africa which runs through Chivi provides important opportunities for trading both agricultural produce and other items. The tourist traffic along the road also provides a ready market for a range of produce, including craft items.
Research and extension services Research and extension service provision has undergone major changes over the last decade in all three countries. In part this has been due to structural adjustment reforms which have reduced the expenditure levels in government services. But, in addition, there have been some other changes in focus, with a gradual realization of the need to gear research and extension support to the needs of small-scale farmers. In all three countries this has been a slow process, but through interaction with a range of project-based initiatives, both within and outside government, some changes are being seen in the broader national agricultural research and extension strategy in all three countries. Since the 1970s, agricultural research and extension in Ethiopia has been associated with a technical package approach. A range of programmes have advocated different technical solutions to small-scale farming problems, but with relatively limited impact. While there has been important research, particularly on new varieties, this has had a limited impact on farming livelihoods in areas such as Wolayta. One criticism is that research has been largely focused on cereal crops for the highland areas. This is of clear national importance, but it has resulted in other agricultural production systems – including particularly the enset/root crop and pastoral
376 Enabling Policies and Institutions for Sustainable Agricultural and Food Systems
systems of the south – being largely neglected. However, over the last few years the national research services have been undergoing signifcant reforms. With the formation of the new Ethiopian Agricultural Research Organization, a new and broader mandate for agricultural research has begun to be defined. In terms of extension outreach, however, the focus remains on a package approach. This has been reinforced by the national adoption of the improved cropfertilizer-credit package originally promoted by the NGO SG-2000. While there are undoubted benefits of the package under the right conditions, this does not suit everywhere and everyone. In Wolayta the previous experiences of the WADU programme during the 1970s provide an important lesson. When subsidized credit was available and the infrastructural, marketing and other requirements were covered by the project, significant gains were achieved in cereal production. However, this was at the expense of the traditional root-crop system, and when the project withdrew in the early 1980s, cereal yields collapsed and farmers had to return to a focus on their previous mixed strategy of combining enset with root crops and cereals. Not surprisingly, the impact of the government’s agricultural extension strategy in the Ethiopia study areas has been mixed, with richer farmers in the higher rainfall areas being able to make good use of the package. However, poorer farmers by and large have not benefited and many, following poor rainfall years, have gone into debt (Carswell et al, 2000). The limitations of the approach, however, are now beginning to be recognized and a strategy for addressing the problems of poorer farmers in more marginal areas is being developed, with an extension of the range of extension packages to such issues as soil and water conservation and livestock management. The agricultural research sector in Mali largely consists of the Institut d’Economie Rurale (IER) which, despite its name, is mainly technical in focus. Agricultural research has paid greatest attention to the problems faced by cotton farmers in the CMDT area and irrigated rice producers in the Office du Niger. Recent structural reforms to the IER have led to cuts in funding and greater reliance on a range of clients, particularly donor agencies requiring short-term research support for their field projects. At the same time, IER has moved towards a regional model, with greater responsibilities allocated to the five regional research centres (of which Niono and Sikasso are part). At the regional level, consultation committees have been set up in the hope of establishing closer communication between researchers and farmer groups in that area. However, it is unclear how effective these have been in influencing the direction and methods followed by researchers. Rice and cotton farmers have thus received the lion’s share of research expenditure. In both cases, this seems to have brought considerable improvements in yield when combined with favourable market conditions. Much greater attention is now being paid to differences between farm households in the CMDT region, so that the difficulties faced by small, poor households can also be addressed. Rainfed cereal areas, by contrast, have not been the object of concerted research and extension work, with provision of technical advice and credit the result of limited-duration programmes such as the Programme National de Vulgarization
Ways Forward? Technical Choices, Intervention Strategies and Policy Options 377
Agricole, or the presence of an NGO field project. Despite this neglect, farmers outside the main cash-crop zones have made very considerable changes to their cropping systems – taking up new varieties, adopting ox-drawn ploughs and experimenting with inorganic fertilizer – based on their own capacity to learn, experiment and share lessons. While earlier research focused on the development of technical packages for farmers based on inorganic fertilizer, much greater effort has been made in the CMDT area over the last ten years to promote more sustainable management of soils. This is being done by work on anti-erosion measures combined with better use of organic materials such as crop residues and manure. Private sources of extension advice and input supply are also growing, related to particular crops being cultivated under contract to a commercial buyer. Thus, for example, in the Office du Niger, irrigated tomatoes are being grown in the dry season for a canning factory, with seed, other inputs and advice being supplied to the farmers by the buyer. In Zimbabwe, government policy towards agricultural research and extension switched from a concentration on the large-scale commercial farming sector to smallholders following independence in 1980. However, this transition has not been easy. The available technologies and the style of research which predominates in the Department of Research and Specialist Services (DRSS) of the Ministry of Agriculture has resulted in a relatively limited uptake of research results in the communal areas. This problem has been compounded by continuing budget cuts, particularly in the period following structural adjustment. This has limited the ability of station-based researchers to get to the field and interact with farmers. Nevertheless a number of project-based initiatives have in recent years started a more farmer-focused approach to agricultural research. The Farming Systems Research Unit (FSRU) in DRSS, for example, has developed a farmer-led participatory research approach in Chivi and Mangwende, with many experiments focused on soil-fertility issues. This has been complemented by more technical research both within DRSS and at the University of Zimbabwe supported by the Rockefeller Foundation-funded SoilFertNet. The result has been the exploration of a range of technologies and management practices which are more in line with farmer demands, and, in some instances, a quite rapid uptake of new practices. In Zimbabwe, the links between research and extension have been relatively weak, except through more informal contacts at the local level. Agricultural extension, run by the Ministry of Agriculture department Agritex, has been hit by similar budget cuts as research. This has meant a decline in extension coverage over the 1990s, particularly as a result of reduced mobility due to mileage restrictions. In rethinking the role of extension in the country, a number of important lessons have been drawn from past experience. First, the top-down technology driven package approach which has dominated Zimbabwean extension support since the 1930s has been criticized as not really addressing farmer demands. Second, the high costs of broad field-level extension coverage (with the aim of having an extension worker in every ward) have been seen to be unfeasible given government budget limitations. In particular, the training-and-visit approach, originally recommended
378 Enabling Policies and Institutions for Sustainable Agricultural and Food Systems
by the World Bank in the period following independence, has come in for a lot of criticism as being both too technically oriented and too costly. Drawing on a variety of experiments in alternative types of extension approach, particularly emanating from Masvingo Province (Hagmann et al, 1998), Agritex is now exploring more participatory approaches which redefine the role of the extension worker and the linkages between farmers, researchers and the extension system.
Land and tenure reform in the context of decentralization Land tenure security is often seen as a critical factor in ensuring effective long-term investment in natural resources. A variety of land tenure reform initiatives have been started across the three country case studies. Various forms of land reform and resettlement have also been significant in affecting the distribution of land resources across the study areas. Land and tenure reform is occurring in the context of broader administrative changes associated with programmes of decentralization. Farmers in Ethiopia have witnessed major upheavals due to land tenure changes and villagization, which have generated continued uncertainty over their landholdings. The land reform policy implemented by the Derg regime during the 1970s resulted in a major reallocation of land to farmers who were previously reliant only on tenancy arrangements with landlords under the feudal system. While this disrupted the strategies of richer landlords, it did provide new land for those previously unable to farm for themselves. However, despite the reforms significant inequalities in landholding persist, with former landlords often repurchasing or contracting land from poorer households. Today a huge range of landholding arrangements exist, including outright ownership, share cropping, contracting and different forms of tenancy. While many of these are notionally illegal, the range of informal institutional arrangements surrounding land are an important aspect of the local situation. Resettlement policies to less densely populated areas in the lowlands have been important in Ethiopia since the late 1960s. For example, the lowland case study site was established as a settlement scheme in 1971 as part of the WADU integrated rural development project. The allocation of 5ha plots to former tenant farmers provided new opportunities for agricultural livelihoods, although the consequences of moving to a lowland area with different agroecological conditions and high levels of both human and livestock disease incidence caused many problems. During the 1980s, the policy of villagization caused further changes in landholding patterns. Villagization was aimed at rational planning for increased production, combining private and collective farming arrangements. The broader political effect was to increase the state’s political and economic control over peasant farmers. Farmers in lowland areas of Wolayta were forced to move into villages and to leave behind the plots of higher-fertility darkoa land which they were in the process of enriching. Fortunately, they were to return to their home sites following the fall of the Derg in 1991 and reinvest in their garden areas. Resettlement and
Ways Forward? Technical Choices, Intervention Strategies and Policy Options 379
land reorganization have not been major features of land policy under the current government, with the land redistribution efforts in the Amhara region in the mid1990s not being repeated elsewhere. Movement between sites instead tends to be more spontaneous, with families resettling to new areas (particularly in the lowlands) through informal connections with relatives and other contacts. In Ethiopia there is continued debate at national level concerning further changes to land tenure (Dessalegn, 1994). The government insists that all rural land will remain the property of the state, but that this should not undermine security of land holdings and customary inheritance arrangements. However, given past government policies – particularly of land reform and villagization – many farmers remain sceptical about government intentions and a sense of uncertainty continues (Worku, 1998). Yet despite this, farmers continue to invest in long-term soil-fertility improvement in their garden sites, and the growth in on-farm tree planting in the area suggests that farmers are not thinking only for the short term (Carswell et al, 2000). Regionalization, involving a form of political and administrative decentralization, has been a central plank of the post-1991 government’s policy. While a process of devolving certain powers to the different regions which make up the country has occurred, it is unclear as yet how far this will lead to major changes in agricultural policy, given the continued political and administrative tensions between central government and ministries at the federal level and the new regional administrations, where capacity and political authority often remains weak. This is particularly apparent in the southern region which is made up of a wide range of disparate ethnic groupings (Young, 1996). In Mali, the ongoing process of decentralization and land tenure reform provides an evolving landscape within which farmers must plan their strategies. Control over land currently being farmed seems relatively secure, with customary rules predominating (Lavigne Delville, 1999), but there is much greater uncertainty over management of collective resources such as grazing, woodlands and water (Joldersma et al, 1996; Hilhorst and Coulibaly, 1998). These common resources provide a variety of important products, including pasture for livestock which transport nutrients from bush to cropland. In addition, it is also not clear how the powers of the newly established rural communes will relate to customary structures at village level. While the tenure reforms (Code domaniale et fonder) propose allocating firmer rights to community groups to control access to resources within their territory, this may conflict with the claims that rural communes may wish to assert over resources now under their formal responsibility (IIED, 1999). Where communes see the allocation of rights as an important source of income and patronage, serious difficulties may arise over the prerogatives of village and commune-level structures. Given that the new Communes Ruraux were elected in May 1999 and are currently in the process of establishing themselves, it is too early to judge their likely impact. However, it should be remembered that the rationale for decentralization in Mali (and many other countries) has been based far more on service delivery and political considerations, rather than ensuring more effective management of land and natural resources.
380 Enabling Policies and Institutions for Sustainable Agricultural and Food Systems
In Zimbabwe, debate regarding land and resettlement has been underway since independence in 1980. After an initial flurry of activity in the early 1980s there has been little action on the ground until the last few years (Moyo, 1998). From the late 1990s, the issue gained greater attention from both government and donors, with a new phase of the resettlement programme approved in 1999. During 2000, however, the politics of land reform changed dramatically, as the ruling party and the ‘war veterans’ began to focus their electoral campaigning on the land issue. A range of land invasions followed, and an attempt by the government to institute a ‘fast-track’ resettlement policy. The degree to which such resettlement programmes will reduce land pressure in the existing communal areas, however, remains uncertain. Nevertheless a number of studies show that, if the appropriate support is given to new settlers and resettlement takes place in areas where productive agriculture is viable, then the potentials for a resurgence of smallholder agriculture in Zimbabwe are great. In practice, though, the consequences to date for farmers in the Chivi and Mangwende study areas have been minimal. Relatively few have been able to sign up for resettlement programmes, which have been targeted largely at richer farmers with Master Farmer Certificates. Instead, more informal processes of resettlement are occuring with farmers moving, particularly from dryland Chivi, to other parts of the country (notably Gokwe and the Zambezi valley area) where land is more abundant, and, more recently, nearby commercial farms have been invaded and occupied. Parallel debates centred more on land tenure reform and decentralization are also ongoing. Following growing concerns about land tenure and rural administration issues in the communal areas, a commission of inquiry was established which suggested a range of changes to land administration and tenure issues (Government of Zimbabwe, 1994). The commission recommended that village areas be granted tenure rights on a collective basis, combined with a review of the village and ward committee system which was widely regarded as inadequate. A greater role for ‘traditional’ leaders and customary arrangements was argued for. However, the implementation of the recommendations has been fragmentary, with particular rural political contexts largely affecting change at the local level. With the political hiatus of the last few years, little progress has been made on the ground. Decentralization to Rural District Councils has also been seen as a route to more effective agricultural and land management in the communal areas, but, again, the capacities of district councils to do much without significant budgets and in the context of joint responsibilities with central line ministries has been very evident.
Policy Options and Strategies A range of policy measures, therefore, is seen to affect farmer management of soil fertility. However, rarely has soil-fertility management itself been the main target of such policies. Rather, impacts on soil management tend to be the cumulative
Ways Forward? Technical Choices, Intervention Strategies and Policy Options 381
results of a series of interventions whose focus and interest lie in other fields. As Scherr (1998, p2) notes, ‘policy makers typically consider soil quality not as a policy objective in itself, but as an input into achieving other policy objectives’. The launch of the Soil-Fertility Initiative (SFI) by the World Bank, FAO and other donors was intended to remedy this weakness (World Bank, 1996). One objective of the SFI has been to identify more clearly those policies which are likely to have an impact on soil-fertility management, where overlaps and contradictions currentiy exist. National soil-fertility action plans are intended to promote greater coherence in policy making by bringing together those bodies with responsibilities which are likely to affect soils, and focusing on ways to encourage longer-term investment in improving soil quality. Thus, for example, the steering group for the elaboration of national plan of action to address soil-fertility management in Mali comprises representatives from the Ministries of Planning and Rural Development, as well as from the CMDT, the Office du Niger, the National Environmental Action Plan, the agricultural research sector, the World Bank and the Dutch Embassy. It is important to examine both the content of policy (statements and instruments) as well as its process (elaboration, implementation and review) and to try and understand differences between what is said, and what actually happens (Keeley and Scoones, 1999; Mayers and Bass, 1999). It is clear that: The policy-making process is by no means the rational activity that it is so often held up to be... policy research over recent years suggest that it is actually rather messy, with outcomes occurring as a result of complicated political, social and institutional processes. (Juma and Clark, 1995, pp128–129)
Several points emerge from examining the policy process in the three countries studied. First, policy changes have stemmed largely from the demands of a range of international actors, rather than from internal debate and consultation among stakeholders at national and local levels. In many African countries, agenda-setting tends to be done within a very limited group of people, largely within government, with little or no public consultation, making it much more difficult to introduce alternative views and perspectives. The World Bank, IMF and major donors have also been able to maintain a highly influential role in policy directions because of the high level of indebtedness amongst many sub-Saharan African states, and their consequent dependence on development assistance. Governments remain heavily reliant on, and reactive to, new international initiatives (such as the Convention to Combat Desertification and the SFI), often in the hopes of gaining renewed funding rather than necessarily feeling committed to the objectives of the initiative in question. Second, the data which drive such policy debates are heavily reliant on a very limited number of documents, which are repeated time and time again. These include the FAO survey of 1990 (Stoorvogel and Smaling, 1990) and research which attempts to put an economic estimate on soil-nutrient losses (Bishop and
382 Enabling Policies and Institutions for Sustainable Agricultural and Food Systems
Allen, 1989; van der Pol, 1992). Such data provide simplistic messages regarding the significance, diversity and dynamics of soil-nutrient management at farmer level, and also lead to a blinkered view of the means by which to encourage more sustainable agricultural practices generally. The end result is often a set of policy statements which bear only partial relation to what can be seen at farmer level, but which many are unwilling to contest. Third, the current policy focus on soil-fertility management needs to be understood in the light of the structural adjustment measures undertaken by African countries under IMF and World Bank guidance in the 1980s and 1990s, which reduced substantially farmers’ ability to gain access to inorganic nutrients by cutting subsidies and credit programmes. The fact that the World Bank is behind both structural adjustment and the SFI has sent a set of contradictory signals to African governments, who hope that the SFI may provide a vehicle for the reintroduction of such measures.
New directions? Recognizing the multiple dimensions of soil-fertility management Interventions to address soil-fertility management need to consider five dimensions which frame the range of options available. First, as has been demonstrated throughout this book, the diversity of sites, soils and strategies found within and between African farming systems is very great. Thus, tailoring approaches to suit the opportunities and problems encountered in any particular location is of key importance. Second, there is a considerable level of differentiation between farmers in any one location, which means that no single package of measures will be appropriate for all. Third, as was clear from the discussion above, there is a wide choice of potential actions aimed at achieving better soil-fertility management, from direct technical inputs to broader macro-economic measures, which can be pursued either separately or in combination. This presents decision makers at different levels with a valuable menu of options from which to choose. The fourth dimension concerns the time frame over which such measures might usefully be implemented, given current conditions and other ongoing policy changes with an influence on soil management. Some measures produce rapid impacts, particularly those operating through prices and markets, while others are far slower in bringing about changes such as land tenure reforms, and changes to training of extension officers. The fifth dimension concerns the broader context, and how macro-level decisions might better take into account the need to promote more sustainable patterns of soil management at farm level. Hence the potential role to be played by a national strategy for soil-fertility management which forces an explicit analysis of how current policies in a range of fields affect incentives at farm level.
Ways Forward? Technical Choices, Intervention Strategies and Policy Options 383
A sustainable livelihoods approach to policy design So how can these multiple dimensions of soil-fertility management be combined? As the case study research has shown, an exclusive focus on the technical aspects of soil-fertility management is unlikely to generate effective interventions and appropriate policies. Soil-fertility management is but one part of a broader set of livelihood activities that rural people pursue. Taking a more holistic analysis, then, a sustainable rural livelihoods approach outlines the range of different ‘capital’ assets which such interventions might address, as discussed in Box 19.1. As can be seen, there are many routes to achieving the goal of improved soils management. For each of the five forms of ‘capital’ described in Box 19.1, there will be a range of intervention options to be considered, depending on the assets and livelihood strategies of different groups of people, with men, women, younger people, older people, in-migrants and others requiring different forms of support. Thus, for example, ways of improving natural capital will need to consider how to address the particular constraints of poorer farmers with small fields and poor soils, who also have limited access to cash and labour. Thus, attention might usefully be paid to forms of micro-credit best suited to poorer groups, as well as getting extension staff to focus on the differentiated needs of farmers, instead of targeting the ‘average’ farm household. By contrast, the options open to better-off farmers in a given site are likely to be much broader and, therefore, prompt a different set of interventions. Box 19.1 Rural livelihoods: identifying avenues for intervention for soil-fertility management •
Natural capital, through a range of direct interventions aimed at improving the biophysical status of soils, such as recapitalization, use of chemical inputs and build-up of organic matter, and construction of anti-erosion measures.
•
Financial capital, by support to credit and savings schemes to facilitate the import of nutrients onto farms and investment in labour, transport, or livestock for their manure.
•
Physical capital, by building roads and other means of communication to improve access to markets and thus shift relative prices and improve incentives for soil-fertility management.
•
Human capital, through working with and building on farmers’ knowledge and skills, to develop more effective partnerships between farmers, research and extension staff.
•
Social capital, by improving the organizational capacity of farmers to work together, experiment with alternative technologies, reflect and evaluate options and identify needs from technical service agencies.
Source: Scoones and Toulmin, 1999
384 Enabling Policies and Institutions for Sustainable Agricultural and Food Systems
The way different social groups gain access to these different forms of ‘capital’ is dependent on a complex interaction of institutions and organizations operating at different levels. The institutional process which mediates access to such assets is therefore a critical component of any livelihoods analysis. For example, in Ethiopia, depending on social status, religious affiliation and the ability to pay in kind for labour, different people may gain access to labour for soil management and other agricultural activities through a variety of different local institutional forms. Such local institutions may interact with more formal organizational structures of the state or development agencies in various ways. Thus, for example, local, largely informal credit or savings organizations operating among networks of kin, friends or church members may be usefully enhanced by externally supported credit arrangements to improve the ability of members to increase financial capital. It is this interlocking, multilayered nature of informal and formal organizational arrangements which is central to an understanding of how livelihoods are constructed by different people in different settings. Insights into the changing nature of institutional configurations across levels, then, can assist with the sensitive design of appropriate interventions which enhance people’s own capacities to manage resources.
Combining different approaches Much of the current international debate on agriculture in Africa pays particular attention to direct interventions aimed at increasing soil nutrients, through supplementing natural capital by, for example, increasing use of inorganic fertilizer. However, there may be more effective means of achieving the objective of improving livelihood sustainability. Box 19.1 suggests other avenues which should also be considered in identifying a broader spread of options for tailoring to local conditions. In any particular setting, it is unlikely that a single intervention, by itself, will make a big difference to soil-fertility management and improved livelihoods. For example, in agricultural systems where soil organic matter is in short supply, substantial inputs of N may be needed initially to generate sufficient biomass to contribute to the longer-term objective of improving soil structure and building organic matter content. At the same time, work could be initiated through farmer field schools and experimentation aimed at increasing human and social capital through raising skills, knowledge of more effective biomass management and strengthening partnerships between farmers and extension systems. At the macrolevel, debate could be initiated on reforms to research and extension systems, ways of improving access to markets and credit, and strengthening of tenure security. From the case study sites, a range of combined actions can be identified aimed at improving soil management and livelihood sustainability, which address the particular characteristics of location and farm household, as shown in Box 19.2 below. From these examples based on the field research, a varied choice of interventions can be identified to support more effective soil-fertility management. Some
Ways Forward? Technical Choices, Intervention Strategies and Policy Options 385
of these are focused at farm and field level, while others relate to wider policy and macro-level changes. An analysis that cuts across scales – from the micro to the macro – and across intervention areas – from technical to institutional – is essential if the appropriate mix is to be found. As we have seen, however, much of emphasis in the past – and persisting to the present – has focused on technical options derived from a limited view of soil management emanating from soil and agronomic studies. The emphasis on inorganic chemical fertilizers is perhaps the dominant example of such an approach, although it could be argued that the low external input and organic farming perspective suffers from a similar weakness and narrowness of vision. Any technical options, then, need to be seen in a broader context. This points to the importance of a wider socioeconomic and institutional analysis, asking who gains and who loses from different options? How are different intervention options linked into broader patterns of livelihood change? Which combination of institutional and policy factors operate and interact at different levels, and how do they help direct farmers along more desirable pathways of change?
Strategies for Integrated Soil-fertility Management: Following a Phased Approach As previous sections have shown, a long-term strategy for integrated soil-fertility management needs to take account of a wide range of factors, from the macro to the micro, and across a huge range of policy areas. Such a strategy needs to consider how to implement such a range of measures over time, and best link locallevel practice and national level policy. This would allow for the design of a set of interventions to be implemented, which are tailored to particular settings and able to adapt to changing circumstances.3 A phased strategy would therefore need to start with a period of participatory planning and assessment, the development of new skills, and be linked to a series of decisions regarding the appropriate scale and vehicle for intervention. A first step would be an initial assessment of context and constraints to identify the biophysical, socioeconomic and institutional characteristics of the district, province or commune where work is planned. In parallel, a macro-level analysis is needed of policies which affect the pattern of incentives for farmers to manage their soils more sustainably, given the range of other opportunities and constraints they face, in the agricultural sector and elsewhere. At farm and community levels, participatory planning and analysis enables local people, researchers and extension staff to identify a set of activities which farmers want to try, and to establish methods for joint reflection and evaluation. Experience with participatory extension approaches in combination with farmer field schools provides a variety of practical tools for supporting farmers in the analysis of problems, choice of options to test
386 Enabling Policies and Institutions for Sustainable Agricultural and Food Systems
Box 19.2 Identifying options for policy and practice: examples from the field sites Mali In the irrigated rice village of Tissana in Mali, the diversification by farmers into crops other than rice is set to continue. Further growth of the scheme is also underway, with investment in construction of new canals and irrigation works into neighbouring dryland areas. Interventions to improve soil-fertility management within the Office du Niger thus need to include a combination of: •
A shift in research and extension from an exclusive focus on irrigated rice, grown with inorganic fertilizer, towards support for other crops, combining organic and chemical materials to best effect.
•
Work with newly settled rice farmers who are less familiar with inputs and credit, water management and marketing, as well as how best to maintain and improve the quality of soil on their plots, combined with attention to areas long under cultivation where soils are suffering from salinization and loss of structure.
•
Seeking maximum complementation between livestock and cropping enterprises in and around the Office du Niger. Cattle herds depend on gaining access to dry-season grazing, while at the same time providing manure which is becoming a key component of the farming system.
Ethiopia In the highland site in southern Ethiopia, livelihood options are increasingly constrained. Limited land areas and the lack of available oxen and cash to invest in increasing agricultural production on the small plots of land means that a flexible strategy involving a range of farm and non-farm activities is essential. The current focus for rural development in this area concentrates on an extension package involving improved seeds and fertilizer linked to a credit arrangement, which is implemented in an inflexible manner. Only the better-off can risk the package and gain the undoubted benefits. By contrast, this option increases vulnerability for poorer farmers, as they have no other sources of income or land to fall back on in case of failure. Alternative options could include: •
A wider set of technical options as part of the package, which involve lower-risk crops and management practices.
•
A more flexible form of package so that farmers may take different elements of the package in relation to the condition of their soils, their production objectives, their asset status and risk preferences.
•
An alternative form of ‘credit for livelihoods’ which would allow the allocation of credit to a range of livelihood activities to encourage agricultural improvement in the context of wider livelihood diversification.
•
The linking of formal credit (from government and private sources) to informal institutions governing savings and mutual assurance.
Ways Forward? Technical Choices, Intervention Strategies and Policy Options 387
Zimbabwe In Zimbabwe, the increasingly uneconomic option of applying inorganic fertilizer at recommended rates has resulted in declining use, even in higher-potential areas where agronomic responses are relatively good. This has potentially negative impacts on the viability of agriculture in these areas, with consequences for economic growth and food security. Farmers’ own experiments with combinations of organic and inorganic amendments have not received much attention from research and are not recognized in standard extension support. A range of options for improving the situation suggest themselves. •
A revision of fertilizer recommendations to take greater account of local agroecological setting and socioeconomic circumstance, with a set of graded options with different mixes offered by local traders.
•
Support for new fertilizer traders and suppliers to encourage a growth in the market. A variety of public–private partnerships could be explored which might help reduce trading margins, particularly in more remote areas, and so reduce farm-gate costs.
•
Different bagging options and more variety in fertilizer mixes, with advice offered by retailers, would allow greater customer choice, and perhaps greater demand, particularly from those requiring relatively small amounts for specific uses.
•
More emphasis in research and extension on improving fertilizer-use efficiency through different placement and timing options. Combined with innovative ways of combining inorganic with organic sources, limited supplies of fertility inputs could be made to go further, thus increasing productivity.
out, and strengthening of organizational links to help spread ideas and discussion amongst farmers. At the same time, an assessment of organizational setting is needed to identify the current strengths and capacity of different channels through which a combination of interventions might be supported. This will depend on existing structures within the existing governmental, NGO and private sectors, the skills and resources available, and the flexibility and openness of different structures to working with farmers in a more intensive and collegiate manner. As already discussed, the tailoring of soil-fertility interventions to the diversity and dynamics of particular contexts will need to go beyond a purely technical focus, to embrace a much wider set of options (see Boxes 19.1 and 19.2). The skills needed by research, extension and development agents to take forward the approach outlined above will need to include: •
Economic and social analysis to understand the diverse constraints faced by farmers and the historical dimension to the farming system’s development, in order to set the particular issue of soil-fertility management within the broader context of farming livelihoods.
388 Enabling Policies and Institutions for Sustainable Agricultural and Food Systems
•
•
Participatory planning, analysis and facilitation of farmer-led experimentation, by support to processes of learning and exchange, and major changes in the roles of research and extension staff. Such changes are partly underway in many research and extension structures but require further commitment to ensure their firmer establishment, and the integration of participatory approaches within the way such organizations operate. Institutional and organizational analysis to identify structures with which to work and pathways along which the goal of improved soil-fertility management can be achieved. For example, in Mali and Zimbabwe there is a much greater role now being played by the private sector (traders, transporters, shopkeepers) in the provision of inputs and purchase of crops. Organizational analysis needs to assess, for example, how best to build on the energy and flexibility afforded by the local private sector to improve access to inputs and markets.
However, it takes a long time to change the ethos and skills base available to institutions such as government research and extension agencies. Hence, a long-term programme for training and retraining may be required, as well as reliance in the short term on other sources of expertise, such as the NGO community. Developing a strategy for integrated soil-fertility management will also mean making choices about level and strategy. Trade-offs and synergies must be assessed between the following strategies: •
•
A local-level focus, based on a participatory learning approach which gradually builds capacity at this level through the development of skills, pilot projects to test out methods of working with farmers, training of trainers and methods of spreading experience with possible partners. There may already exist a body of organizations with considerable experience in this field on which to build. Even if lacking within a given country, there may be useful experience in neighbouring countries on whose skills such a locally focused programme could be based. Support to networking amongst the various organizations working on participatory soil-fertility management could be one among several ways of spreading such approaches, through exchange of experience and lesson learning. Attention must also be paid to structures of incentives faced by researchers and extension agents to adopt new methods of work, other changes underway in the agricultural research and NGO worlds, the space for local fora to be established and opportunities for linking debate at local level with higher levels. A centralized approach with a technical focus, such as distribution of rock phosphate supplies for recapitalization of soils. This would require a well-planned system for organization of delivery, instructions to farmers regarding its use and methods for recouping costs. The newly completed National Strategy for Soil-fertility Management for Burkina Faso provides an example of such a technical focus involving the distribution of substantial volumes of rock phosphate mined in the north of the country to farmers in the centre and
Ways Forward? Technical Choices, Intervention Strategies and Policy Options 389
•
north-west (Government of Burkina Faso, 1999). The cost of this activity, estimated to be 5.9 billion CFA francs (equivalent to US$9.7 million), may well be covered from a range of interested donors who often find it easier to provide a single large payment of funds than a smaller, regular commitment. A macro-policy focus, which aims to influence policy measures in ways likely to improve the incentives faced by smallholder farmers. Such a macro-level focus requires that farmers be sufficiently well-integrated into economic and policy circuits for changes at macro-level to have an impact at farm level. This is much more assured where farmers are already engaged in cash-crop production and reliant on significant levels of purchased inputs. In such cases, price changes for inputs and outputs can have a major and rapid impact on choice of crop, and the level and type of soil-fertility inputs used. In other areas more distant from markets, pricing policy will have more muted effects. Use of macro-level instruments also assumes a willingness in government policy and donor circles to develop a more coherent approach to addressing soil-fertility management for improved livelihoods. Without such coherence, the incentives faced by farmers are, in practice, merely the net result of decisions made in a number of areas with no explicit account taken of their impact on soil management.
As part of any consideration of phasing external support, it may be appropriate to look at how such approaches may be combined at different points. It may, for instance, be essential to address broader macro-policy issues before embarking on a local-level approach, as without such an enabling context at higher level, local initiatives may fail. Equally, it may be appropriate to aim for a top-down, technical intervention (such as fertilizer supply) to address the immediate consequences of short-term food insecurity and build towards a more long-term integrated and participatory approach over some years.
Future Directions? The approach outlined above contrasts in some important respects with the current round of environmental strategies and conventions which are in the process of preparation and implementation. These include the UN Convention to Combat Desertification, the Soil-fertility Initiative and National Environment Action Plans. One obvious problem raised by these environmental strategies is the degree of overlap, duplication and waste involved in pursing often similar objectives but through different structures, which actively compete with each other, both at national and international level. A second issue concerns the very high cost of preparing such global strategies in comparison with the funding available to implement what has been agreed. For example, it is reckoned that the cost of negotiating the UN Convention to Combat Desertification must far exceed US$100 million
390 Enabling Policies and Institutions for Sustainable Agricultural and Food Systems
over the period from May 1993 (Toulmin, 1997). It is reasonable to ask whether such sums are justifiable given the end product and the likelihood of the intended beneficiaries gaining anything tangible from the National Action Programmes currently being formulated. But the third, and most important, problem concerns the approach taken by these international plans and strategies. Despite a rhetorical flourish in favour of participation and consultation, and a nod in recognition of diversity, such initiatives continue to be led by international donors, and emphasize the important role of international coordination and facilitation, rather than taking measures to ensure real interest and ownership in the countries concerned. It is vital to have an agreed consensus regarding the nature of the policy problem being faced, and the system of which it forms part. The ‘crisis narrative’ expressed in many international statements about the state of African agriculture tells a particular story which is appealing in its simplicity. It suggests that things are bad and getting worse, and something must be done urgently. While this may be good at raising the interest of donors and others, it may result in poorly thoughtout and hastily implemented projects which make it difficult for other more considered approaches to be carried out. Such interventions may, in some cases, undermine livelihoods and reduce the potential for sustainability in the long term. Programmes which stress inorganic fertilizer use may, for example, push out a more balanced approach including biomass management which would help assure the longer-term structure and productivity of soils. An alternative, more cautious way forward is needed. Such an approach does not state that ‘there is no soil-fertility problem’, but rather that problems are local, specific, differentiated and dynamic and will require mostly local efforts to be addressed effectively. This approach proceeds through a combination of farmer experimentation, monitoring and sequential learning as part of a longer-term participatory process. It is less glamorous than global initiatives and spends aid money less on technical aspects and more on building local skills and reforming institutional and policy processes. Such an approach pays particular attention to the phasing and skills required for pursuing this kind of programme, it acknowledges the very diverse set of conditions and practices found at farm level, and it recognizes that African farmers have been very creative in their ability to adapt and cope with rapid changes to the economic, institutional, technical and political settings in which they find themselves. While such an approach focuses on the local and the particular, it recognizes the importance of the broader macro conditions within which local practices are set. Those in favour of this approach need to establish a rather different kind of debate at global level which avoids simplification. The narrative for such an approach tells a story of diversity and dynamics and the need to support a set of locally generated processes, pay attention to institutional and policy settings and place soil-fertility management issues in their broader livelihood context. It is hoped that this book can make a contribution to this alternative vision and so help set the debate on how best to support soil management in Africa on a new and more productive path.
Ways Forward? Technical Choices, Intervention Strategies and Policy Options 391
Notes 1
2 3
It is beyond the scope of this chapter to review these in detail, but many other studies provide useful overviews. For example, Bumb and Baanante (1996) and Larson (1993) on fertilizer use; Lal (1984) on soil conservation; Greenland and Nye (1959) on fallows; Vogel (1994) on tillage; Mugwira and Murwira (1997) on animal manures; Giller and Cadisch (1995) on nitrogen fixation and Jones et al (1997) on legume residue use. For example in Zimbabwe, 10 tons of manure per hectare every three years is the standard recommendation. See Defoer and Budelman (2000) for a set of practical guidelines about how to develop an integrated soil-fertility management approach at farm level over a series of cropping seasons.
References Bishop, J and Allen, J (1989) ‘The economics of soil degradation’, Discussion Paper 95–02, Environmental Economics Programme, IIED, London Breman, H and Sissoko, K (1998) L’Intensification Agricole au Sabel, Karthala, Paris Bumb, B L and Baanante, C A (1996) The Role of Fertilizers in Sustaining Food Security and Protecting the Environment: Trends to 2020, International Food Policy Research Institute, Washington, DC Carney, D (1998) ‘Implementing the sustainable rural livelihoods approach’, in D Carney (ed), Sustainable Rural Livelihoods: What Contribution Can We Make? DFID, London Carswell, G, Data, D, De Haan, A, Alemayehu Konde, Haileyesus Seba and Sinclair, A, (2000) ‘Ethiopia Country Report’ IDS Research Report, Brighton, IDS Croppenstedt, A, Demeke, M and Meschi, M (1998) Technology Adoption in the Presence of Constraints, the Case of Fertiliser Demand in Ethiopia, paper prepared for the Ethiopia-Eritrea network meeting, June 1998, University of East Anglia, Norwich de Groote, H, Kebé, D and Hilhorst, T (1995) ‘Report from the seminar on rural financial systems in southern Mali’, Sikasso, 3–5 May, 1995 Defoer, T and Budelman, A (eds) (2000) Managing Soil Fertility, A Resource Guide for Participatory Learning and Action Research, KIT Publications, Amsterdam Dessalegn, R (1994) ‘The unquiet countryside, the collapse of “socialism” and rural agitation, 1990 and 1991’, pp242–279, in Abebe Zegeye and S Pausewang (eds), Ethiopia in Change: Peasantry, Nationalism and Democracy, British Academic Press, London FSRU (1998) ‘Economic structural adjustment and communal area agriculture, case studies or the effects of policy changes on farmers’ management of soil fertility in Mangwende and Chivi communal areas, Zimbabwe’, pp446–486, in C Toulmin and I Scoones (eds), Dynamics of Soil Fertility Management in Savanna Africa, Final report to EU, IIED, London Giller, K E and Cadisch, G (1995) ‘Future benefits from biologial nitrogen fixation: an ecological approach to agriculture’, Plant Soil, vol 174, pp255–277 Giraudy, F and Niang, M, (1996) Impact de la devaluation sur les systemes de production et les revenues paysans en zone Mali-Sud, CMDT, Bamako Government of Burkina Faso (1999) Strategie nationale et plan d’action de gestion integree de la fertilite des sols, Ministere de l’Agriculture, Ouagadougou Hagmann, J, Chuma, E, Connolly, M and Murwira, K (1998) ‘Client-driven change and institutional reform in agricultural extension: an action learning experience from Zimbabwe’, AgREN, no 79, ODI, London Hijkoop, J, van der Poel, P and Kaya, B (1991) Une Lutte de Longue Haleine; Aménagements Anti-Erosifs et Gestion de Terroir, KIT, Amsterdam
392 Enabling Policies and Institutions for Sustainable Agricultural and Food Systems Hilhorst, T and Coulibaly, A (1999) ‘Elaborating a local convention for managing village woodlands in southern Mali’, Issue Paper No 78, Drylands Programme IIED, London IIED (1999) Land Tenure and Resource Access in West Africa, Issues and Opportunities for the Next Twenty Five Years, IIED, London Joldersma, R, Hilhorst, T, Diarra, S, Coulibaly, L and Vlaar, J (1996) ‘Siwaa, la brousse sèche, Expérience de gestion de terroir villageois au Mali’, Bulletin 341, KIT, Amsterdam Jones, R B, Snapp, S S, et al (1997) ‘Management of leguminous leaf residues to improve nutrient use efficiency in the sub-humid tropics’, in Driven by Nature: Plant Litter Quality and Decomposition, G Cadisch and K E Giller (eds), CABI, Wallingford Keeley, J and Scoones, I (1999) ‘Understanding environmental policy processes: a review’, IDS Working Paper, no 89, IDS, Brighton Lal, R (1984) ‘Soil erosion from tropical arable lands and its control’, Advances in Agronomy, vol 37, pp83–248 Larson, B (1993) ‘Fertilisers to support agricultural development in sub-Saharan Africa: what is needed and why?’, Center for Economic and Policy Studies Discussion Paper, 13, Winrock International, Morilton Lavigne Delville, P (1999) ‘Harmonising formal law and customary land rights in French speaking West Africa’, Issue Paper no 86, Drylands Programme, IIED, London Mugwira, L M and Murwira, H K (1997) Use of Cattle Manure to Improve Soil Fertility in Zimbabwe: Past and Current Research and Future Research Needs, CIMMYT, Harare Noordwijk, M van (1999) ‘Nutrient cycling in ecosystems versus nutrient budgets of agricultural systems’, pp1–26, in E Smaling, O Oenema and L Fresco (eds), Nutrient Disequilibria in Agroecosystems: Concepts and Case Studies, CABI, Wallingford Piha, M I (1993) ‘Optimizing fertilizer use and practical rainfall capture in a semi-arid environment with variable rainfall’. Experimental Agriculture, vol 29, pp405–415 Reij, C, Scoones, I and Toulmin, C (eds) (1996) Sustaining the Soil Indigenous Soil and Water Conservation in Africa, Earthscan, London Sanchez, P A, Shepherd, K D et al (1997) ‘Soil fertility replenishment in Africa: an investment in natural resource capital’, Replenishing Soil Fertility in Africa, pp1–46, in R J Buresh, P A Sanchez and F Calhoun, SSSA, Wisconsin Scoones, I (1998) ‘Investigating soil fertility in Africa: some reflections from research in Ethiopia and Zimbabwe’, in L Bergström and H Kirchmann (eds) Carbon and Nutrient Dynamics in Natural and Agricultural Tropical Ecosystems, CABI, Wallingford, Oxon Scoones, I and Toulmin, C (1999) Policies for Soil Fertility Management in Africa, DFID, London Stoorvogel, J and Smaling, E (1990) Assessment of Soil Nutrient Depletion in Sub-Saharan Africa, Winand Staring Centre, Wageningen Tiffen, M, Mortimore, M and Gichuki, F (1994) More People, Less Erosion, Environmental Recovery in Kenya, John Wiley, Chichester Toulmin, C (1997) ‘The Desertification Convention’, in F Dodds (ed), The Way Forward: Beyond Agenda 21, Earthscan, London van der Pol (1992) Soil Mining, an Unseen Contributor to Farm Income in Southern Mali, Royal Tropical Institute KIT, Amsterdam Vogel, H (1994) ‘An evaluation of five tillage systems for smallholder agriculture in Zimbabwe’, Der Tropenlandwirt, vol 94, pp21–36 Woomer, P L and Swift, M J (eds) (1994) The Biological Management of Tropical Soil Fertility, Wiley, Chichester Worku, T (2000) ‘Stakeholder participation in policy processes in Ethiopia’, Managing African Soils, vol 17, IIED, London World Bank-FAO (1996) Recapitalisation of Soil Productivity in Suh-Saharan Africa, World Bank, Washington DC/FAO, Rome
20
Social Visions of Future Sustainable Societies Patricia Benjamin, Jeanne X. Kasperson, Roger E. Kasperson, Jacque L. Emel and Dianne E. Rocheleau
All manner of social issues receive short shrift in the debates on ‘environment and development’ and ‘managing the global commons’. Family life, community, stratification and individual dignity and fulfilment all suffer from varying degrees of neglect, while international security, nature/society relations, economic alternatives and processes of social change are badly in need of new theories. To the extent that the discussion is couched in terms of sustainability, the emphasis has been on reconciling ecological sustainability (planetary life support) with economic sustainability (continued economic growth), while social sustainability (creation of conditions for community and individual well-being) is generally ignored – or equated with economics, which is almost as bad. Social sustainability, we should note at the outset, does not mean the continuation of existing social structures but, rather, creation and maintenance of the conditions for creativity, empowerment, self-determination and self-actualization. Research, both past and present, reflects this imbalance. For example, in a 1989 World Future Society publication, most of the items absent from a list of issues deemed important by a panel of 17 prominent American futurists are social in nature (Coates and Jarratt, 1989, pp24–25). Current research shows little change: for example, global environmental change is widely construed as a serious global problem with human causes (ICSU, 1987; IFIAS, 1987; IGES, 1999; ISSC, 1989; Jacobson and Price, 1991), yet the International Human Dimensions Programme has a tiny budget compared with the science-based International Biosphere-Geosphere Programme, a dichotomy largely apparent in the national global change research programmes. In general, little funding is available for collaborative, international, long-term social science research, and the funding allocated to policy work is usually for specific policy problems rather than for understanding more broadly human-induced environmental Reprinted from Benjamin P, Kasperson J X, Kasperson R E, Emel J L and Rocheleau D E. 2001. Social visions of future sustainable societies. In Kasperson J X and Kasperson R E (eds) Global Environmental Risk, Earthscan, London, pp467–507.
394 Enabling Policies and Institutions for Sustainable Agricultural and Food Systems
change. The assessments by the American Council for the United Nations University (ACUNU) in the Millennium Project (Glenn and Gordon, 1999; State of the Future, 1997, 1998, 1999) show important gaps to be filled. This hesitation to engage social issues is perhaps understandable – ecology and economy alone are complicated enough (Daly, 1999); the social and political aspects, as emphasized throughout this volume, are often regarded as intractable and politically touchy; however, the price of ignoring them is high. Social issues are central to problems of environment and development, and are, in any case, worthy of attention in their own right. Social concerns are critical to environment and development issues in several ways. First, a number of authors, working on an array of environmental-degradation problems, have argued that these issues are fundamentally social in nature. For example, a ‘downward spiral’ linking poverty and environment is widely recognized (e.g. Durning, 1989; Kates, 2000; Kates and Haarmann, 1992; Leonard, 1989; Mellor, 1988); Blaikie (1985), Blaikie and Brookfield (1987), and Blaikie et al (1994) argue that land degradation is a social problem, related to a ‘simple reproduction squeeze’ (e.g. Bernstein, 1979). Hunger can be viewed as a distribution rather than a production problem (e.g. Lappé and Collins, 1978; Lappé et al, 1998), as an entitlement problem (Sen, 1981), or as an outcome of political conflicts (Chen, 1990); a few decades ago, it was viewed as a population-control problem (e.g. Ehrlich, 1968). To the extent that any of these observations are accurate, social as well as economic and environmental factors will determine whether clashes of environment and economy can be resolved. Second, leaving aside momentarily the thorny problem of implementation, if policy makers do attempt directly to reconcile environment and economy, they still face the task of anticipating or identifying institutions, political structures, value systems and lifestyles that are consistent with the desired or necessary conditions. What kinds of social structures, belief systems, families, activity patterns, geographies and aspirations will be compatible with the environment/economy system they recommend? It is clear that merely making and attempting to implement policy does not necessarily result in actual social change, particularly given the tendency of the policy makers to take existing social structures and institutions for granted. Any changes in resource use, in the structure of the economy or in nature/society relations must all be implemented through the existing social system and will require major changes in that system. Relatively little is really known, however, about the sources and dynamics of social change, and even less under such conditions as global scale of impacts, rapid change, large populations, complex technologies, diverse and interacting cultures, and responses to subtle and systemic problems with long lag times. It is clear that societal initiatives or responses that work in some cultures do not work in others. These three concerns – global change as a social phenomenon, identification of social systems compatible with ecological and economic sustainability and the dynamics of social change – all point to the need for an integral social science engagement in
Social Visions of Future Sustainable Societies 395
any discussions of sustainable futures. Furthermore, it is clear that the talents of the entire spectrum of human knowledge and creativity – including all the social sciences and the humanities – are needed to address these issues. Discussion and reflection on the social implications at all scales of current trajectories and possible alternatives are sorely needed. The two overriding issues of where to go and how to get there, defined in social terms, need concerted and determined attention. To return to the role of planning in the context of ecological and economic reconciliation, although there is an argument that responsible public policy must try to manage key environmental dimensions, planning alone is not enough. Furthermore, it cannot be done in a social vacuum: neither rational environmental policy nor planned economic growth necessarily guarantees fundamental human rights such as livelihood security, freedom, dignity or opportunity; nor do they result in the maintenance of human values, cultures or communities; nor do they enhance human welfare, particularly for marginal or exploited groups. Securing such values must be a principal motive behind whatever planning does occur, and therefore cannot be the prerogative of current planners. The full plurality and diversity of values that exist in society must be mobilized to inform and guide policy making. This leads to a second (and much more critical) point – that social goals and considerations are, a priori, pre-eminent. After all, fulfilment of basic needs propels human material interactions with the rest of the planet: the entire economic system is supposed to be motivated by the enhancement of human welfare. And then there are the broader dimensions of individual and community experience to which people attach great importance – values and aspirations; our relations to each other and to nature; the need for meaning and fulfilment; the institutions through which we interrelate; avenues for creative expression; meanings, symbols, belief systems; in short, family, culture, religion, work, play, artefacts. Even if global economic planners and managers do devise an efficient, sustainable way to reconcile economic growth and ecological limits, what would that world be like and would anyone want to live in it? In addressing the future, it is equally possible to make a desirable, livable world the starting point, and to strive for resource use and economic systems that foster the attainment of that future. Do we eschew such an approach because of an assumption that everyone wants to live like uppermiddle-class North Americans or Europeans, but cannot, owing to resource limits and economic problems? If so, this is surely an assumption worth examining. Gandhi’s famous statement, reported by Tolba (1987), may be relevant here: when asked if independent India should be like Britain, he asked, ‘If it took Britain half the resources of the world to be what it is today, how many worlds would India need?’ It is a question of priorities. Social systems should not be forced to evolve from determinations of optimal capital, material and energy flows; rather, economic and material systems should be designed to support social ideals. Stating the same point differently, one can argue that it is no more ‘unrealistic’ to expect the economic system to adjust to human needs and ecological limits than it is to expect people to change in order to serve economic imperatives or to expect nature to continue to conform to economic demands.
396 Enabling Policies and Institutions for Sustainable Agricultural and Food Systems
Not that those are the only options, or even that the global capacity to design and implement ways for reaching solutions is well developed. There is little reason to suppose that change really occurs in this way – by top-down management – no matter what the priorities are. At the very least, this exploration needs to be interactive, so that thinking about the future environment and economy is continually tested against thinking about societal and spiritual aspirations. If the direction and weight of current discussion fail to match real priorities, this should be acknowledged and corrected.
Visions and a History of the Future If the preceding line of reasoning has merit, the envisioning of alternative futures is an urgent priority. Although ‘the concept of alternative futures has become the linchpin of current future thinking’ (Coates, 1989, p16), much of modern futurist thought has exhibited a very limited conception of alternative futures. Modern, formal futurism has a relatively short history. Modernists tend to assume that, until very recently, basic survival was an all-consuming endeavour, leaving little time for idle speculations, and that past societies were relatively unchanging and people expected the future to resemble the present and the past. A sense of human influence over one’s own destiny grew from the late Middle Ages onward (Polak, 1961, pp1, 33), however, until the positivists, religious and secular repression kept most Western minds fixed firmly on the past and the present (Adelson, 1989). The rapid technological advances of the industrial revolution, along with social changes brought by capitalism and by the revolutions of the late 18th century, raised obvious questions about the future of society (McHale, 1969), while Darwin and the geologists were expanding the magnitude of conceivable timescales (Alkon, 1987). The idea of constant social and material change has been slowly penetrating popular and official culture since the 1840s. It has influenced American government planning since World War I, as it influenced the Soviet Plans of the 1920s and 1930s (McHale, 1969). Forecasting came of age in World War II in the United States, leading to the development of a formal ‘science’ of futurism. In his The Image of the Future, Polak (1961) warned depressed, post-war Europe of the danger of living with no mental horizons beyond the present and of the need to envision alternate futures. Despite this broad view, modern futurism concentrated on narrow post-war military and corporate concerns such as strategic planning, R&D and marketing (Coates, 1989; Coates and Jarratt, 1989). Governments and corporations, whose ability to pay and high stakes made them easy clients, became the main constituencies (Adelson, 1989). In response to this narrow base of clients, formal futurism has largely abandoned imagery and social imagination and has embraced the technologies of social forecasting and cross-impact analysis. As Elise Boulding (1983) puts it: ‘Polak asked for visions. Futurists give blueprints.’ We return to some of these issues below.
Social Visions of Future Sustainable Societies 397
Despite its substantial shortcomings, formal futurism points to the importance of envisioning alternative futures. ‘Visions’ may be defined as stories of possible alternative futures (Anderberg, 1989; Nagpal and Foltz, 1995; Stokke et al, 1991). The process of forming them may be viewed as a purposeful strategic choice, as a tactic for moral suasion, or as an innate propensity of the human psyche. The first posture is exemplified by Gordon (1989, p26), who states that ‘without thinking about the future, we abandon our destinies to chance and the decisions of others’. Simmonds (1989) shares this view, arguing that, in order for institutions to get where they want to go, they must have a sense of where they are going and an ability to institutionalize problem solving. This is, perhaps, the inspiration behind the global modelling efforts of the 1970s (see below) and the various scenario-development and integrated-assessment efforts of the 1980s and 1990s (Morgan and Dowlatabadi, 1996; Rotmans and Dowlatabadi, 1998; Timmerman and Munn, 1997; Toth, 1995). Giddens takes a broader approach, denying that humans are condemned to be swept along by inevitable social forces and calling for the exercise of sociological imagination – being ‘conscious of the alternative futures potentially open to us’ (Giddens, 1987, p22). The second position generally appears in the context of empowering a specific social movement or project. Caldwell (1985, 1990), for example, adopts it in reference to environmental politics, arguing that scientific knowledge alone is ineffective in changing behaviour, because it provide[s] no comprehensive view of the future – or a route-map to reach it – that most people find plausible and persuasive. Rather, scientific knowledge must be converted into ‘a vision of the possible’, to be realized through a programme of action that enlists belief, a popular, political movement with ‘a vision of the possible that possesses a quasi-religious quality’ (Caldwell, 1985, pp195–196). Similarly, Malone (1988, p289) calls for ‘unleash[ing] the creative power of human reason’ to develop alternatives to nuclear annihilation and planetary environmental collapse; this may be ‘an unrealistic dream … but surely at least a vision – and from Proverbs we know “Where there is no vision, the people perish”’. The third position is an essentialist one, held by many futurists. The claim is that each person carries around a view of the world, built from everyday observation and interpretation, that is projected into the future (e.g. Stokke et al, 1991). According to Adelson (1989, p28), implicit ‘images of futures within which … intentions take shape and make sense’ are an inherent part of the human psyche which help form our view of the present and are necessary to purposive action. Therefore, neither individual nor group behaviour, culture nor politics can be entirely understood without understanding those images. A better understanding of human behaviour, and particularly its purposive aspects, entails dealing with the key role that images of futures play in shaping it (Adelson, 1989, p33). These images also have a pragmatic role, since they are essential to the ability of individuals, organizations or communities to compose actions, strategies and policies; to fit them into their context; and to give them meaning (Adelson, 1989, p32). Similarly, Elise Boulding (1983) argues that, from the individual to the societal level, images about ‘the not-yet’ are constantly generated. This imagery inspires
398 Enabling Policies and Institutions for Sustainable Agricultural and Food Systems
our intentions as we move toward that which we consider desirable. Innate human creativity allows the imaging of alternatives to the present. Despite repression of these images through social stress and socialization processes (such as education), ‘all folk experiment with new ways of seeing and doing. The mental imagery precedes the overt act. If this is normal human activity, then utopia-building, in the broadest sense of the word, is a normal human activity’ (Boulding, 1983). Taken together, these conceptions of social visions – empowering, inspirational/manipulative or universalistic – argue for the necessity and power of visions. Polak, taking a mixed idealist/materialist view of history, claims that such images play an active historical role. He argues that forming images of the future requires an awareness of the future, which makes possible a conscious, voluntary and responsible choice among alternatives. These images are constantly reformulated in a dialectical process between the image itself and the actuality of an unfolding future (Polak, 1961, pp1, 41–42). At minimum, it is clear that some people see a need for overall social visions to guide action – whether that vision is articulated as an artistic creation, a corporate plan or an ideal to guide policy deliberations. Such an enterprise has often been viewed as socially ambiguous. Modern futurism, although ‘more respectable than it used to be’ (Gordon, 1989, p21), is tainted by the shady aspects of other futuristic enterprises. Futurism gets a bad name from ‘mediums and hallucinogens and yuppie stockbrokers … turn[ing] over tarot cards and pork bellies’ (Adelson, 1989, p28). Serious rejection of the value of envisaging societal futures may be found in other quarters. There are some who, except for relatively narrow endeavours such as military or industrial strategic planning and technology assessment (Coates, 1989), see no need for visions, finding in technological optimism and progress a belief that things are already fine or getting better. Among the scientifically orthodox, any endeavour so explicitly dependent on imagination is automatically suspect. Among others, a distrust of unscientific, non-material and (possibly) elitist idealism has lingered since Marx’s day. An emphasis on historical specificity and dynamic process rather than static end point, and a claim that the future is unimaginable because it is impossible for those conditioned by present social conditions to conceive of that which will be produced by human beings not yet born acting under new conditions, have engendered disinterest or suspicion about whether the project of envisioning futures merits human struggle. Despite these views, it is essential to ponder goals and directions. Creating multiple visions – confronting a diversity of goals, values and structures – allows for ongoing clarification, communication, contestation and critique of alternate futures (Nagpal and Foltz, 1995). It also provides a forum for examining possible ramifications of current decisions, envisioned actions and proposed new pathways.
Social Visions of Future Sustainable Societies 399
Broadening the discourse Incorporating social visions into the discourse about the future would serve the purpose of explicitly introducing a number of ignored or neglected elements into the ‘managing the planet’ discusssion. In the process, it would also open up that discussion to critique and to much wider participation. Futurists and their clients have been accused of being motivated by goals of control and manipulation (e.g. Dublin, 1991); however, a number of more benign interests – such as concern for children and grandchildren, seeking information on future impacts in order to guide current actions, simple nosiness or curiosity – may also motivate the desire to know the future. Some of us want to know what life will be like after us, and how our time here affects what follows. For others, a deep spiritual connection with the Earth and its creatures, religious or ethical notions of stewardship, or a strong sense of responsibility for the Earth and its future, inspire concern. Still others harbour a deep respect for what has come before – a sense of history. All of these motives reflect a common desire to know what it would be like to live in various possible futures. Whereas such issues as population, energy, food, pollution and the like do tell us something about the constraints under which society is organized, they shed little light on the nature of lived human experience. Just as today’s statistics on coal mining, methane emissions or capital flows fail to capture the experience of most peoples’ lives, future scenarios limited to such factors constrain human inquiry, when we should be seeking to liberate and expand it. Whereas some specialists enter the futures discussion in such topics as material flows, atmospheric gases, capital investment, species richness, energy-conversion technologies, agricultural production or demographic profiles, and their results are a needed part of knowledge, such analyses are intrinsically unable to explore the nature of society and the human condition. How people will live, and how all these phenomena will be translated through societal institutions into factors affecting daily life and human dignity, remains opaque and unexplored. Understanding what some future circumstance might feel like not only provides empathy or human interest but also makes possible a holistic view, a demonstration of interconnections. Thus, ‘dispassionate’ social science is not the only, or even the most, valid element in the current discourse. In academic terms, a ‘passionate’ social science and a stronger voice for the humanities are needed. Finding diverse, rich and textured ways of expressing social visions – through literary or artistic means, for instance – can make the issues accessible to more people and can contribute to emancipatory assessment, humanistic orientation and democratic decision processes. The expansion of discourse into the areas of everyday life, tapping our concerns about our grandchildren and about the impacts of our present lives – and piquing our curiosity – can open the possibility of capturing and mobilizing popular attention to important issues, perhaps even enabling the Habermasian dialogue advocated by O’Riordan and Timmerman in chapter 14 of Global Environmental Risk (Earthscan, 2001).
400 Enabling Policies and Institutions for Sustainable Agricultural and Food Systems
Confronting modellers with issues derived from inquiry outside their bounds of analysis, propelling social choices and social possibilities onto the public agenda, and stimulating explicit thinking about alternative futures can all generate a more powerful knowledge as well as greater awareness of the consequences of present decisions and policies (or of passive acquiescence to them). Public dialogue, conducted through alternate social visions, may also help to clarify the fact that no particular technical, economic or environmental scenario is inevitable; that a particular set of variables or trajectories does not necessarily translate into a specific social scenario; and that futures (and risks) must be negotiated. Choice, not determinism, prevails. Viewed in this way, thinking about the future can have an empowering rather than a discouraging effect, and can form an important part of emancipatory global risk analysis. We have asserted that social concerns have been inadequately addressed in past research attempts at envisioning the future. The outstanding efforts of this type were the global models generated in the 1970s. To test this assertion, we turn our attention to an examination of the social content of this first generation of global models.
Global Models, Futurism and Social Visions Looking at global models A number of comprehensive efforts to predict the planetary future were mounted in the 1970s. Several factors spurred this work. Mounting concern over population, pollution and food supplies was expressed in an awakening environmental movement and in such books as Rachel Carson’s Silent Spring (Carson, 1962), Paul Ehrlich’s The Population Bomb (Ehrlich, 1968), Barry Commoner’s The Closing Circle (Commoner, 1971) and E. F. Schumacher’s Small is Beautiful (Schumacher, 1973). The use of the image ‘spaceship Earth’ by Kenneth Boulding (Boulding, 1973) and Buckminster Fuller (Fuller, 1969) acquired new power, owing to photographs of Earth taken from space and the moon. Developing computer technologies made possible the manipulation of large quantities of data about the present in the service of constructing plausible futures. Multiple global models appeared. Their distinguishing features included a global scale; a methodology based on extrapolation from the present; and a focus on the interactions among population, environment and economy. These models and their constituent features have largely defined the terms of the mainstream global environmental debate up to the current time. The emphasis has been on demography, resources, pollution and capital. Social commentary proliferated in the 1950s and 1960s (e.g. Bell, 1973; Fromm, 1955; Galbraith, 1958; Heilbroner, 1972; Marcuse, 1964; Riesman, 1950; Whyte, 1956), including reports on global futures from the likes of the Commission on the Year 2000 (AAAS, 1965–1967;
Social Visions of Future Sustainable Societies 401
Bell, 1969) and the International Peace Research Institute (Jungk and Galtung, 1969), and reports addressing the specific issues taken up by modellers [e.g. MIT’s Study of Critical Environmental Problems (SCEP, 1971) and the Ward and Dubos (1972) report for the 1972 UN Conference on the Human Environment in Stockholm] – yet the models, not the rich variety of research, were adopted as the defining voice of global environment and development issues. The discussion that follows centres on the models, partly because a new generation of global models is now being created [e.g. the various efforts at integrated assessment; the PoleStar project of the Stockholm Environment Institute, reported in Raskin et al (1998); and the Hammond (1998) analysis of the 21st-century scenarios]. In the early 1990s, Gordon Goodman, Director of the Stockholm Environment Institute, discussed with members of a Clark University group his plans for PoleStar, an analytic process for systematically exploring alternative futures to inform international efforts for coping with global environmental change. The centrepiece of this process as it has developed is an accounting device – the PoleStar computer-based tool, building upon the first generations of global models – that allows an ongoing exploration of global environmental change. The Clark group argued that a process such as PoleStar should include a component missing from the earlier modelling efforts – an explicit exploration of the social nature of future sustainable societies. Such an inquiry would begin with the desired human conditions and social structures, with processes aimed at fulfilling human development and dignity, and would proceed to elicit diverse social visions from a heterogeneous sample of creative thinkers. The outcomes would have tremendous value in their own right, but the process would also complement modelling of economic and physical phenomena, interacting with them by setting up a dialectic (missing from earlier models) in which diverse social arrangements would drive, be explicitly incorporated in, or be compared with, the models. The process would test not only model feasibility but also the modellers’ assumptions and implicit world visions (at least, those aspects of the visions capable of being modelled would be tested, thereby enriching the modelling process). The Clark group undertook an initial experiment, involving a review of the social content of the first generation of global models. As an aid in comparing the social content of the models, we constructed a set of attributes that (arguably) might be used to characterize a sustainable society. We sought to create a frame of analysis by which very different social visions could be compared (see below). This frame included some components typically treated (e.g. population) as well as some less-obvious attributes (e.g. equity, views of nature). A striking lesson of this process was the difficulty of creating an analytical approach that does not lose the richness of texture and interconnections among attributes or components. Previous listings of important qualities of social visions include everything from Maslow’s hierarchy of needs (Maslow, 1959) to transportation systems, from political change to individual spiritual fulfilment. Such a wide range of factors might help to begin to address questions such as those posed above – what it would be like to live in such a society, and whether anyone would want to do so. For the
402 Enabling Policies and Institutions for Sustainable Agricultural and Food Systems
sake of manageability, this wide sweep of characteristics was pared down to a limited set of variables that could be used to construct a comparative matrix. In the interests of ‘getting a handle’ on what we viewed as the multidimensional nature of social visions, however, we narrowed these wide-ranging themes to a set of somewhat conventional attributes (cf. Jessen, 1981, pp114–116), as well as several that are less conventional. Finding a balance – between having criteria that structure the analysis without overly structuring it – proved difficult. For the limited purpose of reviewing the global models, however, they proved useful in dealing with complexity.
The models We examined the reports of six global modelling efforts and one related environmentalist tract in an attempt to extract the social visions, if any, contained therein. The models are the two Club of Rome efforts, Limits to Growth (Meadows et al, 1972) and the update, Mankind at the Turning Point (Mesarovic and Pestel, 1974); Kahn and colleagues’ Hudson Institute rebuttal from the right, The Next 200 Years (Kahn et al, 1976); the Latin American rebuttal from the left, the Latin American World Model or LAWM (Bruckmann, 1976; Herrera et al, 1976), also known as the Bariloche model (Gallopin, 2001); Leontief ’s economic model for the UN (Leontief et al, 1977), and the Carter administration’s compilation of US government models in the Global 2000 report (USCEQ, 1980). The environmentalist report is Blueprint for Survival by Edward Goldsmith and the other editors of the Ecologist (1972). None of these models is explicitly social; they examine neither social structure nor the lived experience of people. All focus primarily on the economic and environmental implications of global development (Leontief et al, 1977), on the compatibility of economics and natural resources, and on demography as an input governing economics. The variables used are primarily those for which numerical data were relatively readily available. They all use basically the same variables – population growth, production, income, materials/energy consumption and sometimes pollution. Each model or report was created for a specific and limited purpose. In no case was the primary purpose of a model the elaboration of a social vision. The Latin American and UN (Leontief et al, 1977) reports make no claim to be anything other than economic models; the input–output structure of the Leontief model treats society as a ‘black box’. Other model reports specifically state that they do not address social issues, claiming, for example, to be explicitly ‘concerned with biophysical matters, as opposed to social, political, and economic developments’ (USCEQ, 1980, pp2, 275), and noting that ‘no formal model of social conditions’ is offered (Meadows et al, 1972, p174). Even Blueprint for Survival, which claims to offer a vision for a radically different and stable society, offers few specifics beyond a call for decentralization; its main emphasis is on resource conservation and a steady-state economy. Its section
Social Visions of Future Sustainable Societies 403
on ecological disruption is primarily devoted to denouncing technology, while the discussion of social disruption is limited to northern social pathologies such as crime, drug abuse and suicide. Similarly, the Second Club of Rome model includes ‘group’ and ‘individual’ strata in each regional model but the model results are concerned with the usual issues – population, food, energy and income. [Nor does this change in the more optimistic second-generation treatment; see Meadows et al (1992)]. A preliminary examination forces acknowledgement of the non-social nature of these models. The reports are dominated by a concern with material and readily quantifiable issues. Although the models are, in some sense, views of the future, their anchors in current data, extrapolations therefrom, and moral or political judgement about the result leave the reports with the distinct flavour of the present. In so far as they have social concerns, these seem to centre around an exploration of limits or material and economic breaking points, rather than an exploration of the nature and qualities of human institutions, values or experiences. They ask what limits of stress this society can endure and what will make this society collapse; they do not ask about intrinsic cultural and individual qualities, about human experiences or about that which is valued. As such, they provide little or no guidance to the central directions by which people can create dignity, liberation or fulfilment or how these may be possible in different nature–society settings.
Evaluating the Models As mentioned earlier, we formulated a set of criteria for social visions to characterize the essential features of a social vision and to provide a basis for comparing and evaluating the models. We agreed that the overall social vision created by an author or research group could be characterized in terms of scope, bias, scale, tone and vantage point, among other qualities. Within the vision, major spheres of concern – human/nature relationships, material concerns, social organization and value systems – could then be analysed. The specific variables we selected include the following: view of nature, view of human nature, view of time, valid modes of understanding, view of society and social goals, agent of change, population, equity, relative rights and responsibilities of individual and society, political organization and authority, institutions, economic system and exchange, technology, lifestyle, spatial linkages and security. These categories may be loosely grouped as philosophical assumptions, social organization and material arrangements (see Table 20.1).
404 Enabling Policies and Institutions for Sustainable Agricultural and Food Systems Table 20.1 Attributes of social visions Philosophical assumptions • • • •
view of nature view of human nature view of time valid modes of understanding
Social organization • • • • • • • • •
view of society and social goals agent of change population equity relative rights and responsibilities of individuals and society political organization and authority institutions lifestyle security
Material arrangements • • •
economic system and exchange technology spatial linkages
The social content of the models The results of analysing the models using this framework are summarized in Table 20.2. Several points should be noted. For many of the categories, ‘not addressed’ would be the most appropriate notation. If a diligent search of the text revealed even some small mention of the topic, however, it was considered an indicator of the authors’ attitude and incorporated into the matrix. As a result, we have in some cases characterized a model on the basis of a brief passage. Mesarovic and Pestel, for example, devote a brief space to their view of nature, waxing eloquent about human survival depending on living in harmony with the web of life. We have repeated these phrases in our characterization, for they express the explicit views of the authors; however, the overall tenor of their report and the model itself treats nature solely as a collection of resources. In other cases, where we found no specific mention in the text but an obvious characterization could be extrapolated from the overall tenor of the text, we have done so. None of the six models, for example, overtly expresses a conception of time, yet all implicitly treat it as linear. Organizing the attributes into the aforementioned loose categories – philosophical assumptions, social organization and material arrangements (Table 20.1) – permits some general observations. In the sphere of material arrangements, the models are fairly forthcoming, offering moderately detailed visions of economic and technological conditions and at least a general sense of spatial linkages. Philosophical assumptions are, for the most part, not explicitly addressed at all, but implied stances may in many cases be gleaned from the overal tenor of the text,
Mesarovic and Pestel (1974) Harmony; web of life; human survival; scarcity Basic goods; can change; do right thing
Linear w/ cycles; narrowing options; 50 years Holism; science; objective + subjective; science engaged; participation
Meadows et al (1972)
Resources; waste sink; scarcity
Culture; creativity, incentive = improvement; basic good
Mechanical; interval; open future; 70 years
Rational science; analyse, then manage; science engaged in morals
Nature
Human nature
Time
Valid modes of understanding
Rational; engineering; objective; science; morality
Linear: sequential developing progress; slowing change
Self-interest; incentive = struggle; satisfaction; test/stimulate; structure/ purpose; engineered
Warehouse; conquer; monitor; manage
Kahn, Brown and Martel (1976)
Culturally determined; may be many; science serves ecosphere
Not clear; critical point; industrialism as historical aberration
Part of nature; adaptation; natural law; community; belonging
System; complexity; stable; self-regulatory; predictable
Goldsmith et al (1972)
Analytical; rational; economic models; ideology
USCEQb (1980)
Not addressed; implied – Homo economus
Analytical; rational; economic models
Goodness; utilitarian
Garden; Gaia; resources
Clark and Munn (1986)
Analytical models
Linear
Rational; do right thing
Harmony; resources
Brown (1981)
Science; Rational interdisciplinary; surprises; linear argument for non-linearity
Linear; future Linear; as extrapola- holistic tion of present; narrowing options
Not addressed; implied – part of nature
Economic Life support; factor; resources resources; waste sink; not limiting
Leontief, Carter and Petri (1977)
Linear; history Linear open-ended and depends on human will; process as original
Not addressed; solidarity; progress
Resources
LAWMa Herrera et al (1976)
Table 20.2 Comparison of social attributes of first-generation global models
Stages; high morale; dynamism; consensus; smooth function
Positive images; individual; influence not choice
Rate high but declining; not a problem; economic development will slow growth; colonize space; 7–30 billion
Sustainable material and spiritual; cooperation; organism; can adapt
Homogeneous system to be managed; open future; participation; can set limits; leisure; freedom from struggle
Moral Individual or resources; society? values; gradual Values; internal crisis; ‘public figures’; ‘political leaders’
Out of control; Serious major threat by problem; 35 2050 years to fix
Society and goals
Agent of change
Population
Kahn, Brown and Martel (1976)
Mesarovic and Pestel (1974)
Meadows et al (1972)
Major threat; wealth will not necessarily slow; ZPG;d 3.5 billion maximum; halt immigration
Economic decentralization; conscious restructuring; education in new values
Stability not expansion; analogue of nature; system; hierarchical; functional
Goldsmith et al (1972)
Need to slow; economic development as precondition; focus on basic needs; urbanization
Not addressed; locus = property and production – structural changes
Goals = equity; produce for need not profit; social (not state) control
LAWMa Herrera et al (1976)
Table 20.2 (continued)
Not a big problem; wealth slows growth; economy can keep up
Not addressed; economic restructuring as implied driver
Development; wealth; employment; NIEO;c justice; rationality
Leontief, Carter and Petri (1977)
Major problem; reducing carrying capacity; 10 billion under ‘intensive management’
A problem but not too serious; still time 8–11 billion
Managers; also technological, institutions, research; having vision
Not addressed
Not addressed (explicitly); highly evolved system
Information; planning; analysis plus political will
Clark and Munn (1986)
USCEQb (1980)
Must stabilize at 8 billion
Individuals; having vision
Not addressed
Brown (1981)
Nation state; no world government; reduced competition; manipulative power; elite rule; public lacks expertise; democracy, if ‘republican virtues’ re-established
Nation state; global cooperation; reduced polarization
Not addressed; nationstate; define values then choose; participation
Political organization and authority
Decentralized; local, small scale; participation; peer pressure; only unstable society needs strong authority
Maintain social economic stability; restrain consumption, reproduction; provide goal structure – prestige
All share in market levers of control; individual struggle for meaning; individuals maintain morale
Not addressed; share global wealth and resources; change values
Basic needs; produce food; moral resources; behavioural restraint; trade-off of freedoms
Rights and responsibilities
Goldsmith et al (1972)
Gap to persist; Not inequity nor addressed; mal, healthy, implied goal moral
Kahn, Brown and Martel (1976)
Social goals: Narrow justice = basic income gap; needs we’re all connected
Mesarovic and Pestel (1974)
Equity
Meadows et al (1972)
International socialism; nationstate; participation
Basic needs; priority = needs; universal rights; work collectively
Main goal
LAWMa Herrera et al (1976)
Table 20.2 (continued)
Not addressed
Increased
USCEQb (1980)
Nation state; Not internally addressed; restructured nation-state LDC;e North surrender power to South
Basic needs; benefits of development
Main goal
Leontief, Carter and Petri (1977)
More of the same
Not addressed
Not addressed
Clark and Munn (1986)
Not addressed
Individuals responsible to shape society; emphasis on voluntarism
Need for redistribuon, not growth
Brown (1981)
Institutions
Mesarovic and Pestel (1974) Not addressed; institutions put information before public for action; institutions for global crisis prevention
Meadows et al (1972)
Institutions to constrain growth; humans will develop unknown institutions
Specialized; technocratic; impersonal; decline of family and community; innovation institutionalized; control of serendipity/ synergy; privatization; family, economic exchange superseded
Kahn, Brown and Martel (1976) Not addressed; ‘Movement for Survival’ Coalition
Goldsmith et al (1972) Nationstate; cosmopolitan world organization
LAWMa Herrera et al (1976)
Table 20.2 (continued)
Not addressed; institutions to close North–South gap
Leontief, Carter and Petri (1977) Institutions for long term; global environmental analysis
USCEQb (1980)
Better use of existing ones; formal and informal
Clark and Munn (1986)
Not addressed; emphasis on planning
Brown (1981)
Mesarovic and Pestel (1974) Organic model; cooperation; planning implied; restrained growth in North
Not cause or solution; useful; restrain by social concerns
Meadows et al (1972)
No-growth; services; human needs; planning implied; resource efficiency; balance of consumption/ population; surplus for arts and leisure
Not cause or solution; useful technofaith as diversion; shape by social need/ priority
Economic system and exchange
Technology
Good to control nature; main human resource; Faustian bargain
Growth for South to catch up; North model as universal; technology, institutional, morale as key; eventual slowing of demand
Kahn, Brown and Martel (1976)
Incompatible with stability; anti-ecological – simplifies complexity; hubris; increases vulnerability; should serve decentralization
Steady state; stock not flow resource efficiency; minimal disruption; local control; small scale; correspondence of economic/real costs/values
Goldsmith et al (1972)
Avert scarcity; prevent pollution; social control; progress essential
Scarcity = technopolity; human needs; socialist redistribution; social determination of needs; planning; eventual slowing of growth; growth not answer
LAWMa Herrera et al (1976)
Table 20.2 (continued) USCEQb (1980)
Narrow North–South gap; expand resource exploitation; pollution abatement
Solution available but politically constrained
Develop under- Decelerating growth used resources; NIEOc to close North–South gap; selfreliance; pollution abatement
Leontief, Carter and Petri (1977)
Brings environmental changes, good and bad
More of the same
Clark and Munn (1986)
Decentralized; soft-path renewables
Steady state; intragenerational welfare; durability; high-tech, high design; resource efficiency; conservation; labourintensive; generalization
Brown (1981)
Mesarovic and Pestel (1974) Standard of living, not just material; less materialism; conservation ethic; social, moral, organizational, scientific growth
Diverse regions; inter-regional cooperation; diversity key to survival, and to moral strength
Meadows et al (1972)
Art and leisure; leisure time essential for higher pursuits
Not discussed
Lifestyle
Spatial linkages
Homogeneity – ‘they’ become like ‘us’; modernism; links impersonal, business-like; urban/ suburban globe; huge economic scale
Useless work; hedonism; gaming, art, education, ritual, social interaction; secular with romantic, mystic counter-reaction
Kahn, Brown and Martel (1976)
Decentralized but linked; small scale; diverse rural/ urban mix; material self-sufficiency
Personalized; intimate; self-reliance; pleasure of community; non-materialistic; reintegrated work/ home
Goldsmith et al (1972)
Autarchy; North–South interconnected; economic complementarity
Not based on consumerism; rich to reduce consumption
LAWMa Herrera et al (1976)
Table 20.2 (continued)
15 political/ economic regions; regional interaction; international trade
Lower Northern consumption; higher Southern consumption
Leontief, Carter and Petri (1977)
Food, energy imports; use distant resources; unaware of environmental impacts
Not addressed
USCEQb (1980)
Region-toglobe links; global noosphere
Not addressed
Clark and Munn (1986)
Reversed global interdependencies; local self-reliance; population rural and dispersed; decentralized
Nonmaterialistic; simple, frugal; personal/ social development; integrate home/work; telecommuting and bicycles; rich/poor convergence
Brown (1981)
Disarmament; without reform, conflict will bring nuclear holocaust; confrontation = dysfunctional
Not addressed
Increased violence due to boredom; weakened Northern defences due to false sense of safety
Kahn, Brown and Martel (1976)
a. LAWM, Latin American World Model. b. USCEQ, US Council on Environmental Quality. c. NIEO, New International Economic Order. d. ZPG, Zero population growth. e. LDCs, Less-developed countries.
Security
Mesarovic and Pestel (1974)
Meadows et al (1972)
LAWMa Herrera et al (1976)
Internal Not disintegration; addressed chaos of industrial society; chaos leads to dictators, war; deviant behaviour absent; stable society
Goldsmith et al (1972)
Table 20.2 (continued)
Not addressed
Leontief, Carter and Petri (1977) Tension; vulnerable people; production system; vulnerability to climate change
USCEQb (1980)
Not addressed
Clark and Munn (1986)
No war; conflict and fear = environmental not military; UN peacekeeping
Brown (1981)
412 Enabling Policies and Institutions for Sustainable Agricultural and Food Systems
with ‘view of human nature’ being the most difficult to discern. The treatment of social organization is mixed. Equity, and especially population, are central issues in virtually all of the reports and are addressed in some detail. None of the reports, however, offers a comprehensive or coherent picture of social goals, processes, and relations: the attributes listed in Table 20.2 are a collection of brief and disparate mentions culled from the texts. The same scattershot approach involved in the models applies to politics and institutions, with the difference that these are at least recognized by the modellers as important topics – not that this recognition results in any comprehensive or systematic treatment. Finally, lifestyle and security issues generally receive brief mentions, but are not elaborated. Further generalizations may be gleaned from a more detailed look at each of the attributes. All of the models treat nature primarily as a bundle of natural resources. None of the reports includes an overt discussion of conceptions of time or notions of legitimate modes of understanding, but implicit in all of them is a linear view of time and a reliance on rational, analytical scientific thought and quantitative data. The models are fairly evenly split on whether individuals or society as a whole, values, or economic structure drive social change, but none of them explores this issue beyond the level of assertion. The reports also split on the issue of whether population is a problem. All models except those by Kahn et al (1976) and Goldsmith and colleagues (1972) state explicitly that equity is a major social goal, and the latter implies it. The notion of equity adopted is itself limited, focusing on the admittedly pressing issue of inter-generational equity and particularly apparent distributional inequalities among nationstates. On the other hand, the complexity of equity deliberations such as the valued goods to be distributed, the relevant populations used to structure analysis and the philosophical principles by which to define social justice receive scant attention. Those studies that propose means of achieving equity advocate economic growth (Kahn et al, 1976; Bruckmann, 1976; Leontief et al, 1977; Mesarovic and Pestel, 1974) or redistribution (Goldsmith et al, 1972, implied by Bruckmann, 1976; Herrera et al, 1976; Leontief et al, 1977). Most of the models advocate economic growth, although Meadows et al (1972) and Goldsmith et al (1972) oppose it, and Mesarovic and Pestel (1974) call for a different kind. With the exception of Kahn et al (1976) and Bruckmann (1976), all agree that technology is not the solution to environmental and economic problems, with Leontief taking a middle position. It is interesting to note that, except on the issue of equity, the positions taken by Kahn et al (1976) and the advocates of the LAWM model are the most alike: they agree that population growth is not a problem and that resources are not limiting; they advocate economic growth, believe in technological solutions and argue that environmental concerns are secondary to economic ones. As mentioned above, for those attributes (e.g. philosophical assumptions, social organization) central to a deeper understanding of society, the models take a haphazard approach, implicitly assigning peripheral importance to them. On the question of ‘human nature,’ for example, all but Kahn et al (1976) – who emphasize struggle
Social Visions of Future Sustainable Societies 413
and self-interest – imply a belief in the basic goodness of people. Little attention is given to the nature and goals of society or to the structure of the relationship between the individual and political society. Disparate details related to political organization and calls for international cooperation appear in the various reports, but issues of power, authority, conflict and security are generally not addressed at all, or are addressed only very briefly. The same is true for institutions – only Kahn et al (1976) really treat them at all, and their analysis is sketchy. The models make more mention of lifestyle, with many general calls for less materialism and more creative leisure activities, but this is for the most part left to individual decision making and not linked to social and economic structure or to broad social policies. Finally, spatial linkages, if treated at all, are discussed in general terms, such as degree of centralization and homogeneity, or in terms of North–South economic relations, despite the growing evidence of the importance of regional linkages to the global economy and social movements.
Model visions From these observations (and the details in Table 20.2), it is clear that – even using relatively conservative and conventional categories and giving the modellers the benefit of the doubt by extracting minor details and extrapolating from the tone of the text – the models fail badly to confront social or philosophical issues, much less to probe them in any depth. The modelling approach is based on quantitative analysis using largely linear extrapolations from the present. Its materialistic (as opposed to relational or experiential) bias results in an avowedly utilitarian approach and a largely managerial orientation. The resulting emphasis is on just a few variables – population, resources, pollution levels, technology and economy – with some speculations about their social meaning, in terms of wars, crises, international ‘tensions’, ‘overshoot’ or ‘collapse.’ Even within the mode of extrapolation from the present, little or no attention is given to current social trends, with the exception of growing global divisions between rich and poor. The major non-demographic social factors for which data exist – such as health, education and settlement pattern – receive minimal attention. Structural considerations related to politics, social norms, the organization of political economy and institutions are only peripherally and sporadically treated; issues such as human rights, cultural diversity, psychological fulfilment, personal relations and freedom are not addressed at all, and neither are environmental or psychological issues, such as the impacts of an increasingly artificial and homogeneous environment (Mumford, 1970, 37 ff ) and the social choice of reliability over resilience (Blaikie et al, 1994; Timmerman, 1981). The first-generation models performed the invaluable services of initiating discussion about possible economic and environmental futures; of taking a global instead of a national perspective; of treating the planet as a single, integrated whole; and of taking a long-term view. As our review demonstrates, however, the approach of these models was inherently limited by the specific rationality and methodology
414 Enabling Policies and Institutions for Sustainable Agricultural and Food Systems
employed. Global problems were approached as essentially economic and resource based, resulting in limited parameters of concern focused largely on material and energy flows. Population, and society in general, were seen as relevant only in so far as they generated (or were affected by) these flows.
Models: the second generation Efforts to look at the global environment/development picture have become more sophisticated in the 1980s and 1990s. The authors analysed several studies from researchers associated with the International Institute for Applied Systems Analysis (IIASA) and the Worldwatch Institute, applying the same list of attributes used to analyse the models. Table 20.2, above, includes the social visions contained in pieces written in the 1980s by Lester Brown (Brown, 1981; Brown et al, 1990) and by Clark and Munn (1986) on the prospects for a sustainable global future. The pieces examined demonstrate a more complex view than the models but share a similar focus. Like the modellers, Brown and his Worldwatch colleagues concentrate on population, resources and material/energy flows. Explicit social concerns are limited to an emphasis on lifestyle (presumably in industrialized countries) and the argument that individual behaviour can reduce demand on global resources. Broader social, organizational and structural issues are not addressed. The Clark and Munn piece differs from the first-generation models in its non-linear approach; greater concern with institutions; and the treatment of uncertainty, surprise and discontinuities in the generation of knowledge and its uses. The major concerns, however, remain population and resources, and no distinct social vision is generated. Although sharing a similar focus with the early models, these more recent efforts attempt to improve on earlier studies by acknowledging the role of uncertainty and surprise in projections and by experimenting with other techniques, such as backcasting and constructing future histories. The importance of surprise was emphasized by the failed projections of some of the early models, and has received significant recent attention (Glantz et al, 1998; Kates and Clark, 1996; Schneider et al, 1998; Toth et al, 1989). Global systems theorists have come to recognize that, for systems near thresholds of change, deterministic analysis no longer works as the system becomes unpredictable and stochastic elements predominate, and inherent indeterminism sets in (see, for example, Gallopin and Raskin, 1998). Research concerned with systems undergoing change must assume the prevalence of discontinuous changes and surprise and be more concerned with uncertainty than predictability. Perrings (1987, p11) distinguishes between ‘the probabilistic uncertainty that assumes away our inability to foresee the effects of our actions’ and ‘uncertainty before ignorance, novelty, and surprise … [arising] from the system’s existence in real, historical, irreversible time’. The time in question is, in Georgescu-Roegen’s terms, not time (the mechanical measurement of an interval) but rather Time (the continous succession of moments) (Perrings, 1987, p111). Whereas statistical prediction may have some relevance in time, it has none
Social Visions of Future Sustainable Societies 415
in Time. The probabilistic approach assumes the future to be a ‘stationary stochastic process’ in which a pre-image of the range of possible outcomes exists and various possible futures become rival hypotheses to be tested (Perrings, 1987, p113). But true uncertainty assumes an incomplete set of images of the future and denies that the future is knowable from the past. The Swedish work on ‘surprising futures’ (Svedin and Aniansson, 1987) and the IIASA project to develop ‘surprise-rich scenarios’ (Toth, 1995) are both attempts to address these concerns and to face head-on the major shortcomings of projections. Schneider and Turner (1995) hosted an Aspen seminar on surprises in global environmental change in 1994, aimed at identifying a rich panoply of types of surprise, an endeavour to which Kates and Clark (1996) have also contributed. Despite these helpful advances, the primary concern is still with population, economic growth, technology, energy use and agricultural production. Although much more detailed and sophisticated than earlier modelling efforts, and vigorously developed during the 1990s, the current second generation of models and their scenarios do not include social, cultural and institutional developments and they lack the requisite variety needed to capture possible worlds reflecting the dynamic interplay and different social and cultural groups (Thompson and Rayner, 1998). The models and scenarios still rely heavily on conventional socioeconomic indicators, such as population, energy production, SO2 and CO2 emissions, labour force, production capacity, industrial emissions, agricultural production, forest production, water demand – plus a long list of environmental indicators, although more social attributes are being worked into the impacts. Future histories, as in Beyond Hunger in Africa (Achebe et al, 1990), are richer and explore a wider range of concerns, including cultural ones. Meanwhile, the process for developing integrated assessments also remains disputed; none of the second generation of models is being developed in close conjunction with the decision makers and others who will use them. As a result, they remain politically simplistic and naive and lack the flexibility needed to represent the interests of various interests and social groups over space and time (Rotmans and Dowlatabadi, 1998, p341). Several promising developments in the current global modelling efforts deserve mention. The 2050 Project undertaken by the World Resources Institute during the 1990s intentionally sought to broaden the social visions involved in alternative future worlds. So, in 1993, project members solicited nominations from a range of colleagues and the World Council of Indigenous Peoples and other NGO leaders to prepare essays envisioning positive futures for their regions or locales. Some 52 ‘envisionaries’ from 34 countries eventually submitted essays in five languages, with developing countries substantially over-represented. The results provide a highly suggestive tapestry of the potential richness of global visions (Nagpal and Foltz, 1995). Hammond (1998) also subsequently examined three scenarios, or worldviews, of the future which he entitled the market world – a world of rapid economic growth and technological innovation; a fortress world, in which future market failures create a future in which enclaves of wealth and prosperity coexist with widening misery, desperation and conflict; and a transformed world, where
416 Enabling Policies and Institutions for Sustainable Agricultural and Food Systems
greater sharing of power and fundamental social change transforms governments and institutions. In a separate effort, Costanza (1999) identifies four ‘future histories’ – ‘Star Trek’, a vision of technological optimism, free competition and unlimited resources; ‘Mad Max’, the technological scepticist nightmare come true, when technology and consumption go bad; ‘Big Government’, in which protective government policies override the free market; and ‘Ecotopia’, the low-consumption, sustainability vision. The PoleStar Project of the Stockholm Environment Institute, referred to above, has also sought a broader framework that includes the conventional IPAT (impacts = population × affluence × technology) drivers of change but also a broader array of social variables (international equity, national equity, welfare, conflict, poverty and political instability), designed to capture the ‘interlocking crises’ of concern in the Brundtland report (WCED, 1987). PoleStar identifies and analyses three archetypal scenarios of the future – conventional worlds, a class of scenarios that assumes that current global trends play out without major discontinuity or surprise in the evolution of institutions, environmental systems, and human values; barbarization, scenarios in which fundamental social change occurs but brings great human misery and collapse of civilized norms; and great transitions, in which fundamental social transformation occurs but a new and higher stage of human civilization is achieved (Gallopin et al, 1997). Events with the capability to redirect beliefs, behaviours and institutions away from some visions of the future and toward others are posited, as are sideswipes, major surprises (e.g. world wars, miracle technologies, pandemics) that greatly alter trends toward particular outcomes (Gallopin and Raskin, 1998; Raskin et al, 1998). Although these and other efforts of the 1980s and 1990s have come a long way in improving on the earlier models, mostly they are still bound by their focus on a limited set of traditional (if important) variables. It seems fair to conclude that the models have unduly set the terms of social and political debate, defining a sustainable global future largely in terms of population, resource and economic relationships. In other words, the debate and the ongoing work in integrated assessment, with several notable exceptions, remain unduly limited in social content and visions. In this regard, the explicit attention by Robinson in chapter 15 [of Global Environmental Risk, Earthscan, 2001] to identify social principles of sustainability is a step in the right direction, as are the use of differing cultural perspectives by the RIVM group in The Netherlands to enrich the underlying assumptions of integrated assessment (Asselt and Rotmans, 1996) and the efforts of the US Interagency Working Group on Sustainable Development Indicators (1998). In envisioning alternative futures, in short, the net needs to be cast to include a larger array of ideologies, religions and cultures but also historians, anthropologists and humanists; of course, some of these will generate dark views of the future (Kaplan, 1994).
Social Visions of Future Sustainable Societies 417
The ideology of futurism Although global models have largely set the stage and defined the terms for current debates on global futures, the formal ‘science’ of futurism represents the primary institutionalized means for peering into the future. Most futurists have concentrated on the specific interests of their clientele rather than on broad social alternatives or long-term global futures. This professionalized and institutionalized version of the futurological endeavour has attracted substantial criticism of the narrowness of vision. One critic equates futurism with the institutionalization of prophecy (i.e. forecasting) in an ‘attempt by self-appointed experts to rationalize the future’ and to impose their own narrow, mechanistic worldview. The prophetic endeavour – and its tendency to reflect the needs of corporate, military and state institutions – trivializes and depersonalizes the future, ignores diversity as too difficult to capture and control, and produces restricted visions that attempt to monopolize the future in the hope that it will resemble the present status quo (Dublin, 1991, p248). Critics early on noted a restriction of the range of alternative futures discussed; an ethnocentric preoccupation with a single society (an idealized, post-industrial North America); as well as tendencies towards technological determinism, mystification and over-quantification; a readiness to apply technical fixes to social problems; and an uncritical acceptance of the status quo (Miles, 1978). The net effect is to empower further the already powerful, to perpetuate an interpretation of the world that serves particular interests and to frame problems so that only certain options are considered (Miles, 1978). The critics demand a close scrutiny of futurist ideologies – an explicit identification and evaluation of ‘what is being sought, by whom, and for what purposes’ (Hoos, 1983, p61). Although some futurists have called for extension of the ‘futuristic mission farther into the social domain and toward a much larger constituency of stakeholders’ (Adelson, 1989, p31), such a ‘populist futurism’ may also be problematic. Although more participation might result in people having increased control over their own destiny and might produce futures more responsive to wider interests, the means to accomplish this ‘may be actually employed as manipulative tools for legitimating the status quo through pseudoparticipation’, exchanging fatalism for people’s participation in the management of their own exploitation (Miles, 1978, p81). Forecasting tends to minimize the intrinsic uncertainty of the future by attempting to reduce it to probability. It typically founders on the shoals of institutions and value systems. Although some futurists (e.g. Adelson, 1989; Simmonds, 1989) argue that current organizations no longer seem to work, most futurists work for existing institutions. Adelson (1989, p35) argues that futurists, instead of designing policies for existing organizations, should concentrate on a transition to new institutions, and that efforts to look to the future should be less bureaucratic and institutional and more ‘artistic, entrepreneurial, expressive, pragmatic, case-by-case, constructive … visionary’. Adelson (1989, p33) further advocates thinking from the
418 Enabling Policies and Institutions for Sustainable Agricultural and Food Systems
design disciplines, not the sciences – a sentiment echoed by Utopian theorists Manuel and Manuel (1979, p813) in their observation that architecture, not science, provides the most imaginative and authentically Utopian creations of the age. Another futurist points out that, in the chaotic context of changing value systems, forecasting is not very useful: ‘All we possess are remnants of previously demolished value systems … inconsistent collections of irreconcilable bits and pieces from the past’ (Michael, 1989, p82). Norgaard (1988, p613) describes this as the gradual demise of Progress – ‘a great carpet under which old beliefs and new contradictions were swept for centuries’ – and its likely replacement with the metabelief, Sustainability – the ‘clarion of a new age’. Faced with multiple, confusing and uncertain signals, individuals gravitate towards interpretations compatible with their personal worldview – a process that forecasts do not capture. Some futurists have themselves claimed that the prophetic endeavour, or forecasting, is inherently untenable when applied to society. Forecasting is meant to enhance coherence, but this is impossible in a modern society that is internally fragmented and increasingly incoherent – epistemologically, socially and psychologically (Michael, 1989, p79). For other futurists, a prescriptive or normative futurism offers an alternative to technocratic extrapolations of the status quo. Coates and Jarratt (1989), for example, advocate a prescriptive, ideological and ethical focus, calling for more emphasis on outcomes and less on driving forces. Others dismiss normative futurology as a ‘rapture of the future’ which, in the case of social prescription, ‘founders on the axiomatic “we’’’ (Kern, 1987, p216).
Alternative futures Underlying these criticisms of formal, mechanistic futurism and its traditional constituency is an association of the prophetic, predictive endeavour with goals of manipulation and control (e.g. Dublin, 1991). Such observations should serve not as reasons to disengage from all exploration of future possibilities but rather as warnings. We distinguish between a controlling futurism and the process of creating social visions. We need to eschew blueprints by which some groups control others; rather, we should create means for thinking through the consequences of current actions and for stimulating a sense of open possibilities, of wonder and of power to act. Although a desire for control serves as a powerful motive for peering into the future, it is not the only alternative: a sense of wonder or of responsibility may also serve as motives. A sense of wonder permits exploration of alternate possibilities while retaining a strong sense of humility toward the future – and the conviction that it will inevitably be more amazing than we can imagine. A sense of responsibility may guide attempts to add the consideration of long-range impacts to present actions, and it may inspire present activities to be conducted in a manner that leads to morally defensible future directions. Envisioning the future and emancipatory risk assessment should be conducted in such a way as to enrich empowerment and a sense of ability to create one’s own life.
Social Visions of Future Sustainable Societies 419
Alternative motivations are compatible with a diversity of social visions. Multiple visions encourage continuing clarification and communication, and contestation and critique of alternate futures; they also provide a forum for examining the possible ramifications of present proposals, decisions and actions. For multiple visions of alternative futures to flourish, it is necessary to bring diverse perspectives to the table. People operating from different basic assumptions will tend to articulate a multiplicity of social visions; those with alternative views of the present will tend to envision alternative futures. Only by such a multiplicity can there be real choice, or even meaningful debate.
Envisioning Alternative Futures We have asserted the desirability of an active and broad-based exploration of the widest possible range of imaginable futures. In the context of global environment and development concerns, the envisioning of alternative futures – and exploration of their implications for peoples’ lived experience – is an essential component of the hope for a sustainable world. Current processes of envisioning, the content of visions and the political frame for both imaging and images are incapable of creating a rich range of possible futures. Despite attempts at ‘backcasting’, as reviewed in Robinson and Slocombe (1996) and Mulder and Biesiot (1998), the modern approach to the future is symbolized by a technocratic and economic style and a narrow focus to global models and formal futurism. Social institutions, processes of social change, and human values and aspirations are still rarely at centre stage (but see Robinson et al, 1996a). The reliance on a single approach to examining possible global futures – modelling – has, in our view, promoted a narrowness and sterility in the imaging process. Complementary or conflicting images – derived from anthropology, novels or paintings, for example – have not yet become relevant to debates on global futures. Despite the goal of some modellers to initiate public debate and stimulate action (Rotmans and Dowlatabadi, 1998), current approaches have too often depicted securing the planetary future as a management challenge properly addressed by experts. An urgent need exists to enrich this debate by expanding both the content and the form of discussions about global futures. The process of envisioning and debating the future of the planet needs to be democratized and diversified, just as we need emancipatory risk analysis. There is a need to expand the debate into everyday life and to put everyday concerns on the agenda, but also for the discussion itself to become a part of everyday life rather than the exclusive domain of specialists. In the discussion to follow, we take the modest step of arguing for a broader content in social visions, an expansion that necessitates much wider participation. We argue for the legitimacy of multiple forms of communication, and use the
420 Enabling Policies and Institutions for Sustainable Agricultural and Food Systems
example of science fiction to illustrate the relevance of one non-academic, popularculture form of vision creation.
Broadening content and form Enriching the content of future visions and broadening participation may be addressed on several levels. Although the ideal is a wide-ranging democratic discussion – taking place in the world’s cities and villages, fields and marketplaces, bars and watering-holes, schools and workplaces, meetings and media outlets – even the confines of policy circles and academia provide ample scope for expansion.
Content: social science Although a few scholars in the social sciences have come forward to participate in discussions about environment and development or human dimensions of global change, many of the pertinent findings of the social sciences other than economics (e.g. sociology, anthropology, political science, human geography, psychology) are still not incorporated. It is not clear how existing research on cultural identity, social change, political cultures, nature–society relations, international politics or individual development can enrich our understanding of possible futures – a lack which is itself an indictment. The gap arising from the paucity of attention to prominent social science theory is compounded by the lack of attention to, or visibility of, less-known innovative voices outside the social science mainstream. Those whose views might expand the conventional range of debate, or who question hallowed assumptions, are usually not heard. People doing creative work on a number of theoretical fronts, who may not have published on the subject of planetary futures but who deal with relevant topics, could greatly expand notions of what is possible. For example, critical theorists and oppositional political economists have not chosen, for the most part, to apply their efforts to the economy, institutional structures, politics or social arrangements of alternative futures, nor have they always been effective when choosing to do so. An encouraging counter-example is the flourishing of a vigorous school of ecological economists, who have brought a new, valuable perspective to economic questions. In general, however, theorists outside the confines of conventional disciplines – such as bioregionalists and others concerned with regional and cultural diversity, contemplators of the meaning of place and technology theorists – conduct a largely unacknowledged parallel debate on environment and development. Beyond the realm of theory, reservoirs of experience have been generated in praxis across a wide spectrum ranging from applied social sciences (such as development, design, architecture, planning, appropriate technology) to social and political activism. A truly enriched debate, one that includes ‘passionate’ as well as ‘dispassionate’ social science, would draw from (for example) proponents of bottom-up development, decentralization, local self-reliance; from advocates for the
Social Visions of Future Sustainable Societies 421
disadvantaged and people confronting poverty; from activists for grassroots environmental action, for community empowerment, for indigenous rights – and any number of other sites of activism. The engagement of activists and the participation of those often left out of the discussion (and especially those vulnerable groups who may disproportionately bear global environmental risks) will broaden the set of questions to be asked. Visions generated from the bottom are sure to challenge the view from the top.
Content: humanities and popular culture Incorporating social science will bring neglected issues into focus, but the expansion of visions should not stop there. A broader conception should also include the humanities and even popular culture. Expanding the content of social visions to include a wide range of community and individual structures, relations, experiences and consciousnesses should draw on the richness found in literary, artistic, philosophical and spiritual expression. And just as visions drawing on the social sciences may gain from mainstream knowledge as well as the more innovative fringes and from the world of experience or praxis, both formal and informal expressions may contribute. Can the critiques of postmodernist philosophers and literary deconstructionists be directed toward the positive task of envisioning alternative social futures? Can work by ethicists, philosophers and religious leaders on questions of individual and societal values and aspirations, absent from much of the global-futures discussion, make a contribution? As with social science theory and praxis, there is value in the work of practitioners as well as that of critics in philosophy and the arts; in artists’ works and experiences as well as the theories of critics; in the experience of mystics as well as the concepts of theologians. Artists of all kinds can offer a diversity of communicative forms as well as creative new content. Not only may insights into individual and social meanings be derived from academic work in philosophy, history, literature and the arts; from the work of writers and artists, performers and composers; but it may also come from popular culture, traditional knowledge, folk wisdom, myths and prophecies. Work in rural development, in women’s studies and elsewhere has shown the value of folk and women’s knowledge (e.g. Richards, 1985; Rocheleau et al, 1996; Shiva, 1994). In the West, popular culture has been recognized as an important source for the expression of contemporary social values (e.g. Browne, 1984).
Broadening the pool of communicative forms In Western discussions about the planetary future, discourse has generally occurred in a single communicative form – scientific written texts. To the extent that an enriched and expanded envisioning process is desired, multiple forms of expression – including the qualitative, philosophical and artistic – must be encouraged. If the goal of creating holistic as well as reductionist, empathetic as well as objectified
422 Enabling Policies and Institutions for Sustainable Agricultural and Food Systems
visions, is a valid one, then personal as well as impersonal styles of communication and visual, oral or kinetic forms of expression are also legitimate vehicles for conveying these visions. In fact, different forms of expression will be inherent in some of the efforts, suggested above, to broaden the content of visions by including art, popular culture or traditional knowledge. Future visions abound, for example, in American popular and traditional cultures, such as science-fiction novels, short stories, comics and films; Hopi prophecies; post-apocalyptic rock videos; and television shows. Furthermore, as O’Riordan and Timmerman (chapter 14 Global Environmental Risk, Earthscan, 2001) show in their discussion of the paintings of Swedish energy futures, multiple forms of expression may also be used to gainful (and democratic) effect in the social sciences. Local non-governmental organizations (NGOs) and villagers in rural India have been using maps, models and time lines (made from local materials) to theorize the present and to imagine possible local futures (Mascarenhas et al, 1991). The Peace 2010 contest of the Christian Science Monitor received 1300 essays, written from the perspective of the year 2010, explaining ‘how peace came to the world’ (Foell and Nenneman, 1986). Policy exercises like those reported by Achebe et al (1990) use the literary device of alternative histories to construct alternate futures. The essays from diverse ‘envisionaries’ throughout the world as part of Project 2050 suggest the range of planetary futures that remain to be discovered and articulated (Nagpal and Foltz, 1995). Commentators from the South (e.g. Banuri and Marglin, 1993) see the roots of global environmental destruction in the power and violence inherent in the Western tradition.
Science, Imagination and Story Within science, the notion of ‘objective’ rationality, untainted by society, personality or values, tends to be a caricature. Indeed, many scientists have long noted the artificiality of divisions between science and imagination. Popularizers of physics have, for example, pointed out the dissolution of orthodox dualities (matter versus energy, observer versus observed) in the ‘new’ physics – a physics that explicitly acknowledges that a complete understanding of reality lies beyond the capabilities of rational thought. Statements by Einstein and others on the role played in science by serendipity, inspiration, creativity and a childlike sense of wonder speak to the same point. Although many scientists embrace qualities such as intuition and imagination, the mechanistic paradigm also survives, zealously protected by orthodox proponents with a tenacity likened by Lynn Margulis (1991, p213) to that of medieval monastic scholars. They reflect the relegation of intuition and imagination to the status of ‘other’ in much of Western society. Imagination is an ‘absolutely essential human faculty… If you truly eradicated it in a child, he would grow up to be an eggplant’ (LeGuin, 1979, pp41–42). This is
Social Visions of Future Sustainable Societies 423
because of ‘the mixture of realism and fantasy that lies at the psychic core of all humans’ and the key role played by fantasy ‘in the enlivenment and transformation of culture’ (Tuan, 1990, p444). In fact, a free but disciplined imagination may ‘be the essential method or technique of both art and science’ (LeGuin, 1979, p41). Storytelling is perhaps the most common imaginative expression. According to novelist Ursula LeGuin (1979, p31), stories are integral to human society: … [A] person who had never listened to nor read a tale or myth or parable or story, would remain ignorant of his own emotional and spiritual heights and depths, would not know quite fully what is it to be human. For the story … is one of the basic tools invented by the mind of man, for the purpose of gaining understanding. There have been great societies that did not use the wheel, but there have been no societies that did not tell stories.
The writer’s exploration of her own imagination taps into Jungian archetypes – the collective unconscious of deep, shared experience that makes possible aesthetic, intuitive and emotional (as well as rational) communication (LeGuin, 1979, p78). This type of communication – accessing multiple dimensions of experience – is precisely what we argue is missing from discussions of the planetary future. Story provides one avenue (among many) for achieving it.
Stories of the future: science fiction The accessibility and multidimensionality of the story medium serve both to promote a more democratic public discussion and to compensate for the failure of imagination reflected in the sterility of much existing debate about the future. Applied to the future, story adds participant observation to the available methodological repertoire. A fiction of the future, argues literary scholar Robert Scholes (1975), responds to Sartre’s call for literature to be a force for improving the human situation. Such a fiction combines entertainment and intellectual value – wedding idea and story, satisfying both cognitive (content) and speculative (narrative/escapist) needs, and providing suspense with intellectual consequences (Scholes, 1975, p41). Writers of such fiction produce imaginative models of the future, alternative projections that can give us some sense of the consequences of present actions and do so ‘with a power which no other form of discourse can hope to equal’ (Scholes, 1975, pp17, 74). Scholes asserts that what we need in all areas of life is more sensitive and vigorous feedback. A futuristic imagination ‘will inform mankind of the consequences of actions not yet taken. But it must not merely inform, it must make us feel the consequences of those actions, feel them in our hearts and our viscera. [This] imagination must help us to live in the future so that we can indeed continue to live in the future’ (Scholes, 1975, p16). In practice, science fiction is the primary literary genre seeking to accomplish these goals (although Scholes and other critics would deny that all science fiction
424 Enabling Policies and Institutions for Sustainable Agricultural and Food Systems
succeeds). In this visionary role, science fiction has served for decades as a nonacademic form of communication in envisioning a wide array of alternate futures. Although there is much to criticize in the genre – including occasional lapses into forecasting – its continued vitality hints at the richness of future visions already existing in society. It provides an excellent example of an existing cultural resource that should be welcomed into policy debates on alternative futures. Science fiction addresses themes relevant to debates on global futures, such as technology, environment and sociopolitical alternatives. Within the world of popular culture, science fiction has involved large numbers of people in a decades-long public dialogue (between authors and readers/fans) about the shape of possible future societies. This public conversation has utilized the power of the story form – a kind of power that the technical narrative of science lacks. By embracing fantasy, these stories achieve an imaginative range lacking in policy debates: they coax a suspension of disbelief, resulting in a creative expansion of the realm of the possible, and they demand emotional involvement. They are, therefore, able to access the multiple dimensions of personal and social experience and to provide an empathetic and holistic assessment of the possible future being envisioned. Science fiction is, of course, only one of many potential contributors to an enriched global futures debate, within the realm of story, in a Western popularculture context.
Conclusions We have emphasized the social content of future visions and the processes of their creation, calling for the ongoing creation of multiple visions by a broad and diverse array of participants. We have argued in favour of multiple ways of knowing and of diverse expressive forms. We have not, however, addressed the politics of vision creation – how to ensure a diversity of views (diverse in both content and form) and how to achieve wide participation – or the politics of turning vision into action. These are, obviously, enormously problematic. To acknowledge the constraints on the creation of multiple, diverse visions (let alone their implementation) is, nevertheless, not to deny the validity of the visioning enterprise. Currently, a newly globalized society is undergoing rapid political, economic and cultural shifts. Far from diminishing the validity of, or need for, social visions, chaotic times and conflicting values make them all the more necessary. By stimulating continuous broad-based discourse on alternative futures, the process of creating social visions offers choice and the chance to democratize thinking. The limited visions of alternative futures currently on the table need to be broadened in content to include any and all aspects of human life that various groups of people view as important. Employing multiple forms of expression or modes of discourse will bring not only richer visions but also wider participation and the recognition that envisioning is a dynamic process. In this endeavour, no vision is
Social Visions of Future Sustainable Societies 425
ever truly completed. There is no possibility of ‘One Ultimate Vision’. This is in line with the emancipated and democratic risk analysis which this volume seeks: we believe that it is worthwhile to ponder goals and directions. Visions of the future offer a means to think through the consequences of current actions: there are stimuli for creativity and the sensing of possibilities, and tools for broadening the range and sharpening the terms of debate on possible global futures.
References AAAS (American Academy of Arts and Sciences). 1965–1967. Working papers of the Commission on the Year 2000 of American Academy of Arts and Sciences. 5 vols in 6. Boston: Commission on the Year 2000, AAAS. Achebe, Chinua, Göran Hyden, Christopher Magadza, and Achola Pala Okeyo, eds. 1990. Beyond hunger in Africa: Conventional wisdom and an African vision. Nairobi: Heinemann Kenya. Adelson, N. 1989. ‘Reflections on the past and future of the future’. Technological Forecasting and Soil Change 36: 27–37. Alkon, P. 1987, ‘Origins of futuristic fiction: Felix Bodin’s Novel of the future’. In Storm warnings: Science fiction confronts the future, ed. George E. Slusser, Colin Greenland and Eric S. Rabkin. Carbondale, IL: Southern Illinois University Press, pp. 21–33. Anderberg, S. 1989. ‘Surprise-rich scenarios for global population, energy and agriculture 1975–2075’. In Scenarios of socioeconomic development for studies of global environmental change: A critical review, ed. Ferenc L. Toth, Eva Hizsnyik and William C. Clark. Research Report RR 89–4. Vienna: International Institute for Applied Systems Analysis (IIASA), pp. 230–279. Asselt, Marjolein B.A. van and Jan Rotmans. 1996 ‘Uncertainty in perspective’. Global Environmental Change 6, no 2 (June): 121–157. Banuri, Tariq and Frédérique Apfell Marglin, eds. 1993. Who will save the forests? Knowledge, power, and environmental destruction. London: Zed. Bell, Daniel, ed. 1969. Toward the year 2000: Work in progress. Boston: Beacon Press. Bell, Daniel. 1973. The coming of post-industrial society. New York: Basic Books. Bernstein, H. 1979. ‘African peasantries: A theoretical framework’. Journal of Peasant Studies 6: 420– 444. Blaikie, Piers M. 1985. The political economy of soil erosion in developing countries. London: Longman. Blaikie, Piers M. and Harold C. Brookfield, eds. 1987. Land degradation and society. London: Methuen Blaikie, Piers M., Terry Cannon, Ian Davis and Ben Wisner. 1994. At risk: Natural hazards people’s vulnerability, and disasters. London: Routledge. Boulding, Elise. 1983. ‘Shaping a viable future with our imaginations’. UNU Newsletter 7, no. 3: 8. Brown, Lester C. 1981. Building a sustainable society. New York: North and Co. Browne, R. B. 1984. ‘Popular culture as the new humanities.’ Journal of Popular Culture 17, no. 4: 1–8. Bruckmann, Gerhart, ed. 1976. Latin American world model: Proceedings of the second IIASA Symposium on Global Modelling, Baden, Austria, October 7–10, 1974. Laxenburg, Austria: International Institute for Applied Systems Analysis (IIASA). Caldwell, Lynton K. 1985. ‘Science will not save the biosphere but politics might’. Environmental Conservation 12, no. 3: 195–197. Caldwell, Lynton K. 1990. Between two worlds: Science, the environmental movement, and policy choice. Cambridge: Cambridge University Press.
426 Enabling Policies and Institutions for Sustainable Agricultural and Food Systems Carson, Rachel. 1962. Silent spring. Boston: Houghton Mifflin. Chen, Robert S., ed. 1990. The hunger report, 1990. Providence, RI: Alan Shawn Feinstein World Hunger Program, Brown University. Clark, William C. and Ralph E. Munn, eds. 1986. Sustainable development of the biosphere. Cambridge: Cambridge University Press. Coates, Joseph F. 1989. ‘Forecasting and planning today plus or minus twenty years’. Technological Forecasting and Social Change 36: 15–20. Coates, Joseph F. and J. Jarratt. 1989. What futurists believe. A World Future Society Book. Mt Airy. MD: Lomond. Commoner, Barry. 1971. The closing circle: Nature, man and technology. New York: Knopf. Costanza, Robert. 1999. ‘Four visions of the century ahead: Will it be Star Trek, Ecotopia, Big Government, or Mad Max? (technological optimism and skepticism)’. The Futurist 33, no. 6: 23–30. Daly, Herman E. 1999. Ecological economics and the ecology of economics: Essays in criticism. Cheltenham, UK: Edward Elgar. Dublin, Max. 1991 (© 1989). Futurehype: The tyranny of prophecy. New York: Dutton. Durning, Alan T. 1989. Poverty and the environment: Reversing the downward spiral. Worldwatch Paper No. 92. Washington DC: Worldwatch Institute. Foell, Earl W. and Richard A. Nenneman. 1986. How peace came to the world. Cambridge, MA: MIT Press. Fromm, Erich. 1955. The sane society. Greenwich, CT: Fawcett. Fuller, R. Buckminster. 1969. Operating manual for spaceship earth. Carbondale, IL: Southern Illinois University Press. Galbraith, John K. 1958. The affluent society. Boston: Houghton Mifflin. Gallopin, Gilberto. 2001. ‘The Latin American World Model (a.k.a. the Bariloche Model): Three decades ago’. Futures 33, no. 1 (January): 77–89. Gallopin, Gilberto and Paul Raskin. 1998. ‘Windows on the future; Global scenarios and sustainability.’ Environment 40, no. 3 (April): 6–11, 26–31. Gallopin, Gilberto, Allen Hammond, Paul Raskin and Rob Swart. 1997. Branch points: Global scenarios and human choice. PoleStar Series Report No. 7. Stockholm; Stockholm Environment Institute. Giddens, Anthony. 1987. Sociology, 2nd edn. San Diego: Harcourt, Brace, Jovanovich. Glantz, Michael H., D. G. Streets, T. R. Stewart, N. Bhatti, C. M. Moore and C. H. Rosa. 1998. Exploring the concept of climate surprises: A review of the literature on the concept of surprise and how it is related to climate change. ANL/DIS/TM-46. Argonne, IL: Argonne National Laboratory. Glenn, Jerome C. and Theodore J. Gordon, eds. 1999. ‘Special issue: The Millennium Project’. Technological Forecasting and Social Change 61, no. 2 (June): 97–208. Goldsmith, Edward, Robert Allen, Michael Allaby, John Davoll and Sam Lawrence. 1972. Blueprint for survival. Harmondsworth, UK: Penguin. Gordon, T. J. 1989. ‘Futures research: Did it meet its promise? Can it meet its promise?’ Technological Forecasting and Social Change 36: 21–26. Hammond, Allen L. 1998. Which world? Scenarios for the 21st century, Washington DC: Island Press. Heilbroner, Robert. 1972. An inquiry into the human prospect. New York: Norton. Herrera, Amílcar O., Hugo D. Scolnik, Graciela Chichilnisky, Gilberto C. Gallopin, Jorge E. Hardoy, Diana Mosovich, Enrique Oteiza, Gilda, L. de Romero Brest, Carlos E. Suárez and Luis Talavera. 1976. Catastrophe or new society? A Latin American world model. IDRC-064e. Ottawa, Ontario, Canada: International Development Research Centre. Hoos, Ida R. 1983. Systems analysis in public policy: A critique. Rev. edn. Berkeley: University of California Press. ICSU (International Council of Scientific Unions). 1987. The International Geosphere Biosphere Program: A study of global change. Paris: ICSU.
Social Visions of Future Sustainable Societies 427 IFIAS (International Federation of Institutes of Advanced Study). 1989. The human dimensions of global change: An international programme on human interactions with the Earth. Report of the Tokyo International Symposium on the Human Response to Global Change, Tokyo, 19–22 September, 1988. Toronto: IFIAS. IGES (Institute for Global Environmental Strategies). 1999. Climate Change Research Project: Discussion papers in FY 1988 for the design of effective framework of Kyoto mechanisms. Hayama, Kanagawa, Japan: IGES. ISSC (International Social Science Council). 1989. ‘Plan of action for research on the human dimensions of global environmental change’. Draft 3.1. Paris, 27 October 1989. Jacobson, Harold K. and Martin F. Price. 1991. A framework for research on the human dimensions of global environmental change. ISSC/UNESCO, 3. Paris: ISSC with the cooperation of UNESCO. Jessen, P. J. 1981. ‘The role of energy ideologies in developing environmental policy.’ In Environmental policy formulation, ed, D. E. Mann. Lexington. M.A. Lexington Books, pp. 103–123. Jungk, Robert and Johan Galtung, eds. 1969. Mankind 2000. Futures Research Monographs, no. 1. Oslo: Universitetsforlaget. Kahn, Herman, W. Brown and L. Martel. 1976. The next 200 years: A scenario for America and the world. New York: Morrow. Kaplan, Robert D. 1994. ‘The coming anarchy.’ Atlantic Monthly 273(2) (February): 44ff. Kates, Robert W. and William C. Clark. 1996. ‘Environmental surprise: Expecting the unexpected’. Environment 38, no. 2 (March): 6–11, 28–34. Kates, Robert W. and Viola Haarmann. 1992. ‘Where the poor live: Are the assumptions correct?’ Environment 34, no. 4: 4–11, 25–28. Kern, G. 1987. ‘News vs. fiction: reflections on prognostication’. In Storm warnings: Science fiction confronts the future, ed. Slusser, Greenland and Eric Rabkin. Carbondale, IL: Southern Illinois University Press, pp. 211–231. Lappé, Frances M. and J. Collins. 1978. Food first: Beyond the myth of scarcity, rev. edn. New York: Ballantine. Lappé, Frances M., J. Collins and Peter Rosset, with Luis Esparza. 1998. World hunger: 12 myths, 2nd edn. London: Earthscan. LeGuin, Ursula K. 1979. Language of the night: Essays on fantasy and science fiction. New York: Putnam. Leonard, H. J. 1989. Environment and the poor: Development strategies for a common agenda. New Brunswick: Transaction Books. Leontief, Wassily W., Anne P. Carter and Peter A. Petri. 1977. The future of the world economy: A United Nations study. New York: Oxford University Press. Malone, Thomas F. 1988. ‘A dance of death or a celebration of life?’ Environmental Conservation 15, no. 4: 289–290. Manuel, F. E. and F. P. Manuel. 1979. Utopian though, in the western world. Cambridge, MA: Harvard University Press. Marcuse, Herbert. 1964. The one-dimensional man. Boston: Beacon Press. Margulis, L. 1991. ‘Big trouble in biology: Physiological autopoiesis versus mechanistic neo-Darwinism.’ In Doing science: The reality club, ed. J. Brockman. New York: Prentice Hall, pp. 211–235. Mascarenhas, J., P. Shah, S. Joseph, R. Jayakaran, J. Devavaram, V. Ramachandran, A. Fernandez, R. Chambers and J. Pretty, eds. 1991. Participatory rural appraisal: Proceedings of the February 1991 Bangalore PRA Trainers Workshop. RRA Notes, No. 13. London: IIED. Maslow, Abraham. 1959. New knowledge in human values. New York: Harper. McHale, John. 1969. The future of the future. New York: G. Braziller. Meadows, Donella H., Dennis L. Meadows and Jørgen Randers. 1992. Beyond the limits: Confronting global collapse, envisioning a sustainable future. Mills, VT: Chelsea Green. Mellor, John W. 1988. ‘The intertwining of environmental problems and poverty’. Environment 30, no. 9: 8–13, 28–30.
428 Enabling Policies and Institutions for Sustainable Agricultural and Food Systems Mesarovic, M. and E. Pestel. 1974. Mankind at the turning point. New York: Dutton. Michael, Donald N. 1989. ‘Forecasting and planning in an incoherent context’. Technological Forecasting and Social Change 36, nos. 1–2 (August): 79–87. Miles, Ian. 1978. ‘The ideologies of futurists’. In Handbook of futures research, ed. Jib Fowles. Westport, CT: Greenwood Press, pp. 67–97. Morgan, M. Granger and Hadi Dowlatabadi. 1996. ‘Learning from integrated assessment’. Climate Change 34: 337–368. Mulder, Henk A. J. and Wouter Biesiot. 1998. Transition to a sustainable society: A backcasting approach to modelling energy and ecology. Cheltenham, UK: Edward Elgar. Mumford, Lewis. 1970. The pentagon of power. New York: Harcourt Brace Jovanovich. Nagpal, Tanvi and Camilla Foltz, eds. 1995. Choosing our future: Visions of a sustainable world. Washington DC: World Resources Institute. Norgaard, R B. 1988. ‘Sustainable development: A co-evolutionary view’. Futures 20, no. 6: 606– 620. Perrings, C. 1987. Economy and environment: A theoretical essay on the interdependence of economic and environmental systems. Cambridge: Cambridge University Press. Polak, Frederick L. 1961. The image of the future: Enlightening the past, orientating the present, forecasting the future (2 vols.) Leiden: A. W. Sythoff. Raskin, Paul, Peter Gleick, Paul Kirshen, Gil Pontius and Kenneth Strzepek. 1997. Water futures: Assessment of long-range patterns and problems. Comprehensive Assessment of the Fresh Water Resources of the World, Background Report, 3. Stockholm: Stockholm Environment Institute. Raskin, Paul, Gilberto Gallopin, Pablo Gutman, Al Hammond and Rob Swart. 1998. Bending the curve: Toward global sustainability: A Report of the Global Scenario Group. PoleStar Series Report No. 8. Stockholm: Stockholm Environment Institute. Richards, Paul. 1985. Indigenous agricultural revolution: Ecology and food production in West Africa. Boulder, CO. Westview Press. Riesman, David. 1950. The lonely crowd. New Haven, CT: Yale University Press. Robinson, John (B) and D. Scott Slocombe. 1996. Exploring a sustainable future for Canada. In Life in 2030: Exploring a sustainable future for Canada, by John B. Robinson, David Biggs, George Francis, Russel Legge, Sally Lerner, D. Scott Slocombe, and Caroline Van Bers. Vancouver, BC: UBC Press, pp. 3–12. Robinson, John (B), David Biggs, George Francis, Russel Legge, Sally Lerner, D. Scott Slocombe and Caroline Van Bers. 1996a. Life in 2030: Exploring a sustainable future for Canada. Vancouver, BC: UBC Press. Rocheleau, Dianne (E.), Barbara P. Thomas-Slayter and Esther Wangari, eds. 1996. Feminist political ecology: Global issues and local experience. London; Routledge. Rotmans, Jan and Hadi Dowlatabadi. 1998. ‘Integrated assessment modeling.’ In Human choice and climate change, vol. 3: Tools for policy analysis, ed. Steve Rayner and Elizabeth L. Malone. Columbus, OH: Battelle Press, pp. 291–378. SCEP (Study of Critical Environmental Problems). 1971. Man’s impact on the global environment: Report of the study of critical environmental problems. Cambridge, MA: MIT Press. Schneider, Stephen H., B. L. Turner and Holly Morehouse Garriga. 1998. ‘Imaginable surprise in global change science’. Journal of Risk Research 1, no. 2 (April): 165–185. Scholes, Robert. 1975. Structural fabulation: An essay on fiction of the future. Notre Dame, IN: Notre Dame University Press. Sen, Amartya. 1981. Poverty and famine: An essay on entitlement and deprivation. Oxford: Oxford University Press. Shiva, Vandana. 1994. Close to home: Women reconnect ecology, health, and development worldwide. London: Earthscan. Simmonds, W.H.C. 1989. ‘Gaining a sense of direction in futures work’. Technological Forecasting and Social Change 36: 61–67.
Social Visions of Future Sustainable Societies 429 State of the Future. Annual. Washington DC: American Council for the United Nations University. Stokke, Per R., Thomas A. Boyce, William K. Ralston and Ian H. Wilson. 1991. ‘Visioning (and preparing for) the future: The introduction of scenario-based planning into Staf oil.’ Technological Forecasting and Social Change 40: 73–86. Svedin, Uno and Britt Aniansson. 1987. Surprising futures: Notes from an international workshop on long term world development. Stockholm, Sweden: Swedish Council for Planning and Coordination of Research. Thompson, Michael and Steve Rayner. 1998. ‘Cultural discourses’. In Human choices and climate change, vol. I: The societal framework, ed. Steve Rayner and Elizabeth L. Malone. Columbus, OH: Battelle Press, pp. 265–343. Timmerman, Peter M. 1981. Vulnerability, resilience and the collapse of society. Environmental Monograph No. 1. Toronto: Institute for Environmental Studies, University of Toronto. Timmerman, Peter M. and R. E. Munn. 1997. ‘The tiger in the dining room: Designing and evaluating integrated assessments of atmospheric change’. Environmental Monitoring and Assessment 46: 45–58. Tolba, Mostafa Kamal. 1987. Sustainable development: Constraints and opportunities. London: Butterworth Heinemann. Toth, Ferenc. 1995. ‘Practice and progress in integrated assessments of climate change: A workshop report’. Energy Policy 23, no. 4/5: 253–268. Toth, Ferenc, Eva Hizsnyik and William C. Clark. 1989. Scenarios of socioeconomic development for studies of global environmental change: A critical review. Laxenburg, Austria: IIASA. Tuan, Yi-fu. 1990. ‘Realism and fantasy in art, history, and geography’. Annals of the Association of American Geographers 80, no, 3: 435–446. USCEQ (US Council on Environmental Quality). 1980. 3 vols. The global 2000 report to the President. Washington, DC: USCEQ. US Interagency Working Group on Sustainable Development Indicators. 1998. Sustainable development in the United States: An experimental set of indicators. Washington DC: US Council on Environmental Quality. Ward, Barbara and Rene Dubos. 1972. Only one earth: The care and maintenance of a small planet. New York: North. WCED (World Commission on Environment and Development). 1987. Our common future. Oxford: Oxford University Press. Whyte, William H. 1956. The organization man. New York: Simon and Schuster.
Index
Compiled by INDEXING SPECIALISTS (UK) Ltd A–B cleavage 25–6 acceptance 75, 77 access to communications 241 services 192 Achebe, - 422 ACIAR see Australian Centre for International Agricultural Research Ackoff, R.L. 37, 40 action learning 290–9 action research 69, 83, 87 action-structure relationship 145 action systems 115, 119–22 activism in social sciences 420–1 actor-networks 140, 146, 150–1, 314–15 actors in participation 160–3 adaptive management 35, 39–40, 45, 207– 11 adaptive response to change 304 additionality concept 348 Adelson, - 397, 417–18 adoption of technologies 219, 255, 261– 80 see also technologies adult education 184–93, 217 see also education advertising 220 advisory communication 217–18, 226, 227–8 Africa 11–12, 109, 111, 119, 356–90 see also individual countries agency 137–40, 148–9, 151–2, 162, 166 agenda-setting 158–9 agricultural extension definition 219, 232 see also extension Agricultural Knowledge and Information System (AKIS) 231, 317 agricultural knowledge systems 231–4 see also knowledge agricultural sustainability definitions 5, 52–67, 307–8 recent impacts 109–10 spread of 1–2 see also sustainability Agriculture Act 1947 338 agri-environmental schemes 11, 337–55 Agritex, Zimbabwe 377–8
agroecology diversity 358–9 education 9–10, 290–9 agroecosystems 306, 317 agroforestry 111 see also forestry agronomy 52 Aguaruna people 210 Ahl, V. 44 AKIS see Agricultural Knowledge and Information System Allen, Patricia 57–8 Allen, T.F.H. 44 alley cropping 111 alternative futures 396–8, 418–22 America see Latin America; North America; South America; United States of America analytical methods 94–5, 105, 240 see also individual methods Anderson, B. 152 Andhra Pradesh, India 330, 333–94 application efficiency, nutrients 363 Arable Area Payments 345–6 Argyris, C. 126, 293 Asia 109, 119, 236–60 see also individual countries Asopa, V.N. 71, 73 associations, labour 331 attitudes 105 Auel, Jean 152–3 Australia 122, 261–2, 264 Australian Centre for International Agricultural Research (ACIAR) 262, 264, 269–70 authenticity of participatory methods 123 authority 36, 158–9, 166 autonomy 166 axioms 170–1 Bailey, A.P. 343 Bangladesh 7, 184–93, 332 banking industry 282 ‘banner’ approach 57–8 Barangay Ned Landcare Programme 262, 264, 266–79 barbarization scenario 416 Barzman, Marco 7, 184–93
Index 431 Bawden, Richard 4–5, 34–51, 54–5 Bebbington, A. 96 belief index 240–1, 246–8, 250, 252–4 see also faith Belshaw, C. 43 benefits analysis insecticide use reduction 248 production sustainability 60–1 rice-based systems 188–90 see also positive externalities benefit sharing 195, 208–11, 333 Benjamin, Patricia 12, 393–425 Bentham, Jeremy 59–60 Berhampur village 208 Berkes, F. 43, 47 Berry, Wendell 9, 281–9 ‘best technical means’ goal 311–12 Bevan, Digby 84 Bhutan 1 bioclimatic zones, India 196, 197 biodiversity 8, 194–213, 339, 342, 344, 352 biological systems 37, 38 biomass 202 biotas 22, 24, 26 biotic community 17, 20–5, 27, 34–5, 43 birds 20 Bithu, B.D. 83 blueprint research 86, 102 Blueprint for Survival (Goldsmith) 402–3 Bohm, David 46, 314 Bohr, Niels 314 Bolivia 103–4 bonding social capital 266, 277 Bortoft, H. 46 Bottrall, Anthony 84 Boud, D. 291 Boulding, Elise 396, 397–8 Boulding, Kenneth E. 39, 400 boundaries authority 159 systems thinking 42–3, 54 Brazil 2 bridging social capital 266, 277–8 Bromley, D.W. 345 Brouwer, Henk 165–6 Brown, Lester 405–11, 414 Bunch, R. 112 bunds 328, 329–30 bureaucracies 93, 97–9 Burke, Edmund 61 CADA see Command Area Development Authority Caldwell, - 397 California state 287–8 Campbell, A. 261 Campbell, Mora 65–6 canal irrigation 5–6, 69–89 cane-lands 17 Canon, W.B. 38 CAP see Common Agricultural Policy
capacity-building 226, 230 capital 161, 276, 362–5, 383–4 see also financial capital; human capital; natural capital; social capital CARE-Bangladesh 7, 184–93 Carlos, M. 152 Cartesian paradigm see positivism CDR see complex, diverse and risk-prone farming centralization food systems 287–8 institutions 98, 99 rural economies 282–3, 287–8 soil-fertility management 388–9 chaks 74–9 Chambers, Robert 5–6, 69–89, 93–107 change ecological 194–5 institutional 93–107 land pyramid 23 pest management approaches 236–60 responses to 304–6, 307 sustainable futures 394–6, 414 see also transformations; transitions change agents 223, 224 Checkland, Peter B. 40, 44, 316, 317 chemical alternatives 30, 32–3 Chilika lagoon 208–9 China 2 choice 95–6 Claassen, R. 348–9 Clark, - 405–11, 414 Clark University group 401 Claveria Land Care Association (CLCA) 263 climate change 303–4 climate zones, India 196, 197 clover 30, 31–2 Club of Rome global models 402, 403 CMDT area 372–4, 376–7 Coates, - 418 Cobb, D. 343 co-evolution 142, 164 cognitive authoritarianism 36 cognitive systems 5, 37, 41–8 collective action 190 collective analysis 120 collective memory 136, 137 colonialism 289 co-management 205, 207–11 Command Area Development Authority (CADA) 70–1, 82, 85 Common Agricultural Policy (CAP) 337–8, 343–6, 350 commons soil management 379–80 communication broadening forms 421–4 functions 225 innovation 217–35 media 236–60 services and strategies 224–31 Communication and Innovation Studies 232–3 communicative rationality 313
432 Policies, Processes and Institutions communities conservation 281–9 ethics 16–18, 20–5, 27–8 systems thinking 42 see also biotic community; rural areas community landcare groups 261, 263, 266–7, 269–70 community organizations, India 333 competency-oriented learning 296–8 complex, diverse and risk-prone (CDR) farming 100, 103–4, 106 complex systems 39–40, 45, 47 compliance policies 342, 344–6, 350–1 compost see fertilizers conceptualizations extension 217–24 sustainability 52–3, 55–6, 57–8, 65–6 conceptual research 234 conflict management 226, 229–30 conflicts 204, 238, 253 congruence 162, 163–4 conqueror role 16 consequentialism 63 conservation communities 281–9 compliance policies 342, 350–1 economics 20–1 education 18–19, 281–9 land health 25 People’s Biodiversity Registers 196, 204, 206, 209 soil and water 322–3, 325, 327–9, 331–2, 334 conservation farming 9, 261–80 Conservation Security Program (CSP) 351–2 conservation tillage 363 conservatism 284 constraints assessments 385 constructionism 10, 313–17 consultative participation 118, 119 context assessments 385 context-specific systems 120 contextualism 45, 47 continuous cultivation 267–9 contour farming 261, 263, 269–71, 276–7, 329 control of future societies 418 controls in irrigation studies 75–8, 82–3 conventional worlds scenario 416 convergence of projects 140–1, 160–2 Conway, G.R. 307 cooperative mechanisms 15–16 coordination of projects 158–60 co-production 142–3, 160–2 Corn Belt farmers 350 corporate farming 281–5, 288, 317 corruption 326 COSECHA study 112 Costanza, - 416 costs environmental compliance 344–6 farmer-first approach 104 insecticides 251–3 macroprojects 156–7
managing local externalities 332–3 People’s Biodiversity Registers 206 production sustainability 60–1 rice-based systems 186–7 soil erosion 322 spread of sustainable agriculture 1 transport 4 cotton farming 372–3 countryside concept 167 Countryside Stewardship Scheme 338 Cramb, Rob A. 9, 261–80 credit schemes 332, 367, 372, 373–4, 386 ‘crisis’ narrative 390 critical knowing systems 42, 44–5 critical reflection 291 crops alley cropping 111 canal irrigation systems 69–89 high yielding varieties 74–6, 78 insurance schemes 341, 344 Landcare Programme 269, 270–1 natural farming principles 29–33 rotation of 343, 350, 359 see also dyke crop systems; individual crops cross-compliance requirements 344–6 CSP see Conservation Security Program Cuba 1 Culasero, Z. 9, 261–80 cultivation alternatives 29, 30, 31–2 culture see popular culture dairy farming 162–6 Daley, J.M. 42 DAR see Department of Agrarian Reform DAS see days after sowing data collection methods 239–40 Landcare Programme 266–7 policy options 381–2 Datye, D.R. 82 Dave, K.M. 80 days after sowing (DAS), insecticide use 240, 243, 247–8 decentralization 98–9, 370, 378–80 decision-making 36, 219, 237 decision-oriented research 233–4 Defined Methodology approach 120 degraded land conservation 261 De Groot, Wouter 308 Delli Priscoli, Jerome 113 democracy 156, 157–8, 313, 323, 419–20, 425 demonstration effect 322 Department of Agrarian Reform (DAR), Philippines 267–8, 276 Department for International Development (DFID) 185 Department of Research and Specialist Services (DRSS) 377 descriptive definitions 220–1, 222–4 Desilles, Sylvie 7, 184–93 determinants of research 85–6 determinism 174
Index 433 devaluation 364–73 developing countries 1, 2 see also individual countries; resource-poor agriculture development agencies 6–7, 116–19 development aspirations 203–4 development opportunities 162–6 convergence 140–1, 160–2 coordination 158–60 extension 223 interaction 150–1 unfolding 136–7, 140, 146–9, 155 watershed subsidies 321–36 Devli, Vaidyonki 8, 201 Dewey, John 290, 291, 292–3 De Zeeuw, H. 306 DFID see Department for International Development Dhani village 202, 207 Dhanori Changa Piyat Sahakari Mandli 81 diagnostic analyses 72–3 diagramming methods 120–1, 122 dialogue methods 120–2 Dietz, T. 36 differentiated policy approach 3–4 diffusion of technologies 219 discontinuance of innovations 255 diseases 29–30 see also pest control/management disincentives, subsidies 326 disorganization in land 24 dissemination of innovations 224 distantiation 147, 148, 160–2, 172 see also spatial factors distortions to incentives 331–2 divergent modes of learning 295 diversification of agriculture 11–12, 184–93, 265, 356, 358–9 diversity see biodiversity Dobbs, Thomas L. 11, 337–55 Doli village 202, 206 Douglass, Gordon 57 dramatizations 239, 241–2, 249, 256–8 DRSS see Department of Research and Specialist Services dryland areas 324, 327–9, 358 ducks 31 duration of sustainability 60–1 Dworkin, Ronald 63 Dwyer, J. 346 dyke crop systems 187–8, 189–90 dynamic farming systems 356 eco-counties 2 ecological ethics 15–16, 18–19, 25–7 ecological knowledge 194–213 ecological sustainability 393–5 economics conserving communities 281–9 future societies 393–6, 402, 409, 412, 420 industrialized agriculture 64 Landcare Programme 275
land ethics 15, 20–1, 27 rice-based systems 188–9 social science impact 315 soil-fertility policies 364–73, 387 subsidies 323–5 sustainability 110 see also financial ... Economic Structural Adjustment Programme (ESAP) 371 ecosystems 38–9, 43, 196, 198–200 education 8–10, 217–99 agroecology 290–9 CARE-Bangladesh 184–93 conservation 18–19, 281–9 extension 217–35 land ethics 4, 18–19, 27 subsidized services 326 see also learning efficiency in nutrient use 363 electricity subsidies 324, 325 Ellis, F. 265 emancipatory risk analysis 418, 419, 425 empiricism 54–5, 62, 167–72 employment 268, 322, 329 see also labour empowerment 116–17, 184–93 enabling policies/institutions 10–12, 303–425 energy flows/circuits 23–4 energy use 113 Enlightenment thinking 218–19 environmental benefits, rice-based systems 189 environmental compliance 344–6 environmental costs of transport 4 environmental ethics see ethics environmental knowledge 34–51 Environmentally Sensitive Areas scheme 338, 348 environmental problems definition 308 envisioning see visions/visualizations epistemologies 41–8, 311–13, 315 equilibria in ecosystems 38–9 equity 407, 412 erosion see soil erosion Ervin, D.E. 347–8 ESAP see Economic Structural Adjustment Programme Escalada, M.M. 236–60 essentialism 397 ethics 4–6, 15–89 Ethiopia 358–9, 361–3, 366–72, 373–6, 378–9, 384, 386 European Union (EU) agrienvironmental policy 349–50, 352 agrienvironmental schemes 11 biota 24 Common Agricultural Policy 337–8, 343–6, 350 extension 217–18 multifunctionality concept 339–42, 347 see also individual countries evaluation by farmers 97 see also monitoring surveys evolution in nature 142, 164
434 Policies, Processes and Institutions evolving conceptions extension 217–24 land ethics 27–8 exchange of knowledge 226, 228 experiential learning 46–7, 291–3, 296 experimentation 96–7, 190 see also innovation expert systems 120, 138, 141–3, 166, 171–2 export-led policies 3 extension 8, 217–35 Bangladesh rice programme 191–2 constructionist thinking 315–16 definitions 218–24 evolving conceptions 217–24 farmer-to-farmer 333 institutional change 99, 101 Landcare Programme 263, 270, 275 research 233–4 science 232–3 soil-fertility management 362, 368, 375–8, 385 training 227, 233 external costs 322, 332–3, 344–6 see also costs external inputs impact 109 external validity 123 facilitation horizontal knowledge exchange 228 Landcare Programme 269, 270, 276–7 learning and action systems 120 sustainable agriculture 303–20 faith 138–9 see also belief index fall-back position 166 family farming 144, 332 see also small-scale farming fantasy 423–4 FAO see Food and Agriculture Organization Farmer Field Schools (FFS) 7, 184–93, 237, 250–2, 254 farmer-first approach 6, 93–7, 98–106 farmer practice see farming systems farmers’ organizations 103–4 farmer-to-farmer spread 228, 248–50, 333 farming systems agroecological diversity 358–9 dynamic nature 356 Landcare Programme 261–80 Farming Systems Research Unit (FSRU) 377 farm management communication 225–6 farm population, USA 281 Farm Security and Rural Investment Act 2002 350 fashions in research 85 feminism 65–6 fertilizers 29, 30–1, 372 see also soil fertility FEZ see Friese Ecologische Zuivelfabriek FFS see Farmer Field Schools fiction writing 423–4 field investigators 196, 198–200 financial capital 161, 276, 383 see also economics
financial subsidies 325–6, 332 see also subsidies fingerling sales 187, 190 fish/fisheries 187–90, 201–2, 208–9 Flora, C.B. 42 flow management, nutrients 361–3 folk knowledge 7–8, 194 Food and Agriculture Organization (FAO) 184 food chains 22–3 food systems 1–4, 287–8 food values 26 forecasting 396, 417–18 Forest Protection Committee, India 207 forestry alley cropping 111 land ethics 20, 25 local economies 288 natural farming 31, 32 policy failures 324 fortress world scenario 415 Francis, Charles 290–9 Friese Ecologische Zuivelfabriek (FEZ) 162–6 fruit trees 271–2 FSRU see Farming Systems Research Unit fuelwood 207–8 Fukuoka, Masanobu 4, 29–33 Fuller, Buckminster 400 Fuller, S. 36 functional integrity 5, 56–7, 59, 60–4, 66 functional participation 118 functions of communication 225 funding matters 85, 86 see also economics; financial capital; subsidies fungus 32 Funtowicz, S.O. 313 ‘future histories’ models 415–16 future-orientation 136–8 congruence 162 expert systems 141–2, 171 networks 149, 151–2, 154, 156–7 social visioning 393–429 see also past/present/future futurism 396–9, 400–3, 417–18 Gadgil, Madhav 7–8, 194–213, 324 Galjart, B.F. 141 Gandhi, Mahatma 395 gaps and linkage research 73–4, 85–7, 160 Gemeinschaft 136 General Agreement on Tariffs and Trade 285 General Systems Theory (GST) 38, 39, 42 genetic materials 96 Georgescu-Roegen, - 414 Gesellschaft 136 Giddens, A. 148, 152, 315, 397 giveaways 326, 329, 334 global change 394–5 global economy 283–5, 288 global-level soil-fertility strategies 389–90 global modelling 397, 400–19 goals in agriculture 165, 311–13, 316, 398, 406 Goethe, Johann Wolfgang von 46
Index 435 Goldsmith, Edward 402–3, 405–12 Goodman, Gordon 401 Goodwin, P. 344 Gordon, - 397 governance 8–10, 217–99 government intervention conservation 20–1 extension 220 macroprojects 156–7 People’s Biodiversity Registers 204, 205–6 water cooperatives 81 watershed development projects 321–36 see also intervention strategies Grameen Bank 332 grasslands 17–18 ‘great transitions’ scenario 416 ‘Green Box’ zone 347–9 Greenland 303–4, 313 Green Revolution 97–8, 322 groundwater 72 Group Learning Process 120–1 group methods 120–1, 261, 263, 266–7, 269–72, 275–9 Grove-White, R. 43–4 GST see General Systems Theory Guatemala 112 Guba, E. 123 Gujarat, India 69–74, 79–82 Gulati, A. 334 Habermas, J. 44, 313 habitat destruction, India 201 Haiti 111–12 Hammond, - 415–16 hard systems thinking 41–2, 44, 66, 307, 316–17 Hart, R.A. 126 Hasdeo Bango Project (HBP) 74–9, 83 Hawkesbury pioneers 307 HBP see Hasdeo Bango Project health of land 25–6 hedgerows 111–12, 261, 263, 269–71 Henderson, L.J. 38 Heong, K.L. 8–9, 236–60 herbal medicine see medicinal plants Herrera, - 402, 405–11 heuristics 237, 249 hierarchical systems thinking 39, 44 high-input agriculture 309–10, 364–5 high yielding varieties (HYVs), crops 74–6, 78 Himachal Pradesh, India 198–9, 201–2, 204, 206, 207, 211 historical perspectives 217–24, 398, 415–16 Hodge, I. 348, 349 Hoechst Marion Roussel India 209–10 holism 37, 38, 45–6, 315–16 Honduras 112, 252 horizontal knowledge exchange 226, 228 Hossain, S.M.A. 96 household-level factors 188–9, 273, 357, 359–60 Huan, N.H. 236–60 human capital 63, 265, 276, 278–9, 383 humanities’ role 394, 421
‘human nature’ concept 405, 412–13 human systems 39–40, 42 hunger-productivity relationship 309 Hutchinson, W.G. 345 HYVs see high yielding varieties ICRAF see International Centre for Research in Agroforestry ICRISAT 102 ideology of futurism 417–18 IER see Institut d’Economie Rurale ignorance-knowledge gap 293 imagination role 422–4 incentives extension 223 institutional change 100–1 participation for 118, 119 soil-fertility management 357 subsidy effects 325–7, 331–2 India bioclimatic zones 196, 197 canal irrigation systems 69–89 People’s Biodiversity Registers 8, 195–213 watershed development projects 2, 321–36 Indian Institute of Management, Ahmedabad 70–1 individual-level factors 15–16, 221, 225, 295 inducements see incentives inductive learning 294 industrialized agriculture 64 informational learning 45 information recording 195, 210–11 infrastructure management 367, 374–5 innovation adoption rate factors 255 communication 217–35 facilitation 305–7 Farmer Field Schools 190 learning and action systems 119 local externality management 332–3 paradigms 311–13, 315–16 rice pest management 238, 255 structure 153–4, 156–7 see also experimentation input/output (I/O) relations 173, 366, 371 input subsidies 328–9, 332 see also nutrient management insects/insecticides costs/sales 251–3 natural farming 29–30 rice-based systems 9, 186, 189, 236–7, 240–1, 243–55 inspirational knowing 47 Institut d’Economie Rurale (IER) 376 institutional clustering 156–8, 160 institutions analysis 388 capital investments 384 change 93–107 enabling 10–12, 303–425 global models 397, 408, 412–13 innovation 332–3 past/present/future 156–8, 160
436 Policies, Processes and Institutions People’s Biodiversity Registers 194, 205–7 professionalism 126–7 prophecies 417–18 rural communities 283 instrumental rationality 313 insurance schemes 341, 344 integrated area development 71 integrated farming programmes 2, 186–8, 364–5, 385–9 integrated pest management (IPM) 7, 184, 254 integration concept 147, 266, 277 intellectual property rights 210 intensification of agriculture 275–6 interactions extension role 223 farmer-scientist 97, 101–2 projects-networks 150–1 interactive participation method 118, 119 interface analysis 160–1 internal validity 123 International Agricultural Research Centres 102–3 International Centre for Research in Agroforestry (ICRAF) 263 international extension activities 217–18 International Rice Research Institute (IRRI) 263 international soil-fertility initiatives 381, 390 international trade agreements 284 interpretations 114–15 intervention strategies 219–25, 229–30, 233, 356–92 see also government intervention interviewing methods 120–2 Inuit people 303 I/O see input/output relations IPM see integrated pest management IRRI see International Rice Research Institute irrigation systems 5–6, 69–89, 324, 333 ‘islands of salvation’ 79–84, 87 ISNAR on-farm research 105 isomorphism 39 Ison, R.L. 222 Jackson, M.C. 37, 39, 40 Jamieson, Dale 57, 60, 62–3, 65–6 Jarratt, - 418 Jayaraman, T.K. 73 Jiggins, J.L.S. 306 ‘job creation’ strategies 283, 285 judgmental thinking 42, 54, 55, 58, 63 Juma, C. 96 justice 53, 57–8, 66 ‘just in time’ education 292 Kadana reservoir 69–70 Kahn, - 402, 405–13 Kahneman, D. 237 kambal trees 207–8 Karnataka State, India 198, 208–9, 211 Keen, M. 45 Kegan, R. 45 Kentucky state 17
Kerr, John M. 10–11, 321–36 Kitchener, K.S. 41, 45 Knorr-Cetina, K.D. 140 knowing systems 4–5, 34–51, 317 knowledge agricultural knowledge systems 231–4 change responses 304 competency-oriented 296–8 folk knowledge 7–8 horizontal exchange 226, 228 ignorance gap 293 Landcare Programme 272, 274 past/present/future 139–41 People‘s Biodiversity Registers 194–213 positivism 113, 115, 311–13 systems thinking 4–5, 34–51, 317 teaching paradigm 126 technological innovations 229 transformations 290–1 see also learning Kolb, D.A. 46–7 Koliary outlet 76–8, 83 Kuhn, Thomas S. 41, 115–16, 312, 313 Kuiper, D. 221 labour regularities 144 soil-fertility management 359–61, 384 subsidized 329, 331 see also employment Landcare Programme 9, 122, 261–80 land ethics 4, 15–28 land pyramid 21–5 land reform 370, 378–80 land tenure 369, 378–80 Latacz-Lohmann, U. 348, 349 Latin America 109, 119 see also South America Latin American World Model (LAWM) 402, 405–12 Law, John 160 LAWM see Latin American World Model leadership by women 190 leaf-feeding insects 9, 236–8, 240, 243–5, 249–52, 254 learning agroecology 10, 290–9 alternative systems 119–22 Bangladesh rice programme 191, 192 divergent modes of 295 extension 222 facilitation of 305 media materials 243 participatory processes 102, 109–34 People’s Biodiversity Registers 204–5 real life foundations 294, 296 systems thinking 5–6, 35–7, 45–7, 69–89 see also education; knowledge; training Leeuwis, Cees 8, 217–35 LeGuin, Ursula 422–3 Leontief global model 402, 405–12 Leopold, Aldo 4, 15–28, 35
Index 437 Lewin, Kurt 234 LGUs see local government units Lieblein, Geir 10, 290–9 lifestyles 410, 413 linkages 73–4, 85–7, 160, 266, 277–8 literature role 423–4 livelihoods approach 261–80, 383–4, 386 livestock farming 310, 345 living resources 194–5, 200–6 see also nature local communities 284–7 see also rural areas local externalities management 332–3 local food economies 287–9 local government units (LGUs) 271, 278 local-level soil-fertility management 388 Long An province, Vietnam 239, 242, 244–54, 256–8 Long, N. 148–9 López, G. 112 low external-input strategies 364–5 macro-policies 382, 385, 389 macroprojects 154–7, 168 see also megaprojects Madhya Pradesh, India 75 Mahanadi River Project (MRP) 74–9, 83 Maharashtra State, India 80, 200, 203, 329 Mahi-Kadana Project 69–74, 86–7 Mahi Right Bank (MRB) 69–74 Mai, V. 236–60 maize cultivation 268–9 Mala village 208–9 Malaysia 237–8 Mali 358, 360–2, 366–76, 379, 381, 386, 388 Malone, - 397 management practices 332–3, 356–92 see also individual practices manipulative participation 117, 118 Manuel, - and Manual, - 418 manure 31, 207–8 Margulis, Lynn 422 market failures 323–4 marketing 366, 371 see also promotion methods markets 138, 172, 323–4, 415 mass media see media materials distribution 239, 241–2, 254 global models 403–4 Maurya, D.M. 97 MBRLC see Mindanao Baptist Rural Life Centre Meadows, - 402, 405–12 measuring sustainability 55–6, 62 media approaches 236–60 medical schools 297 medicinal plants 194, 195, 201, 208–9 megaprojects 138–9, 154–7, 168 Mekong Delta, Vietnam 236–60 mentoring approach 297 Mesarovic, - 402, 405–12 meta-cognition 41, 46
methodology epistemic cognition 41 farmer-first approach 101–2 Landcare Programme 264–7 People’s Biodiversity Registers 195–200 rice pest management 238–41 see also individual methods Mezirow, J. 45–6, 290–1 Midgely, G. 40 Midwest region Agroecology programme 291–9 ‘mild’ sustainability approach 58 Mindanao, Philippines 261–80 Mindanao Baptist Rural Life Centre (MBRLC) 268, 271 mislearning in irrigation systems 5–6, 69–89 Mississippi valley 17 Mitchell, - 152 mobilization of resources 172–3 modelling systems 54–5, 66, 397, 400–19 modernization period empiricism 168–9 future-orientation 136–8 knowing systems 34, 36 structure 143, 153–4, 156, 159 variation/selection 140 modesty in innovation 153 Mohini Water Cooperative Society 79–82, 83, 84 monitoring surveys 239–40 see also evaluation by farmers Montana state 281–2 Moolya, Kunjeera 208–9 moral disincentives to subsidies 326 motivation 57, 65, 203–4 MRB see Mahi Right Bank MRP see Mahanadi River Project Mukerji, S.P. 81 multi-actor problematic situations 223–4 multidimensional soil-fertility management 382 multifunctionality 11, 337–55 Multiple Perspectives approach 120, 121 multiple visioning 398, 419, 424 multiplier effect 248–50 Munn, - 405–11, 414 NAIPD see Ned Agro-Industrial Development Project Nanj village 207 NAPRALERT 210 Narayan, D. 266 national agricultural research systems (NARs) 93, 98, 99, 102–3 national-level soil-fertility management 360, 379, 381, 382, 385, 389 natural capital 62–4, 383 see also nature natural farming principles 4, 29–33 natural resource management (NRM) 205–8, 324, 333 natural resources..., see also nature natural sciences 232–3 natural vegetative strips (NVS) 263, 269, 278
438 Policies, Processes and Institutions nature A–B cleavage 25–6 co-production 142 facilitating sustainability 306, 309–11 global modelling 404, 405, 412 People’s Biodiversity Registers 194–5, 200–6 rural livelihoods 383 social relations 39–40, 43 strong sustainability 62–4 systems thinking 34, 39–40, 42–3 Naurangdeshar Canal System 82–3, 84 Ned Agro-Industrial Development Project (NAIDP) 267–9 Ned Landcare Association (NLCA) 271 Ned Landcare Programme 262, 264, 266–79 negative externalities 344–5 see also external costs nematodes 32 Netherlands 167–8, 170–3 Netting, F.E. 42 networks 146–8, 150–2, 154–7, 160–1, 165–6, 314–15 New Mexico state 17 NGOs see non-governmental organizations Nitrate Sensitive Areas (NSAs) 345 Nitrate Vulnerable Zones (NVZs) 344–5 NLCA see Ned Landcare Association non-agency 149 non-economic benefits, rice systems 189–90 nonfarm activities 341, 342 non-governmental organizations (NGOs) 103–4, 196, 206–7, 210–11 non-substantive sustainability 56, 57–9, 65 Nordic region Agroecology programme 291–9 Norfolk Area Land Management Initiative 352 Norgaard, - 418 normative perspective extension 219–21, 224 institutional change 93, 97–9 past/present/future 136–8, 141 sustainability 65–6 Norsemen, Greenland 303–4, 313 North America 9, 17–19, 285 see also United States of America North American Free Trade Agreement 285 Norton, Bryan G. 43, 45, 54, 63 Norway 294, 297 Norwegian University for Life Sciences 294 NRM see natural resource management NSAs see Nitrate Sensitive Areas nursery management 277 nutrient management 361–3 see also soil fertility management nutritional benefits, rice systems 189 NVS see natural vegetative strips NVZs see Nitrate Vulnerable Zones objectivity 42, 44, 123, 311, 313–14 obligations in land ethics 19 observation methods 123, 272, 275 one-time soil recapitalization strategy 364–5 one-world economy 284
on-farm development (OFD) 70 on-farm research 105 ontology 54–5 open learning research approach 86–7, 102 open systems 38 optimization 60–1 orans 201, 202, 206 ordering process 137–42, 145–58, 160–1, 169 Oregan Health Sciences Hospital 297 organic farming 10, 26, 162–6, 290, 341–3 organisms in systems thinking 38 organizational arrangements 226, 230, 384, 387– 8 O’Riordan, - 399, 422 Orissa State, India 199, 202, 207, 208–9 O[strike through]stergaard, Edvin 290–9 Ostrom, E. 205 ‘otherness’ 43 outlet management 73, 76–8 outputs see input/output relations ‘outsider’ roles 94–7 Panchayat Raj 205–6 paradigms innovation 311–13, 315–16 sustainability concepts 56 parallel investigation methods 123–4 Parker, M. 294 participant checking 124–5 participation/participatory processes 6–8, 93– 213 futurist ideology 417 holism 46 interpretations of 116–19 Landcare Programme 261–80 multiple visioning 424 participatory learning 109–34 soil-fertility management 385, 388 subsidized 330–1 typology 117–18 Participatory Rural Appraisals (PRAs) 119, 195 passive participation 117, 118–19 past/present/future 136–83 Patil, R.K. 80, 82 payments agri-environmental schemes 340–1 local externalities 332 participation 330–1 stewardship 11, 342–3, 344–9, 351 see also subsidies PBRs see People’s Biodiversity Registers Peace 2010 contest 422 pedagogy ‘of no mercy’ 296 People’s Biodiversity Registers (PBRs) 8, 194– 213 ‘people’s’ participation 116–17 perennial crops 269, 270–1 Perrings, - 414–15 Perry, W.G. 45 personality factors 102 persuasive transfer 226, 230–1
Index 439 pest control/management 32–3, 236–60 see also diseases; integrated pest management; weed control Pestel, - 402, 405–12 pesticides 236 Pfeffer, J. 293 Philippines 9, 236, 253, 261–80 philosophy 5, 15, 52–67, 403–4, 412 physical capital 383 physics 422 pilot projects 79–84, 87 pine trees 31, 32 planning activities 238–9, 395 plant successions 17–18 ploughing practices 29, 30 pluralist strategies 102–4 Polak, - 396, 398 Polestar global model 401, 416 policies agri-environmental schemes 337–55 enabling 10–12, 303–429 future directions 356–92 generating through extension 226, 228–9 persuasive transfer 226, 230–1 social visions 393–429 subsidies 323–36 wider context 1–4 politics conserving communities 284–7 environmental compliance 345 facilitating sustainable agriculture 310 global models 407, 413 non-substantive sustainability 58 organization development 230 propaganda 220 subsidies 323 sustainability emphasis 394 polluter-pays principle 346, 351 pollution impacts 201 popular culture 417, 421, 423–4 population densities 25 global models 406, 412 US farms 281 positive externalities 344–6 see also benefit... positivism 37, 42, 112–16, 123–6, 311–13, 315 see also rationalism postmodernism 137–8, 141–3, 154, 156–8, 169 Potter, C. 344 poundage food-value 26 poverty reduction 264–5, 321, 334 practical approaches farmer-first approach 104–6 learning foundations 294, 296 People’s Biodiversity Registers 202 see also individual approaches PRAs see Participatory Rural Appraisals predators 20 preferential treatment 83, 84 present see past/present/future
pre-test-post-test research design 239–40, 243–51, 254–5 Pretty, Jules N. 1–12, 109–34, 266, 306, 337–55 prices insecticides 253 soil-fertility management 366, 371, 372 World War I 338 prioritizing environmental issues 35–6 private landowners 20–1 private traders 371 probabilistic uncertainty 414–15 problem-based learning 293 problem-in-context framework 308 problem-solving approaches 115, 219, 223–5, 227–9 production of food living resource impacts 200 local economies 288 mobilization of resources 173 multifunctionality concept 339–44 resource sufficiency approach 59, 60–2 rice-based systems 186–8 productivity of agricultural systems 184–5, 309 professionalism 125–8 profile studies 241 Project 2050 422 project-based approaches convergence 140–1, 160–2 coordination 158–60 farmer-first approach 103–4 FEZ example 162–6 interactions 150–1 see also development opportunities; individual projects promotion methods 261–80, 331–3 see also marketing propaganda 220 prophecies, institutionalized 417–18 protected areas 196 provider-gets principle 346, 351 psychological disincentives to subsidies 326 public relations 220 Punjab irrigation systems 83 pyramidal systems 21–5 qualitative/quantitative methods 239 quantum physics 314 questionnaires see survey methods Radcliff-Brown, - 152 radio broadcasts 239, 241–2, 249, 256–8 rain-fed agriculture see watershed development projects Rajasthan, India 82–4, 198, 201–2, 206 Rajasthan Canal 82–3, 84 random selection methods 240, 242 Rao, P.S. 84 RASE see Royal Agricultural Society of England rationalism 36, 313 see also positivism Ravetz, J.R. 313 realist-positivism 311–13, 315
440 Policies, Processes and Institutions realities constructionism 313–15 learning foundations 294, 296 ordering process 137–8, 140, 150–1, 154–5 recapitalization strategies 362–5 reclamation projects 24 recording information 195, 210–11 reductionism 37, 38, 112–13 reflective practice 291, 293 reflexive journals 124 reform of land 370, 378–80 regeneration of systems 56, 60–1, 64 regenerative agriculture 109–10, 309 regionalization policy 379 regression analyses 248 regularities I/O relations 173 ordering process 147 social sciences 143–5 relative factor prices 305 reliability of methods 123 replicability objective 329–30 reproduction see social reproduction research approaches 86–7, 102 communication for innovation 233–4 determinants 85–6 extension 233–4 soil-fertility management 362, 368, 375–8 sustainability emphasis 393 reservoirs 69–70 resettlement practices 370, 378–80 resource analysis 71–2 resource-conserving technologies 109–12 resource-poor agriculture 93, 97–9, 103, 106 see also developing countries resource sufficiency 5, 52, 56–7, 59–61, 62–4, 66 Revans, Reg 291 reversals 93–107 Rhoades, R.E. 96 rice continuous cultivation 268–9 diversified systems 184–93 dyke crops 187–8, 189–90 fish production 187, 188, 189–90 insecticides 9 natural farming 29–32 pest management changes 236–60 rights-based approach 63 risk analyses 161, 418, 419, 425 Robinson, - 416 Röling, Niels G. 10, 220–2, 230, 303–20 Rolston III, Holmes 55 rotational credit 332 rotation of crops 343, 350, 359 water 78–9 routinization of innovations 255 Royal Agricultural Society of England (RASE) 343 rural areas conservation 281–9 development 84, 337, 340, 342, 352
industrialized agriculture 64 infrastructure 367, 374–5 People’s Biodiversity Registers 194–213 soil-fertility management 367, 374–5, 379–80 subsidies 329 tourism 84 see also local communities rural livelihoods framework 264–9, 278–9, 383–4, 386 Russell, D.B. 222 Sachs, Carolyn 57–8 sales of insecticides 251–3 Salner, M. 45 SALT see Sloping Agricultural Land Technology sampling methods 120–1, 240 Sanghi, N.K. 321–36 Sarma, P.B.S. 72 Scherr, - 381 Schneider, - 415 Scholes, J. 316 Scholes, Robert 423–4 Schön, D.A. 293 science community concept 17 costs 104 extension 218–19, 232–3 farmer interaction 97, 101–2 sustainability 112–14 uncertainties 313 values 63–4 visioning futures 422–4 watershed development 327–8 science fiction writing 423–4 Scoones, Ian 11–12, 265, 356–92 SEARCA see Southeast Asian Regional Centre for Graduate Study and Research in Agriculture search and supply activities 99 seasonal factors, insecticide use 248, 253–5 seed production systems 186, 188 seed-sowing methods 31–2 selection concept 140, 143, 173–4 self-interest 18, 19, 21 self-mobilization 117, 118 Sen, Amartya 63 Senge, P.M. 294 service learning method 291 services communication 224–31 subsidized 326–7 see also support services SFI see Soil-Fertility Initiative Shilimb village 203 ‘sideswipes’ global model 416 Simmonds, - 397 single loop learning 126 Sinha, V.S. 80, 81 situated learning 293 size of farm regularity 144 ‘skeleton’ structures 145 skills in agroecology 293, 297–8 Skowlimowski, H. 46
Index 441 Sloping Agricultural Land Technology (SALT) 261, 263, 268 small-scale farming 282 see also family farming Smuts, J.C. 38 social actor network theory 314–15 see also actor-networks social capital 265–6, 275–9, 383 social change 394, 396 social cohesion 138–43 social justice 53, 57–8, 66 social learning 35, 45, 310–11 social networks 152 social objectives, multifunctionality 340–1 social organization 229, 403–4, 412 social practices 136–7, 151–2 social reproduction 61–2 social sciences Communication and Innovation Studies 232–3 facilitating sustainability 305–6, 315 time/structure 143–60 visioning sustainable futures 394–5, 399, 420–1 social sustainability 12, 393–429 social systems 64, 394–5 social visions 393–429 society–nature relations 15–16, 39–40, 43 socio-economic factors 357, 359, 387 see also economics soft systems methodology (SSM) 41, 44, 308, 315–17 soil and water conservation (SWC) projects 322–3, 325, 327–9, 331–2, 334 soil conservation Landcare Programme 263, 272, 276, 278 land ethics 18–19 SWC projects 322–3, 325, 327–9, 331–2, 334 see also soil fertility management soil erosion 23, 113, 269, 271–2, 322, 363 Soil-Fertility Initiative (SFI) 381–2 soil fertility management 11–12, 23–4, 26, 29–31, 271–2, 356–92 see also soil conservation South America 24 see also Latin America Southeast Asian Regional Centre for Graduate Study and Research in Agriculture (SEARCA) 264, 267, 269, 272, 278 Southwest America 17–18 see also United States of America spatial factors 144, 410, 413 see also distantiation spatial linkages 410, 413 SPEECH programme 334 spray frequencies, insecticides 243–6, 248–50, 253–5 Sri Lanka 113 Sriramappa, G. 321–36 Srishtigyan methodology 196, 197 Sriskandarajah, N. 115 SSM see soft systems methodology state intervention see government intervention stewardship 11, 337–55
Stocking, Michael 113–14 stock management, nutrients 361–3 storytelling 7, 171, 172–4, 422–4 strategic rationality 313 strategies communication 224–31 FEZ example 165–6 soil-fertility management 380–5 see also intervention strategies straw mulch 29–30, 31–2 strong sustainability 62–4 structural adjustments 364–73, 382 structure empiricism 169 land pyramid 23 ordering process 146–58 soil-fertility policies 364–73, 382 time factors 143–60 student-focused education 295 study sites People’s Biodiversity Registers 196, 197 rice pest management 238 subchaks 74, 78–9 the subjunctive 153 subsidies 10–11, 321–36, 344 see also payments substantive sustainability 58 sub-system level factors 38, 44–5, 61, 64 succession of plants 17–18 success measures, rice programme 192 Sukhomajri watershed project 333 support services agri-environmental schemes 350 community organizations 333 horizontal knowledge exchange 226, 228 multifunctionality concept 340–4 organization development/capacity building 226, 230 Surat, Gujarat 79–82 surprises 414–15, 416 survey methods 239–40, 242, 254–5, 266–7, 271–2 sustainability definitions 5, 10, 52–67, 110–12, 115, 307–8 encountering 53–7 future societies 393–429 importance 59–62 non-substantive 56, 57–9 recent impacts 109–10 scientific applications 112–14 social 12 sustainable agriculture see agricultural sustainability sustainable livelihoods framework 264–6, 383–4 SWC see soil and water conservation projects Swedish Agricultural University 292 Switzerland 1 symbioses 15 systemics 37, 38, 40, 120 systems thinking 4–6, 15–89 agricultural sustainability 52–67 facilitating sustainability 307–8, 315–17 social visions 395, 414
442 Policies, Processes and Institutions Tansley, A.G. 38, 43 T’boli people 267 teaching 126, 292, 293, 296 see also learning technologies extension 219, 226, 228–9, 230–1 farmer-first approach 6 future directions 356–92 Landcare Programme 261–80 positivism 113 resource-conserving 109–12 rice pest management 255 subsidized 326–8, 331–2 see also transfer of technology tenure, land 369, 378–80 theory-based education 296 Thompson, Paul B. 5, 52–67 three-dimensional thinking 41, 44, 45–6, 47 time factors canal irrigation systems 75, 77–8 global modelling 404, 405, 412, 414–15 soil-fertility management 382 structure 143–60 Timmerman, - 399, 422 Toffler, A. 36 tonnage food-value 26 TOT see transfer of technology Toulmin, Camilla 11–12, 356–92 tourism 84 trade-distorting policies 347–9 traditional societies 136, 138, 168–9 training extension 227, 233 Farmer Field Schools 250–1, 254 Landcare Programme 270, 271, 275, 276–7 survey methods 240 see also learning transaction costs 157 transferable skills 298 transfer of technology (TOT) 93–4, 99, 102–3, 312, 316 Bangladesh rice programme 191 extension 226, 230–1 transformational learning 45–7 transformations 290–1 see also change ‘transformed world’ scenario 415–16 transitions 1–3 see also change transport 4, 98–9, 374–5 transportation in land pyramid 23 travel allowances 98–9 trees 20, 31–2, 188–90, 207–8, 271–2, 324 see also forestry trials in irrigation studies 75–8, 82–3 triangulation of sources 124–5 Tripathi, B.L. 71, 73 Tromso[strike through] University, Norway 297 trust erosion of 313 macroprojects 155
participatory methods 122–5 social cohesion 141–2 tubewell water 73 Turing, Alan 111 Turner, - 415 Tversky, A. 237 UK see United Kingdom UN see United Nations uncertainties 115, 126, 164, 309, 313, 414–15 ‘undecidability’ theorem 111 unfolding of development opportunities 136–7, 140, 146–9, 155 United Kingdom (UK) 11, 185, 337–42, 343–9, 350–2 United Nations (UN) 389–90, 402 see also Food and Agriculture Organization United States of America (USA) agri-environmental schemes 337, 340–4, 347–52 agroecology education 291–9 conserving communities 281–9 energy needs 113 extension 217–18 land ethics 17–21, 24 see also North America universities 102–3, 217, 290–9 urban communities 285 USA see United States of America USCEQ global model 402, 405–11 use efficiency, nutrients 363 user groups, People’s Biodiversity Registers 202–3 utilitarianism 59–61, 63 Utopianism 418 validity of participatory methods 123 values food 26 land 27 science 113–14 sustainability 54–5, 58–9, 61, 63–4 trustworthiness 125 Van den Berg, H. 153 van der Ploeg, Jan Douwe 7, 136–83 Van Kessel, J. 153 Van Woerkum, C.M.J. 221–2 variance in yields canal irrigation systems 75, 78 rice-based systems 186 variation concept 140, 173–4 vegetable-rice systems 187–8, 189–90 Vickers, G. 42 Vietnam 9, 236–60 village-level diversity 358, 359–60 villagization policy 378–9 violence in land pyramid 24–5 virtual farmers 154–5, 170–1 virtual networks 151–2, 155–6 visions/visualizations 12, 120–2, 294–5, 393– 429 von Bertalanffy, L. 38, 39
Index 443 WADU programme 372, 376, 378 Wagemakers, M. Annemarie E. 10, 303–20 WAPCOS see Water and Power Consultancy Services warabandi 84 Ward, H. 266 Water and Power Consultancy Services (WAPCOS) 74–5, 78, 85 water cooperatives 71, 79–82, 83 water management adequacy of supply 309–10 energy circulation 23 environmental compliance 345 ‘islands of salvation’ 83–4 Mahi-Kadana Project 69–74 Naurangdeshar Canal System 82–3 participatory learning 119 SWC projects 322–3, 325, 327–9, 331–2, 334 see also irrigation systems; watershed development projects Water Management Synthesis Project (WMSP) 70, 72–3, 85–7 watershed development projects 2, 10–11, 321– 36 water supply see water management Water Technology Centre (WTC), Delhi 70, 71–3, 80, 85–6 weak sustainability 63, 64 Weaver, Professor 25 weed control 29–30, 31–2 weevil blight 32 welfare subsidies 322–3 well-being 59–61, 63
Western Europe 24 see also European Union Western Ghats Biodiversity Network Programme 196 wildlife 25–6 see also nature Wisconsin state 18–20 wisdom 194 see also knowledge W.K.Kellogg Foundation (WKKF) 306 WKKF see W.K.Kellogg Foundation WMSP see Water Management Synthesis Project women in agriculture 3, 190, 191, 192 Woodger, J.H. 38 Woodhill, Jim 122 Woolcock, M. 265–6, 277 workshops, pest management 238–9 World Bank 381–2 World Council of Indigenous Peoples 415 World Trade Organization (WTO) 347–9 World War I price controls 338 Worldwatch Institute 414 WTC see Water Technology Centre WTO see World Trade Organization yield effects canal irrigation systems 75, 78–9, 83 leaf-feeding insects 236 resource sufficiency approach 63, 64 rice-based systems 184, 186 Zimbabwe 358–63, 366–72, 374–5, 377, 380, 387–8