Statistics and Sociology 9780231890199
Presents in scientific form those statistics of population from the late 1800's which are of interest to the studen
174 104 25MB
English Pages 400 [416] Year 2019
Advertisement
Contents
Introduction
Chapter I. Statistics in the Service of Sociology
Chapter II. The Criteria of Statistics
Chapter III. Method of Study
Book I. Demographic
Chapter IV. Sex, Age, and Conjugal Condition
Chapter V. Births
Chapter VI. Marriages
Chapter VII. Deaths
Chapter VIII. Sickness and Mortality
Book II. Social
Chapter IX. Social Condition
Chapter X. The Infirm and Dependent
Chapter XI. Suicide
Chapter XII. Crime
Book III. Ethnographic
Chapter XIII. Back and Nationality
Chapter XIV. Migration
Book IV. Environment
Chapter XV. Population and Land (Physical Enyironment).
Chapter XVI. Population and Civilization (Social Environment)
Index by Topics
Index by Countries
Recommend Papers
![Sociology and Statistics in Britain, 1833–1979 [1st ed.]
9783030551322, 9783030551339](https://ebin.pub/img/200x200/sociology-and-statistics-in-britain-18331979-1st-ed-9783030551322-9783030551339.jpg)


- Author / Uploaded
- Richmond Mayo-Smith
File loading please wait...
Citation preview
SCIENCE
OF
STATISTICS
PABT I STATISTICS
AND
SOCIOLOGY
SCIENCE
OF STATISTICS
PAKT 1.
STATISTICS AND SOCIOLOGY
BT
RICHMOND MAYO-SMITH, PH.D. f B O F B S S O B or
P O L I T I C A L ECONOMY A N D SOCIAL IN COLUMBIA COLLEQB
Neto Jfotk M A C M I L L A N AND CO. AND
LONDON
1895 AÜ right» ratrvtd
8CIENCI
COPTEIORT, 1895, BT MACMILLAN AND OO.
NorinooS
JJhn*
J . 8. Cushinfr k Co. — Berwick & Smith Norwood U a m . U.S.A.
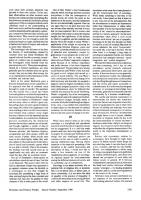
ADVERTISEMENT. THE present seems a favourable moment to present in scientific form those statistics of population which are of interest to the student of sociology and of economics, to the journalist and publicist, to those interested in social questions, and to intelligent men generally. The results of the great censuses of 1890 and 1891 in the United States, England, Scotland, Ireland, Germany, France, Austria, and India are now available. These data will not be superseded for at least ten years, nor is it probable that the next enumerations will be any more extensive or of greater sociological interest. For vital and criminal statistics we have the averages for 1871-90. This is a particularly favourable period, because the unification of Germany and of Italy marked the beginning of it, and there have been no great political changes since. At the same time, it has all the characteristics of modern life, — industrial development, commercial crises, migration, and intense social activity. Statistics based on averages for such a period, or following the changes from one phase to another, are of much greater interest than those of a single year, even the most recent. On the basis of this material, a systematic effort is made, in this volume, to present the statistics of population in such a way as to show their real significance. No figures have been v
vi
ADVERTISEMENT.
introduced unless they seemed to bear on the question in hand; while enough have been given to present each topic objectively. In this way the aridity of the ordinary handbook of statistics has been avoided, and also the temptation to use the material merely to support a particular thesis. The topical index is intended to make the volume useful as a dictionary of statistics. The index by countries will facilitate reference when it is desired to study the relations of various facts to each other in the same land. While the volume is not intended primarily as a manual of statistics, yet it is hoped that by means of the indexes it will be as easily manageable as the ordinary manual and much more suggestive. The author lays considerable stress upon the somewhat formal arrangement of the material under the heads, sociological purpose, statistical data, scientific tests, and reflective analysis. Its purpose is fully explained in Chapter III., on Method of Study. It has the further advantage that each reader can find that which is of immediate concern to him. The first and last divisions are of more general interest to the ordinary reader. The second presents the material in systematic form. The third (scientific tests) is intended particularly for the student (sociologist or statistician) who desires to know the exact value of his method and how it is to be controlled. An experience of some years in lecturing on statistics has convinced the author that training in statistical method is one of the most valuable as well as interesting disciplines for the student of sociology. It is hoped that this volume will serve as a text-book in the statistical laboratory which will soon be a necessary adjunct of the teaching of sociology in college and university. It has not been thought necessary to refer every particular statistical figure to volume and page of official publications,
ADVERTISEMENT.
vii
which would have multiplied references to such an extent as to have been wearisome and confusing.
T h e chief official
authorities are referred to whenever a new subject is introduced, and subsequent statements can be easily verified from the same documents.
Secondary authorities are indicated,
when used. Great care has been taken to verify all figures and to avoid errors in transcription and printing. course, that mistakes have not occurred.
I t is impossible, of The author will be
grateful for correction of such errors, and also to have his attention directed to what may be considered mistaken inferences. The present volume is issued as Part I. of a systematic Science of Statistics, and is intended to cover what is ordinarily termed Population Statistics.
The author has in prep-
aration Part II., Statistics and Economics, which will cover the statistics of commerce, trade, finance, and economic social life generally.
CONTENTS. INTRODUCTION. CHAPTER I. STATISTICS IN THE S E R V I C E OP SOCIOLOGY. FASZ
Sociology and social phenomena Difficulties of Sociology Classification of social phenomena Methods of observation The Science of Statistics . The service which Statistics performs for Sociology
CHAPTER THE
CRITERIA
OP
1 3 0 7
8 14
II. STATISTICS.
The nse of the statistical method
17
Collecting the material Arranging and tabulating the material Comparing the statistics Deducing statistical or sociological laws
19 22 24 20
CHAPTER M E T H O D OP
in. STUDY.
Sociological purpose
20
Statistical data Scientific tests Reflective analysis
31 32 36 ix
X
CONTENTS.
BOOK I. DEMOGRAPHIC. CHAPTER IV. S E X , A G E , AND CONJUGAL CONDITION. FAQI
Sociological purpose Statistical data: Sex. Sex in cities Population by age Military age Voting age School age . . . . . Average age of the living Conjugal condition Conjugal condition by age Scientific tests Trustworthiness of statistics of age Statistics of conjugal condition Reflective analysis
.
.
.
.
.
.
36 39 44 46 47 48 49 60 51 52 66 69 61 62
CHAPTER V. BIBTHS.
Sociological purpose Statistical data: Birth-rates Influence of climate, geographical position, and race . . . Density of population and birth-rate Birth-rate in city and country Births according to religious confession, social position, and occupation of parents Influence of war on the birth-rate Births and the price of food Births according to seasons Sex at birth The living and the still-born Multiple births Illegitimate births Scientific tests: Method of observation Basis for comparison . . . . . . . . . Question of the still-born Particular tests Reflective analysis
65 67 68 70 71 73 73 74 75 76 78 80 81 81 85 87 88 89
CONTENTS. CHAPTER
XI
VL
M a b b i a q b s . PAGI
Sociological purpose Statistical data: Marriage-rates Influence of climate and geographical position Marriages according to seasons Density of population and marriage-rate Marriage-rate in city and country Marriages according to race and religious confession . . . Influence of war on the marriage-rate Marriages and the price of food The probability of marriage Age at marriage Probability of marriage at different ages Probability of marriage according to conjugal condition ; by conjugal condition and age Mixed marriages between persons of different religious confession, race, or nationality Marriages between blood relations Fecundity of marriage Dissolution of marriage Dissolution of marriage by divorce Scientific tests: Method of observation Basis for comparison Particular tests Reflective analysis Marriage and population
03 95 06 97 97 98 99 99 100 101 103 107 100 110 112 112 110 118 119 121 122 123 124
CHAPTER VTI. D e a t h s .
Sociological purpose 128 Statistical data: Death-rates 131 Influence of climate and geographical position 132 Influence of race and religion 132 Density of population and death-rate 133 Mortality in cities 184 Death-rates in successive periods of time 136 Kffect of war on deaths 137 Influence of scarcity of food upon deaths 137 Influence of death-rate on birth-rate 139 Deaths according to seasons 140 Deaths according to seasons combined with the ages of the persons dyin^ 142
xii
CONTENTS.
Deaths according to sex Deaths according to age Infantile mortality Death« according to conjugal condition Accidental and violent deaths Deaths in the United States Scientific tests: Method of observation Comparison of death-rates Reflective analysis CHAPTER SICKNESS
AND
PAGF
.
.
.
.
.
142 143 144 140 147 148 148 149 152
VIIL MORTALITY.
Sociological purpose Statistical data : Statistics of sicknoss Accident insurance The statistics of disease International comparison of mortality from different diseases . Mortality according to occupations Duration of life Scientific tests : Methods of observation Duration of life : Comparative death-rates Average age of the dying . . . . . . . . . Average age of the living Reflective analysis
.
154 157 159 100 103 164 168 172 174 175 170 177
BOOK II. SOCIAL. C H A P T E R SOCIAL
(Families
and dwellings,
Sociological purpose Statistical data : Families Families of different size Dwellings Kind of dwelling
IX.
CONDITION.
education, religious confession, occupations.)
and 181 183 185 187 188
CONTENTS.
xiii PAGE
Education Religious confession Occupations Scientific tests Reflective analysis
193 197 199 203 206
CHAPTER THE
INFIRM
AND
X. DEPENDENT.
Sociological purpose Statistical data The blind, deaf-mutes, insane, and idiotic The blind The blind according to sex and age The deaf and dumb The insane and idiotic Double or triple misfortune Other physical infirmities Provision for the infirm Pauperism (Great Britain and Ireland) Sex, conjugal condition, and age (paupere) Pauperism in other countries Pauperism in the United States Scientific testa Reflective analysis
210 212 213 214 215 217 219 224 226 228 228 230 231 232 233 235
CHAPTER XL SUICIDE.
Sociological purpose Statistical data: The number of suicides Influence of climate and seasons on suicide Ethnological influences Social influences on suicide Influence of economic condition Suicide in cities Individual biological influence Influence of age Combination of age and sex Conjugal condition of suicides Motive for suicide
238 241 242 244 245 246 246 248 247 248 249 251
xiv
CONTENTS. rui 262 263 266
Method and place of suicide Scientific tests Reflective analysis CHAPTER XII. Cbixb. Sociological purpose Statistical data The kind of crime Particular crimes Influences on crime Influence of climate and geographical position Influence of the seasons City and country General social influences on crime Influence of religious confession Influence of social position Occupation and profession Illiteracy and crime Economic condition, scarcity of food, and war Individual biological influence Conjugal condition and criminality Motives for crime Penalties Habitual criminals Scientific tests Reflective analysis
269 263 260 268 269 270 271 272 273 274 274 275 276 277 277 278 279 280 281 283 288
BOOK I I I . ETHNOGRAPHIC. CHAPTER
Xin.
R A C E AND N A T I O N A L I T Y .
Sociological purpose Statistical data : Statistics of races Race in the United States Nationalities in the United States Foreign parentage
289 293 296 299 302
XV
CONTENTS.
PAGE
Intermarriage Scientific testa Reflective analysis
304 306 312 CHAPTER
XIV.
MLGILATIOY.
Sociological purpose Statistical data: Emigration Emigration and population Immigration in the United States Immigration according to race Nationalities Immigrants according to sex and age Occupation of immigrants Economic and social condition Causes of migration Balance of emigration and immigration Effect of immigration on population Immigration in other countries Internal migration Scientific tests Reflective analysis
BOOK
314 317 318 321 322 322 323 324 324 326 320 327 329 329 332 336
IV.
ENVIRONMENT. CHAPTER P O P U L A T I O N AND L A N D
XV.
(PHYSICAL
ENVIRONMENT).
Sociological purpose Statistical data: Density of population In Europe In the United States Distribution of population by topographical features . . . Distribution of population according to temperature, rainfall, humidity, and character of the soil Scientific tests Reflective analysis
341 343 344 346 349 361 363 366
CONTENTS.
xvi
CHAPTER P O P U L A T I O N AND C I V I L I Z A T I O N
The social environment Size of communities Colonial power Concentration of population in cities Wealth and social position Social environment and race The law of population Social environment and statistics Social environment and free-will
XVI. (SOCIAL
ENVIRONMENT). PASI
301 363 364 365 371 372 377 381 382
INDEX BY TOPICS
383
INDEX BT COUNTRIES
396
STATISTICS AND SOCIOLOGY. INTRODUCTION. CHAPTER
I.
STATISTICS IN THE SERVICE OF SOCIOLOGY. SOCIOLOGY is the science which treats of social organization. It has for object of research the laws which seem to underlie the relations of men in society. The second definition is no more comprehensive than the first. For by law we mean the ordinary empirical law, namely, the necessary connection which subsists between a phenomenon and the conditions under which that phenomenon exists. In formulating sociological laws, therefore, we are simply describing the facts of social organization and the way those facts are related to each other. If by synthesis of all the facts and relations we are able to arrive at any conclusions in regard to the ends of social organization or are able to detect the goal towards which changes in social organization seem to be leading and the successive steps in the line of progress, then we have a philosophy of society or a theory of social progress, which is also sometimes called Sociology. The fundamental thing, however, is the study of social phenomena or the facts of the social organization. For whatever our synthesis may be, it will depend for its B
L
2
STATISTICS AND SOCIOLOGY.
validity upon the correct analysis and interpretation of the phenomena. Sociology has not yet reached that stage of development where the discovery of some great central truth enables us to change from the inductive to the deductive method. What are social phenomena ? They are obviously the facts and relations existing in human life in society. They are not the same as the facts and relations of man's life simply as an animal. If they were, Sociology would be a branch of biology, and Darwinism would be as true of the social struggles of man as of the struggles of brutes. They are not simply psychological, for in many respects the action of the mass, society, is not explicable by the psychology of the individual. Since the individual man is an animal and has a mind, it is true, indeed, that Sociology is intimately connected with biology and psychology. The continuance of a society depends upon the reproductive powers of its individuals, and births and deaths are primarily pure physiological processes ; but births and deaths are influenced by many other things besides the laws of mere animal reproduction and survival. Psychology of the individual reveals the self-regarding motives; but they are not the only nor even the dominant motives which hold society together. Social phenomena are of their owu kind. The units which contribute to the social organization, unlike those which make up an animal organism, are endowed with sensibility and consciousness. In many cases, especially in the higher forms of society, they unite among themselves in a purely contractual relation. 1 There is no doubt, however, that even these purely contractual relations are subject to regularities, i.e., law. These relations are sociological relations and must be treated as such. Recognizing that Sociology has to do simply with the facts and relations of social organization, we are confronted ' D e Greef, Les lois sociologiques, p. 25.
STATISTICS IN THE SERVICE OF SOCIOLOGY.
3
at once with two great difficulties, — one is the enormous number and complexity of the social phenomena to be described ; the second is the lack of any precise means of measuring or gauging social forces, that is, of estimating the degree of intensity in the relations of social phenomena to each other. The first difficulty is recognized on all sides and often serves sociologists as an excuse that their science is not more precise and perfect, while on the other hand it leads to the denial in some quarters that a science of society is possible. How can we pretend, it is asked, to examine and understand all the numerous facts of social organization and social activity? Take the highly developed apparatus by which a civilized society satisfies its various wants, — its perpetuation, its material support, its testhetic, ethical, intellectual, and religious needs. Then try to comprehend all these things for all stages of civilization and for all circumstances under which man is placed in this world. Or take one simple problem, — that of the perpetuation of the race, — and explain the variety of marriage customs and of treatment of children, and the variation of the birth-rate according to climate, race and nationality, social and economic condition, city and country, occupations, social customs and religious influences. Sociologists try to escape this difficulty by the assertion that a science may be certain without being exact, but such a plea is a confession of weakness. The second difficulty is commonly expressed as that of defining and measuring social forces. I t is very easy to speak of establishing or discovering relations of cause and effect. But here as elsewhere every cause is an effect and every effect a cause, and even between two phenomena it is often difficult to say which is cause and which is effect. Still further, every effect in social action or life is the resultant of many causes, and it is almost impossible to disentangle and measure the intensity of
4
STATISTICS AND SOCIOLOGY.
the various causes. Does city life cause the large amount of crime in large cities, or does the sex, age, and parentage distribution of urban populations bring it about that a large amount of crime is localized, so to speak, in large cities ? And if both factors are at work as well as, say, a decline in the religious spirit, what part does each play in the result? The large amount of violent crime in the building trades in Germany is due not to any influence of occupation, but simply to the fact that many of the working men in those trades are youths in the passionate and reckless period of life. On the other hand, the short life of publicans in England is ascribed to the influence of the trade with its constant temptations to drink. I t may be remarked in passing that possibly sociologists have exaggerated the complexity of social phenomena and the action of social forces in comparison with the difficulties of natural science. To the lay mind, biological forms, from palceontological fossils to the existing mammals, present a bewildering complexity and an incomprehensible confusion, very similar to that offered by social phenomena. I t is only the " scientific imagination " that makes the working of natural forces, by which planets are evolved out of gas and human beings out of protoplasm, seem so simple that a schoolboy speaks of it as glibly as we used to speak of the creation of the world in six days. Are the gaps in Sociology any more serious than those conceded to exist, when the geologists and the biologists are honest with us, in the history of the earth and in the evolution of man ? In the presence of the " scientific imagination v are not all these difficulties of the same kind and different in degree only ? Sociologists themselves have perhaps added to the apparent difficulties of their science as regards both the collection and the explanation of its data. They have accumulated an enormous number of facts without discriminating clearly between those which are of impor-
STATISTICS IN THE SERVICE OF SOCIOLOGY.
5
tance and those which are certainly of less importance, between those which are typical and universal and those which are accidental and local. They have taken all history, all archaeology, all observations of travellers, as material for their science, and have treated all this material as equally valuable. Now, all actions of men in society certainly have some relation to social organization and social change. But it is impossible to believe that all have equal value in revealing to us the principles of that organization or the direction of those changes. W e must make a choice in some way, or the material will be unmanageable. Again, instead of contenting themselves with seeking simple relations of cause and effect, of co-existence and of sequence in social phenomena, sociologists have often substituted an artificial classification with an artificial terminology, and considered that as an explanation of social life. These classifications are most often based on biological analogies, as is the case with the sustaining, circulating, and regulating systems of Spencer, which correspond to the digestive, vascular, and nervous systems of vital organisms. Or we have the social anatomy, physiology, pathology, and psychology of Schaffle. Many sociologists, it is true, admit that these are merely analogies, and that the social organism, if there be such a thing, is something different from the organism of an animal, claiming only that there is an interrelation and dependence of parts similar to what we find in an animal organism. But the tendency of all this elaboration is to give the impression that the analogy is the explanation. It is not difficult, however, to define with some precision the range of phenomena which furnish the material for Sociology, and the method by which this material should be treated so as to enable us to measure social forces. If we can do this, we shall escape the danger of being overwhelmed by the multiplicity of phenomena and avoid the
6
STATISTIC» AND SOCIOLOGY.
cheap and unsatisfactory makeshift of an explanation based on superficial analogies. The phenomena which we have to observe in Sociology are those of the social organization. The social forces which we have to measure are those revealed by the relations of these phenomena to each other. But since Sociology does not deal with the individual man, but with societies of men, it is evident that its whole material may be comprehended in the single term, population. Those facts of population which reveal the laws of social organization are the facts which are of importance for Sociology, and no others. T h a t men differ in race, nationality, religious belief, and ethical standards is an important f a c t ; that they differ in height, weight, colour of eyes and hair, is of much less importance. Our material may be arranged as follows: I. Population in itself is a very general conception, and does not carry us far in describing social organization. I t is necessary to proceed at once to classification. The most important lines of classification are as follows: Demographic Classes. The individuals of the population are distinguished according to differences of sex, age, conjugal condition, and physical health. Connected with this classification we have the social phenomena of births, deaths, marriages, and sickness. All these are important facts influencing the social organization of every community. Social Classes. Men differ in social position, religious confession, occupation, material condition, and ethical conduct. The differences in societies in these respects often mark the stages of social well-being and make for progress, peace, and stability on the one hand, or retrogression, discord, and instability on the other. Ethnographic Classes. Men differ in race, blood, and nationality; hence societies differ in ethnic composition, race character, national ideals, and political allegiance.
STATISTICS IN THE SERVICE OF SOCIOLOGY.
7
These facts have attracted much attention because they underlie political science. II. Physical Environment. Population is possible, of course, only as conditioned by physical environment. The relations of population organized in society to the land are important facts for Sociology, and these relations have to be followed out in all the divisions of population noted above. III. Social Environment. A s men live together in social relations they develop language, customs, institutions, social and ethical standards and ideals. These constitute what Herbert Spencer calls the superorganic environment. By them all the phenomena of social life are modified, and the new relations thus established are, perhaps, the most important elements of social organization. The relation of population to the physical environment is also very much modified by these influences. I V . Finally, we have the fact that social relations are changing. It is necessary to trace these changes and how they affect social organization. It is here that we come across the doctrine of social forces and need some scientific method of measuring their strength. This is sometimes called dynamic sociology, but the distinction is not an important one for us, as in our study we shall find that all society is dynamic. Such is the field of Sociology, large, indeed, but perfectly well defined. The next question is, what methods shall we use to observe these facts of social organization and social change ? The methods to be employed are those common to all exact sciences, viz., observation, analysis, induction, and generalization. We first observe the facts and relations of the social organization. W e then analyze and classify according to similarities and dissimilarities. B y induction we reach to relations of co-existence or sequence, and by generalization we strive to attain to formulae expressing
8
STATISTICS AND SOCIOLOGY.
these relations. W e strive, in short, to describe the social organization in its main lines and the nature of the changes going on. 1 T h u s far our method is purely descriptive, or, as regards the changes in society, it may be termed historical. U p to this point the analysis is purely qualitative. B u t in order that Sociology shall become a science it is necessary to have not only qualitative distinctions, but also quantitative measurements. Description itself often implies at least enumeration, as when we describe population according to sex, age, and conjugal condition. Classification, again, is a method of description by enumeration, as when we arrange societies according to form of religious belief, fetichism, polytheism, and monotheism, or classify the members of a given community, as Protestants, Catholics, and Jews. Mere description may, indeed, suffice to prove the co-existence of social phenomena, as we find savagery accompanied b y fetichism, a rude economic organization, little government, and low standards of conduct. But co-existences may be defined more sharply by enumeration, as when we compare the number of illegitimate births in a Catholic population with those in a Protestant similarly situated. A n d when we come to sequences in time which seem to bear the relation of cause and effect, we need quantitative measurements. A scarcity of food retards the natural increase of population. This may be demonstrated more conclusively by comparing the increasing price of food with the increased death-rate and the diminished marriage and birth-rate. Wherever it is possible, we seek to supplement our qualitative descriptions with quantitative measurements. It is the Science of Statistics that serves this purpose. It gives us the quantitative measurements of social phenomena which are required for the analysis of social organization, i.e., for Sociology. 1
De Greef, op. ci't
STATISTICS IX THE SERVICE OF SOCIOLOGY.
9
Statistics consists in the observation of phenomena which can be counted or expressed in figures. I t always finds a quantitative expression for phenomena or their relations. I t must be observed that the method of statistical observation is not of universal application. In some cases it is unnecessary, in others it is inadequate. In order to perceive the connection between savagery and fetichism it is not necessary for us to have statistics either of economic condition or of religious confession. The fact stands out of itself simply by the consensus of observation of travellers and historians. On the other hand, it is difficult to express the relation between economic condition or religious feeling and aesthetic development, in a civilized state, because music, painting, and sculpture cannot in any way be measured statistically. This is a question of quality, and not in any sense one of quantity. But there are many phenomena which allow of quantitative measurement, or at least of comparison of greater or less. In mentioning these we shall follow the order indicated above. All classification of population, whether on demographic, social, or ethnographic lines, is on the basis of statistics. Demographic distinctions (age, sex, and conjugal condition) are fundamental for any society, and their influence pervades the whole social organization. The distinctions seem to be very simple, being given either by nature (sex and age) or by well-established social institutions (conjugal condition). But back of the mere classification lie the great social factors, birth, marriage, and death, which make up and control the life both of the individual and of society. Vital statistics not only measure the growth or decay of population, but reveal to us normal and abnormal conditions, the working of great social influences or the presence of anti-social forces. A decreasing marriage-rate, — is it a sign of forethought and pru-
10
STATISTICS AND SOCIOLOGY.
dence or an indication of luxury and vice ? and what will be the result on population and social morality ? Social classes may be differentiated according to religious confession, economic condition (paupers), degree of education (illiterates), ethical conduct (criminals), occupation (professional classes), or acquired position (upper and lower classes). The distinctions are not always easy to make, but when we consider the bitterness of the struggle associated with these divisions of society into groups, their importance for Sociology must be apparent. Ethnographic grouping is on various lines. We have first the races of man, i.e., groups characterized by common descent or by association for so many generations that the individuals have acquired a common trait such as colour of skin, shape of head, or quality of hair. Or we may have nationalities speaking the same language, or living in the same territory, or owing allegiance to the same government. Any analysis of mankind according to these various forms of association depends upon statistics, for the only quantitative measurements we have for these relations is enumeration of the number of individuals in a group. This enumeration seems to be a very simple matter, but it is of fundamental importance. The mere size of ethnographic groups, for instance, is of sociological interest. A large number of petty hordes in a state of constant hostility, and a small number of powerful nations whose dealings with one another, if not always peaceful, are at least regulated by more or less well-defined rule or custom,—these constitute two widely different types of human society. The social activity of the petty republic of Andorra with its population of 6000 souls is not the same as that of the British empire with its 350,000,000. The difference is primarily one of mere numbers, but it pervades all the relations of social life, even the intellectual
STATISTICS IN THE SERVICE OF SOCIOLOGY.
11
and artistic. The relative size of demographic and social groups is even more important. Still further, statistical analysis is not confined to the mere enumeration of population according to these classifications. Each group must in turn be studied according to the characteristics of the other methods of association. If we analyze society into political groups, — that is, bodies of men inhabiting a fixed territory and under the same government, — the population in each of these groups may be still further analyzed according to sex, age, and conjugal condition, according to economic condition and social position, and according to race, language, and nationality. Two political groups numerically equal may possess a very unequal political significance if their populations exhibit great differences of constitution on economic or ethnical lines. Roumania does not have the same social significance as Belgium with the same population. Switzerland is peculiarly constituted with its three equally privileged nationalities. Who will say what the characteristics of the future population of the United States will be with its mixture of nationalities? How often the social prosperity of a country has been sacrificed by religious divisions ! How often has a state been wrecked by social and economic antitheses! In fact, we find here one of the favourite devices of the old philosophy of history which explained the decay and fall of nations or civilizations by these irreconcilable antitheses. Sociology cannot refuse to notice these same relations, and it measures them by means of statistics. The task of Statistics in all this classification is not one of mere enumeration, but of distinction. What are the real marks of race ? What is the real meaning of nationality, and what can we take as a distinctive trait,— language, common origin, or subjection to the same government ? Are the Germans of Austria and the German speaking Swiss of the same nationality? Are the
12
STATISTICS AND SOCIOLOGY.
Englishman and the Irishman of the same race ? Are the negro and the white in the United States alike Americans? In social grouping these questions of statistical method are of equal difficulty and importance. What is the true line between the rich and the poor, the mental and manual labourer, the moral and the vicious, the criminal and the ignorant trespasser ? W e have thus far considered only the analysis of population or societies according to certain characteristics. But this is mere descriptive sociology. W e cannot stop here. Sociology demands not only description but comparison. According to what rules do these social facts co-exist? What is their relation to each other? What economic constitution of a society is able to co-exist with what moral condition ? What race condition is able to coexist with what intellectual or political condition ? Here everything does not lend itself to statistical measurement, but it is not too much to say that the statistical method is our most important instrument of investigation. W e have here the relations existing between population and the external world. We study the density of population in accordance with the fertility of the soil, the climate, and the orographic and hydrographic character of the land. W e study the economic condition of the population (its average wealth) under these same categories. We study vital conditions (births, deaths, infirmities, and disease) in the same way. We study moral conditions — e.g., suicide and crime — according to climate and season of the year. The method is a very simple one — it is simply the plus or minus, the greater or less frequency of one characteristic of the population (e.g., disease) compared with the plus or minus of some characteristic of the physical environment {e.g., elevation above the sea). Yet it is always a quantitative measurement, and without statistics we should be helpless. And here the office of Statistics, as we shall see in the next chapter, is not merely
STATISTICS IN THE SERVICE OF SOCIOLOGY.
13
to count, but to say what shall be counted and how that which is counted in one direction (population) shall be compared with that which has been counted in another direction (environment). This embraces the whole technique of statistical method. And any sociology which springs from the notion that man and society are the expression of the working of natural forces, must depend upon statistics for its material and its proof. But an even more delicate and important field for statistical inquiry is the co-existence of these social phenomena among themselves. This is the Spencerian influence of the superorganic environment. I t is the interlacing of the different social phenomena so that they form together something different from their mere sum, viz., an organic whole. The economic phenomena cannot exist and be as they are without the political, or the moral, or the religious phenomena ; and each of the latter is equally dependent upon the others. I t is the delicate office of statistical science to prove this relation and to give a quantitative measurement of it. Examples abound on all sides. The distinction of sex is accompanied by a different age classification, by different average length of life, by different disposition to commit crime. Varying age constitution of populations means different economic power, different rate of natural increase, different military strength. Economic condition is a controlling influence apparently in the relative frequency of crimes against the person and against property. Illiteracy is accompanied by a low rate of suicide and a high rate of crimes against the person. Race seems reflected with constant fidelity in some of the phenomena of man's social life, while religious confession has influence in directions where we should scarcely expect to find it, such as insanity, still-birth, and illegitimacy. We have here the true field for statistical comparison. We do not get exact proportions, but we get corresponding elevations and depres-
14
STATISTICS AND SOCIOLOGY.
sions. As, for instance, in those counties of Bavaria where the women are employed in factory and field, we get constantly high rates of infant mortality. In the same country when the laws (juristic organization) made marriage difficult, we had an enormous rate of illegitimacy, and the rate continued high even after the laws had been repealed, showing that the acquired social disposition was more powerful than legislation. When now we find everywhere corresponding economic conditions accompanied by the same social results, we begin to discern regularities which may be called sociological laws. Dynamic sociology gives us precisely the same opportunity of measuring social phenomena by the statistical method, only the application is more delicate and difficult. Societies are constantly changing and the relations of functions and organs constantly change. In these changes can we detect cause and effect? When the food supply decreases and crime increases, is the former the cause of the latter ? As intellectual progress proceeds and suicide grows more frequent, is the latter phenomenon the necessary result of the former ? We have here all the facts of vital statistics to be brought into sequence of time with each other and with the remaining social facts. A society grows by the excess of births over deaths. What is the relation of the two to each other and to that great social function, marriage ? Marriages become more frequent with economic prosperity. The number of births is influenced (although not always to the same degree) by the number of marriages. Mortality increases with births, but in a peculiar way. How shall we watch these fundamental phenomena of a growing society except by the statistical comparison of the relative number of marriages, births, and deaths through successive years ? The service which Statistics performs for Sociology is not always of the same kind nor of the same degree of exactness. Sometimes statistics reveal only regularities which
STATISTICS IN THE SERVICE OF SOCIOLOGY.
15
we have as yet been unable to explain, as, for instance, the constant excess of boys over girls among the new-born. I t sometimes points out regularities which are explicable, but which become very striking when the regularities continue, as the proportion of male criminals to female. The man, more violent, more impatient, more subject to temptation in life than the woman, might naturally enough be expected to be represented more numerously in the criminal class than the latter. But when we find the proportion remaining the same year after year, the strength of these influences is strikingly apparent. But the grand office of Statistics is to direct our attention to possible relations of cause and effect which might otherwise have escaped our notice, or which would scarcely have been thought of as invariably present. That the infliction of certain penalties has little effect in preventing crime is brought home to us painfully by the statistics of the habitual criminals. That it has less effect on women than on men might not have been suspected, except from the actual statistics. We get from statistics indications of relations which maintain themselves with a persistence and constancy that give us an impressive sense of the reign of law in the social actions of men. I t is this reign of law which we desire to see revealed. We desire to look beyond the accidental and temporary and see the grand forces by which human affairs are governed. This is not atheism or rationalism, for we say nothing about the first cause, and to discover regularities in the social world no more impeaches the divine goodness than to discover that a flower is built upon a symmetrical plan. Nor is it fatalistic, for it does not deny that man's actions are governed by subjective motives, but it shows that in many cases these motives are controlled by great influences exerting themselves on masses of men. Nor does this attempt to show the reign of law result in pessimistic views as to social reform and amelioration, for if
16
STATISTICS AND SOCIOLOGY.
certain causes produce certain effects, it is obvious that by changing the causes we shall produce other effects, and this is the only basis for the possibility of social reform. Statistics enables us to catch glimpses of these relations and hence to predicate the existence of social laws. It may not enable us to formulate the law exactly, or to construct a perfect system of sociology, but it helps us on our way to attain the desired end. This leads us to say one final word about Statistics in the service of Sociology. We are surrounded by sociological or social problems which urgently demand solution. We cannot wait for the completed science; we must seek to understand the conditions affecting the particular problem before us. This may be called practical sociology. Everywhere in this domain we find Statistics a useful instrument of investigation. In fact the primary object of collecting statistics is to serve administrative purposes and to guide legislation. A government must know about the statistics of trade, of finance, of the military and economic resources of the nation. It should know equally about the economic and social condition of its citizens. Evils which are to be remedied, such as the prevalence of disease, of vice, of crime, and their connection with other phenomena, such as economic condition, sanitary surroundings, illiteracy, vicious moral training, etc., must be clearly described before they can be proceeded against practically. Many schemes of social amelioration are altogether illusory because they do not comprehend the real cause of the evil. In practical sociology thus we have a constant demand for scientific statistical measurements and descriptions.
CHAPTER T H E CRITERIA OF
II. STATISTICS.
STATISTICS is one extremely useful instrument of investigation in Sociology. It has lately been affirmed that it is the most useful and potent instrument which that science possesses, and there has been and is a tendency among some writers to expand Statistics, so that it becomes in itself a scheme of social science, covering all the phenomena of social human life. 1 It is not necessary for our present purpose to discuss the question whether Statistics is a science like Sociology, or is only a scientific method of investigation like the science of microscopy. It is certainly the latter even if it be not the former. But if Statistics is a scientific instrument of investigation it must be used scientifically. It must first of all be used for the purposes for which it is fitted. W e do not take a sledge-hammer to regulate a watch, or a pair of tweezers to mend an iron gate. W e cannot measure the merits of a painter by the square yards of canvas he covers, or the morality of a nation by the seating capacity of its churches. The statistical method is fitted for some purposes ; — for others it is quite unfitted. This is often misunderstood. W e continue to gather statistics which neither are nor ever can be of use, — simply because they are statistics. Still further, with the collection of the statistical data 1
Reichesberg,
des Preuss.
Statistik und Socialwissenschaft.
Bureaus, 1871, p. 181.
schaftslehre, 1895.
Engel,
Zeitschrift
V o n Mayr, Statistik und Gesell-
This is the latest and most complete treatise on
statistics that we possess.
18
STATISTICS AND SOCIOLOGY.
only the first step has been taken. The statistics in that condition are only raw material showing nothing. They are not an instrument of investigation any more than a kiln of bricks is a monument of architecture. They need to be arranged, classified, tabulated, and brought into connection with other statistics by the statistician. Then only do they become an instrument of investigation, just as a tool is nothing more than a mass of wood or metal, except in the hands of a skilled workman. It is here that we have a science of statistics in the sense of the ability to use what would otherwise be useless. And this skill extends in all directions, in the methods of collecting statistics, in arranging and tabulating them, in comparing them with each other, and especially in judging of the validity of the deductions or inferences to be drawn from them. The statistician is not a mere collector of figures, any more than the chemist is a mixer of chemicals. He is an investigator of the phenomena behind the figures. It is not our purpose in this book to enter into the practical details of statistical method, or into the refinements of statistical theory. There are, however, some obvious conditions which must be satisfied in order that any mass of statistics shall have the slightest scientific value, and it is necessary to bear these in mind whenever using statistics either in general or in practical sociology. I have called these things the Criteria of Statistics. They are most of them so obvious that they are self-evident when stated, but many of them are flagrantly disregarded in practice. Before going on to our actual statistics it has seemed to me useful to summarize these criteria once for all so that we can refer to them later on. This will be done as briefly as possible. The work of Statistics falls under four heads: (1) Gathering the material; (2) tabulating and arranging i t ; (3) comparing one set of statistics with another in
THE CRITERIA OF STATISTICS.
19
order to discover relations of co-existence or of cause and effect; (4) formulating statistical or sociological laws. The criteria which it is necessary for us to bear in mind attach themselves to these four stages and may best be considered in this order. I. Collecting the Material. This is a matter not only of administrative technique, but also of scientific judgment. In the first place, what statistics shall we gather ? Many social phenomena are capable of statistical measurement, and we cannot always tell in advance which will prove to be of scientific value. But it is obviously impossible to collect them all, and so we are obliged to make a choice. There are many actions of men of so trivial or indifferent a nature that we cannot conceive of their being of sociological importance, e.g., as to whether the inhabitants of a country take their noonday meal at twelve or at one o'clock. On the other hand, the number of school-children with light or dark hair, blue or brown eyes, may be of importance in connection with race. We must, therefore, choose what we shall observe, and the choice is not always easy. As a matter of fact, also, the choice is limited largely by administrative considerations, i.e., as to what the government officials are authorized or willing to collect. Statistics are collected principally by governmental agency. The task is too great and too unremunerative for private persons as a rule to undertake. Private individuals also do not possess the necessary legal power to compel an answer to their questions or to punish false and misleading answers. But the primary object of many, in fact most, official statistics, is to furnish guidance for administrative action or to gain practical information. Such is the character of the statistics of imports and exports, of land ownership, agriculture and industry, shipping and railroads. It enters into the statistics of population, of disease and death, of crime and
20
STATISTICS AND SOCIOLOGY.
punishment. This has led to the apportioning of the work of gathering statistics among numerous departments of the government, each one securing the information that is useful and interesting to it. One great evil attending this splitting-up of statistical activity is that the information is often very extensive, but is not comparable. For instance, in the English statistical returns different age-classifications are used for prisoners, paupers, lunatics, illiterates, diseased, married, employed in factories, etc., so that we cannot trace the same class of persons through these different social conditions. This is an example of how scientific interest is sacrificed to pure administrative routine. Science often suffers also from the conservatism and obstinacy of governmental officials, who are first of all departmental chiefs and not statisticians. A slight change here and there, a little expansion of the schedule, would often increase the value of the statistics many-fold without disturbing their administrative usefulness or requiring additional labour in collecting. If there is lack of harmony in the statistics of different departments of the same government, one can imagine how useless it is to expect harmony among the statistical departments of different countries. It is this fact which makes international statistical comparisons so difficult. Again, with the best will on the part of the statisticians, the organization of government or of departments is sometimes such as to render certain branches of statistics practically impossible. The vital statistics of the United States are imperfect because the Federal government has no registering office for births, deaths, and marriages, and it is quite hopeless to expect that all the different states will collect such statistics with uniformity or efficiency. Prison statistics as well as educational statistics all suffer in this country from the variety of laws and regulations prevailing in the different states. We cannot see any remedy for this
T H E C R I T E R I A OF STATISTICS.
21
except in special inquiries conducted oyer limited fields either by state organs or by special offices at Washington, like the Department of Labour or the Bureau of Education. Great care should be taken in any statistical inquiry, especially a census, in determining the questions to be asked and their form. Questions impossible of answer should, of course, not be asked. An example of this sort in the United States census of 1890 was the question of colour — whether black, mulatto, quadroon, or octoroon. It was impossible for the individuals themselves, ignorant of their own descent, to answer such a question accurately, and mere shade of colour is an insufficient guide. Number of days unemployed during the year could not be easily answered except from the pay-rolls of the employer. Itemized family expenditure cannot be furnished except by the small number of persons who are accustomed to keep books of account. Questions that demand an unusual effort of memory are seldom accurately answered by the mass of the people. Questions which arouse suspicion or hostility should not be asked, or asked only with great caution. Questions as to religious belief often excite opposition. Generally questions as to property or income arouse the fear of new taxation or fiscal imposition. Questions as to mental or physical infirmity should be put in such a way as not to offend susceptibilities. Of course, questions of mere opinion should be omitted, and questions which may seem to offer advantage or disadvantage if answered one way or the other. An example of the latter was the demand in the United States census of 1890 whether one was soldier or sailor in the war, which seemed to hold out the possibility of a pension. Such, in a charity inquiry, would be the question of "whether in need of assistance or not" when answered by the individuals themselves. A skilled statistician will make out his schedule so as to give by combination the greatest amount of information
22
STATISTICS AND SOCIOLOGY.
with the smallest demand on the intelligence of the answerer. Often a single question, like that of "occupation," "nationality," or "age," opens up a series of combinations which were otherwise impossible. It is obvious that the questions must be worded in such a way as not to be ambiguous, to be answered if possible by a single word, to be of such a kind that the enumerator can detect obvious misstatements by the connection with other questions. All this belongs to the technique of statistics, but is often undervalued and not understood. The success of a statistical inquiry depends largely upon the skill with which the original schedules are arranged. Of course, intelligence, honesty and zeal on the part of the enumerators are equally demanded. II. Arranging and Tabulating the Material. It is necessary to put the material into such shape as to be most useful in imparting information. This is the ordinary work of tabulation, as, for instance, the population at successive censuses or the number of criminals in successive years. Various devices are employed to make the facts more luminous. For instance, we can calculate the percentage of increase of the population from census to census in order to judge whether the rate of increase is greater or less. Or we can take the percentage the urban population bears to the whole from decade to decade ; or the percentage of the blacks to the total population. Care should be taken to preserve as much as possible the same standard,— as, for instance, the whole population, — in reckoning the percentages of the different elements, as the native and foreign-born, the blacks and whites, the illiterate, the criminal, etc. Sometimes the number of blacks is expressed as a percentage of the- whites, the number of foreign-born as a percentage of the native-born, etc. But when we come to consider the strength of the blacks compared with that of the foreign-born, we have not the same standard.
T H E C R I T E R I A OF STATISTICS.
23
Vital statistics are commonly expressed by rates, as the birth and marriage-rate. They may be expressed in one of two ways. Deaths may be expressed by saying one out of 40 of the population died during the year, or 25 per 1000 died. The latter is always preferable, it being easier to judge of the fluctuation from year to year by saying 25 and 2-4 per 1000, than by saying one out of 40 and one out of 42. When we say the birth-rate in one country is one in 29 of the population and in a second it is one in 31, it is not easy to measure the superiority of one over the other. When we express the rates as 34.5 and 33.2 per 1000, the difference is obvious. When there is a whole list of rates to compare, as the fluctuations in birth-rates for a period of twenty years, the advantage of the latter method is still greater. The most common device in statistics for making the figures expressive, next to the per cent and per mille arrangement, is to take the average. The average is the short expression for the general truth underlying the diversity of phenomena. The rate of suicide may vary from year to year in England, but the average for ten years will be, say, 80 per 1,000,000 inhabitants. One year it may be as high as 85 and another year as low as 77, but ordinarily it will be near 80. Prices fluctuate from day to day or from month to month, but the average price will be the middle point about which the market prices fluctuate. The average is of inestimable benefit in statistics. Without it we should be helpless before the enormous accumulation of figures, which we could neither remember nor understand. It is the average which takes hold of the imagination and presents itself to our minds as the expression of the real condition of things. It is the average which is sought in order to unburden the mind of the mass of details. Hence we have everywhere averages, — the average length of life, average price, average wages,
24
STATISTICS AND SOCIOLOGY.
average wealth, average well-being, and even the average man. I t is necessary to use the average with care for it is often delusive. In the first place only those things should be averaged which belong to the same class. If we try to get the average length of life of healthy males, it is not permissible to include unhealthy males. If we are seeking the average wages of men, it is not permissible to include the wages of women and children. In the latter case we get an average, but it represents nothing. It is too low for men's wages ; it is too high for the wages of women and children. Care must be taken not to allow extreme cases to have too much influence. The rate of interest on money may in some flurry of the stock-exchange suddenly rise to 40 or 50 per cent for a few transactions, while for the great mass of transactions during the day it has been 5 or 6 per cent. To say that the average rate for money had been 22 or 28 per cent would be misleading, the great mass of transactions having been at 5 or 6 per cent. A remedy for this is found by taking account of the number of transactions at each rate instead of merely the rates themselves. Sometimes it is permissible to drop out extreme cases where they can be distinguished. For instance, if we are calculating the ordinary mortality of a community by taking the average death-rate for a series of years, and find an excessive death-rate for a single year due to a particular cause, as cholera or a war, we can drop out that year and get a truer average. An average must not be a mere numerical average, for that amounts to nothing. It must be a typical average, expressive of about what the real condition of things is. This requires great care and discrimination in the use of the figures and in their arrangement. I I I . We must compare the statistics of one social phenomenon with those of another in order to discover if
THE CRITERIA OF STATISTICS.
25
there be any relation between the two. These relations may display themselves either in space or in time. Suppose we have reason to suspect that city life increases the death-rate. W e arrange on one side the death-rates for the cities of England, and on the other the rates for the rural communities. If we find in the former column constantly higher death-rates than in the latter, we conclude that for some reason or other deaths are more frequent in cities than in the country. If we believe that altitude has something to do with lung diseases, we arrange the deaths from such diseases in mountainous regions with those in the lowlands, and see if in one case they are more numerous than in the other. Or we may compare differences in time. If we find the largest number of suicides everywhere falling in early summer, then we conclude that temperature has something to do with the suicidal mania. Or if we find that in times of high price of food and dull business, crimes against property always increase in number, then we conclude that economic condition is an influence on crime. It is obvious that in the complexity of social phenomena we may have two or three causes bound together and may attribute to one cause an effect due to another. Crime is more frequent among the foreign-born population of the United States than among the native-born. But if we take account of the larger number of adult males among the foreign-born, we shall suspect that the greater criminality is due as much to the sex and age proportion as to the nationality. There is a larger proportion of the blind, and deaf and dumb, among the Catholics of Ireland than among the Protestants, but one must remember that all the poorest and most helpless of the population are included among the Catholics. It is necessary, therefore, to eliminate as far as possible the causes other than the one we are studying, so as to trace the connection between that one cause and the effect
26
STATISTICS AND SOCIOLOGY.
produced. T h i s requires great care and a true statistical insight, for often unsuspected causes are at work. Finally, can we measure the intensity of the cause? How much is bad economic condition responsible for the increase of crime ? This is simply a question of greater refinement of method, which is sometimes possible, but more often impossible. B a d economic condition increases crime, but is very seldom of such importance that a proportionate variation in it results in a proportionate variation in the amount of crime. Such exact measurements are almost always impossible. We must be content if we can show that the influence is a constant one. I V . Even when we discover constant regularities or relations of cause and effect, have we any right to dub them statistical or sociological l a w s ? That is what we are inclined to call them. Some are merely the expression of a fact, as that there are always more boys than girls born. Others are statements of regularities which remain as long as the conditions remain, as that the rate of suicide in England is 80 per 1,000,000 inhabitants. Still others are affirmations, e.g., that economic condition is a cause of crime. About these so-called laws it is only necessary to remark : — ( 1 ) That they are merely empirical laws of no high degree of validity, — simple regularities that may be easily affected in a great variety of ways. Suicide is influenced not only by economic condition, but by social opinion, religious belief, external hindrances, etc., so that the number may vary from year to year. ( 2 ) In order to formulate a law we must demand a certain regularity. This is commonly measured by the law of probability. If the fluctuations from year to year are not greater than the mean error in a series of a like number of events happening by chance, then we seem to have a regularity showing the working of a constant cause. If they are greater, then we must try to discover a par-
THE CRITERIA OF STATISTICS.
27
ticular cause for the variation and eliminate it. Here we have a chance for careful and minute inspection of these regularities revealed by statistics. ( 3 ) The regularities of the mass have no compelling force over the individual. That the rate of suicide in England remains constant from year to year does not mean that I am in any more danger of committing suicide than if the rate fluctuated capriciously. That 500,000 people, that is one-third of the inhabitants of New York, are carried daily on the elevated railroads does not mean that I am obliged to ride once in three days. I may ride every day or I may never use the road. These things are sometimes forgotten when we speak of the inevitableness of social laws, of the responsibility of society for the crimes committed in its bosom, of the budget that must be paid, the budget of the galleys, the scaffold, and the prison. ( 4 ) This last affirmation means that statistics do not destroy the doctrine of the freedom of the human will. Whatever may be the validity or non-validity of that notion, it cannot be overthrown by statistics. With all the regularities there are numerous irregularities which leave room for the freedom of the individual. And it is scarcely possible that statistics will ever be so perfect an instrument of investigation as to destroy these variations. Free will may not really exist, but it is not yet disproven. ( 5 ) But, it is commonly said, if you admit freedom of the will, what becomes of your statistical regularities and your sociological laws? This question has already been answered. By statistics we seek to show that social actions are controlled often and demonstrably by certain great and general influences. This is mere connection of cause and effect, but the connection is so close that if the cause remain the same the effect also remains the same. This is a great discovery to make and is the first step towards understanding social phenomena and formulating a theory of the organization of society. We do not affirm
28
STATISTICS AND SOCIOLOGY.
that the causes do not change. In fact directly the contrary is affirmed, viz., that if the causes change, the effects will change. And it is just as important to prove this as the former. The irregularities of statistics pointing to unlike causes are just as important as the regularities pointing to like causes.
CHAPTER III. METHOD OF STUDY.
THE statistical method offers us an enormous amount of material of all degrees of completeness and trustworthiness. If we are not to be entirely confused and overwhelmed by the mere mass of data and by the conflicting conclusions to which they seem to lend support, it is necessary that we strive for and attain absolute clearness in respect to the ends to be sought and the methods of seeking them. For this purpose we shall adopt a certain rigidity of arrangement and of argument which will be carried out in each chapter, although it may sometimes appear superfluous and even pedantic. This rigidity does not lie in the nature of the material itself, for social phenomena are constantly intermingling and overlapping and can be separated only in thought; but it lies in the limitations of the human mind, which ordinarily in scientific investigation is obliged to contemplate separately things which in life never exist separately. In order to preserve a certain degree of clearness, each of the successive chapters will be arranged on the following plan : (1) Sociological purpose of the investigation; ( 2 ) Statistical data now accessible; ( 3 ) Scientific tests of the trustworthiness of these data; and ( 4 ) Reflective analysis of the results obtained. The object of this arrangement (and its value) will best appear as the subject is developed, but some preliminary explanation of what is meant under each head may find a place here. ( 1 ) Sociological Purpose. In order to deal intelli29
30
STATISTICS AND SOCIOLOGY.
gently with a particular group of statistics, it is absolutely necessary to have in mind the purpose for which we wish to use them. I t is impossible to work in any science without some "working hypothesis." We must assume that it is possible to prove that which we wish to prove, and that the data of which we have command will help us on to that proof. The general sociological purpose of any group of statistics is to throw light on the organization of society. That is the general purpose. More particular purposes will vary according to the character of the statistics, but the general line of inquiry will be that indicated in Chapter I. We inquire first what bearing the particular statistics have on the classification of population. This bearing is sometimes direct, as in the statistics of race, or of sex, age, and conjugal condition. It is sometimes indirect, as in those of migration, births, deaths, and marriages. The second sociological purpose is to arrange the particular statistics in such a way as to reveal any relation between population and land (physical environment). This relation is sometimes direct, as between births and the season of the year ; sometimes it is indirect, as between births and density of population due to the physical character of the land. A precisely similar purpose must be kept constantly in view in regard to the social environment, that is, the effect of other phenomena of population upon the particular phenomenon we have in hand, e.g., the influence of religious confession on illegitimate births, of economic condition upon marriage, of sex upon suicide. What sort of co-existences can we reasonably expect to establish here ? We must have some conception of what we expect to find before we shall ever find anything. Sociological purpose must keep our minds open to changes in the different groups of phenomena and their relation to each other. Fluctuations in birth-rates must
METHOD OP STUDY.
31
obviously find a possible explanation in a variety of ways, as in changes in the marriage-rate, in wars and times of adversity or prosperity, or in statutory enactments, etc. A definite purpose must exist in our minds to test all such sequences and to try to establish relations of cause and effect. The object of Statistics is often not so much to establish new truths as to confirm truths already guessed at. Finally, our sociological purpose in many groups of statistics must be to gain information for the purpose of guiding social action—what we have called practical sociology. What effect does the infliction of certain penalties have upon the repetition of crime ? From what classes in the community are juvenile offenders recruited ? Is pauperism due to economic misfortune, lack of thrift, lack of intelligence, habits of dissipation, or to general social causes over which the individual has no control? The statistician who should neglect such practical questions while seeking to establish the general outlines of social organization, would fail to comprehend one very important sociological purpose of his investigation. (2) Statistical Data. The main purpose of each chapter will be to present the particular statistics in accordance with the sociological purpose laid down in the introductory part. The data should be developed in that order, viz., the general data with reference to the whole population, in connection with the physical environment, in connection with the social environment, with reference to the changing relations of a dynamic society, and with reference to specific problems. I t is not necessary to give all the statistics. Typical ones should be selected which will prove the point in hand, but enough should be furnished to show that the rule is general and not exceptional. Care must be taken in comparing phenomena that the comparison is a fair one, e.g., in comparing the number of paupers and defective persons among the
82
STATISTICS AND SOCIOLOGY.
Catholics and Protestants of Ireland, that the two bodies represent the same social and economic condition; or in comparing the numbers of persons convicted of larceny in England with those in Italy, that larceny covers the same range of offences in the two countries. The number of statistical data at command is enormous. It is not easy to select those that are homogeneous and suited for the purpose. Fittingness and suggestiveness are more important for us than mere accumulation of facts. So, too, in making our comparisons it is well to fix our attention upon two and only two phenomena at the same time, e.g., combine criminality at first with age classes alone, and afterwards with sex and conjugal condition. Our rule should be to present the simple first, and proceed from the simple to the complex. Ordinarily, however, we shall find it necessary to eliminate as many of the influences as possible in order to study the effect of one. (3) Scientific Test». Having chosen our material with respect to the sociological purpose in view, the next question is whether it is adequate. This is a very important matter, the neglect of which leads to many impotent conclusions and much wasted labour. Our general scientific method is observation, analysis, induction, and generalization. But all observation is not statistical, and after observing a particular group of phenomena, the first question to be asked is whether the statistical method is at all applicable, and if so, to what extent. Degree of intelligence would be a valuable item in the study of crime, but have we any statistical method of measuring intelligence ? Density of population probably has an influence on many social phenomena, but it is commonly so associated with other things, such as city life, industrial condition, economic well-being, that statistical analysis fails to isolate it. Always and everywhere with statistical analysis comes the question whether our classification is legitimate and scientific. What is the distin-
METHOD OF STUDY.
33
guishing mark of race? W i t h classification comes the question of nomenclature. D o names mean the same thing in different countries or at different periods of history ? W h e n we make comparisons, have we eliminated all the disturbing elements? For instance, in comparing death-rates of city and country, do we take account of differences in sex and age ? Finally, in proceeding from analysis to induction and generalization, it is necessary to consider the universality of the facts upon which our reasoning is based. Besides these general scientific tests there are the particular questions of technique mentioned in the preceding chapter. In some cases there are difficulties in getting the material, as in the birth, marriage, and death statistics of the United States. W e can see that some inquiries are very difficult to answer with certainty, e.g., the exact motive leading to suicide. Again, we suspect that some questions will not be answered truthfully, as when parents are asked the age of their children employed in factories. In other cases we know that the administrative processes are so inadequate that the returns are not trustworthy. Such is said to be the case in some South American censuses and is true of many local statistics. Because the material is imperfect or incomplete it does not always follow that it is useless. I t may give us indications of relations or tendencies without our being able to define them exactly. I t may confirm to a certain degree what we have already suspected from observation. I t may be used to frame hypotheses which may then be tested in other ways. Questions of technique connect themselves also with tabulating and presenting the statistics. In many cases we have to determine the most practicable classification, as, for instance, in ages ; shall we take each separate age by itself or shall we group them, and if the latter, shall we group them by quinquennial or decennial periods or otherD
84
STATISTICS AND SOCIOLOGY.
wise ? One great difficulty in all age classifications is the concentration about ages ending with zero or the figure five. We should adopt a classification that will avoid the evil effects of this as far as possible. In tabulating population in respect to density, it is necessary to determine what scale of gradations we shall use; in separating urban and rural population, what limit we shall adopt as minimum size for a city; in studying relation of population to land, whether we shall take lines of equal latitude, equal altitude, or equal temperature. Still further, in making comparison between different countries, or in studying the changes in time in the same country, it is necessary to adopt some sort of rate. Births, for instance, vary from year to year because of increasing population. It is obviously better to take a per capita relation than the absolute numbers. It is the same way with marriages, deaths, sickness, suicide, crime, and almost all social statistics. In order to make them comparable it is necessary to turn them into rates. The important question is, what standard shall we adopt. The most simple is that of the whole population. I t has the added advantage that then all our different phenomena are comparable among themselves. I t has the disadvantage that the whole population is not affected by the particular phenomenon. Marriage is only entered into by adults who are not already living in the married state; hence the number of unmarried persons above the age, say, of fifteen, is the true standard with which to compare the marriages in any country or at any one time. Legitimate births are due to the married women of child-bearing age, illegitimate to the unmarried of child-bearing age, and neither has reference to children or old persons. I t is always an important question, now, what standard we shall employ for each particular group of statistics; or if we use the general standard, the influence which difference in the sex and age proportions may have.
METHOD OF STUDY.
35
The presentation of the figures involves the question of the average. W e must have some short expression for the multiplicity of facts, and the average is useful for that purpose, as already explained in the last chapter. In our " scientific tests " we shall constantly be obliged to decide whether our averages are " typical," that is, corresponding to something in real life, or are empty mathematical ones. ( 4 ) Reflective Analysis. Having thus tested the statistical data of each particular kind collected together for the sociological purpose defined in the beginning, it will be necessary at the end of each chapter to determine how far that purpose has been attained. This will be done simply by reflective analysis of the results for the purpose of determining whether the classification is adequate, whether there is any connection between the particular phenomenon and the physical environment, or with other phenomena showing relations of co-existence or of sequence. Finally, we must determine whether we can formulate any sociological laws, what effect such laws have on the doctrine of the freedom of the will, and whether our results have any practical sociological consequences.
BOOK I. DEMOGRAPHIC.
CHAPTER
IV.
S E X , AGE, AND CONJUGAL CONDITION.
Sociological Purpose. POPULATION falls into natural groups according to two characteristics present everywhere, viz., sex and age. Both are natural in the sense of depending for their classification upon nature and the natural divisions of time. Both are of very considerable sociological importance, inasmuch as the relative size of the groups affects the social and political constitution of each community. The relative number of men and women has some economic influence, inasmuch as the man is stronger and better able to bear the work of production than the woman. An excess of males or of females affects the marriage relation, the increase of population and the mortality of the community. Still further, the characteristic of sex either in itself or as a result of historical evolution seems to influence social phenomena, such as mortality, disposition to disease, participation in vice and crime, in particular ways which are explicable only by reference to sex. I t is the purpose of Statistics to disclose these relations. It is a question of sociology whether the cause is physiological 30
SEX, AGE, AND CONJUGAL CONDITION.
37
or due simply to social influences which have centred about the distinction of sex. Classification by age has important social, economic and political influences. A population may have an excessive number of children and old people, thus increasing the burden on the productive class. It may have a deficiency of children, thus leading to depopulation or at least a stationary population. Emigration may weaken the economic power of a nation by drawing away the fullgrown persons ; or immigration add to it by increasing the relative number of adults. The military strength of a country is measured by the number of men able to bear arms. The voting strength is measured by the number of males above a certain age. The growth of population is conditioned by the number of women of child-bearing age. The number of criminals depends partly on the number of adult men. Disease, mortality, and other phenomena vary in intensity because of the distribution of the age classes, as, for instance, many of the facts peculiar to large cities are explicable by the age-constitution of urban populations. Thus the mortality rate in cities cannot be directly compared with that of the country, but account must be taken of the distribution of the population by age. It follows from this that in many cases comparison of the same fact in two classes of the population can only be made accurately when we take into account the ageconstitution of each. Thus, in asserting that crime, pauperism, and insanity are more frequent among the foreign-born in the United States than among the natives, we must remember that all these are phenomena of adult life and that the proportion of adults is greater among the foreign-born than among the natives. The contrary is true in respect to homeless children, idiots, and the feeble-minded. The rate of mortality among the blacks at the South is greater than among the whites because of the large number of children.
88
STATISTICS AND SOCIOLOGY.
While the total number of the population ordinarily furnishes us the basis of comparison for such social phenomena as the rate of increase, the birth-rate and the deathrate, in some cases a particular section of the population gives us a truer standard. The number of births is sometimes compared with the number of women of child-bearing age ; the number of marriages with the number of unmarried persons of marriageable age ; the criminals with the number of adults ; the illiterates with the number of persons 10 or 12 years of age and over; the number of permanent paupers with the number of persons 60 or 65 years of age and over ; the celibates with the number of persons 40 years of age and over ; the adult mortality with the number of adults. The classification by age and groups of ages is therefore very important in sociological investigation. Almost everywhere it gives *us greater precision. It enables us to eliminate one of the permanent causes, so to speak, and leaves us free to search for the particular cause. When we are examining the prevalence of insanity among the foreign-born and natives, the elimination of children among whom insanity is rare removes one cause of variation and concentrates our attention on the influence of race. When we compare the marriage-rate of city and country, the number of marriageable persons is the standard we are seeking, — not the number of children. The distribution of the population according to conjugal condition (single, married, widowed and divorced) does not depend upon natural causes, like the distribution by sex and age, but upon the social institution of marriage. Nevertheless, marriage is so well established in civilized communities, its consummation is so dependent on age, and its dissolution upon death, that the classification of the population according to conjugal condition is almost as natural and as stable as that by sex and age. Conjugal condition is a very important fact in social
SEX, AGE, AND CONJUGAL CONDITION.
39
organization. The relative number of the single and married affects the growth of population, the number of births, the constitution of the family, and social morality. Widowhood has important economic and social effects. — as has also divorce. Still further, the married and widowed states seem to have peculiar influence on other social phenomena, such as death, disease, insanity, suicide, vice and crime. The combination of conjugal condition and age reveals many interesting relations. The sociological purpose of presenting statistics of sex, age, and conjugal condition is to establish firmly this fundamental classification of population which is absolutely essential to any understanding of social organization or the facts of social life. W e must inquire how far the classification itself depends upon natural and social influences, e.g., climate and celibacy, social customs and second marriages. But our more important task is to establish the distribution of population itself according to these categories as a foundation for all our later statistics of births, deaths, marriages, suicide, vice, and crime. Such foundation is absolutely necessary in order to make these statistics comparable and thus to establish relations either of co-existence or of sequence, i.e., of cause and effect. A t the same time it is the sociological purpose of this chapter to consider whether the relations of sex, age, and conjugal condition disclose any regularities which may be termed sociological laws. Practical questions must also be kept in view, such as the effect of an abnormal number of unmarried women on the policy of factory laws, the effect of celibacy occasioned by economic condition on social morality and the like. Statistical Data. Sex. The relative number of males and females varies widely in different parts of the world and in different
40
STATISTICS AND SOCIOLOGY.
countries. General estimates lead us to suppose that to 1000 males there are in Australasia only about 852 females, in Asia 958, in Africa 968, in America 978. I t must be confessed, however, that our knowledge of these populations rests on estimates or very imperfect enumerations, so that the figures are uncertain. In Europe, on the other hand, we have an excess of females, 1024 females to 1000 males, and this is typical of old countries. In the United States, typical of a new country, the excess of males is undoubted, — 952 females to 1000 males in 1890. In both Europe and the United States we have wide variations, as is shown by the following figures, indicating the number of females to 1000 males in different countries of Europe and different sections of the United States : Europe
.
. Norway Scotland . Sweden . England and Wales . . Switzerland . . . . . Denmark . Austria . . Germany Ireland . Holland .
France
. .
1064 1091 1072 1065 1064 1067 1051 1044 1030 1029 1024 1015 1014
Europe —
Continued.
Belgium Italy Servia Greece
United States
. .
North Atlantic States. South Atlantic States. North Central States . South Central States . Western States . . .
.
1005 989 947 929
.
952
.
1004 928 961 698
. 1006
.
It is a curious circumstance that the greatest excess of females is found in the northern countries of Europe, thence diminishing towards the South until in the countries on the Mediterranean there is an excess of males. Ireland forms a marked exception to the rule. It might seem at first sight that climate or geographical position had something to do with this distribution of females among the countries of Europe. But we cannot believe
SEX, AGE, AND CONJUGAL CONDITION.
41
that there is any direct influence of climate on the proportion of the sexes. If there be any influence it must come about indirectly through births, deaths, or migration affecting the two sexes unequally. In the whole of Europe there are more males born from year to year than females. That would naturally lead to an excess of males. But in most countries there is also a greater mortality among men than women, and sufficiently greater to wipe out the excess of male births. If in any country, therefore, we started out with an equal number of males and females, at the end of the year there would be an excess of females. In England, for instance, during the decennium 1881-90 there were 1037 males born to every 1000 females ; but there were, out of equal numbers living, 1123 male deaths to 1000 female. The greater mortality among males more than effaced the superiority of male births. This tendency going on year after year would eventually accumulate in the population a greater number of females. There would be a limit to the excess, however, when females became so numerous that even with a lower death-rate the number of deaths among them would counterbalance the excess of male births. The greater mortality among males is commonly ascribed to the dangers of their occupations, as soldiers, sailors, miners, and factory and railway hands. Men are also more addicted to vice, crime, and excesses of various kinds which shorten life. When we consider that the different countries of Europe differ both in the relative number of males to females born, and especially in the dangers to male life owing to differences in occupation, we can readily understand that the proportions of males to females might vary greatly even from these natural causes. It is not, however, always true that mortality among males is sufficiently great to overcome the excess of male births. In Italy, from 1865 to 1880, the excess of births
42
STATISTICS AND SOCIOLOGY.
over deaths among males was 1,567,091, while among females it was only 1,417,955. Italy has in its population an excess of males. 1 Among uncivilized peoples there seems to be usually an excess of males, although our data are not very certain. It has commonly been supposed that among savages the constant wars tend to decimate the men, while the women are accumulated as slaves and servants. But whenever peace is established it is probable that the hardships of life and burden of labour fall on the women even more than on the men, while the female life is less valued than the male. It is only upon some such theory that we can explain the excess of males in Asia and Africa. In Europe and America we have a second cause powerfully affecting the relative proportion of the sexes in any particular country, namely, migration. Emigration is a direct cause of excess of females by carrying off more men than women ; 60 per cent of the immigrants to the United States from Europe are males. Emigration is stronger from Great Britain, Germany, and Scandinavia than from France, Italy, or Greece ; this partly accounts for the excess of females in Northern Europe. The relative number of males and females among the emigrants is not the same for different countries. Of the immigrants to the United States from England, 188090, 61.3 per cent, from Scotland 61.6 per cent, and from Ireland only 51.0 per cent, were males. These figures explain the smaller excess of females in Ireland than in the two other divisioas of the United Kingdom. Fewer females are left behind. Of all the emigrants from Ireland, from 1851 to 1892, only 53 per cent were males. In 1892 the numbers were almost equal, 25,495 males and 25,372 females, and in some years there has been an excess of females. The eastern provinces of Prussia show a much 1
Btlcher, Ueber die Vertheilung der beiden Geschlechter auf der Erde. Allgemeines Statistischea Archiv, Vol. II., p. 392.
SEX, AGE, AND CONJUGAL CONDITION.
43
greater excess of females than the western, due probably to the greater emigration. In a new country there is generally a preponderance of males owing to immigration. This is plainly the case in the United States as a whole. The states of the North and South Atlantic divisions show, however, an excess of females, as Massachusetts, 1058, and Rhode Island, 1056, females to 1000 males. This is due to the emigration of inhabitants of those states to the West, and the immigration of females into the factories. The excess of females has diminished since 1880, showing probably an increasing immigration of men. In the South Atlantic states, like the countries of Europe, the excess of females is due to natural causes, e.g., North Carolina with 1024, and South Carolina 1011, females to 1000 males. Some of the Southern states are influenced by immigration, as Florida with only 938, and Texas 906, females to 1000 males. The Western states are typical of newly settled communities, as Montana with only 503 females to 1000 males. Even Utah shows only 882 females to 1000 males, notwithstanding the experience with Mormonism. In a new country the changes from decade to decade are often very marked. In the United States the relative number of females seems to be diminishing, 978 in 1870, 965 in 1880, and only 952 in 1890. This must be due to the large immigration of the past two decades. The result of this has been to decrease the excess of females in those states of the East and the South where there was an excess, and in some cases to turn it into an excess of males, as, for instance, in Maine, Pennsylvania, Tennessee, Alabama, and Louisiana. In the extreme Western states the number of females has increased owing to the settlement of the country. Owing to mortality and emigration the excess of females increases with advancing age. In Germany, up to the age of 10, there are more boys than girls, but from that point
44
STATISTICS AND SOCIOLOGY.
on there is a regular progression in the excess of females. The progression is apt to be interrupted or at least retarded during the period 10 to 15, owing to the increased mortality among girls at that age. In Massachusetts there is an unusual excess of females of the age of 20 to 30, due to the immigration of girls as domestic servants and factory hands. The proportion of males to females does not remain the same from year to year, but varies with social causes such as those mentioned above. In France the movement has been almost constantly in the direction of greater equality in the relative number of males and females. In 1821 there were 1059 females to 1000 males, in 1891 there were only 1007. In Scotland the proportion was 1128 in 1821 and only 1072 in 1891. Is this an effort of nature to restore equilibrium ? In England the change has been the other way, the number of females to 1000 males having been 1038 in 1821-31 and 1060 in 1881-91. Sex in Cities. In large cities there is commonly an excess of females. In England there were 109 females to 100 males in the urban districts, while in the rural districts the proportion was only 101 to 100. Up to the age of 10 there is practically no difference in this respect between the two districts, the proportion of males being almost the same as that of the other sex. After the age of 10 the girls begin to migrate to the towns as domestic servants, leaving their brothers behind them, and this migration continuing during the next period, the proportion of females at the age 15 to 20 is, in towns, 107 to 100 males, while in the rural districts it is only 87. Then begins the migration of men to the towns, so that the excess of females is diminished. During the age period 35 to 45 the proportion is very nearly the same. As old age comes on, the excess of females in towns again becomes very large. There are two possible explanations of this: — One is that old men migrate from the towns back to the countrv,
SEX, AGE, AND CONJUGAL CONDITION.
45
and the second, that town life is more inimical to old men than to old women. Dr. Ogle thinks that both of these causes are at work. He finds that the death-rate for persons from 55 to 65 years of age was in London 34 per cent greater for males than for females, while in the rural districts it was only 16 per cent greater. The other assumption is incapable of statistical proof, but men become incapacitated for work earlier than women, to whom a variety of light occupations is still open even in advanced age, so that it is not improbable that they retire to the country, where living is cheaper, at an earlier age than old women.1 Statistics of other countries show a similar excess of females in cities. Distribution by single years makes Population by Age. so many divisions that it is customary to group the population by quinquennial or decennial periods. In countries with increasing population the lower age classes are always well filled. The typical example is Germany, where onethird of the population is under the age of 15. In countries where the population is stationary, the middle-age classes are well filled and there is a large proportion of old men. France is the typical example. England is a country where population is increasing at a moderate rate and stands between Germany and France. Ireland approaches France because population is decreasing, but emigration taking away a large number of adults makes the proportion of children larger than in France. On the other hand, the number of children in Ireland is smaller than in either England or Scotland, while the number of old people is greater. The real weakness is in the age class 30 to 40, that is, in the productive years. Immigration influences the population of a country by increasing the proportion in the middle-age classes and decreasing that of the children and old people. In the United States we have several classes, the whites and 1 Census of Eneland. 1891. Vol. IV.. d. 31.
46
STATISTICS AMD SOCIOLOGY.
coloured, the native and the foreign-born. The foreignborn have very few children because there are very few children among the immigrants, and the children born here go to swell the number of the native-born. The various contrasts are shown in the following table: Population bt Age. Pbbcbktaqb in Each Gboup.1 England. Under 10, 23.9 10 to 20, 21.3 20 to 30, 17.2 30 to 40, 13.1 40 to 50, 9.9 50 to 60, 7.1 60 to 70, 4.7 70 and over, 2 . 8
Sootland. 24.3 21.6 16.8 12.6 9.6 7.2 4.8 3.1
Ireland. 20.8 23.4 16.2 10.8 9.8 8.6 6.0 4.6
Franoe.
Germany.
United U. 8. United Statu. Foreign States White. Coloured.
17.6 17.4 16.3 13.8 12.3 10.1 7.6 6.0
24.2 20.7 16.2 12.7 10.4 7.8 6.2 2.8
24.29 21.70 18.24 13.49 9.45 6.38 3.94 2.61
3.67 10.06 21.81 19.88 18.06 13.63 8.66 4.34
28.23 26.19 17.40 11.20 7.89 4.92 2.87 2.26
Large cities generally have a large proportion of adults from the age of 20 to 40, owing to the influx of strangers. In Germany (1885) the population was distributed as in the accompanying table.' Age. Under 20 20 to 40 Oyer 40
Large Citte«. 39.8 37.2 23.6
An Germany. 44.9 28.8 26.3
100.0
100.0
Some industrial cities, however, show a large number of children due to the large number of young married persons and the heavy birth-rate. This varying age constitution of urban populations is an important consideration in calculating the real death-rate, as we shall see hereafter. The Western states of the United States are very much like cities in this respect. Population may be grouped in many other different ways for particular purposes. One is as productive and 1 2
Stat. Archiv, III., pp. 403 f t U. S. Census, 1890. Brückner, in Allg. Statis. Archiv, I., p. 651.
SEX, AGE, AND CONJUGAL CONDITION.
47
unproductive, taking those from the age of 15 to 70 as productive and those below or above that age as unproductive. Ordinarily the productive population varies between 60 and 70 per cent of the whole. The United States shows the smallest percentage, namely, 60.1, while France shows the largest, namely, 68.2. It would seem as if France were in the better situation ; but we must also consider that the small number of children now may make a small number of producers in the future. Military Age. It is sometimes of interest to know the proportion of males capable of serving in the army. This is to a certain extent indicative of the military strength of the nation. The proportion of those actually in the army is indicative of the burden of military service. Ordinarily the military age is said to be from 18 to 44 or 45 years, both inclusive. In England the males 18 to 45 years of age were 19.5 per cent of the total population. In Germany, in 1885, males between the ages of 18 and 45 numbered 9,128,722, or 19.4 per cent of the total population. The proportion varied in different parts of the empire, being generally high in the large cities, as, for instance, Berlin, 25.2 per cent, Hamburg, 23 per cent; and low in the country districts such as Wurtemberg, 17.8 per cent, Posen, 17.8 per cent, etc. We may say, however, that, as a rule, about one-fifth of the population of Germany is of an age to serve in the army. The proportion of those who may be actually called into service (from the age of 20 to 37) comprises 6,134,578 males, or 13 per cent of the total population, and this represents the total number of men from whom Germany recruits her army. Of course only a small proportion of these are in actual service. In 1894—95 the German army and navy numbered 605,046 out of an estimated population of 51,217,000, that is, a little over one per cent. In the United States the males 18 to 44 years, both inclusive, numbered 13,230,168, that is 21.1 per cent of the
48
STATISTICS AND SOCIOLOGY.
total population. Of the whole number, the native-born constituted 10,424,086, or 78.79 per cent, and the foreignborn 2,806,082, or 21.21 per cent. Since the foreign-born constitute only 14.77 per cent of the aggregate population, they are excessively represented among those of military age. If we separate the two classes we find that the native whites of military age are 19.8 per cent of the total native white population ; while the foreign-born of military age are 29.7 per cent of the total foreign-born population. These proportions are explained of course by the facts mentioned above. Voting Age. The number of persons of an age to exercise the right of suffrage is of some interest, especially when brought into comparison with the actual number exercising the right. In Germany the number of males 25 years of age and over (the age required for voting for members of the Reichstag) is 22.3 per cent of the total population. It is higher in cities and lower in the country, as usual. In the United States the number of males 21 years of age and over is 27.05 per cent of the total population. Here we have several classifications that are of interest. Of the total number of males 21 years of age and over, 74.33 per cent are native-born and 25.67 per cent are foreignborn. The potential voters among the foreign-born number 47.01 per cent of the foreign-born population. The voting strength of the foreign-born would thus seem to be formidable. But they cannot vote until they are naturalized, so that although the foreign-born males 21 years of age and over are 25.67 per cent, yet only 58.55 per cent of them being naturalized it reduces their actual voting strength to 15.02 per cent of the total males 21 years of age and over. If we consolidate the foreign vote and the native vote of foreign parentage, the percentage for the whole of the United States is 34.77. The possible vote may be still larger than this as foreigners become natural-
SEX, AGE, AND CONJUGAL CONDITION.
49
ized. Male native whites of native parentage constitute only 51.98 per cent of the total male population 21 years of age and over. That is to say, only about onehalf of the potential voting power among the men in the United States is held by whites of American birth and parentage. School Age. The number of children of school age is a matter of interest, especially in countries where there is compulsory school attendance. There is some difference in custom as to the limits of the school age in various countries, and in different states. In England the children from 3 to 13 years of age were 23.2 per cent of the whole population. In Germany the compulsory school age is from full 6 years to under 14 years. In 1885 the number of children of that age amounted to 8,G09,198, or 18.3 per cent of the total population. In the United States, in 1890, the number of children from 5 to 17 years, both inclusive, was 18,543,201, or 29.6 per cent of the total population. The native whites between 5 and 17 years were 14,946,990, or 32.5 per cent of the total native white population; while the foreign whites of school age were only 917,475, or 10 per cent of the total foreign white population. This great difference in proportion is due, again, to the large number of adults among the immigrants, and to the fact that the children of the foreigners born in the United States are classed aa natives. If we take these native whites of foreign parents we shall find that there are 4,400,105 of school age, showing a percentage of 38.2 of that class. The coloured of school age constitute 2,678,736 persons, or 35 per cent of the total coloured population. This seems to be an enormous proportion. The interesting point in these comparisons is to show the burden of common school education which rests upon the different states. In this respect the proportion of children of school age in the United States is very heavy. The very large proportion among the
50
STATISTICS AND SOCIOLOGY.
coloured increases the burden because they are of the ignorant classes, and the large number of those of foreign birth or at least of foreign parentage also renders the task more difficult. In European censuses other age classifications are often made. In Germany we have the age of majority from the completed twenty-first year, the number of persons of that age being 53.3 per cent of the total population, varying from 60.5 per cent in Berlin down to 48.5 per cent in an agricultural district like Posen. In the same way we have the marriageable age. In Germany the men 20 years of age and over constitute 26.5 per cent of the total population, and the women 16 years of age and over constitute 32.3 per cent. Then we have the women of childbearing age, that is from 17 to under 50, who constitute in Germany 22.9 per cent of the total population. All these combinations and other similar ones may be made up for any country from the tables of population according to age.1 Average Age of the Living.
I f w e take all the people
of a country and add together their ages and divide by the number of people, we have the average age of the living. In Germany it is about 27 years; in France it is, for males, 30.69 and for females, 31.19 years ; in England it is 25.31 for males and 25.86 for females. This average age of the living is sometimes confounded with the average length of life, or the probability of life. But it is not safe to draw any conclusions from this number as to the health or viability of a community. For the average may be made up from a great variety of figures, the result of many different causes, some of which are favourable and others unfavourable to the well-being of the community. A large infant mortality, by leaving a relatively small number of individuals in the lower age 1 Jahrbuch, 1889. Census 1891, p. 30.
Similar figures for England in General Report,
SEX, AGE, AND CONJUGAL CONDITION.
51
classes, would increase the average age of the living, although it would not be a sign of good economic or social conditions. Thus, in Bavaria, where infant mortality is very great, the average age of the living is more than 29 years. In France the average age is also very high, but owing to an entirely different reason, namely, a small number of births. Emigration of full-grown men and women tends to diminish the average age of the living, and immigration of the same classes tends to increase it, although neither may have anything to do with the general health of the community. Conjugal Condition. In studying the conjugal condition of the population we take only the persons over 15 years of age, because marriage does not begin until that age. The relative proportion of the four classes ( omitting the divorced, who are a mere fraction ) in various countries is shown in the following table : 1
Austria . . Hungary. . Switzerland Italy . . . France . . Great Britain Ireland . . Belgium . . Holland . . Germany Sweden . . Norway . .
Percentage of Females oYer 15 who are Married. Widowed.
Percentage of Male* oyer IB who are Single. Married. Widowed.
Single.
43.8 31.5 45.2 40.9 36.0 39.5 49.3 46.0 42.2 40.9 42.6 43.3
40.0 22.0 41.6 33.2 30.0 37.3 43.5 41.8 38.7 36.5 40.8 41.7
61.3 63.7 48.0 53.1 66.5 64.9 44.8 47.6 62.0 63.7 61.9 61.0
4.8 4.7 0.4 6.0 7.5 6.6 6.9 6.6 6.8 6.3 6.4 6.6
48.1 62.8 45.6 53.2 56.3 50.9 42.1 47.1 49.8 60.8 47.1 47.0
11.8 15.0 12.3 13.6 14.7 11.8 14.4 11.1 11.4 12.4 12.0 11.1
This table shows us some interesting differences. The married males are generally a little over 50 per cent of the males above 15, and the married females are somewhat less. The larger proportion among the males is due i Statistik des Destechen Reichs, No. 44, p. 36.*
52
STATISTICS AND SOCIOLOGY.
to the fact that marriage is more often dissolved by the death of the husband than by that of the wife, so that there are always more widows than widowers. This is seen clearly in the columns headed "widowed." Widowers also remarry more frequently than widows, thereby increasing the proportion of "married." The proportion of widows is almost always twice that of widowers. There are striking differences between countries. Hungary has a very large proportion of "married." This is probably due to early marriages, as shown by the fact that only 22 per cent of the women above the age of 15 are single. Early marriages (and remarriages of widowers, which are said to be frequent in Hungary) produce many widows, as is seen in the high proportion (15 per cent). France also shows a large proportion of widows, due to the comparatively large number of old people. In Ireland the proportion of married persons is very small, on account of the emigration of young men and women of marriageable age. The contrast between two countries lying side by side like Belgium and Holland is very noticeable. It probably means that marriage is deferred to a later age in Belgium. The importance of these statistics lies in two directions. They point to fundamental differences in the constitution of the population of different countries which must have some effect on the social organization, the life, and activity of the community. And the relative number of the single, married, and widowed affects also all vital statistics, especially births. Conjugal condition seems also to affect certain social phenomena, such as crime, vice, suicide, and pauperism. This classification is therefore fundamental for any precise characterization of such phenomena. Conjugal Condition by Age. Whether a man is married or not depends very much upon his age. If we distribute the population into three classes, 15 to 40, 40 to 60, 60 and over, we shall get more precise results in regard to
SEX, AGE, AND CONJUGAL CONDITION.
53
conjugal condition. The figures for Germany (1872-80) are shown in the following table : MEM
15-40
Single . . . . Married . . . Widowed and D.
40-60
WOMEK
60 and orsr
16-40
40-60
60 and over
. 62.1 . 37.3 . 0.6
9.6 84.8 6.6
8.2 62.2 20.6
63.6 44.6 1.9
12.1 70.2 17.7
11.3 36.5 63.2
100.0
100.0
100.0
100.0
100.0
100.0
A careful study of this table shows some very interesting differences between the two sexes. In the lowest age class, 15 to 40, the proportionate number of single is greater among men than among women, while in the upper age classes it is less. This is due to the fact that in the earlier years single women marry more frequently than single men, while at a more advanced age they have less chance of marrying. In the upper age classes the proportion of the married is greater among men than among women because of earlier widowhood among women and the fact that widows have less chance of remarrying than widowers. For the same reasons, the proportion of widowed and divorced is greater at all age periods among women than among men. It would lead us too far to carry out all these details of conjugal condition according to sex and age for different countries. Some special points may be noticed which are of interest. Von Mayr has remarked that the proportion of married persons to the population over 15 years of age gives us no exact information as to the number of persons unable or unwilling to get married, because at the age of 16 marriage is just beginning. If we take, however, the proportion of persons 60 years of age and over who are not and never have been married, we have some indication of the number of people unable or unwilling to marry. In the above table for Germany 8.2 per cent of the men
64
STATISTICS AND SOCIOLOGY.
and 11.3 per cent of the women above the age of 60 are still single. In England, Germany, and France the proportions are about the same. In Sweden and Norway they are lower, while in Holland, Belgium, Italy, Switzerland, Austria, and Ireland the proportion is over 10 per cent, in some cases running as high as 15 per cent. It would seem from these figures that the normal proportion of bachelors in the population above 60 was about 10 per cent, and of single women was somewhat greater. There are, however, considerable variations due to peculiar age constitution or to particular laws and customs. In a portion of Bavaria, for instance, owing to the influence of the old marriage laws, 16.9 per cent of the men and 25.7 per cent of the women above the age of 60 are still unmarried. In the other part of Bavaria called the Palatinate the proportions are only 5.2 and 10.1 respectively.1 Von Mayr also tries to indicate the commonness of the marriage state, that is, the proportion of marriageable people whom we may ordinarily expect to find living in the married state. For this purpose we may take the proportion of married persons between the ages of 40 and 60. At that time most marriages have been consummated, while not too many have been broken by death. The normal number appears to be about 75 per cent. In Germany (see above) 84.8 per cent of the men and 70.2 per cent of the women, between 40 and 60, were living in the married state. Similar statistics for other countries give about 80 per cent for men and 70 per cent for women. Switzerland, Belgium, and Ireland seem to have smaller proportions among both men and women, about 73 per cent for men and 62 (Belgium 68) for women. In the case of Ireland the reason for this is emigration. In 1 Dr. Ogle has shown that celibacy is least among shopkeepers, then come artisans and labourers, while the proportion of permanent bachelors is by far the greatest among the professional and independent class. Jour. Stat. Soc., 1890, p. 276.
SEX, AGE, AND CONJUGAL CONDITION.
55
Switzerland and Belgium there is a very large proportion of single persons in the population 40 to 60 years of age, running over 19 per cent, while the ordinary proportion in other countries is from 12 to 15 per cent. There seems to be a strong tendency for men and women in these countries to remain single. If we compare the conjugal condition of men and women at successive quinquennial age periods we shall have a vivid picture of the family life of the community. Below the age of 15 all the men are single. At the age of 20 they begin to marry, and at the age period 25 to 30 the number of married is about equal to the number still single, while a few have already become widowed or divorced. From this point on the relative number of the married compared with the single is always greater, although from the age period 30 to 35 the absolute number begins to decline. In other words, death carries off more married men than marriage is able to create out of the ranks of the single and the widowed. The number of the widowed increases steadily until the age period 75/ to 80, when it exceeds that of the married. From that time on the absolute number of widowers decreases because the source of supply is exhausted. Among women the process is a little different because marriage occurs at an earlier age. In the age period 25 to 30 the married and widowed women are almost double the single women ; at the age period 60 to 65 the widowed and divorced already nearly equal the number of married women ; from the age of 65 the proportionate number of widows to married women increases enormously. The above description relates to the age classification according to conjugal condition as shown by the Prussian census of 1890. In other countries the particular relations might be slightly different owing to differences in age distribution and in the time of marriage, but the general course of events would be the same.1 1
Zeitschrift des Preuss. Bureaus, 1892, p. 233.
56
STATISTICS AND SOCIOLOGY.
In Massachusetts, in 1885, they compared the number of native-born persons 20 years of age and oyer with the foreign-born of the same age as regards conjugal condition. It was found, of course, that the number of married among the foreign-born was proportionately greater than among the native-born, because the foreigners are very largely in the early years of manhood and womanhood. Of the foreign-born 53 per cent were married and 10 per cent widowed, while of the native-born only 32 per cent were married and 6 per cent widowed.1 These figures give rise to interesting reflections in regard to the increase of the foreign element in the United States. Scientific Tests. There is no doubt that the statistical method is the proper one for the classification of population according to sex, age, and conjugal condition. The chief question is whether there are any particular difficulties connected with the collection ot the statistics, and whether they can be tabulated in such a way as to show social relations. In regard to the statistics of sex there is ordinarily no reason to doubt their accuracy. Even where a census is defective there would seem to be no reason why one sex should be omitted more than the other, so that the relative number of males to females would seem to be pretty well established. There are, however, some exceptions to this. One of the most remarkable is furnished by the last census of India, which returned six and a quarter million fewer women than men. This made a proportion of 958 females to 1000 males. The proportion varied in the different provinces between 804 and 1084 to 1000. There has been much discussion as to whether this small proportion of women is due to omissions, or whether the number of women is really so much smaller than that of men. Undoubtedly part is due to simple omissions. Women are 1 Census Mass., 1885, I't. I., p. 63.
SEX, AGE, AND CONJUGAL CONDITION.
57
held in such low esteem that many males, heads of households, would simply neglect to return daughters or female servants, not thinking the matter of sufficient importance. Others having daughters of marriageable age not yet married, would neglect to return them on account of a feeling of shame, and among the hill tribes there is said to be considerable jealousy in regard to their wives and daughters. From these various causes it is believed that there were very considerable omissions in the number of females returned, the largest deficiency being between the ages of 10 and 15. A t that age there were only 795 girls to 1000 boys. It is probable also that there are real causes tending to decrease the number of females. Infanticide is not now practised to any great extent, but girls are still regarded as more or less of a burden because a dowry must be provided for them when married, so that they are less well taken care of than boys. Early marriages, childbearing at immature age, and insufficient medical care are also fatal to the life of the female. Later on in life there is not that distinction of employments which increases the mortality of men in European countries. The mass of the people in India are engaged in agriculture, and women share equally with men in the labours of the field. Mortality tends to bear equally on the two sexes, so that it is not until the age of 60 that the number of surviving women is greater than the number of men.1 In Europe we do not find any such prejudices in regard to returning the true number of either sex. Occasionally there are practical difficulties in getting at the number of men belonging to a given community. This is due either to their absence as soldiers, marines or sailors, or to the agglomeration of men in particular localities, either soldiers in garrison, or men drawn together by industrial works. The most striking example of this is England. If we exclude the army, navy, marines, and mer1
Census of India, 1801, p. 244.
58
STATISTICS AND SOCIOLOGY.
chant seamen abroad, the number of females is 1063.3 to 1000 males; while if we include these classes the number of females is only 1049.1 to 1000 males. I t is necessary for us to know whether these classes are included or excluded in the enumeration of any country. The chief scientific test, therefore, is to examine the figures with care in order to see whether the excess of males or females may not be due to some purely local and possibly temporary cause. The general causes are those noted above, viz., the greater mortality of men, emigration, and immigration. These may be called real social causes, that is, they are wide-spread and general in their nature. Emigration, it is true, may be merely temporary, like the Irish passing into England, and Italians across the frontier into France at harvest time or some other occasion for securing work. The time of taking the census might have great effect in distorting the relative number of the sexes for particular sections owing to these temporary causes. It is desirable, where possible, to eliminate these influences. A very good illustration of local and temporal influences is found in the relative number of the sexes in the cities of Germany, which, as a rule, show a large proportion of females compared with males. This lias not always been so. In Prussia, in 1867, there were only 990 women to 1000 men; in 1875 there were 1006; and in 1885 and 1890 there were 1037. It is somewhat difficult to account for this growing excess of females. The true reason seems to be the establishment of factories employing women. Owing to this cause the migratory movement, which was formerly much more prominent among men, has seized the women also.1 There are still some cities, however, where there is an excess of males. These are the garrison towns like Magdeburg, Strassburg, Metz, Mayence, Potsdam, and 1 Stat. Jahrbuch deutscher Stadte, 1892, p. 21. 1892, p. 147. Allg. Stat. Arcbiv, 1890, p. 628.
Preuss. Zeitschrift,
SEX, AGE, AND CONJUGAL CONDITION.
59
Kiel, and places like Dortmund and Essen, where there are large ironworks. When we consider the general reasons for an excess of one sex over the other, aside from the particular cases mentioned above, it is interesting to ask whether the relative strength of the different influences can be measured. Such an attempt has been made in Prussia. From 1871 to 1885 the statistics of births and deaths show that there should have been an excess of 59,250 women over men. As a matter of fact, by the census of 1885, there was an excess of 174,689 women. How shall we account for this difference of 115,389 in the excess of women? If we take the statistics of emigration from 1872 to 1885, we shall find an excess of 107,803 male over female emigrants. This almost exactly balances the deficiency of women noted above. It seems, therefore, that the excess of women over men in Prussia is due about two-thirds to emigration and one-third to natural causes. 1 Trustworthiness of Statistics of Age. The statistics of age are much more uncertain than those of sex, because many people, even in a civilized community, are ignorant of their exact age or give it wrongly from pure carelessness. This is shown by the well-known tendency for the ages to concentrate on the years ending with a 0 or the figure 5. Changes from age to age should be gradual, unless some unusual event has occurred to diminish or increase the normal number of a certain age. But there is always a larger number returned as of the age of 40 years than of either 39 or 41, more of 50 years than of either 49 or 51, etc. Some illustrations are as follows: Massachusetts, Massachusetts, Massachusetts, Massachusetts, Massachusetts, Massachusetts, 1
1885, number of persons 39 years old was . 1885, number of persons 40 years old was . 1885, number of persons 41 years old was . 1885, number of persons 44 years old was . 1885, number of persons 45 years old was . 1885, number of persons 48 years old was . Zeitschrift des Preuss. Bureaus, 1888, p. 231.
. . . . . .
. . . . . .
21,972 88,381 18,061 18,489 30,878 18,307
60
STATISTICS AND SOCIOLOGY.
Even in Prussia, where the common people are well educated, we find that while the number of people returned in 1890 as 40 years of age was 372,604, the number of 39 years was only 335,607, and the number of 41 years was 337,596. In India, where the population is very ignorant, the concentration on the decennial periods is extraordinary. Out of 100,000 persons of all ages the number returned as 40 years of age was 5240, of 39 years was 322, and of 41 years was 216. In India the termination 5 is the next favourite, the figure 2 stands third, and the figure 8 fourth. In England the number of women returning themselves as from 20 to 25 years of age is always greater than the number of girls 10 to 15 years of age ten years previously, although they are only the survivors of the latter after a lapse of ten years, and should of necessity be fewer in number. The absolute numbers in the age classes are evidently far from being correct and are not safe to use by themselves. If, for instance, we find a small number of people in the age class 19, in 1890, in Germany, it is not permissible to attribute it to a small number of births in the year 1871 on account of the war. Various devices are used to combat this difficulty. One is the arrangement by periods, 0 to 4, 5 to 9, 10 to 14, 15 to 19, 20 to 24, etc. Here each period contains a year of concentration ending with a 0 or a 5, while the depleted years each side of the 0 or 5 fall into different periods. In England they take the decennial periods 25 to 34, 35 to 44, 45 to 54, etc., so that the year ending with 0 will fall in the middle of each class. There are some difficulties even here, for sometimes other years, such as 18 and 21, are favourites either among men or women. Where arbitrary classes are made, as from 5 to 17 (school age), 17 to 45 (military age), 17 to 49 (child-bearing age), these difficulties are not removed. The result is that it is possible to use these age classifications only in a very general way.
SEX, AGE, AND CONJUGAL CONDITION.
61
A second device is to control the return by other statistics. There is apt to be a larger number of children two years old than one year, although the reverse should be the case. This seems to be due to a confusion in the minds of the parents as to whether two years old means in the second year or in the completed second year. This can sometimes be controlled by means of the registration lists of births and deaths. Among those of middle age this means of control is useless because migration is so active that reference to the registration lists is of no avail. At the other end,—persons of extreme old age,—an investigation can be made for each case. By this means the number of centenarians is being steadily reduced from census to census, as greater care is taken to investigate the proof. In Prussia the number of persons declared to be 100 years old in 1890 was 149, of whom more than one-half were discovered upon investigation to be of less age; and of these 8.8 per cent were found to be from 95 to 100; 14.3 per cent between 90 and 95 ; and the rest not yet 90 years old. 1 Statistics of Conjugal Condition. Ordinarily there would seem to be no difficulty in believing the statements of persons in regard to their conjugal condition. The number of married women always exceeds that of married men (England, 1891, 4,916,649 wives, 4,851,548 husbands). This is due to the absence of the husbands, although probably in some instances women return themselves as wives when they have no right to that title. It is also believed that many divorced persons called themselves widowed in the census return. This may account for some of the excessive rates of crime, insanity, suicide, etc., found among the divorced. In the particular phenomenon careful inquiry is made about the conjugal 1 This was in a total population of 30,000,000. In South Carolina, in 1840, out of a coloured population of 336,000 there were 228 reported aa 100 years of age and over!
62
STATISTICS AND SOCIOLOGY.
condition of the person, while in the census such careful inquiry is lacking. 1 The proportion of married persons in the population does not always vary according to the number of marriages. In England the average annual marriage-rate in the period between the censuses of 1881 and 1891 was very considerably lower than that of the next preceding decennium, but the proportion of married persons decreased very slightly. This is explained by the fact that while a decline in the marriage-rate has primarily the effect of diminishing the proportion of married men and women in the population, it has the secondary effect of diminishing the number of children born, and thus of cutting down also the proportion of the unmarried. This would not happen if we took simply persons above the age of 15 for our standard. 2 Reflective Analysis. The distribution of population by sex and age shows the working of a variety of causes. Can we generalize from these to sociological laws of wider bearing, tracing back the peculiarities of sex and age distribution to natural factors, or to social factors of universal significance? Can we, for instance, trace any influence of climate or topographical features upon the proportions of the sexes or of the age classes ? Can we show that the proportions vary according to the stages of civilization? Only the most general results are to be expected. A German statistician traces the natural influences on the proportion of sexes as follows: In cold climates there should be more men than women because life makes greater demands on mere physical strength. In warm climates there should be more women than men. Social conditions, however, affect the proportion of the sexes. 1 3
Westergaard, Mortalität und Morbilität, p. 35. Census of England, 1891, General Report, p. 33.
SEX, AGE, AND CONJUGAL CONDITION.
63
The hunting and nomadic conditions are more favourable to men than to women. In early agriculture the women bear the burden as well as the men, and being less strong, perish earlier. As civilization advances the economic position of woman improves and disastrous social events such as wars, pestilences, hard times seem to bear heavier on the men, and we find an excess of women. Among particular civilized nations or sections of countries the variation in the proportion of the sexes seems to be due neither to climate nor to race, but to social causes, the principal of which are emigration and immigration, and industrial development. Similar remarks would seem to hold good in respect to the distribution of population by ages. It is not probable that climate and race have any influence except as they are the underlying causes of varying social conditions. The distribution itself is determined by the rate at which population is increasing, and by the chances of life at different ages. Among savage and barbarous tribes there is commonly a large number of births, but owing to the hardships of the life there is great mortality. Among such peoples there are very few old men, and thus the tendency is to depress the age classes. As nations become more civilized greater care is taken of human life and the upper age classes are better filled out. If it is a progressive nation population continues to increase, that is, the number of births is greater from year to year, so that the lower age classes are also well filled out. A typical case of this sort is Germany. Increase in population may also be brought about, not by increasing the birth-rate, but by decreasing the death-rate through sanitary and economic improvements. In such a case the lower age classes will be proportionately smaller, while the middle and upper classes will be strengthened. An approach to such a type is seen in England. Where population is declining, although the upper classes may be well filled, the weak-
64
STATISTICS AND SOCIOLOGY.
ness of the lower ones is fatal for the future. W e have no example of this among civilized nations, although the stationariness of population in France has alarmed some of her economists and statesmen. W i t h her, however, the question is not so much sociological as political, owing to her military rivalry with Germany, a country of rapidly increasing population. Various important social results follow the distribution of population by sex, age, and conjugal condition. A large excess of unmarried males or females may lead to conditions resulting in social vice or to the dependence of a large class in the community. I t leads often also to varying social ideals in regard to the position and privileges of women. There seems to be no " n a t u r a l " law of equality in the number of the sexes such as was formerly asserted as a support for monogamy. One or the other is always in excess. I t is necessary for us to discover the reasons for this excess in order to adjust social institutions to actual conditions. The varying distribution by age and sex affects the economic productive power of the community, as has been insisted upon above. Such age distribution is an index of the economic strength of the nation. The productive ages must always support the unproductive. I t is true that the actual age distribution does not seem to be within the control of man. But its careful study may enable us to judge of the influence of social forces which can be encouraged or discouraged by public opinion. This fundamental classification of population is the result of great natural and social influences. In all cases it is necessary to an understanding of social phenomena, and in many it gives us the explanation of facts of practical bearing on social life.
CHAPTER
V.
BIRTHS.
Sociological Purpose. THE population of the world or of a country is constantly losing by the death or withdrawal of certain individuals and constantly gaining by the addition of others. It is like an army whose ranks are depleted by deaths and desertions but continually refilled with new recruits, the total number of the army perhaps increasing, perhaps decreasing, perhaps remaining the same. Statistical observation has three questions to investigate here : ( 1 ) Is population increasing or decreasing ? — this is merely to establish a fact which can be established only by statistical enumeration. ( 2 ) At what rate is population increasing or decreasing ? — this also is merely the establishment of a fact. ( 3 ) What are the causes of the increase or decrease ? This last is the attempt to establish a connection of cause and effect in social phenomena by means of statistical observation. For the world at large the immediate cause of an increase or decrease of population is the relation of the number of births to the number of deaths. The facts for a particular country may be distorted by emigration and immigration, but from the standpoint of statistics they are secondary phenomena. Back of them lie births and deaths as primary factors. Births are the primary phenomenon of a continuing population. If it were not for births population would F
66
66
STATISTICS AND SOCIOLOGY.
cease. Hence they are the foundation of all demographic or demological inquiries. The sociological purpose of our investigation extends in several directions in accordance with the questions noted above. In the first place we have merely to constitute a fact, namely, what is the number of births in a country at a given time or in successive periods of time. This bare fact has great political and social interest. In connection with the number of deaths it determines the natural increase of the population, the population of the future, the relative strength of nations. For the purposes of comparison, the number of births is commonly expressed by a birth-rate, i.e., the number of births per annum per 1000 of the population. This birth-rate (although somewhat crude in itself) enables us to compare the births in different countries or in the same country from year to year. Its connection with the death-rate reveals a variety of conditions of great sociological interest. A population may increase by having a large birth-rate and a large death-rate ; or it may increase by a comparatively small birth-rate accompanied by a correspondingly small death-rate. It is, however, evident that these two different relations create different social conditions. A large or small birth-rate creates a different age distribution, with certain important consequences to be mentioned hereafter. I t is also a matter of social interest to observe the birth-rate among different classes in the community, the rich and poor, urban and rural, agricultural and industrial, and in such a country as the United States between the whites and blacks, the native and foreign-born. The mere relative growth of these different classes is often a matter of interest. The particular sociological purpose, therefore, of enumerating the number of births in any community is to bring out these facts clearly and scientifically in order to direct attention to social conditions. But there is a range of questions in regard to births,
BIRTHS.
67
lying deeper than these, viz., what is the cause of a large or small birth-rate or of variations in the birth-rate ? We can conceive of two sets of causes, natural and psychological. In the individual cases, births are a pure process of nature ; but their total number may be affected also by social-psychological causes influencing large bodies of men. Is it possible for us to demonstrate that the number of births is influenced by purely natural causes, such as climate, geographical and topographical position, the seasons, etc. ? Then there are great influences which are partly natural and partly social, such as race, density of population, residence in city or country, occupation, good or bad nourishment, economic prosperity, social hopefulness and ambition. Do any of these have influence in determining the birth-rate ? Finally, do social customs in regard to marriage, family life, sexual morality, public opinion, have any influence on the number of births ? All these questions may be reduced to two, namely, the influence of physical and the influence of social environment. Some minor characteristics of births are subject to the same analysis. The number of boys and girls born, the still-born, and multiple births seem to be due to physical laws of which we have little or no knowledge. The number of illegitimate births in connection with the great social institution of marriage and with the state of public morality, or at least public opinion, is of great importance. What are the laws which govern these phenomena, and what is their relation to social conditions and social progress ? Statistical
Data.
For purposes of comparison the number of births is expressed as a rate, that is, the number of births per annum for each 1000 of the population. This is called the crude birth-rate, but it is sufficiently accurate for
68
STATISTICS AND SOCIOLOGY.
general purposes. We have exact statistics of births for the countries of Europe only, and even in Europe the statistics for Russia, Spain, Greece, and Turkey are not very trustworthy. Taking the average for a period of twenty years in order to avoid accidental fluctuations, we have the following birth-rates : 1 Hungary (1870-90) Austria Germany . . Italy Holland England and Wales Scotland United Kingdom . Denmark . . . Belgium Norway Sweden Switzerland . . Ireland France
. . . . .
.
ATtnp 1871-90. 44.0 38.6 38.1 87.3 36.2 34.0 33.6 32.6 31.7 31.0 30.7 29.8 29.4 24.9 24.6
1891. 42.3 38.1 37.0 37.3 33.7 31.4 31.2 30.4 31.0 29.6 30.9 28.3 28.3 23.1 22.6
1899. 40.3 36.2 35.7 36.3 32.0 30.6 30.8 29.6 29.6 28.9 29.6 27.0 28.1 22.4 22.1
1898. 42.6 -
36.7 36.6 33.8 30.8 31.0 29.9 30.6 29.6 30.7 -
28.6 23.0 -
The above table shows wide differences in birth-rates, from Hungary with 44 per 1000 down to France with 24 per 1000. In Russia the birth-rate is commonly supposed to be higher still, running up to 49 per 1000. Influence of Climate, Geographical Position, and Race. To study such influences it would be necessary to have statistics of the different parts of the world. But in barbarous or uncivilized countries such statistics are entirely lacking or very imperfect. It is generally supposed that in warm climates births are more frequent than in cold. The women marry younger, the climate makes less demands upon their energy, there is greater improvidence in regard to the future; hence there is a large number of children, 1 Report of Registrar General, England, 1893. (The rates are exclusive of still-born. Later figures, quoted from German reports, include stillborn.)
BIBTHS.
69
and population is restrained only by the correspondingly large number of deaths. In India the birth-rate is said to be nearly 48 per 1000, greater than in any country of Europe except Russia.1 The women marry at the age of fifteen, and among the higher and middle classes there is a general feeling that the paternal hearth is disgraced by the presence of a girl who has arrived at womanhood unmarried. Notwithstanding the enormous birth-rate, population grows but slowly on account of the abnormal death-rate, which, even if we omit the frequent occurrence of famine and epidemic disease, reaches on an average 41 per mille. What is true of India would probably be true of other hot countries inhabited by uncivilized races. If we look at the above table for Europe, minor variations of climate seem to have no effect. Countries distant from each other, such as Norway and Belgium, have about the same rate ; while adjacent countries, like Italy and France, or Germany and France, have widely different rates. Some authors have discovered a rough geographical arrangement, namely, that the highest rate is in the east of Europe (Russia and Hungary); a lower rate in Central Europe (Austria, Prussia, Germany, and Italy) ; a still lower rate in Northern Europe (Great Britain, Norway, and Sweden). Ireland and France seem to be exceptions. It is evident, however, that this arrangement is only a rough one, and general social condition probably has more influence than either climate or geographical position. The influence of race also seems to be covered by that of general social condition. Uncivilized nations have large numbers of children. The negroes in the United States have a larger birth-rate than the whites, this being due to their low social condition and general improvidence.2 The 1
Census of India, 1891, p. 81. The birth-rate as calculated by the Census of 1890 was for the whole population 26.68; for whites, 26.86; for coloured, 29.07; for whites, with both parents native, 28.68 ; with both parents foreign, 38.29. The 3
70
STATISTICS AND SOCIOLOGY.
same remark may be made in regard to distinctions of race in Europe. The enormous birth-rate in Russia and the eastern provinces of Prussia would seem to indicate great fertility in the Slavonic race. But this again is probably social condition rather than race. W e can trace no distinction between the Germanic or Teutonic and the Romance or Latin races. Among the Teutons, Germany is high, Scandinavia and England low. Among the Latins, Italy is high and South France is low. Density of Population and Birth-rate. It has often been supposed that the density of population had an influence upon the birth-rate. But in the table given above it is impossible to trace any connection between average density and the number of births. Belgium and Saxony, both of which are very densely populated, have very different birth-rates, viz., Belgium 29.6 and Saxony 43.1 in 1891. So England and Scotland have very nearly the same birthrate, although the density of population differs. Even if we take the smaller divisions of the same country, it is difficult to trace any connection between density and birthrate. For the provinces of Prussia, taking the average birth-rate for the period 1841-85, a period sufficiently long to obliterate all exceptional causes, we reach contradictory results. The eastern provinces, with the exception of Silesia, have the least density of population and the highest birth-rate. They are agricultural. But Silesia, Saxony, and Rhineland, which also have high birth-rates, have much more than the average density of population, owing to their mining and industrial occupations. It seems clear, therefore, that mere density of population does not control the birth-rate, but that it is subject to social influences. In England the registration counties in which the birthrates were highest (1891) are the mining and industrial last two figures were only for limited areas. These rates are probably too low by from 20 to 30 per cent, owing to deficiencies in the return of infants " born and died " during the year.
71
BIRTHS.
counties, such as Derbyshire, 33.0; Lancashire, 33.3; Northumberland, 34.1; South Wales, 3 5 . 1 ; Staffordshire, 3 6 . 3 ; Monmouthshire, 36.4; and Durham, 38.2. On the other hand, the lowest rates, in no case exceeding 27.5, were in the agricultural counties, such as Surrey, Sussex, Hertfordshire, Huntingdonshire, Dorsetshire, Devonshire, Herefordshire, Shropshire, Rutlandshire, Westmoreland, and North Wales. Birth-rate in City and Country. In England, where the urban districts consist very generally of industrial and mining towns, there is commonly a higher birth-rate in the cities than in the country. For other countries the evidence is conflicting. For the 47 cities of Germany of 50,000 inhabitants and over, the birth-rate seems to be less than that for all Germany. The figures for the last few years are as follows: 1 1885.
188«.
1887.
1888.
1889.
1890.
Germany. . . 38.6 Cities . . . . 35.8
38.6 35.6
38.4 35.4
38.1 36.0
37.9 35.7
36.9 36.2
If we take another classification, however, namely, the 25 large cities having 100,000 and over, we shall get somewhat different results. Arranged by periods, the birthrate in these large cities was as follows : a 1861-64.
All cities . . . 36.9 Chemnitz . . 47.6 Frankfort . . 21.0
1864-67.
1867-71.
1871-75.
1875-80.
1880-85.
38.7 60.4 26.0
38.3 29.0
41.9 61.8 30.6
42.1 49.3 34.3
37.4 46.3 29.6
This last table shows that the birth-rate in cities varies from time to time and from city to city. For instance, in. all cities there was an enormous fall from the period 1875-80 to the period 1880-85, which is not easily accounted for. There had been a corresponding rise from the period 1867-71 to 1871-75, but that was partly expli1 2
Stat. Jahrbuch deatscher St&dte, II., p. 22. Allg. Stat. Archlv, I., p. 162.
72
STATISTICS AND SOCIOLOGY.
cable by the influence of war upon the first period. The two cities shown in the table represent two extremes, and we see in some cases that the birth-rate in Chemnitz is twice that of Frankfort. In both cities we find the same rapid fall from 1875-80 to 1880-85. It is pretty plain from this evidence that it is not city life in itself which influences the birth-rate, since there are so many variations and in such different directions. The number of births is influenced by the age composition of the population, especially by the number of women of child-bearing age, the number of such women actually married, and the number of new marriages. The rapid growth of cities on account of immigration allows very great fluctuations from time to time in these elements of population. For instance, in the last table the great increase in the birth-rate from 1867 to 1875 was partly due to the great industrial development, which attracted a large number of marriageable men and women to the cities. As that industrial development slackened and immigration fell off, the number of births naturally decreased, because there was a less number of women of marriageable age or newly married, and decreased very much, proportionately, because population was now increased by the large number of children born during the previous decade. Such movements might naturally affect different cities in varying degree, as they shared or not in the industrial development. That would probably explain the difference between two such cities as Chemnitz and Frankfort. Minor differences may sometimes be noted. As, for instance, in some cities the working population and the young married people of the middle classes are accustomed to live in the suburbs, while doing business in the city. If, now, these suburbs happen to lie outside the municipal line, the city birth-rate is apt to be low, while it would be high if they were included. 1 The effect of city life on 1
Brückner, op. cit. Allg. Stat. Archiv, I.
BIRTHS.
73
births cannot be determined by this crude birth-rate. It might be studied by following out the births among the city born and bred, as compared with the country immigrants. Such statistics are not yet available to any great extent. Births according to Religion» Confession, Social Position, It might seem that great and Occupation of Parents. social influences would be expressed under the above titles. But if there be such influences it is difficult to distinguish them. The great religious confessions show no differences. We have about the same birth-rate in a Catholic country like Italy, as in a Protestant country like Prussia. Where both religions are represented in the same country, as in Germany, no difference is visible. Social position has some influence, but it is difficult to follow out on account of the difficulty of classification. Occupations would have an effect principally by affecting the economic position of the parents. Influence of War on the Birth-rate. If we follow the birth-rate of a country by single years we can generally detect the influence of great public events like a war by a depression in the rate during the war period, followed by an unusual rise during the year or two following. Yon Mayr gives the following example of the influence of the war of 1870-71 in Bavaria. 1 Before the war, under normal relations, the number of births was about 16,000 per month. During the war it sank about 2000 per month. Immediately on the cessation of hostilities it rose to its former number, while the actual return of the troops brought an increase of 2000 per month. The maximum was reached in March of 1872, when it was 18,450. The 1 Figures for births are thrown back nine months, so as to show time of conception. Von Mayr believes that the war had a depressing influence apart from the mere absence of the men, as shown in the fact that immediately upon the cessation of hostilities the number recovered, although it was several months before the return of the troops. This and subsequent references are to Von Mayr's earlier book, Die Gesetzmässigkeit im Gesellschaftsleben.
74
STATISTICS AND SOCIOLOGY.
war of 1866 seems to have passed over Germany without ^ny great influence, the birth-rate in 1865 being 39.2; in 1866, 39.4; in 1867, 38.3; in 1868, 38.4. On the other hand, while the birth-rate in 1870 was 40.1, in 1871 it was only 35.9; in 1872 it recovered to 41.1, and remained above 41 down to 1878. Births and the Price of Food. The economic condition of the population has an influence upon the number of births by increasing or decreasing the number of marriages, and even perhaps directly. In former years when the population was mainly dependent upon the local supply of grain, economic prosperity or adversity was expressed by a low or a high price of the grain commonly used for food. I t was then found that if we compared the number of births, marriages, and deaths with the price of food, the first two varied inversely, and the third directly with the price of grain. This connection is seen most clearly in marriages, but may be traced also in births if we take pains to place the births somewhat later than the variations in prices. Von Mayr has shown by means of a diagram that during the 25 years from 1835 to 1860 any violent rise in the price of rye in Bavaria, such as occurred in 1845 and again in 1853, was followed by a fall in the number of births. After 1860 the relation is obscured, and, with a single interruption, births seem to go on utterly regardless of the price of food. There is a local explanation for this, inasmuch as the Bavarian marriage laws, which had been very severe, were relaxed in 1862 and entirely abolished in 1868. This encouraged marriage, and doubtless affected births. Even before 1860 the fluctuations in the price of food were much more violent than the corresponding fluctuations in the number of births, showing that the price of food was only one factor in the economic prosperity of the community. Since 1860, owing to the industrial and commercial development of Germany, the price of food has ceased to be the main factor in the economic life of the
BIRTHS.
75
country. This is still more true of England, so that there the connection between the price of food and births has disappeared, and a better index of economic prosperity has been found in the amount of British exports. But economic prosperity and adversity have a much more direct influence on marriages and deaths than on births, so that it will be better to defer further treatment of the subject to the next two chapters. Births according to Seasons. If we arrange the births of the year according to months, we shall find great fluctuations. The largest number almost always falls in the month of February,1 the minimum number in the month of June or July, while there is a second increase towards the month of September or October.3 From a great number of observations this general tendency seems to be well established, although there are occasional variations in different countries.8 It is possible that we have to do here with some sort of physical law, but this physical law is very much obscured by social influences. One great social influence is the time of marriage. Marriages tend to accumulate about the social festivities of Christmas time,4 and, in Catholic countries especially, in the period just before Lent. 1
Corresponding to conceptions in May and Jane. Some statisticians are disposed to look upon this as pointing to a natural " pairing time " among human beings in the spring, as among some birds and animals. As the number of births is influenced largely by first marriages, and the time of marriage is largely governed by social conditions, the influence is obscured. 3 Corresponding to conceptions In December. 'Observations tend to show the largest number of conceptions in Sweden falling in June, in Holland and France in May-June, in Spain, Austria, and Italy in May, in Greece in April. That is, the farther South, the earlier the spring and the earlier the conceptions. 1 In agricultural districts this concentration is most marked, due perhaps to the leisure following the labours of the autumn. In cities the births are more evenly distributed, showing that artificial life has overcome the influence of seasons and particular occupations.
76
STATISTICS AND SOCIOLOGY.
Such being the causes of the varying birth-rate so far as we can trace them, we now turn to certain facts in regard to the children born which are the subject of statistical investigation. These are ( 1 ) the number of boys compared with the number of girls; (2) the number of stillborn ; ( 3 ) the number at a birth ; and ( 4 ) the number of illegitimate births. Sex at Birth. This is the establishment of a purely physical law over which we have no control, and whose reason we do not understand. It is an excellent illustration of the value of the statistical method in establishing a mere fact, which can be established in no other way. By personal observation of particular families, we can get at no rule in regard to the number of boys and girls. The number seems entirely arbitrary. Sometimes they are all boys, sometimes all girls, more frequently both boys and girls. Reasoning, however, from general observation, one would probably say that the numbers would in the long run be about equal; there might be more boys born this year, and more girls the next, but the numbers would tend to counterbalance each other. Statistical observation shows us a constant relation, but this relation is not one of equality, but of a constant excess of boys. This excess of male births over female varies from country to country, as is shown in the following table : 1 BOTS
B O B * TO 1 0 0 0 G I R L S
1887-91. Italy 1068 Austria 1058 France . . . . 1046 Switzerland . . . . 1045 German Empire . . 1062 Holland 1066 Belgium 1045
BOB».
Scotland Ireland England and Wales . Massachusetts . . . Connecticut.... Rhode Island . . .
1887-01. 1056 1055 1036 1046 1072 1049
This table shows a constant excess of boys, but there are considerable variations from country to country. In i Bulletin de l'Institut international de Statistique, VU., p. 21.
BIRTHS.
77
England the proportion is less than in any other European country, and is tending to become still smaller. In Germany we find great variations in the states and provinces. In 1891, while for all Germany there were (including stillborn) 1062 boys to 1000 girls born, in Baden there were only 1052, in Pomerania only 1044, and in Bremen only 990. On the other hand, the proportion ran up in Posen to 1073, in Schleswig-Holstein to 1074, in Westphalia to 1073, and in Mecklenburg and Brunswick to 1098. The reason for this predominance of male births over female has never been determined. The theory most heard of is Sadler's, that the age of the parents determines the sex in the way that more boys are born in proportion as the father is older. This, of course, corresponds to the fact that the fathers are as a rule older than the mothers ; but the theory is purely hypothetical, and has never been supported by any exact statistical proof. Statisticians have sought in various directions to discover whether social influences have any effect. Levasseur has shown that the proportion of boys to girls is less in cities than in the country, but the bearing of this fact is not yet apparent. It is found, too, that among illegitimate children the excess of boys is less than among legitimate, and this has led to various theories in regard to the desire of the mother having a psychological influence upon the sex of the child.1 Among the still-born the excess of boys over girls is very much greater than among the living-born. From 1887 to 1891 the proportion was in France 1422, in 1 Levasseur argues that parents generally desire sons. When that desire is satisfied by the first or second birth, they cease to have children, or are indifferent as to the sex of the following ones. Levasseur, Population française, II., p. 60. Another argument is that most women desire sons, and hence the greater number of boys born. Among mothers of Illegitimates the feeling of shame and despair would render the mother indifferent. See for other theories, Encyclopaedia Britannica, Article, " S e x , " and DQsing, Das Geschlechtverh<niss im Königreich Preussen.
78
STATISTICS AND SOCIOLOGY.
Sweden 1350, in Italy 1811, in Germany 1283, in Austria 1321, in Massachusetts 1461, in Connecticut 1451, in Rhode Island 1418 to 1000.1 This excess is probably due to a physiological cause. A certain number of The Living and the Still-born. children do not survive the dangers of the act of birth,— the still-born. The number varies from country to country, as one would naturally expect, owing to differences in medical care and economic condition. It is probable that in Europe between three and four per cent of all the births are still-born. The proportion to 100 births (18879 1 ) is as follows : 2 Sweden Norway Denmark Holland Belgium
. . . . .
. . . . .
. . . . .
2.62 2.76 2.72 4.76 4.56
France. . Switzerland Germany . Austria . Hungary .
. . . . .
4.60 3.80 3.53 2.86
Italy . . . . 8.67 Massachusetts . 3.41 Connecticut . . 3.86 Rhode Island . 3.62
2.00
There is great uncertainty in these statistics, owing to the natural difficulty of distinguishing in the returns between infants still-born and those dying soon after birth. In Catholic countries there is a great desire to have the child live until it can be baptized, and in many communities a still-born child is looked upon as a greater misfortune than one dying soon after birth. It often happens, therefore, that a child is declared to have been born living when it was really born dead. Still further, in the French law and in the German law based on the Code Napoleon, it is provided that a child must be registered within three days after birth. It often happens that a child who has died during those three days is registered as a still-born. The statistics, therefore, are so imperfect that it is impossible to compare one country with another. For instance, in the Palatinate, a Protestant country with the French law, the number of still-born 1 Bulletin de l'Institut, cited above. 2 Ibid., p. 26.
BIRTHS.
79
from 1835 to 1860 was 4.8 per cent of the total number of births, while in Lower Bavaria, a Catholic country with German law, the number was only 1.7 per cent. The large number in France is probably due to the French law. The number of still-born has been studied in various directions. The proportion among illegitimates is always greater than among legitimates, owing to the large number of foundlings. The still-born are always more numerous in the city than in the country, owing, however, to the fact that the number of illegitimates is greater in the city. In Prussia they have studied the still-born in connection with the social and economic position of the parents. If we take the mothers according to religious confession, we shall find the percentage among Evangelical mothers to be 4.26 ; Catholic mothers, 3.84; and Jewish mothers, 3.35. The low percentage among the Jews is probably due to their better economic condition. If we take the social position of the parents, we naturally find a very heavy percentage among the inmates of hospitals and asylums and among beggars. We find the proportion to be greater than the average among servants and day labourers, to be less than the average among the officials and the well-to-do. The figures for different occupations show great variations, due principally in all probability to economic condition. 1 The smallest number of still-born is found among the mothers from 20 to 25 years of age. It then increases with increasing age, until for women over 45 it is 6 and 7 per cent. 2 The proportion of the still-born is naturally much greater among the first births than among the later. It is much heavier in the case of twins than 1
Statistisches Handbuch ftlr den Preussischen Staat, 1890, p. 139. Statistik des Deutschen Reichs, No. 44, p. 178. For Berlin, see Jahrbuch ftir die Stadt Berlin, 1880, 1884, etc. 2
80
STATISTICS AMD SOCIOLOGY.
in the case of single births. The proportion is greater in winter than in summer. Multiple Birth». It is only in a little more than one per cent of the total number of parturitions that there is more than one child. The latest statistics give the following averages of the number of cases to 100 births where there were two or more to a birth : 1 Sweden Denmark Scotland Italy . France.
. . . . . . . . . .
. . . .
1.46 1.34 1.22 1 21 0.99
Germany Holland Norway Austria Belgium
. . . .
. . . . .
1.24 1.30 1.32 1.17 0.97
Bavaria . Prussia Saxony . Switzerland Spain . .
. . . .
. . . .
1.38 1.20 1.20 1.16 086
In Prussia, from 1826 to 1880, there were 85 cases of quadruplets and three cases of five at a birth. The number of twins or more at a birth is thus comparatively rare, so that it is scarcely worth while to follow out their statistics in detail. It is a well-known fact that there is a greater number of still-born than in the case of single births, and the mortality increases as the number at a birth increases. Westergaard has made a curious study on the basis of material gathered by the National Life Insurance Society of London. The investigation covered only 337 cases of multiple births, of which four were triplets. Of the total number of children, 51.5 per cent were boys and 48.5 per cent were girls. In 35 per cent both the children were boys, in 33 per cent both were girls, in 32 per cent they were mixed. On the basis of probability, one-half of the cases should have been mixed. Westergaard shows the greater mortality among the twins, which continues during the first five years of life. He shows also that where one of twins dies, there is great probability that the other one follows ; when one of twins, lives, the proba1 Harald Westergaard, Zur Statistik der Mehrgeburten, Allg. Stat. Archiv, II., p. 509. See also Levasseur, La Pop. française, II., p. 201, and Statistik des Deutschen Reichs, No. 44, p. 178.
BIRTHS.
81
bility of life for the other is, indeed, smaller than for single births, but is much greater than in the preceding case. Illegitimate Birth». In civilized countries, where the institution of marriage is firmly established, by far the greater number of children are born in wedlock. There still remains a certain percentage, varying from as low as 3 to as high as 14, of children born out of wedlock. This figure is often taken as an index of the morality of a community. This, however, is not always justifiable, because the number is often indicative of the influence of special laws and customs rather than of vice or dissipation. A classical example of this is Bavaria. In former times, owing to the severe marriage laws which forbade marriage to all except those who possessed property or who were members of a guild, the number of illegitimate births was simply enormous. Even with the modification of those laws the percentage of illegitimate births during 1860-68 was 22.2. With the repeal the proportion sank at once to 17.9 per cent, and continued to sink each year until 1875, when it was 12.6 per cent. The explanation, of course, is that many couples who had lived together without being legally married were now permitted to marry. The customs, however, engendered by this condition of things have continued, so that even to the present day the number of illegitimate berths in Bavaria is very large. In other countries, as in Scotland, and in the eastern provinces of Prussia, public opinion is disposed to regard a birth before marriage lightly, if the child be legitimized by subsequent marriage. In Rhenish Prussia and in England, on the other hand, such a birth would be looked upon as a disgrace and a hindrance to marriage. A large number of illegitimate births would naturally follow in the first case, but would not necessarily show a lower state of public morality than a small number in the second. Poor-law relief and laws in regard to the respono
82
STATISTICS AND SOCIOLOGY.
sibility of the father also affect the number of illegitimate births. Under these circumstances the number of illegitimate births varies greatly in different countries, and for fair comparison it is necessary to study carefully the laws and customs of each. The most common way of calculating the number of illegitimates is to give the percentage of the total number of births. The largest numbers are in Bavaria, 14.01 per cent; Austria, 14.6 per cent; and Saxony, 12.45 per cent. Other Germanic countries like Denmark, 9.4 per cent; Sweden, 10.2 per cent; Scotland, 7.9 per cent; and Prussia, 7.8 per cent; together with France, 8 . 4 ; Italy, 7.3 ; Belgium, 8.7 ; also show a large percentage. England, 4.5; Holland, 3.2; and Ireland, 2.7; show a smaller percentage.1 The number of illegitimates is said to be increasing in Italy, France, Austria, Hungary, Belgium, Roumania, Servia, and Massachusetts ; to be decreasing in England, Scotland, Holland, Norway, and Denmark. 2 The number of illegitimate births varies in a most extraordinary way in different parts of the same country. Thus, in England the proportion varies (average of 10 years 1881-90) from 8.2 per cent in Shropshire, 7.6 per cent in Cumberland, 7.2 per cent in Norfolk, 7.6 per cent in Herefordshire, and 7 per cent in Westmoreland and North Wales, down to 4.1 per cent in Surrey, 3.4 per cent in Middlesex, and 3.3 per cent in Essex. 8 These proportions remain very constant from year to year. The Registrar General has pointed out that England and Wales can be roughly divided into three zones: a south zone, with an illegitimate rate below the general average; a midland zone, with illegitimacy somewhat above the average ; and a northern zone, with an excessively high rate of illegitimacy. 1 Figures are for 1887-91, from Bulletin de l'Inst., etc., Vol. VII. 2 Ibid. »Report Registrar General, 1891. See also, Leffingwell, Illegitimacy.
83
BIRTHS.
In Prussia we find the same contrasts between different provinces as between the different counties of England. Pomerania and Silesia have an extraordinary number of illegitimate births, 10.48 and 10.15 per cent, although one is agricultural and the other is mining and manufacturing. On the other hand, Saxony and the Rhineland, although both are industrial regions, have very different rates of illegitimacy, viz., 9.36 and 3.76 per cent. Agricultural or industrial life does not seem to be a determining influence. The number of illegitimates is particularly large in cities. For France, Levasseur gives the following numbers per 100 births for 1879-83 : 1 Department of the Seine Urban population (France) Rural population (France) Average for France
24.1 10.1 4.2 7.4
In Germany, in 1890, the number of illegitimate births in the cities was 13.2 per cent, while in the country it was only 9.1 per cent.2 The large number of illegitimates in cities is due partly to the presence of garrisons and partly to the fact that the city is the refuge for the vicious and thoughtless of both sexes. In Prussia they have made special investigations in regard to the religious confession of the mothers of illegitimate children, with the following result (average 1875-81): 8 Among Evangelical mothera the number of illegitimate children was 8.86 per cent Among Catholic mothers the number of illegitimate children was 5.64 per cent Among Jewish mothers the number of illegitimate children was 2.73 per cent 1 La Pop. française, II., p. 34. * Jahrbuch der deutschen Städte, 1802. • Zeitschrift des Prenss. Bureaas, 1882, p. 232.
84
STATISTICS AND SOCIOLOGY.
In Ireland the percentage of illegitimate births (188190) was greatest in Ulster, viz., 4.3, and least for Connaught, viz., 0.8. The percentage for all Ireland was 2.7 against 2.4 for the preceding decade. The Prussian statistics show that illegitimate children are more frequent among divorced women than among the widowed, although among the latter three-fourths of the children are illegitimate. It is difficult to follow out exactly the occupation of the mothers of illegitimate children, but in Prussia the highest illegitimate fecundity seemed to be among female agricultural servants ; then came domestic servants, factory-hands, etc. A very low rate of illegitimate births is shown among women living with their parents, and women employed in hospitals, churches, and public offices.1 Scientific Tests. Method of Observation. The first question that arises in statistics of births is whether we get all of the births. For it is evident that if we have omissions, our comparisons between different countries and for different periods in the same country are vitiated. In our observations in regard to the number of the people, their distribution by race, sex, age, etc., a single census at intervals of five or ten years is sufficient to give us the necessary data. But for the statistics of births, deaths, and marriages a census is inadequate. It is utterly impossible to recover at the end of such a period all the births or deaths for the preceding five or ten years. I t is even impossible (as shown by experience in the United States) to go back a single year and get a satisfactory enumeration for the census year. For vital statistics it is necessary to have immediate and continuous registration. When the birth, death, or marriage occurs it should at once be registered. In the old days when baptisms, marriages, and burials were 1
Zeitschrift des Preuss. Bureaus, 1889, p. 195.
BIRTHS.
85
all church offices, the church registers furnished a foundation for vital statistics. In modern times the duty of collecting such statistics is exercised by the state. I n England the office of Registrar General was established in 1887. Down to 1876 the registration of births was voluntary, and Dr. Farr estimates that the proportion of unregistered births was about 5 per cent. By the Act of 1874 registration was made compulsory, and the birthrate for 1876 reached 36.6 per 1000, the highest on record, being 1.2 per 1000 higher than the average for the ten previous years. 1 It is probable that there are still imperfections in registration due either to negligence, or to the shame of illegitimacy, or in order to avoid compulsory vaccination, or among migratory people such as gypsies. Notwithstanding these, the registration in England reaches probably within a very small fraction of the true number of births. Conditions in the United States are quite different, as we have just seen. The above illustration of England shows how impossible it must be to expect good birth statistics in barbarous or uncivilized countries. Basis for Comparison. I n all the statistics of births we are met with the difficulty of a proper basis for comparison. If the age distribution were the same for the population of all countries, we might then compare the number of births with the total population and we should have a fair standard. But if in any population the number of adults, especially of women from 20 to 40 years of age, be large, we naturally expect a large birthrate ; while if such proportion be small, we expect a low birth-rate. Thus in the United States, in 1880, 46.4 per cent of the population were between the ages 20 to 60, while in France (1886) 52.3 per cent were of that age. London has a larger birth-rate than the county of Hereford, but this is partly explained by the fact that in London 36.3 per cent of the population are between the 1
Farr, Vital Statistics, p. 87.
Newsholme, Vital Statistics, p. 16.
86
STATISTICS AND SOCIOLOGY.
ages 20 to 40, while in Hereford the percentage is only 28.4. The same difficulty meets us when we study the statistics of illegitimacy. On account of these uncertainties it has been proposed to take as basis for comparison, not the whole population, but the women of child-bearing age, say from 15 to 45, 15 to 50, or 15 to 55. Dr. Farr carried out such calculations in many of his annual reports, going back as far as 1851. In the last-mentioned report he makes the following observations : " T h e mothers of all the children that are born in the country are between the ages of 15 and 55 ; and the greater part of them are between the ages of 20 and 40. The proportion of children to 1000 married women under the age of 55 ranges between 197.3 in Herefordshire and 255.6 in Durham; the proportion of children to 1000 unmarried women (age 15-55) ranges between 11.2 in Devon and 28.3 in Norfolk." Later on he says : " For all England 1000 married women of the age 15 to 55 have 220 children annually, 1000 unmarried women have 16 children annually, or one in 14 of them is exposed to the same chance of bearing children as married women." This method would seem to give us a satisfactory basis for comparison of birth-rates. The difficulty with its use is that we must know the number of married and unmarried women between 15 and 55 years of age. For census years it would be easy to obtain this number, but for intermediate years it would have to be calculated on the supposition that the proportion of married and unmarried women of that age remained the same from census to census. For a very large population this would probably be true, but for small divisions like counties or cities the divergencies, owing to migration, might be considerable. We know that calculations of the total population for intermediate years on the basis of births and deaths is sometimes as much as 15 or 20 per cent out of the way,
BIRTHS.
87
in the case of rapidly growing towns. The chances for error would be greater in the case of a particular class, and the number being comparatively small, the proportionate birth-rate would be considerably affected. It would seem to be better, therefore, to employ the crude birth-rate for comparison between large bodies of population, or for the purpose of following the number of births from year to year in a population which is reasonably stable. The refined birth-rate may be used during census years for comparison between small bodies of population. A second reason for retaining the crude birth-rate is that we then have the same basis for general vital statistics, such as marriages, deaths, disease, crime, pauperism, etc. It is true that in these cases also we have other standards of comparison, as in the case of marriages, the number of persons of marriageable age; in the case of criminals, the number of adults; but these special classes do not correspond to each other. I t is, therefore, convenient to retain a crude birth-rate for comparison with the crude marriage-rate, crude death-rate, etc., bearing in mind the scientific limitations in each case. Question of the Still-born. The statistics of different countries often differ in one respect which gives rise to considerable confusion, i.e., by including or excluding from births and deaths the still-born. In England the number of the still-born is returned, but they are included in neither births nor deaths. They are not regarded as forming or as having formed a portion of the population. On the Continent, on the other hand, they are included in both births and deaths. Their inclusion or exclusion makes a very considerable difference in the birth-rate. For instance, the birth-rate for Germany, including the still-born, was 38.24 per 1000 in 1891. The still-born were 3.31 per cent of the total number of births. Excluding the still-born reduces the birth-rate to about 37 per 1000. For 1890 the birth-rate, including the still-born, was 36.97, excluding
88
STATISTICS AND SOCIOLOGY.
them, it was 35.75. W e must, therefore, in comparing the birth-rates of different countries, always know whether the still-born are included or excluded. Comparative tables published by continental authors always include them ; while those published by the Registrar General of England always exclude them. Care must be taken not to bring into juxtaposition figures taken from these two sources. The abstract question whether the still-born should or should not be included in the birth-rate is not of great importance compared with the practical inconveniences mentioned above. Continental statisticians defend the practice of entering the still-born among both the births and deaths, because of the difficulty of distinguishing between the still-born and infants dying a few minutes, or, at least, a short time after birth. If the child were capable of living when born, they contend that it is to all intents and purposes a birth. The English statisticians think that the proper plan would be to register all still-births in a separate category. By them no child is considered to have been born unless actually breathing after birth. Particular Tests. The age distribution is perhaps the most important factor influencing the birth-rate. But in studying the birth-rate of small communities, care should always be taken to consider local circumstances which may affect the birth-rate. W e have already referred to the fact that in some cities the young married people live in the suburbs where rents are cheap. In such suburbs the birth-rate would be high, while in the centre of the town it would be low. In some cases we have the reverse phenomenon, the poor being crowded into the centre, and the rich and well-to-do living in the park-like suburbs. Other particular circumstances are the presence of troops in barracks, the number of women living as domestic servants, immigration in search of temporary employment, and economic conditions. These things affect both the legitimate and illegitimate births.
BIRTHS.
Reflective
89
Analytit.
It appears from the above statistics that the number of births in a country from year to year has an important connection with its social condition. Where it decreases suddenly it shows the effect of a war, or of commercial distress or economic disaster. Where it increases, it is generally a sign of economic prosperity, because no such increase could be brought about except by some influence affecting a large portion of the community. Even if the birth-rate only brought about a shifting of the age distribution, it would be a fact too important to be neglected. If the number of births remained the same from year to year, then, the mortality remaining unchanged, the community would retain the same age distribution. Where the number of births increases from year to year, at first there is a proportionately large number of children and youth in the population. If there then follow a period of decreasing births, the proportionate number of adults ia increased. If the births continue stationary, the proportionate number of old people is increased. These different conditions have considerable social importance. In France, the low birth-rate results in a population of high productive power, but with poor prospects for the future. The moderately increasing births in England give a population of good productive power, with great elasticity and reserve power for the future. A low birth-rate, in one direction, is an evil if it lead to future low productive power, to social immorality, or to the destruction of family l i f e ; while a high birth-rate, in the other direction, is an evil if it overburden the productive power and lead to a condition of persistent and hopeless poverty. Close analysis and study of local communities may sometimes enable us to detect instances of these two extremes. The comparative birth-rate among different classes in the same community must always be a matter of social
90
STATISTICS AND SOCIOLOGY.
importance. It would seem to be a dangerous sign where the upper classes cease to have children, while the lower have large numbers. It must be a matter of social concern that the negroes in the United States have a large birthrate, and the whites a small. It must be a matter of social interest, if it be true, that the foreign-born in the United States have a large number of children, while the descendants of the colonists have smaller and smaller families. It is sociologically important to know that the population of cities is kept up only by immigration, and that the city born and bred show a decreasing birth-rate from generation to generation. It is true that the importance of the relative growth of different sections in the community may be exaggerated. For, owing to the many changes brought about by births and deaths, the antitheses are softened and the upper classes are recruited from the lower. The birth-rate, however, is a rough index of the rapidity with which these changes are going on. The way in which a community grows, whether by numerous births and numerous deaths, or by a moderate number of births and few deaths, is to a certain extent an indication of the stage of civilization in which that community finds itself. The former must be looked upon as unfortunate and degrading. In some mining districts of England the large birth-rate is due to the fact that the women marry at a very early age, have numerous children, and that the great mortality among their children, by shortening the suckling period, enables the births to be more frequent. Such early marriage and frequent child-bearing destroys the health and strength of the women, and reduces the whole family life to the level of the brute. The other extreme of late or no marriage is equally destructive of social morality. The desirable system is marriage at a reasonable age, and the birth of a sufficient number of children to keep up family life and recruit the population. The statistics of illegitimate births must always be of
BIKTHS.
91
interest as indicative of social morality, but must be studied under the limitations and conditions noted above. I t is certainly astonishing, when we take a long period, to see how little the birth-rate varies from year to year. In Germany, for instance, for the long period from 1841 to 1885, the annual variation from the average birth-rate was on an average only 3.98 per cent. This number is calculated as follows. The average birth-rate is ascertained, being the arithmetical mean of all the different years. The variation for each year from this mean is ascertained, and these variations are added together. T h e per cent relation of this sum to the sum of all the yearly birth-rates represents the per-cent variation from the average birth-rate. That this variation was so small, does not show, indeed, that there were not larger variations in different parts of the country, but simply that they counterbalanced each other. I t is also curious to notice that the variations are much greater if we take the legitimate and the illegitimate births separately, than if we take them together, and are especially great among the illegitimate. T h e annual variation among legitimate births was 4.57 per cent, and among the illegitimate was 9.40 per cent. In the smaller territories the variation among the latter was very great, often running as high as 20 or 25 per cent, and in one case going as high as 31 per cent. Of course, where we have small figures to deal with, as in the case of illegitimate births in a small population, the variations from year to year may be very considerable.1 W e may, in conclusion, demand whether we have discovered any sociological law bearing upon the number of births. The answer to this question is perfectly plain from the statistical data given above. Natural influences seem to have an effect only indirectly, by affecting the economic condition of the community. Here the effect is probably enormous, working again indirectly through 1 Statistik des Deutschen Reichs, No. 44, p. 15».
92
STATISTICS AND SOCIOLOGY.
the increase in the number of marriages. Natural influences may be traced also in the variation of births during different seasons of the year, and possibly in the commonly supposed large birth-rate in warm climates. Great social influences are undoubtedly seen in the variations from province to province or from county to county in the same country. Psychological influences may occasionally be detected in the depression in the birth-rate during a time of war or some public calamity, or in public opinion encouraging small families, as in France. It is safe to say, therefore, that we have here traces of sociological laws governing the number of births. Some of them are simple regularities, like the proportion of boys to girls born ; some are physiological, like that governing the number of still-born; some are social-moral, like those governing the number of illegitimates; some are socialpsychological or social-economic, like those governing the general birth-rate. The difficult and delicate task of Statistical Science is to disentangle these relations so as to enable us to catch a glimpse of the working of these laws.
CHAPTER
VI.
MARRIAGES. Sociological
Purpose.
THE second great sociological event in the life of man is marriage. For the community it has significance, not only because the number of marriages affects the number of births, but also because marriage establishes the family, and through its influence on the life of the individual permeates all the phenomena of social life. The number of marriages from year to year is always worthy of study. A sudden decline is generally traceable to a war or some economic shock. A gradual decline may be due to declining economic prosperity, or to some change in social condition or habits. It may be indicative of conditions leading to social vice or unhappiness, and if continued may affect the character and happiness of the whole nation. A gradual rise is indicative of economic well-being and hopefulness in regard to the future. A tendency to defer marriage may affect the growth of population by diminishing the period of married life and increasing the interval between generations. It may indicate economic difficulty, or simply prudence and forethought. The sociological purpose of an inquiry into the number of marriages and its increase or decrease from year to year is to explain its significance for the social life of the community. But just as in the case of births, so with marriages, 03
94
STATISTICS AND SOCIOLOGY.
there are questions lying behind the mere number and its increase or decrease, viz., whether there are causes affecting marriages. Do natural causes such as climate, geographical position, seasons, race, etc., influence the proportionate number of marriages or the marriage-rate ? Marriage in the case of the individual is simply a private act, but the total number of marriages for the community is a social phenomenon. How is the action of the individual affected b y other social phenomena, such as economic prosperity or adversity, human laws, public opinion, social hopefulness and ambition? Is the influence of social forces so powerful that in the mass of cases the will of the individual is controlled by them, and, the forces remaining the same, the number of marriages remains the same ? These inquiries may be extended to consideration of density of population, residence in city and country, social position, occupation, etc. Where we can establish relations of regularity or variation we are on the track of sociological laws. Finally, there are certain circumstances connected with marriage which are of the highest sociological importance. One is the dissolution of marriage by death or divorce, with the result for the individuals concerned and the community at large. Another is the fruitfulness of marriage, i.e., the number of children to each married couple. Another is the question of conjugal condition. The institution of marriage resolves the community into four classes, the single, married, widowed, and divorced. T h e relative number of these four classes has economic and social importance, as already set forth in a preceding chapter. Their connection with other demographic phenomena is extremely curious. The probability of marriage or of remarriage is of considerable social interest. In all these respects the sociological purpose of our inquiry is to arrange the statistics of marriage in connection with other phenomena so that they may explain each other.
95
MARRIAGES.
Statistical
Data.
The number of marriages is generally reduced for purposes of comparison to a marriage-rate, i.e., the number of marriages celebrated in a year per each 1000 of the population. There is some slight confusion here because some statisticians count the number of marriages, and others the number of persons married. As the latter number is naturally exactly twice the former and the variations are not wide, there is little danger of confusing one with the other. For purposes of comparison, of course, the two methods must be kept apart. The number of persons annually married per 1000 of the population, according to the figures of the Registrar General of England, for the different countries of Europe, is shown in the following table : CoUHTHT. Hungary (16 years) Prussia German Empire . Austria England and Wales Italy France Denmark Holland Switzerland . . . The United Kingdom Belgium Scotland Norway Sweden Ireland
. .
. .
A renge 1871-90. 19.1 16.7 16.4 16.3 15.6 15.6 15.4 16.2 15.1 14.7 14.4 14.2 13.0 13.7 13.1 e.o
1891. 17.2 16.3 16.1 15.4 15.6 15.0 15.0 13.6 14.2 14.4 14.6 14.8 13.9 13.2 11.7 9.2
189«. 18.4 16.1 15.9 15.6 15.4 15.0 15.2 13.6 14.4 14.8 14.5 15.4 14.1 12.7 11.4 9.3
1898. 18.6 16.1 15.8 -
14.7 14.7 -
14.1 14.6 14.7 13.9 15.2 13.2 12.8 -
9.4
This table shows wide differences between the different countries of Europe, the number of persons married per 1000 of the population being double in Hungary what it is in Ireland. These, however, may be regarded as extremes, the usual marriage-rate being between 14 and
96
STATISTICS AND SOCIOLOGY.
16 married persons, or between 7 and 8 marriages annually for each 1000 persons in the population. Taking one country, the marriage-rate shows very considerable regularity from year to year. Since 1871-80 there has been a tendency to a decline in most of the countries of Europe, with some recovery since 1890. During the period 1838-92, the average marriage-rate for England and Wales has been 16.1, with a maximum of 17.9 in 1853, and a minimum of 14.2 in 1886. The average, 16.1, has not been attained since 1876. Much the Bame tendency is observable in France and Germany. Influence of Climate and Geographical Position on Marriages. To study these influences it would be necessary to have statistics of the different parts of the world. For barbarous or uncivilized countries, such statistics are entirely lacking, or very imperfect. It is generally supposed that in warm climates women marry young, and thus the marriage-rate would be increased. In India, for example, although we have no exact marriage statistics, we know that marriage is almost universal, that the girls marry at a youthful age, and that widows often remarry. What is true of India would probably be true of other hot countries inhabited by uncivilized races. As marriage, however, is not a process of nature, but merely a social custom, the statistics of civilized and uncivilized nations differing in religion and law would not be comparable. Even in Europe, where the degree of civilization is about the same, the influence of climate, geographical position, and race is less noticeable than in the case of births. It is true that in the east of Europe, as in Hungary, Austria, and the eastern provinces of Prussia, we have a large marriage-rate. That is due probably to the state of civilization, which encourages early marriages, rather than to any climatic, geographical, or race influence. In Northern Europe, as in Norway, Sweden, and Scotland, we have rather a small marriage-rate, but this is due probably to
MARRIAGES.
97
emigration. A n extreme case of this sort is Ireland, where we have an abnormally low marriage-rate, owing to the emigration of young men and women. It is a curious fact that France, which has such an abnormally low birthrate, has about the same marriage-rate as England and Italy. Marriages according to Season». In births we found a well-defined tendency to concentration about certain months, due somewhat to natural influences and somewhat to social customs influencing the time of marriage, the principal among which are the observance of religious fasts or festivals. In most countries there are few marriages during Advent and Lent, while they tend to concentrate themselves about the Christmas holidays and before and after Lent. This movement, however, differs in different populations according as the religious influence is strong or weak. In Germany (1872 to 1885), if we represent the average per month by 100, the maximum number of marriages would be represented by 153 for November; and it descends to 76 for December, and ascends over January (97) to February (118) ; March shows the minimum with 58 ; then the number ascends over April (115) to May (124) ; June shows 91, July 84, August 68, and then the number ascends over September (92) and October (128), to the maximum in November. The influence of religious and social causes is very plain. Where Catholicism is powerful the influence of the fasting time is much more marked. In cities like Berlin the religious influence almost disappears. In Sweden and Finland, Protestant countries, the maximum falls in December, that is, during A d v e n t ; in Scotland it falls in January, and a second maximum in June, showing the absence of churchly influence. 1 Density of Population and Marriage-rate. It is diffi1 Becker, Allg. Stat. Archiv, II., p. 29 ff. Reichs, No. 44, p. 200. H
Statistik des Deutschen
98
STATISTICS AND SOCIOLOGY.
cult to trace any uniform influence of density upon marriages. Belgium, with a high density, has a low marriage-rate, but not so low as Norway and Sweden, which have a thin population. If we take the provinces of Prussia, using the average marriage-rate for a period of 45 years, which ought to exclude merely temporary influences and show us any permanent power of climate, density, and agricultural or industrial condition, we are struck by the fact that the highest marriage-rate, just as in the case of the birth-rate, is found in the eastern provinces, which have also a low density of population. Silesia and the Rhineland, however, which both have dense populations and are both mining and industrial regions, have, the former, the average marriage-rate, while the latter has the lowest marriage-rate of any province. In England the registration counties in which the marriage-rate is the highest are London ( 1 7 . 6 ) , Lancashire (16.2), Northumberland ( 1 6 . 0 ) , Nottinghamshire ( 1 6 . 3 ) ; while the lowest is found in Hertfordshire (10.8), Rutlandshire (11.2), Herefordshire (11.8), and Middlesex ( 1 1 . 1 ) . This is for the decade 1881-90, when the rate for all England was 14.9. These variations in England are due more to the age distribution and occupations of the people than to any density of population or influence of climate. Marriage-rate in City and Country. The marriage-rate is generally higher in towns and cities than in the country, because of the larger number of persons of the age of 20 to 40. In Germany, while the average marriagerate for the whole country (1890) was 16.6, in 47 cities the average rate was 19.9. In the city of Berlin it was 22.9, in Hamburg 21.7, in Leipsic 22.7, in Munich 19.6, in Breslau 18.9, in Cologne 19.8, in Dresden 20.2, in Magdeburg 19.3, in Frankfort 21.0. In a few of the cities the marriage-rate fell below the average. Thus
MARRIAGES.
99
in Stuttgart it was only 13.8, in Strasburg 14.9, in Metz 14.6, and in Darmstadt 14.9. These variations again are due probably to variations in the age classes.1 In France the marriage-rate in 1885 was for the Department of the Seine 16.6, for the urban population of France 14.8, and for the rural population 14.6. 2 The difference is inconsiderable. In England the marriage-rate is generally highest in manufacturing towns. Marriages according to Race and Religious Confession. Marriage depending partly upon age and partly upon social customs, general influences like race and religious confession are obscured by the influence of the age distribution and the social and economic condition of the people. Race nowhere asserts itself. For religious confession we have some particular statistics. In Prussia, in 1890, the average marriage-rate among men was 16.64 ; among Evangelical men, 16.84; among Catholic men, 16.30 ; among Jewish men, 14.66. The marriage-rate among women was 16.04 ; among Evangelical women, 16.35 ; among Catholic women, 15.59 ; among Jewish women, 14.12. The low rate among the Jews may perhaps be due to greater prudence in marriage, that is, to marrying at an advanced age.a Influence of War on the Marriage-rate. The effect of war, removing as it does a considerable number of men of marriageable age, and interfering often with the occupations of those who remain, is to bring down the marriagerate. In 1866 the Prussian rate fell from 18.2 to 15.6, while the Austrian rate fell from 15.5 to 13.0. In the war of 1870-71, the Prussian rate fell from 17.9 in 1869 to 14.9 in 1870 and 15.9 in 1871 ; but in the two years after peace was made it rose to 20.6 and 20.2, the highest 1
Jahrbuch deutscher Stftdte, 1892. Levasseur, Population française, II., p. 77. » Handbuch des Preuss. Staats, 1800, pp. 109, 144. a
100
8TATISTIC8 AND SOCIOLOGY.
rates ever recorded. In France the rate fell from 16.5 to 12.1 and 14.4, and then rose to 19.5 and 17.7, the highest rates ever recorded in France. The reason for this is too obvious to need explanation. 1 In former times Marriages and the Price of Food. there seems to have been a close connection between the number of marriages and the price of food. For instance, in Bavaria, while the number of marriages was usually about 30,000 per annum, in 1846-47 it sank to 28,331, and in 1853-54 it sank to 26,939. This was undoubtedly due to the scarcity of food. So marked was this influence in the early part of this century, that it became a commonplace of statistics that the number of marriages varied inversely with the price of corn. In Germany this tendency of the number of marriages to decrease when the price of rye was high and to increase when the price was low was observable until about 1860. Since that time Germany has become so industrial and commercial that the price of food is only one element in the economic well-being of the masses. The truth of the above maxim is better expressed in a more general form in the words of Hermann, the Bavarian statistician, as follows : " The number of marriages in any period expresses the expectation of economic prosperity prevailing at that time, and expresses this the more clearly, the greater the degree of economic freedom in the country." This is well illustrated in England, where during this century, at least, the number of marriages and the price of corn have seemed to bear no relation to each other.2 1 Dr. William Ogle, On Marriage Rates, etc., Jour. Stat. Soc. 1890, p. 253. 2 In recent years the marriage-rate has increased as the price of c o m has increased. Dr. Ogle explains this by increased exports and imports putting up freights and thus increasing the price of corn, although it is a time of economic prosperity and marriages are more frequent. Jour. Stat. Soc. 1890, p. 262.
MARRIAGES.
101
English statisticians have taken other things as the measure of economic prosperity, such as the amount of exports or imports, or the transactions of the Clearing House, per head of population. The marriage-rate corresponds most closely with the value of exports ; for although the fluctuations from year to year are much greater in the latter than in the former, yet an increase or depression in the one is almost always followed by a corresponding increase or depression in the other. Dr. Ogle asserts that in the 50 years from 1839 to 1888 there are only five in which the marriage-rate moved in a different direction from the export values ; there are three years in which the rate remained unchanged, while the exports rose or fell ; while in all the remaining years the two rose or fell together. The amount of exports is an index of economic prosperity, because it gauges the opportunity for employment. And it does this the more surely in proportion as the people of England become less dependent on agriculture and more on industry. But although the fluctuations correspond in general direction, they do not correspond in amount. For while the value per capita of British exports in 1891 is as great as it was in 1866, the marriagerate has decreased from 17.5 to 15.6. Dr. Ogle ascribes this continued decrease to the depression in agriculture, which has rendered marriage more difficult for those who depend for their livelihood upon the land, and secondly, to the increasing standard of comfort, which makes men and women unwilling to burden themselves with a family until they are assured of a much higher income than they would in former days have held to be sufficient.1 The Probability of Marriage. The marriage-rate which we have been using thus far is simply the proportion of persons getting married during the year to the whole 1 Jour. Stat. Soc. 1890, p. 265. For effect of scarcity on marriagerate in France, see Leyaaseur, Fop. française, IL, p. 71.
102
STATISTICS AND SOCIOLOGY.
population. But a large portion of the population, namely, the children, are unable to get married, and another large portion is already married. These persons have nothing to do with the marriages of the current year, and hence it is incorrect to include them in the standard of comparison. We get a better standard if we take the persons over 15 years of age who are not living in the married state, that is, are either single, widowed, or divorced. The proportion of persons getting married to this total of marriageable persons may be called the refined marriage-rate. It represents also the probability of marriage. It is higher for men than for women, because the number of marriageable men is less than that of women. For instance, in Germany, during the period 1872-80, of every 1000 persons capable of marriage 55.7 became married; of 1000 such men, 59.3, and of 1000 such women, 52.6. This figure diminished during the nine years, for while in 1872 it was 64.7, in 1880 it was only 49.1. 1 The probability of marriage differs widely in different countries and even in the provinces of the same country. In Hungary it ran as high as 81.4, and in Ireland as low as 25.8. In Great Britain it was 5 3 . 1 ; in France, 50.4 ; in Italy, 48.6 ; in Austria, 4 7 . 5 ; in Norway, 4 3 . 2 ; in Switzerland, 42.6 ; in Sweden, 40.3. Should we continue this examination for smaller subdivisions of territory such as the provinces of Prussia, we should find equally great variations. In the province Posen the marriage-rate calculated on this plan was 63.8, while in the Rhine province, exclusive of Düsseldorf, the rate was only 47.3. In the former province there was the usual difference between the sexes, the rates being 72.6 for men and 57. for women, while in the Rhine province it was the same for men and women. The cause of these great variations can lie in part only 1
Statistik des Deutschen Reichs, No. 44, pp. 44* and 46*.
MARBIAGES.
103
in the age distribution. Other influences are a t work but it is difficult to trace them. The high rates in most of the provinces of eastern Prussia would seem to indicate that an agricultural and sparse population was favourable to marriage. But the rate is also high in the city of Berlin, in the kingdom and province of Saxony, and in the cities of Bremen and Hamburg. There is a sort of geographical distribution, inasmuch as the heaviest rates are found in Central and East Germany, the lightest in South and West Germany. Other countries of the Continent group themselves to a certain extent about Galicia and Hungary resemble East GerGermany. many ; West Austria is something like South Germany ; in France the numbers correspond to those in B a d e n ; in Belgium to the Rhine province; Holland and Denmark resemble Schleswig-Holstein. A more minute study of small areas might very likely reveal the influence of climate, race, or social condition. 1 Age at Marriage. Here we have two figures of statistical interest, namely, the average age at which men and women marry, and the combination of ages, that is, the relative ages of bridegroom and bride. We find very great differences in different countries. In Prussia the average age of bridegrooms was 29.56 and of brides, 26.52 years; in England, of bridegrooms, 28.37, and of brides, 26.08; in Norway, of bridegrooms, 30.66, and of brides, 27.83. I t makes considerable difference whether we take the age of all bridegrooms, or only those marrying for the first time. In England, for instance, the average age of bachelor-bridegrooms was 26.44; of widowers, 44.30; of spinster-brides, 24.87; and of widows, 40.43. This average age varies considerably for different social classes, the upper classes generally showing an advanced age. The following figures are for England (1884-85) : »Ibid. p. 46.»
104
STATISTICS AND SOCIOLOGY.
Miners Textile bands Shoemakers, tailors Artisans Labourers Commercial clerks Shopkeepers, etc Farmers and sons Professional and independent class .
Age of btcWori marrying. 24.00 24.38 24.02 25.35 25.60 20.25 26.67 29.23 31.22
Aft of iptnitas mmylng. 22.40 23.43 24.31 23.70 23.66 24.43 24.22 20.91 20.40
There seems to be a general tendency in England to defer marriage, for while, in 1891, the average age of bachelors marrying was 26.4 and of spinsters 24.8, in 1880 it was only 25.8 and 24.4. 1 The number of underage marriages in England has steadily declined since 1874 from 8.4 per cent for men and 22.7 per cent for women down to 5.9 per cent for men and 19 per cent for women.2 In Prussia, in 1891, only 1.26 per cent of the men and 16.5 per cent of the women were under 20 years of age. In Prussia the lowest average age at marriage was found among miners, printers, factory-hands and day-labourers ; the highest among artists, literary men, inn-keepers, clergymen and soldiers. Men marry most frequently women without occupations (Haus-Tochter) ; then women who possess some knowledge of household work, such as cooks and domestic servants. 8 The average age of brides and bridegrooms is of less interest than the distribution by age classes. Here we find very peculiar national differences. In some countries both bridegrooms and brides are much younger than in other countries. The general facts are seen in the following tables referring to the period 1870-82. 4 1 Ogle, Jour. Stat. Soc. 1890, p. 274. Newsholme, Vital Statistics, p. 48. 2 Registrar General, Rep. 1891, p. vii. • Zeitschrift des Preuss. Bureaus, 1889, p. 179. 4 Levasseur, II., p. 214.
105
MARRIAGES. A,
PERCENTAGE
OF B R I D E Q B O O X S BT A O E
CLAMES.
Under 20 years. 20-30 years. 80-40 years. Above 40 years.
Russia . Scotland England Prussia. Bavaria Italy . France . Sweden. Norway B.
. . . . . . . . .
. . . . . . . . .
.
.
37.8 3.1 3.3 0.6 0.2 1.1 2.4 0.1 1.7
PERCENTAGE
11.8 18.8 14.4 22.6 30.0 26.1 26.1 28.8 24.6
43.9 68.8 73.4 67.2 66.6 61.9 62.3 68.9 62.1
OF B R I D E S
BT
AOE
7.4 9.3 8.9 9.6 14.3 10.9 10.3 12.2 11.6
CLASSES.
Under 20 years. 20-80 years. 80-40 years. Above 40 years.
Russia . Scotland England Prussia . Bavaria. Italy. . France . Sweden. Norway.
68.0 13.6 14.4 10.3 6.4 16.9 21.2 6.6 0.9
33.2 68.9 68.8 69.7 64.8 65.8 69.6 66.0 69.1
6.2 13.1 10.9 14.9 20.6 12.6 13.7 22.2 27.6
2.6 4.6 6.9 6.9 8.1 4.7 6.6 13. 12.4
It appears from these two tables that the brides are as a rule younger than the bridegrooms; that in Russia there is an extraordinarily large number of bridegrooms under the age of 20, and that more than one-half the brides are under that age ; that England stands next in the number of youthful marriages ; while Bavaria shows the greatest number of bridegrooms above the age of 40 ; and Norway leads in the number of brides above the age of 40. The reason for these differences lies probably in local customs. Russia is an example of an agricultural community with communistic arrangements under which marriage is easy and undertaken at a youthful age. Bavaria shows the effect of the old marriage laws. In Norway young married couples are said to have great difficulty in getting established. The comparatively low age in England may possibly be explained by the influence of factory life, which brings men and women together and
106
STATISTICS AND SOCIOLOGY.
renders marriage easier by the fact that the woman is able to contribute to the expenses of the household. . Another interesting investigation is the combination of ages of bridegrooms and brides. Here we may have a great variety of combinations, as women marry men older than they, or men of about the same age, or even younger. From German statistics it appears that as a rule bridegrooms under 20 marry women between 20 and 30 ; bridegrooms from 20 to 30 marry women of the same age ; and bridegrooms above 30 marry women younger than they. Brides under 20 marry men from 20 to 30 ; brides between 20 and 30 marry men of the same age ; brides between 30 and 40 marry men between 20 and 30 ; and brides above 40 marry men of the same age class. In most countries the most frequent marriages are of men with women of the quinquennial age class immediately below them. A singular exception is England, where in nearly one-third of the cases both men and women are between 20 and 25 years of age. The combination of ages differs very much in different occupations. Dr. Ogle has followed it out for all the occupations mentioned on page 104. Taking the two extremes, namely, the miners and the professional and independent class, we have the following distribution per 1000 bachelors marrying and their wives.1 Unxu.
AOIS. Men.
Under age . . 21 to 25 . . . 26 to 30 . . . 30 to 36 . . . 35 to 40 . . . 40 to 45 . . . 45 to 60 . . . 50 and upwards
. . . . . . . . 1 Jour.
169 635 228 47 14 6 1 1000
Women.
439 388 123 30 11 4 4 1 1000
Stat. Soc. 1890, p. 274.
PROFESSIONAL
AM>
I N D K P E N D E N T CL.AFLFL. Men.
7 144 376 272 08
43 26 34 1000
Women.
127 402 278 107 34 24 11 17 1000
107
MARRIAGES.
One is struck here by the fact that not only do the men marry younger among the miners, but also the women. The possibility of a man marrying is generally controlled by his economic condition. But among women such a cause would not be active in the majority of cases, so that one does not see exactly why marriage should be deferred in the case of women of the upper classes. The Probability of Marriage at Different Ages. The above tables showing the number of men or women marrying at different ages do not take into account the fact that there is a greater number of people in the lower age classes than in the upper, and also that there is a less number married. I t is obvious, however, that the number of men, say of the age 20 to 30, who contract marriage must depend upon the number of men of that age, and especially upon the number of men still unmarried. For certain states of Germany they have compared the number of men and women marrying at each age with the number of men or women still unmarried of that age, and thus they reach what may be called a refined marriage-rate or the probability of marriage for each age. The following table shows the number of men or women marrying per 1000 men or women unmarried in each age class (eight German states, 1872-80): 15-20
Among men . . 0.2 Among women . 12.0
Aai C u n . 20-25 25-80
42. 97.
162. 146.
80-10
141. 90.
40-50 50-fi0 60 and over.
77. 30.
32. 6.
6.6 0.6
I t appears from this that the chance of an unmarried man to marry is greatest from the age of 25 to 30, but is very nearly as great from 30 to 40. The chance of an unmarried woman to marry is greatest from the age of 25 to 30, and is much less in the periods above and below.1 Marriage according to Conjugal Condition. If we analyse marriages according to the condition of people marrying, that is, whether they have ever been married before or not, 1
Statistlk des Deutschen Relcha, Neue Folge, No. 44, p. 49*.
108
STATISTICS AND SOCIOLOGY.
we find that from 75 to 85 per cent are between bachelors and maids; 3.5 to 5 per cent are between bachelors and widows; 8 to 10 per cent are between widowers and maids; and 2.5 to 5 per cent are between widowers and widows. The number of first marriages shows very considerable regularity in different countries, but there are some differences of combination in the later ones. Austria and Bavaria have a very large proportion of second marriages, that is, where one of the parties has been widowed. In all countries there are more marriages between widowers and maids than between widows and bachelors. Marriages between divorced persons make up only a small proportion of the total, because of the small number of divorced people. Here also, as in the case of widowhood, the man has a better chance of remarrying than the woman. In Saxony 11 per cent of the divorced men married again, against 5 per cent of the divorced women. In Prussia the most common combination was between a divorced man and a maid, the next between a divorced woman and a bachelor, and the least common was where both parties had been divorced.1 The above figures show the distribution of marriages. I f we take the persons who contract marriage according to their conjugal condition, we shall find that out of 100 bachelors marrying, about 95 choose maids, and 5. widows or divorced women ; of 100 widowers, about 75 marry maids, and 25, widows or divorced women; of 100 maids, about 88 take bachelors, and about 12, widowers or divorced men ; of 100 widows, about 60 marry bachelors, and about 40, widowers or divorced men. The proportion of bachelors marrying maids remains about the same, but the other combinations are subject to wide variations. Peculiarities are that in Hungary widowers marry widows 1 In the large cities of Prussia the number of marriages where one or both of the parties had been divorced was exceptionally large, 1881=2.49 per cent. Zeitschrift des Preuss. Stat. Bureaus, 1882, p. 235.
109
MARRIAGES.
in more than one-half of the cases, and widows marry widowers in nearly 70 per cent of the cases. On the other hand, in Sweden and Norway widowers marry widows in less than 20 per cent of the cases, and widows marry widowers in less than 40 per cent. These variations can be explained only by national customs and habits of life. Probability of Marriage according to Conjugal Condition. From the above figures it would seem that in by far the largest number of marriages one of the parties is either bachelor or maid. This is perfectly natural, because, of the people of marriageable age and still unmarried, by far the greatest portion consists of bachelors and maids. This shows nothing, therefore, as to the frequency of marriage among the four different classes, bachelors, maids, widowers, and widows, or, as we have chosen to call it, the probability of marriage for persons in each of these conditions in life. That probability is represented by the number of persons of each class getting married per 1000 persons of that class over 15 years of age. Maids have a better chance than widows, but widowers in many countries have a greater probability than bachelors. (See next table.) Probability of Marriage by Conjugal Condition and Age. The probability of marriage may still further be studied according to the ages of persons in each of the four different conjugal classes. The following table (England, 188082) shows the number of persons marrying per 1000 of each conjugal condition, and in each age class : 1 Aon. 15 to 20 . . 20 to 25 . . 25 to 35 . . 36 to 45 . . 45 to 56 . . 65 to 66 . . 65 and over. All ages .
. . . . . . . .
Bachelors.
Spinsters.
4.6 106.8 112.4 40.6 14.3 4.4 1.0 65.8
21.5 121.0 80.6 26.3 10.4 2.6 0.4 66.9
Widowers. -
193.0 246.5 157.8 76.9 33.9 66.0 58.2
Widows.
66.6 155.3 114.6 50.2 18.6 5.4 0.6 18.2
i Jour. Stat. Soc. 1890, p. 273. For other examples see Farr, Vital Statistics, pp. 79 and 80, and Statistik des Deutschen Reichs, No. 44, p. 53», and p. 172.
110
STATISTICS AND SOCIOLOGY.
A close examination of this table shows that widowers have a better chance of marrying than bachelors at all ages, but that the chance becomes better with increasing age. On the contrary, widows, as a whole, have much less chance of marrying than spinsters, notwithstanding the fact that at each age widows have a better chance of marrying. That the frequency of marriage is less, on the whole, among widows than among spinsters, is due to the large number of the latter in the younger ages compared with the former. Mixed Marriages between Persons of Different Religious Confession, Race, or Nationality. The general tendency is for persons of the same religion, race, or nationality to marry, simply because they are brought into relation with each other and marriage follows naturally. In former times the clergy discouraged marriage with persons of other religious confession, and race and national prejudice prevented intermarriage between different races and nationalities. In modern times these prejudices have been very much softened if not done away with, and marriages between persons of different religion or nationality are not infrequent. Race seems still to be an obstacle where the difference is marked by colour. As a rule, persons of the same religious confession marry. In Prussia, during the period 1875-90, 94.77 per cent of the Protestant men, 88.20 per cent of the Catholic, and 94.79 per cent of the Jewish, married women of the same religious confession. Marriages between Christians and Jews form in the marriages of Jewish men 5.21 per cent, and among Jewish women 5.23 per cent, of the cases. On account of the small number of Jewish brides and bridegrooms, such mixed marriages form only a small proportion of the total number of marriages of Protestant and Catholic men and women. Catholic men seem to be the most liberal in contracting mixed marriages, especially with Protestant women.1 1
Zeitschrift des Preuss. Bureaus, 1891, p. 197.
MARRIAGES.
Ill
Mixed marriages between persons of different nationality are not very common in Europe compared with the total number of marriages, because of the small number of foreigners present in the country. Some statistics from France for 1891 show that more than one-fourth of the Germans marrying there married German wives, while about one-half married French wives. On the other hand, more than one-half of the German women married French husbands. About the same proportions are true of the English. Two-thirds of the Belgians marry women of the same nationality; about one-third of the Italians and about one-sixth of the Swiss marry women of the same nationality. In all these cases the foreign women are more disposed to marry French men than foreign men are disposed to marry French women.1 It is in the United States that we have the greatest mixture of nationalities, and it is here that we should expect to find some facts in regard to intermarriage. The very fact, also, that among the immigrants there is always an excess of males, while among the native-born there is often a local excess of females, would lead us to expect intermarriage. Our statistics of marriage, unfortunately, are very incomplete, and give no indication of the nationality of bride and bridegroom. W e have some indirect information in the statistics of mixed parentage. In Massachusetts in 1885, 6.17 per cent of the total population, comprising 119,741 persons, were the offspring of marriages between natives and foreigners. Of these, 67,656 had father foreign-born and mother native, while 52,085 had native father and foreign mother. There was also some intermarriage between foreigners of different nationality. The Tenth Census made the interesting deduction that in those portions of the country where a single nationality was numerously represented, as, for instance, the Irish in New York city, there was little intermarriage i Zeitschrift des Preuss. Bureaus, 1803, S. C. IV.
112
STATISTICS AND SOCIOLOGY.
with other nationalities. But where the nationality was not numerously represented, as the Irish in St. Louis, there was a greater tendency among the men to marry native-born women, or women of other nationality. Marriages between Blood Relations. These are not very frequent, but have always been of interest on account of the physiological questions supposed to be connected with them. They are generally less than one per cent of all the marriages, and as a rule are more frequent in the country than in the city. Very few countries make complete returns. The following table shows the number per 1000 marriages CorNTBT.
Prussia, 1877-80 Bavaria " Italy, 1872-80 . France "
. . . .
. . . .
. .
. .
.
.
First cousins.
Uncle and niece.
Nephew and aunt.
7.8 8.6 6.6 10.6
0.70 0.82 0.57 0.60
0.18 0.36 0.09 0.23
Together. 8.7 9.8
7.3 11.4
Fecundity of Marriage. The fecundity or fruitfulness of marriage is of the greatest importance, for upon it depends the increase of population. In order to measure it exactly we should take each married couple and record the number of children born during marriage. This would require ordinarily a period of say 20 years and extremely accurate statistics. I t is impossible to attain such perfection, and in order to judge of the comparative fruitfulness of marriage in different countries, we have recourse to cruder methods. One is to divide the total number of children born in the year by the number of marriages consummated that year. Of course the births in any one year are not due to the marriages of that year. But if the number of marriages did not increase, such a division would represent pretty accurately the average fecundity. In most countries, however, the absolute number of marriages is increasing rapidly, so that the births of this year 1
Statistik des Deutschen Reichs, No. 44, p. 63*.
113
MABBIAGES.
represent the fruitfulness of a less number of marriages than those of this year. It is therefore desirable to divide the number of births by the marriages of some previous year. Dr. Farr calculated that the interval between the mean age of mothers at marriage and their mean age at the births of their children is about six years. Hence, if the legitimate births of a given year be divided by the marriages of six years earlier date, the quotient will be the proportion of children to a marriage. This gives a slightly larger average than the cruder method. An example of the two methods is shown in the following table, where the first column gives the number of births divided by the marriages of six years previous, while the second column shows the number of births divided by the number of marriages of the same year. The ordinary number of children to a family varies from three in France, to five in Ireland and Italy. 1 Italy Ireland Prussia Sweden Holland England Belgium Spain Denmark Austria France
1ST«. Births to marriages six years previous.
18SS. Births to marriages of same year.
5.16 6.00 4.92 4.84 4.83 4.63 4.48 4.47 4.24 3.73 3.42
4.5 4.8 4.1 4.3 4.1 3.9 3.9 4.5 3.7 3.9 3.0
A second method of measuring the fecundity of marriage is by comparing the number of births with the number of women of child-bearing age. This has already been referred to in the chapter on Births, as giving a truer standard of comparison than the ordinary birth-rate. In order to show the fruitfulness of marriage, we take the legitimate children and compare the number of births in 1
Newsholme, Vital Statistics, p. 61, Levasseur, Fop. frangaise, III., 191.
114
STATISTICS AND SOCIOLOGY.
any one year with the number of married women of 15 to 50 years of age. Some of the results are shown in the following table : 1 Births to 1000 married women 18 to 60 years of age.
Holland . Belgium . Norway . Switzerland Austria .
. . . . . . . . . . . . . . .
310 289 268 269 268
Births to 1000 married women 15 to 50 years of age.
Italy Sweden . . . . Denmark • . . . France • . . . .
264 248 241 174
This table shows the very considerable variations between different countries. In Holland, for instance, 1000 married women of the age 15 to 50 bear 310 children per annum, while in France 1000 married women of the same age bear only 174 children. In regard to fruitfulness at various ages we have data from a few countries giving the number of births per annum for 1000 married women of each age class as follows : Eight German States . Denmark . Sweden . . . Norway Finland
15-20
20-25
25-30
80-35
85-40
40-45
45-50
593 729 637 263 408
604 491 476 413 416
405 391 384 395 369
299 315 334 354 328
221 240 262 301 268
102 120 167 187 166
13 13 24 43 27
It is seen from this table how much the fruitfulness of the younger age classes excels that of the upper, although there are very considerable variations from country to country. It is not true, however, that the mere age of the married women, is the controlling influence in the number of births. If that were true we should find the birth-rate heaviest in those countries where the largest proportion of married women is in the lower age classes. This is not always the case. In some countries, as, for instance, in Sweden and Denmark, a low birth-rate corresponds to a small proportionate number of married women 1
Statistik des Deutsclien Reicha, No. 44, p. 56».
MARRIAGES.
115
under 30 years of age. In Holland and Belgium, on the other hand, with a s i m i l a r l y small proportionate number of married women of that age, the birth-rate is considerable. In Italy, and especially in France, although the number of such women is large, the birth-rate is small. All this goes to show that the fruitfulness of marriage is controlled by social as well as physiological causes. In Prussia there are statistics of the fruitfulness of marriage according to the religious confession of the parents. These statistics, which have been continued for a long series of years, show that marriages between Christians and Jews result in a very small number of children. From 1875 to 1890, there were born to each marriage of Protestants, 4.35 children, to each marriage of Catholics, 5.24 children, to each marriage of Jews, 4.21 children. But when the husband was a Jew and the wife a Protestant or Catholic, the number was only 1.58 and 1.38 ; when the wife was a Jewess and the husband a Protestant or Catholic, the number was 1.78 and 1.66. Whether this small fruitfulness of mixed marriages is due to differences of blood or to social reasons is uncertain.1 In Massachusetts they have made some attempt to determine the relative fruitfulness of the native and foreign-born population. These figures do not rest on the statistics of births, but on the census statistics in regard to the family. It appeared in the census of 1885, that of all the married women in Massachusetts 17.56 per cent had never had children. Of the native-born married women it was 20.18 per cent, while of the foreign-born married women it was only 13.27 per cent. Of the foreignborn married women, among the Irish only 11.57, among the French Canadians 11.66, and among the Germans only 11.16 per cent had never had children. These figures would seem to indicate that the fruitfulness was greater among the foreign than among the native-born. The 1
Zeitschrift des Preuss. Stat. Bureaus, 1891, p. 106, 1802, p. 32.
116
STATISTICS AND SOCIOLOGY.
same census seemed to show that the foreign-born women had a larger number of children than the native-born, for the average number of children to the foreign-born married women was 5.22, while to the native-born married women it was only 3.37. This figure is inconclusive because the total number of children which have been born depends upon the length of time during which marriage has existed, and unless the proportions were the same among the two classes the figures would not be comparable. Another interesting fact is that while the foreignborn women have the largest number of children, they lose a larger number by death. The number of living children among the foreign-born women was only 3.46, while among the native-born married women it was 2.41. While the native-born, therefore, have a less number of children, more survive. 1 In Prussia they have studied the fecundity of marriage according to the occupation of the father. Men change their occupation sometimes (as servants become innkeepers), so that the statistics are not altogether exact. The highest fruitfulness was shown by agriculturists, miners, and clergymen — more than five children to a marriage. Next came labourers, factory-hands, men engaged in transportation, etc. The lowest number was among artists, literary men, and the higher professions. These figures must be used with great care, for all classifications of occupation are doubtful, and many other influences affect the result. 2 Dissolution of Marriage. Marriage is dissolved either by the death of one of the parties, or by divorce. The former, of course, is the more frequent, and the death of the husband is more frequently the occasion than that of the wife, because husbands are, as a rule, older than their wives. Out of 100 marriages dissolved by death there 1 2
Census of Massachusetts, 1885, p. ciii. Zeitschrift des Preuss. Bureaus, 1889, p. 193.
117
MARRIAGES.
were in Denmark 55.3, in Norway 53.4, and in six German states 56.2 due to the death of the husband. In England, Dr. Farr declared that the mean age at marriage being 25 years, the mean time that such a couple survives is 27 years, which represents the duration of married life. The further mean life-time of the survivor is, in case of the husband, 9.44 years, and in case of the wife 11.31 years. In Prussia ( 1 8 6 7 - 8 1 ) the average length of married life was 22.4 years. Where the husband died first the average length was 23.2 ; where the wife died first it was 21.5 years. This less duration of married life where the wife dies first is due to the fact that the marriages of short duration are apt to be those broken by the death of the wife from the dangers of child-birth. Marriages which have stood five years are more apt to be broken thereafter, especially during the following 20 years, by the death of the man. 1 Some later statistics for the three German states, Prussia, Bavaria, and Oldenburg are a little different, but show the same general course of events. Out of 100 marriages dissolved by death the following table shows how long they had lasted, and compares the length of those dissolved by the death of the husband with those dissolved by the death of the wife. 3 Dissolved by death of the huBband.
D U R A T I O N OF M A R R I A G E .
6 years and under . Over 6 to 10 years Over 10 to 15 years Over 16 to 20 years Over 20 to 25 years Over 25 to 30 years Over 30 to 35 years Over 35 to 40 years Over 40 to 45 years Over 45 to 50 years Over 50 years . . Sum 1 9
. . . . . . . . . . .
. . . . . . . . . . .
9.4 11.7 12.2 11.6 11.8 11.3 10.6 8.3 6.7 3.9 2.5 100.0
Dissolved by death of the wife.
14.1 13.8 12.4 10.3 9.7 9.6 9.5 7.9 6.4 3.8 2.5 100.0
Zeitschrift des Preuss. Bureaus, 1882, p. 242. Statistik des Deutschen Reichs, No. 44, p. 184.
Average.
11.5 12.6 12.3 11.0
10.9 10.6 10.1 8.1 6.5 3.9 2.5 100.0
118
STATISTICS AMD SOCIOLOGY.
This table shows the greater frequency of the marriages of short duration which are broken by the death of the wife. It also shows an almost steady progress in the dissolution of marriage. Dissolution of Marriage by Divorce. It is difficult to determine the exact number of divorces because of the difference in law in different countries, some granting full divorce with liberty to marry again, and others granting simply separation. The following table shows in the first column the absolute number for the year 1885, and in the second column the number per 100,000 of the population in 1886. 1 Couhtet.
France Germany Austria Russia Switzerland Denmark Italy Roumania Great Britain and i Ireland ) • • . . . Belgium Holland Sweden Norway Australia Canada United States Total
Total number.
6,246 6,161 1,718 1,789 920 636 666 641 ^ 508 290 339 229 68 100 12 23,472
Number per 100,000 of the populmtiou.
32.61 26.97
64.4» 3.76 r 3.79 j ^
11.14 4.81 88.71
43,583
It appears from this table that there are more divorces in the United States than in all other countries put together, and that the divorce-rate is higher than in any other country. In 1870 there were 155 divorces, 1 Willcox, The Divorce Problem, and A Study in Vital Statistics, Political Science Quarterly, 1893. Report of the Commissioner of Labour, 1889, Marriage and Divorce.
MABBIAGES.
119
and in 1880, 203 divorces, to 100,000 married couples. In 1870, 3.5 per cent of the marriages were terminated by divorce; in 1880, 4.8 per cent; and in 1890, 6.2 per cent. Divorce is more frequent among the blacks than among the whites; less frequent among Catholics than among Protestants; less frequent among the foreignborn than among the natives. The city divorce-rate is greater than the country and increases more rapidly. The duration of marriage before dissolved by divorce was on the average 9.17 years, but, One-fourth of the divorces came within 3.42 years One-third " " 4.38 " One-half " " 0.56 " Two-third« " " 9.06 " Three-fourths " " 11.83 "
Nearly two-thirds of the divorces were granted on demand of the wife. The causes alleged were : desertion, 40.15 per c e n t ; adultery, 21.45 per cent; cruelty, 16.35 per cent; drunkenness, 4.40 per c e n t ; neglect to provide, 2.52 per c e n t ; imprisonment, 0.87 per cent; combination of general causes, 11.23 per c e n t ; local and minor causes, 3.03 per cent. It does not appear from statistics that divorced men and women are more disposed to remarry than widowers and widows. Scientific
Tests.
Method of Observation. We may repeat here the remarks made in the chapter on Births, as to the method of observation necessary in order to get good statistics of marriages. A single census of the number of people married within the year is utterly untrustworthy because of the omissions due to deaths, migration, and carelessness about dates. Each marriage should be registered at the time it is celebrated and the various facts of sociological interest, such as the age, conjugal condition, and
120
STATISTICS AND SOCIOLOGY.
occupation of the two parties, should be ascertained. Marriage is such an important event and has such important legal consequences in domestic relations and the transmission of property that its registration should be compulsory. In old times marriages were celebrated in churches, and the church registers give us more or less complete statistics. With the establishment of different religious denominations, and of civil marriages, the church registers are no longer adequate. For instance, in England, at the end of 1891, there were 15,044 churches or chapels belonging to the Established Church in which marriages could be solemnized, and 10,781 buildings registered for marriage by other rites than those of the Established Church. Of 1000 marriages, 699 were celebrated according to the rites of the Established Church, 42 in registered places belonging to Roman Catholics, 118 in registered places belonging to other Christian denominations, 0.3 according to the rites of the Quakers, 4.6 among the Jews, and 136 were civil marriages in Superintendent Registrar's Office.1 In such a condition of things, with marriage celebrated in so many different places and by such a variety of officers, no dependence can be placed upon voluntary registration, and so compulsory registration with penalty attached for non-compliance with the law is necessary. In the United States the statistics of marriage, like those of births and deaths, are very incomplete. The Eleventh Census put into its list of questions the inquiry " Married during census year," with the hope of supplying this deficiency. But such a method is very crude and can give us no complete or accurate knowledge.2 The whole matter is one that pertains to the states, and Rep. Registrar General, 1891. The total number married daring the year was 730,562 : males, 368, 809 ; females, 361,753. This would give a marriage-rate of only 11.6 per 1000, which is evidently absurd. 1 1
MARRIAGES.
121
the way in which the states perform this duty is described by Commissioner Wright as follows : 1 " It is to be regretted that while this report is practically complete as regards divorces, it is thoroughly incomplete and unsatisfactory so far as marriages are concerned. Very few states have any registration system by which marriages are recorded. . . . Licenses are recorded on various bases and under various conditions, and there is little compulsory law relative to the returns of marriages celebrated. In some states the number of licenses issued greatly exceeds the number of marriages celebrated. In some other quarters the number of marriages celebrated greatly exceeds the number of licenses issued. This may occur on account of conditions of law, as, for instance, in some counties in Maryland, marriages celebrated exceed the licenses issued, and in others the reverse is true. The reason of this is that marriage may take place either under license or publication of bans; so if those under licenses were well reported, or those under bans were many, they might together exceed the number of licenses ; and if poorly reported or but few occurred under bans they might be considerably less than the licenses. It will be readily understood that no records, under such a condition, can be very valuable."
Bash for Comparison. It has already been remarked that the so-called marriage-rate, that is, the number of marriages or of persons marrying per 1000 of the population, is not an altogether scientific method of comparing the marriages of different countries. The reason for this is that one population may have a larger proportion of children and non-marriageable persons than another. This would make a great difference in the marriage-rate. A better standard would seem to be the number of marriageable persons, who are not yet married. Such a comparison has already been made on page 101, under the head of Probability of Marriage. The employment of the refined marriage-rate changes considerably the order of the different countries as regards the frequency of marriage. The crude marriage-rate, therefore, would seem to be a very inadequate method for comparing the frequency of mar1
Marriage and Divorce, 1889, p. 18.
122
STATISTICS AND SOCIOLOGY.
riage in different countries or in different portions of the same country. The reason for employing it is that it is easier to calculate. It is not easy to ascertain for years between censuses the exact number of unmarried persons above the age of fifteen, which is the standard for the refined marriage-rate. For whole countries the changes from year to year will probably be indicated with sufficient accuracy by the crude marriage-rate, because the constitution of a large population by age and conjugal condition changes slowly. Particular Test». The distribution by age and conjugal condition is the most important factor whose influence must be considered in comparing the marriage-rates of different communities. But in studying the marriagerate of small communities care should always be taken to consider local circumstances which may affect the marriage-rate. The relative proportion of the sexes, the number of domestic servants, the presence of religious houses, social customs, military conscription, all of these may have special influence on the marriage-rate. Dr. Ogle, for instance, explains the high marriage-rate in Bedfordshire by the great extent to which young women are employed in certain industries, and are thus able to earn money and contribute to the family expenses. I t has generally been supposed that the age of marriage was determined among men by economic condition, and among women by their maturity. Dr. Ogle's theory would seem to show that economic condition may be a factor among women also. In considering the influence of natural conditions upon such a phenomenon as marriage, care must be taken to explain the facts if possible by social influences. Thus in tracing the frequency of marriage according to seasons, the influence of social and religious festivals is probably greater than any natural influence. Becker has still further pointed out that in large cities the habit of chang-
MARRIAGES.
123
ing the domicile at certain fixed periods, or of making contracts for service for certain fixed periods terminating, for instance, the first of May or the first of November, might be sufficient to influence the marriage-rate. For the marriage would not be celebrated until the contract had expired, or until the new domicile had been taken possession of by the family. It behooves us, therefore, before attributing sudden changes in marriage-rates to natural influences or even to general social causes, to eliminate all local causes which can be detected. With these provisos and under these conditions it would seem as if marriage were a social phenomenon peculiarly fitted for the statistical method. There is no valid reason why every marriage and every dissolution of marriage should not be accurately registered, with full details of the time and circumstance and the demographic condition of the participants. Births may be concealed and deaths wrongly classified, but marriage is generally an important event of adult life, easily ascertainable, and with little motive for concealing or falsifying the facts. A t the same time, it is of so much importance in social life that it either influences or is influenced by almost all other social actions. The scientific collection, tabulation and comparison of statistics of marriages is one of the most important parts of statistical science. Reflective
Analysis.
It is not necessary to dilate here upon the importance of marriage to the social condition of any community. It has important influence on population, although there is no fixed proportion between the marriage-rate and birth-rate. W e have seen in the case of France that while the marriage-rate is about that of the rest of Europe, the birth-rate is very low. But marriage in itself has great social significance. It forms the family and influences the social condition of its members. Fluctua-
124
STATISTICS AND SOCIOLOGY.
tions in the marriage-rate are therefore an important index of the economic and social prosperity of the community. Although the old relation between the marriagerate and the price of corn has become obscured by the great complexity of modern industrial relations, yet there is no doubt that the former is an index of economic prosperity. The great problem is to find the phenomenon which is the best barometer of industrial life with which to compare it. Marriage and Population. The way in which marriage affects population is somewhat interesting to follow out. A possible effect might be produced either by decreasing the number of marriages, or by advancing the age at which people marry. In Europe the marriage-rate seems to be slowly decreasing, i.e., the number of celibates is increasing. The decrease is so small, however, that it has very little effect on population. Dr. Ogle estimates that the number of children per marriage ( 4 . 2 ) remaining the same, it would be necessary to reduce the English marriage-rate from the lowest rate ever recorded ( 1 4 . 1 ) to 7.8 per 1000, in order to reach a stationary population. That is to say, nearly one-half of the people who now marry would have to remain single. An advancing age at marriage might retard population in three ways : ( 1 ) because there would be a less number of persons to get married, say at the age of 30 than at 25 ; ( 2 ) the child-bearing period would be somewhat diminished ; and ( 3 ) the interval between generations would be increased. The most important influence would seem to be the second, and an increasing age of women at marriage would probably have an effect on the number of births. The difficulty is that the child-bearing period is indefinite, and although a woman is probably less fertile as she advances in age, yet the period is so long that there is still time to bear the average number of children. Dr. Ogle estimates that, if the age of all women at marriage
MARRIAGES.
125
were advanced five years, the child-bearing period and presumably the number of births would be diminished by 26.6 per cent. Even then we should have in England a birth-rate of 23.3 per 1000, which is 5.5 per 1000 in excess of a perfectly attainable death-rate. When we remember that from 1873 to 1888 the average age of spinsters marrying increased by only six months, we see how impossible it is to expect a stationary population either from an increase in celibacy or from advanced age in marriage.1 Artificial restraints compelling celibacy or deferring marriage very long would probably not restrain population, but would simply destroy social morality. Certainly a sound sociology would not advocate such a course. We may demand, as in the study of Births, whether there are sociological laws governing the number of marriages from year to year. Marriage is a peculiar phenomenon. It is partly dependent on physiological laws, as the impulse to get married is in response to a natural desire, and the time of getting married is governed primarily by age. It is at the same time a psychological and social phenomenon, for there are purely social influences leading to marriage, and the choice of time and circumstance is in the hands of the individual although he may be governed by considerations of economic expediency and of public opinion. We should expect, therefore, to find a phenomenon preserving a general regularity in its movement and yet subject to considerable fluctuations. And we find the marriage-rate answering to this description perfectly. If we take a long period, say 1841-85, in Germany the average marriage-rate was 16.39. The average annual variation from this marriage-rate was only 6.48 per cent. This, of course, does not prove that there were no greater variations from year to year, but that the variations often balanced each other. If we take a smaller territory the variation is more considerable, as, for 1
Jour. Stat. Soc. 1890, pp. 270 and 279.
126
STATISTICS AMD SOCIOLOGY.
instance, in most of the smaller German states it is 10 per cent. And where the population is homogeneous, as in cities, the variation is more considerable,—in Hamburg it was 11.86 per cent, and in Bremen 12.07 per cent. This is because any cause affecting particularly, say the industrial class, would not be offset by some other influence affecting other classes in a counterbalancing way. The regularity for all Germany, however, is something very peculiar. And it is more striking from the fact that the marriage-rate has on the whole been declining during the period. Marriage therefore may be looked upon as one of the great natural social phenomena whose movement we can to a certain extent explain and even predict. It is not so regular and constant as births and deaths. While the annual average variation from the average in the case of marriages was 6.48 per cent, for births it was only 3.98 per cent and for deaths only 3.90 per cent. Marriage is thus probably more subject to individual caprice than the other two. What the influence of natural causes on marriage may be, it is difficult to determine. Climate seems to have little influence, unless it be in the earlier maturity of women, leading to earlier marriages. Still there is a curious geographical concentration of high marriage-rates about Hungary, Austria, and the eastern provinces of Prussia, thence decreasing on the north and west, which is difficult to explain. The influence of the seasons is but dimly felt. On the other hand, the influence of great social causes is evident in all the statistics of marriages. The effect of war and bad times in decreasing, of economic prosperity in increasing the marriage-rate, shows how the natural desire to get married is controlled by the favourable or unfavourable opportunity. That the man is older than the woman is due to the fact that in our civilization the man is largely responsible for the support of the family,
MARRIAGES.
127
and hence must attain full wages or a secure position before he marries. The woman either adds nothing to the money income or her addition is only supplementary, and hence she need not wait until attaining economic independence before being married. T h a t widowers have a greater probability of getting married than bachelors is doubtless due to their better economic position. That widows have less chance than maids and marry less often than widowers is again due to the fact that widowhood often leaves them without the means of support, or perhaps burdened with children. The more advanced age at which the upper classes marry compared with the lower shows the effect of ambition and prudence in one, of contentment and perhaps improvidence in the other. Are these influences strong enough to destroy the notion of the freedom of will on the part of the individual in contracting marriage? We cannot say. The great social movement goes on, governed and influenced by general causes working through the individual. That the mass of the people are controlled by these great influences is shown by the recurring regularities in the statistics or in their variations. How much room there is left for the exercise of choice on the part of the individual it is difficult to say.
CHAPTER
VII.
DEATHS. Sociological
Purpose.
NEXT to birth the most important phenomenon in human life is death. It is also of great sociological significance. Upon the relation of births to deaths depends the increase of population, with all its consequences for the strength and prosperity of the community. Upon the character of this relation depends the social character of the increase. For the same net increase may be attained either by a large birth and death-rate or by the conjunction of a small birth and death-rate. When one considers the economic, social, and moral interests connected with the bearing and rearing of children, the difference between these two methods of increase becomes fundamental for the type of society. In fact we are apt to think of the former as characteristic of barbarous and half-civilized conditions, and of the latter as more or less the ideal aimed at by civilization. And although a large birth-rate may often be consistent with national prosperity, a large death-rate always demands explanation. Death is always a loss and a misfortune. The comparative death-rate is therefore an index of the relative civilization of countries, an index which needs to be used with care, but which, when once established, appeals with almost irresistible force to the imagination and the understanding. Man will not believe it to be a good country to live in where human beings are born simply to be swept away like flies at the end of the summer. 128
DEATHS.
129
I n the same way in any particular country the deathrate is looked upon as an index of the condition of the community from year to year, of the healthfulness of different localities and occupations. Wars, epidemics, and economic adversity show themselves in an increased death-rate during the year or in the years following; while economic prosperity, peace, and social morality are marked by a slowly decreasing death-rate. The deathrate tests the circumstances under which men live. I t discloses the evil influences of city life. I t reveals the dangers accompanying civilization. In other words, wherever a circumstance or a condition can be shown to produce an increased mortality, such circumstance or condition is at once condemned. There is no appeal from the decision if the fact be once established. So the death-rate is watched eagerly, in order to detect the result of sanitary legislation or other measures intended to promote the health of the community. The death-rate thus has important connections with all the social interests of the people. As Dr. Farr quaintly said more than twenty years ago : " How the people of England live is one of the most important questions that can be considered; and how — of what causes, and at what ages — they die is scarcely of less account; for it is the complement of the primary question teaching men how to live a longer, healthier, and happier life. . . . There is a relation betwixt death and sickness ; and to every death from every cause there is an average number of attacks of sickness, and a specific number of persons incapacitated for work. . . . There is a relation betwixt death, health, and energy of body and mind. There is a relation betwixt death, birth, and marriage. There is a relation betwixt death and national primacy : numbers turn the tide in the struggle of population, and the most mortal die out. There is a relation betwixt the forms of death and moral excellence or infamy; men destroy themselves directly or their fellows under the most varied mental conditions, they may die by indulgences in excesses, by idleness, or by improvidence."1 i Vital Statistics, p. 116.
130
STATISTICS AND SOCIOLOGY.
This is simply saying that the statistics of death have relation to all other social statistics. The death-rate varies according to sex, age, and conjugal condition. I t varies in different climates, according to seasons, among different races, in city and country, in different occupations. Death is the concomitant of crime, of vice, of poverty, and of misery. I t is, on the other hand, often an index of the resisting power of the community in times of economic distress and hardship. Where the death-rate fluctuates, going up and down with every change of social conditions, it shows that the community has but little resisting power against the forces of nature. Where, on the other hand, a community has reached a stable and selfcontained position, it rides over these calamities without suffering the extreme penalty which the other community pays. Death in itself is a pure process of nature, but the time and circumstances are, to a certain extent at least, under the control of man. He can adapt himself to every climate; he can resist the extremes of heat and cold; he can take precautions against accidents and disease; — i n other words, his life is partially in his own hands. The statistics of mortality under different circumstances show us the success or ill success which accompanies man's struggle for life. The statistics of deaths at successive ages, the calculation of the mean mortality and of the average length of life, show us with what success the community at large is guarding its vital force. The sociological purpose of statistics is to follow out the relation of death to all these other social phenomena. We are to place the statistics in such a way as to show the influences mentioned above. We are to seek everywhere to disengage the constant and inevitable influence of nature from the transient and remediable influence of social condition and environment, for the purpose of indicating the possibility of social amelioration. W e are to
131
DEATHS.
discuss the question how far the astonishing regularity in the death-rates for successive years proves that death is a pure process of nature, and how far the irregularities show us the influence of varying social conditions. In other words, as in all vital statistics, we seek to reach back of the mere phenomena to the real underlying causes. Statistical
Data.
Deaths are commonly expressed by means of a deathrate, that is, the number of deaths per annum for each 1000 of the population. This crude death-rate is open to criticism, as we shall see later on, but it is sufficiently accurate for large populations or for the study of the same population from year to year. The deaths (still-born excluded) per 1000 of the population are shown in the following table Average 1871-90.
Hungary (16 years) Austria Italy Germany (19 years) Prussia Fiance Holland • Switzerland . . Belgium Scotland England and Wales United Kingdom . Denmark Ireland Sweden Norway
. .
.
.
.
. . . .
33.7 30.6 28.6 26.0 25.6 22.8 22.6 22.1 21.4 20.4 20.3 19.9 19.0 18.0 17.6 16.9
1891.
ISM.
1893.
33.1 27.9 26.2 23.4 22.9 22.6 20.7 20.8 21.0 20.7 20.2 20.0 20.0 18.4 16.8 17.6
35.0 28.8 26.3 24.1 23.4 22.6 21.0 19.3 21.8 18.6 19.0 19.0 19.4 19.4 17.9 17.8
31.1 -
25.3 24.6 24.2
_
19.2 20.6 20.3 19.4 19.2 19.1 18.9 17.9 -
16.4
The above table shows wide differences in the deathrate,— Hungary with its 33.7 per 1000 being almost double Norway with its 16.9. Austria, Italy, and Germany, including Prussia, all seem to have a heavy death1
Registrar General, England, Report 1893.
132
STATISTICS AND SOCIOLOGY.
rate for the period 1871-90, but since then the rate has declined. France stands about midway in the death-rate, while it stood lowest in the birth-rates. Ireland, which had a very feeble birth-rate, has also a feeble death-rate. Influence of Climate and Geographical Position. There is no doubt that climate has enormous influence upon mortality. There are some places where it is impossible for human beings to live. In tropical climates, while the native thrives, the foreigner succumbs. All these things, however, are generally matters of particular observation and do not enter into general statistics. The most interesting question in this connection is that of acclimation, that is, whether by continued residence foreigners can accustom themselves to a climate which at first is fatal. Our statistics are not sufficiently accurate to indicate that it is impossible for Europeans to become permanently acclimated in the tropics, but they do show that it is a matter of extreme difficulty. The death-rate for the British army at home in 1891 was 4.7, abroad 13.5, per 1000. Older statistics show that out of a thousand soldiers stationed in Ceylon, 44 died the first year, 48 the second, and 49 the third ; of 1000 stationed in Jamaica, 77 died the first year, 87 the second, and 93 the t h i r d ; of 1000 in Guiana, 77 died the first year and the number increased steadily till the tenth year, when it was 140. These figures seem to show that the longer the soldiers are kept abroad the greater the mortality. Mere geographical position does not seem to be a determining factor in the distribution of death-rates. It is true that we find the highest death-rate in the east of Europe, a moderate one in the centre, and the lowest in Northern Europe. A somewhat similar distribution was observed in the birth-rates, and, generally, heavy deathrates accompany heavy birth-rates. Both are due more to general social influences than to mere geographical position. Influence of Race and Religion. The influence of race
DEATHS.
133
is also obscured by that of social and economic condition. The high "death-rates prevalent in Russia and the Slavonic provinces of Prussia and Austria would seem to show greater mortality among the Slavs than among Germanic nations, but this is probably economic condition rather than race influence. In the United States the census of 1890 gives a deathrate of 17. for native-born whites of native parentage, 24.42 for native-born whites of foreign parents, 19.85 for foreign-born whites and 19.57 for the coloured. The excessive rate among the native-born whites of foreign parentage is due to the large number of children in that class. The death-rate of the coloured is a trifle less than that of all the whites, but in the cities the death-rate of the coloured is 34.52, while that of the whites is 23.22. Jews show everywhere a small death-rate. Thus in Bavaria in 1876, the death-rate for Protestants was 25.5, for Catholics 32.2, for Jews 18.8, average for the whole country 30.3. The low rate for Jews is due partly to their lower birth-rate. In Prussia it was shown, that while they were 13.25 per mille of the population, they were only 7.28 per mille of those dying under the age of 15, and 11.16 per mille of those dying over the age of 15. This shows the preponderance of the Jews in the upper age classes. Density of Population and Death-rate. It has often been supposed that the density of population had an influence upon the death-rate, but no such influence is traceable for whole countries. Belgium, which has. a very dense population, has a very low death-rate, but Norway, with a sparse population, has a still lower rate. If we take the provinces of Prussia for the period 1841-85, a period sufficiently long to obliterate exceptional influences, and compare the average death-rate with the density of population, the highest death-rate (42 per mille) is found in the thinly peopled agricultural provinces of the East;
134
STATISTICS AND SOCIOLOGY.
but a low death-rate (30 per mille) is found in the equally agricultural region of Schleswig-Holstein, while the thickly peopled, industrial Silesia, Westphalia, and Rhineland have a medium death-rate (36 per mille). If we take smaller areas, there seems to be some relation between density of population and mortality. Dr. Farr believed that he had discovered an exact formula for this relation. However this may be, if we divide the population of England into urban and rural, classifying under the former all towns of 3000 inhabitants or over, we shall always find a higher death-rate in the former than in the latter. For the decade 1881-90, while the death-rate for all England was 19.1, for urban districts it was 20.3, while for rural districts it was only 17.3, that is, the mortality in towns was to the mortality in the country as 117 to 100. 1 The true difference between urban and rural mortality is greater than this, if due allowance be made for age and sex distribution. There is in towns a large proportion of females and of adults, and a small proportion of very aged persons. There is the slightly counterbalancing influence of a large number of infants in towns, but this is followed by an increase of young persons, whose death-rate is very low, so that general mortality in towns should be less than in rural districts. 3 The method for eliminating this disturbing factor will be considered under the head of Scientific Tests. Mortality in Cities. If density were the only factor determining the increase of mortality, then the death-rate in cities ought always to be much greater than in the country. But when we compare city with country mortality there are many things to be considered. In cities we have, as already mentioned, a favourable age classification ; we have, as a rule, better medical assistance, hospitals, free dispensaries, and in some cities the water supply and 1 a
Registrar General, England, 1891, p. lvii. Newsholme, Vital Statistics, p. 137.
135
DEATHS.
sanitation are better than in small villages or country districts. On the other hand, there are many things tending to increase mortality in large cities, such as poverty, crowded tenement houses, filth and neglect of sanitary precautions, vice, crime, drunkenness, and accidents. As a consequence, if we compare city with city, we do not find that the death-rate increases either with the population or with the density. Some cities have a larger deathrate than the average for the whole country, and some have a smaller. Thus in England and Wales, in 1887, the death-rate for the whole country was 19.1, for 28 large towns it was 20.8. But for Manchester it was 28.7, for Preston 27.9, for Newcastle 25.3, and for Blackburn 25.5; while, on the other hand, for Brighton it was only 16.9, for Derby 17.1, and for Nottingham 18.7, all below the average, while even for London it was only 19.6.1 In Germany the cities seem to have a somewhat greater death-rate than the average, but not markedly so. For successive periods the rates were as follows : In great cities The empire .
1871-75.
31.5 29.5
1875-30.
29.6 27.8
1880-85.
27.6 27.2
It will be seen that in the last period the death-rate in the cities was only slightly higher than in the Empire at large. The cities of Germany vary widely in this respect. Some of them, such as Munich, Königsberg, Breslau, and Chemnitz, have a high death-rate, varying between 31.6 and 33.2. On the other hand, in Frankfort the death-rate was only 19.7, in Hanover 21.9, in Bremen 21.8, in Stuttgart 23.5, in Leipsic 24.1, and even in Berlin it was only 27.8.2 It is probable that all these death-rates would be raised if due regard were paid to the sex and age distribution. Nevertheless, the example of Germany seems to show that we can have city populations with a very low death-rate. 1
Newsholme, op. cit., p. 143.
* Allg. Stat. Archiv, 1890, p. 164.
136
STATISTICS AND SOCIOLOGY.
The reason for the higher death-rate in cities is not the density itself, but the circumstances which accompany it. In Scotland, it was found that Aberdeen, which has only 13.6 per cent of its population living in one room to a family, has the lowest death-rate of eight great Scotch towns, the death-rate rising pari passu with the diminution of size of the average house, until we come to Glasgow, with 24.7 per cent of its population living in one room and the highest death-rate. In comparing the 24 districts of Glasgow, the same general relation was demonstrated. For those living in one and two room houses the death-rate was 27.74 per 1000 ; in houses of three and four rooms, 19.45 ; and in houses of five rooms and upwards only 11.23. In an investigation made in regard to " back-to-back " houses in England, it was found that the greatest mortality was in those districts which contained an average proportion of over 50 per cent of such houses, while the lowest mortality was found where there were none. 1 Various attempts have been made to distinguish different rates of mortality in different quarters of the same city according to density of population. In Paris, for instance, the Elysée and the Opéra, rich quarters, had only 13.4 and 16.2 deaths per 1000, while Mènilmontant, a poor quarter, had 31.3. 2 In Berlin they distinguish the deaths according to the storey of the house where the deceased lived. The statistics were not entirely complete, but in 1880 the mortality was shown to be greater, as a rule, in the cellars and the garrets than in the other stories, and greater in the rear than in the front tenements. Probably poverty of the inmates had as much to do with it as the inferiority of the tenement itself. 3 Death-rates 1 3 8
in Successive
Periods
of Time.
If we take
Newsholme, Vital Statistics, pp. 140, 156. Levasseur, Pop. française, II., p. 403. Stat. Jahrbuch der Stadt Berlin, Jahrgang IX., p. 36.
DEATHS.
137
the average death-rates by decades there is often a wonderful regularity. In France, for instance, the rates for the successive decades from 1840 to 1880 were 23.3, 23.9, 23.6, and 23.6. But from year to year we find considerable fluctuations. In England we have a death-rate beginning with 21.7 in 1842, going as high as 25.1 in 1849, and as low as 18.9 in 1881 and 18.1 in 1888, and then re-ascending to 20.2 in 1891. In Germany we have a death-rate of 26.4 in 1841-45, ascending to 29.3 in 1848, descending to 23.7 in 1860, and ascending to 30.8 in 1866, then decreasing to 23.4 in 1891. Effect of War on Deaths. The variations in the deathrate from year to year are brought about either by war, epidemics, and hard times, or the reaction from them. The effect does not always show itself immediately, for the privation may result at first in simply weakening the physical strength and leading to disease and death later. During a war period the death-rate commonly increases. In Prussia, for instance, in 1865 it was 29.2, in 1866 it rose to 35.9, and in 1867 sank again to 28.1. 1 In Germany the effect of the war of 1871 was only slightly felt, the death-rate in 1869 being 28.5; in 1870, 29.0; in 1871, 31.0 ; from which point it steadily decreased. 2 In France, on the other hand, the death-rate, which in 1869 was only 23.4, rose to 28.3 in 1870, and to 34.8 in 1871, sinking to 22 in 1872. 8 Influence of Scarcity of Food upon Deaths. If we look back in histor}', we read of famines and dearths which swept away large fractions of the population. In halfcivilized countries like India, even at the present time, the failure of the principal food crop is the immediate cause of the death of millions of people. In civilized countries absolute famine is rarely felt, although there 1
Zeitschrift des Pre usa. Stat. Bureaus, 1885, p. 176. Stat. Jahrbuch f(ir das Deutsche Reich, 1890, p. 14. * Levasseur, La Fop. française, II., pp. 9 and 149. 1
138
STATISTICS AND SOCIOLOGY.
may be scarcity and hardship. Unless the dearth ia accompanied by some epidemic it is difficult to trace its influence on the death-rate of the same year. The usual effect of scarcity of food is through deprivation to cause disease and weakness, which later result in death. But the resulting deaths may naturally spread themselves over several years. Many attempts have been made to connect the price of food directly with the death-rate. The results, however, are not altogether satisfactory. For instance, in Germany they have traced the price of rye and the corresponding curve for deaths from 1841 to 1885. During the first 10 or 15 years there is close correspondence. When the price of rye rose from 120 marks for 1000 kilos in 1844 to 225 marks in 1847, the death-rate rose from 26 per 1000 in 1844 to 30.5 per 1000 in 1848 ; and when the price of rye sank to its former level a year later, the death-rate also resumed its usual level. 1 W e have here a striking example of the effect of a sudden and distressful failure of the food supply. But the next period of scarcity in 1853-54 which raised the price of rye even higher than in 1847, and resulted in both a decreased marriage and birth-rate, brought about a fluctuating death-rate, which rose to only 29.5 and sank immediately thereafter. Since that time the price of rye and the death-rate in Germany have shown no direct connection with each other. The price of food has become only one factor in the economic life of the community. A detailed study of deaths in connection with years of scarcity points to some interesting facts. I t is said that in times of hardship, at first men suffer more than women, because they are exhausted by labour and have insufficient nourishment; when the scarcity continues, the strain comes upon the women. In Prussia and England it would seem that the portion of the people engaged in agriculture suffers more than the city population from the 1
Statistik des Deutschen Reichs, Neue Folge, Bd. 44, p. 20».
DEATHS.
139
high price of food; in Belgium the reverse seems to be true. In England it is said that children do not suffer so severely in dear years as usual, — old people more. This probably comes from the fact that little is gained by depriving the child of food, and in times of non-employment of the parent the child receives at least equal care and attention as before.1 Influence of Death-rate on Birth-rate. It is sometimes assumed that a high birth-rate is necessarily followed by a high death-rate. This, however, is not true. In England from 1871 to 1892 there were five years in which the birthrate rose ; in three of these cases there was a rise in the death-rate, in two, a fall. In Germany during the same period there were eight years in which the birth-rate rose and in only three was there a rise in the death-rate. The notion that an increased birth-rate results in an increased death-rate is founded on the well-known fact of the heavy mortality in the early years of childhood. And it is undoubtedly true that a very sudden increase in the number of births, by increasing the relative proportion of young children in a population, would be apt to increase the death-rate. Dr. Farr, however, has pointed out that if the high birth-rate continues, the age classes from 10 to 40, where the mortality is the least, will gradually become well filled, so that the death-rate in such a population will be low, notwithstanding the large birth-rate. It must be remembered also that a large birth-rate ordinarily implies a large number of young married persons who, of course, are in the healthy ages. I t seems, therefore, that the influence of the birth-rate upon the death-rate has been greatly exaggerated. The director of the official German statistics, after comparing the curve of births and deaths during a period of 45 years comes to the following conclusion : " It is impossible to discover any connection between the birth and death-rates in the sense that a high birth-rate corresponds to a high i Weisz. Einfluss von theueren and billigen Zeiten auf der Sterblichkeit.
140
STATISTICS AND SOCIOLOGY.
death-rate in the same or subsequent year, — as one might expect on account of the great infant mortality. Only in Bavaria, where the infant mortality is particularly large, it is to be observed that the level of both rates is higher at the end of the period than at the beginning. Otherwise the years with numerous births fall more commonly together with those where the death-rate is low, the low birth-rates with the high death-rates, or the low birth-rates follow the high death-rates. This seems to indicate that the economic prosperity of the year, while it increases the birth-rate decreases the death-rate."
Deaths according to Seasons. In the changes of seasons we have a natural influence which has a great effect upon the health of man and hence upon mortality. We have here a large number of observations which are commonly illustrated by tables or charts showing the months in which the death-rate exceeds or is less than the average. The distribution varies from year to year, as an epidemic or some unusual cause may increase the rate during a particular month. But for the same country the general course of events commonly preserves about the same appearance. Characteristic types of death distribution may be seen in the following table, where Sweden represents a northern country, Germany and France countries of Central Europe, and Italy a southern country. The city of Berlin is added as a type of a city population. If the average number of deaths were 100 per month (1200 per year), the number for each month would be as follows
(1872-80):
January . February March April . . May . . June . . July . . August September October . November December
Sweden.
112.6 113.3 110.7 112.9 111.4 93.9 84.9 79.5 79.8 88.1 102.1 111.8
Germany.
101.7 108.0 109.9 105.8 101.5 94.2 94.9 103.0 99.7 91.5 92.6 97.7
France. 1050 111.3 108.2 105.4 98.1 92.5 92.1 100.8 100.7 92.8 94.2 99.4
Italy.
107.8 106.6 104.4 94.2 84.2 84.9 103.9 111.9 104.9 97.1 98.9 101.2
Berlin.
89.0 88.3 90.2 89.4 92.0 132.1 144.7 116.0 101.4 89.1 81.8 85.2
DEATHS.
141
In a northern country like Sweden the extreme mortality is found in winter, the whole summer being favourable. In Italy, on the other hand, the extreme mortality is found in summer, there being a second maximum in winter. Germany and France have the maximum in winter, with a tendency to a second maximum in summer. A large city like Berlin resembles a southern country, with the maximum in summer. This is undoubtedly due to the crowded and unsanitary arrangements of large cities, which increase the mortality, especially among children, during the hot weather. Of the other countries of Europe, Austria, Switzerland, Holland, and Belgium resemble Germany and France, with the maximum in late winter and early spring, and a second rising tendency in late summer. Denmark, Norway, Finland, and Scotland resemble Sweden, with a single maximum in winter. Spain resembles Italy, with the maximum in late summer, but without the second rising tendency in winter. 1 I t is obvious that in cold countries the cold weather is the most dangerous, while in warm countries warm weather is the most so. This may sometimes be traced even in the same country in the varying severity of winter and summer in different years. Thus in Oldenburg from 1831 to 1860, if we represent the average mortality by 1000, then the mortality In years with cold winter and warm summer would be represented by In years with cold winter and cold summer would be represented by In years with warm winter and warm summer would be represented by In years with warm winter and cold summer would be represented by
1066 1020 1007 944
The most favourable mortality is shown when the winter is warm and the summer cool, and the extreme mortality 1
Statistik des Deutschen Reichs, No. 44. pp. 80 and 205.
142
STATISTICS AND SOCIOLOGY.
when both winter and Bummer show extreme temperatures. 1 Death» according to Seasons, combined with the Ages of the Persons dying. The seasons affect old and young differently. In countries like Germany winter is most fatal to all classes except the infants under one year of age, who seem to be protected against the cold, their greatest mortality falling in summer. The next class, children from one to under five years of age, have an excessive mortality in winter, their weak organisms not being able to resist the extremes of cold. From that age on, the extremes of temperature have less influence, and especially during the age 20 to 40 the death-rate is very evenly distributed throughout the year. As old age comes on the winter cold is again dangerous, while the summer heat is favourable. It thus appears that the extremes of age are the least able to resist the influence of temperature. In a southern country like Italy summer heat is particularly dangerous to children from the age of one to five, becoming less marked with increasing age, until after the age of 40, when winter is most dangerous and summer shows a minimum. Deaths according to Sex. More men than women die every year. This is due to the greater general mortality attending the life of the male. The difference is variously expressed. Sometimes we have the number of males dying to 100 females. For instance, during the period 1865 to 1877, the number of males dying to 100 females was in Denmark 102 ; Holland, Sweden, and Norway, 104 ; Italy, 106 ; France, and England and Wales, 107 ; Austria, Hungary, and Switzerland, 108 ; Germany 109 ; Servia, 110 ; Greece, 112; Roumania, 117. The method is inadequate, because it does not take into account the relative number of the two sexes. For instance, in the province of Westphalia in Prussia, in 1890, there were 1
Westergaard, Mortalität und Morbilität, p. 136.
DEATH&
143
110.9 men dying to 100 women, but in that province there were 104.3 men to 100 women; in Silesia, there were only 105.2 men dying to 100 women, but in that province there were only 90 men to 100 women. The second and only scientific method is to calculate the death-rate per 1000 of each sex. The average deathrate (1872-80) was in Italy, males 30.6, females 29.3; in France, males 23.2, females 21.6 ; in Ireland, males 18.8, females 17.7 ; in Great Britain, males 22.7, females 20.2 ;^in Germany, males 28.6, females 25.3. Everywhere the male death-rate exceeds the female. There are some striking differences pointing to important social differences in the condition of woman. In Italy, Holland, France, Denmark, and Ireland the female deathrate is from 93 to 96 per cent that of the male. Probably in these countries woman participates in the life and labour of man, and is exposed to the same dangers. In Switzerland, Germany, and Great Britain the females are less exposed to the dangers of life, and the female death-rate is only about 88 per cent that of the male. There is a certain correspondence between the two in the sense that, where there is a heavy rate for one sex, there is a correspondingly heavy one for the other, and vice versa. Deaths according to Age. It is well known that mortality varies according to age. Sometimes an attempt is made to show this by simply distributing the deaths according to ages. This method, however, is utterly valueless, because there is always a larger number of persons in the lower age classes than in the upper, and hence a larger number of deaths. The only true way is to compare the number at each age with the number of persons living at that age, that is, ascertain the death-rate at each age. During the greater part of life, the deathrate changes slowly as persons grow older. It is highest in infancy, decreases rapidly until about the age of ten, and then slowly increases.
144
STATISTICS AND SOCIOLOGY.
Infantile Mortality. Mortality among small children is so great that it has always received particular attention from statisticians. Whenever we have high death-rates it is almost always caused in great part by heavy mortality during early years of life. There is an enormous difference among countries in this respect, and the difference is indicative of good or bad sanitary and social conditions. For instance : Out of 100 born living, there die during the the first year : 1 In Bavaria . . . . European Bussia . West Austria . . Italy Prussia . . . . Holland . . . .
30.6 29.6 25.6 21.4 21.2 20.3
In France . . Great Britain Denmark . Sweden . . Norway . Ireland . .
16.6 14.6 13.8 13.0 10.4 9.7
In this table, West Austria, Bavaria, and Russia show a very high infant mortality; while Norway, Sweden, and Denmark have a very low infant mortality. The causes of infantile mortality must be sought for in the particular locality. Among general causes are prematurity of birth and congenital defects, hereditary tendencies, improper food and methods of feeding, infanticide and accidental deaths, and insurance of infants. 3 It is a disputed question how far industrial conditions affect infant mortality. In Germany high rates are found equally in agricultural and industrial regions. The highest is in Southern Bavaria (37.2), which is an agricultural region. In England, on the other hand, infantile mortality is almost invariably greater in towns and mining districts then in rural counties. If we take three agricultural counties, Hertfordshire, Wiltshire, and Dorsetshire, and compare them with three manufacturing towns, Preston, Leicester, and Blackburn, we have the following contrast. Of 100,000 children born living, iStatistik des Deutschen Reichs, No. 44. p. 71». a Newsholme, Vital Statistics, p. 100.
145
DEATHS.
there survive at the end of three months in the rural counties 94,820, in the three towns only 90,874; at the end of 12 months in the rural counties 90,283, and in the three towns, only 78,197. The reason for the greater mortality in towns is found in their crowded and unsanitary condition, the spread of contagious diseases, the drunkenness and vice of parents, and the employment of mothers in factories.1 Infant mortality is greater among the lower classes than among the upper. Two methods have been attempted for proving this. One is to take the infant mortality in different quarters of the city. Thus, in Breslau, it was less in the three rich quarters than in the three poor ones. This method is very general because no definite geographical boundary separates the poor from the rich. In Prussia they compare the infant mortality for different social classes. It is rather less among the professional and commercial classes, and rather greater among servants and ordinary labourers. The result is affected by the greater mortality among illegitimates, which are more numerous among the lower classes than the upper. The excessive infantile mortality among illegitimate children has been everywhere observed. It is due, of course, to the neglect of the child, and to the fact that almost all foundlings are illegitimate. Out of 100 of each class born living, there died during the first year : 2 In Austria . France . Belgium. Norway .
. . . .
Legitlmate. 24.6 16.6 16.1 9.9
in««lUmate. 33.3 30.0 26.2 12.6
In Prussia . . Bavaria . . Wtirtemberg Baden . .
Legltlmate. 19.3 29.4 29.6 26.0
Illegitimate. 34.8 38.6 36.4 32.8
1 Report of Registrar General, England, 1891, p. xi. Pull discussion there. 3 Statistik des Deutschen Reicha, No. 44, p. 183. For an elaborate study of infantile mortality in Prussia, see Neumann, Pauperismus und Kindersterblichkeit in Preussen. JahrbUcher ftir Nationaloekonomie, etc., Dritte Folge, Vol. V., p. 617. L
146
STATISTICS AND SOCIOLOGY.
It will be seen that the mortality among illegitimates is always greater and sometimes nearly double that among legitimates. The usual rule that the mortality is greater among males than among females holds good for both classes. Where there is a heavy infantile mortality it affects both. In some places in Bavaria, from 1867 to 1869, between TO and 75 per cent of the illegitimate children died during the first year. Deaths according to Conjugal Condition. There is no doubt that marriage influences mortality. But it is impossible to compare the number of deaths with the number of persons of each conjugal condition, because of the marked differences in age of the single, married, and widowed. It is necessary, therefore, to look at the deathrate for each class at each age. In Germany (1876-80) the number of deaths per 100 of each age and condition was as follows : 1 Males. As«. Single.
to 2 0 . . to 3 0 . . 3 0 to 4 0 . . 4 0 to 6 0 . . 6 0 to 6 0 . . 6 0 to 7 0 . . 7 0 to 8 0 . . 80 and over
Married.
Fzmalr. Widowed and Divorced.
Single.
-
Widowed and Married. Divorced.
16
0.49
0.45
0.74
20
0.84
0.67
1.78
0.59
1.68
0.00
0.88
2.28
1.00
1.01
1.14
2.66
1.42
2.99
1.54
1.14
1.34
4.2
2.4
4.1
2.7
1.9
2.3
7.1
4.6
6.7
6.3
4.1
4.9
13.8
9.6
12.9
11.9
9.7
10.9
26.3
20.2
26.0
25.7
20.3
22.7
-
-
1.17
If we compare the males in this mortality table, we shall see that at all ages the death-rate is less among the married than in either of the other two classes. Among women the death-rate for the married is at first slightly greater than for the single, but later on it is less than for either the single or the widowed and divorced. The statistics for Italy, France, Holland, and Sweden show very much the same thing, namely, a favourable mortality 1
Statiatik des Deutschen Reicha, No. 44, p. 72».
DEATHS.
147
among the married, — the men at all ages, the women in the ages after child-bearing. This favourable mortality is due partly to the fact that marriage in itself is more or less a process of natural selection, and partly to the greater regularity and soberness of life induced by marriage. Accidental and Violent Death». By far the larger number of deaths are owing to weakness or disease, but there is always a certain number due to suicide, murder, or accident. The figures for suicide and homicide we shall treat of later on, the latter under the statistics of crime. The number of accidental deaths varies principally according to the industrial character of the country. Thus we have a large number in England (16,343 in 1892), Sweden, and Norway, on account of the large number of men engaged in mining and shipping. In Switzerland there is a large number, due partly to the mountainous character of the country. There are always more accidental deaths among men than among women, owing to occupation, the proportion being generally three to one. There is a larger number among the single than among the married and widowed, owing to accidental deaths among children, and the employment of single men in dangerous industries. In respect to age, among the males about one-fifth are children under the age of five; the number in the next age period is small, increasing with advancing age, reaching the maximum in the period 35 to 45, and then decreasing. Among females nearly one-half are children under the age of five, while old age is represented much more heavily than among the men. The kind of accident depends very much upon sex and age. In England and Prussia drowning is the most frequent. In Italy, falls are the most frequent, and they come next to drowning in England and Prussia. In England, for children under the age of five, suffocation is the most frequent cause of accidental death, and next to that, burns, scalds, and explosions. As the child advances in age, drowning becomes the most frequent
148
STATISTICS AND SOCIOLOGY.
cause. In middle life, accidents due to vehicles and railways and those connected with mines and machinery become frequent, although drowning and falls are still numerously represented. Owing to the large number of deaths from drowning, the maximum number of accidental deaths generally falls in summer.1 Deaths in the United States. The death-rate in the United States is very difficult to estimate, owing to the absence in most of the states of any adequate registration. The total number of deaths reported as having occurred in 1890 was 875,521, giving a death-rate of only 13.98 per 1000. In some states and cities the registration returns were used, and there we have a death-rate of 20.27 per 1000; while in those states where the returns of the enumerators of the Eleventh Census were alone used, the death-rate was only 10.79 per 1000. Estimating the returns as deficient by 30 per cent, we have a death-rate for the whole country of about 18 per 1000. Scientific Tests. Method of Observation. It is probable that the registration of deaths is more complete than that of marriages or births, because of the necessity of getting a burial permit. In the interests of criminal justice, also, a close watch is kept upon deaths, so that cases of violence, neglect, or malpractice may be detected. Thus, while an infant who has never been registered may live and grow up, and persons may go through the form of marriage without being recorded, in the case of death, official cognizance is taken of the fact, and in case of doubt an investigation is made. The deficiencies in registration, therefore, are not so much deficiencies in the number of deaths as in the detailed information in regard to age, conjugal condition, and the cause of death. This last is principally a question of cer1 Preuss. Zeitschrift 1881, p. 29. land, Reg. Gen. Rep., 1891.
Italy, Cause di Morte, 1890-91.
Eng-
DEATHS.
149
tification by medical practitioners. In England (1891) the causes of 91.8 per cent of the deaths were certified by registered medical practitioners, of 5.5 per cent by coroners after inquest, while the remaining 2.7 per cent were not certified. The proportion of uncertified deaths is steadily decreasing, it having been in 1880, 4.3 per cent. The number is largest in North Wales and Huntingdonshire, in those counties running up to 6 per cent. In London it was only 1.1 per cent. There is always some difficulty in getting the true deathrate according to ages. This is felt, for instance, in the mortality of children under the age of one. When the ages of the population are taken, children of 9, 10, and 11 months are often returned as being one year of age, when in reality they are only in their first year of age. In case of death, more care is taken to get the exact age. The death-rate for infants is thus exaggerated. It is advisable, therefore, to calculate the death-rate upon the basis of the children born during the year rather than upon the census return of children under one year. A somewhat similar difficulty is met in comparing the number of deaths according to conjugal condition. In the census, persons may conceal the fact that they are widowed or divorced, which fact, however, comes out in the closer investigation at death. The death-rates of these classes would hence be exaggerated. Comparison of Death-rates. The ordinary basis for comparison of mortality is to take the number of deaths per 1000 of the population. As the death-rate, however, is greater among males than among females, and at certain age periods than at others, it is obvious that comparison would only be fair between two populations, where the sex and age distribution was exactly the same. This never happens, and even in the same population in course of time, the sex and age distribution may vary. The use of the crude death-rate has given rise, therefore, to many
150
STATISTICS AND SOCIOLOGY.
criticisms. In 1881 the general rate in England and Wales was 18.9 per 1000 of all ages, while in France it was 22.0, i.e., 3.1 higher. But had the age distribution of the French population been identical with that of the English, the general death-rate would have been 20.9 and not 22.0. Thus, of the 3.1 difference between the two rates, 2.0 was due to difference of health condition, and 1.1 to difference of age distribution.1 Dr. Ogle has proposed to correct the death-rates for different countries by reducing population to a common standard. He shows, that even if we had the same mortality at different ages in all the countries of Europe, the differences in age distribution would, nevertheless, bring about a different general death-rate. For instance, if we should apply the death-rates for England and Wales according to 12 age classes, to the populations of 7 different countries, the general death-rate would be : 18.88 18.82 19.38 19.21
per per per per
1000 1000 1000 1000
in in in in
England and Wales, Austria, Switzerland, Germany,
20.18 per 1000 in Holland, 21.31 per 1000 in France, 19.33 per 1000 in Italy.
These differences are due solely to differences in age distribution. Dr. Ogle proposes to establish a standard population, which shall be the average of the population of these 7 countries. A death-rate shall then be calculated for each country, on the supposition that its population corresponds in age distribution to this standard pop ulation. 2 Korosi 3 has investigated the subject more in detail, in order to discover how many age classes it is necessary to employ, and how many countries it is necessary to introduce into the standard population. He has discovered that four age classes, namely, 0-1, 1-20, 20-50, and over 1
Newaholme, Vital Statistics, p. 96. Bulletin de l'lnstitut international de Statistique, VI., p. 83. 8 Ibid. 2 feme Livraison, p. 305.
2
151
DEATHS.
50, give about the same result as using six or even twelve, and of course saves a great deal of labour. He also declares that the results are very nearly the same, whether one uses the population of a single country as the standard, or that of all Europe. He therefore proposes to take the population of Sweden as the standard, and to get a corrected death-rate for each country by calculating what it would be if its population were distributed in the same way as is the Swedish. An example of his method for Austria is as follows : AOI
Per rent of population In Sweden of each age class.
CLASS.
Under 1 year 1 to 20 years 20 to 60 years Over 50 years Sum .
. . . .
2.65 39.81 38.62 18.92
.
100.00
Death-rate In Austria for each age class — per cent.
30.67 1.90 1.20 6.39
Deaths In population of Austria distributed aa In Sweden.
8.13 7.66 4.63 10.20
per 20.5 per 398.1 per 386.2 per 189.2
30.62 per 1000.0
The crude death-rate for Austria was 30.6 per 1000. The advantage of this method is its simplicity. All one has to do is to take the death-rate at each of four different ages and multiply it by the percentage of the Swedish population living at that age. The result is the number of deaths which would occur if the population were distributed as in Sweden. The sum of these deaths for the four age classes gives the number of deaths for 1000 of the population, or the corrected death-rate. Applying this method to various countries, Korosi found that there were considerable differences between the crude and the corrected death-rates, but that the order of the countries remained practically unchanged. The crude death-rate is sufficient for international comparison. For smaller communities it is advisable to use the corrected rate. Dr. Ogle has shown that while the mean annual deathrate in 1871-80 in London and in Lancashire, representing an urban population, was 23.69 per 1000, the rate in 12
152
STATISTICS AND SOCIOLOGY.
rural counties was 19.14. But this does not fairly represent the difference between the healthfulness of urban and rural communities. For if the rural population had had the same age and sex distribution as the urban, its general death-rate, instead of being 19.14 per 1000, would have been only 16.33. The difference, therefore, between the urban and rural mortality was really very much greater than would be supposed from the death-rates as ordinarily given, the true comparison being between 23.69 and 16.33 and not between 23.69 and 19.14. Birth and death-rates depend on the enumeration of the people. Between censuses the population must be estimated by carrying on the average rate of increase or decrease during the last census period, or by adding each year the excess of births over deaths. This sometimes gives rise to serious errors. Thus in England the estimated population in 28 towns for 1891 was 6.4 per cent greater than the census population. In Liverpool it was 20 and in Salford 26.3 per cent greater. This vitiated all the birth and death-rates of the previous ten years. In Liverpool they believed on the basis of the estimated population that the death-rate had decreased from 26.7 per 1000 in 1881 to 23.6 in 1891. When they got the census population in 1891 they found that the real deathrate was 27.8 per 1000. Great caution must be exercised in drawing inductions from city death-rates based on inter-censal estimates of the population. Reflective Analysis. I t is unnecessary to speak again concerning the importance of the death-rate in considering the social condition of any community. The cause of deaths, which is the most important thing to be considered, we shall treat of more fully in the next chapter. But even in this chapter, as we have considered the variations of the death-rates according to climate and geographical position, in city
DEATHS.
153
and in country, by seasons, as influenced by war and scarcity, as varying according to sex, age, and conjugal condition, we have had abundant opportunity to point out how intimately the death-rate is connected with the natural environment, with the social condition, and with the demographic constitution of any community. But notwithstanding all these variations, the death-rate maintains a wonderful regularity. In Germany, during the long period from 1841 to 1885, the average annual variation from the average death-rate was only 3.9 per cent. This was less than for births and very much less than for marriages. The fluctuations above and below, however great, tend in the long run to counterbalance each other.1 i Statistik des Deutschen Beichs, No. 44, p. 16».
CHAPTER
VIII.
SICKNESS AND MORTALJTY.
Sociological
Purpose.
IN the previous chapter we considered the statistics of deaths. We regarded the death-rate as an index of the prosperity of the community, and we studied carefully its variations according to time, place, and circumstance. We also examined the true method of getting death-rates for different populations, which shall be comparable after eliminating the influence of age and sex. We turn now more specifically to the causes of deaths and the influence of death upon human life, — i.e., upon the length and vigour of life. Most human lives come to an end through disease. Congenital weakness, old age, and lack of food are not diseases in the ordinary acceptation of the term, although they often receive their final expression under some specific form of disease. At all ages, noxious influences, exposure to the weather, poisonous germs or bacilli may cause inflamation or atrophy, some abnormal condition of an organ or of the whole body, and this we call disease. The presence of disease in the world influences the happiness and prosperity of the community in two ways of which statistics can take notice. It disables or hinders men from working, and causes thus a loss of time and productive power. It ends in death, and thus shortens human life. We have, therefore, the statistics of Morbidity (sickness) and of Mortality. 154
SICKNESS AND MOBTALITT.
155
Our statistics of sickness are in a very imperfect condition. The registration of deaths gives us only those cases which terminate fatally. But for every case that terminates fatally there are many which cause loss of time and often impairment of strength and possibly permanent loss of health. I t is impossible to reason from the deaths to the number of illnesses, because the rate of mortality varies for different diseases, and according to time, place, and circumstance. There are some diseases, again, which do not greatly affect the mortality, and of which the death returns are silent. But from an economic point of view, this sickness is almost as important as death, for it destroys the productive power and thus the prosperity of the community. The great mass of such sickness now escapes registration. We have some information from Friendly Societies and Sick Clubs, but the statistics do not cover a large number of persons, and relate generally only to diseases of adult life. We have also some returns from public institutions such as hospitals, poorhouses, and asylums, but these, too, cover a comparatively small number of cases. Finally, we have compulsory notification of contagious diseases, such as smallpox, scarlet fever, diphtheria, and typhoid fever. I t would be very desirable to extend the principle of notification to all infectious diseases. By such means early measures could be taken to choke epidemics at their birth, to isolate those actually ill, to prevent the commingling of " suspects," who have been exposed to infection, with others, and to control the attendance at school of children from an infected family. Incidentally an inspection following early notification might lead to the discovery of conditions causing or likely to spread the disease. Such compulsory notification of infectious diseases is not always insisted upon, and there seems to be no probability of our getting a complete registration of all sickness. If we had complete registration of sickness we could
156
STATISTICS AND SOCIOLOGY.
ascertain its total amount, and then analyze the different diseases according to their absolute and relative frequency, according to the length of sickness, the greater or less fatality, according to their causes, and, if possible, according to the success of different methods of treatment. The value of such statistics, both for scientific purposes and for medical practice, as well as for sanitary guidance, would be enormous. When the disease results in death, the cause is commonly registered, and our Morbidity statistics are completed through our statistics of Mortality. The medical practitioner is compelled to return the cause of death. This of course is commonly the disease according to his diagnosis. Where there is doubt an autopsy may take place, but nowhere is an autopsy compulsory unless crime is suspected. Our statistics of death from disease suffer from the ignorance of physicians, and from the natural difficulty of making a correct diagnosis where the symptoms are obscure. I t is the office of medical statistics to arrange deaths from disease according to a scientific classification, to study each disease according to the age and sex of the victim, according to the season, the time and place of its prevalence, the influence of profession or occupation, or habit of life, such as intemperance, etc. These statistics are of great interest to the science of medicine even in their minutest details, and are also of general concern as affecting the health and happiness of the community. We cannot go into the details of medical statistics, but the sociological purpose of this chapter is to delineate in a general way the effect of disease on the community, and to trace out the accompanying circumstances. Some of these may be said to be natural conditions which are not influenced by the will of man. But there is no doubt that, if we had sufficient knowledge, much of the disease which now afflicts the human race might be avoided. Finally, having thus rounded out our study of deaths,
157
SICKNESS AND MORTALITY.
sickness, and mortality, we can conclude by studying the general effect of death on human life. W e do this by constructing Mortality Tables, or, as they may also be termed, Life Tables. These show us the average length of human life, the expectation of life at birth and at each successive age, whether human life is increasing in length, the periods of life most fatal, etc. In short, we may sum up and put into scientific shape our statistics of deaths and mortality. Statistical
Data.
Statistics of Sickness. There being no official registration of sickness, our information is derived principally from the experience of private associations, such as benefit societies, which give aid to members when they are ill. The following table is based upon the experience of the largest and most important Friendly Society in England — the Manchester Unity of Odd Fellows, comprising 400,000 members. AGE.
A V * E A S E BICKNVSS PER INDIVIDUAL FEE ANNUM (IN W E E K S ) .
16 to 20 20 to 26 25 to 45 46 to 66 15 to 65
Males.
Females.
666 737 .905 2.736 1.314
.666 .737 .995 2.761 1.334
This table shows that during the working years of life the average annual time of sickness is 1.314 weeks, or a fraction more than 9 days in each year. I f this experience were applied to all England, the total annual loss of work through sickness among males would be 9,692,505 weeks ; among females, 10,592,761 weeks, or about 20,000,000 of weeks altogether. The members of this society may be regarded as belonging to the more frugal portion of the working classes, and would include very few insane,
158
STATISTICS AND SOCIOLOGY.
imbecile, or idiotic, such as are present in considerable numbers in the community at large; this calculation may therefore be regarded as approximately correct. The great economic loss from sickness is at once apparent. According to another method of estimate based on the experience of the English Friendly Societies:—for every 100 men living at the age of 20 to 30, 1.69 are constantly sick ; of the age 30 to 40, 1.91; of the age 40 to 50, 2.89 ; of the age 50 to 60, 5.21 are constantly sick. 1 Another estimate is that of Dr. Farr, who declares that in England to one annual death in a body of men, two are on an average constantly suffering from sickness of some severity. According to some Friendly Societies the constantly sick to one annual death are 2.8. As the number of deaths in England per annum is about 750,000, this would mean a million and a half of persons constant sufferers from severe sickness. The German legislation in regard to insurance against sickness promises to give us a better basis for our statistics. In 1892 the number of persons insured was 7,723,000 and there were 2,752,000 cases of sickness. 2 The experience has not been long enough yet to trace the effect of good and bad years upon the number of cases of sickness; but it is said that when times are good, the number is less because the workmen dislike to lose high wages; while in bad times, when wages are low and employment scarce, they are both inclined and compelled to resort to sickness insurance. In the building trades, however, increased activity brings increased sickness on account of the bodily strain and liability to injury of the work itself. The number of days lost for each sickness was 15.7, and for each insured person, 5.6. If the danger of sickness be expressed by the average 1 Newsholme, Vital Statistics, pp. 278-278. The Economic Journal, Vol. I I I . , p. 142.
2
SICKNESS AND MORTALITY.
159
number of days of sickness to each member of a certain trade or occupation, we have the following figures. The most unfavourable result is shown in gas works, and dye and paint works, where there were 8.8 days of illness to each insured workman. From 7 to 8 days of illness fell to each workman in iron, steel, wire, and chain works; in ship-yards and manufactures of machinery ; in silver, lead, copper, zinc, and tin smelting works, in blacksmithing and other trades having to do with metals. Between 6 and 7 days of illness happened in 13 trades, such as the chemical industries, breweries, printing, powder works, etc. From 5 to 6 days happened in 24 trades, such as paper mills, potteries, flour mills, distilleries, tanneries, etc. From 4 to 5 happened in 15 occupations, such as boots and shoes, glass works, and match works. From 3 to 4 days happened in 6 occupations, such as ribbon-weaving, cigar and tobacco factories. In the group from 2 to 3 days fell the corset factories, while the least number of sick days, namely, 1.6, fell in the factories for underwear and cloaks. The enumeration of these occupations shows that sickness is not determined by the kind of occupation, but must depend largely upon other circumstances.1 Accident Insurance. Statistics of the accidents in Germany are of very considerable interest. The figures for the year 1892 gave 18,014,280 persons insured against accidents. In that year 236,265 accidents were reported, and compensation was paid for 55,654. The remainder resulted in disability for less than 13 weeks, and so came under the sickness insurance. This shows an average of 13.1 accidents to each 1000 workmen, or 3.1 compensated accidents to each 1000 workmen. In agriculture the number of accidents was only 4.1 to each 1000 insured, while in industry it was 32.5. The number of accidents in different occupations has not yet been clearly worked out. The highest number is found in the iron and 1
Allg. Stat. Archiv, Vol. II., p. 233 ft.
160
STATISTICS AND SOCIOLOGY.
steel works, and in the breweries, where the experience of four years showed more than 40 accidents to 1000 insured. Of the compensated accidents 10.6 per cent resulted in death, and 5 per cent in permanent incapacity for work. The proportion of fatal accidents varies greatly in different trades. In ocean shipping, for instance, the number of accidents resulting in death ran as high as one-third. The nature of the accident varies with the occupation, as burning and scalding in sugar and iron works, poisoning in chemical works, injury to the right arm in machine works, etc. Curious statistics in regard to the hour of day when the accident occurred show an increasing number from 6 o'clock in the morning up to noon, and from 1 o'clock up to 6 in the afternoon, apparently due to the fatigue of the continuous work. According to the statistics of 1887, 53 per cent of the accidents were due to negligence, namely, 19.7 per cent to the negligence of the employers, 25.6 per cent to that of the workmen, 4.5 per cent to that of workman and employer, and 3.3 per cent to the negligence of fellow-workmen and third persons. In regard to age, among persons under 16 years of age 40.14 per cent of the accidents were due to their own negligence, among persons from 16 to 20 years, 33.45 per cent, and among persons over 20 years, 24.4 per cent. Among women 39.65 per cent, among men 25.08 per cent, of the accidents were due to their own negligence.1 The Statistics of Disease. Disease being the principal cause of death, one of the great functions of vital statistics is to classify deaths according to the diseases which cause them. Unfortunately there is no universally accepted system of classification, and medical science is making such rapid progress that it does not seem possible to devise one which shall be good for the future. As an i Allg. Stat. Archiv, Vol. II., p. 272.
161
SICKNESS AND MORTALITY.
example of classification the following table is given for England: 1 CAUSES o r
Total Deaths,
D u n
1891.
Zymotic diseases Parasitic diseases Dietetic diseases Constitutional diseases Developmental diseases Local diseases Violence Ill-defined and not specified causes . All causes
Bate per Million Living, Mean, 1881-90.
78,704
.
2,656
658
32
2,406
65
97,108
3,325
49,150
1,593
314,253
9,785
19,500
651
26,140
1,012
687,925
19,149
Under the zymotic or specific febrile diseases are included small-pox, measles, scarlet fever, typhus, diphtheria, etc. Under dietetic diseases are included starvation, scurvy, and alcoholism. Under constitutional diseases are included gout, rickets, cancer, phthisis and other forms of tuberculosis. Under developmental diseases are included premature birth, congenital defects, old age, etc. The class, local diseases, is divided into those of the nervous, the circulating, the respiratory, and the digestive system. In all there are about 150 different diseases registered. In Italy the number is 169. It is evident that the statistician cannot enter into the details of all these different diseases, because in many cases the numbers are so small that variations from year to year would be due to purely accidental causes. I t is therefore customary to pick out the principal diseases or classes of disease, and estimate the death-rate per one million persons living. We can also calculate what proportion the deaths from any particular disease bear to the total deaths. That figure is not very satisfactory, because the deaths from any particular disease remaining the same and the total number of deaths varying, the proportion would vary. The death-rate from different diseases varies greatly 1
K
Report of the Registrar General, 1891.
162
STATISTICS AND
SOCIOLOGY.
in different years. There may be an epidemic, and after such epidemic there may be a lull for several years caused by the fact that there are but few in the population who have not purchased immunity by a previous attack. It is the duty of medical statistics to connect the prevalence of particular diseases with temperature, density of population, sanitary condition, sex, age, etc. For us it is impossible to go into these details. Diseases of the digestive system are especially fatal during the summer months, and hot and dry summers are more fatal than cold and wet ones. Measles in large cities like London seems to have two periods of prevalence, one in May and June, the other in December. Typhoid fever shows its maximum in October. Age, of course, makes a great difference in the mortality from particular diseases. Many are distinctively diseases of childhood. The mortality from scarlet fever rises to a maximum in the third year of life, and then falls, at first slowly, but afterwards rapidly, becoming smaller at each age period. Cancer, on the other hand, is very infrequent in childhood, but after the 25th year of age increases with great rapidity. Similar facts might be given for other diseases. Sex also makes a great difference. The mortality among males is greater in small-pox, measles, scarlet fever, diarrhoea, phthisis, diseases of the nervous system, and of the respiratory system. The mortality for females is greater in diphtheria, whooping cough, and cancer. The mortality from different diseases varies greatly according to geographical situation, character of the soil, conditions of temperature, quality of the M'ater-supply, and density of population. Each one of these, however, requires minute investigation for each disease, which is of great interest to the medical profession, but is too special for the statistician and the student of sociology.1 1
Newsholme, Vital Statistics.
Longstaff, Studies in Statistics.
163
SICKNESS AND MORTALITY.
International Comparison of Mortality from Different Disease». The system of classification of diseases differs in different countries. The skill of the medical practitioners, the correctness of the diagnosis, and the carefulness in the registration also differ. When we consider in addition the different climatic and sanitary peculiarities of each country, the varying conditions of the population according to age, sex, density, and economic position, we may at once admit that international comparison of mortality from diseases can have but little value. In giving, therefore, the following table, we give it simply as an illustration of an attempt in this direction. DEATHS ( 1 8 8 7 - 9 1 ) FHOM CEBTAIN DISEASES PER 1 0 , 0 0 0 IXHA BIT ANTS. 1 COUNTEY.
Bmall-pox.
Italy France (cities) England.... Ireland . . . . Germany (cities) . Prussia . Austria . . . . Switzerland . . Belgium . . . . Holland . . . . Sweden . . . .
Meaalas.
Scarlet Diphtheria. Fever.
Typhoid Feyer.
Tuberculoeis.
3.86
6.17
2.99
6.08
7.49
13.61
2.30
6.18
3.10
6.66
6.32
33.00
0,11
4.68
2.31
1.74
1.90
16.09
0 01
2.01
1.22
0.76
2.33
21.16
0.04
2.80
2.15
10.21
2.11
31.29
0 03
3.20
2.46
14.17
2.26
28.06
4 43
6.36
13.20
5.42
37.20
0.06
1.63
5.57 1.22
3.63
1.47
21.07
1 52
6.20
1.62
6.77
3.83
19.87
0 02
3.93
0.38
1.46
2.60
19.21
0,01
2.30
3.69
3.89
2.22
_
The figures for each disease give a rough measure of its prevalence in different countries. The large figures for small-pox in Italy and Austria show the absence of vaccination. Diphtheria seems to be very fatal in Germany and Austria. Italy has a large rate in typhoid fever, and the same is true of other fevers. France, Germany, and Austria show a large rate for tuberculosis, while Italy shows a very small one. Other diseases show similar variations. All these proportions must be taken with great caution, in consequence of what has been said above. i Statistic» delle Cause di Morte, 1891-02.
Roma, 1894.
164
STATISTICS AND SOCIOLOGY.
Mortality according to Occupation«. There is no doubt that the trade or occupation which a man pursues often has a great effect upon his health and length of life. Some occupations are so dangerous owing to liability to accident, or so unhealthy owing to the conditions under which they are carried on, or the necessity of using poisonous substances, that no insurance company will have anything to do with the persons engaged in them. Some of these unfavourable conditions might possibly be removed, and the first step is to ascertain whether the occupation is dangerous or not, and the second, to detect the exact cause of the dangerous or unhealthful influence. Care must be taken to get a trustworthy statistical basis for our observations. Of course the mere distribution of the total number of deaths among different occupations shows us absolutely nothing, because the number of persons is so different. Even if we calculate the death-rate for all persons in an occupation, it is not a good basis for comparison, because of the different age distribution. The only method of making death-rates that can be safely compared with each other is the laborious one of calculating them for each occupation at each successive age period, and then applying these death-rates to a population with precisely the same age distribution. The latest calculation of this sort is one published by Dr. Ogle, based on a comparison between the census returns in England for 1881 and the death registers for the three years 1880-1-2. The figures relate only to males between 25 and 65 years of age, the death-rates being calculated for two groups, one above and the other below 45, and they have been applied to a male population in which these two age classes bore a certain fixed proportion to each other. Of the death-rates thus obtained the lowest was that of men in the clerical profession. That is therefore taken as a standard represented by 100, and the death-rate of each other profession or
165
SICKNESS AND MORTALITY.
occupation is represented by a figure proportionate to this standard. We have then a table of the following sort: Comparative Mortality.
OOOTTFATIOH.
Clergymen, priests, ministers . Lawyers Medical men Gardeners Farmers Agricultural labourers . Fishermen
.
.
Commercial clerks . . . . Commercial travellers . . . Innkeepers, liquor dealers. . Inn, hotel service . . . . Brewers Butchers Bakers Corn millers Grocers Drapers Shopkeepers generally . . Tailors Shoemakers Hatters Printers Bookbinders
.
.
OCCUPATIOIT.
Comparative Mortal-
100 Builders, masons, bricklayers 152 Carpenters, joiners . . . . 202 Cabinetmakers, upholsterers. Plumbers, painters, glaziers . 108 114 Blacksmiths 126 Engine, machine, boiler-makers 143 Silk manufacture 179 Wool, worsted, manufacture . 171 Cotton manufacture . . . . 274 397 Cutlers, scissors-makers . . 245 Gunsmiths File-makers 211 172 Paper-makers 172 Glass workers Earthenware-makers . . . 139 169 Coal miners 158 Cornish miners Stone, slate, quarries . . 189 166 Cab, omnibus service . . . 192 Railway, road, labourers . . 193 Costermongers, hawkers, street 210 sellers
itj. 174 148 173 216 176 155 162 186 196 229 186 300 129 214 314 160 331 202 267 185 308
It will be seen from this table that the differences of mortality in the different industries are very great. If the mortality of clergymen, for instance, is represented by 100, that of men engaged in the earthenware manufacture is represented by 314, and that of inn and hotel servants by 397. Dr. Ogle classes the causes of high mortality under the following seven general headings : ( 1 ) Working in a cramped or constrained attitude, as the silk weavers, lace-makers, and possibly shoemakers.
166
STATISTICS AND SOCIOLOGY.
( 2 ) Exposure to the action of poisonous or irritating substances, such as phosphorus, mercury, lead, infected hair or wool. We have here a list of diseases peculiar to certain trades, which attack the dippers of lucifer matches, gilders, hatters, furriers, and others who make use of quicksilver; the arsenical poisoning of paper-hangers; lead poisoning among painters, plumbers, glaziers, gasfitters, printers, and file-makers. ( 3 ) Excessive work, mental or physical, especially such as involves sudden strains, as among fishermen. ( 4 ) Working in confined and foul air, as among tailors, printers, book-binders, and hatters, or even shopkeepers. ( 5 ) The effect of alcoholic drinks, as seen among innkeepers, publicans, and wine and spirit dealers. ( 6 ) Liability to fatal accident, as among miners, stone and slate quarrymen, and fishermen. ( 7 ) Inhalation of dust increasing the mortality from phthisis and diseases of the lungs. The effect differs very greatly, not only according to the amount, but also according to the character of the dust, that which consists of hard and sharp, pointed particles naturally being more irritating to the air passages than that of which the particles are soft and rounded. The hard woods, such as are used by cabinet-makers, are said to give off a much more injurious dust than do the softer ones used by carpenters. Flour, of which millers, bakers, and confectioners inspire large quantities, appears to have no injurious effect upon their vitality. The dust given off in textile factories, especially cotton factories, increases the mortality from diseases of the respiratory organs. Most injurious is metallic dust, such as is given off in the manufacture of cutlery and file-making, and the dust of stone, giving rise to great mortality among masons and bricklayers, stone and slate quarrymen, Cornish miners, and pottery makers. The low mortality from lung diseases among coal miners has provoked much discussion. Dr. Ogle says there are
SICKNESS AND MORTALITY.
167
two possible explanations: — one, that the apparent exemption is simply due to the picked character of the miners, inasmuch as none but strong men are likely to adopt so laborious a calling ; the other, that there is some special preservative condition attaching to the industry, namely, that coal dust possesses the property of hindering the development of tuberculosis and of arresting its progress. Dr. Ogle thinks the latter theory has some basis of probability. It is comparatively easy to give plausible reasons for the differences in mortality in different occupations. Clergymen, for instance, for the most part live in the country, pursue a quiet, regular life, have a moderate but certain income, and escape the worry and excitement of modern life. The mortality among medical men is due to the exposure and irregular hours necessitated by their profession. Among lawyers the mortality is greater than among clergymen, but less than among physicians. I t is less among barristers than among attorneys, due probably to social position. The mortality of school-teachers is about the average of the whole population, but increases with advancing age, owing to the confining nature of the work. Commercial clerks have rather high mortality, — they mostly live in cities, work in a confined posture, and are not particularly well paid. Commercial travellers have about the same mortality, due probably to the exposures of travel and their irregular life. Out-door occupations, as farming and gardening, are the most favourable to life. This whole subject of mortality among occupations demands further and minute investigation, and especially a more exact census of occupations. And it is also evident that economic and social position must have great influence on the mortality as well as the occupation itself. There is one profession, namely, the army, of which we have very exact statistics. In time of peace the mortality
168
STATISTICS AKD SOCIOLOGY.
is generally less than among the male population of the same age. In England, in 1887, the general mortality for the whole army in the United Kingdom was 6.68 per 1000. For the troops abroad it was generally higher, being in Gibraltar 9.51, in the West Indies 14.70, and in India 15.51. The death-rate in the Prussian army for the period from 1846 to 1863 was 9.49. In time of war the death-rate is naturally greater. The German army, in 1870 and 1871, lost by death 40,743 men, of whom three-fourths were killed, and one-fourth died from disease. In addition to these, 112,336 were wounded, and 4009 were missing. The death-rate for the whole army during the time of war was 45.89, but varied greatly according to the branch of service and rank, as the following little table will show : Death-rate.
BBAXCH o r BEKVIOK.
Headquarters Infantry Cavalry Artillery Pioneers Train
.
.
.
. . . . . .
16.93 62.79 27.08 27.22 17.63 26.39
BASK.
Death-rat«.
General . . . . . . . 46.16 Staff officers . . . . . 106.18 Captains . . . . . . 86.23 Lieutenants . . . . . 88.69 Surgeons . . . . . . 11.96 Non-commissioned officers and file . . . . . 46.01
This table shows the greater exposure of certain branches of the service, and especially how much greater danger the staff and commissioned officers are exposed to than the ordinary rank and file. Duration of Life. One of the most important facts to learn about population is the length of human life. Suppose we observe a million children, born the same year, and follow them through life, entering in a column the number still alive at the end of each successive year until all have died. In this way we shall have a complete life table or history of that generation from birth to death. We can tell at a glance how many out of the one million are still surviving at the age of 20, or 50, or 85, or " x " years. If we add together these survivors for all
SICKNESS AND MORTALITY.
169
the years, we get the total number of years of life enjoyed by the whole one million persons. Dividing this total by one million we get the average number of years of life enjoyed by each of the one million. This is called the "expectation of life." Such "expectation of l i f e " does not represent the number of years a man will probably live. Very few of the lives will fail when they have exactly completed the expectation of life. Many will fall far short of it ; and many will long survive it. In fact, to form the expectation of life, we take the excess from those who live long and distribute it among those who die early, so as to place all on an equality ; and the expectation of life has no relation whatever to the most probable lifetime of any given individual. 1 The expectation of life may be calculated for each age and then represents the Mean After Life, or the average number of years that the survivors at that age will still live. A t the age of 20, for instance, a man in England will on the average still have 39.4 years to live, that is, he will reach the age of 59.4 years. The expectation of life, or Mean After Life, according to Dr. Ogle's English Life Table, is as follows : AGE.
0 5
10 15 20
26
30 35 40 45 60
Males.
Females.
AOI.
41.35 60.87 47.60 43.41 39.40 35.68 32.10 28.64 25.30 22.07 18.93
44.62 53.08 49.76 45.63 41.06 37.98 34.41 30.90 27.46 24.06 20.68
55 60 65 70 75 80
86
90 95 100
In early childhood the expectation of life increases, up to about the age of five. This is due to the excessive 1
Quoted from King, Life Contingencies, p. 29.
170
STATISTICS AND SOCIOLOGY.
mortality among infants, which causes a large number of very short lives to be counted in the average. After the age of five the " expectation" decreases with advancing years, but even at a very advanced age the chance of surviving the following year is greater than the probability of dying during the year. It will be observed that the expectation of life is always greater for women than for men, on account of the greater mortality among men. Countries differ very much in the expectation of life. A t birth it is in Germany for males 35.58, and for females 38.45 ; in France it is for males 40.83, and for females 43.41. At the age of 25 it is in France 37.17 for males and 38.67 for females, as contrasted with 34.96 for males and 36.53 for females in Germany, and the figures given in the table for England. The low expectation at birth in Germany is due to infant mortality, and the high expectation in France to the large number of old people who live long lives, and thus bring up the average. In extreme old age the expectation of life both in France and England is superior to that in Germany. It is to be observed that life tables for a whole community differ from those which are prepared for a particular purpose, such as the insurance of lives, calculation of annuities, payment of pensions, etc. The life table for the whole country includes all classes of persons, the poor, the criminal, the diseased, and the vicious. Persons insured are as a rule a select class. They therefore may be expected to have a longer life than the average. So in calculating the cost of pensioning the civil servants of a government regard must be had to the same fact that they are probably a select class, and will live longer than the usual life table would show. In granting pensions to soldiers who have been disabled by wounds or disease the reverse might be true. Hence for these particular purposes special tables are made out, founded upon actual
SICKNESS AND MORTALITY.
171
experience with the classes concerned. Occupation, social position, and place of residence also have influence in these calculations. As an example of these variations we give the following list, showing the expectation of life or Mean After Life at the age of 40 for different classes of persons : 1 Years.
20.59 France, civil pensioners in general France, pensioners, from a sedentary life 17.88 France, pensioners, from an active life 21.23 France, pensioners, widows 29.31 Mean after life of members of the Institute, deceased 1796-1869 . 29.74 England, pensioners, males 26.00 England, pensioners, females 29.80 Experience of twenty English insurance companies 27.60 Experience of the Mutual Life Insurance Company of New York. 29.73 Experience of thirty American offices 28.48 Experience of the Gotha Mutual, Germany 26.94 City of Berlin, males 23.40 City of Berlin, females 28.36 City of New York, males 22.64 City of New York, females 25.24 City of Baltimore, white males 26.70 City of Baltimore, coloured males 21.71 City of Baltimore, white females 29.40 City of Baltimore, coloured females 27.64 Deaths among 10,618 Jewish families, United States, 1889, males. 36.17 Deaths among 10,618 Jewish families, United States, 1889, females, 31.98
This table, which might be extended to other ages, is sufficient to show how much depends upon the selection of lives in calculating life tables. The figures for the United States, especially for the Jewish families, are very uncertain on account of imperfect methods of registration. The data for cities are often deceptive because of the number of persons who come to the city for treatment in hospitals and asylums. 1
Levasseur, La Pop. fran^aise, II., p. 321. Tenth Census of the United States, XII., p. cxliii. Stat. Jahrbuch für die Stadt Berlin. Eleventh Census of the United States, Bulletin No. 19.
172
STATISTICS AND SOCIOLOGY.
Scientific Tests. Methods of Observation. In all statistics of Morbidity and Disease the initial difficulty is in defining what is sickness, and in diagnosing the disease. Of course, slight ailments such as colds, aches, pains are disregarded. They could never be gathered by any statistical machinery, however perfect. It is only serious sickness, principally that disabling persons from work, that we can consider. Even here there are several sources of error — viz., that serious sickness may escape notice because the persons afflicted are not insured, or are not attended by a medical practitioner; or that the disease is of such a character that the person desires to conceal it. So even if we had compulsory returns by physicians of all serious cases of sickness, it is not probable that they would be exact. Another question would come up as to the duration of the sickness. Are we to count the period of convalescence until full health and strength are regained, or count only up to the time when the disease proper may be said to have left the person ? These difficulties seem to disappear when our statistics are based on returns from benefit societies, or from state workingmen's insurance against sickness, as in Germany. But here another danger meets us, viz., that of simulation. When a workingman is lazy, or sees hard times and lack of employment approaching, will he not feign sickness in order to draw his allowance ? There is some reason to suspect that this is being done in Germany at the present time. It has even been asserted that workmen injure themselves in order to get the accident insurance money. Where the insurance is voluntary, as in a benefit society, there is a greater or less feeling of honour, and where the group is small each one is exposed to the watchfulness of the others who contribute to the funds. But where the group is large and the funds come partly or
SICKNESS AND MORTALITY.
173
wholly from the employers, there may be a feeling of indulgence or sympathy for the fellow-workman, or a sentiment that the workman is only getting back a part of what the employer has been squeezing out of him. Simulation, too, may be more or less unconscious, consisting in simple exaggeration of aches and pains, until the sufferer really makes himself ill. A very rigid and severe standard of duty would be required among physicians to guard against all these cases. 1 The difficulties of classification of disease have already been mentioned. Even if we had a consistent and satisfactory classification, there would be numerous errors due to the ignorance or carelessness of physicians, or to the obscurity of the subject, or to deaths due to a complication of causes. Many physicians use the popular rather than the scientific name of diseases. Some vague term such as fever, heart-failure, etc., is used to designate the cause. Examples of ignorance among the physicians are given in the following quotation from the Mortality Statistics of the Tenth Census, I., p. xii.: " While the results obtained from these physicians' returns are of interest and value, it must be constantly borne in mind that they were not derived solely from competent medical men, but from all those who chose to call themselves physicians. " When the cause of death is reported as ' Tecis,' ' Spinalgitis' ' Colory in Phantum,' ' Colria fontim,' ' Cholor Rhear Infantum,' ' Hasphmar,' ' New Moner Fever,' ' No fisian tendin,' ' Struck in on the aire sells,' ' Yaller ganders of the Liver,' ' Unnowing,' ' Know Knowen cause,' etc., it is evidently unsafe to lay too much stress on the scientific accuracy of the diagnosis by the same reporter in other cases, even although the spelling may be more nearly correct."
When we come to statistics of disease and occupations, we have the uncertainty of the classification of occupa1
See Brooks, A Weakness in the German " Imperial Socialism." Brit. Economic Journal, II., p. 302.
174
STATISTICS AND SOCIOLOGY.
tions to contend against. This makes international comparison difficult. Still further, the question arises, how far the mortality in a particular occupation is due to the work itself, to the circumstances under which it is carried on, to the character of the persons who choose it, or to the general social and economic condition of the community. These must be carefully distinguished. If the mortality is due to the occupation itself, then our statistics may point to the necessity of taking some measures to guard against dangers due to that particular occupation, as accidents from machinery, poisoning from fumes or vapours, etc. Where it is due to the circumstances under which the occupation is carried on, then a limitation of the number of hours of labour, or provision for ventilation, etc., may remedy part of the evil. Where it is due to the social or economic condition of a whole class of persons who are forced into such occupation, as mendicants and vagabonds, then the problem is more difficult and requires social amelioration or reform. Where the mortality is due simply to the fact that the occupation is such that the weak and infirm can enter it, then nothing can be done. Such information is of the highest social value, but it must be carefully analyzed. Duration of Life. This term has been sufficiently explained, but we have a number of figures which are often confused with it. Comparative Death-rates. In the first place, the deathrate is sometimes supposed to be an indication of the average length of life. If we had a death-rate of 40 per mille, it would mean that one out of every 25 of the population died each year. In another country, if we had a death-rate of 30 per mille, it would mean that one out of every 33 inhabitants died each year. It is sometimes supposed that these figures indicate that life is longer in the second country than in the first, and in the proportion of 33 to 25. But this is fallacious. Only in case of a popu-
SICKNESS AND MORTALITY.
175
lation neither increasing nor decreasing, and dying regularly from year to year, would the death-rate indicate anything as to the duration of life. But as a matter of fact, population is generally increasing, and death-rates are very different at different ages. In one country the deaths may be largely of children, and in another of adult persons, so that even if the rate were the same, the expectation of life would be very different in the two. In England, the expectation of life for males was 41.35 during the decade 1871-80, while one in 44.2 died annually.
Average Age of the Dying.
In the second place, we can
take the ages of those who have died during the year, add them together, and divide by the number of the deceased. This gives what is called the " average age of the dying," and is sometimes said to indicate the average length of life. This, however, is evidently on the supposition that the deaths are regularly distributed throughout a stationary population. But in an ordinary population this average age of the dying is affected by so many different things, that it indicates nothing in respect to the expectation of life. Where a generation is weakened, either because it started with a small number of births, or on account of some epidemic or war which has fallen heavily upon it, such generation would contribute less than it ought to the total number of dying. For instance, the civil war of 1861 to '65 swept away a large number of men of the ages between 20 and 30. Men of that generation would now be between 50 and 60, and they contribute less than their proper share to the number of the dying. This decreases the average age of the dying at the present time, although the event happened 30 years ago. So a hard, cold year, which sweeps away the old people, increases the average age of the dying, while a prosperous year, resulting in a large number of births, and consequently an increased number of deaths among infants,
176
STATISTICS AND SOCIOLOGY.
decreases it. Engel gives the following striking example for P r u s s i a : 1 n 1829, 1831, 1847, 1855, 1851, 1860,
hard, cold year, average age of dying was cholera year, average age of dying was scarcity year, average age of dying was . scarcity year, average age of dying was . prosperous year, average age of dying was prosperous year, average age of dying was
Ye»n. 31.31 31.24 28.29 29.82 25.60 25.17
So also, if a population were increasing, it is evident that the average age of the dying would be pulled down because the death-rate would be applied to a constantlyincreasing number in the lower age classes. Emigration and immigration would evidently affect the average age of the dying without any reference whatsoever to the sanitary condition of the community. So also, as Newsholme 2 points out, " i t would be absurd to draw any inferences from a comparison of the mean ages at death of bishops and curates, as men do not usually become bishops till they have passed the middle period of life." " T h e low mean age at death of dressmakers has been adduced as a proof of the unhealthy character of their employment. Without denying the latter fact, the low mean age at death is no more a proof of their insanitary circumstances than is a low mean age at death among the pupils in a boardingschool." Average Age of the Living. In the third place, by a census we can get the average age of the living. This also is sometimes confused with the average duration of life, but it is fallacious for precisely the same reasons as have just been mentioned when speaking of the average age of the dying. 3 If both of these corresponded with the average duration of life, then they should correspond 1
2 Preuss. Zeitschrift, 1801, p. 335. Vital Statistics, p. 247. 8 See ante, p. 50.
SICKNESS AND MORTALITY.
177
to each other. How widely they differ is shown by the following table : Average Age of Dying —Years.
Prussia Denmark Sweden England Holland Belgium France
31.10 40.49 40.66 36.92 34.72 38.35 40.36
Reflective
Average Age of Living — Tears.
27.60 27.85 27.66 25.31 27.76 28.63 31.06
Analysis.
Sickness and mortality bring great loss to the community. Even sickness and death among children, while they do not directly affect the productive power of the community, are a loss because the child has to be replaced by a new birth, and thus the expense of bringing the child up is lost. A still greater economic loss is caused by the preventible sickness and mortality from 15 to 45 years of age. According to Dr. Farr's English Life Table, of a million persons born, 72,397 die between the ages of 15 and 45 as the result of phthisis, and 24,805 as the result of zymotic diseases. If we take the money value of each person aged 15 to 45 as 200 pounds sterling, the pecuniary loss from phthisis alone is 14,479,4001. It is therefore of great importance to the community that the amount of sickness and mortality should decrease. A comparison between the annual deaths per million in England during the two decades 1861-70 and 1871-80 shows that the deaths from fever had decreased 401 per million and from phthisis 359 per million. Every decrease of this sort is a direct gain to the community. 1 One use of life tables is to show whether the average duration of human life is increasing or decreasing. From such evidence as we can get, it is probable that it is steadily increasing. In England, if we compare the exi Newsholme, Vital Statistics, pp. 279, 273. H
178
STATISTICS AND SOCIOLOGY.
pectation of life at birth according to Dr. Farr's table, 1838-54, with that of Dr. Ogle's table, 1871-81, the increase for males has been 1.44 years, and for females 2.77 years. By the old life table one-half out of a million males born would be dead before the end of the 45th year ; by the new table one-half would not have died until after the end of the 47th year. It is true that the deathrate has increased for males over 35 and for females over 45, but notwithstanding this, the survivors at the end of each year by the new table exceed the survivors by the old table at every age up to the 67th year. After that date the survivors at the end of each subsequent year are more numerous by the old than by the new table. This points to the fact that the survivors at the end of the 45th year are so much more numerous than they were under the rate of mortality prevailing in 1838-54, that they can support the higher mortality of after years for a considerable period and yet retain their numerical superiority. In the same manner it is shown that the length of human life has increased in France, Sweden, Holland, Belgium, and Norway. 1 The average duration of human life has great economic importance. Engel reckoned in 1855 that the population of Prussia, consisting of 17,702,831 individuals, had lived a total of 444,281,631 years, of which 210,792,890 were in the unproductive ages under 15 and over 70 ; while 233,488,741 were in the productive ages between 15 and 70. These latter years have to support not only themselves but an almost equal number of unproductive ones. Suppose now that the productive years should be reduced by reducing the average duration of life so that they amounted to only 200,000,000. It is true that the total number of years to be supported would also be reduced, so that instead of 444,281,631 there would be only 1
Newsholme, Vital Statistics, p. 288. II., p. 309.
Levasseur, La Pop. française,
SICKNESS AND MORTALITY.
179
410,792,890 years. But these years must now be supported by 200,000,000 years instead of 233,488,741, so that the pressure on each individual is greater. In quintessence : the shorter the mean duration of life, the more difficult it is for a generation to pay the cost of bringing itself into existence.1 This subject has been pursued in somewhat greater detail by Dr. Ogle in England. He shows by a table of death-rates that the mean annual mortality has declined from the period 1841-70 to the period 1881-85 by 12.44 per cent for males and 14.95 per cent for females. This gain is due principally to less mortality among children, for, as already said, males over 35 and females over 45 have a greater mortality than formerly. It has consequently been affirmed not only that this decrease in the death-rate is no economic benefit, but still further that by preserving the weak and unsound constitutions a higher death-rate results in adult life. This, however, gives a false impression. The extinction of any disease might theoretically produce two results on the mean duration of life. Either the proportion of deaths from other causes would remain as before ; or if one disease were annihilated (as, for instance, small-pox), other diseases (as scarlet fever and measles) would become more fatal, thus counterbalancing to a greater or less extent the gain. If all the deaths now caused by violence were to cease, the persons thus saved would doubtless share the rate of mortality of the whole community. If again the causes of death annihilated were those peculiar to children in the first year of life, the actual mortality would necessarily be increased at the higher ages ; for all men must die at some time, and the larger the number escaping the dangers of childhood, the more numerous will be the victims in adult life. 2 The higher rate of 1 1
Preuss. Zeitschrift, 1861, p. 323. Newaholme, Vital Statistics, p. 266.
180
STATISTICS AND SOCIOLOGY.
mortality may, of course, be due to the survival of the weakly, although Dr. Ogle finds two other possible causes of this increased adult mortality, viz., the increasing severity of competition among adults, resulting in greater wear and tear on life ; and the ever-increasing proportion which flocks to share in city life. But, however this may be, if we sum up the additional years of life saved by the decreased death-rate, we shall find that in the case of males 66 per cent, and of females 65 per cent, of the years gained are lived between 25 and 65. Dr. Ogle gives a further calculation, showing the actual annual gain owing to the lower death-rate in 1871-80. The mean annual number of births in England and Wales in 1871-80 was 858,878. I f these children be traced through life, the changes occurring in the death-rates 1871-80, as compared with 1838-54, will result in an addition of 1,800,047 years of life shared among them ; and since this number of births occurs annually, it may be reasonably inferred that there is an annual addition of nearly 2,000,000 years of life to the community, the greater share in which must be ascribed to sanitary measures. 1 These facts would seem to be an answer to those persons who maintain that by our sanitary measures, hospitals and charitable relief, we are simply promoting the survival of the unfit-test and thus weakening the human race; for it appears that a large proportion of those born survive to the non-dependent or useful ages. W e must also consider the diminution of suffering brought about by the decrease of disease, which counts in the sum total of human happiness. iNewsholme, p. 272.
BOOK
II.
SOCIAL.
CHAPTER
IX.
SOCIAL CONDITION. (FAMILIES
A1TD
DWELLINGS,
EDUCATION,
RELIGIOUS
CONFESSION,
kVT
OCCUPATIONS.)
Sociological
Purpose.
WE have reviewed the principal demographic facts concerning population — sex, age, and conjugal condition. W e have also reviewed those great phenomena, births, marriages, deaths, sickness, and mortality, which affect the population of the world. But we have not yet exhausted the range of sociological inquiry, or the function of statistics in such inquiry. Populations differ from each other in numerous ways. Their composition shows a great variety of elements combined in a great variety of ways. W e have differences of religious confession, of education, of social position, of occupation, and of family life. These combined give a certain impress which we designate as social condition. Such condition involves, of course, the question of civilization, i.e., the happiness and prosperity of the community. Each fact 181
182
STATISTICS AND SOCIOLOGY.
has important sociological connections. Occupation, illiteracy, and social position affect births, marriages, deaths, and all other social statistics. The family is the important factor in the growth of population. Family life is the foundation of the moral life of the community. Economic condition decides often the question of social progress. The general sociological purpose of all statistical inquiry is to reveal the existence of social organization. There is no doubt that the constitution of the family, religious confession, occupation, and economic condition are elements in such organization. Social condition stratifies the community in more directions than we are aware of. I f we could have exposed before us the real motives of men's actions, we should see in many cases how the narrow bond of family relation makes itself felt in the broader manifestations of social life. Such connection it is not easy to depict with accuracy, because the influence is often unconscious, when conscious is often concealed, and seldom (in modern times) manifests itself in large or dominant groups. Religious confession, on the other hand, does result in a classification of population, and only a little while back such differences led to the most bitter political and international struggles. No one can doubt that in modern times, although the political significance of difference in religious confession has nominally been suppressed, in reality it is still present and its social significance is in many communities enormous. Much more can be said of the importance of occupation and economic condition in classifying the community. Here we have the associations and the antitheses implied in the terms capitalists and labourers, employers and workmen, masters and domestic servants, the rich and the poor, the productive and the unproductive classes, plutocracy and wageslavery. Statistical classification is not always exact in these directions, for the terms themselves are not precise,
SOCIAL CONDITION.
183
but such classification is essential to the understanding of modern industrial society. To connect these facts of social condition with the physical environment is not always easy, although in the study of city life a relation of this sort is often manifest. Their connection with each other and with other social phenomena (social environment), as already said, is striking. Relations of co-existence and of sequence meet us on every side. This is the great field of practical social reform, and all effort at reform implies a knowledge of the cause of the evil and the belief that such cause can be modified, changed, or removed. The sociological purpose of Statistics in this chapter cannot be mistaken nor should it be underestimated. We have to do with phenomena of considerable difficulty to grasp and gauge. They partake of the complexity of social life, and thus are difficult to classify and arrange. The inter-relations are numerous and it is not easy to disentangle cause and effect. Often all we can do is to analyze the facts and wait for future knowledge to show the proper correlation. Social statistics present the most delicate questions of correct analysis and interpretation, for the facts themselves are so elusive as to escape exact expression. I t is the purpose of this chapter to present these facts in as scientific a way as possible. Statistical
Data.
Families. All social conditions have intimate connection with the family and family life. Hence, as a basis for our social statistics, we can commence with an enumeration of families, and a description of the composition of the family as to the number of persons. The number living alone and living in families is a matter of considerable interest as showing the habits of the people and their inclination to family life. The varying size of families is instructive as showing the fecundity of the population,
184
STATISTICS AND SOCIOLOGY.
and the disposition to undertake or to avoid the burdens of married life. The statistics are not altogether exact, because under the term family it is necessary to include persons living alone, as well as agglomerations of persons, such as hotels, schools, and asylums. For whole countries, however, these latter cases are not important. In Europe, with the exception of France, there are always four or more persons to a family. In France in 1891 there were 10,662,423 households or families in a population of 38,133,385, giving an average of 3.57 persons to a family. In 1861 the average was 3.8, and in 1851, 3.9. This steady decrease is due to the small number of births. In Germany, in 1890, there were 10,617,923 households, giving 4.66 persons to a family. Among these households, 747,689 were single persons living alone, 33,674 were institutions, and 9,836,560 were ordinary families of two or more persons.1 In Austria the number of persons to a family was 4 . 8 4 ; in Switzerland, 4 . 6 ; in England, 4 . 7 ; in Scotland, 4 . 6 ; and in Ireland, 5 persons to a family. 2 In the United States the total number of families, in 1890, was 12,690,152, with an aggregate population of 62,622,250, or 4.93 persons on the average to each family. In 1880 the average size of family was 5.04 ; in 1870 it was 5.09 ; in 1860 it was 5.28 ; and in 1850 it was 5.55. The decrease in the North Atlantic division is particularly marked, the average size of family in 1890 being 4.69, against 5.45 in 1850. In the North Central division there has also been a considerable decrease, from 5.69 in 1850 to 4.86 in 1890. In the extreme Western states there is a tendency to increase. In newly settled territories the average size of family is small at first, but Allg. Stat. Archiv, Dritter Jahrgang, p. 405. Census of Ireland, p. 530. Single persons seem to be included in the families as " visitors." 1
2
SOCIAL CONDITION.
185
increases steadily as settlement goes on. In the Western division the average for 1890 was 4.88, against 4.18 in 1850. When the population becomes more or less urban in character the maximum is reached, and a constantly receding average is likely to be shown at each census thereafter. This is now the case with all the older commonwealths of the United States except the Southern, where the coloured element is large. In these latter, although there has been a decrease in 1890 as compared with 1850, there has been a general increase since 1870. For instance, in the South Atlantic division the average size of family in Virginia has increased from 5.29 in 1870 to 5.44 in 1890; in North Carolina, from 5.20 to 5.27 ; in South Carolina, from 4.67 to 5.16; in Georgia, from 4.98 to 5.22; and in Florida, from 4.77 to 4.89, although there has been a slight decrease in the latter since 1880. In the South Central division the same increase is shown; in Alabama, from 4.92 in 1870 to 5.27 in 1890; in Mississippi, from 4.96 to 5.35; and in Louisiana, from 4.60 to 5.22. In Texas and Arkansas an increase is also noticed, due partly, no doubt, to the great growth of population since 1870. In cities there is a very marked tendency for the size of the family to decrease. In New York the average size of a family decreased from 4.96 in 1880 to 4.84 in 1890; in Brooklyn, from 4.92 to 4.72 ; in Philadelphia, from 5.13 to 5.10; in St. Louis, from 5.38 to 4.92; and in Chicago, from 5.19 to 4.99. 1 Families of Different Size. Families may be analyzed according to the number containing a specified number of persons. In France, for instance, out of 100 households, 14 consisted of single individuals, 41.3 of from two to three individuals, 29.8 of four to five individuals and 14.5 of six or more individuals. For the United States we have the following table, showing interesting 1
Compendium of the Eleventh Census, Fart I., p. cxi.
186
STATISTICS AND SOCIOLOGY.
differences for different sections of the country and for cities : One Two to Six Beren to Ten Kferea Pereon. Persons. Person*. end orer. Per Cent Per Cent. Per Cent. Per Cent.
The United States . . . North Atlantic division. South Atlantic division . North Central division . South Central division . Western division . . . Cities: New York Chicago Philadelphia . . . . Brooklyn St. Louis
3.03 3.23 3.45 3.43 3.00 10.16
73.33 78.06 67.70 74.96 67.40 68.16
20.97 17.00 26.16 19.84 26.97 18.86
2.07 1.72 2.69 1.77 2.63 2.84
3.08 1.89 1.91 2.71 4.64
77.38 76.49 74.67 78.37 73.22
17.66 19.68 21.09 17.63 19.82
2.04 2.33 1.39 2.32
1.80
If we look at different sections of the United States we find the largest number of families of one person in the Western division. This is due, of course, to the mining and frontier population of that region. The other noticeable thing is, that, while in the North Atlantic and North Central divisions the moderate-sized families of from two to six persons constitute nearly three-quarters of the total number, in the South Atlantic and South Central divisions they constitute only two-thirds. The complementary relations are seen in the large families, which are more numerous in the South than in the North. This is due probably to the large negro families in the South, and the urban population of the North, for in cities the size of family is small. This latter fact is apparent in the second part of the table, showing the large percentage of moderatesized families of from two to six persons in the five largest cities of the United States. In some industrial cities, not shown in the table, the proportion of moderate-sized families of from two to six persons runs as high as 79 or 80 per cent. Such is the case with Indianapolis, Ind., Newark, N.J., and Providence, R.I. At the other extreme stands Omaha, Neb., showing 65 per cent of mod-
SOCIAL CONDITION.
187
erate-sized families, and 28 per cent of large families of from seven to ten persons. The number of families of different size is determined first of all by the fecundity of the population. This is shown by comparing the 14 per cent of families consisting of one individual in France, with the 7 per cent of such families in Germany, and the 3.63 per cent in the United States. It is indicative, in the second place, of the general character of the population, for we find the largest families in the rural districts. In France, for instance, families having seven children and more are found principally in Corsica, Brittany, Poitou, the lower Pyrenees, the Massif Central, and the Alpine region, all agricultural communities, and in three departments of the North. 1 Dwellings. The number and kind of houses the people occupy, and the number of families and persons to a house, are important indications of the social condition of the community. In England there were 5,451,497 inhabited houses, 372,184 uninhabited, and 38,387 building. This made 1.1 families and 5.3 persons to an inhabited house. In Scotland there were 1.07 families and 4.92 persons; in Ireland, 1.07 families and 5.4 persons; in Germany, 1.8 families and 8.45 persons ; in Austria, 1.6 families and 7.5 persons ; in France, 1.4 families and 5 persons to a house. In the United States there were 11,483,318 occupied dwellings, or 1.1 families, and 5.45 persons to a dwelling. These figures show that everywhere there are more families than dwellings, i.e., that sometimes two or more families must live in the same house. Thus, in the United States there are 1,206,834, or 10.5 per cent more families than dwellings. In the agricultural states of the South the excess is very small, only 3.2 per cent; while in the North Atlantic division it is 25.3 per cent; in Massachusetts, 35 per cent; in Rhode Island, 43.5 per cent; and ill New York, 46 per cent. 1
Levasaeur, La Pop. française, HI., p. 158.
188
STATISTICS AND SOCIOLOGY.
It is, of course, in cities that we find the largest number of families and persons to a house. The cities, indeed, vary in this respect. Philadelphia has almost as many houses as families, while in New York there are 3.82 families and 18.5 persons to a house. There is great concentration in some of the smaller cities also, as in Fall River, where there are 11.2 persons to a dwelling. In some of the wards of New York City concentration is still greater. In the district below East 14th Street there are 6.39 families, and 30.27 persons to a dwelling. The highest number is in the Tenth Ward, namely, 7.85 families, and 38.50 persons to a dwelling. In three wards only is the average number of families to a dwelling less than two ; in two wards it is between two and three ; in nine wards, between three and four; in three wards, between four and five; in two wards, between five and six ; in four wards, between six and seven ; and in one ward it is very nearly eight. In New York, 46 per cent of the dwellings have one family, 11 per cent have two families, and 43 per cent have three families and over. Brooklyn stands next to New York, 51 per cent of the dwellings having one family, 23 per cent having two families, and 26 per cent, three or more families.1 New York makes a particularly bad showing, because the tenement house population is concentrated on the island while the ordinary middle class is scattered in neighbouring towns and states. For English cities, the census of 1891 reported only 7.72 persons per inhabited house in London; 7.33 in Newcastle-upon-Tyne; 5.68 in Liverpool; and 5.04 in Manchester.2 Kind of Dwelling. The mere enumeration of the number of houses does not give us very satisfactory information of the condition of the people. In the census every 1 J
Compendium of the Eleventh Census, Part I., pp. cxiv and cxx. Census of England, Vol. IV., p. 21.
SOCIAL CONDITION.
189
inhabited building is a house, from the stone castle to the mud hovel. Even where we ascertain the number of families or of persons to a house, the information is not very definite, for a modern apartment house may contain more than the worst crowded tenement house. It is, however, extremely difficult to classify houses in such a way as to indicate their real value as dwellings. Some attempts have been made in various countries which will be noted here. In Ireland all houses are classified in four divisions, according to size, as shown by the number of rooms ; according to quality, as shown by the number of windows in front; and according to solidity and durability, as shown by the material of the walls and roof. In the lowest of the four classes are comprised houses built of mud or perishable material, having only one room and window ; in the third class, a better description of house, with from one to four rooms and windows ; in the second, what might be considered a good farm house, having from five to nine rooms and windows; and in the first class all houses of a better description than the preceding. The number of houses of different classes was: — First class, 70,7-10 (8.1 per cent) ; second class, 466,632 (53.6 per cent); third class, 312,589 (35.9 per cent); and fourth class, 20,617 (2.4 per cent). The mud hovels (fourth class) are almost exclusively in the rural districts. The houses of the third class are mostly in the rural districts. On the other hand, nearly one-half of the houses of the first class are in the civic districts. The extraordinary thing is the 20,617 mud hovels having only one room and window, inhabited by 20,729 families. The number of these mud cabins, however, is only one-half what it was in 1881, and considerably less than one-fourth of the number in 1861. In the county of Kerry, indeed, they still comprise 7.9 per cent, and in the county of Limerick 6 per cent of all the houses. In
190
8TATI8TICS AND SOCIOLOGY.
the counties of Mayo and Donegal, the houses of the third class are more than one-half of the whole. The Irish census tries to combine the style of house with the number of families occupying the house. For this purpose, it calculates what it calls house accommodation. House accommodation is arranged under four classes, viz. : First Class accommodation, consisting of first class houses occupied by one family. Second Class accommodation, consisting of second class houses occupied by one family, or of first class houses occupied by two or three families. Third Class accommodation, comprising third class houses with one family each, or second class houses with two or three families, or first class houses occupied by four or five families. Fourth Class accommodation includes all fourth class houses, third class houses with more than one family, second class houses with four or more families, and first class houses inhabited by six or more families. This classification gives us a slightly different result from the above. Specimens of the variations in different counties are given in the following table, showing the percentage of families having each class of house accommodation: First Class. Second Class. Third Class. Fourth Class. Per Cent. Per Cent. Per Cent. Per Cent.
All Ireland . . . . County Mayo . . County Kerry . County Dublin . . County Tipperary.
5.3 1.9 2.8 12.2 6.0
47.7 22.5 35.6 52.3 65.9
43.3 71.0 51.6 31.3 34.1
3.7 4.6 10.0 4.2 4.0
This table gives a very fair idea of the differences in house accommodation between a poor agricultural county of West Ireland like Kerry or Mayo, and an urban county like Dublin. 1 1
Census of Ireland, 1891, General Report, pp. ix and 167.,
SOCIAL CONDITION.
191
In Scotland they adopt a different system, classifying the houses according to the number of rooms. In 1891 there were 817,568 houses containing 2,649,186 rooms, making an average of 3.24 rooms to a house, and 1.52 persons to a room. In towns, each house has an average of 3.02 rooms, and 1.62 persons to a room; in villages, each has an average of 3.09 rooms, and 1.55 persons to a room ; and in the rural districts, each has an average of 3.95 rooms, and 1.28 persons to a room. In Scotland, in 1891, there were 398 families registered as living in one room with no window, and 193,337 families (22 per cent) as living in one room with window. House accommodation is, however, steadily improving. In 1861 there were 7,964 families occupying each one room with no window, while 34 per cent of the families occupied each one room with window.1 In England they have still another method of measuring house accommodation. They distinguish between a house and a tenement, the latter being any part of a house separately occupied either by the owner or by a tenant. Tenements were classified according to the number of rooms, and it was found that 4.7 per cent were one-room, and 11.4 per cent were two-room, tenements. Still further, the number of persons to each room was given. Where there were more than two persons to a room the tenement was said to be "overcrowded." Taking the tenements of less than five rooms, it was found that 11.23 per cent of the total population were living in such overcrowded tenements. The proportion in urban districts was 12.31 per cent, and in some cities it ran as high as 35 and 40 per cent. The overcrowding is worst in industrial and mining districts. 2 Besides these general census returns as to house accomCensus of Scotland, 1891, Vol. I., p. xv. For interesting details and discussion, see Census of England, Vol. IV., p. 19 ff. 1 3
192
STATISTICS AND SOCIOLOGY.
modation, we have had special investigations with reference to the so-called tenement house problem of large cities. The most recent is the Tenement House Census of Boston which was taken in 1891. This covered 36,223 rented houses inhabited by 71,665 families comprising 311,396 persons, or an average of 4.35 persons to a family, and of 8.60 persons to a rented house. The average number of persons to a room was 0.91, but in some cases it was as high as 2.11. Of the 71,665 families, 11,825 were found in one-tenement houses, that is, in separate houses held under rental; 41,245 families lived in houses containing two and three tenements. These two classes together comprise three-fourths of all the families and persons living in rented houses. The number of families to a house, according to this statement, does not seem to be excessive. Nevertheless, calling the three-tenement house a tenement house in the ordinary sense of the word, and excluding houses containing more than six tenements, which are ordinarily of the higher class called " apartment houses," they find in Boston that 48 per cent of the families occupying rented houses are in tenement houses. They constitute, however, only 37.24 per cent of the estimated number of families in the city, and only 29.67 per cent of the estimated total population. They tried in Boston to indicate more particularly the character of the tenement houses. I t was found, for instance, that of these families 25.78 per cent have bathrooms, while 74.22 per cent do not. The tenement houses were still further classified in respect to outside sanitary condition, light and air, ventilation, and cleanliness. The inspector designated them under each head as excellent, good, fair, poor, or bad. About 12 per cent of the population in rented houses were living in " p o o r " or " b a d " tenements, but in some of the wards the proportion was as high as 25 per cent. 1 1
Report of the Massachusetts Bureau of Statistics of Labour, 1891, pp.
193
SOCIAL CONDITION.
I n the city of Bale in Switzerland, a still more minute investigation has been made of the dwelling accommodations of the people. This covered only tenement houses, that is, housjs inhabited- by two or more families. The peculiarity o: the inquiry is that the rooms were measured and classified according to their cubic contents. T e n cubic metres was fixed upon as the minimum necessary for a sleeping room per person, and 20 cubic metres as the minimum for a liring room. There lived in dwellings which did not furnish the minimum amount of sleeping room, 7.3 per cent of the population; in dwellings which gave the minimum amount of sleeping room but not of living room, 35.2 per eeut of the population. Another 30.8 per cent lived in dwellings with a moderate amount of living room. Only 19.2 per cent had abundant room. 1 Education. T h e condition of a people is very often gauged by its intelligence, or the prevalence of education. W e have here two statistical measurements, one of illiteracy and the other of educational facilities. T h e first is much easier ".o express than the second. There are various methods of ascertaining the illiteracy of a population. The first is to ascertain by a census inquiry the nunber of persons who can read and write, or at least read. An example is the Census of Ireland, which gives for two periods, fifty years apart, the number of literates and illiterates in the population 5 years of age and over as follows: Ireland, 1841 Ireland, 18fl
Bead and Write. Per Cent.
28 71
Read bat not Write. Per Cent.
Seither Bead nor Write Per Cent.
19 11
63 18
T h i s showi the wonderful progress made during the last 63S, 561, 666. iee also The Seventh Special Report of the Commissioner of Labor : Tie Sums of Baltimore, Chicago, New York, and Philadelphia. Washington, 18*4. 1 Bücher, Die Wohnungs-Enquete in der Stadt Basel. Reviewed in the Allg. Stat. Archiv, I L , 200. o
194
STATISTICS AND SOCIOLOGY.
fifty years. The province of Connaught shows the highest percentage of illiteracy at the present time (27 per cent) and the county of Galway has the highest percentage ( 3 4 . 1 ) of any county in Ireland. Of the Roman Catholic population 5 years of age and upward, 22.0 per cent, of the Protestant Episcopalian, 8.6 per cent, and of the Presbyterian 5.6 per cent, could neither read nor write. Ireland is considered an illiterate country, but it is not nearly as much BO as some of the countries of continental Europe. In Austria, for instance, 27.7 per cent of the males and 31 per cent of the females, six years of age and over, could neither read nor write, and in Bukowina and Dalmatia the percentage was 75 and 85 for males and females.1 As a contrast to this, we may take the state of Massachusetts in 1885, where of the population 10 years of age and over, 1.6 per cent could read but not write, and 6.12 per cent could neither read nor write. Of all the illiterates, 88 per cent were foreign-born. The number of adult illiterates (among whom illiteracy is practically permanent) was much greater among the foreign than among the native-born.2 The second method of ascertaining illiteracy is to take the number of parties contracting marriage who are unable to sign their names in the registration book. This is the English method. The number signing with a mark was, for one hundred of each sex: Males.
In 1843 1873
. .
. .
32.7 18.8
Fem&leB.
49.0 25.4
Mule«.
In 1883 1893
. .
. .
12.6 5.0
Females.
15.5 6.7
This table shows a great decrease, especially marked since 1883. In Scotland the proportion, in 1890, was 3.92 per cent for men, and 6.42 per cent for women. In Ire1 a
Allg. Stat. Archiv, III., p. 414. Census, Mass., 1885, Vol. I., Part II., p. lxxxv.
SOCIAL CONDITION.
195
land the proportion, in 1890, was 20.4 for men, and 20.9 for women. In Prussia, notwithstanding the universal compulsory school-attendance, there is a certain number of newly-married people unable to sign the marriage certificate. They forget how to write between the time of leaving school and getting married. The number is decreasing, and, in 1891, was only 1.6 per cent among males, and 2.5 per cent among females.1 The number is greater among females than among males, because men have greater occasion to exercise their writing in occupations after leaving school than have females. The male recruits also are taught reading and writing, if found illiterate. A third method is to obtain the number of recruits unable to read and write. In Germany, of the recruits for the year 1889-90, only 0.5 per cent could neither read nor write their own name. For the province of Posen, the proportion was 3 per cent; for West Prussia, 3.26 per cent; for East Prussia, 2.49 per cent; but for all the other provinces of Prussia and the rest of the empire, it was less than one per cent, in some cases going as low as 0.01 per cent. In France 2 the results of the second and third method correspond, there being, in 1887, about 10 per cent of the recruits who were illiterate, and about the same per cent of bridegrooms who could not sign their names. The amount of illiteracy has decreased rapidly since 1870. International comparison of illiteracy is difficult, because countries pursue these different methods. Comparatively few take a census of illiterates ; and the census answers being made by the individuals themselves, probably the amount of illiteracy returned is less than really exists. On the other hand, recruits and people able to marry are a select class, and thus the great amount of illiteracy existing among the lower classes, the vagabonds, criminals, 1 Preuss. Zeitschrift, 1893, S. C. II. Levasseur, La Pop. française, VoL II., p. 490.
2
196
STATISTICS AND SOCIOLOGY.
paupers, and defectives, escapes notice. So, too, where education has recently been introduced, the older persons, who passed their youth before it became common, may be very illiterate, although the younger classes, from which the recruits and bridegrooms come, are now able to read and write. In Belgium the lowest number of illiterates is found among persons 15 to 25 years of age, — only 15 per cent; it then increases, until from the age of 60, over one-half of the persons are illiterate. Such statistics of illiteracy by age-groups are always extremely interesting, because they show the long and wearisome struggle that any educational system has in overcoming ignorance. Removal by death is the only cure for this illiteracy of advanced years. The application to the foreign-born population of the United States has already been noticed. Notwithstanding these difficulties, an attempt has been made to secure an international comparison. For sake of uniformity the figures are taken from the years 1880 to 1882 and refer to illiteracy among recruits, except for England, Scotland, and Ireland, where bridegrooms are taken, and the United States, where males 15-21 are taken as the class nearest the recruits. We have then countries in four groups and the percentage of illiterates as follows: GEODP I .
Rouinania . 79.6 Servia . . . 79.3 Kussia . . . 78.8 United States coloured population . . 62.1
GROUP I I .
Hungary. Italy . . Austria . Ireland . Belgium . France .
. . . . . .
GROUP I I I .
50.8 47.7 38.9 27.6 15.9 14.9
England . . Holland . . United States whites . . Scotland . .
GROUP
IV.
13.2 Switzerland . 2.3 10.4 Prussia. . . 2 . 3 Germany . . 1.6 7.7 Sweden . . 0.4 6.8 Denmark . . 0.4
Group I., with enormous illiteracy, is typical of the Slavonic countries in Eastern and Southeastern Europe. Hungary and Austria, in Group II., having large Slavonic mixture, approach the figures for Group I. The second group is mainly the Latin and Celtic nationalities, but while Italy approaches the East, France is nearer England and the North. The condition of Ireland is due largely to
197
SOCIAL CONDITION.
economic circumstances. Group III. is mainly AngloSaxon, and presents a moderate amount of illiteracy. Group IV. is mostly Germanic, and represents illiteracy pushed down probably to its lowest limits. 1 The single test of absolute illiteracy is a very crude one for measuring the social condition of a community. Education can be of all degrees of excellence and extend indefinitely into the higher domains of science, art, and learning. We should therefore extend our statistics so as to show the number of universities and higher schools, the number of professors and teachers employed, the number of students enrolled of various grades, the average length of the school year, the regularity of attendance, the amount of money spent, and so on. The combination of all these things might serve to give us some notion of the educational facilities enjoyed by different communities. It is difficult, if not impossible, to bring these figures into international comparison so as to measure exactly the social position of different populations, and we shall not attempt it here. 2 Religion» Confession. This is an important index of the social condition of different populations. We have first the absolute number of members of different confessions as shown in the following table (1890-91) : 8 COUNTEY.
Germany. Austria . Hungary . Switzerland Holland . Denmark. Sweden . Norway . Ireland . 1
. . . . . . . .
Pro te« U n ta.
Komin Catholics.
Greek Catholics.
51,026,810 486,352 2,661,831 1,716,648 2,674,904 2,163,486 4,736,747 1,966,476 1,046,077
17,671,929 18,934,166 8,886,940 1,183,828 1,696,482 3,648 1,390 1,004 3,647,307
2,992 3,368,939 4,321,187 -
146,640 17,646 74,417 -
37 -
62 -
Other Christiana.
61,613 10,682 18,606 16,368 79,371
Jews.
667,884 1,141,616 730,342 8,069 97,324 4,080 3,402 214 1,786
Mischler, AUg. Stat. Archiv, III., p. 730. Recent attempts are by Levasseur, Balletin de l'Institut international de statistique, Vol. VI., and by Mischler, op. eit. » AUg. Stat. Archiv, IIL, p. 472. 1
198
STATISTICS AND SOCIOLOGY.
The above table gives a general notion of the mixture of religious confessions in some of the principal countries of Europe. When we come to distinguish Christian sects, as in the United States, the matter is much more difficult. We do not demand in our general census the religious belief of each individual, but endeavour by collecting the statistics of churches to ascertain the relative strength of different denominations. The great difficulty is that we have to get the numbers from church officials, and that the definition of what constitutes membership varies. In some, it is all who have been baptized ; in others, those who attend the church service or contribute to its support ; in others, only those who have previously joined the church or who are communicants. Specimens of the Church Statistics of the Eleventh Census are as follows : 1 DENOMINATION.
Organization.
Total . .
165,177
Methodists Baptists . . Presbyterians. Catholics . . Lutherans . .
61,489 42,609 13,478 10,276 8,695
Church Edifices.
Seating Capacity.
Valne of Church Property.
142,621 43,664,863 $679,630,139 46,138 12,863,178 37,671 11,568,019 12,469 4,038,650 8,816 3,374,907 6,701 2,205,635
132,140,179 82,328,123 94,869,097 118,371,366 35,060,354
Commnnl' cants or Members.
20,612,806 4,689,284 3,712,468 1,278,332 6,257,871 1,231,072
One peculiarity to be noted in this table is that while in Protestant denominations the seating capacity is greater than the number of members, among the Roman Catholics the number of members is greater than the seating capacity. This is due to the fact that in Catholic churches two, three, or even four masses are held on Sunday, which are attended by and intended for different bodies of communicants. One case (an extreme one) is mentioned of a Polish church in Buffalo where there were 17,490 communicants, although the church had a seating capacity 1
Compendium of the Eleventh Census, Part II., p. 306.
S O C I A L CONDITION.
199
of only 1900. These figures of church property, capacity, and membership for the United States have only a limited value, because they rest on uncertain data. They show in a general way the religious proclivities of the people, and the attention they pay to religious culture. Occupations. The classification of the population by occupation gives us important knowledge of social condition. We adopt for this purpose such general grouping as will apply to large bodies of men living under somewhat similar circumstances. Detailed occupations refer to such small bodies of persons that although extremely useful for the study of particular conditions, they cannot be used for general purposes. The ordinary classification ia shown in the following table: 1 PROPORTIONS PER 1000 OF ALL AGBS. Englsnd Sootland. And Wales. Professional . 32 28 Domestic . 66 50 Commercial 45 . 48 62 Agricultural and fishing . . 46 Industrial 263 256 Unoccupied . 655 569 CLASS.
Ireland. 44 61 20 200 140 545
United Kingdom. 33 62 44 67 239 665
Less than one-half of the population, including women and children, is accounted for as engaged in productive occupations. The differences among the countries are apparent. In England and in Scotland one-fourth of the population is engaged in industry, while in Ireland one-fifth is engaged in agriculture and fishing. If the unoccupied and nonproductive classes were distributed proportionately among the different occupations (which would not be strictly correct), more than one-half of the population of England and Scotland would be dependent on industry, and two-fifths of the population of Ireland on agriculture. In other countries the census of occupations is taken on 1
Census of England, 1891, Vol. IV., p. 87.
200
S T A T I S T I C S
A N D
SOCIOLOGY.
a different plan. In France and Germany the dependents are classed with the person upon whom they are dependent. This gives a different set of figures from those shown above. A general comparison of France and Germany would show the following percentages of the whole population dependent upon different occupations: 1 Agriculture and fishing Industry Commerce and transportation . . . . Professional and official Unoccupied and independent
Germany.
France.
42.6 35.6 11.0 4.9 6.0
47.8 26.1 14.3 6.0 6.2
100.0
100.0
These figures tend to show that France is agricultural, while Germany is more industrial. Similar figures for the United States go to show that about 40 per cent of the population are engaged in agriculture. The figures are as follows: PERSONS
IN G A I N F U L
OCCUPATIONS, or
CLASSES o r OCCUPATIONS.
UNITED
STATES,
1890,
BY
OCCUPATIONS. Total.
Males.
Females.
CLASSES Per Cent i n e a c h occupation.
Total population ten years Totals. of age and over . . . 47,413,569 24,362,669 23,060,900 All occupations . . . . 22,735,661 18,820,912 3,914,749 100.00 Agriculture, fisheries, and mining 9,013,201 8,333,692 679,509 39.6 Professional 944,543 632,861 311,682 4.1 Domestic and personal service 4,360,286 2,692,600 1,667,686 19.1 Trade and transportation 3,325,962 3,097,640 228,322 14.6 Manufacturing and mechanical industries. . 6,091,669 4,064,119 1,027,550 22.3
A further refinement of the statistics of occupations is to divide the persons in each occupation into employers, employed, and working on their own account. In Scot1 Stat. Jahrbuch ffir das Deutsche Reich, 1891. française, I., p. 366.
Levasseur, Pop.
SOCIA!, CONDITION.
201
land,1 for instance, the 623,459 males engaged in certain occupations (excluding such as the public service, army and navy, professional and domestic, where it is selfevident whether a man is employer or employee) are classified as follows : The number of male employers is 56,789, of employed, 505,323 ; of those working on their own account, 48,881. Of the females, 7,316 are employers, 210,716 are employed, and 37,914 are working on their own account. These figures are not altogether satisfactory, because they include only a portion of the population. In Germany they have a still more detailed classification covering employers, administrative personelle, day labourers, other assistants, etc. The results for Prussia expressed in percentages of the whole population were as follows : 2 Per Cent.
Working on own account . Labouring class . . . . House service
11.22 24.86 1.02
Per Cent.
Day service Unoccupied or independent Dependents
3.26 2.68 67.08
Such figures do not carry us very far in our estimates of the social position of a population. The difficulties of classification seem to be practically insuperable, especially when we try to compare the population of one country with that of another.8 There are many other indirect indices of the social condition of the community. They are mostly economic in their nature, and can be treated critically only under Economic Statistics. It will suffice merely to mention some of the more important ones here. The ownership of land is an important factor in the social condition of a people. Where we contrast the peasant proprietorship system of France, with more than Census of Scotland, 1891, Vol. II., Part IL, p. xiii. Statistisches Handbuch fttr den Preussischen Staat., Band IL, p. 136. * Interesting discussion of statistics of occupations in Census of England, 1891, Vol. IV., p. 36. 1
1
202
STATISTICS AND SOCIOLOGY.
4,500,000 owners of land, with the great landlord system of England, with its 325,000 owners, the social as well as the economic influence must be very different. When we know that in Great Britain the average size of agricultural holding is 58J acres, while in France it is only 12J acres, the difference between the two systems is very clearly seen. The indebtedness resting on owners of farms and homes is another important index of social condition. Out of 12,690,132 families in the United States, 52.2 per cent hired their farms or homes, 34.43 per cent owned them unincumbered, and 13.37 per cent owned them incumbered. The details of this interesting investigation will be considered under Economic Statistics. The statistics of savings banks give us positive evidence of the prosperity of the people. In the same way, we have indirect evidence in the number of benefit societies, of cooperative societies, of mutual insurance associations, etc. The consumption of the necessaries and comforts of life, as revealed in the statistics of imports and the returns of taxation, may be made to show variations in the well-being of the mass of the people. Price statistics, in conjunction with wage statistics, show a greater or less command over the comforts and conveniences of life. The rent of houses is especially important in this connection. Social statistics require minute investigation, and we can often get details in regard to a small community or section of a community which we cannot extend statistically. An example is Mr. Charles Booth's investigation of the conditions in East London, where he was able to divide the people into general classes, showing on the whole whether they were utterly wretched, very poor and with uncertain livelihood, poor but decently comfortable, fairly well-off, and well-to-do. Such minute investigations allow us to describe the general sanitary condition of the neighbourhood, park and recreation places, opportunities for
SOCIAL CONDITION.
203
amusement, associations for mutual benefit, which we could not deal with for larger areas. The greatest opportunity for social statistics probably lies in this direction. Scientific Test». The principal difficulty in social statistics is to get definitions of terms sufficiently precise to classify the elusive phenomena of social life. A very simple example of this is the definition of the terms family and house. What do we mean by the term family ? Does an individual living alone constitute a family ? Does a boarding-house constitute one family, or as many as there are individual boarders not connected by any tie of relationship or pecuniary interest ? A boarding-school of 75 girls, is that a family, or shall the girls be assigned to their respective families ? The latter process is inconvenient and difficult, for often they live outside the state, or perhaps the girls are orphans. In statistics they are obliged to cut the knot very simply by counting every individual living isolated as a family, and all agglomerations of persons living together as a family or household. Little harm is done when we still further classify the families according to size, for the single individuals at once appear, and the institutions and hotels become prominent by the number of individuals in them. Even when we come to average the families for the purpose of ascertaining the average size, if the area is of considerable extent these exceptional cases disappear. For instance, in Massachusetts in 1885, the average size of family, including these artificial aggregations, was 4.58 persons, and excluding them it was 4.45, a difference which would not be important. In small communities it is otherwise. For instance, in the town of Tewksbury, including the state almshouse as one family, the average size of family was 7.05, while excluding it, it was 4.50. The definition of a house presents some difficulty.
204
STATISTICS AND SOCIOLOGY.
W h a t a difference between a mad hovel and a city hotel! Yet they are both dwelling-houses. It seems best to consider each building as a house, and then to enumerate the number of tenements in a house, each tenement being occupied by a family. In Scotland they count a dwelling with an entrance into a common stair as a house. Care must be taken in international comparisons to see that the same definition has been used. T h e influence of the modern apartment houses in cities is somewhat peculiar. Wherever they are present it results in a large number of families to a house. This, of course, does not represent "overcrowding." Misinterpretation can be guarded against by giving the number of rooms to a family or tenement. The interpretation of the social meaning of a large or small average size of family must always be made with careful consideration of surrounding circumstances. In a frontier country there will be a large number of single persons, or young married couples, and the family will be small. In a settled agricultural region, where the grownup children continue to find employment on the farm, the family will be large. In a city, where adults congregate and bachelor life is easy, or in a country of immigration, the family is small. Some influences seem contradictory. A n industrial population generally has a large number of children, but the children leave the parents at an early age, and there is large infant mortality, so that in factory towns the family is small. These things, also, affect the question of overcrowding, for when we say that a family occupies only two or three rooms, it evidently makes a difference whether the family consists of adults or of small children. Among the lower classes, where overcrowding is most felt, the small children predominate. The statistics of occupations offer various technical difficulties which can only be fully considered when occupations are treated in detail under Economic Statistics. The
SOCIAL CONDITION.
205
lines of division between great groups, like agriculture and manufacturing, are not always clearly drawn. Some men pursue two or more occupations, as farmer and fisherman, clergyman and schoolmaster, but must be classed in one alone. It is difficult to class women and children, who perhaps assist the husband or father, or work intermittently outside. They are not full members of the occupation, and yet in a certain sense they belong to it. The term "professional" especially, allows wide divergence of interpretation, as, for instance, in the United States Census of 1880, boot-blacks and whitewashes were included under it. Shall a maid in a farm-house be included under the domestic or the agricultural class ? When we calculate the proportions of the different occupations, shall we take the whole population as a standard? In that case, we must class the women and children with the men on whom they are dependent, or we shall have a large class of "unoccupied." Shall we take the population above the age (say) of ten years? We shall still have the women and a large number of children " unoccupied," and the proportion would vary according to the sex and age composition of the particular population. Shall we take only those actually engaged in gainful occupations ? Then the proportion would vary according to the employment of women and children in factories. Whatever basis we adopt, international comparison is difficult. Such statistics are useful, mainly, in tracing progress in the same country. In the statistics of education we encounter the same difficulty of exact definition. The terms illiterate and literate are very elastic. It makes considerable difference whether we take the assertion of the individual or not; and whether the test is an easy one, such as signing one's name, or a real one. The education of the literates may, of course, be widely different, so that while we have a minimum grade we have no upward divisions.
206
STATISTICS AND SOCIOLOGY.
Scientific precision, in statistics of social position, is not to be expected. Status is too complex to be expressed in numerical terms. We can only take certain facts as indicative of the probable condition, and base our judgment upon these facts. Science here does not demand exact measurements, but simply tests pointing to probable conclusions. Reflective
Analysis.
Social condition rests always upon an economic foundation. There can be no security or refinement in the art of living unless the economic organization furnishes abundant and sure means of subsistence. There can be little development of intellectual, artistic, and social life, until the crude physical wants are satisfied. Even the morality of a community, its participation in vice and crime, are, as we shall see later, strongly influenced by its economic condition. This gives rise to the reflection that in order to measure social condition we must begin with thorough statistics of economic condition. The most important thing here is trustworthy statistics of wages, for a large portion of the modern community consists of wage-receivers. Wages must then be turned into incomes, and this requires care, for we must know something about average wages, regularity of employment, time lost by sickness and accident, strikes and lockouts, how many members of the family are wage-earners, size of the family to be supported, etc. Incomes must then be turned into means of livelihood by tables of prices of the necessaries and comforts of life, such as food, clothing, shelter, and medical attendance; and these last must be adjusted to incomes by " budgets," showing in what proportion the various items enter into the expenditure of a workingman's family. All these things belong to economic statistics and cannot be elucidated here. It is evident that they form the foundation of social condition, and in a thorough treatment of the subject would hold the first place.
SOCIAL CONDITION.
207
The statistics of social condition which we have given in this chapter are therefore secondary. They are manifestations of social life which serve as indices of the condition of a community. They depend upon the economic condition lying behind and underneath them. They are to be looked upon not as independent primary factors, but simply as manifestations, phenomena, revealing in a certain way the real condition of things. One of the most important of these manifestations is revealed by the statistics of houses and dwellings. Man always demands shelter for his head. Beginning with caves and holes in the earth, he progresses through huts, wigwams, and mud hovels to the heated and lighted houses of modern times with doors, chimneys, and windows. The importance of such progress cannot be denied. I t is seen in the struggles over hearth and window taxes which have always been denounced as hindering a development which was most important for the condition of the mass of the people, viz., better building. When we find, therefore, 20,000 families in Ireland still in mud hovels, it gives us a vivid impression of poverty and destitution. And it is a sign of progress noted by the censustaker of Scotland with satisfaction, that the number of families living in one room without window has become extremely small, and the proportion of families living in one room with window is growing steadily less. The size of the house, although only a rough measure, for houses vary infinitely in quality even when built of the same material, affords us an index of the social condition of the people. W i t h the crowding of population into large cities the problem of house accommodation as an index of social condition has become more complex, while at the same time even more important. The size of the house in the country is an index of the comfort of the inhabitants. The tenement house in the city with its numerous families, lack of light and air, bad sanitary condition, and
208
STATISTICS AND SOCIOLOGY.
deteriorating surroundings is an index of the possibility, or rather impossibility, of leading a decent, healthful, and moral life. It means not only a limited space in which to live and sleep, but constant exposure to disease, to disorder and disturbance, and to moral contamination. The social results of tenement house living are widespread and permeating. The statistical problem of how to express these conditions is correspondingly difficult. It is necessary that we find some measure which will gauge the evils and point to methods of improvement. Mere statistics of overcrowding, i.e., of the number of families to a house or of persons to a room, are not sufficient. Even if accompanied by measurements of the cubic contents of the rooms, the statistics are not altogether adequate, for they do not give us the quality of the house accommodation. They must be supplemented by observations of the sanitary condition, situation, and cleanliness of the house. These latter are, of course, the subjective judgment of the inspectors, but there is no doubt that we must train men to make such observations, if our house statistics are to be of value. Only by such refinements can we attain the desired result. A n d there is no reason why such refinements should not be reached, if we are willing to expend sufficient scientific care in the development of our social statistics. The number of families and the number of persons to a family are less directly an index of social conditions proper, because they are evidently closely connected with merely demographic phenomena, such as births, deaths, and marriages. They have, indeed, deep social significance, but this significance has to be interpreted with great care in connection with other facts. If small families indicate prudence and foresight, and result in comfort and wellbeing, low death-rates and freedom from misery, it is hard to condemn them. If they are accompanied by vice and
SOCIAL CONDITION.
209
immorality and threaten the future prosperity of the nation, it is necessary to condemn them. How widely interpretation differs may be seen by examining the theories and judgments in regard to the present stationary state of the population of France. As indicative of the influence of other phenomena, such as the effect of urban life, the competition of other nationalities, the growing taste for luxury, the loosening of the bonds of religion and domestic life, the statistics of families will always have great interest and value. Education can scarcely fail to be always an index of the social condition of a people. Ignorance generally accompanies poverty, vice, and crime. We do not always make men moral by teaching them to read and write, for some of the worst criminals have been educated men. Nevertheless, it remains true that the intelligent community is, in general, a prosperous and moral one. Religious confession, again, is not always indicative of morality, but certain characteristics accompany different religions, so that the statistics serve as an index of social condition. Occupations possess, mainly, an economic significance and need to be treated in greater detail under Economic Statistics. W e have already shown their relation to sickness and mortality. The problem of how to unite these different measurements so as to form a true " index " of social condition has not yet been solved. If an " index-number " for the prices of commodities is difficult, how much more so would be an " index-number " which should measure variations in social condition. p
CHAPTER
X.
THE INFIRM A N D DEPENDENT. Sociological
Purpose.
IN the last chapter we looked into some of the positive elements for judging of the social condition of the community. But the positive elements are always much more difficult to measure than the negative. It is comparatively easy to say that people are poor; it is difficult to measure how rich they are. When people are very poor they demand public assistance, and we have statistics of pauperism. B u t when they are able to take care of themselves we have no need of knowing how well-to-do they are, and get only indirect evidence of it by an income tax or the like. In one respect we have already taken negative evidence, viz., of illiteracy, which is easier to test than the degree of education. There is, now, a range of subjects where we have negative evidence of the condition of a community, economic and social. These are the statistics of pauperism already mentioned; the statistics of the infirm in body or mind, such as the blind, the deaf and dumb, the insane and idiotic. Finally, we have statistics which evidence not only the absence of wealth, health, and strength, but the commission of acts which the community absolutely condemns as bad or immoral. These are the statistics of suicide, vice, and crime. Here we cannot measure the good directly, as the morality of a community, but we can indirectly, by measuring the evil. 210
THE INFIRM AND DEPENDENT.
211
In this chapter we take up the statistics of misfortune, that is, of those conditions which we do not attribute to the immorality or criminality of the individual. These are the statistics of the infirm and dependent. There is a certain number of persons in every community who, on account of some physical or mental infirmity, are not able-bodied. They are more or less of a burden to society. They do not represent the full strength which their numbers would indicate. Their presence is, in that sense, an economic loss. Not only that, but in many cases their presence indicates some defect in the social organization, or in the manner of life of the people. Where possible, it is necessary to remedy At least it is necessary to study the consuch defects. dition of these unfortunates with a view to ameliorating it, both for their sake and for that of the community. For this purpose we seek statistics of the number of each class, their sex, age, and conjugal condition, their sickness and mortality, their economic and social condition, in order to understand the cause of and the remedy for the misfortune. In pauperism we seem to have a slightly different phenomenon, for men are paupers often through their own fault, sometimes almost of their own choice. But we treat pauperism as a social phenomenon, its causes in social conditions, in intemperance, in industrial organization, and the remedies to be applied for its amelioration or extinction. In all these directions we still remain true to the sociological purpose of depicting social organization. The dependent and infirm constitute classes in society, and they influence many other social phenomena. They make peculiar contributions to the statistics of births, marriages, deaths, age, and conjugal condition. They constitute a classification which cuts transversely, as it were, across other classifications. They show us peculiar rela-
212
STATISTICS AND SOCIOLOGY.
tions to the physical environment, as land, climate, and economic condition ; while pauperism and dependence are associated with the social environment, such as institutions, family life, religious belief, morality, race, nationality, and social condition. W e have abundant opportunity to study relations of co-existence and of sequence. Practical sociology is also deeply interested here, and whether we discover sociological laws or not, our statistics furnish the knowledge of actual conditions necessary to initiate reform. The sociological purpose of this chapter is to arrange and analyze the statistical data in such a way as to reveal these relations.. Statistical
Data.
There are many classes of infirmities, some of them entirely incapacitating the individual, others only partly, — some present from birth, others coming on with advancing age. There are also many different degrees of the same infirmity. Among the blind, some are totally blind, others have simple impairment of the vision. Among the deaf, there are deaf-mutes, others are deaf but not dumb, others are only partly deaf. A great many of these infirmities have comparatively little social importance, because they are simply the natural consequence of advancing age. Such are the natural failure of eyesight and hearing as people grow old. Partial blindness and partial deafness are often not incompatible with the individual earning his livelihood and fulfilling his social duties. There are many other physical infirmities, such as loss of arm, or leg, or eye, spinal difficulty, chronic diseased condition, which, while they interfere with the individual's full capacity, do not absolutely prevent his taking part in the work of the world. These cases of partial disability are difficult to register, because the line can never be drawn between the different degrees of the same infirmity. It is only of the extreme cases, such as
213
THE INFIRM AND DEPENDENT.
total blindness, deaf-mute ism, insanity, and idiocy, that we get trustworthy statistics, and this is due to the fact that these unfortunates are largely the inmates of public institutions. The Blind, Deaf-mutes, Insane, and Idiotic. These are the four classes commonly registered, and of which we have statistics. The insane and idiotic are often classed together under one term, such as mentally deranged, or simply insane and idiotic. The statistics are not altogether trustworthy, because in some countries there is a larger number of institutions for such persons, or more of them are gathered into institutions, in which case the statistics are more perfect than when they are scattered among their families. The numbers per 1,000,000 of the population for some of the countries of Europe and the United States are shown in the following table (1890-91) : 1 Blind. Deaf-mutes.
Austria Hungary Sweden Norway England and Wales . Scotland Ireland United States . . . North Atlantic div. South Atlantic div. North Central div. South Central div. Western div. . .
806
1292
Ina&ne. 1613
Idiotic. 656»
2
Total. 4267
1051
1089
603
1009
826
1109
1818
1592
5344
1289
1080
4
6265
33574
4653
3896
3752
809
489
696
628
2694
1246
6063
1135
716
1327
6363
806
669
3176 1697
1626
4687
777
670
2385
1472
5304
888
634
1322
1653
4797
783
731
1647
1634
4795
895
581
959
1532
3967
561
430
1878
648
3617
I t will be seen by reference to this table that the Allg. Stat. Archiv, Vol. i n . , p. 474. Comp. Eleventh Census, U. S., Part II. Census of England, 1891, Vols. III. and IV. Census of Scotland, Vol. II., Parts I. and II. Census of Ireland, Part II. All further facta are from these sources, unless otherwise stated. 3 Under insane are included also " Blödsinnige " or idiots. * Under idiots are meant cretins. 4 Includes both insane and idiotic. 1
214
STATISTICS AND SOCIOLOGY.
total number of these unfortunates is everywhere less than one per cent of the population. The number is greatest in Norway and Ireland, where it exceeds sixtenths of one per cent. There are extraordinary differences in the prevalence of the various infirmities in different countries. Norway and Ireland show an extraordinary number of blind. Austria has an extraordinary number of deaf-mutes. Ireland again shows the largest number of insane and idiotic, while Norway follows close after, and Scotland is next. It is evident that there is no geographical distribution of these infirmities according to climate or elevation above the sea. There is no fixed law of distribution according to race, although it is probable that race temperament displays itself to a certain extent in the statistics of insanity. The number of unfortunates in these different classes is influenced most largely by local conditions, such as food and nourishment, occupation, medical care, and general social condition. The divisions of the United States show marked differences, insanity especially being more frequent in the North than in the South. It will be necessary to study each infirmity by itself, and with particular reference to the country whose statistics we are using. The Blind. Under the blind are meant, of course, those who are totally blind. In Ireland a very particular study has been made of them since 1851. There were then reported 7587 blind persons in the population, and this number increased to 8679 in 1861, notwithstanding the decrease in population. This was attributed to the prevalence of ophthalmia, especially in the poor-houses. In 1891 the number had decreased to 5341, or 770 less than in 1881, and 1006 less than in 1871. The proportion to the population still remains high, because emigration leaves the blind behind. In Scotland also the number of blind has decreased from 3158 in 1881
THE DîFEBM AND DEPENDENT.
215
to 2797 in 1891, or from 846 per million to 695. Other countries of Europe show a slight decrease from decade to decade. The Blind according to Sex and Age. There are generally more males than females among the blind, although this is not always the case. For every hundred blind males there are in Scotland 90.4, in England 91, and in the United States 80.1 blind females. In Ireland, on the other hand, for every hundred blind males there are 107.3 females, and there is a slight excess of females also in Hungary and Sweden. In respect to age, we have those who have been blind from childhood, and others with whom blindness has been due to disease, accident, or advancing age. In England 17 per cent, in Scotland 11, and in Ireland 5 per cent, were reported as having been blind from infancy. Even these figures are probably exaggerated, because many of these unfortunates, poor and friendless, have no clear recollection of whether they were born blind, or became so later. In fact, blindness is an infirmity of advancing age. In Ireland 71 per cent of the total blind were aged 50 years or over. In Scotland 50 per cent of the males, and 65 per cent of the females, who were blind, were over 50 years of age. In England 45 per cent of the males, and 56 per cent of the females, were 55 years of age and over. In England and Scotland the number of blind males exceeds that of blind females until the age of 65, after which the females outnumber the males at like ages. The combination of sex and age shows why the proportion of the two sexes varies in different countries. There are two conflicting influences. Blindness caused by accident, dangerous occupations, violence, and dissipation would fall more heavily on men than on women; while blindness due to advancing age would afflict more women than men, simply because the former live longer. Part of the variation would be explained by differences
216
STATISTICS AND SOCIOLOGY.
in sex and age distribution, and in the industrial or agricultural character of the occupations. Ireland, for instance, is agricultural, with many old people, and we have an excess of females among the blind. The United States has an excess of males and a small proportion of old people. England and Scotland are industrial. The general excess in the Southern divisions of the United States (agricultural) over the North (industrial) is probably due to the presence of the coloured population. As blindness is an affliction of advancing age, it does not necessarily interfere with marriage. A very large proportion of the blind is found among the married, widowed, and divorced, simply because of the greater age of persons in those classes. Perhaps some natural selection is shown in the smaller number of females among the married. In Prussia (1880), out of 100 blind males, 55 were married, widowed, or divorced, while out of 100 females, only 53 were married, widowed, or divorced. In a normal population the proportion is greater among females than among males. In regard to religious confession, in Prussia the figures per million were, for Protestants 820, for Catholics 840, and for Jews 1100. The reason for thia excess among Jews is not explained. In Ireland the proportion per million was 1216 for Catholics, and 884 for Protestants. This, of course, is due to the fact that all of the lower classes are Catholics. In regard to education, out of the 5341 blind in Ireland, 2176, or about 40 per cent, were uneducated. Of the 3145 reported as educated, 184 had received education since blindness came on, while 169 had been educated previously, and had also received a special education fitted to their condition subsequent to becoming blind. The occupations of the blind depend upon their previous occupation, and as to whether they have been able to continue the exercise of it. So many of them are practically
THE INFIRM AND DEPENDENT.
217
unable to do the latter that the statistics are not of much value. In Ireland, out of 2932 blind persons whose actual or former occupation was specified, 590 were farmers, 377 were labourers, 348 were knitters, 301 were servants, 254 were musicians, and 215 basket-makers. It is evident that former and present occupations are mixed together in this enumeration. In nearly one-half of the cases the occupation is not specified. We have similar statistics for Scotland and England. In the latter country musicians, servants, mat-makers, broom and basket makers are especially heavily represented. The number of unoccupied is also large. The causes of blindness would be a matter of great interest if our statistics were trustworthy. But, as a matter of fact, the causes are returned by ignorant persons, so that they possess but little scientific value. Various diseases are assigned as causes, and various accidents, such as wounds, explosions, injury by animals, etc. In Ireland, in 1891, the most frequent causes assigned were cataract, ophthalmia and external inflammations, smallpox, and diseases of the brain and nervous system. But the unspecified causes were much more than one-half of the whole. The Deaf and Dumb. Here we have two classes, those who are deaf and dumb, or the deaf-mutes, and those who are deaf but not dumb.1 In Scotland there were 2125 deaf and dumb, and 741 deaf but not dumb. In England there were 14,192 deaf and dumb, and 15,088 deaf only. The number of deaf-mutes is generally decreasing. Among the deaf-mutes the males exceed the females; while among the deaf only, the females exceed the males, because of increasing age. In England, among the deaf and dumb, the i This is the ordinary classification. In Ireland the Census of 1891 returns 3366 "deaf and dumb," and 1099 "dumb not deaf." This latter seems to me an extraordinary number, and I have not been able to obtain an explanation of it. The Irish Census makes no return of " deaf only."
218
STATISTICS AND SOCIOLOGY.
proportion per million of each sex was 548 for males and only 434 for females ; while for the deaf only it was 444 for males and 592 for females. Deaf-muteism is an affliction of childhood. In Ireland, out of 3365 cases, 2570, or 76 per cent, were congenital. In Scotland the largest number of deaf and dumb is found during the early years of life. The steady decrease after the age 15 to 20 shows the greater mortality among these unfortunates. In regard to conjugal condition the deaf-mute3 are largely shut out from marriage because of the mortality among them. In Prussia only 8.5 per cent of the males and 6 per cent of the females were married. In regard to religious confession, in Prussia the proportion among Jews was greater than among Catholics or Protestants; in Ireland the proportion among Catholics was greater than among Protestants, for the same reason as was assigned in regard to the blind. In regard to education, in Ireland the proportion of the educated to the uneducated, among those who were not suffering from any infirmity which would render them unsusceptible of the instruction imparted to this class of the community, was as 1 to 1.3. Occupation depends very much upon the social condition of the families in which the deaf-mutes live. In Ireland the largest number was found to be servants, next labourers, then sempstresses, boot and shoemakers, tailors, etc. The causes of acquired muteism are chiefly epidemic diseases, such as small-pox, measles, and scarlatina, and accidents affecting the hearing. Among children who have lost their sense of hearing at an early age, the faculty of speech often disappears partially or wholly. In Ireland information was obtained of the number of Congenital deaf-mutes born of the same parents. In 2328 families one mute in a family occurred in 1807 instances;
THE INFIRM AND DEPENDENT.
219
there were 297 cases of two mutes born in a family; 155 instances of three mutes; 41 cases of four; 14 of five ; 8 of six; 3 of seven; 2 of eight; and one case of no less than 11 deaf-mutes in a family. Special inquiry was also made into cases of mute ism where consanguinity of the parents existed. In 1891 there were 185 instances where the parents of mutes were related, and the result of intermarriage was 105 cases of one mute in the family, — 99 congenital and 6 acquired; 44 of 2 mutes, — 42 congenital and two acquired; 20 of three, 9 of four, 1 of five, 3 of six, 1 of seven, and 2 of eight mutes in a family ; all the cases of more than two mutes were congenital. There is a general impression that deaf-muteism, cretinism, and idiocy are often the result of the same general causes. A recent Austrian inquiry, in which special attention was paid to cretinism, seems to support this notion. In general those districts where there is the greatest number of cretins, such as Salzburg, Carinthia, Styria, and Upper Austria, also show a large number of deaf-mutes. Galicia, however, has a large number of deaf-mutes, but few cretins; while the Tyrol has a large number of cretins, but comparatively few deaf-mutes. Among persons who are doubly afflicted the combination of deaf-muteism and mental derangement is the most frequent, as will be shown later. 1 The Insane and Idiotic. In some countries they do not distinguish in the statistics between lunatics and idiots, so that it is necessary to deal with these two classes together. We shall, however, distinguish between them whenever the statistics allow. It is generally believed that insanity is increasing in civilized countries. This is sometimes denied, and the apparent increase is explained on the ground that it has become more and more customary to treat these unfort1
Rauchberg, Bevölkerung Oesterreichs, p. 234.
220
STATISTICS AND SOCIOLOGY.
unates in asylums and public institutions, where they will receive the best scientific care. This fact doubtless points to the probability that part of the increase is simply due to more perfect statistics. This is Mr. Noel Humphrey's argument in reference to the alleged increase of insanity in England: " Thus the mean annual proportion of registered lunacy to population in the five years 1864-68, compared with that in the preceding five years 1859-63, showed an increase of 12.9 per cent, whereas, the rate of increase in succeeding five-year periods, compared with the preceding quinquennium, successively declined to 11.7, 7.6, 5.0, and to 2.8 per cent in the five years 1884-88. This marked and steady decline in the rate of increase of registered cases appears to be inconsistent with the supposed real increase of lunacy, whereas it is entirely consistent with the theory that the increase in the proportion of registered cases to population is mainly due to improved and more complete registration, which is constantly bringing within the knowledge of the Commissioners a larger proportion of the total existing cases of insanity, and thus reducing the reserve of unregistered cases." 1
The census of 1891 (England) shows that there has been an increase since 1871 in the total number of lunatics, but accounts for it by supposing that the better care in asylums prolongs life, and thus tends to accumulate the total number. The rate of discharge by death and recovery from the asylums averaged 19 per cent annually in 1871-80, while in 1881-90 it was only 17.83. But with a discharge rate of 19 per cent it required an average of 689 new cases per million persons living to reach the rate of 1881, while with a discharge rate of 17.83 per cent it required an average of only 661 new cases per million persons living to reach the rate of 1891. These figures, therefore, seem to indicate a slight decrease. In Ireland the figures show an enormous increase of lunatics, they having trebled since 1851, or, if we take into account the decrease in population, having quadrupled. In 1851 the proportion to one million of the popui Jour, of Statistical Society, 1890, p. 213.
THE INFIRM AND DEPENDENT.
221
lation was 775 ; in 1891 it was 3174. The proportion of idiots in 1851 was 750 per million; in 1891 it was 1326. Since 1881, however, there has been a decrease in the number of idiots. The proportion in some of the counties is still astounding. In the county of Meath there was one lunatic for every 177 inhabitants, and one idiot for every 438 inhabitants, showing a ratio of 5650 and 2283 per million for the two classes. In Scotland the number of lunatics has increased from 2250 per million in 1881 to 2594 in 1891, while the number of idiots has decreased from 1603 per million in 1881 to 1246 in 1891. Most other countries show an increase in the number of those suffering from mental derangement, but as the lunatics and idiots are seldom distinguished, the figures are of little value. As already remarked, the increase in the number of the insane in asylums does not necessarily indicate an increase in insanity. In the United States, for instance, the total number of insane persons treated in both public and private institutions during the year 1889 was 97,535, while during the year 1881 there were 56,205 treated, showing an increase in the nine years of 41,330, or 73.53 per cent. This percentage of increase does not indicate an increase in the proportion of insane persons to population, but rather a great increase in the amount of asylum accommodation provided, and a willingness on the part of the public to make full use of all the facilities thus provided.1 The total number of insane per.million of population was 1697 in 1890, and 1833 in 1880. Special statistics of the insane in regard to sex, age, and conjugal condition are as follows:—There are more women than men among the insane in Sweden, England, Scotland, and Ireland.2 In Austria and Hungary there is Quotation from Census Bulletin No. 62. * In Ireland, however, there was an excess of males if we take equal numbers living of the two sexes, viz., 4728 insane males and only 4286 1
222
STATISTICS AND SOCIOLOGY.
a greater number among the males, but in the former country there are some idiotic included under the head insane. In England, taking the insane and idiotic together, there were 114 females to 100 males. Where the idiotic are taken separately there is an excess of males. The real relations are brought out more clearly by combining sex and age. Of the 97,383 mentally deranged in England, 7722 were so from childhood, and here we have an excess of males ; among the other 89,661 mentally deranged, there is a large excess of females, taken as a whole. Up to the age of 25, however, the males are in excess, while after that the females are always greatly in excess. This is partly, if not wholly, accounted for by the greater mortality among males. That idiocy is a disease of childhood, and insanity of advancing age, is shown by the statistics of those countries where they distinguish the two-classes. In Scotland the largest number of idiots was found between the ages 15-20, after which it gradually declined. Among the insane, up to the age of 20 the number was small, but from that age on, each quinquennial period up to 70-75 was represented by a large number; after 40 years of age the females outnumbered the males. For a true comparison, we should obtain the proportion of insane and imbeciles at each age period to the population of that age. This would show a constantly decreasing proportion of idiots after the age of 20, owing to the great mortality among these unfortunates ; and an increasing proportion among the insane, owing to new cases. These statistics are confirmed by those for Ireland, where persons suffering from particular forms of mental derangement, such as mania, monomania, melaninsane females per million living of corresponding sex. Even in England, where the proportions were 3230 males and 3478 females per million living, it is argued that the excess of females is due to their accumulation owing to less rapid discharge by death or recovery. See Census of England, Vol. IV., pp. 78 and 90.
THE INFIRM AND DEPENDENT.
223
eholia, dementia, idiocy, epilepsy, and various combinations of these . forms are distinguished by age. The violent forms, such as the different kinds of mania, as well as melancholia and dementia, scarcely appear in childhood, but are strongly represented after the age of 30. Idiocy, on the other hand, is strongly represented in childhood, and the maximum number of cases is found in the age class 20-25. In regard to conjugal condition, in Ireland 79.6 per cent of the mentally deranged were unmarried, 14.8 per cent were married, and 5.6 per cent were widowed. The appearance of idiocy in childhood acts as a bar to marriage, and the total number of married and widowed is insignificant. Among the insane, doubtless the symptoms which afterwards develop into insanity may, by the law of natural selection, shut them out from marriage. It is also possible that married life with its regularity and orderliness acts as a restraining influence, while widowhood and the divorced state, by bringing grief, remorse, and passion, lead to insanity. In regard to education, the lunatics and idiots are largely illiterate. In Ireland, in 1891, 41.1 per cent could read and write, 11.4 per cent could read but not write, 47.5 per cent could neither read nor write. This large amount of illiteracy is doubtless due principally to the fact of idiocy being an affliction of childhood. Occupations depend very largely upon the kind of work that can be entrusted to persons of deranged or weak minds. Accordingly, in Ireland we find that the occupation most largely represented among lunatics and idiots was that of labourer; next in numerical order was servants ; and the next largest number was tabulated under the head of farmers and their families. It is evident that we have here simply the principal occupations of the country, and that the figures are too indefinite to
224
STATISTICS AND SOCIOLOGY.
show any causal relation between occupation and mental derangement. 1 The cause of lunacy and idiocy is always difficult to determine, even where skilled physicians have had charge of the case, because it requires a minute knowledge of the past history of the person afflicted. Where the lunatic or idiot lives with his or her family the cause is generally unknown. In Ireland, for instance, out of 21,188 cases the number in which the cause was stated was only 6565, — less than one-third. Of these, 1834 were attributed to moral or mental causes, 2099 to physical causes, and 2632 were returned as hereditary. Of the moral or mental causes, the largest numbers were attributed to grief (446) ; terror (297) ; religious excitement (286) ; anxiety (228) ; reverse of fortune (224) ; and love and jealousy (132). Of the physical causes, the highest numbers were intemperance (671) ; epilepsy (320) ; injury to the head (234) ; sunstroke (220) ; cerebral disease (163) ; and diseases of the nervous system (126). It is usual to give also a description of the kind of lunacy or idiocy, and this is an indication, to a certain extent, of the cause. These forms, however, run into each other so that our information is not very definite. In Ireland, for instance, the kinds of lunacy and idiocy were classified as follows in the order of the number suffering from them:—mania, idiocy, dementia, melancholia, epilepsy, acute mania, dementia with epilepsy, monomania, suicidal mania, idiocy with epilepsy, puerperal mania. Double or Triple Misfortune. We have some unfortu1 In France, statistics of the insane in asylums gave the following proportions per 100,000 of each class (Levasseur, Pop. française, I., p. 347) : Government officials. . . 1.4 Artists 9.6 Industry . 1.1 Clergy 4.1 Leisure class . . . . . 1.0 . 0.4 Commercial Physicians 3.8 . 0.2 Agricultural Professors and literary men 3.5 Soldiers and sailors . . . 2.0
THE INFIRM AND DEPENDENT.
225
nates, who enter not only into one, but into several of these categories. In England, in 1891, there were 82 both blind, and deaf and dumb, 380 blind lunatics, 500 deafmute lunatics, and 25 lunatics who were also blind, and deaf and dumb. We have thus completed a rapid survey of these four principal kinds of misfortune. Each one of them is worthy of study, particularly from a medical standpoint, with the view of seeking to diminish the loss and suffering occasioned to the community. From the standpoint of sociology it would be desirable to point out general causes, such as food, nourishment, and sanitary condition, which may have an influence in producing these misfortunes. Unfortunately our statistics do not carry us very far in this direction. In France they find blindness more frequent in the south than in the north, and this is believed to be due to the dust, and the blaze of the sunlight. In France also it is found that the cretins, idiots, and goitreux are especially numerous in mountainous regions. These misfortunes are probably due to poor nourishment, bad water, and absence of sun. Statistics from Austria show also the greater frequency of cretinism in mountainous regions. While in Austria the number of cretins per 100,000 of the population was 79, in Carinthia it was 303, in Salzburg 273, in Styria 248, and in the Tyrol 140. Statistics for Germany show that idiocy is more frequent in the south than in the north, and this again is due to the large number of cretins in the Alpine regions of Bavaria. 1 Insanity is more frequent in the west of Germany than in the east, and this is supposed to be due to the more exciting life of an industrial region. In Ireland we have a very careful distribution of the various forms of misfortune according to counties, but with no very clear results. The largest proportion of 1
Q
Allg. Stat. Aichiv, Vol. II., p. 691.
226
STATISTICS AND SOCIOLOGY.
blind seems to be in the south, in Limerick, Tipperary, and Cork. The deaf-mutes are scattered through different counties ; while the proportion of lunatics and idiots is greatest in Meath. Ulster stands the lowest of the four provinces in all three kinds of infirmities. Other Physical Infirmities. Besides the blind, deaf and dumb, and mentally deranged, there are many other forms of infirmity which occasion suffering and economic loss to the community. An attempt is sometimes made to enumerate these in a census, but as the classes sought for are never the same in any two countries it is impossible to give uniform statistics. We can therefore only give samples of what different censuses have undertaken, in order to get a notion of the kinds of misfortune prevalent in a community besides those already enumerated. In Ireland they distinguish between the permanently diseased, comprising the deaf and dumb, blind, lunatic, and idiotic, and the temporarily diseased. Under the latter head are understood those in hospitals and infirmaries, and those sick at their own homes who are not able to follow their usual occupations. The total number was 35,745 compared with 30,993 of the former category. Of the temporarily diseased, 16,466 were at their own homes ; 4490 were in infirmaries, and general and special hospitals ; and 14,789 in workhouse hospitals. The proportion of those temporarily diseased was 7.6 per 1000 persons living. The rate was highest in the city of Dublin, a circumstance partly attributable to the hospital accommodation. In the United States there were 194,029 persons returned as so afflicted with various forms of disease as to be unable to pursue their usual occupation, giving a proportion of 14.5 to each 1000. In addition to these afflicted with disease, out of every 1000 of the population there were 1.3 suffering from the effects of accidents and injuries ; 1.4 were paralyzed ; 1.6 were lame ; 0.38
227
THE INFIRM AND DEPENDENT.
had lost one arm ; 0.35 had lost one leg ; and 0.38 were affected with deformed or contracted limbs. In Massachusetts, in 1885, they made a much more minute inquiry as to different forms of physical infirmity. The following classification was adopted: 1 D i r t e r i v « PHYSICAL COITDITIOK.
Acute diseases Chronic diseases Blind Deaf Dumb Deaf and dumb Insane Idiotic Maimed Lame Bedridden Paralytic Deformed Total individuals
Milee.
.
,
. . . ,.
Females.
Both Sexes.
676
609
1,184
7,619
6,846
14,364
2,080
1,496
3,682
1,266
1,718
2,973
74
60
134
438
390
828
2,344
2,919
6,263
987
661
1,638
2,206
177
2,382
3,464
1,682
6,136
136
298
433
1,437
1,103
2,640
399
281
680
21,794
17,419
39,213
Out of this aggregate number, 1824 were suffering from more than one misfortune. The table is interesting, as showing the differences between the sexes in the various kinds of misfortune. In addition to the usual classes we have a large number of persons suffering from chronic diseases, and a very considerable number who are either maimed, lame, or paralytic. The proportion of the whole number to the total population of Massachusetts was 20 per 1000. Of the total 39,213, no less than 6004 were paupers, 527 were homeless children, and 117 were convicts and prisoners. Of the total number, 5976 were supported by public charity, 540 partially by public charity, 2396 by private charity, and 887 partially by private charity. Of the total number, only about 25 per cent were of foreign birth, although the foreign-born were 27 per cent of the total population. i Census of Massachusetts, 1886, Vol. I., Part II., p. c m . suffering from two or more infirmities are entered under each.
Persona
228
STATISTICS AND SOCIOLOGY.
Provision for the Infirm. The final consideration under this section should be to determine what provision is made for the care of these unfortunate members of the community. This consists of asylums for the insane, the idiotic, the blind, the paralytic, etc., and of schools for the instruction of the blind, and the deaf and dumb. A mere enumeration of the number of these asylums, or schools, would be of little use. W e have one statistical fact which is of interest, namely, the number in each of these different classes cared for in institutions. In Ireland, out of 14,945 persons returned as lunatics, 11,265 were in asylums, 2787 in workhouses, while only 893 were at large. Out of 6243 idiots, 996 were in asylums, 1170 were in workhouses, and 4077 were at large. The different proportions in the two classes are due, of course, to the greater danger of violence from lunatics. In Massachusetts, out of 5263 insane, 4384 were in institutions, and 879 in private families ; of the idiotic, 605 were in institutions, and 1033 in private families. Of the other kinds of misfortune, by far the largest number of persons suffering from them are found in private families. A considerable number are in hospitals and poorhouses. The number of schools for the education of the blind, and the deaf and dumb is a matter of special inquiry. In Ireland there were nine institutions for the education of the blind, with accommodation for 758 inmates, but with only 464 actual inmates in 1891. There were four institutions for the education of the deaf and dumb, with 533 inmates. In the United States, in 1889, there were 2931 persons under instruction in institutions for the blind. Pauperism. There is a large number of persons in every community, some of them able-bodied, but many of them infirm, who are dependent upon public charity for their means of support. Some of them are supported entirely by the community, such persons being collected
229
T H E INFIRM AITO DEPENDENT.
generally in poorhouses or almshouses, while others receive out-door relief. The inmates of workhouses for Great Britain and Ireland, in 1891, were declared to be as follows: Hales.
Ireland Scotland England and Wales. Total
Female«.
Both Sexes.
19,998 4,669 102,689
22,350 4,922 80,024
42,348 9,481 182,713
127,246
107,296
234,542
These statistics are sufficient to show the immense number of paupers in the ordinary civilized community. Besides these inmates of workhouses, there is a large number of persons receiving out-door relief. This number varies greatly from year to year, and from week to week. In Ireland, at the time of the taking of the census in 1891, the number of persons receiving out-door relief was 62,988, or one out of every 75 of the population. The number of each class, and the proportion to the population, in England, is shown in the following table: 1 RECEIVIKO IA-DOOB R E L I E F .
OOT-DOOB R E L I E F .
Ratio
Ratio
1000. 7.0 6.8 7.1 7.1 6.5 6.3
Number.
1860 1860 1870 1880 1890 1891
. . . . . .
per
123,004 113,507 156,800 180,817 187,921 185,838
Rxczrvura
Number.
885,696 731,126 876,000 627,213 687.296 673,892
1000. 60.0 37.1 39.4 24.7 20.2 19.6
per
TOTAL.
Number.
Ratio per 1000.
1,008,700 844,633 1,032,800 808,030 775,217 759,730
57.4 42.9 46.6 31.8 26.7 25.8
It will be seen from this table that the total number of persons in receipt of relief has greatly decreased since 1870, and still more the ratio of persons to the total population. As regards the distribution of pauperism, it was greatest, in 1891, in the Southwestern division, amounting there to 40.8 per 1000 ; it was least in the Northwestern, only 17.8 per 1000. The individual counties in which it was greatest were Norfolk, 45.8, and Dorset, 44.8 per 1
Jour. Stat. Soc., 1892, p. 133.
230
STATISTICS AND SOCIOLOGY.
1000. The number of paupers varies according to the season, the ratio being generally from 0.5 to 1 per 1000 lower in July than in January. With one exception (London), the number of out-door paupers in every county is much greater than the number of in-door. In London the ratio of in-door paupers is far greater than in any other county, viz., 13.9, while the ratio of out-door paupers is only 11.6 per 1000. The expenditure on relief of the poor in 1890 amounted to 8,444,345 pounds sterling, or at the rate of 5s. 9|